UNITED STATES
SECURITIES AND EXCHANGE COMMISSION
Washington, D.C. 20549
FORM N-CSR
CERTIFIED SHAREHOLDER REPORT OF REGISTERED
MANAGEMENT INVESTMENT COMPANIES
Investment Company Act file number 811-4008
Fidelity Investment Trust
(Exact name of registrant as specified in charter)
245 Summer St., Boston, MA 02210
(Address of principal executive offices) (Zip code)
William C. Coffey, Secretary
245 Summer St.
Boston, Massachusetts 02210
(Name and address of agent for service)
Registrant's telephone number, including area code:
617-563-7000
| |
Date of fiscal year end: | October 31 |
|
|
Date of reporting period: | April 30, 2019 |
Item 1.
Reports to Stockholders
Fidelity® Diversified International K6 Fund
Semi-Annual Report April 30, 2019 |
 |
Beginning on January 1, 2021, as permitted by regulations adopted by the Securities and Exchange Commission, paper copies of a fund’s shareholder reports will no longer be sent by mail, unless you specifically request paper copies of the reports from the fund or from your financial intermediary, such as a financial advisor, broker-dealer or bank. Instead, the reports will be made available on a website, and you will be notified by mail each time a report is posted and provided with a website link to access the report.
If you already elected to receive shareholder reports electronically, you will not be affected by this change and you need not take any action. You may elect to receive shareholder reports and other communications from a fund electronically, by contacting your financial intermediary. For Fidelity customers, visit Fidelity's web site or call Fidelity using the contact information listed below.
You may elect to receive all future reports in paper free of charge. If you wish to continue receiving paper copies of your shareholder reports, you may contact your financial intermediary or, if you are a Fidelity customer, visit Fidelity’s website, or call Fidelity at the applicable toll-free number listed below. Your election to receive reports in paper will apply to all funds held with the fund complex/your financial intermediary.
| Account Type | Website | Phone Number |
| Brokerage, Mutual Fund, or Annuity Contracts: | fidelity.com/mailpreferences | 1-800-343-3548 |
| Employer Provided Retirement Accounts: | netbenefits.fidelity.com/preferences (choose 'no' under Required Disclosures to continue to print) | 1-800-343-0860 |
| Advisor Sold Accounts Serviced Through Your Financial Intermediary: | Contact Your Financial Intermediary | Your Financial Intermediary's phone number |
| Advisor Sold Accounts Serviced by Fidelity: | institutional.fidelity.com | 1-877-208-0098 |
Contents
To view a fund's proxy voting guidelines and proxy voting record for the 12-month period ended June 30, visit http://www.fidelity.com/proxyvotingresults or visit the Securities and Exchange Commission's (SEC) web site at http://www.sec.gov.
You may also call 1-800-835-5092 to request a free copy of the proxy voting guidelines.
Standard & Poor's, S&P and S&P 500 are registered service marks of The McGraw-Hill Companies, Inc. and have been licensed for use by Fidelity Distributors Corporation.
Other third-party marks appearing herein are the property of their respective owners.
All other marks appearing herein are registered or unregistered trademarks or service marks of FMR LLC or an affiliated company. © 2019 FMR LLC. All rights reserved.
This report and the financial statements contained herein are submitted for the general information of the shareholders of the Fund. This report is not authorized for distribution to prospective investors in the Fund unless preceded or accompanied by an effective prospectus.
A fund files its complete schedule of portfolio holdings with the SEC for the first and third quarters of each fiscal year on Form N-PORT. Forms N-PORT are available on the SEC’s web site at http://www.sec.gov. A fund's Forms N-PORT may be reviewed and copied at the SEC’s Public Reference Room in Washington, DC. Information regarding the operation of the SEC's Public Reference Room may be obtained by calling 1-800-SEC-0330.
For a complete list of a fund's portfolio holdings, view the most recent holdings listing, semiannual report, or annual report on Fidelity's web site at http://www.fidelity.com, http://www.institutional.fidelity.com, or http://www.401k.com, as applicable.
NOT FDIC INSURED •MAY LOSE VALUE •NO BANK GUARANTEE
Neither the Fund nor Fidelity Distributors Corporation is a bank.
Investment Summary (Unaudited)
Geographic Diversification (% of fund's net assets)
| As of April 30, 2019 |
| | Japan | 16.5% |
| | United Kingdom | 13.0% |
| | United States of America* | 10.3% |
| | Germany | 9.1% |
| | France | 6.5% |
| | Netherlands | 5.8% |
| | Switzerland | 5.8% |
| | India | 4.9% |
| | Canada | 3.1% |
| | Other | 25.0% |

* Includes Short-Term investments and Net Other Assets (Liabilities).
Percentages are based on country or territory of incorporation and are adjusted for the effect of futures contracts, if applicable.
Asset Allocation as of April 30, 2019
| | % of fund's net assets |
| Stocks | 96.2 |
| Short-Term Investments and Net Other Assets (Liabilities) | 3.8 |
Top Ten Stocks as of April 30, 2019
| | % of fund's net assets |
| SAP SE (Germany, Software) | 2.1 |
| Roche Holding AG (participation certificate) (Switzerland, Pharmaceuticals) | 2.0 |
| AIA Group Ltd. (Hong Kong, Insurance) | 1.8 |
| Unilever NV (Certificaten Van Aandelen) (Bearer) (Netherlands, Personal Products) | 1.6 |
| ASML Holding NV (Netherlands, Semiconductors & Semiconductor Equipment) | 1.5 |
| Keyence Corp. (Japan, Electronic Equipment & Components) | 1.5 |
| Hoya Corp. (Japan, Health Care Equipment & Supplies) | 1.4 |
| AstraZeneca PLC (United Kingdom) (United Kingdom, Pharmaceuticals) | 1.4 |
| Prudential PLC (United Kingdom, Insurance) | 1.3 |
| HDFC Bank Ltd. (India, Banks) | 1.3 |
| | 15.9 |
Top Market Sectors as of April 30, 2019
| | % of fund's net assets |
| Financials | 22.9 |
| Information Technology | 15.2 |
| Industrials | 14.7 |
| Health Care | 13.9 |
| Consumer Staples | 8.3 |
| Consumer Discretionary | 7.4 |
| Materials | 5.5 |
| Energy | 4.0 |
| Communication Services | 3.1 |
| Real Estate | 0.6 |
Schedule of Investments April 30, 2019 (Unaudited)
Showing Percentage of Net Assets
| Common Stocks - 96.2% | | | |
| | | Shares | Value |
| Australia - 1.1% | | | |
| CSL Ltd. | | 116,275 | $16,276,398 |
| Magellan Financial Group Ltd. | | 441,106 | 13,871,822 |
|
| TOTAL AUSTRALIA | | | 30,148,220 |
|
| Bailiwick of Jersey - 1.0% | | | |
| Experian PLC | | 496,867 | 14,463,258 |
| Ferguson PLC | | 179,896 | 12,761,390 |
|
| TOTAL BAILIWICK OF JERSEY | | | 27,224,648 |
|
| Belgium - 1.2% | | | |
| KBC Groep NV | | 373,075 | 27,625,470 |
| Umicore SA | | 132,506 | 5,127,346 |
|
| TOTAL BELGIUM | | | 32,752,816 |
|
| Bermuda - 1.7% | | | |
| Credicorp Ltd. (United States) | | 54,478 | 12,905,838 |
| Hiscox Ltd. | | 515,023 | 11,242,416 |
| IHS Markit Ltd. (a) | | 208,677 | 11,948,845 |
| Marvell Technology Group Ltd. | | 399,277 | 9,989,911 |
|
| TOTAL BERMUDA | | | 46,087,010 |
|
| Brazil - 0.3% | | | |
| BM&F BOVESPA SA | | 480,043 | 4,217,562 |
| Notre Dame Intermedica Participacoes SA | | 437,741 | 3,920,702 |
|
| TOTAL BRAZIL | | | 8,138,264 |
|
| Canada - 3.1% | | | |
| Alimentation Couche-Tard, Inc. Class B (sub. vtg.) | | 551,509 | 32,517,501 |
| Cenovus Energy, Inc. (Canada) | | 781,046 | 7,742,249 |
| Constellation Software, Inc. | | 12,619 | 11,134,240 |
| Fairfax India Holdings Corp. (a)(b) | | 656,692 | 8,799,673 |
| Suncor Energy, Inc. | | 701,264 | 23,125,956 |
| Waste Connection, Inc. (Canada) | | 29,434 | 2,731,823 |
|
| TOTAL CANADA | | | 86,051,442 |
|
| Cayman Islands - 1.6% | | | |
| Alibaba Group Holding Ltd. sponsored ADR (a) | | 97,912 | 18,169,530 |
| ENN Energy Holdings Ltd. | | 402,223 | 3,799,297 |
| Momo, Inc. ADR | | 68,828 | 2,413,798 |
| Sea Ltd. ADR (a) | | 120,100 | 2,989,289 |
| Tencent Holdings Ltd. | | 315,575 | 15,553,954 |
| Zai Lab Ltd. ADR (a) | | 89,428 | 2,383,256 |
|
| TOTAL CAYMAN ISLANDS | | | 45,309,124 |
|
| China - 1.5% | | | |
| Kweichow Moutai Co. Ltd. (A Shares) | | 103,077 | 14,906,977 |
| Ping An Insurance (Group) Co. of China Ltd. (H Shares) | | 994,428 | 12,037,218 |
| Shanghai International Airport Co. Ltd. (A Shares) | | 749,724 | 7,862,478 |
| Wuliangye Yibin Co. Ltd. (A Shares) | | 448,510 | 6,816,654 |
|
| TOTAL CHINA | | | 41,623,327 |
|
| Denmark - 1.3% | | | |
| DONG Energy A/S (b) | | 184,135 | 14,097,201 |
| DSV de Sammensluttede Vognmaend A/S | | 88,767 | 8,201,509 |
| Netcompany Group A/S (b) | | 98,100 | 3,498,782 |
| Novozymes A/S Series B | | 197,010 | 9,181,152 |
|
| TOTAL DENMARK | | | 34,978,644 |
|
| France - 6.5% | | | |
| Amundi SA (b) | | 256,163 | 18,402,361 |
| Capgemini SA | | 186,965 | 22,668,564 |
| Danone SA | | 71,724 | 5,800,859 |
| Elis SA | | 94,586 | 1,686,794 |
| Ipsen SA | | 25,935 | 3,028,133 |
| Kering SA | | 15,618 | 9,231,537 |
| Legrand SA | | 114,547 | 8,417,742 |
| LVMH Moet Hennessy - Louis Vuitton SA | | 84,071 | 33,007,725 |
| Pernod Ricard SA | | 15,199 | 2,648,282 |
| Sanofi SA | | 351,273 | 30,648,324 |
| SR Teleperformance SA | | 108,363 | 20,819,792 |
| VINCI SA (c) | | 249,486 | 25,197,150 |
|
| TOTAL FRANCE | | | 181,557,263 |
|
| Germany - 9.1% | | | |
| adidas AG | | 84,726 | 21,771,071 |
| Allianz SE | | 103,626 | 25,047,872 |
| Bayer AG | | 245,306 | 16,326,523 |
| Continental AG | | 42,160 | 6,968,162 |
| Deutsche Borse AG | | 157,352 | 21,025,745 |
| Deutsche Post AG | | 441,797 | 15,357,054 |
| Fresenius SE & Co. KGaA | | 96,495 | 5,474,212 |
| Hannover Reuck SE | | 103,259 | 15,565,576 |
| Linde PLC | | 165,361 | 29,749,211 |
| Morphosys AG (a) | | 21,700 | 2,151,543 |
| Morphosys AG sponsored ADR | | 149,200 | 3,679,272 |
| SAP SE | | 457,332 | 58,953,865 |
| Symrise AG | | 165,346 | 15,893,243 |
| Vonovia SE | | 284,350 | 14,182,682 |
|
| TOTAL GERMANY | | | 252,146,031 |
|
| Hong Kong - 2.6% | | | |
| AIA Group Ltd. | | 4,887,279 | 50,042,979 |
| BOC Hong Kong (Holdings) Ltd. | | 2,351,430 | 10,521,007 |
| Techtronic Industries Co. Ltd. | | 1,628,221 | 11,768,322 |
|
| TOTAL HONG KONG | | | 72,332,308 |
|
| India - 4.9% | | | |
| Axis Bank Ltd. (a) | | 1,283,223 | 14,128,958 |
| Godrej Consumer Products Ltd. | | 241,398 | 2,259,153 |
| HDFC Bank Ltd. | | 1,077,574 | 35,749,255 |
| Housing Development Finance Corp. Ltd. | | 1,104,241 | 31,631,169 |
| Infosys Ltd. sponsored ADR | | 478,627 | 5,150,027 |
| Kotak Mahindra Bank Ltd. | | 492,339 | 9,801,609 |
| LIC Housing Finance Ltd. | | 882,266 | 6,292,671 |
| Reliance Industries Ltd. | | 1,606,297 | 32,122,711 |
|
| TOTAL INDIA | | | 137,135,553 |
|
| Indonesia - 1.1% | | | |
| PT Bank Central Asia Tbk | | 7,255,162 | 14,637,608 |
| PT Bank Rakyat Indonesia Tbk | | 50,491,963 | 15,484,202 |
|
| TOTAL INDONESIA | | | 30,121,810 |
|
| Ireland - 2.6% | | | |
| Allergan PLC | | 37,202 | 5,468,694 |
| CRH PLC | | 368,841 | 12,382,246 |
| DCC PLC (United Kingdom) | | 46,026 | 4,110,026 |
| Kerry Group PLC Class A | | 161,082 | 18,030,823 |
| Kingspan Group PLC (Ireland) | | 347,015 | 18,246,260 |
| Ryanair Holdings PLC sponsored ADR (a) | | 177,279 | 13,763,942 |
|
| TOTAL IRELAND | | | 72,001,991 |
|
| Israel - 0.5% | | | |
| Check Point Software Technologies Ltd. (a) | | 111,077 | 13,413,659 |
| Italy - 0.9% | | | |
| FinecoBank SpA | | 225,845 | 2,972,566 |
| Intesa Sanpaolo SpA | | 3,916,182 | 10,260,461 |
| Moncler SpA | | 98,485 | 4,039,551 |
| Recordati SpA | | 178,916 | 7,222,192 |
|
| TOTAL ITALY | | | 24,494,770 |
|
| Japan - 16.5% | | | |
| Bandai Namco Holdings, Inc. | | 129,126 | 6,143,613 |
| Daikin Industries Ltd. | | 150,430 | 19,152,669 |
| Hoya Corp. | | 575,846 | 40,398,909 |
| Iriso Electronics Co. Ltd. | | 40,426 | 2,090,343 |
| Itochu Corp. | | 572,595 | 10,280,443 |
| Kao Corp. | | 244,885 | 18,811,266 |
| Keyence Corp. (d) | | 65,324 | 40,533,192 |
| KH Neochem Co. Ltd. | | 135,796 | 3,931,434 |
| Minebea Mitsumi, Inc. | | 1,596,329 | 28,230,784 |
| Misumi Group, Inc. | | 334,634 | 8,645,600 |
| Mitsubishi UFJ Financial Group, Inc. | | 2,646,100 | 13,128,694 |
| Morinaga & Co. Ltd. | | 8,397 | 348,634 |
| Nabtesco Corp. | | 123,155 | 3,747,883 |
| Nidec Corp. | | 30,705 | 4,350,989 |
| Nissan Chemical Corp. (d) | | 60,794 | 2,690,555 |
| Nitori Holdings Co. Ltd. | | 139,426 | 16,584,178 |
| ORIX Corp. (d) | | 2,172,429 | 30,647,445 |
| PALTAC Corp. | | 75,676 | 4,150,818 |
| Persol Holdings Co., Ltd. | | 211,099 | 3,949,282 |
| Recruit Holdings Co. Ltd. | | 918,444 | 27,447,373 |
| Renesas Electronics Corp. (a) | | 1,786,607 | 9,510,821 |
| Shimadzu Corp. | | 159,684 | 4,263,209 |
| Shin-Etsu Chemical Co. Ltd. | | 195,696 | 18,537,212 |
| Shiseido Co. Ltd. | | 199,792 | 15,636,130 |
| SMC Corp. | | 49,515 | 20,473,638 |
| SoftBank Corp. | | 219,556 | 23,279,827 |
| Sony Corp. | | 191,829 | 9,662,064 |
| Suzuki Motor Corp. | | 338,256 | 15,380,104 |
| Takeda Pharmaceutical Co. Ltd. (d) | | 441,804 | 16,303,330 |
| Tokyo Electron Ltd. (e) | | 61,003 | 9,662,893 |
| Tsubaki Nakashima Co. Ltd. | | 107,610 | 1,990,005 |
| Tsuruha Holdings, Inc. | | 187,188 | 15,913,375 |
| Welcia Holdings Co. Ltd. | | 244,186 | 9,590,320 |
| Yahoo! Japan Corp. (e) | | 1,909,961 | 5,075,169 |
|
| TOTAL JAPAN | | | 460,542,201 |
|
| Korea (South) - 0.6% | | | |
| LG Chemical Ltd. | | 21,228 | 6,583,541 |
| SK Hynix, Inc. | | 153,919 | 10,446,303 |
|
| TOTAL KOREA (SOUTH) | | | 17,029,844 |
|
| Luxembourg - 0.7% | | | |
| B&M European Value Retail SA | | 3,279,324 | 16,869,761 |
| Samsonite International SA (b) | | 1,390,347 | 3,987,713 |
|
| TOTAL LUXEMBOURG | | | 20,857,474 |
|
| Mexico - 0.1% | | | |
| Grupo Financiero Banorte S.A.B. de CV Series O | | 637,089 | 4,026,974 |
| Netherlands - 5.8% | | | |
| Adyen BV (b) | | 4,948 | 4,026,846 |
| ASML Holding NV | | 205,643 | 42,942,371 |
| Heineken NV (Bearer) | | 101,888 | 10,998,074 |
| Koninklijke Philips Electronics NV | | 394,776 | 16,953,154 |
| NXP Semiconductors NV | | 183,896 | 19,423,096 |
| Unilever NV (Certificaten Van Aandelen) (Bearer) | | 722,558 | 43,718,071 |
| Wolters Kluwer NV | | 342,287 | 23,871,468 |
|
| TOTAL NETHERLANDS | | | 161,933,080 |
|
| New Zealand - 0.3% | | | |
| Ryman Healthcare Group Ltd. | | 1,121,963 | 9,104,713 |
| Norway - 1.4% | | | |
| Adevinta ASA: | | | |
| Class A (a) | | 547,587 | 5,523,187 |
| Class B | | 271,000 | 2,666,197 |
| Equinor ASA | | 844,463 | 18,837,189 |
| Schibsted ASA (A Shares) | | 436,124 | 11,444,688 |
|
| TOTAL NORWAY | | | 38,471,261 |
|
| South Africa - 0.3% | | | |
| Capitec Bank Holdings Ltd. | | 77,233 | 7,216,818 |
| Spain - 1.3% | | | |
| Amadeus IT Holding SA Class A | | 156,868 | 12,477,888 |
| CaixaBank SA | | 4,784,768 | 15,251,423 |
| Masmovil Ibercom SA (a) | | 62,321 | 1,365,831 |
| Prosegur Cash SA (b) | | 3,277,355 | 7,028,285 |
|
| TOTAL SPAIN | | | 36,123,427 |
|
| Sweden - 1.9% | | | |
| ASSA ABLOY AB (B Shares) | | 869,600 | 18,589,933 |
| Coor Service Management Holding AB (b) | | 386,247 | 3,338,948 |
| Indutrade AB | | 187,274 | 5,725,851 |
| Svenska Handelsbanken AB (A Shares) | | 488,962 | 5,340,980 |
| Swedbank AB (A Shares) | | 333,380 | 5,447,170 |
| Telefonaktiebolaget LM Ericsson (B Shares) | | 1,557,621 | 15,408,263 |
|
| TOTAL SWEDEN | | | 53,851,145 |
|
| Switzerland - 5.8% | | | |
| Alcon, Inc. (a) | | 341,848 | 19,686,580 |
| Julius Baer Group Ltd. | | 255,239 | 12,329,296 |
| Lonza Group AG | | 40,167 | 12,404,747 |
| Medacta Group SA (b) | | 28,700 | 2,629,319 |
| Roche Holding AG (participation certificate) | | 206,257 | 54,423,666 |
| Sig Combibloc Group AG | | 76,293 | 742,751 |
| Sika AG | | 195,010 | 29,855,793 |
| Sonova Holding AG Class B | | 44,091 | 8,892,193 |
| Swiss Re Ltd. | | 143,434 | 13,803,561 |
| UBS Group AG | | 523,716 | 7,023,484 |
|
| TOTAL SWITZERLAND | | | 161,791,390 |
|
| Taiwan - 1.0% | | | |
| Taiwan Semiconductor Manufacturing Co. Ltd. sponsored ADR | | 659,171 | 28,884,873 |
| United Kingdom - 13.0% | | | |
| Admiral Group PLC | | 131,218 | 3,771,226 |
| Aon PLC | | 64,235 | 11,571,293 |
| Ascential PLC | | 1,571,376 | 7,306,999 |
| AstraZeneca PLC (United Kingdom) | | 502,412 | 37,429,597 |
| Beazley PLC | | 841,288 | 6,318,948 |
| Big Yellow Group PLC | | 278,287 | 3,777,646 |
| BP PLC sponsored ADR | | 649,890 | 28,419,690 |
| Bunzl PLC | | 647,971 | 19,509,992 |
| Coca-Cola European Partners PLC | | 202,391 | 10,846,134 |
| Compass Group PLC | | 820,472 | 18,668,905 |
| Halma PLC | | 120,128 | 2,818,861 |
| Hastings Group Holdings PLC (b) | | 933,880 | 2,317,434 |
| InterContinental Hotel Group PLC | | 168,108 | 10,890,493 |
| Lloyds Banking Group PLC | | 26,534,666 | 21,700,990 |
| London Stock Exchange Group PLC | | 313,610 | 20,561,308 |
| Micro Focus International PLC | | 178,954 | 4,521,973 |
| Network International Holdings PLC (b) | | 661,500 | 4,494,125 |
| Ocado Group PLC (a) | | 147,176 | 2,614,876 |
| Prudential PLC | | 1,577,196 | 35,836,072 |
| RELX PLC (Euronext N.V.) | | 1,090,921 | 25,034,385 |
| Rentokil Initial PLC | | 1,157,586 | 5,887,019 |
| Rio Tinto PLC | | 283,491 | 16,538,601 |
| Smith & Nephew PLC | | 766,261 | 14,813,731 |
| Spectris PLC | | 203,838 | 7,304,315 |
| St. James's Place Capital PLC | | 566,109 | 8,278,982 |
| Standard Chartered PLC (United Kingdom) | | 668,308 | 6,100,315 |
| Tesco PLC | | 3,645,993 | 11,895,561 |
| The Weir Group PLC | | 535,795 | 11,594,539 |
|
| TOTAL UNITED KINGDOM | | | 360,824,010 |
|
| United States of America - 6.5% | | | |
| Alphabet, Inc. Class C (a) | | 14,759 | 17,540,776 |
| Amgen, Inc. | | 70,762 | 12,689,042 |
| Becton, Dickinson & Co. | | 46,934 | 11,298,891 |
| Boston Scientific Corp. (a) | | 342,328 | 12,707,215 |
| Citigroup, Inc. | | 163,049 | 11,527,564 |
| Coty, Inc. Class A (c) | | 756,076 | 8,180,742 |
| IQVIA Holdings, Inc. (a) | | 96,661 | 13,426,213 |
| Marsh & McLennan Companies, Inc. | | 85,252 | 8,038,411 |
| MasterCard, Inc. Class A | | 121,602 | 30,916,092 |
| Microsoft Corp. | | 136,306 | 17,801,564 |
| QIAGEN NV (a) | | 162,399 | 6,327,065 |
| Visa, Inc. Class A | | 187,464 | 30,824,706 |
|
| TOTAL UNITED STATES OF AMERICA | | | 181,278,281 |
|
| TOTAL COMMON STOCKS | | | |
| (Cost $2,505,903,496) | | | 2,677,452,371 |
|
| Nonconvertible Preferred Stocks - 0.0% | | | |
| Germany - 0.0% | | | |
| Sartorius AG (non-vtg.) | | | |
| (Cost $769,613) | | 7,649 | 1,400,112 |
|
| Money Market Funds - 4.3% | | | |
| Fidelity Cash Central Fund, 2.49% (f) | | 90,260,619 | 90,278,671 |
| Fidelity Securities Lending Cash Central Fund 2.49% (f)(g) | | 28,342,956 | 28,345,790 |
| TOTAL MONEY MARKET FUNDS | | | |
| (Cost $118,623,839) | | | 118,624,461 |
| TOTAL INVESTMENT IN SECURITIES - 100.5% | | | |
| (Cost $2,625,296,948) | | | 2,797,476,944 |
| NET OTHER ASSETS (LIABILITIES) - (0.5)% | | | (13,218,627) |
| NET ASSETS - 100% | | | $2,784,258,317 |
Categorizations in the Schedule of Investments are based on country or territory of incorporation.
Legend
(a) Non-income producing
(b) Security exempt from registration under Rule 144A of the Securities Act of 1933. These securities may be resold in transactions exempt from registration, normally to qualified institutional buyers. At the end of the period, the value of these securities amounted to $72,620,687 or 2.6% of net assets.
(c) Security or a portion of the security is on loan at period end.
(d) A portion of the security sold on a delayed delivery basis.
(e) Security or a portion of the security purchased on a delayed delivery or when-issued basis.
(f) Affiliated fund that is generally available only to investment companies and other accounts managed by Fidelity Investments. The rate quoted is the annualized seven-day yield of the fund at period end. A complete unaudited listing of the fund's holdings as of its most recent quarter end is available upon request. In addition, each Fidelity Central Fund's financial statements are available on the SEC's website or upon request.
(g) Investment made with cash collateral received from securities on loan.
Affiliated Central Funds
Information regarding fiscal year to date income earned by the Fund from investments in Fidelity Central Funds is as follows:
| Fund | Income earned |
| Fidelity Cash Central Fund | $1,522,976 |
| Fidelity Securities Lending Cash Central Fund | 75,881 |
| Total | $1,598,857 |
Amounts in the income column in the above table include any capital gain distributions from underlying funds, which are presented in the corresponding line-item in the Statement of Operations, if applicable.
Investment Valuation
The following is a summary of the inputs used, as of April 30, 2019, involving the Fund's assets and liabilities carried at fair value. The inputs or methodology used for valuing securities may not be an indication of the risk associated with investing in those securities. For more information on valuation inputs, and their aggregation into the levels used below, please refer to the Investment Valuation section in the accompanying Notes to Financial Statements.
| | Valuation Inputs at Reporting Date: |
| Description | Total | Level 1 | Level 2 | Level 3 |
| Investments in Securities: | | | | |
| Equities: | | | | |
| Communication Services | $83,981,042 | $45,147,261 | $38,833,781 | $-- |
| Consumer Discretionary | 212,897,712 | 151,559,018 | 61,338,694 | -- |
| Consumer Staples | 228,918,556 | 167,504,065 | 61,414,491 | -- |
| Energy | 110,247,795 | 110,247,795 | -- | -- |
| Financials | 634,024,836 | 350,265,373 | 283,759,463 | -- |
| Health Care | 387,467,726 | 204,491,177 | 182,976,549 | -- |
| Industrials | 407,388,864 | 305,564,001 | 101,824,863 | -- |
| Information Technology | 426,856,041 | 352,493,913 | 74,362,128 | -- |
| Materials | 151,213,085 | 103,755,026 | 47,458,059 | -- |
| Real Estate | 17,960,328 | 17,960,328 | -- | -- |
| Utilities | 17,896,498 | 17,896,498 | -- | -- |
| Money Market Funds | 118,624,461 | 118,624,461 | -- | -- |
| Total Investments in Securities: | $2,797,476,944 | $1,945,508,916 | $851,968,028 | $-- |
See accompanying notes which are an integral part of the financial statements.
Financial Statements
Statement of Assets and Liabilities
| | | April 30, 2019 (Unaudited) |
| Assets | | |
Investment in securities, at value (including securities loaned of $27,319,025) — See accompanying schedule:
Unaffiliated issuers (cost $2,506,673,109) | $2,678,852,483 | |
| Fidelity Central Funds (cost $118,623,839) | 118,624,461 | |
| Total Investment in Securities (cost $2,625,296,948) | | $2,797,476,944 |
| Foreign currency held at value (cost $372,451) | | 372,452 |
| Receivable for investments sold | | |
| Regular delivery | | 4,885,396 |
| Delayed delivery | | 10,327,079 |
| Receivable for fund shares sold | | 1,544,380 |
| Dividends receivable | | 10,613,438 |
| Distributions receivable from Fidelity Central Funds | | 278,900 |
| Other receivables | | 104,731 |
| Total assets | | 2,825,603,320 |
| Liabilities | | |
| Payable for investments purchased | | |
| Regular delivery | $4,298,479 | |
| Delayed delivery | 3,219,136 | |
| Payable for fund shares redeemed | 2,403,326 | |
| Accrued management fee | 1,371,044 | |
| Other payables and accrued expenses | 1,707,228 | |
| Collateral on securities loaned | 28,345,790 | |
| Total liabilities | | 41,345,003 |
| Net Assets | | $2,784,258,317 |
| Net Assets consist of: | | |
| Paid in capital | | $2,816,093,234 |
| Total distributable earnings (loss) | | (31,834,917) |
| Net Assets, for 266,082,779 shares outstanding | | $2,784,258,317 |
| Net Asset Value, offering price and redemption price per share ($2,784,258,317 ÷ 266,082,779 shares) | | $10.46 |
See accompanying notes which are an integral part of the financial statements.
Statement of Operations
| | | Six months ended April 30, 2019 (Unaudited) |
| Investment Income | | |
| Dividends | | $23,986,985 |
| Non-Cash dividends | | 4,466,669 |
| Income from Fidelity Central Funds | | 1,598,857 |
| Total income | | 30,052,511 |
| Expenses | | |
| Management fee | $7,318,056 | |
| Independent trustees' fees and expenses | 6,497 | |
| Commitment fees | 3,383 | |
| Total expenses before reductions | 7,327,936 | |
| Expense reductions | (122,647) | |
| Total expenses after reductions | | 7,205,289 |
| Net investment income (loss) | | 22,847,222 |
| Realized and Unrealized Gain (Loss) | | |
| Net realized gain (loss) on: | | |
| Investment securities: | | |
| Unaffiliated issuers | (146,112,877) | |
| Fidelity Central Funds | (708) | |
| Foreign currency transactions | (35,244) | |
| Total net realized gain (loss) | | (146,148,829) |
| Change in net unrealized appreciation (depreciation) on: | | |
| Investment securities: | | |
| Unaffiliated issuers (net of increase in deferred foreign taxes of $1,707,074) | 360,249,465 | |
| Fidelity Central Funds | 622 | |
| Assets and liabilities in foreign currencies | (1,201) | |
| Total change in net unrealized appreciation (depreciation) | | 360,248,886 |
| Net gain (loss) | | 214,100,057 |
| Net increase (decrease) in net assets resulting from operations | | $236,947,279 |
See accompanying notes which are an integral part of the financial statements.
Statement of Changes in Net Assets
| | Six months ended April 30, 2019 (Unaudited) | Year ended October 31, 2018 |
| Increase (Decrease) in Net Assets | | |
| Operations | | |
| Net investment income (loss) | $22,847,222 | $29,005,340 |
| Net realized gain (loss) | (146,148,829) | (76,202,056) |
| Change in net unrealized appreciation (depreciation) | 360,248,886 | (195,652,805) |
| Net increase (decrease) in net assets resulting from operations | 236,947,279 | (242,849,521) |
| Distributions to shareholders | (29,912,287) | (1,421,142) |
| Share transactions | | |
| Proceeds from sales of shares | 688,197,005 | 2,562,853,883 |
| Reinvestment of distributions | 29,912,287 | 1,421,142 |
| Cost of shares redeemed | (348,240,738) | (408,795,237) |
| Net increase (decrease) in net assets resulting from share transactions | 369,868,554 | 2,155,479,788 |
| Total increase (decrease) in net assets | 576,903,546 | 1,911,209,125 |
| Net Assets | | |
| Beginning of period | 2,207,354,771 | 296,145,646 |
| End of period | $2,784,258,317 | $2,207,354,771 |
| Other Information | | |
| Shares | | |
| Sold | 71,381,832 | 238,286,615 |
| Issued in reinvestment of distributions | 3,226,784 | 133,315 |
| Redeemed | (36,380,915) | (38,373,698) |
| Net increase (decrease) | 38,227,701 | 200,046,232 |
See accompanying notes which are an integral part of the financial statements.
Financial Highlights
Fidelity Diversified International K6 Fund
| | Six months ended (Unaudited) April 30, | Years endedOctober 31, | |
| | 2019 | 2018 | 2017 A |
| Selected Per–Share Data | | | |
| Net asset value, beginning of period | $9.69 | $10.65 | $10.00 |
| Income from Investment Operations | | | |
| Net investment income (loss)B | .09 | .18 | .03C |
| Net realized and unrealized gain (loss) | .81 | (1.12) | .62 |
| Total from investment operations | .90 | (.94) | .65 |
| Distributions from net investment income | (.13) | (.02) | – |
| Distributions from net realized gain | – | (.01) | – |
| Total distributions | (.13) | (.02)D | – |
| Net asset value, end of period | $10.46 | $9.69 | $10.65 |
| Total ReturnE,F | 9.40% | (8.83)% | 6.50% |
| Ratios to Average Net AssetsG,H | | | |
| Expenses before reductions | .60%I | .60% | .60%I |
| Expenses net of fee waivers, if any | .60%I | .60% | .60%I |
| Expenses net of all reductions | .59%I | .58% | .60%I |
| Net investment income (loss) | 1.87%I | 1.67% | .64%C,I |
| Supplemental Data | | | |
| Net assets, end of period (000 omitted) | $2,784,258 | $2,207,355 | $296,146 |
| Portfolio turnover rateJ | 57%I,K | 48%K | 27%K,L |
A For the period May 25, 2017 (commencement of operations) to October 31, 2017.
B Calculated based on average shares outstanding during the period.
C Net investment income per share reflects a large, non-recurring dividend which amounted to $.01 per share. Excluding this non-recurring dividend, the ratio of net investment income (loss) to average net assets would have been .58%.
D Total distributions of $.02 per share is comprised of distributions from net investment income of $.016 and distributions from net realized gain of $.005 per share.
E Total returns for periods of less than one year are not annualized.
F Total returns would have been lower if certain expenses had not been reduced during the applicable periods shown.
G Fees and expenses of any underlying Fidelity Central Funds are not included in the Fund's expense ratio. The Fund indirectly bears its proportionate share of the expenses of any underlying Fidelity Central Funds.
H Expense ratios reflect operating expenses of the Fund. Expenses before reductions do not reflect amounts reimbursed by the investment adviser or reductions from brokerage service arrangements or reductions from other expense offset arrangements and do not represent the amount paid by the Fund during periods when reimbursements or reductions occur. Expense ratios before reductions for start-up periods may not be representative of longer term operating periods. Expenses net of fee waivers reflect expenses after reimbursement by the investment adviser but prior to reductions from brokerage service arrangements or other expense offset arrangements. Expenses net of all reductions represent the net expenses paid by the Fund.
I Annualized
J Amount does not include the portfolio activity of any underlying Fidelity Central Funds.
K Portfolio turnover rate excludes securities received or delivered in-kind.
L Amount not annualized.
See accompanying notes which are an integral part of the financial statements.
Notes to Financial Statements (Unaudited)
For the period ended April 30, 2019
1. Organization.
Fidelity Diversified International K6 Fund (the Fund) is a fund of Fidelity Investment Trust (the Trust) and is authorized to issue an unlimited number of shares. Share transactions on the Statement of Changes in Net Assets may contain exchanges between affiliated funds. The Trust is registered under the Investment Company Act of 1940, as amended (the 1940 Act), as an open-end management investment company organized as a Massachusetts business trust. Shares generally are available only to employer-sponsored retirement plans that are recordkept by Fidelity, or to certain employer-sponsored retirement plans that are not recordkept by Fidelity. The Fund's investments in emerging markets can be subject to social, economic, regulatory, and political uncertainties and can be extremely volatile.
2. Investments in Fidelity Central Funds.
The Fund invests in Fidelity Central Funds, which are open-end investment companies generally available only to other investment companies and accounts managed by the investment adviser and its affiliates. The Fund's Schedule of Investments lists each of the Fidelity Central Funds held as of period end, if any, as an investment of the Fund, but does not include the underlying holdings of each Fidelity Central Fund. As an Investing Fund, the Fund indirectly bears its proportionate share of the expenses of the underlying Fidelity Central Funds.
The Money Market Central Funds seek preservation of capital and current income and are managed by Fidelity Investments Money Management, Inc. (FIMM), an affiliate of the investment adviser. Annualized expenses of the Money Market Central Funds as of their most recent shareholder report date are less than .005%.
A complete unaudited list of holdings for each Fidelity Central Fund is available upon request or at the Securities and Exchange Commission (the SEC) website at www.sec.gov. In addition, the financial statements of the Fidelity Central Funds are available on the SEC website or upon request.
3. Significant Accounting Policies.
The Fund is an investment company and applies the accounting and reporting guidance of the Financial Accounting Standards Board (FASB) Accounting Standards Codification Topic 946 Financial Services – Investments Companies. The financial statements have been prepared in conformity with accounting principles generally accepted in the United States of America (GAAP), which require management to make certain estimates and assumptions at the date of the financial statements. Actual results could differ from those estimates. Subsequent events, if any, through the date that the financial statements were issued have been evaluated in the preparation of the financial statements. The following summarizes the significant accounting policies of the Fund:
Investment Valuation. Investments are valued as of 4:00 p.m. Eastern time on the last calendar day of the period. The Board of Trustees (the Board) has delegated the day to day responsibility for the valuation of the Fund's investments to the Fair Value Committee (the Committee) established by the Fund's investment adviser. In accordance with valuation policies and procedures approved by the Board, the Fund attempts to obtain prices from one or more third party pricing vendors or brokers to value its investments. When current market prices, quotations or currency exchange rates are not readily available or reliable, investments will be fair valued in good faith by the Committee, in accordance with procedures adopted by the Board. Factors used in determining fair value vary by investment type and may include market or investment specific events. The frequency with which these procedures are used cannot be predicted and they may be utilized to a significant extent. The Committee oversees the Fund's valuation policies and procedures and reports to the Board on the Committee's activities and fair value determinations. The Board monitors the appropriateness of the procedures used in valuing the Fund's investments and ratifies the fair value determinations of the Committee.
The Fund categorizes the inputs to valuation techniques used to value its investments into a disclosure hierarchy consisting of three levels as shown below:
- Level 1 – quoted prices in active markets for identical investments
- Level 2 – other significant observable inputs (including quoted prices for similar investments, interest rates, prepayment speeds, etc.)
- Level 3 – unobservable inputs (including the Fund's own assumptions based on the best information available)
Valuation techniques used to value the Fund's investments by major category are as follows:
Equity securities, including restricted securities, for which market quotations are readily available, are valued at the last reported sale price or official closing price as reported by a third party pricing vendor on the primary market or exchange on which they are traded and are categorized as Level 1 in the hierarchy. In the event there were no sales during the day or closing prices are not available, securities are valued at the last quoted bid price or may be valued using the last available price and are generally categorized as Level 2 in the hierarchy. For foreign equity securities, when market or security specific events arise, comparisons to the valuation of American Depositary Receipts (ADRs), futures contracts, Exchange-Traded Funds (ETFs) and certain indexes as well as quoted prices for similar securities may be used and would be categorized as Level 2 in the hierarchy. For equity securities, including restricted securities, where observable inputs are limited, assumptions about market activity and risk are used and these securities may be categorized as Level 3 in the hierarchy.
Investments in open-end mutual funds, including the Fidelity Central Funds, are valued at their closing net asset value (NAV) each business day and are categorized as Level 1 in the hierarchy.
Changes in valuation techniques may result in transfers in or out of an assigned level within the disclosure hierarchy. The aggregate value of investments by input level as of April 30, 2019, is included at the end of the Fund's Schedule of Investments.
Foreign Currency. The Fund may use foreign currency contracts to facilitate transactions in foreign-denominated securities. Gains and losses from these transactions may arise from changes in the value of the foreign currency or if the counterparties do not perform under the contracts' terms.
Foreign-denominated assets, including investment securities, and liabilities are translated into U.S. dollars at the exchange rates at period end. Purchases and sales of investment securities, income and dividends received and expenses denominated in foreign currencies are translated into U.S. dollars at the exchange rate in effect on the transaction date.
The effects of exchange rate fluctuations on investments are included with the net realized and unrealized gain (loss) on investment securities. Other foreign currency transactions resulting in realized and unrealized gain (loss) are disclosed separately.
Investment Transactions and Income. For financial reporting purposes, the Fund's investment holdings and NAV include trades executed through the end of the last business day of the period. The NAV per share for processing shareholder transactions is calculated as of the close of business of the New York Stock Exchange (NYSE), normally 4:00 p.m. Eastern time and includes trades executed through the end of the prior business day. Gains and losses on securities sold are determined on the basis of identified cost. Dividend income is recorded on the ex-dividend date, except for certain dividends from foreign securities where the ex-dividend date may have passed, which are recorded as soon as the Fund is informed of the ex-dividend date. Non-cash dividends included in dividend income, if any, are recorded at the fair market value of the securities received. Income and capital gain distributions from Fidelity Central Funds, if any, are recorded on the ex-dividend date. Certain distributions received by the Fund represent a return of capital or capital gain. The Fund determines the components of these distributions subsequent to the ex-dividend date, based upon receipt of tax filings or other correspondence relating to the underlying investment. These distributions are recorded as a reduction of cost of investments and/or as a realized gain. Investment income is recorded net of foreign taxes withheld where recovery of such taxes is uncertain.
Expenses. Expenses directly attributable to a fund are charged to that fund. Expenses attributable to more than one fund are allocated among the respective funds on the basis of relative net assets or other appropriate methods. Expense estimates are accrued in the period to which they relate and adjustments are made when actual amounts are known.
Income Tax Information and Distributions to Shareholders. Each year, the Fund intends to qualify as a regulated investment company under Subchapter M of the Internal Revenue Code, including distributing substantially all of its taxable income and realized gains. As a result, no provision for U.S. Federal income taxes is required. The Fund files a U.S. federal tax return, in addition to state and local tax returns as required. The Fund's federal income tax returns are subject to examination by the Internal Revenue Service (IRS) for a period of three fiscal years after they are filed. State and local tax returns may be subject to examination for an additional fiscal year depending on the jurisdiction. Foreign taxes are provided for based on the Fund's understanding of the tax rules and rates that exist in the foreign markets in which it invests. The Fund is subject to a tax imposed on capital gains by certain countries in which it invests. An estimated deferred tax liability for net unrealized appreciation on the applicable securities is included in Other payables and accrued expenses on the Statement of Assets & Liabilities.
Distributions are declared and recorded on the ex-dividend date. Income and capital gain distributions are determined in accordance with income tax regulations, which may differ from GAAP.
Capital accounts within the financial statements are adjusted for permanent book-tax differences. These adjustments have no impact on net assets or the results of operations. Capital accounts are not adjusted for temporary book-tax differences which will reverse in a subsequent period.
Book-tax differences are primarily due to foreign currency transactions, passive foreign investment companies (PFIC), certain foreign taxes, capital loss carryforwards and losses deferred due to wash sales.
As of period end, the cost and unrealized appreciation (depreciation) in securities, and derivatives if applicable, for federal income tax purposes were as follows:
| Gross unrealized appreciation | $272,545,222 |
| Gross unrealized depreciation | (105,454,439) |
| Net unrealized appreciation (depreciation) | $167,090,783 |
| Tax Cost | $2,630,386,161 |
Capital loss carryforwards are only available to offset future capital gains of the Fund to the extent provided by regulations and may be limited. Under the Regulated Investment Company Modernization Act of 2010 (the Act), the Fund is permitted to carry forward capital losses incurred in taxable years beginning after December 22, 2010 for an unlimited period and such capital losses are required to be used prior to any losses that expire. The capital loss carryforward information presented below, including any applicable limitation, is estimated as of prior fiscal period end and is subject to adjustment.
| No expiration | |
| Short-term | $(73,286,177) |
| Long-term | (498,463) |
| Total capital loss carryforward | $(73,784,640) |
Due to large subscriptions in a prior period, $154,447 of the Fund's capital losses are subject to limitation. Due to this limitation, the Fund will only be permitted to use approximately $41,863 of those $154,447 of capital losses per year to offset capital gains. The remainder of the Fund's capital losses are not subject to this limitation.
Delayed Delivery Transactions and When-Issued Securities. During the period, the Fund transacted in securities on a delayed delivery or when-issued basis. Payment and delivery may take place after the customary settlement period for that security. The price of the underlying securities and the date when the securities will be delivered and paid for are fixed at the time the transaction is negotiated. The securities purchased on a delayed delivery or when-issued basis are identified as such in the Fund's Schedule of Investments. Losses may arise due to changes in the value of the underlying securities or if the counterparty does not perform under the contract's terms, or if the issuer does not issue the securities due to political, economic, or other factors.
Restricted Securities. The Fund may invest in securities that are subject to legal or contractual restrictions on resale. These securities generally may be resold in transactions exempt from registration or to the public if the securities are registered. Disposal of these securities may involve time-consuming negotiations and expense, and prompt sale at an acceptable price may be difficult. Information regarding restricted securities is included at the end of the Fund's Schedule of Investments.
4. Purchases and Sales of Investments.
Purchases and sales of securities, other than short-term securities and in-kind transactions, aggregated $772,143,193 and $651,817,927, respectively.
Unaffiliated Exchanges In-Kind. During the period, 32,329,680 shares of the Fund were redeemed in-kind for investments and cash with a value of $307,954,122. The amount of the in-kind redemptions is included in share transactions in the accompanying Statement of Changes in Net Assets. The Fund recognized no gain or loss for federal income tax purposes.
Prior Fiscal Year Exchanges In-Kind. During the prior period, investments and cash received in-kind through subscriptions totaled $1,914,771,242 in exchange for 177,875,328 shares of the Fund. The amount of in-kind exchanges is included in share transactions in the accompanying Statement of Changes in Net Assets. The Fund recognized no gain or loss for federal income tax purposes.
5. Fees and Other Transactions with Affiliates.
Management Fee. Fidelity Management & Research Company (the investment adviser) and its affiliates provide the Fund with investment management related services for which the Fund pays a monthly management fee that is based on an annual rate of .60% of average net assets. Under the management contract, the investment adviser or an affiliate pays all other expenses of the Fund, excluding fees and expenses of the independent Trustees, and certain miscellaneous expenses such as proxy and shareholder meeting expenses.
Brokerage Commissions. The Fund placed a portion of its portfolio transactions with brokerage firms which are affiliates of the investment adviser. Brokerage commissions are included in net realized gain (loss) and change in net unrealized appreciation (depreciation) in the Statement of Operations. The commissions paid to these affiliated firms were $1,598 for the period.
Interfund Trades. The Fund may purchase from or sell securities to other Fidelity Funds under procedures adopted by the Board. The procedures have been designed to ensure these interfund trades are executed in accordance with Rule 17a-7 of the 1940 Act. Interfund trades are included within the respective purchases and sales amounts shown in the Purchases and Sales of Investments note.
6. Committed Line of Credit.
The Fund participates with other funds managed by the investment adviser or an affiliate in a $4.25 billion credit facility (the "line of credit") to be utilized for temporary or emergency purposes to fund shareholder redemptions or for other short-term liquidity purposes. The Fund has agreed to pay commitment fees on its pro-rata portion of the line of credit, which amounted to $3,383 and is reflected in Commitment fees on the Statement of Operations. During the period, the Fund did not borrow on this line of credit.
7. Security Lending.
The Fund lends portfolio securities through a lending agent from time to time in order to earn additional income. For equity securities, a lending agent is used and may loan securities to certain qualified borrowers, including Fidelity Capital Markets (FCM), a broker-dealer affiliated with the Fund. On the settlement date of the loan, the Fund receives collateral (in the form of U.S. Treasury obligations, letters of credit and/or cash) against the loaned securities and maintains collateral in an amount not less than 100% of the market value of the loaned securities during the period of the loan. The market value of the loaned securities is determined at the close of business of the Fund and any additional required collateral is delivered to the Fund on the next business day. The Fund or borrower may terminate the loan at any time, and if the borrower defaults on its obligation to return the securities loaned because of insolvency or other reasons, the Fund may apply collateral received from the borrower against the obligation. The Fund may experience delays and costs in recovering the securities loaned. Any cash collateral received is invested in the Fidelity Securities Lending Cash Central Fund. The value of loaned securities and cash collateral at period end are disclosed on the Fund's Statement of Assets and Liabilities. Security lending income represents the income earned on investing cash collateral, less rebates paid to borrowers and any lending agent fees associated with the loan, plus any premium payments received for lending certain types of securities. Security lending income is presented in the Statement of Operations as a component of income from Fidelity Central Funds. Total security lending income during the period amounted to $75,881. During the period, there were no securities loaned to FCM.
8. Expense Reductions.
Commissions paid to certain brokers with whom the investment adviser, or its affiliates, places trades on behalf of the Fund include an amount in addition to trade execution, which may be rebated back to the Fund to offset certain expenses. This amount totaled $122,440 for the period. In addition, through arrangements with the Fund's custodian, credits realized as a result of certain uninvested cash balances were used to reduce the Fund's expenses. During the period, these credits reduced the Fund's custody expenses by $207.
9. Other.
The Fund's organizational documents provide former and current trustees and officers with a limited indemnification against liabilities arising in connection with the performance of their duties to the Fund. In the normal course of business, the Fund may also enter into contracts that provide general indemnifications. The Fund's maximum exposure under these arrangements is unknown as this would be dependent on future claims that may be made against the Fund. The risk of material loss from such claims is considered remote.
Shareholder Expense Example
As a shareholder of the Fund, you incur two types of costs: (1) transaction costs and (2) ongoing costs, including management fees and other Fund expenses. This Example is intended to help you understand your ongoing costs (in dollars) of investing in the Fund and to compare these costs with the ongoing costs of investing in other mutual funds.
The Example is based on an investment of $1,000 invested at the beginning of the period and held for the entire period (November 1, 2018 to April 30, 2019).
Actual Expenses
The first line of the accompanying table provides information about actual account values and actual expenses. You may use the information in this line, together with the amount you invested, to estimate the expenses that you paid over the period. Simply divide your account value by $1,000.00 (for example, an $8,600 account value divided by $1,000.00 = 8.6), then multiply the result by the number in the first line under the heading entitled "Expenses Paid During Period" to estimate the expenses you paid on your account during this period. In addition, the Fund, as a shareholder in the underlying Fidelity Central Funds, will indirectly bear its pro-rata share of the fees and expenses incurred by the underlying Fidelity Central Funds. These fees and expenses are not included in the Fund's annualized expense ratio used to calculate the expense estimate in the table below.
Hypothetical Example for Comparison Purposes
The second line of the accompanying table provides information about hypothetical account values and hypothetical expenses based on the Fund's actual expense ratio and an assumed rate of return of 5% per year before expenses, which is not the Fund's actual return. The hypothetical account values and expenses may not be used to estimate the actual ending account balance or expenses you paid for the period. You may use this information to compare the ongoing costs of investing in the Fund and other funds. To do so, compare this 5% hypothetical example with the 5% hypothetical examples that appear in the shareholder reports of the other funds. In addition, the Fund, as a shareholder in the underlying Fidelity Central Funds, will indirectly bear its pro-rata share of the fees and expenses incurred by the underlying Fidelity Central Funds. These fees and expenses are not included in the Fund's annualized expense ratio used to calculate the expense estimate in the table below.
Please note that the expenses shown in the table are meant to highlight your ongoing costs only and do not reflect any transaction costs. Therefore, the second line of the table is useful in comparing ongoing costs only, and will not help you determine the relative total costs of owning different funds.
| | Annualized Expense Ratio-A | Beginning
Account Value
November 1, 2018 | Ending
Account Value
April 30, 2019 | Expenses Paid
During Period-B
November 1, 2018
to April 30, 2019 |
| Actual | .60% | $1,000.00 | $1,094.00 | $3.12 |
| Hypothetical-C | | $1,000.00 | $1,021.82 | $3.01 |
A Annualized expense ratio reflects expenses net of applicable fee waivers.
B Expenses are equal to the Fund's annualized expense ratio, multiplied by the average account value over the period, multiplied by 181/365 (to reflect the one-half year period).
C 5% return per year before expenses
Board Approval of Investment Advisory Contracts and Management Fees
Fidelity Diversified International K6 Fund
Each year, the Board of Trustees, including the Independent Trustees (together, the Board), votes on the renewal of the management contract with Fidelity Management & Research Company (FMR) and the sub-advisory agreements (together, the Advisory Contracts) for the fund. FMR and the sub-advisers are referred to herein as the Investment Advisers. The Board, assisted by the advice of fund counsel and Independent Trustees' counsel, requests and considers a broad range of information relevant to the renewal of the Advisory Contracts throughout the year.
The Board meets regularly and, at each of its meetings, covers an extensive agenda of topics and materials and considers factors that are relevant to its annual consideration of the renewal of the fund's Advisory Contracts, including the services and support provided to the fund and its shareholders. The Board has established various standing committees (Committees), each composed of and chaired by Independent Trustees with varying backgrounds, to which the Board has assigned specific subject matter responsibilities in order to enhance effective decision-making by the Board. The Board, acting directly and through its Committees, requests and receives information concerning the annual consideration of the renewal of the fund's Advisory Contracts. The Board also meets as needed to review matters specifically related to the Board's annual consideration of the renewal of the Advisory Contracts. Members of the Board may also meet with trustees of other Fidelity funds through joint ad hoc committees to discuss certain matters relevant to all of the Fidelity funds.
At its January 2019 meeting, the Board unanimously determined to renew the fund's Advisory Contracts. In reaching its determination, the Board considered all factors it believed relevant, including (i) the nature, extent, and quality of the services to be provided to the fund and its shareholders (including the investment performance of the fund); (ii) the competitiveness of the fund's management fee and total expense ratio relative to peer funds; (iii) the total costs of the services to be provided by and the profits to be realized by Fidelity from its relationships with the fund; and (iv) the extent to which, if any, economies of scale exist and would be realized as the fund grows, and whether any economies of scale are appropriately shared with fund shareholders.
In considering whether to renew the Advisory Contracts for the fund, the Board reached a determination, with the assistance of fund counsel and Independent Trustees' counsel and through the exercise of its business judgment, that the renewal of the Advisory Contracts was in the best interests of the fund and its shareholders and that the compensation payable under the Advisory Contracts was fair and reasonable. The Board's decision to renew the Advisory Contracts was not based on any single factor, but rather was based on a comprehensive consideration of all the information provided to the Board at its meetings throughout the year. The Board, in reaching its determination to renew the Advisory Contracts, was aware that shareholders of the fund have a broad range of investment choices available to them, including a wide choice among funds offered by Fidelity's competitors, and that the fund's shareholders, who have the opportunity to review and weigh the disclosure provided by the fund in its prospectus and other public disclosures, have chosen to invest in this fund, which is part of the Fidelity family of funds.
Nature, Extent, and Quality of Services Provided. The Board considered Fidelity's staffing as it relates to the fund, including the backgrounds of investment personnel of Fidelity, and also considered the fund's investment objective, strategies, and related investment philosophy. The Independent Trustees also had discussions with senior management of Fidelity's investment operations and investment groups. The Board considered the structure of the investment personnel compensation program and whether this structure provides appropriate incentives to act in the best interests of the fund. Additionally, the Board considered the portfolio managers' investments, if any, in the funds that they manage.
Resources Dedicated to Investment Management and Support Services. The Board and the Fund Oversight and Research Committees reviewed the general qualifications and capabilities of Fidelity's investment staff, including its size, education, experience, and resources, as well as Fidelity's approach to recruiting, training, managing, and compensating investment personnel. The Board noted that Fidelity has continued to increase the resources devoted to non-U.S. offices, including expansion of Fidelity's global investment organization. The Board also noted that Fidelity's analysts have extensive resources, tools and capabilities that allow them to conduct sophisticated quantitative and fundamental analysis, as well as credit analysis of issuers, counterparties and guarantors. Further, the Board considered that Fidelity's investment professionals have sufficient access to global information and data so as to provide competitive investment results over time, and that those professionals also have access to sophisticated tools that permit them to assess portfolio construction and risk and performance attribution characteristics continuously, as well as to transmit new information and research conclusions rapidly around the world. Additionally, in its deliberations, the Board considered Fidelity's trading, risk management, compliance, and technology and operations capabilities and resources, which are integral parts of the investment management process.
Shareholder and Administrative Services. The Board considered (i) the nature, extent, quality, and cost of advisory, administrative, and shareholder services performed by the Investment Advisers and their affiliates under the Advisory Contracts and under separate agreements covering transfer agency, pricing and bookkeeping, and securities lending services for the fund; (ii) the nature and extent of the supervision of third party service providers, principally custodians, subcustodians, and pricing vendors; and (iii) the resources devoted to, and the record of compliance with, the fund's compliance policies and procedures. The Board also reviewed the allocation of fund brokerage, including allocations to brokers affiliated with the Investment Advisers, the use of brokerage commissions to pay fund expenses, and the use of "soft" commission dollars to pay for research services.
The Board noted that the growth of fund assets over time across the complex allows Fidelity to reinvest in the development of services designed to enhance the value and convenience of the Fidelity funds as investment vehicles. These services include 24-hour access to account information and market information through telephone representatives and over the Internet, investor education materials and asset allocation tools, and the expanded availability of Fidelity Investor Centers.
The Board noted that it and the boards of certain other Fidelity funds had formed an ad hoc Committee on Transfer Agency Fees to review the variety of transfer agency fee structures throughout the industry and Fidelity's competitive positioning with respect to industry participants.
Investment in a Large Fund Family. The Board considered the benefits to shareholders of investing in a Fidelity fund, including the benefits of investing in a fund that is part of a large family of funds offering a variety of investment disciplines and providing a large variety of mutual fund investor services. The Board noted that Fidelity had taken, or had made recommendations that resulted in the Fidelity funds taking, a number of actions over the previous year that benefited particular funds, including: (i) continuing to dedicate additional resources to Fidelity's investment research process, which includes meetings with management of issuers of securities in which the funds invest, and to the support of the senior management team that oversees asset management; (ii) continuing efforts to enhance Fidelity's global research capabilities; (iii) launching new funds and making other enhancements to meet client needs; (iv) launching new share classes of existing funds; (v) eliminating purchase minimums and broadening eligibility requirements for certain funds and share classes; (vi) reducing management fees and total expenses for certain growth equity funds and index funds; (vii) lowering expense caps for certain existing funds and classes, and converting certain voluntary expense caps to contractual caps, to reduce expenses borne by shareholders; (viii) eliminating short-term redemption fees for funds that had such fees; (ix) rationalizing product lines and gaining increased efficiencies from fund mergers and share class consolidations; (x) continuing to develop, acquire and implement systems and technology to improve services to the funds and shareholders, strengthen information security, and increase efficiency; and (xi) continuing to implement enhancements to further strengthen Fidelity's product line to increase investors' probability of success in achieving their investment goals, including retirement income goals.
Investment Performance. The Board considered whether the fund has operated in accordance with its investment objective, as well as its record of compliance with its investment restrictions and its performance history.
The Board took into account discussions that occur at Board meetings throughout the year with representatives of the Investment Advisers about fund investment performance. In this regard the Board noted that as part of regularly scheduled fund reviews and other reports to the Board on fund performance, the Board considers annualized return information for the fund for different time periods, measured against an appropriate securities market index ("benchmark index") and a peer group of funds with similar objectives ("peer group"), if any. In its evaluation of fund investment performance, the Board gave particular attention to information indicating changes in performance of certain Fidelity funds for specific time periods and discussed with the Investment Advisers the reasons for any overperformance or underperformance.
In addition to reviewing absolute and relative fund performance, the Independent Trustees periodically consider the appropriateness of fund performance metrics in evaluating the results achieved. In general, the Independent Trustees believe that fund performance should be evaluated based on net performance (after fees and expenses) of both the highest performing and lowest performing fund share classes, where applicable, compared to appropriate benchmark indices, over appropriate time periods that may include full market cycles, and compared to peer groups, as applicable, over the same periods, taking into account relevant factors including the following: general market conditions; issuer-specific information; and fund cash flows and other factors.
The Independent Trustees recognize that shareholders evaluate performance on a net basis over their own holding periods, for which one-, three-, and five-year periods are often used as a proxy. For this reason, the performance information reviewed by the Board also included net total return information for the fund and an appropriate benchmark index and peer group for the most recent one-year period ended June 30, 2018, as shown below. Returns are shown compared to the 25th percentile (top of box, 75% beaten) and 75th percentile (bottom of box, 25% beaten) of the peer universe. Returns of the benchmark index are "net MA,"
i.e., adjusted for tax withholding rates applicable to U.S.-based funds organized as Massachusetts business trusts.
Fidelity Diversified International K6 Fund

Based on its review, the Board concluded that the nature, extent, and quality of services provided to the fund under the Advisory Contracts should continue to benefit the shareholders of the fund.
Competitiveness of Management Fee and Total Expense Ratio. The Board considered the fund's management fee and total expense ratio compared to "mapped groups" of competitive funds and classes created for the purpose of facilitating the Trustees' competitive analysis of management fees and total expenses. Fidelity creates "mapped groups" by combining similar Lipper investment objective categories that have comparable investment mandates. Combining Lipper investment objective categories aids the Board's management fee and total expense ratio comparisons by broadening the competitive group used for comparison.
Management Fee. The Board considered two proprietary management fee comparisons for the 12-month period ended June 30 shown in basis points (BP) in the chart below. The group of Lipper funds used by the Board for management fee comparisons is referred to below as the "Total Mapped Group." The Total Mapped Group comparison focuses on a fund's standing in terms of gross management fees before expense reimbursements or caps relative to the total universe of funds with comparable investment mandates, regardless of whether their management fee structures also are comparable. Funds with comparable investment mandates offer exposure to similar types of securities. Funds with comparable management fee structures have similar management fee contractual arrangements (
e.g., flat rate charged for advisory services, all-inclusive fee rate,
etc.). "TMG %" represents the percentage of funds in the Total Mapped Group that had management fees that were lower than the fund's. For example, a hypothetical TMG % of 20% would mean that 80% of the funds in the Total Mapped Group had higher, and 20% had lower, management fees than the fund. The fund's actual TMG % and the number of funds in the Total Mapped Group are in the chart below. The "Asset-Size Peer Group" (ASPG) comparison focuses on a fund's standing relative to a subset of non-Fidelity funds within the Total Mapped Group that are similar in size and management fee structure. For example, if a fund is in the first quartile of the ASPG, the fund's management fee ranks in the least expensive or lowest 25% of funds in the ASPG. The ASPG represents at least 15% of the funds in the Total Mapped Group with comparable asset size and management fee structures, subject to a minimum of 50 funds (or all funds in the Total Mapped Group if fewer than 50). Additional information, such as the ASPG quartile in which the fund's management fee rate ranked, is also included in the chart and was considered by the Board.
Fidelity Diversified International K6 Fund
The Board noted that the fund's management fee rate ranked below the median of its Total Mapped Group and below the median of its ASPG for the 12-month period ended June 30, 2018.
The Board noted that it and the boards of other Fidelity funds formed an ad hoc Committee on Group Fee, which meets periodically, to conduct an in-depth review of the "group fee" component of the management fee of funds with such management fee structures. The Committee's focus included the mechanics of the group fee, the competitive landscape of group fee structures, Fidelity funds with no group fee component (such as the fund) and investment products not included in group fee assets. The Board also considered that, for funds subject to the group fee, FMR agreed to voluntarily waive fees over a specified period of time in amounts designed to account for assets converted from certain funds to certain collective investment trusts.
The Board also noted that, in 2013, the ad hoc Committee on Management Fees was formed to conduct an in-depth review of the management fee rates of Fidelity's active equity mutual funds. The Committee focused on the following areas: (i) standard fee structures; (ii) research consumption and trading evolution; (iii) management fee competitiveness/profitability by category; and (iv) factors that drive institutional pricing.
Based on its review, the Board concluded that the fund's management fee is fair and reasonable in light of the services that the fund receives and the other factors considered.
Total Expense Ratio. In its review of the fund's total expense ratio, the Board considered the fund's unitary fee rate as well as other fund expenses paid by FMR under the fund's management contract, such as transfer agent fees, pricing and bookkeeping fees, and custodial, legal, and audit fees. The Board also noted that Fidelity may agree to waive fees and expenses from time to time, and the extent to which, if any, it has done so for the fund. As part of its review, the Board also considered the current total expense ratio of the fund compared to competitive fund median expenses. The fund is compared to those funds in the Total Mapped Group (used by the Board for management fee comparisons) that have a similar sales load structure.
In connection with the renewal of the Advisory Contracts, the Board also approved amendments to the management contract for the fund to clarify that the fund pays its non-operating expenses, including brokerage commissions and fees and expenses associated with the fund's securities lending program. The Board considered that the amendments would not change the services provided to the fund or the party responsible for making such payments under the current management contract.
The Board noted that the fund's total expense ratio ranked below the competitive median for the 12-month period ended June 30, 2018.
Fees Charged to Other Fidelity Clients. The Board also considered Fidelity fee structures and other information with respect to clients of Fidelity, such as other funds advised or subadvised by Fidelity, pension plan clients, and other institutional clients with similar mandates. The Board noted that a joint ad hoc committee created by it and the boards of other Fidelity funds periodically reviews and compares Fidelity's institutional investment advisory business with its business of providing services to the Fidelity funds and also noted the most recent findings of the committee. The Board noted that the committee's review included a consideration of the differences in services provided, fees charged, and costs incurred, as well as competition in the markets serving the different categories of clients.
Based on its review of total expense ratios and fees charged to other Fidelity clients, the Board concluded that the fund's total expense ratio was reasonable in light of the services that the fund and its shareholders receive and the other factors considered.
Costs of the Services and Profitability. The Board considered the revenues earned and the expenses incurred by Fidelity in conducting the business of developing, marketing, distributing, managing, administering and servicing the fund and servicing the fund's shareholders. The Board also considered the level of Fidelity's profits in respect of all the Fidelity funds.
On an annual basis, Fidelity presents to the Board information about the profitability of its relationships with the fund. Fidelity calculates profitability information for each fund, as well as aggregate profitability information for groups of Fidelity funds and all Fidelity funds, using a series of detailed revenue and cost allocation methodologies which originate with the books and records of Fidelity on which Fidelity's audited financial statements are based. The Audit Committee of the Board reviews any significant changes from the prior year's methodologies.
PricewaterhouseCoopers LLP (PwC), auditor to Fidelity and certain Fidelity funds, has been engaged annually by the Board as part of the Board's assessment of Fidelity's profitability analysis. PwC's engagement includes the review and assessment of the methodologies used by Fidelity in determining the revenues and expenses attributable to Fidelity's mutual fund business, and completion of agreed-upon procedures in respect of the mathematical accuracy of the fund profitability information and its conformity to established allocation methodologies. After considering PwC's reports issued under the engagement and information provided by Fidelity, the Board concluded that while other allocation methods may also be reasonable, Fidelity's profitability methodologies are reasonable in all material respects.
The Board also reviewed Fidelity's non-fund businesses and potential indirect benefits such businesses may have received as a result of their association with Fidelity's mutual fund business (i.e., fall-out benefits) as well as cases where Fidelity's affiliates may benefit from the fund's business. The Board noted that changes to fall-out benefits year-over-year reflect business developments at Fidelity's various businesses.
The Board considered the costs of the services provided by and the profits realized by Fidelity in connection with the operation of the fund and was satisfied that the profitability was not excessive.
Economies of Scale. The Board considered whether there have been economies of scale in respect of the management of the Fidelity funds, whether the Fidelity funds (including the fund) have appropriately benefited from any such economies of scale, and whether there is potential for realization of any further economies of scale. The Board considered the extent to which the fund will benefit from economies of scale as assets grow through increased services to the fund, through waivers or reimbursements, or through fee or expense ratio reductions. The Board recognized that, due to the fund's current contractual arrangements, its expense ratio will not decline if the fund's operating costs decrease as assets grow, or rise as assets decrease. The Board also noted that a committee (the Economies of Scale Committee) created by it and the boards of other Fidelity funds periodically analyzes whether Fidelity attains economies of scale in respect of the management and servicing of the Fidelity funds, whether the Fidelity funds have appropriately benefited from such economies of scale, and whether there is potential for realization of any further economies of scale.
The Board concluded, taking into account the analysis of the Economies of Scale Committee, that economies of scale, if any, are being appropriately shared between fund shareholders and Fidelity.
Additional Information Requested by the Board. In order to develop fully the factual basis for consideration of the Fidelity funds' advisory contracts, the Board requested and received additional information on certain topics, including: (i) fund performance trends, in particular the underperformance of certain funds, and Fidelity's long-term strategies for certain funds; (ii) Fidelity's fund profitability methodology, profitability trends for certain funds, and the impact of certain factors on fund profitability results; (iii) metrics for evaluating index fund and ETF performance and information about ETF trading characteristics; (iv) the methodology with respect to the evaluation of competitive fund data and peer group classifications and fee comparisons; (v) the expense structures for different funds and classes; (vi) information regarding other accounts managed by Fidelity, including collective investment trusts; and (vii) Fidelity's philosophies and strategies for evaluating funds and classes with lower or declining asset levels.
Based on its evaluation of all of the conclusions noted above, and after considering all factors it believed relevant, the Board concluded that the advisory fee arrangements are fair and reasonable, and that the fund's Advisory Contracts should be renewed.

DIFK6-SANN-0619
1.9883986.101
Fidelity® Emerging Markets Discovery Fund
Fidelity® Total Emerging Markets Fund
Semi-Annual Report April 30, 2019 Includes Fidelity and Fidelity Advisor share classes |
|
Beginning on January 1, 2021, as permitted by regulations adopted by the Securities and Exchange Commission, paper copies of a fund’s shareholder reports will no longer be sent by mail, unless you specifically request paper copies of the reports from the fund or from your financial intermediary, such as a financial advisor, broker-dealer or bank. Instead, the reports will be made available on a website, and you will be notified by mail each time a report is posted and provided with a website link to access the report.
If you already elected to receive shareholder reports electronically, you will not be affected by this change and you need not take any action. You may elect to receive shareholder reports and other communications from a fund electronically, by contacting your financial intermediary. For Fidelity customers, visit Fidelity's web site or call Fidelity using the contact information listed below.
You may elect to receive all future reports in paper free of charge. If you wish to continue receiving paper copies of your shareholder reports, you may contact your financial intermediary or, if you are a Fidelity customer, visit Fidelity’s website, or call Fidelity at the applicable toll-free number listed below. Your election to receive reports in paper will apply to all funds held with the fund complex/your financial intermediary.
| Account Type | Website | Phone Number |
| Brokerage, Mutual Fund, or Annuity Contracts: | fidelity.com/mailpreferences | 1-800-343-3548 |
| Employer Provided Retirement Accounts: | netbenefits.fidelity.com/preferences (choose 'no' under Required Disclosures to continue to print) | 1-800-343-0860 |
| Advisor Sold Accounts Serviced Through Your Financial Intermediary: | Contact Your Financial Intermediary | Your Financial Intermediary's phone number |
| Advisor Sold Accounts Serviced by Fidelity: | institutional.fidelity.com | 1-877-208-0098 |
Contents
To view a fund's proxy voting guidelines and proxy voting record for the 12-month period ended June 30, visit http://www.fidelity.com/proxyvotingresults or visit the Securities and Exchange Commission's (SEC) web site at http://www.sec.gov.
You may also call 1-800-544-8544 if you’re an individual investing directly with Fidelity, call 1-800-835-5092 if you’re a plan sponsor or participant with Fidelity as your recordkeeper or call 1-877-208-0098 on institutional accounts or if you’re an advisor or invest through one to request a free copy of the proxy voting guidelines.
Standard & Poor's, S&P and S&P 500 are registered service marks of The McGraw-Hill Companies, Inc. and have been licensed for use by Fidelity Distributors Corporation.
Other third-party marks appearing herein are the property of their respective owners.
All other marks appearing herein are registered or unregistered trademarks or service marks of FMR LLC or an affiliated company. © 2019 FMR LLC. All rights reserved.
This report and the financial statements contained herein are submitted for the general information of the shareholders of the Funds. This report is not authorized for distribution to prospective investors in the Funds unless preceded or accompanied by an effective prospectus.
A fund files its complete schedule of portfolio holdings with the SEC for the first and third quarters of each fiscal year on Form N-PORT. Forms N-PORT are available on the SEC’s web site at http://www.sec.gov. A fund's Forms N-PORT may be reviewed and copied at the SEC’s Public Reference Room in Washington, DC. Information regarding the operation of the SEC's Public Reference Room may be obtained by calling 1-800-SEC-0330.
For a complete list of a fund's portfolio holdings, view the most recent holdings listing, semiannual report, or annual report on Fidelity's web site at http://www.fidelity.com, http://www.institutional.fidelity.com, or http://www.401k.com, as applicable.
NOT FDIC INSURED •MAY LOSE VALUE •NO BANK GUARANTEE
Neither the Funds nor Fidelity Distributors Corporation is a bank.
Fidelity® Emerging Markets Discovery Fund
Investment Summary (Unaudited)
Top Five Stocks as of April 30, 2019
| | % of fund's net assets |
| Fourlis Holdings SA (Greece, Specialty Retail) | 1.5 |
| Shangri-La Asia Ltd. (Bermuda, Hotels, Restaurants & Leisure) | 1.3 |
| Kingsoft Corp. Ltd. (Cayman Islands, Software) | 1.3 |
| Qingdao Haier Co. Ltd. (A Shares) (China, Household Durables) | 1.3 |
| Impala Platinum Holdings Ltd. (South Africa, Metals & Mining) | 1.2 |
| | 6.6 |
Top Five Market Sectors as of April 30, 2019
| | % of fund's net assets |
| Industrials | 14.9 |
| Consumer Discretionary | 14.4 |
| Financials | 12.3 |
| Information Technology | 10.8 |
| Materials | 10.5 |
Top Five Countries as of April 30, 2019
| (excluding cash equivalents) | % of fund's net assets |
| Cayman Islands | 12.6 |
| India | 9.4 |
| Korea (South) | 9.0 |
| Brazil | 8.8 |
| China | 8.6 |
Percentages are adjusted for the effect of futures contracts, if applicable.
Asset Allocation (% of fund's net assets)
| As of April 30, 2019 |
| | Stocks and Equity Futures | 95.8% |
| | Short-Term Investments and Net Other Assets (Liabilities) | 4.2% |

Fidelity® Emerging Markets Discovery Fund
Schedule of Investments April 30, 2019 (Unaudited)
Showing Percentage of Net Assets
| Common Stocks - 92.5% | | | |
| | | Shares | Value |
| Argentina - 0.5% | | | |
| BBVA Banco Frances SA sponsored ADR | | 52,700 | $422,654 |
| Central Puerto SA sponsored ADR (a) | | 47,400 | 382,992 |
| Inversiones y Representaciones SA ADR (b) | | 45,007 | 422,616 |
| YPF SA Class D sponsored ADR | | 19,200 | 259,776 |
|
| TOTAL ARGENTINA | | | 1,488,038 |
|
| Bangladesh - 0.2% | | | |
| BRAC Bank Ltd. (b) | | 1,125,390 | 822,416 |
| Bermuda - 3.1% | | | |
| AGTech Holdings Ltd. (b) | | 13,368,000 | 800,908 |
| Alibaba Pictures Group Ltd. (a)(b) | | 3,380,000 | 758,311 |
| Cosan Ltd. Class A | | 93,600 | 1,143,792 |
| Joy City Property Ltd. | | 5,573,000 | 795,656 |
| Kunlun Energy Co. Ltd. | | 841,400 | 888,078 |
| Pacific Basin Shipping Ltd. | | 6,742,000 | 1,383,671 |
| Shangri-La Asia Ltd. | | 3,086,000 | 4,374,403 |
|
| TOTAL BERMUDA | | | 10,144,819 |
|
| Brazil - 7.1% | | | |
| Atacadao Distribuicao Comercio e Industria Ltda | | 249,900 | 1,351,121 |
| Azul SA sponsored ADR (b) | | 89,100 | 2,313,036 |
| BR Malls Participacoes SA | | 353,800 | 1,109,826 |
| BTG Pactual Participations Ltd. unit | | 137,500 | 1,451,060 |
| Companhia de Saneamento de Minas Gerais | | 88,520 | 1,557,696 |
| Construtora Tenda SA | | 133,000 | 609,525 |
| Direcional Engenharia SA | | 332,500 | 698,733 |
| Equatorial Energia SA | | 19,060 | 399,078 |
| Localiza Rent A Car SA | | 369,685 | 3,412,970 |
| LPS Brasil Consultoria de Imoveis SA (b) | | 306,500 | 365,821 |
| Natura Cosmeticos SA | | 269,600 | 3,591,825 |
| Notre Dame Intermedica Participacoes SA | | 300,517 | 2,691,632 |
| QGEP Participacoes SA | | 528,000 | 1,804,392 |
| Tegma Gestao Logistica SA | | 332,400 | 2,076,917 |
|
| TOTAL BRAZIL | | | 23,433,632 |
|
| British Virgin Islands - 0.4% | | | |
| Dolphin Capital Investors Ltd. (b) | | 8,361,857 | 553,371 |
| Mail.Ru Group Ltd. GDR (Reg. S) (b) | | 31,600 | 729,960 |
|
| TOTAL BRITISH VIRGIN ISLANDS | | | 1,283,331 |
|
| Canada - 0.4% | | | |
| Pan American Silver Corp. | | 101,500 | 1,290,065 |
| Cayman Islands - 12.6% | | | |
| 58.com, Inc. ADR (b) | | 3,802 | 272,946 |
| Airtac International Group | | 178,000 | 2,373,180 |
| ASM Pacific Technology Ltd. | | 63,700 | 737,705 |
| China Biologic Products Holdings, Inc. (a)(b) | | 14,622 | 1,466,002 |
| China State Construction International Holdings Ltd. | | 2,200,000 | 2,279,982 |
| China ZhengTong Auto Services Holdings Ltd. | | 2,700,500 | 1,494,005 |
| CStone Pharmaceuticals Co. Ltd. (b)(c) | | 837,698 | 1,467,210 |
| ENN Energy Holdings Ltd. | | 63,700 | 601,694 |
| Fu Shou Yuan International Group Ltd. | | 3,352,000 | 2,871,385 |
| GDS Holdings Ltd. ADR (a)(b) | | 23,000 | 899,990 |
| Haitian International Holdings Ltd. | | 1,111,000 | 2,781,465 |
| HUYA, Inc. ADR | | 16,110 | 384,868 |
| Kingdee International Software Group Co. Ltd. | | 1,217,000 | 1,489,292 |
| Kingsoft Corp. Ltd. | | 1,665,760 | 4,257,405 |
| Koolearn Technology Holding Ltd. (b)(c) | | 312,500 | 438,985 |
| LexinFintech Holdings Ltd. ADR (b) | | 27,700 | 357,330 |
| Longfor Properties Co. Ltd. | | 342,000 | 1,259,917 |
| Maoyan Entertainment (b)(c) | | 1,067,650 | 2,191,154 |
| Momo, Inc. ADR | | 14,812 | 519,457 |
| NetEase, Inc. ADR | | 3,000 | 853,590 |
| Parade Technologies Ltd. | | 64,000 | 1,083,166 |
| PPDAI Group, Inc. ADR | | 168,980 | 882,076 |
| Qutoutiao, Inc. ADR (a) | | 32,300 | 213,826 |
| Sea Ltd. ADR (b) | | 22,100 | 550,069 |
| Shimao Property Holdings Ltd. | | 275,500 | 839,339 |
| Silergy Corp. | | 59,000 | 966,086 |
| Sunny Optical Technology Group Co. Ltd. | | 70,300 | 857,153 |
| TAL Education Group ADR (b) | | 13,770 | 529,732 |
| Uni-President China Holdings Ltd. | | 2,518,000 | 2,304,615 |
| Wise Talent Information Technology Co. Ltd. (b) | | 112,705 | 295,239 |
| Yirendai Ltd. sponsored ADR (a) | | 34,700 | 549,648 |
| Yuzhou Properties Co.�� | | 2,456,600 | 1,296,441 |
| YY, Inc. ADR (b) | | 12,300 | 1,040,703 |
| Zai Lab Ltd. ADR (a)(b) | | 45,700 | 1,217,905 |
|
| TOTAL CAYMAN ISLANDS | | | 41,623,560 |
|
| Chile - 0.9% | | | |
| Compania Cervecerias Unidas SA sponsored ADR | | 25,600 | 705,024 |
| Empresas CMPC SA | | 641,927 | 2,160,734 |
|
| TOTAL CHILE | | | 2,865,758 |
|
| China - 8.6% | | | |
| BBMG Corp. (H Shares) | | 1,944,000 | 683,949 |
| China Longyuan Power Grid Corp. Ltd. (H Shares) | | 1,566,200 | 1,078,100 |
| China Machinery Engineering Co. (H Shares) | | 3,429,000 | 1,660,998 |
| China Oilfield Services Ltd. (H Shares) | | 1,930,000 | 2,066,592 |
| China Suntien Green Energy Corp. Ltd. (H Shares) | | 2,566,000 | 739,236 |
| Hangzhou Hikvision Digital Technology Co. Ltd. (A Shares) | | 261,500 | 1,268,886 |
| Hangzhou Tigermed Consulting Co. Ltd. (A Shares) | | 272,343 | 2,685,055 |
| Hualan Biological Engineer, Inc. (A Shares) | | 217,064 | 1,374,920 |
| Lens Technology Co. Ltd. (A Shares) | | 488,629 | 602,905 |
| Qingdao Haier Co. Ltd. (A Shares) | | 1,651,596 | 4,213,042 |
| Shandong Weigao Medical Polymer Co. Ltd. (H Shares) | | 1,467,886 | 1,440,792 |
| Shanghai International Airport Co. Ltd. (A Shares) | | 313,941 | 3,292,351 |
| Shanghai Junshi Biosciences Co. Ltd. (H Shares) (c) | | 384,072 | 1,566,682 |
| Sinopec Engineering Group Co. Ltd. (H Shares) | | 2,724,000 | 2,632,052 |
| Tonghua Dongbao Pharmaceutical Co. Ltd. (A Shares) | | 578,108 | 1,356,235 |
| Tsingtao Brewery Co. Ltd. (H Shares) | | 262,000 | 1,669,896 |
|
| TOTAL CHINA | | | 28,331,691 |
|
| Colombia - 0.2% | | | |
| Bancolombia SA sponsored ADR | | 10,300 | 522,416 |
| Curacao - 0.4% | | | |
| Emirates NBD (Merrill Lynch International & Co. Bank Warrant Program) warrants 1/3/22 (b)(c) | | 422,400 | 1,374,210 |
| Cyprus - 1.3% | | | |
| Etalon Group PLC GDR (Reg. S) | | 463,200 | 856,920 |
| Globaltrans Investment PLC GDR (Reg. S) | | 252,700 | 2,443,609 |
| TCS Group Holding PLC unit | | 52,200 | 1,038,780 |
|
| TOTAL CYPRUS | | | 4,339,309 |
|
| Egypt - 1.1% | | | |
| Credit Agricole Egypt | | 329,474 | 809,773 |
| Egyptian Kuwaiti Holding | | 1,021,100 | 1,484,679 |
| Six of October Development & Investment Co. | | 1,254,300 | 1,252,839 |
|
| TOTAL EGYPT | | | 3,547,291 |
|
| Greece - 2.9% | | | |
| Alpha Bank AE (b) | | 683,200 | 1,058,995 |
| Fourlis Holdings SA | | 807,000 | 4,887,707 |
| Mytilineos Holdings SA | | 45,200 | 489,980 |
| Titan Cement Co. SA (Reg.) | | 148,900 | 3,233,241 |
|
| TOTAL GREECE | | | 9,669,923 |
|
| Hong Kong - 1.5% | | | |
| China Everbright International Ltd. | | 813,000 | 795,921 |
| China Resources Beer Holdings Co. Ltd. | | 588,000 | 2,687,105 |
| Far East Horizon Ltd. | | 891,584 | 989,916 |
| Sun Art Retail Group Ltd. | | 457,500 | 399,484 |
|
| TOTAL HONG KONG | | | 4,872,426 |
|
| India - 9.4% | | | |
| Adani Ports & Special Economic Zone Ltd. (b) | | 510,992 | 2,881,928 |
| Bharat Petroleum Corp. Ltd. | | 96,000 | 523,577 |
| CESC Ltd. GDR | | 74,146 | 746,549 |
| Deccan Cements Ltd. (b) | | 236,946 | 1,364,752 |
| Federal Bank Ltd. | | 1,237,181 | 1,647,573 |
| Info Edge India Ltd. | | 23,200 | 643,982 |
| JK Cement Ltd. (b) | | 126,071 | 1,635,192 |
| JM Financial Ltd. | | 614,700 | 781,095 |
| LIC Housing Finance Ltd. | | 405,164 | 2,889,790 |
| Manappuram General Finance & Leasing Ltd. | | 1,173,188 | 1,986,841 |
| Natco Pharma Ltd. | | 139,550 | 1,092,604 |
| NTPC Ltd. | | 219,400 | 422,281 |
| Oberoi Realty Ltd. | | 332,938 | 2,425,079 |
| Phoenix Mills Ltd. | | 64,806 | 558,482 |
| Piramal Enterprises Ltd. | | 60,288 | 2,044,600 |
| Power Grid Corp. of India Ltd. | | 383,468 | 1,026,296 |
| Shriram Transport Finance Co. Ltd. | | 88,100 | 1,405,297 |
| Solar Industries India Ltd. | | 103,245 | 1,594,029 |
| The Ramco Cements Ltd. (b) | | 248,911 | 2,767,624 |
| Torrent Pharmaceuticals Ltd. | | 73,211 | 1,883,596 |
| Zee Entertainment Enterprises Ltd. | | 112,400 | 698,153 |
|
| TOTAL INDIA | | | 31,019,320 |
|
| Indonesia - 1.6% | | | |
| PT ACE Hardware Indonesia Tbk | | 20,857,100 | 2,415,033 |
| PT Bank Negara Indonesia (Persero) Tbk | | 961,000 | 647,411 |
| PT Ciputra Development Tbk | | 12,252,600 | 971,610 |
| PT Media Nusantara Citra Tbk | | 2,684,180 | 177,062 |
| PT Pakuwon Jati Tbk | | 18,237,500 | 915,075 |
|
| TOTAL INDONESIA | | | 5,126,191 |
|
| Japan - 0.3% | | | |
| Iriso Electronics Co. Ltd. | | 21,030 | 1,087,417 |
| Kenya - 0.2% | | | |
| Equity Group Holdings Ltd. | | 1,414,900 | 572,115 |
| Korea (South) - 8.2% | | | |
| AfreecaTV Co. Ltd. | | 6,400 | 351,337 |
| AMOREPACIFIC Group, Inc. | | 31,524 | 2,036,585 |
| Cafe24 Corp. (b) | | 5,090 | 419,790 |
| Daou Technology, Inc. | | 43,199 | 822,036 |
| Hanon Systems | | 352,000 | 3,795,156 |
| HDC Hyundai Development Co. | | 10,726 | 429,405 |
| HUGEL, Inc. (b) | | 3,826 | 1,362,097 |
| Hyundai Fire & Marine Insurance Co. Ltd. | | 33,002 | 1,084,464 |
| Hyundai Wia Corp. | | 37,718 | 1,616,935 |
| Iljin Materials Co. Ltd. | | 32,215 | 1,032,310 |
| Kakao Corp. | | 15,790 | 1,627,821 |
| KB Financial Group, Inc. | | 15,620 | 618,955 |
| Korean Reinsurance Co. | | 84,986 | 665,864 |
| LG Corp. | | 28,720 | 1,801,153 |
| LG Innotek Co. Ltd. | | 11,551 | 1,215,623 |
| Meerecompany, Inc. | | 6,265 | 329,394 |
| NCSOFT Corp. | | 1,757 | 793,964 |
| Netmarble Corp. (c) | | 1,860 | 203,735 |
| Pearl Abyss Corp. (b) | | 3,100 | 464,197 |
| Samsung Electro-Mechanics Co. Ltd. | | 7,395 | 689,305 |
| Samsung SDI Co. Ltd. | | 9,355 | 1,900,720 |
| ViroMed Co. Ltd. (b) | | 9,395 | 2,100,943 |
| Yuhan Corp. | | 7,675 | 1,618,725 |
|
| TOTAL KOREA (SOUTH) | | | 26,980,514 |
|
| Kuwait - 0.2% | | | |
| National Bank of Kuwait | | 228,060 | 696,652 |
| Luxembourg - 1.2% | | | |
| Adecoagro SA (b) | | 60,300 | 410,040 |
| Samsonite International SA (c) | | 1,249,500 | 3,583,743 |
|
| TOTAL LUXEMBOURG | | | 3,993,783 |
|
| Malaysia - 0.8% | | | |
| British American Tobacco (Malaysia) Bhd | | 245,100 | 2,066,558 |
| Matrix Concepts Holdings Bhd | | 1,284,600 | 596,549 |
|
| TOTAL MALAYSIA | | | 2,663,107 |
|
| Mexico - 1.8% | | | |
| Credito Real S.A.B. de CV | | 520,000 | 593,298 |
| Fibra Uno Administracion SA de CV | | 1,148,860 | 1,712,586 |
| Gruma S.A.B. de CV Series B | | 150,800 | 1,507,304 |
| Grupo Comercial Chedraui S.A.B. de CV | | 714,200 | 1,411,240 |
| Macquarie Mexican (REIT) (c) | | 718,600 | 854,386 |
|
| TOTAL MEXICO | | | 6,078,814 |
|
| Netherlands - 0.3% | | | |
| VEON Ltd. sponsored ADR (a) | | 218,400 | 511,056 |
| Yandex NV Series A (b) | | 11,000 | 411,730 |
|
| TOTAL NETHERLANDS | | | 922,786 |
|
| Panama - 0.6% | | | |
| Copa Holdings SA Class A | | 25,600 | 2,131,456 |
| Peru - 1.1% | | | |
| Compania de Minas Buenaventura SA sponsored ADR | | 233,100 | 3,778,551 |
| Philippines - 1.1% | | | |
| Metropolitan Bank & Trust Co. | | 457,828 | 656,757 |
| Philippine Seven Corp. | | 667,100 | 1,482,158 |
| Robinsons Land Corp. | | 2,915,108 | 1,379,833 |
|
| TOTAL PHILIPPINES | | | 3,518,748 |
|
| Poland - 1.2% | | | |
| CD Projekt RED SA | | 21,000 | 1,180,939 |
| Dino Polska SA (b)(c) | | 79,900 | 2,655,353 |
|
| TOTAL POLAND | | | 3,836,292 |
|
| Russia - 1.3% | | | |
| Bank St. Petersburg PJSC (b) | | 1,478,500 | 1,329,035 |
| LSR Group OJSC | | 64,564 | 665,050 |
| Moscow Exchange MICEX-RTS OAO | | 922,800 | 1,299,502 |
| RusHydro PJSC | | 30,588,000 | 255,467 |
| Unipro PJSC | | 22,104,000 | 891,938 |
|
| TOTAL RUSSIA | | | 4,440,992 |
|
| Saudi Arabia - 0.3% | | | |
| Samba Financial Group | | 107,900 | 1,090,422 |
| Singapore - 0.9% | | | |
| First Resources Ltd. | | 1,721,600 | 2,316,394 |
| Yoma Strategic Holdings Ltd. | | 2,180,400 | 521,013 |
|
| TOTAL SINGAPORE | | | 2,837,407 |
|
| South Africa - 7.4% | | | |
| AngloGold Ashanti Ltd. | | 143,600 | 1,708,533 |
| Barclays Africa Group Ltd. | | 123,256 | 1,415,311 |
| Bidvest Group Ltd. | | 191,400 | 2,904,784 |
| Cashbuild Ltd. | | 86,900 | 1,601,135 |
| Impala Platinum Holdings Ltd. (b) | | 987,200 | 3,951,560 |
| Imperial Holdings Ltd. | | 201,700 | 879,838 |
| Mondi Ltd. | | 53,600 | 1,181,373 |
| Motus Holdings Ltd. | | 531,400 | 3,296,872 |
| Mr Price Group Ltd. | | 135,400 | 2,050,451 |
| Nampak Ltd. (b) | | 1,442,438 | 1,058,763 |
| Pick 'n Pay Stores Ltd. | | 523,800 | 2,540,091 |
| Reunert Ltd. | | 338,500 | 1,834,123 |
|
| TOTAL SOUTH AFRICA | | | 24,422,834 |
|
| Sri Lanka - 0.1% | | | |
| Hatton National Bank PLC | | 516,651 | 498,486 |
| Taiwan - 6.3% | | | |
| Advantech Co. Ltd. | | 82,693 | 668,994 |
| Chipbond Technology Corp. | | 441,000 | 998,964 |
| Chroma ATE, Inc. | | 184,350 | 879,931 |
| Cleanaway Co. Ltd. | | 336,000 | 1,853,861 |
| CTCI Corp. | | 1,432,000 | 2,219,688 |
| Delta Electronics, Inc. | | 161,000 | 846,628 |
| E Ink Holdings, Inc. | | 662,000 | 791,564 |
| Inventec Corp. | | 1,887,000 | 1,514,387 |
| LandMark Optoelectronics Corp. | | 100,000 | 893,146 |
| Largan Precision Co. Ltd. | | 4,020 | 604,912 |
| Micro-Star International Co. Ltd. | | 209,210 | 579,522 |
| Nanya Technology Corp. | | 690,920 | 1,462,241 |
| PChome Online, Inc. (b) | | 29,000 | 123,406 |
| Sino-American Silicon Products, Inc. | | 371,000 | 801,980 |
| Taiwan Fertilizer Co. Ltd. | | 1,675,000 | 2,436,452 |
| Unimicron Technology Corp. | | 1,013,450 | 1,129,809 |
| Vanguard International Semiconductor Corp. | | 510,000 | 1,130,509 |
| Win Semiconductors Corp. | | 208,000 | 1,393,308 |
| Wiwynn Corp. | | 37,127 | 386,264 |
|
| TOTAL TAIWAN | | | 20,715,566 |
|
| Thailand - 2.7% | | | |
| Bangkok Bank PCL (For. Reg.) | | 71,200 | 466,227 |
| PTT Global Chemical PCL (For. Reg.) | | 410,600 | 884,429 |
| Siam Cement PCL (For. Reg.) | | 227,800 | 3,297,364 |
| Siam Global House PCL | | 5,724,355 | 3,102,729 |
| Star Petroleum Refining PCL | | 3,822,200 | 1,269,376 |
|
| TOTAL THAILAND | | | 9,020,125 |
|
| Turkey - 2.1% | | | |
| Aksa Akrilik Kimya Sanayii | | 811,600 | 1,107,179 |
| Aselsan A/S | | 509,300 | 1,744,640 |
| Celebi Hava Servisi A/S | | 37,000 | 462,585 |
| Mavi Jeans Class B (c) | | 315,200 | 2,013,679 |
| Tupras Turkiye Petrol Rafinerileri A/S | | 73,528 | 1,519,382 |
|
| TOTAL TURKEY | | | 6,847,465 |
|
| United Arab Emirates - 1.2% | | | |
| Aldar Properties PJSC | | 2,100,010 | 1,017,660 |
| DP World Ltd. | | 107,800 | 2,156,000 |
| Emaar Properties PJSC | | 477,967 | 624,598 |
|
| TOTAL UNITED ARAB EMIRATES | | | 3,798,258 |
|
| United Kingdom - 0.9% | | | |
| Bank of Georgia Group PLC | | 27,240 | 610,605 |
| Contemporary Amperex Technology Co. Ltd. ELS (UBS Bank Warrant Program) Class A warrants 6/24/19 (b) | | 32,600 | 386,075 |
| Georgia Capital PLC (b) | | 52,700 | 695,454 |
| TBC Bank Group PLC | | 24,453 | 519,116 |
| Tonghua Dongbao Pharmaceutical Co. Ltd. (UBS AG London Bank Warrant Program) A warrants 4/8/20 (b) | | 285,190 | 669,053 |
|
| TOTAL UNITED KINGDOM | | | 2,880,303 |
|
| Vietnam - 0.1% | | | |
| FTP Corp. | | 177,196 | 377,029 |
| TOTAL COMMON STOCKS | | | |
| (Cost $292,090,401) | | | 304,943,518 |
|
| Nonconvertible Preferred Stocks - 2.9% | | | |
| Brazil - 1.7% | | | |
| Banco ABC Brasil SA | | 367,320 | 1,822,033 |
| Banco do Estado Rio Grande do Sul SA | | 103,700 | 645,827 |
| Companhia Paranaense de Energia-Copel (PN-B) sponsored ADR (a) | | 151,760 | 1,581,339 |
| Metalurgica Gerdau SA (PN) | | 779,700 | 1,352,161 |
|
| TOTAL BRAZIL | | | 5,401,360 |
|
| Korea (South) - 0.8% | | | |
| Hyundai Motor Co. Series 2 | | 30,166 | 2,267,614 |
| Samsung Fire & Marine Insurance Co. Ltd. | | 2,758 | 467,956 |
|
| TOTAL KOREA (SOUTH) | | | 2,735,570 |
|
| Russia - 0.4% | | | |
| Sberbank of Russia | | 469,900 | 1,441,832 |
| TOTAL NONCONVERTIBLE PREFERRED STOCKS | | | |
| (Cost $8,676,428) | | | 9,578,762 |
| | | Principal Amount | Value |
|
| Government Obligations - 0.4% | | | |
| United States of America - 0.4% | | | |
| U.S. Treasury Bills, yield at date of purchase 2.36% to 2.41% 5/2/19 to 6/6/19(d) | | | |
| (Cost $1,347,160) | | $1,350,000 | 1,347,167 |
| | | Shares | Value |
|
| Money Market Funds - 5.4% | | | |
| Fidelity Cash Central Fund, 2.49% (e) | | 12,610,000 | 12,612,522 |
| Fidelity Securities Lending Cash Central Fund 2.49% (e)(f) | | 5,134,136 | 5,134,650 |
| TOTAL MONEY MARKET FUNDS | | | |
| (Cost $17,746,525) | | | 17,747,172 |
| TOTAL INVESTMENT IN SECURITIES - 101.2% | | | |
| (Cost $319,860,514) | | | 333,616,619 |
| NET OTHER ASSETS (LIABILITIES) - (1.2)% | | | (3,822,140) |
| NET ASSETS - 100% | | | $329,794,479 |
| Futures Contracts | | | | | |
| | Number of contracts | Expiration Date | Notional Amount | Value | Unrealized Appreciation/(Depreciation) |
| Purchased | | | | | |
| Equity Index Contracts | | | | | |
| ICE E-mini MSCI Emerging Markets Index Contracts (United States) | 27 | June 2019 | $1,458,270 | $49,661 | $49,661 |
The notional amount of futures purchased as a percentage of Net Assets is 0.4%
Security Type Abbreviations
ELS – Equity-Linked Security
Categorizations in the Schedule of Investments are based on country or territory of incorporation.
Legend
(a) Security or a portion of the security is on loan at period end.
(b) Non-income producing
(c) Security exempt from registration under Rule 144A of the Securities Act of 1933. These securities may be resold in transactions exempt from registration, normally to qualified institutional buyers. At the end of the period, the value of these securities amounted to $16,349,137 or 5.0% of net assets.
(d) Security or a portion of the security was pledged to cover margin requirements for futures contracts. At period end, the value of securities pledged amounted to $107,742.
(e) Affiliated fund that is generally available only to investment companies and other accounts managed by Fidelity Investments. The rate quoted is the annualized seven-day yield of the fund at period end. A complete unaudited listing of the fund's holdings as of its most recent quarter end is available upon request. In addition, each Fidelity Central Fund's financial statements are available on the SEC's website or upon request.
(f) Investment made with cash collateral received from securities on loan.
Affiliated Central Funds
Information regarding fiscal year to date income earned by the Fund from investments in Fidelity Central Funds is as follows:
| Fund | Income earned |
| Fidelity Cash Central Fund | $124,839 |
| Fidelity Securities Lending Cash Central Fund | 8,029 |
| Total | $132,868 |
Amounts in the income column in the above table include any capital gain distributions from underlying funds, which are presented in the corresponding line-item in the Statement of Operations, if applicable.
Investment Valuation
The following is a summary of the inputs used, as of April 30, 2019, involving the Fund's assets and liabilities carried at fair value. The inputs or methodology used for valuing securities may not be an indication of the risk associated with investing in those securities. For more information on valuation inputs, and their aggregation into the levels used below, please refer to the Investment Valuation section in the accompanying Notes to Financial Statements.
| | Valuation Inputs at Reporting Date: |
| Description | Total | Level 1 | Level 2 | Level 3 |
| Investments in Securities: | | | | |
| Equities: | | | | |
| Communication Services | $12,762,165 | $12,762,165 | $-- | $-- |
| Consumer Discretionary | 47,666,730 | 47,666,730 | -- | -- |
| Consumer Staples | 29,134,793 | 29,134,793 | -- | -- |
| Energy | 10,214,201 | 10,214,201 | -- | -- |
| Financials | 40,539,377 | 37,491,084 | 3,048,293 | -- |
| Health Care | 25,368,998 | 25,368,998 | -- | -- |
| Industrials | 49,235,593 | 49,235,593 | -- | -- |
| Information Technology | 35,283,554 | 35,283,554 | -- | -- |
| Materials | 34,378,772 | 32,670,239 | 1,708,533 | -- |
| Real Estate | 20,994,667 | 20,994,667 | -- | -- |
| Utilities | 8,943,430 | 8,943,430 | -- | -- |
| Government Obligations | 1,347,167 | -- | 1,347,167 | -- |
| Money Market Funds | 17,747,172 | 17,747,172 | -- | -- |
| Total Investments in Securities: | $333,616,619 | $327,512,626 | $6,103,993 | $-- |
| Derivative Instruments: | | | | |
| Assets | | | | |
| Futures Contracts | $49,661 | $49,661 | $-- | $-- |
| Total Assets | $49,661 | $49,661 | $-- | $-- |
| Total Derivative Instruments: | $49,661 | $49,661 | $-- | $-- |
Value of Derivative Instruments
The following table is a summary of the Fund's value of derivative instruments by primary risk exposure as of April 30, 2019. For additional information on derivative instruments, please refer to the Derivative Instruments section in the accompanying Notes to Financial Statements.
| Primary Risk Exposure / Derivative Type | Value |
| | Asset | Liability |
| Equity Risk | | |
| Futures Contracts(a) | $49,661 | $0 |
| Total Equity Risk | 49,661 | 0 |
| Total Value of Derivatives | $49,661 | $0 |
(a) Reflects gross cumulative appreciation (depreciation) on futures contracts as presented in the Schedule of Investments. In the Statement of Assets and Liabilities, the period end daily variation margin is included in receivable or payable for daily variation margin on futures contracts, and the net cumulative appreciation (depreciation) is included in net unrealized appreciation (depreciation).
See accompanying notes which are an integral part of the financial statements.
Fidelity® Emerging Markets Discovery Fund
Financial Statements
Statement of Assets and Liabilities
| | | April 30, 2019 (Unaudited) |
| Assets | | |
Investment in securities, at value (including securities loaned of $4,963,794) — See accompanying schedule:
Unaffiliated issuers (cost $302,113,989) | $315,869,447 | |
| Fidelity Central Funds (cost $17,746,525) | 17,747,172 | |
| Total Investment in Securities (cost $319,860,514) | | $333,616,619 |
| Cash | | 113,195 |
| Foreign currency held at value (cost $12,122) | | 12,120 |
| Receivable for investments sold | | 1,548,847 |
| Receivable for fund shares sold | | 113,206 |
| Dividends receivable | | 682,106 |
| Distributions receivable from Fidelity Central Funds | | 24,194 |
| Prepaid expenses | | 210 |
| Other receivables | | 164,882 |
| Total assets | | 336,275,379 |
| Liabilities | | |
| Payable for investments purchased | $193,246 | |
| Payable for fund shares redeemed | 689,870 | |
| Accrued management fee | 232,410 | |
| Distribution and service plan fees payable | 14,055 | |
| Payable for daily variation margin on futures contracts | 3,639 | |
| Other affiliated payables | 67,462 | |
| Other payables and accrued expenses | 145,668 | |
| Collateral on securities loaned | 5,134,550 | |
| Total liabilities | | 6,480,900 |
| Net Assets | | $329,794,479 |
| Net Assets consist of: | | |
| Paid in capital | | $330,075,951 |
| Total distributable earnings (loss) | | (281,472) |
| Net Assets�� | | $329,794,479 |
| Net Asset Value and Maximum Offering Price | | |
| Class A: | | |
| Net Asset Value and redemption price per share ($16,171,585 ÷ 1,193,001 shares) | | $13.56 |
| Maximum offering price per share (100/94.25 of $13.56) | | $14.39 |
| Class M: | | |
| Net Asset Value and redemption price per share ($5,993,724 ÷ 442,740 shares) | | $13.54 |
| Maximum offering price per share (100/96.50 of $13.54) | | $14.03 |
| Class C: | | |
| Net Asset Value and offering price per share ($9,491,342 ÷ 716,861 shares)(a) | | $13.24 |
| Emerging Markets Discovery: | | |
| Net Asset Value, offering price and redemption price per share ($236,183,558 ÷ 17,334,548 shares) | | $13.63 |
| Class I: | | |
| Net Asset Value, offering price and redemption price per share ($55,176,291 ÷ 4,038,770 shares) | | $13.66 |
| Class Z: | | |
| Net Asset Value, offering price and redemption price per share ($6,777,979 ÷ 497,136 shares) | | $13.63 |
(a) Redemption price per share is equal to net asset value less any applicable contingent deferred sales charge.
See accompanying notes which are an integral part of the financial statements.
Statement of Operations
| | | Six months ended April 30, 2019 (Unaudited) |
| Investment Income | | |
| Dividends | | $3,437,583 |
| Interest | | 6,245 |
| Income from Fidelity Central Funds | | 132,868 |
| Income before foreign taxes withheld | | 3,576,696 |
| Less foreign taxes withheld | | (293,803) |
| Total income | | 3,282,893 |
| Expenses | | |
| Management fee | $1,245,035 | |
| Transfer agent fees | 299,807 | |
| Distribution and service plan fees | 87,034 | |
| Accounting and security lending fees | 77,143 | |
| Custodian fees and expenses | 164,181 | |
| Independent trustees' fees and expenses | 820 | |
| Registration fees | 57,581 | |
| Audit | 68,977 | |
| Legal | 434 | |
| Miscellaneous | 1,135 | |
| Total expenses before reductions | 2,002,147 | |
| Expense reductions | (35,368) | |
| Total expenses after reductions | | 1,966,779 |
| Net investment income (loss) | | 1,316,114 |
| Realized and Unrealized Gain (Loss) | | |
| Net realized gain (loss) on: | | |
| Investment securities: | | |
| Unaffiliated issuers | (8,650,937) | |
| Fidelity Central Funds | (535) | |
| Foreign currency transactions | 14,347 | |
| Futures contracts | 1,030,219 | |
| Total net realized gain (loss) | | (7,606,906) |
| Change in net unrealized appreciation (depreciation) on: | | |
| Investment securities: | | |
| Unaffiliated issuers (net of decrease in deferred foreign taxes of $3,398) | 45,774,132 | |
| Fidelity Central Funds | 487 | |
| Assets and liabilities in foreign currencies | 13,117 | |
| Futures contracts | 66,568 | |
| Total change in net unrealized appreciation (depreciation) | | 45,854,304 |
| Net gain (loss) | | 38,247,398 |
| Net increase (decrease) in net assets resulting from operations | | $39,563,512 |
See accompanying notes which are an integral part of the financial statements.
Statement of Changes in Net Assets
| | Six months ended April 30, 2019 (Unaudited) | Year ended October 31, 2018 |
| Increase (Decrease) in Net Assets | | |
| Operations | | |
| Net investment income (loss) | $1,316,114 | $6,119,071 |
| Net realized gain (loss) | (7,606,906) | (3,781,351) |
| Change in net unrealized appreciation (depreciation) | 45,854,304 | (74,753,811) |
| Net increase (decrease) in net assets resulting from operations | 39,563,512 | (72,416,091) |
| Distributions to shareholders | (4,896,604) | (9,625,215) |
| Share transactions - net increase (decrease) | 16,395,919 | (24,209,703) |
| Redemption fees | – | 66,641 |
| Total increase (decrease) in net assets | 51,062,828 | (106,184,369) |
| Net Assets | | |
| Beginning of period | 278,731,651 | 384,916,020 |
| End of period | $329,794,479 | $278,731,651 |
See accompanying notes which are an integral part of the financial statements.
Financial Highlights
Fidelity Emerging Markets Discovery Fund Class A
| | Six months ended (Unaudited) April 30, | Years endedOctober 31, | | | | |
| | 2019 | 2018 | 2017 | 2016 | 2015 | 2014 |
| Selected Per–Share Data | | | | | | |
| Net asset value, beginning of period | $12.01 | $15.03 | $12.27 | $10.92 | $12.17 | $12.49 |
| Income from Investment Operations | | | | | | |
| Net investment income (loss)A | .04 | .18 | .14 | .09 | .09B | .04 |
| Net realized and unrealized gain (loss) | 1.70 | (2.89) | 2.74 | 1.30 | (1.34) | (.01) |
| Total from investment operations | 1.74 | (2.71) | 2.88 | 1.39 | (1.25) | .03 |
| Distributions from net investment income | (.18) | (.08) | (.07) | (.05) | – | (.06) |
| Distributions from net realized gain | (.01) | (.23) | (.06) | – | – | (.30) |
| Total distributions | (.19) | (.31) | (.13) | (.05) | – | (.36) |
| Redemption fees added to paid in capitalA | – | –C | .01 | .01 | –C | .01 |
| Net asset value, end of period | $13.56 | $12.01 | $15.03 | $12.27 | $10.92 | $12.17 |
| Total ReturnD,E,F | 14.65% | (18.39)% | 23.89% | 12.93% | (10.27)% | .31% |
| Ratios to Average Net AssetsG,H | | | | | | |
| Expenses before reductions | 1.57%I | 1.52% | 1.63% | 1.89% | 1.88% | 1.82% |
| Expenses net of fee waivers, if any | 1.56%I | 1.52% | 1.63% | 1.70% | 1.70% | 1.70% |
| Expenses net of all reductions | 1.55%I | 1.48% | 1.62% | 1.70% | 1.69% | 1.70% |
| Net investment income (loss) | .66%I | 1.22% | 1.03% | .85% | .76%B | .29% |
| Supplemental Data | | | | | | |
| Net assets, end of period (000 omitted) | $16,172 | $14,472 | $16,062 | $5,252 | $4,660 | $4,362 |
| Portfolio turnover rateJ | 74%I | 98% | 58% | 60% | 103% | 148% |
A Calculated based on average shares outstanding during the period.
B Net investment income per share reflects a large, non-recurring dividend which amounted to $.06 per share. Excluding this non-recurring dividend, the ratio of net investment income (loss) to average net assets would have been .22%.
C Amount represents less than $.005 per share.
D Total returns for periods of less than one year are not annualized.
E Total returns would have been lower if certain expenses had not been reduced during the applicable periods shown.
F Total returns do not include the effect of the sales charges.
G Fees and expenses of any underlying Fidelity Central Funds are not included in the Fund's expense ratio. The Fund indirectly bears its proportionate share of the expenses of any underlying Fidelity Central Funds.
H Expense ratios reflect operating expenses of the class. Expenses before reductions do not reflect amounts reimbursed by the investment adviser or reductions from brokerage service arrangements or reductions from other expense offset arrangements and do not represent the amount paid by the class during periods when reimbursements or reductions occur. Expenses net of fee waivers reflect expenses after reimbursement by the investment adviser but prior to reductions from brokerage service arrangements or other expense offset arrangements. Expenses net of all reductions represent the net expenses paid by the class.
I Annualized
J Amount does not include the portfolio activity of any underlying Fidelity Central Funds.
See accompanying notes which are an integral part of the financial statements.
Fidelity Emerging Markets Discovery Fund Class M
| | Six months ended (Unaudited) April 30, | Years endedOctober 31, | | | | |
| | 2019 | 2018 | 2017 | 2016 | 2015 | 2014 |
| Selected Per–Share Data | | | | | | |
| Net asset value, beginning of period | $11.94 | $14.94 | $12.20 | $10.86 | $12.13 | $12.44 |
| Income from Investment Operations | | | | | | |
| Net investment income (loss)A | .02 | .14 | .10 | .07 | .06B | –C |
| Net realized and unrealized gain (loss) | 1.69 | (2.87) | 2.74 | 1.28 | (1.33) | –C |
| Total from investment operations | 1.71 | (2.73) | 2.84 | 1.35 | (1.27) | –C |
| Distributions from net investment income | (.10) | (.04) | (.04) | (.02) | – | (.02) |
| Distributions from net realized gain | (.01) | (.23) | (.06) | – | – | (.30) |
| Total distributions | (.11) | (.27) | (.11)D | (.02) | – | (.32) |
| Redemption fees added to paid in capitalA | – | –C | .01 | .01 | –C | .01 |
| Net asset value, end of period | $13.54 | $11.94 | $14.94 | $12.20 | $10.86 | $12.13 |
| Total ReturnE,F,G | 14.39% | (18.58)% | 23.63% | 12.58% | (10.47)% | .05% |
| Ratios to Average Net AssetsH,I | | | | | | |
| Expenses before reductions | 1.89%J | 1.79% | 1.92% | 2.17% | 2.16% | 2.10% |
| Expenses net of fee waivers, if any | 1.88%J | 1.79% | 1.92% | 1.95% | 1.95% | 1.95% |
| Expenses net of all reductions | 1.87%J | 1.75% | 1.90% | 1.94% | 1.94% | 1.95% |
| Net investment income (loss) | .34%J | .94% | .74% | .60% | .51%B | .04% |
| Supplemental Data | | | | | | |
| Net assets, end of period (000 omitted) | $5,994 | $5,374 | $9,393 | $2,868 | $2,015 | $2,031 |
| Portfolio turnover rateK | 74%J | 98% | 58% | 60% | 103% | 148% |
A Calculated based on average shares outstanding during the period.
B Net investment income per share reflects a large, non-recurring dividend which amounted to $.06 per share. Excluding this non-recurring dividend, the ratio of net investment income (loss) to average net assets would have been (.03) %.
C Amount represents less than $.005 per share.
D Total distributions of $.11 per share is comprised of distributions from net investment income of $.044 and distributions from net realized gain of $.064 per share.
E Total returns for periods of less than one year are not annualized.
F Total returns would have been lower if certain expenses had not been reduced during the applicable periods shown.
G Total returns do not include the effect of the sales charges.
H Fees and expenses of any underlying Fidelity Central Funds are not included in the Fund's expense ratio. The Fund indirectly bears its proportionate share of the expenses of any underlying Fidelity Central Funds.
I Expense ratios reflect operating expenses of the class. Expenses before reductions do not reflect amounts reimbursed by the investment adviser or reductions from brokerage service arrangements or reductions from other expense offset arrangements and do not represent the amount paid by the class during periods when reimbursements or reductions occur. Expenses net of fee waivers reflect expenses after reimbursement by the investment adviser but prior to reductions from brokerage service arrangements or other expense offset arrangements. Expenses net of all reductions represent the net expenses paid by the class.
J Annualized
K Amount does not include the portfolio activity of any underlying Fidelity Central Funds.
See accompanying notes which are an integral part of the financial statements.
Fidelity Emerging Markets Discovery Fund Class C
| | Six months ended (Unaudited) April 30, | Years endedOctober 31, | | | | |
| | 2019 | 2018 | 2017 | 2016 | 2015 | 2014 |
| Selected Per–Share Data | | | | | | |
| Net asset value, beginning of period | $11.66 | $14.64 | $11.97 | $10.69 | $12.00 | $12.35 |
| Income from Investment Operations | | | | | | |
| Net investment income (loss)A | (.01) | .06 | .04 | .01 | –B,C | (.06) |
| Net realized and unrealized gain (loss) | 1.65 | (2.79) | 2.69 | 1.26 | (1.31) | –C |
| Total from investment operations | 1.64 | (2.73) | 2.73 | 1.27 | (1.31) | (.06) |
| Distributions from net investment income | (.05) | (.02) | (.01) | – | – | – |
| Distributions from net realized gain | (.01) | (.23) | (.06) | – | – | (.30) |
| Total distributions | (.06) | (.25) | (.07) | – | – | (.30) |
| Redemption fees added to paid in capitalA | – | –C | .01 | .01 | –C | .01 |
| Net asset value, end of period | $13.24 | $11.66 | $14.64 | $11.97 | $10.69 | $12.00 |
| Total ReturnD,E,F | 14.11% | (18.97)% | 23.02% | 11.97% | (10.92)% | (.42)% |
| Ratios to Average Net AssetsG,H | | | | | | |
| Expenses before reductions | 2.39%I | 2.28% | 2.38% | 2.63% | 2.64% | 2.58% |
| Expenses net of fee waivers, if any | 2.38%I | 2.28% | 2.38% | 2.45% | 2.45% | 2.45% |
| Expenses net of all reductions | 2.36%I | 2.24% | 2.37% | 2.44% | 2.44% | 2.45% |
| Net investment income (loss) | (.15)%I | .45% | .28% | .10% | .01%B | (.46)% |
| Supplemental Data | | | | | | |
| Net assets, end of period (000 omitted) | $9,491 | $11,278 | $14,168 | $2,203 | $1,675 | $1,750 |
| Portfolio turnover rateJ | 74%I | 98% | 58% | 60% | 103% | 148% |
A Calculated based on average shares outstanding during the period.
B Net investment income per share reflects a large, non-recurring dividend which amounted to $.06 per share. Excluding this non-recurring dividend, the ratio of net investment income (loss) to average net assets would have been (.52) %.
C Amount represents less than $.005 per share.
D Total returns for periods of less than one year are not annualized.
E Total returns would have been lower if certain expenses had not been reduced during the applicable periods shown.
F Total returns do not include the effect of the contingent deferred sales charge.
G Fees and expenses of any underlying Fidelity Central Funds are not included in the Fund's expense ratio. The Fund indirectly bears its proportionate share of the expenses of any underlying Fidelity Central Funds.
H Expense ratios reflect operating expenses of the class. Expenses before reductions do not reflect amounts reimbursed by the investment adviser or reductions from brokerage service arrangements or reductions from other expense offset arrangements and do not represent the amount paid by the class during periods when reimbursements or reductions occur. Expenses net of fee waivers reflect expenses after reimbursement by the investment adviser but prior to reductions from brokerage service arrangements or other expense offset arrangements. Expenses net of all reductions represent the net expenses paid by the class.
I Annualized
J Amount does not include the portfolio activity of any underlying Fidelity Central Funds.
See accompanying notes which are an integral part of the financial statements.
Fidelity Emerging Markets Discovery Fund
| | Six months ended (Unaudited) April 30, | Years endedOctober 31, | | | | |
| | 2019 | 2018 | 2017 | 2016 | 2015 | 2014 |
| Selected Per–Share Data | | | | | | |
| Net asset value, beginning of period | $12.10 | $15.12 | $12.33 | $10.98 | $12.21 | $12.52 |
| Income from Investment Operations | | | | | | |
| Net investment income (loss)A | .06 | .23 | .18 | .12 | .12B | .07 |
| Net realized and unrealized gain (loss) | 1.70 | (2.91) | 2.76 | 1.31 | (1.35) | –C |
| Total from investment operations | 1.76 | (2.68) | 2.94 | 1.43 | (1.23) | .07 |
| Distributions from net investment income | (.22) | (.11) | (.09) | (.09) | – | (.09) |
| Distributions from net realized gain | (.01) | (.23) | (.06) | – | – | (.30) |
| Total distributions | (.23) | (.34) | (.16)D | (.09) | – | (.39) |
| Redemption fees added to paid in capitalA | – | –C | .01 | .01 | –C | .01 |
| Net asset value, end of period | $13.63 | $12.10 | $15.12 | $12.33 | $10.98 | $12.21 |
| Total ReturnE,F | 14.77% | (18.11)% | 24.30% | 13.19% | (10.07)% | .61% |
| Ratios to Average Net AssetsG,H | | | | | | |
| Expenses before reductions | 1.29%I | 1.22% | 1.35% | 1.55% | 1.56% | 1.48% |
| Expenses net of fee waivers, if any | 1.27%I | 1.22% | 1.35% | 1.45% | 1.45% | 1.45% |
| Expenses net of all reductions | 1.26%I | 1.18% | 1.34% | 1.44% | 1.44% | 1.45% |
| Net investment income (loss) | .95%I | 1.51% | 1.31% | 1.10% | 1.01%B | .54% |
| Supplemental Data | | | | | | |
| Net assets, end of period (000 omitted) | $236,184 | $188,690 | $248,124 | $67,178 | $61,601 | $78,377 |
| Portfolio turnover rateJ | 74%I | 98% | 58% | 60% | 103% | 148% |
A Calculated based on average shares outstanding during the period.
B Net investment income per share reflects a large, non-recurring dividend which amounted to $.06 per share. Excluding this non-recurring dividend, the ratio of net investment income (loss) to average net assets would have been .48%.
C Amount represents less than $.005 per share.
D Total distributions of $.16 per share is comprised of distributions from net investment income of $.091 and distributions from net realized gain of $.064 per share.
E Total returns for periods of less than one year are not annualized.
F Total returns would have been lower if certain expenses had not been reduced during the applicable periods shown.
G Fees and expenses of any underlying Fidelity Central Funds are not included in the Fund's expense ratio. The Fund indirectly bears its proportionate share of the expenses of any underlying Fidelity Central Funds.
H Expense ratios reflect operating expenses of the class. Expenses before reductions do not reflect amounts reimbursed by the investment adviser or reductions from brokerage service arrangements or reductions from other expense offset arrangements and do not represent the amount paid by the class during periods when reimbursements or reductions occur. Expenses net of fee waivers reflect expenses after reimbursement by the investment adviser but prior to reductions from brokerage service arrangements or other expense offset arrangements. Expenses net of all reductions represent the net expenses paid by the class.
I Annualized
J Amount does not include the portfolio activity of any underlying Fidelity Central Funds.
See accompanying notes which are an integral part of the financial statements.
Fidelity Emerging Markets Discovery Fund Class I
| | Six months ended (Unaudited) April 30, | Years endedOctober 31, | | | | |
| | 2019 | 2018 | 2017 | 2016 | 2015 | 2014 |
| Selected Per–Share Data | | | | | | |
| Net asset value, beginning of period | $12.13 | $15.15 | $12.37 | $11.02 | $12.25 | $12.53 |
| Income from Investment Operations | | | | | | |
| Net investment income (loss)A | .06 | .23 | .19 | .13 | .12B | .07 |
| Net realized and unrealized gain (loss) | 1.70 | (2.90) | 2.75 | 1.30 | (1.35) | –C |
| Total from investment operations | 1.76 | (2.67) | 2.94 | 1.43 | (1.23) | .07 |
| Distributions from net investment income | (.22) | (.12) | (.10) | (.09) | – | (.06) |
| Distributions from net realized gain | (.01) | (.23) | (.06) | – | – | (.30) |
| Total distributions | (.23) | (.35) | (.17)D | (.09) | – | (.36) |
| Redemption fees added to paid in capitalA | – | –C | .01 | .01 | –C | .01 |
| Net asset value, end of period | $13.66 | $12.13 | $15.15 | $12.37 | $11.02 | $12.25 |
| Total ReturnE,F | 14.69% | (18.06)% | 24.25% | 13.16% | (10.04)% | .61% |
| Ratios to Average Net AssetsG,H | | | | | | |
| Expenses before reductions | 1.27%I | 1.22% | 1.32% | 1.59% | 1.54% | 1.56% |
| Expenses net of fee waivers, if any | 1.26%I | 1.22% | 1.32% | 1.45% | 1.45% | 1.45% |
| Expenses net of all reductions | 1.25%I | 1.18% | 1.30% | 1.44% | 1.43% | 1.45% |
| Net investment income (loss) | .96%I | 1.51% | 1.34% | 1.10% | 1.01%B | .54% |
| Supplemental Data | | | | | | |
| Net assets, end of period (000 omitted) | $55,176 | $57,506 | $97,170 | $8,337 | $1,410 | $481 |
| Portfolio turnover rateJ | 74%I | 98% | 58% | 60% | 103% | 148% |
A Calculated based on average shares outstanding during the period.
B Net investment income per share reflects a large, non-recurring dividend which amounted to $.06 per share. Excluding this non-recurring dividend, the ratio of net investment income (loss) to average net assets would have been .48%.
C Amount represents less than $.005 per share.
D Total distributions of $.17 per share is comprised of distributions from net investment income of $.101 and distributions from net realized gain of $.064 per share.
E Total returns for periods of less than one year are not annualized.
F Total returns would have been lower if certain expenses had not been reduced during the applicable periods shown.
G Fees and expenses of any underlying Fidelity Central Funds are not included in the Fund's expense ratio. The Fund indirectly bears its proportionate share of the expenses of any underlying Fidelity Central Funds.
H Expense ratios reflect operating expenses of the class. Expenses before reductions do not reflect amounts reimbursed by the investment adviser or reductions from brokerage service arrangements or reductions from other expense offset arrangements and do not represent the amount paid by the class during periods when reimbursements or reductions occur. Expenses net of fee waivers reflect expenses after reimbursement by the investment adviser but prior to reductions from brokerage service arrangements or other expense offset arrangements. Expenses net of all reductions represent the net expenses paid by the class.
I Annualized
J Amount does not include the portfolio activity of any underlying Fidelity Central Funds.
See accompanying notes which are an integral part of the financial statements.
Fidelity Emerging Markets Discovery Fund Class Z
| | Six months ended (Unaudited) April 30, | Years endedOctober 31, |
| | 2019 | 2018 A |
| Selected Per–Share Data | | |
| Net asset value, beginning of period | $12.13 | $13.19 |
| Income from Investment Operations | | |
| Net investment income (loss)B | .07 | –C |
| Net realized and unrealized gain (loss) | 1.69 | (1.06) |
| Total from investment operations | 1.76 | (1.06) |
| Distributions from net investment income | (.26) | – |
| Distributions from net realized gain | (.01) | – |
| Total distributions | (.26)D | – |
| Net asset value, end of period | $13.63 | $12.13 |
| Total ReturnE,F | 14.79% | (8.04)% |
| Ratios to Average Net AssetsG,H | | |
| Expenses before reductions | 1.13%I | 1.17%I |
| Expenses net of fee waivers, if any | 1.12%I | 1.02%I |
| Expenses net of all reductions | 1.11%I | .98%I |
| Net investment income (loss) | 1.10%I | (.12)%I |
| Supplemental Data | | |
| Net assets, end of period (000 omitted) | $6,778 | $1,412 |
| Portfolio turnover rateJ | 74%I | 98% |
A For the period October 2, 2018 (commencement of sale of shares) to October 31, 2018.
B Calculated based on average shares outstanding during the period.
C Amount represents less than $.005 per share.
D Total distributions of $.26 per share is comprised of distributions from net investment income of $.256 and distributions from net realized gain of $.008 per share.
E Total returns for periods of less than one year are not annualized.
F Total returns would have been lower if certain expenses had not been reduced during the applicable periods shown.
G Fees and expenses of any underlying Fidelity Central Funds are not included in the Fund's expense ratio. The Fund indirectly bears its proportionate share of the expenses of any underlying Fidelity Central Funds.
H Expense ratios reflect operating expenses of the class. Expenses before reductions do not reflect amounts reimbursed by the investment adviser or reductions from brokerage service arrangements or reductions from other expense offset arrangements and do not represent the amount paid by the class during periods when reimbursements or reductions occur. Expense ratios before reductions for start-up periods may not be representative of longer-term operating periods. Expenses net of fee waivers reflect expenses after reimbursement by the investment adviser but prior to reductions from brokerage service arrangements or other expense offset arrangements. Expenses net of all reductions represent the net expenses paid by the class.
I Annualized
J Amount does not include the portfolio activity of any underlying Fidelity Central Funds.
See accompanying notes which are an integral part of the financial statements.
Notes to Financial Statements (Unaudited)
For the period ended April 30, 2019
1. Organization.
Fidelity Emerging Markets Discovery Fund (the Fund) is a fund of Fidelity Investment Trust (the Trust) and is authorized to issue an unlimited number of shares. The Trust is registered under the Investment Company Act of 1940, as amended (the 1940 Act), as an open-end management investment company organized as a Massachusetts business trust. The Fund offers Class A, Class M Class C, Emerging Markets Discovery, Class I and Class Z shares, each of which has equal rights as to assets and voting privileges. Each class has exclusive voting rights with respect to matters that affect that class. Effective March 1, 2019, Class C shares will automatically convert to Class A shares after a holding period of ten years from the initial date of purchase, with certain exceptions. The Fund's investments in emerging markets can be subject to social, economic, regulatory, and political uncertainties and can be extremely volatile.
2. Investments in Fidelity Central Funds.
The Fund invests in Fidelity Central Funds, which are open-end investment companies generally available only to other investment companies and accounts managed by the investment adviser and its affiliates. The Fund's Schedule of Investments lists each of the Fidelity Central Funds held as of period end, if any, as an investment of the Fund, but does not include the underlying holdings of each Fidelity Central Fund. As an Investing Fund, the Fund indirectly bears its proportionate share of the expenses of the underlying Fidelity Central Funds.
The Money Market Central Funds seek preservation of capital and current income and are managed by Fidelity Investments Money Management, Inc. (FIMM), an affiliate of the investment adviser. Annualized expenses of the Money Market Central Funds as of their most recent shareholder report date are less than .005%.
A complete unaudited list of holdings for each Fidelity Central Fund is available upon request or at the Securities and Exchange Commission (the SEC) website at www.sec.gov. In addition, the financial statements of the Fidelity Central Funds are available on the SEC website or upon request.
3. Significant Accounting Policies.
The Fund is an investment company and applies the accounting and reporting guidance of the Financial Accounting Standards Board (FASB) Accounting Standards Codification Topic 946 Financial Services – Investments Companies. The financial statements have been prepared in conformity with accounting principles generally accepted in the United States of America (GAAP), which require management to make certain estimates and assumptions at the date of the financial statements. Actual results could differ from those estimates. Subsequent events, if any, through the date that the financial statements were issued have been evaluated in the preparation of the financial statements. The following summarizes the significant accounting policies of the Fund:
Investment Valuation. Investments are valued as of 4:00 p.m. Eastern time on the last calendar day of the period. The Board of Trustees (the Board) has delegated the day to day responsibility for the valuation of the Fund's investments to the Fair Value Committee (the Committee) established by the Fund's investment adviser. In accordance with valuation policies and procedures approved by the Board, the Fund attempts to obtain prices from one or more third party pricing vendors or brokers to value its investments. When current market prices, quotations or currency exchange rates are not readily available or reliable, investments will be fair valued in good faith by the Committee, in accordance with procedures adopted by the Board. Factors used in determining fair value vary by investment type and may include market or investment specific events, changes in interest rates and credit quality. The frequency with which these procedures are used cannot be predicted and they may be utilized to a significant extent. The Committee oversees the Fund's valuation policies and procedures and reports to the Board on the Committee's activities and fair value determinations. The Board monitors the appropriateness of the procedures used in valuing the Fund's investments and ratifies the fair value determinations of the Committee.
The Fund categorizes the inputs to valuation techniques used to value its investments into a disclosure hierarchy consisting of three levels as shown below:
- Level 1 – quoted prices in active markets for identical investments
- Level 2 – other significant observable inputs (including quoted prices for similar investments, interest rates, prepayment speeds, etc.)
- Level 3 – unobservable inputs (including the Fund's own assumptions based on the best information available)
Valuation techniques used to value the Fund's investments by major category are as follows:
Equity securities, including restricted securities, for which market quotations are readily available, are valued at the last reported sale price or official closing price as reported by a third party pricing vendor on the primary market or exchange on which they are traded and are categorized as Level 1 in the hierarchy. In the event there were no sales during the day or closing prices are not available, securities are valued at the last quoted bid price or may be valued using the last available price and are generally categorized as Level 2 in the hierarchy. For foreign equity securities, when market or security specific events arise, comparisons to the valuation of American Depositary Receipts (ADRs), futures contracts, Exchange-Traded Funds (ETFs) and certain indexes as well as quoted prices for similar securities may be used and would be categorized as Level 2 in the hierarchy. For equity securities, including restricted securities, where observable inputs are limited, assumptions about market activity and risk are used and these securities may be categorized as Level 3 in the hierarchy.
Debt securities, including restricted securities, are valued based on evaluated prices received from third party pricing vendors or from brokers who make markets in such securities. U.S. government and government agency obligations are valued by pricing vendors who utilize matrix pricing which considers yield or price of bonds of comparable quality, coupon, maturity and type or by broker-supplied prices. When independent prices are unavailable or unreliable, debt securities may be valued utilizing pricing methodologies which consider similar factors that would be used by third party pricing vendors. Debt securities are generally categorized as Level 2 in the hierarchy but may be Level 3 depending on the circumstances.
Futures contracts are valued at the settlement price established each day by the board of trade or exchange on which they are traded and are categorized as Level 1 in the hierarchy. Investments in open-end mutual funds, including the Fidelity Central Funds, are valued at their closing net asset value (NAV) each business day and are categorized as Level 1 in the hierarchy.
Changes in valuation techniques may result in transfers in or out of an assigned level within the disclosure hierarchy. The aggregate value of investments by input level as of April 30, 2019 is included at the end of the Fund's Schedule of Investments.
Foreign Currency. The Fund may use foreign currency contracts to facilitate transactions in foreign-denominated securities. Gains and losses from these transactions may arise from changes in the value of the foreign currency or if the counterparties do not perform under the contracts' terms.
Foreign-denominated assets, including investment securities, and liabilities are translated into U.S. dollars at the exchange rates at period end. Purchases and sales of investment securities, income and dividends received and expenses denominated in foreign currencies are translated into U.S. dollars at the exchange rate in effect on the transaction date.
The effects of exchange rate fluctuations on investments are included with the net realized and unrealized gain (loss) on investment securities. Other foreign currency transactions resulting in realized and unrealized gain (loss) are disclosed separately.
Investment Transactions and Income. For financial reporting purposes, the Fund's investment holdings and NAV include trades executed through the end of the last business day of the period. The NAV per share for processing shareholder transactions is calculated as of the close of business of the New York Stock Exchange (NYSE), normally 4:00 p.m. Eastern time and includes trades executed through the end of the prior business day. Gains and losses on securities sold are determined on the basis of identified cost and include proceeds received from litigation. Dividend income is recorded on the ex-dividend date, except for certain dividends from foreign securities where the ex-dividend date may have passed, which are recorded as soon as the Fund is informed of the ex-dividend date. Non-cash dividends included in dividend income, if any, are recorded at the fair market value of the securities received. Income and capital gain distributions from Fidelity Central Funds, if any, are recorded on the ex-dividend date. Certain distributions received by the Fund represent a return of capital or capital gain. The Fund determines the components of these distributions subsequent to the ex-dividend date, based upon receipt of tax filings or other correspondence relating to the underlying investment. These distributions are recorded as a reduction of cost of investments and/or as a realized gain. Interest income is accrued as earned and includes coupon interest and amortization of premium and accretion of discount on debt securities as applicable. Investment income is recorded net of foreign taxes withheld where recovery of such taxes is uncertain.
Class Allocations and Expenses. Investment income, realized and unrealized capital gains and losses, common expenses of the Fund, and certain fund-level expense reductions, if any, are allocated daily on a pro-rata basis to each class based on the relative net assets of each class to the total net assets of the Fund. Each class differs with respect to transfer agent and distribution and service plan fees incurred. Certain expense reductions may also differ by class. For the reporting period, the allocated portion of income and expenses to each class as a percent of its average net assets may vary due to the timing of recording these transactions in relation to fluctuating net assets of the classes. Expenses directly attributable to a fund are charged to that fund. Expenses attributable to more than one fund are allocated among the respective funds on the basis of relative net assets or other appropriate methods. Expense estimates are accrued in the period to which they relate and adjustments are made when actual amounts are known.
Income Tax Information and Distributions to Shareholders. Each year, the Fund intends to qualify as a regulated investment company under Subchapter M of the Internal Revenue Code, including distributing substantially all of its taxable income and realized gains. As a result, no provision for U.S. Federal income taxes is required. The Fund files a U.S. federal tax return, in addition to state and local tax returns as required. The Fund's federal income tax returns are subject to examination by the Internal Revenue Service (IRS) for a period of three fiscal years after they are filed. State and local tax returns may be subject to examination for an additional fiscal year depending on the jurisdiction. Foreign taxes are provided for based on the Fund's understanding of the tax rules and rates that exist in the foreign markets in which it invests. The Fund is subject to a tax imposed on capital gains by certain countries in which it invests. An estimated deferred tax liability for net unrealized appreciation on the applicable securities is included in Other payables and accrued expenses on the Statement of Assets & Liabilities.
Distributions are declared and recorded on the ex-dividend date. Income and capital gain distributions are declared separately for each class. Income and capital gain distributions are determined in accordance with income tax regulations, which may differ from GAAP.
Capital accounts within the financial statements are adjusted for permanent book-tax differences. These adjustments have no impact on net assets or the results of operations. Capital accounts are not adjusted for temporary book-tax differences which will reverse in a subsequent period.
Book-tax differences are primarily due to foreign currency transactions, futures transactions, certain foreign taxes, passive foreign investment companies (PFIC), market discount, capital loss carryforwards, and losses deferred due to wash sales.
As of period end, the cost and unrealized appreciation (depreciation) in securities, and derivatives if applicable, for federal income tax purposes were as follows:
| Gross unrealized appreciation | $36,263,807 |
| Gross unrealized depreciation | (25,112,798) |
| Net unrealized appreciation (depreciation) | $11,151,009 |
| Tax cost | $322,515,271 |
Capital loss carryforwards are only available to offset future capital gains of the Fund to the extent provided by regulations and may be limited. Under the Regulated Investment Company Modernization Act of 2010 (the Act), the Fund is permitted to carry forward capital losses incurred in taxable years beginning after December 22, 2010 for an unlimited period and such capital losses are required to be used prior to any losses that expire. The capital loss carryforward information presented below, including any applicable limitation, is estimated as of prior fiscal period end and is subject to adjustment.
| No expiration | |
| Short-term | $(3,929,791) |
| Total no expiration | (3,929,791) |
| Total capital loss carryforward | $(3,929,791) |
Restricted Securities. The Fund may invest in securities that are subject to legal or contractual restrictions on resale. These securities generally may be resold in transactions exempt from registration or to the public if the securities are registered. Disposal of these securities may involve time-consuming negotiations and expense, and prompt sale at an acceptable price may be difficult. Information regarding restricted securities is included at the end of the Fund's Schedule of Investments.
4. Derivative Instruments.
Risk Exposures and the Use of Derivative Instruments. The Fund's investment objective allows the Fund to enter into various types of derivative contracts, including futures contracts. Derivatives are investments whose value is primarily derived from underlying assets, indices or reference rates and may be transacted on an exchange or over-the-counter (OTC). Derivatives may involve a future commitment to buy or sell a specified asset based on specified terms, to exchange future cash flows at periodic intervals based on a notional principal amount, or for one party to make one or more payments upon the occurrence of specified events in exchange for periodic payments from the other party.
The Fund used derivatives to increase returns and to manage exposure to certain risks as defined below. The success of any strategy involving derivatives depends on analysis of numerous economic factors, and if the strategies for investment do not work as intended, the Fund may not achieve its objectives.
The Fund's use of derivatives increased or decreased its exposure to the following risk:
| Equity Risk | Equity risk relates to the fluctuations in the value of financial instruments as a result of changes in market prices (other than those arising from interest rate risk or foreign exchange risk), whether caused by factors specific to an individual investment, its issuer, or all factors affecting all instruments traded in a market or market segment.
|
The Fund is also exposed to additional risks from investing in derivatives, such as liquidity risk and counterparty credit risk. Liquidity risk is the risk that the Fund will be unable to close out the derivative in the open market in a timely manner. Counterparty credit risk is the risk that the counterparty will not be able to fulfill its obligation to the Fund. Counterparty credit risk related to exchange-traded futures contracts may be mitigated by the protection provided by the exchange on which they trade.
Investing in derivatives may involve greater risks than investing in the underlying assets directly and, to varying degrees, may involve risk of loss in excess of any initial investment and collateral received and amounts recognized in the Statement of Assets and Liabilities. In addition, there may be the risk that the change in value of the derivative contract does not correspond to the change in value of the underlying instrument.
Futures Contracts. A futures contract is an agreement between two parties to buy or sell a specified underlying instrument for a fixed price at a specified future date. The Fund used futures contracts to manage its exposure to the stock market.
Upon entering into a futures contract, a fund is required to deposit either cash or securities (initial margin) with a clearing broker in an amount equal to a certain percentage of the face value of the contract. Futures contracts are marked-to-market daily and subsequent daily payments (variation margin) are made or received by a fund depending on the daily fluctuations in the value of the futures contracts and are recorded as unrealized appreciation or (depreciation). This receivable and/or payable, if any, is included in daily variation margin on futures contracts in the Statement of Assets and Liabilities. Realized gain or (loss) is recorded upon the expiration or closing of a futures contract. The net realized gain (loss) and change in net unrealized appreciation (depreciation) on futures contracts during the period is presented in the Statement of Operations.
Any open futures contracts at period end are presented in the Schedule of Investments under the caption "Futures Contracts". The notional amount at value reflects each contract's exposure to the underlying instrument or index at period end and is representative of volume of activity during the period. Securities deposited to meet initial margin requirements are identified in the Schedule of Investments.
5. Purchases and Sales of Investments.
Purchases and sales of securities, other than short-term securities and U.S. Government securties, aggregated $124,142,101 and $105,416,892, respectively.
6. Fees and Other Transactions with Affiliates.
Management Fee. Fidelity Management & Research Company (the investment adviser) and its affiliates provide the Fund with investment management related services for which the Fund pays a monthly management fee. The management fee is the sum of an individual fund fee rate that is based on an annual rate of .60% of the Fund's average net assets and an annualized group fee rate that averaged .24% during the period. The group fee rate is based upon the average net assets of all the mutual funds advised by the investment adviser, including any mutual funds previously advised by the investment adviser that are currently advised by Fidelity SelectCo, LLC, an affiliate of the investment adviser. The group fee rate decreases as assets under management increase and increases as assets under management decrease. For the reporting period, the total annualized management fee rate was .84% of the Fund's average net assets.
Distribution and Service Plan Fees. In accordance with Rule 12b-1 of the 1940 Act, the Fund has adopted separate Distribution and Service Plans for each class of shares. Certain classes pay Fidelity Distributors Corporation (FDC), an affiliate of the investment adviser, separate Distribution and Service Fees, each of which is based on an annual percentage of each class' average net assets. In addition, FDC may pay financial intermediaries for selling shares of the Fund and providing shareholder support services. For the period, the Distribution and Service Fee rates, total fees and amounts retained by FDC were as follows:
| | Distribution Fee | Service Fee | Total Fees | Retained by FDC |
| Class A | -% | .25% | $19,337 | $735 |
| Class M | .25% | .25% | 14,470 | 148 |
| Class C | .75% | .25% | 53,227 | 10,235 |
| | | | $87,034 | $11,118 |
Sales Load. FDC may receive a front-end sales charge of up to 5.75% for selling Class A shares and 3.50% for selling Class M shares, some of which is paid to financial intermediaries for selling shares of the Fund. Depending on the holding period, FDC may receive contingent deferred sales charges levied on Class A, Class M and Class C redemptions. The deferred sales charges are 1.00% for Class C shares, 1.00% for certain purchases of Class A shares and .25% for certain purchases of Class M shares.
For the period, sales charge amounts retained by FDC were as follows:
| | Retained by FDC |
| Class A | $1,245 |
| Class M | 497 |
| Class C(a) | 784 |
| | $2,526 |
(a) When Class C shares are initially sold, FDC pays commissions from its own resources to financial intermediaries through which the sales are made.
Transfer Agent Fees. Fidelity Investments Institutional Operations Company, Inc., (FIIOC), an affiliate of the investment adviser, is the transfer, dividend disbursing and shareholder servicing agent for each class of the Fund. FIIOC receives account fees and asset-based fees that vary according to the account size and type of account of the shareholders of the respective classes of the Fund, except for Class Z. FIIOC receives an asset-based fee of Class Z's average net assets. FIIOC pays for typesetting, printing and mailing of shareholder reports, except proxy statements.
For the period, transfer agent fees for each class were as follows:
| | Amount | % of Class-Level Average Net Assets(a) |
| Class A | $18,345 | .24 |
| Class M | 8,794 | .30 |
| Class C | 15,946 | .30 |
| Emerging Markets Discovery | 204,573 | .20 |
| Class I | 51,122 | .18 |
| Class Z | 1,027 | .05 |
| | $299,807 | |
(a) Annualized
Accounting and Security Lending Fees. Fidelity Service Company, Inc. (FSC), an affiliate of the investment adviser, maintains the Fund's accounting records. The accounting fee is based on the level of average net assets for each month. Prior to April 1, 2019, FSC had a separate agreement with the Fund for administration of the security lending program, based on the number and duration of lending transactions. For the period, the total fees paid for accounting and administration of securities lending were equivalent to an annualized rate of .05%.
Brokerage Commissions. The Fund placed a portion of its portfolio transactions with brokerage firms which are affiliates of the investment adviser. Brokerage commissions are included in net realized gain (loss) and change in net unrealized appreciation (depreciation) in the Statement of Operations. The commissions paid to these affiliated firms were $499 for the period.
Interfund Trades. The Fund may purchase from or sell securities to other Fidelity Funds under procedures adopted by the Board. The procedures have been designed to ensure these interfund trades are executed in accordance with Rule 17a-7 of the 1940 Act. Interfund trades are included within the respective purchases and sales amounts shown in the Purchases and Sales of Investments note.
7. Committed Line of Credit.
The Fund participates with other funds managed by the investment adviser or an affiliate in a $4.25 billion credit facility (the "line of credit") to be utilized for temporary or emergency purposes to fund shareholder redemptions or for other short-term liquidity purposes. The Fund has agreed to pay commitment fees on its pro-rata portion of the line of credit, which amounted to $416 and is reflected in Miscellaneous expenses on the Statement of Operations. During the period, the Fund did not borrow on this line of credit.
8. Security Lending.
The Fund lends portfolio securities through a lending agent from time to time in order to earn additional income. For equity securities, a lending agent is used and may loan securities to certain qualified borrowers, including Fidelity Capital Markets (FCM), a broker-dealer affiliated with the Fund. On the settlement date of the loan, the Fund receives collateral (in the form of U.S. Treasury obligations, letters of credit and/or cash) against the loaned securities and maintains collateral in an amount not less than 100% of the market value of the loaned securities during the period of the loan. The market value of the loaned securities is determined at the close of business of the Fund and any additional required collateral is delivered to the Fund on the next business day. The Fund or borrower may terminate the loan at any time, and if the borrower defaults on its obligation to return the securities loaned because of insolvency or other reasons, the Fund may apply collateral received from the borrower against the obligation. The Fund may experience delays and costs in recovering the securities loaned. Any cash collateral received is invested in the Fidelity Securities Lending Cash Central Fund. The value of loaned securities and cash collateral at period end are disclosed on the Fund's Statement of Assets and Liabilities. Security lending income represents the income earned on investing cash collateral, less rebates paid to borrowers and any lending agent fees associated with the loan, plus any premium payments received for lending certain types of securities. Security lending income is presented in the Statement of Operations as a component of income from Fidelity Central Funds. Total security lending income during the period amounted to $8,029. During the period, there were no securities loaned to FCM.
9. Expense Reductions.
Commissions paid to certain brokers with whom the investment adviser, or its affiliates, places trades on behalf of the Fund include an amount in addition to trade execution, which may be rebated back to the Fund to offset certain expenses. This amount totaled $18,269 for the period.
In addition, during the period the investment adviser reimbursed and/or waived a portion of fund-level operating expenses in the amount of $1,100 and a portion of class-level operating expenses as follows:
| | Amount |
| Class A | $849 |
| Class M | 319 |
| Class C | 573 |
| Emerging Markets Discovery | 11,030 |
| Class I | 2,952 |
| Class Z | 276 |
| | $15,999 |
10. Distributions to Shareholders.
Distributions to shareholders of each class were as follows:
| | Six months ended
April 30, 2019 | Year ended
October 31, 2018 |
| Distributions to shareholders | | |
| Class A | $223,445 | $352,909 |
| Class M | 47,798 | 173,255 |
| Class C | 53,825 | 250,963 |
| Emerging Markets Discovery | 3,515,165 | 6,626,159 |
| Class I | 985,108 | 2,221,929 |
| Class Z | 71,263 | – |
| Total | $4,896,604 | $9,625,215 |
11. Share Transactions.
Share transactions for each class were as follows and may contain automatic conversions between classes or exchanges between affiliated funds:
| | Shares | Shares | Dollars | Dollars |
| | Six months ended April 30, 2019 | Year ended October 31, 2018(a) | Six months ended April 30, 2019 | Year ended October 31, 2018(a) |
| Class A | | | | |
| Shares sold | 121,247 | 777,539 | $1,554,617 | $11,772,607 |
| Reinvestment of distributions | 18,309 | 23,808 | 222,825 | 349,501 |
| Shares redeemed | (151,024) | (665,814) | (1,937,267) | (9,435,862) |
| Net increase (decrease) | (11,468) | 135,533 | $(159,825) | $2,686,246 |
| Class M | | | | |
| Shares sold | 38,820 | 210,943 | $498,350 | $3,284,695 |
| Reinvestment of distributions | 3,931 | 11,842 | 47,798 | 173,256 |
| Shares redeemed | (50,162) | (401,523) | (650,350) | (5,504,533) |
| Net increase (decrease) | (7,411) | (178,738) | $(104,202) | $(2,046,582) |
| Class C | | | | |
| Shares sold | 59,968 | 347,529 | $744,893 | $5,193,330 |
| Reinvestment of distributions | 4,495 | 17,450 | 53,580 | 250,411 |
| Shares redeemed | (314,712) | (365,570) | (3,963,792) | (5,076,684) |
| Net increase (decrease) | (250,249) | (591) | $(3,165,319) | $367,057 |
| Emerging Markets Discovery | | | | |
| Shares sold | 5,183,272 | 10,973,034 | $67,549,629 | $167,396,079 |
| Reinvestment of distributions | 267,714 | 427,369 | 3,268,785 | 6,303,689 |
| Shares redeemed | (3,711,337) | (12,217,890) | (47,050,078) | (179,945,966) |
| Net increase (decrease) | 1,739,649 | (817,487) | $23,768,336 | $(6,246,198) |
| Class I | | | | |
| Shares sold | 851,079 | 3,126,297 | $11,121,508 | $46,808,802 |
| Reinvestment of distributions | 79,303 | 148,725 | 971,460 | 2,198,156 |
| Shares redeemed | (1,633,720) | (4,945,734) | (20,958,600) | (69,393,677) |
| Net increase (decrease) | (703,338) | (1,670,712) | $(8,865,632) | $(20,386,719) |
| Class Z | | | | |
| Shares sold | 420,246 | 117,308 | $5,432,086 | $1,426,892 |
| Reinvestment of distributions | 5,593 | – | 68,346 | – |
| Shares redeemed | (45,136) | (875) | (577,871) | (10,399) |
| Net increase (decrease) | 380,703 | 116,433 | $4,922,561 | $1,416,493 |
(a) Share transactions for Class Z are for the period October 2, 2018 (commencement of sale of shares) to October 31, 2018
12. Other.
The Fund's organizational documents provide former and current trustees and officers with a limited indemnification against liabilities arising in connection with the performance of their duties to the Fund. In the normal course of business, the Fund may also enter into contracts that provide general indemnifications. The Fund's maximum exposure under these arrangements is unknown as this would be dependent on future claims that may be made against the Fund. The risk of material loss from such claims is considered remote.
Fidelity® Total Emerging Markets Fund
Investment Summary (Unaudited)
Top Five Stocks as of April 30, 2019
| | % of fund's net assets |
| Tencent Holdings Ltd. (Cayman Islands, Interactive Media & Services) | 4.1 |
| Alibaba Group Holding Ltd. sponsored ADR (Cayman Islands, Internet & Direct Marketing Retail) | 3.2 |
| Taiwan Semiconductor Manufacturing Co. Ltd. (Taiwan, Semiconductors & Semiconductor Equipment) | 2.9 |
| Industrial & Commercial Bank of China Ltd. (H Shares) (China, Banks) | 2.2 |
| Naspers Ltd. Class N (South Africa, Internet & Direct Marketing Retail) | 1.9 |
| | 14.0 |
Top Five Market Sectors as of April 30, 2019
| | % of fund's net assets |
| Financials | 18.0 |
| Consumer Discretionary | 12.6 |
| Information Technology | 8.6 |
| Energy | 8.5 |
| Communication Services | 7.2 |
Top Five Countries as of April 30, 2019
| (excluding cash equivalents) | % of fund's net assets |
| Cayman Islands | 15.2 |
| China | 8.7 |
| Korea (South) | 8.5 |
| India | 7.2 |
| Brazil | 5.6 |
Asset Allocation (% of fund's net assets)
| As of April 30, 2019 |
| | Stocks and Equity Futures | 71.8% |
| | Bonds | 24.9% |
| | Short-Term Investments and Net Other Assets (Liabilities) | 3.3% |

Fidelity® Total Emerging Markets Fund
Schedule of Investments April 30, 2019 (Unaudited)
Showing Percentage of Net Assets
| Common Stocks - 66.6% | | | |
| | | Shares | Value |
| Argentina - 0.2% | | | |
| Central Puerto SA sponsored ADR | | 42,660 | $344,693 |
| Grupo Financiero Galicia SA sponsored ADR | | 21,840 | 475,675 |
| Inversiones y Representaciones SA ADR (a) | | 22,980 | 215,782 |
| YPF SA Class D sponsored ADR | | 16,320 | 220,810 |
|
| TOTAL ARGENTINA | | | 1,256,960 |
|
| Australia - 0.0% | | | |
| Frontier Digital Ventures Ltd. (a) | | 454,743 | 185,931 |
| Bermuda - 0.9% | | | |
| AGTech Holdings Ltd. (a) | | 1,752,000 | 104,966 |
| Cosan Ltd. Class A | | 43,600 | 532,792 |
| Credicorp Ltd. (United States) | | 7,616 | 1,804,230 |
| GP Investments Ltd. Class A (depositary receipt) (a) | | 22,922 | 22,799 |
| Kunlun Energy Co. Ltd. | | 504,440 | 532,424 |
| Marvell Technology Group Ltd. | | 21,100 | 527,922 |
| Pacific Basin Shipping Ltd. | | 2,927,000 | 600,713 |
| Shangri-La Asia Ltd. | | 1,708,000 | 2,421,089 |
|
| TOTAL BERMUDA | | | 6,546,935 |
|
| Brazil - 3.0% | | | |
| Azul SA sponsored ADR (a) | | 45,400 | 1,178,584 |
| Banco do Brasil SA | | 385,584 | 4,885,316 |
| BR Malls Participacoes SA | | 210,200 | 659,371 |
| BTG Pactual Participations Ltd. unit | | 170,300 | 1,797,203 |
| Companhia de Saneamento de Minas Gerais | | 96,136 | 1,691,715 |
| Direcional Engenharia SA | | 336,700 | 707,559 |
| Localiza Rent A Car SA | | 155,885 | 1,439,146 |
| Natura Cosmeticos SA | | 291,000 | 3,876,932 |
| Notre Dame Intermedica Participacoes SA | | 127,196 | 1,139,253 |
| Petrobras Distribuidora SA | | 188,400 | 1,138,731 |
| Vale SA sponsored ADR | | 249,068 | 3,183,089 |
|
| TOTAL BRAZIL | | | 21,696,899 |
|
| British Virgin Islands - 0.1% | | | |
| Mail.Ru Group Ltd. GDR (Reg. S) (a) | | 47,800 | 1,104,180 |
| Canada - 0.1% | | | |
| Pan American Silver Corp. | | 75,400 | 958,334 |
| Cayman Islands - 15.2% | | | |
| 58.com, Inc. ADR (a) | | 8,698 | 624,429 |
| Airtac International Group | | 95,000 | 1,266,585 |
| Alibaba Group Holding Ltd. sponsored ADR (a) | | 124,600 | 23,122,022 |
| Ant International Co. Ltd. Class C (b)(c) | | 288,435 | 1,773,875 |
| China Biologic Products Holdings, Inc. (a) | | 7,233 | 725,181 |
| China Resources Land Ltd. | | 476,890 | 2,075,999 |
| China State Construction International Holdings Ltd. | | 1,172,000 | 1,214,608 |
| CStone Pharmaceuticals Co. Ltd. (a)(d) | | 437,343 | 765,997 |
| ENN Energy Holdings Ltd. | | 123,394 | 1,165,549 |
| Haitian International Holdings Ltd. | | 499,000 | 1,249,281 |
| HUYA, Inc. ADR | | 73,210 | 1,748,987 |
| JD.com, Inc. sponsored ADR (a) | | 205,200 | 6,211,404 |
| Kingdee International Software Group Co. Ltd. | | 633,000 | 774,628 |
| Kingsoft Corp. Ltd. | | 2,367,000 | 6,049,657 |
| Koolearn Technology Holding Ltd. (a)(d) | | 485,000 | 681,305 |
| LexinFintech Holdings Ltd. ADR (a) | | 29,000 | 374,100 |
| Meituan Dianping Class B | | 1,446,000 | 10,506,578 |
| Momo, Inc. ADR | | 88,720 | 3,111,410 |
| NetEase, Inc. ADR | | 16,900 | 4,808,557 |
| PPDAI Group, Inc. ADR | | 48,500 | 253,170 |
| Qutoutiao, Inc. ADR | | 43,300 | 286,646 |
| Sea Ltd. ADR (a) | | 48,197 | 1,199,623 |
| Shenzhou International Group Holdings Ltd. | | 385,400 | 5,173,187 |
| Shimao Property Holdings Ltd. | | 132,360 | 403,249 |
| Sunny Optical Technology Group Co. Ltd. | | 123,000 | 1,499,713 |
| Tencent Holdings Ltd. | | 612,650 | 30,196,081 |
| Uni-President China Holdings Ltd. | | 2,021,600 | 1,850,281 |
| Weidai Ltd. ADR | | 13,400 | 134,000 |
| Wise Talent Information Technology Co. Ltd. (a) | | 217,268 | 569,149 |
| YY, Inc. ADR (a) | | 4,700 | 397,667 |
| Zai Lab Ltd. ADR (a) | | 22,400 | 596,960 |
|
| TOTAL CAYMAN ISLANDS | | | 110,809,878 |
|
| Chile - 0.3% | | | |
| Compania Cervecerias Unidas SA sponsored ADR | | 28,000 | 771,120 |
| Vina Concha y Toro SA | | 567,835 | 1,195,530 |
|
| TOTAL CHILE | | | 1,966,650 |
|
| China - 8.7% | | | |
| BBMG Corp. (H Shares) | | 3,325,000 | 1,169,820 |
| Beijing Sinnet Technology Co. Ltd. (A Shares) | | 134,514 | 346,526 |
| China Communications Construction Co. Ltd. (H Shares) | | 609,000 | 586,114 |
| China Life Insurance Co. Ltd. (H Shares) | | 2,759,834 | 7,842,372 |
| China Longyuan Power Grid Corp. Ltd. (H Shares) | | 1,662,460 | 1,144,361 |
| China Oilfield Services Ltd. (H Shares) | | 1,444,000 | 1,546,196 |
| China Pacific Insurance (Group) Co. Ltd. (H Shares) | | 1,012,906 | 4,151,148 |
| China Petroleum & Chemical Corp. (H Shares) | | 4,036,000 | 3,102,512 |
| China Tower Corp. Ltd. (H Shares) (d) | | 2,672,000 | 722,089 |
| Glodon Co. Ltd. (A Shares) | | 91,497 | 380,394 |
| Hangzhou Hikvision Digital Technology Co. Ltd. (A Shares) | | 84,265 | 408,882 |
| Hangzhou Tigermed Consulting Co. Ltd. (A Shares) | | 139,287 | 1,373,243 |
| Industrial & Commercial Bank of China Ltd. (H Shares) | | 21,906,160 | 16,447,492 |
| Jiangsu Hengrui Medicine Co. Ltd. (A Shares) | | 134,217 | 1,310,304 |
| Kweichow Moutai Co. Ltd. (A Shares) | | 13,398 | 1,937,616 |
| PICC Property & Casualty Co. Ltd. (H Shares) | | 697,870 | 783,734 |
| Ping An Insurance (Group) Co. of China Ltd. (H Shares) | | 531,440 | 6,432,903 |
| Qingdao Haier Co. Ltd. (A Shares) | | 2,195,511 | 5,600,511 |
| Shanghai International Airport Co. Ltd. (A Shares) | | 180,737 | 1,895,419 |
| Shenzhen Mindray Bio-Medical Electronics Co. Ltd. (A Shares) (a) | | 75,250 | 1,573,625 |
| Shenzhen Sunway Communication Co. Ltd. (A Shares) | | 76,635 | 304,838 |
| Sinopec Engineering Group Co. Ltd. (H Shares) | | 838,500 | 810,197 |
| Tonghua Dongbao Pharmaceutical Co. Ltd. (A Shares) | | 366,705 | 860,286 |
| Tsingtao Brewery Co. Ltd. (H Shares) | | 328,000 | 2,090,557 |
| WuXi AppTec Co. Ltd. (H Shares) (d) | | 41,000 | 504,347 |
|
| TOTAL CHINA | | | 63,325,486 |
|
| Egypt - 0.0% | | | |
| Six of October Development & Investment Co. | | 171,679 | 171,479 |
| Greece - 0.3% | | | |
| Titan Cement Co. SA (Reg.) | | 103,102 | 2,238,775 |
| Hong Kong - 2.2% | | | |
| AIA Group Ltd. | | 79,600 | 815,059 |
| China Everbright International Ltd. | | 996,000 | 975,076 |
| China Overseas Land and Investment Ltd. | | 1,050,240 | 3,929,296 |
| China Resources Beer Holdings Co. Ltd. | | 634,666 | 2,900,364 |
| China Resources Power Holdings Co. Ltd. | | 288,429 | 403,701 |
| China Unicom Ltd. | | 820,300 | 974,003 |
| China Unicom Ltd. sponsored ADR (e) | | 42,820 | 508,273 |
| CNOOC Ltd. | | 2,609,000 | 4,738,816 |
| Far East Horizon Ltd. | | 841,780 | 934,620 |
|
| TOTAL HONG KONG | | | 16,179,208 |
|
| India - 7.2% | | | |
| Adani Ports & Special Economic Zone Ltd. (a) | | 322,203 | 1,817,183 |
| Axis Bank Ltd. (a) | | 367,979 | 4,051,642 |
| Bharat Petroleum Corp. Ltd. | | 1,700 | 9,272 |
| Bharti Infratel Ltd. | | 77,190 | 290,985 |
| Embassy Office Parks (REIT) (a) | | 32,400 | 149,060 |
| Federal Bank Ltd. | | 1,153,806 | 1,536,542 |
| ICICI Bank Ltd. | | 258,692 | 1,505,779 |
| ICICI Bank Ltd. sponsored ADR | | 663,440 | 7,596,388 |
| IndoStar Capital Finance Ltd. (d) | | 77,613 | 444,135 |
| Indraprastha Gas Ltd. (a) | | 331,593 | 1,489,257 |
| ITC Ltd. | | 916,713 | 3,966,452 |
| JK Cement Ltd. (a) | | 92,574 | 1,200,723 |
| JM Financial Ltd. | | 26,200 | 33,292 |
| Larsen & Toubro Ltd. | | 108,069 | 2,092,501 |
| LIC Housing Finance Ltd. | | 521,990 | 3,723,040 |
| Manappuram General Finance & Leasing Ltd. | | 984,440 | 1,667,189 |
| NTPC Ltd. | | 279,364 | 537,694 |
| Oberoi Realty Ltd. | | 180,003 | 1,311,119 |
| Petronet LNG Ltd. | | 288,506 | 998,941 |
| Phoenix Mills Ltd. | | 117,492 | 1,012,516 |
| Power Grid Corp. of India Ltd. | | 469,242 | 1,255,858 |
| Reliance Industries Ltd. | | 389,713 | 7,793,477 |
| Shree Cement Ltd. | | 6,500 | 1,846,910 |
| Shriram Transport Finance Co. Ltd. | | 80,600 | 1,285,663 |
| SREI Infrastructure Finance Ltd. | | 116,223 | 43,304 |
| State Bank of India (a) | | 894,075 | 3,978,901 |
| Torrent Pharmaceuticals Ltd. | | 49,142 | 1,264,341 |
|
| TOTAL INDIA | | | 52,902,164 |
|
| Indonesia - 0.9% | | | |
| PT Bank Mandiri (Persero) Tbk | | 3,373,800 | 1,838,060 |
| PT Bank Rakyat Indonesia Tbk | | 14,969,500 | 4,590,647 |
| PT Media Nusantara Citra Tbk | | 8,083,800 | 533,247 |
|
| TOTAL INDONESIA | | | 6,961,954 |
|
| Japan - 0.7% | | | |
| Keyence Corp. | | 1,300 | 806,643 |
| LINE Corp. (a)(f) | | 16,900 | 566,225 |
| Nintendo Co. Ltd. | | 3,400 | 1,171,014 |
| Renesas Electronics Corp. (a)(f) | | 106,100 | 564,813 |
| SNK Corp. unit (a)(c)(f) | | 2,400 | 83,298 |
| SoftBank Corp. (f) | | 9,742 | 1,032,958 |
| Square Enix Holdings Co. Ltd. (f) | | 12,400 | 426,339 |
| Zozo, Inc. (f) | | 21,700 | 382,786 |
|
| TOTAL JAPAN | | | 5,034,076 |
|
| Korea (South) - 7.5% | | | |
| AMOREPACIFIC Group, Inc. | | 31,949 | 2,064,041 |
| BS Financial Group, Inc. | | 189,958 | 1,143,981 |
| Cafe24 Corp. (a) | | 2,300 | 189,689 |
| Daou Technology, Inc. | | 69,122 | 1,315,326 |
| Hanon Systems | | 6,181 | 66,642 |
| Hyundai Fire & Marine Insurance Co. Ltd. | | 34,455 | 1,132,210 |
| Hyundai Mobis | | 38,665 | 7,722,968 |
| Iljin Materials Co. Ltd. | | 15,581 | 499,284 |
| Kakao Corp. | | 5,000 | 515,459 |
| KB Financial Group, Inc. | | 93,688 | 3,712,463 |
| Korea Electric Power Corp. | | 27,732 | 673,739 |
| Korea Electric Power Corp. sponsored ADR | | 9,920 | 120,726 |
| LG Chemical Ltd. | | 4,683 | 1,452,361 |
| LG Corp. | | 29,212 | 1,832,008 |
| LG Innotek Co. Ltd. | | 5,690 | 598,814 |
| NAVER Corp. | | 6,347 | 651,598 |
| NCSOFT Corp. | | 3,550 | 1,604,196 |
| Netmarble Corp. (d) | | 4,250 | 465,524 |
| POSCO | | 15,862 | 3,484,281 |
| S-Oil Corp. | | 13,480 | 1,067,737 |
| Samsung Biologics Co. Ltd. (a)(d) | | 3,745 | 1,093,891 |
| Samsung Electronics Co. Ltd. | | 259,338 | 10,215,245 |
| Samsung Life Insurance Co. Ltd. | | 15,795 | 1,152,048 |
| Samsung SDI Co. Ltd. | | 12,687 | 2,577,706 |
| Shinhan Financial Group Co. Ltd. | | 69,843 | 2,649,097 |
| SK Hynix, Inc. | | 85,652 | 5,813,101 |
| ViroMed Co. Ltd. (a) | | 3,186 | 712,465 |
|
| TOTAL KOREA (SOUTH) | | | 54,526,600 |
|
| Luxembourg - 0.4% | | | |
| Samsonite International SA (d) | | 1,032,900 | 2,962,504 |
| Malaysia - 0.3% | | | |
| British American Tobacco (Malaysia) Bhd | | 121,400 | 1,023,583 |
| IHH Healthcare Bhd | | 740,000 | 995,138 |
|
| TOTAL MALAYSIA | | | 2,018,721 |
|
| Mexico - 1.6% | | | |
| America Movil S.A.B. de CV Series L sponsored ADR | | 86,200 | 1,273,174 |
| Fibra Uno Administracion SA de CV | | 904,000 | 1,347,578 |
| Gruma S.A.B. de CV Series B | | 166,600 | 1,665,231 |
| Grupo Aeroportuario del Pacifico S.A.B. de CV Series B | | 122,600 | 1,246,581 |
| Grupo Financiero Banorte S.A.B. de CV Series O | | 278,429 | 1,759,921 |
| Macquarie Mexican (REIT) (d) | | 1,249,370 | 1,485,451 |
| Wal-Mart de Mexico SA de CV Series V | | 913,700 | 2,685,035 |
|
| TOTAL MEXICO | | | 11,462,971 |
|
| Netherlands - 0.2% | | | |
| NXP Semiconductors NV | | 7,600 | 802,712 |
| Yandex NV Series A (a) | | 19,339 | 723,859 |
|
| TOTAL NETHERLANDS | | | 1,526,571 |
|
| Nigeria - 0.3% | | | |
| Guaranty Trust Bank PLC | | 4,339,783 | 396,986 |
| Guaranty Trust Bank PLC GDR (Reg. S) | | 105,540 | 466,487 |
| Transnational Corp. of Nigeria PLC | | 22,547,439 | 69,377 |
| Zenith Bank PLC | | 19,380,836 | 1,144,315 |
|
| TOTAL NIGERIA | | | 2,077,165 |
|
| Pakistan - 0.1% | | | |
| Habib Bank Ltd. | | 537,900 | 484,681 |
| Panama - 0.2% | | | |
| Copa Holdings SA Class A | | 14,849 | 1,236,328 |
| Peru - 0.5% | | | |
| Compania de Minas Buenaventura SA sponsored ADR | | 240,200 | 3,893,642 |
| Philippines - 0.4% | | | |
| Metropolitan Bank & Trust Co. | | 1,335,522 | 1,915,814 |
| Robinsons Land Corp. | | 2,459,860 | 1,164,346 |
|
| TOTAL PHILIPPINES | | | 3,080,160 |
|
| Poland - 0.1% | | | |
| Dino Polska SA (a)(d) | | 25,700 | 854,100 |
| Russia - 3.9% | | | |
| Lukoil PJSC sponsored ADR | | 69,100 | 5,858,298 |
| MMC Norilsk Nickel PJSC sponsored ADR | | 185,400 | 4,115,880 |
| NOVATEK OAO GDR (Reg. S) | | 17,500 | 3,372,250 |
| RusHydro PJSC | | 20 | 0 |
| Sberbank of Russia | | 1,528,300 | 5,354,177 |
| Sberbank of Russia sponsored ADR | | 503,784 | 7,201,592 |
| Tatneft PAO | | 132,900 | 1,557,030 |
| Unipro PJSC | | 28,040,700 | 1,131,494 |
|
| TOTAL RUSSIA | | | 28,590,721 |
|
| Singapore - 0.2% | | | |
| First Resources Ltd. | | 990,000 | 1,332,034 |
| South Africa - 4.4% | | | |
| AngloGold Ashanti Ltd. | | 141,600 | 1,684,738 |
| Barclays Africa Group Ltd. | | 401,650 | 4,612,026 |
| Bidvest Group Ltd. | | 96,556 | 1,465,383 |
| FirstRand Ltd. | | 179,900 | 854,038 |
| Impala Platinum Holdings Ltd. (a) | | 675,000 | 2,701,887 |
| Imperial Holdings Ltd. | | 105,500 | 460,203 |
| Mondi Ltd. | | 98,500 | 2,170,994 |
| Motus Holdings Ltd. | | 105,500 | 654,535 |
| Mr Price Group Ltd. | | 124,700 | 1,888,414 |
| Naspers Ltd. Class N (g) | | 53,000 | 13,634,278 |
| Pick 'n Pay Stores Ltd. | | 283,800 | 1,376,246 |
| Sasol Ltd. | | 26,800 | 889,129 |
|
| TOTAL SOUTH AFRICA | | | 32,391,871 |
|
| Taiwan - 3.9% | | | |
| Chroma ATE, Inc. | | 55,000 | 262,523 |
| Delta Electronics, Inc. | | 156,000 | 820,335 |
| King's Town Bank | | 521,600 | 557,856 |
| Largan Precision Co. Ltd. | | 10,403 | 1,565,399 |
| Nanya Technology Corp. | | 699,000 | 1,479,341 |
| PChome Online, Inc. (a) | | 36,000 | 153,194 |
| Taiwan Semiconductor Manufacturing Co. Ltd. | | 2,271,000 | 19,066,772 |
| Taiwan Semiconductor Manufacturing Co. Ltd. sponsored ADR | | 52,342 | 2,293,626 |
| Unified-President Enterprises Corp. | | 995,000 | 2,363,375 |
|
| TOTAL TAIWAN | | | 28,562,421 |
|
| Thailand - 0.8% | | | |
| PTT Global Chemical PCL (For. Reg.) | | 1,047,800 | 2,256,952 |
| Siam Cement PCL (For. Reg.) | | 242,600 | 3,511,591 |
|
| TOTAL THAILAND | | | 5,768,543 |
|
| Turkey - 0.5% | | | |
| Aselsan A/S | | 306,100 | 1,048,565 |
| Enerjisa Enerji A/S (d) | | 127,500 | 114,959 |
| Tupras Turkiye Petrol Rafinerileri A/S | | 88,000 | 1,818,432 |
| Turkiye Garanti Bankasi A/S | | 306,200 | 419,255 |
|
| TOTAL TURKEY | | | 3,401,211 |
|
| United Arab Emirates - 0.6% | | | |
| DP World Ltd. | | 69,359 | 1,387,180 |
| Emaar Properties PJSC | | 1,508,564 | 1,971,362 |
| National Bank of Abu Dhabi PJSC (a) | | 168,380 | 733,452 |
|
| TOTAL UNITED ARAB EMIRATES | | | 4,091,994 |
|
| United Kingdom - 0.1% | | | |
| Tonghua Dongbao Pharmaceutical Co. Ltd. (UBS AG London Bank Warrant Program) A warrants 4/8/20 (a) | | 173,511 | 407,055 |
| United States of America - 0.7% | | | |
| Activision Blizzard, Inc. | | 24,500 | 1,181,145 |
| MercadoLibre, Inc. (a) | | 7,300 | 3,534,222 |
| NVIDIA Corp. | | 4,000 | 724,000 |
|
| TOTAL UNITED STATES OF AMERICA | | | 5,439,367 |
|
| Vietnam - 0.1% | | | |
| Vietnam Technological & Commercial Joint Stock Bank (a) | | 500,000 | 518,519 |
| TOTAL COMMON STOCKS | | | |
| (Cost $419,038,183) | | | 485,966,088 |
|
| Nonconvertible Preferred Stocks - 3.6% | | | |
| Brazil - 2.6% | | | |
| Ambev SA sponsored ADR | | 442,700 | 2,085,117 |
| Banco do Estado Rio Grande do Sul SA | | 123,420 | 768,641 |
| Companhia Paranaense de Energia-Copel: | | | |
| (PN-B) | | 3,315 | 34,832 |
| (PN-B) sponsored ADR | | 171,052 | 1,782,362 |
| Itau Unibanco Holding SA sponsored ADR | | 781,486 | 6,759,854 |
| Metalurgica Gerdau SA (PN) | | 898,970 | 1,559,000 |
| Petroleo Brasileiro SA - Petrobras (PN) sponsored ADR (non-vtg.) | | 356,806 | 4,923,923 |
| Telefonica Brasil SA | | 70,163 | 833,310 |
|
| TOTAL BRAZIL | | | 18,747,039 |
|
| Korea (South) - 1.0% | | | |
| Hyundai Motor Co. Series 2 | | 60,917 | 4,579,203 |
| Samsung Electronics Co. Ltd. | | 74,628 | 2,384,998 |
| Samsung Fire & Marine Insurance Co. Ltd. | | 3,128 | 530,734 |
|
| TOTAL KOREA (SOUTH) | | | 7,494,935 |
|
| TOTAL NONCONVERTIBLE PREFERRED STOCKS | | | |
| (Cost $22,644,186) | | | 26,241,974 |
| | | Principal Amount(h) | Value |
|
| Nonconvertible Bonds - 5.7% | | | |
| Azerbaijan - 0.6% | | | |
| Southern Gas Corridor CJSC 6.875% 3/24/26 (d) | | 1,430,000 | 1,615,900 |
| State Oil Co. of Azerbaijan Republic 6.95% 3/18/30 (Reg. S) | | 2,625,000 | 2,988,825 |
|
| TOTAL AZERBAIJAN | | | 4,604,725 |
|
| Bahrain - 0.3% | | | |
| The Oil and Gas Holding Co. 7.5% 10/25/27 (d) | | 1,905,000 | 2,024,063 |
| Georgia - 0.9% | | | |
| Georgian Oil & Gas Corp. 6.75% 4/26/21 (d) | | 3,125,000 | 3,210,938 |
| JSC Georgian Railway 7.75% 7/11/22 (d) | | 3,150,000 | 3,378,375 |
|
| TOTAL GEORGIA | | | 6,589,313 |
|
| Mexico - 1.1% | | | |
| Pemex Project Funding Master Trust 6.625% 6/15/35 | | 3,975,000 | 3,833,888 |
| Petroleos Mexicanos 6.5% 6/2/41 | | 4,100,000 | 3,778,191 |
|
| TOTAL MEXICO | | | 7,612,079 |
|
| Netherlands - 0.1% | | | |
| Petrobras Global Finance BV 6.9% 3/19/49 | | 1,000,000 | 999,700 |
| Oman - 0.2% | | | |
| Oman Sovereign Sukuk SAOC 4.397% 6/1/24 (d) | | 1,500,000 | 1,428,750 |
| Saudi Arabia - 0.3% | | | |
| Saudi Arabian Oil Co.: | | | |
| 3.5% 4/16/29 (d) | | 700,000 | 688,093 |
| 4.25% 4/16/39 (d) | | 1,155,000 | 1,127,170 |
| 4.375% 4/16/49(d) | | 700,000 | 683,284 |
|
| TOTAL SAUDI ARABIA | | | 2,498,547 |
|
| South Africa - 0.8% | | | |
| Eskom Holdings SOC Ltd.: | | | |
| 5.75% 1/26/21 (Reg. S) | | 1,350,000 | 1,338,188 |
| 6.75% 8/6/23 (d) | | 3,325,000 | 3,341,625 |
| 8.45% 8/10/28 (d) | | 850,000 | 918,412 |
|
| TOTAL SOUTH AFRICA | | | 5,598,225 |
|
| Tunisia - 0.2% | | | |
| Banque Centrale de Tunisie: | | | |
| 5.75% 1/30/25 (d) | | 600,000 | 547,500 |
| 6.75% 10/31/23 (Reg. S) | EUR | 1,025,000 | 1,152,514 |
|
| TOTAL TUNISIA | | | 1,700,014 |
|
| Turkey - 0.2% | | | |
| Turk Sise ve Cam Fabrikalari A/S 6.95% 3/14/26 (d) | | 545,000 | 521,838 |
| Turkiye Ihracat Kredi Bankasi A/S 6.125% 5/3/24 (d) | | 955,000 | 872,918 |
|
| TOTAL TURKEY | | | 1,394,756 |
|
| United Kingdom - 0.6% | | | |
| Biz Finance PLC 9.625% 4/27/22 (d) | | 4,350,000 | 4,355,438 |
| Venezuela - 0.4% | | | |
| Petroleos de Venezuela SA: | | | |
| 6% 5/16/24 (d)(i) | | 5,700,000 | 1,197,000 |
| 6% 11/15/26 (Reg. S) (i) | | 6,800,000 | 1,428,000 |
|
| TOTAL VENEZUELA | | | 2,625,000 |
|
| TOTAL NONCONVERTIBLE BONDS | | | |
| (Cost $42,310,454) | | | 41,430,610 |
|
| Government Obligations - 19.4% | | | |
| Angola - 0.4% | | | |
| Angola Republic 9.375% 5/8/48 (d) | | 2,575,000 | 2,763,451 |
| Argentina - 2.6% | | | |
| Argentine Republic: | | | |
| 5.875% 1/11/28 | | 5,230,000 | 3,624,102 |
| 6.875% 4/22/21 | | 4,575,000 | 3,836,138 |
| 6.875% 1/26/27 | | 2,200,000 | 1,580,700 |
| 7.125% 7/6/36 | | 2,550,000 | 1,753,125 |
| 7.5% 4/22/26 | | 10,510,000 | 7,886,231 |
| 7.82% 12/31/33 | EUR | 688,052 | 577,859 |
|
| TOTAL ARGENTINA | | | 19,258,155 |
|
| Benin - 0.2% | | | |
| Republic of Benin 5.75% 3/26/26 (d) | EUR | 1,000,000 | 1,107,580 |
| Cameroon - 0.5% | | | |
| Cameroon Republic 9.5% 11/19/25 (d) | | 3,750,000 | 4,011,956 |
| Costa Rica - 0.1% | | | |
| Costa Rican Republic 9.2% 2/21/24 (d) | | 665,000 | 690,612 |
| Ecuador - 0.4% | | | |
| Ecuador Republic: | | | |
| 7.875% 1/23/28 (d) | | 750,000 | 722,929 |
| 7.95% 6/20/24 (d) | | 570,000 | 578,735 |
| 8.75% 6/2/23 (d) | | 375,000 | 397,125 |
| 8.875% 10/23/27 (d) | | 710,000 | 721,413 |
| 9.625% 6/2/27 (d) | | 200,000 | 211,900 |
| 9.65% 12/13/26 (d) | | 450,000 | 479,144 |
|
| TOTAL ECUADOR | | | 3,111,246 |
|
| Egypt - 1.8% | | | |
| Arab Republic of Egypt: | | | |
| , yield at date of purchase 17.0012% to 17.3799% 8/6/19 to 9/17/19 | EGP | 26,000,000 | 1,414,163 |
| 5.625% 4/16/30(Reg. S) | EUR | 550,000 | 582,181 |
| 6.375% 4/11/31 (d) | EUR | 500,000 | 550,638 |
| 7.5% 1/31/27 (d) | | 3,550,000 | 3,643,188 |
| 7.6003% 3/1/29 (d) | | 220,000 | 221,100 |
| 7.903% 2/21/48 (d) | | 2,325,000 | 2,240,719 |
| 8.5% 1/31/47 (d) | | 4,375,000 | 4,429,688 |
| 8.7002% 3/1/49 (d) | | 295,000 | 302,744 |
|
| TOTAL EGYPT | | | 13,384,421 |
|
| El Salvador - 1.5% | | | |
| El Salvador Republic: | | | |
| 6.375% 1/18/27 (d) | | 1,550,000 | 1,518,225 |
| 7.375% 12/1/19 | | 1,375,000 | 1,388,771 |
| 7.625% 2/1/41 (d) | | 1,850,000 | 1,893,938 |
| 7.65% 6/15/35 (Reg. S) | | 2,400,000 | 2,485,200 |
| 8.625% 2/28/29 (d) | | 3,510,000 | 3,899,610 |
|
| TOTAL EL SALVADOR | | | 11,185,744 |
|
| Gabon - 0.4% | | | |
| Gabonese Republic 6.375% 12/12/24 (d) | | 2,800,000 | 2,698,500 |
| Ghana - 0.5% | | | |
| Ghana Republic: | | | |
| 7.875% 3/26/27 (d) | | 225,000 | 227,813 |
| 8.125% 1/18/26 (d) | | 1,725,000 | 1,785,375 |
| 8.95% 3/26/51 (d) | | 985,000 | 974,712 |
| 10.75% 10/14/30 (d) | | 625,000 | 771,875 |
|
| TOTAL GHANA | | | 3,759,775 |
|
| Iraq - 0.8% | | | |
| Republic of Iraq: | | | |
| 5.8% 1/15/28 (Reg. S) | | 5,400,000 | 5,224,500 |
| 6.752% 3/9/23 (d) | | 500,000 | 507,500 |
|
| TOTAL IRAQ | | | 5,732,000 |
|
| Ivory Coast - 0.4% | | | |
| Ivory Coast: | | | |
| 5.125% 6/15/25(Reg. S) | EUR | 750,000 | 859,896 |
| 5.75% 12/31/32 | | 2,488,750 | 2,339,425 |
|
| TOTAL IVORY COAST | | | 3,199,321 |
|
| Jordan - 0.5% | | | |
| Jordanian Kingdom 7.375% 10/10/47 (d) | | 4,010,000 | 3,899,725 |
| Lebanon - 3.1% | | | |
| Lebanese Republic: | | | |
| 5.45% 11/28/19 | | 7,050,000 | 6,917,918 |
| 6.1% 10/4/22 | | 4,535,000 | 3,988,147 |
| 6.375% 3/9/20 | | 9,725,000 | 9,507,014 |
| 8.25% 4/12/21 (Reg.S) | | 1,945,000 | 1,876,925 |
|
| TOTAL LEBANON | | | 22,290,004 |
|
| Nigeria - 0.9% | | | |
| Republic of Nigeria: | | | |
| , yield at date of purchase 13.7104% to 16.1171% 11/28/19 to 2/20/20 | NGN | 1,074,000,000 | 2,680,283 |
| 7.625% 11/21/25 (d) | | 600,000 | 640,500 |
| 9.248% 1/21/49 (d) | | 3,060,000 | 3,331,575 |
|
| TOTAL NIGERIA | | | 6,652,358 |
|
| Oman - 0.8% | | | |
| Sultanate of Oman: | | | |
| 6.5% 3/8/47 (d) | | 1,455,000 | 1,296,769 |
| 6.75% 1/17/48 (d) | | 5,250,000 | 4,757,813 |
|
| TOTAL OMAN | | | 6,054,582 |
|
| Qatar - 0.3% | | | |
| State of Qatar 9.75% 6/15/30 (Reg. S) | | 1,530,000 | 2,379,150 |
| Rwanda - 0.4% | | | |
| Rwanda Republic 6.625% 5/2/23 (d) | | 2,875,000 | 2,975,625 |
| Suriname - 0.2% | | | |
| Republic of Suriname 9.25% 10/26/26 (d) | | 1,515,000 | 1,479,269 |
| TAJIKISTAN - 0.2% | | | |
| Tajikistan Republic 7.125% 9/14/27 (d) | | 1,425,000 | 1,318,125 |
| Turkey - 1.5% | | | |
| Turkish Republic: | | | |
| 5.75% 5/11/47 | | 2,325,000 | 1,822,626 |
| 6.875% 3/17/36 | | 1,375,000 | 1,230,866 |
| 7.375% 2/5/25 | | 825,000 | 815,162 |
| 8% 2/14/34 | | 705,000 | 705,229 |
| Turkiye Ihracat Kredi Bankasi A/S 5.375% 2/8/21 (d) | | 6,275,000 | 6,007,622 |
|
| TOTAL TURKEY | | | 10,581,505 |
|
| Ukraine - 1.3% | | | |
| Ukraine Government: | | | |
| 7.375% 9/25/32 (d) | | 3,900,000 | 3,441,750 |
| 7.75% 9/1/20 (d) | | 1,375,000 | 1,371,184 |
| 7.75% 9/1/21 (d) | | 2,280,000 | 2,261,760 |
| 7.75% 9/1/24 (d) | | 2,250,000 | 2,151,000 |
|
| TOTAL UKRAINE | | | 9,225,694 |
|
| United States of America - 0.2% | | | |
| U.S. Treasury Bills, yield at date of purchase 2.38% to 2.39% 5/9/19 to 7/25/19 (j) | | 1,590,000 | 1,585,913 |
| Venezuela - 0.3% | | | |
| Venezuelan Republic 9.25% 9/15/27 (i) | | 6,200,000 | 1,875,500 |
| Zambia - 0.1% | | | |
| Republic of Zambia 8.97% 7/30/27 (d) | | 650,000 | 450,125 |
| TOTAL GOVERNMENT OBLIGATIONS | | | |
| (Cost $145,997,616) | | | 141,670,336 |
| | | Shares | Value |
|
| Money Market Funds - 4.5% | | | |
| Fidelity Cash Central Fund, 2.49% (k) | | 32,223,063 | 32,229,508 |
| Fidelity Securities Lending Cash Central Fund 2.49% (k)(l) | | 316,018 | 316,050 |
| TOTAL MONEY MARKET FUNDS | | | |
| (Cost $32,544,917) | | | 32,545,558 |
| TOTAL INVESTMENT IN SECURITIES - 99.8% | | | |
| (Cost $662,535,356) | | | 727,854,566 |
| NET OTHER ASSETS (LIABILITIES) - 0.2% | | | 1,244,672 |
| NET ASSETS - 100% | | | $729,099,238 |
| Futures Contracts | | | | | |
| | Number of contracts | Expiration Date | Notional Amount | Value | Unrealized Appreciation/(Depreciation) |
| Purchased | | | | | |
| Equity Index Contracts | | | | | |
| ICE E-mini MSCI Emerging Markets Index Contracts (United States) | 212 | June 2019 | $11,450,120 | $208,383 | $208,383 |
The notional amount of futures purchased as a percentage of Net Assets is 1.6%
Currency Abbreviations
EGP – Egyptian pound
EUR – European Monetary Unit
NGN – Nigerian naira
Categorizations in the Schedule of Investments are based on country or territory of incorporation.
Legend
(a) Non-income producing
(b) Restricted securities - Investment in securities not registered under the Securities Act of 1933 (excluding 144A issues). At the end of the period, the value of restricted securities (excluding 144A issues) amounted to $1,773,875 or 0.2% of net assets.
(c) Level 3 security
(d) Security exempt from registration under Rule 144A of the Securities Act of 1933. These securities may be resold in transactions exempt from registration, normally to qualified institutional buyers. At the end of the period, the value of these securities amounted to $108,738,918 or 14.9% of net assets.
(e) Security or a portion of the security is on loan at period end.
(f) Security or a portion of the security purchased on a delayed delivery or when-issued basis.
(g) A portion of the security sold on a delayed delivery basis.
(h) Amount is stated in United States dollars unless otherwise noted.
(i) Non-income producing - Security is in default.
(j) Security or a portion of the security was pledged to cover margin requirements for futures contracts. At period end, the value of securities pledged amounted to $258,888.
(k) Affiliated fund that is generally available only to investment companies and other accounts managed by Fidelity Investments. The rate quoted is the annualized seven-day yield of the fund at period end. A complete unaudited listing of the fund's holdings as of its most recent quarter end is available upon request. In addition, each Fidelity Central Fund's financial statements are available on the SEC's website or upon request.
(l) Investment made with cash collateral received from securities on loan.
Additional information on each restricted holding is as follows:
| Security | Acquisition Date | Acquisition Cost |
| Ant International Co. Ltd. Class C | 5/16/18 | $1,618,120 |
Affiliated Central Funds
Information regarding fiscal year to date income earned by the Fund from investments in Fidelity Central Funds is as follows:
| Fund | Income earned |
| Fidelity Cash Central Fund | $453,797 |
| Fidelity Securities Lending Cash Central Fund | 19,722 |
| Total | $473,519 |
Amounts in the income column in the above table include any capital gain distributions from underlying funds, which are presented in the corresponding line-item in the Statement of Operations, if applicable.
Investment Valuation
The following is a summary of the inputs used, as of April 30, 2019, involving the Fund's assets and liabilities carried at fair value. The inputs or methodology used for valuing securities may not be an indication of the risk associated with investing in those securities. For more information on valuation inputs, and their aggregation into the levels used below, please refer to the Investment Valuation section in the accompanying Notes to Financial Statements.
| | Valuation Inputs at Reporting Date: |
| Description | Total | Level 1 | Level 2 | Level 3 |
| Investments in Securities: | | | | |
| Equities: | | | | |
| Communication Services | $52,528,109 | $18,587,828 | $33,940,281 | $-- |
| Consumer Discretionary | 92,567,470 | 78,933,192 | 13,634,278 | -- |
| Consumer Staples | 34,037,614 | 34,037,614 | -- | -- |
| Energy | 38,072,910 | 30,231,582 | 7,841,328 | -- |
| Financials | 125,438,931 | 94,881,966 | 30,556,965 | -- |
| Health Care | 12,915,031 | 12,915,031 | -- | -- |
| Industrials | 23,801,655 | 23,801,655 | -- | -- |
| Information Technology | 64,897,436 | 45,747,366 | 19,066,772 | 83,298 |
| Materials | 38,318,106 | 32,259,958 | 6,058,148 | -- |
| Real Estate | 17,670,483 | 15,896,608 | -- | 1,773,875 |
| Utilities | 11,960,317 | 11,286,578 | 673,739 | -- |
| Corporate Bonds | 41,430,610 | -- | 41,430,610 | -- |
| Government Obligations | 141,670,336 | -- | 141,670,336 | -- |
| Money Market Funds | 32,545,558 | 32,545,558 | -- | -- |
| Total Investments in Securities: | $727,854,566 | $431,124,936 | $294,872,457 | $1,857,173 |
| Derivative Instruments: | | | | |
| Assets | | | | |
| Futures Contracts | $208,383 | $208,383 | $-- | $-- |
| Total Assets | $208,383 | $208,383 | $-- | $-- |
| Total Derivative Instruments: | $208,383 | $208,383 | $-- | $-- |
Value of Derivative Instruments
The following table is a summary of the Fund's value of derivative instruments by primary risk exposure as of April 30, 2019. For additional information on derivative instruments, please refer to the Derivative Instruments section in the accompanying Notes to Financial Statements.
| Primary Risk Exposure / Derivative Type | Value |
| | Asset | Liability |
| Equity Risk | | |
| Futures Contracts(a) | $208,383 | $0 |
| Total Equity Risk | 208,383 | 0 |
| Total Value of Derivatives | $208,383 | $0 |
(a) Reflects gross cumulative appreciation (depreciation) on futures contracts as presented in the Schedule of Investments. In the Statement of Assets and Liabilities, the period end daily variation margin is included in receivable or payable for daily variation margin on futures contracts, and the net cumulative appreciation (depreciation) is included in distributable earnings.
Other Information
The composition of credit quality ratings as a percentage of Total Net Assets is as follows (Unaudited):
| AAA,AA,A | 0.6% |
| BBB | 1.1% |
| BB | 2.6% |
| B | 15.3% |
| CCC,CC,C | 1.8% |
| D | 0.4% |
| Not Rated | 3.1% |
| Equities | 70.2% |
| Short-Term Investments and Net Other Assets | 4.9% |
| | 100% |
We have used ratings from Moody's Investors Service, Inc. Where Moody's® ratings are not available, we have used S&P® ratings. All ratings are as of the date indicated and do not reflect subsequent changes.
See accompanying notes which are an integral part of the financial statements.
Fidelity® Total Emerging Markets Fund
Financial Statements
Statement of Assets and Liabilities
| | | April 30, 2019 (Unaudited) |
| Assets | | |
Investment in securities, at value (including securities loaned of $306,246) — See accompanying schedule:
Unaffiliated issuers (cost $629,990,439) | $695,309,008 | |
| Fidelity Central Funds (cost $32,544,917) | 32,545,558 | |
| Total Investment in Securities (cost $662,535,356) | | $727,854,566 |
| Cash | | 481,732 |
| Foreign currency held at value (cost $3,125,186) | | 3,124,545 |
| Receivable for investments sold | | |
| Regular delivery | | 2,434,065 |
| Delayed delivery | | 132,321 |
| Receivable for fund shares sold | | 1,332,312 |
| Dividends receivable | | 716,846 |
| Interest receivable | | 3,020,802 |
| Distributions receivable from Fidelity Central Funds | | 90,489 |
| Receivable for daily variation margin on futures contracts | | 5,665 |
| Prepaid expenses | | 396 |
| Other receivables | | 152,401 |
| Total assets | | 739,346,140 |
| Liabilities | | |
| Payable for investments purchased | | |
| Regular delivery | $7,171,577 | |
| Delayed delivery | 257,223 | |
| Payable for fund shares redeemed | 1,713,800 | |
| Accrued management fee | 473,679 | |
| Distribution and service plan fees payable | 44,830 | |
| Other affiliated payables | 135,236 | |
| Other payables and accrued expenses | 134,507 | |
| Collateral on securities loaned | 316,050 | |
| Total liabilities | | 10,246,902 |
| Net Assets | | $729,099,238 |
| Net Assets consist of: | | |
| Paid in capital | | $701,320,610 |
| Total distributable earnings (loss) | | 27,778,628 |
| Net Assets | | $729,099,238 |
| Net Asset Value and Maximum Offering Price | | |
| Class A: | | |
| Net Asset Value and redemption price per share ($40,136,515 ÷ 3,149,452 shares) | | $12.74 |
| Maximum offering price per share (100/94.25 of $12.74) | | $13.52 |
| Class M: | | |
| Net Asset Value and redemption price per share ($8,881,192 ÷ 697,199 shares) | | $12.74 |
| Maximum offering price per share (100/96.50 of $12.74) | | $13.20 |
| Class C: | | |
| Net Asset Value and offering price per share ($39,184,714 ÷ 3,096,776 shares)(a) | | $12.65 |
| Total Emerging Markets: | | |
| Net Asset Value, offering price and redemption price per share ($212,557,115 ÷ 16,655,940 shares) | | $12.76 |
| Class I: | | |
| Net Asset Value, offering price and redemption price per share ($392,046,301 ÷ 30,766,955 shares) | | $12.74 |
| Class Z: | | |
| Net Asset Value, offering price and redemption price per share ($36,293,401 ÷ 2,854,468 shares) | | $12.71 |
(a) Redemption price per share is equal to net asset value less any applicable contingent deferred sales charge.
See accompanying notes which are an integral part of the financial statements.
Statement of Operations
| | | Six months ended April 30, 2019 (Unaudited) |
| Investment Income | | |
| Dividends | | $4,086,727 |
| Interest | | 7,232,971 |
| Income from Fidelity Central Funds | | 473,519 |
| Income before foreign taxes withheld | | 11,793,217 |
| Less foreign taxes withheld | | (442,228) |
| Total income | | 11,350,989 |
| Expenses | | |
| Management fee | $2,584,366 | |
| Transfer agent fees | 604,119 | |
| Distribution and service plan fees | 258,553 | |
| Accounting and security lending fees | 161,648 | |
| Custodian fees and expenses | 191,620 | |
| Independent trustees' fees and expenses | 1,806 | |
| Registration fees | 77,105 | |
| Audit | 79,135 | |
| Legal | 2,201 | |
| Miscellaneous | 2,277 | |
| Total expenses before reductions | 3,962,830 | |
| Expense reductions | (35,563) | |
| Total expenses after reductions | | 3,927,267 |
| Net investment income (loss) | | 7,423,722 |
| Realized and Unrealized Gain (Loss) | | |
| Net realized gain (loss) on: | | |
| Investment securities: | | |
| Unaffiliated issuers | (13,334,986) | |
| Fidelity Central Funds | (426) | |
| Foreign currency transactions | (70,889) | |
| Futures contracts | 2,743,829 | |
| Total net realized gain (loss) | | (10,662,472) |
| Change in net unrealized appreciation (depreciation) on: | | |
| Investment securities: | | |
| Unaffiliated issuers | 81,719,867 | |
| Fidelity Central Funds | 426 | |
| Assets and liabilities in foreign currencies | 6,806 | |
| Futures contracts | 208,383 | |
| Total change in net unrealized appreciation (depreciation) | | 81,935,482 |
| Net gain (loss) | | 71,273,010 |
| Net increase (decrease) in net assets resulting from operations | | $78,696,732 |
See accompanying notes which are an integral part of the financial statements.
Statement of Changes in Net Assets
| | Six months ended April 30, 2019 (Unaudited) | Year ended October 31, 2018 |
| Increase (Decrease) in Net Assets | | |
| Operations | | |
| Net investment income (loss) | $7,423,722 | $17,099,153 |
| Net realized gain (loss) | (10,662,472) | (28,676,433) |
| Change in net unrealized appreciation (depreciation) | 81,935,482 | (97,197,474) |
| Net increase (decrease) in net assets resulting from operations | 78,696,732 | (108,774,754) |
| Distributions to shareholders | (14,178,054) | (20,273,542) |
| Share transactions - net increase (decrease) | 50,905,348 | 13,246,904 |
| Redemption fees | – | 23,374 |
| Total increase (decrease) in net assets | 115,424,026 | (115,778,018) |
| Net Assets | | |
| Beginning of period | 613,675,212 | 729,453,230 |
| End of period | $729,099,238 | $613,675,212 |
See accompanying notes which are an integral part of the financial statements.
Financial Highlights
Fidelity Total Emerging Markets Fund Class A
| | Six months ended (Unaudited) April 30, | Years endedOctober 31, | | | | |
| | 2019 | 2018 | 2017 | 2016 | 2015 | 2014 |
| Selected Per–Share Data | | | | | | |
| Net asset value, beginning of period | $11.53 | $13.56 | $11.33 | $10.35 | $11.56 | $11.37 |
| Income from Investment Operations | | | | | | |
| Net investment income (loss)A | .13 | .25 | .24 | .26 | .28 | .18 |
| Net realized and unrealized gain (loss) | 1.32 | (1.94) | 2.11 | .96 | (1.30) | .19 |
| Total from investment operations | 1.45 | (1.69) | 2.35 | 1.22 | (1.02) | .37 |
| Distributions from net investment income | (.24) | (.16) | (.12) | (.24) | (.17) | (.18) |
| Distributions from net realized gain | – | (.19) | (.01) | – | (.02) | – |
| Total distributions | (.24) | (.34)B | (.13) | (.24) | (.19) | (.18) |
| Redemption fees added to paid in capitalA | – | –C | .01 | –C | –C | –C |
| Net asset value, end of period | $12.74 | $11.53 | $13.56 | $11.33 | $10.35 | $11.56 |
| Total ReturnD,E,F | 12.85% | (12.77)% | 21.13% | 12.13% | (8.92)% | 3.30% |
| Ratios to Average Net AssetsG,H | | | | | | |
| Expenses before reductions | 1.41%I | 1.40% | 1.47% | 1.87% | 1.93% | 1.98% |
| Expenses net of fee waivers, if any | 1.40%I | 1.40% | 1.47% | 1.65% | 1.65% | 1.65% |
| Expenses net of all reductions | 1.40%I | 1.37% | 1.46% | 1.64% | 1.64% | 1.65% |
| Net investment income (loss) | 2.07%I | 1.92% | 1.97% | 2.47% | 2.58% | 1.61% |
| Supplemental Data | | | | | | |
| Net assets, end of period (000 omitted) | $40,137 | $34,617 | $42,213 | $15,206 | $10,164 | $13,627 |
| Portfolio turnover rateJ | 88%I | 94% | 59% | 57% | 80% | 102% |
A Calculated based on average shares outstanding during the period.
B Total distributions of $.34 per share is comprised of distributions from net investment income of $.157 and distributions from net realized gain of $.185 per share.
C Amount represents less than $.005 per share.
D Total returns for periods of less than one year are not annualized.
E Total returns would have been lower if certain expenses had not been reduced during the applicable periods shown.
F Total returns do not include the effect of the sales charges.
G Fees and expenses of any underlying Fidelity Central Funds are not included in the Fund's expense ratio. The Fund indirectly bears its proportionate share of the expenses of any underlying Fidelity Central Funds.
H Expense ratios reflect operating expenses of the class. Expenses before reductions do not reflect amounts reimbursed by the investment adviser or reductions from brokerage service arrangements or reductions from other expense offset arrangements and do not represent the amount paid by the class during periods when reimbursements or reductions occur. Expenses net of fee waivers reflect expenses after reimbursement by the investment adviser but prior to reductions from brokerage service arrangements or other expense offset arrangements. Expenses net of all reductions represent the net expenses paid by the class.
I Annualized
J Amount does not include the portfolio activity of any underlying Fidelity Central Funds.
See accompanying notes which are an integral part of the financial statements.
Fidelity Total Emerging Markets Fund Class M
| | Six months ended (Unaudited) April 30, | Years endedOctober 31, | | | | |
| | 2019 | 2018 | 2017 | 2016 | 2015 | 2014 |
| Selected Per–Share Data | | | | | | |
| Net asset value, beginning of period | $11.51 | $13.55 | $11.33 | $10.33 | $11.54 | $11.34 |
| Income from Investment Operations | | | | | | |
| Net investment income (loss)A | .10 | .21 | .20 | .23 | .25 | .15 |
| Net realized and unrealized gain (loss) | 1.34 | (1.93) | 2.11 | .97 | (1.30) | .19 |
| Total from investment operations | 1.44 | (1.72) | 2.31 | 1.20 | (1.05) | .34 |
| Distributions from net investment income | (.21) | (.13) | (.09) | (.20) | (.14) | (.14) |
| Distributions from net realized gain | – | (.19) | (.01) | – | (.02) | – |
| Total distributions | (.21) | (.32) | (.10) | (.20) | (.16) | (.14) |
| Redemption fees added to paid in capitalA | – | –B | .01 | –B | –B | –B |
| Net asset value, end of period | $12.74 | $11.51 | $13.55 | $11.33 | $10.33 | $11.54 |
| Total ReturnC,D,E | 12.70% | (13.03)% | 20.66% | 11.92% | (9.18)% | 3.04% |
| Ratios to Average Net AssetsF,G | | | | | | |
| Expenses before reductions | 1.74%H | 1.74% | 1.82% | 2.22% | 2.27% | 2.32% |
| Expenses net of fee waivers, if any | 1.73%H | 1.74% | 1.82% | 1.90% | 1.90% | 1.90% |
| Expenses net of all reductions | 1.72%H | 1.71% | 1.81% | 1.90% | 1.89% | 1.90% |
| Net investment income (loss) | 1.74%H | 1.58% | 1.62% | 2.22% | 2.33% | 1.36% |
| Supplemental Data | | | | | | |
| Net assets, end of period (000 omitted) | $8,881 | $8,519 | $8,751 | $3,019 | $3,331 | $5,277 |
| Portfolio turnover rateI | 88%H | 94% | 59% | 57% | 80% | 102% |
A Calculated based on average shares outstanding during the period.
B Amount represents less than $.005 per share.
C Total returns for periods of less than one year are not annualized.
D Total returns would have been lower if certain expenses had not been reduced during the applicable periods shown.
E Total returns do not include the effect of the sales charges.
F Fees and expenses of any underlying Fidelity Central Funds are not included in the Fund's expense ratio. The Fund indirectly bears its proportionate share of the expenses of any underlying Fidelity Central Funds.
G Expense ratios reflect operating expenses of the class. Expenses before reductions do not reflect amounts reimbursed by the investment adviser or reductions from brokerage service arrangements or reductions from other expense offset arrangements and do not represent the amount paid by the class during periods when reimbursements or reductions occur. Expenses net of fee waivers reflect expenses after reimbursement by the investment adviser but prior to reductions from brokerage service arrangements or other expense offset arrangements. Expenses net of all reductions represent the net expenses paid by the class.
H Annualized
I Amount does not include the portfolio activity of any underlying Fidelity Central Funds.
See accompanying notes which are an integral part of the financial statements.
Fidelity Total Emerging Markets Fund Class C
| | Six months ended (Unaudited) April 30, | Years endedOctober 31, | | | | |
| | 2019 | 2018 | 2017 | 2016 | 2015 | 2014 |
| Selected Per–Share Data | | | | | | |
| Net asset value, beginning of period | $11.40 | $13.45 | $11.25 | $10.25 | $11.47 | $11.29 |
| Income from Investment Operations | | | | | | |
| Net investment income (loss)A | .08 | .15 | .15 | .18 | .20 | .10 |
| Net realized and unrealized gain (loss) | 1.32 | (1.92) | 2.11 | .97 | (1.30) | .19 |
| Total from investment operations | 1.40 | (1.77) | 2.26 | 1.15 | (1.10) | .29 |
| Distributions from net investment income | (.15) | (.09) | (.06) | (.15) | (.10) | (.11) |
| Distributions from net realized gain | – | (.19) | (.01) | – | (.02) | – |
| Total distributions | (.15) | (.28) | (.07) | (.15) | (.12) | (.11) |
| Redemption fees added to paid in capitalA | – | –B | .01 | –B | –B | –B |
| Net asset value, end of period | $12.65 | $11.40 | $13.45 | $11.25 | $10.25 | $11.47 |
| Total ReturnC,D,E | 12.45% | (13.45)% | 20.29% | 11.36% | (9.68)% | 2.56% |
| Ratios to Average Net AssetsF,G | | | | | | |
| Expenses before reductions | 2.15%H | 2.14% | 2.21% | 2.62% | 2.68% | 2.72% |
| Expenses net of fee waivers, if any | 2.15%H | 2.14% | 2.21% | 2.40% | 2.40% | 2.40% |
| Expenses net of all reductions | 2.14%H | 2.12% | 2.20% | 2.39% | 2.39% | 2.40% |
| Net investment income (loss) | 1.32%H | 1.18% | 1.23% | 1.72% | 1.83% | .86% |
| Supplemental Data | | | | | | |
| Net assets, end of period (000 omitted) | $39,185 | $37,191 | $34,869 | $10,710 | $7,736 | $10,104 |
| Portfolio turnover rateI | 88%H | 94% | 59% | 57% | 80% | 102% |
A Calculated based on average shares outstanding during the period.
B Amount represents less than $.005 per share.
C Total returns for periods of less than one year are not annualized.
D Total returns would have been lower if certain expenses had not been reduced during the applicable periods shown.
E Total returns do not include the effect of the contingent deferred sales charge.
F Fees and expenses of any underlying Fidelity Central Funds are not included in the Fund's expense ratio. The Fund indirectly bears its proportionate share of the expenses of any underlying Fidelity Central Funds.
G Expense ratios reflect operating expenses of the class. Expenses before reductions do not reflect amounts reimbursed by the investment adviser or reductions from brokerage service arrangements or reductions from other expense offset arrangements and do not represent the amount paid by the class during periods when reimbursements or reductions occur. Expenses net of fee waivers reflect expenses after reimbursement by the investment adviser but prior to reductions from brokerage service arrangements or other expense offset arrangements. Expenses net of all reductions represent the net expenses paid by the class.
H Annualized
I Amount does not include the portfolio activity of any underlying Fidelity Central Funds.
See accompanying notes which are an integral part of the financial statements.
Fidelity Total Emerging Markets Fund
| | Six months ended (Unaudited) April 30, | Years endedOctober 31, | | | | |
| | 2019 | 2018 | 2017 | 2016 | 2015 | 2014 |
| Selected Per–Share Data | | | | | | |
| Net asset value, beginning of period | $11.56 | $13.58 | $11.34 | $10.38 | $11.60 | $11.40 |
| Income from Investment Operations | | | | | | |
| Net investment income (loss)A | .14 | .29 | .27 | .28 | .31 | .21 |
| Net realized and unrealized gain (loss) | 1.34 | (1.95) | 2.10 | .97 | (1.31) | .19 |
| Total from investment operations | 1.48 | (1.66) | 2.37 | 1.25 | (1.00) | .40 |
| Distributions from net investment income | (.28) | (.17) | (.14) | (.29) | (.20) | (.20) |
| Distributions from net realized gain | – | (.19) | (.01) | – | (.02) | – |
| Total distributions | (.28) | (.36) | (.14)B | (.29) | (.22) | (.20) |
| Redemption fees added to paid in capitalA | – | –C | .01 | –C | –C | –C |
| Net asset value, end of period | $12.76 | $11.56 | $13.58 | $11.34 | $10.38 | $11.60 |
| Total ReturnD,E | 13.09% | (12.56)% | 21.37% | 12.44% | (8.74)% | 3.56% |
| Ratios to Average Net AssetsF,G | | | | | | |
| Expenses before reductions | 1.14%H | 1.13% | 1.26% | 1.62% | 1.72% | 1.73% |
| Expenses net of fee waivers, if any | 1.14%H | 1.13% | 1.26% | 1.40% | 1.40% | 1.40% |
| Expenses net of all reductions | 1.13%H | 1.11% | 1.24% | 1.39% | 1.39% | 1.40% |
| Net investment income (loss) | 2.33%H | 2.19% | 2.18% | 2.72% | 2.83% | 1.86% |
| Supplemental Data | | | | | | |
| Net assets, end of period (000 omitted) | $212,557 | $190,025 | $272,002 | $104,332 | $37,918 | $45,763 |
| Portfolio turnover rateI | 88%H | 94% | 59% | 57% | 80% | 102% |
A Calculated based on average shares outstanding during the period.
B Total distributions of $.14 per share is comprised of distributions from net investment income of $.135 and distributions from net realized gain of $.009 per share.
C Amount represents less than $.005 per share.
D Total returns for periods of less than one year are not annualized.
E Total returns would have been lower if certain expenses had not been reduced during the applicable periods shown.
F Fees and expenses of any underlying Fidelity Central Funds are not included in the Fund's expense ratio. The Fund indirectly bears its proportionate share of the expenses of any underlying Fidelity Central Funds.
G Expense ratios reflect operating expenses of the class. Expenses before reductions do not reflect amounts reimbursed by the investment adviser or reductions from brokerage service arrangements or reductions from other expense offset arrangements and do not represent the amount paid by the class during periods when reimbursements or reductions occur. Expenses net of fee waivers reflect expenses after reimbursement by the investment adviser but prior to reductions from brokerage service arrangements or other expense offset arrangements. Expenses net of all reductions represent the net expenses paid by the class.
H Annualized
I Amount does not include the portfolio activity of any underlying Fidelity Central Funds.
See accompanying notes which are an integral part of the financial statements.
Fidelity Total Emerging Markets Fund Class I
| | Six months ended (Unaudited) April 30, | Years endedOctober 31, | | | | |
| | 2019 | 2018 | 2017 | 2016 | 2015 | 2014 |
| Selected Per–Share Data | | | | | | |
| Net asset value, beginning of period | $11.55 | $13.58 | $11.33 | $10.37 | $11.59 | $11.40 |
| Income from Investment Operations | | | | | | |
| Net investment income (loss)A | .14 | .29 | .28 | .29 | .31 | .21 |
| Net realized and unrealized gain (loss) | 1.33 | (1.95) | 2.11 | .96 | (1.31) | .18 |
| Total from investment operations | 1.47 | (1.66) | 2.39 | 1.25 | (1.00) | .39 |
| Distributions from net investment income | (.28) | (.19) | (.14) | (.29) | (.20) | (.20) |
| Distributions from net realized gain | – | (.19) | (.01) | – | (.02) | – |
| Total distributions | (.28) | (.37)B | (.15) | (.29) | (.22) | (.20) |
| Redemption fees added to paid in capitalA | – | –C | .01 | –C | –C | –C |
| Net asset value, end of period | $12.74 | $11.55 | $13.58 | $11.33 | $10.37 | $11.59 |
| Total ReturnD,E | 13.06% | (12.56)% | 21.51% | 12.48% | (8.74)% | 3.51% |
| Ratios to Average Net AssetsF,G | | | | | | |
| Expenses before reductions | 1.12%H | 1.12% | 1.19% | 1.54% | 1.58% | 1.71% |
| Expenses net of fee waivers, if any | 1.11%H | 1.12% | 1.19% | 1.40% | 1.40% | 1.40% |
| Expenses net of all reductions | 1.11%H | 1.10% | 1.17% | 1.39% | 1.39% | 1.40% |
| Net investment income (loss) | 2.35%H | 2.20% | 2.25% | 2.72% | 2.83% | 1.86% |
| Supplemental Data | | | | | | |
| Net assets, end of period (000 omitted) | $392,046 | $341,720 | $371,617 | $21,099 | $6,343 | $4,773 |
| Portfolio turnover rateI | 88%H | 94% | 59% | 57% | 80% | 102% |
A Calculated based on average shares outstanding during the period.
B Total distributions of $.37 per share is comprised of distributions from net investment income of $.185 and distributions from net realized gain of $.185 per share.
C Amount represents less than $.005 per share.
D Total returns for periods of less than one year are not annualized.
E Total returns would have been lower if certain expenses had not been reduced during the applicable periods shown.
F Fees and expenses of any underlying Fidelity Central Funds are not included in the Fund's expense ratio. The Fund indirectly bears its proportionate share of the expenses of any underlying Fidelity Central Funds.
G Expense ratios reflect operating expenses of the class. Expenses before reductions do not reflect amounts reimbursed by the investment adviser or reductions from brokerage service arrangements or reductions from other expense offset arrangements and do not represent the amount paid by the class during periods when reimbursements or reductions occur. Expenses net of fee waivers reflect expenses after reimbursement by the investment adviser but prior to reductions from brokerage service arrangements or other expense offset arrangements. Expenses net of all reductions represent the net expenses paid by the class.
H Annualized
I Amount does not include the portfolio activity of any underlying Fidelity Central Funds.
See accompanying notes which are an integral part of the financial statements.
Fidelity Total Emerging Markets Fund Class Z
| | Six months ended (Unaudited) April 30, | Years endedOctober 31, |
| | 2019 | 2018 A |
| Selected Per–Share Data | | |
| Net asset value, beginning of period | $11.55 | $12.17 |
| Income from Investment Operations | | |
| Net investment income (loss)B | .15 | .01 |
| Net realized and unrealized gain (loss) | 1.32 | (.63) |
| Total from investment operations | 1.47 | (.62) |
| Distributions from net investment income | (.31) | – |
| Distributions from net realized gain | – | – |
| Total distributions | (.31) | – |
| Net asset value, end of period | $12.71 | $11.55 |
| Total ReturnC,D | 13.05% | (5.09)% |
| Ratios to Average Net AssetsE,F | | |
| Expenses before reductions | .99%G | 1.07%G |
| Expenses net of fee waivers, if any | .98%G | 1.04%G |
| Expenses net of all reductions | .98%G | 1.02%G |
| Net investment income (loss) | 2.49%G | 1.51%G |
| Supplemental Data | | |
| Net assets, end of period (000 omitted) | $36,293 | $1,603 |
| Portfolio turnover rateH | 88%G | 94% |
A For the period October 2, 2018 (commencement of sale of shares) to October 31, 2018.
B Calculated based on average shares outstanding during the period.
C Total returns for periods of less than one year are not annualized.
D Total returns would have been lower if certain expenses had not been reduced during the applicable periods shown.
E Fees and expenses of any underlying Fidelity Central Funds are not included in the Fund's expense ratio. The Fund indirectly bears its proportionate share of the expenses of any underlying Fidelity Central Funds.
F Expense ratios reflect operating expenses of the class. Expenses before reductions do not reflect amounts reimbursed by the investment adviser or reductions from brokerage service arrangements or reductions from other expense offset arrangements and do not represent the amount paid by the class during periods when reimbursements or reductions occur. Expense ratios before reductions for start-up periods may not be representative of longer-term operating periods. Expenses net of fee waivers reflect expenses after reimbursement by the investment adviser but prior to reductions from brokerage service arrangements or other expense offset arrangements. Expenses net of all reductions represent the net expenses paid by the class.
G Annualized
H Amount does not include the portfolio activity of any underlying Fidelity Central Funds.
See accompanying notes which are an integral part of the financial statements.
Notes to Financial Statements (Unaudited)
For the period ended April 30, 2019
1. Organization.
Fidelity Total Emerging Markets Fund (the Fund) is a fund of Fidelity Investment Trust (the Trust) and is authorized to issue an unlimited number of shares. The Trust is registered under the Investment Company Act of 1940, as amended (the 1940 Act), as an open-end management investment company organized as a Massachusetts business trust. The Fund offers Class A, Class M, Class C, Total Emerging Markets, Class I and Class Z shares, each of which has equal rights as to assets and voting privileges. Each class has exclusive voting rights with respect to matters that affect that class. Effective March 1, 2019, Class C shares will automatically convert to Class A shares after a holding period of ten years from the initial date of purchase, with certain exceptions. The Fund's investments in emerging markets can be subject to social, economic, regulatory, and political uncertainties and can be extremely volatile.
2. Investments in Fidelity Central Funds.
The Fund invests in Fidelity Central Funds, which are open-end investment companies generally available only to other investment companies and accounts managed by the investment adviser and its affiliates. The Fund's Schedule of Investments lists each of the Fidelity Central Funds held as of period end, if any, as an investment of the Fund, but does not include the underlying holdings of each Fidelity Central Fund. As an Investing Fund, the Fund indirectly bears its proportionate share of the expenses of the underlying Fidelity Central Funds.
The Money Market Central Funds seek preservation of capital and current income and are managed by Fidelity Investments Money Management, Inc. (FIMM), an affiliate of the investment adviser. Annualized expenses of the Money Market Central Funds as of their most recent shareholder report date are less than .005%.
A complete unaudited list of holdings for each Fidelity Central Fund is available upon request or at the Securities and Exchange Commission (the SEC) website at www.sec.gov. In addition, the financial statements of the Fidelity Central Funds are available on the SEC website or upon request.
3. Significant Accounting Policies.
The Fund is an investment company and applies the accounting and reporting guidance of the Financial Accounting Standards Board (FASB) Accounting Standards Codification Topic 946 Financial Services – Investments Companies. The financial statements have been prepared in conformity with accounting principles generally accepted in the United States of America (GAAP), which require management to make certain estimates and assumptions at the date of the financial statements. Actual results could differ from those estimates. Subsequent events, if any, through the date that the financial statements were issued have been evaluated in the preparation of the financial statements. The following summarizes the significant accounting policies of the Fund:
Investment Valuation. Investments are valued as of 4:00 p.m. Eastern time on the last calendar day of the period. The Board of Trustees (the Board) has delegated the day to day responsibility for the valuation of the Fund's investments to the Fair Value Committee (the Committee) established by the Fund's investment adviser. In accordance with valuation policies and procedures approved by the Board, the Fund attempts to obtain prices from one or more third party pricing vendors or brokers to value its investments. When current market prices, quotations or currency exchange rates are not readily available or reliable, investments will be fair valued in good faith by the Committee, in accordance with procedures adopted by the Board. Factors used in determining fair value vary by investment type and may include market or investment specific events, changes in interest rates and credit quality. The frequency with which these procedures are used cannot be predicted and they may be utilized to a significant extent. The Committee oversees the Fund's valuation policies and procedures and reports to the Board on the Committee's activities and fair value determinations. The Board monitors the appropriateness of the procedures used in valuing the Fund's investments and ratifies the fair value determinations of the Committee.
The Fund categorizes the inputs to valuation techniques used to value its investments into a disclosure hierarchy consisting of three levels as shown below:
- Level 1 – quoted prices in active markets for identical investments
- Level 2 – other significant observable inputs (including quoted prices for similar investments, interest rates, prepayment speeds, etc.)
- Level 3 – unobservable inputs (including the Fund's own assumptions based on the best information available)
Valuation techniques used to value the Fund's investments by major category are as follows:
Equity securities, including restricted securities, for which market quotations are readily available, are valued at the last reported sale price or official closing price as reported by a third party pricing vendor on the primary market or exchange on which they are traded and are categorized as Level 1 in the hierarchy. In the event there were no sales during the day or closing prices are not available, securities are valued at the last quoted bid price or may be valued using the last available price and are generally categorized as Level 2 in the hierarchy. For foreign equity securities, when market or security specific events arise, comparisons to the valuation of American Depositary Receipts (ADRs), futures contracts, Exchange-Traded Funds (ETFs) and certain indexes as well as quoted prices for similar securities may be used and would be categorized as Level 2 in the hierarchy. For equity securities, including restricted securities, where observable inputs are limited, assumptions about market activity and risk are used and these securities may be categorized as Level 3 in the hierarchy.
Debt securities, including restricted securities, are valued based on evaluated prices received from third party pricing vendors or from brokers who make markets in such securities. Corporate bonds, foreign government and government agency obligations and U.S. government and government agency obligations are valued by pricing vendors who utilize matrix pricing which considers yield or price of bonds of comparable quality, coupon, maturity and type or by broker-supplied prices. When independent prices are unavailable or unreliable, debt securities may be valued utilizing pricing methodologies which consider similar factors that would be used by third party pricing vendors. Debt securities are generally categorized as Level 2 in the hierarchy but may be Level 3 depending on the circumstances.
Futures contracts are valued at the settlement price established each day by the board of trade or exchange on which they are traded and are categorized as Level 1 in the hierarchy. Investments in open-end mutual funds, including the Fidelity Central Funds, are valued at their closing net asset value (NAV) each business day and are categorized as Level 1 in the hierarchy.
Changes in valuation techniques may result in transfers in or out of an assigned level within the disclosure hierarchy. The aggregate value of investments by input level as of April 30, 2019 is included at the end of the Fund's Schedule of Investments.
Foreign Currency. The Fund may use foreign currency contracts to facilitate transactions in foreign-denominated securities. Gains and losses from these transactions may arise from changes in the value of the foreign currency or if the counterparties do not perform under the contracts' terms.
Foreign-denominated assets, including investment securities, and liabilities are translated into U.S. dollars at the exchange rates at period end. Purchases and sales of investment securities, income and dividends received and expenses denominated in foreign currencies are translated into U.S. dollars at the exchange rate in effect on the transaction date.
The effects of exchange rate fluctuations on investments are included with the net realized and unrealized gain (loss) on investment securities. Other foreign currency transactions resulting in realized and unrealized gain (loss) are disclosed separately.
Investment Transactions and Income. For financial reporting purposes, the Fund's investment holdings and NAV include trades executed through the end of the last business day of the period. The NAV per share for processing shareholder transactions is calculated as of the close of business of the New York Stock Exchange (NYSE), normally 4:00 p.m. Eastern time and includes trades executed through the end of the prior business day. Gains and losses on securities sold are determined on the basis of identified cost and include proceeds received from litigation. Dividend income is recorded on the ex-dividend date, except for certain dividends from foreign securities where the ex-dividend date may have passed, which are recorded as soon as the Fund is informed of the ex-dividend date. Non-cash dividends included in dividend income, if any, are recorded at the fair market value of the securities received. Income and capital gain distributions from Fidelity Central Funds, if any, are recorded on the ex-dividend date. Certain distributions received by the Fund represent a return of capital or capital gain. The Fund determines the components of these distributions subsequent to the ex-dividend date, based upon receipt of tax filings or other correspondence relating to the underlying investment. These distributions are recorded as a reduction of cost of investments and/or as a realized gain. Interest income is accrued as earned and includes coupon interest and amortization of premium and accretion of discount on debt securities as applicable. Investment income is recorded net of foreign taxes withheld where recovery of such taxes is uncertain. Debt obligations may be placed on non-accrual status and related interest income may be reduced by ceasing current accruals and writing off interest receivables when the collection of all or a portion of interest has become doubtful based on consistently applied procedures. A debt obligation is removed from non-accrual status when the issuer resumes interest payments or when collectability of interest is reasonably assured.
Class Allocations and Expenses. Investment income, realized and unrealized capital gains and losses, common expenses of the Fund, and certain fund-level expense reductions, if any, are allocated daily on a pro-rata basis to each class based on the relative net assets of each class to the total net assets of the Fund. Each class differs with respect to transfer agent and distribution and service plan fees incurred. Certain expense reductions may also differ by class. For the reporting period, the allocated portion of income and expenses to each class as a percent of its average net assets may vary due to the timing of recording these transactions in relation to fluctuating net assets of the classes. Expenses directly attributable to a fund are charged to that fund. Expenses attributable to more than one fund are allocated among the respective funds on the basis of relative net assets or other appropriate methods. Expense estimates are accrued in the period to which they relate and adjustments are made when actual amounts are known.
Income Tax Information and Distributions to Shareholders. Each year, the Fund intends to qualify as a regulated investment company under Subchapter M of the Internal Revenue Code, including distributing substantially all of its taxable income and realized gains. As a result, no provision for U.S. Federal income taxes is required. The Fund files a U.S. federal tax return, in addition to state and local tax returns as required. The Fund's federal income tax returns are subject to examination by the Internal Revenue Service (IRS) for a period of three fiscal years after they are filed. State and local tax returns may be subject to examination for an additional fiscal year depending on the jurisdiction. Foreign taxes are provided for based on the Fund's understanding of the tax rules and rates that exist in the foreign markets in which it invests.
Distributions are declared and recorded on the ex-dividend date. Income and capital gain distributions are declared separately for each class. Income and capital gain distributions are determined in accordance with income tax regulations, which may differ from GAAP.
Capital accounts within the financial statements are adjusted for permanent book-tax differences. These adjustments have no impact on net assets or the results of operations. Capital accounts are not adjusted for temporary book-tax differences which will reverse in a subsequent period.
Book-tax differences are primarily due to foreign currency transactions, futures contracts, certain foreign taxes, market discount, passive foreign investment companies (PFIC), capital loss carryforwards and losses deferred due to wash sales.
As of period end, the cost and unrealized appreciation (depreciation) in securities, and derivatives if applicable, for federal income tax purposes were as follows:
| Gross unrealized appreciation | $88,374,978 |
| Gross unrealized depreciation | (29,274,160) |
| Net unrealized appreciation (depreciation) | $59,100,818 |
| Tax cost | $668,962,131 |
Capital loss carryforwards are only available to offset future capital gains of the Fund to the extent provided by regulations and may be limited. Under the Regulated Investment Company Modernization Act of 2010 (the Act), the Fund is permitted to carry forward capital losses incurred in taxable years beginning after December 22, 2010 for an unlimited period and such capital losses are required to be used prior to any losses that expire. The capital loss carryforward information presented below, including any applicable limitation, is estimated as of prior fiscal period end and is subject to adjustment.
| No expiration | |
| Short-term | $(25,726,179) |
| Total no expiration | (25,726,179) |
| Total capital loss carryforward | $(25,726,179) |
Delayed Delivery Transactions and When-Issued Securities. During the period, the Fund transacted in securities on a delayed delivery or when-issued basis. Payment and delivery may take place after the customary settlement period for that security. The price of the underlying securities and the date when the securities will be delivered and paid for are fixed at the time the transaction is negotiated. The securities purchased on a delayed delivery or when-issued basis are identified as such in the Fund's Schedule of Investments. Losses may arise due to changes in the value of the underlying securities or if the counterparty does not perform under the contract's terms, or if the issuer does not issue the securities due to political, economic, or other factors.
Restricted Securities. The Fund may invest in securities that are subject to legal or contractual restrictions on resale. These securities generally may be resold in transactions exempt from registration or to the public if the securities are registered. Disposal of these securities may involve time-consuming negotiations and expense, and prompt sale at an acceptable price may be difficult. Information regarding restricted securities is included at the end of the Fund's Schedule of Investments.
4. Derivative Instruments.
Risk Exposures and the Use of Derivative Instruments. The Fund's investment objective allows the Fund to enter into various types of derivative contracts, including futures contracts. Derivatives are investments whose value is primarily derived from underlying assets, indices or reference rates and may be transacted on an exchange or over-the-counter (OTC). Derivatives may involve a future commitment to buy or sell a specified asset based on specified terms, to exchange future cash flows at periodic intervals based on a notional principal amount, or for one party to make one or more payments upon the occurrence of specified events in exchange for periodic payments from the other party.
The Fund used derivatives to increase returns and to manage exposure to certain risks as defined below. The success of any strategy involving derivatives depends on analysis of numerous economic factors, and if the strategies for investment do not work as intended, the Fund may not achieve its objectives.
The Fund's use of derivatives increased or decreased its exposure to the following risk:
| Equity Risk | Equity risk relates to the fluctuations in the value of financial instruments as a result of changes in market prices (other than those arising from interest rate risk or foreign exchange risk), whether caused by factors specific to an individual investment, its issuer, or all factors affecting all instruments traded in a market or market segment.
|
The Fund is also exposed to additional risks from investing in derivatives, such as liquidity risk and counterparty credit risk. Liquidity risk is the risk that the Fund will be unable to close out the derivative in the open market in a timely manner. Counterparty credit risk is the risk that the counterparty will not be able to fulfill its obligation to the Fund. Counterparty credit risk related to exchange-traded futures contracts may be mitigated by the protection provided by the exchange on which they trade.
Investing in derivatives may involve greater risks than investing in the underlying assets directly and, to varying degrees, may involve risk of loss in excess of any initial investment and collateral received and amounts recognized in the Statement of Assets and Liabilities. In addition, there may be the risk that the change in value of the derivative contract does not correspond to the change in value of the underlying instrument.
Futures Contracts. A futures contract is an agreement between two parties to buy or sell a specified underlying instrument for a fixed price at a specified future date. The Fund used futures contracts to manage its exposure to the stock market.
Upon entering into a futures contract, a fund is required to deposit either cash or securities (initial margin) with a clearing broker in an amount equal to a certain percentage of the face value of the contract. Futures contracts are marked-to-market daily and subsequent daily payments (variation margin) are made or received by a fund depending on the daily fluctuations in the value of the futures contracts and are recorded as unrealized appreciation or (depreciation). This receivable and/or payable, if any, is included in daily variation margin on futures contracts in the Statement of Assets and Liabilities. Realized gain or (loss) is recorded upon the expiration or closing of a futures contract. The net realized gain (loss) and change in net unrealized appreciation (depreciation) on futures contracts during the period is presented in the Statement of Operations.
Any open futures contracts at period end are presented in the Schedule of Investments under the caption "Futures Contracts". The notional amount at value reflects each contract's exposure to the underlying instrument or index at period end and is representative of volume activity during the period. Securities deposited to meet initial margin requirements are identified in the Schedule of Investments.
5. Purchases and Sales of Investments.
Purchases and sales of securities, other than short-term securities and U.S. government securities, aggregated $301,656,545 and $250,399,534, respectively.
6. Fees and Other Transactions with Affiliates.
Management Fee. Fidelity Management & Research Company (the investment adviser) and its affiliates provide the Fund with investment management related services for which the Fund pays a monthly management fee. The management fee is the sum of an individual fund fee rate that is based on an annual rate of .55% of the Fund's average net assets and an annualized group fee rate that averaged .24% during the period. The group fee rate is based upon the average net assets of all the mutual funds advised by the investment adviser, including any mutual funds previously advised by the investment adviser that are currently advised by Fidelity SelectCo, LLC, an affiliate of the investment adviser. The group fee rate decreases as assets under management increase and increases as assets under management decrease. For the reporting period, the total annualized management fee rate was .79% of the Fund's average net assets.
Distribution and Service Plan Fees. In accordance with Rule 12b-1 of the 1940 Act, the Fund has adopted separate Distribution and Service Plans for each class of shares. Certain classes pay Fidelity Distributors Corporation (FDC), an affiliate of the investment adviser, separate Distribution and Service Fees, each of which is based on an annual percentage of each class' average net assets. In addition, FDC may pay financial intermediaries for selling shares of the Fund and providing shareholder support services. For the period, the Distribution and Service Fee rates, total fees and amounts retained by FDC were as follows:
| | Distribution Fee | Service Fee | Total Fees | Retained by FDC |
| Class A | -% | .25% | $45,622 | $2,234 |
| Class M | .25% | .25% | 21,564 | 260 |
| Class C | .75% | .25% | 191,367 | 42,987 |
| | | | $258,553 | $45,481 |
Sales Load. FDC may receive a front-end sales charge of up to 5.75% for selling Class A shares and 3.50% for selling Class M shares, some of which is paid to financial intermediaries for selling shares of the Fund. Depending on the holding period, FDC may receive contingent deferred sales charges levied on Class A, Class M and Class C redemptions. The deferred sales charges are 1.00% for Class C shares, 1.00% for certain purchases of Class A shares and .25% for certain purchases of Class M shares.
For the period, sales charge amounts retained by FDC were as follows:
| | Retained by FDC |
| Class A | $8,598 |
| Class M | 1,015 |
| Class C(a) | 2,614 |
| | $12,227 |
(a) When Class C shares are initially sold, FDC pays commissions from its own resources to financial intermediaries through which the sales are made.
Transfer Agent Fees. Fidelity Investments Institutional Operations Company, Inc., (FIIOC), an affiliate of the investment adviser, is the transfer, dividend disbursing and shareholder servicing agent for each class of the Fund. FIIOC receives account fees and asset-based fees that vary according to the account size and type of account of the shareholders of the respective classes of the Fund, except for Class Z. FIIOC receives an asset-based fee of Class Z's average net assets. FIIOC pays for typesetting, printing and mailing of shareholder reports, except proxy statements.
For the period, transfer agent fees for each class were as follows:
| | Amount | % of Class-Level Average Net Assets(a) |
| Class A | $38,513 | .21 |
| Class M | 12,517 | .29 |
| Class C | 39,809 | .21 |
| Total Emerging Markets | 197,556 | .20 |
| Class I | 311,888 | .17 |
| Class Z | 3,836 | .05 |
| | $604,119 | |
(a) Annualized
Accounting and Security Lending Fees. Fidelity Service Company, Inc. (FSC), an affiliate of the investment adviser, maintains the Fund's accounting records. The accounting fee is based on the level of average net assets for each month. Prior to April 1, 2019, FSC had a separate agreement with the Fund for administration of the security lending program, based on the number and duration of lending transactions. For the period, the total fees paid for accounting and administration of securities lending were equivalent to an annualized rate of .05%.
Brokerage Commissions. The Fund placed a portion of its portfolio transactions with brokerage firms which are affiliates of the investment adviser. Brokerage commissions are included in net realized gain (loss) and change in net unrealized appreciation (depreciation) in the Statement of Operations. The commissions paid to these affiliated firms were $1,296 for the period.
Interfund Trades. The Fund may purchase from or sell securities to other Fidelity Funds under procedures adopted by the Board. The procedures have been designed to ensure these interfund trades are executed in accordance with Rule 17a-7 of the 1940 Act. Interfund trades are included within the respective purchases and sales amounts shown in the Purchases and Sales of Investments note.
7. Committed Line of Credit.
The Fund participates with other funds managed by the investment adviser or an affiliate in a $4.25 billion credit facility (the "line of credit") to be utilized for temporary or emergency purposes to fund shareholder redemptions or for other short-term liquidity purposes. The Fund has agreed to pay commitment fees on its pro-rata portion of the line of credit, which amounted to $923 and is reflected in Miscellaneous expenses on the Statement of Operations. During the period, the Fund did not borrow on this line of credit.
8. Security Lending.
The Fund lends portfolio securities through a lending agent from time to time in order to earn additional income. For equity securities, a lending agent is used and may loan securities to certain qualified borrowers, including Fidelity Capital Markets (FCM), a broker-dealer affiliated with the Fund. On the settlement date of the loan, the Fund receives collateral (in the form of U.S. Treasury obligations, letters of credit and/or cash) against the loaned securities and maintains collateral in an amount not less than 100% of the market value of the loaned securities during the period of the loan. The market value of the loaned securities is determined at the close of business of the Fund and any additional required collateral is delivered to the Fund on the next business day. The Fund or borrower may terminate the loan at any time, and if the borrower defaults on its obligation to return the securities loaned because of insolvency or other reasons, the Fund may apply collateral received from the borrower against the obligation. The Fund may experience delays and costs in recovering the securities loaned. Any cash collateral received is invested in the Fidelity Securities Lending Cash Central Fund. The value of loaned securities and cash collateral at period end are disclosed on the Fund's Statement of Assets and Liabilities. Security lending income represents the income earned on investing cash collateral, less rebates paid to borrowers and any lending agent fees associated with the loan, plus any premium payments received for lending certain types of securities. Security lending income is presented in the Statement of Operations as a component of income from Fidelity Central Funds. Total security lending income during the period amounted to $19,722. During the period, there were no securities loaned to FCM.
9. Expense Reductions.
Commissions paid to certain brokers with whom the investment adviser, or its affiliates, places trades on behalf of the Fund include an amount in addition to trade execution, which may be rebated back to the Fund to offset certain expenses. This amount totaled $17,146 for the period.
In addition, during the period the investment adviser reimbursed and/or waived a portion of fund-level operating expenses in the amount of $2,417 and a portion of class-level operating expenses as follows:
| | Amount |
| Class A | $870 |
| Class M | 203 |
| Class C | 919 |
| Total Emerging Markets | 4,770 |
| Class I | 8,600 |
| Class Z | 638 |
| | $16,000 |
10. Distributions to Shareholders.
Distributions to shareholders of each class were as follows:
| | Six months ended
April 30, 2019 | Year ended
October 31, 2018 |
| Distributions to shareholders | | |
| Class A | $714,243 | $1,173,252 |
| Class M | 223,588 | 134,477 |
| Class C | 488,821 | 782,198 |
| Total Emerging Markets | 4,522,488 | 7,266,702 |
| Class I | 8,130,208 | 10,916,913 |
| Class Z | 98,706 | – |
| Total | $14,178,054 | $20,273,542 |
11. Share Transactions.
Share transactions for each class were as follows and may contain automatic conversions between classes or exchanges between affiliated funds:
| | Shares | Shares | Dollars | Dollars |
| | Six months ended April 30, 2019 | Year ended October 31, 2018(a) | Six months ended April 30, 2019 | Year ended October 31, 2018(a) |
| Class A | | | | |
| Shares sold | 555,807 | 1,859,563 | $6,748,425 | $25,085,167 |
| Reinvestment of distributions | 62,554 | 88,408 | 711,236 | 1,166,980 |
| Shares redeemed | (471,860) | (2,058,546) | (5,620,592) | (26,793,915) |
| Net increase (decrease) | 146,501 | (110,575) | $1,839,069 | $(541,768) |
| Class M | | | | |
| Shares sold | 57,572 | 275,701 | $697,967 | $3,701,993 |
| Reinvestment of distributions | 13,182 | 15,634 | 150,011 | 206,523 |
| Shares redeemed | (113,929) | (196,678) | (1,356,440) | (2,571,520) |
| Net increase (decrease) | (43,175) | 94,657 | $(508,462) | $1,336,996 |
| Class C | | | | |
| Shares sold | 323,314 | 1,470,832 | $3,900,839 | $19,647,127 |
| Reinvestment of distributions | 43,111 | 59,490 | 488,019 | 781,699 |
| Shares redeemed | (532,057) | (861,075) | (6,376,912) | (10,881,951) |
| Net increase (decrease) | (165,632) | 669,247 | $(1,988,054) | $9,546,875 |
| Total Emerging Markets | | | | |
| Shares sold | 3,176,715 | 8,907,832 | $38,590,315 | $120,823,803 |
| Reinvestment of distributions | 380,480 | 522,036 | 4,329,863 | 6,896,099 |
| Shares redeemed | (3,332,724) | (13,024,202) | (39,960,701) | (167,212,962) |
| Net increase (decrease) | 224,471 | (3,594,334) | $2,959,477 | $(39,493,060) |
| Class I | | | | |
| Shares sold | 9,132,409 | 17,527,189 | $110,155,497 | $232,099,188 |
| Reinvestment of distributions | 691,717 | 792,863 | 7,857,900 | 10,457,863 |
| Shares redeemed | (8,645,707) | (16,103,644) | (102,330,485) | (201,759,709) |
| Net increase (decrease) | 1,178,419 | 2,216,408 | $15,682,912 | $40,797,342 |
| Class Z | | | | |
| Shares sold | 2,837,081 | 139,605 | $34,403,643 | $1,609,269 |
| Reinvestment of distributions | 7,811 | – | 88,498 | – |
| Shares redeemed | (129,271) | (758) | (1,571,735) | (8,750) |
| Net increase (decrease) | 2,715,621 | 138,847 | $32,920,406 | $1,600,519 |
(a) Share transactions for Class Z are for the period October 2, 2018 (commencement of sale of shares) to October 31, 2018
12. Other.
The Fund's organizational documents provide former and current trustees and officers with a limited indemnification against liabilities arising in connection with the performance of their duties to the Fund. In the normal course of business, the Fund may also enter into contracts that provide general indemnifications. The Fund's maximum exposure under these arrangements is unknown as this would be dependent on future claims that may be made against the Fund. The risk of material loss from such claims is considered remote.
Shareholder Expense Example
As a shareholder of a Fund, you incur two types of costs: (1) transaction costs, including sales charges (loads) on purchase payments or redemption proceeds, and (2) ongoing costs, including management fees, distribution and/or service (12b-1) fees and other Fund expenses. This Example is intended to help you understand your ongoing costs (in dollars) of investing in the Funds and to compare these costs with the ongoing costs of investing in other mutual funds.
The Example is based on an investment of $1,000 invested at the beginning of the period and held for the entire period (November 1, 2018 to April 30, 2019).
Actual Expenses
The first line of the accompanying table for each Class of each fund provides information about actual account values and actual expenses. You may use the information in this line, together with the amount you invested, to estimate the expenses that you paid over the period. Simply divide your account value by $1,000.00 (for example, an $8,600 account value divided by $1,000.00 = 8.6), then multiply the result by the number in the first line for a Class of the fund under the heading entitled "Expenses Paid During Period" to estimate the expenses you paid on your account during this period. In addition, each Fund, as a shareholder in the underlying Fidelity Central Funds, will indirectly bear its pro-rata share of the fees and expenses incurred by the underlying Fidelity Central Funds. These fees and expenses are not included in the Fund's annualized expense ratio used to calculate the expense estimate in the table below.
Hypothetical Example for Comparison Purposes
The second line of the accompanying table for each Class of each fund provides information about hypothetical account values and hypothetical expenses based on a Class' actual expense ratio and an assumed rate of return of 5% per year before expenses, which is not the Class' actual return. The hypothetical account values and expenses may not be used to estimate the actual ending account balance or expenses you paid for the period. You may use this information to compare the ongoing costs of investing in the Fund and other funds. To do so, compare this 5% hypothetical example with the 5% hypothetical examples that appear in the shareholder reports of the other funds. In addition, each Fund, as a shareholder in the underlying Fidelity Central Funds, will indirectly bear its pro-rata share of the fees and expenses incurred by the underlying Fidelity Central Funds. These fees and expenses are not included in the Fund's annualized expense ratio used to calculate the expense estimate in the table below.
Please note that the expenses shown in the table are meant to highlight your ongoing costs only and do not reflect any transaction costs. Therefore, the second line of the table is useful in comparing ongoing costs only, and will not help you determine the relative total costs of owning different funds. In addition, if these transactional costs were included, your costs would have been higher.
| | Annualized Expense Ratio-A | Beginning
Account Value
November 1, 2018 | Ending
Account Value
April 30, 2019 | Expenses Paid
During Period-B
November 1, 2018
to April 30, 2019 |
| Fidelity Emerging Markets Discovery Fund | | | | |
| Class A | 1.56% | | | |
| Actual | | $1,000.00 | $1,146.50 | $8.30 |
| Hypothetical-C | | $1,000.00 | $1,017.06 | $7.80 |
| Class M | 1.88% | | | |
| Actual | | $1,000.00 | $1,143.90 | $9.99 |
| Hypothetical-C | | $1,000.00 | $1,015.47 | $9.39 |
| Class C | 2.38% | | | |
| Actual | | $1,000.00 | $1,141.10 | $12.63 |
| Hypothetical-C | | $1,000.00 | $1,012.99 | $11.88 |
| Emerging Markets Discovery | 1.27% | | | |
| Actual | | $1,000.00 | $1,147.70 | $6.76 |
| Hypothetical-C | | $1,000.00 | $1,018.50 | $6.36 |
| Class I | 1.26% | | | |
| Actual | | $1,000.00 | $1,146.90 | $6.71 |
| Hypothetical-C | | $1,000.00 | $1,018.55 | $6.31 |
| Class Z | 1.12% | | | |
| Actual | | $1,000.00 | $1,147.90 | $5.96 |
| Hypothetical-C | | $1,000.00 | $1,019.24 | $5.61 |
| Fidelity Total Emerging Markets Fund | | | | |
| Class A | 1.40% | | | |
| Actual | | $1,000.00 | $1,128.50 | $7.39 |
| Hypothetical-C | | $1,000.00 | $1,017.85 | $7.00 |
| Class M | 1.73% | | | |
| Actual | | $1,000.00 | $1,127.00 | $9.12 |
| Hypothetical-C | | $1,000.00 | $1,016.22 | $8.65 |
| Class C | 2.15% | | | |
| Actual | | $1,000.00 | $1,124.50 | $11.33 |
| Hypothetical-C | | $1,000.00 | $1,014.13 | $10.74 |
| Total Emerging Markets | 1.14% | | | |
| Actual | | $1,000.00 | $1,130.90 | $6.02 |
| Hypothetical-C | | $1,000.00 | $1,019.14 | $5.71 |
| Class I | 1.11% | | | |
| Actual | | $1,000.00 | $1,130.60 | $5.86 |
| Hypothetical-C | | $1,000.00 | $1,019.29 | $5.56 |
| Class Z | .98% | | | |
| Actual | | $1,000.00 | $1,130.50 | $5.18 |
| Hypothetical-C | | $1,000.00 | $1,019.93 | $4.91 |
A Annualized expense ratio reflects expenses net of applicable fee waivers.
B Expenses are equal to each Class' annualized expense ratio, multiplied by the average account value over the period, multiplied by 181/ 365 (to reflect the one-half year period).
C 5% return per year before expenses
Board Approval of Investment Advisory Contracts and Management Fees
Fidelity Emerging Markets Discovery Fund
Fidelity Total Emerging Markets Fund
Each year, the Board of Trustees, including the Independent Trustees (together, the Board), votes on the renewal of the management contract with Fidelity Management & Research Company (FMR) and the sub-advisory agreements (together, the Advisory Contracts) for each fund. FMR and the sub-advisers are referred to herein as the Investment Advisers. The Board, assisted by the advice of fund counsel and Independent Trustees' counsel, requests and considers a broad range of information relevant to the renewal of the Advisory Contracts throughout the year.
The Board meets regularly and, at each of its meetings, covers an extensive agenda of topics and materials and considers factors that are relevant to its annual consideration of the renewal of each fund's Advisory Contracts, including the services and support provided to each fund and its shareholders. The Board has established various standing committees (Committees), each composed of and chaired by Independent Trustees with varying backgrounds, to which the Board has assigned specific subject matter responsibilities in order to enhance effective decision-making by the Board. The Board, acting directly and through its Committees, requests and receives information concerning the annual consideration of the renewal of each fund's Advisory Contracts. The Board also meets as needed to review matters specifically related to the Board's annual consideration of the renewal of the Advisory Contracts. Members of the Board may also meet with trustees of other Fidelity funds through joint ad hoc committees to discuss certain matters relevant to all of the Fidelity funds.
At its January 2019 meeting, the Board unanimously determined to renew each fund's Advisory Contracts. In reaching its determination, the Board considered all factors it believed relevant, including (i) the nature, extent, and quality of the services to be provided to each fund and its shareholders (including the investment performance of each fund); (ii) the competitiveness of each fund's management fee and total expense ratio relative to peer funds; (iii) the total costs of the services to be provided by and the profits to be realized by Fidelity from its relationships with each fund; and (iv) the extent to which, if any, economies of scale exist and would be realized as each fund grows, and whether any economies of scale are appropriately shared with fund shareholders.
In considering whether to renew the Advisory Contracts for each fund, the Board reached a determination, with the assistance of fund counsel and Independent Trustees' counsel and through the exercise of its business judgment, that the renewal of the Advisory Contracts was in the best interests of each fund and its shareholders and that the compensation payable under the Advisory Contracts was fair and reasonable. The Board's decision to renew the Advisory Contracts was not based on any single factor, but rather was based on a comprehensive consideration of all the information provided to the Board at its meetings throughout the year. The Board, in reaching its determination to renew the Advisory Contracts, was aware that shareholders of each fund have a broad range of investment choices available to them, including a wide choice among funds offered by Fidelity's competitors, and that each fund's shareholders, who have the opportunity to review and weigh the disclosure provided by the fund in its prospectus and other public disclosures, have chosen to invest in that fund, which is part of the Fidelity family of funds.
Nature, Extent, and Quality of Services Provided. The Board considered Fidelity's staffing as it relates to the funds, including the backgrounds of investment personnel of Fidelity, and also considered the funds' investment objectives, strategies, and related investment philosophies. The Independent Trustees also had discussions with senior management of Fidelity's investment operations and investment groups. The Board considered the structure of the investment personnel compensation program and whether this structure provides appropriate incentives to act in the best interests of each fund. Additionally, the Board considered the portfolio managers' investments, if any, in the funds that they manage.
Resources Dedicated to Investment Management and Support Services. The Board and the Fund Oversight and Research Committees reviewed the general qualifications and capabilities of Fidelity's investment staff, including its size, education, experience, and resources, as well as Fidelity's approach to recruiting, training, managing, and compensating investment personnel. The Board noted that Fidelity has continued to increase the resources devoted to non-U.S. offices, including expansion of Fidelity's global investment organization. The Board also noted that Fidelity's analysts have extensive resources, tools and capabilities that allow them to conduct sophisticated quantitative and fundamental analysis, as well as credit analysis of issuers, counterparties and guarantors. Further, the Board considered that Fidelity's investment professionals have sufficient access to global information and data so as to provide competitive investment results over time, and that those professionals also have access to sophisticated tools that permit them to assess portfolio construction and risk and performance attribution characteristics continuously, as well as to transmit new information and research conclusions rapidly around the world. Additionally, in its deliberations, the Board considered Fidelity's trading, risk management, compliance, and technology and operations capabilities and resources, which are integral parts of the investment management process.
Shareholder and Administrative Services. The Board considered (i) the nature, extent, quality, and cost of advisory, administrative, and shareholder services performed by the Investment Advisers and their affiliates under the Advisory Contracts and under separate agreements covering transfer agency, pricing and bookkeeping, and securities lending services for each fund; (ii) the nature and extent of the supervision of third party service providers, principally custodians, subcustodians, and pricing vendors; and (iii) the resources devoted to, and the record of compliance with, each fund's compliance policies and procedures. The Board also reviewed the allocation of fund brokerage, including allocations to brokers affiliated with the Investment Advisers, the use of brokerage commissions to pay fund expenses, and the use of "soft" commission dollars to pay for research services.
The Board noted that the growth of fund assets over time across the complex allows Fidelity to reinvest in the development of services designed to enhance the value and convenience of the Fidelity funds as investment vehicles. These services include 24-hour access to account information and market information through telephone representatives and over the Internet, investor education materials and asset allocation tools, and the expanded availability of Fidelity Investor Centers.
The Board noted that it and the boards of certain other Fidelity funds had formed an ad hoc Committee on Transfer Agency Fees to review the variety of transfer agency fee structures throughout the industry and Fidelity's competitive positioning with respect to industry participants.
Investment in a Large Fund Family. The Board considered the benefits to shareholders of investing in a Fidelity fund, including the benefits of investing in a fund that is part of a large family of funds offering a variety of investment disciplines and providing a large variety of mutual fund investor services. The Board noted that Fidelity had taken, or had made recommendations that resulted in the Fidelity funds taking, a number of actions over the previous year that benefited particular funds, including: (i) continuing to dedicate additional resources to Fidelity's investment research process, which includes meetings with management of issuers of securities in which the funds invest, and to the support of the senior management team that oversees asset management; (ii) continuing efforts to enhance Fidelity's global research capabilities; (iii) launching new funds and making other enhancements to meet client needs; (iv) launching new share classes of existing funds; (v) eliminating purchase minimums and broadening eligibility requirements for certain funds and share classes; (vi) reducing management fees and total expenses for certain growth equity funds and index funds; (vii) lowering expense caps for certain existing funds and classes, and converting certain voluntary expense caps to contractual caps, to reduce expenses borne by shareholders; (viii) eliminating short-term redemption fees for funds that had such fees; (ix) rationalizing product lines and gaining increased efficiencies from fund mergers and share class consolidations; (x) continuing to develop, acquire and implement systems and technology to improve services to the funds and shareholders, strengthen information security, and increase efficiency; and (xi) continuing to implement enhancements to further strengthen Fidelity's product line to increase investors' probability of success in achieving their investment goals, including retirement income goals.
Investment Performance. The Board considered whether each fund has operated in accordance with its investment objective, as well as its record of compliance with its investment restrictions and its performance history. The Board noted that there were portfolio management changes for Fidelity Total Emerging Markets Fund in October 2015, January 2017, and June 2018. The Board noted that there were portfolio management changes for Fidelity Emerging Markets Discovery Fund in May 2018 and June 2018. The Board will continue to monitor closely the funds' performance, taking into account the portfolio manager changes.
The Board took into account discussions that occur at Board meetings throughout the year with representatives of the Investment Advisers about fund investment performance. In this regard the Board noted that as part of regularly scheduled fund reviews and other reports to the Board on fund performance, the Board considers annualized return information for each fund for different time periods, measured against an appropriate securities market index ("benchmark index") and a peer group of funds with similar objectives ("peer group"), if any. In its evaluation of fund investment performance, the Board gave particular attention to information indicating changes in performance of certain Fidelity funds for specific time periods and discussed with the Investment Advisers the reasons for any overperformance or underperformance.
In addition to reviewing absolute and relative fund performance, the Independent Trustees periodically consider the appropriateness of fund performance metrics in evaluating the results achieved. In general, the Independent Trustees believe that fund performance should be evaluated based on net performance (after fees and expenses) of both the highest performing and lowest performing fund share classes, where applicable, compared to appropriate benchmark indices, over appropriate time periods that may include full market cycles, and compared to peer groups, as applicable, over the same periods, taking into account relevant factors including the following: general market conditions; issuer-specific information; and fund cash flows and other factors.
The Independent Trustees recognize that shareholders evaluate performance on a net basis over their own holding periods, for which one-, three-, and five-year periods are often used as a proxy. For this reason, the performance information reviewed by the Board also included net cumulative total return information for each fund and an appropriate benchmark index and, in the case of Fidelity Emerging Markets Discovery Fund, peer group for the most recent one-, three-, and five-year periods ended June 30, 2018, as shown below. Returns are shown compared to the 25th percentile (top of box, 75% beaten) and 75th percentile (bottom of box, 25% beaten) of the peer universe. For Fidelity Total Emerging Markets Fund, a peer group is not shown below because the fund does not generally utilize a peer group for performance comparison purposes.
Fidelity Emerging Markets Discovery Fund

Fidelity Total Emerging Markets Fund

Based on its review, the Board concluded that the nature, extent, and quality of services provided to each fund under the Advisory Contracts should continue to benefit the shareholders of each fund.
Competitiveness of Management Fee and Total Expense Ratio. The Board considered each fund's management fee and total expense ratio compared to "mapped groups" of competitive funds and classes created for the purpose of facilitating the Trustees' competitive analysis of management fees and total expenses. Fidelity creates "mapped groups" by combining similar Lipper investment objective categories that have comparable investment mandates. Combining Lipper investment objective categories aids the Board's management fee and total expense ratio comparisons by broadening the competitive group used for comparison.
Management Fee. The Board considered two proprietary management fee comparisons for the 12-month periods (ended June 30 for 2018 and December 31 for prior periods) shown in basis points (BP) in the charts below. The group of Lipper funds used by the Board for management fee comparisons is referred to below as the "Total Mapped Group." The Total Mapped Group comparison focuses on a fund's standing in terms of gross management fees before expense reimbursements or caps relative to the total universe of funds with comparable investment mandates, regardless of whether their management fee structures also are comparable. Funds with comparable investment mandates offer exposure to similar types of securities. Funds with comparable management fee structures have similar management fee contractual arrangements (
e.g., flat rate charged for advisory services, all-inclusive fee rate,
etc.). "TMG %" represents the percentage of funds in the Total Mapped Group that had management fees that were lower than a fund's. For example, a hypothetical TMG % of 20% would mean that 80% of the funds in the Total Mapped Group had higher, and 20% had lower, management fees than a fund. The funds' actual TMG %s and the number of funds in the Total Mapped Group are in the charts below. The "Asset-Size Peer Group" (ASPG) comparison focuses on a fund's standing relative to a subset of non-Fidelity funds within the Total Mapped Group that are similar in size and management fee structure. For example, if a fund is in the first quartile of the ASPG, the fund's management fee ranks in the least expensive or lowest 25% of funds in the ASPG. The ASPG represents at least 15% of the funds in the Total Mapped Group with comparable asset size and management fee structures, subject to a minimum of 50 funds (or all funds in the Total Mapped Group if fewer than 50). Additional information, such as the ASPG quartile in which a fund's management fee rate ranked, is also included in the charts and was considered by the Board.
Fidelity Emerging Markets Discovery Fund

Fidelity Total Emerging Markets Fund
The Board noted that each fund's management fee rate ranked below the median of its Total Mapped Group and below the median of its ASPG for the 12-month period ended June 30, 2018.
The Board noted that it and the boards of other Fidelity funds formed an ad hoc Committee on Group Fee, which meets periodically, to conduct an in-depth review of the "group fee" component of the management fee of funds with such management fee structures. The Committee's focus included the mechanics of the group fee, the competitive landscape of group fee structures, Fidelity funds with no group fee component and investment products not included in group fee assets. The Board also considered that, for funds subject to the group fee, FMR agreed to voluntarily waive fees over a specified period of time in amounts designed to account for assets converted from certain funds to certain collective investment trusts.
The Board also noted that, in 2013, the ad hoc Committee on Management Fees was formed to conduct an in-depth review of the management fee rates of Fidelity's active equity mutual funds. The Committee focused on the following areas: (i) standard fee structures; (ii) research consumption and trading evolution; (iii) management fee competitiveness/profitability by category; and (iv) factors that drive institutional pricing.
Based on its review, the Board concluded that each fund's management fee is fair and reasonable in light of the services that the fund receives and the other factors considered.
Total Expense Ratio. In its review of the total expense ratio of each class of each fund, the Board considered the fund's management fee rate as well as other fund or class expenses, as applicable, such as transfer agent fees, pricing and bookkeeping fees, fund-paid 12b-1 fees, and custodial, legal, and audit fees. The Board also noted that Fidelity may agree to waive fees and expenses from time to time, and the extent to which, if any, it has done so for each fund. As part of its review, the Board also considered the current and historical total expense ratios of each class of each fund compared to competitive fund median expenses. Each class of each fund is compared to those funds and classes in the Total Mapped Group (used by the Board for management fee comparisons) that have a similar sales load structure.
The Board noted that each fund offers multiple classes, each of which has a different sales load and 12b-1 fee structure, and that the multiple structures are intended to offer a range of pricing options for the intermediary market. The Board also noted that the total expense ratios of the classes of each fund vary primarily by the level of their 12b-1 fees, although differences in transfer agent fees may also cause expenses to vary from class to class.
The Board noted that the total expense ratio of each of Class A and the retail class of Fidelity Emerging Markets Discovery Fund ranked below the competitive median for the 12-month period ended June 30, 2018, and each of Class M, Class C, and Class I of Fidelity Emerging Markets Discovery Fund ranked above the competitive median for the 12-month period ended June 30, 2018. The Board considered that, in general, various factors can affect total expense ratios. The Board noted that the total expense ratio of Class M was above the competitive median primarily because of higher 12b-1 fees on Class M as compared to most competitor funds. Class M has a higher 12b-1 fee, but a lower front-end sales charge, than traditionally priced front-end sales charge classes. The Board considered that Class M is primarily sold load-waived to retirement plans and intermediary wrap programs where its 0.50% 12b-1 fee is comparable to competing no-load, higher 12b-1 fee classes designed specifically for retirement plans and wrap programs. The Board noted that the total expense ratio of Class C was above the competitive median primarily because of its 1.00% 12b-1 fee. The Board noted that, although Class I is categorized by Lipper as an institutional class, Class I has a significantly lower investment minimum than most other funds and classes categorized as institutional. As a result, FMR believes Class I is generally more comparable to retail funds and classes.
The Board noted that the total expense ratio of each of Class A, Class C, Class I, and the retail class of Fidelity Total Emerging Markets Fund ranked below the competitive median for the 12-month period ended June 30, 2018, and the total expense ratio of Class M ranked above the competitive median for the 12-month period ended June 30, 2018. The Board considered that, in general, various factors can affect total expense ratios. The Board noted that the total expense ratio of Class M was above the competitive median primarily because of higher 12b-1 fees on Class M as compared to most competitor funds. Class M has a higher 12b-1 fee, but a lower front-end sales charge, than traditionally priced front-end sales charge classes. The Board considered that Class M is primarily sold load-waived to retirement plans and intermediary wrap programs where its 0.50% 12b-1 fee is comparable to competing no-load, higher 12b-1 fee classes designed specifically for retirement plans and wrap programs. The Board noted that, when compared with competitor funds that charge a 0.50% 12b-1 fee, the total expense ratio of Class M is below median.
The Board further considered that FMR has contractually agreed to reimburse Class A, Class M, Class C, Class I, and the retail class of Fidelity Emerging Markets Discovery Fund to the extent that total operating expenses, with certain exceptions, as a percentage of their respective average net assets, exceed 1.70%, 1.95%, 2.45%, 1.45%, and 1.45% through February 29, 2020.
The Board further considered that FMR has contractually agreed to reimburse Class A, Class M, Class C, Class I, and the retail class of Fidelity Total Emerging Markets Fund to the extent that total operating expenses, with certain exceptions, as a percentage of their respective average net assets, exceed 1.65%, 1.90%, 2.40%, 1.40%, and 1.40% through February 29, 2020.
Fees Charged to Other Fidelity Clients. The Board also considered Fidelity fee structures and other information with respect to clients of Fidelity, such as other funds advised or subadvised by Fidelity, pension plan clients, and other institutional clients with similar mandates. The Board noted that a joint ad hoc committee created by it and the boards of other Fidelity funds periodically reviews and compares Fidelity's institutional investment advisory business with its business of providing services to the Fidelity funds and also noted the most recent findings of the committee. The Board noted that the committee's review included a consideration of the differences in services provided, fees charged, and costs incurred, as well as competition in the markets serving the different categories of clients.
Based on its review of total expense ratios and fees charged to other Fidelity clients, the Board concluded that the total expense ratio of each class of each fund was reasonable in light of the services that the fund and its shareholders receive and the other factors considered.
Costs of the Services and Profitability. The Board considered the revenues earned and the expenses incurred by Fidelity in conducting the business of developing, marketing, distributing, managing, administering and servicing each fund and servicing each fund's shareholders. The Board also considered the level of Fidelity's profits in respect of all the Fidelity funds.
On an annual basis, Fidelity presents to the Board information about the profitability of its relationships with each fund. Fidelity calculates profitability information for each fund, as well as aggregate profitability information for groups of Fidelity funds and all Fidelity funds, using a series of detailed revenue and cost allocation methodologies which originate with the books and records of Fidelity on which Fidelity's audited financial statements are based. The Audit Committee of the Board reviews any significant changes from the prior year's methodologies.
PricewaterhouseCoopers LLP (PwC), auditor to Fidelity and certain Fidelity funds, has been engaged annually by the Board as part of the Board's assessment of Fidelity's profitability analysis. PwC's engagement includes the review and assessment of the methodologies used by Fidelity in determining the revenues and expenses attributable to Fidelity's mutual fund business, and completion of agreed-upon procedures in respect of the mathematical accuracy of the fund profitability information and its conformity to established allocation methodologies. After considering PwC's reports issued under the engagement and information provided by Fidelity, the Board concluded that while other allocation methods may also be reasonable, Fidelity's profitability methodologies are reasonable in all material respects.
The Board also reviewed Fidelity's non-fund businesses and potential indirect benefits such businesses may have received as a result of their association with Fidelity's mutual fund business (i.e., fall-out benefits) as well as cases where Fidelity's affiliates may benefit from the funds' business. The Board noted that changes to fall-out benefits year-over-year reflect business developments at Fidelity's various businesses.
The Board considered the costs of the services provided by and the profits realized by Fidelity in connection with the operation of each fund and was satisfied that the profitability was not excessive.
Economies of Scale. The Board considered whether there have been economies of scale in respect of the management of the Fidelity funds, whether the Fidelity funds (including each fund) have appropriately benefited from any such economies of scale, and whether there is potential for realization of any further economies of scale. The Board considered the extent to which each fund will benefit from economies of scale as assets grow through increased services to the fund, through waivers or reimbursements, or through fee or expense ratio reductions. The Board also noted that a committee (the Economies of Scale Committee) created by it and the boards of other Fidelity funds periodically analyzes whether Fidelity attains economies of scale in respect of the management and servicing of the Fidelity funds, whether the Fidelity funds have appropriately benefited from such economies of scale, and whether there is potential for realization of any further economies of scale.
The Board recognized that each fund's management contract incorporates a "group fee" structure, which provides for lower group fee rates as total group assets increase, and for higher group fee rates as total group assets decrease (with "group assets" defined to include fund assets under FMR's management plus the assets of sector funds previously under FMR's management). FMR calculates the group fee rates based on a tiered asset "breakpoint" schedule that varies based on asset class. The Board considered that the group fee is designed to deliver the benefits of economies of scale to fund shareholders when total Fidelity fund assets increase, even if assets of any particular fund are unchanged or have declined, because some portion of Fidelity's costs are attributable to services provided to all Fidelity funds, and all funds benefit if those costs can be allocated among more assets. The Board concluded that, given the group fee structure, fund shareholders will benefit from lower management fees as group assets increase at the fund complex level, regardless of whether Fidelity achieves any such economies of scale.
The Board concluded, taking into account the analysis of the Economies of Scale Committee, that economies of scale, if any, are being appropriately shared between fund shareholders and Fidelity.
Additional Information Requested by the Board. In order to develop fully the factual basis for consideration of the Fidelity funds' advisory contracts, the Board requested and received additional information on certain topics, including: (i) fund performance trends, in particular the underperformance of certain funds, and Fidelity's long-term strategies for certain funds; (ii) Fidelity's fund profitability methodology, profitability trends for certain funds, and the impact of certain factors on fund profitability results; (iii) metrics for evaluating index fund and ETF performance and information about ETF trading characteristics; (iv) the methodology with respect to the evaluation of competitive fund data and peer group classifications and fee comparisons; (v) the expense structures for different funds and classes; (vi) information regarding other accounts managed by Fidelity, including collective investment trusts; and (vii) Fidelity's philosophies and strategies for evaluating funds and classes with lower or declining asset levels.
Based on its evaluation of all of the conclusions noted above, and after considering all factors it believed relevant, the Board concluded that the advisory fee arrangements are fair and reasonable, and that each fund's Advisory Contracts should be renewed.
EMD-TEK-SANN-0619
1.931240.107
Fidelity® Emerging Europe, Middle East, Africa (EMEA) Fund
Semi-Annual Report April 30, 2019 Includes Fidelity and Fidelity Advisor share classes |
|
Beginning on January 1, 2021, as permitted by regulations adopted by the Securities and Exchange Commission, paper copies of a fund’s shareholder reports will no longer be sent by mail, unless you specifically request paper copies of the reports from the fund or from your financial intermediary, such as a financial advisor, broker-dealer or bank. Instead, the reports will be made available on a website, and you will be notified by mail each time a report is posted and provided with a website link to access the report.
If you already elected to receive shareholder reports electronically, you will not be affected by this change and you need not take any action. You may elect to receive shareholder reports and other communications from a fund electronically, by contacting your financial intermediary. For Fidelity customers, visit Fidelity's web site or call Fidelity using the contact information listed below.
You may elect to receive all future reports in paper free of charge. If you wish to continue receiving paper copies of your shareholder reports, you may contact your financial intermediary or, if you are a Fidelity customer, visit Fidelity’s website, or call Fidelity at the applicable toll-free number listed below. Your election to receive reports in paper will apply to all funds held with the fund complex/your financial intermediary.
| Account Type | Website | Phone Number |
| Brokerage, Mutual Fund, or Annuity Contracts: | fidelity.com/mailpreferences | 1-800-343-3548 |
| Employer Provided Retirement Accounts: | netbenefits.fidelity.com/preferences (choose 'no' under Required Disclosures to continue to print) | 1-800-343-0860 |
| Advisor Sold Accounts Serviced Through Your Financial Intermediary: | Contact Your Financial Intermediary | Your Financial Intermediary's phone number |
| Advisor Sold Accounts Serviced by Fidelity: | institutional.fidelity.com | 1-877-208-0098 |
Contents
To view a fund's proxy voting guidelines and proxy voting record for the 12-month period ended June 30, visit http://www.fidelity.com/proxyvotingresults or visit the Securities and Exchange Commission's (SEC) web site at http://www.sec.gov.
You may also call 1-800-544-8544 if you’re an individual investing directly with Fidelity, call 1-800-835-5092 if you’re a plan sponsor or participant with Fidelity as your recordkeeper or call 1-877-208-0098 on institutional accounts or if you’re an advisor or invest through one to request a free copy of the proxy voting guidelines.
Standard & Poor's, S&P and S&P 500 are registered service marks of The McGraw-Hill Companies, Inc. and have been licensed for use by Fidelity Distributors Corporation.
Other third-party marks appearing herein are the property of their respective owners.
All other marks appearing herein are registered or unregistered trademarks or service marks of FMR LLC or an affiliated company. © 2019 FMR LLC. All rights reserved.
This report and the financial statements contained herein are submitted for the general information of the shareholders of the Fund. This report is not authorized for distribution to prospective investors in the Fund unless preceded or accompanied by an effective prospectus.
A fund files its complete schedule of portfolio holdings with the SEC for the first and third quarters of each fiscal year on Form N-PORT. Forms N-PORT are available on the SEC’s web site at http://www.sec.gov. A fund's Forms N-PORT may be reviewed and copied at the SEC’s Public Reference Room in Washington, DC. Information regarding the operation of the SEC's Public Reference Room may be obtained by calling 1-800-SEC-0330.
For a complete list of a fund's portfolio holdings, view the most recent holdings listing, semiannual report, or annual report on Fidelity's web site at http://www.fidelity.com, http://www.institutional.fidelity.com, or http://www.401k.com, as applicable.
NOT FDIC INSURED •MAY LOSE VALUE •NO BANK GUARANTEE
Neither the Fund nor Fidelity Distributors Corporation is a bank.
Investment Summary (Unaudited)
Geographic Diversification (% of fund's net assets)
| As of April 30, 2019 |
| | South Africa | 40.7% |
| | Russia | 30.6% |
| | United Arab Emirates | 5.8% |
| | Saudi Arabia | 4.2% |
| | Hungary | 2.0% |
| | Qatar | 1.9% |
| | Greece | 1.9% |
| | Nigeria | 1.9% |
| | Romania | 1.8% |
| | Other* | 9.2% |
* Includes Short-Term Investments and Net Other Assets (Liabilities).
Percentages are based on country or territory of incorporation and are adjusted for the effect of futures contracts, if applicable.
Asset Allocation as of April 30, 2019
| | % of fund's net assets |
| Stocks | 98.8 |
| Short-Term Investments and Net Other Assets (Liabilities) | 1.2 |
Top Ten Stocks as of April 30, 2019
| | % of fund's net assets |
| Naspers Ltd. Class N (South Africa, Internet & Direct Marketing Retail) | 8.0 |
| Sberbank of Russia (Russia, Banks) | 6.0 |
| Gazprom OAO (Russia, Oil, Gas & Consumable Fuels) | 5.3 |
| Lukoil PJSC sponsored ADR (Russia, Oil, Gas & Consumable Fuels) | 4.5 |
| NOVATEK OAO (Russia, Oil, Gas & Consumable Fuels) | 4.3 |
| Standard Bank Group Ltd. (South Africa, Banks) | 3.9 |
| FirstRand Ltd. (South Africa, Diversified Financial Services) | 3.2 |
| Sasol Ltd. (South Africa, Chemicals) | 2.9 |
| MMC Norilsk Nickel PJSC (Russia, Metals & Mining) | 2.8 |
| PSG Group Ltd. (South Africa, Diversified Financial Services) | 2.4 |
| | 43.3 |
Top Market Sectors as of April 30, 2019
| | % of fund's net assets |
| Financials | 33.1 |
| Energy | 22.8 |
| Consumer Discretionary | 15.0 |
| Materials | 12.7 |
| Consumer Staples | 7.4 |
| Industrials | 3.2 |
| Communication Services | 2.2 |
| Real Estate | 1.4 |
| Health Care | 1.0 |
Market Sectors may include more than one industry category.
The Fund may invest up to 35% of its total assets in any industry that represents more than 20% of the emerging Europe, Middle East and Africa markets. As of April 30, 2019, the Fund did not have more than 25% of its total assets invested in any one industry.
Schedule of Investments April 30, 2019 (Unaudited)
Showing Percentage of Net Assets
| Common Stocks - 96.7% | | | |
| | | Shares | Value |
| Bermuda - 1.2% | | | |
| Central European Media Enterprises Ltd. Class A (a) | | 342,600 | $1,356,696 |
| Cyprus - 0.5% | | | |
| Globaltrans Investment PLC GDR (Reg. S) | | 60,000 | 580,200 |
| Egypt - 0.4% | | | |
| EFG-Hermes Holding SAE (a) | | 480,000 | 444,496 |
| Greece - 1.9% | | | |
| EFG Eurobank Ergasias SA (a) | | 810,000 | 676,830 |
| Fourlis Holdings SA | | 96,700 | 585,677 |
| Jumbo SA | | 26,536 | 482,157 |
| Sarantis SA | | 55,600 | 460,848 |
|
| TOTAL GREECE | | | 2,205,512 |
|
| Hungary - 2.0% | | | |
| OTP Bank PLC | | 53,400 | 2,366,635 |
| Kenya - 0.7% | | | |
| Safaricom Ltd. | | 3,056,844 | 850,718 |
| Kuwait - 0.7% | | | |
| National Bank of Kuwait | | 283,500 | 866,004 |
| Morocco - 0.3% | | | |
| Attijariwafa Bank | | 6,725 | 311,855 |
| Netherlands - 1.0% | | | |
| X5 Retail Group NV GDR (Reg. S) | | 39,300 | 1,192,755 |
| Nigeria - 1.9% | | | |
| Dangote Cement PLC | | 1,107,463 | 552,580 |
| Guaranty Trust Bank PLC | | 5,263,598 | 481,493 |
| Nigerian Breweries PLC | | 3,170,122 | 571,193 |
| Zenith Bank PLC | | 9,851,272 | 581,655 |
|
| TOTAL NIGERIA | | | 2,186,921 |
|
| Poland - 1.5% | | | |
| Globe Trade Centre SA | | 283,900 | 654,505 |
| LPP SA | | 491 | 1,100,476 |
|
| TOTAL POLAND | | | 1,754,981 |
|
| Qatar - 1.9% | | | |
| Qatar Gas Transport Co. Ltd. (Nakilat) (a) | | 40,000 | 235,336 |
| Qatar Islamic Bank (a) | | 44,300 | 2,028,376 |
|
| TOTAL QATAR | | | 2,263,712 |
|
| Romania - 1.8% | | | |
| Banca Transilvania SA | | 956,231 | 497,004 |
| BRD-Groupe Societe Generale | | 483,935 | 1,555,929 |
|
| TOTAL ROMANIA | | | 2,052,933 |
|
| Russia - 28.5% | | | |
| Alrosa Co. Ltd. | | 803,100 | 1,170,438 |
| Gazprom OAO | | 2,422,013 | 6,154,889 |
| Lukoil PJSC | | 30,700 | 2,619,862 |
| Lukoil PJSC sponsored ADR | | 61,795 | 5,238,980 |
| MMC Norilsk Nickel PJSC | | 14,900 | 3,305,107 |
| NOVATEK OAO | | 269,700 | 5,027,239 |
| Sberbank of Russia | | 1,995,450 | 6,990,770 |
| Tatneft PAO | | 228,700 | 2,679,405 |
|
| TOTAL RUSSIA | | | 33,186,690 |
|
| Saudi Arabia - 4.2% | | | |
| Abdullah Al Othaim Markets Co. | | 27,800 | 585,606 |
| Al Rajhi Bank | | 36,230 | 724,542 |
| Aldrees Petroleum and Transport Services Co. | | 79,750 | 730,452 |
| Bupa Arabia for Cooperative Insurance Co. | | 25,000 | 619,950 |
| Mouwasat Medical Services Co. | | 24,700 | 559,822 |
| SABIC | | 14,700 | 486,825 |
| Saudi Co. for Hardware CJSC | | 24,950 | 520,249 |
| United International Transportation Co. | | 75,484 | 671,251 |
|
| TOTAL SAUDI ARABIA | | | 4,898,697 |
|
| South Africa - 40.7% | | | |
| African Rainbow Minerals Ltd. | | 89,800 | 1,067,556 |
| Anglo American Platinum Ltd. | | 18,200 | 918,550 |
| AVI Ltd. | | 133,000 | 854,807 |
| Barloworld Ltd. | | 79,000 | 702,744 |
| Cashbuild Ltd. | | 50,000 | 921,251 |
| City Lodge Hotels Ltd. | | 85,000 | 712,681 |
| Clicks Group Ltd. | | 120,583 | 1,649,302 |
| DRDGOLD Ltd. (a) | | 3,724,814 | 731,714 |
| FirstRand Ltd. | | 794,000 | 3,769,349 |
| Harmony Gold Mining Co. Ltd. (a) | | 653,800 | 1,120,153 |
| Imperial Holdings Ltd. | | 191,100 | 833,599 |
| KAP Industrial Holdings Ltd. | | 1,875,500 | 963,644 |
| Kumba Iron Ore Ltd. | | 23,600 | 707,175 |
| Motus Holdings Ltd. | | 128,100 | 794,748 |
| Mr Price Group Ltd. | | 122,500 | 1,855,098 |
| MTN Group Ltd. | | 46,950 | 339,267 |
| MultiChoice Group Ltd. (a) | | 25,300 | 227,178 |
| Nampak Ltd. (a) | | 1,172,200 | 860,405 |
| Naspers Ltd. Class N | | 36,303 | 9,338,969 |
| Pretoria Portland Cement Co. Ltd. (a) | | 1,192,249 | 415,891 |
| PSG Group Ltd. | | 149,300 | 2,766,616 |
| RMB Holdings Ltd. | | 272,900 | 1,592,568 |
| Sanlam Ltd. | | 441,000 | 2,358,371 |
| Sasol Ltd. | | 102,200 | 3,390,632 |
| Shoprite Holdings Ltd. | | 168,100 | 2,025,191 |
| Spar Group Ltd. | | 105,000 | 1,423,978 |
| Standard Bank Group Ltd. | | 329,486 | 4,583,552 |
| Steinhoff Africa Retail Ltd. (b) | | 390,000 | 542,538 |
|
| TOTAL SOUTH AFRICA | | | 47,467,527 |
|
| United Arab Emirates - 5.8% | | | |
| Abu Dhabi Commercial Bank PJSC | | 595,200 | 1,600,963 |
| Abu Dhabi National Oil Co. for Distribution PJSC (a) | | 1,137,731 | 805,331 |
| Aldar Properties PJSC | | 2,011,768 | 974,898 |
| Dubai Financial Market PJSC | | 2,241,002 | 470,390 |
| Dubai Parks and Resorts PJSC (a) | | 4,523,254 | 288,156 |
| National Bank of Abu Dhabi PJSC (a) | | 589,340 | 2,567,126 |
|
| TOTAL UNITED ARAB EMIRATES | | | 6,706,864 |
|
| United Kingdom - 1.7% | | | |
| ASA International (b) | | 55,100 | 290,994 |
| Georgia Capital PLC (a) | | 40,000 | 527,859 |
| NMC Health PLC | | 17,349 | 638,424 |
| Tullow Oil PLC | | 184,500 | 542,045 |
|
| TOTAL UNITED KINGDOM | | | 1,999,322 |
|
| TOTAL COMMON STOCKS | | | |
| (Cost $86,326,389) | | | 112,692,518 |
|
| Nonconvertible Preferred Stocks - 2.1% | | | |
| Russia - 2.1% | | | |
| Tatneft PAO | | | |
| (Cost $857,120) | | 251,000 | 2,463,561 |
|
| Money Market Funds - 0.5% | | | |
| Fidelity Cash Central Fund, 2.49% (c) | | | |
| (Cost $569,354) | | 569,241 | 569,354 |
| TOTAL INVESTMENT IN SECURITIES - 99.3% | | | |
| (Cost $87,752,863) | | | 115,725,433 |
| NET OTHER ASSETS (LIABILITIES) - 0.7% | | | 807,129 |
| NET ASSETS - 100% | | | $116,532,562 |
Categorizations in the Schedule of Investments are based on country or territory of incorporation.
Legend
(a) Non-income producing
(b) Security exempt from registration under Rule 144A of the Securities Act of 1933. These securities may be resold in transactions exempt from registration, normally to qualified institutional buyers. At the end of the period, the value of these securities amounted to $833,532 or 0.7% of net assets.
(c) Affiliated fund that is generally available only to investment companies and other accounts managed by Fidelity Investments. The rate quoted is the annualized seven-day yield of the fund at period end. A complete unaudited listing of the fund's holdings as of its most recent quarter end is available upon request. In addition, each Fidelity Central Fund's financial statements are available on the SEC's website or upon request.
Affiliated Central Funds
Information regarding fiscal year to date income earned by the Fund from investments in Fidelity Central Funds is as follows:
| Fund | Income earned |
| Fidelity Cash Central Fund | $14,472 |
| Total | $14,472 |
Amounts in the income column in the above table include any capital gain distributions from underlying funds, which are presented in the corresponding line-item in the Statement of Operations, if applicable.
Investment Valuation
The following is a summary of the inputs used, as of April 30, 2019, involving the Fund's assets and liabilities carried at fair value. The inputs or methodology used for valuing securities may not be an indication of the risk associated with investing in those securities. For more information on valuation inputs, and their aggregation into the levels used below, please refer to the Investment Valuation section in the accompanying Notes to Financial Statements.
| | Valuation Inputs at Reporting Date: |
| Description | Total | Level 1 | Level 2 | Level 3 |
| Investments in Securities: | | | | |
| Equities: | | | | |
| Communication Services | $2,546,681 | $2,546,681 | $-- | $-- |
| Consumer Discretionary | 17,369,178 | 8,030,209 | 9,338,969 | -- |
| Consumer Staples | 8,763,680 | 8,763,680 | -- | -- |
| Energy | 26,497,100 | 17,722,349 | 8,774,751 | -- |
| Financials | 38,673,327 | 31,682,557 | 6,990,770 | -- |
| Health Care | 1,198,246 | 1,198,246 | -- | -- |
| Industrials | 3,751,438 | 3,751,438 | -- | -- |
| Materials | 14,727,026 | 9,484,527 | 5,242,499 | -- |
| Real Estate | 1,629,403 | 1,629,403 | -- | -- |
| Money Market Funds | 569,354 | 569,354 | -- | -- |
| Total Investments in Securities: | $115,725,433 | $85,378,444 | $30,346,989 | $-- |
See accompanying notes which are an integral part of the financial statements.
Financial Statements
Statement of Assets and Liabilities
| | | April 30, 2019 (Unaudited) |
| Assets | | |
Investment in securities, at value — See accompanying schedule:
Unaffiliated issuers (cost $87,183,509) | $115,156,079 | |
| Fidelity Central Funds (cost $569,354) | 569,354 | |
| Total Investment in Securities (cost $87,752,863) | | $115,725,433 |
| Cash | | 5,815 |
| Foreign currency held at value (cost $280,231) | | 280,095 |
| Receivable for investments sold | | 1,095,671 |
| Receivable for fund shares sold | | 40,712 |
| Dividends receivable | | 235,640 |
| Distributions receivable from Fidelity Central Funds | | 531 |
| Prepaid expenses | | 48 |
| Receivable from investment adviser for expense reductions | | 3,736 |
| Other receivables | | 16,216 |
| Total assets | | 117,403,897 |
| Liabilities | | |
| Payable for fund shares redeemed | $687,854 | |
| Accrued management fee | 76,967 | |
| Distribution and service plan fees payable | 4,274 | |
| Other affiliated payables | 29,664 | |
| Other payables and accrued expenses | 72,576 | |
| Total liabilities | | 871,335 |
| Net Assets | | $116,532,562 |
| Net Assets consist of: | | |
| Paid in capital | | $103,583,004 |
| Total distributable earnings (loss) | | 12,949,558 |
| Net Assets | | $116,532,562 |
| Net Asset Value and Maximum Offering Price | | |
| Class A: | | |
| Net Asset Value and redemption price per share ($5,537,193 ÷ 560,022 shares) | | $9.89 |
| Maximum offering price per share (100/94.25 of $9.89) | | $10.49 |
| Class M: | | |
| Net Asset Value and redemption price per share ($2,272,478 ÷ 230,713 shares) | | $9.85 |
| Maximum offering price per share (100/96.50 of $9.85) | | $10.21 |
| Class C: | | |
| Net Asset Value and offering price per share ($2,618,798 ÷ 265,253 shares)(a) | | $9.87 |
| Emerging Europe, Middle East, Africa (EMEA): | | |
| Net Asset Value, offering price and redemption price per share ($95,488,731 ÷ 9,657,933 shares) | | $9.89 |
| Class I: | | |
| Net Asset Value, offering price and redemption price per share ($10,615,362 ÷ 1,075,451 shares) | | $9.87 |
(a) Redemption price per share is equal to net asset value less any applicable contingent deferred sales charge.
See accompanying notes which are an integral part of the financial statements.
Statement of Operations
| | | Six months ended April 30, 2019 (Unaudited) |
| Investment Income | | |
| Dividends | | $1,644,128 |
| Income from Fidelity Central Funds | | 14,472 |
| Income before foreign taxes withheld | | 1,658,600 |
| Less foreign taxes withheld | | (158,455) |
| Total income | | 1,500,145 |
| Expenses | | |
| Management fee | $429,240 | |
| Transfer agent fees | 144,513 | |
| Distribution and service plan fees | 25,997 | |
| Accounting fees and expenses | 28,169 | |
| Custodian fees and expenses | 55,746 | |
| Independent trustees' fees and expenses | 292 | |
| Registration fees | 73,362 | |
| Audit | 33,682 | |
| Legal | 153 | |
| Miscellaneous | 318 | |
| Total expenses before reductions | 791,472 | |
| Expense reductions | (31,231) | |
| Total expenses after reductions | | 760,241 |
| Net investment income (loss) | | 739,904 |
| Realized and Unrealized Gain (Loss) | | |
| Net realized gain (loss) on: | | |
| Investment securities: | | |
| Unaffiliated issuers | 379,292 | |
| Foreign currency transactions | 1,396 | |
| Total net realized gain (loss) | | 380,688 |
| Change in net unrealized appreciation (depreciation) on: | | |
| Investment securities: | | |
| Unaffiliated issuers | 12,973,194 | |
| Assets and liabilities in foreign currencies | 2,012 | |
| Total change in net unrealized appreciation (depreciation) | | 12,975,206 |
| Net gain (loss) | | 13,355,894 |
| Net increase (decrease) in net assets resulting from operations | | $14,095,798 |
See accompanying notes which are an integral part of the financial statements.
Statement of Changes in Net Assets
| | Six months ended April 30, 2019 (Unaudited) | Year ended October 31, 2018 |
| Increase (Decrease) in Net Assets | | |
| Operations | | |
| Net investment income (loss) | $739,904 | $2,935,717 |
| Net realized gain (loss) | 380,688 | 2,339,332 |
| Change in net unrealized appreciation (depreciation) | 12,975,206 | (10,853,464) |
| Net increase (decrease) in net assets resulting from operations | 14,095,798 | (5,578,415) |
| Distributions to shareholders | (2,353,924) | (1,645,681) |
| Share transactions - net increase (decrease) | 7,290,734 | 5,076,428 |
| Redemption fees | – | 823 |
| Total increase (decrease) in net assets | 19,032,608 | (2,146,845) |
| Net Assets | | |
| Beginning of period | 97,499,954 | 99,646,799 |
| End of period | $116,532,562 | $97,499,954 |
See accompanying notes which are an integral part of the financial statements.
Financial Highlights
Fidelity Emerging Europe, Middle East, Africa (EMEA) Fund Class A
| | Six months ended (Unaudited) April 30, | Years endedOctober 31, | | | | |
| | 2019 | 2018 | 2017 | 2016 | 2015 | 2014 |
| Selected Per–Share Data | | | | | | |
| Net asset value, beginning of period | $8.87 | $9.39 | $8.13 | $7.49 | $9.04 | $9.49 |
| Income from Investment Operations | | | | | | |
| Net investment income (loss)A | .05 | .25 | .12 | .14 | .12 | .13 |
| Net realized and unrealized gain (loss) | 1.16 | (.63) | 1.22 | .61 | (1.50) | (.46) |
| Total from investment operations | 1.21 | (.38) | 1.34 | .75 | (1.38) | (.33) |
| Distributions from net investment income | (.18) | (.13) | (.09) | (.11) | (.14) | (.12) |
| Distributions from net realized gain | –B | (.01) | – | – | (.04) | – |
| Total distributions | (.19)C | (.14) | (.09) | (.11) | (.17)D | (.12) |
| Redemption fees added to paid in capitalA | – | –B | .01 | –B | –B | –B |
| Net asset value, end of period | $9.89 | $8.87 | $9.39 | $8.13 | $7.49 | $9.04 |
| Total ReturnE,F,G | 13.83% | (4.17)% | 16.69% | 10.22% | (15.42)% | (3.48)% |
| Ratios to Average Net AssetsH,I | | | | | | |
| Expenses before reductions | 1.65%J | 1.59% | 1.63% | 1.69% | 1.61% | 1.60% |
| Expenses net of fee waivers, if any | 1.65%J | 1.59% | 1.62% | 1.65% | 1.61% | 1.60% |
| Expenses net of all reductions | 1.60%J | 1.57% | 1.61% | 1.64% | 1.60% | 1.60% |
| Net investment income (loss) | 1.16%J | 2.49% | 1.41% | 1.90% | 1.51% | 1.45% |
| Supplemental Data | | | | | | |
| Net assets, end of period (000 omitted) | $5,537 | $5,034 | $5,538 | $7,867 | $5,788 | $7,889 |
| Portfolio turnover rateK | 30%J | 39% | 47% | 54% | 50% | 38% |
A Calculated based on average shares outstanding during the period.
B Amount represents less than $.005 per share.
C Total distributions of $.19 per share is comprised of distributions from net investment income of $.184 and distributions from net realized gain of $.003 per share.
D Total distributions of $.17 per share is comprised of distributions from net investment income of $.135 and distributions from net realized gain of $.039 per share.
E Total returns for periods of less than one year are not annualized.
F Total returns would have been lower if certain expenses had not been reduced during the applicable periods shown.
G Total returns do not include the effect of the sales charges.
H Fees and expenses of any underlying Fidelity Central Funds are not included in the Fund's expense ratio. The Fund indirectly bears its proportionate share of the expenses of any underlying Fidelity Central Funds.
I Expense ratios reflect operating expenses of the class. Expenses before reductions do not reflect amounts reimbursed by the investment adviser or reductions from brokerage service arrangements or reductions from other expense offset arrangements and do not represent the amount paid by the class during periods when reimbursements or reductions occur. Expenses net of fee waivers reflect expenses after reimbursement by the investment adviser but prior to reductions from brokerage service arrangements or other expense offset arrangements. Expenses net of all reductions represent the net expenses paid by the class.
J Annualized
K Amount does not include the portfolio activity of any underlying Fidelity Central Funds.
See accompanying notes which are an integral part of the financial statements.
Fidelity Emerging Europe, Middle East, Africa (EMEA) Fund Class M
| | Six months ended (Unaudited) April 30, | Years endedOctober 31, | | | | |
| | 2019 | 2018 | 2017 | 2016 | 2015 | 2014 |
| Selected Per–Share Data | | | | | | |
| Net asset value, beginning of period | $8.82 | $9.35 | $8.10 | $7.44 | $9.01 | $9.46 |
| Income from Investment Operations | | | | | | |
| Net investment income (loss)A | .04 | .22 | .10 | .12 | .10 | .11 |
| Net realized and unrealized gain (loss) | 1.15 | (.63) | 1.21 | .61 | (1.51) | (.46) |
| Total from investment operations | 1.19 | (.41) | 1.31 | .73 | (1.41) | (.35) |
| Distributions from net investment income | (.16) | (.11) | (.07) | (.07) | (.13) | (.10) |
| Distributions from net realized gain | –B | (.01) | – | – | (.04) | – |
| Total distributions | (.16) | (.12) | (.07) | (.07) | (.16)C | (.10) |
| Redemption fees added to paid in capitalA | – | –B | .01 | –B | –B | –B |
| Net asset value, end of period | $9.85 | $8.82 | $9.35 | $8.10 | $7.44 | $9.01 |
| Total ReturnD,E,F | 13.73% | (4.51)% | 16.40% | 9.98% | (15.80)% | (3.67)% |
| Ratios to Average Net AssetsG,H | | | | | | |
| Expenses before reductions | 1.96%I | 1.92% | 1.95% | 2.00% | 1.92% | 1.92% |
| Expenses net of fee waivers, if any | 1.90%I | 1.90% | 1.90% | 1.90% | 1.90% | 1.90% |
| Expenses net of all reductions | 1.85%I | 1.88% | 1.88% | 1.89% | 1.89% | 1.90% |
| Net investment income (loss) | .91%I | 2.18% | 1.14% | 1.65% | 1.22% | 1.15% |
| Supplemental Data | | | | | | |
| Net assets, end of period (000 omitted) | $2,272 | $2,153 | $2,490 | $2,580 | $2,003 | $2,465 |
| Portfolio turnover rateJ | 30%I | 39% | 47% | 54% | 50% | 38% |
A Calculated based on average shares outstanding during the period.
B Amount represents less than $.005 per share.
C Total distributions of $.16 per share is comprised of distributions from net investment income of $.125 and distributions from net realized gain of $.039 per share.
D Total returns for periods of less than one year are not annualized.
E Total returns would have been lower if certain expenses had not been reduced during the applicable periods shown.
F Total returns do not include the effect of the sales charges.
G Fees and expenses of any underlying Fidelity Central Funds are not included in the Fund's expense ratio. The Fund indirectly bears its proportionate share of the expenses of any underlying Fidelity Central Funds.
H Expense ratios reflect operating expenses of the class. Expenses before reductions do not reflect amounts reimbursed by the investment adviser or reductions from brokerage service arrangements or reductions from other expense offset arrangements and do not represent the amount paid by the class during periods when reimbursements or reductions occur. Expenses net of fee waivers reflect expenses after reimbursement by the investment adviser but prior to reductions from brokerage service arrangements or other expense offset arrangements. Expenses net of all reductions represent the net expenses paid by the class.
I Annualized
J Amount does not include the portfolio activity of any underlying Fidelity Central Funds.
See accompanying notes which are an integral part of the financial statements.
Fidelity Emerging Europe, Middle East, Africa (EMEA) Fund Class C
| | Six months ended (Unaudited) April 30, | Years endedOctober 31, | | | | |
| | 2019 | 2018 | 2017 | 2016 | 2015 | 2014 |
| Selected Per–Share Data | | | | | | |
| Net asset value, beginning of period | $8.80 | $9.30 | $8.06 | $7.39 | $8.93 | $9.39 |
| Income from Investment Operations | | | | | | |
| Net investment income (loss)A | .02 | .17 | .06 | .09 | .06 | .06 |
| Net realized and unrealized gain (loss) | 1.14 | (.62) | 1.20 | .60 | (1.48) | (.46) |
| Total from investment operations | 1.16 | (.45) | 1.26 | .69 | (1.42) | (.40) |
| Distributions from net investment income | (.09) | (.04) | (.03) | (.02) | (.08) | (.06) |
| Distributions from net realized gain | –B | (.01) | – | – | (.04) | – |
| Total distributions | (.09) | (.05) | (.03) | (.02) | (.12) | (.06) |
| Redemption fees added to paid in capitalA | – | –B | .01 | –B | –B | –B |
| Net asset value, end of period | $9.87 | $8.80 | $9.30 | $8.06 | $7.39 | $8.93 |
| Total ReturnC,D,E | 13.34% | (4.92)% | 15.85% | 9.33% | (16.08)% | (4.24)% |
| Ratios to Average Net AssetsF,G | | | | | | |
| Expenses before reductions | 2.44%H | 2.38% | 2.42% | 2.47% | 2.41% | 2.40% |
| Expenses net of fee waivers, if any | 2.40%H | 2.38% | 2.39% | 2.40% | 2.40% | 2.40% |
| Expenses net of all reductions | 2.35%H | 2.37% | 2.37% | 2.39% | 2.39% | 2.40% |
| Net investment income (loss) | .41%H | 1.69% | .65% | 1.15% | .72% | .65% |
| Supplemental Data | | | | | | |
| Net assets, end of period (000 omitted) | $2,619 | $2,845 | $4,336 | $6,269 | $4,104 | $6,662 |
| Portfolio turnover rateI | 30%H | 39% | 47% | 54% | 50% | 38% |
A Calculated based on average shares outstanding during the period.
B Amount represents less than $.005 per share.
C Total returns for periods of less than one year are not annualized.
D Total returns would have been lower if certain expenses had not been reduced during the applicable periods shown.
E Total returns do not include the effect of the contingent deferred sales charge.
F Fees and expenses of any underlying Fidelity Central Funds are not included in the Fund's expense ratio. The Fund indirectly bears its proportionate share of the expenses of any underlying Fidelity Central Funds.
G Expense ratios reflect operating expenses of the class. Expenses before reductions do not reflect amounts reimbursed by the investment adviser or reductions from brokerage service arrangements or reductions from other expense offset arrangements and do not represent the amount paid by the class during periods when reimbursements or reductions occur. Expenses net of fee waivers reflect expenses after reimbursement by the investment adviser but prior to reductions from brokerage service arrangements or other expense offset arrangements. Expenses net of all reductions represent the net expenses paid by the class.
H Annualized
I Amount does not include the portfolio activity of any underlying Fidelity Central Funds.
See accompanying notes which are an integral part of the financial statements.
Fidelity Emerging Europe, Middle East, Africa (EMEA) Fund
| | Six months ended (Unaudited) April 30, | Years endedOctober 31, | | | | |
| | 2019 | 2018 | 2017 | 2016 | 2015 | 2014 |
| Selected Per–Share Data | | | | | | |
| Net asset value, beginning of period | $8.88 | $9.41 | $8.14 | $7.50 | $9.08 | $9.52 |
| Income from Investment Operations | | | | | | |
| Net investment income (loss)A | .07 | .27 | .15 | .16 | .14 | .16 |
| Net realized and unrealized gain (loss) | 1.16 | (.63) | 1.21 | .61 | (1.51) | (.47) |
| Total from investment operations | 1.23 | (.36) | 1.36 | .77 | (1.37) | (.31) |
| Distributions from net investment income | (.21) | (.16) | (.10) | (.13) | (.17) | (.13) |
| Distributions from net realized gain | –B | (.01) | – | – | (.04) | – |
| Total distributions | (.22)C | (.17) | (.10) | (.13) | (.21) | (.13) |
| Redemption fees added to paid in capitalA | – | –B | .01 | –B | –B | –B |
| Net asset value, end of period | $9.89 | $8.88 | $9.41 | $8.14 | $7.50 | $9.08 |
| Total ReturnD,E | 14.06% | (4.00)% | 17.04% | 10.54% | (15.33)% | (3.21)% |
| Ratios to Average Net AssetsF,G | | | | | | |
| Expenses before reductions | 1.40%H | 1.34% | 1.38% | 1.46% | 1.39% | 1.37% |
| Expenses net of fee waivers, if any | 1.40%H | 1.34% | 1.38% | 1.40% | 1.38% | 1.37% |
| Expenses net of all reductions | 1.35%H | 1.32% | 1.37% | 1.39% | 1.38% | 1.37% |
| Net investment income (loss) | 1.41%H | 2.74% | 1.66% | 2.15% | 1.74% | 1.68% |
| Supplemental Data | | | | | | |
| Net assets, end of period (000 omitted) | $95,489 | $82,387 | $80,392 | $76,193 | $67,521 | $96,784 |
| Portfolio turnover rateI | 30%H | 39% | 47% | 54% | 50% | 38% |
A Calculated based on average shares outstanding during the period.
B Amount represents less than $.005 per share.
C Total distributions of $.22 per share is comprised of distributions from net investment income of $.213 and distributions from net realized gain of $.003 per share.
D Total returns for periods of less than one year are not annualized.
E Total returns would have been lower if certain expenses had not been reduced during the applicable periods shown.
F Fees and expenses of any underlying Fidelity Central Funds are not included in the Fund's expense ratio. The Fund indirectly bears its proportionate share of the expenses of any underlying Fidelity Central Funds.
G Expense ratios reflect operating expenses of the class. Expenses before reductions do not reflect amounts reimbursed by the investment adviser or reductions from brokerage service arrangements or reductions from other expense offset arrangements and do not represent the amount paid by the class during periods when reimbursements or reductions occur. Expenses net of fee waivers reflect expenses after reimbursement by the investment adviser but prior to reductions from brokerage service arrangements or other expense offset arrangements. Expenses net of all reductions represent the net expenses paid by the class.
H Annualized
I Amount does not include the portfolio activity of any underlying Fidelity Central Funds.
See accompanying notes which are an integral part of the financial statements.
Fidelity Emerging Europe, Middle East, Africa (EMEA) Fund Class I
| | Six months ended (Unaudited) April 30, | Years endedOctober 31, | | | | |
| | 2019 | 2018 | 2017 | 2016 | 2015 | 2014 |
| Selected Per–Share Data | | | | | | |
| Net asset value, beginning of period | $8.88 | $9.40 | $8.14 | $7.50 | $9.08 | $9.52 |
| Income from Investment Operations | | | | | | |
| Net investment income (loss)A | .07 | .28 | .16 | .17 | .15 | .16 |
| Net realized and unrealized gain (loss) | 1.15 | (.62) | 1.20 | .61 | (1.51) | (.46) |
| Total from investment operations | 1.22 | (.34) | 1.36 | .78 | (1.36) | (.30) |
| Distributions from net investment income | (.22) | (.17) | (.11) | (.14) | (.18) | (.14) |
| Distributions from net realized gain | –B | (.01) | – | – | (.04) | – |
| Total distributions | (.23)C | (.18) | (.11) | (.14) | (.22) | (.14) |
| Redemption fees added to paid in capitalA | – | –B | .01 | –B | –B | –B |
| Net asset value, end of period | $9.87 | $8.88 | $9.40 | $8.14 | $7.50 | $9.08 |
| Total ReturnD,E | 13.95% | (3.80)% | 17.01% | 10.69% | (15.23)% | (3.09)% |
| Ratios to Average Net AssetsC,F | | | | | | |
| Expenses before reductions | 1.45%G | 1.24% | 1.27% | 1.31% | 1.25% | 1.26% |
| Expenses net of fee waivers, if any | 1.40%G | 1.24% | 1.27% | 1.31% | 1.25% | 1.26% |
| Expenses net of all reductions | 1.35%G | 1.23% | 1.26% | 1.30% | 1.24% | 1.26% |
| Net investment income (loss) | 1.41%G | 2.83% | 1.77% | 2.24% | 1.88% | 1.79% |
| Supplemental Data | | | | | | |
| Net assets, end of period (000 omitted) | $10,615 | $5,080 | $6,891 | $5,807 | $3,478 | $5,596 |
| Portfolio turnover rateH | 30%G | 39% | 47% | 54% | 50% | 38% |
A Calculated based on average shares outstanding during the period.
B Amount represents less than $.005 per share.
C Total distributions of $.23 per share is comprised of distributions from net investment income of $.222 and distributions from net realized gain of $.003 per share.
D Total returns for periods of less than one year are not annualized.
E Total returns would have been lower if certain expenses had not been reduced during the applicable periods shown.
F Fees and expenses of any underlying Fidelity Central Funds are not included in the Fund's expense ratio. The Fund indirectly bears its proportionate share of the expenses of any underlying Fidelity Central Funds.
G Annualized
H Amount does not include the portfolio activity of any underlying Fidelity Central Funds.
See accompanying notes which are an integral part of the financial statements.
Notes to Financial Statements (Unaudited)
For the period ended April 30, 2019
1. Organization.
Fidelity Emerging Europe, Middle East, Africa (EMEA) Fund (the Fund) is a non-diversified fund of Fidelity Investment Trust (the Trust) and is authorized to issue an unlimited number of shares. The Trust is registered under the Investment Company Act of 1940, as amended (the 1940 Act), as an open-end management investment company organized as a Massachusetts business trust. The Fund offers Class A, Class M, Class C, Emerging Europe, Middle East, Africa (EMEA), and Class I shares, each of which has equal rights as to assets and voting privileges. Each class has exclusive voting rights with respect to matters that affect that class. Effective March 1, 2019, Class C shares will automatically convert to Class A shares after a holding period of ten years from the initial date of purchase, with certain exceptions. The Fund's investments in emerging markets can be subject to social, economic, regulatory, and political uncertainties and can be extremely volatile.
2. Investments in Fidelity Central Funds.
The Fund invests in Fidelity Central Funds, which are open-end investment companies generally available only to other investment companies and accounts managed by the investment adviser and its affiliates. The Fund's Schedule of Investments lists each of the Fidelity Central Funds held as of period end, if any, as an investment of the Fund, but does not include the underlying holdings of each Fidelity Central Fund. As an Investing Fund, the Fund indirectly bears its proportionate share of the expenses of the underlying Fidelity Central Funds.
The Money Market Central Funds seek preservation of capital and current income and are managed by Fidelity Investments Money Management, Inc. (FIMM), an affiliate of the investment adviser. Annualized expenses of the Money Market Central Funds as of their most recent shareholder report date are less than .005%.
A complete unaudited list of holdings for each Fidelity Central Fund is available upon request or at the Securities and Exchange Commission (the SEC) website at www.sec.gov. In addition, the financial statements of the Fidelity Central Funds are available on the SEC website or upon request.
3. Significant Accounting Policies.
The Fund is an investment company and applies the accounting and reporting guidance of the Financial Accounting Standards Board (FASB) Accounting Standards Codification Topic 946 Financial Services – Investments Companies. The financial statements have been prepared in conformity with accounting principles generally accepted in the United States of America (GAAP), which require management to make certain estimates and assumptions at the date of the financial statements. Actual results could differ from those estimates. Subsequent events, if any, through the date that the financial statements were issued have been evaluated in the preparation of the financial statements. The following summarizes the significant accounting policies of the Fund:
Investment Valuation. Investments are valued as of 4:00 p.m. Eastern time on the last calendar day of the period. The Board of Trustees (the Board) has delegated the day to day responsibility for the valuation of the Fund's investments to the Fair Value Committee (the Committee) established by the Fund's investment adviser. In accordance with valuation policies and procedures approved by the Board, the Fund attempts to obtain prices from one or more third party pricing vendors or brokers to value its investments. When current market prices, quotations or currency exchange rates are not readily available or reliable, investments will be fair valued in good faith by the Committee, in accordance with procedures adopted by the Board. Factors used in determining fair value vary by investment type and may include market or investment specific events. The frequency with which these procedures are used cannot be predicted and they may be utilized to a significant extent. The Committee oversees the Fund's valuation policies and procedures and reports to the Board on the Committee's activities and fair value determinations. The Board monitors the appropriateness of the procedures used in valuing the Fund's investments and ratifies the fair value determinations of the Committee.
The Fund categorizes the inputs to valuation techniques used to value its investments into a disclosure hierarchy consisting of three levels as shown below:
- Level 1 – quoted prices in active markets for identical investments
- Level 2 – other significant observable inputs (including quoted prices for similar investments, interest rates, prepayment speeds, etc.)
- Level 3 – unobservable inputs (including the Fund's own assumptions based on the best information available)
Valuation techniques used to value the Fund's investments by major category are as follows:
Equity securities, including restricted securities, for which market quotations are readily available, are valued at the last reported sale price or official closing price as reported by a third party pricing vendor on the primary market or exchange on which they are traded and are categorized as Level 1 in the hierarchy. In the event there were no sales during the day or closing prices are not available, securities are valued at the last quoted bid price or may be valued using the last available price and are generally categorized as Level 2 in the hierarchy. For foreign equity securities, when market or security specific events arise, comparisons to the valuation of American Depositary Receipts (ADRs), futures contracts, Exchange-Traded Funds (ETFs)and certain indexes as well as quoted prices for similar securities may be used and would be categorized as Level 2 in the hierarchy. For equity securities, including restricted securities, where observable inputs are limited, assumptions about market activity and risk are used and these securities may be categorized as Level 3 in the hierarchy.
Investments in open-end mutual funds, including the Fidelity Central Funds, are valued at their closing net asset value (NAV) each business day and are categorized as Level 1 in the hierarchy.
Changes in valuation techniques may result in transfers in or out of an assigned level within the disclosure hierarchy. The aggregate value of investments by input level as of April 30, 2019 is included at the end of the Fund's Schedule of Investments.
Foreign Currency. The Fund may use foreign currency contracts to facilitate transactions in foreign-denominated securities. Gains and losses from these transactions may arise from changes in the value of the foreign currency or if the counterparties do not perform under the contracts' terms.
Foreign-denominated assets, including investment securities, and liabilities are translated into U.S. dollars at the exchange rates at period end. Purchases and sales of investment securities, income and dividends received and expenses denominated in foreign currencies are translated into U.S. dollars at the exchange rate in effect on the transaction date.
The effects of exchange rate fluctuations on investments are included with the net realized and unrealized gain (loss) on investment securities. Other foreign currency transactions resulting in realized and unrealized gain (loss) are disclosed separately.
Investment Transactions and Income. For financial reporting purposes, the Fund's investment holdings and NAV include trades executed through the end of the last business day of the period. The NAV per share for processing shareholder transactions is calculated as of the close of business of the New York Stock Exchange (NYSE), normally 4:00 p.m. Eastern time and includes trades executed through the end of the prior business day. Gains and losses on securities sold are determined on the basis of identified cost. Dividend income is recorded on the ex-dividend date, except for certain dividends from foreign securities where the ex-dividend date may have passed, which are recorded as soon as the Fund is informed of the ex-dividend date. Non-cash dividends included in dividend income, if any, are recorded at the fair market value of the securities received. Income and capital gain distributions from Fidelity Central Funds, if any, are recorded on the ex-dividend date. Investment income is recorded net of foreign taxes withheld where recovery of such taxes is uncertain.
Class Allocations and Expenses. Investment income, realized and unrealized capital gains and losses, common expenses of the Fund, and certain fund-level expense reductions, if any, are allocated daily on a pro-rata basis to each class based on the relative net assets of each class to the total net assets of the Fund. Each class differs with respect to transfer agent and distribution and service plans incurred. Certain expense reductions may also differ by class. For the reporting period, the allocated portion of income and expenses to each class as a percent of its average net assets may vary due to the timing of recording these transactions in relation to fluctuating net assets of the classes. Expenses directly attributable to a fund are charged to that fund. Expenses attributable to more than one fund are allocated among the respective funds on the basis of relative net assets or other appropriate methods. Expense estimates are accrued in the period to which they relate and adjustments are made when actual amounts are known.
Income Tax Information and Distributions to Shareholders. Each year, the Fund intends to qualify as a regulated investment company under Subchapter M of the Internal Revenue Code, including distributing substantially all of its taxable income and realized gains. As a result, no provision for U.S. Federal income taxes is required. The Fund files a U.S. federal tax return, in addition to state and local tax returns as required. The Fund's federal income tax returns are subject to examination by the Internal Revenue Service (IRS) for a period of three fiscal years after they are filed. State and local tax returns may be subject to examination for an additional fiscal year depending on the jurisdiction. Foreign taxes are provided for based on the Fund's understanding of the tax rules and rates that exist in the foreign markets in which it invests.
Distributions are declared and recorded on the ex-dividend date. Income and capital gain distributions are declared separately for each class. Income and capital gain distributions are determined in accordance with income tax regulations, which may differ from GAAP.
Capital accounts within the financial statements are adjusted for permanent book-tax differences. These adjustments have no impact on net assets or the results of operations. Capital accounts are not adjusted for temporary book-tax differences which will reverse in a subsequent period.
Book-tax differences are primarily due to foreign currency transactions, passive foreign investment companies (PFIC), capital loss carryforwards, expiring capital loss carryforwards and losses deferred due to wash sales.
As of period end, the cost and unrealized appreciation (depreciation) in securities, and derivatives if applicable, for federal income tax purposes were as follows:
| Gross unrealized appreciation | $34,598,324 |
| Gross unrealized depreciation | (6,747,175) |
| Net unrealized appreciation (depreciation) | $27,851,149 |
| Tax cost | $87,874,284 |
Capital loss carryforwards are only available to offset future capital gains of the Fund to the extent provided by regulations and may be limited. Under the Regulated Investment Company Modernization Act of 2010 (the Act), the Fund is permitted to carry forward capital losses incurred in taxable years beginning after December 22, 2010 for an unlimited period and such capital losses are required to be used prior to any losses that expire. The capital loss carryforward information presented below, including any applicable limitation, is estimated as of prior fiscal period end and is subject to adjustment.
| Fiscal year of expiration | |
| No expiration | |
| Short-term | $(3,664,835) |
| Long-term | (12,096,582) |
| Total capital loss carryforward | $(15,761,417) |
Restricted Securities. The Fund may invest in securities that are subject to legal or contractual restrictions on resale. These securities generally may be resold in transactions exempt from registration or to the public if the securities are registered. Disposal of these securities may involve time-consuming negotiations and expense, and prompt sale at an acceptable price may be difficult. Information regarding restricted securities is included at the end of the Fund's Schedule of Investments.
4. Purchases and Sales of Investments.
Purchases and sales of securities, other than short-term securities, aggregated $21,516,957 and $15,864,622, respectively.
5. Fees and Other Transactions with Affiliates.
Management Fee. Fidelity Management & Research Company (the investment adviser) and its affiliates provide the Fund with investment management related services for which the Fund pays a monthly management fee. The management fee is the sum of an individual fund fee rate that is based on an annual rate of .55% of the Fund's average net assets and an annualized group fee rate that averaged .24% during the period. The group fee rate is based upon the average net assets of all the mutual funds advised by the investment adviser, including any mutual funds previously advised by the investment adviser that are currently advised by Fidelity SelectCo, LLC, an affiliate of the investment adviser. The group fee rate decreases as assets under management increase and increases as assets under management decrease. For the reporting period, the total annualized management fee rate was .79% of the Fund's average net assets.
Distribution and Service Plan Fees. In accordance with Rule 12b-1 of the 1940 Act, the Fund has adopted separate Distribution and Service Plans for each class of shares. Certain classes pay Fidelity Distributors Corporation (FDC), an affiliate of the investment adviser, separate Distribution and Service Fees, each of which is based on an annual percentage of each class' average net assets. In addition, FDC may pay financial intermediaries for selling shares of the Fund and providing shareholder support services. For the period, the Distribution and Service Fee rates, total fees and amounts retained by FDC were as follows:
| | Distribution Fee | Service Fee | Total Fees | Retained by FDC |
| Class A | -% | .25% | $6,416 | $121 |
| Class M | .25% | .25% | 5,588 | 168 |
| Class C | .75% | .25% | 13,993 | 1,252 |
| | | | $25,997 | $1,541 |
Sales Load. FDC may receive a front-end sales charge of up to 5.75% for selling Class A shares and 3.50% for selling Class M shares, some of which is paid to financial intermediaries for selling shares of the Fund. Depending on the holding period, FDC may receive contingent deferred sales charges levied on Class A, Class M and Class C redemptions. The deferred sales charges are 1.00% for Class C shares, 1.00% for certain purchases of Class A shares and .25% for certain purchases of Class M shares.
For the period, sales charge amounts retained by FDC were as follows:
| | Retained by FDC |
| Class A | $959 |
| Class M | 230 |
| Class C(a) | 2 |
| | $1,191 |
(a) When Class C shares are initially sold, FDC pays commissions from its own resources to financial intermediaries through which the sales are made.
Transfer Agent Fees. Fidelity Investments Institutional Operations Company, Inc., (FIIOC), an affiliate of the investment adviser, is the transfer, dividend disbursing and shareholder servicing agent for each class of the Fund. FIIOC receives account fees and asset-based fees that vary according to the account size and type of account of the shareholders of the respective classes of the Fund. FIIOC pays for typesetting, printing and mailing of shareholder reports, except proxy statements.
For the period, transfer agent fees for each class were as follows:
| | Amount | % of Class-Level Average Net Assets(a) |
| Class A | $6,623 | .26 |
| Class M | 3,567 | .32 |
| Class C | 4,215 | .30 |
| Emerging Europe, Middle East, Africa (EMEA) | 117,205 | .26 |
| Class I | 12,903 | .30 |
| | $144,513 | |
(a) Annualized
Accounting Fees. Fidelity Service Company, Inc. (FSC), an affiliate of the investment adviser, maintains the Fund's accounting records. The fee is based on the level of average net assets for each month. For the period, the fees were equivalent to an annualized rate of .05%.
Interfund Trades. The Fund may purchase from or sell securities to other Fidelity Funds under procedures adopted by the Board. The procedures have been designed to ensure these interfund trades are executed in accordance with Rule 17a-7 of the 1940 Act. Interfund trades are included within the respective purchases and sales amounts shown in the Purchases and Sales of Investments note.
6. Committed Line of Credit.
The Fund participates with other funds managed by the investment adviser or an affiliate in a $4.25 billion credit facility (the "line of credit") to be utilized for temporary or emergency purposes to fund shareholder redemptions or for other short-term liquidity purposes. The Fund has agreed to pay commitment fees on its pro-rata portion of the line of credit, which amounted to $152 and is reflected in Miscellaneous expenses on the Statement of Operations. During the period, the Fund did not borrow on this line of credit.
7. Expense Reductions.
The investment adviser contractually agreed to reimburse each class to the extent annual operating expenses exceeded certain levels of class-level average net assets as noted in the table below. This reimbursement will remain in place through February 29, 2020. Some expenses, for example the compensation of the independent Trustees, and certain miscellaneous expenses such as proxy and shareholder meeting expenses, are excluded from this reimbursement.
The following classes were in reimbursement during the period:
| | Expense Limitations | Reimbursement |
| Class M | 1.90% | $648 |
| Class C | 2.40% | 485 |
| Emerging Europe, Middle East, Africa (EMEA) | 1.40% | 556 |
| Class I | 1.40% | 2,047 |
| | | $3,736 |
Commissions paid to certain brokers with whom the investment adviser, or its affiliates, places trades on behalf of the Fund include an amount in addition to trade execution, which may be rebated back to the Fund to offset certain expenses. This amount totaled $26,952 for the period. In addition, through arrangements with the Fund's custodian, credits realized as a result of certain uninvested cash balances were used to reduce the Fund's expenses. During the period, these credits reduced the Fund's custody fee by $141.
In addition, during the period the investment adviser reimbursed and/or waived a portion of fund-level operating expenses in the amount of $402.
8. Distributions to Shareholders.
Distributions to shareholders of each class were as follows:
| | Six months ended
April 30, 2019 | Year ended
October 31, 2018 |
| Distributions to shareholders | | |
| Class A | $99,906 | $80,590 |
| Class M | 40,149 | 31,578 |
| Class C | 29,829 | 21,185 |
| Emerging Europe, Middle East, Africa (EMEA) | 1,999,708 | 1,390,507 |
| Class I | 184,332 | 121,821 |
| Total | $2,353,924 | $1,645,681 |
9. Share Transactions.
Share transactions for each class were as follows and may contain automatic conversions between classes or exchanges between affiliated funds:
| | Shares | Shares | Dollars | Dollars |
| | Six months ended April 30, 2019 | Year ended October 31, 2018 | Six months ended April 30, 2019 | Year ended October 31, 2018 |
| Class A | | | | |
| Shares sold | 51,938 | 177,927 | $481,897 | $1,897,467 |
| Reinvestment of distributions | 11,024 | 8,201 | 98,665 | 78,321 |
| Shares redeemed | (70,784) | (208,116) | (655,755) | (2,037,720) |
| Net increase (decrease) | (7,822) | (21,988) | $(75,193) | $(61,932) |
| Class M | | | | |
| Shares sold | 11,035 | 44,576 | $101,474 | $452,127 |
| Reinvestment of distributions | 4,497 | 3,314 | 40,115 | 31,578 |
| Shares redeemed | (28,893) | (70,074) | (268,594) | (697,760) |
| Net increase (decrease) | (13,361) | (22,184) | $(127,005) | $(214,055) |
| Class C | | | | |
| Shares sold | 12,966 | 63,115 | $120,291 | $657,000 |
| Reinvestment of distributions | 2,996 | 2,063 | 26,845 | 19,680 |
| Shares redeemed | (74,219) | (207,873) | (685,875) | (2,030,610) |
| Net increase (decrease) | (58,257) | (142,695) | $(538,739) | $(1,353,930) |
| Emerging Europe, Middle East, Africa (EMEA) | | | | |
| Shares sold | 2,004,992 | 5,006,638 | $18,602,750 | $50,740,861 |
| Reinvestment of distributions | 208,558 | 134,990 | 1,864,507 | 1,287,802 |
| Shares redeemed | (1,831,223) | (4,409,321) | (17,041,067) | (43,865,965) |
| Net increase (decrease) | 382,327 | 732,307 | $3,426,190 | $8,162,698 |
| Class I | | | | |
| Shares sold | 669,367 | 579,144 | $6,153,344 | $6,006,521 |
| Reinvestment of distributions | 16,413 | 11,175 | 146,566 | 106,495 |
| Shares redeemed | (182,704) | (750,732) | (1,694,429) | (7,569,369) |
| Net increase (decrease) | 503,076 | (160,413) | $4,605,481 | $(1,456,353) |
10. Other.
The Fund's organizational documents provide former and current trustees and officers with a limited indemnification against liabilities arising in connection with the performance of their duties to the Fund. In the normal course of business, the Fund may also enter into contracts that provide general indemnifications. The Fund's maximum exposure under these arrangements is unknown as this would be dependent on future claims that may be made against the Fund. The risk of material loss from such claims is considered remote.
Shareholder Expense Example
As a shareholder of the Fund, you incur two types of costs: (1) transaction costs, including sales charges (loads) on purchase payments or redemption proceeds, and (2) ongoing costs, including management fees, distribution and/or service (12b-1) fees and other Fund expenses. This Example is intended to help you understand your ongoing costs (in dollars) of investing in the Fund and to compare these costs with the ongoing costs of investing in other mutual funds.
The Example is based on an investment of $1,000 invested at the beginning of the period and held for the entire period (November 1, 2018 to April 30, 2019).
Actual Expenses
The first line of the accompanying table for each class of the Fund provides information about actual account values and actual expenses. You may use the information in this line, together with the amount you invested, to estimate the expenses that you paid over the period. Simply divide your account value by $1,000.00 (for example, an $8,600 account value divided by $1,000.00 = 8.6), then multiply the result by the number in the first line for a class of the Fund under the heading entitled "Expenses Paid During Period" to estimate the expenses you paid on your account during this period. In addition, the Fund, as a shareholder in the underlying Fidelity Central Funds, will indirectly bear its pro-rata share of the fees and expenses incurred by the underlying Fidelity Central Funds. These fees and expenses are not included in the Fund's annualized expense ratio used to calculate the expense estimate in the table below.
Hypothetical Example for Comparison Purposes
The second line of the accompanying table for each class of the Fund provides information about hypothetical account values and hypothetical expenses based on a Class' actual expense ratio and an assumed rate of return of 5% per year before expenses, which is not the Class' actual return. The hypothetical account values and expenses may not be used to estimate the actual ending account balance or expenses you paid for the period. You may use this information to compare the ongoing costs of investing in the Fund and other funds. To do so, compare this 5% hypothetical example with the 5% hypothetical examples that appear in the shareholder reports of the other funds. In addition, the Fund, as a shareholder in the underlying Fidelity Central Funds, will indirectly bear its pro-rata share of the fees and expenses incurred by the underlying Fidelity Central Funds. These fees and expenses are not included in the Fund's annualized expense ratio used to calculate the expense estimate in the table below.
Please note that the expenses shown in the table are meant to highlight your ongoing costs only and do not reflect any transaction costs. Therefore, the second line of the table is useful in comparing ongoing costs only, and will not help you determine the relative total costs of owning different funds. In addition, if these transactional costs were included, your costs would have been higher.
| | Annualized Expense Ratio-A | Beginning
Account Value
November 1, 2018 | Ending
Account Value
April 30, 2019 | Expenses Paid
During Period-B
November 1, 2018
to April 30, 2019 |
| Class A | 1.65% | | | |
| Actual | | $1,000.00 | $1,138.30 | $8.75 |
| Hypothetical-C | | $1,000.00 | $1,016.61 | $8.25 |
| Class M | 1.90% | | | |
| Actual | | $1,000.00 | $1,137.30 | $10.07 |
| Hypothetical-C | | $1,000.00 | $1,015.37 | $9.49 |
| Class C | 2.40% | | | |
| Actual | | $1,000.00 | $1,133.40 | $12.70 |
| Hypothetical-C | | $1,000.00 | $1,012.89 | $11.98 |
| Emerging Europe, Middle East, Africa (EMEA) | 1.40% | | | |
| Actual | | $1,000.00 | $1,140.60 | $7.43 |
| Hypothetical-C | | $1,000.00 | $1,017.85 | $7.00 |
| Class I | 1.40% | | | |
| Actual | | $1,000.00 | $1,139.50 | $7.43 |
| Hypothetical-C | | $1,000.00 | $1,017.85 | $7.00 |
A Annualized expense ratio reflects expenses net of applicable fee waivers.
B Expenses are equal to each Class' annualized expense ratio, multiplied by the average account value over the period, multiplied by 181/365 (to reflect the one-half year period).
C 5% return per year before expenses
Board Approval of Investment Advisory Contracts and Management Fees
Fidelity Emerging Europe, Middle East, Africa (EMEA) Fund
Each year, the Board of Trustees, including the Independent Trustees (together, the Board), votes on the renewal of the management contract with Fidelity Management & Research Company (FMR) and the sub-advisory agreements (together, the Advisory Contracts) for the fund. FMR and the sub-advisers are referred to herein as the Investment Advisers. The Board, assisted by the advice of fund counsel and Independent Trustees' counsel, requests and considers a broad range of information relevant to the renewal of the Advisory Contracts throughout the year.
The Board meets regularly and, at each of its meetings, covers an extensive agenda of topics and materials and considers factors that are relevant to its annual consideration of the renewal of the fund's Advisory Contracts, including the services and support provided to the fund and its shareholders. The Board has established various standing committees (Committees), each composed of and chaired by Independent Trustees with varying backgrounds, to which the Board has assigned specific subject matter responsibilities in order to enhance effective decision-making by the Board. The Board, acting directly and through its Committees, requests and receives information concerning the annual consideration of the renewal of the fund's Advisory Contracts. The Board also meets as needed to review matters specifically related to the Board's annual consideration of the renewal of the Advisory Contracts. Members of the Board may also meet with trustees of other Fidelity funds through joint ad hoc committees to discuss certain matters relevant to all of the Fidelity funds.
At its January 2019 meeting, the Board unanimously determined to renew the fund's Advisory Contracts. In reaching its determination, the Board considered all factors it believed relevant, including (i) the nature, extent, and quality of the services to be provided to the fund and its shareholders (including the investment performance of the fund); (ii) the competitiveness of the fund's management fee and total expense ratio relative to peer funds; (iii) the total costs of the services to be provided by and the profits to be realized by Fidelity from its relationships with the fund; and (iv) the extent to which, if any, economies of scale exist and would be realized as the fund grows, and whether any economies of scale are appropriately shared with fund shareholders.
In considering whether to renew the Advisory Contracts for the fund, the Board reached a determination, with the assistance of fund counsel and Independent Trustees' counsel and through the exercise of its business judgment, that the renewal of the Advisory Contracts was in the best interests of the fund and its shareholders and that the compensation payable under the Advisory Contracts was fair and reasonable. The Board's decision to renew the Advisory Contracts was not based on any single factor, but rather was based on a comprehensive consideration of all the information provided to the Board at its meetings throughout the year. The Board, in reaching its determination to renew the Advisory Contracts, was aware that shareholders of the fund have a broad range of investment choices available to them, including a wide choice among funds offered by Fidelity's competitors, and that the fund's shareholders, who have the opportunity to review and weigh the disclosure provided by the fund in its prospectus and other public disclosures, have chosen to invest in this fund, which is part of the Fidelity family of funds.
Nature, Extent, and Quality of Services Provided. The Board considered Fidelity's staffing as it relates to the fund, including the backgrounds of investment personnel of Fidelity, and also considered the fund's investment objective, strategies, and related investment philosophy. The Independent Trustees also had discussions with senior management of Fidelity's investment operations and investment groups. The Board considered the structure of the investment personnel compensation program and whether this structure provides appropriate incentives to act in the best interests of the fund. Additionally, the Board considered the portfolio managers' investments, if any, in the funds that they manage.
Resources Dedicated to Investment Management and Support Services. The Board and the Fund Oversight and Research Committees reviewed the general qualifications and capabilities of Fidelity's investment staff, including its size, education, experience, and resources, as well as Fidelity's approach to recruiting, training, managing, and compensating investment personnel. The Board noted that Fidelity has continued to increase the resources devoted to non-U.S. offices, including expansion of Fidelity's global investment organization. The Board also noted that Fidelity's analysts have extensive resources, tools and capabilities that allow them to conduct sophisticated quantitative and fundamental analysis, as well as credit analysis of issuers, counterparties and guarantors. Further, the Board considered that Fidelity's investment professionals have sufficient access to global information and data so as to provide competitive investment results over time, and that those professionals also have access to sophisticated tools that permit them to assess portfolio construction and risk and performance attribution characteristics continuously, as well as to transmit new information and research conclusions rapidly around the world. Additionally, in its deliberations, the Board considered Fidelity's trading, risk management, compliance, and technology and operations capabilities and resources, which are integral parts of the investment management process.
Shareholder and Administrative Services. The Board considered (i) the nature, extent, quality, and cost of advisory, administrative, and shareholder services performed by the Investment Advisers and their affiliates under the Advisory Contracts and under separate agreements covering transfer agency, pricing and bookkeeping, and securities lending services for the fund; (ii) the nature and extent of the supervision of third party service providers, principally custodians, subcustodians, and pricing vendors; and (iii) the resources devoted to, and the record of compliance with, the fund's compliance policies and procedures. The Board also reviewed the allocation of fund brokerage, including allocations to brokers affiliated with the Investment Advisers, the use of brokerage commissions to pay fund expenses, and the use of "soft" commission dollars to pay for research services.
The Board noted that the growth of fund assets over time across the complex allows Fidelity to reinvest in the development of services designed to enhance the value and convenience of the Fidelity funds as investment vehicles. These services include 24-hour access to account information and market information through telephone representatives and over the Internet, investor education materials and asset allocation tools, and the expanded availability of Fidelity Investor Centers.
The Board noted that it and the boards of certain other Fidelity funds had formed an ad hoc Committee on Transfer Agency Fees to review the variety of transfer agency fee structures throughout the industry and Fidelity's competitive positioning with respect to industry participants.
Investment in a Large Fund Family. The Board considered the benefits to shareholders of investing in a Fidelity fund, including the benefits of investing in a fund that is part of a large family of funds offering a variety of investment disciplines and providing a large variety of mutual fund investor services. The Board noted that Fidelity had taken, or had made recommendations that resulted in the Fidelity funds taking, a number of actions over the previous year that benefited particular funds, including: (i) continuing to dedicate additional resources to Fidelity's investment research process, which includes meetings with management of issuers of securities in which the funds invest, and to the support of the senior management team that oversees asset management; (ii) continuing efforts to enhance Fidelity's global research capabilities; (iii) launching new funds and making other enhancements to meet client needs; (iv) launching new share classes of existing funds; (v) eliminating purchase minimums and broadening eligibility requirements for certain funds and share classes; (vi) reducing management fees and total expenses for certain growth equity funds and index funds; (vii) lowering expense caps for certain existing funds and classes, and converting certain voluntary expense caps to contractual caps, to reduce expenses borne by shareholders; (viii) eliminating short-term redemption fees for funds that had such fees; (ix) rationalizing product lines and gaining increased efficiencies from fund mergers and share class consolidations; (x) continuing to develop, acquire and implement systems and technology to improve services to the funds and shareholders, strengthen information security, and increase efficiency; and (xi) continuing to implement enhancements to further strengthen Fidelity's product line to increase investors' probability of success in achieving their investment goals, including retirement income goals.
Investment Performance. The Board considered whether the fund has operated in accordance with its investment objective, as well as its record of compliance with its investment restrictions and its performance history. The Board noted that there was a portfolio management change for the fund in May 2017. The Board will continue to monitor closely the fund's performance, taking into account the portfolio manager change.
The Board took into account discussions that occur at Board meetings throughout the year with representatives of the Investment Advisers about fund investment performance. In this regard the Board noted that as part of regularly scheduled fund reviews and other reports to the Board on fund performance, the Board considers annualized return information for the fund for different time periods, measured against an appropriate securities market index ("benchmark index") and a peer group of funds with similar objectives ("peer group"), if any. In its evaluation of fund investment performance, the Board gave particular attention to information indicating changes in performance of certain Fidelity funds for specific time periods and discussed with the Investment Advisers the reasons for any overperformance or underperformance.
In addition to reviewing absolute and relative fund performance, the Independent Trustees periodically consider the appropriateness of fund performance metrics in evaluating the results achieved. In general, the Independent Trustees believe that fund performance should be evaluated based on net performance (after fees and expenses) of both the highest performing and lowest performing fund share classes, where applicable, compared to appropriate benchmark indices, over appropriate time periods that may include full market cycles, and compared to peer groups, as applicable, over the same periods, taking into account relevant factors including the following: general market conditions; issuer-specific information; and fund cash flows and other factors.
The Independent Trustees recognize that shareholders evaluate performance on a net basis over their own holding periods, for which one-, three-, and five-year periods are often used as a proxy. For this reason, the performance information reviewed by the Board also included net cumulative total return information for the fund and an appropriate benchmark index for the most recent one-, three-, and five-year periods ended June 30, 2018, as shown below. A peer group is not shown below because the fund does not generally utilize a peer group for performance comparison purposes.
Fidelity Emerging Europe, Middle East, Africa (EMEA) Fund
Based on its review, the Board concluded that the nature, extent, and quality of services provided to the fund under the Advisory Contracts should continue to benefit the shareholders of the fund.
Competitiveness of Management Fee and Total Expense Ratio. The Board considered the fund's management fee and total expense ratio compared to "mapped groups" of competitive funds and classes created for the purpose of facilitating the Trustees' competitive analysis of management fees and total expenses. Fidelity creates "mapped groups" by combining similar Lipper investment objective categories that have comparable investment mandates. Combining Lipper investment objective categories aids the Board's management fee and total expense ratio comparisons by broadening the competitive group used for comparison.
Management Fee. The Board considered two proprietary management fee comparisons for the 12-month periods (ended June 30 for 2018 and December 31 for prior periods) shown in basis points (BP) in the chart below. The group of Lipper funds used by the Board for management fee comparisons is referred to below as the "Total Mapped Group." The Total Mapped Group comparison focuses on a fund's standing in terms of gross management fees before expense reimbursements or caps relative to the total universe of funds with comparable investment mandates, regardless of whether their management fee structures also are comparable. Funds with comparable investment mandates offer exposure to similar types of securities. Funds with comparable management fee structures have similar management fee contractual arrangements (
e.g., flat rate charged for advisory services, all-inclusive fee rate,
etc.). "TMG %" represents the percentage of funds in the Total Mapped Group that had management fees that were lower than the fund's. For example, a hypothetical TMG % of 20% would mean that 80% of the funds in the Total Mapped Group had higher, and 20% had lower, management fees than the fund. The fund's actual TMG %s and the number of funds in the Total Mapped Group are in the chart below. The "Asset-Size Peer Group" (ASPG) comparison focuses on a fund's standing relative to a subset of non-Fidelity funds within the Total Mapped Group that are similar in size and management fee structure. For example, if a fund is in the first quartile of the ASPG, the fund's management fee ranks in the least expensive or lowest 25% of funds in the ASPG. The ASPG represents at least 15% of the funds in the Total Mapped Group with comparable asset size and management fee structures, subject to a minimum of 50 funds (or all funds in the Total Mapped Group if fewer than 50). Additional information, such as the ASPG quartile in which the fund's management fee rate ranked, is also included in the chart and was considered by the Board.
Fidelity Emerging Europe, Middle East, Africa (EMEA) Fund

The Board noted that the fund's management fee rate ranked below the median of its Total Mapped Group and below the median of its ASPG for the 12-month period ended June 30, 2018.
The Board noted that it and the boards of other Fidelity funds formed an ad hoc Committee on Group Fee, which meets periodically, to conduct an in-depth review of the "group fee" component of the management fee of funds with such management fee structures. The Committee's focus included the mechanics of the group fee, the competitive landscape of group fee structures, Fidelity funds with no group fee component and investment products not included in group fee assets. The Board also considered that, for funds subject to the group fee, FMR agreed to voluntarily waive fees over a specified period of time in amounts designed to account for assets converted from certain funds to certain collective investment trusts.
The Board also noted that, in 2013, the ad hoc Committee on Management Fees was formed to conduct an in-depth review of the management fee rates of Fidelity's active equity mutual funds. The Committee focused on the following areas: (i) standard fee structures; (ii) research consumption and trading evolution; (iii) management fee competitiveness/profitability by category; and (iv) factors that drive institutional pricing.
Based on its review, the Board concluded that the fund's management fee is fair and reasonable in light of the services that the fund receives and the other factors considered.
Total Expense Ratio. In its review of each class's total expense ratio, the Board considered the fund's management fee rate as well as other fund or class expenses, as applicable, such as transfer agent fees, pricing and bookkeeping fees, fund-paid 12b-1 fees, and custodial, legal, and audit fees. The Board also noted that Fidelity may agree to waive fees and expenses from time to time, and the extent to which, if any, it has done so for the fund. As part of its review, the Board also considered the current and historical total expense ratios of each class of the fund compared to competitive fund median expenses. Each class of the fund is compared to those funds and classes in the Total Mapped Group (used by the Board for management fee comparisons) that have a similar sales load structure.
The Board noted that the total expense ratio of the retail class ranked below the competitive median for the 12-month period ended June 30, 2018, and the total expense ratio of each of Class A, Class M, Class C, and Class I ranked above the competitive median for the 12-month period ended June 30, 2018. The Board considered that, in general, various factors can affect total expense ratios. The Board noted that the total expense ratio of Class A was above the competitive median because of relatively higher other expenses due to asset levels or small average account sizes. The Board noted that the total expense ratio of Class M was above the competitive median primarily because of higher 12b-1 fees on Class M as compared to most competitor funds. Class M has a higher 12b-1 fee, but a lower front-end sales charge, than traditionally priced front-end sales charge classes. The Board considered that Class M is primarily sold load-waived to retirement plans and intermediary wrap programs where its 0.50% 12b-1 fee is comparable to competing no-load, higher 12b-1 fee classes designed specifically for retirement plans and wrap programs. The Board noted that the total expense ratio of Class C was above the competitive median primarily because of its 1.00% 12b-1 fee. The Board noted that, although Class I is categorized by Lipper as an institutional class, Class I has a significantly lower investment minimum than most other funds and classes categorized as institutional. As a result, FMR believes Class I is generally more comparable to retail funds and classes. The Board noted that the fund offers multiple classes, each of which has a different sales load and 12b-1 fee structure, and that the multiple structures are intended to offer a range of pricing options for the intermediary market. The Board also noted that the total expense ratios of the classes vary primarily by the level of their 12b-1 fees, although differences in transfer agent fees may also cause expenses to vary from class to class.
The Board further considered that FMR has contractually agreed to reimburse the fund to the extent that total operating expenses, with certain exceptions, as a percentage of its average net assets, exceed 1.40% through February 29, 2020.
Fees Charged to Other Fidelity Clients. The Board also considered Fidelity fee structures and other information with respect to clients of Fidelity, such as other funds advised or subadvised by Fidelity, pension plan clients, and other institutional clients with similar mandates. The Board noted that a joint ad hoc committee created by it and the boards of other Fidelity funds periodically reviews and compares Fidelity's institutional investment advisory business with its business of providing services to the Fidelity funds and also noted the most recent findings of the committee. The Board noted that the committee's review included a consideration of the differences in services provided, fees charged, and costs incurred, as well as competition in the markets serving the different categories of clients.
Based on its review of total expense ratios and fees charged to other Fidelity clients, the Board concluded that the total expense ratio of each class of the fund was reasonable in light of the services that the fund and its shareholders receive and the other factors considered.
Costs of the Services and Profitability. The Board considered the revenues earned and the expenses incurred by Fidelity in conducting the business of developing, marketing, distributing, managing, administering and servicing the fund and servicing the fund's shareholders. The Board also considered the level of Fidelity's profits in respect of all the Fidelity funds.
On an annual basis, Fidelity presents to the Board information about the profitability of its relationships with the fund. Fidelity calculates profitability information for each fund, as well as aggregate profitability information for groups of Fidelity funds and all Fidelity funds, using a series of detailed revenue and cost allocation methodologies which originate with the books and records of Fidelity on which Fidelity's audited financial statements are based. The Audit Committee of the Board reviews any significant changes from the prior year's methodologies.
PricewaterhouseCoopers LLP (PwC), auditor to Fidelity and certain Fidelity funds, has been engaged annually by the Board as part of the Board's assessment of Fidelity's profitability analysis. PwC's engagement includes the review and assessment of the methodologies used by Fidelity in determining the revenues and expenses attributable to Fidelity's mutual fund business, and completion of agreed-upon procedures in respect of the mathematical accuracy of the fund profitability information and its conformity to established allocation methodologies. After considering PwC's reports issued under the engagement and information provided by Fidelity, the Board concluded that while other allocation methods may also be reasonable, Fidelity's profitability methodologies are reasonable in all material respects.
The Board also reviewed Fidelity's non-fund businesses and potential indirect benefits such businesses may have received as a result of their association with Fidelity's mutual fund business (i.e., fall-out benefits) as well as cases where Fidelity's affiliates may benefit from the fund's business. The Board noted that changes to fall-out benefits year-over-year reflect business developments at Fidelity's various businesses.
The Board considered the costs of the services provided by and the profits realized by Fidelity in connection with the operation of the fund and was satisfied that the profitability was not excessive.
Economies of Scale. The Board considered whether there have been economies of scale in respect of the management of the Fidelity funds, whether the Fidelity funds (including the fund) have appropriately benefited from any such economies of scale, and whether there is potential for realization of any further economies of scale. The Board considered the extent to which the fund will benefit from economies of scale as assets grow through increased services to the fund, through waivers or reimbursements, or through fee or expense ratio reductions. The Board also noted that a committee (the Economies of Scale Committee) created by it and the boards of other Fidelity funds periodically analyzes whether Fidelity attains economies of scale in respect of the management and servicing of the Fidelity funds, whether the Fidelity funds have appropriately benefited from such economies of scale, and whether there is potential for realization of any further economies of scale.
The Board recognized that the fund's management contract incorporates a "group fee" structure, which provides for lower group fee rates as total group assets increase, and for higher group fee rates as total group assets decrease (with "group assets" defined to include fund assets under FMR's management plus the assets of sector funds previously under FMR's management). FMR calculates the group fee rates based on a tiered asset "breakpoint" schedule that varies based on asset class. The Board considered that the group fee is designed to deliver the benefits of economies of scale to fund shareholders when total Fidelity fund assets increase, even if assets of any particular fund are unchanged or have declined, because some portion of Fidelity's costs are attributable to services provided to all Fidelity funds, and all funds benefit if those costs can be allocated among more assets. The Board concluded that, given the group fee structure, fund shareholders will benefit from lower management fees as group assets increase at the fund complex level, regardless of whether Fidelity achieves any such economies of scale.
The Board concluded, taking into account the analysis of the Economies of Scale Committee, that economies of scale, if any, are being appropriately shared between fund shareholders and Fidelity.
Additional Information Requested by the Board. In order to develop fully the factual basis for consideration of the Fidelity funds' advisory contracts, the Board requested and received additional information on certain topics, including: (i) fund performance trends, in particular the underperformance of certain funds, and Fidelity's long-term strategies for certain funds; (ii) Fidelity's fund profitability methodology, profitability trends for certain funds, and the impact of certain factors on fund profitability results; (iii) metrics for evaluating index fund and ETF performance and information about ETF trading characteristics; (iv) the methodology with respect to the evaluation of competitive fund data and peer group classifications and fee comparisons; (v) the expense structures for different funds and classes; (vi) information regarding other accounts managed by Fidelity, including collective investment trusts; and (vii) Fidelity's philosophies and strategies for evaluating funds and classes with lower or declining asset levels.
Based on its evaluation of all of the conclusions noted above, and after considering all factors it believed relevant, the Board concluded that the advisory fee arrangements are fair and reasonable, and that the fund's Advisory Contracts should be renewed.
EME-SANN-0619
1.861975.110
Fidelity® International Value Fund
Semi-Annual Report April 30, 2019 Includes Fidelity and Fidelity Advisor share classes |
|
Beginning on January 1, 2021, as permitted by regulations adopted by the Securities and Exchange Commission, paper copies of a fund’s shareholder reports will no longer be sent by mail, unless you specifically request paper copies of the reports from the fund or from your financial intermediary, such as a financial advisor, broker-dealer or bank. Instead, the reports will be made available on a website, and you will be notified by mail each time a report is posted and provided with a website link to access the report.
If you already elected to receive shareholder reports electronically, you will not be affected by this change and you need not take any action. You may elect to receive shareholder reports and other communications from a fund electronically, by contacting your financial intermediary. For Fidelity customers, visit Fidelity's web site or call Fidelity using the contact information listed below.
You may elect to receive all future reports in paper free of charge. If you wish to continue receiving paper copies of your shareholder reports, you may contact your financial intermediary or, if you are a Fidelity customer, visit Fidelity’s website, or call Fidelity at the applicable toll-free number listed below. Your election to receive reports in paper will apply to all funds held with the fund complex/your financial intermediary.
| Account Type | Website | Phone Number |
| Brokerage, Mutual Fund, or Annuity Contracts: | fidelity.com/mailpreferences | 1-800-343-3548 |
| Employer Provided Retirement Accounts: | netbenefits.fidelity.com/preferences (choose 'no' under Required Disclosures to continue to print) | 1-800-343-0860 |
| Advisor Sold Accounts Serviced Through Your Financial Intermediary: | Contact Your Financial Intermediary | Your Financial Intermediary's phone number |
| Advisor Sold Accounts Serviced by Fidelity: | institutional.fidelity.com | 1-877-208-0098 |
Contents
To view a fund's proxy voting guidelines and proxy voting record for the 12-month period ended June 30, visit http://www.fidelity.com/proxyvotingresults or visit the Securities and Exchange Commission's (SEC) web site at http://www.sec.gov.
You may also call 1-800-544-8544 if you’re an individual investing directly with Fidelity, call 1-800-835-5092 if you’re a plan sponsor or participant with Fidelity as your recordkeeper or call 1-877-208-0098 on institutional accounts or if you’re an advisor or invest through one to request a free copy of the proxy voting guidelines.
Standard & Poor's, S&P and S&P 500 are registered service marks of The McGraw-Hill Companies, Inc. and have been licensed for use by Fidelity Distributors Corporation.
Other third-party marks appearing herein are the property of their respective owners.
All other marks appearing herein are registered or unregistered trademarks or service marks of FMR LLC or an affiliated company. © 2019 FMR LLC. All rights reserved.
This report and the financial statements contained herein are submitted for the general information of the shareholders of the Fund. This report is not authorized for distribution to prospective investors in the Fund unless preceded or accompanied by an effective prospectus.
A fund files its complete schedule of portfolio holdings with the SEC for the first and third quarters of each fiscal year on Form N-PORT. Forms N-PORT are available on the SEC’s web site at http://www.sec.gov. A fund's Forms N-PORT may be reviewed and copied at the SEC’s Public Reference Room in Washington, DC. Information regarding the operation of the SEC's Public Reference Room may be obtained by calling 1-800-SEC-0330.
For a complete list of a fund's portfolio holdings, view the most recent holdings listing, semiannual report, or annual report on Fidelity's web site at http://www.fidelity.com, http://www.institutional.fidelity.com, or http://www.401k.com, as applicable.
NOT FDIC INSURED •MAY LOSE VALUE •NO BANK GUARANTEE
Neither the Fund nor Fidelity Distributors Corporation is a bank.
Investment Summary (Unaudited)
Geographic Diversification (% of fund's net assets)
| As of April 30, 2019 |
| | Japan | 23.3% |
| | United Kingdom | 18.1% |
| | France | 13.5% |
| | Germany | 9.2% |
| | Switzerland | 4.3% |
| | Spain | 4.0% |
| | Italy | 4.0% |
| | Australia | 3.6% |
| | Netherlands | 3.3% |
| | Other* | 16.7% |
* Includes Short-Term investments and Net Other Assets (Liabilities).
Percentages are based on country or territory of incorporation and are adjusted for the effect of futures contracts, if applicable.
Asset Allocation as of April 30, 2019
| | % of fund's net assets |
| Stocks | 98.3 |
| Short-Term Investments and Net Other Assets (Liabilities) | 1.7 |
Top Ten Stocks as of April 30, 2019
| | % of fund's net assets |
| Total SA (France, Oil, Gas & Consumable Fuels) | 3.0 |
| BHP Billiton PLC (United Kingdom, Metals & Mining) | 2.8 |
| BP PLC (United Kingdom, Oil, Gas & Consumable Fuels) | 2.7 |
| Banco Santander SA (Spain) (Spain, Banks) | 2.1 |
| Commonwealth Bank of Australia (Australia, Banks) | 1.9 |
| Sanofi SA (France, Pharmaceuticals) | 1.9 |
| VINCI SA (France, Construction & Engineering) | 1.9 |
| AXA SA (France, Insurance) | 1.8 |
| Enel SpA (Italy, Electric Utilities) | 1.7 |
| Lloyds Banking Group PLC (United Kingdom, Banks) | 1.7 |
| | 21.5 |
Top Market Sectors as of April 30, 2019
| | % of fund's net assets |
| Financials | 37.6 |
| Industrials | 10.7 |
| Energy | 10.6 |
| Materials | 8.8 |
| Health Care | 7.7 |
| Information Technology | 6.7 |
| Consumer Discretionary | 5.2 |
| Communication Services | 3.9 |
| Consumer Staples | 3.2 |
| Real Estate | 2.2 |
Schedule of Investments April 30, 2019 (Unaudited)
Showing Percentage of Net Assets
| Common Stocks - 97.0% | | | |
| | | Shares | Value |
| Australia - 3.6% | | | |
| Commonwealth Bank of Australia | | 174,642 | $9,174,446 |
| Insurance Australia Group Ltd. | | 638,866 | 3,548,904 |
| Macquarie Group Ltd. | | 47,286 | 4,490,126 |
|
| TOTAL AUSTRALIA | | | 17,213,476 |
|
| Austria - 0.8% | | | |
| Erste Group Bank AG | | 99,900 | 4,000,108 |
| Bailiwick of Jersey - 1.7% | | | |
| Glencore Xstrata PLC | | 1,710,500 | 6,786,511 |
| WPP PLC | | 123,000 | 1,534,769 |
|
| TOTAL BAILIWICK OF JERSEY | | | 8,321,280 |
|
| Belgium - 1.1% | | | |
| KBC Groep NV | | 73,625 | 5,451,786 |
| Canada - 0.5% | | | |
| Nutrien Ltd. | | 46,880 | 2,542,585 |
| China - 0.7% | | | |
| Ping An Insurance (Group) Co. of China Ltd. (H Shares) | | 279,000 | 3,377,202 |
| Denmark - 0.6% | | | |
| A.P. Moller - Maersk A/S Series B | | 2,348 | 3,026,793 |
| Finland - 1.8% | | | |
| Nokia Corp. | | 762,100 | 4,004,539 |
| Sampo Oyj (A Shares) | | 101,734 | 4,658,207 |
|
| TOTAL FINLAND | | | 8,662,746 |
|
| France - 13.5% | | | |
| Atos Origin SA (a) | | 21,971 | 2,261,705 |
| AXA SA (a) | | 326,821 | 8,715,184 |
| Bouygues SA | | 65,205 | 2,452,912 |
| Capgemini SA | | 33,493 | 4,060,857 |
| Natixis SA | | 618,800 | 3,642,354 |
| Sanofi SA | | 103,079 | 8,993,571 |
| Societe Generale Series A | | 104,100 | 3,301,167 |
| SR Teleperformance SA | | 18,600 | 3,573,620 |
| Total SA (a) | | 260,690 | 14,491,952 |
| VINCI SA | | 88,800 | 8,968,467 |
| Vivendi SA (a) | | 152,192 | 4,417,501 |
|
| TOTAL FRANCE | | | 64,879,290 |
|
| Germany - 8.3% | | | |
| Bayer AG | | 102,100 | 6,795,341 |
| Brenntag AG | | 35,400 | 1,908,205 |
| Continental AG | | 25,300 | 4,181,558 |
| Hannover Reuck SE | | 36,600 | 5,517,195 |
| HeidelbergCement Finance AG | | 51,400 | 4,150,817 |
| Linde PLC | | 31,314 | 5,633,534 |
| Rheinmetall AG | | 12,705 | 1,457,768 |
| SAP SE | | 31,960 | 4,119,908 |
| Vonovia SE | | 125,493 | 6,259,284 |
|
| TOTAL GERMANY | | | 40,023,610 |
|
| Indonesia - 0.4% | | | |
| PT Bank Rakyat Indonesia Tbk | | 6,271,800 | 1,923,352 |
| Ireland - 1.0% | | | |
| CRH PLC | | 139,302 | 4,686,217 |
| Italy - 4.0% | | | |
| Assicurazioni Generali SpA | | 195,700 | 3,797,300 |
| Enel SpA | | 1,279,700 | 8,103,270 |
| Intesa Sanpaolo SpA | | 1,702,000 | 4,459,268 |
| Mediobanca SpA | | 264,825 | 2,806,912 |
|
| TOTAL ITALY | | | 19,166,750 |
|
| Japan - 23.3% | | | |
| DENSO Corp. | | 83,400 | 3,633,379 |
| Hitachi High-Technologies Corp. | | 46,600 | 2,070,739 |
| Honda Motor Co. Ltd. | | 247,300 | 6,900,400 |
| Hoya Corp. | | 64,200 | 4,503,999 |
| Idemitsu Kosan Co. Ltd. | | 67,800 | 2,194,165 |
| INPEX Corp. | | 211,900 | 2,056,321 |
| Itochu Corp. | | 325,800 | 5,849,455 |
| Japan Tobacco, Inc. (b) | | 155,300 | 3,588,614 |
| Kao Corp. | | 46,800 | 3,595,023 |
| Makita Corp. | | 67,700 | 2,461,376 |
| Minebea Mitsumi, Inc. | | 238,500 | 4,217,828 |
| Mitsubishi UFJ Financial Group, Inc. | | 1,462,200 | 7,254,744 |
| Mitsui Fudosan Co. Ltd. | | 188,800 | 4,350,730 |
| Nintendo Co. Ltd. | | 4,700 | 1,618,754 |
| OBIC Co. Ltd. | | 41,600 | 4,802,514 |
| Oracle Corp. Japan | | 37,400 | 2,554,998 |
| ORIX Corp. | | 343,500 | 4,845,911 |
| Recruit Holdings Co. Ltd. | | 93,100 | 2,782,260 |
| Shin-Etsu Chemical Co. Ltd. | | 50,100 | 4,745,699 |
| Shinsei Bank Ltd. | | 181,400 | 2,511,053 |
| SoftBank Corp. | | 23,400 | 2,481,134 |
| Sony Corp. | | 35,600 | 1,793,105 |
| Sony Financial Holdings, Inc. | | 192,800 | 3,923,673 |
| Subaru Corp. | | 102,900 | 2,513,034 |
| Sumitomo Mitsui Financial Group, Inc. | | 183,500 | 6,669,534 |
| Suzuki Motor Corp. (b) | | 35,200 | 1,600,503 |
| T&D Holdings, Inc. | | 202,100 | 2,170,768 |
| Taiheiyo Cement Corp. (b) | | 600 | 19,229 |
| Takeda Pharmaceutical Co. Ltd. | | 155,251 | 5,729,030 |
| Tokio Marine Holdings, Inc. | | 131,700 | 6,623,129 |
| Tokyo Electron Ltd. | | 11,700 | 1,853,283 |
|
| TOTAL JAPAN | | | 111,914,384 |
|
| Netherlands - 3.3% | | | |
| AerCap Holdings NV (c) | | 57,500 | 2,854,300 |
| ING Groep NV (Certificaten Van Aandelen) | | 433,190 | 5,527,517 |
| Koninklijke Philips Electronics NV | | 83,804 | 3,598,856 |
| Wolters Kluwer NV | | 53,155 | 3,707,088 |
|
| TOTAL NETHERLANDS | | | 15,687,761 |
|
| Norway - 1.2% | | | |
| Equinor ASA | | 262,776 | 5,861,667 |
| Portugal - 0.6% | | | |
| Galp Energia SGPS SA Class B | | 182,985 | 3,072,383 |
| Singapore - 0.8% | | | |
| United Overseas Bank Ltd. | | 179,400 | 3,670,835 |
| Spain - 3.6% | | | |
| Banco Santander SA (Spain) | | 2,033,050 | 10,287,433 |
| CaixaBank SA | | 742,697 | 2,367,343 |
| Cellnex Telecom SA (d) | | 60,400 | 1,857,558 |
| Masmovil Ibercom SA (c) | | 83,388 | 1,827,537 |
| Unicaja Banco SA (d) | | 1,031,900 | 1,185,156 |
|
| TOTAL SPAIN | | | 17,525,027 |
|
| Sweden - 3.2% | | | |
| Alfa Laval AB (a) | | 121,900 | 2,829,502 |
| Investor AB (B Shares) | | 129,660 | 6,183,708 |
| Swedbank AB (A Shares) (a) | | 121,742 | 1,989,170 |
| Telefonaktiebolaget LM Ericsson (B Shares) | | 445,700 | 4,408,943 |
|
| TOTAL SWEDEN | | | 15,411,323 |
|
| Switzerland - 4.3% | | | |
| Credit Suisse Group AG | | 193,276 | 2,570,358 |
| Swiss Life Holding AG | | 9,360 | 4,400,977 |
| UBS Group AG | | 459,658 | 6,177,804 |
| Zurich Insurance Group Ltd. | | 24,261 | 7,735,805 |
|
| TOTAL SWITZERLAND | | | 20,884,944 |
|
| United Kingdom - 18.1% | | | |
| AstraZeneca PLC (United Kingdom) | | 78,112 | 5,819,329 |
| Aviva PLC | | 907,873 | 5,098,731 |
| BHP Billiton PLC | | 567,165 | 13,387,689 |
| BP PLC | | 1,772,024 | 12,885,633 |
| British American Tobacco PLC (United Kingdom) | | 113,596 | 4,447,164 |
| Bunzl PLC | | 101,111 | 3,044,387 |
| Imperial Tobacco Group PLC | | 113,588 | 3,608,173 |
| Informa PLC | | 346,764 | 3,522,484 |
| ITV PLC | | 982,463 | 1,750,667 |
| Lloyds Banking Group PLC | | 9,790,600 | 8,007,099 |
| Micro Focus International PLC | | 114,405 | 2,890,890 |
| Royal Dutch Shell PLC Class B sponsored ADR (a) | | 121,500 | 7,884,135 |
| RSA Insurance Group PLC | | 444,610 | 3,142,361 |
| Standard Chartered PLC (United Kingdom) | | 574,111 | 5,240,485 |
| Standard Life PLC | | 1,125,263 | 4,092,419 |
| The Weir Group PLC | | 109,752 | 2,375,020 |
|
| TOTAL UNITED KINGDOM | | | 87,196,666 |
|
| United States of America - 0.6% | | | |
| ConocoPhillips Co. | | 43,200 | 2,726,784 |
| TOTAL COMMON STOCKS | | | |
| (Cost $490,553,076) | | | 467,226,969 |
|
| Nonconvertible Preferred Stocks - 1.3% | | | |
| Germany - 0.9% | | | |
| Porsche Automobil Holding SE (Germany) | | 63,400 | 4,407,418 |
| Spain - 0.4% | | | |
| Grifols SA Class B | | 91,100 | 1,753,792 |
| TOTAL NONCONVERTIBLE PREFERRED STOCKS | | | |
| (Cost $6,716,452) | | | 6,161,210 |
|
| Money Market Funds - 4.7% | | | |
| Fidelity Cash Central Fund, 2.49% (e) | | 4,452,666 | 4,453,556 |
| Fidelity Securities Lending Cash Central Fund 2.49% (e)(f) | | 18,145,894 | 18,147,709 |
| TOTAL MONEY MARKET FUNDS | | | |
| (Cost $22,601,265) | | | 22,601,265 |
| TOTAL INVESTMENT IN SECURITIES - 103.0% | | | |
| (Cost $519,870,793) | | | 495,989,444 |
| NET OTHER ASSETS (LIABILITIES) - (3.0)% | | | (14,669,606) |
| NET ASSETS - 100% | | | $481,319,838 |
Legend
(a) Security or a portion of the security is on loan at period end.
(b) A portion of the security sold on a delayed delivery basis.
(c) Non-income producing
(d) Security exempt from registration under Rule 144A of the Securities Act of 1933. These securities may be resold in transactions exempt from registration, normally to qualified institutional buyers. At the end of the period, the value of these securities amounted to $3,042,714 or 0.6% of net assets.
(e) Affiliated fund that is generally available only to investment companies and other accounts managed by Fidelity Investments. The rate quoted is the annualized seven-day yield of the fund at period end. A complete unaudited listing of the fund's holdings as of its most recent quarter end is available upon request. In addition, each Fidelity Central Fund's financial statements are available on the SEC's website or upon request.
(f) Investment made with cash collateral received from securities on loan.
Affiliated Central Funds
Information regarding fiscal year to date income earned by the Fund from investments in Fidelity Central Funds is as follows:
| Fund | Income earned |
| Fidelity Cash Central Fund | $49,229 |
| Fidelity Securities Lending Cash Central Fund | 132,828 |
| Total | $182,057 |
Amounts in the income column in the above table include any capital gain distributions from underlying funds, which are presented in the corresponding line-item in the Statement of Operations, if applicable.
Investment Valuation
The following is a summary of the inputs used, as of April 30, 2019, involving the Fund's assets and liabilities carried at fair value. The inputs or methodology used for valuing securities may not be an indication of the risk associated with investing in those securities. For more information on valuation inputs, and their aggregation into the levels used below, please refer to the Investment Valuation section in the accompanying Notes to Financial Statements.
| | Valuation Inputs at Reporting Date: |
| Description | Total | Level 1 | Level 2 | Level 3 |
| Investments in Securities: | | | | |
| Equities: | | | | |
| Communication Services | $19,010,404 | $8,958,246 | $10,052,158 | $-- |
| Consumer Discretionary | 25,029,397 | 11,928,474 | 13,100,923 | -- |
| Consumer Staples | 15,238,974 | 7,203,196 | 8,035,778 | -- |
| Energy | 51,173,040 | 23,795,455 | 27,377,585 | -- |
| Financials | 180,539,524 | 110,360,292 | 70,179,232 | -- |
| Health Care | 37,193,918 | 11,299,340 | 25,894,578 | -- |
| Industrials | 51,508,981 | 36,684,219 | 14,824,762 | -- |
| Information Technology | 33,028,376 | 20,494,986 | 12,533,390 | -- |
| Materials | 41,952,281 | 12,346,165 | 29,606,116 | -- |
| Real Estate | 10,610,014 | 10,610,014 | -- | -- |
| Utilities | 8,103,270 | -- | 8,103,270 | -- |
| Money Market Funds | 22,601,265 | 22,601,265 | -- | -- |
| Total Investments in Securities: | $495,989,444 | $276,281,652 | $219,707,792 | $-- |
See accompanying notes which are an integral part of the financial statements.
Financial Statements
Statement of Assets and Liabilities
| | | April 30, 2019 (Unaudited) |
| Assets | | |
Investment in securities, at value (including securities loaned of $17,294,886) — See accompanying schedule:
Unaffiliated issuers (cost $497,269,528) | $473,388,179 | |
| Fidelity Central Funds (cost $22,601,265) | 22,601,265 | |
| Total Investment in Securities (cost $519,870,793) | | $495,989,444 |
| Foreign currency held at value (cost $74,689) | | 74,689 |
| Receivable for investments sold | | |
| Regular delivery | | 36,455 |
| Delayed delivery | | 851,951 |
| Receivable for fund shares sold | | 356,190 |
| Dividends receivable | | 4,936,698 |
| Distributions receivable from Fidelity Central Funds | | 63,029 |
| Prepaid expenses | | 230 |
| Other receivables | | 26,652 |
| Total assets | | 502,335,338 |
| Liabilities | | |
| Payable for investments purchased | $1,680,726 | |
| Payable for fund shares redeemed | 837,236 | |
| Accrued management fee | 209,793 | |
| Distribution and service plan fees payable | 6,581 | |
| Other affiliated payables | 87,666 | |
| Other payables and accrued expenses | 45,789 | |
| Collateral on securities loaned | 18,147,709 | |
| Total liabilities | | 21,015,500 |
| Net Assets | | $481,319,838 |
| Net Assets consist of: | | |
| Paid in capital | | $529,071,648 |
| Total distributable earnings (loss) | | (47,751,810) |
| Net Assets | | $481,319,838 |
| Net Asset Value and Maximum Offering Price | | |
| Class A: | | |
| Net Asset Value and redemption price per share ($7,913,813 ÷ 972,040 shares) | | $8.14 |
| Maximum offering price per share (100/94.25 of $8.14) | | $8.64 |
| Class M: | | |
| Net Asset Value and redemption price per share ($3,873,330 ÷ 475,806 shares) | | $8.14 |
| Maximum offering price per share (100/96.50 of $8.14) | | $8.44 |
| Class C: | | |
| Net Asset Value and offering price per share ($3,918,424 ÷ 481,123 shares)(a) | | $8.14 |
| International Value: | | |
| Net Asset Value, offering price and redemption price per share ($456,792,331 ÷ 56,191,180 shares) | | $8.13 |
| Class I: | | |
| Net Asset Value, offering price and redemption price per share ($8,660,792 ÷ 1,063,727 shares) | | $8.14 |
| Class Z: | | |
| Net Asset Value, offering price and redemption price per share ($161,148 ÷ 19,825 shares) | | $8.13 |
(a) Redemption price per share is equal to net asset value less any applicable contingent deferred sales charge.
See accompanying notes which are an integral part of the financial statements.
Statement of Operations
| | | Six months ended April 30, 2019 (Unaudited) |
| Investment Income | | |
| Dividends | | $10,193,130 |
| Income from Fidelity Central Funds | | 182,057 |
| Income before foreign taxes withheld | | 10,375,187 |
| Less foreign taxes withheld | | (700,974) |
| Total income | | 9,674,213 |
| Expenses | | |
| Management fee | | |
| Basic fee | $1,558,563 | |
| Performance adjustment | (402,065) | |
| Transfer agent fees | 382,579 | |
| Distribution and service plan fees | 41,092 | |
| Accounting and security lending fees | 118,410 | |
| Custodian fees and expenses | 35,530 | |
| Independent trustees' fees and expenses | 1,258 | |
| Registration fees | 95,293 | |
| Audit | 32,947 | |
| Legal | 654 | |
| Miscellaneous | 1,437 | |
| Total expenses before reductions | 1,865,698 | |
| Expense reductions | (46,694) | |
| Total expenses after reductions | | 1,819,004 |
| Net investment income (loss) | | 7,855,209 |
| Realized and Unrealized Gain (Loss) | | |
| Net realized gain (loss) on: | | |
| Investment securities: | | |
| Unaffiliated issuers | (9,742,554) | |
| Fidelity Central Funds | (987) | |
| Foreign currency transactions | 5,775 | |
| Total net realized gain (loss) | | (9,737,766) |
| Change in net unrealized appreciation (depreciation) on: | | |
| Investment securities: | | |
| Unaffiliated issuers | 16,702,387 | |
| Fidelity Central Funds | 474 | |
| Assets and liabilities in foreign currencies | (6,167) | |
| Total change in net unrealized appreciation (depreciation) | | 16,696,694 |
| Net gain (loss) | | 6,958,928 |
| Net increase (decrease) in net assets resulting from operations | | $14,814,137 |
See accompanying notes which are an integral part of the financial statements.
Statement of Changes in Net Assets
| | Six months ended April 30, 2019 (Unaudited) | Year ended October 31, 2018 |
| Increase (Decrease) in Net Assets | | |
| Operations | | |
| Net investment income (loss) | $7,855,209 | $13,690,019 |
| Net realized gain (loss) | (9,737,766) | 17,670,754 |
| Change in net unrealized appreciation (depreciation) | 16,696,694 | (75,956,079) |
| Net increase (decrease) in net assets resulting from operations | 14,814,137 | (44,595,306) |
| Distributions to shareholders | (13,674,095) | (8,990,094) |
| Share transactions - net increase (decrease) | 23,146,289 | 127,811,807 |
| Redemption fees | – | 12,452 |
| Total increase (decrease) in net assets | 24,286,331 | 74,238,859 |
| Net Assets | | |
| Beginning of period | 457,033,507 | 382,794,648 |
| End of period | $481,319,838 | $457,033,507 |
See accompanying notes which are an integral part of the financial statements.
Financial Highlights
Fidelity International Value Fund Class A
| | Six months ended (Unaudited) April 30, | Years endedOctober 31, | | | | |
| | 2019 | 2018 | 2017 | 2016 | 2015 | 2014 |
| Selected Per–Share Data | | | | | | |
| Net asset value, beginning of period | $8.13 | $9.08 | $7.78 | $8.27 | $8.62 | $8.96 |
| Income from Investment Operations | | | | | | |
| Net investment income (loss)A | .12 | .21 | .17 | .17 | .13 | .31B |
| Net realized and unrealized gain (loss) | .10 | (1.04) | 1.31 | (.57) | (.20) | (.47) |
| Total from investment operations | .22 | (.83) | 1.48 | (.40) | (.07) | (.16) |
| Distributions from net investment income | (.21) | (.10) | (.17) | (.09) | (.28) | (.17) |
| Distributions from net realized gain | – | (.01) | (.01) | – | – | (.01) |
| Total distributions | (.21) | (.12)C | (.18) | (.09) | (.28) | (.18) |
| Redemption fees added to paid in capitalA | – | –D | –D | –D | –D | –D |
| Net asset value, end of period | $8.14 | $8.13 | $9.08 | $7.78 | $8.27 | $8.62 |
| Total ReturnE,F,G | 2.99% | (9.30)% | 19.36% | (4.91)% | (.81)% | (1.76)% |
| Ratios to Average Net AssetsH,I | | | | | | |
| Expenses before reductions | 1.14%J | 1.23% | 1.33% | 1.40% | 1.37% | 1.32% |
| Expenses net of fee waivers, if any | 1.13%J | 1.23% | 1.33% | 1.40% | 1.37% | 1.32% |
| Expenses net of all reductions | 1.12%J | 1.21% | 1.32% | 1.39% | 1.36% | 1.32% |
| Net investment income (loss) | 3.15%J | 2.36% | 2.01% | 2.19% | 1.58% | 3.44%B |
| Supplemental Data | | | | | | |
| Net assets, end of period (000 omitted) | $7,914 | $7,887 | $8,151 | $7,717 | $8,956 | $6,296 |
| Portfolio turnover rateK | 44%J | 55% | 50% | 47% | 44% | 69% |
A Calculated based on average shares outstanding during the period.
B Net investment income per share reflects a large, non-recurring dividend which amounted to $.14 per share. Excluding this non-recurring dividend, the ratio of net investment income (loss) to average net assets would have been 1.90%.
C Total distributions of $.12 per share is comprised of distributions from net investment income of $.102 and distributions from net realized gain of $.014 per share.
D Amount represents less than $.005 per share.
E Total returns for periods of less than one year are not annualized.
F Total returns would have been lower if certain expenses had not been reduced during the applicable periods shown.
G Total returns do not include the effect of the sales charges.
H Fees and expenses of any underlying Fidelity Central Funds are not included in the Fund's expense ratio. The Fund indirectly bears its proportionate share of the expenses of any underlying Fidelity Central Funds.
I Expense ratios reflect operating expenses of the class. Expenses before reductions do not reflect amounts reimbursed by the investment adviser or reductions from brokerage service arrangements or reductions from other expense offset arrangements and do not represent the amount paid by the class during periods when reimbursements or reductions occur. Expenses net of fee waivers reflect expenses after reimbursement by the investment adviser but prior to reductions from brokerage service arrangements or other expense offset arrangements. Expenses net of all reductions represent the net expenses paid by the class.
J Annualized
K Amount does not include the portfolio activity of any underlying Fidelity Central Funds.
See accompanying notes which are an integral part of the financial statements.
Fidelity International Value Fund Class M
| | Six months ended (Unaudited) April 30, | Years endedOctober 31, | | | | |
| | 2019 | 2018 | 2017 | 2016 | 2015 | 2014 |
| Selected Per–Share Data | | | | | | |
| Net asset value, beginning of period | $8.11 | $9.06 | $7.76 | $8.25 | $8.60 | $8.94 |
| Income from Investment Operations | | | | | | |
| Net investment income (loss)A | .11 | .18 | .14 | .15 | .11 | .28B |
| Net realized and unrealized gain (loss) | .10 | (1.04) | 1.31 | (.58) | (.20) | (.46) |
| Total from investment operations | .21 | (.86) | 1.45 | (.43) | (.09) | (.18) |
| Distributions from net investment income | (.18) | (.08) | (.14) | (.06) | (.26) | (.15) |
| Distributions from net realized gain | – | (.01) | (.01) | – | – | (.01) |
| Total distributions | (.18) | (.09) | (.15) | (.06) | (.26) | (.16) |
| Redemption fees added to paid in capitalA | – | –C | –C | –C | –C | –C |
| Net asset value, end of period | $8.14 | $8.11 | $9.06 | $7.76 | $8.25 | $8.60 |
| Total ReturnD,E,F | 2.85% | (9.59)% | 19.04% | (5.24)% | (1.09)% | (1.99)% |
| Ratios to Average Net AssetsG,H | | | | | | |
| Expenses before reductions | 1.45%I | 1.56% | 1.64% | 1.70% | 1.66% | 1.59% |
| Expenses net of fee waivers, if any | 1.44%I | 1.55% | 1.64% | 1.70% | 1.66% | 1.59% |
| Expenses net of all reductions | 1.43%I | 1.54% | 1.63% | 1.69% | 1.65% | 1.59% |
| Net investment income (loss) | 2.84%I | 2.04% | 1.70% | 1.89% | 1.29% | 3.17%B |
| Supplemental Data | | | | | | |
| Net assets, end of period (000 omitted) | $3,873 | $3,920 | $4,181 | $3,703 | $4,086 | $3,604 |
| Portfolio turnover rateJ | 44%I | 55% | 50% | 47% | 44% | 69% |
A Calculated based on average shares outstanding during the period.
B Net investment income per share reflects a large, non-recurring dividend which amounted to $.14 per share. Excluding this non-recurring dividend, the ratio of net investment income (loss) to average net assets would have been 1.64%.
C Amount represents less than $.005 per share.
D Total returns for periods of less than one year are not annualized.
E Total returns would have been lower if certain expenses had not been reduced during the applicable periods shown.
F Total returns do not include the effect of the sales charges.
G Fees and expenses of any underlying Fidelity Central Funds are not included in the Fund's expense ratio. The Fund indirectly bears its proportionate share of the expenses of any underlying Fidelity Central Funds.
H Expense ratios reflect operating expenses of the class. Expenses before reductions do not reflect amounts reimbursed by the investment adviser or reductions from brokerage service arrangements or reductions from other expense offset arrangements and do not represent the amount paid by the class during periods when reimbursements or reductions occur. Expenses net of fee waivers reflect expenses after reimbursement by the investment adviser but prior to reductions from brokerage service arrangements or other expense offset arrangements. Expenses net of all reductions represent the net expenses paid by the class.
I Annualized
J Amount does not include the portfolio activity of any underlying Fidelity Central Funds.
See accompanying notes which are an integral part of the financial statements.
Fidelity International Value Fund Class C
| | Six months ended (Unaudited) April 30, | Years endedOctober 31, | | | | |
| | 2019 | 2018 | 2017 | 2016 | 2015 | 2014 |
| Selected Per–Share Data | | | | | | |
| Net asset value, beginning of period | $8.08 | $9.04 | $7.75 | $8.23 | $8.59 | $8.93 |
| Income from Investment Operations | | | | | | |
| Net investment income (loss)A | .09 | .14 | .10 | .11 | .07 | .24B |
| Net realized and unrealized gain (loss) | .10 | (1.04) | 1.31 | (.57) | (.20) | (.45) |
| Total from investment operations | .19 | (.90) | 1.41 | (.46) | (.13) | (.21) |
| Distributions from net investment income | (.13) | (.04) | (.11) | (.02) | (.23) | (.11) |
| Distributions from net realized gain | – | (.01) | (.01) | – | – | (.01) |
| Total distributions | (.13) | (.06)C | (.12) | (.02) | (.23) | (.13)D |
| Redemption fees added to paid in capitalA | – | –E | –E | –E | –E | –E |
| Net asset value, end of period | $8.14 | $8.08 | $9.04 | $7.75 | $8.23 | $8.59 |
| Total ReturnF,G,H | 2.52% | (10.06)% | 18.41% | (5.61)% | (1.58)% | (2.43)% |
| Ratios to Average Net AssetsI,J | | | | | | |
| Expenses before reductions | 1.94%K | 2.04% | 2.12% | 2.17% | 2.15% | 2.07% |
| Expenses net of fee waivers, if any | 1.94%K | 2.04% | 2.12% | 2.17% | 2.14% | 2.07% |
| Expenses net of all reductions | 1.92%K | 2.02% | 2.11% | 2.17% | 2.14% | 2.07% |
| Net investment income (loss) | 2.35%K | 1.55% | 1.22% | 1.42% | .81% | 2.69%B |
| Supplemental Data | | | | | | |
| Net assets, end of period (000 omitted) | $3,918 | $5,339 | $5,171 | $4,168 | $4,502 | $3,647 |
| Portfolio turnover rateL | 44%K | 55% | 50% | 47% | 44% | 69% |
A Calculated based on average shares outstanding during the period.
B Net investment income per share reflects a large, non-recurring dividend which amounted to $.14 per share. Excluding this non-recurring dividend, the ratio of net investment income (loss) to average net assets would have been 1.15%.
C Total distributions of $.06 per share is comprised of distributions from net investment income of $.042 and distributions from net realized gain of $.014 per share.
D Total distributions of $.13 per share is comprised of distributions from net investment income of $.111 and distributions from net realized gain of $.014 per share.
E Amount represents less than $.005 per share.
F Total returns for periods of less than one year are not annualized.
G Total returns would have been lower if certain expenses had not been reduced during the applicable periods shown.
H Total returns do not include the effect of the contingent deferred sales charge.
I Fees and expenses of any underlying Fidelity Central Funds are not included in the Fund's expense ratio. The Fund indirectly bears its proportionate share of the expenses of any underlying Fidelity Central Funds.
J Expense ratios reflect operating expenses of the class. Expenses before reductions do not reflect amounts reimbursed by the investment adviser or reductions from brokerage service arrangements or reductions from other expense offset arrangements and do not represent the amount paid by the class during periods when reimbursements or reductions occur. Expenses net of fee waivers reflect expenses after reimbursement by the investment adviser but prior to reductions from brokerage service arrangements or other expense offset arrangements. Expenses net of all reductions represent the net expenses paid by the class.
K Annualized
L Amount does not include the portfolio activity of any underlying Fidelity Central Funds.
See accompanying notes which are an integral part of the financial statements.
Fidelity International Value Fund
| | Six months ended (Unaudited) April 30, | Years endedOctober 31, | | | | |
| | 2019 | 2018 | 2017 | 2016 | 2015 | 2014 |
| Selected Per–Share Data | | | | | | |
| Net asset value, beginning of period | $8.14 | $9.09 | $7.79 | $8.29 | $8.64 | $8.97 |
| Income from Investment Operations | | | | | | |
| Net investment income (loss)A | .14 | .24 | .20 | .20 | .16 | .34B |
| Net realized and unrealized gain (loss) | .09 | (1.04) | 1.31 | (.58) | (.19) | (.46) |
| Total from investment operations | .23 | (.80) | 1.51 | (.38) | (.03) | (.12) |
| Distributions from net investment income | (.24) | (.14) | (.20) | (.12) | (.32) | (.20) |
| Distributions from net realized gain | – | (.01) | (.01) | – | – | (.01) |
| Total distributions | (.24) | (.15) | (.21) | (.12) | (.32) | (.21) |
| Redemption fees added to paid in capitalA | – | –C | –C | –C | –C | –C |
| Net asset value, end of period | $8.13 | $8.14 | $9.09 | $7.79 | $8.29 | $8.64 |
| Total ReturnD,E | 3.13% | (8.95)% | 19.83% | (4.69)% | (.41)% | (1.34)% |
| Ratios to Average Net AssetsF,G | | | | | | |
| Expenses before reductions | .80%H | .89% | .97% | 1.03% | 1.02% | .96% |
| Expenses net of fee waivers, if any | .79%H | .89% | .97% | 1.03% | 1.02% | .96% |
| Expenses net of all reductions | .78%H | .87% | .96% | 1.03% | 1.01% | .95% |
| Net investment income (loss) | 3.49%H | 2.70% | 2.36% | 2.56% | 1.93% | 3.80%B |
| Supplemental Data | | | | | | |
| Net assets, end of period (000 omitted) | $456,792 | $433,015 | $359,770 | $309,199 | $267,567 | $192,789 |
| Portfolio turnover rateI | 44%H | 55% | 50% | 47% | 44% | 69% |
A Calculated based on average shares outstanding during the period.
B Net investment income per share reflects a large, non-recurring dividend which amounted to $.14 per share. Excluding this non-recurring dividend, the ratio of net investment income (loss) to average net assets would have been 2.27%.
C Amount represents less than $.005 per share.
D Total returns for periods of less than one year are not annualized.
E Total returns would have been lower if certain expenses had not been reduced during the applicable periods shown.
F Fees and expenses of any underlying Fidelity Central Funds are not included in the Fund's expense ratio. The Fund indirectly bears its proportionate share of the expenses of any underlying Fidelity Central Funds.
G Expense ratios reflect operating expenses of the class. Expenses before reductions do not reflect amounts reimbursed by the investment adviser or reductions from brokerage service arrangements or reductions from other expense offset arrangements and do not represent the amount paid by the class during periods when reimbursements or reductions occur. Expenses net of fee waivers reflect expenses after reimbursement by the investment adviser but prior to reductions from brokerage service arrangements or other expense offset arrangements. Expenses net of all reductions represent the net expenses paid by the class.
H Annualized
I Amount does not include the portfolio activity of any underlying Fidelity Central Funds.
See accompanying notes which are an integral part of the financial statements.
Fidelity International Value Fund Class I
| | Six months ended (Unaudited) April 30, | Years endedOctober 31, | | | | |
| | 2019 | 2018 | 2017 | 2016 | 2015 | 2014 |
| Selected Per–Share Data | | | | | | |
| Net asset value, beginning of period | $8.15 | $9.10 | $7.80 | $8.29 | $8.65 | $8.98 |
| Income from Investment Operations | | | | | | |
| Net investment income (loss)A | .13 | .23 | .19 | .19 | .15 | .33B |
| Net realized and unrealized gain (loss) | .10 | (1.04) | 1.31 | (.58) | (.19) | (.45) |
| Total from investment operations | .23 | (.81) | 1.50 | (.39) | (.04) | (.12) |
| Distributions from net investment income | (.24) | (.13) | (.19) | (.10) | (.32) | (.19) |
| Distributions from net realized gain | – | (.01) | (.01) | – | – | (.01) |
| Total distributions | (.24) | (.14) | (.20) | (.10) | (.32) | (.21)C |
| Redemption fees added to paid in capitalA | – | –D | –D | –D | –D | –D |
| Net asset value, end of period | $8.14 | $8.15 | $9.10 | $7.80 | $8.29 | $8.65 |
| Total ReturnE,F | 3.05% | (9.04)% | 19.68% | (4.81)% | (.53)% | (1.41)% |
| Ratios to Average Net AssetsG,H | | | | | | |
| Expenses before reductions | .88%I | .97% | 1.10% | 1.17% | 1.14% | 1.05% |
| Expenses net of fee waivers, if any | .87%I | .97% | 1.10% | 1.17% | 1.14% | 1.05% |
| Expenses net of all reductions | .86%I | .95% | 1.09% | 1.16% | 1.13% | 1.04% |
| Net investment income (loss) | 3.42%I | 2.62% | 2.23% | 2.42% | 1.81% | 3.71%B |
| Supplemental Data | | | | | | |
| Net assets, end of period (000 omitted) | $8,661 | $6,779 | $5,523 | $1,955 | $1,969 | $1,310 |
| Portfolio turnover rateJ | 44%I | 55% | 50% | 47% | 44% | 69% |
A Calculated based on average shares outstanding during the period.
B Net investment income per share reflects a large, non-recurring dividend which amounted to $.14 per share. Excluding this non-recurring dividend, the ratio of net investment income (loss) to average net assets would have been 2.18%.
C Total distributions of $.21 per share is comprised of distributions from net investment income of $.191 and distributions from net realized gain of $.014 per share.
D Amount represents less than $.005 per share.
E Total returns for periods of less than one year are not annualized.
F Total returns would have been lower if certain expenses had not been reduced during the applicable periods shown.
G Fees and expenses of any underlying Fidelity Central Funds are not included in the Fund's expense ratio. The Fund indirectly bears its proportionate share of the expenses of any underlying Fidelity Central Funds.
H Expense ratios reflect operating expenses of the class. Expenses before reductions do not reflect amounts reimbursed by the investment adviser or reductions from brokerage service arrangements or reductions from other expense offset arrangements and do not represent the amount paid by the class during periods when reimbursements or reductions occur. Expenses net of fee waivers reflect expenses after reimbursement by the investment adviser but prior to reductions from brokerage service arrangements or other expense offset arrangements. Expenses net of all reductions represent the net expenses paid by the class.
I Annualized
J Amount does not include the portfolio activity of any underlying Fidelity Central Funds.
See accompanying notes which are an integral part of the financial statements.
Fidelity International Value Fund Class Z
| | Six months ended (Unaudited) April 30, | Years endedOctober 31, |
| | 2019 | 2018 A |
| Selected Per–Share Data | | |
| Net asset value, beginning of period | $8.14 | $8.81 |
| Income from Investment Operations | | |
| Net investment income (loss)B | .14 | .01 |
| Net realized and unrealized gain (loss) | .11 | (.68) |
| Total from investment operations | .25 | (.67) |
| Distributions from net investment income | (.26) | – |
| Distributions from net realized gain | – | – |
| Total distributions | (.26) | – |
| Net asset value, end of period | $8.13 | $8.14 |
| Total ReturnC,D | 3.32% | (7.60)% |
| Ratios to Average Net AssetsE,F | | |
| Expenses before reductions | .68%G | .84%G |
| Expenses net of fee waivers, if any | .68%G | .84%G |
| Expenses net of all reductions | .66%G | .82%G |
| Net investment income (loss) | 3.61%G | 1.58%G |
| Supplemental Data | | |
| Net assets, end of period (000 omitted) | $161 | $92 |
| Portfolio turnover rateH | 44%G | 55% |
A For the period October 2, 2018 (commencement of sale of shares) to October 31, 2018.
B Calculated based on average shares outstanding during the period.
C Total returns for periods of less than one year are not annualized.
D Total returns would have been lower if certain expenses had not been reduced during the applicable periods shown.
E Fees and expenses of any underlying Fidelity Central Funds are not included in the Fund's expense ratio. The Fund indirectly bears its proportionate share of the expenses of any underlying Fidelity Central Funds.
F Expense ratios reflect operating expenses of the class. Expenses before reductions do not reflect amounts reimbursed by the investment adviser or reductions from brokerage service arrangements or reductions from other expense offset arrangements and do not represent the amount paid by the class during periods when reimbursements or reductions occur. Expense ratios before reductions for start-up periods may not be representative of longer-term operating periods. Expenses net of fee waivers reflect expenses after reimbursement by the investment adviser but prior to reductions from brokerage service arrangements or other expense offset arrangements. Expenses net of all reductions represent the net expenses paid by the class.
G Annualized
H Amount does not include the portfolio activity of any underlying Fidelity Central Funds.
See accompanying notes which are an integral part of the financial statements.
Notes to Financial Statements (Unaudited)
For the period ended April 30, 2019
1. Organization.
Fidelity International Value Fund (the Fund) is a fund of Fidelity Investment Trust (the Trust) and is authorized to issue an unlimited number of shares. The Trust is registered under the Investment Company Act of 1940, as amended (the 1940 Act), as an open-end management investment company organized as a Massachusetts business trust. The Fund offers Class A, Class M, Class C, International Value, Class I and Class Z shares, each of which has equal rights as to assets and voting privileges. Each class has exclusive voting rights with respect to matters that affect that class. Effective March 1, 2019, Class C shares will automatically convert to Class A shares after a holding period of ten years from the initial date of purchase, with certain exceptions.
2. Investments in Fidelity Central Funds.
The Fund invests in Fidelity Central Funds, which are open-end investment companies generally available only to other investment companies and accounts managed by the investment adviser and its affiliates. The Fund's Schedule of Investments lists each of the Fidelity Central Funds held as of period end, if any, as an investment of the Fund, but does not include the underlying holdings of each Fidelity Central Fund. As an Investing Fund, the Fund indirectly bears its proportionate share of the expenses of the underlying Fidelity Central Funds.
The Money Market Central Funds seek preservation of capital and current income and are managed by Fidelity Investments Money Management, Inc. (FIMM), an affiliate of the investment adviser. Annualized expenses of the Money Market Central Funds as of their most recent shareholder report date are less than .005%.
A complete unaudited list of holdings for each Fidelity Central Fund is available upon request or at the Securities and Exchange Commission (the SEC) website at www.sec.gov. In addition, the financial statements of the Fidelity Central Funds are available on the SEC website or upon request.
3. Significant Accounting Policies.
The Fund is an investment company and applies the accounting and reporting guidance of the Financial Accounting Standards Board (FASB) Accounting Standards Codification Topic 946 Financial Services – Investments Companies. The financial statements have been prepared in conformity with accounting principles generally accepted in the United States of America (GAAP), which require management to make certain estimates and assumptions at the date of the financial statements. Actual results could differ from those estimates. Subsequent events, if any, through the date that the financial statements were issued have been evaluated in the preparation of the financial statements. The following summarizes the significant accounting policies of the Fund:
Investment Valuation. Investments are valued as of 4:00 p.m. Eastern time on the last calendar day of the period. The Board of Trustees (the Board) has delegated the day to day responsibility for the valuation of the Fund's investments to the Fair Value Committee (the Committee) established by the Fund's investment adviser. In accordance with valuation policies and procedures approved by the Board, the Fund attempts to obtain prices from one or more third party pricing vendors or brokers to value its investments. When current market prices, quotations or currency exchange rates are not readily available or reliable, investments will be fair valued in good faith by the Committee, in accordance with procedures adopted by the Board. Factors used in determining fair value vary by investment type and may include market or investment specific events. The frequency with which these procedures are used cannot be predicted and they may be utilized to a significant extent. The Committee oversees the Fund's valuation policies and procedures and reports to the Board on the Committee's activities and fair value determinations. The Board monitors the appropriateness of the procedures used in valuing the Fund's investments and ratifies the fair value determinations of the Committee.
The Fund categorizes the inputs to valuation techniques used to value its investments into a disclosure hierarchy consisting of three levels as shown below:
- Level 1 – quoted prices in active markets for identical investments
- Level 2 – other significant observable inputs (including quoted prices for similar investments, interest rates, prepayment speeds, etc.)
- Level 3 – unobservable inputs (including the Fund's own assumptions based on the best information available)
Valuation techniques used to value the Fund's investments by major category are as follows:
Equity securities, including restricted securities, for which market quotations are readily available, are valued at the last reported sale price or official closing price as reported by a third party pricing vendor on the primary market or exchange on which they are traded and are categorized as Level 1 in the hierarchy. In the event there were no sales during the day or closing prices are not available, securities are valued at the last quoted bid price or may be valued using the last available price and are generally categorized as Level 2 in the hierarchy. For foreign equity securities, when market or security specific events arise, comparisons to the valuation of American Depositary Receipts (ADRs), futures contracts, Exchange-Traded Funds (ETFs) and certain indexes as well as quoted prices for similar securities may be used and would be categorized as Level 2 in the hierarchy. For equity securities, including restricted securities, where observable inputs are limited, assumptions about market activity and risk are used and these securities may be categorized as Level 3 in the hierarchy.
Investments in open-end mutual funds, including the Fidelity Central Funds, are valued at their closing net asset value (NAV) each business day and are categorized as Level 1 in the hierarchy.
Changes in valuation techniques may result in transfers in or out of an assigned level within the disclosure hierarchy. The aggregate value of investments by input level as of April 30, 2019 is included at the end of the Fund's Schedule of Investments.
Foreign Currency. The Fund may use foreign currency contracts to facilitate transactions in foreign-denominated securities. Gains and losses from these transactions may arise from changes in the value of the foreign currency or if the counterparties do not perform under the contracts' terms.
Foreign-denominated assets, including investment securities, and liabilities are translated into U.S. dollars at the exchange rates at period end. Purchases and sales of investment securities, income and dividends received and expenses denominated in foreign currencies are translated into U.S. dollars at the exchange rate in effect on the transaction date.
The effects of exchange rate fluctuations on investments are included with the net realized and unrealized gain (loss) on investment securities. Other foreign currency transactions resulting in realized and unrealized gain (loss) are disclosed separately.
Investment Transactions and Income. For financial reporting purposes, the Fund's investment holdings and NAV include trades executed through the end of the last business day of the period. The NAV per share for processing shareholder transactions is calculated as of the close of business of the New York Stock Exchange (NYSE), normally 4:00 p.m. Eastern time and includes trades executed through the end of the prior business day. Gains and losses on securities sold are determined on the basis of identified cost and include proceeds received from litigation. Dividend income is recorded on the ex-dividend date, except for certain dividends from foreign securities where the ex-dividend date may have passed, which are recorded as soon as the Fund is informed of the ex-dividend date. Non-cash dividends included in dividend income, if any, are recorded at the fair market value of the securities received. Income and capital gain distributions from Fidelity Central Funds, if any, are recorded on the ex-dividend date. Certain distributions received by the Fund represent a return of capital or capital gain. The Fund determines the components of these distributions subsequent to the ex-dividend date, based upon receipt of tax filings or other correspondence relating to the underlying investment. These distributions are recorded as a reduction of cost of investments and/or as a realized gain. Investment income is recorded net of foreign taxes withheld where recovery of such taxes is uncertain.
Class Allocations and Expenses. Investment income, realized and unrealized capital gains and losses, common expenses of the Fund, and certain fund-level expense reductions, if any, are allocated daily on a pro-rata basis to each class based on the relative net assets of each class to the total net assets of the Fund. Each class differs with respect to transfer agent and distribution and service plan fees incurred. Certain expense reductions may also differ by class. For the reporting period, the allocated portion of income and expenses to each class as a percent of its average net assets may vary due to the timing of recording these transactions in relation to fluctuating net assets of the classes. Expenses directly attributable to a fund are charged to that fund. Expenses attributable to more than one fund are allocated among the respective funds on the basis of relative net assets or other appropriate methods. Expense estimates are accrued in the period to which they relate and adjustments are made when actual amounts are known.
Income Tax Information and Distributions to Shareholders. Each year, the Fund intends to qualify as a regulated investment company under Subchapter M of the Internal Revenue Code, including distributing substantially all of its taxable income and realized gains. As a result, no provision for U.S. Federal income taxes is required. The Fund files a U.S. federal tax return, in addition to state and local tax returns as required. The Fund's federal income tax returns are subject to examination by the Internal Revenue Service (IRS) for a period of three fiscal years after they are filed. State and local tax returns may be subject to examination for an additional fiscal year depending on the jurisdiction. Foreign taxes are provided for based on the Fund's understanding of the tax rules and rates that exist in the foreign markets in which it invests.
Distributions are declared and recorded on the ex-dividend date. Income and capital gain distributions are declared separately for each class. Income and capital gain distributions are determined in accordance with income tax regulations, which may differ from GAAP.
Capital accounts within the financial statements are adjusted for permanent book-tax differences. These adjustments have no impact on net assets or the results of operations. Capital accounts are not adjusted for temporary book-tax differences which will reverse in a subsequent period.
Book-tax differences are primarily due to foreign currency transactions, passive foreign investment companies (PFIC), expiring capital loss carryforwards, capital loss carryforwards and losses deferred due to wash sales.
As of period end, the cost and unrealized appreciation (depreciation) in securities, and derivatives if applicable, for federal income tax purposes were as follows:
| Gross unrealized appreciation | $29,462,214 |
| Gross unrealized depreciation | (54,825,104) |
| Net unrealized appreciation (depreciation) | $(25,362,890) |
| Tax cost | $521,352,334 |
Capital loss carryforwards are only available to offset future capital gains of the Fund to the extent provided by regulations and may be limited. Under the Regulated Investment Company Modernization Act of 2010 (the Act), the Fund is permitted to carry forward capital losses incurred in taxable years beginning after December 22, 2010 for an unlimited period and such capital losses are required to be used prior to any losses that expire. The capital loss carryforward information presented below, including any applicable limitation, is estimated as of prior fiscal period end and is subject to adjustment.
| Fiscal year of expiration | |
| 2019 | $(19,448,816) |
Delayed Delivery Transactions and When-Issued Securities. During the period, the Fund transacted in securities on a delayed delivery or when-issued basis. Payment and delivery may take place after the customary settlement period for that security. The price of the underlying securities and the date when the securities will be delivered and paid for are fixed at the time the transaction is negotiated. Losses may arise due to changes in the value of the underlying securities or if the counterparty does not perform under the contract's terms, or if the issuer does not issue the securities due to political, economic, or other factors.
Restricted Securities. The Fund may invest in securities that are subject to legal or contractual restrictions on resale. These securities generally may be resold in transactions exempt from registration or to the public if the securities are registered. Disposal of these securities may involve time-consuming negotiations and expense, and prompt sale at an acceptable price may be difficult. Information regarding restricted securities is included at the end of the Fund's Schedule of Investments.
4. Purchases and Sales of Investments.
Purchases and sales of securities, other than short-term securities, aggregated $114,799,865 and $99,351,444, respectively.
5. Fees and Other Transactions with Affiliates.
Management Fee. Fidelity Management & Research Company (the investment adviser) and its affiliates provide the Fund with investment management related services for which the Fund pays a monthly management fee. The management fee is the sum of an individual fund fee rate that is based on an annual rate of .45% of the Fund's average net assets and an annualized group fee rate that averaged .24% during the period. The group fee rate is based upon the average net assets of all the mutual funds advised by the investment adviser, including any mutual funds previously advised by the investment adviser that are currently advised by Fidelity SelectCo, LLC, an affiliate of the investment adviser. The group fee rate decreases as assets under management increase and increases as assets under management decrease. In addition, the management fee is subject to a performance adjustment (up to a maximum of +/- .20% of the Fund's average net assets over a 36 month performance period). The upward or downward adjustment to the management fee is based on the relative investment performance of International Value as compared to its benchmark index, the MSCI EAFE Value Index, over the same 36 month performance period. For the reporting period, the total annualized management fee rate, including the performance adjustment, was .51% of the Fund's average net assets. The performance adjustment included in the management fee rate may be higher or lower than the maximum performance adjustment rate due to the difference between the average net assets for the reporting and performance periods.
Distribution and Service Plan Fees. In accordance with Rule 12b-1 of the 1940 Act, the Fund has adopted separate Distribution and Service Plans for each class of shares. Certain classes pay Fidelity Distributors Corporation (FDC), an affiliate of the investment adviser, separate Distribution and Service Fees, each of which is based on an annual percentage of each class' average net assets. In addition, FDC may pay financial intermediaries for selling shares of the Fund and providing shareholder support services. For the period, the Distribution and Service Fee rates, total fees and amounts retained by FDC were as follows:
| | Distribution Fee | Service Fee | Total Fees | Retained by FDC |
| Class A | - % | .25% | $9,474 | $790 |
| Class M | .25% | .25% | 9,290 | 145 |
| Class C | .75% | .25% | 22,328 | 2,587 |
| | | | $41,092 | $3,522 |
Sales Load. FDC may receive a front-end sales charge of up to 5.75% for selling Class A shares and 3.50% for selling Class M shares, some of which is paid to financial intermediaries for selling shares of the Fund. Depending on the holding period, FDC may receive contingent deferred sales charges levied on Class A, Class M and Class C redemptions. The deferred sales charges are 1.00% for Class C shares, 1.00% for certain purchases of Class A shares and .25% for certain purchases of Class M shares.
For the period, sales charge amounts retained by FDC were as follows:
| | Retained by FDC |
| Class A | $1,906 |
| Class M | 595 |
| Class C(a) | 358 |
| | $2,859 |
(a) When Class C shares are initially sold, FDC pays commissions from its own resources to financial intermediaries through which the sales are made.
Transfer Agent Fees. Fidelity Investments Institutional Operations Company, Inc., (FIIOC), an affiliate of the investment adviser, is the transfer, dividend disbursing and shareholder servicing agent for each class of the Fund. FIIOC receives account fees and asset-based fees that vary according to the account size and type of account of the shareholders of the respective classes of the Fund, except for Class Z. FIIOC receives an asset-based fee of Class Z's average net assets. FIIOC pays for typesetting, printing and mailing of shareholder reports, except proxy statements.
For the period, transfer agent fees for each class were as follows:
| | Amount | % of Class-Level Average Net Assets(a) |
| Class A | $9,676 | .25 |
| Class M | 5,855 | .31 |
| Class C | 6,858 | .31 |
| International Value | 350,890 | .16 |
| Class I | 9,259 | .24 |
| Class Z | 41 | .05 |
| | $382,579 | |
(a) Annualized
Accounting and Security Lending Fees. Fidelity Service Company, Inc. (FSC), an affiliate of the investment adviser, maintains the Fund's accounting records. The accounting fee is based on the level of average net assets for each month. Prior to April 1, 2019, FSC had a separate agreement with the Fund for administration of the security lending program, based on the number and duration of lending transactions. For the period, the total fees paid for accounting and administration of securities lending were equivalent to an annualized rate of .05%.
Brokerage Commissions. The Fund placed a portion of its portfolio transactions with brokerage firms which are affiliates of the investment adviser. Brokerage commissions are included in net realized gain (loss) and change in net unrealized appreciation (depreciation) in the Statement of Operations. The commissions paid to these affiliated firms were $94 for the period.
Interfund Trades. The Funds may purchase from or sell securities to other Fidelity Funds under procedures adopted by the Board. The procedures have been designed to ensure these interfund trades are executed in accordance with Rule 17a-7 of the 1940 Act. Interfund trades are included within the respective purchases and sales amounts shown in the Purchases and Sales of Investments note.
6. Committed Line of Credit.
The Fund participates with other funds managed by the investment adviser or an affiliate in a $4.25 billion credit facility (the "line of credit") to be utilized for temporary or emergency purposes to fund shareholder redemptions or for other short-term liquidity purposes. The Fund has agreed to pay commitment fees on its pro-rata portion of the line of credit, which amounted to $645 and is reflected in Miscellaneous expenses on the Statement of Operations. During the period, the Fund did not borrow on this line of credit.
7. Security Lending.
The Fund lends portfolio securities through a lending agent from time to time in order to earn additional income. For equity securities, a lending agent is used and may loan securities to certain qualified borrowers, including Fidelity Capital Markets (FCM), a broker-dealer affiliated with the Fund. On the settlement date of the loan, the Fund receives collateral (in the form of U.S. Treasury obligations, letters of credit and/or cash) against the loaned securities and maintains collateral in an amount not less than 100% of the market value of the loaned securities during the period of the loan. The market value of the loaned securities is determined at the close of business of the Fund and any additional required collateral is delivered to the Fund on the next business day. The Fund or borrower may terminate the loan at any time, and if the borrower defaults on its obligation to return the securities loaned because of insolvency or other reasons, the Fund may apply collateral received from the borrower against the obligation. The Fund may experience delays and costs in recovering the securities loaned. Any cash collateral received is invested in the Fidelity Securities Lending Cash Central Fund. The value of loaned securities and cash collateral at period end are disclosed on the Fund's Statement of Assets and Liabilities. Security lending income represents the income earned on investing cash collateral, less rebates paid to borrowers and any lending agent fees associated with the loan, plus any premium payments received for lending certain types of securities. Security lending income is presented in the Statement of Operations as a component of income from Fidelity Central Funds. Total security lending income during the period amounted to $132,828. During the period, there were no securities loaned to FCM.
8. Expense Reductions.
Commissions paid to certain brokers with whom the investment adviser, or its affiliates, places trades on behalf of the Fund include an amount in addition to trade execution, which may be rebated back to the Fund to offset certain expenses. This amount totaled $29,794 for the period.
In addition, during the period the investment adviser reimbursed and/or waived a portion of fund-level operating expenses in the amount of $900 and a portion of class-level operating expenses as follows:
| | Amount |
| Class A | $260 |
| Class M | 131 |
| Class C | 158 |
| International Value | 15,161 |
| Class I | 285 |
| Class Z | 5 |
| | $16,000 |
9. Distributions to Shareholders.
Distributions to shareholders of each class were as follows:
| | Six months ended
April 30, 2019 | Year ended
October 31, 2018 |
| Distributions to shareholders | | |
| Class A | $203,466 | $103,389 |
| Class M | 86,532 | 41,092 |
| Class C | 78,779 | 32,748 |
| International Value | 13,098,896 | 8,724,460 |
| Class I | 198,775 | 88,405 |
| Class Z | 7,647 | – |
| Total | $13,674,095 | $8,990,094 |
10. Share Transactions.
Share transactions for each class were as follows and may contain automatic conversions between classes or exchanges between affiliated funds:
| | Shares | Shares | Dollars | Dollars |
| | Six months ended April 30, 2019 | Year ended October 31, 2018 | Six months ended April 30, 2019 | Year ended October 31, 2018 |
| Class A | | | | |
| Shares sold | 124,862 | 286,375 | $966,800 | $2,567,358 |
| Reinvestment of distributions | 26,837 | 11,240 | 199,932 | 100,489 |
| Shares redeemed | (149,822) | (224,999) | (1,161,547) | (2,007,679) |
| Net increase (decrease) | 1,877 | 72,616 | $5,185 | $660,168 |
| Class M | | | | |
| Shares sold | 54,607 | 84,749 | $424,981 | $765,119 |
| Reinvestment of distributions | 11,597 | 4,596 | 86,515 | 41,092 |
| Shares redeemed | (73,718) | (67,389) | (576,307) | (604,451) |
| Net increase (decrease) | (7,514) | 21,956 | $(64,811) | $201,760 |
| Class C | | | | |
| Shares sold | 27,792 | 224,225 | $219,911 | $2,034,976 |
| Reinvestment of distributions | 10,495 | 3,587 | 78,501 | 32,067 |
| Shares redeemed | (218,081) | (139,088) | (1,725,521) | (1,223,224) |
| Net increase (decrease) | (179,794) | 88,724 | $(1,427,109) | $843,819 |
| International Value | | | | |
| Shares sold | 5,795,530 | 22,242,584 | $45,150,126 | $201,187,963 |
| Reinvestment of distributions | 901,853 | 477,419 | 6,700,770 | 4,258,580 |
| Shares redeemed | (3,734,269) | (9,065,603) | (28,986,064) | (81,505,210) |
| Net increase (decrease) | 2,963,114 | 13,654,400 | $22,864,832 | $123,941,333 |
| Class I | | | | |
| Shares sold | 482,768 | 519,858 | $3,683,247 | $4,669,763 |
| Reinvestment of distributions | 24,905 | 9,287 | 185,542 | 82,930 |
| Shares redeemed | (276,218) | (303,812) | (2,171,616) | (2,687,966) |
| Net increase (decrease) | 231,455 | 225,333 | $1,697,173 | $2,064,727 |
| Class Z | | | | |
| Shares sold | 30,139 | 11,351 | $236,231 | $100,000 |
| Reinvestment of distributions | 1,029 | – | 7,647 | – |
| Shares redeemed | (22,694) | – | (172,859) | – |
| Net increase (decrease) | 8,474 | 11,351 | $71,019 | $100,000 |
11. Other.
The Fund's organizational documents provide former and current trustees and officers with a limited indemnification against liabilities arising in connection with the performance of their duties to the Fund. In the normal course of business, the Fund may also enter into contracts that provide general indemnifications. The Fund's maximum exposure under these arrangements is unknown as this would be dependent on future claims that may be made against the Fund. The risk of material loss from such claims is considered remote.
At the end of the period, Strategic Advisers Fidelity International Fund, VIP FundsManager 50% Portfolio and VIP FundsManager 60% Portfolio were the owners of record of approximately 43%, 11% and 13%, respectively, of the total outstanding shares of the Fund. Mutual funds managed by the investment adviser or its affiliates were the owners of record, in the aggregate, of approximately 75% of the total outstanding shares of the Fund.
Shareholder Expense Example
As a shareholder of the Fund, you incur two types of costs: (1) transaction costs, including sales charges (loads) on purchase payments or redemption proceeds, and (2) ongoing costs, including management fees, distribution and/or service (12b-1) fees and other Fund expenses. This Example is intended to help you understand your ongoing costs (in dollars) of investing in the Fund and to compare these costs with the ongoing costs of investing in other mutual funds.
The Example is based on an investment of $1,000 invested at the beginning of the period and held for the entire period (November 1, 2018 to April 30, 2019).
Actual Expenses
The first line of the accompanying table for each class of the Fund provides information about actual account values and actual expenses. You may use the information in this line, together with the amount you invested, to estimate the expenses that you paid over the period. Simply divide your account value by $1,000.00 (for example, an $8,600 account value divided by $1,000.00 = 8.6), then multiply the result by the number in the first line for a class of the Fund under the heading entitled "Expenses Paid During Period" to estimate the expenses you paid on your account during this period. In addition, the Fund, as a shareholder in the underlying Fidelity Central Funds, will indirectly bear its pro-rata share of the fees and expenses incurred by the underlying Fidelity Central Funds. These fees and expenses are not included in the Fund's annualized expense ratio used to calculate the expense estimate in the table below.
Hypothetical Example for Comparison Purposes
The second line of the accompanying table for each class of the Fund provides information about hypothetical account values and hypothetical expenses based on a Class' actual expense ratio and an assumed rate of return of 5% per year before expenses, which is not the Class' actual return. The hypothetical account values and expenses may not be used to estimate the actual ending account balance or expenses you paid for the period. You may use this information to compare the ongoing costs of investing in the Fund and other funds. To do so, compare this 5% hypothetical example with the 5% hypothetical examples that appear in the shareholder reports of the other funds. In addition, the Fund, as a shareholder in the underlying Fidelity Central Funds, will indirectly bear its pro-rata share of the fees and expenses incurred by the underlying Fidelity Central Funds. These fees and expenses are not included in the Fund's annualized expense ratio used to calculate the expense estimate in the table below.
Please note that the expenses shown in the table are meant to highlight your ongoing costs only and do not reflect any transaction costs. Therefore, the second line of the table is useful in comparing ongoing costs only, and will not help you determine the relative total costs of owning different funds. In addition, if these transactional costs were included, your costs would have been higher.
| | Annualized Expense Ratio-A | Beginning
Account Value
November 1, 2018 | Ending
Account Value
April 30, 2019 | Expenses Paid
During Period-B
November 1, 2018
to April 30, 2019 |
| Class A | 1.13% | | | |
| Actual | | $1,000.00 | $1,029.90 | $5.69 |
| Hypothetical-C | | $1,000.00 | $1,019.19 | $5.66 |
| Class M | 1.44% | | | |
| Actual | | $1,000.00 | $1,028.50 | $7.24 |
| Hypothetical-C | | $1,000.00 | $1,017.65 | $7.20 |
| Class C | 1.94% | | | |
| Actual | | $1,000.00 | $1,025.20 | $9.74 |
| Hypothetical-C | | $1,000.00 | $1,015.17 | $9.69 |
| International Value | .79% | | | |
| Actual | | $1,000.00 | $1,031.30 | $3.98 |
| Hypothetical-C | | $1,000.00 | $1,020.88 | $3.96 |
| Class I | .87% | | | |
| Actual | | $1,000.00 | $1,030.50 | $4.38 |
| Hypothetical-C | | $1,000.00 | $1,020.48 | $4.36 |
| Class Z | .68% | | | |
| Actual | | $1,000.00 | $1,033.20 | $3.43 |
| Hypothetical-C | | $1,000.00 | $1,021.42 | $3.41 |
A Annualized expense ratio reflects expenses net of applicable fee waivers.
B Expenses are equal to each Class' annualized expense ratio, multiplied by the average account value over the period, multiplied by 181/365 (to reflect the one-half year period).
C 5% return per year before expenses
Board Approval of Investment Advisory Contracts and Management Fees
Fidelity International Value Fund
Each year, the Board of Trustees, including the Independent Trustees (together, the Board), votes on the renewal of the management contract with Fidelity Management & Research Company (FMR) and the sub-advisory agreements (together, the Advisory Contracts) for the fund. FMR and the sub-advisers are referred to herein as the Investment Advisers. The Board, assisted by the advice of fund counsel and Independent Trustees' counsel, requests and considers a broad range of information relevant to the renewal of the Advisory Contracts throughout the year.
The Board meets regularly and, at each of its meetings, covers an extensive agenda of topics and materials and considers factors that are relevant to its annual consideration of the renewal of the fund's Advisory Contracts, including the services and support provided to the fund and its shareholders. The Board has established various standing committees (Committees), each composed of and chaired by Independent Trustees with varying backgrounds, to which the Board has assigned specific subject matter responsibilities in order to enhance effective decision-making by the Board. The Board, acting directly and through its Committees, requests and receives information concerning the annual consideration of the renewal of the fund's Advisory Contracts. The Board also meets as needed to review matters specifically related to the Board's annual consideration of the renewal of the Advisory Contracts. Members of the Board may also meet with trustees of other Fidelity funds through joint ad hoc committees to discuss certain matters relevant to all of the Fidelity funds.
At its January 2019 meeting, the Board unanimously determined to renew the fund's Advisory Contracts. In reaching its determination, the Board considered all factors it believed relevant, including (i) the nature, extent, and quality of the services to be provided to the fund and its shareholders (including the investment performance of the fund); (ii) the competitiveness of the fund's management fee and total expense ratio relative to peer funds; (iii) the total costs of the services to be provided by and the profits to be realized by Fidelity from its relationships with the fund; and (iv) the extent to which, if any, economies of scale exist and would be realized as the fund grows, and whether any economies of scale are appropriately shared with fund shareholders.
In considering whether to renew the Advisory Contracts for the fund, the Board reached a determination, with the assistance of fund counsel and Independent Trustees' counsel and through the exercise of its business judgment, that the renewal of the Advisory Contracts was in the best interests of the fund and its shareholders and that the compensation payable under the Advisory Contracts was fair and reasonable. The Board's decision to renew the Advisory Contracts was not based on any single factor, but rather was based on a comprehensive consideration of all the information provided to the Board at its meetings throughout the year. The Board, in reaching its determination to renew the Advisory Contracts, was aware that shareholders of the fund have a broad range of investment choices available to them, including a wide choice among funds offered by Fidelity's competitors, and that the fund's shareholders, who have the opportunity to review and weigh the disclosure provided by the fund in its prospectus and other public disclosures, have chosen to invest in this fund, which is part of the Fidelity family of funds.
Nature, Extent, and Quality of Services Provided. The Board considered Fidelity's staffing as it relates to the fund, including the backgrounds of investment personnel of Fidelity, and also considered the fund's investment objective, strategies, and related investment philosophy. The Independent Trustees also had discussions with senior management of Fidelity's investment operations and investment groups. The Board considered the structure of the investment personnel compensation program and whether this structure provides appropriate incentives to act in the best interests of the fund. Additionally, the Board considered the portfolio managers' investments, if any, in the funds that they manage.
Resources Dedicated to Investment Management and Support Services. The Board and the Fund Oversight and Research Committees reviewed the general qualifications and capabilities of Fidelity's investment staff, including its size, education, experience, and resources, as well as Fidelity's approach to recruiting, training, managing, and compensating investment personnel. The Board noted that Fidelity has continued to increase the resources devoted to non-U.S. offices, including expansion of Fidelity's global investment organization. The Board also noted that Fidelity's analysts have extensive resources, tools and capabilities that allow them to conduct sophisticated quantitative and fundamental analysis, as well as credit analysis of issuers, counterparties and guarantors. Further, the Board considered that Fidelity's investment professionals have sufficient access to global information and data so as to provide competitive investment results over time, and that those professionals also have access to sophisticated tools that permit them to assess portfolio construction and risk and performance attribution characteristics continuously, as well as to transmit new information and research conclusions rapidly around the world. Additionally, in its deliberations, the Board considered Fidelity's trading, risk management, compliance, and technology and operations capabilities and resources, which are integral parts of the investment management process.
Shareholder and Administrative Services. The Board considered (i) the nature, extent, quality, and cost of advisory, administrative, and shareholder services performed by the Investment Advisers and their affiliates under the Advisory Contracts and under separate agreements covering transfer agency, pricing and bookkeeping, and securities lending services for the fund; (ii) the nature and extent of the supervision of third party service providers, principally custodians, subcustodians, and pricing vendors; and (iii) the resources devoted to, and the record of compliance with, the fund's compliance policies and procedures. The Board also reviewed the allocation of fund brokerage, including allocations to brokers affiliated with the Investment Advisers, the use of brokerage commissions to pay fund expenses, and the use of "soft" commission dollars to pay for research services.
The Board noted that the growth of fund assets over time across the complex allows Fidelity to reinvest in the development of services designed to enhance the value and convenience of the Fidelity funds as investment vehicles. These services include 24-hour access to account information and market information through telephone representatives and over the Internet, investor education materials and asset allocation tools, and the expanded availability of Fidelity Investor Centers.
The Board noted that it and the boards of certain other Fidelity funds had formed an ad hoc Committee on Transfer Agency Fees to review the variety of transfer agency fee structures throughout the industry and Fidelity's competitive positioning with respect to industry participants.
Investment in a Large Fund Family. The Board considered the benefits to shareholders of investing in a Fidelity fund, including the benefits of investing in a fund that is part of a large family of funds offering a variety of investment disciplines and providing a large variety of mutual fund investor services. The Board noted that Fidelity had taken, or had made recommendations that resulted in the Fidelity funds taking, a number of actions over the previous year that benefited particular funds, including: (i) continuing to dedicate additional resources to Fidelity's investment research process, which includes meetings with management of issuers of securities in which the funds invest, and to the support of the senior management team that oversees asset management; (ii) continuing efforts to enhance Fidelity's global research capabilities; (iii) launching new funds and making other enhancements to meet client needs; (iv) launching new share classes of existing funds; (v) eliminating purchase minimums and broadening eligibility requirements for certain funds and share classes; (vi) reducing management fees and total expenses for certain growth equity funds and index funds; (vii) lowering expense caps for certain existing funds and classes, and converting certain voluntary expense caps to contractual caps, to reduce expenses borne by shareholders; (viii) eliminating short-term redemption fees for funds that had such fees; (ix) rationalizing product lines and gaining increased efficiencies from fund mergers and share class consolidations; (x) continuing to develop, acquire and implement systems and technology to improve services to the funds and shareholders, strengthen information security, and increase efficiency; and (xi) continuing to implement enhancements to further strengthen Fidelity's product line to increase investors' probability of success in achieving their investment goals, including retirement income goals.
Investment Performance. The Board considered whether the fund has operated in accordance with its investment objective, as well as its record of compliance with its investment restrictions and its performance history.
The Board took into account discussions that occur at Board meetings throughout the year with representatives of the Investment Advisers about fund investment performance. In this regard the Board noted that as part of regularly scheduled fund reviews and other reports to the Board on fund performance, the Board considers annualized return information for the fund for different time periods, measured against an appropriate securities market index ("benchmark index") and a peer group of funds with similar objectives ("peer group"), if any. In its evaluation of fund investment performance, the Board gave particular attention to information indicating changes in performance of certain Fidelity funds for specific time periods and discussed with the Investment Advisers the reasons for any overperformance or underperformance.
In addition to reviewing absolute and relative fund performance, the Independent Trustees periodically consider the appropriateness of fund performance metrics in evaluating the results achieved. In general, the Independent Trustees believe that fund performance should be evaluated based on net performance (after fees and expenses) of both the highest performing and lowest performing fund share classes, where applicable, compared to appropriate benchmark indices, over appropriate time periods that may include full market cycles, and compared to peer groups, as applicable, over the same periods, taking into account relevant factors including the following: general market conditions; issuer-specific information; and fund cash flows and other factors.
The Independent Trustees recognize that shareholders evaluate performance on a net basis over their own holding periods, for which one-, three-, and five-year periods are often used as a proxy. For this reason, the performance information reviewed by the Board also included net cumulative total return information for the fund and an appropriate benchmark index and peer group for the most recentone-, three-, and five-year periods ended June 30, 2018, as shown below. Returns are shown compared to the 25th percentile (top of box, 75% beaten) and 75th percentile (bottom of box, 25% beaten) of the peer universe. Returns of the benchmark index are "net MA,"
i.e., adjusted for tax withholding rates applicable to U.S.-based funds organized as Massachusetts business trusts.
Fidelity International Value Fund
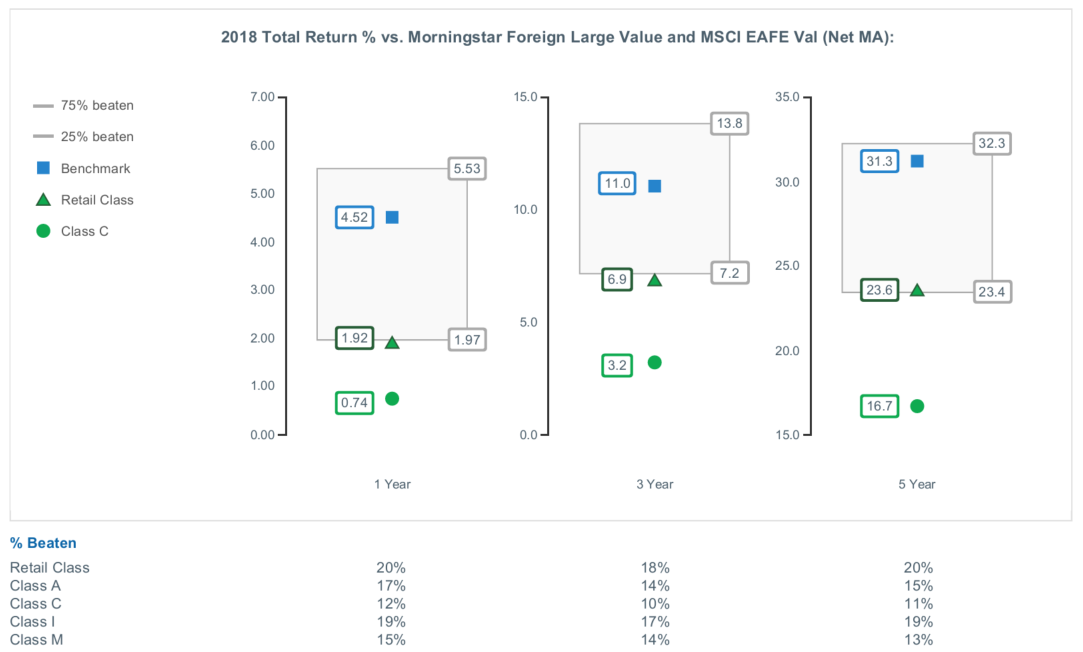
The Board considered the fund's underperformance for different time periods based on the June 30, 2018 data presented above and based on earlier periods ended prior to June 30, 2018. The Board's discussions with FMR regarding underperformance cover topics including, but not limited to: the longer-term track record of a fund's portfolio manager(s); broader trends in the market that may adversely impact a fund's performance; attribution reports on contributors to the fund's underperformance; and the applicable portfolio manager's explanation of his or her underperformance. The Board engages with FMR on steps that might be taken to address a fund's underperformance.
The Board also considered that the fund's management fee is subject to upward or downward adjustment depending upon whether, and to what extent, the fund's investment performance for the performance period (a rolling 36-month period) exceeds, or is exceeded by, a securities index, thus leading to a performance adjustment for the same period. The Board noted that the performance adjustment provides FMR with a strong economic incentive to seek to achieve superior long-term performance for the fund's shareholders and helps to more closely align the interests of FMR and the shareholders of the fund.
Based on its review, the Board concluded that the nature, extent, and quality of services provided to the fund under the Advisory Contracts should continue to benefit the shareholders of the fund.
Competitiveness of Management Fee and Total Expense Ratio. The Board considered the fund's management fee and total expense ratio compared to "mapped groups" of competitive funds and classes created for the purpose of facilitating the Trustees' competitive analysis of management fees and total expenses. Fidelity creates "mapped groups" by combining similar Lipper investment objective categories that have comparable investment mandates. Combining Lipper investment objective categories aids the Board's management fee and total expense ratio comparisons by broadening the competitive group used for comparison.
Management Fee. The Board considered two proprietary management fee comparisons for the 12-month periods (ended June 30 for 2018 and December 31 for prior periods) shown in basis points (BP) in the chart below. The group of Lipper funds used by the Board for management fee comparisons is referred to below as the "Total Mapped Group." The Total Mapped Group comparison focuses on a fund's standing in terms of gross management fees before expense reimbursements or caps, and without giving effect to the fund's performance adjustment, relative to the total universe of funds with comparable investment mandates, regardless of whether their management fee structures also are comparable. Funds with comparable investment mandates offer exposure to similar types of securities. Funds with comparable management fee structures have similar management fee contractual arrangements (
e.g., flat rate charged for advisory services, all-inclusive fee rate,
etc.). "TMG %" represents the percentage of funds in the Total Mapped Group that had management fees that were lower than the fund's. For example, a hypothetical TMG % of 20% would mean that 80% of the funds in the Total Mapped Group had higher, and 20% had lower, management fees than the fund. The fund's actual TMG %s and the number of funds in the Total Mapped Group are in the chart below. The "Asset-Size Peer Group" (ASPG) comparison focuses on a fund's standing relative to a subset of non-Fidelity funds within the Total Mapped Group that are similar in size and management fee structure without taking into account performance adjustments, if any. For example, if a fund is in the first quartile of the ASPG, the fund's management fee ranks in the least expensive or lowest 25% of funds in the ASPG. The ASPG represents at least 15% of the funds in the Total Mapped Group with comparable asset size and management fee structures, subject to a minimum of 50 funds (or all funds in the Total Mapped Group if fewer than 50). Additional information, such as the ASPG quartile in which the fund's management fee rate ranked and the impact of the fund's performance adjustment, is also included in the chart and was considered by the Board.
Fidelity International Value Fund
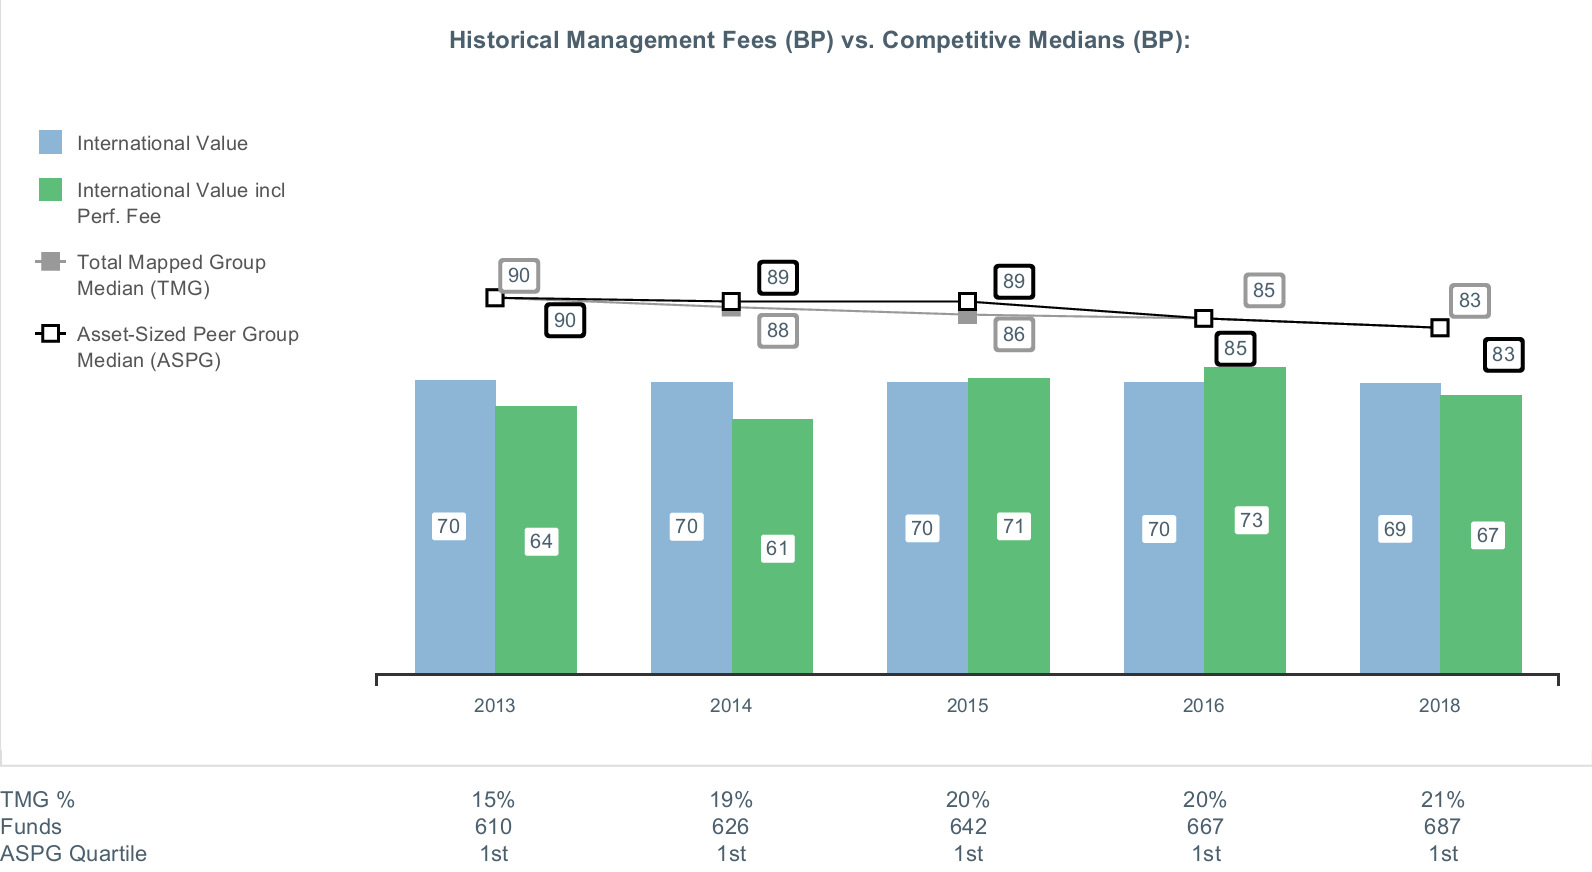
The Board noted that the fund's management fee rate ranked below the median of its Total Mapped Group and below the median of its ASPG for the 12-month period ended June 30, 2018. The Board also noted the effect of the fund's performance adjustment, if any, on the fund's management fee ranking.
The Board noted that it and the boards of other Fidelity funds formed an ad hoc Committee on Group Fee, which meets periodically, to conduct an in-depth review of the "group fee" component of the management fee of funds with such management fee structures. The Committee's focus included the mechanics of the group fee, the competitive landscape of group fee structures, Fidelity funds with no group fee component and investment products not included in group fee assets. The Board also considered that, for funds subject to the group fee, FMR agreed to voluntarily waive fees over a specified period of time in amounts designed to account for assets converted from certain funds to certain collective investment trusts.
The Board also noted that, in 2013, the ad hoc Committee on Management Fees was formed to conduct an in-depth review of the management fee rates of Fidelity's active equity mutual funds. The Committee focused on the following areas: (i) standard fee structures; (ii) research consumption and trading evolution; (iii) management fee competitiveness/profitability by category; and (iv) factors that drive institutional pricing.
Based on its review, the Board concluded that the fund's management fee is fair and reasonable in light of the services that the fund receives and the other factors considered.
Total Expense Ratio. In its review of each class's total expense ratio, the Board considered the fund's management fee rate as well as other fund or class expenses, as applicable, such as transfer agent fees, pricing and bookkeeping fees, fund-paid 12b-1 fees, and custodial, legal, and audit fees. The Board noted the impact of the fund's performance adjustment. The Board also noted that Fidelity may agree to waive fees and expenses from time to time, and the extent to which, if any, it has done so for the fund. As part of its review, the Board also considered the current and historical total expense ratios of each class of the fund compared to competitive fund median expenses. Each class of the fund is compared to those funds and classes in the Total Mapped Group (used by the Board for management fee comparisons) that have a similar sales load structure.
The Board noted that the total expense ratio of each of Class A and the retail class ranked below the competitive median for the 12-month period ended June 30, 2018, and the total expense ratio of each of Class M, Class C, and Class I ranked above the competitive median for the 12-month period ended June 30, 2018. The Board considered that, in general, various factors can affect total expense ratios. The Board noted that the total expense ratio of Class M was above the competitive median primarily because of higher 12b-1 fees on Class M as compared to most competitor funds. Class M has a higher 12b-1 fee, but a lower front-end sales charge, than traditionally priced front-end sales charge classes. The Board considered that Class M is primarily sold load-waived to retirement plans and intermediary wrap programs where its 0.50% 12b-1 fee is comparable to competing no-load, higher 12b-1 fee classes designed specifically for retirement plans and wrap programs. The Board noted that the total expense ratio of Class C was above the competitive median primarily because of its 1.00% 12b-1 fee. The Board noted that, although Class I is categorized by Lipper as an institutional class, Class I has a significantly lower investment minimum than most other funds and classes categorized as institutional. As a result, FMR believes Class I is generally more comparable to retail funds and classes. The Board considered that, when compared to retail funds and classes, Class I would not be above the competitive median for the 12-month period ended June 30, 2018. The Board noted that the fund offers multiple classes, each of which has a different sales load and 12b-1 fee structure, and that the multiple structures are intended to offer a range of pricing options for the intermediary market. The Board also noted that the total expense ratios of the classes vary primarily by the level of their 12b-1 fees, although differences in transfer agent fees may also cause expenses to vary from class to class.
The Board further considered that FMR has contractually agreed to reimburse Class A, Class M, Class C, Class I, Class Z, and the retail class of the fund to the extent that total operating expenses, with certain exceptions, as a percentage of their respective average net assets, exceed 1.45%, 1.70%, 2.20%, 1.20%, 1.05%, and 1.20% through February 28, 2020.
Fees Charged to Other Fidelity Clients. The Board also considered Fidelity fee structures and other information with respect to clients of Fidelity, such as other funds advised or subadvised by Fidelity, pension plan clients, and other institutional clients with similar mandates. The Board noted that a joint ad hoc committee created by it and the boards of other Fidelity funds periodically reviews and compares Fidelity's institutional investment advisory business with its business of providing services to the Fidelity funds and also noted the most recent findings of the committee. The Board noted that the committee's review included a consideration of the differences in services provided, fees charged, and costs incurred, as well as competition in the markets serving the different categories of clients.
Based on its review of total expense ratios and fees charged to other Fidelity clients, the Board concluded that the total expense ratio of each class of the fund was reasonable in light of the services that the fund and its shareholders receive and the other factors considered.
Costs of the Services and Profitability. The Board considered the revenues earned and the expenses incurred by Fidelity in conducting the business of developing, marketing, distributing, managing, administering and servicing the fund and servicing the fund's shareholders. The Board also considered the level of Fidelity's profits in respect of all the Fidelity funds.
On an annual basis, Fidelity presents to the Board information about the profitability of its relationships with the fund. Fidelity calculates profitability information for each fund, as well as aggregate profitability information for groups of Fidelity funds and all Fidelity funds, using a series of detailed revenue and cost allocation methodologies which originate with the books and records of Fidelity on which Fidelity's audited financial statements are based. The Audit Committee of the Board reviews any significant changes from the prior year's methodologies.
PricewaterhouseCoopers LLP (PwC), auditor to Fidelity and certain Fidelity funds, has been engaged annually by the Board as part of the Board's assessment of Fidelity's profitability analysis. PwC's engagement includes the review and assessment of the methodologies used by Fidelity in determining the revenues and expenses attributable to Fidelity's mutual fund business, and completion of agreed-upon procedures in respect of the mathematical accuracy of the fund profitability information and its conformity to established allocation methodologies. After considering PwC's reports issued under the engagement and information provided by Fidelity, the Board concluded that while other allocation methods may also be reasonable, Fidelity's profitability methodologies are reasonable in all material respects.
The Board also reviewed Fidelity's non-fund businesses and potential indirect benefits such businesses may have received as a result of their association with Fidelity's mutual fund business (i.e., fall-out benefits) as well as cases where Fidelity's affiliates may benefit from the fund's business. The Board noted that changes to fall-out benefits year-over-year reflect business developments at Fidelity's various businesses.
The Board considered the costs of the services provided by and the profits realized by Fidelity in connection with the operation of the fund and was satisfied that the profitability was not excessive.
Economies of Scale. The Board considered whether there have been economies of scale in respect of the management of the Fidelity funds, whether the Fidelity funds (including the fund) have appropriately benefited from any such economies of scale, and whether there is potential for realization of any further economies of scale. The Board considered the extent to which the fund will benefit from economies of scale as assets grow through increased services to the fund, through waivers or reimbursements, or through fee or expense ratio reductions. The Board also noted that a committee (the Economies of Scale Committee) created by it and the boards of other Fidelity funds periodically analyzes whether Fidelity attains economies of scale in respect of the management and servicing of the Fidelity funds, whether the Fidelity funds have appropriately benefited from such economies of scale, and whether there is potential for realization of any further economies of scale.
The Board recognized that the fund's management contract incorporates a "group fee" structure, which provides for lower group fee rates as total group assets increase, and for higher group fee rates as total group assets decrease (with "group assets" defined to include fund assets under FMR's management plus the assets of sector funds previously under FMR's management). FMR calculates the group fee rates based on a tiered asset "breakpoint" schedule that varies based on asset class. The Board considered that the group fee is designed to deliver the benefits of economies of scale to fund shareholders when total Fidelity fund assets increase, even if assets of any particular fund are unchanged or have declined, because some portion of Fidelity's costs are attributable to services provided to all Fidelity funds, and all funds benefit if those costs can be allocated among more assets. The Board concluded that, given the group fee structure, fund shareholders will benefit from lower management fees as group assets increase at the fund complex level, regardless of whether Fidelity achieves any such economies of scale.
The Board concluded, taking into account the analysis of the Economies of Scale Committee, that economies of scale, if any, are being appropriately shared between fund shareholders and Fidelity.
Additional Information Requested by the Board. In order to develop fully the factual basis for consideration of the Fidelity funds' advisory contracts, the Board requested and received additional information on certain topics, including: (i) fund performance trends, in particular the underperformance of certain funds, and Fidelity's long-term strategies for certain funds; (ii) Fidelity's fund profitability methodology, profitability trends for certain funds, and the impact of certain factors on fund profitability results; (iii) metrics for evaluating index fund and ETF performance and information about ETF trading characteristics; (iv) the methodology with respect to the evaluation of competitive fund data and peer group classifications and fee comparisons; (v) the expense structures for different funds and classes; (vi) information regarding other accounts managed by Fidelity, including collective investment trusts; and (vii) Fidelity's philosophies and strategies for evaluating funds and classes with lower or declining asset levels.
Based on its evaluation of all of the conclusions noted above, and after considering all factors it believed relevant, the Board concluded that the advisory fee arrangements are fair and reasonable, and that the fund's Advisory Contracts should be renewed.
FIV-SANN-0619
1.827485.112
Fidelity® Global Commodity Stock Fund
Semi-Annual Report April 30, 2019 Includes Fidelity and Fidelity Advisor share classes |
|
Beginning on January 1, 2021, as permitted by regulations adopted by the Securities and Exchange Commission, paper copies of a fund’s shareholder reports will no longer be sent by mail, unless you specifically request paper copies of the reports from the fund or from your financial intermediary, such as a financial advisor, broker-dealer or bank. Instead, the reports will be made available on a website, and you will be notified by mail each time a report is posted and provided with a website link to access the report.
If you already elected to receive shareholder reports electronically, you will not be affected by this change and you need not take any action. You may elect to receive shareholder reports and other communications from a fund electronically, by contacting your financial intermediary. For Fidelity customers, visit Fidelity's web site or call Fidelity using the contact information listed below.
You may elect to receive all future reports in paper free of charge. If you wish to continue receiving paper copies of your shareholder reports, you may contact your financial intermediary or, if you are a Fidelity customer, visit Fidelity’s website, or call Fidelity at the applicable toll-free number listed below. Your election to receive reports in paper will apply to all funds held with the fund complex/your financial intermediary.
| Account Type | Website | Phone Number |
| Brokerage, Mutual Fund, or Annuity Contracts: | fidelity.com/mailpreferences | 1-800-343-3548 |
| Employer Provided Retirement Accounts: | netbenefits.fidelity.com/preferences (choose 'no' under Required Disclosures to continue to print) | 1-800-343-0860 |
| Advisor Sold Accounts Serviced Through Your Financial Intermediary: | Contact Your Financial Intermediary | Your Financial Intermediary's phone number |
| Advisor Sold Accounts Serviced by Fidelity: | institutional.fidelity.com | 1-877-208-0098 |
Contents
To view a fund's proxy voting guidelines and proxy voting record for the 12-month period ended June 30, visit http://www.fidelity.com/proxyvotingresults or visit the Securities and Exchange Commission's (SEC) web site at http://www.sec.gov.
You may also call 1-800-544-8544 if you’re an individual investing directly with Fidelity, call 1-800-835-5092 if you’re a plan sponsor or participant with Fidelity as your recordkeeper or call 1-877-208-0098 on institutional accounts or if you’re an advisor or invest through one to request a free copy of the proxy voting guidelines.
Standard & Poor's, S&P and S&P 500 are registered service marks of The McGraw-Hill Companies, Inc. and have been licensed for use by Fidelity Distributors Corporation.
Other third-party marks appearing herein are the property of their respective owners.
All other marks appearing herein are registered or unregistered trademarks or service marks of FMR LLC or an affiliated company. © 2019 FMR LLC. All rights reserved.
This report and the financial statements contained herein are submitted for the general information of the shareholders of the Fund. This report is not authorized for distribution to prospective investors in the Fund unless preceded or accompanied by an effective prospectus.
A fund files its complete schedule of portfolio holdings with the SEC for the first and third quarters of each fiscal year on Form N-PORT. Forms N-PORT are available on the SEC’s web site at http://www.sec.gov. A fund's Forms N-PORT may be reviewed and copied at the SEC’s Public Reference Room in Washington, DC. Information regarding the operation of the SEC's Public Reference Room may be obtained by calling 1-800-SEC-0330.
For a complete list of a fund's portfolio holdings, view the most recent holdings listing, semiannual report, or annual report on Fidelity's web site at http://www.fidelity.com, http://www.institutional.fidelity.com, or http://www.401k.com, as applicable.
NOT FDIC INSURED •MAY LOSE VALUE •NO BANK GUARANTEE
Neither the Fund nor Fidelity Distributors Corporation is a bank.
Investment Summary (Unaudited)
Top Ten Stocks as of April 30, 2019
| | % of fund's net assets |
| Nutrien Ltd. | 5.8 |
| Rio Tinto PLC | 5.5 |
| Exxon Mobil Corp. | 4.7 |
| Archer Daniels Midland Co. | 4.2 |
| Chevron Corp. | 4.2 |
| BHP Billiton Ltd. | 3.8 |
| Royal Dutch Shell PLC Class A (United Kingdom) | 3.7 |
| UPM-Kymmene Corp. | 3.3 |
| Total SA | 3.2 |
| CF Industries Holdings, Inc. | 3.0 |
| | 41.4 |
Top Sectors (% of fund's net assets)
| As of April 30, 2019 |
| | Metals | 35.3% |
| | Energy | 33.0% |
| | Agriculture | 27.8% |
| | Other | 2.5% |
| | Short-Term Investments and Net Other Assets | 1.4% |

Schedule of Investments April 30, 2019 (Unaudited)
Showing Percentage of Net Assets
| Common Stocks - 97.4% | | | |
| | | Shares | Value |
| Chemicals - 12.7% | | | |
| Fertilizers & Agricultural Chemicals - 12.7% | | | |
| CF Industries Holdings, Inc. | | 370,060 | $16,571,287 |
| FMC Corp. | | 122,200 | 9,661,132 |
| Israel Chemicals Ltd. | | 598,600 | 3,169,396 |
| Nutrien Ltd. | | 586,983 | 31,835,622 |
| The Mosaic Co. | | 308,561 | 8,056,528 |
| | | | 69,293,965 |
| Construction Materials - 1.3% | | | |
| Construction Materials - 1.3% | | | |
| Eagle Materials, Inc. | | 75,500 | 6,863,705 |
| Containers & Packaging - 1.3% | | | |
| Metal & Glass Containers - 1.3% | | | |
| Crown Holdings, Inc. (a) | | 123,400 | 7,173,242 |
| Food Products - 6.4% | | | |
| Agricultural Products - 6.4% | | | |
| Archer Daniels Midland Co. | | 513,700 | 22,911,020 |
| Bunge Ltd. | | 171,000 | 8,962,110 |
| Darling International, Inc. (a) | | 127,200 | 2,774,232 |
| | | | 34,647,362 |
| Metals & Mining - 35.1% | | | |
| Copper - 2.7% | | | |
| Antofagasta PLC | | 272,200 | 3,222,935 |
| First Quantum Minerals Ltd. | | 405,324 | 4,281,059 |
| Freeport-McMoRan, Inc. | | 412,600 | 5,079,106 |
| Lundin Mining Corp. | | 388,200 | 2,083,420 |
| | | | 14,666,520 |
| Diversified Metals & Mining - 17.8% | | | |
| Alcoa Corp. (a) | | 120,600 | 3,217,608 |
| Anglo American PLC (United Kingdom) | | 439,851 | 11,364,631 |
| BHP Billiton Ltd. | | 785,897 | 20,796,674 |
| BHP Billiton PLC | | 684,844 | 16,165,452 |
| Boliden AB | | 80,700 | 2,401,626 |
| Grupo Mexico SA de CV Series B | | 742,620 | 2,177,592 |
| Ivanhoe Mines Ltd. (a) | | 767,900 | 1,868,593 |
| MMC Norilsk Nickel PJSC | | 23,600 | 5,234,934 |
| MMC Norilsk Nickel PJSC sponsored ADR | | 55,400 | 1,229,880 |
| Rio Tinto PLC | | 515,921 | 30,098,351 |
| South32 Ltd. | | 1,141,097 | 2,686,751 |
| | | | 97,242,092 |
| Gold - 5.0% | | | |
| Agnico Eagle Mines Ltd. (Canada) | | 92,900 | 3,847,199 |
| Barrick Gold Corp. (Canada) | | 553,447 | 7,035,308 |
| Franco-Nevada Corp. | | 65,871 | 4,719,681 |
| Kirkland Lake Gold Ltd. | | 39,000 | 1,260,797 |
| Newcrest Mining Ltd. | | 234,152 | 4,128,287 |
| Newmont Goldcorp Corp. | | 194,700 | 6,047,382 |
| | | | 27,038,654 |
| Precious Metals & Minerals - 0.6% | | | |
| Alrosa Co. Ltd. | | 2,263,900 | 3,299,407 |
| Silver - 0.8% | | | |
| Wheaton Precious Metals Corp. | | 199,900 | 4,324,179 |
| Steel - 8.2% | | | |
| Allegheny Technologies, Inc. (a) | | 113,300 | 2,823,436 |
| ArcelorMittal SA Class A unit (b) | | 249,902 | 5,457,860 |
| Fortescue Metals Group Ltd. | | 1,058,792 | 5,336,727 |
| Hyundai Steel Co. | | 27,439 | 1,091,422 |
| JFE Holdings, Inc. | | 188,000 | 3,215,046 |
| Nippon Steel & Sumitomo Metal Corp. | | 141,700 | 2,519,295 |
| Nucor Corp. | | 116,792 | 6,665,319 |
| POSCO | | 23,004 | 5,053,108 |
| Steel Dynamics, Inc. | | 137,600 | 4,359,168 |
| Tata Steel Ltd. | | 80,000 | 640,028 |
| Thyssenkrupp AG | | 93,500 | 1,314,540 |
| Vale SA | | 421,400 | 5,384,239 |
| Voestalpine AG | | 30,700 | 985,820 |
| | | | 44,846,008 |
|
| TOTAL METALS & MINING | | | 191,416,860 |
|
| Oil, Gas & Consumable Fuels - 31.9% | | | |
| Integrated Oil & Gas - 23.4% | | | |
| BP PLC | | 2,264,432 | 16,466,278 |
| Chevron Corp. | | 189,200 | 22,715,352 |
| Equinor ASA | | 151,300 | 3,375,005 |
| Exxon Mobil Corp. | | 321,200 | 25,785,936 |
| Gazprom OAO | | 1,429,600 | 3,632,941 |
| Lukoil PJSC sponsored ADR | | 57,100 | 4,840,938 |
| Occidental Petroleum Corp. | | 66,900 | 3,939,072 |
| Royal Dutch Shell PLC: | | | |
| Class A (United Kingdom) | | 626,524 | 19,961,945 |
| Class B (United Kingdom) | | 58,582 | 1,890,638 |
| Suncor Energy, Inc. | | 225,832 | 7,447,382 |
| Total SA (b) | | 318,981 | 17,732,393 |
| | | | 127,787,880 |
| Oil & Gas Exploration & Production - 8.3% | | | |
| Cabot Oil & Gas Corp. | | 96,600 | 2,500,974 |
| Canadian Natural Resources Ltd. | | 92,500 | 2,777,002 |
| CNOOC Ltd. sponsored ADR (b) | | 22,300 | 4,051,464 |
| Concho Resources, Inc. | | 30,800 | 3,553,704 |
| ConocoPhillips Co. | | 162,800 | 10,275,936 |
| Devon Energy Corp. | | 43,500 | 1,398,090 |
| Diamondback Energy, Inc. | | 28,400 | 3,021,476 |
| EOG Resources, Inc. | | 28,100 | 2,699,005 |
| Hess Corp. | | 20,400 | 1,308,048 |
| Lundin Petroleum AB | | 49,300 | 1,605,515 |
| Noble Energy, Inc. | | 88,600 | 2,397,516 |
| NOVATEK OAO GDR (Reg. S) | | 6,600 | 1,271,820 |
| Pioneer Natural Resources Co. | | 49,210 | 8,191,497 |
| | | | 45,052,047 |
| Oil & Gas Refining & Marketing - 0.2% | | | |
| Neste Oyj | | 31,000 | 1,023,617 |
|
| TOTAL OIL, GAS & CONSUMABLE FUELS | | | 173,863,544 |
|
| Paper & Forest Products - 8.7% | | | |
| Forest Products - 0.5% | | | |
| Quintis Ltd. (a)(c) | | 413,280 | 3 |
| Svenska Cellulosa AB (SCA) (B Shares) | | 293,200 | 2,559,593 |
| | | | 2,559,596 |
| Paper Products - 8.2% | | | |
| Mondi PLC | | 269,500 | 5,905,748 |
| Nine Dragons Paper (Holdings) Ltd. | | 2,600,000 | 2,402,866 |
| Oji Holdings Corp. | | 406,000 | 2,427,362 |
| Sappi Ltd. | | 352,406 | 1,679,625 |
| Stora Enso Oyj (R Shares) | | 618,100 | 7,670,933 |
| Suzano Papel e Celulose SA | | 632,445 | 6,569,454 |
| UPM-Kymmene Corp. (b) | | 640,400 | 18,035,826 |
| | | | 44,691,814 |
|
| TOTAL PAPER & FOREST PRODUCTS | | | 47,251,410 |
|
| TOTAL COMMON STOCKS | | | |
| (Cost $585,808,902) | | | 530,510,088 |
|
| Nonconvertible Preferred Stocks - 1.2% | | | |
| Metals & Mining - 0.2% | | | |
| Steel - 0.2% | | | |
| Gerdau SA sponsored ADR (b) | | 268,600 | 961,588 |
| Oil, Gas & Consumable Fuels - 1.0% | | | |
| Integrated Oil & Gas - 1.0% | | | |
| Petroleo Brasileiro SA - Petrobras (PN) sponsored ADR (non-vtg.) | | 404,300 | 5,579,340 |
| TOTAL NONCONVERTIBLE PREFERRED STOCKS | | | |
| (Cost $5,906,131) | | | 6,540,928 |
|
| Money Market Funds - 1.0% | | | |
| Fidelity Cash Central Fund, 2.49% (d) | | 1,077,241 | 1,077,457 |
| Fidelity Securities Lending Cash Central Fund 2.49% (d)(e) | | 4,327,516 | 4,327,949 |
| TOTAL MONEY MARKET FUNDS | | | |
| (Cost $5,405,620) | | | 5,405,406 |
| TOTAL INVESTMENT IN SECURITIES - 99.6% | | | |
| (Cost $597,120,653) | | | 542,456,422 |
| NET OTHER ASSETS (LIABILITIES) - 0.4% | | | 2,054,587 |
| NET ASSETS - 100% | | | $544,511,009 |
Legend
(a) Non-income producing
(b) Security or a portion of the security is on loan at period end.
(c) Level 3 security
(d) Affiliated fund that is generally available only to investment companies and other accounts managed by Fidelity Investments. The rate quoted is the annualized seven-day yield of the fund at period end. A complete unaudited listing of the fund's holdings as of its most recent quarter end is available upon request. In addition, each Fidelity Central Fund's financial statements are available on the SEC's website or upon request.
(e) Investment made with cash collateral received from securities on loan.
Affiliated Central Funds
Information regarding fiscal year to date income earned by the Fund from investments in Fidelity Central Funds is as follows:
| Fund | Income earned |
| Fidelity Cash Central Fund | $118,580 |
| Fidelity Securities Lending Cash Central Fund | 140,058 |
| Total | $258,638 |
Amounts in the income column in the above table include any capital gain distributions from underlying funds, which are presented in the corresponding line-item in the Statement of Operations, if applicable.
Investment Valuation
The following is a summary of the inputs used, as of April 30, 2019, involving the Fund's assets and liabilities carried at fair value. The inputs or methodology used for valuing securities may not be an indication of the risk associated with investing in those securities. For more information on valuation inputs, and their aggregation into the levels used below, please refer to the Investment Valuation section in the accompanying Notes to Financial Statements.
| | Valuation Inputs at Reporting Date: |
| Description | Total | Level 1 | Level 2 | Level 3 |
| Investments in Securities: | | | | |
| Common Stocks | $530,510,088 | $392,145,571 | $138,364,514 | $3 |
| Nonconvertible Preferred Stocks | 6,540,928 | 6,540,928 | -- | -- |
| Money Market Funds | 5,405,406 | 5,405,406 | -- | -- |
| Total Investments in Securities: | $542,456,422 | $404,091,905 | $138,364,514 | $3 |
Other Information
Distribution of investments by country or territory of incorporation, as a percentage of Total Net Assets, is as follows (Unaudited):
| United States of America | 36.3% |
| United Kingdom | 19.3% |
| Canada | 13.1% |
| Australia | 6.1% |
| Finland | 4.9% |
| Russia | 3.6% |
| Brazil | 3.4% |
| France | 3.2% |
| Bermuda | 2.1% |
| Japan | 1.6% |
| Sweden | 1.2% |
| Korea (South) | 1.1% |
| Luxembourg | 1.0% |
| Others (Individually Less Than 1%) | 3.1% |
| | 100.0% |
See accompanying notes which are an integral part of the financial statements.
Financial Statements
Statement of Assets and Liabilities
| | | April 30, 2019 (Unaudited) |
| Assets | | |
Investment in securities, at value (including securities loaned of $4,123,286) — See accompanying schedule:
Unaffiliated issuers (cost $591,715,033) | $537,051,016 | |
| Fidelity Central Funds (cost $5,405,620) | 5,405,406 | |
| Total Investment in Securities (cost $597,120,653) | | $542,456,422 |
| Foreign currency held at value (cost $71,835) | | 71,835 |
| Receivable for investments sold | | 7,389,767 |
| Receivable for fund shares sold | | 149,061 |
| Dividends receivable | | 1,177,738 |
| Distributions receivable from Fidelity Central Funds | | 67,902 |
| Prepaid expenses | | 301 |
| Other receivables | | 29,725 |
| Total assets | | 551,342,751 |
| Liabilities | | |
| Payable for investments purchased | $1,037,538 | |
| Payable for fund shares redeemed | 943,286 | |
| Accrued management fee | 322,998 | |
| Distribution and service plan fees payable | 18,870 | |
| Other affiliated payables | 143,553 | |
| Other payables and accrued expenses | 37,765 | |
| Collateral on securities loaned | 4,327,732 | |
| Total liabilities | | 6,831,742 |
| Net Assets | | $544,511,009 |
| Net Assets consist of: | | |
| Paid in capital | | $659,945,411 |
| Total distributable earnings (loss) | | (115,434,402) |
| Net Assets | | $544,511,009 |
| Net Asset Value and Maximum Offering Price | | |
| Class A: | | |
| Net Asset Value and redemption price per share ($27,591,840 ÷ 2,222,849 shares) | | $12.41 |
| Maximum offering price per share (100/94.25 of $12.41) | | $13.17 |
| Class M: | | |
| Net Asset Value and redemption price per share ($6,251,313 ÷ 504,005 shares) | | $12.40 |
| Maximum offering price per share (100/96.50 of $12.40) | | $12.85 |
| Class C: | | |
| Net Asset Value and offering price per share ($11,960,427 ÷ 972,381 shares)(a) | | $12.30 |
| Global Commodity Stock: | | |
| Net Asset Value, offering price and redemption price per share ($375,443,139 ÷ 30,258,923 shares) | | $12.41 |
| Class I: | | |
| Net Asset Value, offering price and redemption price per share ($113,562,995 ÷ 9,151,518 shares) | | $12.41 |
| Class Z: | | |
| Net Asset Value, offering price and redemption price per share ($9,701,295 ÷ 782,371 shares) | | $12.40 |
(a) Redemption price per share is equal to net asset value less any applicable contingent deferred sales charge.
See accompanying notes which are an integral part of the financial statements.
Statement of Operations
| | | Six months ended April 30, 2019 (Unaudited) |
| Investment Income | | |
| Dividends | | $12,612,329 |
| Income from Fidelity Central Funds | | 258,638 |
| Income before foreign taxes withheld | | 12,870,967 |
| Less foreign taxes withheld | | (678,095) |
| Total income | | 12,192,872 |
| Expenses | | |
| Management fee | $1,883,159 | |
| Transfer agent fees | 701,495 | |
| Distribution and service plan fees | 141,728 | |
| Accounting and security lending fees | 140,252 | |
| Custodian fees and expenses | 18,113 | |
| Independent trustees' fees and expenses | 1,537 | |
| Registration fees | 104,762 | |
| Audit | 38,861 | |
| Legal | 799 | |
| Miscellaneous | 1,806 | |
| Total expenses before reductions | 3,032,512 | |
| Expense reductions | (31,027) | |
| Total expenses after reductions | | 3,001,485 |
| Net investment income (loss) | | 9,191,387 |
| Realized and Unrealized Gain (Loss) | | |
| Net realized gain (loss) on: | | |
| Investment securities: | | |
| Unaffiliated issuers | (33,793,572) | |
| Fidelity Central Funds | (155) | |
| Foreign currency transactions | 11,641 | |
| Total net realized gain (loss) | | (33,782,086) |
| Change in net unrealized appreciation (depreciation) on: | | |
| Investment securities: | | |
| Unaffiliated issuers | 34,492,068 | |
| Fidelity Central Funds | 62 | |
| Assets and liabilities in foreign currencies | (3,495) | |
| Total change in net unrealized appreciation (depreciation) | | 34,488,635 |
| Net gain (loss) | | 706,549 |
| Net increase (decrease) in net assets resulting from operations | | $9,897,936 |
See accompanying notes which are an integral part of the financial statements.
Statement of Changes in Net Assets
| | Six months ended April 30, 2019 (Unaudited) | Year ended October 31, 2018 |
| Increase (Decrease) in Net Assets | | |
| Operations | | |
| Net investment income (loss) | $9,191,387 | $10,318,695 |
| Net realized gain (loss) | (33,782,086) | 33,085,884 |
| Change in net unrealized appreciation (depreciation) | 34,488,635 | (46,889,653) |
| Net increase (decrease) in net assets resulting from operations | 9,897,936 | (3,485,074) |
| Distributions to shareholders | (11,167,623) | (7,402,151) |
| Share transactions - net increase (decrease) | (2,132,980) | 129,504,630 |
| Redemption fees | – | 181 |
| Total increase (decrease) in net assets | (3,402,667) | 118,617,586 |
| Net Assets | | |
| Beginning of period | 547,913,676 | 429,296,090 |
| End of period | $544,511,009 | $547,913,676 |
See accompanying notes which are an integral part of the financial statements.
Financial Highlights
Fidelity Global Commodity Stock Fund Class A
| | Six months ended (Unaudited) April 30, | Years endedOctober 31, | | | | |
| | 2019 | 2018 | 2017 | 2016 | 2015 | 2014 |
| Selected Per–Share Data | | | | | | |
| Net asset value, beginning of period | $12.42 | $12.56 | $10.73 | $10.05 | $13.25 | $14.17 |
| Income from Investment Operations | | | | | | |
| Net investment income (loss)A | .19 | .21 | .12 | .11 | .22 | .15 |
| Net realized and unrealized gain (loss) | .02 | (.22) | 1.86 | .79 | (3.25) | (.91) |
| Total from investment operations | .21 | (.01) | 1.98 | .90 | (3.03) | (.76) |
| Distributions from net investment income | (.20) | (.09) | (.08) | (.21) | (.14) | (.15) |
| Distributions from net realized gain | (.02) | (.05) | (.07) | (.01) | (.03) | (.01) |
| Total distributions | (.22) | (.13)B | (.15) | (.22) | (.17) | (.16) |
| Redemption fees added to paid in capitalA | – | –C | –C | –C | –C | –C |
| Net asset value, end of period | $12.41 | $12.42 | $12.56 | $10.73 | $10.05 | $13.25 |
| Total ReturnD,E,F | 1.78% | (.05)% | 18.53% | 9.29% | (23.16)% | (5.41)% |
| Ratios to Average Net AssetsG,H | | | | | | |
| Expenses before reductions | 1.30%I | 1.28% | 1.33% | 1.38% | 1.34% | 1.35% |
| Expenses net of fee waivers, if any | 1.30%I | 1.28% | 1.33% | 1.38% | 1.34% | 1.35% |
| Expenses net of all reductions | 1.29%I | 1.27% | 1.32% | 1.37% | 1.34% | 1.35% |
| Net investment income (loss) | 3.17%I | 1.55% | 1.07% | 1.18% | 1.85% | 1.05% |
| Supplemental Data | | | | | | |
| Net assets, end of period (000 omitted) | $27,592 | $27,258 | $29,920 | $34,791 | $31,391 | $51,586 |
| Portfolio turnover rateJ | 73%I | 70% | 81% | 85% | 77% | 75% |
A Calculated based on average shares outstanding during the period.
B Total distributions of $.13 per share is comprised of distributions from net investment income of $.086 and distributions from net realized gain of $.047 per share.
C Amount represents less than $.005 per share.
D Total returns for periods of less than one year are not annualized.
E Total returns would have been lower if certain expenses had not been reduced during the applicable periods shown.
F Total returns do not include the effect of the sales charges.
G Fees and expenses of any underlying Fidelity Central Funds are not included in the Fund's expense ratio. The Fund indirectly bears its proportionate share of the expenses of any underlying Fidelity Central Funds.
H Expense ratios reflect operating expenses of the class. Expenses before reductions do not reflect amounts reimbursed by the investment adviser or reductions from brokerage service arrangements or reductions from other expense offset arrangements and do not represent the amount paid by the class during periods when reimbursements or reductions occur. Expenses net of fee waivers reflect expenses after reimbursement by the investment adviser but prior to reductions from brokerage service arrangements or other expense offset arrangements. Expenses net of all reductions represent the net expenses paid by the class.
I Annualized
J Amount does not include the portfolio activity of any underlying Fidelity Central Funds.
See accompanying notes which are an integral part of the financial statements.
Fidelity Global Commodity Stock Fund Class M
| | Six months ended (Unaudited) April 30, | Years endedOctober 31, | | | | |
| | 2019 | 2018 | 2017 | 2016 | 2015 | 2014 |
| Selected Per–Share Data | | | | | | |
| Net asset value, beginning of period | $12.39 | $12.53 | $10.72 | $10.02 | $13.21 | $14.13 |
| Income from Investment Operations | | | | | | |
| Net investment income (loss)A | .17 | .16 | .09 | .09 | .19 | .11 |
| Net realized and unrealized gain (loss) | .02 | (.20) | 1.84 | .79 | (3.25) | (.90) |
| Total from investment operations | .19 | (.04) | 1.93 | .88 | (3.06) | (.79) |
| Distributions from net investment income | (.16) | (.06) | (.05) | (.17) | (.10) | (.11) |
| Distributions from net realized gain | (.02) | (.05) | (.07) | (.01) | (.03) | (.01) |
| Total distributions | (.18) | (.10)B | (.12) | (.18) | (.13) | (.13)C |
| Redemption fees added to paid in capitalA | – | –D | –D | –D | –D | –D |
| Net asset value, end of period | $12.40 | $12.39 | $12.53 | $10.72 | $10.02 | $13.21 |
| Total ReturnE,F,G | 1.60% | (.30)% | 18.09% | 9.08% | (23.40)% | (5.65)% |
| Ratios to Average Net AssetsH,I | | | | | | |
| Expenses before reductions | 1.61%J | 1.59% | 1.62% | 1.65% | 1.63% | 1.62% |
| Expenses net of fee waivers, if any | 1.61%J | 1.59% | 1.62% | 1.65% | 1.63% | 1.62% |
| Expenses net of all reductions | 1.60%J | 1.58% | 1.61% | 1.64% | 1.62% | 1.62% |
| Net investment income (loss) | 2.86%J | 1.24% | .78% | .90% | 1.57% | .78% |
| Supplemental Data | | | | | | |
| Net assets, end of period (000 omitted) | $6,251 | $7,200 | $6,876 | $6,068 | $6,335 | $9,867 |
| Portfolio turnover rateK | 73%J | 70% | 81% | 85% | 77% | 75% |
A Calculated based on average shares outstanding during the period.
B Total distributions of $.10 per share is comprised of distributions from net investment income of $.055 and distributions from net realized gain of $.047 per share.
C Total distributions of $.13 per share is comprised of distributions from net investment income of $.113 and distributions from net realized gain of $.013 per share.
D Amount represents less than $.005 per share.
E Total returns for periods of less than one year are not annualized.
F Total returns would have been lower if certain expenses had not been reduced during the applicable periods shown.
G Total returns do not include the effect of the sales charges.
H Fees and expenses of any underlying Fidelity Central Funds are not included in the Fund's expense ratio. The Fund indirectly bears its proportionate share of the expenses of any underlying Fidelity Central Funds.
I Expense ratios reflect operating expenses of the class. Expenses before reductions do not reflect amounts reimbursed by the investment adviser or reductions from brokerage service arrangements or reductions from other expense offset arrangements and do not represent the amount paid by the class during periods when reimbursements or reductions occur. Expenses net of fee waivers reflect expenses after reimbursement by the investment adviser but prior to reductions from brokerage service arrangements or other expense offset arrangements. Expenses net of all reductions represent the net expenses paid by the class.
J Annualized
K Amount does not include the portfolio activity of any underlying Fidelity Central Funds.
See accompanying notes which are an integral part of the financial statements.
Fidelity Global Commodity Stock Fund Class C
| | Six months ended (Unaudited) April 30, | Years endedOctober 31, | | | | |
| | 2019 | 2018 | 2017 | 2016 | 2015 | 2014 |
| Selected Per–Share Data | | | | | | |
| Net asset value, beginning of period | $12.26 | $12.39 | $10.61 | $9.92 | $13.06 | $13.96 |
| Income from Investment Operations | | | | | | |
| Net investment income (loss)A | .15 | .11 | .04 | .04 | .13 | .04 |
| Net realized and unrealized gain (loss) | .01 | (.19) | 1.82 | .78 | (3.22) | (.89) |
| Total from investment operations | .16 | (.08) | 1.86 | .82 | (3.09) | (.85) |
| Distributions from net investment income | (.11) | – | (.01) | (.12) | (.03) | (.03) |
| Distributions from net realized gain | (.02) | (.05) | (.07) | (.01) | (.03) | (.01) |
| Total distributions | (.12)B | (.05) | (.08) | (.13) | (.05)C | (.05)D |
| Redemption fees added to paid in capitalA | – | –E | –E | –E | –E | –E |
| Net asset value, end of period | $12.30 | $12.26 | $12.39 | $10.61 | $9.92 | $13.06 |
| Total ReturnF,G,H | 1.40% | (.67)% | 17.59% | 8.46% | (23.74)% | (6.13)% |
| Ratios to Average Net AssetsI,J | | | | | | |
| Expenses before reductions | 2.03%K | 2.00% | 2.07% | 2.13% | 2.12% | 2.11% |
| Expenses net of fee waivers, if any | 2.02%K | 1.99% | 2.07% | 2.13% | 2.12% | 2.11% |
| Expenses net of all reductions | 2.02%K | 1.98% | 2.06% | 2.12% | 2.11% | 2.11% |
| Net investment income (loss) | 2.44%K | .84% | .33% | .43% | 1.08% | .29% |
| Supplemental Data | | | | | | |
| Net assets, end of period (000 omitted) | $11,960 | $20,793 | $14,289 | $12,620 | $11,274 | $17,659 |
| Portfolio turnover rateL | 73%K | 70% | 81% | 85% | 77% | 75% |
A Calculated based on average shares outstanding during the period.
B Total distributions of $.12 per share is comprised of distributions from net investment income of $.105 and distributions from net realized gain of $.018 per share.
C Total distributions of $.05 per share is comprised of distributions from net investment income of $.025 and distributions from net realized gain of $.026 per share.
D Total distributions of $.05 per share is comprised of distributions from net investment income of $.033 and distributions from net realized gain of $.013 per share.
E Amount represents less than $.005 per share.
F Total returns for periods of less than one year are not annualized.
G Total returns would have been lower if certain expenses had not been reduced during the applicable periods shown.
H Total returns do not include the effect of the contingent deferred sales charge.
I Fees and expenses of any underlying Fidelity Central Funds are not included in the Fund's expense ratio. The Fund indirectly bears its proportionate share of the expenses of any underlying Fidelity Central Funds.
J Expense ratios reflect operating expenses of the class. Expenses before reductions do not reflect amounts reimbursed by the investment adviser or reductions from brokerage service arrangements or reductions from other expense offset arrangements and do not represent the amount paid by the class during periods when reimbursements or reductions occur. Expenses net of fee waivers reflect expenses after reimbursement by the investment adviser but prior to reductions from brokerage service arrangements or other expense offset arrangements. Expenses net of all reductions represent the net expenses paid by the class.
K Annualized
L Amount does not include the portfolio activity of any underlying Fidelity Central Funds.
See accompanying notes which are an integral part of the financial statements.
Fidelity Global Commodity Stock Fund
| | Six months ended (Unaudited) April 30, | Years endedOctober 31, | | | | |
| | 2019 | 2018 | 2017 | 2016 | 2015 | 2014 |
| Selected Per–Share Data | | | | | | |
| Net asset value, beginning of period | $12.44 | $12.59 | $10.77 | $10.09 | $13.31 | $14.24 |
| Income from Investment Operations | | | | | | |
| Net investment income (loss)A | .21 | .23 | .15 | .14 | .25 | .19 |
| Net realized and unrealized gain (loss) | .01 | (.20) | 1.84 | .79 | (3.27) | (.92) |
| Total from investment operations | .22 | .03 | 1.99 | .93 | (3.02) | (.73) |
| Distributions from net investment income | (.23) | (.13) | (.11) | (.24) | (.18) | (.19) |
| Distributions from net realized gain | (.02) | (.05) | (.07) | (.01) | (.03) | (.01) |
| Total distributions | (.25) | (.18) | (.17)B | (.25) | (.20)C | (.20) |
| Redemption fees added to paid in capitalA | – | –D | –D | –D | –D | –D |
| Net asset value, end of period | $12.41 | $12.44 | $12.59 | $10.77 | $10.09 | $13.31 |
| Total ReturnE,F | 1.90% | .23% | 18.65% | 9.62% | (22.97)% | (5.16)% |
| Ratios to Average Net AssetsG,H | | | | | | |
| Expenses before reductions | 1.10%I | 1.08% | 1.10% | 1.13% | 1.12% | 1.11% |
| Expenses net of fee waivers, if any | 1.09%I | 1.08% | 1.10% | 1.13% | 1.12% | 1.11% |
| Expenses net of all reductions | 1.09%I | 1.06% | 1.09% | 1.12% | 1.11% | 1.11% |
| Net investment income (loss) | 3.37%I | 1.75% | 1.30% | 1.43% | 2.08% | 1.29% |
| Supplemental Data | | | | | | |
| Net assets, end of period (000 omitted) | $375,443 | $369,563 | $264,557 | $228,982 | $156,320 | $223,084 |
| Portfolio turnover rateJ | 73%I | 70% | 81% | 85% | 77% | 75% |
A Calculated based on average shares outstanding during the period.
B Total distributions of $.17 per share is comprised of distributions from net investment income of $.105 and distributions from net realized gain of $.068 per share.
C Total distributions of $.20 per share is comprised of distributions from net investment income of $.178 and distributions from net realized gain of $.026 per share.
D Amount represents less than $.005 per share.
E Total returns for periods of less than one year are not annualized.
F Total returns would have been lower if certain expenses had not been reduced during the applicable periods shown.
G Fees and expenses of any underlying Fidelity Central Funds are not included in the Fund's expense ratio. The Fund indirectly bears its proportionate share of the expenses of any underlying Fidelity Central Funds.
H Expense ratios reflect operating expenses of the class. Expenses before reductions do not reflect amounts reimbursed by the investment adviser or reductions from brokerage service arrangements or reductions from other expense offset arrangements and do not represent the amount paid by the class during periods when reimbursements or reductions occur. Expenses net of fee waivers reflect expenses after reimbursement by the investment adviser but prior to reductions from brokerage service arrangements or other expense offset arrangements. Expenses net of all reductions represent the net expenses paid by the class.
I Annualized
J Amount does not include the portfolio activity of any underlying Fidelity Central Funds.
See accompanying notes which are an integral part of the financial statements.
Fidelity Global Commodity Stock Fund Class I
| | Six months ended (Unaudited) April 30, | Years endedOctober 31, | | | | |
| | 2019 | 2018 | 2017 | 2016 | 2015 | 2014 |
| Selected Per–Share Data | | | | | | |
| Net asset value, beginning of period | $12.45 | $12.60 | $10.76 | $10.09 | $13.31 | $14.24 |
| Income from Investment Operations | | | | | | |
| Net investment income (loss)A | .22 | .25 | .17 | .16 | .25 | .19 |
| Net realized and unrealized gain (loss) | .01 | (.21) | 1.86 | .77 | (3.26) | (.92) |
| Total from investment operations | .23 | .04 | 2.03 | .93 | (3.01) | (.73) |
| Distributions from net investment income | (.25) | (.14) | (.12) | (.25) | (.19) | (.19) |
| Distributions from net realized gain | (.02) | (.05) | (.07) | (.01) | (.03) | (.01) |
| Total distributions | (.27) | (.19) | (.19) | (.26) | (.21)B | (.20) |
| Redemption fees added to paid in capitalA | – | –C | –C | –C | –C | –C |
| Net asset value, end of period | $12.41 | $12.45 | $12.60 | $10.76 | $10.09 | $13.31 |
| Total ReturnD,E | 2.00% | .30% | 18.99% | 9.63% | (22.93)% | (5.16)% |
| Ratios to Average Net AssetsF,G | | | | | | |
| Expenses before reductions | .94%H | .93% | .96% | 1.01% | 1.09% | 1.06% |
| Expenses net of fee waivers, if any | .93%H | .93% | .95% | 1.01% | 1.08% | 1.06% |
| Expenses net of all reductions | .93%H | .91% | .94% | 1.00% | 1.08% | 1.06% |
| Net investment income (loss) | 3.53%H | 1.90% | 1.45% | 1.55% | 2.11% | 1.34% |
| Supplemental Data | | | | | | |
| Net assets, end of period (000 omitted) | $113,563 | $117,981 | $113,655 | $70,068 | $24,841 | $23,840 |
| Portfolio turnover rateI | 73%H | 70% | 81% | 85% | 77% | 75% |
A Calculated based on average shares outstanding during the period.
B Total distributions of $.21 per share is comprised of distributions from net investment income of $.186 and distributions from net realized gain of $.026 per share.
C Amount represents less than $.005 per share.
D Total returns for periods of less than one year are not annualized.
E Total returns would have been lower if certain expenses had not been reduced during the applicable periods shown.
F Fees and expenses of any underlying Fidelity Central Funds are not included in the Fund's expense ratio. The Fund indirectly bears its proportionate share of the expenses of any underlying Fidelity Central Funds.
G Expense ratios reflect operating expenses of the class. Expenses before reductions do not reflect amounts reimbursed by the investment adviser or reductions from brokerage service arrangements or reductions from other expense offset arrangements and do not represent the amount paid by the class during periods when reimbursements or reductions occur. Expenses net of fee waivers reflect expenses after reimbursement by the investment adviser but prior to reductions from brokerage service arrangements or other expense offset arrangements. Expenses net of all reductions represent the net expenses paid by the class.
H Annualized
I Amount does not include the portfolio activity of any underlying Fidelity Central Funds.
See accompanying notes which are an integral part of the financial statements.
Fidelity Global Commodity Stock Fund Class Z
| | Six months ended (Unaudited) April 30, | Years endedOctober 31, |
| | 2019 | 2018 A |
| Selected Per–Share Data | | |
| Net asset value, beginning of period | $12.46 | $13.84 |
| Income from Investment Operations | | |
| Net investment income (loss)B | .22 | (.01) |
| Net realized and unrealized gain (loss) | .01 | (1.37) |
| Total from investment operations | .23 | (1.38) |
| Distributions from net investment income | (.27) | – |
| Distributions from net realized gain | (.02) | – |
| Total distributions | (.29) | – |
| Net asset value, end of period | $12.40 | $12.46 |
| Total ReturnC,D | 2.00% | (9.97)% |
| Ratios to Average Net AssetsE,F | | |
| Expenses before reductions | .85%G | .89%G |
| Expenses net of fee waivers, if any | .84%G | .89%G |
| Expenses net of all reductions | .84%G | .87%G |
| Net investment income (loss) | 3.62%G | (.70)%G |
| Supplemental Data | | |
| Net assets, end of period (000 omitted) | $9,701 | $5,118 |
| Portfolio turnover rateH | 73%G | 70% |
A For the period October 2, 2018 (commencement of sale of shares) to October 31, 2018.
B Calculated based on average shares outstanding during the period.
C Total returns for periods of less than one year are not annualized.
D Total returns would have been lower if certain expenses had not been reduced during the applicable periods shown.
E Fees and expenses of any underlying Fidelity Central Funds are not included in the Fund's expense ratio. The Fund indirectly bears its proportionate share of the expenses of any underlying Fidelity Central Funds.
F Expense ratios reflect operating expenses of the class. Expenses before reductions do not reflect amounts reimbursed by the investment adviser or reductions from brokerage service arrangements or reductions from other expense offset arrangements and do not represent the amount paid by the class during periods when reimbursements or reductions occur. Expense ratios before reductions for start-up periods may not be representative of longer-term operating periods. Expenses net of fee waivers reflect expenses after reimbursement by the investment adviser but prior to reductions from brokerage service arrangements or other expense offset arrangements. Expenses net of all reductions represent the net expenses paid by the class.
G Annualized
H Amount does not include the portfolio activity of any underlying Fidelity Central Funds.
See accompanying notes which are an integral part of the financial statements.
Notes to Financial Statements (Unaudited)
For the period ended April 30, 2019
1. Organization.
Fidelity Global Commodity Stock Fund (the Fund) is a non-diversified fund of Fidelity Investment Trust (the Trust) and is authorized to issue an unlimited number of shares. The Trust is registered under the Investment Company Act of 1940, as amended (the 1940 Act), as an open-end management investment company organized as a Massachusetts business trust. The Fund offers Class A, Class M, Class C, Global Commodity Stock, Class I and Class Z shares, each of which has equal rights as to assets and voting privileges. Each class has exclusive voting rights with respect to matters that affect that class. Effective March 1, 2019, Class C shares will automatically convert to Class A shares after a holding period of ten years from the initial date of purchase, with certain exceptions
2. Investments in Fidelity Central Funds.
The Fund invests in Fidelity Central Funds, which are open-end investment companies generally available only to other investment companies and accounts managed by the investment adviser and its affiliates. The Fund's Schedule of Investments lists each of the Fidelity Central Funds held as of period end, if any, as an investment of the Fund, but does not include the underlying holdings of each Fidelity Central Fund. As an Investing Fund, the Fund indirectly bears its proportionate share of the expenses of the underlying Fidelity Central Funds.
The Money Market Central Funds seek preservation of capital and current income and are managed by Fidelity Investments Money Management, Inc. (FIMM), an affiliate of the investment adviser. Annualized expenses of the Money Market Central Funds as of their most recent shareholder report date are less than .005%.
A complete unaudited list of holdings for each Fidelity Central Fund is available upon request or at the Securities and Exchange Commission (the SEC) website at www.sec.gov. In addition, the financial statements of the Fidelity Central Funds are available on the SEC website or upon request.
3. Significant Accounting Policies.
The Fund is an investment company and applies the accounting and reporting guidance of the Financial Accounting Standards Board (FASB) Accounting Standards Codification Topic 946 Financial Services – Investments Companies. The financial statements have been prepared in conformity with accounting principles generally accepted in the United States of America (GAAP), which require management to make certain estimates and assumptions at the date of the financial statements. Actual results could differ from those estimates. Subsequent events, if any, through the date that the financial statements were issued have been evaluated in the preparation of the financial statements. The following summarizes the significant accounting policies of the Fund:
Investment Valuation. Investments are valued as of 4:00 p.m. Eastern time on the last calendar day of the period. The Board of Trustees (the Board) has delegated the day to day responsibility for the valuation of the Fund's investments to the Fair Value Committee (the Committee) established by the Fund's investment adviser. In accordance with valuation policies and procedures approved by the Board, the Fund attempts to obtain prices from one or more third party pricing vendors or brokers to value its investments. When current market prices, quotations or currency exchange rates are not readily available or reliable, investments will be fair valued in good faith by the Committee, in accordance with procedures adopted by the Board. Factors used in determining fair value vary by investment type and may include market or investment specific events. The frequency with which these procedures are used cannot be predicted and they may be utilized to a significant extent. The Committee oversees the Fund's valuation policies and procedures and reports to the Board on the Committee's activities and fair value determinations. The Board monitors the appropriateness of the procedures used in valuing the Fund's investments and ratifies the fair value determinations of the Committee.
The Fund categorizes the inputs to valuation techniques used to value its investments into a disclosure hierarchy consisting of three levels as shown below:
- Level 1 – quoted prices in active markets for identical investments
- Level 2 – other significant observable inputs (including quoted prices for similar investments, interest rates, prepayment speeds, etc.)
- Level 3 – unobservable inputs (including the Fund's own assumptions based on the best information available)
Valuation techniques used to value the Fund's investments by major category are as follows:
Equity securities, including restricted securities, for which market quotations are readily available, are valued at the last reported sale price or official closing price as reported by a third party pricing vendor on the primary market or exchange on which they are traded and are categorized as Level 1 in the hierarchy. In the event there were no sales during the day or closing prices are not available, securities are valued at the last quoted bid price or may be valued using the last available price and are generally categorized as Level 2 in the hierarchy. For foreign equity securities, when market or security specific events arise, comparisons to the valuation of American Depositary Receipts (ADRs), futures contracts, Exchange-Traded Funds (ETFs) and certain indexes as well as quoted prices for similar securities may be used and would be categorized as Level 2 in the hierarchy. For equity securities, including restricted securities, where observable inputs are limited, assumptions about market activity and risk are used and these securities may be categorized as Level 3 in the hierarchy.
Investments in open-end mutual funds, including the Fidelity Central Funds, are valued at their closing net asset value (NAV) each business day and are categorized as Level 1 in the hierarchy.
Changes in valuation techniques may result in transfers in or out of an assigned level within the disclosure hierarchy. The aggregate value of investments by input level as of April 30, 2019 is included at the end of the Fund's Schedule of Investments.
Foreign Currency. The Fund may use foreign currency contracts to facilitate transactions in foreign-denominated securities. Gains and losses from these transactions may arise from changes in the value of the foreign currency or if the counterparties do not perform under the contracts' terms.
Foreign-denominated assets, including investment securities, and liabilities are translated into U.S. dollars at the exchange rates at period end. Purchases and sales of investment securities, income and dividends received and expenses denominated in foreign currencies are translated into U.S. dollars at the exchange rate in effect on the transaction date.
The effects of exchange rate fluctuations on investments are included with the net realized and unrealized gain (loss) on investment securities. Other foreign currency transactions resulting in realized and unrealized gain (loss) are disclosed separately.
Investment Transactions and Income. For financial reporting purposes, the Fund's investment holdings and NAV include trades executed through the end of the last business day of the period. The NAV per share for processing shareholder transactions is calculated as of the close of business of the New York Stock Exchange (NYSE), normally 4:00 p.m. Eastern time and includes trades executed through the end of the prior business day. Gains and losses on securities sold are determined on the basis of identified cost and include proceeds received from litigation. Dividend income is recorded on the ex-dividend date, except for certain dividends from foreign securities where the ex-dividend date may have passed, which are recorded as soon as the Fund is informed of the ex-dividend date. Non-cash dividends included in dividend income, if any, are recorded at the fair market value of the securities received. Income and capital gain distributions from Fidelity Central Funds, if any, are recorded on the ex-dividend date. Certain distributions received by the Fund represent a return of capital or capital gain. The Fund determines the components of these distributions subsequent to the ex-dividend date, based upon receipt of tax filings or other correspondence relating to the underlying investment. These distributions are recorded as a reduction of cost of investments and/or as a realized gain. Investment income is recorded net of foreign taxes withheld where recovery of such taxes is uncertain.
Class Allocations and Expenses. Investment income, realized and unrealized capital gains and losses, common expenses of the Fund, and certain fund-level expense reductions, if any, are allocated daily on a pro-rata basis to each class based on the relative net assets of each class to the total net assets of the Fund. Each class differs with respect to transfer agent and distribution and service plan fees incurred. Certain expense reductions may also differ by class. For the reporting period, the allocated portion of income and expenses to each class as a percent of its average net assets may vary due to the timing of recording these transactions in relation to fluctuating net assets of the classes. Expenses directly attributable to a fund are charged to that fund. Expenses attributable to more than one fund are allocated among the respective funds on the basis of relative net assets or other appropriate methods. Expense estimates are accrued in the period to which they relate and adjustments are made when actual amounts are known.
Income Tax Information and Distributions to Shareholders. Each year, the Fund intends to qualify as a regulated investment company under Subchapter M of the Internal Revenue Code, including distributing substantially all of its taxable income and realized gains. As a result, no provision for U.S. Federal income taxes is required. The Fund files a U.S. federal tax return, in addition to state and local tax returns as required. The Fund's federal income tax returns are subject to examination by the Internal Revenue Service (IRS) for a period of three fiscal years after they are filed. State and local tax returns may be subject to examination for an additional fiscal year depending on the jurisdiction. Foreign taxes are provided for based on the Fund's understanding of the tax rules and rates that exist in the foreign markets in which it invests.
Distributions are declared and recorded on the ex-dividend date. Income and capital gain distributions are declared separately for each class. Income and capital gain distributions are determined in accordance with income tax regulations, which may differ from GAAP.
Capital accounts within the financial statements are adjusted for permanent book-tax differences. These adjustments have no impact on net assets or the results of operations. Capital accounts are not adjusted for temporary book-tax differences which will reverse in a subsequent period.
Book-tax differences are primarily due to foreign currency transactions, partnerships, passive foreign investment companies (PFIC), capital loss carryforwards and losses deferred due to wash sales.
As of period end, the cost and unrealized appreciation (depreciation) in securities, and derivatives if applicable, for federal income tax purposes were as follows:
| Gross unrealized appreciation | $19,879,745 |
| Gross unrealized depreciation | (79,286,364) |
| Net unrealized appreciation (depreciation) | $(59,406,619) |
| Tax cost | $601,863,041 |
Capital loss carryforwards are only available to offset future capital gains of the Fund to the extent provided by regulations and may be limited. Under the Regulated Investment Company Modernization Act of 2010 (the Act), the Fund is permitted to carry forward capital losses incurred in taxable years beginning after December 22, 2010 for an unlimited period and such capital losses are required to be used prior to any losses that expire. The capital loss carryforward information presented below, including any applicable limitation, is estimated as of prior fiscal period end and is subject to adjustment.
| Fiscal year of expiration | |
| 2019 | $(6,952,413) |
| No expiration | |
| Long-term | (20,359,394) |
| Total capital loss carryforward | $(27,311,807) |
4. Purchases and Sales of Investments.
Purchases and sales of securities, other than short-term securities, aggregated $194,440,279 and $200,352,907, respectively.
5. Fees and Other Transactions with Affiliates.
Management Fee. Fidelity Management & Research Company (the investment adviser) and its affiliates provide the Fund with investment management related services for which the Fund pays a monthly management fee. The management fee is the sum of an individual fund fee rate that is based on an annual rate of .45% of the Fund's average net assets and an annualized group fee rate that averaged .24% during the period. The group fee rate is based upon the average net assets of all the mutual funds advised by the investment adviser, including any mutual funds previously advised by the investment adviser that are currently advised by Fidelity SelectCo, LLC, an affiliate of the investment adviser. The group fee rate decreases as assets under management increase and increases as assets under management decrease. For the reporting period, the total annualized management fee rate was .69% of the Fund's average net assets.
Distribution and Service Plan Fees. In accordance with Rule 12b-1 of the 1940 Act, the Fund has adopted separate Distribution and Service Plans for each class of shares. Certain classes pay Fidelity Distributors Corporation (FDC), an affiliate of the investment adviser, separate Distribution and Service Fees, each of which is based on an annual percentage of each class' average net assets. In addition, FDC may pay financial intermediaries for selling shares of the Fund and providing shareholder support services. For the period, the Distribution and Service Fee rates, total fees and amounts retained by FDC were as follows:
| | Distribution Fee | Service Fee | Total Fees | Retained by FDC |
| Class A | -% | .25% | $33,820 | $854 |
| Class M | .25% | .25% | 16,692 | 196 |
| Class C | .75% | .25% | 91,216 | 7,492 |
| | | | $141,728 | $8,542 |
Sales Load. FDC may receive a front-end sales charge of up to 5.75% for selling Class A shares and 3.50% for selling Class M shares, some of which is paid to financial intermediaries for selling shares of the Fund. Depending on the holding period, FDC may receive contingent deferred sales charges levied on Class A, Class M and Class C redemptions. The deferred sales charges are 1.00% for Class C shares, 1.00% for certain purchases of Class A shares and .25% for certain purchases of Class M shares.
For the period, sales charge amounts retained by FDC were as follows:
| | Retained by FDC |
| Class A | $3,460 |
| Class M | 458 |
| Class C(a) | 877 |
| | $4,795 |
(a) When Class C shares are initially sold, FDC pays commissions from its own resources to financial intermediaries through which the sales are made.
Transfer Agent Fees. Fidelity Investments Institutional Operations Company, Inc., (FIIOC), an affiliate of the investment adviser, is the transfer, dividend disbursing and shareholder servicing agent for each class of the Fund. FIIOC receives account fees and asset-based fees that vary according to the account size and type of account of the shareholders of the respective classes of the Fund, except for Class Z. FIIOC receives an asset-based fee of Class Z's average net assets. FIIOC pays for typesetting, printing and mailing of shareholder reports, except proxy statements.
For the period, transfer agent fees for each class were as follows:
| | Amount | % of Class-Level Average Net Assets(a) |
| Class A | $34,243 | .25 |
| Class M | 10,447 | .31 |
| Class C | 20,592 | .23 |
| Global Commodity Stock | 557,370 | .30 |
| Class I | 76,907 | .14 |
| Class Z | 1,936 | .05 |
| | $701,495 | |
(a) Annualized
Accounting and Security Lending Fees. Fidelity Service Company, Inc. (FSC), an affiliate of the investment adviser, maintains the Fund's accounting records. The accounting fee is based on the level of average net assets for each month. Prior to April 1, 2019, FSC had a separate agreement with the Fund for administration of the security lending program, based on the number and duration of lending transactions. For the period, the total fees paid for accounting and administration of securities lending were equivalent to an annualized rate of .05%.
Brokerage Commissions. The Fund placed a portion of its portfolio transactions with brokerage firms which are affiliates of the investment adviser. Brokerage commissions are included in net realized gain (loss) and change in net unrealized appreciation (depreciation) in the Statement of Operations. The commissions paid to these affiliated firms were $1,888 for the period.
Interfund Trades. The Fund may purchase from or sell securities to other Fidelity Funds under procedures adopted by the Board. The procedures have been designed to ensure these interfund trades are executed in accordance with Rule 17a-7 of the 1940 Act. Interfund trades are included within the respective purchases and sales amounts shown in the Purchases and Sales of Investments note.
6. Committed Line of Credit.
The Fund participates with other funds managed by the investment adviser or an affiliate in a $4.25 billion credit facility (the "line of credit") to be utilized for temporary or emergency purposes to fund shareholder redemptions or for other short-term liquidity purposes. The Fund has agreed to pay commitment fees on its pro-rata portion of the line of credit, which amounted to $786 and is reflected in Miscellaneous expenses on the Statement of Operations. During the period, the Fund did not borrow on this line of credit.
7. Security Lending.
The Fund lends portfolio securities through a lending agent from time to time in order to earn additional income. For equity securities, a lending agent is used and may loan securities to certain qualified borrowers, including Fidelity Capital Markets (FCM), a broker-dealer affiliated with the Fund. On the settlement date of the loan, the Fund receives collateral (in the form of U.S. Treasury obligations, letters of credit and/or cash) against the loaned securities and maintains collateral in an amount not less than 100% of the market value of the loaned securities during the period of the loan. The market value of the loaned securities is determined at the close of business of the Fund and any additional required collateral is delivered to the Fund on the next business day. The Fund or borrower may terminate the loan at any time, and if the borrower defaults on its obligation to return the securities loaned because of insolvency or other reasons, the Fund may apply collateral received from the borrower against the obligation. The Fund may experience delays and costs in recovering the securities loaned. Any cash collateral received is invested in the Fidelity Securities Lending Cash Central Fund. The value of loaned securities and cash collateral at period end are disclosed on the Fund's Statement of Assets and Liabilities. At period end, there were no security loans outstanding with FCM. Security lending income represents the income earned on investing cash collateral, less rebates paid to borrowers and any lending agent fees associated with the loan, plus any premium payments received for lending certain types of securities. Security lending income is presented in the Statement of Operations as a component of income from Fidelity Central Funds. Total security lending income during the period amounted to $140,058, including $290 from securities loaned to FCM.
8. Expense Reductions.
Commissions paid to certain brokers with whom the investment adviser, or its affiliates, places trades on behalf of the Fund include an amount in addition to trade execution, which may be rebated back to the Fund to offset certain expenses. This amount totaled $12,950 for the period.
In addition, during the period the investment adviser reimbursed and/or waived a portion of fund-level operating expenses in the amount of $2,076 and a portion of class-level operating expenses as follows:
| | Amount |
| Class A | $782 |
| Class M | 193 |
| Class C | 571 |
| Global Commodity Stock | 10,955 |
| Class I | 3,278 |
| Class Z | 222 |
| | $16,001 |
9. Distributions to Shareholders.
Distributions to shareholders of each class were as follows:
| | Six months ended
April 30, 2019 | Year ended
October 31, 2018 |
| Distributions to shareholders | | |
| Class A | $483,346 | $309,556 |
| Class M | 100,322 | 55,615 |
| Class C | 200,915 | 53,428 |
| Global Commodity Stock | 7,706,193 | 5,313,895 |
| Class I | 2,518,989 | 1,669,657 |
| Class Z | 157,858 | – |
| Total | $11,167,623 | $7,402,151 |
10. Share Transactions.
Share transactions for each class were as follows and may contain automatic conversions between classes or exchanges between affiliated funds:
| | Shares | Shares | Dollars | Dollars |
| | Six months ended April 30, 2019 | Year ended October 31, 2018(a) | Six months ended April 30, 2019 | Year ended October 31, 2018(a) |
| Class A | | | | |
| Shares sold | 455,538 | 961,117 | $5,590,636 | $12,976,845 |
| Reinvestment of distributions | 41,258 | 24,771 | 479,423 | 306,172 |
| Shares redeemed | (468,584) | (1,173,857) | (5,751,112) | (15,724,822) |
| Net increase (decrease) | 28,212 | (187,969) | $318,947 | $(2,441,805) |
| Class M | | | | |
| Shares sold | 40,226 | 228,243 | $481,010 | $3,056,866 |
| Reinvestment of distributions | 8,615 | 4,488 | 100,105 | 55,468 |
| Shares redeemed | (126,059) | (200,167) | (1,519,937) | (2,622,769) |
| Net increase (decrease) | (77,218) | 32,564 | $(938,822) | $489,565 |
| Class C | | | | |
| Shares sold | 110,711 | 880,029 | $1,335,636 | $11,853,888 |
| Reinvestment of distributions | 17,161 | 4,237 | 198,038 | 52,034 |
| Shares redeemed | (852,022) | (340,536) | (10,405,334) | (4,503,052) |
| Net increase (decrease) | (724,150) | 543,730 | $(8,871,660) | $7,402,870 |
| Global Commodity Stock | | | | |
| Shares sold | 4,123,216 | 17,721,753 | $49,701,092 | $231,763,153 |
| Reinvestment of distributions | 615,573 | 414,534 | 7,140,644 | 5,123,639 |
| Shares redeemed | (4,192,945) | (9,429,371) | (50,213,919) | (125,657,701) |
| Net increase (decrease) | 545,844 | 8,706,916 | $6,627,817 | $111,229,091 |
| Class I | | | | |
| Shares sold | 1,279,480 | 3,453,489 | $15,239,003 | $46,712,238 |
| Reinvestment of distributions | 137,668 | 65,617 | 1,596,951 | 810,368 |
| Shares redeemed | (1,741,689) | (3,065,738) | (20,544,213) | (39,890,323) |
| Net increase (decrease) | (324,541) | 453,368 | $(3,708,259) | $7,632,283 |
| Class Z | | | | |
| Shares sold | 851,853 | 412,977 | $10,389,308 | $5,219,125 |
| Reinvestment of distributions | 5,496 | – | 63,640 | – |
| Shares redeemed | (485,817) | (2,138) | (6,013,951) | (26,499) |
| Net increase (decrease) | 371,532 | 410,839 | $4,438,997 | $5,192,626 |
(a) Share transactions for Class Z are for the period October 2, 2018 (commencement of sale of shares) to October 31, 2018.
11. Other.
The Fund's organizational documents provide former and current trustees and officers with a limited indemnification against liabilities arising in connection with the performance of their duties to the Fund. In the normal course of business, the Fund may also enter into contracts that provide general indemnifications. The Fund's maximum exposure under these arrangements is unknown as this would be dependent on future claims that may be made against the Fund. The risk of material loss from such claims is considered remote.
At the end of the period, VIP FundsManager 50% Portfolio was the owner of record of approximately 10% of the total outstanding shares of the Fund. Mutual funds managed by the investment adviser or its affiliates were the owners of record, in the aggregate, of approximately 26% of the total outstanding shares of the Fund.
Shareholder Expense Example
As a shareholder of the Fund, you incur two types of costs: (1) transaction costs, including sales charges (loads) on purchase payments or redemption proceeds, and (2) ongoing costs, including management fees, distribution and/or service (12b-1) fees and other Fund expenses. This Example is intended to help you understand your ongoing costs (in dollars) of investing in the Fund and to compare these costs with the ongoing costs of investing in other mutual funds.
The Example is based on an investment of $1,000 invested at the beginning of the period and held for the entire period (November 1, 2018 to April 30, 2019).
Actual Expenses
The first line of the accompanying table for each class of the Fund provides information about actual account values and actual expenses. You may use the information in this line, together with the amount you invested, to estimate the expenses that you paid over the period. Simply divide your account value by $1,000.00 (for example, an $8,600 account value divided by $1,000.00 = 8.6), then multiply the result by the number in the first line for a class of the Fund under the heading entitled "Expenses Paid During Period" to estimate the expenses you paid on your account during this period. In addition, the Fund, as a shareholder in the underlying Fidelity Central Funds, will indirectly bear its pro-rata share of the fees and expenses incurred by the underlying Fidelity Central Funds. These fees and expenses are not included in the Fund's annualized expense ratio used to calculate the expense estimate in the table below.
Hypothetical Example for Comparison Purposes
The second line of the accompanying table for each class of the Fund provides information about hypothetical account values and hypothetical expenses based on a Class' actual expense ratio and an assumed rate of return of 5% per year before expenses, which is not the Class' actual return. The hypothetical account values and expenses may not be used to estimate the actual ending account balance or expenses you paid for the period. You may use this information to compare the ongoing costs of investing in the Fund and other funds. To do so, compare this 5% hypothetical example with the 5% hypothetical examples that appear in the shareholder reports of the other funds. In addition, the Fund, as a shareholder in the underlying Fidelity Central Funds, will indirectly bear its pro-rata share of the fees and expenses incurred by the underlying Fidelity Central Funds. These fees and expenses are not included in the Fund's annualized expense ratio used to calculate the expense estimate in the table below.
Please note that the expenses shown in the table are meant to highlight your ongoing costs only and do not reflect any transaction costs. Therefore, the second line of the table is useful in comparing ongoing costs only, and will not help you determine the relative total costs of owning different funds. In addition, if these transactional costs were included, your costs would have been higher.
| | Annualized Expense Ratio-A | Beginning
Account Value
November 1, 2018 | Ending
Account Value
April 30, 2019 | Expenses Paid
During Period-B
November 1, 2018
to April 30, 2019 |
| Class A | 1.30% | | | |
| Actual | | $1,000.00 | $1,017.80 | $6.50 |
| Hypothetical-C | | $1,000.00 | $1,018.35 | $6.51 |
| Class M | 1.61% | | | |
| Actual | | $1,000.00 | $1,016.00 | $8.05 |
| Hypothetical-C | | $1,000.00 | $1,016.81 | $8.05 |
| Class C | 2.02% | | | |
| Actual | | $1,000.00 | $1,014.00 | $10.09 |
| Hypothetical-C | | $1,000.00 | $1,014.78 | $10.09 |
| Global Commodity Stock | 1.09% | | | |
| Actual | | $1,000.00 | $1,019.00 | $5.46 |
| Hypothetical-C | | $1,000.00 | $1,019.39 | $5.46 |
| Class I | .93% | | | |
| Actual | | $1,000.00 | $1,020.00 | $4.66 |
| Hypothetical-C | | $1,000.00 | $1,020.18 | $4.66 |
| Class Z | .84% | | | |
| Actual | | $1,000.00 | $1,020.00 | $4.21 |
| Hypothetical-C | | $1,000.00 | $1,020.63 | $4.21 |
A Annualized expense ratio reflects expenses net of applicable fee waivers.
B Expenses are equal to each Class' annualized expense ratio, multiplied by the average account value over the period, multiplied by 181/365 (to reflect the one-half year period).
C 5% return per year before expenses
Board Approval of Investment Advisory Contracts and Management Fees
Fidelity Global Commodity Stock Fund
Each year, the Board of Trustees, including the Independent Trustees (together, the Board), votes on the renewal of the management contract with Fidelity Management & Research Company (FMR) and the sub-advisory agreements (together, the Advisory Contracts) for the fund. FMR and the sub-advisers are referred to herein as the Investment Advisers. The Board, assisted by the advice of fund counsel and Independent Trustees' counsel, requests and considers a broad range of information relevant to the renewal of the Advisory Contracts throughout the year.
The Board meets regularly and, at each of its meetings, covers an extensive agenda of topics and materials and considers factors that are relevant to its annual consideration of the renewal of the fund's Advisory Contracts, including the services and support provided to the fund and its shareholders. The Board has established various standing committees (Committees), each composed of and chaired by Independent Trustees with varying backgrounds, to which the Board has assigned specific subject matter responsibilities in order to enhance effective decision-making by the Board. The Board, acting directly and through its Committees, requests and receives information concerning the annual consideration of the renewal of the fund's Advisory Contracts. The Board also meets as needed to review matters specifically related to the Board's annual consideration of the renewal of the Advisory Contracts. Members of the Board may also meet with trustees of other Fidelity funds through joint ad hoc committees to discuss certain matters relevant to all of the Fidelity funds.
At its January 2019 meeting, the Board unanimously determined to renew the fund's Advisory Contracts. In reaching its determination, the Board considered all factors it believed relevant, including (i) the nature, extent, and quality of the services to be provided to the fund and its shareholders (including the investment performance of the fund); (ii) the competitiveness of the fund's management fee and total expense ratio relative to peer funds; (iii) the total costs of the services to be provided by and the profits to be realized by Fidelity from its relationships with the fund; and (iv) the extent to which, if any, economies of scale exist and would be realized as the fund grows, and whether any economies of scale are appropriately shared with fund shareholders.
In considering whether to renew the Advisory Contracts for the fund, the Board reached a determination, with the assistance of fund counsel and Independent Trustees' counsel and through the exercise of its business judgment, that the renewal of the Advisory Contracts was in the best interests of the fund and its shareholders and that the compensation payable under the Advisory Contracts was fair and reasonable. The Board's decision to renew the Advisory Contracts was not based on any single factor, but rather was based on a comprehensive consideration of all the information provided to the Board at its meetings throughout the year. The Board, in reaching its determination to renew the Advisory Contracts, was aware that shareholders of the fund have a broad range of investment choices available to them, including a wide choice among funds offered by Fidelity's competitors, and that the fund's shareholders, who have the opportunity to review and weigh the disclosure provided by the fund in its prospectus and other public disclosures, have chosen to invest in this fund, which is part of the Fidelity family of funds.
Nature, Extent, and Quality of Services Provided. The Board considered Fidelity's staffing as it relates to the fund, including the backgrounds of investment personnel of Fidelity, and also considered the fund's investment objective, strategies, and related investment philosophy. The Independent Trustees also had discussions with senior management of Fidelity's investment operations and investment groups. The Board considered the structure of the investment personnel compensation program and whether this structure provides appropriate incentives to act in the best interests of the fund. Additionally, the Board considered the portfolio managers' investments, if any, in the funds that they manage.
Resources Dedicated to Investment Management and Support Services. The Board and the Fund Oversight and Research Committees reviewed the general qualifications and capabilities of Fidelity's investment staff, including its size, education, experience, and resources, as well as Fidelity's approach to recruiting, training, managing, and compensating investment personnel. The Board noted that Fidelity has continued to increase the resources devoted to non-U.S. offices, including expansion of Fidelity's global investment organization. The Board also noted that Fidelity's analysts have extensive resources, tools and capabilities that allow them to conduct sophisticated quantitative and fundamental analysis, as well as credit analysis of issuers, counterparties and guarantors. Further, the Board considered that Fidelity's investment professionals have sufficient access to global information and data so as to provide competitive investment results over time, and that those professionals also have access to sophisticated tools that permit them to assess portfolio construction and risk and performance attribution characteristics continuously, as well as to transmit new information and research conclusions rapidly around the world. Additionally, in its deliberations, the Board considered Fidelity's trading, risk management, compliance, and technology and operations capabilities and resources, which are integral parts of the investment management process.
Shareholder and Administrative Services. The Board considered (i) the nature, extent, quality, and cost of advisory, administrative, and shareholder services performed by the Investment Advisers and their affiliates under the Advisory Contracts and under separate agreements covering transfer agency, pricing and bookkeeping, and securities lending services for the fund; (ii) the nature and extent of the supervision of third party service providers, principally custodians, subcustodians, and pricing vendors; and (iii) the resources devoted to, and the record of compliance with, the fund's compliance policies and procedures. The Board also reviewed the allocation of fund brokerage, including allocations to brokers affiliated with the Investment Advisers, the use of brokerage commissions to pay fund expenses, and the use of "soft" commission dollars to pay for research services.
The Board noted that the growth of fund assets over time across the complex allows Fidelity to reinvest in the development of services designed to enhance the value and convenience of the Fidelity funds as investment vehicles. These services include 24-hour access to account information and market information through telephone representatives and over the Internet, investor education materials and asset allocation tools, and the expanded availability of Fidelity Investor Centers.
The Board noted that it and the boards of certain other Fidelity funds had formed an ad hoc Committee on Transfer Agency Fees to review the variety of transfer agency fee structures throughout the industry and Fidelity's competitive positioning with respect to industry participants.
Investment in a Large Fund Family. The Board considered the benefits to shareholders of investing in a Fidelity fund, including the benefits of investing in a fund that is part of a large family of funds offering a variety of investment disciplines and providing a large variety of mutual fund investor services. The Board noted that Fidelity had taken, or had made recommendations that resulted in the Fidelity funds taking, a number of actions over the previous year that benefited particular funds, including: (i) continuing to dedicate additional resources to Fidelity's investment research process, which includes meetings with management of issuers of securities in which the funds invest, and to the support of the senior management team that oversees asset management; (ii) continuing efforts to enhance Fidelity's global research capabilities; (iii) launching new funds and making other enhancements to meet client needs; (iv) launching new share classes of existing funds; (v) eliminating purchase minimums and broadening eligibility requirements for certain funds and share classes; (vi) reducing management fees and total expenses for certain growth equity funds and index funds; (vii) lowering expense caps for certain existing funds and classes, and converting certain voluntary expense caps to contractual caps, to reduce expenses borne by shareholders; (viii) eliminating short-term redemption fees for funds that had such fees; (ix) rationalizing product lines and gaining increased efficiencies from fund mergers and share class consolidations; (x) continuing to develop, acquire and implement systems and technology to improve services to the funds and shareholders, strengthen information security, and increase efficiency; and (xi) continuing to implement enhancements to further strengthen Fidelity's product line to increase investors' probability of success in achieving their investment goals, including retirement income goals.
Investment Performance. The Board considered whether the fund has operated in accordance with its investment objective, as well as its record of compliance with its investment restrictions and its performance history. The fund had a portfolio manager change in September 2018. The Board will continue to monitor closely the fund's performance, taking into account the portfolio manager change.
The Board took into account discussions that occur at Board meetings throughout the year with representatives of the Investment Advisers about fund investment performance. In this regard the Board noted that as part of regularly scheduled fund reviews and other reports to the Board on fund performance, the Board considers annualized return information for the fund for different time periods, measured against an appropriate securities market index ("benchmark index") and a peer group of funds with similar objectives ("peer group"), if any. In its evaluation of fund investment performance, the Board gave particular attention to information indicating changes in performance of certain Fidelity funds for specific time periods and discussed with the Investment Advisers the reasons for any overperformance or underperformance.
In addition to reviewing absolute and relative fund performance, the Independent Trustees periodically consider the appropriateness of fund performance metrics in evaluating the results achieved. In general, the Independent Trustees believe that fund performance should be evaluated based on net performance (after fees and expenses) of both the highest performing and lowest performing fund share classes, where applicable, compared to appropriate benchmark indices, over appropriate time periods that may include full market cycles, and compared to peer groups, as applicable, over the same periods, taking into account relevant factors including the following: general market conditions; issuer-specific information; and fund cash flows and other factors.
The Independent Trustees recognize that shareholders evaluate performance on a net basis over their own holding periods, for which one-, three-, and five-year periods are often used as a proxy. For this reason, the performance information reviewed by the Board also included net cumulative total return information for the fund and an appropriate benchmark index for the most recent one-, three-, and five-year periods ended June 30, 2018, as shown below. A peer group is not shown below because the fund does not generally utilize a peer group for performance comparison purposes.
Fidelity Global Commodity Stock Fund

The Board considered the fund's underperformance for different time based on time periods ended prior to June 30, 2018 (which periods are not shown in the chart above). The Board noted that the fund's underperformance has continued since the Board approved the management contract in 2016 and 2017. The Board's discussions with FMR regarding underperformance cover topics including, but not limited to: the longer-term track record of a fund's portfolio manager(s); broader trends in the market that may adversely impact a fund's performance; attribution reports on contributors to the fund's underperformance; and the applicable portfolio manager's explanation of his or her underperformance. The Board engages with FMR on steps that might be taken to address a fund's underperformance. The Board noted that the fund's more recent performance had improved.
Based on its review, the Board concluded that the nature, extent, and quality of services provided to the fund under the Advisory Contracts should continue to benefit the shareholders of the fund.
Competitiveness of Management Fee and Total Expense Ratio. The Board considered the fund's management fee and total expense ratio compared to "mapped groups" of competitive funds and classes created for the purpose of facilitating the Trustees' competitive analysis of management fees and total expenses. Fidelity creates "mapped groups" by combining similar Lipper investment objective categories that have comparable investment mandates. For this purpose, all sector focused equity funds are grouped in the same mapped group. Combining Lipper investment objective categories aids the Board's management fee and total expense ratio comparisons by broadening the competitive group used for comparison.
Management Fee. The Board considered two proprietary management fee comparisons for the 12-month periods (ended June 30 for 2018 and December 31 for prior periods) shown in basis points (BP) in the chart below. The group of Lipper funds used by the Board for management fee comparisons is referred to below as the "Total Mapped Group." The Total Mapped Group comparison focuses on a fund's standing in terms of gross management fees before expense reimbursements or caps relative to the total universe of funds with comparable investment mandates (i.e., sector equities), regardless of whether their management fee structures also are comparable. Funds with comparable management fee structures have similar management fee contractual arrangements (
e.g., flat rate charged for advisory services, all-inclusive fee rate,
etc.). "TMG %" represents the percentage of funds in the Total Mapped Group that had management fees that were lower than the fund's. For example, a hypothetical TMG % of 20% would mean that 80% of the funds in the Total Mapped Group had higher, and 20% had lower, management fees than the fund. The fund's actual TMG %s and the number of funds in the Total Mapped Group are in the chart below. The "Asset-Size Peer Group" (ASPG) comparison focuses on a fund's standing relative to a subset of non-Fidelity funds within the Total Mapped Group that are similar in size and management fee structure. For example, if a fund is in the first quartile of the ASPG, the fund's management fee ranks in the least expensive or lowest 25% of funds in the ASPG. The ASPG represents at least 15% of the funds in the Total Mapped Group with comparable asset size and management fee structures, subject to a minimum of 50 funds (or all funds in the Total Mapped Group if fewer than 50). Additional information, such as the ASPG quartile in which the fund's management fee rate ranked, is also included in the chart and was considered by the Board.
Fidelity Global Commodity Stock Fund
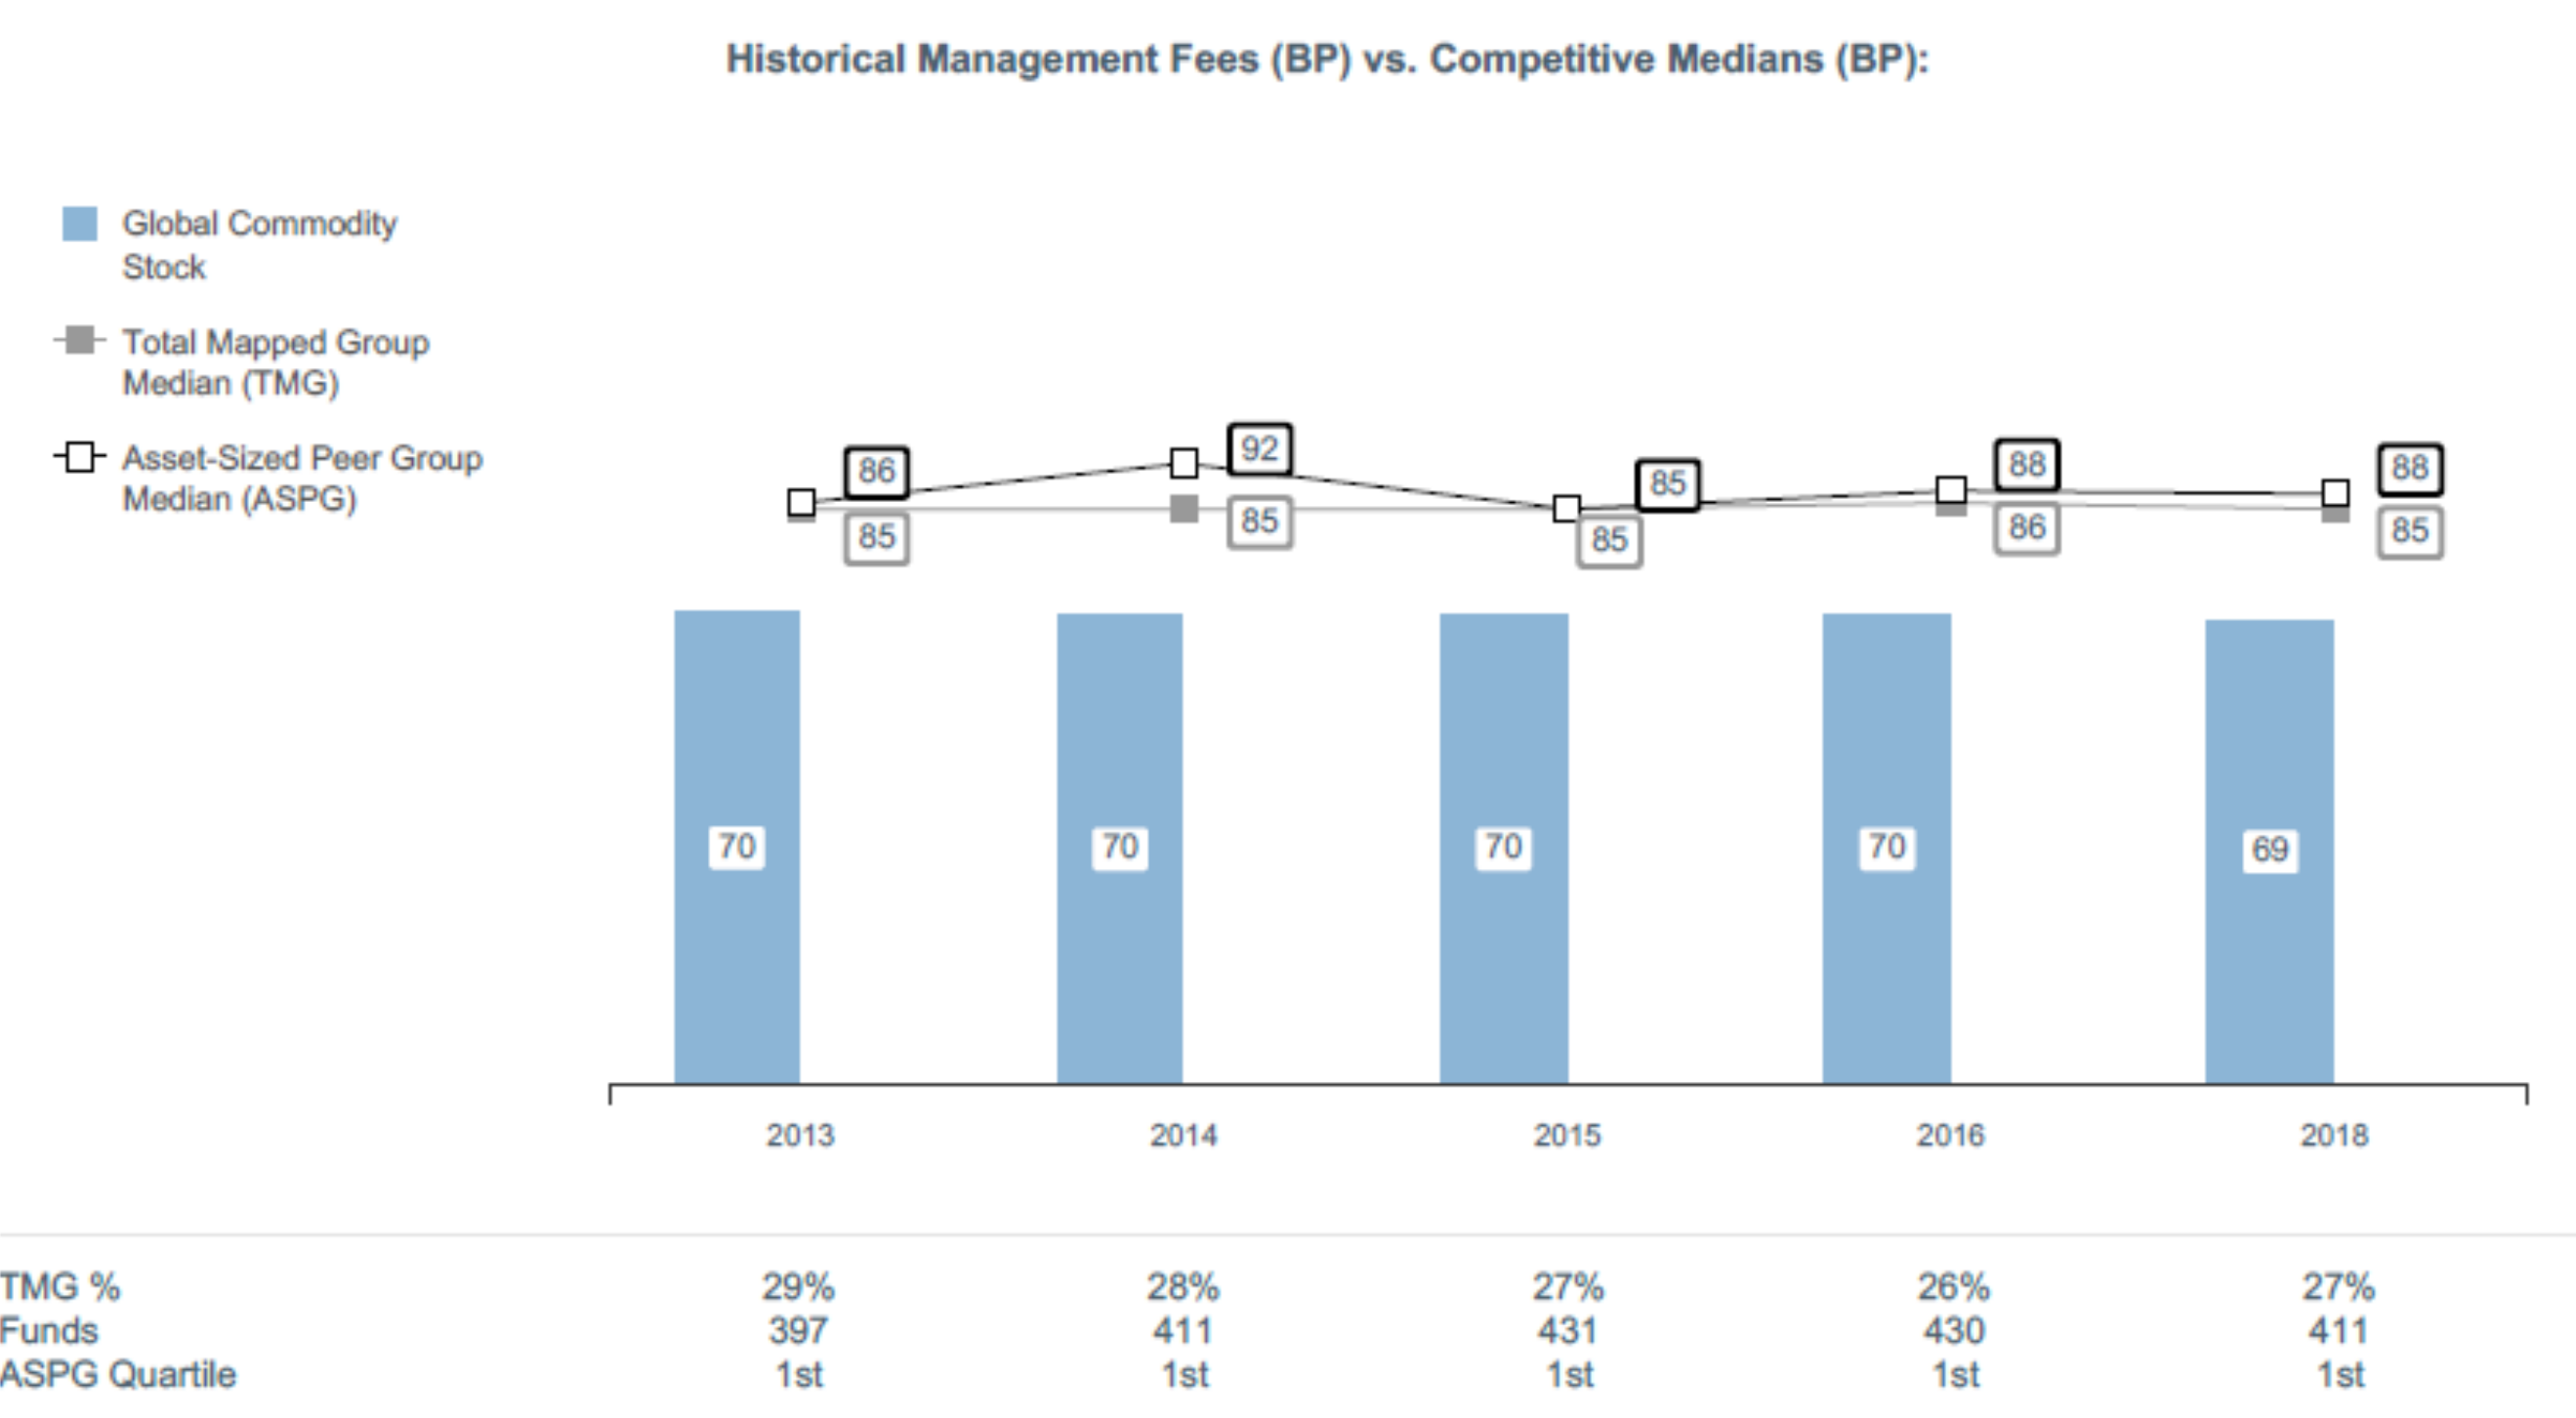
The Board noted that the fund's management fee rate ranked below the median of its Total Mapped Group and below the median of its ASPG for the 12-month period ended June 30, 2018.
The Board noted that it and the boards of other Fidelity funds formed an ad hoc Committee on Group Fee, which meets periodically, to conduct an in-depth review of the "group fee" component of the management fee of funds with such management fee structures. The Committee's focus included the mechanics of the group fee, the competitive landscape of group fee structures, Fidelity funds with no group fee component and investment products not included in group fee assets. The Board also considered that, for funds subject to the group fee, FMR agreed to voluntarily waive fees over a specified period of time in amounts designed to account for assets converted from certain funds to certain collective investment trusts.
The Board also noted that, in 2013, the ad hoc Committee on Management Fees was formed to conduct an in-depth review of the management fee rates of Fidelity's active equity mutual funds. The Committee focused on the following areas: (i) standard fee structures; (ii) research consumption and trading evolution; (iii) management fee competitiveness/profitability by category; and (iv) factors that drive institutional pricing.
Based on its review, the Board concluded that the fund's management fee is fair and reasonable in light of the services that the fund receives and the other factors considered.
Total Expense Ratio. In its review of each class's total expense ratio, the Board considered the fund's management fee rate as well as other fund or class expenses, as applicable, such as transfer agent fees, pricing and bookkeeping fees, fund-paid 12b-1 fees, and custodial, legal, and audit fees. The Board also noted that Fidelity may agree to waive fees and expenses from time to time, and the extent to which, if any, it has done so for the fund. As part of its review, the Board also considered the current and historical total expense ratios of each class of the fund compared to competitive fund median expenses. Each class of the fund is compared to those funds and classes in the Total Mapped Group (used by the Board for management fee comparisons) that have a similar sales load structure.
The Board noted that the total expense ratio of each of Class A, Class C, and Class I ranked below the competitive median for the 12-month period ended June 30, 2018, and the total expense ratio of each of Class M and the retail class ranked above the competitive median for the 12-month period ended June 30, 2018. The Board considered that, in general, various factors can affect total expense ratios. The Board noted that the total expense ratio of Class M was above the competitive median primarily because of higher 12b-1 fees on Class M as compared to most competitor funds. Class M has a higher 12b-1 fee, but a lower front-end sales charge, than traditionally priced front-end sales charge classes. The Board considered that Class M is primarily sold load-waived to retirement plans and intermediary wrap programs where its 0.50% 12b-1 fee is comparable to competing no-load, higher 12b-1 fee classes designed specifically for retirement plans and wrap programs. The Board noted that the total expense ratio of the retail class was above the competitive median due to higher transfer agent fees from small average account sizes. The Board noted that the fund offers multiple classes, each of which has a different sales load and 12b-1 fee structure, and that the multiple structures are intended to offer a range of pricing options for the intermediary market. The Board also noted that the total expense ratios of the classes vary primarily by the level of their 12b-1 fees, although differences in transfer agent fees may also cause expenses to vary from class to class.
Fees Charged to Other Fidelity Clients. The Board also considered Fidelity fee structures and other information with respect to clients of Fidelity, such as other funds advised or subadvised by Fidelity, pension plan clients, and other institutional clients with similar mandates. The Board noted that a joint ad hoc committee created by it and the boards of other Fidelity funds periodically reviews and compares Fidelity's institutional investment advisory business with its business of providing services to the Fidelity funds and also noted the most recent findings of the committee. The Board noted that the committee's review included a consideration of the differences in services provided, fees charged, and costs incurred, as well as competition in the markets serving the different categories of clients.
Based on its review of total expense ratios and fees charged to other Fidelity clients, the Board concluded that the total expense ratio of each class of the fund was reasonable in light of the services that the fund and its shareholders receive and the other factors considered.
Costs of the Services and Profitability. The Board considered the revenues earned and the expenses incurred by Fidelity in conducting the business of developing, marketing, distributing, managing, administering and servicing the fund and servicing the fund's shareholders. The Board also considered the level of Fidelity's profits in respect of all the Fidelity funds.
On an annual basis, Fidelity presents to the Board information about the profitability of its relationships with the fund. Fidelity calculates profitability information for each fund, as well as aggregate profitability information for groups of Fidelity funds and all Fidelity funds, using a series of detailed revenue and cost allocation methodologies which originate with the books and records of Fidelity on which Fidelity's audited financial statements are based. The Audit Committee of the Board reviews any significant changes from the prior year's methodologies.
PricewaterhouseCoopers LLP (PwC), auditor to Fidelity and certain Fidelity funds, has been engaged annually by the Board as part of the Board's assessment of Fidelity's profitability analysis. PwC's engagement includes the review and assessment of the methodologies used by Fidelity in determining the revenues and expenses attributable to Fidelity's mutual fund business, and completion of agreed-upon procedures in respect of the mathematical accuracy of the fund profitability information and its conformity to established allocation methodologies. After considering PwC's reports issued under the engagement and information provided by Fidelity, the Board concluded that while other allocation methods may also be reasonable, Fidelity's profitability methodologies are reasonable in all material respects.
The Board also reviewed Fidelity's non-fund businesses and potential indirect benefits such businesses may have received as a result of their association with Fidelity's mutual fund business (i.e., fall-out benefits) as well as cases where Fidelity's affiliates may benefit from the fund's business. The Board noted that changes to fall-out benefits year-over-year reflect business developments at Fidelity's various businesses.
The Board considered the costs of the services provided by and the profits realized by Fidelity in connection with the operation of the fund and was satisfied that the profitability was not excessive.
Economies of Scale. The Board considered whether there have been economies of scale in respect of the management of the Fidelity funds, whether the Fidelity funds (including the fund) have appropriately benefited from any such economies of scale, and whether there is potential for realization of any further economies of scale. The Board considered the extent to which the fund will benefit from economies of scale as assets grow through increased services to the fund, through waivers or reimbursements, or through fee or expense ratio reductions. The Board also noted that a committee (the Economies of Scale Committee) created by it and the boards of other Fidelity funds periodically analyzes whether Fidelity attains economies of scale in respect of the management and servicing of the Fidelity funds, whether the Fidelity funds have appropriately benefited from such economies of scale, and whether there is potential for realization of any further economies of scale.
The Board recognized that the fund's management contract incorporates a "group fee" structure, which provides for lower group fee rates as total group assets increase, and for higher group fee rates as total group assets decrease (with "group assets" defined to include fund assets under FMR's management plus the assets of sector funds previously under FMR's management). FMR calculates the group fee rates based on a tiered asset "breakpoint" schedule that varies based on asset class. The Board considered that the group fee is designed to deliver the benefits of economies of scale to fund shareholders when total Fidelity fund assets increase, even if assets of any particular fund are unchanged or have declined, because some portion of Fidelity's costs are attributable to services provided to all Fidelity funds, and all funds benefit if those costs can be allocated among more assets. The Board concluded that, given the group fee structure, fund shareholders will benefit from lower management fees as group assets increase at the fund complex level, regardless of whether Fidelity achieves any such economies of scale.
The Board concluded, taking into account the analysis of the Economies of Scale Committee, that economies of scale, if any, are being appropriately shared between fund shareholders and Fidelity.
Additional Information Requested by the Board. In order to develop fully the factual basis for consideration of the Fidelity funds' advisory contracts, the Board requested and received additional information on certain topics, including: (i) fund performance trends, in particular the underperformance of certain funds, and Fidelity's long-term strategies for certain funds; (ii) Fidelity's fund profitability methodology, profitability trends for certain funds, and the impact of certain factors on fund profitability results; (iii) metrics for evaluating index fund and ETF performance and information about ETF trading characteristics; (iv) the methodology with respect to the evaluation of competitive fund data and peer group classifications and fee comparisons; (v) the expense structures for different funds and classes; (vi) information regarding other accounts managed by Fidelity, including collective investment trusts; and (vii) Fidelity's philosophies and strategies for evaluating funds and classes with lower or declining asset levels.
Based on its evaluation of all of the conclusions noted above, and after considering all factors it believed relevant, the Board concluded that the advisory fee arrangements are fair and reasonable, and that the fund's Advisory Contracts should be renewed.
GCS-SANN-0619
1.879383.110
Fidelity® Global Equity Income Fund
Semi-Annual Report April 30, 2019 |
|
Beginning on January 1, 2021, as permitted by regulations adopted by the Securities and Exchange Commission, paper copies of a fund’s shareholder reports will no longer be sent by mail, unless you specifically request paper copies of the reports from the fund or from your financial intermediary, such as a financial advisor, broker-dealer or bank. Instead, the reports will be made available on a website, and you will be notified by mail each time a report is posted and provided with a website link to access the report.
If you already elected to receive shareholder reports electronically, you will not be affected by this change and you need not take any action. You may elect to receive shareholder reports and other communications from a fund electronically, by contacting your financial intermediary. For Fidelity customers, visit Fidelity's web site or call Fidelity using the contact information listed below.
You may elect to receive all future reports in paper free of charge. If you wish to continue receiving paper copies of your shareholder reports, you may contact your financial intermediary or, if you are a Fidelity customer, visit Fidelity’s website, or call Fidelity at the applicable toll-free number listed below. Your election to receive reports in paper will apply to all funds held with the fund complex/your financial intermediary.
| Account Type | Website | Phone Number |
| Brokerage, Mutual Fund, or Annuity Contracts: | fidelity.com/mailpreferences | 1-800-343-3548 |
| Employer Provided Retirement Accounts: | netbenefits.fidelity.com/preferences (choose 'no' under Required Disclosures to continue to print) | 1-800-343-0860 |
| Advisor Sold Accounts Serviced Through Your Financial Intermediary: | Contact Your Financial Intermediary | Your Financial Intermediary's phone number |
| Advisor Sold Accounts Serviced by Fidelity: | institutional.fidelity.com | 1-877-208-0098 |
Contents
To view a fund's proxy voting guidelines and proxy voting record for the 12-month period ended June 30, visit http://www.fidelity.com/proxyvotingresults or visit the Securities and Exchange Commission's (SEC) web site at http://www.sec.gov.
You may also call 1-800-544-8544 to request a free copy of the proxy voting guidelines.
Standard & Poor's, S&P and S&P 500 are registered service marks of The McGraw-Hill Companies, Inc. and have been licensed for use by Fidelity Distributors Corporation.
Other third-party marks appearing herein are the property of their respective owners.
All other marks appearing herein are registered or unregistered trademarks or service marks of FMR LLC or an affiliated company. © 2019 FMR LLC. All rights reserved.
This report and the financial statements contained herein are submitted for the general information of the shareholders of the Fund. This report is not authorized for distribution to prospective investors in the Fund unless preceded or accompanied by an effective prospectus.
A fund files its complete schedule of portfolio holdings with the SEC for the first and third quarters of each fiscal year on Form N-PORT. Forms N-PORT are available on the SEC’s web site at http://www.sec.gov. A fund's Forms N-PORT may be reviewed and copied at the SEC’s Public Reference Room in Washington, DC. Information regarding the operation of the SEC's Public Reference Room may be obtained by calling 1-800-SEC-0330.
For a complete list of a fund's portfolio holdings, view the most recent holdings listing, semiannual report, or annual report on Fidelity's web site at http://www.fidelity.com, http://www.institutional.fidelity.com, or http://www.401k.com, as applicable.
NOT FDIC INSURED •MAY LOSE VALUE •NO BANK GUARANTEE
Neither the Fund nor Fidelity Distributors Corporation is a bank.
Investment Summary (Unaudited)
Geographic Diversification (% of fund's net assets)
| As of April 30, 2019 |
| | United States of America* | 53.9% |
| | United Kingdom | 8.6% |
| | Japan | 7.1% |
| | Canada | 4.4% |
| | Switzerland | 4.4% |
| | Netherlands | 2.2% |
| | France | 2.1% |
| | Germany | 1.9% |
| | Taiwan | 1.5% |
| | Other | 13.9% |

* Includes Short-Term investments and Net Other Assets (Liabilities).
Percentages are based on country or territory of incorporation and are adjusted for the effect of futures contracts, if applicable.
Asset Allocation as of April 30, 2019
| | % of fund's net assets |
| Stocks | 95.5 |
| Short-Term Investments and Net Other Assets (Liabilities) | 4.5 |
Top Ten Stocks as of April 30, 2019
| | % of fund's net assets |
| Microsoft Corp. (United States of America, Software) | 3.8 |
| Apple, Inc. (United States of America, Technology Hardware, Storage & Peripherals) | 3.3 |
| American Tower Corp. (United States of America, Equity Real Estate Investment Trusts (REITs)) | 2.8 |
| Hoya Corp. (Japan, Health Care Equipment & Supplies) | 2.0 |
| JPMorgan Chase & Co. (United States of America, Banks) | 1.9 |
| Constellation Software, Inc. (Canada, Software) | 1.9 |
| Amgen, Inc. (United States of America, Biotechnology) | 1.7 |
| Bank of America Corp. (United States of America, Banks) | 1.5 |
| Wells Fargo & Co. (United States of America, Banks) | 1.5 |
| Roche Holding AG (participation certificate) (Switzerland, Pharmaceuticals) | 1.5 |
| | 21.9 |
Top Market Sectors as of April 30, 2019
| | % of fund's net assets |
| Financials | 17.8 |
| Information Technology | 14.7 |
| Health Care | 13.9 |
| Consumer Staples | 11.7 |
| Industrials | 9.8 |
| Communication Services | 7.6 |
| Energy | 7.2 |
| Consumer Discretionary | 5.9 |
| Real Estate | 2.8 |
| Utilities | 2.6 |
Schedule of Investments April 30, 2019 (Unaudited)
Showing Percentage of Net Assets
| Common Stocks - 94.5% | | | |
| | | Shares | Value |
| Bailiwick of Guernsey - 0.2% | | | |
| Amdocs Ltd. | | 2,400 | $132,192 |
| Bailiwick of Jersey - 0.3% | | | |
| WPP PLC | | 19,122 | 238,600 |
| Belgium - 0.8% | | | |
| KBC Groep NV | | 7,745 | 573,502 |
| Bermuda - 0.8% | | | |
| Dairy Farm International Holdings Ltd. | | 4,000 | 31,320 |
| Hiscox Ltd. | | 12,200 | 266,313 |
| IHS Markit Ltd. (a) | | 4,900 | 280,574 |
|
| TOTAL BERMUDA | | | 578,207 |
|
| Brazil - 0.6% | | | |
| Equatorial Energia SA | | 9,600 | 201,005 |
| Ultrapar Participacoes SA | | 38,400 | 205,657 |
|
| TOTAL BRAZIL | | | 406,662 |
|
| Canada - 4.4% | | | |
| Alimentation Couche-Tard, Inc. Class B (sub. vtg.) | | 8,300 | 489,376 |
| Constellation Software, Inc. | | 1,462 | 1,289,980 |
| Fairfax Financial Holdings Ltd. (sub. vtg.) | | 343 | 163,571 |
| Imperial Oil Ltd. | | 13,348 | 387,776 |
| Suncor Energy, Inc. | | 21,721 | 716,305 |
|
| TOTAL CANADA | | | 3,047,008 |
|
| Cayman Islands - 1.0% | | | |
| Best Pacific International Holdings Ltd. | | 138,000 | 50,311 |
| SITC International Holdings Co. Ltd. | | 558,000 | 592,512 |
| Value Partners Group Ltd. | | 53,000 | 39,861 |
|
| TOTAL CAYMAN ISLANDS | | | 682,684 |
|
| China - 0.9% | | | |
| Kweichow Moutai Co. Ltd. (A Shares) | | 2,200 | 318,164 |
| Shanghai International Airport Co. Ltd. (A Shares) | | 30,468 | 319,523 |
|
| TOTAL CHINA | | | 637,687 |
|
| France - 2.1% | | | |
| Amundi SA (b) | | 3,140 | 225,573 |
| Elior SA (b) | | 14,779 | 204,549 |
| Sanofi SA | | 6,807 | 593,906 |
| VINCI SA | | 4,286 | 432,870 |
|
| TOTAL FRANCE | | | 1,456,898 |
|
| Germany - 1.9% | | | |
| Deutsche Post AG | | 6,779 | 235,641 |
| Hannover Reuck SE | | 2,000 | 301,486 |
| Linde PLC | | 1,886 | 339,300 |
| SAP SE | | 3,569 | 460,074 |
|
| TOTAL GERMANY | | | 1,336,501 |
|
| Hong Kong - 1.3% | | | |
| AIA Group Ltd. | | 51,200 | 524,259 |
| Techtronic Industries Co. Ltd. | | 52,000 | 375,841 |
|
| TOTAL HONG KONG | | | 900,100 |
|
| India - 1.1% | | | |
| HDFC Asset Management Co. Ltd. (b) | | 3,700 | 90,050 |
| HDFC Bank Ltd. sponsored ADR | | 1,800 | 206,370 |
| Housing Development Finance Corp. Ltd. | | 5,600 | 160,413 |
| Reliance Industries Ltd. | | 15,400 | 307,969 |
|
| TOTAL INDIA | | | 764,802 |
|
| Ireland - 1.2% | | | |
| Accenture PLC Class A | | 4,512 | 824,207 |
| Israel - 0.1% | | | |
| Ituran Location & Control Ltd. | | 965 | 35,483 |
| Japan - 7.1% | | | |
| Aucnet, Inc. | | 2,031 | 23,009 |
| Daiichikosho Co. Ltd. (c) | | 17,400 | 849,733 |
| Hoya Corp. | | 19,600 | 1,375,053 |
| Inaba Denki Sangyo Co. Ltd. | | 7,500 | 304,659 |
| Japan Meat Co. Ltd. | | 27,900 | 427,786 |
| Minebea Mitsumi, Inc. | | 21,500 | 380,224 |
| Mitani Shoji Co. Ltd. | | 4,000 | 208,627 |
| Nippon Telegraph & Telephone Corp. | | 8,400 | 349,511 |
| Nitori Holdings Co. Ltd. | | 1,400 | 166,525 |
| Ryohin Keikaku Co. Ltd. | | 200 | 37,955 |
| Sony Corp. | | 8,400 | 423,092 |
| Tsuruha Holdings, Inc. | | 3,900 | 331,550 |
|
| TOTAL JAPAN | | | 4,877,724 |
|
| Kenya - 0.6% | | | |
| Safaricom Ltd. | | 1,452,500 | 404,230 |
| Liberia - 0.5% | | | |
| Royal Caribbean Cruises Ltd. | | 3,025 | 365,844 |
| Luxembourg - 1.5% | | | |
| B&M European Value Retail SA | | 198,556 | 1,021,428 |
| Multi-National - 0.8% | | | |
| HKT Trust/HKT Ltd. unit | | 351,600 | 545,005 |
| Netherlands - 2.2% | | | |
| NXP Semiconductors NV | | 5,844 | 617,243 |
| Unilever NV (Certificaten Van Aandelen) (Bearer) | | 15,234 | 921,727 |
|
| TOTAL NETHERLANDS | | | 1,538,970 |
|
| Nigeria - 0.1% | | | |
| Guaranty Trust Bank PLC | | 617,500 | 56,486 |
| Norway - 0.5% | | | |
| Equinor ASA | | 15,863 | 353,851 |
| Sweden - 0.6% | | | |
| Indutrade AB | | 5,900 | 180,391 |
| Loomis AB (B Shares) | | 5,700 | 210,885 |
|
| TOTAL SWEDEN | | | 391,276 |
|
| Switzerland - 4.4% | | | |
| Alcon, Inc. (a) | | 1,200 | 69,840 |
| Banque Cantonale Vaudoise | | 440 | 347,181 |
| Chubb Ltd. | | 4,369 | 634,379 |
| Nestle SA (Reg. S) | | 9,545 | 918,970 |
| Roche Holding AG (participation certificate) | | 4,000 | 1,055,453 |
|
| TOTAL SWITZERLAND | | | 3,025,823 |
|
| Taiwan - 1.5% | | | |
| Taiwan Semiconductor Manufacturing Co. Ltd. | | 124,000 | 1,041,074 |
| United Kingdom - 8.6% | | | |
| AstraZeneca PLC sponsored ADR | | 20,367 | 767,021 |
| BP PLC | | 76,268 | 554,598 |
| British American Tobacco PLC (United Kingdom) | | 9,208 | 360,484 |
| Bunzl PLC | | 16,000 | 481,750 |
| Cineworld Group PLC | | 51,596 | 213,954 |
| Cranswick PLC | | 4,400 | 166,276 |
| Diageo PLC | | 11,600 | 489,029 |
| Hilton Food Group PLC | | 58,600 | 776,370 |
| Imperial Tobacco Group PLC | | 6,056 | 192,372 |
| Micro Focus International PLC | | 18,126 | 458,024 |
| Moneysupermarket.com Group PLC | | 56,608 | 268,472 |
| Nielsen Holdings PLC | | 4,200 | 107,226 |
| Reckitt Benckiser Group PLC | | 5,400 | 436,895 |
| St. James's Place Capital PLC | | 23,878 | 349,200 |
| Standard Life PLC | | 39,950 | 145,292 |
| Victrex PLC | | 5,800 | 183,937 |
|
| TOTAL UNITED KINGDOM | | | 5,950,900 |
|
| United States of America - 49.4% | | | |
| Altria Group, Inc. | | 11,271 | 612,353 |
| Ameren Corp. | | 7,443 | 541,627 |
| American Tower Corp. | | 9,918 | 1,936,985 |
| AMETEK, Inc. | | 10,886 | 959,819 |
| Amgen, Inc. | | 6,435 | 1,153,924 |
| Apple, Inc. | | 11,327 | 2,272,989 |
| Bank of America Corp. | | 35,013 | 1,070,698 |
| Becton, Dickinson & Co. | | 3,709 | 892,905 |
| Bristol-Myers Squibb Co. | | 10,450 | 485,194 |
| Capital One Financial Corp. | | 8,848 | 821,360 |
| Charter Communications, Inc. Class A (a) | | 919 | 341,124 |
| Chevron Corp. | | 8,059 | 967,564 |
| Cigna Corp. | | 1,300 | 206,492 |
| Citigroup, Inc. | | 5,163 | 365,024 |
| Comcast Corp. Class A | | 14,226 | 619,258 |
| ConocoPhillips Co. | | 11,039 | 696,782 |
| Danaher Corp. | | 3,800 | 503,272 |
| Diamond Hill Investment Group, Inc. | | 1,000 | 144,480 |
| Dow, Inc. (a) | | 3,448 | 195,605 |
| DowDuPont, Inc. | | 7,345 | 282,415 |
| Eli Lilly & Co. | | 3,267 | 382,370 |
| Equifax, Inc. | | 1,700 | 214,115 |
| Fortive Corp. | | 3,930 | 339,316 |
| General Dynamics Corp. | | 1,470 | 262,718 |
| General Electric Co. | | 43,432 | 441,703 |
| Huntington Bancshares, Inc. | | 6,200 | 86,304 |
| Interpublic Group of Companies, Inc. | | 10,012 | 230,276 |
| Johnson & Johnson | | 5,887 | 831,244 |
| JPMorgan Chase & Co. | | 11,405 | 1,323,550 |
| Lowe's Companies, Inc. | | 8,498 | 961,464 |
| M&T Bank Corp. | | 1,100 | 187,077 |
| Marsh & McLennan Companies, Inc. | | 2,500 | 235,725 |
| McCormick & Co., Inc. (non-vtg.) | | 700 | 107,779 |
| MetLife, Inc. | | 5,400 | 249,102 |
| Microsoft Corp. | | 20,087 | 2,623,361 |
| MSCI, Inc. | | 1,719 | 387,428 |
| NextEra Energy, Inc. | | 1,500 | 291,660 |
| Northrop Grumman Corp. | | 900 | 260,919 |
| NRG Energy, Inc. | | 8,200 | 337,594 |
| PepsiCo, Inc. | | 6,533 | 836,551 |
| Philip Morris International, Inc. | | 2,800 | 242,368 |
| Phillips 66 Co. | | 3,500 | 329,945 |
| PVH Corp. | | 1,000 | 128,990 |
| Qualcomm, Inc. | | 3,267 | 281,387 |
| S&P Global, Inc. | | 1,670 | 368,502 |
| SunTrust Banks, Inc. | | 12,054 | 789,296 |
| The J.M. Smucker Co. | | 3,275 | 401,613 |
| The Kraft Heinz Co. | | 4,300 | 142,932 |
| The Travelers Companies, Inc. | | 2,900 | 416,875 |
| The Walt Disney Co. | | 3,675 | 503,365 |
| U.S. Bancorp | | 8,491 | 452,740 |
| United Technologies Corp. | | 3,830 | 546,196 |
| UnitedHealth Group, Inc. | | 4,297 | 1,001,502 |
| Valero Energy Corp. | | 4,610 | 417,943 |
| Verizon Communications, Inc. | | 18,297 | 1,046,405 |
| Vistra Energy Corp. | | 7,200 | 196,200 |
| Wabtec Corp. | | 228 | 16,888 |
| WEC Energy Group, Inc. | | 2,600 | 203,918 |
| Wells Fargo & Co. | | 22,025 | 1,066,230 |
|
| TOTAL UNITED STATES OF AMERICA | | | 34,213,421 |
|
| TOTAL COMMON STOCKS | | | |
| (Cost $49,432,068) | | | 65,400,565 |
|
| Nonconvertible Preferred Stocks - 1.0% | | | |
| Brazil - 0.6% | | | |
| Itau Unibanco Holding SA | | 48,350 | 417,148 |
| Spain - 0.4% | | | |
| Grifols SA Class B | | 12,900 | 248,342 |
| TOTAL NONCONVERTIBLE PREFERRED STOCKS | | | |
| (Cost $651,840) | | | 665,490 |
| | | Principal Amount | Value |
|
| Nonconvertible Bonds - 0.0% | | | |
| Canada - 0.0% | | | |
| Constellation Software, Inc. Canada Consumer Price Index + 6.500% 8.8% 3/31/40 (d)(e) | CAD | | |
| (Cost $2,060) | | CAD 2,400 | 2,284 |
| | | Shares | Value |
|
| Money Market Funds - 5.2% | | | |
| Fidelity Cash Central Fund, 2.49% (f) | | | |
| (Cost $3,593,611) | | 3,592,896 | 3,593,615 |
| TOTAL INVESTMENT IN SECURITIES - 100.7% | | | |
| (Cost $53,679,579) | | | 69,661,954 |
| NET OTHER ASSETS (LIABILITIES) - (0.7)% | | | (459,623) |
| NET ASSETS - 100% | | | $69,202,331 |
Currency Abbreviations
CAD – Canadian dollar
Categorizations in the Schedule of Investments are based on country or territory of incorporation.
Legend
(a) Non-income producing
(b) Security exempt from registration under Rule 144A of the Securities Act of 1933. These securities may be resold in transactions exempt from registration, normally to qualified institutional buyers. At the end of the period, the value of these securities amounted to $520,172 or 0.8% of net assets.
(c) A portion of the security sold on a delayed delivery basis.
(d) Coupon rates for floating and adjustable rate securities reflect the rates in effect at period end.
(e) Coupon is indexed to a floating interest rate which may be multiplied by a specified factor and/or subject to caps or floors.
(f) Affiliated fund that is generally available only to investment companies and other accounts managed by Fidelity Investments. The rate quoted is the annualized seven-day yield of the fund at period end. A complete unaudited listing of the fund's holdings as of its most recent quarter end is available upon request. In addition, each Fidelity Central Fund's financial statements are available on the SEC's website or upon request.
Affiliated Central Funds
Information regarding fiscal year to date income earned by the Fund from investments in Fidelity Central Funds is as follows:
| Fund | Income earned |
| Fidelity Cash Central Fund | $37,051 |
| Fidelity Securities Lending Cash Central Fund | 2,939 |
| Total | $39,990 |
Amounts in the income column in the above table include any capital gain distributions from underlying funds, which are presented in the corresponding line-item in the Statement of Operations, if applicable.
Investment Valuation
The following is a summary of the inputs used, as of April 30, 2019, involving the Fund's assets and liabilities carried at fair value. The inputs or methodology used for valuing securities may not be an indication of the risk associated with investing in those securities. For more information on valuation inputs, and their aggregation into the levels used below, please refer to the Investment Valuation section in the accompanying Notes to Financial Statements.
| | Valuation Inputs at Reporting Date: |
| Description | Total | Level 1 | Level 2 | Level 3 |
| Investments in Securities: | | | | |
| Equities: | | | | |
| Communication Services | $5,341,461 | $4,753,350 | $588,111 | $-- |
| Consumer Discretionary | 4,027,480 | 3,604,388 | 423,092 | -- |
| Consumer Staples | 8,203,915 | 5,076,810 | 3,127,105 | -- |
| Energy | 4,938,390 | 4,383,792 | 554,598 | -- |
| Financials | 12,465,475 | 11,941,216 | 524,259 | -- |
| Health Care | 9,566,518 | 7,668,817 | 1,897,701 | -- |
| Industrials | 6,776,556 | 5,716,769 | 1,059,787 | -- |
| Information Technology | 10,036,014 | 8,534,866 | 1,501,148 | -- |
| Materials | 1,001,257 | 1,001,257 | -- | -- |
| Real Estate | 1,936,985 | 1,936,985 | -- | -- |
| Utilities | 1,772,004 | 1,772,004 | -- | -- |
| Corporate Bonds | 2,284 | -- | 2,284 | -- |
| Money Market Funds | 3,593,615 | 3,593,615 | -- | -- |
| Total Investments in Securities: | $69,661,954 | $59,983,869 | $9,678,085 | $-- |
See accompanying notes which are an integral part of the financial statements.
Financial Statements
Statement of Assets and Liabilities
| | | April 30, 2019 (Unaudited) |
| Assets | | |
Investment in securities, at value — See accompanying schedule:
Unaffiliated issuers (cost $50,085,968) | $66,068,339 | |
| Fidelity Central Funds (cost $3,593,611) | 3,593,615 | |
| Total Investment in Securities (cost $53,679,579) | | $69,661,954 |
| Foreign currency held at value (cost $9,336) | | 9,409 |
| Receivable for securities sold on a delayed delivery basis | | 29,444 |
| Receivable for fund shares sold | | 61,453 |
| Dividends receivable | | 278,191 |
| Interest receivable | | 13 |
| Distributions receivable from Fidelity Central Funds | | 7,460 |
| Prepaid expenses | | 35 |
| Other receivables | | 1,241 |
| Total assets | | 70,049,200 |
| Liabilities | | |
| Payable for fund shares redeemed | $51,006 | |
| Accrued management fee | 39,548 | |
| Transfer agent fee payable | 10,408 | |
| Other affiliated payables | 2,978 | |
| Audit fee payable | 27,871 | |
| Other payables and accrued expenses | 15,058 | |
| Total liabilities | | 146,869 |
| Net Assets | | $69,902,331 |
| Net Assets consist of: | | |
| Paid in capital | | $54,223,222 |
| Total distributable earnings (loss) | | 15,679,109 |
| Net Assets, for 4,980,824 shares outstanding | | $69,902,331 |
| Net Asset Value, offering price and redemption price per share ($69,902,331 ÷ 4,980,824 shares) | | $14.03 |
See accompanying notes which are an integral part of the financial statements.
Statement of Operations
| | | Six months ended April 30, 2019 (Unaudited) |
| Investment Income | | |
| Dividends | | $939,751 |
| Interest | | 73 |
| Income from Fidelity Central Funds | | 39,990 |
| Income before foreign taxes withheld | | 979,814 |
| Less foreign taxes withheld | | (33,372) |
| Total income | | 946,442 |
| Expenses | | |
| Management fee | $230,130 | |
| Transfer agent fees | 62,739 | |
| Accounting and security lending fees | 17,307 | |
| Custodian fees and expenses | 3,870 | |
| Independent trustees' fees and expenses | 189 | |
| Registration fees | 21,543 | |
| Audit | 44,988 | |
| Legal | 1,402 | |
| Miscellaneous | 219 | |
| Total expenses before reductions | 382,387 | |
| Expense reductions | (1,425) | |
| Total expenses after reductions | | 380,962 |
| Net investment income (loss) | | 565,480 |
| Realized and Unrealized Gain (Loss) | | |
| Net realized gain (loss) on: | | |
| Investment securities: | | |
| Unaffiliated issuers | (449,890) | |
| Fidelity Central Funds | (4) | |
| Foreign currency transactions | 3,977 | |
| Total net realized gain (loss) | | (445,917) |
| Change in net unrealized appreciation (depreciation) on: | | |
| Investment securities: | | |
| Unaffiliated issuers (net of increase in deferred foreign taxes of $12,042) | 5,398,353 | |
| Fidelity Central Funds | 4 | |
| Assets and liabilities in foreign currencies | 63 | |
| Total change in net unrealized appreciation (depreciation) | | 5,398,420 |
| Net gain (loss) | | 4,952,503 |
| Net increase (decrease) in net assets resulting from operations | | $5,517,983 |
See accompanying notes which are an integral part of the financial statements.
Statement of Changes in Net Assets
| | Six months ended April 30, 2019 (Unaudited) | Year ended October 31, 2018 |
| Increase (Decrease) in Net Assets | | |
| Operations | | |
| Net investment income (loss) | $565,480 | $1,363,605 |
| Net realized gain (loss) | (445,917) | 3,307,849 |
| Change in net unrealized appreciation (depreciation) | 5,398,420 | (5,807,416) |
| Net increase (decrease) in net assets resulting from operations | 5,517,983 | (1,135,962) |
| Distributions to shareholders | (3,033,638) | (2,362,860) |
| Share transactions | | |
| Proceeds from sales of shares | 4,837,721 | 13,947,450 |
| Reinvestment of distributions | 2,868,046 | 2,226,993 |
| Cost of shares redeemed | (8,819,380) | (25,151,825) |
| Net increase (decrease) in net assets resulting from share transactions | (1,113,613) | (8,977,382) |
| Redemption fees | – | 1,273 |
| Total increase (decrease) in net assets | 1,370,732 | (12,474,931) |
| Net Assets | | |
| Beginning of period | 68,531,599 | 81,006,530 |
| End of period | $69,902,331 | $68,531,599 |
| Other Information | | |
| Shares | | |
| Sold | 367,254 | 967,487 |
| Issued in reinvestment of distributions | 227,529 | 156,544 |
| Redeemed | (677,628) | (1,759,434) |
| Net increase (decrease) | (82,845) | (635,403) |
See accompanying notes which are an integral part of the financial statements.
Financial Highlights
Fidelity Global Equity Income Fund
| | Six months ended (Unaudited) April 30, | Years endedOctober 31, | | | | |
| | 2019 | 2018 | 2017 | 2016 | 2015 | 2014 |
| Selected Per–Share Data | | | | | | |
| Net asset value, beginning of period | $13.53 | $14.21 | $12.06 | $12.12 | $12.87 | $12.20 |
| Income from Investment Operations | | | | | | |
| Net investment income (loss)A | .11 | .25 | .17 | .15 | .16 | .28B |
| Net realized and unrealized gain (loss) | 1.00 | (.50) | 2.15 | .11 | .21 | .92 |
| Total from investment operations | 1.11 | (.25) | 2.32 | .26 | .37 | 1.20 |
| Distributions from net investment income | (.10) | (.25) | (.17) | (.15) | (.16) | (.25) |
| Distributions from net realized gain | (.51) | (.18) | – | (.16) | (.95) | (.28) |
| Total distributions | (.61) | (.43) | (.17) | (.32)C | (1.12)D | (.53) |
| Redemption fees added to paid in capitalA | – | –E | –E | –E | –E | –E |
| Net asset value, end of period | $14.03 | $13.53 | $14.21 | $12.06 | $12.12 | $12.87 |
| Total ReturnF,G | 8.69% | (1.88)% | 19.31% | 2.13% | 2.93% | 10.10% |
| Ratios to Average Net AssetsH,I | | | | | | |
| Expenses before reductions | 1.14%J | 1.06% | 1.13% | 1.18% | 1.15% | 1.16% |
| Expenses net of fee waivers, if any | 1.14%J | 1.06% | 1.13% | 1.18% | 1.15% | 1.16% |
| Expenses net of all reductions | 1.14%J | 1.05% | 1.13% | 1.18% | 1.14% | 1.16% |
| Net investment income (loss) | 1.69%J | 1.75% | 1.29% | 1.24% | 1.27% | 2.21%B |
| Supplemental Data | | | | | | |
| Net assets, end of period (000 omitted) | $69,902 | $68,532 | $81,007 | $71,675 | $67,926 | $52,038 |
| Portfolio turnover rateK | 34%J | 34% | 37% | 40% | 64% | 92% |
A Calculated based on average shares outstanding during the period.
B Net investment income per share reflects a large, non-recurring dividend which amounted to $.08 per share. Excluding this non-recurring dividend, the ratio of net investment income (loss) to average net assets would have been 1.56%.
C Total distributions of $.32 per share is comprised of distributions from net investment income of $.153 and distributions from net realized gain of $.162 per share.
D Total distributions of $1.12 per share is comprised of distributions from net investment income of $.164 and distributions from net realized gain of $.954 per share.
E Amount represents less than $.005 per share.
F Total returns for periods of less than one year are not annualized.
G Total returns would have been lower if certain expenses had not been reduced during the applicable periods shown.
H Fees and expenses of any underlying Fidelity Central Funds are not included in the Fund's expense ratio. The Fund indirectly bears its proportionate share of the expenses of any underlying Fidelity Central Funds.
I Expense ratios reflect operating expenses of the Fund. Expenses before reductions do not reflect amounts reimbursed by the investment adviser or reductions from brokerage service arrangements or reductions from other expense offset arrangements and do not represent the amount paid by the Fund during periods when reimbursements or reductions occur. Expenses net of fee waivers reflect expenses after reimbursement by the investment adviser but prior to reductions from brokerage service arrangements or other expense offset arrangements. Expenses net of all reductions represent the net expenses paid by the Fund.
J Annualized
K Amount does not include the portfolio activity of any underlying Fidelity Central Funds.
See accompanying notes which are an integral part of the financial statements.
Notes to Financial Statements (Unaudited)
For the period ended April 30, 2019
1. Organization.
Fidelity Global Equity Income Fund (the Fund) is a fund of Fidelity Investment Trust (the Trust) and is authorized to issue an unlimited number of shares. Share transactions on the Statement of Changes in Net Assets may contain exchanges between affiliated funds. The Trust is registered under the Investment Company Act of 1940, as amended (the 1940 Act), as an open-end management investment company organized as a Massachusetts business trust.
2. Investments in Fidelity Central Funds.
The Fund invests in Fidelity Central Funds, which are open-end investment companies generally available only to other investment companies and accounts managed by the investment adviser and its affiliates. The Fund's Schedule of Investments lists each of the Fidelity Central Funds held as of period end, if any, as an investment of the Fund, but does not include the underlying holdings of each Fidelity Central Fund. As an Investing Fund, the Fund indirectly bears its proportionate share of the expenses of the underlying Fidelity Central Funds.
The Money Market Central Funds seek preservation of capital and current income and are managed by Fidelity Investments Money Management, Inc. (FIMM), an affiliate of the investment adviser. Annualized expenses of the Money Market Central Funds as of their most recent shareholder report date are less than .005%.
A complete unaudited list of holdings for each Fidelity Central Fund is available upon request or at the Securities and Exchange Commission (the SEC) website at www.sec.gov. In addition, the financial statements of the Fidelity Central Funds are available on the SEC website or upon request.
3. Significant Accounting Policies.
The Fund is an investment company and applies the accounting and reporting guidance of the Financial Accounting Standards Board (FASB) Accounting Standards Codification Topic 946 Financial Services – Investments Companies. The financial statements have been prepared in conformity with accounting principles generally accepted in the United States of America (GAAP), which require management to make certain estimates and assumptions at the date of the financial statements. Actual results could differ from those estimates. Subsequent events, if any, through the date that the financial statements were issued have been evaluated in the preparation of the financial statements. The following summarizes the significant accounting policies of the Fund:
Investment Valuation. Investments are valued as of 4:00 p.m. Eastern time on the last calendar day of the period. The Board of Trustees (the Board) has delegated the day to day responsibility for the valuation of the Fund's investments to the Fair Value Committee (the Committee) established by the Fund's investment adviser. In accordance with valuation policies and procedures approved by the Board, the Fund attempts to obtain prices from one or more third party pricing vendors or brokers to value its investments. When current market prices, quotations or currency exchange rates are not readily available or reliable, investments will be fair valued in good faith by the Committee, in accordance with procedures adopted by the Board. Factors used in determining fair value vary by investment type and may include market or investment specific events, changes in interest rates and credit quality. The frequency with which these procedures are used cannot be predicted and they may be utilized to a significant extent. The Committee oversees the Fund's valuation policies and procedures and reports to the Board on the Committee's activities and fair value determinations. The Board monitors the appropriateness of the procedures used in valuing the Fund's investments and ratifies the fair value determinations of the Committee.
The Fund categorizes the inputs to valuation techniques used to value its investments into a disclosure hierarchy consisting of three levels as shown below:
- Level 1 – quoted prices in active markets for identical investments
- Level 2 – other significant observable inputs (including quoted prices for similar investments, interest rates, prepayment speeds, etc.)
- Level 3 – unobservable inputs (including the Fund's own assumptions based on the best information available)
Valuation techniques used to value the Fund's investments by major category are as follows:
Equity securities, including restricted securities, for which market quotations are readily available, are valued at the last reported sale price or official closing price as reported by a third party pricing vendor on the primary market or exchange on which they are traded and are categorized as Level 1 in the hierarchy. In the event there were no sales during the day or closing prices are not available, securities are valued at the last quoted bid price or may be valued using the last available price and are generally categorized as Level 2 in the hierarchy. For foreign equity securities, when market or security specific events arise, comparisons to the valuation of American Depositary Receipts (ADRs), futures contracts, Exchange-Traded Funds (ETFs)and certain indexes as well as quoted prices for similar securities may be used and would be categorized as Level 2 in the hierarchy. For equity securities, including restricted securities, where observable inputs are limited, assumptions about market activity and risk are used and these securities may be categorized as Level 3 in the hierarchy.
Debt securities, including restricted securities, are valued based on evaluated prices received from third party pricing vendors or from brokers who make markets in such securities. Corporate bonds are valued by pricing vendors who utilize matrix pricing which considers yield or price of bonds of comparable quality, coupon, maturity and type or by broker-supplied prices. When independent prices are unavailable or unreliable, debt securities may be valued utilizing pricing methodologies which consider similar factors that would be used by third party pricing vendors. Debt securities are generally categorized as Level 2 in the hierarchy but may be Level 3 depending on the circumstances.
Investments in open-end mutual funds, including the Fidelity Central Funds, are valued at their closing net asset value (NAV) each business day and are categorized as Level 1 in the hierarchy.
Changes in valuation techniques may result in transfers in or out of an assigned level within the disclosure hierarchy. The aggregate value of investments by input level as of April 30, 2019 is included at the end of the Fund's Schedule of Investments.
Foreign Currency. The Fund may use foreign currency contracts to facilitate transactions in foreign-denominated securities. Gains and losses from these transactions may arise from changes in the value of the foreign currency or if the counterparties do not perform under the contracts' terms.
Foreign-denominated assets, including investment securities, and liabilities are translated into U.S. dollars at the exchange rates at period end. Purchases and sales of investment securities, income and dividends received and expenses denominated in foreign currencies are translated into U.S. dollars at the exchange rate in effect on the transaction date.
The effects of exchange rate fluctuations on investments are included with the net realized and unrealized gain (loss) on investment securities. Other foreign currency transactions resulting in realized and unrealized gain (loss) are disclosed separately.
Investment Transactions and Income. For financial reporting purposes, the Fund's investment holdings and NAV include trades executed through the end of the last business day of the period. The NAV per share for processing shareholder transactions is calculated as of the close of business of the New York Stock Exchange (NYSE), normally 4:00 p.m. Eastern time and includes trades executed through the end of the prior business day. Gains and losses on securities sold are determined on the basis of identified cost and include proceeds received from litigation. Dividend income is recorded on the ex-dividend date, except for certain dividends from foreign securities where the ex-dividend date may have passed, which are recorded as soon as the Fund is informed of the ex-dividend date. Non-cash dividends included in dividend income, if any, are recorded at the fair market value of the securities received. Income and capital gain distributions from Fidelity Central Funds, if any, are recorded on the ex-dividend date. Certain distributions received by the Fund represent a return of capital or capital gain. The Fund determines the components of these distributions subsequent to the ex-dividend date, based upon receipt of tax filings or other correspondence relating to the underlying investment. These distributions are recorded as a reduction of cost of investments and/or as a realized gain. Interest income is accrued as earned and includes coupon interest and amortization of premium and accretion of discount on debt securities as applicable. Investment income is recorded net of foreign taxes withheld where recovery of such taxes is uncertain.
Expenses. Expenses directly attributable to a fund are charged to that fund. Expenses attributable to more than one fund are allocated among the respective funds on the basis of relative net assets or other appropriate methods. Expense estimates are accrued in the period to which they relate and adjustments are made when actual amounts are known.
Income Tax Information and Distributions to Shareholders. Each year, the Fund intends to qualify as a regulated investment company under Subchapter M of the Internal Revenue Code, including distributing substantially all of its taxable income and realized gains. As a result, no provision for U.S. Federal income taxes is required. The Fund files a U.S. federal tax return, in addition to state and local tax returns as required. The Fund's federal income tax returns are subject to examination by the Internal Revenue Service (IRS) for a period of three fiscal years after they are filed. State and local tax returns may be subject to examination for an additional fiscal year depending on the jurisdiction. Foreign taxes are provided for based on the Fund's understanding of the tax rules and rates that exist in the foreign markets in which it invests. The Fund is subject to a tax imposed on capital gains by certain countries in which it invests. An estimated deferred tax liability for net unrealized appreciation on the applicable securities is included in Other payables and accrued expenses on the Statement of Assets & Liabilities.
Distributions are declared and recorded on the ex-dividend date. Income and capital gain distributions are determined in accordance with income tax regulations, which may differ from GAAP.
Capital accounts within the financial statements are adjusted for permanent book-tax differences. These adjustments have no impact on net assets or the results of operations. Capital accounts are not adjusted for temporary book-tax differences which will reverse in a subsequent period.
Book-tax differences are primarily due to foreign currency transactions, passive foreign investment companies (PFIC), partnerships and losses deferred due to wash sales.
As of period end, the cost and unrealized appreciation (depreciation) in securities, and derivatives if applicable, for federal income tax purposes were as follows:
| Gross unrealized appreciation | $17,363,600 |
| Gross unrealized depreciation | (1,390,089) |
| Net unrealized appreciation (depreciation) | $15,973,511 |
| Tax cost | $53,688,443 |
Delayed Delivery Transactions and When-Issued Securities. During the period, the Fund transacted in securities on a delayed delivery or when-issued basis. Payment and delivery may take place after the customary settlement period for that security. The price of the underlying securities and the date when the securities will be delivered and paid for are fixed at the time the transaction is negotiated. Losses may arise due to changes in the value of the underlying securities or if the counterparty does not perform under the contract's terms, or if the issuer does not issue the securities due to political, economic, or other factors.
Restricted Securities. The Fund may invest in securities that are subject to legal or contractual restrictions on resale. These securities generally may be resold in transactions exempt from registration or to the public if the securities are registered. Disposal of these securities may involve time-consuming negotiations and expense, and prompt sale at an acceptable price may be difficult. Information regarding restricted securities is included at the end of the Fund's Schedule of Investments.
4. Purchases and Sales of Investments.
Purchases and sales of, other short-term securities, aggregated $10,888,594 and $17,410,245, respectively.
5. Fees and Other Transactions with Affiliates.
Management Fee. Fidelity Management & Research Company (the investment adviser) and its affiliates provide the Fund with investment management related services for which the Fund pays a monthly management fee. The management fee is the sum of an individual fund fee rate that is based on an annual rate of .45% of the Fund's average net assets and an annualized group fee rate that averaged .24% during the period. The group fee rate is based upon the average net assets of all the mutual funds advised by the investment adviser, including any mutual funds previously advised by the investment adviser that are currently advised by Fidelity SelectCo, LLC, an affiliate of the investment adviser. The group fee rate decreases as assets under management increase and increases as assets under management decrease. For the reporting period, the total annualized management fee rate was .69% of the Fund's average net assets.
Transfer Agent Fees. Fidelity Investments Institutional Operations Company, Inc. (FIIOC), an affiliate of the investment adviser, is the Fund's transfer, dividend disbursing and shareholder servicing agent. FIIOC receives account fees and asset-based fees that vary according to account size and type of account. FIIOC pays for typesetting, printing and mailing of shareholder reports, except proxy statements. For the period, the transfer agent fees were equivalent to an annualized rate of .19% of average net assets.
Accounting and Security Lending Fees. Fidelity Service Company, Inc. (FSC), an affiliate of the investment adviser, maintains the Fund's accounting records. The accounting fee is based on the level of average net assets for each month. Prior to April 1, 2019, FSC had a separate agreement with the Fund for administration of the security lending program, based on the number and duration of lending transactions. For the period, the total fees paid for accounting and administration of securities lending were equivalent to an annualized rate of .05%.
Brokerage Commissions. The Fund placed a portion of its portfolio transactions with brokerage firms which are affiliates of the investment adviser. Brokerage commissions are included in net realized gain (loss) and change in net unrealized appreciation (depreciation) in the Statement of Operations. The commissions paid to these affiliated firms were $175 for the period.
Interfund Trades. The Fund may purchase from or sell securities to other Fidelity Funds under procedures adopted by the Board. The procedures have been designed to ensure these interfund trades are executed in accordance with Rule 17a-7 of the 1940 Act. Interfund trades are included within the respective purchases and sales amounts shown in the Purchases and Sales of Investments note.
6. Committed Line of Credit.
The Fund participates with other funds managed by the investment adviser or an affiliate in a $4.25 billion credit facility (the "line of credit") to be utilized for temporary or emergency purposes to fund shareholder redemptions or for other short-term liquidity purposes. The Fund has agreed to pay commitment fees on its pro-rata portion of the line of credit, which amounted to $96 and is reflected in Miscellaneous expenses on the Statement of Operations. During the period, the Fund did not borrow on this line of credit.
7. Security Lending.
The Fund lends portfolio securities through a lending agent from time to time in order to earn additional income. For equity securities, a lending agent is used and may loan securities to certain qualified borrowers, including Fidelity Capital Markets (FCM), a broker-dealer affiliated with the Fund. On the settlement date of the loan, the Fund receives collateral (in the form of U.S. Treasury obligations, letters of credit and/or cash) against the loaned securities and maintains collateral in an amount not less than 100% of the market value of the loaned securities during the period of the loan. The market value of the loaned securities is determined at the close of business of the Fund and any additional required collateral is delivered to the Fund on the next business day. The Fund or borrower may terminate the loan at any time, and if the borrower defaults on its obligation to return the securities loaned because of insolvency or other reasons, the Fund may apply collateral received from the borrower against the obligation. The Fund may experience delays and costs in recovering the securities loaned. Any cash collateral received is invested in the Fidelity Securities Lending Cash Central Fund. At period end, there were no security loans outstanding. Security lending income represents the income earned on investing cash collateral, less rebates paid to borrowers and any lending agent fees associated with the loan, plus any premium payments received for lending certain types of securities. Security lending income is presented in the Statement of Operations as a component of income from Fidelity Central Funds. Total security lending income during the period amounted to $2,939. During the period, there were no securities loaned to FCM.
8. Expense Reductions.
Commissions paid to certain brokers with whom the investment adviser, or its affiliates, places trades on behalf of the Fund include an amount in addition to trade execution, which may be rebated back to the Fund to offset certain expenses. This amount totaled $913 for the period. Through arrangements with the Fund's custodian, credits realized as a result of certain uninvested cash balances were used to reduce the Fund's expenses. During the period, these credits reduced the Fund's custody expenses by $254.
In addition, during the period the investment adviser reimbursed and/or waived a portion of operating expenses in the amount of $258.
9. Other.
The Fund's organizational documents provide former and current trustees and officers with a limited indemnification against liabilities arising in connection with the performance of their duties to the Fund. In the normal course of business, the Fund may also enter into contracts that provide general indemnifications. The Fund's maximum exposure under these arrangements is unknown as this would be dependent on future claims that may be made against the Fund. The risk of material loss from such claims is considered remote.
Shareholder Expense Example
As a shareholder of the Fund, you incur two types of costs: (1) transaction costs and (2) ongoing costs, including management fees and other Fund expenses. This Example is intended to help you understand your ongoing costs (in dollars) of investing in the Fund and to compare these costs with the ongoing costs of investing in other mutual funds.
The Example is based on an investment of $1,000 invested at the beginning of the period and held for the entire period (November 1, 2018 to April 30, 2019).
Actual Expenses
The first line of the accompanying table provides information about actual account values and actual expenses. You may use the information in this line, together with the amount you invested, to estimate the expenses that you paid over the period. Simply divide your account value by $1,000.00 (for example, an $8,600 account value divided by $1,000.00 = 8.6), then multiply the result by the number in the first line under the heading entitled "Expenses Paid During Period" to estimate the expenses you paid on your account during this period. In addition, the Fund, as a shareholder in the underlying Fidelity Central Funds, will indirectly bear its pro-rata share of the fees and expenses incurred by the underlying Fidelity Central Funds. These fees and expenses are not included in the Fund's annualized expense ratio used to calculate the expense estimate in the table below.
Hypothetical Example for Comparison Purposes
The second line of the accompanying table provides information about hypothetical account values and hypothetical expenses based on the Fund's actual expense ratio and an assumed rate of return of 5% per year before expenses, which is not the Fund's actual return. The hypothetical account values and expenses may not be used to estimate the actual ending account balance or expenses you paid for the period. You may use this information to compare the ongoing costs of investing in the Fund and other funds. To do so, compare this 5% hypothetical example with the 5% hypothetical examples that appear in the shareholder reports of the other funds. In addition, the Fund, as a shareholder in the underlying Fidelity Central Funds, will indirectly bear its pro-rata share of the fees and expenses incurred by the underlying Fidelity Central Funds. These fees and expenses are not included in the Fund's annualized expense ratio used to calculate the expense estimate in the table below.
Please note that the expenses shown in the table are meant to highlight your ongoing costs only and do not reflect any transaction costs. Therefore, the second line of the table is useful in comparing ongoing costs only, and will not help you determine the relative total costs of owning different funds.
| | Annualized Expense Ratio-A | Beginning
Account Value
November 1, 2018 | Ending
Account Value
April 30, 2019 | Expenses Paid
During Period-B
November 1, 2018
to April 30, 2019 |
| Actual | 1.14% | $1,000.00 | $1,086.90 | $5.90 |
| Hypothetical-C | | $1,000.00 | $1,019.14 | $5.71 |
A Annualized expense ratio reflects expenses net of applicable fee waivers.
B Expenses are equal to the Fund's annualized expense ratio, multiplied by the average account value over the period, multiplied by 181/365 (to reflect the one-half year period).
C 5% return per year before expenses
Board Approval of Investment Advisory Contracts
Fidelity Global Equity Income Fund
Each year, the Board of Trustees, including the Independent Trustees (together, the Board), votes on the renewal of the management contract with Fidelity Management & Research Company (FMR) and the sub-advisory agreements (together, the Advisory Contracts) for the fund. FMR and the sub-advisers are referred to herein as the Investment Advisers. The Board, assisted by the advice of fund counsel and Independent Trustees' counsel, requests and considers a broad range of information relevant to the renewal of the Advisory Contracts throughout the year.
The Board meets regularly and, at each of its meetings, covers an extensive agenda of topics and materials and considers factors that are relevant to its annual consideration of the renewal of the fund's Advisory Contracts, including the services and support provided to the fund and its shareholders. The Board has established various standing committees (Committees), each composed of and chaired by Independent Trustees with varying backgrounds, to which the Board has assigned specific subject matter responsibilities in order to enhance effective decision-making by the Board. The Board, acting directly and through its Committees, requests and receives information concerning the annual consideration of the renewal of the fund's Advisory Contracts. The Board also meets as needed to review matters specifically related to the Board's annual consideration of the renewal of the Advisory Contracts. Members of the Board may also meet with trustees of other Fidelity funds through joint ad hoc committees to discuss certain matters relevant to all of the Fidelity funds.
At its January 2019 meeting, the Board unanimously determined to renew the fund's Advisory Contracts. In reaching its determination, the Board considered all factors it believed relevant, including (i) the nature, extent, and quality of the services to be provided to the fund and its shareholders (including the investment performance of the fund); (ii) the competitiveness of the fund's management fee and total expense ratio relative to peer funds; (iii) the total costs of the services to be provided by and the profits to be realized by Fidelity from its relationships with the fund; and (iv) the extent to which, if any, economies of scale exist and would be realized as the fund grows, and whether any economies of scale are appropriately shared with fund shareholders.
In considering whether to renew the Advisory Contracts for the fund, the Board reached a determination, with the assistance of fund counsel and Independent Trustees' counsel and through the exercise of its business judgment, that the renewal of the Advisory Contracts was in the best interests of the fund and its shareholders and that the compensation payable under the Advisory Contracts was fair and reasonable. The Board's decision to renew the Advisory Contracts was not based on any single factor, but rather was based on a comprehensive consideration of all the information provided to the Board at its meetings throughout the year. The Board, in reaching its determination to renew the Advisory Contracts, was aware that shareholders of the fund have a broad range of investment choices available to them, including a wide choice among funds offered by Fidelity's competitors, and that the fund's shareholders, who have the opportunity to review and weigh the disclosure provided by the fund in its prospectus and other public disclosures, have chosen to invest in this fund, which is part of the Fidelity family of funds.
Nature, Extent, and Quality of Services Provided. The Board considered Fidelity's staffing as it relates to the fund, including the backgrounds of investment personnel of Fidelity, and also considered the fund's investment objective, strategies, and related investment philosophy. The Independent Trustees also had discussions with senior management of Fidelity's investment operations and investment groups. The Board considered the structure of the investment personnel compensation program and whether this structure provides appropriate incentives to act in the best interests of the fund. Additionally, the Board considered the portfolio managers' investments, if any, in the funds that they manage.
Resources Dedicated to Investment Management and Support Services. The Board and the Fund Oversight and Research Committees reviewed the general qualifications and capabilities of Fidelity's investment staff, including its size, education, experience, and resources, as well as Fidelity's approach to recruiting, training, managing, and compensating investment personnel. The Board noted that Fidelity has continued to increase the resources devoted to non-U.S. offices, including expansion of Fidelity's global investment organization. The Board also noted that Fidelity's analysts have extensive resources, tools and capabilities that allow them to conduct sophisticated quantitative and fundamental analysis, as well as credit analysis of issuers, counterparties and guarantors. Further, the Board considered that Fidelity's investment professionals have sufficient access to global information and data so as to provide competitive investment results over time, and that those professionals also have access to sophisticated tools that permit them to assess portfolio construction and risk and performance attribution characteristics continuously, as well as to transmit new information and research conclusions rapidly around the world. Additionally, in its deliberations, the Board considered Fidelity's trading, risk management, compliance, and technology and operations capabilities and resources, which are integral parts of the investment management process.
Shareholder and Administrative Services. The Board considered (i) the nature, extent, quality, and cost of advisory, administrative, and shareholder services performed by the Investment Advisers and their affiliates under the Advisory Contracts and under separate agreements covering transfer agency, pricing and bookkeeping, and securities lending services for the fund; (ii) the nature and extent of the supervision of third party service providers, principally custodians, subcustodians, and pricing vendors; and (iii) the resources devoted to, and the record of compliance with, the fund's compliance policies and procedures. The Board also reviewed the allocation of fund brokerage, including allocations to brokers affiliated with the Investment Advisers, the use of brokerage commissions to pay fund expenses, and the use of "soft" commission dollars to pay for research services.
The Board noted that the growth of fund assets over time across the complex allows Fidelity to reinvest in the development of services designed to enhance the value and convenience of the Fidelity funds as investment vehicles. These services include 24-hour access to account information and market information through telephone representatives and over the Internet, investor education materials and asset allocation tools, and the expanded availability of Fidelity Investor Centers.
The Board noted that it and the boards of certain other Fidelity funds had formed an ad hoc Committee on Transfer Agency Fees to review the variety of transfer agency fee structures throughout the industry and Fidelity's competitive positioning with respect to industry participants.
Investment in a Large Fund Family. The Board considered the benefits to shareholders of investing in a Fidelity fund, including the benefits of investing in a fund that is part of a large family of funds offering a variety of investment disciplines and providing a large variety of mutual fund investor services. The Board noted that Fidelity had taken, or had made recommendations that resulted in the Fidelity funds taking, a number of actions over the previous year that benefited particular funds, including: (i) continuing to dedicate additional resources to Fidelity's investment research process, which includes meetings with management of issuers of securities in which the funds invest, and to the support of the senior management team that oversees asset management; (ii) continuing efforts to enhance Fidelity's global research capabilities; (iii) launching new funds and making other enhancements to meet client needs; (iv) launching new share classes of existing funds; (v) eliminating purchase minimums and broadening eligibility requirements for certain funds and share classes; (vi) reducing management fees and total expenses for certain growth equity funds and index funds; (vii) lowering expense caps for certain existing funds and classes, and converting certain voluntary expense caps to contractual caps, to reduce expenses borne by shareholders; (viii) eliminating short-term redemption fees for funds that had such fees; (ix) rationalizing product lines and gaining increased efficiencies from fund mergers and share class consolidations; (x) continuing to develop, acquire and implement systems and technology to improve services to the funds and shareholders, strengthen information security, and increase efficiency; and (xi) continuing to implement enhancements to further strengthen Fidelity's product line to increase investors' probability of success in achieving their investment goals, including retirement income goals.
Investment Performance. The Board considered whether the fund has operated in accordance with its investment objective, as well as its record of compliance with its investment restrictions and its performance history.
The Board took into account discussions that occur at Board meetings throughout the year with representatives of the Investment Advisers about fund investment performance. In this regard the Board noted that as part of regularly scheduled fund reviews and other reports to the Board on fund performance, the Board considers annualized return information for the fund for different time periods, measured against an appropriate securities market index ("benchmark index") and a peer group of funds with similar objectives ("peer group"), if any. In its evaluation of fund investment performance, the Board gave particular attention to information indicating changes in performance of certain Fidelity funds for specific time periods and discussed with the Investment Advisers the reasons for any overperformance or underperformance.
In addition to reviewing absolute and relative fund performance, the Independent Trustees periodically consider the appropriateness of fund performance metrics in evaluating the results achieved. In general, the Independent Trustees believe that fund performance should be evaluated based on net performance (after fees and expenses) of both the highest performing and lowest performing fund share classes, where applicable, compared to appropriate benchmark indices, over appropriate time periods that may include full market cycles, and compared to peer groups, as applicable, over the same periods, taking into account relevant factors including the following: general market conditions; issuer-specific information; and fund cash flows and other factors.
The Independent Trustees recognize that shareholders evaluate performance on a net basis over their own holding periods, for which one-, three-, and five-year periods are often used as a proxy. For this reason, the performance information reviewed by the Board also included net cumulative total return information for the fund and an appropriate benchmark index and peer group for the most recent one-, three-, and five-year periods ended June 30, 2018, as shown below. Returns are shown compared to the 25th percentile (top of box, 75% beaten) and 75th percentile (bottom of box, 25% beaten) of the peer universe. Returns of the benchmark index are "net MA,"
i.e., adjusted for tax withholding rates applicable to U.S.-based funds organized as Massachusetts business trusts.
Fidelity Global Equity Income Fund

Based on its review, the Board concluded that the nature, extent, and quality of services provided to the fund under the Advisory Contracts should continue to benefit the shareholders of the fund.
Competitiveness of Management Fee and Total Expense Ratio. The Board considered the fund's management fee and total expense ratio compared to "mapped groups" of competitive funds and classes created for the purpose of facilitating the Trustees' competitive analysis of management fees and total expenses. Fidelity creates "mapped groups" by combining similar Lipper investment objective categories that have comparable investment mandates. Combining Lipper investment objective categories aids the Board's management fee and total expense ratio comparisons by broadening the competitive group used for comparison.
Management Fee. The Board considered two proprietary management fee comparisons for the 12-month periods (ended June 30 for 2018 and December 31 for prior periods) shown in basis points (BP) in the chart below. The group of Lipper funds used by the Board for management fee comparisons is referred to below as the "Total Mapped Group." The Total Mapped Group is broader than the Lipper peer group used by the Board for performance comparisons because the Total Mapped Group combines several Lipper investment objective categories while the Lipper peer group does not. The Total Mapped Group comparison focuses on a fund's standing in terms of gross management fees before expense reimbursements or caps relative to the total universe of funds with comparable investment mandates, regardless of whether their management fee structures also are comparable. Funds with comparable investment mandates offer exposure to similar types of securities. Funds with comparable management fee structures have similar management fee contractual arrangements (
e.g., flat rate charged for advisory services, all-inclusive fee rate,
etc.). "TMG %" represents the percentage of funds in the Total Mapped Group that had management fees that were lower than the fund's. For example, a hypothetical TMG % of 20% would mean that 80% of the funds in the Total Mapped Group had higher, and 20% had lower, management fees than the fund. The fund's actual TMG %s and the number of funds in the Total Mapped Group are in the chart below. The "Asset-Size Peer Group" (ASPG) comparison focuses on a fund's standing relative to a subset of non-Fidelity funds within the Total Mapped Group that are similar in size and management fee structure. For example, if a fund is in the first quartile of the ASPG, the fund's management fee ranks in the least expensive or lowest 25% of funds in the ASPG. The ASPG represents at least 15% of the funds in the Total Mapped Group with comparable asset size and management fee structures, subject to a minimum of 50 funds (or all funds in the Total Mapped Group if fewer than 50). Additional information, such as the ASPG quartile in which the fund's management fee rate ranked, is also included in the chart and was considered by the Board.
Fidelity Global Equity Income Fund

The Board noted that the fund's management fee rate ranked below the median of its Total Mapped Group and below the median of its ASPG for the 12-month period ended June 30, 2018.
The Board noted that it and the boards of other Fidelity funds formed an ad hoc Committee on Group Fee, which meets periodically, to conduct an in-depth review of the "group fee" component of the management fee of funds with such management fee structures. The Committee's focus included the mechanics of the group fee, the competitive landscape of group fee structures, Fidelity funds with no group fee component and investment products not included in group fee assets. The Board also considered that, for funds subject to the group fee, FMR agreed to voluntarily waive fees over a specified period of time in amounts designed to account for assets converted from certain funds to certain collective investment trusts.
The Board also noted that, in 2013, the ad hoc Committee on Management Fees was formed to conduct an in-depth review of the management fee rates of Fidelity's active equity mutual funds. The Committee focused on the following areas: (i) standard fee structures; (ii) research consumption and trading evolution; (iii) management fee competitiveness/profitability by category; and (iv) factors that drive institutional pricing.
Based on its review, the Board concluded that the fund's management fee is fair and reasonable in light of the services that the fund receives and the other factors considered.
Total Expense Ratio. In its review of the fund's total expense ratio, the Board considered the fund's management fee rate as well as other fund expenses, such as transfer agent fees, pricing and bookkeeping fees, and custodial, legal, and audit fees. The Board also noted that Fidelity may agree to waive fees and expenses from time to time, and the extent to which, if any, it has done so for the fund. As part of its review, the Board also considered the current and historical total expense ratios of the fund compared to competitive fund median expenses. The fund is compared to those funds and classes in the Total Mapped Group (used by the Board for management fee comparisons) that have a similar sales load structure.
The Board noted that the fund's total expense ratio ranked below the competitive median for the 12-month period ended June 30, 2018.
The Board further considered that FMR has contractually agreed to reimburse the fund to the extent that total operating expenses, with certain exceptions, as a percentage of its average net assets, exceed 1.20% through February 29, 2020.
Fees Charged to Other Fidelity Clients. The Board also considered Fidelity fee structures and other information with respect to clients of Fidelity, such as other funds advised or subadvised by Fidelity, pension plan clients, and other institutional clients with similar mandates. The Board noted that a joint ad hoc committee created by it and the boards of other Fidelity funds periodically reviews and compares Fidelity's institutional investment advisory business with its business of providing services to the Fidelity funds and also noted the most recent findings of the committee. The Board noted that the committee's review included a consideration of the differences in services provided, fees charged, and costs incurred, as well as competition in the markets serving the different categories of clients.
Based on its review of total expense ratios and fees charged to other Fidelity clients, the Board concluded that the fund's total expense ratio was reasonable in light of the services that the fund and its shareholders receive and the other factors considered.
Costs of the Services and Profitability. The Board considered the revenues earned and the expenses incurred by Fidelity in conducting the business of developing, marketing, distributing, managing, administering and servicing the fund and servicing the fund's shareholders. The Board also considered the level of Fidelity's profits in respect of all the Fidelity funds.
On an annual basis, Fidelity presents to the Board information about the profitability of its relationships with the fund. Fidelity calculates profitability information for each fund, as well as aggregate profitability information for groups of Fidelity funds and all Fidelity funds, using a series of detailed revenue and cost allocation methodologies which originate with the books and records of Fidelity on which Fidelity's audited financial statements are based. The Audit Committee of the Board reviews any significant changes from the prior year's methodologies.
PricewaterhouseCoopers LLP (PwC), auditor to Fidelity and certain Fidelity funds, has been engaged annually by the Board as part of the Board's assessment of Fidelity's profitability analysis. PwC's engagement includes the review and assessment of the methodologies used by Fidelity in determining the revenues and expenses attributable to Fidelity's mutual fund business, and completion of agreed-upon procedures in respect of the mathematical accuracy of the fund profitability information and its conformity to established allocation methodologies. After considering PwC's reports issued under the engagement and information provided by Fidelity, the Board concluded that while other allocation methods may also be reasonable, Fidelity's profitability methodologies are reasonable in all material respects.
The Board also reviewed Fidelity's non-fund businesses and potential indirect benefits such businesses may have received as a result of their association with Fidelity's mutual fund business (i.e., fall-out benefits) as well as cases where Fidelity's affiliates may benefit from the fund's business. The Board noted that changes to fall-out benefits year-over-year reflect business developments at Fidelity's various businesses.
The Board considered the costs of the services provided by and the profits realized by Fidelity in connection with the operation of the fund and was satisfied that the profitability was not excessive.
Economies of Scale. The Board considered whether there have been economies of scale in respect of the management of the Fidelity funds, whether the Fidelity funds (including the fund) have appropriately benefited from any such economies of scale, and whether there is potential for realization of any further economies of scale. The Board considered the extent to which the fund will benefit from economies of scale as assets grow through increased services to the fund, through waivers or reimbursements, or through fee or expense ratio reductions. The Board also noted that a committee (the Economies of Scale Committee) created by it and the boards of other Fidelity funds periodically analyzes whether Fidelity attains economies of scale in respect of the management and servicing of the Fidelity funds, whether the Fidelity funds have appropriately benefited from such economies of scale, and whether there is potential for realization of any further economies of scale.
The Board recognized that the fund's management contract incorporates a "group fee" structure, which provides for lower group fee rates as total group assets increase, and for higher group fee rates as total group assets decrease (with "group assets" defined to include fund assets under FMR's management plus the assets of sector funds previously under FMR's management). FMR calculates the group fee rates based on a tiered asset "breakpoint" schedule that varies based on asset class. The Board considered that the group fee is designed to deliver the benefits of economies of scale to fund shareholders when total Fidelity fund assets increase, even if assets of any particular fund are unchanged or have declined, because some portion of Fidelity's costs are attributable to services provided to all Fidelity funds, and all funds benefit if those costs can be allocated among more assets. The Board concluded that, given the group fee structure, fund shareholders will benefit from lower management fees as group assets increase at the fund complex level, regardless of whether Fidelity achieves any such economies of scale.
The Board concluded, taking into account the analysis of the Economies of Scale Committee, that economies of scale, if any, are being appropriately shared between fund shareholders and Fidelity.
Additional Information Requested by the Board. In order to develop fully the factual basis for consideration of the Fidelity funds' advisory contracts, the Board requested and received additional information on certain topics, including: (i) fund performance trends, in particular the underperformance of certain funds, and Fidelity's long-term strategies for certain funds; (ii) Fidelity's fund profitability methodology, profitability trends for certain funds, and the impact of certain factors on fund profitability results; (iii) metrics for evaluating index fund and ETF performance and information about ETF trading characteristics; (iv) the methodology with respect to the evaluation of competitive fund data and peer group classifications and fee comparisons; (v) the expense structures for different funds and classes; (vi) information regarding other accounts managed by Fidelity, including collective investment trusts; and (vii) Fidelity's philosophies and strategies for evaluating funds and classes with lower or declining asset levels.
Based on its evaluation of all of the conclusions noted above, and after considering all factors it believed relevant, the Board concluded that the advisory fee arrangements are fair and reasonable, and that the fund's Advisory Contracts should be renewed.
GED-SANN-0619
1.938166.106
Fidelity® Series Emerging Markets Fund
Fidelity® Series Emerging Markets Opportunities Fund
Fidelity® Series International Growth Fund
Fidelity® Series International Small Cap Fund
Fidelity® Series International Value Fund
Semi-Annual Report April 30, 2019 |
|
Beginning on January 1, 2021, as permitted by regulations adopted by the Securities and Exchange Commission, paper copies of a fund’s shareholder reports will no longer be sent by mail, unless you specifically request paper copies of the reports from the fund or from your financial intermediary, such as a financial advisor, broker-dealer or bank. Instead, the reports will be made available on a website, and you will be notified by mail each time a report is posted and provided with a website link to access the report.
If you already elected to receive shareholder reports electronically, you will not be affected by this change and you need not take any action. You may elect to receive shareholder reports and other communications from a fund electronically, by contacting your financial intermediary. For Fidelity customers, visit Fidelity's web site or call Fidelity using the contact information listed below.
You may elect to receive all future reports in paper free of charge. If you wish to continue receiving paper copies of your shareholder reports, you may contact your financial intermediary or, if you are a Fidelity customer, visit Fidelity’s website, or call Fidelity at the applicable toll-free number listed below. Your election to receive reports in paper will apply to all funds held with the fund complex/your financial intermediary.
| Account Type | Website | Phone Number |
| Brokerage, Mutual Fund, or Annuity Contracts: | fidelity.com/mailpreferences | 1-800-343-3548 |
| Employer Provided Retirement Accounts: | netbenefits.fidelity.com/preferences (choose 'no' under Required Disclosures to continue to print) | 1-800-343-0860 |
| Advisor Sold Accounts Serviced Through Your Financial Intermediary: | Contact Your Financial Intermediary | Your Financial Intermediary's phone number |
| Advisor Sold Accounts Serviced by Fidelity: | institutional.fidelity.com | 1-877-208-0098 |
Contents
To view a fund's proxy voting guidelines and proxy voting record for the 12-month period ended June 30, visit http://www.fidelity.com/proxyvotingresults or visit the Securities and Exchange Commission's (SEC) web site at http://www.sec.gov.
You may also call 1-800-544-8544 to request a free copy of the proxy voting guidelines.
Standard & Poor's, S&P and S&P 500 are registered service marks of The McGraw-Hill Companies, Inc. and have been licensed for use by Fidelity Distributors Corporation.
Other third-party marks appearing herein are the property of their respective owners.
All other marks appearing herein are registered or unregistered trademarks or service marks of FMR LLC or an affiliated company. © 2019 FMR LLC. All rights reserved.
This report and the financial statements contained herein are submitted for the general information of the shareholders of the Funds. This report is not authorized for distribution to prospective investors in the Funds unless preceded or accompanied by an effective prospectus.
A fund files its complete schedule of portfolio holdings with the SEC for the first and third quarters of each fiscal year on Form N-PORT. Forms N-PORT are available on the SEC’s web site at http://www.sec.gov. A fund's Forms N-PORT may be reviewed and copied at the SEC’s Public Reference Room in Washington, DC. Information regarding the operation of the SEC's Public Reference Room may be obtained by calling 1-800-SEC-0330.
For a complete list of a fund's portfolio holdings, view the most recent holdings listing, semiannual report, or annual report on Fidelity's web site at http://www.fidelity.com, http://www.institutional.fidelity.com, or http://www.401k.com, as applicable.
NOT FDIC INSURED •MAY LOSE VALUE •NO BANK GUARANTEE
Neither the Funds nor Fidelity Distributors Corporation is a bank.
Fidelity® Series Emerging Markets Fund
Investment Summary (Unaudited)
Geographic Diversification (% of fund's net assets)
| As of April 30, 2019 |
| | Cayman Islands | 17.8% |
| | India | 14.5% |
| | Taiwan | 9.3% |
| | Korea (South) | 8.3% |
| | United States of America* | 8.0% |
| | Hong Kong | 6.4% |
| | South Africa | 4.6% |
| | Philippines | 4.0% |
| | United Kingdom | 3.5% |
| | Other | 23.6% |
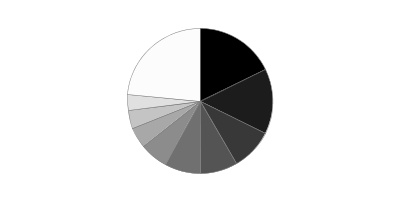
* Includes Short-Term investments and Net Other Assets (Liabilities).
Percentages are based on country or territory of incorporation and are adjusted for the effect of futures contracts, if applicable.
Asset Allocation as of April 30, 2019
| | % of fund's net assets |
| Stocks | 98.1 |
| Short-Term Investments and Net Other Assets (Liabilities) | 1.9 |
Top Ten Stocks as of April 30, 2019
| | % of fund's net assets |
| Tencent Holdings Ltd. (Cayman Islands, Interactive Media & Services) | 6.5 |
| Taiwan Semiconductor Manufacturing Co. Ltd. (Taiwan, Semiconductors & Semiconductor Equipment) | 4.7 |
| HDFC Bank Ltd. sponsored ADR (India, Banks) | 4.5 |
| iShares MSCI India ETF (United States of America, Investment Companies) | 3.6 |
| Hyundai Fire & Marine Insurance Co. Ltd. (Korea (South), Insurance) | 2.7 |
| SITC International Holdings Co. Ltd. (Cayman Islands, Marine) | 2.7 |
| AIA Group Ltd. (Hong Kong, Insurance) | 2.5 |
| Shanghai International Airport Co. Ltd. (A Shares) (China, Transportation Infrastructure) | 2.3 |
| Voltronic Power Technology Corp. (Taiwan, Electrical Equipment) | 2.3 |
| Pilipinas Shell Petroleum Corp. (Philippines, Oil, Gas & Consumable Fuels) | 2.3 |
| | 34.1 |
Top Market Sectors as of April 30, 2019
| | % of fund's net assets |
| Financials | 28.1 |
| Information Technology | 11.9 |
| Consumer Staples | 11.9 |
| Communication Services | 11.9 |
| Industrials | 9.7 |
| Health Care | 5.8 |
| Energy | 5.5 |
| Consumer Discretionary | 5.2 |
| Materials | 2.2 |
| Real Estate | 1.4 |
Fidelity® Series Emerging Markets Fund
Schedule of Investments April 30, 2019 (Unaudited)
Showing Percentage of Net Assets
| Common Stocks - 94.5% | | | |
| | | Shares | Value |
| Bermuda - 1.5% | | | |
| Dairy Farm International Holdings Ltd. | | 3,307,100 | $25,894,593 |
| Brazil - 3.4% | | | |
| Equatorial Energia SA | | 779,261 | 16,316,168 |
| Instituto Hermes Pardini SA | | 2,048,700 | 10,658,611 |
| Ultrapar Participacoes SA | | 5,527,200 | 29,601,693 |
|
| TOTAL BRAZIL | | | 56,576,472 |
|
| Cayman Islands - 17.8% | | | |
| ASM Pacific Technology Ltd. | | 2,471,600 | 28,623,401 |
| Best Pacific International Holdings Ltd. | | 43,440,500 | 15,837,221 |
| Greatview Aseptic Pack Co. Ltd. | | 30,085,000 | 18,293,067 |
| Haitian International Holdings Ltd. | | 27,000 | 67,596 |
| JD.com, Inc. sponsored ADR (a) | | 737,800 | 22,333,206 |
| Pico Far East Holdings Ltd. | | 29,891,200 | 10,935,619 |
| SITC International Holdings Co. Ltd. | | 42,424,000 | 45,047,920 |
| Tencent Holdings Ltd. | | 2,205,200 | 108,689,154 |
| TK Group Holdings Ltd. | | 27,340,000 | 18,471,089 |
| Vinda International Holdings Ltd. | | 16,227,000 | 31,110,300 |
|
| TOTAL CAYMAN ISLANDS | | | 299,408,573 |
|
| Chile - 2.2% | | | |
| Compania Cervecerias Unidas SA | | 2,147,019 | 29,670,896 |
| Quinenco SA | | 2,901,159 | 7,817,238 |
|
| TOTAL CHILE | | | 37,488,134 |
|
| China - 3.1% | | | |
| Shanghai International Airport Co. Ltd. (A Shares) | | 3,699,996 | 38,802,464 |
| Shenzhen Expressway Co. (H Shares) | | 11,192,332 | 13,625,175 |
|
| TOTAL CHINA | | | 52,427,639 |
|
| Hong Kong - 6.4% | | | |
| AIA Group Ltd. | | 4,074,400 | 41,719,557 |
| China Resources Pharmaceutical Group Ltd. (b) | | 21,896,149 | 31,149,427 |
| Far East Horizon Ltd. | | 31,144,779 | 34,579,725 |
|
| TOTAL HONG KONG | | | 107,448,709 |
|
| India - 14.5% | | | |
| Axis Bank Ltd. GDR (Reg. S) (a) | | 396,909 | 21,591,850 |
| CCL Products (India) Ltd. | | 1,082,447 | 4,023,799 |
| Cyient Ltd. | | 3,800,892 | 32,176,632 |
| HDFC Bank Ltd. sponsored ADR | | 654,330 | 75,018,935 |
| Hindustan Oil Exploration Co. Ltd. (a) | | 264,331 | 470,996 |
| Lupin Ltd. (a) | | 1,618,467 | 20,264,823 |
| Redington India Ltd. | | 6,376,837 | 9,316,168 |
| SH Kelkar & Co. Ltd. (b)(c) | | 7,416,709 | 15,941,553 |
| Sunteck Realty Ltd. (a) | | 3,586,457 | 23,762,267 |
| Tata Communications Ltd. (a) | | 4,325,207 | 34,848,449 |
| Zensar Technologies Ltd. | | 1,918,412 | 6,463,385 |
|
| TOTAL INDIA | | | 243,878,857 |
|
| Indonesia - 0.5% | | | |
| PT Bank Rakyat Indonesia Tbk | | 28,745,000 | 8,815,133 |
| Kenya - 1.6% | | | |
| Safaricom Ltd. | | 94,874,600 | 26,403,559 |
| Korea (South) - 8.3% | | | |
| AMOREPACIFIC Group, Inc. | | 516,884 | 33,392,906 |
| Hyundai Fire & Marine Insurance Co. Ltd. | | 1,398,022 | 45,939,761 |
| KB Financial Group, Inc. | | 717,301 | 28,423,638 |
| Leeno Industrial, Inc. | | 63,701 | 3,130,297 |
| Nice Information & Telecom, Inc. | | 156,942 | 2,878,594 |
| Samsung Electronics Co. Ltd. | | 661,346 | 26,050,218 |
|
| TOTAL KOREA (SOUTH) | | | 139,815,414 |
|
| Malaysia - 0.2% | | | |
| Scientex Bhd | | 1,744,665 | 3,607,906 |
| Mexico - 1.8% | | | |
| Regional S.A.B. de CV | | 5,545,168 | 30,218,317 |
| Nigeria - 2.0% | | | |
| Guaranty Trust Bank PLC | | 360,693,695 | 32,994,849 |
| Papua New Guinea - 1.4% | | | |
| Oil Search Ltd. ADR | | 4,318,291 | 23,683,715 |
| Philippines - 4.0% | | | |
| Ayala Corp. | | 1,666,065 | 29,098,199 |
| Pilipinas Shell Petroleum Corp. | | 43,631,910 | 38,102,054 |
|
| TOTAL PHILIPPINES | | | 67,200,253 |
|
| Singapore - 1.6% | | | |
| Delfi Ltd. | | 27,497,700 | 27,293,504 |
| South Africa - 4.6% | | | |
| Capitec Bank Holdings Ltd. | | 279,900 | 26,154,459 |
| City Lodge Hotels Ltd. (c) | | 2,547,019 | 21,355,432 |
| Pinnacle Technology Holdings Ltd. | | 2,291,845 | 2,643,512 |
| Remgro Ltd. | | 1,964,036 | 26,656,245 |
|
| TOTAL SOUTH AFRICA | | | 76,809,648 |
|
| Spain - 1.5% | | | |
| Prosegur Cash SA (b) | | 11,742,022 | 25,180,757 |
| Taiwan - 9.3% | | | |
| King's Town Bank | | 8,994,000 | 9,619,174 |
| Poya International Co. Ltd. | | 2,392,000 | 28,988,544 |
| Taiwan Semiconductor Manufacturing Co. Ltd. | | 9,493,000 | 79,700,954 |
| Voltronic Power Technology Corp. | | 1,938,000 | 38,255,776 |
|
| TOTAL TAIWAN | | | 156,564,448 |
|
| Thailand - 1.9% | | | |
| Kasikornbank PCL (For. Reg.) | | 5,428,500 | 32,400,070 |
| United Kingdom - 3.5% | | | |
| ITE Group PLC | | 19,838,600 | 18,729,543 |
| Network International Holdings PLC (b) | | 408,900 | 2,778,001 |
| NMC Health PLC | | 1,027,187 | 37,799,331 |
|
| TOTAL UNITED KINGDOM | | | 59,306,875 |
|
| United States of America - 2.5% | | | |
| Cognizant Technology Solutions Corp. Class A | | 129,000 | 9,411,840 |
| Philip Morris International, Inc. | | 381,500 | 33,022,640 |
|
| TOTAL UNITED STATES OF AMERICA | | | 42,434,480 |
|
| Vietnam - 0.9% | | | |
| Vietnam Dairy Products Corp. | | 2,765,100 | 15,412,130 |
| TOTAL COMMON STOCKS | | | |
| (Cost $1,488,816,148) | | | 1,591,264,035 |
|
| Investment Companies - 3.6% | | | |
| United States of America - 3.6% | | | |
| iShares MSCI India ETF | | | |
| (Cost $59,540,882) | | 1,702,300 | 60,448,673 |
|
| Money Market Funds - 2.1% | | | |
| Fidelity Cash Central Fund, 2.49% (d) | | | |
| (Cost $35,233,403) | | 35,226,890 | 35,233,936 |
| TOTAL INVESTMENT IN SECURITIES - 100.2% | | | |
| (Cost $1,583,590,433) | | | 1,686,946,644 |
| NET OTHER ASSETS (LIABILITIES) - (0.2)% | | | (2,871,018) |
| NET ASSETS - 100% | | | $1,684,075,626 |
Security Type Abbreviations
ETF – Exchange-Traded Fund
Categorizations in the Schedule of Investments are based on country or territory of incorporation.
Legend
(a) Non-income producing
(b) Security exempt from registration under Rule 144A of the Securities Act of 1933. These securities may be resold in transactions exempt from registration, normally to qualified institutional buyers. At the end of the period, the value of these securities amounted to $75,049,738 or 4.5% of net assets.
(c) Affiliated company
(d) Affiliated fund that is generally available only to investment companies and other accounts managed by Fidelity Investments. The rate quoted is the annualized seven-day yield of the fund at period end. A complete unaudited listing of the fund's holdings as of its most recent quarter end is available upon request. In addition, each Fidelity Central Fund's financial statements are available on the SEC's website or upon request.
Affiliated Central Funds
Information regarding fiscal year to date income earned by the Fund from investments in Fidelity Central Funds is as follows:
| Fund | Income earned |
| Fidelity Cash Central Fund | $1,301,877 |
| Total | $1,301,877 |
Amounts in the income column in the above table include any capital gain distributions from underlying funds, which are presented in the corresponding line-item in the Statement of Operations, if applicable.
Other Affiliated Issuers
An affiliated company is a company in which the Fund has ownership of at least 5% of the voting securities. Fiscal year to date transactions with companies which are or were affiliates are as follows:
| Affiliate | Value, beginning of period | Purchases | Sales Proceeds | Dividend Income | Realized Gain (loss) | Change in Unrealized appreciation (depreciation) | Value, end of period |
| City Lodge Hotels Ltd. | $16,603,714 | $6,208,383 | $-- | $255,098 | $-- | $(1,456,665) | $21,355,432 |
| SH Kelkar & Co. Ltd. | -- | 16,424,412 | -- | -- | -- | (482,859) | 15,941,553 |
| Total | $16,603,714 | $22,632,795 | $-- | $255,098 | $-- | $(1,939,524) | $37,296,985 |
Investment Valuation
The following is a summary of the inputs used, as of April 30, 2019, involving the Fund's assets and liabilities carried at fair value. The inputs or methodology used for valuing securities may not be an indication of the risk associated with investing in those securities. For more information on valuation inputs, and their aggregation into the levels used below, please refer to the Investment Valuation section in the accompanying Notes to Financial Statements.
| | Valuation Inputs at Reporting Date: |
| Description | Total | Level 1 | Level 2 | Level 3 |
| Investments in Securities: | | | | |
| Equities: | | | | |
| Communication Services | $199,606,324 | $90,917,170 | $108,689,154 | $-- |
| Consumer Discretionary | 88,514,403 | 88,514,403 | -- | -- |
| Consumer Staples | 199,820,768 | 199,820,768 | -- | -- |
| Energy | 91,858,458 | 91,858,458 | -- | -- |
| Financials | 471,188,670 | 401,045,475 | 70,143,195 | -- |
| Health Care | 99,872,192 | 99,872,192 | -- | -- |
| Industrials | 162,087,258 | 162,087,258 | -- | -- |
| Information Technology | 200,395,001 | 120,694,047 | 79,700,954 | -- |
| Materials | 37,842,526 | 37,842,526 | -- | -- |
| Real Estate | 23,762,267 | 23,762,267 | -- | -- |
| Utilities | 16,316,168 | 16,316,168 | -- | -- |
| Investment Companies | 60,448,673 | 60,448,673 | -- | -- |
| Money Market Funds | 35,233,936 | 35,233,936 | -- | -- |
| Total Investments in Securities: | $1,686,946,644 | $1,428,413,341 | $258,533,303 | $-- |
See accompanying notes which are an integral part of the financial statements.
Fidelity® Series Emerging Markets Fund
Financial Statements
Statement of Assets and Liabilities
| | | April 30, 2019 (Unaudited) |
| Assets | | |
Investment in securities, at value — See accompanying schedule:
Unaffiliated issuers (cost $1,508,408,209) | $1,614,415,723 | |
| Fidelity Central Funds (cost $35,233,403) | 35,233,936 | |
| Other affiliated issuers (cost $39,948,821) | 37,296,985 | |
| Total Investment in Securities (cost $1,583,590,433) | | $1,686,946,644 |
| Cash | | 103,013 |
| Foreign currency held at value (cost $3,543,592) | | 3,537,936 |
| Receivable for fund shares sold | | 364,572 |
| Dividends receivable | | 2,143,632 |
| Distributions receivable from Fidelity Central Funds | | 51,224 |
| Receivable from investment adviser for expense reductions | | 33,080 |
| Total assets | | 1,693,180,101 |
| Liabilities | | |
| Payable for investments purchased | $6,797,336 | |
| Payable for fund shares redeemed | 747,841 | |
| Other payables and accrued expenses | 1,559,298 | |
| Total liabilities | | 9,104,475 |
| Net Assets | | $1,684,075,626 |
| Net Assets consist of: | | |
| Paid in capital | | $1,585,968,034 |
| Total distributable earnings (loss) | | 98,107,592 |
| Net Assets, for 169,063,122 shares outstanding | | $1,684,075,626 |
| Net Asset Value, offering price and redemption price per share ($1,684,075,626 ÷ 169,063,122 shares) | | $9.96 |
See accompanying notes which are an integral part of the financial statements.
Statement of Operations
| | | Six months ended April 30, 2019 (Unaudited) |
| Investment Income | | |
| Dividends (including $255,098 earned from other affiliated issuers) | | $17,621,143 |
| Income from Fidelity Central Funds | | 1,301,877 |
| Income before foreign taxes withheld | | 18,923,020 |
| Less foreign taxes withheld | | (2,369,067) |
| Total income | | 16,553,953 |
| Expenses | | |
| Custodian fees and expenses | $296,458 | |
| Independent trustees' fees and expenses | 3,937 | |
| Commitment fees | 336 | |
| Total expenses before reductions | 300,731 | |
| Expense reductions | (185,215) | |
| Total expenses after reductions | | 115,516 |
| Net investment income (loss) | | 16,438,437 |
| Realized and Unrealized Gain (Loss) | | |
| Net realized gain (loss) on: | | |
| Investment securities: | | |
| Unaffiliated issuers | (1,886,815) | |
| Fidelity Central Funds | (533) | |
| Foreign currency transactions | (515,590) | |
| Total net realized gain (loss) | | (2,402,938) |
| Change in net unrealized appreciation (depreciation) on: | | |
| Investment securities: | | |
| Unaffiliated issuers (net of increase in deferred foreign taxes of $1,391,842) | 177,153,271 | |
| Fidelity Central Funds | 533 | |
| Other affiliated issuers | (1,939,524) | |
| Assets and liabilities in foreign currencies | (31,336) | |
| Total change in net unrealized appreciation (depreciation) | | 175,182,944 |
| Net gain (loss) | | 172,780,006 |
| Net increase (decrease) in net assets resulting from operations | | $189,218,443 |
See accompanying notes which are an integral part of the financial statements.
Statement of Changes in Net Assets
| | Six months ended April 30, 2019 (Unaudited) | For the period
August 29, 2018 (commencement of operations) to October 31, 2018 |
| Increase (Decrease) in Net Assets | | |
| Operations | | |
| Net investment income (loss) | $16,438,437 | $790,283 |
| Net realized gain (loss) | (2,402,938) | (12,242,242) |
| Change in net unrealized appreciation (depreciation) | 175,182,944 | (73,242,837) |
| Net increase (decrease) in net assets resulting from operations | 189,218,443 | (84,694,796) |
| Distributions to shareholders | (6,416,055) | – |
| Share transactions | | |
| Proceeds from sales of shares | 163,056,646 | 2,047,094,795 |
| Reinvestment of distributions | 6,416,055 | – |
| Cost of shares redeemed | (99,216,610) | (531,382,852) |
| Net increase (decrease) in net assets resulting from share transactions | 70,256,091 | 1,515,711,943 |
| Total increase (decrease) in net assets | 253,058,479 | 1,431,017,147 |
| Net Assets | | |
| Beginning of period | 1,431,017,147 | – |
| End of period | $1,684,075,626 | $1,431,017,147 |
| Other Information | | |
| Shares | | |
| Sold | 17,391,285 | 219,660,453 |
| Issued in reinvestment of distributions | 710,527 | – |
| Redeemed | (10,430,555) | (58,268,588) |
| Net increase (decrease) | 7,671,257 | 161,391,865 |
See accompanying notes which are an integral part of the financial statements.
Financial Highlights
Fidelity Series Emerging Markets Fund
| | Six months ended (Unaudited) April 30, | Years endedOctober 31, |
| | 2019 | 2018 A |
| Selected Per–Share Data | | |
| Net asset value, beginning of period | $8.87 | $10.00 |
| Income from Investment Operations | | |
| Net investment income (loss)B | .10 | .01 |
| Net realized and unrealized gain (loss) | 1.03 | (1.14) |
| Total from investment operations | 1.13 | (1.13) |
| Distributions from net investment income | (.04) | – |
| Total distributions | (.04) | – |
| Net asset value, end of period | $9.96 | $8.87 |
| Total ReturnC,D | 12.76% | (11.30)% |
| Ratios to Average Net AssetsE,F | | |
| Expenses before reductionsG | .04% | .04% |
| Expenses net of fee waivers, if anyG | .01% | .01% |
| Expenses net of all reductionsG | .01% | .01% |
| Net investment income (loss)G | 2.06% | .65% |
| Supplemental Data | | |
| Net assets, end of period (000 omitted) | $1,684,076 | $1,431,017 |
| Portfolio turnover rateH | 45%G | 15%I,J |
A For the period August 29, 2018 (commencement of operations) to October 31, 2018.
B Calculated based on average shares outstanding during the period.
C Total returns for periods of less than one year are not annualized.
D Total returns would have been lower if certain expenses had not been reduced during the applicable periods shown.
E Fees and expenses of any underlying Fidelity Central Funds are not included in the Fund's expense ratio. The Fund indirectly bears its proportionate share of the expenses of any underlying Fidelity Central Funds.
F Expense ratios reflect operating expenses of the Fund. Expenses before reductions do not reflect amounts reimbursed by the investment adviser or reductions from expense offset arrangements and do not represent the amount paid by the Fund during periods when reimbursements or reductions occur. Expense ratios before reductions for start-up periods may not be representative of longer term operating periods. Expenses net of fee waivers reflect expenses after reimbursement by the investment adviser but prior to reductions from expense offset arrangements. Expenses net of all reductions represent the net expenses paid by the Fund.
G Annualized
H Amount does not include the portfolio activity of any underlying Fidelity Central Funds.
I Portfolio turnover rate excludes securities received or delivered in-kind.
J Amount not annualized.
See accompanying notes which are an integral part of the financial statements.
Fidelity® Series Emerging Markets Opportunities Fund
Investment Summary (Unaudited)
Geographic Diversification (% of fund's net assets)
| As of April 30, 2019 |
| | Cayman Islands | 21.1% |
| | China | 11.8% |
| | Korea (South) | 11.8% |
| | India | 9.9% |
| | Brazil | 7.5% |
| | South Africa | 5.9% |
| | Taiwan | 5.7% |
| | Russia | 5.3% |
| | United States of America* | 4.2% |
| | Other | 16.8% |

* Includes Short-Term investments and Net Other Assets (Liabilities).
Percentages are based on country or territory of incorporation and are adjusted for the effect of futures contracts, if applicable.
Asset Allocation as of April 30, 2019
| | % of fund's net assets |
| Stocks and Equity Futures | 97.9 |
| Short-Term Investments and Net Other Assets (Liabilities) | 2.1 |
Top Ten Stocks as of April 30, 2019
| | % of fund's net assets |
| Tencent Holdings Ltd. (Cayman Islands, Interactive Media & Services) | 6.1 |
| Taiwan Semiconductor Manufacturing Co. Ltd. (Taiwan, Semiconductors & Semiconductor Equipment) | 4.4 |
| Alibaba Group Holding Ltd. (Cayman Islands, Internet & Direct Marketing Retail) | 4.3 |
| Industrial & Commercial Bank of China Ltd. (H Shares) (China, Banks) | 3.1 |
| Naspers Ltd. Class N (South Africa, Internet & Direct Marketing Retail) | 2.4 |
| Sberbank of Russia (Russia, Banks) | 2.3 |
| Samsung Electronics Co. Ltd. (Korea (South), Technology Hardware, Storage & Peripherals) | 2.0 |
| Meituan Dianping Class B (Cayman Islands, Internet & Direct Marketing Retail) | 2.0 |
| ICICI Bank Ltd. (India, Banks) | 1.7 |
| China Life Insurance Co. Ltd. (H Shares) (China, Insurance) | 1.5 |
| | 29.8 |
Top Market Sectors as of April 30, 2019
| | % of fund's net assets |
| Financials | 23.7 |
| Consumer Discretionary | 16.8 |
| Information Technology | 13.2 |
| Communication Services | 10.5 |
| Energy | 7.1 |
| Materials | 7.1 |
| Consumer Staples | 6.3 |
| Industrials | 4.5 |
| Real Estate | 3.0 |
| Health Care | 2.3 |
Fidelity® Series Emerging Markets Opportunities Fund
Schedule of Investments April 30, 2019 (Unaudited)
Showing Percentage of Net Assets
| Common Stocks - 91.8% | | | |
| | | Shares | Value |
| Argentina - 0.2% | | | |
| Central Puerto SA sponsored ADR (a) | | 1,234,900 | $9,977,992 |
| Grupo Financiero Galicia SA sponsored ADR | | 645,100 | 14,050,278 |
| Inversiones y Representaciones SA ADR (b) | | 653,498 | 6,136,346 |
| YPF SA Class D sponsored ADR | | 473,900 | 6,411,867 |
|
| TOTAL ARGENTINA | | | 36,576,483 |
|
| Australia - 0.0% | | | |
| Frontier Digital Ventures Ltd. (b)(c) | | 16,030,591 | 6,554,444 |
| Bermuda - 1.2% | | | |
| AGTech Holdings Ltd. (b) | | 53,392,000 | 3,198,837 |
| Cosan Ltd. Class A | | 1,263,132 | 15,435,473 |
| Credicorp Ltd. (United States) | | 225,140 | 53,335,666 |
| GP Investments Ltd. Class A (depositary receipt) (b)(c) | | 7,634,637 | 7,593,554 |
| Kunlun Energy Co. Ltd. | | 14,584,000 | 15,393,065 |
| Marvell Technology Group Ltd. | | 641,000 | 16,037,820 |
| Pacific Basin Shipping Ltd. | | 87,704,000 | 17,999,623 |
| Shangri-La Asia Ltd. | | 45,260,000 | 64,156,027 |
|
| TOTAL BERMUDA | | | 193,150,065 |
|
| Brazil - 4.0% | | | |
| Azul SA sponsored ADR (b) | | 1,358,800 | 35,274,448 |
| Banco do Brasil SA | | 11,528,800 | 146,068,905 |
| BR Malls Participacoes SA | | 5,975,000 | 18,742,827 |
| BTG Pactual Participations Ltd. unit | | 5,066,800 | 53,470,757 |
| Companhia de Saneamento de Minas Gerais | | 2,782,570 | 48,965,170 |
| Direcional Engenharia SA (c) | | 10,016,460 | 21,049,101 |
| Localiza Rent A Car SA | | 4,670,870 | 43,121,954 |
| Natura Cosmeticos SA | | 8,202,900 | 109,285,531 |
| Notre Dame Intermedica Participacoes SA | | 3,814,100 | 34,161,636 |
| Petrobras Distribuidora SA | | 5,616,000 | 33,944,352 |
| Vale SA sponsored ADR | | 7,159,070 | 91,492,915 |
|
| TOTAL BRAZIL | | | 635,577,596 |
|
| British Virgin Islands - 0.2% | | | |
| Mail.Ru Group Ltd. GDR (Reg. S) (b) | | 1,520,300 | 35,118,930 |
| Canada - 0.3% | | | |
| Pan American Silver Corp. | | 3,378,800 | 42,944,548 |
| Cayman Islands - 21.1% | | | |
| 58.com, Inc. ADR (b) | | 257,164 | 18,461,804 |
| Airtac International Group | | 2,857,000 | 38,090,868 |
| Alibaba Group Holding Ltd. sponsored ADR (b) | | 3,652,506 | 677,795,538 |
| Ant International Co. Ltd. Class C (d)(e) | | 6,359,848 | 39,113,065 |
| China Biologic Products Holdings, Inc. (a)(b) | | 216,591 | 21,715,414 |
| China Resources Land Ltd. | | 13,544,000 | 58,959,770 |
| China State Construction International Holdings Ltd. | | 35,088,000 | 36,363,635 |
| CStone Pharmaceuticals Co. Ltd. (b)(f) | | 14,238,500 | 24,938,429 |
| ENN Energy Holdings Ltd. | | 3,572,300 | 33,743,044 |
| Haitian International Holdings Ltd. | | 14,965,000 | 37,465,914 |
| HUYA, Inc. ADR (a) | | 2,329,528 | 55,652,424 |
| JD.com, Inc. sponsored ADR (b) | | 6,067,504 | 183,663,346 |
| Kingdee International Software Group Co. Ltd. | | 19,267,000 | 23,577,810 |
| Kingsoft Corp. Ltd. (c) | | 72,064,000 | 184,183,561 |
| Koolearn Technology Holding Ltd. (b)(f) | | 14,766,500 | 20,743,273 |
| LexinFintech Holdings Ltd. ADR (b) | | 883,200 | 11,393,280 |
| Meituan Dianping Class B (a) | | 43,465,582 | 315,819,164 |
| Momo, Inc. ADR | | 2,823,116 | 99,006,678 |
| NetEase, Inc. ADR | | 539,000 | 153,361,670 |
| PPDAI Group, Inc. ADR | | 1,478,100 | 7,715,682 |
| Qutoutiao, Inc. ADR (a) | | 1,399,800 | 9,266,676 |
| Sea Ltd. ADR (b) | | 1,533,822 | 38,176,830 |
| Shenzhou International Group Holdings Ltd. | | 10,512,100 | 141,102,913 |
| Shimao Property Holdings Ltd. | | 3,817,500 | 11,630,411 |
| Sunny Optical Technology Group Co. Ltd. | | 3,746,300 | 45,677,850 |
| Tencent Holdings Ltd. | | 19,487,299 | 960,483,415 |
| Uni-President China Holdings Ltd. | | 56,989,000 | 52,159,522 |
| Weidai Ltd. ADR | | 408,100 | 4,081,000 |
| Wise Talent Information Technology Co. Ltd. (a)(b) | | 6,711,803 | 17,582,035 |
| YY, Inc. ADR (b) | | 150,900 | 12,767,649 |
| Zai Lab Ltd. ADR (a)(b) | | 689,300 | 18,369,845 |
|
| TOTAL CAYMAN ISLANDS | | | 3,353,062,515 |
|
| Chile - 0.6% | | | |
| Compania Cervecerias Unidas SA sponsored ADR | | 794,900 | 21,891,546 |
| Vina Concha y Toro SA | | 34,096,719 | 71,787,865 |
|
| TOTAL CHILE | | | 93,679,411 |
|
| China - 11.8% | | | |
| BBMG Corp. (H Shares) | | 95,570,500 | 33,624,131 |
| Beijing Sinnet Technology Co. Ltd. (A Shares) | | 4,095,300 | 10,550,039 |
| China Communications Construction Co. Ltd. (H Shares) | | 18,246,000 | 17,560,333 |
| China Life Insurance Co. Ltd. (H Shares) | | 82,058,400 | 233,177,985 |
| China Longyuan Power Grid Corp. Ltd. (H Shares) | | 48,103,690 | 33,112,371 |
| China Oilfield Services Ltd. (H Shares) | | 43,032,000 | 46,077,504 |
| China Pacific Insurance (Group) Co. Ltd. (H Shares) | | 30,116,694 | 123,425,927 |
| China Petroleum & Chemical Corp. (H Shares) | | 120,336,000 | 92,503,432 |
| China Tower Corp. Ltd. (H Shares) (f) | | 84,982,000 | 22,965,766 |
| Glodon Co. Ltd. (A Shares) | | 2,787,100 | 11,587,225 |
| Hangzhou Hikvision Digital Technology Co. Ltd. (A Shares) | | 2,564,500 | 12,443,817 |
| Hangzhou Tigermed Consulting Co. Ltd. (A Shares) | | 4,180,400 | 41,214,949 |
| Industrial & Commercial Bank of China Ltd. (H Shares) | | 651,613,400 | 489,241,654 |
| Jiangsu Hengrui Medicine Co. Ltd. (A Shares) | | 4,023,000 | 39,274,859 |
| Kweichow Moutai Co. Ltd. (A Shares) | | 378,700 | 54,767,524 |
| PICC Property & Casualty Co. Ltd. (H Shares) | | 20,791,750 | 23,349,903 |
| Ping An Insurance (Group) Co. of China Ltd. (H Shares) | | 15,811,500 | 191,392,917 |
| Qingdao Haier Co. Ltd. (A Shares) | | 61,600,023 | 157,134,983 |
| Shanghai International Airport Co. Ltd. (A Shares) | | 5,415,032 | 56,788,328 |
| Shenzhen Mindray Bio-Medical Electronics Co. Ltd. (A Shares) (b) | | 2,256,000 | 47,177,395 |
| Shenzhen Sunway Communication Co. Ltd. (A Shares) | | 2,334,700 | 9,286,940 |
| Sinopec Engineering Group Co. Ltd. (H Shares) | | 25,125,500 | 24,277,393 |
| Tonghua Dongbao Pharmaceutical Co. Ltd. (A Shares) | | 10,141,088 | 23,790,879 |
| Tsingtao Brewery Co. Ltd. (H Shares) | | 9,260,000 | 59,019,988 |
| WuXi AppTec Co. Ltd. (H Shares) (f) | | 1,299,500 | 15,985,334 |
|
| TOTAL CHINA | | | 1,869,731,576 |
|
| Egypt - 0.0% | | | |
| Six of October Development & Investment Co. | | 5,034,100 | 5,028,236 |
| Greece - 0.5% | | | |
| Titan Cement Co. SA (Reg.) | | 3,400,300 | 73,834,713 |
| Hong Kong - 3.0% | | | |
| AIA Group Ltd. | | 2,370,600 | 24,273,606 |
| China Everbright International Ltd. | | 28,833,000 | 28,227,289 |
| China Overseas Land and Investment Ltd. | | 29,837,000 | 111,630,118 |
| China Resources Beer Holdings Co. Ltd. | | 17,888,666 | 81,749,525 |
| China Resources Power Holdings Co. Ltd. | | 8,362,397 | 11,704,456 |
| China Unicom Ltd. | | 31,533,000 | 37,441,450 |
| China Unicom Ltd. sponsored ADR (a) | | 814,200 | 9,664,554 |
| CNOOC Ltd. | | 77,771,000 | 141,258,143 |
| Far East Horizon Ltd. | | 25,034,750 | 27,795,823 |
|
| TOTAL HONG KONG | | | 473,744,964 |
|
| India - 9.9% | | | |
| Adani Ports & Special Economic Zone Ltd. (b) | | 9,653,281 | 54,443,246 |
| Axis Bank Ltd. (b) | | 10,404,564 | 114,559,707 |
| Axis Bank Ltd. GDR (Reg. S) (b) | | 109,427 | 5,952,829 |
| Bharat Petroleum Corp. Ltd. | | 58,400 | 318,510 |
| Bharti Infratel Ltd. | | 2,499,582 | 9,422,735 |
| Embassy Office Parks (REIT) (b) | | 956,800 | 4,401,882 |
| Federal Bank Ltd. | | 34,320,594 | 45,705,272 |
| ICICI Bank Ltd. | | 8,134,528 | 47,348,970 |
| ICICI Bank Ltd. sponsored ADR | | 19,509,170 | 223,379,997 |
| IndoStar Capital Finance Ltd. (f) | | 2,309,472 | 13,215,789 |
| Indraprastha Gas Ltd. (b) | | 9,885,294 | 44,397,030 |
| ITC Ltd. | | 25,839,554 | 111,803,087 |
| JK Cement Ltd. (b) | | 2,648,322 | 34,349,817 |
| JM Financial Ltd. | | 776,100 | 986,185 |
| Larsen & Toubro Ltd. | | 3,239,144 | 62,718,389 |
| LIC Housing Finance Ltd. | | 15,460,476 | 110,270,241 |
| Manappuram General Finance & Leasing Ltd. | | 29,280,994 | 49,588,543 |
| NTPC Ltd. | | 8,084,307 | 15,559,914 |
| Oberoi Realty Ltd. | | 5,117,141 | 37,272,612 |
| Petronet LNG Ltd. | | 8,599,880 | 29,776,746 |
| Phoenix Mills Ltd. | | 3,340,838 | 28,790,486 |
| Power Grid Corp. of India Ltd. | | 13,579,046 | 36,342,329 |
| Reliance Industries Ltd. | | 11,617,792 | 232,332,487 |
| Shree Cement Ltd. | | 185,499 | 52,707,690 |
| Shriram Transport Finance Co. Ltd. | | 2,397,700 | 38,246,081 |
| SREI Infrastructure Finance Ltd. (c) | | 34,355,610 | 12,800,667 |
| State Bank of India (b) | | 26,593,144 | 118,347,452 |
| Torrent Pharmaceuticals Ltd. | | 1,475,207 | 37,954,591 |
|
| TOTAL INDIA | | | 1,572,993,284 |
|
| Indonesia - 1.3% | | | |
| PT Bank Mandiri (Persero) Tbk | | 103,359,600 | 56,310,737 |
| PT Bank Rakyat Indonesia Tbk | | 445,129,900 | 136,506,503 |
| PT Media Nusantara Citra Tbk | | 257,128,320 | 16,961,447 |
|
| TOTAL INDONESIA | | | 209,778,687 |
|
| Japan - 1.0% | | | |
| Keyence Corp. | | 40,600 | 25,192,082 |
| LINE Corp. (a)(b) | | 537,600 | 18,011,991 |
| Nintendo Co. Ltd. | | 108,500 | 37,369,111 |
| Renesas Electronics Corp. (b)(g) | | 3,262,900 | 17,369,718 |
| SNK Corp. unit (b)(e)(g) | | 77,600 | 2,693,310 |
| SoftBank Corp. | | 310,300 | 32,901,539 |
| Square Enix Holdings Co. Ltd. | | 395,300 | 13,591,265 |
| Zozo, Inc. | | 689,800 | 12,168,024 |
|
| TOTAL JAPAN | | | 159,297,040 |
|
| Korea (South) - 10.3% | | | |
| AMOREPACIFIC Group, Inc. | | 899,769 | 58,128,907 |
| BS Financial Group, Inc. | | 5,644,342 | 33,991,836 |
| Cafe24 Corp. (b) | | 70,100 | 5,781,394 |
| Daou Technology, Inc. | | 2,056,033 | 39,124,347 |
| Hanon Systems | | 194,335 | 2,095,261 |
| Hyundai Fire & Marine Insurance Co. Ltd. | | 1,024,475 | 33,664,804 |
| Hyundai Mobis | | 1,072,712 | 214,264,087 |
| Iljin Materials Co. Ltd. | | 475,383 | 15,233,362 |
| Kakao Corp. | | 159,970 | 16,491,611 |
| KB Financial Group, Inc. | | 2,787,845 | 110,470,634 |
| Korea Electric Power Corp. | | 802,085 | 19,486,367 |
| Korea Electric Power Corp. sponsored ADR (a) | | 287,900 | 3,503,743 |
| LG Chemical Ltd. | | 140,596 | 43,603,711 |
| LG Corp. | | 874,510 | 54,844,228 |
| LG Innotek Co. Ltd. | | 172,520 | 18,155,944 |
| NAVER Corp. | | 201,870 | 20,724,448 |
| NCSOFT Corp. | | 112,543 | 50,856,623 |
| Netmarble Corp. (f) | | 136,240 | 14,923,068 |
| POSCO | | 454,806 | 99,903,662 |
| S-Oil Corp. | | 400,860 | 31,751,696 |
| Samsung Biologics Co. Ltd. (b)(f) | | 110,890 | 32,390,272 |
| Samsung Electronics Co. Ltd. | | 8,055,958 | 317,321,736 |
| Samsung Life Insurance Co. Ltd. | | 468,725 | 34,187,638 |
| Samsung SDI Co. Ltd. | | 386,074 | 78,441,337 |
| Shinhan Financial Group Co. Ltd. | | 2,078,585 | 78,839,305 |
| SK Hynix, Inc. | | 2,608,314 | 177,023,227 |
| ViroMed Co. Ltd. (b) | | 96,300 | 21,534,944 |
|
| TOTAL KOREA (SOUTH) | | | 1,626,738,192 |
|
| Luxembourg - 0.6% | | | |
| Samsonite International SA (f) | | 32,069,100 | 91,978,731 |
| Malaysia - 0.4% | | | |
| British American Tobacco (Malaysia) Bhd | | 3,448,100 | 29,072,625 |
| IHH Healthcare Bhd | | 22,188,000 | 29,838,017 |
|
| TOTAL MALAYSIA | | | 58,910,642 |
|
| Mexico - 2.1% | | | |
| America Movil S.A.B. de CV Series L sponsored ADR | | 2,742,800 | 40,511,156 |
| Fibra Uno Administracion SA de CV | | 25,694,900 | 38,302,957 |
| Gruma S.A.B. de CV Series B | | 5,181,700 | 51,793,084 |
| Grupo Aeroportuario del Pacifico S.A.B. de CV Series B | | 3,672,300 | 37,339,481 |
| Grupo Financiero Banorte S.A.B. de CV Series O | | 8,281,018 | 52,343,468 |
| Macquarie Mexican (REIT) (f) | | 35,514,540 | 42,225,355 |
| Wal-Mart de Mexico SA de CV Series V | | 25,754,600 | 75,683,494 |
|
| TOTAL MEXICO | | | 338,198,995 |
|
| Netherlands - 0.3% | | | |
| NXP Semiconductors NV | | 230,700 | 24,366,534 |
| Yandex NV Series A (b) | | 609,512 | 22,814,034 |
|
| TOTAL NETHERLANDS | | | 47,180,568 |
|
| Nigeria - 0.4% | | | |
| Guaranty Trust Bank PLC | | 129,087,661 | 11,808,435 |
| Guaranty Trust Bank PLC GDR (Reg. S) | | 3,353,504 | 14,822,488 |
| Transnational Corp. of Nigeria PLC | | 717,721,583 | 2,208,374 |
| Zenith Bank PLC | | 576,484,563 | 34,037,758 |
|
| TOTAL NIGERIA | | | 62,877,055 |
|
| Pakistan - 0.1% | | | |
| Habib Bank Ltd. | | 14,543,600 | 13,104,679 |
| Panama - 0.2% | | | |
| Copa Holdings SA Class A | | 444,600 | 37,017,396 |
| Peru - 0.7% | | | |
| Compania de Minas Buenaventura SA sponsored ADR | | 6,872,866 | 111,409,158 |
| Philippines - 0.6% | | | |
| Metropolitan Bank & Trust Co. | | 39,702,022 | 56,952,765 |
| Robinsons Land Corp. | | 69,920,731 | 33,096,173 |
|
| TOTAL PHILIPPINES | | | 90,048,938 |
|
| Poland - 0.2% | | | |
| Dino Polska SA (b)(f) | | 730,000 | 24,260,425 |
| Russia - 5.3% | | | |
| Lukoil PJSC sponsored ADR | | 2,059,400 | 174,595,932 |
| MMC Norilsk Nickel PJSC sponsored ADR (a) | | 5,329,600 | 118,317,120 |
| NOVATEK OAO GDR (Reg. S) | | 520,700 | 100,338,890 |
| RusHydro PJSC | | 100 | 1 |
| RusHydro PJSC rights | | 3 | 0 |
| Sberbank of Russia | | 43,832,550 | 153,560,980 |
| Sberbank of Russia sponsored ADR | | 14,884,294 | 212,770,983 |
| Tatneft PAO | | 3,962,900 | 46,428,563 |
| Unipro PJSC | | 817,180,196 | 32,974,742 |
|
| TOTAL RUSSIA | | | 838,987,211 |
|
| Singapore - 0.2% | | | |
| First Resources Ltd. | | 28,113,900 | 37,826,952 |
| South Africa - 5.9% | | | |
| AngloGold Ashanti Ltd. | | 4,069,000 | 48,412,413 |
| Barclays Africa Group Ltd. | | 12,635,153 | 145,085,651 |
| Bidvest Group Ltd. | | 2,894,145 | 43,923,025 |
| FirstRand Ltd. | | 5,497,000 | 26,095,859 |
| Impala Platinum Holdings Ltd. (b) | | 19,398,000 | 77,646,241 |
| Imperial Holdings Ltd. | | 3,161,400 | 13,790,378 |
| Mondi Ltd. | | 2,832,000 | 62,418,824 |
| Motus Holdings Ltd. | | 3,161,400 | 19,613,719 |
| Mr Price Group Ltd. | | 3,405,700 | 51,574,749 |
| Naspers Ltd. Class N | | 1,464,800 | 376,820,587 |
| Pick 'n Pay Stores Ltd. | | 7,999,600 | 38,792,887 |
| Sasol Ltd. | | 835,700 | 27,725,551 |
|
| TOTAL SOUTH AFRICA | | | 931,899,884 |
|
| Taiwan - 5.7% | | | |
| Chroma ATE, Inc. | | 1,669,000 | 7,966,394 |
| Delta Electronics, Inc. | | 4,747,000 | 24,962,381 |
| King's Town Bank | | 17,583,000 | 18,805,195 |
| Largan Precision Co. Ltd. | | 301,900 | 45,428,613 |
| Nanya Technology Corp. | | 21,292,000 | 45,061,705 |
| PChome Online, Inc. (b) | | 1,141,000 | 4,855,398 |
| Taiwan Semiconductor Manufacturing Co. Ltd. | | 73,035,284 | 613,186,752 |
| Taiwan Semiconductor Manufacturing Co. Ltd. sponsored ADR | | 1,888,801 | 82,767,260 |
| Unified-President Enterprises Corp. | | 28,055,000 | 66,637,661 |
|
| TOTAL TAIWAN | | | 909,671,359 |
|
| Thailand - 1.1% | | | |
| PTT Global Chemical PCL (For. Reg.) | | 30,115,100 | 64,867,647 |
| Siam Cement PCL (For. Reg.) | | 6,972,400 | 100,924,220 |
|
| TOTAL THAILAND | | | 165,791,867 |
|
| Turkey - 0.6% | | | |
| Aselsan A/S | | 9,170,500 | 31,414,138 |
| Enerjisa Enerji A/S (f) | | 3,689,000 | 3,326,153 |
| Tupras Turkiye Petrol Rafinerileri A/S | | 2,624,596 | 54,234,642 |
| Turkiye Garanti Bankasi A/S | | 8,456,000 | 11,578,126 |
|
| TOTAL TURKEY | | | 100,553,059 |
|
| United Arab Emirates - 0.8% | | | |
| DP World Ltd. | | 2,077,770 | 41,555,400 |
| Emaar Properties PJSC | | 42,860,232 | 56,008,906 |
| National Bank of Abu Dhabi PJSC (b) | | 5,125,580 | 22,326,690 |
|
| TOTAL UNITED ARAB EMIRATES | | | 119,890,996 |
|
| United Kingdom - 0.1% | | | |
| Tonghua Dongbao Pharmaceutical Co. Ltd. (UBS AG London Bank Warrant Program) A warrants 4/8/20 (b) | | 6,033,171 | 14,153,752 |
| United States of America - 1.0% | | | |
| Activision Blizzard, Inc. | | 779,900 | 37,598,979 |
| MercadoLibre, Inc. (b) | | 210,100 | 101,717,814 |
| NVIDIA Corp. | | 123,100 | 22,281,100 |
|
| TOTAL UNITED STATES OF AMERICA | | | 161,597,893 |
|
| Vietnam - 0.1% | | | |
| Vietnam Technological & Commercial Joint Stock Bank (b) | | 16,417,800 | 17,025,867 |
| TOTAL COMMON STOCKS | | | |
| (Cost $11,258,892,280) | | | 14,560,196,111 |
|
| Nonconvertible Preferred Stocks - 5.0% | | | |
| Brazil - 3.5% | | | |
| Ambev SA sponsored ADR | | 12,477,200 | 58,767,612 |
| Banco do Estado Rio Grande do Sul SA | | 3,671,386 | 22,864,820 |
| Companhia Paranaense de Energia-Copel: | | | |
| (PN-B) | | 95,800 | 1,006,595 |
| (PN-B) sponsored ADR (a) | | 4,971,139 | 51,799,268 |
| Itau Unibanco Holding SA sponsored ADR | | 23,246,816 | 201,084,958 |
| Metalurgica Gerdau SA (PN) | | 25,835,322 | 44,803,802 |
| Petroleo Brasileiro SA - Petrobras (PN) sponsored ADR (non-vtg.) | | 10,635,700 | 146,772,660 |
| Telefonica Brasil SA | | 2,232,400 | 26,513,700 |
|
| TOTAL BRAZIL | | | 553,613,415 |
|
| Korea (South) - 1.5% | | | |
| Hyundai Motor Co. Series 2 | | 1,663,531 | 125,049,581 |
| Samsung Electronics Co. Ltd. | | 2,716,322 | 86,809,545 |
| Samsung Fire & Marine Insurance Co. Ltd. | | 135,989 | 23,073,537 |
|
| TOTAL KOREA (SOUTH) | | | 234,932,663 |
|
| TOTAL NONCONVERTIBLE PREFERRED STOCKS | | | |
| (Cost $556,790,990) | | | 788,546,078 |
| | | Principal Amount | Value |
|
| Government Obligations - 0.0% | | | |
| United States of America - 0.0% | | | |
| U.S. Treasury Bills, yield at date of purchase 2.38% to 2.41% 5/2/19 to 7/25/19(h) | | | |
| (Cost $9,055,501) | | 9,090,000 | 9,055,582 |
| | | Shares | Value |
|
| Money Market Funds - 4.4% | | | |
| Fidelity Cash Central Fund, 2.49% (i) | | 580,989,308 | 581,105,506 |
| Fidelity Securities Lending Cash Central Fund 2.49% (i)(j) | | 116,435,347 | 116,446,991 |
| TOTAL MONEY MARKET FUNDS | | | |
| (Cost $697,521,915) | | | 697,552,497 |
| TOTAL INVESTMENT IN SECURITIES - 101.2% | | | |
| (Cost $12,522,260,686) | | | 16,055,350,268 |
| NET OTHER ASSETS (LIABILITIES) - (1.2)% | | | (187,426,230) |
| NET ASSETS - 100% | | | $15,867,924,038 |
| Futures Contracts | | | | | |
| | Number of contracts | Expiration Date | Notional Amount | Value | Unrealized Appreciation/(Depreciation) |
| Purchased | | | | | |
| Equity Index Contracts | | | | | |
| ICE E-mini MSCI Emerging Markets Index Contracts (United States) | 3,306 | June 2019 | $178,557,060 | $5,550,053 | $5,550,053 |
The notional amount of futures purchased as a percentage of Net Assets is 1.1%
Categorizations in the Schedule of Investments are based on country or territory of incorporation.
Legend
(a) Security or a portion of the security is on loan at period end.
(b) Non-income producing
(c) Affiliated company
(d) Restricted securities - Investment in securities not registered under the Securities Act of 1933 (excluding 144A issues). At the end of the period, the value of restricted securities (excluding 144A issues) amounted to $39,113,065 or 0.2% of net assets.
(e) Level 3 security
(f) Security exempt from registration under Rule 144A of the Securities Act of 1933. These securities may be resold in transactions exempt from registration, normally to qualified institutional buyers. At the end of the period, the value of these securities amounted to $306,952,595 or 1.9% of net assets.
(g) Security or a portion of the security purchased on a delayed delivery or when-issued basis.
(h) Security or a portion of the security was pledged to cover margin requirements for futures contracts. At period end, the value of securities pledged amounted to $9,055,582.
(i) Affiliated fund that is generally available only to investment companies and other accounts managed by Fidelity Investments. The rate quoted is the annualized seven-day yield of the fund at period end. A complete unaudited listing of the fund's holdings as of its most recent quarter end is available upon request. In addition, each Fidelity Central Fund's financial statements are available on the SEC's website or upon request.
(j) Investment made with cash collateral received from securities on loan.
Additional information on each restricted holding is as follows:
| Security | Acquisition Date | Acquisition Cost |
| Ant International Co. Ltd. Class C | 5/16/18 | $35,678,747 |
Affiliated Central Funds
Information regarding fiscal year to date income earned by the Fund from investments in Fidelity Central Funds is as follows:
| Fund | Income earned |
| Fidelity Cash Central Fund | $4,340,788 |
| Fidelity Securities Lending Cash Central Fund | 1,123,115 |
| Total | $5,463,903 |
Amounts in the income column in the above table include any capital gain distributions from underlying funds, which are presented in the corresponding line-item in the Statement of Operations, if applicable.
Other Affiliated Issuers
An affiliated company is a company in which the Fund has ownership of at least 5% of the voting securities. Fiscal year to date transactions with companies which are or were affiliates are as follows:
| Affiliate | Value, beginning of period | Purchases | Sales Proceeds | Dividend Income | Realized Gain (loss) | Change in Unrealized appreciation (depreciation) | Value, end of period |
| Daou Technology, Inc. | $38,679,457 | $616,126 | $3,372,332 | $558,349 | $(201,578) | $3,402,674 | $-- |
| Direcional Engenharia SA | 23,285,743 | -- | 4,909,347 | 996,389 | 561,231 | 2,111,474 | 21,049,101 |
| Frontier Digital Ventures Ltd. | 6,186,874 | -- | -- | -- | -- | 367,570 | 6,554,444 |
| GP Investments Ltd. Class A (depositary receipt) | 10,339,533 | -- | -- | -- | -- | (2,745,979) | 7,593,554 |
| HUYA, Inc. ADR | -- | 74,669,832 | 30,833,516 | -- | 4,062,707 | 7,753,401 | -- |
| Kingsoft Corp. Ltd. | 102,004,017 | -- | -- | -- | -- | 82,179,544 | 184,183,561 |
| Macquarie Mexican (REIT) | 38,796,336 | -- | 4,115,650 | 1,572,112 | (3,197,847) | 10,742,516 | -- |
| SREI Infrastructure Finance Ltd. | 15,352,257 | -- | -- | 247,644 | -- | (2,551,590) | 12,800,667 |
| Total | $234,644,217 | $75,285,958 | $43,230,845 | $3,374,494 | $1,224,513 | $101,259,610 | $232,181,327 |
Investment Valuation
The following is a summary of the inputs used, as of April 30, 2019, involving the Fund's assets and liabilities carried at fair value. The inputs or methodology used for valuing securities may not be an indication of the risk associated with investing in those securities. For more information on valuation inputs, and their aggregation into the levels used below, please refer to the Investment Valuation section in the accompanying Notes to Financial Statements.
| | Valuation Inputs at Reporting Date: |
| Description | Total | Level 1 | Level 2 | Level 3 |
| Investments in Securities: | | | | |
| Equities: | | | | |
| Communication Services | $1,670,074,789 | $583,867,283 | $1,086,207,506 | $-- |
| Consumer Discretionary | 2,662,500,415 | 2,285,679,828 | 376,820,587 | -- |
| Consumer Staples | 1,003,428,235 | 1,003,428,235 | -- | -- |
| Energy | 1,133,629,610 | 899,868,035 | 233,761,575 | -- |
| Financials | 3,765,360,485 | 2,855,831,599 | 909,528,886 | -- |
| Health Care | 388,346,564 | 388,346,564 | -- | -- |
| Industrials | 712,215,466 | 712,215,466 | -- | -- |
| Information Technology | 2,044,753,769 | 1,428,873,707 | 613,186,752 | 2,693,310 |
| Materials | 1,128,986,163 | 952,944,537 | 176,041,626 | -- |
| Real Estate | 491,339,144 | 452,226,079 | -- | 39,113,065 |
| Utilities | 348,107,549 | 328,621,182 | 19,486,367 | -- |
| Government Obligations | 9,055,582 | -- | 9,055,582 | -- |
| Money Market Funds | 697,552,497 | 697,552,497 | -- | -- |
| Total Investments in Securities: | $16,055,350,268 | $12,589,455,012 | $3,424,088,881 | $41,806,375 |
| Derivative Instruments: | | | | |
| Assets | | | | |
| Futures Contracts | $5,550,053 | $5,550,053 | $-- | $-- |
| Total Assets | $5,550,053 | $5,550,053 | $-- | $-- |
| Total Derivative Instruments: | $5,550,053 | $5,550,053 | $-- | $-- |
Value of Derivative Instruments
The following table is a summary of the Fund's value of derivative instruments by primary risk exposure as of April 30, 2019. For additional information on derivative instruments, please refer to the Derivative Instruments section in the accompanying Notes to Financial Statements.
| Primary Risk Exposure / Derivative Type | Value |
| | Asset | Liability |
| Equity Risk | | |
| Futures Contracts(a) | $5,550,053 | $0 |
| Total Equity Risk | 5,550,053 | 0 |
| Total Value of Derivatives | $5,550,053 | $0 |
(a) Reflects gross cumulative appreciation (depreciation) on futures contracts as presented in the Schedule of Investments. In the Statement of Assets and Liabilities, the period end daily variation margin is included in receivable or payable for daily variation margin for futures contracts, and the net cumulative appreciation (depreciation) is included in net unrealized appreciation (depreciation).
See accompanying notes which are an integral part of the financial statements.
Fidelity® Series Emerging Markets Opportunities Fund
Financial Statements
Statement of Assets and Liabilities
| | | April 30, 2019 (Unaudited) |
| Assets | | |
Investment in securities, at value (including securities loaned of $112,093,525) — See accompanying schedule:
Unaffiliated issuers (cost $11,573,900,267) | $15,125,616,444 | |
| Fidelity Central Funds (cost $697,521,915) | 697,552,497 | |
| Other affiliated issuers (cost $250,838,504) | 232,181,327 | |
| Total Investment in Securities (cost $12,522,260,686) | | $16,055,350,268 |
| Cash | | 44,227 |
| Foreign currency held at value (cost $11,126,198) | | 11,117,222 |
| Receivable for investments sold | | 59,979,269 |
| Receivable for fund shares sold | | 3,606,088 |
| Dividends receivable | | 23,820,020 |
| Distributions receivable from Fidelity Central Funds | | 1,203,217 |
| Receivable from investment adviser for expense reductions | | 194,274 |
| Other receivables | | 2,885,496 |
| Total assets | | 16,158,200,081 |
| Liabilities | | |
| Payable for investments purchased | | |
| Regular delivery | $159,112,534 | |
| Delayed delivery | 6,266,629 | |
| Payable for fund shares redeemed | 6,737,743 | |
| Payable for daily variation margin on futures contracts | 247,950 | |
| Other payables and accrued expenses | 1,463,465 | |
| Collateral on securities loaned | 116,447,722 | |
| Total liabilities | | 290,276,043 |
| Net Assets | | $15,867,924,038 |
| Net Assets consist of: | | |
| Paid in capital | | $12,645,118,293 |
| Total distributable earnings (loss) | | 3,222,805,745 |
| Net Assets, for 835,572,627 shares outstanding | | $15,867,924,038 |
| Net Asset Value, offering price and redemption price per share ($15,867,924,038 ÷ 835,572,627 shares) | | $18.99 |
See accompanying notes which are an integral part of the financial statements.
Statement of Operations
| | | Six months ended April 30, 2019 (Unaudited) |
| Investment Income | | |
| Dividends (including $3,374,494 earned from other affiliated issuers) | | $138,664,871 |
| Interest | | 106,758 |
| Income from Fidelity Central Funds | | 5,463,903 |
| Income before foreign taxes withheld | | 144,235,532 |
| Less foreign taxes withheld | | (15,182,540) |
| Total income | | 129,052,992 |
| Expenses | | |
| Custodian fees and expenses | 2,732,524 | |
| Independent trustees' fees and expenses | 39,627 | |
| Commitment fees | 20,525 | |
| Total expenses before reductions | 2,792,676 | |
| Expense reductions | (1,703,170) | |
| Total expenses after reductions | | 1,089,506 |
| Net investment income (loss) | | 127,963,486 |
| Realized and Unrealized Gain (Loss) | | |
| Net realized gain (loss) on: | | |
| Investment securities: | | |
| Unaffiliated issuers | (242,513,520) | |
| Fidelity Central Funds | (29,396) | |
| Other affiliated issuers | 1,224,513 | |
| Foreign currency transactions | (2,621,547) | |
| Futures contracts | 4,436,024 | |
| Total net realized gain (loss) | | (239,503,926) |
| Change in net unrealized appreciation (depreciation) on: | | |
| Investment securities: | | |
| Unaffiliated issuers | 2,382,856,721 | |
| Fidelity Central Funds | 30,582 | |
| Other affiliated issuers | 101,259,610 | |
| Assets and liabilities in foreign currencies | 227,082 | |
| Futures contracts | 10,811,646 | |
| Total change in net unrealized appreciation (depreciation) | | 2,495,185,641 |
| Net gain (loss) | | 2,255,681,715 |
| Net increase (decrease) in net assets resulting from operations | | $2,383,645,201 |
See accompanying notes which are an integral part of the financial statements.
Statement of Changes in Net Assets
| | Six months ended April 30, 2019 (Unaudited) | Year ended October 31, 2018 |
| Increase (Decrease) in Net Assets | | |
| Operations | | |
| Net investment income (loss) | $127,963,486 | $321,247,606 |
| Net realized gain (loss) | (239,503,926) | 827,680,253 |
| Change in net unrealized appreciation (depreciation) | 2,495,185,641 | (3,331,746,454) |
| Net increase (decrease) in net assets resulting from operations | 2,383,645,201 | (2,182,818,595) |
| Distributions to shareholders | (1,185,081,846) | (442,387,354) |
| Share transactions | | |
| Proceeds from sales of shares | 774,007,568 | 2,738,486,790 |
| Reinvestment of distributions | 1,185,081,846 | 442,387,354 |
| Cost of shares redeemed | (887,538,117) | (2,705,305,537) |
| Net increase (decrease) in net assets resulting from share transactions | 1,071,551,297 | 475,568,607 |
| Total increase (decrease) in net assets | 2,270,114,652 | (2,149,637,342) |
| Net Assets | | |
| Beginning of period | 13,597,809,386 | 15,747,446,728 |
| End of period | $15,867,924,038 | $13,597,809,386 |
| Other Information | | |
| Shares | | |
| Sold | 42,556,645 | 137,281,893 |
| Issued in reinvestment of distributions | 72,129,145 | 21,392,038 |
| Redeemed | (49,206,566) | (126,152,959) |
| Net increase (decrease) | 65,479,224 | 32,520,972 |
See accompanying notes which are an integral part of the financial statements.
Financial Highlights
Fidelity Series Emerging Markets Opportunities Fund
| | Six months ended (Unaudited) April 30, | Years endedOctober 31, | | | | |
| | 2019 | 2018 | 2017 | 2016 | 2015 | 2014 |
| Selected Per–Share Data | | | | | | |
| Net asset value, beginning of period | $17.66 | $21.35 | $16.79 | $15.31 | $17.77 | $17.56 |
| Income from Investment Operations | | | | | | |
| Net investment income (loss)A | .16 | .45 | .30 | .19 | .21B | .21 |
| Net realized and unrealized gain (loss) | 2.72 | (3.52) | 4.49 | 1.47 | (2.53) | .17 |
| Total from investment operations | 2.88 | (3.07) | 4.79 | 1.66 | (2.32) | .38 |
| Distributions from net investment income | (.41) | (.39) | (.19) | (.18) | (.14) | (.17) |
| Distributions from net realized gain | (1.14) | (.23) | (.04) | – | – | (.01) |
| Total distributions | (1.55) | (.62) | (.23) | (.18) | (.14) | (.17)C |
| Net asset value, end of period | $18.99 | $17.66 | $21.35 | $16.79 | $15.31 | $17.77 |
| Total ReturnD,E | 17.66% | (14.82)% | 29.04% | 11.02% | (13.14)% | 2.20% |
| Ratios to Average Net AssetsF,G | | | | | | |
| Expenses before reductions | .04%H | .05% | .59% | 1.03% | 1.04% | 1.06% |
| Expenses net of fee waivers, if any | .01%H | .01% | .57% | 1.03% | 1.04% | 1.06% |
| Expenses net of all reductions | .01%H | .01% | .56% | 1.03% | 1.03% | 1.06% |
| Net investment income (loss) | 1.74%H | 2.16% | 1.63% | 1.24% | 1.29%B | 1.18% |
| Supplemental Data | | | | | | |
| Net assets, end of period (000 omitted) | $15,867,924 | $13,597,809 | $15,747,447 | $6,998,219 | $5,571,493 | $4,837,497 |
| Portfolio turnover rateI | 60%H | 64% | 56% | 45% | 64% | 93% |
A Calculated based on average shares outstanding during the period.
B Net investment income per share reflects a large, non-recurring dividend which amounted to $.05 per share. Excluding this non-recurring dividend, the ratio of net investment income (loss) to average net assets would have been 1.00%.
C Total distributions of $.17 per share is comprised of distributions from net investment income of $.166 and distributions from net realized gain of $.006 per share.
D Total returns for periods of less than one year are not annualized.
E Total returns would have been lower if certain expenses had not been reduced during the applicable periods shown.
F Fees and expenses of any underlying Fidelity Central Funds are not included in the Fund's expense ratio. The Fund indirectly bears its proportionate share of the expenses of any underlying Fidelity Central Funds.
G Expense ratios reflect operating expenses of the Fund. Expenses before reductions do not reflect amounts reimbursed by the investment adviser or reductions from brokerage service arrangements or reductions from other expense offset arrangements and do not represent the amount paid by the Fund during periods when reimbursements or reductions occur. Expenses net of fee waivers reflect expenses after reimbursement by the investment adviser but prior to reductions from brokerage service arrangements or other expense offset arrangements. Expenses net of all reductions represent the net expenses paid by the Fund.
H Annualized
I Amount does not include the portfolio activity of any underlying Fidelity Central Funds.
See accompanying notes which are an integral part of the financial statements.
Fidelity® Series International Growth Fund
Investment Summary (Unaudited)
Geographic Diversification (% of fund's net assets)
| As of April 30, 2019 |
| | United States of America* | 21.4% |
| | Japan | 13.6% |
| | Switzerland | 10.0% |
| | Germany | 8.8% |
| | United Kingdom | 6.3% |
| | Sweden | 5.0% |
| | France | 3.9% |
| | Hong Kong | 3.5% |
| | Spain | 3.4% |
| | Other | 24.1% |
* Includes Short-Term investments and Net Other Assets (Liabilities).
Percentages are based on country or territory of incorporation and are adjusted for the effect of futures contracts, if applicable.
Asset Allocation as of April 30, 2019
| | % of fund's net assets |
| Stocks | 97.8 |
| Short-Term Investments and Net Other Assets (Liabilities) | 2.2 |
Top Ten Stocks as of April 30, 2019
| | % of fund's net assets |
| Nestle SA (Reg. S) (Switzerland, Food Products) | 5.4 |
| SAP SE (Germany, Software) | 4.0 |
| AIA Group Ltd. (Hong Kong, Insurance) | 3.5 |
| Roche Holding AG (participation certificate) (Switzerland, Pharmaceuticals) | 3.4 |
| CSL Ltd. (Australia, Biotechnology) | 3.3 |
| ASML Holding NV (Netherlands) (Netherlands, Semiconductors & Semiconductor Equipment) | 3.3 |
| Keyence Corp. (Japan, Electronic Equipment & Components) | 3.0 |
| MasterCard, Inc. Class A (United States of America, IT Services) | 2.9 |
| Visa, Inc. Class A (United States of America, IT Services) | 2.6 |
| ASSA ABLOY AB (B Shares) (Sweden, Building Products) | 2.4 |
| | 33.8 |
Top Market Sectors as of April 30, 2019
| | % of fund's net assets |
| Industrials | 22.6 |
| Information Technology | 22.2 |
| Financials | 15.1 |
| Health Care | 9.6 |
| Consumer Discretionary | 8.3 |
| Materials | 7.6 |
| Consumer Staples | 7.2 |
| Communication Services | 3.7 |
| Real Estate | 1.1 |
| Energy | 0.4 |
Fidelity® Series International Growth Fund
Schedule of Investments April 30, 2019 (Unaudited)
Showing Percentage of Net Assets
| Common Stocks - 97.4% | | | |
| | | Shares | Value |
| Australia - 3.3% | | | |
| CSL Ltd. | | 3,656,838 | $511,891,211 |
| Austria - 1.0% | | | |
| Andritz AG (a) | | 3,192,760 | 152,192,484 |
| Bailiwick of Jersey - 1.1% | | | |
| Experian PLC | | 5,880,600 | 171,177,876 |
| Belgium - 0.7% | | | |
| KBC Groep NV | | 1,457,451 | 107,921,379 |
| Brazil - 0.5% | | | |
| BM&F BOVESPA SA | | 6,493,800 | 57,053,227 |
| Itau Unibanco Holding SA | | 2,269,500 | 16,987,535 |
|
| TOTAL BRAZIL | | | 74,040,762 |
|
| Canada - 2.5% | | | |
| Alimentation Couche-Tard, Inc. Class B (sub. vtg.) | | 1,376,300 | 81,147,971 |
| Canadian National Railway Co. | | 926,200 | 86,031,446 |
| Canadian Pacific Railway Ltd. | | 393,100 | 88,077,052 |
| Franco-Nevada Corp. | | 1,015,700 | 72,775,280 |
| Pason Systems, Inc. | | 2,004,369 | 29,847,848 |
| PrairieSky Royalty Ltd. (b) | | 2,273,200 | 32,765,165 |
|
| TOTAL CANADA | | | 390,644,762 |
|
| Cayman Islands - 1.4% | | | |
| Alibaba Group Holding Ltd. sponsored ADR (a) | | 1,139,600 | 211,475,572 |
| Denmark - 0.3% | | | |
| Jyske Bank A/S (Reg.) | | 1,213,600 | 48,880,934 |
| Finland - 0.2% | | | |
| Tikkurila Oyj | | 1,797,108 | 30,073,294 |
| France - 3.9% | | | |
| Edenred SA (b) | | 3,053,200 | 143,861,948 |
| Elis SA | | 2,137,452 | 38,118,122 |
| Legrand SA | | 1,846,700 | 135,708,872 |
| Safran SA | | 1,969,600 | 287,091,115 |
|
| TOTAL FRANCE | | | 604,780,057 |
|
| Germany - 8.8% | | | |
| Deutsche Borse AG | | 1,046,000 | 139,768,985 |
| Linde PLC | | 1,710,212 | 307,675,075 |
| MTU Aero Engines Holdings AG | | 809,200 | 190,323,452 |
| SAP SE | | 4,740,984 | 611,151,936 |
| Vonovia SE | | 2,317,500 | 115,591,227 |
|
| TOTAL GERMANY | | | 1,364,510,675 |
|
| Hong Kong - 3.5% | | | |
| AIA Group Ltd. | | 52,567,200 | 538,258,461 |
| India - 1.2% | | | |
| Housing Development Finance Corp. Ltd. | | 6,598,866 | 189,025,624 |
| Ireland - 2.2% | | | |
| CRH PLC sponsored ADR | | 7,873,006 | 264,926,652 |
| James Hardie Industries PLC CDI | | 5,902,101 | 80,218,028 |
|
| TOTAL IRELAND | | | 345,144,680 |
|
| Italy - 0.7% | | | |
| Interpump Group SpA | | 2,954,749 | 110,954,276 |
| Japan - 13.6% | | | |
| Azbil Corp. | | 3,650,500 | 87,399,645 |
| DENSO Corp. | | 3,454,200 | 150,484,605 |
| East Japan Railway Co. | | 1,893,800 | 177,912,985 |
| Fanuc Corp. (c) | | 937,900 | 176,208,491 |
| Hoya Corp. | | 3,096,224 | 217,217,923 |
| Keyence Corp. (c) | | 752,500 | 466,922,214 |
| Komatsu Ltd. | | 5,096,200 | 131,636,935 |
| Misumi Group, Inc. | | 6,989,500 | 180,580,645 |
| Nabtesco Corp. | | 3,136,700 | 95,456,825 |
| OSG Corp. | | 3,875,200 | 77,542,267 |
| SHO-BOND Holdings Co. Ltd. (d) | | 1,459,200 | 100,078,890 |
| USS Co. Ltd. | | 12,674,900 | 241,903,473 |
|
| TOTAL JAPAN | | | 2,103,344,898 |
|
| Kenya - 0.4% | | | |
| Safaricom Ltd. | | 238,150,500 | 66,277,178 |
| Korea (South) - 0.4% | | | |
| BGF Retail Co. Ltd. | | 323,987 | 60,816,625 |
| Netherlands - 3.3% | | | |
| ASML Holding NV (Netherlands) | | 2,444,300 | 508,662,899 |
| New Zealand - 0.5% | | | |
| Auckland International Airport Ltd. | | 14,862,831 | 79,117,272 |
| Norway - 0.8% | | | |
| Adevinta ASA Class B | | 4,499,491 | 44,267,634 |
| Schibsted ASA (B Shares) | | 2,992,191 | 71,584,098 |
|
| TOTAL NORWAY | | | 115,851,732 |
|
| South Africa - 1.9% | | | |
| Clicks Group Ltd. | | 7,046,019 | 96,373,581 |
| Naspers Ltd. Class N | | 770,410 | 198,188,386 |
|
| TOTAL SOUTH AFRICA | | | 294,561,967 |
|
| Spain - 3.4% | | | |
| Amadeus IT Holding SA Class A | | 4,444,700 | 353,548,649 |
| Grifols SA ADR | | 3,051,287 | 58,401,633 |
| Merlin Properties Socimi SA | | 2,823,600 | 38,478,440 |
| Prosegur Compania de Seguridad SA (Reg.) | | 15,251,589 | 79,338,473 |
|
| TOTAL SPAIN | | | 529,767,195 |
|
| Sweden - 5.0% | | | |
| ASSA ABLOY AB (B Shares) | | 16,986,617 | 363,132,554 |
| Atlas Copco AB (A Shares) (b) | | 7,011,800 | 218,868,477 |
| Epiroc AB Class A | | 10,395,800 | 107,467,644 |
| Fagerhult AB | | 3,151,109 | 26,915,127 |
| Loomis AB (B Shares) | | 1,324,300 | 48,995,509 |
|
| TOTAL SWEDEN | | | 765,379,311 |
|
| Switzerland - 10.0% | | | |
| Nestle SA (Reg. S) | | 8,672,445 | 834,962,643 |
| Roche Holding AG (participation certificate) | | 1,955,481 | 515,979,800 |
| Schindler Holding AG: | | | |
| (participation certificate) | | 704,326 | 151,931,748 |
| (Reg.) | | 154,309 | 32,771,449 |
|
| TOTAL SWITZERLAND | | | 1,535,645,640 |
|
| Taiwan - 1.3% | | | |
| Taiwan Semiconductor Manufacturing Co. Ltd. | | 23,883,000 | 200,515,948 |
| United Kingdom - 6.3% | | | |
| BAE Systems PLC | | 9,233,800 | 59,348,238 |
| Elementis PLC | | 15,468,883 | 32,778,563 |
| Informa PLC | | 10,085,988 | 102,455,079 |
| InterContinental Hotel Group PLC ADR (b) | | 4,488,502 | 296,734,867 |
| Prudential PLC | | 11,617,238 | 263,959,698 |
| Rightmove PLC | | 10,618,100 | 74,851,489 |
| Shaftesbury PLC | | 3,555,100 | 39,845,134 |
| Spectris PLC | | 2,873,394 | 102,964,970 |
|
| TOTAL UNITED KINGDOM | | | 972,938,038 |
|
| United States of America - 19.2% | | | |
| Alphabet, Inc. Class A (a) | | 205,094 | 245,899,502 |
| Autoliv, Inc. (b) | | 1,410,327 | 110,696,566 |
| Berkshire Hathaway, Inc. Class B (a) | | 881,950 | 191,127,385 |
| Black Knight, Inc. (a) | | 1,748,400 | 98,644,728 |
| Marsh & McLennan Companies, Inc. | | 1,710,642 | 161,296,434 |
| Martin Marietta Materials, Inc. | | 802,366 | 178,045,015 |
| MasterCard, Inc. Class A | | 1,752,310 | 445,507,294 |
| Mohawk Industries, Inc. (a) | | 453,415 | 61,777,794 |
| Moody's Corp. | | 876,900 | 172,416,078 |
| MSCI, Inc. | | 951,900 | 214,539,222 |
| PayPal Holdings, Inc. (a) | | 842,700 | 95,031,279 |
| PriceSmart, Inc. | | 647,664 | 38,736,784 |
| ResMed, Inc. | | 1,599,200 | 167,132,392 |
| S&P Global, Inc. | | 836,271 | 184,531,559 |
| Sherwin-Williams Co. | | 422,700 | 192,256,641 |
| Visa, Inc. Class A | | 2,434,196 | 400,254,848 |
|
| TOTAL UNITED STATES OF AMERICA | | | 2,957,893,521 |
|
| TOTAL COMMON STOCKS | | | |
| (Cost $9,950,492,091) | | | 15,041,744,271 |
|
| Nonconvertible Preferred Stocks - 0.4% | | | |
| Brazil - 0.4% | | | |
| Itau Unibanco Holding SA | | | |
| (Cost $56,696,907) | | 6,711,450 | 57,904,250 |
|
| Money Market Funds - 2.7% | | | |
| Fidelity Cash Central Fund, 2.49% (e) | | 279,913,386 | 279,969,369 |
| Fidelity Securities Lending Cash Central Fund 2.49% (e)(f) | | 145,880,905 | 145,895,493 |
| TOTAL MONEY MARKET FUNDS | | | |
| (Cost $425,862,774) | | | 425,864,862 |
| TOTAL INVESTMENT IN SECURITIES - 100.5% | | | |
| (Cost $10,433,051,772) | | | 15,525,513,383 |
| NET OTHER ASSETS (LIABILITIES) - (0.5)% | | | (82,888,076) |
| NET ASSETS - 100% | | | $15,442,625,307 |
Categorizations in the Schedule of Investments are based on country or territory of incorporation.
Legend
(a) Non-income producing
(b) Security or a portion of the security is on loan at period end.
(c) Security or a portion of the security purchased on a delayed delivery or when-issued basis.
(d) Affiliated company
(e) Affiliated fund that is generally available only to investment companies and other accounts managed by Fidelity Investments. The rate quoted is the annualized seven-day yield of the fund at period end. A complete unaudited listing of the fund's holdings as of its most recent quarter end is available upon request. In addition, each Fidelity Central Fund's financial statements are available on the SEC's website or upon request.
(f) Investment made with cash collateral received from securities on loan.
Affiliated Central Funds
Information regarding fiscal year to date income earned by the Fund from investments in Fidelity Central Funds is as follows:
| Fund | Income earned |
| Fidelity Cash Central Fund | $4,493,740 |
| Fidelity Securities Lending Cash Central Fund | 615,711 |
| Total | $5,109,451 |
Amounts in the income column in the above table include any capital gain distributions from underlying funds, which are presented in the corresponding line-item in the Statement of Operations, if applicable.
Other Affiliated Issuers
An affiliated company is a company in which the Fund has ownership of at least 5% of the voting securities. Fiscal year to date transactions with companies which are or were affiliates are as follows:
| Affiliate | Value, beginning of period | Purchases | Sales Proceeds | Dividend Income | Realized Gain (loss) | Change in Unrealized appreciation (depreciation) | Value, end of period |
| SHO-BOND Holdings Co. Ltd. | $103,974,547 | $-- | $-- | $595,187 | $-- | $(3,895,657) | $100,078,890 |
| Total | $103,974,547 | $-- | $-- | $595,187 | $-- | $(3,895,657) | $100,078,890 |
Investment Valuation
The following is a summary of the inputs used, as of April 30, 2019, involving the Fund's assets and liabilities carried at fair value. The inputs or methodology used for valuing securities may not be an indication of the risk associated with investing in those securities. For more information on valuation inputs, and their aggregation into the levels used below, please refer to the Investment Valuation section in the accompanying Notes to Financial Statements.
| | Valuation Inputs at Reporting Date: |
| Description | Total | Level 1 | Level 2 | Level 3 |
| Investments in Securities: | | | | |
| Equities: | | | | |
| Communication Services | $561,067,346 | $561,067,346 | $-- | $-- |
| Consumer Discretionary | 1,271,261,263 | 1,073,072,877 | 198,188,386 | -- |
| Consumer Staples | 1,112,037,604 | 277,074,961 | 834,962,643 | -- |
| Energy | 62,613,013 | 62,613,013 | -- | -- |
| Financials | 2,343,670,771 | 1,401,683,627 | 941,987,144 | -- |
| Health Care | 1,470,622,959 | 954,643,159 | 515,979,800 | -- |
| Industrials | 3,510,840,172 | 1,919,998,206 | 1,590,841,966 | -- |
| Information Technology | 3,414,872,044 | 2,603,204,160 | 811,667,884 | -- |
| Materials | 1,158,748,548 | 1,158,748,548 | -- | -- |
| Real Estate | 193,914,801 | 193,914,801 | -- | -- |
| Money Market Funds | 425,864,862 | 425,864,862 | -- | -- |
| Total Investments in Securities: | $15,525,513,383 | $10,631,885,560 | $4,893,627,823 | $-- |
See accompanying notes which are an integral part of the financial statements.
Fidelity® Series International Growth Fund
Financial Statements
Statement of Assets and Liabilities
| | | April 30, 2019 (Unaudited) |
| Assets | | |
Investment in securities, at value (including securities loaned of $139,454,034) — See accompanying schedule:
Unaffiliated issuers (cost $9,964,853,958) | $14,999,569,631 | |
| Fidelity Central Funds (cost $425,862,774) | 425,864,862 | |
| Other affiliated issuers (cost $42,335,040) | 100,078,890 | |
| Total Investment in Securities (cost $10,433,051,772) | | $15,525,513,383 |
| Foreign currency held at value (cost $6,629) | | 6,625 |
| Receivable for investments sold | | 1,307,309 |
| Receivable for fund shares sold | | 2,055,789 |
| Dividends receivable | | 89,926,278 |
| Distributions receivable from Fidelity Central Funds | | 651,142 |
| Total assets | | 15,619,460,526 |
| Liabilities | | |
| Payable for investments purchased | | |
| Regular delivery | $7,439,556 | |
| Delayed delivery | 13,680,560 | |
| Payable for fund shares redeemed | 9,415,536 | |
| Other payables and accrued expenses | 432,027 | |
| Collateral on securities loaned | 145,867,540 | |
| Total liabilities | | 176,835,219 |
| Net Assets | | $15,442,625,307 |
| Net Assets consist of: | | |
| Paid in capital | | $10,185,373,806 |
| Total distributable earnings (loss) | | 5,257,251,501 |
| Net Assets, for 970,943,496 shares outstanding | | $15,442,625,307 |
| Net Asset Value, offering price and redemption price per share ($15,442,625,307 ÷ 970,943,496 shares) | | $15.90 |
See accompanying notes which are an integral part of the financial statements.
Statement of Operations
| | | Six months ended April 30, 2019 (Unaudited) |
| Investment Income | | |
| Dividends (including $595,187 earned from other affiliated issuers) | | $151,950,847 |
| Non-Cash dividends | | 28,884,023 |
| Income from Fidelity Central Funds | | 5,109,451 |
| Income before foreign taxes withheld | | 185,944,321 |
| Less foreign taxes withheld | | (14,187,157) |
| Total income | | 171,757,164 |
| Expenses | | |
| Custodian fees and expenses | $626,390 | |
| Independent trustees' fees and expenses | 39,089 | |
| Commitment fees | 20,113 | |
| Total expenses before reductions | 685,592 | |
| Expense reductions | (1,364) | |
| Total expenses after reductions | | 684,228 |
| Net investment income (loss) | | 171,072,936 |
| Realized and Unrealized Gain (Loss) | | |
| Net realized gain (loss) on: | | |
| Investment securities: | | |
| Unaffiliated issuers | 51,236,911 | |
| Fidelity Central Funds | (4,005) | |
| Foreign currency transactions | (799,647) | |
| Total net realized gain (loss) | | 50,433,259 |
| Change in net unrealized appreciation (depreciation) on: | | |
| Investment securities: | | |
| Unaffiliated issuers | 1,725,765,671 | |
| Fidelity Central Funds | 2,088 | |
| Other affiliated issuers | (3,895,657) | |
| Assets and liabilities in foreign currencies | (1,215,839) | |
| Total change in net unrealized appreciation (depreciation) | | 1,720,656,263 |
| Net gain (loss) | | 1,771,089,522 |
| Net increase (decrease) in net assets resulting from operations | | $1,942,162,458 |
See accompanying notes which are an integral part of the financial statements.
Statement of Changes in Net Assets
| | Six months ended April 30, 2019 (Unaudited) | Year ended October 31, 2018 |
| Increase (Decrease) in Net Assets | | |
| Operations | | |
| Net investment income (loss) | $171,072,936 | $271,551,901 |
| Net realized gain (loss) | 50,433,259 | 663,014,677 |
| Change in net unrealized appreciation (depreciation) | 1,720,656,263 | (1,606,402,204) |
| Net increase (decrease) in net assets resulting from operations | 1,942,162,458 | (671,835,626) |
| Distributions to shareholders | (924,506,492) | (460,665,652) |
| Share transactions | | |
| Proceeds from sales of shares | 721,216,722 | 2,006,174,828 |
| Reinvestment of distributions | 924,506,492 | 460,665,652 |
| Cost of shares redeemed | (1,334,353,891) | (2,005,553,650) |
| Net increase (decrease) in net assets resulting from share transactions | 311,369,323 | 461,286,830 |
| Total increase (decrease) in net assets | 1,329,025,289 | (671,214,448) |
| Net Assets | | |
| Beginning of period | 14,113,600,018 | 14,784,814,466 |
| End of period | $15,442,625,307 | $14,113,600,018 |
| Other Information | | |
| Shares | | |
| Sold | 48,635,185 | 126,128,565 |
| Issued in reinvestment of distributions | 68,583,568 | 29,082,428 |
| Redeemed | (89,961,624) | (122,800,370) |
| Net increase (decrease) | 27,257,129 | 32,410,623 |
See accompanying notes which are an integral part of the financial statements.
Financial Highlights
Fidelity Series International Growth Fund
| | Six months ended (Unaudited) April 30, | Years endedOctober 31, | | | | |
| | 2019 | 2018 | 2017 | 2016 | 2015 | 2014 |
| Selected Per–Share Data | | | | | | |
| Net asset value, beginning of period | $14.96 | $16.22 | $13.37 | $14.28 | $14.17 | $13.95 |
| Income from Investment Operations | | | | | | |
| Net investment income (loss)A | .18 | .30 | .21 | .17B | .15 | .17 |
| Net realized and unrealized gain (loss) | 1.76 | (1.05) | 2.97 | (.60) | .36 | .20 |
| Total from investment operations | 1.94 | (.75) | 3.18 | (.43) | .51 | .37 |
| Distributions from net investment income | (.28) | (.24) | (.16) | (.16) | (.19) | (.10) |
| Distributions from net realized gain | (.72) | (.27) | (.17) | (.33) | (.21) | (.05) |
| Total distributions | (1.00) | (.51) | (.33) | (.48)C | (.40) | (.15) |
| Net asset value, end of period | $15.90 | $14.96 | $16.22 | $13.37 | $14.28 | $14.17 |
| Total ReturnD,E | 14.18% | (4.82)% | 24.42% | (3.10)% | 3.65% | 2.66% |
| Ratios to Average Net AssetsF,G | | | | | | |
| Expenses before reductions | .01%H | .01% | .51% | .94% | .92% | .97% |
| Expenses net of fee waivers, if any | .01%H | .01% | .51% | .94% | .91% | .97% |
| Expenses net of all reductions | .01%H | - %I | .51% | .94% | .91% | .97% |
| Net investment income (loss) | 2.40%H | 1.84% | 1.41% | 1.27%B | 1.06% | 1.23% |
| Supplemental Data | | | | | | |
| Net assets, end of period (000 omitted) | $15,442,625 | $14,113,600 | $14,784,814 | $5,618,983 | $5,563,674 | $6,049,347 |
| Portfolio turnover rateJ | 24%H | 33% | 23% | 26% | 24% | 33% |
A Calculated based on average shares outstanding during the period.
B Net investment income per share reflects a large, non-recurring dividend which amounted to $.05 per share. Excluding this non-recurring dividend, the ratio of net investment income (loss) to average net assets would have been .93%.
C Total distributions of $.48 per share is comprised of distributions from net investment income of $.156 and distributions from net realized gain of $.326 per share.
D Total returns for periods of less than one year are not annualized.
E Total returns would have been lower if certain expenses had not been reduced during the applicable periods shown.
F Fees and expenses of any underlying Fidelity Central Funds are not included in the Fund's expense ratio. The Fund indirectly bears its proportionate share of the expenses of any underlying Fidelity Central Funds.
G Expense ratios reflect operating expenses of the Fund. Expenses before reductions do not reflect amounts reimbursed by the investment adviser or reductions from brokerage service arrangements or reductions from other expense offset arrangements and do not represent the amount paid by the Fund during periods when reimbursements or reductions occur. Expenses net of fee waivers reflect expenses after reimbursement by the investment adviser but prior to reductions from brokerage service arrangements or other expense offset arrangements. Expenses net of all reductions represent the net expenses paid by the Fund.
H Annualized
I Amount represents less than .005%.
J Amount does not include the portfolio activity of any underlying Fidelity Central Funds.
See accompanying notes which are an integral part of the financial statements.
Fidelity® Series International Small Cap Fund
Investment Summary (Unaudited)
Geographic Diversification (% of fund's net assets)
| As of April 30, 2019 |
| | Japan | 34.2% |
| | United Kingdom | 18.0% |
| | United States of America* | 7.0% |
| | Germany | 5.5% |
| | Sweden | 4.8% |
| | Netherlands | 2.6% |
| | Israel | 2.5% |
| | Belgium | 2.3% |
| | Denmark | 2.3% |
| | Other | 20.8% |

* Includes Short-Term investments and Net Other Assets (Liabilities).
Percentages are based on country or territory of incorporation and are adjusted for the effect of futures contracts, if applicable.
Asset Allocation as of April 30, 2019
| | % of fund's net assets |
| Stocks | 94.8 |
| Short-Term Investments and Net Other Assets (Liabilities) | 5.2 |
Top Ten Stocks as of April 30, 2019
| | % of fund's net assets |
| Spirax-Sarco Engineering PLC (United Kingdom, Machinery) | 2.8 |
| CompuGroup Medical AG (Germany, Health Care Technology) | 2.4 |
| Spectris PLC (United Kingdom, Electronic Equipment & Components) | 2.3 |
| Azbil Corp. (Japan, Electronic Equipment & Components) | 2.3 |
| OBIC Co. Ltd. (Japan, IT Services) | 2.2 |
| USS Co. Ltd. (Japan, Specialty Retail) | 1.8 |
| Dechra Pharmaceuticals PLC (United Kingdom, Pharmaceuticals) | 1.6 |
| Nihon Parkerizing Co. Ltd. (Japan, Chemicals) | 1.6 |
| Lasertec Corp. (Japan, Semiconductors & Semiconductor Equipment) | 1.4 |
| SHO-BOND Holdings Co. Ltd. (Japan, Construction & Engineering) | 1.4 |
| | 19.8 |
Top Market Sectors as of April 30, 2019
| | % of fund's net assets |
| Industrials | 23.1 |
| Information Technology | 15.0 |
| Health Care | 12.9 |
| Consumer Discretionary | 10.2 |
| Consumer Staples | 7.8 |
| Financials | 6.8 |
| Materials | 6.4 |
| Communication Services | 5.8 |
| Real Estate | 4.3 |
| Energy | 2.4 |
Fidelity® Series International Small Cap Fund
Schedule of Investments April 30, 2019 (Unaudited)
Showing Percentage of Net Assets
| Common Stocks - 93.8% | | | |
| | | Shares | Value |
| Australia - 1.1% | | | |
| Bapcor Ltd. | | 1,319,707 | $5,293,563 |
| Beacon Lighting Group Ltd. | | 6,633,510 | 4,851,654 |
| DuluxGroup Ltd. | | 1,489,300 | 10,236,350 |
| Imdex Ltd. | | 17,435,670 | 12,782,927 |
| Nanosonics Ltd. (a) | | 678,844 | 2,364,042 |
| Quintis Ltd. (a)(b)(c) | | 9,242,850 | 65 |
| Reckon Ltd. (d) | | 5,931,484 | 2,947,887 |
| Sigma Healthcare Ltd. | | 1,795,948 | 664,678 |
| SomnoMed Ltd. (a) | | 305,402 | 376,763 |
|
| TOTAL AUSTRALIA | | | 39,517,929 |
|
| Austria - 1.1% | | | |
| Andritz AG | | 452,824 | 21,585,214 |
| EVN AG | | 255,100 | 3,805,398 |
| IMMOFINANZ Immobilien Anlagen AG | | 280,582 | 7,190,913 |
| Wienerberger AG | | 220,100 | 5,050,841 |
|
| TOTAL AUSTRIA | | | 37,632,366 |
|
| Bailiwick of Jersey - 0.6% | | | |
| Integrated Diagnostics Holdings PLC (e) | | 4,317,632 | 20,940,515 |
| Belgium - 2.3% | | | |
| Barco NV | | 182,000 | 32,334,382 |
| Econocom Group SA (b) | | 2,600,266 | 10,802,562 |
| KBC Ancora | | 765,941 | 39,002,206 |
|
| TOTAL BELGIUM | | | 82,139,150 |
|
| Brazil - 0.2% | | | |
| Sul America SA unit | | 879,702 | 6,999,746 |
| Canada - 2.1% | | | |
| ECN Capital Corp. | | 3,248,700 | 10,403,018 |
| McCoy Global, Inc. (a) | | 1,110,050 | 662,865 |
| MTY Food Group, Inc. | | 109,600 | 4,528,148 |
| New Look Vision Group, Inc. | | 694,700 | 16,002,420 |
| Pason Systems, Inc. | | 1,151,000 | 17,139,994 |
| PrairieSky Royalty Ltd. | | 948,900 | 13,677,136 |
| ShawCor Ltd. Class A | | 489,800 | 7,268,212 |
| Total Energy Services, Inc. | | 358,600 | 2,623,184 |
|
| TOTAL CANADA | | | 72,304,977 |
|
| Cayman Islands - 0.4% | | | |
| SITC International Holdings Co. Ltd. | | 3,861,000 | 4,099,802 |
| Value Partners Group Ltd. | | 11,815,817 | 8,886,564 |
|
| TOTAL CAYMAN ISLANDS | | | 12,986,366 |
|
| China - 0.4%�� | | | |
| Zhejiang Sanhua Intelligent Controls Co. Ltd. (A Shares) | | 5,740,100 | 13,551,440 |
| Denmark - 2.3% | | | |
| Jyske Bank A/S (Reg.) | | 357,819 | 14,412,102 |
| Netcompany Group A/S (e) | | 334,495 | 11,929,918 |
| SimCorp A/S | | 278,400 | 27,290,837 |
| Spar Nord Bank A/S | | 2,988,581 | 25,681,960 |
|
| TOTAL DENMARK | | | 79,314,817 |
|
| Finland - 0.6% | | | |
| Olvi PLC (A Shares) | | 228,000 | 8,451,705 |
| Tikkurila Oyj | | 850,264 | 14,228,549 |
|
| TOTAL FINLAND | | | 22,680,254 |
|
| France - 2.0% | | | |
| Cegedim SA (a) | | 58,251 | 1,695,426 |
| Elis SA | | 1,803,121 | 32,155,850 |
| Laurent-Perrier Group SA | | 135,868 | 14,385,573 |
| Somfy SA | | 27,200 | 2,465,008 |
| STEF-TFE Group | | 24,910 | 2,358,056 |
| Vetoquinol SA | | 297,227 | 18,668,709 |
|
| TOTAL FRANCE | | | 71,728,622 |
|
| Germany - 4.7% | | | |
| CompuGroup Medical AG | | 1,273,012 | 84,240,806 |
| CTS Eventim AG | | 651,195 | 33,334,558 |
| JOST Werke AG (e) | | 79,379 | 2,924,684 |
| Nexus AG | | 618,016 | 17,675,752 |
| SMA Solar Technology AG (b) | | 148,362 | 3,374,649 |
| WashTec AG | | 275,087 | 21,628,484 |
|
| TOTAL GERMANY | | | 163,178,933 |
|
| Greece - 0.9% | | | |
| Fourlis Holdings SA | | 1,287,902 | 7,800,359 |
| Motor Oil (HELLAS) Corinth Refineries SA | | 690,500 | 17,611,330 |
| Mytilineos Holdings SA | | 482,600 | 5,231,511 |
|
| TOTAL GREECE | | | 30,643,200 |
|
| India - 0.4% | | | |
| Embassy Office Parks (REIT) (a) | | 1,909,600 | 8,785,361 |
| Jyothy Laboratories Ltd. | | 2,762,490 | 7,123,684 |
|
| TOTAL INDIA | | | 15,909,045 |
|
| Ireland - 1.3% | | | |
| Cairn Homes PLC (a) | | 2,398,100 | 3,448,207 |
| FBD Holdings PLC | | 1,318,227 | 13,336,281 |
| Green REIT PLC | | 5,227,578 | 9,932,348 |
| James Hardie Industries PLC CDI | | 951,880 | 12,937,416 |
| Mincon Group PLC | | 1,595,044 | 2,039,462 |
| Total Produce PLC | | 1,472,600 | 2,626,152 |
| United Drug PLC (United Kingdom) | | 191,000 | 1,636,350 |
|
| TOTAL IRELAND | | | 45,956,216 |
|
| Israel - 2.5% | | | |
| Azrieli Group | | 132,479 | 7,540,877 |
| Ituran Location & Control Ltd. (d) | | 1,288,564 | 47,380,498 |
| Strauss Group Ltd. | | 1,229,855 | 31,355,244 |
|
| TOTAL ISRAEL | | | 86,276,619 |
|
| Italy - 1.3% | | | |
| Interpump Group SpA | | 1,199,476 | 45,041,725 |
| Japan - 34.2% | | | |
| Ai Holdings Corp. | | 570,600 | 9,271,386 |
| Aoki Super Co. Ltd. | | 192,900 | 4,467,723 |
| Arcland Service Holdings Co. Ltd. | | 173,200 | 3,077,003 |
| Artnature, Inc. | | 1,415,300 | 7,966,184 |
| Asante, Inc. | | 381,000 | 7,421,967 |
| Aucnet, Inc. | | 542,900 | 6,150,544 |
| Azbil Corp. | | 3,317,600 | 79,429,411 |
| Bank of Kyoto Ltd. | | 154,907 | 6,674,928 |
| Broadleaf Co. Ltd. (f) | | 2,852,800 | 14,623,177 |
| Central Automotive Products Ltd. | | 121,079 | 1,849,961 |
| Chugoku Marine Paints Ltd. | | 275,000 | 2,592,127 |
| Coca-Cola West Co. Ltd. | | 407,650 | 10,016,051 |
| Daiichikosho Co. Ltd. | | 709,200 | 34,633,942 |
| Daikokutenbussan Co. Ltd. (g) | | 539,400 | 18,473,100 |
| Funai Soken Holdings, Inc. (g) | | 628,500 | 16,209,709 |
| GCA Savvian Group Corp. (b) | | 1,719,487 | 12,642,038 |
| Genky DrugStores Co. Ltd. (b) | | 176,600 | 4,131,421 |
| GMO Internet, Inc. | | 462,162 | 7,131,886 |
| Goldcrest Co. Ltd. | | 1,511,010 | 19,817,636 |
| Iwatsuka Confectionary Co. Ltd. | | 115,800 | 4,251,735 |
| Kamigumi Co. Ltd. | | 244,950 | 5,831,567 |
| Kobayashi Pharmaceutical Co. Ltd. | | 305,600 | 24,306,441 |
| Koshidaka Holdings Co. Ltd. | | 2,583,200 | 35,943,804 |
| Kusuri No Aoki Holdings Co. Ltd. | | 359,300 | 25,223,089 |
| Lasertec Corp. | | 1,110,800 | 50,157,763 |
| Medikit Co. Ltd. | | 261,400 | 13,352,179 |
| Mirait Holdings Corp. | | 379,600 | 5,557,948 |
| Miroku Jyoho Service Co., Ltd. | | 428,300 | 11,488,491 |
| Misumi Group, Inc. | | 1,224,500 | 31,636,169 |
| Mitsuboshi Belting Ltd. (f) | | 410,500 | 7,760,788 |
| Monex Group, Inc. (b) | | 2,321,893 | 7,045,198 |
| Nabtesco Corp. | | 1,158,500 | 35,255,757 |
| Nagaileben Co. Ltd. | | 1,560,600 | 35,010,004 |
| Nakanishi, Inc. | | 55,500 | 1,062,718 |
| ND Software Co. Ltd. | | 231,036 | 3,511,324 |
| Nichias Corp. | | 193,700 | 3,724,632 |
| Nihon Parkerizing Co. Ltd. | | 4,364,300 | 56,691,432 |
| Nitto Kohki Co. Ltd. | | 182,900 | 3,761,604 |
| NOF Corp. | | 120,000 | 4,260,514 |
| NS Tool Co. Ltd. (f) | | 466,500 | 10,632,825 |
| OBIC Co. Ltd. | | 663,200 | 76,563,149 |
| Okamoto Industries, Inc. | | 210,800 | 10,881,099 |
| OSG Corp. | | 2,343,500 | 46,893,142 |
| PALTAC Corp. | | 218,500 | 11,984,694 |
| Paramount Bed Holdings Co. Ltd. | | 943,660 | 44,220,164 |
| ProNexus, Inc. (g) | | 1,061,400 | 12,605,882 |
| S Foods, Inc. | | 177,100 | 6,089,079 |
| San-Ai Oil Co. Ltd. | | 2,413,900 | 20,326,210 |
| SCSK Corp. | | 70,000 | 3,311,639 |
| Sekisui Jushi Corp. (f) | | 231,300 | 4,460,096 |
| Shinko Plantech Co. Ltd. | | 138,200 | 1,440,372 |
| Shinsei Bank Ltd. | | 582,331 | 8,060,994 |
| SHO-BOND Holdings Co. Ltd. | | 693,600 | 47,570,394 |
| Shoei Co. Ltd. (d) | | 948,200 | 41,240,891 |
| SK Kaken Co. Ltd. | | 46,500 | 19,076,709 |
| Software Service, Inc. | | 232,300 | 20,624,328 |
| Techno Medica Co. Ltd. | | 283,000 | 5,355,393 |
| The Monogatari Corp. | | 152,300 | 12,168,140 |
| TKC Corp. | | 421,900 | 16,456,354 |
| Tocalo Co. Ltd. | | 1,495,000 | 12,226,267 |
| Toshiba Plant Systems & Services Corp. | | 225,700 | 4,036,038 |
| Tsuruha Holdings, Inc. | | 48,270 | 4,103,567 |
| USS Co. Ltd. | | 3,304,200 | 63,061,441 |
| Welcia Holdings Co. Ltd. | | 537,485 | 21,109,537 |
| Workman Co. Ltd. | | 564,600 | 27,268,262 |
| Yamato Kogyo Co. Ltd. | | 336,500 | 9,288,904 |
| Yuasa Trading Co. Ltd. | | 121,900 | 3,463,472 |
|
| TOTAL JAPAN | | | 1,196,932,393 |
|
| Korea (South) - 0.8% | | | |
| BGF Retail Co. Ltd. | | 115,410 | 21,663,976 |
| Leeno Industrial, Inc. | | 157,283 | 7,728,961 |
|
| TOTAL KOREA (SOUTH) | | | 29,392,937 |
|
| Luxembourg - 0.2% | | | |
| B&M European Value Retail SA | | 1,340,231 | 6,894,524 |
| Mexico - 0.2% | | | |
| Consorcio ARA S.A.B. de CV | | 21,472,120 | 5,753,761 |
| Genomma Lab Internacional SA de CV (a) | | 1,109,000 | 891,517 |
|
| TOTAL MEXICO | | | 6,645,278 |
|
| Netherlands - 2.6% | | | |
| Aalberts Industries NV | | 1,147,500 | 45,046,260 |
| Arcadis NV (b) | | 168,032 | 3,171,861 |
| Arcadis NV rights (a)(f) | | 168,032 | 88,578 |
| Intertrust NV (e) | | 353,960 | 6,713,296 |
| PostNL NV | | 1,980,281 | 5,128,481 |
| PostNL NV rights 10/24/19 (a)(b)(f) | | 1,980,281 | 377,584 |
| RHI Magnesita NV | | 19,491 | 1,261,155 |
| RHI Magnesita NV | | 12,748 | 787,114 |
| Takeaway.com Holding BV (a)(e) | | 245,678 | 21,134,873 |
| Van Lanschot NV (Bearer) | | 301,760 | 7,835,210 |
|
| TOTAL NETHERLANDS | | | 91,544,412 |
|
| New Zealand - 0.1% | | | |
| EBOS Group Ltd. | | 156,813 | 2,243,432 |
| Norway - 1.9% | | | |
| ABG Sundal Collier ASA | | 4,033,578 | 2,010,372 |
| Adevinta ASA Class A (a) | | 128,966 | 1,300,804 |
| Borregaard ASA | | 290,000 | 2,942,874 |
| Kongsberg Gruppen ASA | | 2,395,661 | 34,709,865 |
| Schibsted ASA (A Shares) | | 79,266 | 2,080,084 |
| Skandiabanken ASA (e) | | 2,417,154 | 23,786,446 |
|
| TOTAL NORWAY | | | 66,830,445 |
|
| Philippines - 0.5% | | | |
| Jollibee Food Corp. | | 2,745,490 | 16,156,806 |
| Pilipinas Shell Petroleum Corp. | | 3,503,850 | 3,059,776 |
|
| TOTAL PHILIPPINES | | | 19,216,582 |
|
| Singapore - 0.1% | | | |
| Boustead Singapore Ltd. | | 7,474,200 | 4,423,742 |
| Hour Glass Ltd. | | 1,558,300 | 899,394 |
|
| TOTAL SINGAPORE | | | 5,323,136 |
|
| South Africa - 0.9% | | | |
| Clicks Group Ltd. | | 2,216,453 | 30,316,057 |
| Spain - 1.8% | | | |
| Merlin Properties Socimi SA | | 1,322,300 | 18,019,564 |
| Prosegur Cash SA (e) | | 1,120,441 | 2,402,785 |
| Prosegur Compania de Seguridad SA (Reg.) | | 8,074,164 | 42,001,646 |
|
| TOTAL SPAIN | | | 62,423,995 |
|
| Sweden - 4.8% | | | |
| Addlife AB | | 915,356 | 24,556,911 |
| AddTech AB (B Shares) | | 1,465,310 | 35,640,538 |
| Fagerhult AB (b) | | 2,246,805 | 19,191,035 |
| Granges AB | | 215,000 | 2,334,358 |
| Lagercrantz Group AB (B Shares) | | 2,151,041 | 26,202,903 |
| Loomis AB (B Shares) | | 795,300 | 29,423,943 |
| MIPS AB | | 244,200 | 3,946,379 |
| Saab AB (B Shares) (b) | | 776,250 | 25,554,056 |
|
| TOTAL SWEDEN | | | 166,850,123 |
|
| Switzerland - 1.3% | | | |
| EDAG Engineering Group AG | | 200,200 | 3,143,620 |
| Tecan Group AG | | 145,663 | 32,822,243 |
| VZ Holding AG | | 33,825 | 8,265,788 |
|
| TOTAL SWITZERLAND | | | 44,231,651 |
|
| Taiwan - 0.4% | | | |
| Addcn Technology Co. Ltd. | | 1,655,570 | 14,572,359 |
| United Kingdom - 18.0% | | | |
| Alliance Pharma PLC | | 20,695,866 | 21,212,104 |
| Ascential PLC | | 6,299,086 | 29,291,153 |
| Avon Rubber PLC | | 963,077 | 18,511,264 |
| BCA Marketplace PLC | | 1,628,900 | 4,379,864 |
| Cineworld Group PLC | | 5,036,700 | 20,885,785 |
| Countrywide PLC (a) | | 15,385,715 | 1,304,093 |
| Dechra Pharmaceuticals PLC | | 1,634,563 | 56,697,106 |
| DP Poland PLC (a)(d) | | 14,923,300 | 1,780,588 |
| Elementis PLC | | 15,671,290 | 33,207,463 |
| GetBusy PLC (a) | | 2,405,905 | 925,504 |
| Great Portland Estates PLC | | 3,833,088 | 37,717,524 |
| H&T Group PLC | | 1,786,305 | 7,325,780 |
| Hill & Smith Holdings PLC | | 303,841 | 5,055,623 |
| Hilton Food Group PLC | | 1,028,638 | 13,628,054 |
| Howden Joinery Group PLC | | 1,662,300 | 11,011,607 |
| Informa PLC | | 1,960,738 | 19,917,490 |
| InterContinental Hotel Group PLC ADR | | 251,634 | 16,635,524 |
| ITE Group PLC | | 15,460,833 | 14,596,511 |
| LSL Property Services PLC | | 2,448,480 | 8,492,896 |
| Luxfer Holdings PLC sponsored | | 155,000 | 3,721,550 |
| Majestic Wine PLC | | 705,510 | 2,368,961 |
| Mears Group PLC | | 1,511,110 | 4,729,170 |
| Metro Bank PLC (a)(b) | | 286,572 | 2,802,674 |
| Mitie Group PLC | | 1,797,758 | 3,073,346 |
| Network International Holdings PLC (e) | | 857,200 | 5,823,680 |
| Polypipe Group PLC | | 242,314 | 1,389,037 |
| Rightmove PLC | | 4,510,370 | 31,795,510 |
| Shaftesbury PLC | | 3,009,755 | 33,732,973 |
| Spectris PLC | | 2,219,461 | 79,531,987 |
| Spirax-Sarco Engineering PLC | | 910,628 | 97,965,361 |
| Ted Baker PLC | | 234,700 | 4,921,265 |
| Topps Tiles PLC | | 9,714,845 | 9,551,791 |
| Tullett Prebon PLC | | 1,961,753 | 7,193,450 |
| Ultra Electronics Holdings PLC | | 837,300 | 17,382,080 |
|
| TOTAL UNITED KINGDOM | | | 628,558,768 |
|
| United States of America - 1.8% | | | |
| Autoliv, Inc. | | 132,700 | 10,415,623 |
| Martin Marietta Materials, Inc. | | 64,580 | 14,330,302 |
| Morningstar, Inc. | | 73,500 | 10,543,575 |
| PriceSmart, Inc. | | 231,457 | 13,843,443 |
| ResMed, Inc. | | 135,400 | 14,150,654 |
|
| TOTAL UNITED STATES OF AMERICA | | | 63,283,597 |
|
| TOTAL COMMON STOCKS | | | |
| (Cost $2,348,920,782) | | | 3,282,061,609 |
|
| Nonconvertible Preferred Stocks - 1.0% | | | |
| Brazil - 0.2% | | | |
| Banco ABC Brasil SA | | 1,656,743 | 8,218,013 |
| Germany - 0.8% | | | |
| Sartorius AG (non-vtg.) | | 151,355 | 27,704,794 |
| TOTAL NONCONVERTIBLE PREFERRED STOCKS | | | |
| (Cost $10,496,757) | | | 35,922,807 |
|
| Money Market Funds - 8.6% | | | |
| Fidelity Cash Central Fund, 2.49% (h) | | 270,296,477 | 270,350,536 |
| Fidelity Securities Lending Cash Central Fund 2.49% (h)(i) | | 29,735,997 | 29,738,971 |
| TOTAL MONEY MARKET FUNDS | | | |
| (Cost $300,088,547) | | | 300,089,507 |
| TOTAL INVESTMENT IN SECURITIES - 103.4% | | | |
| (Cost $2,659,506,086) | | | 3,618,073,923 |
| NET OTHER ASSETS (LIABILITIES) - (3.4)% | | | (117,694,173) |
| NET ASSETS - 100% | | | $3,500,379,750 |
Categorizations in the Schedule of Investments are based on country or territory of incorporation.
Legend
(a) Non-income producing
(b) Security or a portion of the security is on loan at period end.
(c) Level 3 security
(d) Affiliated company
(e) Security exempt from registration under Rule 144A of the Securities Act of 1933. These securities may be resold in transactions exempt from registration, normally to qualified institutional buyers. At the end of the period, the value of these securities amounted to $95,656,197 or 2.7% of net assets.
(f) Security or a portion of the security purchased on a delayed delivery or when-issued basis.
(g) A portion of the security sold on a delayed delivery basis.
(h) Affiliated fund that is generally available only to investment companies and other accounts managed by Fidelity Investments. The rate quoted is the annualized seven-day yield of the fund at period end. A complete unaudited listing of the fund's holdings as of its most recent quarter end is available upon request. In addition, each Fidelity Central Fund's financial statements are available on the SEC's website or upon request.
(i) Investment made with cash collateral received from securities on loan.
Affiliated Central Funds
Information regarding fiscal year to date income earned by the Fund from investments in Fidelity Central Funds is as follows:
| Fund | Income earned |
| Fidelity Cash Central Fund | $2,875,992 |
| Fidelity Securities Lending Cash Central Fund | 449,330 |
| Total | $3,325,322 |
Amounts in the income column in the above table include any capital gain distributions from underlying funds, which are presented in the corresponding line-item in the Statement of Operations, if applicable.
Other Affiliated Issuers
An affiliated company is a company in which the Fund has ownership of at least 5% of the voting securities. Fiscal year to date transactions with companies which are or were affiliates are as follows:
| Affiliate | Value, beginning of period | Purchases | Sales Proceeds | Dividend Income | Realized Gain (loss) | Change in Unrealized appreciation (depreciation) | Value, end of period |
| DP Poland PLC | $2,732,613 | $622,802 | $-- | $-- | $-- | $(1,574,827) | $1,780,588 |
| Ituran Location & Control Ltd. | 42,223,022 | 1,771,839 | -- | 444,555 | -- | 3,385,637 | 47,380,498 |
| Reckon Ltd. | 3,045,276 | -- | -- | -- | -- | (97,389) | 2,947,887 |
| Shoei Co. Ltd. | 35,572,615 | 1,229,646 | -- | 7,224 | -- | 4,438,630 | 41,240,891 |
| Total | $83,573,526 | $3,624,287 | $-- | $451,779 | $-- | $6,152,051 | $93,349,864 |
Investment Valuation
The following is a summary of the inputs used, as of April 30, 2019, involving the Fund's assets and liabilities carried at fair value. The inputs or methodology used for valuing securities may not be an indication of the risk associated with investing in those securities. For more information on valuation inputs, and their aggregation into the levels used below, please refer to the Investment Valuation section in the accompanying Notes to Financial Statements.
| | Valuation Inputs at Reporting Date: |
| Description | Total | Level 1 | Level 2 | Level 3 |
| Investments in Securities: | | | | |
| Equities: | | | | |
| Communication Services | $201,107,392 | $201,107,392 | $-- | $-- |
| Consumer Discretionary | 360,629,754 | 356,683,375 | 3,946,379 | -- |
| Consumer Staples | 275,900,776 | 275,900,776 | -- | -- |
| Energy | 83,809,079 | 83,809,079 | -- | -- |
| Financials | 239,352,808 | 239,352,808 | -- | -- |
| Health Care | 451,677,912 | 424,877,569 | 26,800,343 | -- |
| Industrials | 811,037,142 | 701,227,570 | 109,809,572 | -- |
| Information Technology | 520,184,148 | 493,981,245 | 26,202,903 | -- |
| Materials | 217,945,822 | 215,611,399 | 2,334,358 | 65 |
| Real Estate | 152,534,185 | 152,534,185 | -- | -- |
| Utilities | 3,805,398 | 3,805,398 | -- | -- |
| Money Market Funds | 300,089,507 | 300,089,507 | -- | -- |
| Total Investments in Securities: | $3,618,073,923 | $3,448,980,303 | $169,093,555 | $65 |
See accompanying notes which are an integral part of the financial statements.
Fidelity® Series International Small Cap Fund
Financial Statements
Statement of Assets and Liabilities
| | | April 30, 2019 (Unaudited) |
| Assets | | |
Investment in securities, at value (including securities loaned of $27,445,601) — See accompanying schedule:
Unaffiliated issuers (cost $2,304,158,181) | $3,224,634,552 | |
| Fidelity Central Funds (cost $300,088,547) | 300,089,507 | |
| Other affiliated issuers (cost $55,259,358) | 93,349,864 | |
| Total Investment in Securities (cost $2,659,506,086) | | $3,618,073,923 |
| Cash | | 187,893 |
| Foreign currency held at value (cost $155,945) | | 155,946 |
| Receivable for investments sold | | |
| Regular delivery | | 286,858 |
| Delayed delivery | | 756,149 |
| Receivable for fund shares sold | | 240,300 |
| Dividends receivable | | 15,103,285 |
| Distributions receivable from Fidelity Central Funds | | 519,549 |
| Total assets | | 3,635,323,903 |
| Liabilities | | |
| Payable for investments purchased | | |
| Regular delivery | $1,199,538 | |
| Delayed delivery | 1,262,178 | |
| Payable for fund shares redeemed | 102,022,514 | |
| Other payables and accrued expenses | 722,163 | |
| Collateral on securities loaned | 29,737,760 | |
| Total liabilities | | 134,944,153 |
| Net Assets | | $3,500,379,750 |
| Net Assets consist of: | | |
| Paid in capital | | $2,521,416,346 |
| Total distributable earnings (loss) | | 978,963,404 |
| Net Assets, for 215,706,287 shares outstanding | | $3,500,379,750 |
| Net Asset Value, offering price and redemption price per share ($3,500,379,750 ÷ 215,706,287 shares) | | $16.23 |
See accompanying notes which are an integral part of the financial statements.
Statement of Operations
| | | Six months ended April 30, 2019 (Unaudited) |
| Investment Income | | |
| Dividends (including $451,779 earned from other affiliated issuers) | | $28,578,588 |
| Non-Cash dividends | | 7,314,165 |
| Income from Fidelity Central Funds | | 3,325,322 |
| Income before foreign taxes withheld | | 39,218,075 |
| Less foreign taxes withheld | | (2,959,872) |
| Total income | | 36,258,203 |
| Expenses | | |
| Custodian fees and expenses | $179,554 | |
| Independent trustees' fees and expenses | 9,165 | |
| Commitment fees | 4,718 | |
| Total expenses | | 193,437 |
| Net investment income (loss) | | 36,064,766 |
| Realized and Unrealized Gain (Loss) | | |
| Net realized gain (loss) on: | | |
| Investment securities: | | |
| Unaffiliated issuers | 35,454,607 | |
| Fidelity Central Funds | (1,126) | |
| Foreign currency transactions | (33,358) | |
| Total net realized gain (loss) | | 35,420,123 |
| Change in net unrealized appreciation (depreciation) on: | | |
| Investment securities: | | |
| Unaffiliated issuers (net of increase in deferred foreign taxes of $93,169) | 235,754,884 | |
| Fidelity Central Funds | 960 | |
| Other affiliated issuers | 6,152,051 | |
| Assets and liabilities in foreign currencies | (11,994) | |
| Total change in net unrealized appreciation (depreciation) | | 241,895,901 |
| Net gain (loss) | | 277,316,024 |
| Net increase (decrease) in net assets resulting from operations | | $313,380,790 |
See accompanying notes which are an integral part of the financial statements.
Statement of Changes in Net Assets
| | Six months ended April 30, 2019 (Unaudited) | Year ended October 31, 2018 |
| Increase (Decrease) in Net Assets | | |
| Operations | | |
| Net investment income (loss) | $36,064,766 | $74,161,206 |
| Net realized gain (loss) | 35,420,123 | 257,652,301 |
| Change in net unrealized appreciation (depreciation) | 241,895,901 | (436,355,573) |
| Net increase (decrease) in net assets resulting from operations | 313,380,790 | (104,542,066) |
| Distributions to shareholders | (309,676,762) | (218,105,422) |
| Share transactions | | |
| Proceeds from sales of shares | 292,378,361 | 326,419,558 |
| Reinvestment of distributions | 309,676,762 | 218,105,422 |
| Cost of shares redeemed | (330,881,710) | (568,536,120) |
| Net increase (decrease) in net assets resulting from share transactions | 271,173,413 | (24,011,140) |
| Total increase (decrease) in net assets | 274,877,441 | (346,658,628) |
| Net Assets | | |
| Beginning of period | 3,225,502,309 | 3,572,160,937 |
| End of period | $3,500,379,750 | $3,225,502,309 |
| Other Information | | |
| Shares | | |
| Sold | 18,885,096 | 18,009,759 |
| Issued in reinvestment of distributions | 21,746,964 | 12,463,167 |
| Redeemed | (21,212,056) | (30,732,361) |
| Net increase (decrease) | 19,420,004 | (259,435) |
See accompanying notes which are an integral part of the financial statements.
Financial Highlights
Fidelity Series International Small Cap Fund
| | Six months ended (Unaudited) April 30, | Years endedOctober 31, | | | | |
| | 2019 | 2018 | 2017 | 2016 | 2015 | 2014 |
| Selected Per–Share Data | | | | | | |
| Net asset value, beginning of period | $16.43 | $18.17 | $15.02 | $16.11 | $15.21 | $15.75 |
| Income from Investment Operations | | | | | | |
| Net investment income (loss)A | .17B | .38 | .25 | .15 | .14 | .14 |
| Net realized and unrealized gain (loss) | 1.18 | (.99) | 3.47 | (.13) | 1.10 | (.11) |
| Total from investment operations | 1.35 | (.61) | 3.72 | .02 | 1.24 | .03 |
| Distributions from net investment income | (.37) | (.29) | (.15) | (.15) | (.14) | (.13) |
| Distributions from net realized gain | (1.18) | (.85) | (.42) | (.96) | (.20) | (.44) |
| Total distributions | (1.55) | (1.13)C | (.57) | (1.11) | (.34) | (.57) |
| Net asset value, end of period | $16.23 | $16.43 | $18.17 | $15.02 | $16.11 | $15.21 |
| Total ReturnD,E | 9.53% | (3.72)% | 25.87% | .02% | 8.36% | .21% |
| Ratios to Average Net AssetsF,G | | | | | | |
| Expenses before reductions | .01%H | .01% | .56% | 1.06% | 1.10% | 1.18% |
| Expenses net of fee waivers, if any | .01%H | .01% | .56% | 1.06% | 1.10% | 1.18% |
| Expenses net of all reductions | .01%H | .01% | .55% | 1.05% | 1.10% | 1.18% |
| Net investment income (loss) | 1.98%B,H | 2.08% | 1.52% | 1.01% | .89% | .86% |
| Supplemental Data | | | | | | |
| Net assets, end of period (000 omitted) | $3,500,380 | $3,225,502 | $3,572,161 | $1,303,650 | $1,276,570 | $1,330,809 |
| Portfolio turnover rateI | 23%H | 14% | 21% | 21% | 16% | 18% |
A Calculated based on average shares outstanding during the period.
B Net investment income per share reflects a large, non-recurring dividend which amounted to $.03 per share. This dividend is not annualized in the ratio of net investment income (loss) to average net assets. Excluding this dividend the ratio would have been 2.16%.
C Total distributions of $1.13 per share is comprised of distributions from net investment income of $.285 and distributions from net realized gain of $.848 per share.
D Total returns for periods of less than one year are not annualized.
E Total returns would have been lower if certain expenses had not been reduced during the applicable periods shown.
F Fees and expenses of any underlying Fidelity Central Funds are not included in the Fund's expense ratio. The Fund indirectly bears its proportionate share of the expenses of any underlying Fidelity Central Funds.
G Expense ratios reflect operating expenses of the Fund. Expenses before reductions do not reflect amounts reimbursed by the investment adviser or reductions from brokerage service arrangements or reductions from other expense offset arrangements and do not represent the amount paid by the Fund during periods when reimbursements or reductions occur. Expenses net of fee waivers reflect expenses after reimbursement by the investment adviser but prior to reductions from brokerage service arrangements or other expense offset arrangements. Expenses net of all reductions represent the net expenses paid by the Fund.
H Annualized
I Amount does not include the portfolio activity of any underlying Fidelity Central Funds.
See accompanying notes which are an integral part of the financial statements.
Fidelity® Series International Value Fund
Investment Summary (Unaudited)
Geographic Diversification (% of fund's net assets)
| As of April 30, 2019 |
| | Japan | 23.3% |
| | United Kingdom | 18.1% |
| | France | 13.5% |
| | Germany | 9.1% |
| | Switzerland | 4.4% |
| | Spain | 4.0% |
| | Italy | 4.0% |
| | Australia | 3.6% |
| | Netherlands | 3.3% |
| | Other* | 16.7% |
* Includes Short-Term investments and Net Other Assets (Liabilities).
Percentages are based on country or territory of incorporation and are adjusted for the effect of futures contracts, if applicable.
Asset Allocation as of April 30, 2019
| | % of fund's net assets |
| Stocks | 98.3 |
| Short-Term Investments and Net Other Assets (Liabilities) | 1.7 |
Top Ten Stocks as of April 30, 2019
| | % of fund's net assets |
| Total SA (France, Oil, Gas & Consumable Fuels) | 3.0 |
| BHP Billiton PLC (United Kingdom, Metals & Mining) | 2.8 |
| BP PLC (United Kingdom, Oil, Gas & Consumable Fuels) | 2.7 |
| Banco Santander SA (Spain) (Spain, Banks) | 2.1 |
| Commonwealth Bank of Australia (Australia, Banks) | 1.9 |
| Sanofi SA (France, Pharmaceuticals) | 1.9 |
| VINCI SA (France, Construction & Engineering) | 1.9 |
| AXA SA (France, Insurance) | 1.8 |
| Enel SpA (Italy, Electric Utilities) | 1.7 |
| Lloyds Banking Group PLC (United Kingdom, Banks) | 1.7 |
| | 21.5 |
Top Market Sectors as of April 30, 2019
| | % of fund's net assets |
| Financials | 37.6 |
| Industrials | 10.7 |
| Energy | 10.6 |
| Materials | 8.7 |
| Health Care | 7.7 |
| Information Technology | 6.8 |
| Consumer Discretionary | 5.2 |
| Communication Services | 3.9 |
| Consumer Staples | 3.3 |
| Real Estate | 2.1 |
Fidelity® Series International Value Fund
Schedule of Investments April 30, 2019 (Unaudited)
Showing Percentage of Net Assets
| Common Stocks - 97.0% | | | |
| | | Shares | Value |
| Australia - 3.6% | | | |
| Commonwealth Bank of Australia | | 5,262,421 | $276,450,100 |
| Insurance Australia Group Ltd. | | 19,424,985 | 107,905,908 |
| Macquarie Group Ltd. | | 1,468,815 | 139,473,921 |
|
| TOTAL AUSTRALIA | | | 523,829,929 |
|
| Austria - 0.8% | | | |
| Erste Group Bank AG | | 3,007,800 | 120,435,681 |
| Bailiwick of Jersey - 1.7% | | | |
| Glencore Xstrata PLC | | 51,552,500 | 204,537,634 |
| WPP PLC | | 3,792,600 | 47,323,295 |
|
| TOTAL BAILIWICK OF JERSEY | | | 251,860,929 |
|
| Belgium - 1.1% | | | |
| KBC Groep NV | | 2,217,600 | 164,208,916 |
| Canada - 0.5% | | | |
| Nutrien Ltd. | | 1,444,580 | 78,348,274 |
| China - 0.7% | | | |
| Ping An Insurance (Group) Co. of China Ltd. (H Shares) | | 8,427,000 | 102,006,016 |
| Denmark - 0.6% | | | |
| A.P. Moller - Maersk A/S Series B | | 70,757 | 91,212,432 |
| Finland - 1.8% | | | |
| Nokia Corp. | | 23,044,200 | 121,088,304 |
| Sampo Oyj (A Shares) | | 3,064,013 | 140,295,332 |
|
| TOTAL FINLAND | | | 261,383,636 |
|
| France - 13.5% | | | |
| Atos Origin SA (a) | | 682,484 | 70,255,209 |
| AXA SA (a) | | 9,846,673 | 262,576,674 |
| Bouygues SA (a) | | 1,965,498 | 73,939,016 |
| Capgemini SA | | 1,010,005 | 122,458,016 |
| Natixis SA | | 18,782,800 | 110,558,506 |
| Sanofi SA (a) | | 3,108,090 | 271,178,683 |
| Societe Generale Series A (a) | | 3,143,100 | 99,672,416 |
| SR Teleperformance SA | | 559,700 | 107,535,206 |
| Total SA (a) | | 7,855,873 | 436,713,863 |
| VINCI SA(a) | | 2,680,237 | 270,693,880 |
| Vivendi SA (a) | | 4,637,181 | 134,598,075 |
|
| TOTAL FRANCE | | | 1,960,179,544 |
|
| Germany - 8.2% | | | |
| Bayer AG | | 3,083,000 | 205,191,359 |
| Brenntag AG | | 1,066,400 | 57,483,328 |
| Continental AG | | 764,200 | 126,306,194 |
| Hannover Reuck SE | | 1,063,600 | 160,330,298 |
| HeidelbergCement Finance AG | | 1,555,300 | 125,598,563 |
| Linde PLC | | 909,200 | 163,569,299 |
| Rheinmetall AG | | 380,101 | 43,612,667 |
| SAP SE | | 982,311 | 126,627,989 |
| Vonovia SE | | 3,645,440 | 181,825,624 |
|
| TOTAL GERMANY | | | 1,190,545,321 |
|
| Indonesia - 0.4% | | | |
| PT Bank Rakyat Indonesia Tbk | | 188,987,700 | 57,956,228 |
| Ireland - 1.0% | | | |
| CRH PLC | | 4,203,370 | 141,404,319 |
| Italy - 4.0% | | | |
| Assicurazioni Generali SpA | | 5,909,900 | 114,673,809 |
| Enel SpA | | 38,614,200 | 244,511,434 |
| Intesa Sanpaolo SpA | | 52,373,200 | 137,218,646 |
| Mediobanca SpA | | 7,982,072 | 84,602,939 |
|
| TOTAL ITALY | | | 581,006,828 |
|
| Japan - 23.3% | | | |
| DENSO Corp. | | 2,509,200 | 109,315,029 |
| Hitachi High-Technologies Corp. | | 1,413,700 | 62,819,830 |
| Honda Motor Co. Ltd. | | 7,379,400 | 205,907,035 |
| Hoya Corp. | | 1,956,800 | 137,280,776 |
| Idemitsu Kosan Co. Ltd. | | 2,044,453 | 66,163,231 |
| INPEX Corp. | | 6,540,200 | 63,467,446 |
| Itochu Corp. | | 9,724,400 | 174,593,115 |
| Japan Tobacco, Inc. (b) | | 4,685,500 | 108,270,768 |
| Kao Corp. | | 1,447,400 | 111,184,540 |
| Makita Corp. | | 2,040,900 | 74,201,221 |
| Minebea Mitsumi, Inc. | | 7,185,000 | 127,065,398 |
| Mitsubishi UFJ Financial Group, Inc. | | 44,026,300 | 218,437,638 |
| Mitsui Fudosan Co. Ltd. | | 5,683,200 | 130,964,356 |
| Nintendo Co. Ltd. | | 143,000 | 49,251,455 |
| OBIC Co. Ltd. | | 1,289,000 | 148,808,654 |
| Oracle Corp. Japan | | 1,133,100 | 77,408,241 |
| ORIX Corp. | | 10,349,200 | 146,000,878 |
| Recruit Holdings Co. Ltd. | | 2,860,900 | 85,496,980 |
| Shin-Etsu Chemical Co. Ltd. | | 1,521,200 | 144,094,956 |
| Shinsei Bank Ltd. | | 5,576,200 | 77,189,285 |
| SoftBank Corp. | | 706,300 | 74,889,967 |
| Sony Corp. | | 1,083,900 | 54,593,994 |
| Sony Financial Holdings, Inc. | | 5,966,785 | 121,430,061 |
| Subaru Corp. | | 3,100,400 | 75,718,284 |
| Sumitomo Mitsui Financial Group, Inc. | | 5,524,900 | 200,809,308 |
| Suzuki Motor Corp. (b) | | 1,060,500 | 48,219,691 |
| T&D Holdings, Inc. | | 6,084,900 | 65,358,255 |
| Taiheiyo Cement Corp. (b) | | 18,800 | 602,505 |
| Takeda Pharmaceutical Co. Ltd. | | 4,680,622 | 172,723,028 |
| Tokio Marine Holdings, Inc. | | 3,980,300 | 200,167,338 |
| Tokyo Electron Ltd. | | 353,700 | 56,026,182 |
|
| TOTAL JAPAN | | | 3,388,459,445 |
|
| Netherlands - 3.3% | | | |
| AerCap Holdings NV (c) | | 1,731,400 | 85,946,696 |
| ING Groep NV (Certificaten Van Aandelen) | | 13,095,534 | 167,099,390 |
| Koninklijke Philips Electronics NV | | 2,520,232 | 108,228,162 |
| Wolters Kluwer NV | | 1,601,661 | 111,701,581 |
|
| TOTAL NETHERLANDS | | | 472,975,829 |
|
| Norway - 1.2% | | | |
| Equinor ASA | | 7,799,567 | 173,982,656 |
| Portugal - 0.6% | | | |
| Galp Energia SGPS SA Class B | | 5,556,172 | 93,290,084 |
| Singapore - 0.8% | | | |
| United Overseas Bank Ltd. | | 5,407,500 | 110,646,809 |
| Spain - 3.6% | | | |
| Banco Santander SA (Spain) | | 61,279,424 | 310,079,916 |
| CaixaBank SA | | 22,384,708 | 71,351,141 |
| Cellnex Telecom SA (d) | | 1,823,000 | 56,065,038 |
| Masmovil Ibercom SA (c) | | 2,519,260 | 55,212,264 |
| Unicaja Banco SA (d) | | 30,752,247 | 35,319,522 |
|
| TOTAL SPAIN | | | 528,027,881 |
|
| Sweden - 3.2% | | | |
| Alfa Laval AB (a) | | 3,684,700 | 85,528,035 |
| Investor AB (B Shares) | | 3,833,659 | 182,833,767 |
| Swedbank AB (A Shares) | | 3,679,700 | 60,123,436 |
| Telefonaktiebolaget LM Ericsson (B Shares) | | 13,465,900 | 133,207,070 |
|
| TOTAL SWEDEN | | | 461,692,308 |
|
| Switzerland - 4.4% | | | |
| Credit Suisse Group AG | | 5,838,473 | 77,645,249 |
| Swiss Life Holding AG | | 290,150 | 136,425,600 |
| UBS Group AG | | 13,888,071 | 186,655,674 |
| Zurich Insurance Group Ltd. | | 730,415 | 232,898,409 |
|
| TOTAL SWITZERLAND | | | 633,624,932 |
|
| United Kingdom - 18.1% | | | |
| AstraZeneca PLC (United Kingdom) | | 2,356,780 | 175,579,657 |
| Aviva PLC | | 26,869,773 | 150,904,093 |
| BHP Billiton PLC | | 17,094,064 | 403,498,120 |
| BP PLC | | 53,406,006 | 388,352,650 |
| British American Tobacco PLC (United Kingdom) | | 3,424,055 | 134,048,146 |
| Bunzl PLC | | 3,081,138 | 92,771,093 |
| Imperial Tobacco Group PLC | | 3,501,333 | 111,221,383 |
| Informa PLC | | 10,524,946 | 106,914,085 |
| ITV PLC | | 30,279,870 | 53,956,185 |
| Lloyds Banking Group PLC | | 295,677,300 | 241,815,367 |
| Micro Focus International PLC | | 3,457,693 | 87,372,140 |
| Royal Dutch Shell PLC Class B sponsored ADR (a) | | 3,635,200 | 235,888,128 |
| RSA Insurance Group PLC | | 13,398,790 | 94,698,360 |
| Standard Chartered PLC (United Kingdom) | | 17,246,083 | 157,422,245 |
| Standard Life PLC | | 33,899,930 | 123,289,163 |
| The Weir Group PLC | | 3,329,507 | 72,050,132 |
|
| TOTAL UNITED KINGDOM | | | 2,629,780,947 |
|
| United States of America - 0.6% | | | |
| ConocoPhillips Co. | | 1,302,600 | 82,220,112 |
| TOTAL COMMON STOCKS | | | |
| (Cost $13,157,271,809) | | | 14,099,079,056 |
|
| Nonconvertible Preferred Stocks - 1.3% | | | |
| Germany - 0.9% | | | |
| Porsche Automobil Holding SE (Germany) | | 1,909,924 | 132,773,412 |
| Spain - 0.4% | | | |
| Grifols SA Class B | | 2,816,638 | 54,223,891 |
| TOTAL NONCONVERTIBLE PREFERRED STOCKS | | | |
| (Cost $183,919,082) | | | 186,997,303 |
|
| Money Market Funds - 7.9% | | | |
| Fidelity Cash Central Fund, 2.49% (e) | | 113,263,620 | 113,286,273 |
| Fidelity Securities Lending Cash Central Fund 2.49% (e)(f) | | 1,037,669,234 | 1,037,773,001 |
| TOTAL MONEY MARKET FUNDS | | | |
| (Cost $1,151,059,274) | | | 1,151,059,274 |
| TOTAL INVESTMENT IN SECURITIES - 106.2% | | | |
| (Cost $14,492,250,165) | | | 15,437,135,633 |
| NET OTHER ASSETS (LIABILITIES) - (6.2)% | | | (901,989,400) |
| NET ASSETS - 100% | | | $14,535,146,233 |
Categorizations in the Schedule of Investments are based on country or territory of incorporation.
Legend
(a) Security or a portion of the security is on loan at period end.
(b) A portion of the security sold on a delayed delivery basis.
(c) Non-income producing
(d) Security exempt from registration under Rule 144A of the Securities Act of 1933. These securities may be resold in transactions exempt from registration, normally to qualified institutional buyers. At the end of the period, the value of these securities amounted to $91,384,560 or 0.6% of net assets.
(e) Affiliated fund that is generally available only to investment companies and other accounts managed by Fidelity Investments. The rate quoted is the annualized seven-day yield of the fund at period end. A complete unaudited listing of the fund's holdings as of its most recent quarter end is available upon request. In addition, each Fidelity Central Fund's financial statements are available on the SEC's website or upon request.
(f) Investment made with cash collateral received from securities on loan.
Affiliated Central Funds
Information regarding fiscal year to date income earned by the Fund from investments in Fidelity Central Funds is as follows:
| Fund | Income earned |
| Fidelity Cash Central Fund | $1,373,395 |
| Fidelity Securities Lending Cash Central Fund | 4,064,312 |
| Total | $5,437,707 |
Amounts in the income column in the above table include any capital gain distributions from underlying funds, which are presented in the corresponding line-item in the Statement of Operations, if applicable.
Investment Valuation
The following is a summary of the inputs used, as of April 30, 2019, involving the Fund's assets and liabilities carried at fair value. The inputs or methodology used for valuing securities may not be an indication of the risk associated with investing in those securities. For more information on valuation inputs, and their aggregation into the levels used below, please refer to the Investment Valuation section in the accompanying Notes to Financial Statements.
| | Valuation Inputs at Reporting Date: |
| Description | Total | Level 1 | Level 2 | Level 3 |
| Investments in Securities: | | | | |
| Equities: | | | | |
| Communication Services | $578,210,364 | $272,147,572 | $306,062,792 | $-- |
| Consumer Discretionary | 752,833,639 | 359,559,198 | 393,274,441 | -- |
| Consumer Staples | 464,724,837 | 222,405,923 | 242,318,914 | -- |
| Energy | 1,540,078,170 | 715,011,657 | 825,066,513 | -- |
| Financials | 5,446,966,294 | 3,334,177,821 | 2,112,788,473 | -- |
| Health Care | 1,124,405,556 | 342,472,135 | 781,933,421 | -- |
| Industrials | 1,553,830,780 | 1,106,396,433 | 447,434,347 | -- |
| Information Technology | 1,006,071,635 | 625,148,272 | 380,923,363 | -- |
| Materials | 1,261,653,670 | 368,118,641 | 893,535,029 | -- |
| Real Estate | 312,789,980 | 312,789,980 | -- | -- |
| Utilities | 244,511,434 | -- | 244,511,434 | -- |
| Money Market Funds | 1,151,059,274 | 1,151,059,274 | -- | -- |
| Total Investments in Securities: | $15,437,135,633 | $8,809,286,906 | $6,627,848,727 | $-- |
See accompanying notes which are an integral part of the financial statements.
Fidelity® Series International Value Fund
Financial Statements
Statement of Assets and Liabilities
| | | April 30, 2019 (Unaudited) |
| Assets | | |
Investment in securities, at value (including securities loaned of $990,679,640) — See accompanying schedule:
Unaffiliated issuers (cost $13,341,190,891) | $14,286,076,359 | |
| Fidelity Central Funds (cost $1,151,059,274) | 1,151,059,274 | |
| Total Investment in Securities (cost $14,492,250,165) | | $15,437,135,633 |
| Foreign currency held at value (cost $6,597,301) | | 6,620,974 |
| Receivable for investments sold | | |
| Regular delivery | | 1,125,671 |
| Delayed delivery | | 26,680,812 |
| Receivable for fund shares sold | | 2,793,325 |
| Dividends receivable | | 159,150,388 |
| Distributions receivable from Fidelity Central Funds | | 2,015,809 |
| Other receivables | | 2,658 |
| Total assets | | 15,635,525,270 |
| Liabilities | | |
| Payable to custodian bank | $127 | |
| Payable for investments purchased | 55,581,618 | |
| Payable for fund shares redeemed | 6,698,632 | |
| Other payables and accrued expenses | 329,137 | |
| Collateral on securities loaned | 1,037,769,523 | |
| Total liabilities | | 1,100,379,037 |
| Net Assets | | $14,535,146,233 |
| Net Assets consist of: | | |
| Paid in capital | | $14,044,321,964 |
| Total distributable earnings (loss) | | 490,824,269 |
| Net Assets, for 1,507,571,726 shares outstanding | | $14,535,146,233 |
| Net Asset Value, offering price and redemption price per share ($14,535,146,233 ÷ 1,507,571,726 shares) | | $9.64 |
See accompanying notes which are an integral part of the financial statements.
Statement of Operations
| | | Six months ended April 30, 2019 (Unaudited) |
| Investment Income | | |
| Dividends | | $309,062,316 |
| Income from Fidelity Central Funds | | 5,437,707 |
| Income before foreign taxes withheld | | 314,500,023 |
| Less foreign taxes withheld | | (23,932,909) |
| Total income | | 290,567,114 |
| Expenses | | |
| Custodian fees and expenses | $509,919 | |
| Independent trustees' fees and expenses | 38,481 | |
| Interest | 6,883 | |
| Commitment fees | 19,750 | |
| Total expenses before reductions | 575,033 | |
| Expense reductions | (184) | |
| Total expenses after reductions | | 574,849 |
| Net investment income (loss) | | 289,992,265 |
| Realized and Unrealized Gain (Loss) | | |
| Net realized gain (loss) on: | | |
| Investment securities: | | |
| Unaffiliated issuers | (271,948,273) | |
| Fidelity Central Funds | (849) | |
| Foreign currency transactions | 442,014 | |
| Total net realized gain (loss) | | (271,507,108) |
| Change in net unrealized appreciation (depreciation) on: | | |
| Investment securities: | | |
| Unaffiliated issuers | 482,101,482 | |
| Assets and liabilities in foreign currencies | (211,187) | |
| Total change in net unrealized appreciation (depreciation) | | 481,890,295 |
| Net gain (loss) | | 210,383,187 |
| Net increase (decrease) in net assets resulting from operations | | $500,375,452 |
See accompanying notes which are an integral part of the financial statements.
Statement of Changes in Net Assets
| | Six months ended April 30, 2019 (Unaudited) | Year ended October 31, 2018 |
| Increase (Decrease) in Net Assets | | |
| Operations | | |
| Net investment income (loss) | $289,992,265 | $531,754,980 |
| Net realized gain (loss) | (271,507,108) | 411,682,322 |
| Change in net unrealized appreciation (depreciation) | 481,890,295 | (2,130,990,429) |
| Net increase (decrease) in net assets resulting from operations | 500,375,452 | (1,187,553,127) |
| Distributions to shareholders | (506,747,337) | (460,693,678) |
| Share transactions | | |
| Proceeds from sales of shares | 818,186,239 | 1,724,408,564 |
| Reinvestment of distributions | 506,747,337 | 460,693,677 |
| Cost of shares redeemed | (814,091,849) | (1,299,313,186) |
| Net increase (decrease) in net assets resulting from share transactions | 510,841,727 | 885,789,055 |
| Total increase (decrease) in net assets | 504,469,842 | (762,457,750) |
| Net Assets | | |
| Beginning of period | 14,030,676,391 | 14,793,134,141 |
| End of period | $14,535,146,233 | $14,030,676,391 |
| Other Information | | |
| Shares | | |
| Sold | 87,954,289 | 165,958,158 |
| Issued in reinvestment of distributions | 57,913,981 | 43,750,587 |
| Redeemed | (88,267,205) | (121,273,736) |
| Net increase (decrease) | 57,601,065 | 88,435,009 |
See accompanying notes which are an integral part of the financial statements.
Financial Highlights
Fidelity Series International Value Fund
| | Six months ended (Unaudited) April 30, | Years endedOctober 31, | | | | |
| | 2019 | 2018 | 2017 | 2016 | 2015 | 2014 |
| Selected Per–Share Data | | | | | | |
| Net asset value, beginning of period | $9.68 | $10.87 | $9.27 | $9.91 | $10.73 | $11.14 |
| Income from Investment Operations | | | | | | |
| Net investment income (loss)A | .19 | .38 | .29 | .24 | .22 | .45B |
| Net realized and unrealized gain (loss) | .12 | (1.23) | 1.55 | (.68) | (.28) | (.59) |
| Total from investment operations | .31 | (.85) | 1.84 | (.44) | (.06) | (.14) |
| Distributions from net investment income | (.35) | (.31) | (.22) | (.20) | (.44) | (.24) |
| Distributions from net realized gain | – | (.03) | (.02) | – | (.32) | (.04) |
| Total distributions | (.35) | (.34) | (.24) | (.20) | (.76) | (.27)C |
| Net asset value, end of period | $9.64 | $9.68 | $10.87 | $9.27 | $9.91 | $10.73 |
| Total ReturnD,E | 3.55% | (8.11)% | 20.33% | (4.49)% | (.65)% | (1.25)% |
| Ratios to Average Net AssetsF,G | | | | | | |
| Expenses before reductions | .01%H | .01% | .48% | .96% | .89% | .82% |
| Expenses net of fee waivers, if any | .01%H | .01% | .47% | .96% | .89% | .82% |
| Expenses net of all reductions | .01%H | - %I | .46% | .95% | .88% | .81% |
| Net investment income (loss) | 4.19%H | 3.60% | 2.86% | 2.58% | 2.12% | 4.05%B |
| Supplemental Data | | | | | | |
| Net assets, end of period (000 omitted) | $14,535,146 | $14,030,676 | $14,793,134 | $5,774,976 | $5,556,957 | $5,971,189 |
| Portfolio turnover rateJ | 40%H | 43% | 51% | 45% | 44% | 70% |
A Calculated based on average shares outstanding during the period.
B Net investment income per share reflects a large, non-recurring dividend which amounted to $.18 per share. Excluding this non-recurring dividend, the ratio of net investment income (loss) to average net assets would have been 2.46%.
C Total distributions of $.27 per share is comprised of distributions from net investment income of $.237 and distributions from net realized gain of $.036 per share.
D Total returns for periods of less than one year are not annualized.
E Total returns would have been lower if certain expenses had not been reduced during the applicable periods shown.
F Fees and expenses of any underlying Fidelity Central Funds are not included in the Fund's expense ratio. The Fund indirectly bears its proportionate share of the expenses of any underlying Fidelity Central Funds.
G Expense ratios reflect operating expenses of the Fund. Expenses before reductions do not reflect amounts reimbursed by the investment adviser or reductions from brokerage service arrangements or reductions from other expense offset arrangements and do not represent the amount paid by the Fund during periods when reimbursements or reductions occur. Expenses net of fee waivers reflect expenses after reimbursement by the investment adviser but prior to reductions from brokerage service arrangements or other expense offset arrangements. Expenses net of all reductions represent the net expenses paid by the Fund.
H Annualized
I Amount represents less than .005%.
J Amount does not include the portfolio activity of any underlying Fidelity Central Funds.
See accompanying notes which are an integral part of the financial statements.
Notes to Financial Statements (Unaudited)
For the period ended April 30, 2019
1. Organization.
Fidelity Series Emerging Markets Fund, Fidelity Series Emerging Markets Opportunities Fund, Fidelity Series International Growth Fund, Fidelity Series International Small Cap Fund and Fidelity Series International Value Fund (the Funds) are funds of Fidelity Investment Trust (the Trust). The Trust is registered under the Investment Company Act of 1940, as amended (the 1940 Act), as an open-end management investment company organized as a Massachusetts business trust. Each Fund is authorized to issue an unlimited number of shares. Shares of the Funds are only available for purchase by mutual funds for which Fidelity Management & Research Company (FMR) or an affiliate serves as an investment manager. Fidelity Series Emerging Markets Fund and Fidelity Series Emerging Markets Opportunities Fund investments in emerging markets can be subject to social, economic, regulatory, and political uncertainties and can be extremely volatile.
2. Investments in Fidelity Central Funds.
The Funds invest in Fidelity Central Funds, which are open-end investment companies generally available only to other investment companies and accounts managed by the investment adviser and its affiliates. The Funds' Schedules of Investments list each of the Fidelity Central Funds held as of period end, if any, as an investment of each Fund, but do not include the underlying holdings of each Fidelity Central Fund. As an Investing Fund, each Fund indirectly bears its proportionate share of the expenses of the underlying Fidelity Central Funds.
The Money Market Central Funds seek preservation of capital and current income and are managed by Fidelity Investments Money Management, Inc. (FIMM), an affiliate of the investment adviser. Annualized expenses of the Money Market Central Funds as of their most recent shareholder report date are less than .005%.
A complete unaudited list of holdings for each Fidelity Central Fund is available upon request or at the Securities and Exchange Commission (the SEC) website at www.sec.gov. In addition, the financial statements of the Fidelity Central Funds are available on the SEC website or upon request.
3. Significant Accounting Policies.
Each Fund is an investment company and applies the accounting and reporting guidance of the Financial Accounting Standards Board (FASB) Accounting Standards Codification Topic 946 Financial Services – Investments Companies. The financial statements have been prepared in conformity with accounting principles generally accepted in the United States of America (GAAP), which require management to make certain estimates and assumptions at the date of the financial statements. Actual results could differ from those estimates. Subsequent events, if any, through the date that the financial statements were issued have been evaluated in the preparation of the financial statements. The following summarizes the significant accounting policies of the Funds:
Investment Valuation. Investments are valued as of 4:00 p.m. Eastern time on the last calendar day of the period. The Board of Trustees (the Board) has delegated the day to day responsibility for the valuation of each Fund's investments to the Fair Value Committee (the Committee) established by each Fund's investment adviser. In accordance with valuation policies and procedures approved by the Board, each Fund attempts to obtain prices from one or more third party pricing vendors or brokers to value its investments. When current market prices, quotations or currency exchange rates are not readily available or reliable, investments will be fair valued in good faith by the Committee, in accordance with procedures adopted by the Board. Factors used in determining fair value vary by investment type and may include market or investment specific events, changes in interest rates and credit quality. The frequency with which these procedures are used cannot be predicted and they may be utilized to a significant extent. The Committee oversees each Fund's valuation policies and procedures and reports to the Board on the Committee's activities and fair value determinations. The Board monitors the appropriateness of the procedures used in valuing each Fund's investments and ratifies the fair value determinations of the Committee.
Each Fund categorizes the inputs to valuation techniques used to value its investments into a disclosure hierarchy consisting of three levels as shown below:
- Level 1 – quoted prices in active markets for identical investments
- Level 2 – other significant observable inputs (including quoted prices for similar investments, interest rates, prepayment speeds, etc.)
- Level 3 – unobservable inputs (including the Fund's own assumptions based on the best information available)
Valuation techniques used to value each Fund's investments by major category are as follows:
Equity securities, including restricted securities, for which market quotations are readily available, are valued at the last reported sale price or official closing price as reported by a third party pricing vendor on the primary market or exchange on which they are traded and are categorized as Level 1 in the hierarchy. In the event there were no sales during the day or closing prices are not available, securities are valued at the last quoted bid price or may be valued using the last available price and are generally categorized as Level 2 in the hierarchy. For foreign equity securities, when market or security specific events arise, comparisons to the valuation of American Depositary Receipts (ADRs), futures contracts, Exchange-Traded Funds (ETFs) and certain indexes as well as quoted prices for similar securities may be used and would be categorized as Level 2 in the hierarchy. For equity securities, including restricted securities, where observable inputs are limited, assumptions about market activity and risk are used and these securities may be categorized as Level 3 in the hierarchy.
Debt securities, including restricted securities, are valued based on evaluated prices received from third party pricing vendors or from brokers who make markets in such securities. U.S. government and government agency obligations are valued by pricing vendors who utilize matrix pricing which considers yield or price of bonds of comparable quality, coupon, maturity and type or by broker-supplied prices. When independent prices are unavailable or unreliable, debt securities may be valued utilizing pricing methodologies which consider similar factors that would be used by third party pricing vendors. Debt securities are generally categorized as Level 2 in the hierarchy but may be Level 3 depending on the circumstances. Exchange-Traded Funds (ETFs) are valued at their last sale price or official closing price as reported by a third party pricing vendor on the primary market or exchange on which they are traded and are categorized as Level 1 in the hierarchy. In the event there were no sales during the day but the exchange reports a closing bid level, ETFs are valued at the closing bid and would be categorized as Level 1 in the hierarchy. In the event there was no closing bid, ETFs may be valued by another method that the Board believes reflects fair value in accordance with the Board's fair value pricing policies and may be categorized as Level 2 in the hierarchy.
Futures contracts are valued at the settlement price established each day by the board of trade or exchange on which they are traded and are categorized as Level 1 in the hierarchy. Investments in open-end mutual funds, including the Fidelity Central Funds, are valued at their closing net asset value (NAV) each business day and are categorized as Level 1 in the hierarchy.
Changes in valuation techniques may result in transfers in or out of an assigned level within the disclosure hierarchy. The aggregate value of investments by input level as of April 30, 2019 is included at the end of each applicable Fund's Schedule of Investments.
Foreign Currency. The Funds may use foreign currency contracts to facilitate transactions in foreign-denominated securities. Gains and losses from these transactions may arise from changes in the value of the foreign currency or if the counterparties do not perform under the contracts' terms.
Foreign-denominated assets, including investment securities, and liabilities are translated into U.S. dollars at the exchange rates at period end. Purchases and sales of investment securities, income and dividends received and expenses denominated in foreign currencies are translated into U.S. dollars at the exchange rate in effect on the transaction date.
The effects of exchange rate fluctuations on investments are included with the net realized and unrealized gain (loss) on investment securities. Other foreign currency transactions resulting in realized and unrealized gain (loss) are disclosed separately.
Investment Transactions and Income. For financial reporting purposes, the Funds' investment holdings and NAV include trades executed through the end of the last business day of the period. The NAV per share for processing shareholder transactions is calculated as of the close of business of the New York Stock Exchange (NYSE), normally 4:00 p.m. Eastern time and includes trades executed through the end of the prior business day. Gains and losses on securities sold are determined on the basis of identified cost and for certain Funds include proceeds received from litigation. Dividend income is recorded on the ex-dividend date, except for certain dividends from foreign securities where the ex-dividend date may have passed, which are recorded as soon as the Funds are informed of the ex-dividend date. Non-cash dividends included in dividend income, if any, are recorded at the fair market value of the securities received. Income and capital gain distributions from Fidelity Central Funds, if any, are recorded on the ex-dividend date. Certain distributions received by the Funds represent a return of capital or capital gain. The Funds determine the components of these distributions subsequent to the ex-dividend date, based upon receipt of tax filings or other correspondence relating to the underlying investment. These distributions are recorded as a reduction of cost of investments and/or as a realized gain. Interest income is accrued as earned and includes coupon interest and amortization of premium and accretion of discount on debt securities as applicable. Large, non-recurring dividends recognized by the Fund are presented separately on the Statement of Operations as "Non-cash dividends" and the impact of these dividends is presented in the Financial Highlights. Investment income is recorded net of foreign taxes withheld where recovery of such taxes is uncertain.
Expenses. Expenses directly attributable to a fund are charged to that fund. Expenses attributable to more than one fund are allocated among the respective funds on the basis of relative net assets or other appropriate methods. Expense estimates are accrued in the period to which they relate and adjustments are made when actual amounts are known.
Income Tax Information and Distributions to Shareholders. Each year, each Fund intends to qualify as a regulated investment company under Subchapter M of the Internal Revenue Code, including distributing substantially all of its taxable income and realized gains. As a result, no provision for U.S. Federal income taxes is required. Each Fund files a U.S. federal tax return, in addition to state and local tax returns as required. Each Fund's federal income tax returns are subject to examination by the Internal Revenue Service (IRS) for a period of three fiscal years after they are filed. State and local tax returns may be subject to examination for an additional fiscal year depending on the jurisdiction. Foreign taxes are provided for based on each Fund's understanding of the tax rules and rates that exist in the foreign markets in which it invests. Fidelity Series Emerging Markets Fund and Fidelity Series International Small Cap Fund are subject to a tax imposed on capital gains by certain countries in which they invest. An estimated deferred tax liability for net unrealized appreciation on the applicable securities is included in Other payables and accrued expenses on each applicable Fund's Statement of Assets & Liabilities.
Distributions are declared and recorded on the ex-dividend date. Income and capital gain distributions are determined in accordance with income tax regulations, which may differ from GAAP.
Capital accounts within the financial statements are adjusted for permanent book-tax differences. These adjustments have no impact on net assets or the results of operations. Capital accounts are not adjusted for temporary book-tax differences which will reverse in a subsequent period.
Book-tax differences are primarily due to futures contracts, foreign currency transactions, certain foreign taxes, passive foreign investment companies (PFIC), market discount, capital loss carryforwards, and losses deferred due to wash sales.
As of period end, the cost and unrealized appreciation (depreciation) in securities, and derivatives if applicable, for federal income tax purposes were as follows for each Fund:
| | Tax cost | Gross unrealized appreciation | Gross unrealized depreciation | Net unrealized appreciation (depreciation) |
| Fidelity Series Emerging Markets Fund | $1,585,198,540 | $151,469,165 | $(49,721,061) | $101,748,104 |
| Fidelity Series Emerging Markets Opportunities Fund | 12,619,652,394 | 3,990,331,481 | (549,083,554) | 3,441,247,927 |
| Fidelity Series International Growth Fund | 10,460,994,196 | 5,281,121,294 | (216,602,107) | 5,064,519,187 |
| Fidelity Series International Small Cap Fund | 2,697,068,413 | 1,105,797,484 | (184,791,974) | 921,005,510 |
| Fidelity Series International Value Fund | 14,588,447,992 | 1,808,652,422 | (959,964,781) | 848,687,641 |
Capital loss carryforwards are only available to offset future capital gains of the Funds to the extent provided by regulations and may be limited. Under the Regulated Investment Company Modernization Act of 2010 (the Act), the Funds are permitted to carry forward capital losses incurred in taxable years beginning after December 22, 2010 for an unlimited period and such capital losses are required to be used prior to any losses that expire. The capital loss carryforward information presented below, including any applicable limitation, is estimated as of prior fiscal period end and is subject to adjustment.
| | No expiration | | | |
| | Short-term | Long-term | Total no expiration | Total capital loss carryforward |
| Fidelity Series Emerging Markets Fund | $(10,539,477) | $(39,691) | $(10,579,168) | $(10,579,168) |
| Fidelity Series International Value Fund | (337,150,639) | – | (337,150,639) | (337,150,639) |
Delayed Delivery Transactions and When-Issued Securities. During the period, certain Funds transacted in securities on a delayed delivery or when-issued basis. Payment and delivery may take place after the customary settlement period for that security. The price of the underlying securities and the date when the securities will be delivered and paid for are fixed at the time the transaction is negotiated. The securities purchased on a delayed delivery or when-issued basis are identified as such in each applicable Fund's Schedule of Investments. Losses may arise due to changes in the value of the underlying securities or if the counterparty does not perform under the contract's terms, or if the issuer does not issue the securities due to political, economic, or other factors.
Restricted Securities. The Funds may invest in securities that are subject to legal or contractual restrictions on resale. These securities generally may be resold in transactions exempt from registration or to the public if the securities are registered. Disposal of these securities may involve time-consuming negotiations and expense, and prompt sale at an acceptable price may be difficult. Information regarding restricted securities is included at the end of each applicable Fund's Schedule of Investments.
4. Derivative Instruments.
Risk Exposures and the Use of Derivative Instruments. The Funds' investment objective allows the Funds to enter into various types of derivative contracts, including futures contracts. Derivatives are investments whose value is primarily derived from underlying assets, indices or reference rates and may be transacted on an exchange or over-the-counter (OTC). Derivatives may involve a future commitment to buy or sell a specified asset based on specified terms, to exchange future cash flows at periodic intervals based on a notional principal amount, or for one party to make one or more payments upon the occurrence of specified events in exchange for periodic payments from the other party.
The Funds used derivatives to increase returns and to manage exposure to certain risks as defined below. The success of any strategy involving derivatives depends on analysis of numerous economic factors, and if the strategies for investment do not work as intended, the Funds may not achieve their objectives.
The Funds' use of derivatives increased or decreased their exposure to the following risk:
| Equity Risk | Equity risk relates to the fluctuations in the value of financial instruments as a result of changes in market prices (other than those arising from interest rate risk or foreign exchange risk), whether caused by factors specific to an individual investment, its issuer, or all factors affecting all instruments traded in a market or market segment.
|
The Funds are also exposed to additional risks from investing in derivatives, such as liquidity risk and counterparty credit risk. Liquidity risk is the risk that the Funds will be unable to close out the derivative in the open market in a timely manner. Counterparty credit risk is the risk that the counterparty will not be able to fulfill its obligation to the Funds.
Investing in derivatives may involve greater risks than investing in the underlying assets directly and, to varying degrees, may involve risk of loss in excess of any initial investment and collateral received and amounts recognized in the Statement of Assets and Liabilities. In addition, there may be the risk that the change in value of the derivative contract does not correspond to the change in value of the underlying instrument.
A summary of the value of derivatives by primary risk exposure as of period end, if any, is included at the end of the Schedule of Investments.
Futures Contracts. A futures contract is an agreement between two parties to buy or sell a specified underlying instrument for a fixed price at a specified future date. The Funds used futures contracts to manage their exposure to the stock market.
Upon entering into a futures contract, a fund is required to deposit either cash or securities (initial margin) with a clearing broker in an amount equal to a certain percentage of the face value of the contract. Futures contracts are marked-to-market daily and subsequent daily payments (variation margin) are made or received by a fund depending on the daily fluctuations in the value of the futures contracts and are recorded as unrealized appreciation or (depreciation). This receivable and/or payable, if any, is included in daily variation margin on futures contracts in the Statement of Assets and Liabilities. Realized gain or (loss) is recorded upon the expiration or closing of a futures contract. The net realized gain (loss) and change in net unrealized appreciation (depreciation) on futures contracts during the period is presented in the Statement of Operations.
Any open futures contracts at period end are presented in the Schedule of Investments under the caption "Futures Contracts". The notional amount at value reflects each contract's exposure to the underlying instrument or index at period end and is representative of volume of activity during the period. Securities deposited to meet initial margin requirements are identified in the Schedule of Investments.
5. Purchases and Sales of Investments.
Purchases and sales of securities, other than short-term securities, are noted in the table below.
| | Purchases ($) | Sales ($) |
| Fidelity Series Emerging Markets Fund | 573,592,250 | 334,013,164 |
| Fidelity Series Emerging Markets Opportunities Fund | 4,371,722,172 | 4,265,049,670 |
| Fidelity Series International Growth Fund | 1,659,101,962 | 1,809,238,243 |
| Fidelity Series International Small Cap Fund | 477,341,234 | 354,796,222 |
| Fidelity Series International Value Fund | 3,276,864,613 | 2,770,149,587 |
6. Fees and Other Transactions with Affiliates.
Management Fee. Fidelity Management & Research Company (the investment adviser) and its affiliates provide the Funds with investment management related services for which the Funds do not pay a management fee. Under the management contract, the investment adviser or an affiliate pays all ordinary operating expenses of the Funds, except custody fees, fees and expenses of the independent Trustees, and certain miscellaneous expenses such as proxy and shareholder meeting expenses.
Brokerage Commissions. Certain Funds placed a portion of their portfolio transactions with brokerage firms which are affiliates of the investment adviser. Brokerage commissions are included in net realized gain (loss) and change in net unrealized appreciation (depreciation) in the Statement of Operations. The commissions paid to these affiliated firms were as follows:
| | Amount |
| Fidelity Series Emerging Markets Fund | $2,434 |
| Fidelity Series Emerging Markets Opportunities Fund | 35,216 |
| Fidelity Series International Growth Fund | 6,954 |
| Fidelity Series International Small Cap Fund | 862 |
| Fidelity Series International Value Fund | 2,804 |
Interfund Lending Program. Pursuant to an Exemptive Order issued by the SEC, the Funds, along with other registered investment companies having management contracts with FMR or other affiliated entities of FMR, may participate in an interfund lending program. This program provides an alternative credit facility allowing the funds to borrow from, or lend money to, other participating affiliated funds. At period end, there were no interfund loans outstanding. Each applicable fund's activity in this program during the period for which loans were outstanding was as follows:
| | Borrower or Lender | Average Loan Balance | Weighted Average Interest Rate | Interest Expense |
| Fidelity Series International Value Fund | Borrower | $47,649,500 | 2.60% | $6,883 |
Interfund Trades. The Funds may purchase from or sell securities to other Fidelity Funds under procedures adopted by the Board. The procedures have been designed to ensure these interfund trades are executed in accordance with Rule 17a-7 of the 1940 Act. Interfund trades are included within the respective purchases and sales amounts shown in the Purchases and Sales of Investments note.
Prior Fiscal Year Exchanges In-Kind. During the prior period, an affiliated entity completed an exchange in-kind with the Fidelity Series Emerging Markets Fund. The affiliated entity delivered investments valued at $548,241,767 in exchange for 58,062,553 shares of the Fidelity Series Emerging Markets Fund. The amount of in-kind exchanges is included in share transactions in the accompanying Statement of Changes in Net Assets. The Fidelity Series Emerging Markets Fund recognized no gain or loss for federal income tax purposes.
7. Committed Line of Credit.
Certain Funds participate with other funds managed by the investment adviser or an affiliate in a $4.25 billion credit facility (the "line of credit") to be utilized for temporary or emergency purposes to fund shareholder redemptions or for other short-term liquidity purposes. The participating funds have agreed to pay commitment fees on their pro-rata portion of the line of credit, which are reflected in Commitment fees on the Statement of Operations, and are as follows:
| Fidelity Series Emerging Markets Fund | $336 |
| Fidelity Series Emerging Markets Opportunities Fund | 20,525 |
| Fidelity Series International Growth Fund | 20,113 |
| Fidelity Series International Small Cap Fund | 4,718 |
| Fidelity Series International Value Fund | 19,750 |
During the period, the Funds did not borrow on this line of credit.
8. Security Lending.
Certain Funds lend portfolio securities through a lending agent from time to time in order to earn additional income. For equity securities, a lending agent is used and may loan securities to certain qualified borrowers, including Fidelity Capital Markets (FCM), a broker-dealer affiliated with the Funds. On the settlement date of the loan, each applicable Fund receives collateral (in the form of U.S. Treasury obligations, letters of credit and/or cash) against the loaned securities and maintains collateral in an amount not less than 100% of the market value of the loaned securities during the period of the loan. The market value of the loaned securities is determined at the close of business of the Funds and any additional required collateral is delivered to the Funds on the next business day. The Funds or borrower may terminate the loan at any time, and if the borrower defaults on its obligation to return the securities loaned because of insolvency or other reasons, the Funds may apply collateral received from the borrower against the obligation. The Funds may experience delays and costs in recovering the securities loaned. Any cash collateral received is invested in the Fidelity Securities Lending Cash Central Fund. The value of loaned securities and cash collateral at period end are disclosed on each applicable Fund's Statement of Assets and Liabilities. At period end, there were no security loans outstanding with FCM. Security lending income represents the income earned on investing cash collateral, less rebates paid to borrowers and any lending agent fees associated with the loan, plus any premium payments received for lending certain types of securities. Security lending income is presented on each applicable Fund's Statement of Operations as a component of income from Fidelity Central Funds.
Security lending activity was as follows:
| | Total Security Lending Income | Security Lending Income From Securities Loaned to FCM |
| Fidelity Series Emerging Markets Opportunities Fund | $1,123,115 | $4,354 |
| Fidelity Series International Growth Fund | $615,711 | $826 |
| Fidelity Series International Small Cap Fund | $449,330 | $– |
| Fidelity Series International Value Fund | $4,064,312 | $– |
9. Expense Reductions.
The investment adviser contractually agreed to reimburse each Fund to the extent annual operating expenses exceeded certain levels of average net assets as noted in the table below. This reimbursement will remain in place through February 28, 2022. Some expenses, for example the compensation of the independent Trustees, and certain miscellaneous expenses such as proxy and shareholder meeting expenses, are excluded from this reimbursement.
The following Funds were in reimbursement during the period:
| | Expense Limitations | Reimbursement |
| Fidelity Series Emerging Markets Fund | .014% | $184,906 |
| Fidelity Series Emerging Markets Opportunities Fund | .014% | $1,703,170 |
In addition through arrangements with each applicable Fund's custodian, credits realized as a result of certain uninvested cash balances were used to reduce each applicable Fund's expenses. All of the applicable expense reductions are noted in the table below.
| | Custody reduction |
| Fidelity Series Emerging Markets Fund | $309 |
| Fidelity Series International Growth Fund | 1,364 |
| Fidelity Series International Value Fund | 184 |
10. Other.
The Funds' organizational documents provide former and current trustees and officers with a limited indemnification against liabilities arising in connection with the performance of their duties to the Funds. In the normal course of business, the Funds may also enter into contracts that provide general indemnifications. The Funds' maximum exposure under these arrangements is unknown as this would be dependent on future claims that may be made against the Funds. The risk of material loss from such claims is considered remote.
At the end of the period, mutual funds managed by the investment adviser or its affiliates were the owners of record of all of the outstanding shares of the Funds.
Shareholder Expense Example
As a shareholder of a Fund, you incur two types of costs: (1) transaction costs and (2) ongoing costs, including other Fund expenses. This Example is intended to help you understand your ongoing costs (in dollars) of investing in the Funds and to compare these costs with the ongoing costs of investing in other mutual funds.
The Example is based on an investment of $1,000 invested at the beginning of the period and held for the entire period (November 1, 2018 to April 30, 2019).
Actual Expenses
The first line of the accompanying table for each fund provides information about actual account values and actual expenses. You may use the information in this line, together with the amount you invested, to estimate the expenses that you paid over the period. Simply divide your account value by $1,000.00 (for example, an $8,600 account value divided by $1,000.00 = 8.6), then multiply the result by the number in the first line for a fund under the heading entitled "Expenses Paid During Period" to estimate the expenses you paid on your account during this period. In addition, each Fund, as a shareholder in the underlying Fidelity Central Funds, will indirectly bear its pro-rata share of the fees and expenses incurred by the underlying Fidelity Central Funds. These fees and expenses are not included in the Fund's annualized expense ratio used to calculate the expense estimate in the table below.
Hypothetical Example for Comparison Purposes
The second line of the accompanying table for each fund provides information about hypothetical account values and hypothetical expenses based on a fund's actual expense ratio and an assumed rate of return of 5% per year before expenses, which is not the Fund's actual return. The hypothetical account values and expenses may not be used to estimate the actual ending account balance or expenses you paid for the period. You may use this information to compare the ongoing costs of investing in the Fund and other funds. To do so, compare this 5% hypothetical example with the 5% hypothetical examples that appear in the shareholder reports of the other funds. In addition, each Fund, as a shareholder in the underlying Fidelity Central Funds, will indirectly bear its pro-rata share of the fees and expenses incurred by the underlying Fidelity Central Funds. These fees and expenses are not included in the Fund's annualized expense ratio used to calculate the expense estimate in the table below.
Please note that the expenses shown in the table are meant to highlight your ongoing costs only and do not reflect any transaction costs. Therefore, the second line of the table is useful in comparing ongoing costs only, and will not help you determine the relative total costs of owning different funds.
| | Annualized Expense Ratio-A | Beginning
Account Value
November 1, 2018 | Ending
Account Value
April 30, 2019 | Expenses Paid
During Period-B
November 1, 2018
to April 30, 2019 |
| Fidelity Series Emerging Markets Fund | .01% | | | |
| Actual | | $1,000.00 | $1,127.60 | $.05 |
| Hypothetical-C | | $1,000.00 | $1,024.74 | $.05 |
| Fidelity Series Emerging Markets Opportunities Fund | .01% | | | |
| Actual | | $1,000.00 | $1,176.60 | $.05 |
| Hypothetical-C | | $1,000.00 | $1,024.74 | $.05 |
| Fidelity Series International Growth Fund | .01% | | | |
| Actual | | $1,000.00 | $1,141.80 | $.05 |
| Hypothetical-C | | $1,000.00 | $1,024.74 | $.05 |
| Fidelity Series International Small Cap Fund | .01% | | | |
| Actual | | $1,000.00 | $1,095.30 | $.05 |
| Hypothetical-C | | $1,000.00 | $1,024.74 | $.05 |
| Fidelity Series International Value Fund | .01% | | | |
| Actual | | $1,000.00 | $1,035.50 | $.05 |
| Hypothetical-C | | $1,000.00 | $1,024.74 | $.05 |
A Annualized expense ratio reflects expenses net of applicable fee waivers.
B Expenses are equal to each Fund's annualized expense ratio, multiplied by the average account value over the period, multiplied by 181/ 365 (to reflect the one-half year period).
C 5% return per year before expenses
Board Approval of Investment Advisory Contracts and Management Fees
Fidelity Series Emerging Markets Opportunities Fund
Fidelity Series International Growth Fund
Fidelity Series International Small Cap Fund
Fidelity Series International Value Fund
Each year, the Board of Trustees, including the Independent Trustees (together, the Board), votes on the renewal of the management contract with Fidelity Management & Research Company (FMR) and the sub-advisory agreements (together, the Advisory Contracts) for each fund. FMR and the sub-advisers are referred to herein as the Investment Advisers. The Board, assisted by the advice of fund counsel and Independent Trustees' counsel, requests and considers a broad range of information relevant to the renewal of the Advisory Contracts throughout the year.
The Board meets regularly and, at each of its meetings, covers an extensive agenda of topics and materials and considers factors that are relevant to its annual consideration of the renewal of each fund's Advisory Contracts, including the services and support provided to each fund and its shareholders. The Board has established various standing committees (Committees), each composed of and chaired by Independent Trustees with varying backgrounds, to which the Board has assigned specific subject matter responsibilities in order to enhance effective decision-making by the Board. The Board, acting directly and through its Committees, requests and receives information concerning the annual consideration of the renewal of each fund's Advisory Contracts. The Board also meets as needed to review matters specifically related to the Board's annual consideration of the renewal of the Advisory Contracts. Members of the Board may also meet with trustees of other Fidelity funds through joint ad hoc committees to discuss certain matters relevant to all of the Fidelity funds.
At its January 2019 meeting, the Board unanimously determined to renew each fund's Advisory Contracts. In considering whether to renew the Advisory Contracts for each fund, the Board considered all factors it believed relevant and reached a determination, with the assistance of fund counsel and Independent Trustees' counsel and through the exercise of its business judgment, that the renewal of the Advisory Contracts was in the best interests of each fund and its shareholders and the fact that no fee is payable under the management contracts was fair and reasonable.
Nature, Extent, and Quality of Services Provided. The Board considered Fidelity's staffing as it relates to the funds, including the backgrounds of investment personnel of Fidelity, and also considered the funds' investment objectives, strategies, and related investment philosophies. The Independent Trustees also had discussions with senior management of Fidelity's investment operations and investment groups. The Board considered the structure of the investment personnel compensation program and whether this structure provides appropriate incentives to act in the best interests of each fund.
Resources Dedicated to Investment Management and Support Services. The Board and the Fund Oversight and Research Committees reviewed the general qualifications and capabilities of Fidelity's investment staff, including its size, education, experience, and resources, as well as Fidelity's approach to recruiting, training, managing, and compensating investment personnel. The Board noted that Fidelity has continued to increase the resources devoted to non-U.S. offices, including expansion of Fidelity's global investment organization. The Board also noted that Fidelity's analysts have extensive resources, tools and capabilities that allow them to conduct sophisticated quantitative and fundamental analysis, as well as credit analysis of issuers, counterparties and guarantors. Further, the Board considered that Fidelity's investment professionals have sufficient access to global information and data so as to provide competitive investment results over time, and that those professionals also have access to sophisticated tools that permit them to assess portfolio construction and risk and performance attribution characteristics continuously, as well as to transmit new information and research conclusions rapidly around the world. Additionally, in its deliberations, the Board considered Fidelity's trading, risk management, compliance, and technology and operations capabilities and resources, which are integral parts of the investment management process.
Administrative Services. The Board considered (i) the nature, extent, quality, and cost of advisory and administrative services performed by the Investment Advisers and their affiliates under the Advisory Contracts and under separate agreements covering transfer agency, pricing and bookkeeping, and securities lending services for each fund; (ii) the nature and extent of the supervision of third party service providers, principally custodians, subcustodians, and pricing vendors; and (iii) the resources devoted to, and the record of compliance with, each fund's compliance policies and procedures. The Board also reviewed the allocation of fund brokerage, including allocations to brokers affiliated with the Investment Advisers, the use of brokerage commissions to pay fund expenses, and the use of "soft" commission dollars to pay for research services.
Investment Performance. The Board considered whether each fund has operated in accordance with its investment objective, as well as its record of compliance with its investment restrictions. The Board reviewed each fund's absolute investment performance, as well as each fund's relative investment performance, but did not consider performance to be a material factor in its decision to renew each fund's Advisory Contracts, as the funds are not publicly offered as stand-alone investment products. In this regard, the Board noted that each fund is designed to offer an investment option for other investment companies managed by Fidelity and ultimately to enhance the performance of those investment companies.
Based on its review, the Board concluded that the nature, extent, and quality of services provided to each fund under the Advisory Contracts should continue to benefit the shareholders of each fund.
Competitiveness of Management Fee and Total Expense Ratio. The Board considered that each fund does not pay FMR a management fee for investment advisory services. The Board also noted that FMR or an affiliate undertakes to pay all operating expenses of each fund with certain exceptions.
In connection with the renewal of the Advisory Contracts, the Board also approved amendments to the management contract for each fund to clarify that the fund pays its non-operating expenses, including brokerage commissions and fees and expenses associated with the fund's securities lending program. The Board considered that the amendments would not change the services provided to the funds or the party responsible for making such payments under the current management contracts.
The Board further considered that FMR has contractually agreed to reimburse each fund to the extent that total operating expenses, with certain exceptions, as a percentage of its average net assets, exceed 0.014% through December 31, 2020.
Based on its review, the Board considered that each fund does not pay a management fee and concluded that the total expense ratio of each class of each fund was reasonable in light of the services that the fund and its shareholders receive and the other factors considered.
Costs of the Services and Profitability. The Board considered the level of Fidelity's profits in respect of all the Fidelity funds.
PricewaterhouseCoopers LLP (PwC), auditor to Fidelity and certain Fidelity funds, has been engaged annually by the Board as part of the Board's assessment of Fidelity's profitability analysis. PwC's engagement includes the review and assessment of the methodologies used by Fidelity in determining the revenues and expenses attributable to Fidelity's mutual fund business, and completion of agreed-upon procedures in respect of the mathematical accuracy of the fund profitability information and its conformity to established allocation methodologies. After considering PwC's reports issued under the engagement and information provided by Fidelity, the Board concluded that while other allocation methods may also be reasonable, Fidelity's profitability methodologies are reasonable in all material respects.
The Board also reviewed Fidelity's non-fund businesses and potential indirect benefits such businesses may have received as a result of their association with Fidelity's mutual fund business (i.e., fall-out benefits) as well as cases where Fidelity's affiliates may benefit from the funds' business. The Board noted that changes to fall-out benefits year-over-year reflect business developments at Fidelity's various businesses.
The Board concluded that the costs of the services provided by and the profits realized by Fidelity in connection with the operation of each fund were not relevant to the renewal of the Advisory Contracts because each fund pays no advisory fees and FMR or an affiliate bears all expenses of each fund with certain exceptions.
Economies of Scale. The Board concluded that because each fund pays no advisory fees and FMR or an affiliate bears all expenses of each fund with certain exceptions, the realization of economies of scale was not a material factor in the Board's decision to renew each fund's Advisory Contracts.
Additional Information Requested by the Board. In order to develop fully the factual basis for consideration of the Fidelity funds' advisory contracts, the Board requested and received additional information on certain topics, including: (i) fund performance trends, in particular the underperformance of certain funds, and Fidelity's long-term strategies for certain funds; (ii) Fidelity's fund profitability methodology, profitability trends for certain funds, and the impact of certain factors on fund profitability results; (iii) metrics for evaluating index fund and ETF performance and information about ETF trading characteristics; (iv) the methodology with respect to the evaluation of competitive fund data and peer group classifications and fee comparisons; (v) the expense structures for different funds and classes; (vi) information regarding other accounts managed by Fidelity, including collective investment trusts; and (vii) Fidelity's philosophies and strategies for evaluating funds and classes with lower or declining asset levels.
Based on its evaluation of all of the conclusions noted above, and after considering all factors it believed relevant, the Board concluded that the advisory fee arrangements are fair and reasonable, and that each fund's Advisory Contracts should be renewed.
GSV-S-SANN-0619
1.907946.109
Fidelity's Broadly Diversified International Equity Funds Fidelity® Diversified International Fund
Fidelity® International Capital Appreciation Fund
Fidelity® Overseas Fund
Fidelity® Worldwide Fund
Semi-Annual Report April 30, 2019 Includes Fidelity and Fidelity Advisor share classes |
|
Beginning on January 1, 2021, as permitted by regulations adopted by the Securities and Exchange Commission, paper copies of a fund’s shareholder reports will no longer be sent by mail, unless you specifically request paper copies of the reports from the fund or from your financial intermediary, such as a financial advisor, broker-dealer or bank. Instead, the reports will be made available on a website, and you will be notified by mail each time a report is posted and provided with a website link to access the report.
If you already elected to receive shareholder reports electronically, you will not be affected by this change and you need not take any action. You may elect to receive shareholder reports and other communications from a fund electronically, by contacting your financial intermediary. For Fidelity customers, visit Fidelity's web site or call Fidelity using the contact information listed below.
You may elect to receive all future reports in paper free of charge. If you wish to continue receiving paper copies of your shareholder reports, you may contact your financial intermediary or, if you are a Fidelity customer, visit Fidelity’s website, or call Fidelity at the applicable toll-free number listed below. Your election to receive reports in paper will apply to all funds held with the fund complex/your financial intermediary.
| Account Type | Website | Phone Number |
| Brokerage, Mutual Fund, or Annuity Contracts: | fidelity.com/mailpreferences | 1-800-343-3548 |
| Employer Provided Retirement Accounts: | netbenefits.fidelity.com/preferences (choose 'no' under Required Disclosures to continue to print) | 1-800-343-0860 |
| Advisor Sold Accounts Serviced Through Your Financial Intermediary: | Contact Your Financial Intermediary | Your Financial Intermediary's phone number |
| Advisor Sold Accounts Serviced by Fidelity: | institutional.fidelity.com | 1-877-208-0098 |
Contents
To view a fund's proxy voting guidelines and proxy voting record for the 12-month period ended June 30, visit http://www.fidelity.com/proxyvotingresults or visit the Securities and Exchange Commission's (SEC) web site at http://www.sec.gov.
You may also call 1-800-544-8544 if you’re an individual investing directly with Fidelity, call 1-800-835-5092 if you’re a plan sponsor or participant with Fidelity as your recordkeeper or call 1-877-208-0098 on institutional accounts or if you’re an advisor or invest through one to request a free copy of the proxy voting guidelines.
Standard & Poor's, S&P and S&P 500 are registered service marks of The McGraw-Hill Companies, Inc. and have been licensed for use by Fidelity Distributors Corporation.
Other third-party marks appearing herein are the property of their respective owners.
All other marks appearing herein are registered or unregistered trademarks or service marks of FMR LLC or an affiliated company. © 2019 FMR LLC. All rights reserved.
This report and the financial statements contained herein are submitted for the general information of the shareholders of the Funds. This report is not authorized for distribution to prospective investors in the Funds unless preceded or accompanied by an effective prospectus.
A fund files its complete schedule of portfolio holdings with the SEC for the first and third quarters of each fiscal year on Form N-PORT. Forms N-PORT are available on the SEC’s web site at http://www.sec.gov. A fund's Forms N-PORT may be reviewed and copied at the SEC’s Public Reference Room in Washington, DC. Information regarding the operation of the SEC's Public Reference Room may be obtained by calling 1-800-SEC-0330.
For a complete list of a fund's portfolio holdings, view the most recent holdings listing, semiannual report, or annual report on Fidelity's web site at http://www.fidelity.com, http://www.institutional.fidelity.com, or http://www.401k.com, as applicable.
NOT FDIC INSURED •MAY LOSE VALUE •NO BANK GUARANTEE
Neither the Funds nor Fidelity Distributors Corporation is a bank.
Fidelity® Diversified International Fund
Investment Summary (Unaudited)
Geographic Diversification (% of fund's net assets)
| As of April 30, 2019 |
| | Japan | 16.7% |
| | United Kingdom | 13.1% |
| | United States of America* | 9.4% |
| | Germany | 9.2% |
| | France | 6.5% |
| | Switzerland | 5.9% |
| | Netherlands | 5.8% |
| | India | 4.9% |
| | Canada | 3.2% |
| | Other | 25.3% |
* Includes Short-Term investments and Net Other Assets (Liabilities).
Percentages are based on country or territory of incorporation and are adjusted for the effect of futures contracts, if applicable.
Asset Allocation as of April 30, 2019
| | % of fund's net assets |
| Stocks | 97.2 |
| Short-Term Investments and Net Other Assets (Liabilities) | 2.8 |
Top Ten Stocks as of April 30, 2019
| | % of fund's net assets |
| SAP SE (Germany, Software) | 2.1 |
| Roche Holding AG (participation certificate) (Switzerland, Pharmaceuticals) | 1.9 |
| AIA Group Ltd. (Hong Kong, Insurance) | 1.8 |
| Unilever NV (Certificaten Van Aandelen) (Bearer) (Netherlands, Personal Products) | 1.6 |
| ASML Holding NV (Netherlands, Semiconductors & Semiconductor Equipment) | 1.5 |
| Keyence Corp. (Japan, Electronic Equipment & Components) | 1.4 |
| Hoya Corp. (Japan, Health Care Equipment & Supplies) | 1.4 |
| AstraZeneca PLC (United Kingdom) (United Kingdom, Pharmaceuticals) | 1.3 |
| Prudential PLC (United Kingdom, Insurance) | 1.3 |
| HDFC Bank Ltd. (India, Banks) | 1.3 |
| | 15.6 |
Top Market Sectors as of April 30, 2019
| | % of fund's net assets |
| Financials | 23.2 |
| Information Technology | 15.4 |
| Industrials | 14.8 |
| Health Care | 14.0 |
| Consumer Staples | 8.3 |
| Consumer Discretionary | 7.8 |
| Materials | 5.4 |
| Energy | 4.0 |
| Communication Services | 3.0 |
| Real Estate | 0.7 |
Fidelity® Diversified International Fund
Schedule of Investments April 30, 2019 (Unaudited)
Showing Percentage of Net Assets
| Common Stocks - 97.1% | | | |
| | | Shares | Value |
| Australia - 1.1% | | | |
| CSL Ltd. | | 580,742 | $81,293,381 |
| Magellan Financial Group Ltd. | | 2,203,493 | 69,295,050 |
|
| TOTAL AUSTRALIA | | | 150,588,431 |
|
| Bailiwick of Jersey - 1.0% | | | |
| Experian PLC | | 2,406,000 | 70,036,045 |
| Ferguson PLC | | 870,695 | 61,765,013 |
|
| TOTAL BAILIWICK OF JERSEY | | | 131,801,058 |
|
| Belgium - 1.2% | | | |
| KBC Groep NV | | 1,806,628 | 133,777,248 |
| Umicore SA | | 648,807 | 25,105,717 |
|
| TOTAL BELGIUM | | | 158,882,965 |
|
| Bermuda - 1.7% | | | |
| Credicorp Ltd. (United States) | | 278,000 | 65,858,200 |
| Hiscox Ltd. | | 2,595,200 | 56,650,517 |
| IHS Markit Ltd. (a) | | 1,010,400 | 57,855,504 |
| Marvell Technology Group Ltd. | | 2,014,800 | 50,410,296 |
|
| TOTAL BERMUDA | | | 230,774,517 |
|
| Brazil - 0.3% | | | |
| BM&F BOVESPA SA | | 2,416,900 | 21,234,400 |
| Notre Dame Intermedica Participacoes SA | | 2,299,900 | 20,599,446 |
|
| TOTAL BRAZIL | | | 41,833,846 |
|
| Canada - 3.2% | | | |
| Alimentation Couche-Tard, Inc. Class B (sub. vtg.) | | 2,771,781 | 163,426,873 |
| Cenovus Energy, Inc. (Canada) | | 4,171,784 | 41,353,506 |
| Constellation Software, Inc. | | 63,122 | 55,695,023 |
| Fairfax India Holdings Corp. (a)(b) | | 3,180,400 | 42,617,360 |
| Suncor Energy, Inc. | | 3,434,300 | 113,254,739 |
| Waste Connection, Inc. (Canada) | | 156,500 | 14,525,050 |
|
| TOTAL CANADA | | | 430,872,551 |
|
| Cayman Islands - 1.7% | | | |
| Alibaba Group Holding Ltd. sponsored ADR (a) | | 474,200 | 87,997,294 |
| ENN Energy Holdings Ltd. | | 2,131,700 | 20,135,500 |
| Momo, Inc. ADR | | 354,600 | 12,435,822 |
| Sea Ltd. ADR (a) | | 606,200 | 15,088,318 |
| Tencent Holdings Ltd. | | 1,528,200 | 75,321,406 |
| Zai Lab Ltd. ADR (a) | | 504,027 | 13,432,320 |
|
| TOTAL CAYMAN ISLANDS | | | 224,410,660 |
|
| China - 1.5% | | | |
| Kweichow Moutai Co. Ltd. (A Shares) | | 498,860 | 72,145,042 |
| Ping An Insurance (Group) Co. of China Ltd. (H Shares) | | 5,034,000 | 60,934,886 |
| Shanghai International Airport Co. Ltd. (A Shares) | | 3,630,338 | 38,071,950 |
| Wuliangye Yibin Co. Ltd. (A Shares) | | 2,196,500 | 33,383,382 |
|
| TOTAL CHINA | | | 204,535,260 |
|
| Denmark - 1.3% | | | |
| DONG Energy A/S (b) | | 891,600 | 68,260,048 |
| DSV de Sammensluttede Vognmaend A/S | | 443,700 | 40,995,072 |
| Netcompany Group A/S (b) | | 526,165 | 18,765,917 |
| Novozymes A/S Series B | | 983,900 | 45,852,167 |
|
| TOTAL DENMARK | | | 173,873,204 |
|
| France - 6.5% | | | |
| Amundi SA (b) | | 1,254,513 | 90,122,307 |
| Capgemini SA | | 905,200 | 109,750,938 |
| Danone SA | | 358,300 | 28,978,414 |
| Elis SA | | 462,900 | 8,255,099 |
| Ipsen SA | | 131,049 | 15,301,093 |
| Kering SA | | 78,020 | 46,116,311 |
| Legrand SA | | 571,700 | 42,012,651 |
| LVMH Moet Hennessy - Louis Vuitton SA | | 407,238 | 159,888,663 |
| Pernod Ricard SA | | 76,400 | 13,311,979 |
| Sanofi SA | | 1,700,932 | 148,405,129 |
| SR Teleperformance SA | | 524,800 | 100,829,866 |
| VINCI SA (c) | | 1,207,900 | 121,993,368 |
|
| TOTAL FRANCE | | | 884,965,818 |
|
| Germany - 9.1% | | | |
| adidas AG | | 410,302 | 105,430,611 |
| Allianz SE | | 507,400 | 122,645,766 |
| Bayer AG | | 1,201,376 | 79,958,474 |
| Continental AG | | 206,400 | 34,113,581 |
| Deutsche Borse AG | | 770,500 | 102,956,026 |
| Deutsche Post AG | | 2,207,019 | 76,716,933 |
| Fresenius SE & Co. KGaA | | 486,800 | 27,616,421 |
| Hannover Reuck SE | | 506,100 | 76,291,053 |
| Linde PLC | | 800,534 | 144,019,781 |
| Morphosys AG (a) | | 116,100 | 11,511,250 |
| Morphosys AG sponsored ADR | | 745,173 | 18,375,966 |
| SAP SE | | 2,214,389 | 285,453,004 |
| Symrise AG | | 800,500 | 76,944,957 |
| Vonovia SE | | 1,376,600 | 68,661,438 |
|
| TOTAL GERMANY | | | 1,230,695,261 |
|
| Hong Kong - 2.6% | | | |
| AIA Group Ltd. | | 23,664,400 | 242,310,101 |
| BOC Hong Kong (Holdings) Ltd. | | 11,749,000 | 52,568,568 |
| Techtronic Industries Co. Ltd. | | 7,885,000 | 56,990,554 |
|
| TOTAL HONG KONG | | | 351,869,223 |
|
| India - 4.9% | | | |
| Axis Bank Ltd. (a) | | 6,284,405 | 69,194,595 |
| Godrej Consumer Products Ltd. | | 1,268,140 | 11,868,044 |
| HDFC Bank Ltd. | | 5,217,797 | 173,103,985 |
| Housing Development Finance Corp. Ltd. | | 5,346,947 | 153,164,194 |
| Infosys Ltd. sponsored ADR | | 2,415,000 | 25,985,400 |
| Kotak Mahindra Bank Ltd. | | 2,383,705 | 47,455,399 |
| LIC Housing Finance Ltd. | | 4,592,641 | 32,756,535 |
| Reliance Industries Ltd. | | 7,777,712 | 155,538,606 |
|
| TOTAL INDIA | | | 669,066,758 |
|
| Indonesia - 1.1% | | | |
| PT Bank Central Asia Tbk | | 35,129,900 | 70,876,114 |
| PT Bank Rakyat Indonesia Tbk | | 244,483,800 | 74,975,032 |
|
| TOTAL INDONESIA | | | 145,851,146 |
|
| Ireland - 2.6% | | | |
| Allergan PLC | | 187,800 | 27,606,600 |
| CRH PLC | | 1,786,100 | 59,960,603 |
| DCC PLC (United Kingdom) | | 225,389 | 20,126,769 |
| Kerry Group PLC Class A | | 780,200 | 87,332,218 |
| Kingspan Group PLC (Ireland) | | 1,679,900 | 88,330,164 |
| Ryanair Holdings PLC sponsored ADR (a) | | 868,499 | 67,430,262 |
|
| TOTAL IRELAND | | | 350,786,616 |
|
| Israel - 0.5% | | | |
| Check Point Software Technologies Ltd. (a) | | 554,900 | 67,009,724 |
| Italy - 0.9% | | | |
| FinecoBank SpA | | 1,140,200 | 15,007,285 |
| Intesa Sanpaolo SpA | | 19,563,300 | 51,256,168 |
| Moncler SpA | | 501,700 | 20,578,185 |
| Recordati SpA | | 893,800 | 36,079,474 |
|
| TOTAL ITALY | | | 122,921,112 |
|
| Japan - 16.7% | | | |
| Bandai Namco Holdings, Inc. | | 631,100 | 30,026,752 |
| Daikin Industries Ltd. | | 728,400 | 92,739,505 |
| Hoya Corp. | | 2,788,500 | 195,629,315 |
| Iriso Electronics Co. Ltd. | | 212,900 | 11,008,609 |
| Itochu Corp. | | 2,889,500 | 51,878,451 |
| Kao Corp. | | 1,185,700 | 91,081,601 |
| Keyence Corp. (d) | | 316,320 | 196,274,863 |
| KH Neochem Co. Ltd. | | 703,300 | 20,361,259 |
| Minebea Mitsumi, Inc. | | 7,729,500 | 136,694,780 |
| Misumi Group, Inc. | | 1,671,500 | 43,184,856 |
| Mitsubishi UFJ Financial Group, Inc. | | 13,322,200 | 66,098,443 |
| Morinaga & Co. Ltd. | | 44,105 | 1,831,192 |
| Nabtesco Corp. | | 615,100 | 18,718,874 |
| Nidec Corp. | | 166,100 | 23,536,860 |
| Nissan Chemical Corp. (d) | | 297,700 | 13,175,286 |
| Nitori Holdings Co. Ltd. | | 700,700 | 83,345,527 |
| ORIX Corp. (d) | | 10,639,200 | 150,092,040 |
| PALTAC Corp. | | 401,100 | 22,000,278 |
| Persol Holdings Co., Ltd. | | 1,053,900 | 19,716,573 |
| Recruit Holdings Co. Ltd. | | 4,447,000 | 132,897,015 |
| Renesas Electronics Corp. (a) | | 8,935,303 | 47,566,181 |
| Shimadzu Corp. | | 846,310 | 22,594,604 |
| Shin-Etsu Chemical Co. Ltd. | | 947,400 | 89,742,020 |
| Shiseido Co. Ltd. | | 967,300 | 75,702,872 |
| SMC Corp. | | 239,800 | 99,153,355 |
| SoftBank Corp. | | 1,063,000 | 112,711,363 |
| Sony Corp. | | 963,600 | 48,534,710 |
| Suzuki Motor Corp. | | 1,689,400 | 76,815,037 |
| Takeda Pharmaceutical Co. Ltd. (d) | | 2,163,229 | 79,826,883 |
| Tokyo Electron Ltd. (e) | | 300,400 | 47,583,446 |
| Tsubaki Nakashima Co. Ltd. | | 599,000 | 11,077,158 |
| Tsuruha Holdings, Inc. | | 935,014 | 79,488,151 |
| Welcia Holdings Co. Ltd. | | 1,232,200 | 48,394,228 |
| Yahoo! Japan Corp. (e) | | 9,353,800 | 24,855,019 |
|
| TOTAL JAPAN | | | 2,264,337,106 |
|
| Korea (South) - 0.6% | | | |
| LG Chemical Ltd. | | 104,048 | 32,268,905 |
| SK Hynix, Inc. | | 773,170 | 52,474,145 |
|
| TOTAL KOREA (SOUTH) | | | 84,743,050 |
|
| Luxembourg - 0.8% | | | |
| B&M European Value Retail SA | | 16,381,963 | 84,273,404 |
| Samsonite International SA (b) | | 6,814,800 | 19,545,814 |
|
| TOTAL LUXEMBOURG | | | 103,819,218 |
|
| Mexico - 0.1% | | | |
| Grupo Financiero Banorte S.A.B. de CV Series O | | 3,120,100 | 19,721,833 |
| Netherlands - 5.8% | | | |
| Adyen BV (b) | | 25,039 | 20,377,564 |
| ASML Holding NV | | 995,700 | 207,922,074 |
| Heineken NV (Bearer) | | 514,400 | 55,525,768 |
| Koninklijke Philips Electronics NV | | 1,972,100 | 84,689,330 |
| NXP Semiconductors NV | | 890,200 | 94,022,924 |
| Unilever NV (Certificaten Van Aandelen) (Bearer) | | 3,498,857 | 211,696,887 |
| Wolters Kluwer NV | | 1,657,600 | 115,602,828 |
|
| TOTAL NETHERLANDS | | | 789,837,375 |
|
| New Zealand - 0.3% | | | |
| Ryman Healthcare Group Ltd. | | 5,604,628 | 45,481,472 |
| Norway - 1.4% | | | |
| Adevinta ASA: | | | |
| Class A (a) | | 2,681,600 | 27,047,718 |
| Class B | | 1,354,500 | 13,326,065 |
| Equinor ASA | | 4,088,800 | 91,207,664 |
| Schibsted ASA (A Shares) | | 2,200,600 | 57,747,752 |
|
| TOTAL NORWAY | | | 189,329,199 |
|
| South Africa - 0.3% | | | |
| Capitec Bank Holdings Ltd. | | 386,000 | 36,068,671 |
| Spain - 1.3% | | | |
| Amadeus IT Holding SA Class A | | 768,100 | 61,097,648 |
| CaixaBank SA | | 23,901,700 | 76,186,545 |
| Masmovil Ibercom SA (a) | | 313,565 | 6,872,111 |
| Prosegur Cash SA (b) | | 16,376,300 | 35,118,962 |
|
| TOTAL SPAIN | | | 179,275,266 |
|
| Sweden - 2.0% | | | |
| ASSA ABLOY AB (B Shares) | | 4,210,600 | 90,012,386 |
| Coor Service Management Holding AB (b) | | 1,944,984 | 16,813,595 |
| Indutrade AB | | 935,500 | 28,602,656 |
| Svenska Handelsbanken AB (A Shares) | | 2,456,100 | 26,828,221 |
| Swedbank AB (A Shares) | | 1,682,200 | 27,485,840 |
| Telefonaktiebolaget LM Ericsson (B Shares) | | 7,781,200 | 76,973,010 |
|
| TOTAL SWEDEN | | | 266,715,708 |
|
| Switzerland - 5.9% | | | |
| Alcon, Inc. (a) | | 1,694,420 | 97,579,435 |
| Julius Baer Group Ltd. | | 1,275,440 | 61,610,009 |
| Lonza Group AG | | 212,977 | 65,773,539 |
| Medacta Group SA (b) | | 144,100 | 13,201,565 |
| Roche Holding AG (participation certificate) | | 998,624 | 263,500,290 |
| Sig Combibloc Group AG | | 372,845 | 3,629,837 |
| Sika AG | | 944,246 | 144,562,909 |
| Sonova Holding AG Class B | | 222,320 | 44,837,097 |
| Swiss Re Ltd. | | 702,450 | 67,601,204 |
| UBS Group AG | | 2,564,827 | 34,396,546 |
|
| TOTAL SWITZERLAND | | | 796,692,431 |
|
| Taiwan - 1.0% | | | |
| Taiwan Semiconductor Manufacturing Co. Ltd. sponsored ADR | | 3,191,500 | 139,851,530 |
| United Kingdom - 13.1% | | | |
| Admiral Group PLC | | 658,900 | 18,936,891 |
| Aon PLC | | 324,300 | 58,419,402 |
| Ascential PLC | | 7,926,073 | 36,856,747 |
| AstraZeneca PLC (United Kingdom) | | 2,432,639 | 181,231,138 |
| Beazley PLC | | 4,202,900 | 31,568,150 |
| Big Yellow Group PLC | | 1,474,200 | 20,011,734 |
| BP PLC sponsored ADR | | 3,147,000 | 137,618,310 |
| Bunzl PLC | | 3,174,770 | 95,590,292 |
| Coca-Cola European Partners PLC | | 1,010,800 | 54,168,772 |
| Compass Group PLC | | 3,972,888 | 90,398,538 |
| Halma PLC | | 588,356 | 13,806,056 |
| Hastings Group Holdings PLC (b) | | 4,717,688 | 11,706,999 |
| InterContinental Hotel Group PLC | | 848,569 | 54,972,608 |
| Lloyds Banking Group PLC | | 128,481,500 | 105,076,721 |
| London Stock Exchange Group PLC | | 1,535,500 | 100,672,452 |
| Micro Focus International PLC | | 876,385 | 22,145,295 |
| Network International Holdings PLC (b) | | 3,324,682 | 22,587,357 |
| Ocado Group PLC (a) | | 739,600 | 13,140,473 |
| Prudential PLC | | 7,925,881 | 180,086,967 |
| RELX PLC (Euronext N.V.) | | 5,282,499 | 121,222,449 |
| Rentokil Initial PLC | | 5,782,600 | 29,407,990 |
| Rio Tinto PLC | | 1,416,000 | 82,608,121 |
| Smith & Nephew PLC | | 3,827,800 | 74,000,895 |
| Spectris PLC | | 1,016,400 | 36,421,596 |
| St. James's Place Capital PLC | | 2,772,400 | 40,544,575 |
| Standard Chartered PLC (United Kingdom) | | 3,235,757 | 29,535,990 |
| Tesco PLC | | 17,654,119 | 57,599,029 |
| The Weir Group PLC | | 2,676,300 | 57,914,811 |
|
| TOTAL UNITED KINGDOM | | | 1,778,250,358 |
|
| United States of America - 6.6% | | | |
| Alphabet, Inc. Class C (a) | | 74,203 | 88,188,781 |
| Amgen, Inc. | | 356,700 | 63,963,444 |
| Becton, Dickinson & Co. | | 234,200 | 56,381,308 |
| Boston Scientific Corp. (a) | | 1,676,428 | 62,229,007 |
| Citigroup, Inc. | | 822,400 | 58,143,680 |
| Coty, Inc. Class A (c) | | 3,777,200 | 40,869,304 |
| IQVIA Holdings, Inc. (a) | | 467,800 | 64,977,420 |
| Marsh & McLennan Companies, Inc. | | 429,900 | 40,535,271 |
| MasterCard, Inc. Class A | | 588,600 | 149,645,664 |
| Microsoft Corp. | | 681,100 | 88,951,660 |
| QIAGEN NV (a) | | 814,452 | 31,731,050 |
| Visa, Inc. Class A | | 907,500 | 149,220,225 |
|
| TOTAL UNITED STATES OF AMERICA | | | 894,836,814 |
|
| TOTAL COMMON STOCKS | | | |
| (Cost $9,742,549,535) | | | 13,159,698,181 |
|
| Nonconvertible Preferred Stocks - 0.1% | | | |
| Germany - 0.1% | | | |
| Sartorius AG (non-vtg.) | | | |
| (Cost $2,882,517) | | 39,784 | 7,282,267 |
|
| Money Market Funds - 2.5% | | | |
| Fidelity Cash Central Fund, 2.49% (f) | | 302,183,685 | 302,244,122 |
| Fidelity Securities Lending Cash Central Fund 2.49% (f)(g) | | 43,510,318 | 43,514,669 |
| TOTAL MONEY MARKET FUNDS | | | |
| (Cost $345,731,760) | | | 345,758,791 |
| TOTAL INVESTMENT IN SECURITIES - 99.7% | | | |
| (Cost $10,091,163,812) | | | 13,512,739,239 |
| NET OTHER ASSETS (LIABILITIES) - 0.3% | | | 39,265,807 |
| NET ASSETS - 100% | | | $13,552,005,046 |
Categorizations in the Schedule of Investments are based on country or territory of incorporation.
Legend
(a) Non-income producing
(b) Security exempt from registration under Rule 144A of the Securities Act of 1933. These securities may be resold in transactions exempt from registration, normally to qualified institutional buyers. At the end of the period, the value of these securities amounted to $359,117,488 or 2.6% of net assets.
(c) Security or a portion of the security is on loan at period end.
(d) A portion of the security sold on a delayed delivery basis.
(e) Security or a portion of the security purchased on a delayed delivery or when-issued basis.
(f) Affiliated fund that is generally available only to investment companies and other accounts managed by Fidelity Investments. The rate quoted is the annualized seven-day yield of the fund at period end. A complete unaudited listing of the fund's holdings as of its most recent quarter end is available upon request. In addition, each Fidelity Central Fund's financial statements are available on the SEC's website or upon request.
(g) Investment made with cash collateral received from securities on loan.
Affiliated Central Funds
Information regarding fiscal year to date income earned by the Fund from investments in Fidelity Central Funds is as follows:
| Fund | Income earned |
| Fidelity Cash Central Fund | $7,393,394 |
| Fidelity Securities Lending Cash Central Fund | 756,799 |
| Total | $8,150,193 |
Amounts in the income column in the above table include any capital gain distributions from underlying funds, which are presented in the corresponding line-item in the Statement of Operations, if applicable.
Investment Valuation
The following is a summary of the inputs used, as of April 30, 2019, involving the Fund's assets and liabilities carried at fair value. The inputs or methodology used for valuing securities may not be an indication of the risk associated with investing in those securities. For more information on valuation inputs, and their aggregation into the levels used below, please refer to the Investment Valuation section in the accompanying Notes to Financial Statements.
| | Valuation Inputs at Reporting Date: |
| Description | Total | Level 1 | Level 2 | Level 3 |
| Investments in Securities: | | | | |
| Equities: | | | | |
| Communication Services | $414,989,001 | $226,956,232 | $188,032,769 | $-- |
| Consumer Discretionary | 1,049,256,658 | 750,434,747 | 298,821,911 | -- |
| Consumer Staples | 1,126,803,756 | 828,529,426 | 298,274,330 | -- |
| Energy | 538,972,825 | 538,972,825 | -- | -- |
| Financials | 3,124,073,558 | 1,726,821,428 | 1,397,252,130 | -- |
| Health Care | 1,912,495,009 | 1,015,067,805 | 897,427,204 | -- |
| Industrials | 1,993,708,180 | 1,496,793,692 | 496,914,488 | -- |
| Information Technology | 2,091,381,179 | 1,728,955,165 | 362,426,014 | -- |
| Materials | 738,231,562 | 505,920,818 | 232,310,744 | -- |
| Real Estate | 88,673,172 | 88,673,172 | -- | -- |
| Utilities | 88,395,548 | 88,395,548 | -- | -- |
| Money Market Funds | 345,758,791 | 345,758,791 | -- | -- |
| Total Investments in Securities: | $13,512,739,239 | $9,341,279,649 | $4,171,459,590 | $-- |
See accompanying notes which are an integral part of the financial statements.
Fidelity® Diversified International Fund
Financial Statements
Statement of Assets and Liabilities
| | | April 30, 2019 (Unaudited) |
| Assets | | |
Investment in securities, at value (including securities loaned of $41,903,142) — See accompanying schedule:
Unaffiliated issuers (cost $9,745,432,052) | $13,166,980,448 | |
| Fidelity Central Funds (cost $345,731,760) | 345,758,791 | |
| Total Investment in Securities (cost $10,091,163,812) | | $13,512,739,239 |
| Cash | | 3,445 |
| Foreign currency held at value (cost $465,177) | | 465,231 |
| Receivable for investments sold | | |
| Regular delivery | | 23,752,071 |
| Delayed delivery | | 49,121,573 |
| Receivable for fund shares sold | | 7,207,975 |
| Dividends receivable | | 76,176,884 |
| Distributions receivable from Fidelity Central Funds | | 835,880 |
| Prepaid expenses | | 7,944 |
| Other receivables | | 2,224,542 |
| Total assets | | 13,672,534,784 |
| Liabilities | | |
| Payable for investments purchased | | |
| Regular delivery | $24,176,752 | |
| Delayed delivery | 15,293,450 | |
| Payable for fund shares redeemed | 25,688,771 | |
| Accrued management fee | 6,905,654 | |
| Other affiliated payables | 1,590,828 | |
| Other payables and accrued expenses | 3,384,283 | |
| Collateral on securities loaned | 43,490,000 | |
| Total liabilities | | 120,529,738 |
| Net Assets | | $13,552,005,046 |
| Net Assets consist of: | | |
| Paid in capital | | $10,300,862,561 |
| Total distributable earnings (loss) | | 3,251,142,485 |
| Net Assets | | $13,552,005,046 |
| Net Asset Value and Maximum Offering Price | | |
| Diversified International: | | |
| Net Asset Value, offering price and redemption price per share ($9,082,463,480 ÷ 248,738,713 shares) | | $36.51 |
| Class K: | | |
| Net Asset Value, offering price and redemption price per share ($4,469,541,566 ÷ 122,650,961 shares) | | $36.44 |
See accompanying notes which are an integral part of the financial statements.
Statement of Operations
| | | Six months ended April 30, 2019 (Unaudited) |
| Investment Income | | |
| Dividends | | $138,387,573 |
| Non-Cash dividends | | 22,537,974 |
| Income from Fidelity Central Funds | | 8,150,193 |
| Income before foreign taxes withheld | | 169,075,740 |
| Less foreign taxes withheld | | (13,105,839) |
| Total income | | 155,969,901 |
| Expenses | | |
| Management fee | | |
| Basic fee | $44,745,155 | |
| Performance adjustment | (11,326,644) | |
| Transfer agent fees | 8,569,980 | |
| Accounting and security lending fees | 961,692 | |
| Custodian fees and expenses | 693,596 | |
| Independent trustees' fees and expenses | 38,653 | |
| Registration fees | 66,999 | |
| Audit | 116,182 | |
| Legal | 38,441 | |
| Miscellaneous | 47,280 | |
| Total expenses before reductions | 43,951,334 | |
| Expense reductions | (544,871) | |
| Total expenses after reductions | | 43,406,463 |
| Net investment income (loss) | | 112,563,438 |
| Realized and Unrealized Gain (Loss) | | |
| Net realized gain (loss) on: | | |
| Investment securities: | | |
| Unaffiliated issuers | (134,890,714) | |
| Fidelity Central Funds | (3,835) | |
| Foreign currency transactions | (498,796) | |
| Total net realized gain (loss) | | (135,393,345) |
| Change in net unrealized appreciation (depreciation) on: | | |
| Investment securities: | | |
| Unaffiliated issuers (net of increase in deferred foreign taxes of $1,336,545) | 1,233,797,139 | |
| Fidelity Central Funds | 4,298 | |
| Assets and liabilities in foreign currencies | 159,672 | |
| Total change in net unrealized appreciation (depreciation) | | 1,233,961,109 |
| Net gain (loss) | | 1,098,567,764 |
| Net increase (decrease) in net assets resulting from operations | | $1,211,131,202 |
See accompanying notes which are an integral part of the financial statements.
Statement of Changes in Net Assets
| | Six months ended April 30, 2019 (Unaudited) | Year ended October 31, 2018 |
| Increase (Decrease) in Net Assets | | |
| Operations | | |
| Net investment income (loss) | $112,563,438 | $228,505,229 |
| Net realized gain (loss) | (135,393,345) | 1,827,251,570 |
| Change in net unrealized appreciation (depreciation) | 1,233,961,109 | (3,417,451,891) |
| Net increase (decrease) in net assets resulting from operations | 1,211,131,202 | (1,361,695,092) |
| Distributions to shareholders | (905,624,719) | (992,277,149) |
| Share transactions - net increase (decrease) | (1,027,689,437) | (3,220,213,051) |
| Total increase (decrease) in net assets | (722,182,954) | (5,574,185,292) |
| Net Assets | | |
| Beginning of period | 14,274,188,000 | 19,848,373,292 |
| End of period | $13,552,005,046 | $14,274,188,000 |
See accompanying notes which are an integral part of the financial statements.
Fidelity Diversified International Fund
| | Six months ended (Unaudited) April 30, | Years endedOctober 31, | | | | |
| | 2019 | 2018 | 2017 | 2016 | 2015 | 2014 |
| Selected Per–Share Data | | | | | | |
| Net asset value, beginning of period | $35.72 | $41.39 | $34.28 | $36.07 | $36.22 | $35.89 |
| Income from Investment Operations | | | | | | |
| Net investment income (loss)A | .28 | .50 | .41 | .39 | .36 | .60B |
| Net realized and unrealized gain (loss) | 2.83 | (4.05) | 7.15 | (1.71) | .80 | .28 |
| Total from investment operations | 3.11 | (3.55) | 7.56 | (1.32) | 1.16 | .88 |
| Distributions from net investment income | (.43) | (.43) | (.38) | (.33)C | (.40) | (.32) |
| Distributions from net realized gain | (1.89) | (1.69) | (.07) | (.14)C | (.92) | (.23) |
| Total distributions | (2.32) | (2.12) | (.45) | (.47) | (1.31)D | (.55) |
| Redemption fees added to paid in capitalA | – | – | –E | –E | –E | –E |
| Net asset value, end of period | $36.51 | $35.72 | $41.39 | $34.28 | $36.07 | $36.22 |
| Total ReturnF,G | 9.54% | (9.05)% | 22.38% | (3.70)% | 3.29% | 2.48% |
| Ratios to Average Net AssetsH,I | | | | | | |
| Expenses before reductions | .69%J | .81% | .94% | 1.05% | 1.00% | .93% |
| Expenses net of fee waivers, if any | .69%J | .80% | .94% | 1.05% | .99% | .93% |
| Expenses net of all reductions | .68%J | .79% | .93% | 1.05% | .99% | .92% |
| Net investment income (loss) | 1.63%J | 1.27% | 1.10% | 1.15% | .98% | 1.65%B |
| Supplemental Data | | | | | | |
| Net assets, end of period (000 omitted) | $9,082,463 | $9,275,299 | $11,349,633 | $10,990,703 | $13,059,983 | $13,781,306 |
| Portfolio turnover rateK | 45%J,L | 30%L | 37%L | 24%L | 31%L | 39%L |
A Calculated based on average shares outstanding during the period.
B Net investment income per share reflects a large, non-recurring dividend which amounted to $.18 per share. Excluding this non-recurring dividend, the ratio of net investment income (loss) to average net assets would have been 1.16%.
C The amounts shown reflect certain reclassifications related to book to tax differences that were made in the year shown.
D Total distributions of $1.31 per share is comprised of distributions from net investment income of $.397 and distributions from net realized gain of $.917 per share.
E Amount represents less than $.005 per share.
F Total returns for periods of less than one year are not annualized.
G Total returns would have been lower if certain expenses had not been reduced during the applicable periods shown.
H Fees and expenses of any underlying Fidelity Central Funds are not included in the Fund's expense ratio. The Fund indirectly bears its proportionate share of the expenses of any underlying Fidelity Central Funds.
I Expense ratios reflect operating expenses of the class. Expenses before reductions do not reflect amounts reimbursed by the investment adviser or reductions from brokerage service arrangements or reductions from other expense offset arrangements and do not represent the amount paid by the class during periods when reimbursements or reductions occur. Expenses net of fee waivers reflect expenses after reimbursement by the investment adviser but prior to reductions from brokerage service arrangements or other expense offset arrangements. Expenses net of all reductions represent the net expenses paid by the class.
J Annualized
K Amount does not include the portfolio activity of any underlying Fidelity Central Funds.
L Portfolio turnover rate excludes securities received or delivered in-kind.
See accompanying notes which are an integral part of the financial statements.
Fidelity Diversified International Fund Class K
| | Six months ended (Unaudited) April 30, | Years endedOctober 31, | | | | |
| | 2019 | 2018 | 2017 | 2016 | 2015 | 2014 |
| Selected Per–Share Data | | | | | | |
| Net asset value, beginning of period | $35.68 | $41.35 | $34.25 | $36.04 | $36.20 | $35.87 |
| Income from Investment Operations | | | | | | |
| Net investment income (loss)A | .30 | .55 | .45 | .44 | .40 | .65B |
| Net realized and unrealized gain (loss) | 2.82 | (4.05) | 7.15 | (1.71) | .80 | .28 |
| Total from investment operations | 3.12 | (3.50) | 7.60 | (1.27) | 1.20 | .93 |
| Distributions from net investment income | (.47) | (.48) | (.43) | (.38)C | (.45) | (.37) |
| Distributions from net realized gain | (1.89) | (1.69) | (.07) | (.14)C | (.92) | (.23) |
| Total distributions | (2.36) | (2.17) | (.50) | (.52) | (1.36)D | (.60) |
| Redemption fees added to paid in capitalA | – | –E | –E | –E | –E | –E |
| Net asset value, end of period | $36.44 | $35.68 | $41.35 | $34.25 | $36.04 | $36.20 |
| Total ReturnF,G | 9.61% | (8.95)% | 22.55% | (3.57)% | 3.40% | 2.63% |
| Ratios to Average Net AssetsH,I | | | | | | |
| Expenses before reductions | .57%J | .69% | .82% | .92% | .87% | .80% |
| Expenses net of fee waivers, if any | .57%J | .69% | .81% | .92% | .87% | .80% |
| Expenses net of all reductions | .56%J | .67% | .81% | .92% | .86% | .79% |
| Net investment income (loss) | 1.75%J | 1.39% | 1.22% | 1.28% | 1.10% | 1.78%B |
| Supplemental Data | | | | | | |
| Net assets, end of period (000 omitted) | $4,469,542 | $4,998,889 | $8,498,740 | $8,608,956 | $10,143,540 | $11,134,431 |
| Portfolio turnover rateK | 45%J,L | 30%L | 37%L | 24%L | 31%L | 39%L |
A Calculated based on average shares outstanding during the period.
B Net investment income per share reflects a large, non-recurring dividend which amounted to $.18 per share. Excluding this non-recurring dividend, the ratio of net investment income (loss) to average net assets would have been 1.29%.
C The amounts shown reflect certain reclassifications related to book to tax differences that were made in the year shown.
D Total distributions of $1.36 per share is comprised of distributions from net investment income of $.446 and distributions from net realized gain of $.917 per share.
E Amount represents less than $.005 per share.
F Total returns for periods of less than one year are not annualized.
G Total returns would have been lower if certain expenses had not been reduced during the applicable periods shown.
H Fees and expenses of any underlying Fidelity Central Funds are not included in the Fund's expense ratio. The Fund indirectly bears its proportionate share of the expenses of any underlying Fidelity Central Funds.
I Expense ratios reflect operating expenses of the class. Expenses before reductions do not reflect amounts reimbursed by the investment adviser or reductions from brokerage service arrangements or reductions from other expense offset arrangements and do not represent the amount paid by the class during periods when reimbursements or reductions occur. Expenses net of fee waivers reflect expenses after reimbursement by the investment adviser but prior to reductions from brokerage service arrangements or other expense offset arrangements. Expenses net of all reductions represent the net expenses paid by the class.
J Annualized
K Amount does not include the portfolio activity of any underlying Fidelity Central Funds.
L Portfolio turnover rate excludes securities received or delivered in-kind.
See accompanying notes which are an integral part of the financial statements.
Notes to Financial Statements (Unaudited)
For the period ended April 30, 2019
1. Organization.
Fidelity Diversified International Fund (the Fund) is a fund of Fidelity Investment Trust (the Trust) and is authorized to issue an unlimited number of shares. The Trust is registered under the Investment Company Act of 1940, as amended (the 1940 Act), as an open-end management investment company organized as a Massachusetts business trust. The Fund offers Diversified International and Class K shares, each of which has equal rights as to assets and voting privileges. Each class has exclusive voting rights with respect to matters that affect that class. The Fund's investments in emerging markets can be subject to social, economic, regulatory, and political uncertainties and can be extremely volatile.
2. Investments in Fidelity Central Funds.
The Fund invests in Fidelity Central Funds, which are open-end investment companies generally available only to other investment companies and accounts managed by the investment adviser and its affiliates. The Fund's Schedule of Investments lists each of the Fidelity Central Funds held as of period end, if any, as an investment of the Fund, but does not include the underlying holdings of each Fidelity Central Fund. As an Investing Fund, the Fund indirectly bears its proportionate share of the expenses of the underlying Fidelity Central Funds.
The Money Market Central Funds seek preservation of capital and current income and are managed by Fidelity Investments Money Management, Inc. (FIMM), an affiliate of the investment adviser. Annualized expenses of the Money Market Central Funds as of their most recent shareholder report date are less than .005%.
A complete unaudited list of holdings for each Fidelity Central Fund is available upon request or at the Securities and Exchange Commission (the SEC) website at www.sec.gov. In addition, the financial statements of the Fidelity Central Funds are available on the SEC website or upon request.
3. Significant Accounting Policies.
The Fund is an investment company and applies the accounting and reporting guidance of the Financial Accounting Standards Board (FASB) Accounting Standards Codification Topic 946 Financial Services – Investments Companies. The financial statements have been prepared in conformity with accounting principles generally accepted in the United States of America (GAAP), which require management to make certain estimates and assumptions at the date of the financial statements. Actual results could differ from those estimates. Subsequent events, if any, through the date that the financial statements were issued have been evaluated in the preparation of the financial statements. The following summarizes the significant accounting policies of the Fund:
Investment Valuation. Investments are valued as of 4:00 p.m. Eastern time on the last calendar day of the period. The Board of Trustees (the Board) has delegated the day to day responsibility for the valuation of the Fund's investments to the Fair Value Committee (the Committee) established by the Fund's investment adviser. In accordance with valuation policies and procedures approved by the Board, the Fund attempts to obtain prices from one or more third party pricing vendors or brokers to value its investments. When current market prices, quotations or currency exchange rates are not readily available or reliable, investments will be fair valued in good faith by the Committee, in accordance with procedures adopted by the Board. Factors used in determining fair value vary by investment type and may include market or investment specific events. The frequency with which these procedures are used cannot be predicted and they may be utilized to a significant extent. The Committee oversees the Fund's valuation policies and procedures and reports to the Board on the Committee's activities and fair value determinations. The Board monitors the appropriateness of the procedures used in valuing the Fund's investments and ratifies the fair value determinations of the Committee.
The Fund categorizes the inputs to valuation techniques used to value its investments into a disclosure hierarchy consisting of three levels as shown below:
- Level 1 – quoted prices in active markets for identical investments
- Level 2 – other significant observable inputs (including quoted prices for similar investments, interest rates, prepayment speeds, etc.)
- Level 3– unobservable inputs (including the Fund's own assumptions based on the best information available)
Valuation techniques used to value the Fund's investments by major category are as follows:
Equity securities, including restricted securities, for which market quotations are readily available, are valued at the last reported sale price or official closing price as reported by a third party pricing vendor on the primary market or exchange on which they are traded and are categorized as Level 1 in the hierarchy. In the event there were no sales during the day or closing prices are not available, securities are valued at the last quoted bid price or may be valued using the last available price and are generally categorized as Level 2 in the hierarchy. For foreign equity securities, when market or security specific events arise, comparisons to the valuation of American Depositary Receipts (ADRs), futures contracts, Exchange-Traded Funds (ETFs) and certain indexes as well as quoted prices for similar securities may be used and would be categorized as Level 2 in the hierarchy. For equity securities, including restricted securities, where observable inputs are limited, assumptions about market activity and risk are used and these securities may be categorized as Level 3 in the hierarchy.
Investments in open-end mutual funds, including the Fidelity Central Funds, are valued at their closing net asset value (NAV) each business day and are categorized as Level 1 in the hierarchy.
Changes in valuation techniques may result in transfers in or out of an assigned level within the disclosure hierarchy. The aggregate value of investments by input level as of April 30, 2019 is included at the end of the Fund's Schedule of Investments.
Foreign Currency. The Fund may use foreign currency contracts to facilitate transactions in foreign-denominated securities. Gains and losses from these transactions may arise from changes in the value of the foreign currency or if the counterparties do not perform under the contracts' terms.
Foreign-denominated assets, including investment securities, and liabilities are translated into U.S. dollars at the exchange rates at period end. Purchases and sales of investment securities, income and dividends received and expenses denominated in foreign currencies are translated into U.S. dollars at the exchange rate in effect on the transaction date.
The effects of exchange rate fluctuations on investments are included with the net realized and unrealized gain (loss) on investment securities. Other foreign currency transactions resulting in realized and unrealized gain (loss) are disclosed separately.
Investment Transactions and Income. For financial reporting purposes, the Fund's investment holdings and NAV include trades executed through the end of the last business day of the period. The NAV per share for processing shareholder transactions is calculated as of the close of business of the New York Stock Exchange (NYSE), normally 4:00 p.m. Eastern time and includes trades executed through the end of the prior business day. Gains and losses on securities sold are determined on the basis of identified cost and include proceeds received from litigation. Dividend income is recorded on the ex-dividend date, except for certain dividends from foreign securities where the ex-dividend date may have passed, which are recorded as soon as the Fund is informed of the ex-dividend date. Non-cash dividends included in dividend income, if any, are recorded at the fair market value of the securities received. Income and capital gain distributions from Fidelity Central Funds, if any, are recorded on the ex-dividend date. Certain distributions received by the Fund represent a return of capital or capital gain. The Fund determines the components of these distributions subsequent to the ex-dividend date, based upon receipt of tax filings or other correspondence relating to the underlying investment. These distributions are recorded as a reduction of cost of investments and/or as a realized gain. Investment income is recorded net of foreign taxes withheld where recovery of such taxes is uncertain.
Class Allocations and Expenses. Investment income, realized and unrealized capital gains and losses, common expenses of the Fund, and certain fund-level expense reductions, if any, are allocated daily on a pro-rata basis to each class based on the relative net assets of each class to the total net assets of the Fund. Each class differs with respect to transfer agent fees incurred. Certain expense reductions may also differ by class. For the reporting period, the allocated portion of income and expenses to each class as a percent of its average net assets may vary due to the timing of recording these transactions in relation to fluctuating net assets of the classes. Expenses directly attributable to a fund are charged to that fund. Expenses attributable to more than one fund are allocated among the respective funds on the basis of relative net assets or other appropriate methods. Expense estimates are accrued in the period to which they relate and adjustments are made when actual amounts are known.
Deferred Trustee Compensation. Under a Deferred Compensation Plan (the Plan) for the Fund, certain independent Trustees have elected to defer receipt of a portion of their annual compensation. Deferred amounts are invested in a cross-section of Fidelity funds, are marked-to-market and remain in the Fund until distributed in accordance with the Plan. The investment of deferred amounts and the offsetting payable to the Trustees of $1,533,114 are included in the accompanying Statement of Assets and Liabilities in other receivables and other payables and accrued expenses, respectively.
Income Tax Information and Distributions to Shareholders. Each year, the Fund intends to qualify as a regulated investment company under Subchapter M of the Internal Revenue Code, including distributing substantially all of its taxable income and realized gains. As a result, no provision for U.S. Federal income taxes is required. The Fund files a U.S. federal tax return, in addition to state and local tax returns as required. The Fund's federal income tax returns are subject to examination by the Internal Revenue Service (IRS) for a period of three fiscal years after they are filed. State and local tax returns may be subject to examination for an additional fiscal year depending on the jurisdiction. Foreign taxes are provided for based on the Fund's understanding of the tax rules and rates that exist in the foreign markets in which it invests. The Fund is subject to a tax imposed on capital gains by certain countries in which it invests. An estimated deferred tax liability for net unrealized appreciation on the applicable securities is included in Other payables and accrued expenses on the Statement of Assets & Liabilities.
Distributions are declared and recorded on the ex-dividend date. Income and capital gain distributions are declared separately for each class. Income and capital gain distributions are determined in accordance with income tax regulations, which may differ from GAAP.
Capital accounts within the financial statements are adjusted for permanent book-tax differences. These adjustments have no impact on net assets or the results of operations. Capital accounts are not adjusted for temporary book-tax differences which will reverse in a subsequent period.
Book-tax differences are primarily due to foreign currency transactions, passive foreign investment companies (PFIC), certain deemed distributions, redemptions in kind, deferred trustees compensation and losses deferred due to wash sales.
As of period end, the cost and unrealized appreciation (depreciation) in securities, and derivatives if applicable, for federal income tax purposes were as follows:
| Gross unrealized appreciation | $3,644,514,310 |
| Gross unrealized depreciation | (339,447,463) |
| Net unrealized appreciation (depreciation) | $3,305,066,847 |
| Tax cost | $10,207,672,392 |
Delayed Delivery Transactions and When-Issued Securities. During the period, the Fund transacted in securities on a delayed delivery or when-issued basis. Payment and delivery may take place after the customary settlement period for that security. The price of the underlying securities and the date when the securities will be delivered and paid for are fixed at the time the transaction is negotiated. The securities purchased on a delayed delivery or when-issued basis are identified as such in the Fund's Schedule of Investments. Losses may arise due to changes in the value of the underlying securities or if the counterparty does not perform under the contract's terms, or if the issuer does not issue the securities due to political, economic, or other factors.
Restricted Securities. The Fund may invest in securities that are subject to legal or contractual restrictions on resale. These securities generally may be resold in transactions exempt from registration or to the public if the securities are registered. Disposal of these securities may involve time-consuming negotiations and expense, and prompt sale at an acceptable price may be difficult. Information regarding restricted securities is included at the end of the Fund's Schedule of Investments.
4. Purchases and Sales of Investments.
Purchases and sales of securities, other than short-term securities and in-kind transactions, aggregated $2,892,644,318 and $3,638,469,178, respectively.
Unaffiliated Redemptions In-Kind. During the period, 14,648,495 shares of the Fund held by unaffiliated entities were redeemed in-kind for investments and cash with a value of $498,033,553. The net realized gain of $133,332,113 on investments delivered through the in-kind redemptions is included in the accompanying Statement of Operations. The amount of the redemptions is included in share transactions activity shown in the accompanying Statement of Changes in Net Assets as well as the Notes to Financial Statements. The Fund recognized no gain or loss for federal income tax purposes.
Prior Fiscal Year Redemptions In-Kind. During the prior period, 64,249,823 shares of the Fund held by unaffiliated entities were redeemed in-kind for investments and cash with a value of $2,569,847,364. The Fund had a net realized gain of $907,269,340 on investments delivered through the in-kind redemptions. The amount of the redemptions is included in share transactions activity shown in the accompanying Statement of Changes in Net Assets as well as the Notes to Financial Statements. The Fund recognized no gain or loss for federal income tax purposes.
5. Fees and Other Transactions with Affiliates.
Management Fee. Fidelity Management & Research Company (the investment adviser) and its affiliates provide the Fund with investment management related services for which the Fund pays a monthly management fee. The management fee is the sum of an individual fund fee rate that is based on an annual rate of .424% of the Fund's average net assets and an annualized group fee rate that averaged .24% during the period. The group fee rate is based upon the average net assets of all the mutual funds advised by the investment adviser, including any mutual funds previously advised by the investment adviser that are currently advised by Fidelity SelectCo, LLC, an affiliate of the investment adviser. The group fee rate decreases as assets under management increase and increases as assets under management decrease. In addition, the management fee is subject to a performance adjustment (up to a maximum of +/- .20% of the Fund's average net assets over a 36 month performance period). The upward or downward adjustment to the management fee is based on the relative investment performance of Diversified International as compared to its benchmark index, the MSCI EAFE Index, over the same 36 month performance period. For the reporting period, the total annualized management fee rate, including the performance adjustment, was .50% of the Fund's average net assets. The performance adjustment included in the management fee rate may be higher or lower than the maximum performance adjustment rate due to the difference between the average net assets for the reporting and performance periods.
Transfer Agent Fees. Fidelity Investments Institutional Operations Company, Inc., (FIIOC), an affiliate of the investment adviser, is the transfer, dividend disbursing and shareholder servicing agent for each class of the Fund. FIIOC receives account fees and asset-based fees that vary according to the account size and type of account of the shareholders of Diversified International. FIIOC receives an asset-based fee of Class K's average net assets. FIIOC pays for typesetting, printing and mailing of shareholder reports, except proxy statements.
For the period, transfer agent fees for each class were as follows:
| | Amount | % of Class-Level Average Net Assets(a) |
| Diversified International | $7,522,922 | .17 |
| Class K | 1,047,058 | .05 |
| | $8,569,980 | |
(a) Annualized
Accounting and Security Lending Fees. Fidelity Service Company, Inc. (FSC), an affiliate of the investment adviser, maintains the Fund's accounting records. The accounting fee is based on the level of average net assets for each month. Prior to April 1, 2019, FSC had a separate agreement with the Fund for administration of the security lending program, based on the number and duration of lending transactions. For the period, the total fees paid for accounting and administration of securities lending were equivalent to an annualized rate of .01%.
Brokerage Commissions. The Fund placed a portion of its portfolio transactions with brokerage firms which are affiliates of the investment adviser. Brokerage commissions are included in net realized gain (loss) and change in net unrealized appreciation (depreciation) in the Statement of Operations. The commissions paid to these affiliated firms were $8,710 for the period.
Interfund Trades. The Fund may purchase from or sell securities to other Fidelity Funds under procedures adopted by the Board. The procedures have been designed to ensure these interfund trades are executed in accordance with Rule 17a-7 of the 1940 Act. Interfund trades are included within the respective purchases and sales amounts shown in the Purchases and Sales of Investments note.
6. Committed Line of Credit.
The Fund participates with other funds managed by the investment adviser or an affiliate in a $4.25 billion credit facility (the "line of credit") to be utilized for temporary or emergency purposes to fund shareholder redemptions or for other short-term liquidity purposes. The Fund has agreed to pay commitment fees on its pro-rata portion of the line of credit, which amounted to $19,612 and is reflected in Miscellaneous expenses on the Statement of Operations. During the period, the Fund did not borrow on this line of credit.
7. Security Lending.
The Fund lends portfolio securities through a lending agent from time to time in order to earn additional income. For equity securities, a lending agent is used and may loan securities to certain qualified borrowers, including Fidelity Capital Markets (FCM), a broker-dealer affiliated with the Fund. On the settlement date of the loan, the Fund receives collateral (in the form of U.S. Treasury obligations, letters of credit and/or cash) against the loaned securities and maintains collateral in an amount not less than 100% of the market value of the loaned securities during the period of the loan. The market value of the loaned securities is determined at the close of business of the Fund and any additional required collateral is delivered to the Fund on the next business day. The Fund or borrower may terminate the loan at any time, and if the borrower defaults on its obligation to return the securities loaned because of insolvency or other reasons, the Fund may apply collateral received from the borrower against the obligation. The Fund may experience delays and costs in recovering the securities loaned. Any cash collateral received is invested in the Fidelity Securities Lending Cash Central Fund. The value of loaned securities and cash collateral at period end are disclosed on the Fund's Statement of Assets and Liabilities. Security lending income represents the income earned on investing cash collateral, less rebates paid to borrowers and any lending agent fees associated with the loan, plus any premium payments received for lending certain types of securities. Security lending income is presented in the Statement of Operations as a component of income from Fidelity Central Funds. Total security lending income during the period amounted to $756,799. During the period, there were no securities loaned to FCM.
8. Expense Reductions.
Commissions paid to certain brokers with whom the investment adviser, or its affiliates, places trades on behalf of the Fund include an amount in addition to trade execution, which may be rebated back to the Fund to offset certain expenses. This amount totaled $486,980 for the period. In addition, through arrangements with the Fund's custodian, credits realized as a result of certain uninvested cash balances were used to reduce the Fund's expenses. During the period, these credits reduced the Fund's custody expenses by $5,269.
In addition, during the period the investment adviser reimbursed and/or waived a portion of fund-level operating expenses in the amount of $52,622.
9. Distributions to Shareholders.
Distributions to shareholders of each class were as follows:
| | Six months ended
April 30, 2019 | Year ended
October 31, 2018 |
| Distributions to shareholders | | |
| Diversified International | $589,277,164 | $578,499,998 |
| Class K | 316,347,555 | 413,777,151 |
| Total | $905,624,719 | $992,277,149 |
10. Share Transactions.
Share transactions for each class were as follows and may contain automatic conversions between classes or exchanges between affiliated funds:
| | Shares | Shares | Dollars | Dollars |
| | Six months ended April 30, 2019 | Year ended October 31, 2018 | Six months ended April 30, 2019 | Year ended October 31, 2018 |
| Diversified International | | | | |
| Shares sold | 14,639,306 | 29,835,455 | $498,471,266 | $1,174,373,008 |
| Reinvestment of distributions | 16,919,211 | 13,661,964 | 546,998,101 | 537,871,482 |
| Shares redeemed | (42,505,687)(a) | (57,997,016)(b) | (1,463,539,697)(a) | (2,309,553,360)(b) |
| Net increase (decrease) | (10,947,170) | (14,499,597) | $(418,070,330) | $(597,308,870) |
| Class K | | | | |
| Shares sold | 9,311,492 | 29,277,888 | $318,731,766 | $1,163,459,637 |
| Reinvestment of distributions | 9,807,521 | 10,532,806 | 316,292,568 | 413,728,634 |
| Shares redeemed | (36,583,370)(a) | (105,246,564)(b) | (1,244,643,441)(a) | (4,200,092,452)(b) |
| Net increase (decrease) | (17,464,357) | (65,435,870) | $(609,619,107) | $(2,622,904,181) |
(a) Amount includes in-kind redemptions (see the Unaffiliated Redemptions In-Kind note for additional details).
(b) Amount includes in-kind redemptions (see the Prior Fiscal Year Redemptions In-Kind note for additional details).
11. Other.
The Fund's organizational documents provide former and current trustees and officers with a limited indemnification against liabilities arising in connection with the performance of their duties to the Fund. In the normal course of business, the Fund may also enter into contracts that provide general indemnifications. The Fund's maximum exposure under these arrangements is unknown as this would be dependent on future claims that may be made against the Fund. The risk of material loss from such claims is considered remote.
Fidelity® International Capital Appreciation Fund
Investment Summary (Unaudited)
Geographic Diversification (% of fund's net assets)
| As of April 30, 2019 |
| | United States of America* | 18.6% |
| | France | 10.1% |
| | United Kingdom | 7.5% |
| | Germany | 6.9% |
| | Netherlands | 6.3% |
| | Canada | 5.7% |
| | Switzerland | 5.7% |
| | Cayman Islands | 4.9% |
| | Japan | 4.4% |
| | Other | 29.9% |

* Includes Short-Term investments and Net Other Assets (Liabilities).
Percentages are based on country or territory of incorporation and are adjusted for the effect of futures contracts, if applicable.
Asset Allocation as of April 30, 2019
| | % of fund's net assets |
| Stocks | 96.5 |
| Short-Term Investments and Net Other Assets (Liabilities) | 3.5 |
Top Ten Stocks as of April 30, 2019
| | % of fund's net assets |
| Nestle SA (Reg. S) (Switzerland, Food Products) | 2.2 |
| Tencent Holdings Ltd. (Cayman Islands, Interactive Media & Services) | 2.1 |
| Alibaba Group Holding Ltd. sponsored ADR (Cayman Islands, Internet & Direct Marketing Retail) | 1.9 |
| Taiwan Semiconductor Manufacturing Co. Ltd. sponsored ADR (Taiwan, Semiconductors & Semiconductor Equipment) | 1.8 |
| Unilever NV (Certificaten Van Aandelen) (Bearer) (Netherlands, Personal Products) | 1.6 |
| SAP SE (Germany, Software) | 1.5 |
| Naspers Ltd. Class N (South Africa, Internet & Direct Marketing Retail) | 1.4 |
| LVMH Moet Hennessy - Louis Vuitton SA (France, Textiles, Apparel & Luxury Goods) | 1.4 |
| AIA Group Ltd. (Hong Kong, Insurance) | 1.4 |
| Diageo PLC (United Kingdom, Beverages) | 1.3 |
| | 16.6 |
Top Market Sectors as of April 30, 2019
| | % of fund's net assets |
| Information Technology | 19.8 |
| Industrials | 15.5 |
| Financials | 14.8 |
| Consumer Staples | 12.6 |
| Consumer Discretionary | 12.0 |
| Health Care | 7.9 |
| Materials | 4.2 |
| Real Estate | 3.9 |
| Utilities | 2.6 |
| Communication Services | 2.1 |
Fidelity® International Capital Appreciation Fund
Schedule of Investments April 30, 2019 (Unaudited)
Showing Percentage of Net Assets
| Common Stocks - 95.5% | | | |
| | | Shares | Value |
| Australia - 1.1% | | | |
| CSL Ltd. | | 216,189 | $30,262,552 |
| Bailiwick of Jersey - 0.9% | | | |
| Experian PLC | | 864,118 | 25,153,536 |
| Bermuda - 0.9% | | | |
| Credicorp Ltd. (United States) | | 100,629 | 23,839,010 |
| Brazil - 2.7% | | | |
| BM&F BOVESPA SA | | 3,006,500 | 26,414,507 |
| Equatorial Energia SA | | 1,116,600 | 23,379,373 |
| Rumo SA (a) | | 4,904,200 | 22,638,040 |
|
| TOTAL BRAZIL | | | 72,431,920 |
|
| Canada - 5.7% | | | |
| Alimentation Couche-Tard, Inc. Class B (sub. vtg.) | | 431,282 | 25,428,801 |
| Brookfield Asset Management, Inc. | | 547,900 | 26,403,301 |
| Canadian National Railway Co. | | 323,205 | 30,021,371 |
| Canadian Pacific Railway Ltd. | | 118,684 | 26,592,055 |
| Constellation Software, Inc. | | 27,374 | 24,153,157 |
| Waste Connection, Inc. (Canada) | | 264,375 | 24,537,126 |
|
| TOTAL CANADA | | | 157,135,811 |
|
| Cayman Islands - 4.9% | | | |
| Alibaba Group Holding Ltd. sponsored ADR (a) | | 280,361 | 52,026,591 |
| Shenzhou International Group Holdings Ltd. | | 1,724,400 | 23,146,456 |
| Tencent Holdings Ltd. | | 1,163,900 | 57,365,910 |
|
| TOTAL CAYMAN ISLANDS | | | 132,538,957 |
|
| China - 0.8% | | | |
| Kweichow Moutai Co. Ltd. (A Shares) | | 154,005 | 22,272,175 |
| Denmark - 1.8% | | | |
| DONG Energy A/S (b) | | 311,000 | 23,809,864 |
| DSV de Sammensluttede Vognmaend A/S | | 272,000 | 25,131,079 |
|
| TOTAL DENMARK | | | 48,940,943 |
|
| France - 10.1% | | | |
| Dassault Systemes SA | | 163,061 | 25,796,524 |
| Hermes International SCA | | 35,488 | 24,964,655 |
| Kering SA | | 46,778 | 27,649,690 |
| L'Oreal SA | | 109,853 | 30,199,047 |
| LVMH Moet Hennessy - Louis Vuitton SA | | 94,403 | 37,064,246 |
| Orpea | | 197,290 | 24,053,187 |
| Pernod Ricard SA | | 151,267 | 26,356,847 |
| Safran SA | | 197,873 | 28,842,191 |
| SR Teleperformance SA | | 118,365 | 22,741,477 |
| VINCI SA (c) | | 285,577 | 28,842,205 |
|
| TOTAL FRANCE | | | 276,510,069 |
|
| Germany - 6.9% | | | |
| adidas AG | | 105,911 | 27,214,738 |
| Deutsche Borse AG | | 188,300 | 25,161,090 |
| Linde PLC | | 122,600 | 22,056,309 |
| SAP SE | | 317,000 | 40,863,914 |
| Symrise AG | | 237,700 | 22,847,990 |
| Vonovia SE | | 510,300 | 25,452,515 |
| Wirecard AG (c) | | 176,400 | 26,452,577 |
|
| TOTAL GERMANY | | | 190,049,133 |
|
| Hong Kong - 1.4% | | | |
| AIA Group Ltd. | | 3,615,200 | 37,017,608 |
| India - 3.8% | | | |
| HDFC Bank Ltd. | | 680,482 | 22,575,456 |
| Housing Development Finance Corp. Ltd. | | 1,004,004 | 28,759,863 |
| Kotak Mahindra Bank Ltd. | | 1,152,464 | 22,943,543 |
| Reliance Industries Ltd. | | 1,497,913 | 29,955,249 |
|
| TOTAL INDIA | | | 104,234,111 |
|
| Indonesia - 0.9% | | | |
| PT Bank Central Asia Tbk | | 12,544,400 | 25,308,877 |
| Ireland - 2.6% | | | |
| Accenture PLC Class A | | 125,677 | 22,957,418 |
| Kerry Group PLC Class A | | 211,400 | 23,663,203 |
| Kingspan Group PLC (Ireland) | | 459,208 | 24,145,436 |
|
| TOTAL IRELAND | | | 70,766,057 |
|
| Israel - 0.9% | | | |
| NICE Systems Ltd. sponsored ADR (a) | | 184,300 | 25,407,598 |
| Italy - 1.7% | | | |
| Amplifon SpA | | 1,120,877 | 21,535,419 |
| Moncler SpA | | 580,400 | 23,806,216 |
|
| TOTAL ITALY | | | 45,341,635 |
|
| Japan - 4.4% | | | |
| Hoya Corp. | | 367,000 | 25,747,161 |
| Kao Corp. | | 368,200 | 28,283,921 |
| Keyence Corp. | | 47,780 | 29,647,234 |
| OBIC Co. Ltd. | | 224,400 | 25,905,867 |
| Relo Group, Inc. (d) | | 433,500 | 11,791,418 |
|
| TOTAL JAPAN | | | 121,375,601 |
|
| Netherlands - 6.3% | | | |
| ASML Holding NV (Netherlands) | | 164,360 | 34,203,590 |
| Ferrari NV | | 168,100 | 22,766,321 |
| Heineken NV (Bearer) | | 242,300 | 26,154,537 |
| Interxion Holding N.V. (a) | | 325,085 | 22,492,631 |
| Unilever NV (Certificaten Van Aandelen) (Bearer) | | 713,300 | 43,157,920 |
| Wolters Kluwer NV | | 337,400 | 23,530,643 |
|
| TOTAL NETHERLANDS | | | 172,305,642 |
|
| Philippines - 0.9% | | | |
| SM Prime Holdings, Inc. | | 30,012,000 | 24,033,953 |
| South Africa - 3.1% | | | |
| Capitec Bank Holdings Ltd. | | 235,921 | 22,044,966 |
| FirstRand Ltd. | | 5,153,806 | 24,466,618 |
| Naspers Ltd. Class N | | 147,257 | 37,881,942 |
|
| TOTAL SOUTH AFRICA | | | 84,393,526 |
|
| Spain - 1.0% | | | |
| Amadeus IT Holding SA Class A | | 335,600 | 26,694,924 |
| Sweden - 2.6% | | | |
| ASSA ABLOY AB (B Shares) | | 1,157,800 | 24,750,948 |
| Hexagon AB (B Shares) | | 439,500 | 24,010,866 |
| Swedish Match Co. AB | | 473,700 | 23,097,424 |
|
| TOTAL SWEDEN | | | 71,859,238 |
|
| Switzerland - 5.7% | | | |
| Givaudan SA | | 9,399 | 24,342,667 |
| Nestle SA (Reg. S) | | 615,500 | 59,258,895 |
| Partners Group Holding AG | | 30,427 | 22,921,405 |
| Sika AG | | 165,001 | 25,261,451 |
| Temenos Group AG | | 151,524 | 25,190,800 |
|
| TOTAL SWITZERLAND | | | 156,975,218 |
|
| Taiwan - 1.8% | | | |
| Taiwan Semiconductor Manufacturing Co. Ltd. sponsored ADR | | 1,140,548 | 49,978,813 |
| United Kingdom - 7.5% | | | |
| Bunzl PLC | | 749,169 | 22,556,999 |
| Compass Group PLC | | 1,135,788 | 25,843,561 |
| Croda International PLC | | 333,954 | 22,562,012 |
| Diageo PLC | | 836,022 | 35,244,776 |
| InterContinental Hotel Group PLC | | 360,045 | 23,324,694 |
| London Stock Exchange Group PLC | | 380,200 | 24,927,168 |
| RELX PLC (London Stock Exchange) | | 1,232,030 | 28,259,515 |
| Rentokil Initial PLC | | 4,560,600 | 23,193,387 |
|
| TOTAL UNITED KINGDOM | | | 205,912,112 |
|
| United States of America - 15.1% | | | |
| Adobe, Inc. (a) | | 80,538 | 23,295,617 |
| American Tower Corp. | | 121,400 | 23,709,420 |
| Becton, Dickinson & Co. | | 94,800 | 22,822,152 |
| Boston Scientific Corp. (a) | | 626,800 | 23,266,816 |
| Crown Castle International Corp. | | 182,200 | 22,917,116 |
| Fiserv, Inc. (a) | | 251,900 | 21,975,756 |
| HEICO Corp. Class A | | 241,285 | 21,578,118 |
| Intuitive Surgical, Inc. (a) | | 44,500 | 22,723,035 |
| Marsh & McLennan Companies, Inc. | | 231,900 | 21,865,851 |
| MasterCard, Inc. Class A | | 91,851 | 23,352,198 |
| Microsoft Corp. | | 184,409 | 24,083,815 |
| Moody's Corp. | | 118,753 | 23,349,215 |
| NextEra Energy, Inc. | | 116,220 | 22,597,817 |
| Salesforce.com, Inc. (a) | | 143,000 | 23,645,050 |
| Stryker Corp. | | 124,200 | 23,462,622 |
| Thermo Fisher Scientific, Inc. | | 88,012 | 24,418,929 |
| TransDigm Group, Inc. (a) | | 45,675 | 22,039,101 |
| Visa, Inc. Class A | | 140,960 | 23,178,053 |
|
| TOTAL UNITED STATES OF AMERICA | | | 414,280,681 |
|
| TOTAL COMMON STOCKS | | | |
| (Cost $2,067,184,467) | | | 2,615,019,700 |
|
| Nonconvertible Preferred Stocks - 1.0% | | | |
| Brazil - 1.0% | | | |
| Itau Unibanco Holding SA sponsored ADR | | | |
| (Cost $25,381,626) | | 3,219,210 | 27,846,167 |
|
| Money Market Funds - 4.8% | | | |
| Fidelity Cash Central Fund, 2.49% (e) | | 88,179,470 | 88,197,106 |
| Fidelity Securities Lending Cash Central Fund 2.49% (e)(f) | | 44,157,166 | 44,161,582 |
| TOTAL MONEY MARKET FUNDS | | | |
| (Cost $132,358,668) | | | 132,358,688 |
| TOTAL INVESTMENT IN SECURITIES - 101.3% | | | |
| (Cost $2,224,924,761) | | | 2,775,224,555 |
| NET OTHER ASSETS (LIABILITIES) - (1.3)% | | | (36,204,742) |
| NET ASSETS - 100% | | | $2,739,019,813 |
Categorizations in the Schedule of Investments are based on country or territory of incorporation.
Legend
(a) Non-income producing
(b) Security exempt from registration under Rule 144A of the Securities Act of 1933. These securities may be resold in transactions exempt from registration, normally to qualified institutional buyers. At the end of the period, the value of these securities amounted to $23,809,864 or 0.9% of net assets.
(c) Security or a portion of the security is on loan at period end.
(d) A portion of the security sold on a delayed delivery basis.
(e) Affiliated fund that is generally available only to investment companies and other accounts managed by Fidelity Investments. The rate quoted is the annualized seven-day yield of the fund at period end. A complete unaudited listing of the fund's holdings as of its most recent quarter end is available upon request. In addition, each Fidelity Central Fund's financial statements are available on the SEC's website or upon request.
(f) Investment made with cash collateral received from securities on loan.
Affiliated Central Funds
Information regarding fiscal year to date income earned by the Fund from investments in Fidelity Central Funds is as follows:
| Fund | Income earned |
| Fidelity Cash Central Fund | $431,074 |
| Fidelity Securities Lending Cash Central Fund | 516,262 |
| Total | $947,336 |
Amounts in the income column in the above table include any capital gain distributions from underlying funds, which are presented in the corresponding line-item in the Statement of Operations, if applicable.
Investment Valuation
The following is a summary of the inputs used, as of April 30, 2019, involving the Fund's assets and liabilities carried at fair value. The inputs or methodology used for valuing securities may not be an indication of the risk associated with investing in those securities. For more information on valuation inputs, and their aggregation into the levels used below, please refer to the Investment Valuation section in the accompanying Notes to Financial Statements.
| | Valuation Inputs at Reporting Date: |
| Description | Total | Level 1 | Level 2 | Level 3 |
| Investments in Securities: | | | | |
| Equities: | | | | |
| Communication Services | $57,365,910 | $-- | $57,365,910 | $-- |
| Consumer Discretionary | 325,689,110 | 224,899,361 | 100,789,749 | -- |
| Consumer Staples | 343,117,546 | 182,358,531 | 160,759,015 | -- |
| Energy | 29,955,249 | 29,955,249 | -- | -- |
| Financials | 405,844,645 | 296,163,323 | 109,681,322 | -- |
| Health Care | 218,291,873 | 218,291,873 | -- | -- |
| Industrials | 424,553,227 | 316,964,347 | 107,588,880 | -- |
| Information Technology | 543,286,402 | 478,411,622 | 64,874,780 | -- |
| Materials | 117,070,429 | 117,070,429 | -- | -- |
| Real Estate | 107,904,422 | 107,904,422 | -- | -- |
| Utilities | 69,787,054 | 69,787,054 | -- | -- |
| Money Market Funds | 132,358,688 | 132,358,688 | -- | -- |
| Total Investments in Securities: | $2,775,224,555 | $2,174,164,899 | $601,059,656 | $-- |
See accompanying notes which are an integral part of the financial statements.
Fidelity® International Capital Appreciation Fund
Financial Statements
Statement of Assets and Liabilities
| | | April 30, 2019 (Unaudited) |
| Assets | | |
Investment in securities, at value (including securities loaned of $42,123,801) — See accompanying schedule:
Unaffiliated issuers (cost $2,092,566,093) | $2,642,865,867 | |
| Fidelity Central Funds (cost $132,358,668) | 132,358,688 | |
| Total Investment in Securities (cost $2,224,924,761) | | $2,775,224,555 |
| Foreign currency held at value (cost $605,345) | | 605,389 |
| Receivable for investments sold | | |
| Regular delivery | | 2,065,687 |
| Delayed delivery | | 2,427,040 |
| Receivable for fund shares sold | | 4,633,089 |
| Dividends receivable | | 6,279,968 |
| Distributions receivable from Fidelity Central Funds | | 168,627 |
| Prepaid expenses | | 1,109 |
| Other receivables | | 1,304,850 |
| Total assets | | 2,792,710,314 |
| Liabilities | | |
| Payable for investments purchased | $3,585,919 | |
| Payable for fund shares redeemed | 2,793,716 | |
| Accrued management fee | 1,817,316 | |
| Other affiliated payables | 454,500 | |
| Other payables and accrued expenses | 877,468 | |
| Collateral on securities loaned | 44,161,582 | |
| Total liabilities | | 53,690,501 |
| Net Assets | | $2,739,019,813 |
| Net Assets consist of: | | |
| Paid in capital | | $2,195,276,725 |
| Total distributable earnings (loss) | | 543,743,088 |
| Net Assets, for 128,844,384 shares outstanding | | $2,739,019,813 |
| Net Asset Value, offering price and redemption price per share ($2,739,019,813 ÷ 128,844,384 shares) | | $21.26 |
See accompanying notes which are an integral part of the financial statements.
Statement of Operations
| | | Six months ended April 30, 2019 (Unaudited) |
| Investment Income | | |
| Dividends | | $18,508,977 |
| Income from Fidelity Central Funds | | 947,336 |
| Income before foreign taxes withheld | | 19,456,313 |
| Less foreign taxes withheld | | (1,731,607) |
| Total income | | 17,724,706 |
| Expenses | | |
| Management fee | | |
| Basic fee | $8,071,723 | |
| Performance adjustment | 546,336 | |
| Transfer agent fees | 2,010,848 | |
| Accounting and security lending fees | 514,467 | |
| Custodian fees and expenses | 161,236 | |
| Independent trustees' fees and expenses | 6,325 | |
| Registration fees | 60,083 | |
| Audit | 66,593 | |
| Legal | 4,018 | |
| Interest | 33,856 | |
| Miscellaneous | 7,059 | |
| Total expenses before reductions | 11,482,544 | |
| Expense reductions | (319,561) | |
| Total expenses after reductions | | 11,162,983 |
| Net investment income (loss) | | 6,561,723 |
| Realized and Unrealized Gain (Loss) | | |
| Net realized gain (loss) on: | | |
| Investment securities: | | |
| Unaffiliated issuers | 1,704,428 | |
| Fidelity Central Funds | (280) | |
| Foreign currency transactions | 101,063 | |
| Total net realized gain (loss) | | 1,805,211 |
| Change in net unrealized appreciation (depreciation) on: | | |
| Investment securities: | | |
| Unaffiliated issuers (net of increase in deferred foreign taxes of $749,272) | 354,133,039 | |
| Fidelity Central Funds | 20 | |
| Assets and liabilities in foreign currencies | 40,963 | |
| Total change in net unrealized appreciation (depreciation) | | 354,174,022 |
| Net gain (loss) | | 355,979,233 |
| Net increase (decrease) in net assets resulting from operations | | $362,540,956 |
See accompanying notes which are an integral part of the financial statements.
Statement of Changes in Net Assets
| | Six months ended April 30, 2019 (Unaudited) | Year ended October 31, 2018 |
| Increase (Decrease) in Net Assets | | |
| Operations | | |
| Net investment income (loss) | $6,561,723 | $12,533,988 |
| Net realized gain (loss) | 1,805,211 | 62,085,898 |
| Change in net unrealized appreciation (depreciation) | 354,174,022 | (264,254,852) |
| Net increase (decrease) in net assets resulting from operations | 362,540,956 | (189,634,966) |
| Distributions to shareholders | (61,297,938) | (70,699,058) |
| Share transactions | | |
| Proceeds from sales of shares | 485,343,126 | 806,157,755 |
| Reinvestment of distributions | 49,190,814 | 55,240,406 |
| Cost of shares redeemed | (261,838,966) | (548,013,633) |
| Net increase (decrease) in net assets resulting from share transactions | 272,694,974 | 313,384,528 |
| Total increase (decrease) in net assets | 573,937,992 | 53,050,504 |
| Net Assets | | |
| Beginning of period | 2,165,081,821 | 2,112,031,317 |
| End of period | $2,739,019,813 | $2,165,081,821 |
| Other Information | | |
| Shares | | |
| Sold | 25,039,932 | 38,562,264 |
| Issued in reinvestment of distributions | 2,708,745 | 2,676,277 |
| Redeemed | (13,798,653) | (26,615,439) |
| Net increase (decrease) | 13,950,024 | 14,623,102 |
See accompanying notes which are an integral part of the financial statements.
Fidelity International Capital Appreciation Fund
| | Six months ended (Unaudited) April 30, | Years endedOctober 31, | | | | |
| | 2019 | 2018 | 2017 | 2016 | 2015 | 2014 |
| Selected Per–Share Data | | | | | | |
| Net asset value, beginning of period | $18.84 | $21.06 | $16.81 | $16.98 | $17.22 | $16.28 |
| Income from Investment Operations | | | | | | |
| Net investment income (loss)A | .05 | .11 | .09 | .12 | .11 | .13 |
| Net realized and unrealized gain (loss) | 2.90 | (1.63) | 4.27 | (.03) | .56 | .93 |
| Total from investment operations | 2.95 | (1.52) | 4.36 | .09 | .67 | 1.06 |
| Distributions from net investment income | (.08) | (.07) | (.11) | (.07) | (.09) | (.12) |
| Distributions from net realized gain | (.45) | (.63) | – | (.19) | (.81) | – |
| Total distributions | (.53) | (.70) | (.11) | (.26) | (.91)B | (.12) |
| Redemption fees added to paid in capitalA | – | – | –C | –C | –C | –C |
| Net asset value, end of period | $21.26 | $18.84 | $21.06 | $16.81 | $16.98 | $17.22 |
| Total ReturnD,E | 16.16% | (7.51)% | 26.13% | .53% | 3.96% | 6.55% |
| Ratios to Average Net AssetsF,G | | | | | | |
| Expenses before reductions | .98%H | 1.06% | 1.12% | 1.14% | 1.13% | 1.14% |
| Expenses net of fee waivers, if any | .98%H | 1.06% | 1.12% | 1.14% | 1.13% | 1.14% |
| Expenses net of all reductions | .95%H | 1.01% | 1.10% | 1.12% | 1.11% | 1.14% |
| Net investment income (loss) | .56%H | .54% | .50% | .69% | .64% | .74% |
| Supplemental Data | | | | | | |
| Net assets, end of period (000 omitted) | $2,739,020 | $2,165,082 | $2,112,031 | $1,782,912 | $1,379,660 | $1,145,744 |
| Portfolio turnover rateI | 154%H,J | 157%J | 178%J | 167% | 187% | 178% |
A Calculated based on average shares outstanding during the period.
B Total distributions of $.91 per share is comprised of distributions from net investment income of $.092 and distributions from net realized gain of $.813 per share.
C Amount represents less than $.005 per share.
D Total returns for periods of less than one year are not annualized.
E Total returns would have been lower if certain expenses had not been reduced during the applicable periods shown.
F Fees and expenses of any underlying Fidelity Central Funds are not included in the Fund's expense ratio. The Fund indirectly bears its proportionate share of the expenses of any underlying Fidelity Central Funds.
G Expense ratios reflect operating expenses of the Fund. Expenses before reductions do not reflect amounts reimbursed by the investment adviser or reductions from brokerage service arrangements or reductions from other expense offset arrangements and do not represent the amount paid by the Fund during periods when reimbursements or reductions occur. Expenses net of fee waivers reflect expenses after reimbursement by the investment adviser but prior to reductions from brokerage service arrangements or other expense offset arrangements. Expenses net of all reductions represent the net expenses paid by the Fund.
H Annualized
I Amount does not include the portfolio activity of any underlying Fidelity Central Funds.
J Portfolio turnover rate excludes securities received or delivered in-kind.
See accompanying notes which are an integral part of the financial statements.
Notes to Financial Statements (Unaudited)
For the period ended April 30, 2019
1. Organization.
Fidelity International Capital Appreciation Fund (the Fund) is a fund of Fidelity Investment Trust (the Trust) and is authorized to issue an unlimited number of shares. Share transactions on the Statement of Changes in Net Assets may contain exchanges between affiliated funds. The Trust is registered under the Investment Company Act of 1940, as amended (the 1940 Act), as an open-end management investment company organized as a Massachusetts business trust. The Fund's investments in emerging markets can be subject to social, economic, regulatory, and political uncertainties and can be extremely volatile.
2. Investments in Fidelity Central Funds.
The Fund invests in Fidelity Central Funds, which are open-end investment companies generally available only to other investment companies and accounts managed by the investment adviser and its affiliates. The Fund's Schedule of Investments lists each of the Fidelity Central Funds held as of period end, if any, as an investment of the Fund, but does not include the underlying holdings of each Fidelity Central Fund. As an Investing Fund, the Fund indirectly bears its proportionate share of the expenses of the underlying Fidelity Central Funds.
The Money Market Central Funds seek preservation of capital and current income and are managed by Fidelity Investments Money Management, Inc. (FIMM), an affiliate of the investment adviser. Annualized expenses of the Money Market Central Funds as of their most recent shareholder report date are less than .005%.
A complete unaudited list of holdings for each Fidelity Central Fund is available upon request or at the Securities and Exchange Commission (the SEC) website at www.sec.gov. In addition, the financial statements of the Fidelity Central Funds are available on the SEC website or upon request.
3. Significant Accounting Policies.
The Fund is an investment company and applies the accounting and reporting guidance of the Financial Accounting Standards Board (FASB) Accounting Standards Codification Topic 946 Financial Services – Investments Companies. The financial statements have been prepared in conformity with accounting principles generally accepted in the United States of America (GAAP), which require management to make certain estimates and assumptions at the date of the financial statements. Actual results could differ from those estimates. Subsequent events, if any, through the date that the financial statements were issued have been evaluated in the preparation of the financial statements. The following summarizes the significant accounting policies of the Fund:
Investment Valuation. Investments are valued as of 4:00 p.m. Eastern time on the last calendar day of the period. The Board of Trustees (the Board) has delegated the day to day responsibility for the valuation of the Fund's investments to the Fair Value Committee (the Committee) established by the Fund's investment adviser. In accordance with valuation policies and procedures approved by the Board, the Fund attempts to obtain prices from one or more third party pricing vendors or brokers to value its investments. When current market prices, quotations or currency exchange rates are not readily available or reliable, investments will be fair valued in good faith by the Committee, in accordance with procedures adopted by the Board. Factors used in determining fair value vary by investment type and may include market or investment specific events. The frequency with which these procedures are used cannot be predicted and they may be utilized to a significant extent. The Committee oversees the Fund's valuation policies and procedures and reports to the Board on the Committee's activities and fair value determinations. The Board monitors the appropriateness of the procedures used in valuing the Fund's investments and ratifies the fair value determinations of the Committee.
The Fund categorizes the inputs to valuation techniques used to value its investments into a disclosure hierarchy consisting of three levels as shown below:
- Level 1 – quoted prices in active markets for identical investments
- Level 2 – other significant observable inputs (including quoted prices for similar investments, interest rates, prepayment speeds, etc.)
- Level 3 – unobservable inputs (including the Fund's own assumptions based on the best information available)
Valuation techniques used to value the Fund's investments by major category are as follows:
Equity securities, including restricted securities, for which market quotations are readily available, are valued at the last reported sale price or official closing price as reported by a third party pricing vendor on the primary market or exchange on which they are traded and are categorized as Level 1 in the hierarchy. In the event there were no sales during the day or closing prices are not available, securities are valued at the last quoted bid price or may be valued using the last available price and are generally categorized as Level 2 in the hierarchy. For foreign equity securities, when market or security specific events arise, comparisons to the valuation of American Depositary Receipts (ADRs), futures contracts, Exchange-Traded Funds (ETFs) and certain indexes as well as quoted prices for similar securities may be used and would be categorized as Level 2 in the hierarchy. For equity securities, including restricted securities, where observable inputs are limited, assumptions about market activity and risk are used and these securities may be categorized as Level 3 in the hierarchy.
Investments in open-end mutual funds, including the Fidelity Central Funds, are valued at their closing net asset value (NAV) each business day and are categorized as Level 1 in the hierarchy.
Changes in valuation techniques may result in transfers in or out of an assigned level within the disclosure hierarchy. The aggregate value of investments by input level as of April 30, 2019 is included at the end of the Fund's Schedule of Investments.
Foreign Currency. The Fund may use foreign currency contracts to facilitate transactions in foreign-denominated securities. Gains and losses from these transactions may arise from changes in the value of the foreign currency or if the counterparties do not perform under the contracts' terms.
Foreign-denominated assets, including investment securities, and liabilities are translated into U.S. dollars at the exchange rates at period end. Purchases and sales of investment securities, income and dividends received and expenses denominated in foreign currencies are translated into U.S. dollars at the exchange rate in effect on the transaction date.
The effects of exchange rate fluctuations on investments are included with the net realized and unrealized gain (loss) on investment securities. Other foreign currency transactions resulting in realized and unrealized gain (loss) are disclosed separately.
Investment Transactions and Income. For financial reporting purposes, the Fund's investment holdings and NAV include trades executed through the end of the last business day of the period. The NAV per share for processing shareholder transactions is calculated as of the close of business of the New York Stock Exchange (NYSE), normally 4:00 p.m. Eastern time and includes trades executed through the end of the prior business day. Gains and losses on securities sold are determined on the basis of identified cost and include proceeds received from litigation. Dividend income is recorded on the ex-dividend date, except for certain dividends from foreign securities where the ex-dividend date may have passed, which are recorded as soon as the Fund is informed of the ex-dividend date. Non-cash dividends included in dividend income, if any, are recorded at the fair market value of the securities received. Income and capital gain distributions from Fidelity Central Funds, if any, are recorded on the ex-dividend date. Certain distributions received by the Fund represent a return of capital or capital gain. The Fund determines the components of these distributions subsequent to the ex-dividend date, based upon receipt of tax filings or other correspondence relating to the underlying investment. These distributions are recorded as a reduction of cost of investments and/or as a realized gain. Investment income is recorded net of foreign taxes withheld where recovery of such taxes is uncertain.
Expenses. Expenses directly attributable to a fund are charged to that fund. Expenses attributable to more than one fund are allocated among the respective funds on the basis of relative net assets or other appropriate methods. Expense estimates are accrued in the period to which they relate and adjustments are made when actual amounts are known.
Income Tax Information and Distributions to Shareholders. Each year, the Fund intends to qualify as a regulated investment company under Subchapter M of the Internal Revenue Code, including distributing substantially all of its taxable income and realized gains. As a result, no provision for U.S. Federal income taxes is required. The Fund files a U.S. federal tax return, in addition to state and local tax returns as required. The Fund's federal income tax returns are subject to examination by the Internal Revenue Service (IRS) for a period of three fiscal years after they are filed. State and local tax returns may be subject to examination for an additional fiscal year depending on the jurisdiction. Foreign taxes are provided for based on the Fund's understanding of the tax rules and rates that exist in the foreign markets in which it invests. The Fund is subject to a tax imposed on capital gains by certain countries in which it invests. An estimated deferred tax liability for net unrealized appreciation on the applicable securities is included in Other payables and accrued expenses on the Statement of Assets & Liabilities.
Distributions are declared and recorded on the ex-dividend date. Income and capital gain distributions are determined in accordance with income tax regulations, which may differ from GAAP.
Capital accounts within the financial statements are adjusted for permanent book-tax differences. These adjustments have no impact on net assets or the results of operations. Capital accounts are not adjusted for temporary book-tax differences which will reverse in a subsequent period.
Book-tax differences are primarily due to foreign currency transactions, certain foreign taxes, passive foreign investment companies (PFIC), redemptions in kind, deferred trustees compensation and losses deferred due to wash sales.
As of period end, the cost and unrealized appreciation (depreciation) in securities, and derivatives if applicable, for federal income tax purposes were as follows:
| Gross unrealized appreciation | $555,423,591 |
| Gross unrealized depreciation | (12,012,517) |
| Net unrealized appreciation (depreciation) | $543,411,074 |
| Tax cost | $2,231,813,481 |
Delayed Delivery Transactions and When-Issued Securities. During the period, the Fund transacted in securities on a delayed delivery or when-issued basis. Payment and delivery may take place after the customary settlement period for that security. The price of the underlying securities and the date when the securities will be delivered and paid for are fixed at the time the transaction is negotiated. Losses may arise due to changes in the value of the underlying securities or if the counterparty does not perform under the contract's terms, or if the issuer does not issue the securities due to political, economic, or other factors.
Restricted Securities. The Fund may invest in securities that are subject to legal or contractual restrictions on resale. These securities generally may be resold in transactions exempt from registration or to the public if the securities are registered. Disposal of these securities may involve time-consuming negotiations and expense, and prompt sale at an acceptable price may be difficult. Information regarding restricted securities is included at the end of the Fund's Schedule of Investments.
4. Purchases and Sales of Investments.
Purchases and sales of securities, other than short-term securities and in-kind transactions, aggregated $1,933,651,625 and $1,785,203,982, respectively.
Unaffiliated Redemptions In-Kind. During the period, 180,814 shares of the Fund held by unaffiliated entities were redeemed in-kind for investments and cash with a value of $3,486,102. The net realized gain of $817,257 on investments delivered through the in-kind redemptions is included in the accompanying Statement of Operations. The amount of the redemptions is included in share transactions activity shown in the accompanying Statement of Changes in Net Assets. The Fund recognized no gain or loss for federal income tax purposes.
Prior Fiscal Year Redemptions In-Kind. During the prior period, 1,386,625 shares of the Fund held by unaffiliated entities were redeemed in-kind for investments and cash with a value of $29,374,572. The Fund had a net realized gain of $8,546,160 on investments delivered through the in-kind redemptions. The amount of the redemptions is included in share transactions activity shown in the accompanying Statement of Changes in Net Assets as well as the Notes to Financial Statements. The Fund recognized no gain or loss for federal income tax purposes.
5. Fees and Other Transactions with Affiliates.
Management Fee. Fidelity Management & Research Company (the investment adviser) and its affiliates provide the Fund with investment management related services for which the Fund pays a monthly management fee. The management fee is the sum of an individual fund fee rate that is based on an annual rate of .45% of the Fund's average net assets and an annualized group fee rate that averaged .24% during the period. The group fee rate is based upon the average net assets of all the mutual funds advised by the investment adviser, including any mutual funds previously advised by the investment adviser that are currently advised by Fidelity SelectCo, LLC, an affiliate of the investment adviser. The group fee rate decreases as assets under management increase and increases as assets under management decrease. In addition, the management fee is subject to a performance adjustment (up to a maximum of +/- .20% of the Fund's average net assets over a 36 month performance period). The upward or downward adjustment to the management fee is based on the Fund's relative investment performance as compared to its benchmark index, the MSCI All Country World ex USA Index, over the same 36 month performance period. For the reporting period, the total annualized management fee rate, including the performance adjustment, was .73% of the Fund's average net assets. The performance adjustment included in the management fee rate may be higher or lower than the maximum performance adjustment rate due to the difference between the average net assets for the reporting and performance periods.
Transfer Agent Fees. Fidelity Investments Institutional Operations Company, Inc. (FIIOC), an affiliate of the investment adviser, is the Fund's transfer, dividend disbursing and shareholder servicing agent. FIIOC receives account fees and asset-based fees that vary according to account size and type of account. FIIOC pays for typesetting, printing and mailing of shareholder reports, except proxy statements. For the period, the transfer agent fees were equivalent to an annualized rate of .17% of average net assets.
Accounting and Security Lending Fees. Fidelity Service Company, Inc. (FSC), an affiliate of the investment adviser, maintains the Fund's accounting records. The accounting fee is based on the level of average net assets for each month. Prior to April 1, 2019, FSC had a separate agreement with the Fund for administration of the security lending program, based on the number and duration of lending transactions. For the period, the total fees paid for accounting and administration of securities lending were equivalent to an annualized rate of .04%.
Brokerage Commissions. The Fund placed a portion of its portfolio transactions with brokerage firms which are affiliates of the investment adviser. Brokerage commissions are included in net realized gain (loss) and change in net unrealized appreciation (depreciation) in the Statement of Operations. The commissions paid to these affiliated firms were $10,310 for the period.
Interfund Lending Program. Pursuant to an Exemptive Order issued by the SEC, the Fund, along with other registered investment companies having management contracts with Fidelity Management & Research Company (FMR) or other affiliated entities of FMR, may participate in an interfund lending program. This program provides an alternative credit facility allowing the funds to borrow from, or lend money to, other participating affiliated funds. At period end, there were no interfund loans outstanding. The Fund's activity in this program during the period for which loans were outstanding was as follows:
| Borrower or Lender | Average Loan Balance | Weighted Average Interest Rate | Interest Expense |
| Borrower | $25,873,389 | 2.62% | $33,856 |
Interfund Trades. The Fund may purchase from or sell securities to other Fidelity Funds under procedures adopted by the Board. The procedures have been designed to ensure these interfund trades are executed in accordance with Rule 17a-7 of the 1940 Act. Interfund trades are included within the respective purchases and sales amounts shown in the Purchases and Sales of Investments note.
6. Committed Line of Credit.
The Fund participates with other funds managed by the investment adviser or an affiliate in a $4.25 billion credit facility (the "line of credit") to be utilized for temporary or emergency purposes to fund shareholder redemptions or for other short-term liquidity purposes. The Fund has agreed to pay commitment fees on its pro-rata portion of the line of credit, which amounted to $3,265 and is reflected in Miscellaneous expenses on the Statement of Operations. During the period, the Fund did not borrow on this line of credit.
7. Security Lending.
The Fund lends portfolio securities through a lending agent from time to time in order to earn additional income. For equity securities, a lending agent is used and may loan securities to certain qualified borrowers, including Fidelity Capital Markets (FCM), a broker-dealer affiliated with the Fund. On the settlement date of the loan, the Fund receives collateral (in the form of U.S. Treasury obligations, letters of credit and/or cash) against the loaned securities and maintains collateral in an amount not less than 100% of the market value of the loaned securities during the period of the loan. The market value of the loaned securities is determined at the close of business of the Fund and any additional required collateral is delivered to the Fund on the next business day. The Fund or borrower may terminate the loan at any time, and if the borrower defaults on its obligation to return the securities loaned because of insolvency or other reasons, the Fund may apply collateral received from the borrower against the obligation. The Fund may experience delays and costs in recovering the securities loaned. Any cash collateral received is invested in the Fidelity Securities Lending Cash Central Fund. The value of loaned securities and cash collateral at period end are disclosed on the Fund's Statement of Assets and Liabilities. At period end, there were no security loans outstanding with FCM. Security lending income represents the income earned on investing cash collateral, less rebates paid to borrowers and any lending agent fees associated with the loan, plus any premium payments received for lending certain types of securities. Security lending income is presented in the Statement of Operations as a component of income from Fidelity Central Funds. Total security lending income during the period amounted to $516,262, including $23,290 from securities loaned to FCM.
8. Expense Reductions.
Commissions paid to certain brokers with whom the investment adviser, or its affiliates, places trades on behalf of the Fund include an amount in addition to trade execution, which may be rebated back to the Fund to offset certain expenses. This amount totaled $310,630 for the period. In addition, through arrangements with the Fund's custodian, credits realized as a result of certain uninvested cash balances were used to reduce the Fund's expenses. During the period, these credits reduced the Fund's custody expenses by $459.
In addition, during the period the investment adviser reimbursed and/or waived a portion of operating expenses in the amount of $8,472.
9. Other.
The Fund's organizational documents provide former and current trustees and officers with a limited indemnification against liabilities arising in connection with the performance of their duties to the Fund. In the normal course of business, the Fund may also enter into contracts that provide general indemnifications. The Fund's maximum exposure under these arrangements is unknown as this would be dependent on future claims that may be made against the Fund. The risk of material loss from such claims is considered remote.
At the end of the period, Strategic Advisers Fidelity International Fund was the owner of record of approximately 31% of the total outstanding shares of the Fund. Mutual funds managed by the investment adviser or its affiliates were the owners of record, in the aggregate, of approximately 33% of the total outstanding shares of the Fund.
Fidelity® Overseas Fund
Investment Summary (Unaudited)
Geographic Diversification (% of fund's net assets)
| As of April 30, 2019 |
| | United Kingdom | 16.8% |
| | Japan | 16.5% |
| | France | 10.5% |
| | United States of America* | 9.9% |
| | Netherlands | 8.2% |
| | Switzerland | 7.1% |
| | Germany | 6.6% |
| | Sweden | 3.1% |
| | Ireland | 2.9% |
| | Other | 18.4% |
* Includes Short-Term investments and Net Other Assets (Liabilities).
Percentages are based on country or territory of incorporation and are adjusted for the effect of futures contracts, if applicable.
Asset Allocation as of April 30, 2019
| | % of fund's net assets |
| Stocks | 95.3 |
| Investment Companies | 1.2 |
| Short-Term Investments and Net Other Assets (Liabilities) | 3.5 |
Top Ten Stocks as of April 30, 2019
| | % of fund's net assets |
| Roche Holding AG (participation certificate) (Switzerland, Pharmaceuticals) | 2.3 |
| AIA Group Ltd. (Hong Kong, Insurance) | 1.9 |
| Diageo PLC (United Kingdom, Beverages) | 1.9 |
| Unilever NV (Certificaten Van Aandelen) (Bearer) (Netherlands, Personal Products) | 1.8 |
| LVMH Moet Hennessy - Louis Vuitton SA (France, Textiles, Apparel & Luxury Goods) | 1.7 |
| SAP SE (Germany, Software) | 1.7 |
| Total SA (France, Oil, Gas & Consumable Fuels) | 1.6 |
| Prudential PLC (United Kingdom, Insurance) | 1.4 |
| Sanofi SA (France, Pharmaceuticals) | 1.3 |
| Heineken NV (Bearer) (Netherlands, Beverages) | 1.3 |
| | 16.9 |
Top Market Sectors as of April 30, 2019
| | % of fund's net assets |
| Financials | 21.2 |
| Industrials | 17.3 |
| Health Care | 14.5 |
| Information Technology | 13.4 |
| Consumer Staples | 11.9 |
| Consumer Discretionary | 7.8 |
| Materials | 3.3 |
| Communication Services | 3.2 |
| Energy | 2.7 |
Fidelity® Overseas Fund
Schedule of Investments April 30, 2019 (Unaudited)
Showing Percentage of Net Assets
| Common Stocks - 94.8% | | | |
| | | Shares | Value |
| Austria - 0.6% | | | |
| Erste Group Bank AG | | 1,126,000 | $45,086,301 |
| Bailiwick of Jersey - 1.6% | | | |
| Experian PLC | | 2,543,879 | 74,049,553 |
| Sanne Group PLC | | 5,891,754 | 48,094,623 |
|
| TOTAL BAILIWICK OF JERSEY | | | 122,144,176 |
|
| Belgium - 1.2% | | | |
| KBC Groep NV | | 1,264,154 | 93,608,116 |
| Bermuda - 2.1% | | | |
| Credicorp Ltd. (United States) | | 177,600 | 42,073,440 |
| Hiscox Ltd. | | 2,350,100 | 51,300,239 |
| IHS Markit Ltd. (a) | | 1,109,300 | 63,518,518 |
|
| TOTAL BERMUDA | | | 156,892,197 |
|
| Canada - 1.0% | | | |
| Constellation Software, Inc. | | 85,300 | 75,263,545 |
| Denmark - 1.0% | | | |
| DSV de Sammensluttede Vognmaend A/S | | 570,300 | 52,692,111 |
| Netcompany Group A/S (b) | | 637,687 | 22,743,400 |
|
| TOTAL DENMARK | | | 75,435,511 |
|
| France - 10.5% | | | |
| ALTEN | | 418,835 | 45,708,167 |
| Amundi SA (b) | | 608,006 | 43,678,227 |
| Capgemini SA | | 670,933 | 81,347,245 |
| Danone SA (c) | | 1,172,100 | 94,796,537 |
| Edenred SA | | 953,879 | 44,945,268 |
| Elior SA (b)(c) | | 1,161,000 | 16,068,872 |
| Essilor International SA | | 330,600 | 40,279,824 |
| LVMH Moet Hennessy - Louis Vuitton SA | | 331,763 | 130,255,876 |
| Sanofi SA | | 1,147,981 | 100,160,541 |
| SR Teleperformance SA | | 375,500 | 72,144,845 |
| Total SA | | 2,125,060 | 118,133,679 |
|
| TOTAL FRANCE | | | 787,519,081 |
|
| Germany - 6.1% | | | |
| adidas AG | | 294,342 | 75,633,697 |
| Axel Springer Verlag AG | | 285,642 | 16,178,991 |
| Bayer AG | | 670,788 | 44,644,795 |
| Deutsche Borse AG | | 456,500 | 60,998,606 |
| Deutsche Post AG | | 1,205,247 | 41,894,906 |
| Fresenius SE & Co. KGaA | | 571,596 | 32,426,943 |
| Hannover Reuck SE | | 418,400 | 63,070,888 |
| SAP SE | | 984,545 | 126,915,970 |
|
| TOTAL GERMANY | | | 461,764,796 |
|
| Hong Kong - 1.9% | | | |
| AIA Group Ltd. | | 13,902,000 | 142,348,634 |
| India - 1.5% | | | |
| Axis Bank Ltd. (a) | | 3,818,935 | 42,048,477 |
| HDFC Bank Ltd. sponsored ADR | | 434,000 | 49,758,100 |
| LIC Housing Finance Ltd. | | 3,321,700 | 23,691,681 |
|
| TOTAL INDIA | | | 115,498,258 |
|
| Indonesia - 0.3% | | | |
| PT Bank Rakyat Indonesia Tbk | | 86,301,400 | 26,465,763 |
| Ireland - 2.9% | | | |
| DCC PLC (United Kingdom) | | 760,912 | 67,947,859 |
| Kerry Group PLC Class A | | 635,948 | 71,185,272 |
| Kingspan Group PLC (Ireland) | | 789,480 | 41,511,339 |
| United Drug PLC (United Kingdom) | | 4,253,403 | 36,440,094 |
|
| TOTAL IRELAND | | | 217,084,564 |
|
| Italy - 1.3% | | | |
| FinecoBank SpA | | 2,899,200 | 38,159,201 |
| Recordati SpA | | 1,504,300 | 60,723,152 |
|
| TOTAL ITALY | | | 98,882,353 |
|
| Japan - 16.5% | | | |
| AEON Financial Service Co. Ltd. | | 1,781,900 | 36,775,332 |
| Daiichikosho Co. Ltd. | | 751,000 | 36,675,255 |
| Elecom Co. Ltd. | | 588,650 | 19,657,776 |
| Hoya Corp. | | 1,276,700 | 89,567,849 |
| Iriso Electronics Co. Ltd. | | 572,100 | 29,582,082 |
| Kao Corp. | | 880,900 | 67,667,860 |
| Keyence Corp. | | 152,080 | 94,364,824 |
| KH Neochem Co. Ltd. | | 1,534,600 | 44,428,251 |
| Miroku Jyoho Service Co., Ltd. | | 1,028,300 | 27,582,570 |
| Nakanishi, Inc. (d) | | 774,600 | 14,832,100 |
| Nitori Holdings Co. Ltd. | | 402,200 | 47,840,119 |
| NOF Corp. | | 1,082,100 | 38,419,188 |
| OBIC Co. Ltd. | | 484,700 | 55,956,210 |
| Olympus Corp. | | 4,631,600 | 51,723,241 |
| Oracle Corp. Japan | | 332,500 | 22,714,888 |
| ORIX Corp. | | 4,144,900 | 58,473,992 |
| Otsuka Corp. | | 1,162,600 | 45,608,528 |
| PALTAC Corp. | | 559,300 | 30,677,526 |
| Persol Holdings Co., Ltd. | | 2,245,900 | 42,016,748 |
| Recruit Holdings Co. Ltd. | | 2,107,200 | 62,972,923 |
| S Foods, Inc. | | 653,300 | 22,461,861 |
| Shiseido Co. Ltd. | | 864,500 | 67,657,534 |
| SMC Corp. | | 188,200 | 77,817,604 |
| Suzuki Motor Corp. | | 884,700 | 40,226,271 |
| Tsuruha Holdings, Inc. | | 520,400 | 44,240,657 |
| USS Co. Ltd. | | 1,731,800 | 33,051,814 |
| Welcia Holdings Co. Ltd. | | 943,600 | 37,059,563 |
|
| TOTAL JAPAN | | | 1,240,052,566 |
|
| Kenya - 0.4% | | | |
| Safaricom Ltd. | | 99,734,300 | 27,756,011 |
| Korea (South) - 0.3% | | | |
| LG Chemical Ltd. | | 77,240 | 23,954,811 |
| Mexico - 0.3% | | | |
| Grupo Financiero Banorte S.A.B. de CV Series O | | 3,664,400 | 23,162,298 |
| Netherlands - 8.2% | | | |
| ASML Holding NV (Netherlands) | | 437,400 | 91,023,668 |
| Grandvision NV (b) | | 1,531,600 | 34,459,922 |
| Heineken NV (Bearer) | | 880,500 | 95,043,622 |
| IMCD Group BV | | 1,109,378 | 89,588,042 |
| Koninklijke Philips Electronics NV | | 1,992,945 | 85,584,492 |
| QIAGEN NV (Germany) (a) | | 932,000 | 35,990,753 |
| Unilever NV (Certificaten Van Aandelen) (Bearer) | | 2,195,600 | 132,843,865 |
| Wolters Kluwer NV | | 745,500 | 51,991,981 |
|
| TOTAL NETHERLANDS | | | 616,526,345 |
|
| New Zealand - 0.4% | | | |
| EBOS Group Ltd. | | 2,294,501 | 32,826,091 |
| Norway - 1.9% | | | |
| Adevinta ASA: | | | |
| Class A (a) | | 1,674,100 | 16,885,659 |
| Class B | | 579,700 | 5,703,300 |
| Equinor ASA | | 3,696,359 | 82,453,597 |
| Schibsted ASA (A Shares) | | 1,422,700 | 37,334,239 |
|
| TOTAL NORWAY | | | 142,376,795 |
|
| Spain - 1.9% | | | |
| Amadeus IT Holding SA Class A | | 689,430 | 54,839,932 |
| CaixaBank SA | | 17,245,316 | 54,969,356 |
| Prosegur Cash SA (b) | | 15,610,356 | 33,476,396 |
|
| TOTAL SPAIN | | | 143,285,684 |
|
| Sweden - 3.1% | | | |
| Addlife AB | | 959,818 | 25,749,725 |
| AddTech AB (B Shares) | | 877,832 | 21,351,389 |
| Hexagon AB (B Shares) | | 1,028,800 | 56,205,641 |
| Indutrade AB | | 2,011,867 | 61,512,283 |
| Svenska Handelsbanken AB (A Shares) | | 4,788,400 | 52,304,162 |
| Swedbank AB (A Shares) | | 1,236,223 | 20,198,922 |
|
| TOTAL SWEDEN | | | 237,322,122 |
|
| Switzerland - 7.1% | | | |
| Alcon, Inc. (a)(c) | | 1,089,600 | 63,414,720 |
| Julius Baer Group Ltd. | | 970,359 | 46,873,100 |
| Lonza Group AG | | 221,105 | 68,283,704 |
| Roche Holding AG (participation certificate) | | 661,228 | 174,473,843 |
| Sika AG | | 452,149 | 69,223,459 |
| Sonova Holding AG Class B | | 203,270 | 40,995,127 |
| UBS Group AG | | 5,062,887 | 67,897,690 |
|
| TOTAL SWITZERLAND | | | 531,161,643 |
|
| Taiwan - 0.7% | | | |
| Taiwan Semiconductor Manufacturing Co. Ltd. | | 5,941,000 | 49,879,213 |
| United Kingdom - 16.8% | | | |
| Admiral Group PLC | | 1,446,900 | 41,584,137 |
| Ascential PLC | | 6,168,352 | 28,683,231 |
| Beazley PLC | | 6,119,700 | 45,965,311 |
| British American Tobacco PLC (United Kingdom) | | 479,160 | 18,758,609 |
| Cineworld Group PLC | | 12,442,939 | 51,597,384 |
| Compass Group PLC | | 3,805,494 | 86,589,678 |
| Cranswick PLC | | 817,761 | 30,903,123 |
| Dechra Pharmaceuticals PLC | | 839,295 | 29,112,122 |
| Diageo PLC | | 3,314,500 | 139,731,743 |
| Diploma PLC | | 2,543,897 | 53,075,867 |
| Hilton Food Group PLC | | 2,135,189 | 28,288,350 |
| InterContinental Hotel Group PLC | | 1,200,310 | 77,759,346 |
| Intertek Group PLC | | 900,945 | 62,853,527 |
| James Fisher and Sons PLC | | 1,005,258 | 25,823,872 |
| JTC PLC (b) | | 2,888,200 | 14,951,865 |
| London Stock Exchange Group PLC | | 982,630 | 64,424,469 |
| Mondi PLC | | 2,026,700 | 44,412,536 |
| Prudential PLC | | 4,561,871 | 103,652,012 |
| RELX PLC (London Stock Exchange) | | 2,477,100 | 56,818,134 |
| Rentokil Initial PLC | | 10,839,800 | 55,126,887 |
| Rolls-Royce Holdings PLC | | 3,725,092 | 44,609,965 |
| Rotork PLC | | 9,124,706 | 37,111,785 |
| Spectris PLC | | 1,079,044 | 38,666,376 |
| Ultra Electronics Holdings PLC | | 1,308,194 | 27,157,689 |
| Victrex PLC | | 1,040,368 | 32,993,482 |
| Volution Group PLC | | 9,088,967 | 20,503,982 |
|
| TOTAL UNITED KINGDOM | | | 1,261,155,482 |
|
| United States of America - 5.2% | | | |
| Alphabet, Inc. Class C (a) | | 31,593 | 37,547,649 |
| Becton, Dickinson & Co. | | 221,500 | 53,323,910 |
| Boston Scientific Corp. (a) | | 1,392,800 | 51,700,736 |
| Marsh & McLennan Companies, Inc. | | 694,000 | 65,437,260 |
| Moody's Corp. | | 207,900 | 40,877,298 |
| Roper Technologies, Inc. | | 133,900 | 48,163,830 |
| S&P Global, Inc. | | 240,641 | 53,099,843 |
| Total System Services, Inc. | | 427,200 | 43,676,928 |
|
| TOTAL UNITED STATES OF AMERICA | | | 393,827,454 |
|
| TOTAL COMMON STOCKS | | | |
| (Cost $5,700,241,574) | | | 7,141,279,810 |
|
| Nonconvertible Preferred Stocks - 0.5% | | | |
| Germany - 0.5% | | | |
| Henkel AG & Co. KGaA | | 364,944 | 36,937,144 |
| United Kingdom - 0.0% | | | |
| Rolls-Royce Holdings PLC (C Shares) (a) | | 264,481,532 | 344,884 |
| TOTAL NONCONVERTIBLE PREFERRED STOCKS | | | |
| (Cost $33,088,981) | | | 37,282,028 |
|
| Investment Companies - 1.2% | | | |
| United States of America - 1.2% | | | |
| iShares MSCI Japan ETF | | | |
| (Cost $85,095,943) | | 1,617,400 | 89,636,308 |
|
| Money Market Funds - 3.8% | | | |
| Fidelity Cash Central Fund, 2.49% (e) | | 247,215,475 | 247,264,918 |
| Fidelity Securities Lending Cash Central Fund 2.49% (e)(f) | | 39,021,388 | 39,025,290 |
| TOTAL MONEY MARKET FUNDS | | | |
| (Cost $286,284,309) | | | 286,290,208 |
| TOTAL INVESTMENT IN SECURITIES - 100.3% | | | |
| (Cost $6,104,710,807) | | | 7,554,488,354 |
| NET OTHER ASSETS (LIABILITIES) - (0.3)% | | | (25,403,392) |
| NET ASSETS - 100% | | | $7,529,084,962 |
Security Type Abbreviations
ETF – Exchange-Traded Fund
Categorizations in the Schedule of Investments are based on country or territory of incorporation.
Legend
(a) Non-income producing
(b) Security exempt from registration under Rule 144A of the Securities Act of 1933. These securities may be resold in transactions exempt from registration, normally to qualified institutional buyers. At the end of the period, the value of these securities amounted to $165,378,682 or 2.2% of net assets.
(c) Security or a portion of the security is on loan at period end.
(d) A portion of the security sold on a delayed delivery basis.
(e) Affiliated fund that is generally available only to investment companies and other accounts managed by Fidelity Investments. The rate quoted is the annualized seven-day yield of the fund at period end. A complete unaudited listing of the fund's holdings as of its most recent quarter end is available upon request. In addition, each Fidelity Central Fund's financial statements are available on the SEC's website or upon request.
(f) Investment made with cash collateral received from securities on loan.
Affiliated Central Funds
Information regarding fiscal year to date income earned by the Fund from investments in Fidelity Central Funds is as follows:
| Fund | Income earned |
| Fidelity Cash Central Fund | $2,489,658 |
| Fidelity Securities Lending Cash Central Fund | 707,037 |
| Total | $3,196,695 |
Amounts in the income column in the above table include any capital gain distributions from underlying funds, which are presented in the corresponding line-item in the Statement of Operations, if applicable.
Investment Valuation
The following is a summary of the inputs used, as of April 30, 2019, involving the Fund's assets and liabilities carried at fair value. The inputs or methodology used for valuing securities may not be an indication of the risk associated with investing in those securities. For more information on valuation inputs, and their aggregation into the levels used below, please refer to the Investment Valuation section in the accompanying Notes to Financial Statements.
| | Valuation Inputs at Reporting Date: |
| Description | Total | Level 1 | Level 2 | Level 3 |
| Investments in Securities: | | | | |
| Equities: | | | | |
| Communication Services | $235,772,760 | $235,772,760 | $-- | $-- |
| Consumer Discretionary | 612,842,945 | 355,717,567 | 257,125,378 | -- |
| Consumer Staples | 887,575,740 | 501,444,986 | 386,130,754 | -- |
| Energy | 200,587,276 | 82,453,597 | 118,133,679 | -- |
| Financials | 1,594,505,739 | 1,048,736,478 | 545,769,261 | -- |
| Health Care | 1,091,973,938 | 604,895,542 | 487,078,396 | -- |
| Industrials | 1,297,545,791 | 1,054,127,695 | 243,418,096 | -- |
| Information Technology | 1,004,325,922 | 771,325,098 | 233,000,824 | -- |
| Materials | 253,431,727 | 253,431,727 | -- | -- |
| Investment Companies | 89,636,308 | 89,636,308 | -- | -- |
| Money Market Funds | 286,290,208 | 286,290,208 | -- | -- |
| Total Investments in Securities: | $7,554,488,354 | $5,283,831,966 | $2,270,656,388 | $-- |
See accompanying notes which are an integral part of the financial statements.
Fidelity® Overseas Fund
Financial Statements
Statement of Assets and Liabilities
| | | April 30, 2019 (Unaudited) |
| Assets | | |
Investment in securities, at value (including securities loaned of $37,784,405) — See accompanying schedule:
Unaffiliated issuers (cost $5,818,426,498) | $7,268,198,146 | |
| Fidelity Central Funds (cost $286,284,309) | 286,290,208 | |
| Total Investment in Securities (cost $6,104,710,807) | | $7,554,488,354 |
| Foreign currency held at value (cost $264,402) | | 263,507 |
| Receivable for investments sold | | |
| Regular delivery | | 1,247,370 |
| Delayed delivery | | 52,322 |
| Receivable for fund shares sold | | 5,289,149 |
| Dividends receivable | | 32,542,597 |
| Distributions receivable from Fidelity Central Funds | | 532,934 |
| Prepaid expenses | | 3,530 |
| Other receivables | | 840,828 |
| Total assets | | 7,595,260,591 |
| Liabilities | | |
| Payable for fund shares redeemed | $20,816,804 | |
| Accrued management fee | 4,441,403 | |
| Other affiliated payables | 1,010,238 | |
| Other payables and accrued expenses | 881,894 | |
| Collateral on securities loaned | 39,025,290 | |
| Total liabilities | | 66,175,629 |
| Net Assets | | $7,529,084,962 |
| Net Assets consist of: | | |
| Paid in capital | | $6,178,776,380 |
| Total distributable earnings (loss) | | 1,350,308,582 |
| Net Assets | | $7,529,084,962 |
| Net Asset Value and Maximum Offering Price | | |
| Overseas: | | |
| Net Asset Value, offering price and redemption price per share ($6,408,071,554 ÷ 135,301,067 shares) | | $47.36 |
| Class K: | | |
| Net Asset Value, offering price and redemption price per share ($1,121,013,408 ÷ 23,725,500 shares) | | $47.25 |
See accompanying notes which are an integral part of the financial statements.
Statement of Operations
| | | Six months ended April 30, 2019 (Unaudited) |
| Investment Income | | |
| Dividends | | $72,859,506 |
| Non-Cash dividends | | 17,486,694 |
| Income from Fidelity Central Funds | | 3,196,695 |
| Income before foreign taxes withheld | | 93,542,895 |
| Less foreign taxes withheld | | (7,206,459) |
| Total income | | 86,336,436 |
| Expenses | | |
| Management fee | | |
| Basic fee | $22,949,193 | |
| Performance adjustment | 135,386 | |
| Transfer agent fees | 4,985,007 | |
| Accounting and security lending fees | 824,640 | |
| Custodian fees and expenses | 342,235 | |
| Independent trustees' fees and expenses | 19,114 | |
| Registration fees | 87,458 | |
| Audit | 59,498 | |
| Legal | 21,833 | |
| Miscellaneous | 22,029 | |
| Total expenses before reductions | 29,446,393 | |
| Expense reductions | (855,848) | |
| Total expenses after reductions | | 28,590,545 |
| Net investment income (loss) | | 57,745,891 |
| Realized and Unrealized Gain (Loss) | | |
| Net realized gain (loss) on: | | |
| Investment securities: | | |
| Unaffiliated issuers | (127,840,854) | |
| Fidelity Central Funds | (6,361) | |
| Foreign currency transactions | (964,395) | |
| Futures contracts | (12,149,423) | |
| Total net realized gain (loss) | | (140,961,033) |
| Change in net unrealized appreciation (depreciation) on: | | |
| Investment securities: | | |
| Unaffiliated issuers (net of increase in deferred foreign taxes of $320,154) | 698,387,662 | |
| Fidelity Central Funds | 5,899 | |
| Assets and liabilities in foreign currencies | (184,140) | |
| Total change in net unrealized appreciation (depreciation) | | 698,209,421 |
| Net gain (loss) | | 557,248,388 |
| Net increase (decrease) in net assets resulting from operations | | $614,994,279 |
See accompanying notes which are an integral part of the financial statements.
Statement of Changes in Net Assets
| | Six months ended April 30, 2019 (Unaudited) | Year ended October 31, 2018 |
| Increase (Decrease) in Net Assets | | |
| Operations | | |
| Net investment income (loss) | $57,745,891 | $104,135,973 |
| Net realized gain (loss) | (140,961,033) | 253,305,070 |
| Change in net unrealized appreciation (depreciation) | 698,209,421 | (873,865,473) |
| Net increase (decrease) in net assets resulting from operations | 614,994,279 | (516,424,430) |
| Distributions to shareholders | (357,799,774) | (89,089,141) |
| Share transactions - net increase (decrease) | 420,042,774 | (528,598,495) |
| Total increase (decrease) in net assets | 677,237,279 | (1,134,112,066) |
| Net Assets | | |
| Beginning of period | 6,851,847,683 | 7,985,959,749 |
| End of period | $7,529,084,962 | $6,851,847,683 |
See accompanying notes which are an integral part of the financial statements.
Fidelity Overseas Fund
| | Six months ended (Unaudited) April 30, | Years endedOctober 31, | | | | |
| | 2019 | 2018 | 2017 | 2016 | 2015 | 2014 |
| Selected Per–Share Data | | | | | | |
| Net asset value, beginning of period | $46.04 | $50.18 | $40.73 | $41.56 | $39.02 | $39.22 |
| Income from Investment Operations | | | | | | |
| Net investment income (loss)A | .37 | .68 | .58 | .75B | .52 | .77C |
| Net realized and unrealized gain (loss) | 3.37 | (4.27) | 9.65 | (1.15) | 2.69 | (.28) |
| Total from investment operations | 3.74 | (3.59) | 10.23 | (.40) | 3.21 | .49 |
| Distributions from net investment income | (.68) | (.52) | (.72) | (.43) | (.67) | (.51) |
| Distributions from net realized gain | (1.74) | (.03) | (.05) | (.01) | – | (.18) |
| Total distributions | (2.42) | (.55) | (.78)D | (.43)E | (.67) | (.69) |
| Redemption fees added to paid in capitalA | – | – | –F | –F | –F | –F |
| Net asset value, end of period | $47.36 | $46.04 | $50.18 | $40.73 | $41.56 | $39.02 |
| Total ReturnG,H | 8.84% | (7.23)% | 25.63% | (.97)% | 8.34% | 1.27% |
| Ratios to Average Net AssetsI,J | | | | | | |
| Expenses before reductions | .87%K | .97% | 1.00% | 1.03% | 1.04% | 1.04% |
| Expenses net of fee waivers, if any | .87%K | .97% | 1.00% | 1.03% | 1.04% | 1.04% |
| Expenses net of all reductions | .84%K | .96% | 1.00% | 1.03% | 1.03% | 1.04% |
| Net investment income (loss) | 1.65%K | 1.35% | 1.30% | 1.88%B | 1.28% | 1.93%C |
| Supplemental Data | | | | | | |
| Net assets, end of period (000 omitted) | $6,408,072 | $5,825,757 | $6,828,078 | $4,569,084 | $3,844,290 | $2,738,667 |
| Portfolio turnover rateL | 61%K | 33% | 26%M | 33% | 28% | 41% |
A Calculated based on average shares outstanding during the period.
B Net investment income per share reflects a large, non-recurring dividend which amounted to $.18 per share. Excluding this non-recurring dividend, the ratio of net investment income (loss) to average net assets would have been 1.42%.
C Net investment income per share reflects a large, non-recurring dividend which amounted to $.24 per share. Excluding this non-recurring dividend, the ratio of net investment income (loss) to average net assets would have been 1.34%.
D Total distributions of $.78 per share is comprised of distributions from net investment income of $.723 and distributions from net realized gain of $.052 per share.
E Total distributions of $.43 per share is comprised of distributions from net investment income of $.428 and distributions from net realized gain of $.006 per share.
F Amount represents less than $.005 per share.
G Total returns for periods of less than one year are not annualized.
H Total returns would have been lower if certain expenses had not been reduced during the applicable periods shown.
I Fees and expenses of any underlying Fidelity Central Funds are not included in the Fund's expense ratio. The Fund indirectly bears its proportionate share of the expenses of any underlying Fidelity Central Funds.
J Expense ratios reflect operating expenses of the class. Expenses before reductions do not reflect amounts reimbursed by the investment adviser or reductions from brokerage service arrangements or reductions from other expense offset arrangements and do not represent the amount paid by the class during periods when reimbursements or reductions occur. Expenses net of fee waivers reflect expenses after reimbursement by the investment adviser but prior to reductions from brokerage service arrangements or other expense offset arrangements. Expenses net of all reductions represent the net expenses paid by the class.
K Annualized
L Amount does not include the portfolio activity of any underlying Fidelity Central Funds.
M Portfolio turnover rate excludes securities received or delivered in-kind.
See accompanying notes which are an integral part of the financial statements.
Fidelity Overseas Fund Class K
| | Six months ended (Unaudited) April 30, | Years endedOctober 31, | | | | |
| | 2019 | 2018 | 2017 | 2016 | 2015 | 2014 |
| Selected Per–Share Data | | | | | | |
| Net asset value, beginning of period | $45.98 | $50.11 | $40.67 | $41.49 | $38.96 | $39.17 |
| Income from Investment Operations | | | | | | |
| Net investment income (loss)A | .39 | .73 | .64 | .80B | .57 | .82C |
| Net realized and unrealized gain (loss) | 3.36 | (4.26) | 9.62 | (1.14) | 2.68 | (.28) |
| Total from investment operations | 3.75 | (3.53) | 10.26 | (.34) | 3.25 | .54 |
| Distributions from net investment income | (.73) | (.57) | (.77) | (.47) | (.72) | (.58) |
| Distributions from net realized gain | (1.74) | (.03) | (.05) | (.01) | – | (.18) |
| Total distributions | (2.48)D | (.60) | (.82) | (.48) | (.72) | (.75)E |
| Redemption fees added to paid in capitalA | – | – | –F | –F | –F | –F |
| Net asset value, end of period | $47.25 | $45.98 | $50.11 | $40.67 | $41.49 | $38.96 |
| Total ReturnG,H | 8.88% | (7.13)% | 25.80% | (.85)% | 8.47% | 1.41% |
| Ratios to Average Net AssetsI,J | | | | | | |
| Expenses before reductions | .75%K | .86% | .89% | .91% | .91% | .90% |
| Expenses net of fee waivers, if any | .75%K | .86% | .89% | .91% | .91% | .90% |
| Expenses net of all reductions | .73%K | .85% | .88% | .90% | .90% | .90% |
| Net investment income (loss) | 1.76%K | 1.46% | 1.42% | 2.00%B | 1.40% | 2.06%C |
| Supplemental Data | | | | | | |
| Net assets, end of period (000 omitted) | $1,121,013 | $1,026,091 | $1,157,882 | $744,679 | $691,585 | $626,817 |
| Portfolio turnover rateL | 61%K | 33% | 26%M | 33% | 28% | 41% |
A Calculated based on average shares outstanding during the period.
B Net investment income per share reflects a large, non-recurring dividend which amounted to $.18 per share. Excluding this non-recurring dividend, the ratio of net investment income (loss) to average net assets would have been 1.55%.
C Net investment income per share reflects a large, non-recurring dividend which amounted to $.24 per share. Excluding this non-recurring dividend, the ratio of net investment income (loss) to average net assets would have been 1.47%.
D Total distributions of $2.48 per share is comprised of distributions from net investment income of $.733 and distributions from net realized gain of $1.744 per share.
E Total distributions of $.75 per share is comprised of distributions from net investment income of $.575 and distributions from net realized gain of $.177 per share.
F Amount represents less than $.005 per share.
G Total returns for periods of less than one year are not annualized.
H Total returns would have been lower if certain expenses had not been reduced during the applicable periods shown.
I Fees and expenses of any underlying Fidelity Central Funds are not included in the Fund's expense ratio. The Fund indirectly bears its proportionate share of the expenses of any underlying Fidelity Central Funds.
J Expense ratios reflect operating expenses of the class. Expenses before reductions do not reflect amounts reimbursed by the investment adviser or reductions from brokerage service arrangements or reductions from other expense offset arrangements and do not represent the amount paid by the class during periods when reimbursements or reductions occur. Expenses net of fee waivers reflect expenses after reimbursement by the investment adviser but prior to reductions from brokerage service arrangements or other expense offset arrangements. Expenses net of all reductions represent the net expenses paid by the class.
K Annualized
L Amount does not include the portfolio activity of any underlying Fidelity Central Funds.
M Portfolio turnover rate excludes securities received or delivered in-kind.
See accompanying notes which are an integral part of the financial statements.
Notes to Financial Statements (Unaudited)
For the period ended April 30, 2019
1. Organization.
Fidelity Overseas Fund (the Fund) is a fund of Fidelity Investment Trust (the Trust) and is authorized to issue an unlimited number of shares. The Trust is registered under the Investment Company Act of 1940, as amended (the 1940 Act), as an open-end management investment company organized as a Massachusetts business trust. The Fund offers Overseas and Class K shares, each of which has equal rights as to assets and voting privileges. Each class has exclusive voting rights with respect to matters that affect that class.
2. Investments in Fidelity Central Funds.
The Fund invests in Fidelity Central Funds, which are open-end investment companies generally available only to other investment companies and accounts managed by the investment adviser and its affiliates. The Fund's Schedule of Investments lists each of the Fidelity Central Funds held as of period end, if any, as an investment of the Fund, but does not include the underlying holdings of each Fidelity Central Fund. As an Investing Fund, the Fund indirectly bears its proportionate share of the expenses of the underlying Fidelity Central Funds.
The Money Market Central Funds seek preservation of capital and current income and are managed by Fidelity Investments Money Management, Inc. (FIMM), an affiliate of the investment adviser. Annualized expenses of the Money Market Central Funds as of their most recent shareholder report date are less than .005%.
A complete unaudited list of holdings for each Fidelity Central Fund is available upon request or at the Securities and Exchange Commission (the SEC) website at www.sec.gov. In addition, the financial statements of the Fidelity Central Funds are available on the SEC website or upon request.
3. Significant Accounting Policies.
The Fund is an investment company and applies the accounting and reporting guidance of the Financial Accounting Standards Board (FASB) Accounting Standards Codification Topic 946 Financial Services – Investments Companies. The financial statements have been prepared in conformity with accounting principles generally accepted in the United States of America (GAAP), which require management to make certain estimates and assumptions at the date of the financial statements. Actual results could differ from those estimates. Subsequent events, if any, through the date that the financial statements were issued have been evaluated in the preparation of the financial statements. The following summarizes the significant accounting policies of the Fund:
Investment Valuation. Investments are valued as of 4:00 p.m. Eastern time on the last calendar day of the period. The Board of Trustees (the Board) has delegated the day to day responsibility for the valuation of the Fund's investments to the Fair Value Committee (the Committee) established by the Fund's investment adviser. In accordance with valuation policies and procedures approved by the Board, the Fund attempts to obtain prices from one or more third party pricing vendors or brokers to value its investments. When current market prices, quotations or currency exchange rates are not readily available or reliable, investments will be fair valued in good faith by the Committee, in accordance with procedures adopted by the Board. Factors used in determining fair value vary by investment type and may include market or investment specific events. The frequency with which these procedures are used cannot be predicted and they may be utilized to a significant extent. The Committee oversees the Fund's valuation policies and procedures and reports to the Board on the Committee's activities and fair value determinations. The Board monitors the appropriateness of the procedures used in valuing the Fund's investments and ratifies the fair value determinations of the Committee.
The Fund categorizes the inputs to valuation techniques used to value its investments into a disclosure hierarchy consisting of three levels as shown below:
- Level 1 – quoted prices in active markets for identical investments
- Level 2 – other significant observable inputs (including quoted prices for similar investments, interest rates, prepayment speeds, etc.)
- Level 3 – unobservable inputs (including the Fund's own assumptions based on the best information available)
Valuation techniques used to value the Fund's investments by major category are as follows:
Equity securities, including restricted securities, for which market quotations are readily available, are valued at the last reported sale price or official closing price as reported by a third party pricing vendor on the primary market or exchange on which they are traded and are categorized as Level 1 in the hierarchy. In the event there were no sales during the day or closing prices are not available, securities are valued at the last quoted bid price or may be valued using the last available price and are generally categorized as Level 2 in the hierarchy. For foreign equity securities, when market or security specific events arise, comparisons to the valuation of American Depositary Receipts (ADRs), futures contracts, Exchange-Traded Funds (ETFs) and certain indexes as well as quoted prices for similar securities may be used and would be categorized as Level 2 in the hierarchy. For equity securities, including restricted securities, where observable inputs are limited, assumptions about market activity and risk are used and these securities may be categorized as Level 3 in the hierarchy.
ETFs are valued at their last sale price or official closing price as reported by a third party pricing vendor on the primary market or exchange on which they are traded and are categorized as Level 1 in the hierarchy. In the event there were no sales during the day but the exchange reports a closing bid level, ETFs are valued at the closing bid and would be categorized as Level 1 in the hierarchy. In the event there was no closing bid, ETFs may be valued by another method that the Board believes reflects fair value in accordance with the Board's fair value pricing policies and may be categorized as Level 2 in the hierarchy.
Investments in open-end mutual funds, including the Fidelity Central Funds, are valued at their closing net asset value (NAV) each business day and are categorized as Level 1 in the hierarchy.
Changes in valuation techniques may result in transfers in or out of an assigned level within the disclosure hierarchy. The aggregate value of investments by input level as of April 30, 2019 is included at the end of the Fund's Schedule of Investments.
Foreign Currency. The Fund may use foreign currency contracts to facilitate transactions in foreign-denominated securities. Gains and losses from these transactions may arise from changes in the value of the foreign currency or if the counterparties do not perform under the contracts' terms.
Foreign-denominated assets, including investment securities, and liabilities are translated into U.S. dollars at the exchange rates at period end. Purchases and sales of investment securities, income and dividends received and expenses denominated in foreign currencies are translated into U.S. dollars at the exchange rate in effect on the transaction date.
The effects of exchange rate fluctuations on investments are included with the net realized and unrealized gain (loss) on investment securities. Other foreign currency transactions resulting in realized and unrealized gain (loss) are disclosed separately.
Investment Transactions and Income. For financial reporting purposes, the Fund's investment holdings and NAV include trades executed through the end of the last business day of the period. The NAV per share for processing shareholder transactions is calculated as of the close of business of the New York Stock Exchange (NYSE), normally 4:00 p.m. Eastern time and includes trades executed through the end of the prior business day. Gains and losses on securities sold are determined on the basis of identified cost and include proceeds received from litigation. Dividend income is recorded on the ex-dividend date, except for certain dividends from foreign securities where the ex-dividend date may have passed, which are recorded as soon as the Fund is informed of the ex-dividend date. Non-cash dividends included in dividend income, if any, are recorded at the fair market value of the securities received. Income and capital gain distributions from Fidelity Central Funds, if any, are recorded on the ex-dividend date. Certain distributions received by the Fund represent a return of capital or capital gain. The Fund determines the components of these distributions subsequent to the ex-dividend date, based upon receipt of tax filings or other correspondence relating to the underlying investment. These distributions are recorded as a reduction of cost of investments and/or as a realized gain. Investment income is recorded net of foreign taxes withheld where recovery of such taxes is uncertain.
Class Allocations and Expenses. Investment income, realized and unrealized capital gains and losses, common expenses of the Fund, and certain fund-level expense reductions, if any, are allocated daily on a pro-rata basis to each class based on the relative net assets of each class to the total net assets of the Fund. Each class differs with respect to transfer agent fees incurred. Certain expense reductions may also differ by class. For the reporting period, the allocated portion of income and expenses to each class as a percent of its average net assets may vary due to the timing of recording these transactions in relation to fluctuating net assets of the classes. Expenses directly attributable to a fund are charged to that fund. Expenses attributable to more than one fund are allocated among the respective funds on the basis of relative net assets or other appropriate methods. Expense estimates are accrued in the period to which they relate and adjustments are made when actual amounts are known.
Deferred Trustee Compensation. Under a Deferred Compensation Plan (the Plan) for the Fund, certain independent Trustees have elected to defer receipt of a portion of their annual compensation. Deferred amounts are invested in a cross-section of Fidelity funds, are marked-to-market and remain in the Fund until distributed in accordance with the Plan. The investment of deferred amounts and the offsetting payable to the Trustees of $294,747 are included in the accompanying Statement of Assets and Liabilities in other receivables and other payables and accrued expenses, respectively.
Income Tax Information and Distributions to Shareholders. Each year, the Fund intends to qualify as a regulated investment company under Subchapter M of the Internal Revenue Code, including distributing substantially all of its taxable income and realized gains. As a result, no provision for U.S. Federal income taxes is required. The Fund files a U.S. federal tax return, in addition to state and local tax returns as required. The Fund's federal income tax returns are subject to examination by the Internal Revenue Service (IRS) for a period of three fiscal years after they are filed. State and local tax returns may be subject to examination for an additional fiscal year depending on the jurisdiction. Foreign taxes are provided for based on the Fund's understanding of the tax rules and rates that exist in the foreign markets in which it invests. The Fund is subject to a tax imposed on capital gains by certain countries in which it invests. An estimated deferred tax liability for net unrealized appreciation on the applicable securities is included in Other payables and accrued expenses on the Statement of Assets & Liabilities.
Distributions are declared and recorded on the ex-dividend date. Income and capital gain distributions are declared separately for each class. Income and capital gain distributions are determined in accordance with income tax regulations, which may differ from GAAP.
Capital accounts within the financial statements are adjusted for permanent book-tax differences. These adjustments have no impact on net assets or the results of operations. Capital accounts are not adjusted for temporary book-tax differences which will reverse in a subsequent period.
Book-tax differences are primarily due to foreign currency transactions, passive foreign investment companies (PFIC), deferred trustees compensation and losses deferred due to wash sales.
As of period end, the cost and unrealized appreciation (depreciation) in securities, and derivatives if applicable, for federal income tax purposes were as follows:
| Gross unrealized appreciation | $1,589,034,728 |
| Gross unrealized depreciation | (141,787,508) |
| Net unrealized appreciation (depreciation) | $1,447,247,220 |
| Tax cost | $6,107,241,134 |
Delayed Delivery Transactions and When-Issued Securities. During the period, the Fund transacted in securities on a delayed delivery or when-issued basis. Payment and delivery may take place after the customary settlement period for that security. The price of the underlying securities and the date when the securities will be delivered and paid for are fixed at the time the transaction is negotiated. Losses may arise due to changes in the value of the underlying securities or if the counterparty does not perform under the contract's terms, or if the issuer does not issue the securities due to political, economic, or other factors.
Restricted Securities. The Fund may invest in securities that are subject to legal or contractual restrictions on resale. These securities generally may be resold in transactions exempt from registration or to the public if the securities are registered. Disposal of these securities may involve time-consuming negotiations and expense, and prompt sale at an acceptable price may be difficult. Information regarding restricted securities is included at the end of the Fund's Schedule of Investments.
4. Derivative Instruments.
Risk Exposures and the Use of Derivative Instruments. The Fund's investment objective allows the Fund to enter into various types of derivative contracts, including futures contracts. Derivatives are investments whose value is primarily derived from underlying assets, indices or reference rates and may be transacted on an exchange or over-the-counter (OTC). Derivatives may involve a future commitment to buy or sell a specified asset based on specified terms, to exchange future cash flows at periodic intervals based on a notional principal amount, or for one party to make one or more payments upon the occurrence of specified events in exchange for periodic payments from the other party.
The Fund used derivatives to increase returns and to manage exposure to certain risks as defined below. The success of any strategy involving derivatives depends on analysis of numerous economic factors, and if the strategies for investment do not work as intended, the Fund may not achieve its objectives.
The Fund's use of derivatives increased or decreased its exposure to the following risk:
| Equity Risk | Equity risk relates to the fluctuations in the value of financial instruments as a result of changes in market prices (other than those arising from interest rate risk or foreign exchange risk), whether caused by factors specific to an individual investment, its issuer, or all factors affecting all instruments traded in a market or market segment.
|
The Fund is also exposed to additional risks from investing in derivatives, such as liquidity risk and counterparty credit risk. Liquidity risk is the risk that the Fund will be unable to close out the derivative in the open market in a timely manner. Counterparty credit risk is the risk that the counterparty will not be able to fulfill its obligation to the Fund. Counterparty credit risk related to exchange-traded futures contracts may be mitigated by the protection provided by the exchange on which they trade.
Investing in derivatives may involve greater risks than investing in the underlying assets directly and, to varying degrees, may involve risk of loss in excess of any initial investment and collateral received and amounts recognized in the Statement of Assets and Liabilities. In addition, there may be the risk that the change in value of the derivative contract does not correspond to the change in value of the underlying instrument.
Futures Contracts. A futures contract is an agreement between two parties to buy or sell a specified underlying instrument for a fixed price at a specified future date. The Fund used futures contracts to manage its exposure to the stock market.
Upon entering into a futures contract, a fund is required to deposit either cash or securities (initial margin) with a clearing broker in an amount equal to a certain percentage of the face value of the contract. Futures contracts are marked-to-market daily and subsequent daily payments (variation margin) are made or received by a fund depending on the daily fluctuations in the value of the futures contracts and are recorded as unrealized appreciation or (depreciation). This receivable and/or payable, if any, is included in daily variation margin on futures contracts in the Statement of Assets and Liabilities. Realized gain or (loss) is recorded upon the expiration or closing of a futures contract. The net realized gain (loss) and change in net unrealized appreciation (depreciation) on futures contracts during the period is presented in the Statement of Operations.
Any open futures contracts at period end are presented in the Schedule of Investments under the caption "Futures Contracts". The notional amount at value reflects each contract's exposure to the underlying instrument or index at period end.
5. Purchases and Sales of Investments.
Purchases and sales of securities, other than short-term securities, aggregated $2,097,129,190 and $2,050,509,358, respectively.
6. Fees and Other Transactions with Affiliates.
Management Fee. Fidelity Management & Research Company (the investment adviser) and its affiliates provide the Fund with investment management related services for which the Fund pays a monthly management fee. The management fee is the sum of an individual fund fee rate that is based on an annual rate of .424% of the Fund's average net assets and an annualized group fee rate that averaged .24% during the period. The group fee rate is based upon the average net assets of all the mutual funds advised by the investment adviser, including any mutual funds previously advised by the investment adviser that are currently advised by Fidelity SelectCo, LLC, an affiliate of the investment adviser. The group fee rate decreases as assets under management increase and increases as assets under management decrease. In addition, the management fee is subject to a performance adjustment (up to a maximum of +/- .20% of the Fund's average net assets over a 36 month performance period). The upward or downward adjustment to the management fee is based on the relative investment performance of Overseas as compared to its benchmark index, the MSCI EAFE Index, over the same 36 month performance period. For the reporting period, the total annualized management fee rate, including the performance adjustment, was .67% of the Fund's average net assets. The performance adjustment included in the management fee rate may be higher or lower than the maximum performance adjustment rate due to the difference between the average net assets for the reporting and performance periods.
Transfer Agent Fees. Fidelity Investments Institutional Operations Company, Inc., (FIIOC), an affiliate of the investment adviser, is the transfer, dividend disbursing and shareholder servicing agent for each class of the Fund. FIIOC receives account fees and asset-based fees that vary according to the account size and type of account of the shareholders of Overseas. FIIOC receives an asset-based fee of Class K's average net assets. FIIOC pays for typesetting, printing and mailing of shareholder reports, except proxy statements.
For the period, transfer agent fees for each class were as follows:
| | Amount | % of Class-Level Average Net Assets(a) |
| Overseas | $4,745,274 | .16 |
| Class K | 239,733 | .05 |
| | $4,985,007 | |
(a) Annualized
Accounting and Security Lending Fees. Fidelity Service Company, Inc. (FSC), an affiliate of the investment adviser, maintains the Fund's accounting records. The accounting fee is based on the level of average net assets for each month. Prior to April 1, 2019, FSC had a separate agreement with the Fund for administration of the security lending program, based on the number and duration of lending transactions. For the period, the total fees paid for accounting and administration of securities lending were equivalent to an annualized rate of .02%.
Brokerage Commissions. The Fund placed a portion of its portfolio transactions with brokerage firms which are affiliates of the investment adviser. Brokerage commissions are included in net realized gain (loss) and change in net unrealized appreciation (depreciation) in the Statement of Operations. The commissions paid to these affiliated firms were $4,428 for the period.
Interfund Trades. The Fund may purchase from or sell securities to other Fidelity Funds under procedures adopted by the Board. The procedures have been designed to ensure these interfund trades are executed in accordance with Rule 17a-7 of the 1940 Act. Interfund trades are included within the respective purchases and sales amounts shown in the Purchases and Sales of Investments note.
7. Committed Line of Credit.
The Fund participates with other funds managed by the investment adviser or an affiliate in a $4.25 billion credit facility (the "line of credit") to be utilized for temporary or emergency purposes to fund shareholder redemptions or for other short-term liquidity purposes. The Fund has agreed to pay commitment fees on its pro-rata portion of the line of credit, which amounted to $9,817 and is reflected in Miscellaneous expenses on the Statement of Operations. During the period, the Fund did not borrow on this line of credit.
8. Security Lending.
The Fund lends portfolio securities through a lending agent from time to time in order to earn additional income. For equity securities, a lending agent is used and may loan securities to certain qualified borrowers, including Fidelity Capital Markets (FCM), a broker-dealer affiliated with the Fund. On the settlement date of the loan, the Fund receives collateral (in the form of U.S. Treasury obligations, letters of credit and/or cash) against the loaned securities and maintains collateral in an amount not less than 100% of the market value of the loaned securities during the period of the loan. The market value of the loaned securities is determined at the close of business of the Fund and any additional required collateral is delivered to the Fund on the next business day. The Fund or borrower may terminate the loan at any time, and if the borrower defaults on its obligation to return the securities loaned because of insolvency or other reasons, the Fund may apply collateral received from the borrower against the obligation. The Fund may experience delays and costs in recovering the securities loaned. Any cash collateral received is invested in the Fidelity Securities Lending Cash Central Fund. The value of loaned securities and cash collateral at period end are disclosed on the Fund's Statement of Assets and Liabilities. Security lending income represents the income earned on investing cash collateral, less rebates paid to borrowers and any lending agent fees associated with the loan, plus any premium payments received for lending certain types of securities. Security lending income is presented in the Statement of Operations as a component of income from Fidelity Central Funds. Total security lending income during the period amounted to $707,037. During the period, there were no securities loaned to FCM.
9. Expense Reductions.
Commissions paid to certain brokers with whom the investment adviser, or its affiliates, places trades on behalf of the Fund include an amount in addition to trade execution, which may be rebated back to the Fund to offset certain expenses. This amount totaled $829,656 for the period. In addition, through arrangements with the Fund's custodian, credits realized as a result of certain uninvested cash balances were used to reduce the Fund's expenses. During the period, these credits reduced the Fund's custody expenses by $686.
In addition, during the period the investment adviser reimbursed and/or waived a portion of fund-level operating expenses in the amount of $25,506.
10. Distributions to Shareholders.
Distributions to shareholders of each class were as follows:
| | Six months ended
April 30, 2019 | Year ended
October 31, 2018 |
| Distributions to shareholders | | |
| Overseas | $302,291,778 | $74,926,544 |
| Class K | 55,507,996 | 14,162,597 |
| Total | $357,799,774 | $89,089,141 |
11. Share Transactions.
Share transactions for each class were as follows and may contain automatic conversions between classes or exchanges between affiliated funds:
| | Shares | Shares | Dollars | Dollars |
| | Six months ended April 30, 2019 | Year ended October 31, 2018 | Six months ended April 30, 2019 | Year ended October 31, 2018 |
| Overseas | | | | |
| Shares sold | 19,209,409 | 29,404,571 | $835,672,323 | $1,465,217,884 |
| Reinvestment of distributions | 6,585,978 | 1,397,531 | 274,832,872 | 69,429,338 |
| Shares redeemed | (17,021,209) | (40,342,442) | (748,953,322) | (2,020,744,759) |
| Net increase (decrease) | 8,774,178 | (9,540,340) | $361,551,873 | $(486,097,537) |
| Class K | | | | |
| Shares sold | 2,954,872 | 6,397,391 | $130,696,982 | $319,720,787 |
| Reinvestment of distributions | 1,333,686 | 285,767 | 55,507,996 | 14,162,597 |
| Shares redeemed | (2,880,602) | (7,474,394) | (127,714,077) | (376,384,342) |
| Net increase (decrease) | 1,407,956 | (791,236) | $58,490,901 | $(42,500,958) |
12. Other.
The Fund's organizational documents provide former and current trustees and officers with a limited indemnification against liabilities arising in connection with the performance of their duties to the Fund. In the normal course of business, the Fund may also enter into contracts that provide general indemnifications. The Fund's maximum exposure under these arrangements is unknown as this would be dependent on future claims that may be made against the Fund. The risk of material loss from such claims is considered remote.
At the end of the period, Strategic Advisers Fidelity International Fund was the owner of record of approximately 13% of the total outstanding shares of the Fund. Mutual funds managed by the investment adviser or its affiliates were the owners of record, in the aggregate, of approximately 32% of the total outstanding shares of the Fund.
Fidelity® Worldwide Fund
Investment Summary (Unaudited)
Geographic Diversification (% of fund's net assets)
| As of April 30, 2019 |
| | United States of America* | 61.8% |
| | Japan | 5.1% |
| | United Kingdom | 4.8% |
| | Switzerland | 3.8% |
| | Germany | 3.6% |
| | Netherlands | 3.1% |
| | France | 2.7% |
| | Ireland | 1.7% |
| | India | 1.5% |
| | Other | 11.9% |

* Includes Short-Term investments and Net Other Assets (Liabilities).
Percentages are based on country or territory of incorporation and are adjusted for the effect of futures contracts, if applicable.
Asset Allocation as of April 30, 2019
| | % of fund's net assets |
| Stocks | 98.0 |
| Investment Companies | 0.2 |
| Short-Term Investments and Net Other Assets (Liabilities) | 1.8 |
Top Ten Stocks as of April 30, 2019
| | % of fund's net assets |
| MasterCard, Inc. Class A (United States of America, IT Services) | 3.6 |
| Microsoft Corp. (United States of America, Software) | 3.4 |
| PayPal Holdings, Inc. (United States of America, IT Services) | 3.4 |
| Visa, Inc. Class A (United States of America, IT Services) | 3.1 |
| Bank of America Corp. (United States of America, Banks) | 2.7 |
| Amazon.com, Inc. (United States of America, Internet & Direct Marketing Retail) | 2.6 |
| Moody's Corp. (United States of America, Capital Markets) | 2.5 |
| Adobe, Inc. (United States of America, Software) | 2.5 |
| MSCI, Inc. (United States of America, Capital Markets) | 2.4 |
| Union Pacific Corp. (United States of America, Road & Rail) | 2.4 |
| | 28.6 |
Top Market Sectors as of April 30, 2019
| | % of fund's net assets |
| Information Technology | 30.3 |
| Financials | 15.0 |
| Consumer Discretionary | 11.9 |
| Industrials | 10.4 |
| Health Care | 10.2 |
| Consumer Staples | 6.8 |
| Communication Services | 4.8 |
| Real Estate | 4.2 |
| Energy | 2.2 |
| Materials | 1.5 |
Fidelity® Worldwide Fund
Schedule of Investments April 30, 2019 (Unaudited)
Showing Percentage of Net Assets
| Common Stocks - 97.9% | | | |
| | | Shares | Value |
| Australia - 0.7% | | | |
| Bapcor Ltd. | | 842,636 | $3,379,952 |
| Blue Sky Alternative Investments Ltd. (a) | | 156,344 | 29,758 |
| CSL Ltd. | | 51,973 | 7,275,280 |
| Inghams Group Ltd. | | 808,523 | 2,536,359 |
| Magellan Financial Group Ltd. | | 81,493 | 2,562,777 |
| National Storage (REIT) unit | | 1,875,761 | 2,366,949 |
| Pro Medicus Ltd. | | 34,086 | 491,151 |
| Rio Tinto Ltd. | | 278 | 18,690 |
|
| TOTAL AUSTRALIA | | | 18,660,916 |
|
| Austria - 0.4% | | | |
| Erste Group Bank AG | | 192,900 | 7,723,932 |
| Wienerberger AG | | 163,500 | 3,751,988 |
|
| TOTAL AUSTRIA | | | 11,475,920 |
|
| Bailiwick of Jersey - 0.2% | | | |
| Experian PLC | | 211,589 | 6,159,126 |
| Belgium - 0.4% | | | |
| KBC Groep NV | | 144,364 | 10,689,870 |
| Bermuda - 0.6% | | | |
| Haier Electronics Group Co. Ltd. | | 713,000 | 2,040,441 |
| Hiscox Ltd. | | 192,427 | 4,200,481 |
| Marvell Technology Group Ltd. | | 369,000 | 9,232,380 |
|
| TOTAL BERMUDA | | | 15,473,302 |
|
| Brazil - 0.3% | | | |
| BM&F BOVESPA SA | | 403,000 | 3,540,677 |
| Notre Dame Intermedica Participacoes SA | | 444,000 | 3,976,762 |
|
| TOTAL BRAZIL | | | 7,517,439 |
|
| Canada - 1.4% | | | |
| Alimentation Couche-Tard, Inc. Class B (sub. vtg.) | | 134,000 | 7,900,769 |
| Cenovus Energy, Inc. (Canada) | | 228,100 | 2,261,079 |
| Constellation Software, Inc. | | 6,200 | 5,470,504 |
| Dollarama, Inc. | | 102,800 | 3,087,760 |
| Shopify, Inc. (a)(b) | | 48,000 | 11,689,440 |
| Suncor Energy, Inc. | | 212,700 | 7,014,321 |
|
| TOTAL CANADA | | | 37,423,873 |
|
| Cayman Islands - 1.2% | | | |
| Alibaba Group Holding Ltd. sponsored ADR (a) | | 53,400 | 9,909,438 |
| Meituan Dianping Class B | | 369,166 | 2,682,345 |
| Momo, Inc. ADR | | 72,700 | 2,549,589 |
| Sands China Ltd. | | 455,600 | 2,503,105 |
| Sea Ltd. ADR (a) | | 109,300 | 2,720,477 |
| Tencent Holdings Ltd. | | 201,100 | 9,911,749 |
|
| TOTAL CAYMAN ISLANDS | | | 30,276,703 |
|
| China - 0.6% | | | |
| Hangzhou Hikvision Digital Technology Co. Ltd. (A Shares) | | 504,300 | 2,447,033 |
| Kweichow Moutai Co. Ltd. (A Shares) | | 41,900 | 6,059,570 |
| Shanghai International Airport Co. Ltd. (A Shares) | | 425,429 | 4,461,544 |
| SKSHU Paint Co. Ltd. (A Shares) | | 313,200 | 3,074,382 |
|
| TOTAL CHINA | | | 16,042,529 |
|
| Denmark - 0.5% | | | |
| DONG Energy A/S (c) | | 66,600 | 5,098,833 |
| Netcompany Group A/S (c) | | 106,619 | 3,802,616 |
| Novo Nordisk A/S Series B | | 23,176 | 1,135,498 |
| SimCorp A/S | | 32,900 | 3,225,103 |
|
| TOTAL DENMARK | | | 13,262,050 |
|
| France - 2.7% | | | |
| ALTEN | | 19,500 | 2,128,068 |
| Capgemini SA | | 72,800 | 8,826,633 |
| Cegedim SA (a) | | 39,210 | 1,141,227 |
| LVMH Moet Hennessy - Louis Vuitton SA | | 32,239 | 12,657,587 |
| Sartorius Stedim Biotech | | 25,200 | 3,419,983 |
| SR Teleperformance SA | | 36,400 | 6,993,535 |
| Total SA | | 399,409 | 22,203,446 |
| VINCI SA | | 123,600 | 12,483,136 |
|
| TOTAL FRANCE | | | 69,853,615 |
|
| Germany - 3.6% | | | |
| adidas AG | | 48,069 | 12,351,741 |
| Akasol AG (c) | | 27,300 | 1,417,691 |
| Allianz SE | | 41,300 | 9,982,795 |
| Daimler AG (Germany) | | 64,200 | 4,200,872 |
| Deutsche Borse AG | | 9,362 | 1,250,973 |
| Deutsche Post AG | | 212,475 | 7,385,723 |
| Instone Real Estate Group BV (a)(c) | | 74,900 | 1,827,171 |
| Linde PLC | | 35,434 | 6,374,741 |
| MTU Aero Engines Holdings AG | | 41,100 | 9,666,700 |
| Nexus AG | | 46,000 | 1,315,637 |
| Rational AG | | 3,670 | 2,477,996 |
| Rheinmetall AG | | 25,100 | 2,879,966 |
| SAP SE | | 169,384 | 21,834,995 |
| Vonovia SE | | 94,400 | 4,708,441 |
| WashTec AG | | 72,500 | 5,700,252 |
|
| TOTAL GERMANY | | | 93,375,694 |
|
| Greece - 0.0% | | | |
| Ff Group (a)(d) | | 59,300 | 159,626 |
| Hong Kong - 0.6% | | | |
| AIA Group Ltd. | | 1,255,400 | 12,854,587 |
| Techtronic Industries Co. Ltd. | | 231,000 | 1,669,603 |
|
| TOTAL HONG KONG | | | 14,524,190 |
|
| India - 1.5% | | | |
| Avenue Supermarts Ltd. (a)(c) | | 1,642 | 30,543 |
| HDFC Bank Ltd. | | 154,962 | 5,140,970 |
| HDFC Bank Ltd. sponsored ADR | | 91,693 | 10,512,602 |
| Housing Development Finance Corp. Ltd. | | 354,494 | 10,154,540 |
| Lupin Ltd. (a) | | 1,335 | 16,716 |
| Sunteck Realty Ltd. (a) | | 304,120 | 2,014,964 |
| TCNS Clothing Co. Ltd. (a)(c) | | 208,823 | 2,462,658 |
| V-Mart Retail Ltd. (a) | | 182,903 | 7,314,072 |
|
| TOTAL INDIA | | | 37,647,065 |
|
| Indonesia - 0.1% | | | |
| PT Bank Central Asia Tbk | | 896,600 | 1,808,930 |
| PT Bank Rakyat Indonesia Tbk | | 6,238,600 | 1,913,171 |
| PT Kino Indonesia Tbk | | 234,500 | 42,621 |
|
| TOTAL INDONESIA | | | 3,764,722 |
|
| Ireland - 1.7% | | | |
| Accenture PLC Class A | | 152,000 | 27,765,840 |
| Cairn Homes PLC (a) | | 2,880,639 | 4,142,045 |
| Dalata Hotel Group PLC | | 274,574 | 1,813,897 |
| DCC PLC (United Kingdom) | | 16,000 | 1,428,767 |
| Green REIT PLC | | 621,300 | 1,180,464 |
| Greencore Group PLC | | 367,415 | 1,101,951 |
| Kerry Group PLC Class A | | 53,800 | 6,022,140 |
|
| TOTAL IRELAND | | | 43,455,104 |
|
| Italy - 0.3% | | | |
| Recordati SpA | | 173,400 | 6,999,531 |
| Japan - 5.1% | | | |
| A/S One Corp. | | 103,300 | 8,243,970 |
| AEON Financial Service Co. Ltd. | | 116,800 | 2,410,550 |
| Ain Holdings, Inc. | | 51,100 | 4,055,155 |
| Daiichikosho Co. Ltd. | | 62,500 | 3,052,202 |
| Fanuc Corp. | | 42,900 | 8,059,862 |
| Hoya Corp. | | 204,900 | 14,374,914 |
| Kao Corp. | | 50,400 | 3,871,563 |
| Keyence Corp. | | 23,720 | 14,718,133 |
| Minebea Mitsumi, Inc. | | 283,600 | 5,015,414 |
| Misumi Group, Inc. | | 64,700 | 1,671,588 |
| Monex Group, Inc. (b) | | 297,500 | 902,689 |
| MonotaRO Co. Ltd. | | 105,500 | 2,426,420 |
| Nidec Corp. | | 30,600 | 4,336,110 |
| Nitori Holdings Co. Ltd. | | 22,000 | 2,616,814 |
| NSD Co. Ltd. | | 162,900 | 4,031,737 |
| ORIX Corp. | | 606,900 | 8,561,815 |
| PALTAC Corp. | | 43,700 | 2,396,939 |
| Persol Holdings Co., Ltd. | | 131,100 | 2,452,645 |
| Recruit Holdings Co. Ltd. | | 109,200 | 3,263,403 |
| Relo Group, Inc. | | 276,500 | 7,520,939 |
| Shimadzu Corp. | | 85,000 | 2,269,312 |
| Shiseido Co. Ltd. | | 34,300 | 2,684,388 |
| SMC Corp. | | 24,800 | 10,254,392 |
| SoftBank Corp. | | 107,700 | 11,419,580 |
| Terumo Corp. | | 73,200 | 2,199,384 |
|
| TOTAL JAPAN | | | 132,809,918 |
|
| Kenya - 0.1% | | | |
| Safaricom Ltd. | | 6,251,600 | 1,739,818 |
| Korea (South) - 0.2% | | | |
| AMOREPACIFIC Corp. | | 15,680 | 2,801,900 |
| Cafe24 Corp. (a) | | 17,437 | 1,438,091 |
| Hyundai Fire & Marine Insurance Co. Ltd. | | 21,488 | 706,107 |
|
| TOTAL KOREA (SOUTH) | | | 4,946,098 |
|
| Malta - 0.1% | | | |
| Kambi Group PLC (a) | | 76,200 | 1,518,167 |
| Mauritius - 0.0% | | | |
| MakeMyTrip Ltd. (a) | | 32,000 | 806,720 |
| Mexico - 0.1% | | | |
| Grupo Financiero Banorte S.A.B. de CV Series O | | 429,700 | 2,716,090 |
| Netherlands - 3.1% | | | |
| Adyen BV (c) | | 2,066 | 1,681,379 |
| Airbus Group NV | | 55,600 | 7,613,289 |
| Argenx SE ADR (a) | | 21,832 | 2,796,024 |
| ASML Holding NV (Netherlands) | | 56,800 | 11,820,175 |
| Basic-Fit NV (a)(c) | | 65,600 | 2,325,032 |
| IMCD Group BV | | 52,000 | 4,199,270 |
| Interxion Holding N.V. (a) | | 15,000 | 1,037,850 |
| NXP Semiconductors NV | | 280,400 | 29,615,848 |
| Unilever NV (Certificaten Van Aandelen) (Bearer) | | 300,627 | 18,189,312 |
| Van Lanschot NV (Bearer) | | 17,200 | 446,599 |
|
| TOTAL NETHERLANDS | | | 79,724,778 |
|
| New Zealand - 0.5% | | | |
| EBOS Group Ltd. | | 210,137 | 3,006,308 |
| Fisher & Paykel Healthcare Corp. | | 313,590 | 3,311,353 |
| Ryman Healthcare Group Ltd. | | 744,575 | 6,042,215 |
|
| TOTAL NEW ZEALAND | | | 12,359,876 |
|
| Norway - 1.2% | | | |
| Adevinta ASA: | | | |
| Class A (a) | | 218,300 | 2,201,863 |
| Class B | | 198,400 | 1,951,932 |
| Equinor ASA | | 894,280 | 19,948,442 |
| Schibsted ASA (A Shares) | | 218,300 | 5,728,590 |
|
| TOTAL NORWAY | | | 29,830,827 |
|
| Philippines - 0.2% | | | |
| D&L Industries, Inc. | | 8,349,900 | 1,761,610 |
| Holcim Philippines, Inc. | | 12,036,100 | 2,948,565 |
|
| TOTAL PHILIPPINES | | | 4,710,175 |
|
| Poland - 0.1% | | | |
| Bank Polska Kasa Opieki SA | | 53,183 | 1,582,359 |
| South Africa - 0.4% | | | |
| Clicks Group Ltd. | | 169,300 | 2,315,641 |
| Naspers Ltd. Class N | | 27,600 | 7,100,115 |
|
| TOTAL SOUTH AFRICA | | | 9,415,756 |
|
| Spain - 0.4% | | | |
| Grifols SA ADR | | 181,002 | 3,464,378 |
| Masmovil Ibercom SA (a) | | 324,805 | 7,118,447 |
|
| TOTAL SPAIN | | | 10,582,825 |
|
| Sweden - 0.9% | | | |
| ASSA ABLOY AB (B Shares) | | 185,600 | 3,967,677 |
| Indutrade AB | | 241,100 | 7,371,566 |
| Securitas AB (B Shares) | | 197,500 | 3,453,591 |
| Telefonaktiebolaget LM Ericsson (B Shares) | | 831,500 | 8,225,345 |
|
| TOTAL SWEDEN | | | 23,018,179 |
|
| Switzerland - 3.8% | | | |
| Alcon, Inc. (a) | | 92,800 | 5,344,231 |
| Compagnie Financiere Richemont SA Series A | | 20,670 | 1,511,025 |
| EDAG Engineering Group AG | | 77,800 | 1,221,647 |
| Forbo Holding AG (Reg.) | | 1,430 | 2,297,375 |
| Kaba Holding AG (B Shares) (Reg.) | | 2,860 | 2,158,438 |
| Lonza Group AG | | 18,382 | 5,676,900 |
| Medacta Group SA (c) | | 26,500 | 2,427,769 |
| Nestle SA (Reg. S) | | 319,640 | 30,774,189 |
| Partners Group Holding AG | | 11,005 | 8,290,336 |
| Roche Holding AG (participation certificate) | | 92,679 | 24,454,593 |
| Schindler Holding AG (participation certificate) | | 14,628 | 3,155,439 |
| Sika AG | | 40,439 | 6,191,161 |
| Swiss Re Ltd. | | 56,180 | 5,406,557 |
|
| TOTAL SWITZERLAND | | | 98,909,660 |
|
| Taiwan - 0.3% | | | |
| Taiwan Semiconductor Manufacturing Co. Ltd. | | 844,000 | 7,086,022 |
| United Kingdom - 4.8% | | | |
| Anglo American PLC (United Kingdom) | | 142,359 | 3,678,194 |
| AstraZeneca PLC: | | | |
| (United Kingdom) | | 218,492 | 16,277,612 |
| sponsored ADR | | 108,000 | 4,067,280 |
| Beazley PLC | | 568,100 | 4,267,022 |
| BHP Billiton PLC | | 343,865 | 8,116,787 |
| Big Yellow Group PLC | | 199,900 | 2,713,571 |
| Bunzl PLC | | 337,660 | 10,166,726 |
| Compass Group PLC | | 262,934 | 5,982,763 |
| Cranswick PLC | | 68,215 | 2,577,839 |
| Dechra Pharmaceuticals PLC | | 102,400 | 3,551,887 |
| Diageo PLC | | 285,751 | 12,046,609 |
| Fever-Tree Drinks PLC | | 25,100 | 1,029,044 |
| Hilton Food Group PLC | | 374,800 | 4,965,590 |
| Hotel Chocolat Group Ltd. | | 603,300 | 2,891,134 |
| JTC PLC (c) | | 432,300 | 2,237,965 |
| Keywords Studios PLC | | 100,500 | 2,040,480 |
| Lloyds Banking Group PLC | | 6,649,550 | 5,438,237 |
| London Stock Exchange Group PLC | | 6,881 | 451,141 |
| Micro Focus International PLC | | 155,077 | 3,918,627 |
| Network International Holdings PLC (c) | | 535,100 | 3,635,384 |
| Ocado Group PLC (a) | | 273,700 | 4,862,828 |
| Prudential PLC | | 214,700 | 4,878,281 |
| Rio Tinto PLC | | 110,505 | 6,446,759 |
| Rotork PLC | | 752,300 | 3,059,736 |
| Standard Life PLC | | 1,057,800 | 3,847,066 |
|
| TOTAL UNITED KINGDOM | | | 123,148,562 |
|
| United States of America - 59.8% | | | |
| Abbott Laboratories | | 262,000 | 20,844,720 |
| Adobe, Inc. (a) | | 218,124 | 63,092,367 |
| Alexion Pharmaceuticals, Inc. (a) | | 258,000 | 35,121,540 |
| Alphabet, Inc. Class A (a) | | 47,500 | 56,950,600 |
| Amazon.com, Inc. (a) | | 35,000 | 67,428,200 |
| American Tower Corp. | | 242,000 | 47,262,600 |
| American Water Works Co., Inc. | | 8,000 | 865,520 |
| Amphenol Corp. Class A | | 30,000 | 2,986,800 |
| Arista Networks, Inc. (a) | | 18,000 | 5,621,220 |
| AutoZone, Inc. (a) | | 30,000 | 30,849,300 |
| Bank of America Corp. | | 2,279,000 | 69,691,820 |
| Becton, Dickinson & Co. | | 21,000 | 5,055,540 |
| BJ's Wholesale Club Holdings, Inc. | | 41,700 | 1,182,195 |
| bluebird bio, Inc. (a) | | 47,915 | 6,795,784 |
| Broadcom, Inc. | | 30,000 | 9,552,000 |
| Burlington Stores, Inc. (a) | | 13,000 | 2,195,830 |
| Cisco Systems, Inc. | | 548,000 | 30,660,600 |
| Cogent Communications Group, Inc. | | 39,000 | 2,153,970 |
| Costco Wholesale Corp. | | 46,000 | 11,294,380 |
| Crown Castle International Corp. | | 107,000 | 13,458,460 |
| D.R. Horton, Inc. | | 262,000 | 11,609,220 |
| Danaher Corp. | | 76,000 | 10,065,440 |
| Dell Technologies, Inc. (a) | | 65,000 | 4,381,650 |
| Encompass Health Corp. | | 2 | 129 |
| Equinix, Inc. | | 9,000 | 4,092,300 |
| Equity Lifestyle Properties, Inc. | | 12,000 | 1,400,400 |
| Estee Lauder Companies, Inc. Class A | | 307,000 | 52,745,670 |
| Etsy, Inc. (a) | | 15,000 | 1,013,100 |
| Exxon Mobil Corp. | | 44,000 | 3,532,320 |
| Facebook, Inc. Class A (a) | | 46,000 | 8,896,400 |
| Five Below, Inc. (a) | | 78,000 | 11,418,420 |
| Forescout Technologies, Inc. (a) | | 15,000 | 630,600 |
| General Electric Co. | | 175,000 | 1,779,750 |
| Honeywell International, Inc. | | 36,000 | 6,250,680 |
| Humana, Inc. | | 18,300 | 4,674,003 |
| IAC/InterActiveCorp (a) | | 7,000 | 1,573,880 |
| Illumina, Inc. (a) | | 4,000 | 1,248,000 |
| Intercept Pharmaceuticals, Inc. (a) | | 17,060 | 1,470,231 |
| Intuitive Surgical, Inc. (a) | | 4,000 | 2,042,520 |
| IQVIA Holdings, Inc. (a) | | 13,000 | 1,805,700 |
| Kansas City Southern | | 8,000 | 985,120 |
| Keysight Technologies, Inc. (a) | | 9,000 | 783,270 |
| lululemon athletica, Inc. (a) | | 700 | 123,445 |
| Marsh & McLennan Companies, Inc. | | 46,200 | 4,356,198 |
| MasterCard, Inc. Class A | | 369,600 | 93,967,099 |
| McCormick & Co., Inc. (non-vtg.) | | 7,000 | 1,077,790 |
| MercadoLibre, Inc. (a) | | 3,000 | 1,452,420 |
| Mettler-Toledo International, Inc. (a) | | 2,000 | 1,490,520 |
| Microsoft Corp. | | 678,000 | 88,546,800 |
| Moody's Corp. | | 333,000 | 65,474,460 |
| MSCI, Inc. | | 277,000 | 62,430,260 |
| NextEra Energy, Inc. | | 30,000 | 5,833,200 |
| Norfolk Southern Corp. | | 241,000 | 49,168,820 |
| NVIDIA Corp. | | 103,000 | 18,643,000 |
| PayPal Holdings, Inc. (a) | | 769,000 | 86,720,130 |
| Pivotal Software, Inc. | | 120,000 | 2,604,000 |
| Procter & Gamble Co. | | 56,000 | 5,962,880 |
| Prologis, Inc. | | 235,000 | 18,017,450 |
| Qualcomm, Inc. | | 202,000 | 17,398,260 |
| Ross Stores, Inc. | | 84,000 | 8,203,440 |
| S&P Global, Inc. | | 218,628 | 48,242,454 |
| Salesforce.com, Inc. (a) | | 124,000 | 20,503,400 |
| ServiceNow, Inc. (a) | | 14,000 | 3,801,140 |
| Skyworks Solutions, Inc. | | 107,000 | 9,435,260 |
| Snap, Inc. Class A (a) | | 97,000 | 1,080,580 |
| Square, Inc. (a) | | 378,000 | 27,525,960 |
| T-Mobile U.S., Inc. (a) | | 32,000 | 2,335,680 |
| Tableau Software, Inc. (a) | | 21,000 | 2,558,010 |
| The AES Corp. | | 340,900 | 5,836,208 |
| The Boeing Co. | | 4,000 | 1,510,760 |
| Thermo Fisher Scientific, Inc. | | 29,000 | 8,046,050 |
| TJX Companies, Inc. | | 250,000 | 13,720,000 |
| Toro Co. | | 13,000 | 950,950 |
| Tradeweb Markets, Inc. Class A | | 11,000 | 442,750 |
| Twilio, Inc. Class A (a) | | 11,000 | 1,508,540 |
| Twitter, Inc. (a) | | 229,000 | 9,139,390 |
| Ulta Beauty, Inc. (a) | | 110,000 | 38,387,800 |
| Union Pacific Corp. | | 350,000 | 61,964,000 |
| UnitedHealth Group, Inc. | | 114,000 | 26,569,980 |
| Vertex Pharmaceuticals, Inc. (a) | | 16,000 | 2,703,680 |
| VF Corp. | | 61,000 | 5,759,010 |
| Visa, Inc. Class A | | 488,100 | 80,258,283 |
| Wayfair LLC Class A (a) | | 9,022 | 1,462,917 |
| Workday, Inc. Class A (a) | | 4,000 | 822,520 |
| Xcel Energy, Inc. | | 57,000 | 3,220,500 |
| Zebra Technologies Corp. Class A (a) | | 79,000 | 16,680,060 |
|
| TOTAL UNITED STATES OF AMERICA | | | 1,541,398,303 |
|
| TOTAL COMMON STOCKS | | | |
| (Cost $2,022,443,400) | | | 2,523,065,408 |
|
| Nonconvertible Preferred Stocks - 0.1% | | | |
| Brazil - 0.1% | | | |
| Itausa-Investimentos Itau SA (PN) | | | |
| (Cost $4,241,662) | | 1,218,900 | 3,702,303 |
|
| Investment Companies - 0.2% | | | |
| United States of America - 0.2% | | | |
| iShares MSCI Japan ETF | | | |
| (Cost $4,306,231) | | 79,200 | 4,389,264 |
| | | Principal Amount | Value |
|
| Government Obligations - 0.0% | | | |
| United States of America - 0.0% | | | |
U.S. Treasury Bills, yield at date of purchase 2.41% 5/30/19
(Cost $89,827) | | 90,000 | 89,828 |
| | | Shares | Value |
|
| Money Market Funds - 1.8% | | | |
| Fidelity Cash Central Fund, 2.49% (e) | | 42,425,973 | 42,434,458 |
| Fidelity Securities Lending Cash Central Fund 2.49% (e)(f) | | 3,898,420 | 3,898,810 |
| TOTAL MONEY MARKET FUNDS | | | |
| (Cost $46,323,152) | | | 46,333,268 |
| TOTAL INVESTMENT IN SECURITIES - 100.0% | | | |
| (Cost $2,077,404,272) | | | 2,577,580,071 |
| NET OTHER ASSETS (LIABILITIES) - 0.0% | | | (493,666) |
| NET ASSETS - 100% | | | $2,577,086,405 |
Security Type Abbreviations
ETF – Exchange-Traded Fund
Categorizations in the Schedule of Investments are based on country or territory of incorporation.
Legend
(a) Non-income producing
(b) Security or a portion of the security is on loan at period end.
(c) Security exempt from registration under Rule 144A of the Securities Act of 1933. These securities may be resold in transactions exempt from registration, normally to qualified institutional buyers. At the end of the period, the value of these securities amounted to $26,947,041 or 1.0% of net assets.
(d) Level 3 security
(e) Affiliated fund that is generally available only to investment companies and other accounts managed by Fidelity Investments. The rate quoted is the annualized seven-day yield of the fund at period end. A complete unaudited listing of the fund's holdings as of its most recent quarter end is available upon request. In addition, each Fidelity Central Fund's financial statements are available on the SEC's website or upon request.
(f) Investment made with cash collateral received from securities on loan.
Affiliated Central Funds
Information regarding fiscal year to date income earned by the Fund from investments in Fidelity Central Funds is as follows:
| Fund | Income earned |
| Fidelity Cash Central Fund | $1,202,754 |
| Fidelity Securities Lending Cash Central Fund | 107,028 |
| Total | $1,309,782 |
Amounts in the income column in the above table include any capital gain distributions from underlying funds, which are presented in the corresponding line-item in the Statement of Operations, if applicable.
Investment Valuation
The following is a summary of the inputs used, as of April 30, 2019, involving the Fund's assets and liabilities carried at fair value. The inputs or methodology used for valuing securities may not be an indication of the risk associated with investing in those securities. For more information on valuation inputs, and their aggregation into the levels used below, please refer to the Investment Valuation section in the accompanying Notes to Financial Statements.
| | Valuation Inputs at Reporting Date: |
| Description | Total | Level 1 | Level 2 | Level 3 |
| Investments in Securities: | | | | |
| Equities: | | | | |
| Communication Services | $123,650,475 | $102,319,146 | $21,331,329 | $-- |
| Consumer Discretionary | 300,806,380 | 271,877,097 | 28,769,657 | 159,626 |
| Consumer Staples | 184,128,689 | 123,118,579 | 61,010,110 | -- |
| Energy | 54,959,608 | 32,756,162 | 22,203,446 | -- |
| Financials | 392,484,506 | 352,487,522 | 39,996,984 | -- |
| Health Care | 258,944,440 | 208,393,529 | 50,550,911 | -- |
| Industrials | 264,872,391 | 208,378,421 | 56,493,970 | -- |
| Information Technology | 777,140,375 | 739,994,013 | 37,146,362 | -- |
| Materials | 42,362,877 | 27,799,331 | 14,563,546 | -- |
| Real Estate | 106,563,709 | 106,563,709 | -- | -- |
| Utilities | 20,854,261 | 20,854,261 | -- | -- |
| Investment Companies | 4,389,264 | 4,389,264 | -- | -- |
| Government Obligations | 89,828 | -- | 89,828 | -- |
| Money Market Funds | 46,333,268 | 46,333,268 | -- | -- |
| Total Investments in Securities: | $2,577,580,071 | $2,245,264,302 | $332,156,143 | $159,626 |
See accompanying notes which are an integral part of the financial statements.
Fidelity® Worldwide Fund
Financial Statements
Statement of Assets and Liabilities
| | | April 30, 2019 (Unaudited) |
| Assets | | |
Investment in securities, at value (including securities loaned of $4,119,886) — See accompanying schedule:
Unaffiliated issuers (cost $2,031,081,120) | $2,531,246,803 | |
| Fidelity Central Funds (cost $46,323,152) | 46,333,268 | |
| Total Investment in Securities (cost $2,077,404,272) | | $2,577,580,071 |
| Foreign currency held at value (cost $217,748) | | 212,937 |
| Receivable for investments sold | | 13,066,902 |
| Receivable for fund shares sold | | 3,223,494 |
| Dividends receivable | | 5,209,808 |
| Distributions receivable from Fidelity Central Funds | | 118,590 |
| Prepaid expenses | | 940 |
| Other receivables | | 297,954 |
| Total assets | | 2,599,710,696 |
| Liabilities | | |
| Payable for investments purchased | $12,717,527 | |
| Payable for fund shares redeemed | 3,651,007 | |
| Accrued management fee | 1,645,055 | |
| Distribution and service plan fees payable | 25,317 | |
| Other affiliated payables | 458,853 | |
| Other payables and accrued expenses | 226,633 | |
| Collateral on securities loaned | 3,899,899 | |
| Total liabilities | | 22,624,291 |
| Net Assets | | $2,577,086,405 |
| Net Assets consist of: | | |
| Paid in capital | | $2,060,551,753 |
| Total distributable earnings (loss) | | 516,534,652 |
| Net Assets | | $2,577,086,405 |
| Net Asset Value and Maximum Offering Price | | |
| Class A: | | |
| Net Asset Value and redemption price per share ($49,794,993 ÷ 1,844,221 shares) | | $27.00 |
| Maximum offering price per share (100/94.25 of $27.00) | | $28.65 |
| Class M: | | |
| Net Asset Value and redemption price per share ($13,957,155 ÷ 521,061 shares) | | $26.79 |
| Maximum offering price per share (100/96.50 of $26.79) | | $27.76 |
| Class C: | | |
| Net Asset Value and offering price per share ($11,372,320 ÷ 435,896 shares)(a) | | $26.09 |
| Worldwide: | | |
| Net Asset Value, offering price and redemption price per share ($2,444,085,500 ÷ 89,412,952 shares) | | $27.33 |
| Class I: | | |
| Net Asset Value, offering price and redemption price per share ($44,886,446 ÷ 1,651,511 shares) | | $27.18 |
| Class Z: | | |
| Net Asset Value, offering price and redemption price per share ($12,989,991 ÷ 478,157 shares) | | $27.17 |
(a) Redemption price per share is equal to net asset value less any applicable contingent deferred sales charge.
See accompanying notes which are an integral part of the financial statements.
Statement of Operations
| | | Six months ended April 30, 2019 (Unaudited) |
| Investment Income | | |
| Dividends | | $19,337,241 |
| Non-Cash dividends | | 2,585,816 |
| Interest | | 8,268 |
| Income from Fidelity Central Funds | | 1,309,782 |
| Income before foreign taxes withheld | | 23,241,107 |
| Less foreign taxes withheld | | (1,056,355) |
| Total income | | 22,184,752 |
| Expenses | | |
| Management fee | | |
| Basic fee | $7,778,861 | |
| Performance adjustment | 728,625 | |
| Transfer agent fees | 2,288,890 | |
| Distribution and service plan fees | 146,204 | |
| Accounting and security lending fees | 352,269 | |
| Custodian fees and expenses | 87,312 | |
| Independent trustees' fees and expenses | 6,281 | |
| Registration fees | 153,707 | |
| Audit | 63,721 | |
| Legal | 9,896 | |
| Miscellaneous | 6,466 | |
| Total expenses before reductions | 11,622,232 | |
| Expense reductions | (342,465) | |
| Total expenses after reductions | | 11,279,767 |
| Net investment income (loss) | | 10,904,985 |
| Realized and Unrealized Gain (Loss) | | |
| Net realized gain (loss) on: | | |
| Investment securities: | | |
| Unaffiliated issuers | 13,492,371 | |
| Fidelity Central Funds | (9,745) | |
| Foreign currency transactions | 43,981 | |
| Futures contracts | (713,533) | |
| Total net realized gain (loss) | | 12,813,074 |
| Change in net unrealized appreciation (depreciation) on: | | |
| Investment securities: | | |
| Unaffiliated issuers (net of increase in deferred foreign taxes of $136,975) | 230,131,736 | |
| Fidelity Central Funds | 9,701 | |
| Assets and liabilities in foreign currencies | (34,925) | |
| Futures contracts | 459,866 | |
| Total change in net unrealized appreciation (depreciation) | | 230,566,378 |
| Net gain (loss) | | 243,379,452 |
| Net increase (decrease) in net assets resulting from operations | | $254,284,437 |
See accompanying notes which are an integral part of the financial statements.
Statement of Changes in Net Assets
| | Six months ended April 30, 2019 (Unaudited) | Year ended October 31, 2018 |
| Increase (Decrease) in Net Assets | | |
| Operations | | |
| Net investment income (loss) | $10,904,985 | $7,705,413 |
| Net realized gain (loss) | 12,813,074 | 203,152,728 |
| Change in net unrealized appreciation (depreciation) | 230,566,378 | (149,064,911) |
| Net increase (decrease) in net assets resulting from operations | 254,284,437 | 61,793,230 |
| Distributions to shareholders | (191,789,642) | (114,348,791) |
| Share transactions - net increase (decrease) | 281,916,308 | 553,625,621 |
| Total increase (decrease) in net assets | 344,411,103 | 501,070,060 |
| Net Assets | | |
| Beginning of period | 2,232,675,302 | 1,731,605,242 |
| End of period | $2,577,086,405 | $2,232,675,302 |
See accompanying notes which are an integral part of the financial statements.
Fidelity Worldwide Fund Class A
| | Six months ended (Unaudited) April 30, | Years endedOctober 31, | | | | |
| | 2019 | 2018 | 2017 | 2016 | 2015 | 2014 |
| Selected Per–Share Data | | | | | | |
| Net asset value, beginning of period | $26.57 | $27.28 | $21.83 | $22.88 | $24.64 | $25.18 |
| Income from Investment Operations | | | | | | |
| Net investment income (loss)A | .08 | .03 | .11 | .12 | .06 | .02 |
| Net realized and unrealized gain (loss) | 2.51 | 1.00 | 5.53 | (.35) | .58 | 1.46 |
| Total from investment operations | 2.59 | 1.03 | 5.64 | (.23) | .64 | 1.48 |
| Distributions from net investment income | (.02) | (.09) | (.12) | (.07) | – | (.04) |
| Distributions from net realized gain | (2.14) | (1.65) | (.07) | (.75) | (2.40) | (1.98) |
| Total distributions | (2.16) | (1.74) | (.19) | (.82) | (2.40) | (2.02) |
| Redemption fees added to paid in capitalA | – | – | –B | –B | –B | –B |
| Net asset value, end of period | $27.00 | $26.57 | $27.28 | $21.83 | $22.88 | $24.64 |
| Total ReturnC,D,E | 10.87% | 3.96% | 26.06% | (1.09)% | 2.73% | 6.29% |
| Ratios to Average Net AssetsF,G | | | | | | |
| Expenses before reductions | 1.25%H | 1.23% | 1.12% | 1.22% | 1.27% | 1.31% |
| Expenses net of fee waivers, if any | 1.25%H | 1.23% | 1.12% | 1.22% | 1.26% | 1.31% |
| Expenses net of all reductions | 1.22%H | 1.22% | 1.11% | 1.22% | 1.26% | 1.31% |
| Net investment income (loss) | .67%H | .12% | .47% | .55% | .27% | .10% |
| Supplemental Data | | | | | | |
| Net assets, end of period (000 omitted) | $49,795 | $42,947 | $32,823 | $29,052 | $31,043 | $33,788 |
| Portfolio turnover rateI | 145%H | 117% | 111% | 117% | 151% | 163% |
A Calculated based on average shares outstanding during the period.
B Amount represents less than $.005 per share.
C Total returns for periods of less than one year are not annualized.
D Total returns would have been lower if certain expenses had not been reduced during the applicable periods shown.
E Total returns do not include the effect of the sales charges.
F Fees and expenses of any underlying Fidelity Central Funds are not included in the Fund's expense ratio. The Fund indirectly bears its proportionate share of the expenses of any underlying Fidelity Central Funds.
G Expense ratios reflect operating expenses of the class. Expenses before reductions do not reflect amounts reimbursed by the investment adviser or reductions from brokerage service arrangements or reductions from other expense offset arrangements and do not represent the amount paid by the class during periods when reimbursements or reductions occur. Expenses net of fee waivers reflect expenses after reimbursement by the investment adviser but prior to reductions from brokerage service arrangements or other expense offset arrangements. Expenses net of all reductions represent the net expenses paid by the class.
H Annualized
I Amount does not include the portfolio activity of any underlying Fidelity Central Funds.
See accompanying notes which are an integral part of the financial statements.
Fidelity Worldwide Fund Class M
| | Six months ended (Unaudited) April 30, | Years endedOctober 31, | | | | |
| | 2019 | 2018 | 2017 | 2016 | 2015 | 2014 |
| Selected Per–Share Data | | | | | | |
| Net asset value, beginning of period | $26.39 | $27.11 | $21.67 | $22.72 | $24.49 | $25.05 |
| Income from Investment Operations | | | | | | |
| Net investment income (loss)A | .05 | (.05) | .04 | .05 | (.01) | (.04) |
| Net realized and unrealized gain (loss) | 2.49 | 1.00 | 5.50 | (.35) | .57 | 1.46 |
| Total from investment operations | 2.54 | .95 | 5.54 | (.30) | .56 | 1.42 |
| Distributions from net investment income | – | (.02) | (.03) | – | – | – |
| Distributions from net realized gain | (2.14) | (1.65) | (.07) | (.75) | (2.33) | (1.98) |
| Total distributions | (2.14) | (1.67) | (.10) | (.75) | (2.33) | (1.98) |
| Redemption fees added to paid in capitalA | – | – | –B | –B | –B | –B |
| Net asset value, end of period | $26.79 | $26.39 | $27.11 | $21.67 | $22.72 | $24.49 |
| Total ReturnC,D,E | 10.76% | 3.65% | 25.68% | (1.38)% | 2.36% | 6.05% |
| Ratios to Average Net AssetsF,G | | | | | | |
| Expenses before reductions | 1.53%H | 1.52% | 1.42% | 1.53% | 1.57% | 1.58% |
| Expenses net of fee waivers, if any | 1.53%H | 1.52% | 1.42% | 1.52% | 1.56% | 1.58% |
| Expenses net of all reductions | 1.50%H | 1.51% | 1.41% | 1.52% | 1.56% | 1.58% |
| Net investment income (loss) | .39%H | (.17)% | .17% | .25% | (.04)% | (.17)% |
| Supplemental Data | | | | | | |
| Net assets, end of period (000 omitted) | $13,957 | $12,746 | $10,634 | $9,270 | $13,055 | $12,160 |
| Portfolio turnover rateI | 145%H | 117% | 111% | 117% | 151% | 163% |
A Calculated based on average shares outstanding during the period.
B Amount represents less than $.005 per share.
C Total returns for periods of less than one year are not annualized.
D Total returns would have been lower if certain expenses had not been reduced during the applicable periods shown.
E Total returns do not include the effect of the sales charges.
F Fees and expenses of any underlying Fidelity Central Funds are not included in the Fund's expense ratio. The Fund indirectly bears its proportionate share of the expenses of any underlying Fidelity Central Funds.
G Expense ratios reflect operating expenses of the class. Expenses before reductions do not reflect amounts reimbursed by the investment adviser or reductions from brokerage service arrangements or reductions from other expense offset arrangements and do not represent the amount paid by the class during periods when reimbursements or reductions occur. Expenses net of fee waivers reflect expenses after reimbursement by the investment adviser but prior to reductions from brokerage service arrangements or other expense offset arrangements. Expenses net of all reductions represent the net expenses paid by the class.
H Annualized
I Amount does not include the portfolio activity of any underlying Fidelity Central Funds.
See accompanying notes which are an integral part of the financial statements.
Fidelity Worldwide Fund Class C
| | Six months ended (Unaudited) April 30, | Years endedOctober 31, | | | | |
| | 2019 | 2018 | 2017 | 2016 | 2015 | 2014 |
| Selected Per–Share Data | | | | | | |
| Net asset value, beginning of period | $25.82 | $26.67 | $21.33 | $22.48 | $24.12 | $24.78 |
| Income from Investment Operations | | | | | | |
| Net investment income (loss)A | (.02) | (.18) | (.07) | (.05) | (.12) | (.15) |
| Net realized and unrealized gain (loss) | 2.43 | .98 | 5.42 | (.35) | .57 | 1.44 |
| Total from investment operations | 2.41 | .80 | 5.35 | (.40) | .45 | 1.29 |
| Distributions from net investment income | – | – | – | – | – | – |
| Distributions from net realized gain | (2.14) | (1.65) | (.01) | (.75) | (2.09) | (1.95) |
| Total distributions | (2.14) | (1.65) | (.01) | (.75) | (2.09) | (1.95) |
| Redemption fees added to paid in capitalA | – | – | –B | –B | –B | –B |
| Net asset value, end of period | $26.09 | $25.82 | $26.67 | $21.33 | $22.48 | $24.12 |
| Total ReturnC,D,E | 10.48% | 3.12% | 25.10% | (1.88)% | 1.90% | 5.55% |
| Ratios to Average Net AssetsF,G | | | | | | |
| Expenses before reductions | 2.04%H | 2.01% | 1.89% | 2.01% | 2.07% | 2.04% |
| Expenses net of fee waivers, if any | 2.04%H | 2.01% | 1.89% | 2.01% | 2.07% | 2.04% |
| Expenses net of all reductions | 2.02%H | 2.00% | 1.88% | 2.00% | 2.06% | 2.03% |
| Net investment income (loss) | (.13)%H | (.66)% | (.30)% | (.24)% | (.54)% | (.63)% |
| Supplemental Data | | | | | | |
| Net assets, end of period (000 omitted) | $11,372 | $12,744 | $10,264 | $10,315 | $11,231 | $9,229 |
| Portfolio turnover rateI | 145%H | 117% | 111% | 117% | 151% | 163% |
A Calculated based on average shares outstanding during the period.
B Amount represents less than $.005 per share.
C Total returns for periods of less than one year are not annualized.
D Total returns would have been lower if certain expenses had not been reduced during the applicable periods shown.
E Total returns do not include the effect of the contingent deferred sales charge.
F Fees and expenses of any underlying Fidelity Central Funds are not included in the Fund's expense ratio. The Fund indirectly bears its proportionate share of the expenses of any underlying Fidelity Central Funds.
G Expense ratios reflect operating expenses of the class. Expenses before reductions do not reflect amounts reimbursed by the investment adviser or reductions from brokerage service arrangements or reductions from other expense offset arrangements and do not represent the amount paid by the class during periods when reimbursements or reductions occur. Expenses net of fee waivers reflect expenses after reimbursement by the investment adviser but prior to reductions from brokerage service arrangements or other expense offset arrangements. Expenses net of all reductions represent the net expenses paid by the class.
H Annualized
I Amount does not include the portfolio activity of any underlying Fidelity Central Funds.
See accompanying notes which are an integral part of the financial statements.
Fidelity Worldwide Fund
| | Six months ended (Unaudited) April 30, | Years endedOctober 31, | | | | |
| | 2019 | 2018 | 2017 | 2016 | 2015 | 2014 |
| Selected Per–Share Data | | | | | | |
| Net asset value, beginning of period | $26.90 | $27.61 | $22.09 | $23.14 | $24.92 | $25.41 |
| Income from Investment Operations | | | | | | |
| Net investment income (loss)A | .12 | .11 | .19 | .19 | .13 | .11 |
| Net realized and unrealized gain (loss) | 2.54 | 1.00 | 5.60 | (.35) | .58 | 1.47 |
| Total from investment operations | 2.66 | 1.11 | 5.79 | (.16) | .71 | 1.58 |
| Distributions from net investment income | (.09) | (.17) | (.20) | (.14) | (.08) | (.09) |
| Distributions from net realized gain | (2.14) | (1.65) | (.07) | (.75) | (2.41) | (1.98) |
| Total distributions | (2.23) | (1.82) | (.27) | (.89) | (2.49) | (2.07) |
| Redemption fees added to paid in capitalA | – | – | –B | –B | –B | –B |
| Net asset value, end of period | $27.33 | $26.90 | $27.61 | $22.09 | $23.14 | $24.92 |
| Total ReturnC,D | 11.05% | 4.23% | 26.49% | (.78)% | 3.01% | 6.64% |
| Ratios to Average Net AssetsE,F | | | | | | |
| Expenses before reductions | .98%G | .94% | .81% | .91% | .96% | .98% |
| Expenses net of fee waivers, if any | .98%G | .94% | .81% | .91% | .96% | .97% |
| Expenses net of all reductions | .95%G | .93% | .80% | .90% | .95% | .97% |
| Net investment income (loss) | .94%G | .41% | .79% | .87% | .57% | .44% |
| Supplemental Data | | | | | | |
| Net assets, end of period (000 omitted) | $2,444,085 | $2,112,988 | $1,656,173 | $1,421,364 | $1,543,516 | $1,535,658 |
| Portfolio turnover rateH | 145%G | 117% | 111% | 117% | 151% | 163% |
A Calculated based on average shares outstanding during the period.
B Amount represents less than $.005 per share.
C Total returns for periods of less than one year are not annualized.
D Total returns would have been lower if certain expenses had not been reduced during the applicable periods shown.
E Fees and expenses of any underlying Fidelity Central Funds are not included in the Fund's expense ratio. The Fund indirectly bears its proportionate share of the expenses of any underlying Fidelity Central Funds.
F Expense ratios reflect operating expenses of the class. Expenses before reductions do not reflect amounts reimbursed by the investment adviser or reductions from brokerage service arrangements or reductions from other expense offset arrangements and do not represent the amount paid by the class during periods when reimbursements or reductions occur. Expenses net of fee waivers reflect expenses after reimbursement by the investment adviser but prior to reductions from brokerage service arrangements or other expense offset arrangements. Expenses net of all reductions represent the net expenses paid by the class.
G Annualized
H Amount does not include the portfolio activity of any underlying Fidelity Central Funds.
See accompanying notes which are an integral part of the financial statements.
Fidelity Worldwide Fund Class I
| | Six months ended (Unaudited) April 30, | Years endedOctober 31, | | | | |
| | 2019 | 2018 | 2017 | 2016 | 2015 | 2014 |
| Selected Per–Share Data | | | | | | |
| Net asset value, beginning of period | $26.77 | $27.49 | $21.99 | $23.03 | $24.81 | $25.31 |
| Income from Investment Operations | | | | | | |
| Net investment income (loss)A | .12 | .11 | .19 | .17 | .13 | .10 |
| Net realized and unrealized gain (loss) | 2.52 | .99 | 5.56 | (.35) | .58 | 1.47 |
| Total from investment operations | 2.64 | 1.10 | 5.75 | (.18) | .71 | 1.57 |
| Distributions from net investment income | (.09) | (.18) | (.18) | (.11) | (.07) | (.09) |
| Distributions from net realized gain | (2.14) | (1.65) | (.07) | (.75) | (2.41) | (1.98) |
| Total distributions | (2.23) | (1.82)B | (.25) | (.86) | (2.49)C | (2.07) |
| Redemption fees added to paid in capitalA | – | – | –D | –D | –D | –D |
| Net asset value, end of period | $27.18 | $26.77 | $27.49 | $21.99 | $23.03 | $24.81 |
| Total ReturnE,F | 11.06% | 4.22% | 26.45% | (.86)% | 3.00% | 6.63% |
| Ratios to Average Net AssetsG,H | | | | | | |
| Expenses before reductions | .98%I | .96% | .83% | .99% | .98% | 1.01% |
| Expenses net of fee waivers, if any | .97%I | .95% | .83% | .99% | .98% | 1.01% |
| Expenses net of all reductions | .95%I | .94% | .82% | .98% | .97% | 1.00% |
| Net investment income (loss) | .94%I | .40% | .77% | .78% | .55% | .40% |
| Supplemental Data | | | | | | |
| Net assets, end of period (000 omitted) | $44,886 | $50,956 | $21,711 | $12,924 | $25,173 | $19,107 |
| Portfolio turnover rateJ | 145%I | 117% | 111% | 117% | 151% | 163% |
A Calculated based on average shares outstanding during the period.
B Total distributions of $1.82 per share is comprised of distributions from net investment income of $.176 and distributions from net realized gain of $1.648 per share.
C Total distributions of $2.49 per share is comprised of distributions from net investment income of $.074 and distributions from net realized gain of $2.413 per share.
D Amount represents less than $.005 per share.
E Total returns for periods of less than one year are not annualized.
F Total returns would have been lower if certain expenses had not been reduced during the applicable periods shown.
G Fees and expenses of any underlying Fidelity Central Funds are not included in the Fund's expense ratio. The Fund indirectly bears its proportionate share of the expenses of any underlying Fidelity Central Funds.
H Expense ratios reflect operating expenses of the class. Expenses before reductions do not reflect amounts reimbursed by the investment adviser or reductions from brokerage service arrangements or reductions from other expense offset arrangements and do not represent the amount paid by the class during periods when reimbursements or reductions occur. Expenses net of fee waivers reflect expenses after reimbursement by the investment adviser but prior to reductions from brokerage service arrangements or other expense offset arrangements. Expenses net of all reductions represent the net expenses paid by the class.
I Annualized
J Amount does not include the portfolio activity of any underlying Fidelity Central Funds.
See accompanying notes which are an integral part of the financial statements.
Fidelity Worldwide Fund Class Z
| | Six months ended (Unaudited) April 30, | Years endedOctober 31, |
| | 2019 | 2018 A |
| Selected Per–Share Data | | |
| Net asset value, beginning of period | $26.78 | $29.54 |
| Income from Investment Operations | | |
| Net investment income (loss)B | .14 | (.01) |
| Net realized and unrealized gain (loss) | 2.52 | (2.75) |
| Total from investment operations | 2.66 | (2.76) |
| Distributions from net investment income | (.13) | – |
| Distributions from net realized gain | (2.14) | – |
| Total distributions | (2.27) | – |
| Net asset value, end of period | $27.17 | $26.78 |
| Total ReturnC,D | 11.14% | (9.34)% |
| Ratios to Average Net AssetsE,F | | |
| Expenses before reductions | .83%G | .88%G |
| Expenses net of fee waivers, if any | .83%G | .88%G |
| Expenses net of all reductions | .80%G | .87%G |
| Net investment income (loss) | 1.09%G | (.27)%G |
| Supplemental Data | | |
| Net assets, end of period (000 omitted) | $12,990 | $294 |
| Portfolio turnover rateH | 145%G | 117%G |
A For the period October 2, 2018 (commencement of sale of shares) to October 31, 2018.
B Calculated based on average shares outstanding during the period.
C Total returns for periods of less than one year are not annualized.
D Total returns would have been lower if certain expenses had not been reduced during the applicable periods shown.
E Fees and expenses of any underlying Fidelity Central Funds are not included in the Fund's expense ratio. The Fund indirectly bears its proportionate share of the expenses of any underlying Fidelity Central Funds.
F Expense ratios reflect operating expenses of the class. Expenses before reductions do not reflect amounts reimbursed by the investment adviser or reductions from brokerage service arrangements or reductions from other expense offset arrangements and do not represent the amount paid by the class during periods when reimbursements or reductions occur. Expense ratios before reductions for start-up periods may not be representative of longer-term operating periods. Expenses net of fee waivers reflect expenses after reimbursement by the investment adviser but prior to reductions from brokerage service arrangements or other expense offset arrangements. Expenses net of all reductions represent the net expenses paid by the class.
G Annualized
H Amount does not include the portfolio activity of any underlying Fidelity Central Funds.
See accompanying notes which are an integral part of the financial statements.
Notes to Financial Statements (Unaudited)
For the period ended April 30, 2019
1. Organization.
Fidelity Worldwide Fund (the Fund) is a fund of Fidelity Investment Trust (the Trust) and is authorized to issue an unlimited number of shares. The Trust is registered under the Investment Company Act of 1940, as amended (the 1940 Act), as an open-end management investment company organized as a Massachusetts business trust. The Fund offers Class A, Class M, Class C, Worldwide, Class I and Class Z shares, each of which has equal rights as to assets and voting privileges. Each class has exclusive voting rights with respect to matters that affect that class. Effective March 1, 2019, Class C shares will automatically convert to Class A shares after a holding period of ten years from the initial date of purchase, with certain exceptions.
2. Investments in Fidelity Central Funds.
The Fund invests in Fidelity Central Funds, which are open-end investment companies generally available only to other investment companies and accounts managed by the investment adviser and its affiliates. The Fund's Schedule of Investments lists each of the Fidelity Central Funds held as of period end, if any, as an investment of the Fund, but does not include the underlying holdings of each Fidelity Central Fund. As an Investing Fund, the Fund indirectly bears its proportionate share of the expenses of the underlying Fidelity Central Funds.
The Money Market Central Funds seek preservation of capital and current income and are managed by Fidelity Investments Money Management, Inc. (FIMM), an affiliate of the investment adviser. Annualized expenses of the Money Market Central Funds as of their most recent shareholder report date are less than .005%.
A complete unaudited list of holdings for each Fidelity Central Fund is available upon request or at the Securities and Exchange Commission (the SEC) website at www.sec.gov. In addition, the financial statements of the Fidelity Central Funds are available on the SEC website or upon request.
3. Significant Accounting Policies.
The Fund is an investment company and applies the accounting and reporting guidance of the Financial Accounting Standards Board (FASB) Accounting Standards Codification Topic 946 Financial Services – Investments Companies. The financial statements have been prepared in conformity with accounting principles generally accepted in the United States of America (GAAP), which require management to make certain estimates and assumptions at the date of the financial statements. Actual results could differ from those estimates. Subsequent events, if any, through the date that the financial statements were issued have been evaluated in the preparation of the financial statements. The following summarizes the significant accounting policies of the Fund:
Investment Valuation. Investments are valued as of 4:00 p.m. Eastern time on the last calendar day of the period. The Board of Trustees (the Board) has delegated the day to day responsibility for the valuation of the Fund's investments to the Fair Value Committee (the Committee) established by the Fund's investment adviser. In accordance with valuation policies and procedures approved by the Board, the Fund attempts to obtain prices from one or more third party pricing vendors or brokers to value its investments. When current market prices, quotations or currency exchange rates are not readily available or reliable, investments will be fair valued in good faith by the Committee, in accordance with procedures adopted by the Board. Factors used in determining fair value vary by investment type and may include market or investment specific events, changes in interest rates and credit quality. The frequency with which these procedures are used cannot be predicted and they may be utilized to a significant extent. The Committee oversees the Fund's valuation policies and procedures and reports to the Board on the Committee's activities and fair value determinations. The Board monitors the appropriateness of the procedures used in valuing the Fund's investments and ratifies the fair value determinations of the Committee.
The Fund categorizes the inputs to valuation techniques used to value its investments into a disclosure hierarchy consisting of three levels as shown below:
- Level 1 – quoted prices in active markets for identical investments
- Level 2 – other significant observable inputs (including quoted prices for similar investments, interest rates, prepayment speeds, etc.)
- Level 3 – unobservable inputs (including the Fund's own assumptions based on the best information available)
Valuation techniques used to value the Fund's investments by major category are as follows:
Equity securities, including restricted securities, for which market quotations are readily available, are valued at the last reported sale price or official closing price as reported by a third party pricing vendor on the primary market or exchange on which they are traded and are categorized as Level 1 in the hierarchy. In the event there were no sales during the day or closing prices are not available, securities are valued at the last quoted bid price or may be valued using the last available price and are generally categorized as Level 2 in the hierarchy. For foreign equity securities, when market or security specific events arise, comparisons to the valuation of American Depositary Receipts (ADRs), futures contracts, Exchange-Traded Funds (ETFs) and certain indexes as well as quoted prices for similar securities may be used and would be categorized as Level 2 in the hierarchy. For equity securities, including restricted securities, where observable inputs are limited, assumptions about market activity and risk are used and these securities may be categorized as Level 3 in the hierarchy.
Debt securities, including restricted securities, are valued based on evaluated prices received from third party pricing vendors or from brokers who make markets in such securities. U.S. government and government agency obligations are valued by pricing vendors who utilize matrix pricing which considers yield or price of bonds of comparable quality, coupon, maturity and type or by broker-supplied prices. When independent prices are unavailable or unreliable, debt securities may be valued utilizing pricing methodologies which consider similar factors that would be used by third party pricing vendors. Debt securities are generally categorized as Level 2 in the hierarchy but may be Level 3 depending on the circumstances.
ETFs are valued at their last sale price or official closing price as reported by a third party pricing vendor on the primary market or exchange on which they are traded and are categorized as Level 1 in the hierarchy. In the event there were no sales during the day but the exchange reports a closing bid level, ETFs are valued at the closing bid and would be categorized as Level 1 in the hierarchy. In the event there was no closing bid, ETFs may be valued by another method that the Board believes reflects fair value in accordance with the Board's fair value pricing policies and may be categorized as Level 2 in the hierarchy.
Investments in open-end mutual funds, including the Fidelity Central Funds, are valued at their closing net asset value (NAV) each business day and are categorized as Level 1 in the hierarchy.
Changes in valuation techniques may result in transfers in or out of an assigned level within the disclosure hierarchy. The aggregate value of investments by input level as of April 30, 2019 is included at the end of the Fund's Schedule of Investments.
Foreign Currency. The Fund may use foreign currency contracts to facilitate transactions in foreign-denominated securities. Gains and losses from these transactions may arise from changes in the value of the foreign currency or if the counterparties do not perform under the contracts' terms.
Foreign-denominated assets, including investment securities, and liabilities are translated into U.S. dollars at the exchange rates at period end. Purchases and sales of investment securities, income and dividends received and expenses denominated in foreign currencies are translated into U.S. dollars at the exchange rate in effect on the transaction date.
The effects of exchange rate fluctuations on investments are included with the net realized and unrealized gain (loss) on investment securities. Other foreign currency transactions resulting in realized and unrealized gain (loss) are disclosed separately.
Investment Transactions and Income. For financial reporting purposes, the Fund's investment holdings and NAV include trades executed through the end of the last business day of the period. The NAV per share for processing shareholder transactions is calculated as of the close of business of the New York Stock Exchange (NYSE), normally 4:00 p.m. Eastern time and includes trades executed through the end of the prior business day. Gains and losses on securities sold are determined on the basis of identified cost and include proceeds received from litigation. Dividend income is recorded on the ex-dividend date, except for certain dividends from foreign securities where the ex-dividend date may have passed, which are recorded as soon as the Fund is informed of the ex-dividend date. Non-cash dividends included in dividend income, if any, are recorded at the fair market value of the securities received. Income and capital gain distributions from Fidelity Central Funds, if any, are recorded on the ex-dividend date. Certain distributions received by the Fund represent a return of capital or capital gain. The Fund determines the components of these distributions subsequent to the ex-dividend date, based upon receipt of tax filings or other correspondence relating to the underlying investment. These distributions are recorded as a reduction of cost of investments and/or as a realized gain. Interest income is accrued as earned and includes coupon interest and amortization of premium and accretion of discount on debt securities as applicable. Investment income is recorded net of foreign taxes withheld where recovery of such taxes is uncertain.
Class Allocations and Expenses. Investment income, realized and unrealized capital gains and losses, common expenses of the Fund, and certain fund-level expense reductions, if any, are allocated daily on a pro-rata basis to each class based on the relative net assets of each class to the total net assets of the Fund. Each class differs with respect to transfer agent and distribution and service plan fees incurred. Certain expense reductions may also differ by class. For the reporting period, the allocated portion of income and expenses to each class as a percent of its average net assets may vary due to the timing of recording these transactions in relation to fluctuating net assets of the classes. Expenses directly attributable to a fund are charged to that fund. Expenses attributable to more than one fund are allocated among the respective funds on the basis of relative net assets or other appropriate methods. Expense estimates are accrued in the period to which they relate and adjustments are made when actual amounts are known.
Income Tax Information and Distributions to Shareholders. Each year, the Fund intends to qualify as a regulated investment company under Subchapter M of the Internal Revenue Code, including distributing substantially all of its taxable income and realized gains. As a result, no provision for U.S. Federal income taxes is required. The Fund files a U.S. federal tax return, in addition to state and local tax returns as required. The Fund's federal income tax returns are subject to examination by the Internal Revenue Service (IRS) for a period of three fiscal years after they are filed. State and local tax returns may be subject to examination for an additional fiscal year depending on the jurisdiction. Foreign taxes are provided for based on the Fund's understanding of the tax rules and rates that exist in the foreign markets in which it invests. The Fund is subject to a tax imposed on capital gains by certain countries in which it invests. An estimated deferred tax liability for net unrealized appreciation on the applicable securities is included in Other payables and accrued expenses on the Statement of Assets & Liabilities.
Distributions are declared and recorded on the ex-dividend date. Income and capital gain distributions are declared separately for each class. Income and capital gain distributions are determined in accordance with income tax regulations, which may differ from GAAP.
Capital accounts within the financial statements are adjusted for permanent book-tax differences. These adjustments have no impact on net assets or the results of operations. Capital accounts are not adjusted for temporary book-tax differences which will reverse in a subsequent period.
Book-tax differences are primarily due to foreign currency transactions, passive foreign investment companies (PFIC), market discount, partnerships, deferred trustees compensation and losses deferred due to wash sales.
As of period end, the cost and unrealized appreciation (depreciation) in securities, and derivatives if applicable, for federal income tax purposes were as follows:
| Gross unrealized appreciation | $525,014,261 |
| Gross unrealized depreciation | (28,188,648) |
| Net unrealized appreciation (depreciation) | $496,825,613 |
| Tax cost | $2,080,754,458 |
Restricted Securities. The Fund may invest in securities that are subject to legal or contractual restrictions on resale. These securities generally may be resold in transactions exempt from registration or to the public if the securities are registered. Disposal of these securities may involve time-consuming negotiations and expense, and prompt sale at an acceptable price may be difficult. Information regarding restricted securities is included at the end of the Fund's Schedule of Investments.
4. Derivative Instruments.
Risk Exposures and the Use of Derivative Instruments. The Fund's investment objective allows the Fund to enter into various types of derivative contracts, including futures contracts. Derivatives are investments whose value is primarily derived from underlying assets, indices or reference rates and may be transacted on an exchange or over-the-counter (OTC). Derivatives may involve a future commitment to buy or sell a specified asset based on specified terms, to exchange future cash flows at periodic intervals based on a notional principal amount, or for one party to make one or more payments upon the occurrence of specified events in exchange for periodic payments from the other party.
The Fund used derivatives to increase returns and to manage exposure to certain risks as defined below. The success of any strategy involving derivatives depends on analysis of numerous economic factors, and if the strategies for investment do not work as intended, the Fund may not achieve its objectives.
The Fund's use of derivatives increased or decreased its exposure to the following risk:
| Equity Risk | Equity risk relates to the fluctuations in the value of financial instruments as a result of changes in market prices (other than those arising from interest rate risk or foreign exchange risk), whether caused by factors specific to an individual investment, its issuer, or all factors affecting all instruments traded in a market or market segment.
|
The Fund is also exposed to additional risks from investing in derivatives, such as liquidity risk and counterparty credit risk. Liquidity risk is the risk that the Fund will be unable to close out the derivative in the open market in a timely manner. Counterparty credit risk is the risk that the counterparty will not be able to fulfill its obligation to the Fund. Counterparty credit risk related to exchange-traded futures contracts may be mitigated by the protection provided by the exchange on which they trade.
Investing in derivatives may involve greater risks than investing in the underlying assets directly and, to varying degrees, may involve risk of loss in excess of any initial investment and collateral received and amounts recognized in the Statement of Assets and Liabilities. In addition, there may be the risk that the change in value of the derivative contract does not correspond to the change in value of the underlying instrument.
Futures Contracts. A futures contract is an agreement between two parties to buy or sell a specified underlying instrument for a fixed price at a specified future date. The Fund used futures contracts to manage its exposure to the stock market.
Upon entering into a futures contract, a fund is required to deposit either cash or securities (initial margin) with a clearing broker in an amount equal to a certain percentage of the face value of the contract. Futures contracts are marked-to-market daily and subsequent daily payments (variation margin) are made or received by a fund depending on the daily fluctuations in the value of the futures contracts and are recorded as unrealized appreciation or (depreciation). This receivable and/or payable, if any, is included in daily variation margin on futures contracts in the Statement of Assets and Liabilities. Realized gain or (loss) is recorded upon the expiration or closing of a futures contract. The net realized gain (loss) and change in net unrealized appreciation (depreciation) on futures contracts during the period is presented in the Statement of Operations.
Any open futures contracts at period end are presented in the Schedule of Investments under the caption "Futures Contracts". The notional amount at value reflects each contract's exposure to the underlying instrument or index at period end.
5. Purchases and Sales of Investments.
Purchases and sales of securities, other than short-term securities, aggregated $1,905,628,700 and $1,635,785,216, respectively.
6. Fees and Other Transactions with Affiliates.
Management Fee. Fidelity Management & Research Company (the investment adviser) and its affiliates provide the Fund with investment management related services for which the Fund pays a monthly management fee. The management fee is the sum of an individual fund fee rate that is based on an annual rate of .424% of the Fund's average net assets and an annualized group fee rate that averaged .24% during the period. The group fee rate is based upon the average net assets of all the mutual funds advised by the investment adviser, including any mutual funds previously advised by the investment adviser that are currently advised by Fidelity SelectCo, LLC, an affiliate of the investment adviser. The group fee rate decreases as assets under management increase and increases as assets under management decrease. In addition, the management fee is subject to a performance adjustment (up to a maximum of +/- .20% of the Fund's average net assets over a 36 month performance period). The upward or downward adjustment to the management fee is based on the relative investment performance of Worldwide as compared to its benchmark index, the MSCI World Index, over the same 36 month performance period. For the reporting period, the total annualized management fee rate, including the performance adjustment, was .72% of the Fund's average net assets. The performance adjustment included in the management fee rate may be higher or lower than the maximum performance adjustment rate due to the difference between the average net assets for the reporting and performance periods.
Distribution and Service Plan Fees. In accordance with Rule 12b-1 of the 1940 Act, the Fund has adopted separate Distribution and Service Plans for each class of shares. Certain classes pay Fidelity Distributors Corporation (FDC), an affiliate of the investment adviser, separate Distribution and Service Fees, each of which is based on an annual percentage of each class' average net assets. In addition, FDC may pay financial intermediaries for selling shares of the Fund and providing shareholder support services. For the period, the Distribution and Service Fee rates, total fees and amounts retained by FDC were as follows:
| | Distribution Fee | Service Fee | Total Fees | Retained by FDC |
| Class A | -% | .25% | $55,685 | $2,875 |
| Class M | .25% | .25% | 31,834 | 406 |
| Class C | .75% | .25% | 58,685 | 10,821 |
| | | | $146,204 | $ 14,102 |
Sales Load. FDC may receive a front-end sales charge of up to 5.75% for selling Class A shares and 3.50% for selling Class M shares, some of which is paid to financial intermediaries for selling shares of the Fund. Depending on the holding period, FDC may receive contingent deferred sales charges levied on Class A, Class M and Class C redemptions. The deferred sales charges are 1.00% for Class C shares, 1.00% for certain purchases of Class A shares and .25% for certain purchases of Class M shares.
For the period, sales charge amounts retained by FDC were as follows:
| | Retained by FDC |
| Class A | $10,231 |
| Class M | 1,218 |
| Class C(a) | 645 |
| | $12,094 |
(a) When Class C shares are initially sold, FDC pays commissions from its own resources to financial intermediaries through which the sales are made.
Transfer Agent Fees. Fidelity Investments Institutional Operations Company, Inc., (FIIOC), an affiliate of the investment adviser, is the transfer, dividend disbursing and shareholder servicing agent for each class of the Fund. FIIOC receives account fees and asset-based fees that vary according to the account size and type of account of the shareholders of the respective classes of the Fund, except for Class Z. FIIOC receives an asset-based fee of Class Z's average net assets. FIIOC pays for typesetting, printing and mailing of shareholder reports, except proxy statements.
For the period, transfer agent fees for each class were as follows:
| | Amount | % of Class-Level Average Net Assets(a) |
| Class A | $48,001 | .22 |
| Class M | 15,838 | .25 |
| Class C | 15,418 | .26 |
| Worldwide | 2,160,640 | .19 |
| Class I | 48,223 | .19 |
| Class Z | 770 | .04 |
| | $2,288,890 | |
(a) Annualized
Accounting and Security Lending Fees. Fidelity Service Company, Inc. (FSC), an affiliate of the investment adviser, maintains the Fund's accounting records. The accounting fee is based on the level of average net assets for each month. Prior to April 1, 2019, FSC had a separate agreement with the Fund for administration of the security lending program, based on the number and duration of lending transactions. For the period, the total fees paid for accounting and administration of securities lending were equivalent to an annualized rate of .03%.
Brokerage Commissions. The Fund placed a portion of its portfolio transactions with brokerage firms which are affiliates of the investment adviser. Brokerage commissions are included in net realized gain (loss) and change in net unrealized appreciation (depreciation) in the Statement of Operations. The commissions paid to these affiliated firms were $26,911 for the period.
Interfund Trades. The Fund may purchase from or sell securities to other Fidelity Funds under procedures adopted by the Board. The procedures have been designed to ensure these interfund trades are executed in accordance with Rule 17a-7 of the 1940 Act. Interfund trades are included within the respective purchases and sales amounts shown in the Purchases and Sales of Investments note.
7. Committed Line of Credit.
The Fund participates with other funds managed by the investment adviser or an affiliate in a $4.25 billion credit facility (the "line of credit") to be utilized for temporary or emergency purposes to fund shareholder redemptions or for other short-term liquidity purposes. The Fund has agreed to pay commitment fees on its pro-rata portion of the line of credit, which amounted to $3,263 and is reflected in Miscellaneous expenses on the Statement of Operations. During the period, the Fund did not borrow on this line of credit.
8. Security Lending.
The Fund lends portfolio securities through a lending agent from time to time in order to earn additional income. For equity securities, a lending agent is used and may loan securities to certain qualified borrowers, including Fidelity Capital Markets (FCM), a broker-dealer affiliated with the Fund. On the settlement date of the loan, the Fund receives collateral (in the form of U.S. Treasury obligations, letters of credit and/or cash) against the loaned securities and maintains collateral in an amount not less than 100% of the market value of the loaned securities during the period of the loan. The market value of the loaned securities is determined at the close of business of the Fund and any additional required collateral is delivered to the Fund on the next business day. The Fund or borrower may terminate the loan at any time, and if the borrower defaults on its obligation to return the securities loaned because of insolvency or other reasons, the Fund may apply collateral received from the borrower against the obligation. The Fund may experience delays and costs in recovering the securities loaned. Any cash collateral received is invested in the Fidelity Securities Lending Cash Central Fund. The value of loaned securities and cash collateral at period end are disclosed on the Fund's Statement of Assets and Liabilities. Security lending income represents the income earned on investing cash collateral, less rebates paid to borrowers and any lending agent fees associated with the loan, plus any premium payments received for lending certain types of securities. Security lending income is presented in the Statement of Operations as a component of income from Fidelity Central Funds. Total security lending income during the period amounted to $107,028. During the period, there were no securities loaned to FCM.
9. Expense Reductions.
Commissions paid to certain brokers with whom the investment adviser, or its affiliates, places trades on behalf of the Fund include an amount in addition to trade execution, which may be rebated back to the Fund to offset certain expenses. This amount totaled $316,457 for the period. Through arrangements with the Fund's custodian, credits realized as a result of certain uninvested cash balances were used to reduce the Fund's expenses. During the period, these credits reduced the Fund's custody expenses by $1,230.
In addition, during the period the investment adviser reimbursed and/or waived a portion of fund-level operating expenses in the amount of $8,778 and a portion of class-level operating expenses as follows:
| | Amount |
| Class A | $304 |
| Class M | 86 |
| Class C | 78 |
| Worldwide | 15,172 |
| Class I | 351 |
| Class Z | 9 |
| | $16,000 |
10. Distributions to Shareholders.
Distributions to shareholders of each class were as follows:
| | Six months ended
April 30, 2019 | Year ended
October 31, 2018(a) |
| Distributions to shareholders | | |
| Class A | $3,477,297 | $2,051,466 |
| Class M | 999,954 | 654,014 |
| Class C | 1,007,630 | 633,808 |
| Worldwide | 181,843,298 | 109,503,017 |
| Class I | 4,378,836 | 1,506,486 |
| Class Z | 82,627 | – |
| Total | $191,789,642 | $114,348,791 |
(a) Distributions for Class Z are for the period October 2, 2018 (commencement of sale of shares) to October 31, 2018.
11. Share Transactions.
Share transactions for each class were as follows and may contain automatic conversions between classes or exchanges between affiliated funds:
| | Shares | Shares | Dollars | Dollars |
| | Six months ended April 30, 2019 | Year ended October 31, 2018(a) | Six months ended April 30, 2019 | Year ended October 31, 2018(a) |
| Class A | | | | |
| Shares sold | 339,080 | 609,144 | $8,407,519 | $17,061,872 |
| Reinvestment of distributions | 145,668 | 78,436 | 3,446,501 | 2,026,788 |
| Shares redeemed | (257,190) | (274,061) | (6,443,479) | (7,593,781) |
| Net increase (decrease) | 227,558 | 413,519 | $5,410,541 | $11,494,879 |
| Class M | | | | |
| Shares sold | 71,184 | 168,412 | $1,765,887 | $4,717,242 |
| Reinvestment of distributions | 42,261 | 25,202 | 992,713 | 648,710 |
| Shares redeemed | (75,333) | (102,871) | (1,909,563) | (2,844,892) |
| Net increase (decrease) | 38,112 | 90,743 | $849,037 | $2,521,060 |
| Class C | | | | |
| Shares sold | 62,050 | 162,206 | $1,497,929 | $4,408,829 |
| Reinvestment of distributions | 41,980 | 23,576 | 962,606 | 596,476 |
| Shares redeemed | (161,633) | (77,137) | (3,964,479) | (2,067,888) |
| Net increase (decrease) | (57,603) | 108,645 | $(1,503,944) | $2,937,417 |
| Worldwide | | | | |
| Shares sold | 12,684,716 | 25,541,865 | $326,191,356 | $707,560,818 |
| Reinvestment of distributions | 7,338,910 | 4,051,546 | 175,546,728 | 105,785,859 |
| Shares redeemed | (9,146,563) | (11,038,188) | (229,948,947) | (308,523,854) |
| Net increase (decrease) | 10,877,063 | 18,555,223 | $271,789,137 | $504,822,823 |
| Class I | | | | |
| Shares sold | 422,061 | 1,332,978 | $10,713,075 | $37,665,029 |
| Reinvestment of distributions | 180,011 | 55,805 | 4,282,467 | 1,449,814 |
| Shares redeemed | (853,855) | (275,288) | (21,839,174) | (7,566,057) |
| Net increase (decrease) | (251,783) | 1,113,495 | $(6,843,632) | $31,548,786 |
| Class Z | | | | |
| Shares sold | 473,132 | 10,966 | $12,375,899 | $300,656 |
| Reinvestment of distributions | 3,156 | – | 74,996 | – |
| Shares redeemed | (9,097) | – | (235,726) | – |
| Net increase (decrease) | 467,191 | 10,966 | $12,215,169 | $300,656 |
(a) Share transactions for Class Z are for the period October 2, 2018 (commencement of sale of shares) to October 31, 2018.
12. Other.
The Fund's organizational documents provide former and current trustees and officers with a limited indemnification against liabilities arising in connection with the performance of their duties to the Fund. In the normal course of business, the Fund may also enter into contracts that provide general indemnifications. The Fund's maximum exposure under these arrangements is unknown as this would be dependent on future claims that may be made against the Fund. The risk of material loss from such claims is considered remote.
Shareholder Expense Example
As a shareholder of the Fund, you incur two types of costs: (1) transaction costs, including sales charges (loads) on purchase payments or redemption proceeds, and (2) ongoing costs, including distribution and/or service (12b-1) fees and other Fund expenses. This Example is intended to help you understand your ongoing costs (in dollars) of investing in the Fund and to compare these costs with the ongoing costs of investing in other mutual funds.
The Example is based on an investment of $1,000 invested at the beginning of the period and held for the entire period (November 1, 2018 to April 30, 2019).
Actual Expenses
The first line of the accompanying table provides information about actual account values and actual expenses. You may use the information in this line, together with the amount you invested, to estimate the expenses that you paid over the period. Simply divide your account value by $1,000.00 (for example, an $8,600 account value divided by $1,000.00 = 8.6), then multiply the result by the number in the first line under the heading entitled "Expenses Paid During Period" to estimate the expenses you paid on your account during this period. In addition, the Fund, as a shareholder in the underlying Fidelity Central Funds, will indirectly bear its pro-rata share of the fees and expenses incurred by the underlying Fidelity Central Funds. These fees and expenses are not included in the Fund's annualized expense ratio used to calculate the expense estimate in the table below.
Hypothetical Example for Comparison Purposes
The second line of the accompanying table provides information about hypothetical account values and hypothetical expenses based on the Fund's actual expense ratio and an assumed rate of return of 5% per year before expenses, which is not the Fund's actual return. The hypothetical account values and expenses may not be used to estimate the actual ending account balance or expenses you paid for the period. You may use this information to compare the ongoing costs of investing in the Fund and other funds. To do so, compare this 5% hypothetical example with the 5% hypothetical examples that appear in the shareholder reports of the other funds. In addition, the Fund, as a shareholder in the underlying Fidelity Central Funds, will indirectly bear its pro-rata share of the fees and expenses incurred by the underlying Fidelity Central Funds. These fees and expenses are not included in the Fund's annualized expense ratio used to calculate the expense estimate in the table below.
Please note that the expenses shown in the table are meant to highlight your ongoing costs only and do not reflect any transaction costs. Therefore, the second line of the table is useful in comparing ongoing costs only, and will not help you determine the relative total costs of owning different funds.
| | Annualized Expense Ratio-A | Beginning
Account Value
November 1, 2018 | Ending
Account Value
April 30, 2019 | Expenses Paid
During Period-B
November 1, 2018
to April 30, 2019 |
| Diversified International | | | | |
| Diversified International | .69% | | | |
| Actual | | $1,000.00 | $1,095.40 | $3.58 |
| Hypothetical-C | | $1,000.00 | $1,021.37 | $3.46 |
| Class K | .57% | | | |
| Actual | | $1,000.00 | $1,096.10 | $2.96 |
| Hypothetical-C | | $1,000.00 | $1,021.97 | $2.86 |
| International Cap Appreciation | .98% | | | |
| Actual | | $1,000.00 | $1,161.60 | $5.25 |
| Hypothetical-C | | $1,000.00 | $1,019.93 | $4.91 |
| Overseas | | | | |
| Overseas | .87% | | | |
| Actual | | $1,000.00 | $1,088.40 | $4.50 |
| Hypothetical-C | | $1,000.00 | $1,020.48 | $4.36 |
| Class K | .75% | | | |
| Actual | | $1,000.00 | $1,088.80 | $3.88 |
| Hypothetical-C | | $1,000.00 | $1,021.08 | $3.76 |
| Worldwide | | | | |
| Class A | 1.25% | | | |
| Actual | | $1,000.00 | $1,108.70 | $6.54 |
| Hypothetical-C | | $1,000.00 | $1,018.60 | $6.26 |
| Class M | 1.53% | | | |
| Actual | | $1,000.00 | $1,107.60 | $8.00 |
| Hypothetical-C | | $1,000.00 | $1,017.21 | $7.65 |
| Class C | 2.04% | | | |
| Actual | | $1,000.00 | $1,104.80 | $10.65 |
| Hypothetical-C | | $1,000.00 | $1,014.68 | $10.19 |
| Worldwide | .98% | | | |
| Actual | | $1,000.00 | $1,110.50 | $5.13 |
| Hypothetical-C | | $1,000.00 | $1,019.93 | $4.91 |
| Class I | .97% | | | |
| Actual | | $1,000.00 | $1,110.60 | $5.08 |
| Hypothetical-C | | $1,000.00 | $1,019.98 | $4.86 |
| Class Z | .83% | | | |
| Actual | | $1,000.00 | $1,111.40 | $4.35 |
| Hypothetical-C | | $1,000.00 | $1,020.68 | $4.16 |
A Annualized expense ratio reflects expenses net of applicable fee waivers.
B Expenses are equal to each Class' annualized expense ratio, multiplied by the average account value over the period, multiplied by 181/ 365 (to reflect the one-half year period).
C 5% return per year before expenses
Board Approval of Investment Advisory Contracts and Management Fees
Broadly Diversified International Equity Funds
Each year, the Board of Trustees, including the Independent Trustees (together, the Board), votes on the renewal of the management contract with Fidelity Management & Research Company (FMR) and the sub-advisory agreements (together, the Advisory Contracts) for each fund. FMR and the sub-advisers are referred to herein as the Investment Advisers. The Board, assisted by the advice of fund counsel and Independent Trustees' counsel, requests and considers a broad range of information relevant to the renewal of the Advisory Contracts throughout the year.
The Board meets regularly and, at each of its meetings, covers an extensive agenda of topics and materials and considers factors that are relevant to its annual consideration of the renewal of each fund's Advisory Contracts, including the services and support provided to each fund and its shareholders. The Board has established various standing committees (Committees), each composed of and chaired by Independent Trustees with varying backgrounds, to which the Board has assigned specific subject matter responsibilities in order to enhance effective decision-making by the Board. The Board, acting directly and through its Committees, requests and receives information concerning the annual consideration of the renewal of each fund's Advisory Contracts. The Board also meets as needed to review matters specifically related to the Board's annual consideration of the renewal of the Advisory Contracts. Members of the Board may also meet with trustees of other Fidelity funds through joint ad hoc committees to discuss certain matters relevant to all of the Fidelity funds.
At its January 2019 meeting, the Board unanimously determined to renew each fund's Advisory Contracts. In reaching its determination, the Board considered all factors it believed relevant, including (i) the nature, extent, and quality of the services to be provided to each fund and its shareholders (including the investment performance of each fund); (ii) the competitiveness of each fund's management fee and total expense ratio relative to peer funds; (iii) the total costs of the services to be provided by and the profits to be realized by Fidelity from its relationships with each fund; and (iv) the extent to which, if any, economies of scale exist and would be realized as each fund grows, and whether any economies of scale are appropriately shared with fund shareholders.
In considering whether to renew the Advisory Contracts for each fund, the Board reached a determination, with the assistance of fund counsel and Independent Trustees' counsel and through the exercise of its business judgment, that the renewal of the Advisory Contracts was in the best interests of each fund and its shareholders and that the compensation payable under the Advisory Contracts was fair and reasonable. The Board's decision to renew the Advisory Contracts was not based on any single factor, but rather was based on a comprehensive consideration of all the information provided to the Board at its meetings throughout the year. The Board, in reaching its determination to renew the Advisory Contracts, was aware that shareholders of each fund have a broad range of investment choices available to them, including a wide choice among funds offered by Fidelity's competitors, and that each fund's shareholders, who have the opportunity to review and weigh the disclosure provided by the fund in its prospectus and other public disclosures, have chosen to invest in that fund, which is part of the Fidelity family of funds.
Nature, Extent, and Quality of Services Provided. The Board considered Fidelity's staffing as it relates to the funds, including the backgrounds of investment personnel of Fidelity, and also considered the funds' investment objectives, strategies, and related investment philosophies. The Independent Trustees also had discussions with senior management of Fidelity's investment operations and investment groups. The Board considered the structure of the investment personnel compensation program and whether this structure provides appropriate incentives to act in the best interests of each fund. Additionally, the Board considered the portfolio managers' investments, if any, in the funds that they manage.
Resources Dedicated to Investment Management and Support Services. The Board and the Fund Oversight and Research Committees reviewed the general qualifications and capabilities of Fidelity's investment staff, including its size, education, experience, and resources, as well as Fidelity's approach to recruiting, training, managing, and compensating investment personnel. The Board noted that Fidelity has continued to increase the resources devoted to non-U.S. offices, including expansion of Fidelity's global investment organization. The Board also noted that Fidelity's analysts have extensive resources, tools and capabilities that allow them to conduct sophisticated quantitative and fundamental analysis, as well as credit analysis of issuers, counterparties and guarantors. Further, the Board considered that Fidelity's investment professionals have sufficient access to global information and data so as to provide competitive investment results over time, and that those professionals also have access to sophisticated tools that permit them to assess portfolio construction and risk and performance attribution characteristics continuously, as well as to transmit new information and research conclusions rapidly around the world. Additionally, in its deliberations, the Board considered Fidelity's trading, risk management, compliance, and technology and operations capabilities and resources, which are integral parts of the investment management process.
Shareholder and Administrative Services. The Board considered (i) the nature, extent, quality, and cost of advisory, administrative, and shareholder services performed by the Investment Advisers and their affiliates under the Advisory Contracts and under separate agreements covering transfer agency, pricing and bookkeeping, and securities lending services for each fund; (ii) the nature and extent of the supervision of third party service providers, principally custodians, subcustodians, and pricing vendors; and (iii) the resources devoted to, and the record of compliance with, each fund's compliance policies and procedures. The Board also reviewed the allocation of fund brokerage, including allocations to brokers affiliated with the Investment Advisers, the use of brokerage commissions to pay fund expenses, and the use of "soft" commission dollars to pay for research services.
The Board noted that the growth of fund assets over time across the complex allows Fidelity to reinvest in the development of services designed to enhance the value and convenience of the Fidelity funds as investment vehicles. These services include 24-hour access to account information and market information through telephone representatives and over the Internet, investor education materials and asset allocation tools, and the expanded availability of Fidelity Investor Centers.
The Board noted that it and the boards of certain other Fidelity funds had formed an ad hoc Committee on Transfer Agency Fees to review the variety of transfer agency fee structures throughout the industry and Fidelity's competitive positioning with respect to industry participants.
Investment in a Large Fund Family. The Board considered the benefits to shareholders of investing in a Fidelity fund, including the benefits of investing in a fund that is part of a large family of funds offering a variety of investment disciplines and providing a large variety of mutual fund investor services. The Board noted that Fidelity had taken, or had made recommendations that resulted in the Fidelity funds taking, a number of actions over the previous year that benefited particular funds, including: (i) continuing to dedicate additional resources to Fidelity's investment research process, which includes meetings with management of issuers of securities in which the funds invest, and to the support of the senior management team that oversees asset management; (ii) continuing efforts to enhance Fidelity's global research capabilities; (iii) launching new funds and making other enhancements to meet client needs; (iv) launching new share classes of existing funds; (v) eliminating purchase minimums and broadening eligibility requirements for certain funds and share classes; (vi) reducing management fees and total expenses for certain growth equity funds and index funds; (vii) lowering expense caps for certain existing funds and classes, and converting certain voluntary expense caps to contractual caps, to reduce expenses borne by shareholders; (viii) eliminating short-term redemption fees for funds that had such fees; (ix) rationalizing product lines and gaining increased efficiencies from fund mergers and share class consolidations; (x) continuing to develop, acquire and implement systems and technology to improve services to the funds and shareholders, strengthen information security, and increase efficiency; and (xi) continuing to implement enhancements to further strengthen Fidelity's product line to increase investors' probability of success in achieving their investment goals, including retirement income goals.
Investment Performance. The Board considered whether each fund has operated in accordance with its investment objective, as well as its record of compliance with its investment restrictions and its performance history.
The Board took into account discussions that occur at Board meetings throughout the year with representatives of the Investment Advisers about fund investment performance. In this regard the Board noted that as part of regularly scheduled fund reviews and other reports to the Board on fund performance, the Board considers annualized return information for each fund for different time periods, measured against an appropriate securities market index ("benchmark index") and a peer group of funds with similar objectives ("peer group"), if any. In its evaluation of fund investment performance, the Board gave particular attention to information indicating changes in performance of certain Fidelity funds for specific time periods and discussed with the Investment Advisers the reasons for any overperformance or underperformance.
In addition to reviewing absolute and relative fund performance, the Independent Trustees periodically consider the appropriateness of fund performance metrics in evaluating the results achieved. In general, the Independent Trustees believe that fund performance should be evaluated based on net performance (after fees and expenses) of both the highest performing and lowest performing fund share classes, where applicable, compared to appropriate benchmark indices, over appropriate time periods that may include full market cycles, and compared to peer groups, as applicable, over the same periods, taking into account relevant factors including the following: general market conditions; issuer-specific information; and fund cash flows and other factors.
The Independent Trustees recognize that shareholders evaluate performance on a net basis over their own holding periods, for which one-, three-, and five-year periods are often used as a proxy. For this reason, the performance information reviewed by the Board also included net cumulative total return information for each fund and an appropriate benchmark index and peer group for the most recent one-, three-, and five-year periods ended June 30, 2018, as shown below. Returns are shown compared to the 25th percentile (top of box, 75% beaten) and 75th percentile (bottom of box, 25% beaten) of the peer universe. Returns of the benchmark index are "net MA,"
i.e., adjusted for tax withholding rates applicable to U.S.-based funds organized as Massachusetts business trusts.
Fidelity Diversified International Fund
The Board considered the fund's underperformance for different time periods based on the June 30, 2018 data presented above and based on earlier periods ended prior to June 30, 2018. The Board's discussions with FMR regarding underperformance cover topics including, but not limited to: the longer-term track record of a fund's portfolio manager(s); broader trends in the market that may adversely impact a fund's performance; attribution reports on contributors to the fund's underperformance; and the applicable portfolio manager's explanation of his or her underperformance. The Board engages with FMR on steps that might be taken to address a fund's underperformance.
Fidelity International Capital Appreciation Fund
Fidelity Overseas Fund

Fidelity Worldwide Fund
The Board also considered that each fund's management fee is subject to upward or downward adjustment depending upon whether, and to what extent, the fund's investment performance for the performance period (a rolling 36-month period) exceeds, or is exceeded by, a securities index, thus leading to a performance adjustment for the same period. The Board noted that the performance adjustment provides FMR with a strong economic incentive to seek to achieve superior long-term performance for each fund's shareholders and helps to more closely align the interests of FMR and the shareholders of each fund.
Based on its review, the Board concluded that the nature, extent, and quality of services provided to each fund under the Advisory Contracts should continue to benefit the shareholders of each fund.
Competitiveness of Management Fee and Total Expense Ratio. The Board considered each fund's management fee and total expense ratio compared to "mapped groups" of competitive funds and classes created for the purpose of facilitating the Trustees' competitive analysis of management fees and total expenses. Fidelity creates "mapped groups" by combining similar Lipper investment objective categories that have comparable investment mandates. Combining Lipper investment objective categories aids the Board's management fee and total expense ratio comparisons by broadening the competitive group used for comparison.
Management Fee. The Board considered two proprietary management fee comparisons for the 12-month periods (ended June 30 for 2018 and December 31 for prior periods) shown in basis points (BP) in the charts below. The group of Lipper funds used by the Board for management fee comparisons is referred to below as the "Total Mapped Group." The Total Mapped Group comparison focuses on a fund's standing in terms of gross management fees before expense reimbursements or caps, and without giving effect to a fund's performance adjustment, relative to the total universe of funds with comparable investment mandates, regardless of whether their management fee structures also are comparable. Funds with comparable investment mandates offer exposure to similar types of securities. Funds with comparable management fee structures have similar management fee contractual arrangements (
e.g., flat rate charged for advisory services, all-inclusive fee rate,
etc.). "TMG %" represents the percentage of funds in the Total Mapped Group that had management fees that were lower than a fund's. For example, a hypothetical TMG % of 20% would mean that 80% of the funds in the Total Mapped Group had higher, and 20% had lower, management fees than a fund. The funds' actual TMG %s and the number of funds in the Total Mapped Group are in the charts below. The "Asset-Size Peer Group" (ASPG) comparison focuses on a fund's standing relative to a subset of non-Fidelity funds within the Total Mapped Group that are similar in size and management fee structure without taking into account performance adjustments, if any. For example, if a fund is in the first quartile of the ASPG, the fund's management fee ranks in the least expensive or lowest 25% of funds in the ASPG. The ASPG represents at least 15% of the funds in the Total Mapped Group with comparable asset size and management fee structures, subject to a minimum of 50 funds (or all funds in the Total Mapped Group if fewer than 50). Additional information, such as the ASPG quartile in which a fund's management fee rate ranked and the impact of a fund's performance adjustment, is also included in the charts and was considered by the Board.
Fidelity Diversified International Fund
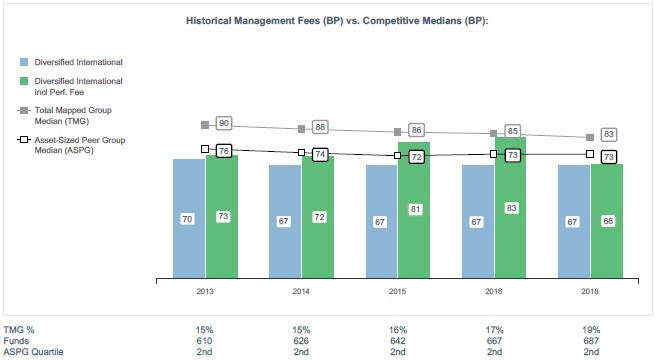
Fidelity International Capital Appreciation Fund
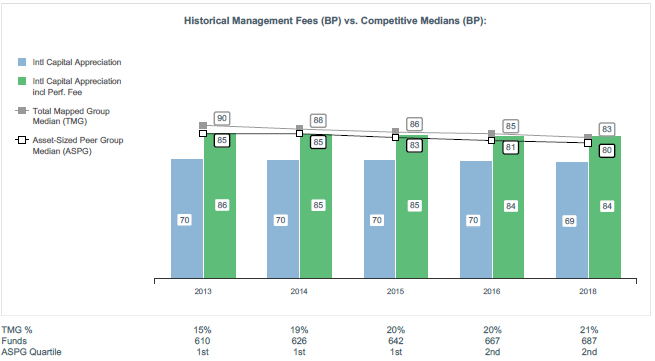
Fidelity Overseas Fund
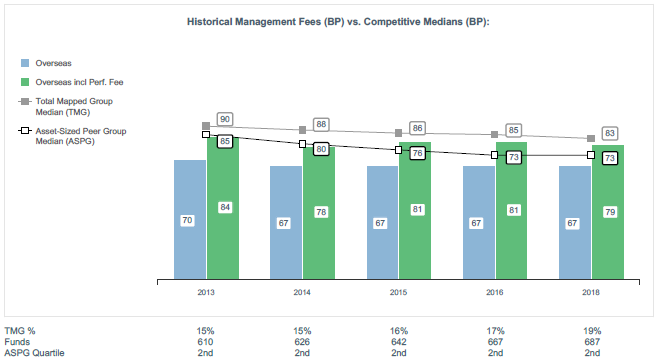
Fidelity Worldwide Fund
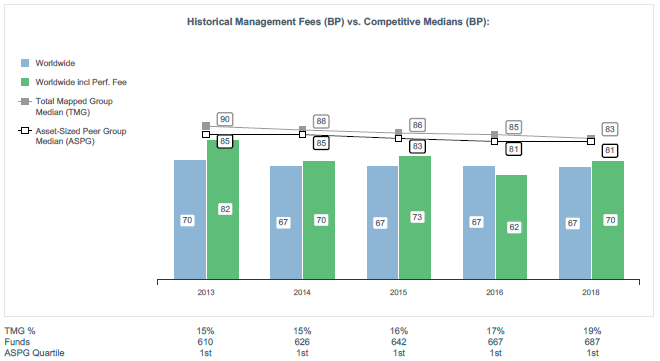
The Board noted that each fund's management fee rate ranked below the median of its Total Mapped Group and below the median of its ASPG for the 12-month period ended June 30, 2018. The Board also noted the effect of each fund's performance adjustment, if any, on the fund's management fee ranking.
The Board considered that it had approved a reduction (effective August 1, 2014) in the individual fund fee rate component of the management fee rate for Fidelity Diversified International Fund, Fidelity Overseas Fund, and Fidelity Worldwide Fund from 0.450% to 0.424%. The Board considered that the chart for each fund reflects the fund's lower management fee rate for 2014, as if the lower fee rate were in effect for the entire year.
The Board noted that it and the boards of other Fidelity funds formed an ad hoc Committee on Group Fee, which meets periodically, to conduct an in-depth review of the "group fee" component of the management fee of funds with such management fee structures. The Committee's focus included the mechanics of the group fee, the competitive landscape of group fee structures, Fidelity funds with no group fee component and investment products not included in group fee assets. The Board also considered that, for funds subject to the group fee, FMR agreed to voluntarily waive fees over a specified period of time in amounts designed to account for assets converted from certain funds to certain collective investment trusts.
The Board also noted that, in 2013, the ad hoc Committee on Management Fees was formed to conduct an in-depth review of the management fee rates of Fidelity's active equity mutual funds. The Committee focused on the following areas: (i) standard fee structures; (ii) research consumption and trading evolution; (iii) management fee competitiveness/profitability by category; and (iv) factors that drive institutional pricing.
Based on its review, the Board concluded that each fund's management fee is fair and reasonable in light of the services that the fund receives and the other factors considered.
Total Expense Ratio. In its review of Fidelity International Capital Appreciation Fund's total expense ratio, the Board considered the fund's management fee rate as well as other fund expenses, such as transfer agent fees, pricing and bookkeeping fees, and custodial, legal, and audit fees. The Board noted the impact of the fund's performance adjustment. The Board also noted that Fidelity may agree to waive fees and expenses from time to time, and the extent to which, if any, it has done so for the fund. As part of its review, the Board also considered the current and historical total expense ratios of the fund compared to competitive fund median expenses. The fund is compared to those funds and classes in the Total Mapped Group (used by the Board for management fee comparisons) that have a similar sales load structure.
In its review of the total expense ratio of each class of each of Fidelity Diversified International Fund, Fidelity Overseas Fund, and Fidelity Worldwide Fund, the Board considered the fund's management fee rate as well as other fund or class expenses, as applicable, such as transfer agent fees, pricing and bookkeeping fees, fund-paid 12b-1 fees (in the case of Fidelity Worldwide Fund), and custodial, legal, and audit fees. The Board noted the impact of each fund's performance adjustment. The Board also noted that Fidelity may agree to waive fees and expenses from time to time, and the extent to which, if any, it has done so for each fund. As part of its review, the Board also considered the current and historical total expense ratios of each class of each fund compared to competitive fund median expenses. Each class of each fund is compared to those funds and classes in the Total Mapped Group (used by the Board for management fee comparisons) that have a similar sales load structure.
The Board noted that the total expense ratio of Fidelity International Capital Appreciation Fund and each class of each of Fidelity Diversified International Fund and Fidelity Overseas Fund ranked below the competitive median for the 12-month period ended June 30, 2018.
The Board noted that the total expense ratio of each of Class A, Class I, and the retail class of Fidelity Worldwide Fund ranked below the competitive median for the 12-month period ended June 30, 2018, the total expense ratio of Class C ranked equal to the competitive median for the 12-month period ended June 30, 2018, and the total expense ratio of Class M ranked above the competitive median for the 12-month period ended June 30, 2018. The Board considered that, in general, various factors can affect total expense ratios. The Board noted that the total expense ratio of Class M was above the competitive median primarily because of higher 12b-1 fees on Class M as compared to most competitor funds. Class M has a higher 12b-1 fee, but a lower front-end sales charge, than traditionally priced front-end sales charge classes. The Board considered that Class M is primarily sold load-waived to retirement plans and intermediary wrap programs where its 0.50% 12b-1 fee is comparable to competing no-load, higher 12b-1 fee classes designed specifically for retirement plans and wrap programs. The Board noted that the fund offers multiple classes, each of which has a different sales load and 12b-1 fee structure, and that the multiple structures are intended to offer a range of pricing options for the intermediary market. The Board also noted that the total expense ratios of the classes vary primarily by the level of their 12b-1 fees, although differences in transfer agent fees may also cause expenses to vary from class to class.
Fees Charged to Other Fidelity Clients. The Board also considered Fidelity fee structures and other information with respect to clients of Fidelity, such as other funds advised or subadvised by Fidelity, pension plan clients, and other institutional clients with similar mandates. The Board noted that a joint ad hoc committee created by it and the boards of other Fidelity funds periodically reviews and compares Fidelity's institutional investment advisory business with its business of providing services to the Fidelity funds and also noted the most recent findings of the committee. The Board noted that the committee's review included a consideration of the differences in services provided, fees charged, and costs incurred, as well as competition in the markets serving the different categories of clients.
Based on its review of total expense ratios and fees charged to other Fidelity clients, the Board concluded that the total expense ratio of Fidelity International Capital Appreciation Fund and the total expense ratio of each class of Fidelity Diversified International Fund, Fidelity Overseas Fund, and Fidelity Worldwide Fund were reasonable in light of the services that each fund and its shareholders receive and the other factors considered.
Costs of the Services and Profitability. The Board considered the revenues earned and the expenses incurred by Fidelity in conducting the business of developing, marketing, distributing, managing, administering and servicing each fund and servicing each fund's shareholders. The Board also considered the level of Fidelity's profits in respect of all the Fidelity funds.
On an annual basis, Fidelity presents to the Board information about the profitability of its relationships with each fund. Fidelity calculates profitability information for each fund, as well as aggregate profitability information for groups of Fidelity funds and all Fidelity funds, using a series of detailed revenue and cost allocation methodologies which originate with the books and records of Fidelity on which Fidelity's audited financial statements are based. The Audit Committee of the Board reviews any significant changes from the prior year's methodologies.
PricewaterhouseCoopers LLP (PwC), auditor to Fidelity and certain Fidelity funds, has been engaged annually by the Board as part of the Board's assessment of Fidelity's profitability analysis. PwC's engagement includes the review and assessment of the methodologies used by Fidelity in determining the revenues and expenses attributable to Fidelity's mutual fund business, and completion of agreed-upon procedures in respect of the mathematical accuracy of the fund profitability information and its conformity to established allocation methodologies. After considering PwC's reports issued under the engagement and information provided by Fidelity, the Board concluded that while other allocation methods may also be reasonable, Fidelity's profitability methodologies are reasonable in all material respects.
The Board also reviewed Fidelity's non-fund businesses and potential indirect benefits such businesses may have received as a result of their association with Fidelity's mutual fund business (i.e., fall-out benefits) as well as cases where Fidelity's affiliates may benefit from the funds' business. The Board noted that changes to fall-out benefits year-over-year reflect business developments at Fidelity's various businesses.
The Board considered the costs of the services provided by and the profits realized by Fidelity in connection with the operation of each fund and was satisfied that the profitability was not excessive.
Economies of Scale. The Board considered whether there have been economies of scale in respect of the management of the Fidelity funds, whether the Fidelity funds (including each fund) have appropriately benefited from any such economies of scale, and whether there is potential for realization of any further economies of scale. The Board considered the extent to which each fund will benefit from economies of scale as assets grow through increased services to the fund, through waivers or reimbursements, or through fee or expense ratio reductions. The Board also noted that a committee (the Economies of Scale Committee) created by it and the boards of other Fidelity funds periodically analyzes whether Fidelity attains economies of scale in respect of the management and servicing of the Fidelity funds, whether the Fidelity funds have appropriately benefited from such economies of scale, and whether there is potential for realization of any further economies of scale.
The Board recognized that each fund's management contract incorporates a "group fee" structure, which provides for lower group fee rates as total group assets increase, and for higher group fee rates as total group assets decrease (with "group assets" defined to include fund assets under FMR's management plus the assets of sector funds previously under FMR's management). FMR calculates the group fee rates based on a tiered asset "breakpoint" schedule that varies based on asset class. The Board considered that the group fee is designed to deliver the benefits of economies of scale to fund shareholders when total Fidelity fund assets increase, even if assets of any particular fund are unchanged or have declined, because some portion of Fidelity's costs are attributable to services provided to all Fidelity funds, and all funds benefit if those costs can be allocated among more assets. The Board concluded that, given the group fee structure, fund shareholders will benefit from lower management fees as group assets increase at the fund complex level, regardless of whether Fidelity achieves any such economies of scale.
The Board concluded, taking into account the analysis of the Economies of Scale Committee, that economies of scale, if any, are being appropriately shared between fund shareholders and Fidelity.
Additional Information Requested by the Board. In order to develop fully the factual basis for consideration of the Fidelity funds' advisory contracts, the Board requested and received additional information on certain topics, including: (i) fund performance trends, in particular the underperformance of certain funds, and Fidelity's long-term strategies for certain funds; (ii) Fidelity's fund profitability methodology, profitability trends for certain funds, and the impact of certain factors on fund profitability results; (iii) metrics for evaluating index fund and ETF performance and information about ETF trading characteristics; (iv) the methodology with respect to the evaluation of competitive fund data and peer group classifications and fee comparisons; (v) the expense structures for different funds and classes; (vi) information regarding other accounts managed by Fidelity, including collective investment trusts; and (vii) Fidelity's philosophies and strategies for evaluating funds and classes with lower or declining asset levels.
Based on its evaluation of all of the conclusions noted above, and after considering all factors it believed relevant, the Board concluded that the advisory fee arrangements are fair and reasonable, and that each fund's Advisory Contracts should be renewed.
IBD-SANN-0619
1.703569.121
Fidelity® International Growth Fund
Semi-Annual Report April 30, 2019 Includes Fidelity and Fidelity Advisor share classes |
|
Beginning on January 1, 2021, as permitted by regulations adopted by the Securities and Exchange Commission, paper copies of a fund’s shareholder reports will no longer be sent by mail, unless you specifically request paper copies of the reports from the fund or from your financial intermediary, such as a financial advisor, broker-dealer or bank. Instead, the reports will be made available on a website, and you will be notified by mail each time a report is posted and provided with a website link to access the report.
If you already elected to receive shareholder reports electronically, you will not be affected by this change and you need not take any action. You may elect to receive shareholder reports and other communications from a fund electronically, by contacting your financial intermediary. For Fidelity customers, visit Fidelity's web site or call Fidelity using the contact information listed below.
You may elect to receive all future reports in paper free of charge. If you wish to continue receiving paper copies of your shareholder reports, you may contact your financial intermediary or, if you are a Fidelity customer, visit Fidelity’s website, or call Fidelity at the applicable toll-free number listed below. Your election to receive reports in paper will apply to all funds held with the fund complex/your financial intermediary.
| Account Type | Website | Phone Number |
| Brokerage, Mutual Fund, or Annuity Contracts: | fidelity.com/mailpreferences | 1-800-343-3548 |
| Employer Provided Retirement Accounts: | netbenefits.fidelity.com/preferences (choose 'no' under Required Disclosures to continue to print) | 1-800-343-0860 |
| Advisor Sold Accounts Serviced Through Your Financial Intermediary: | Contact Your Financial Intermediary | Your Financial Intermediary's phone number |
| Advisor Sold Accounts Serviced by Fidelity: | institutional.fidelity.com | 1-877-208-0098 |
Contents
To view a fund's proxy voting guidelines and proxy voting record for the 12-month period ended June 30, visit http://www.fidelity.com/proxyvotingresults or visit the Securities and Exchange Commission's (SEC) web site at http://www.sec.gov.
You may also call 1-800-544-8544 if you’re an individual investing directly with Fidelity, call 1-800-835-5092 if you’re a plan sponsor or participant with Fidelity as your recordkeeper or call 1-877-208-0098 on institutional accounts or if you’re an advisor or invest through one to request a free copy of the proxy voting guidelines.
Standard & Poor's, S&P and S&P 500 are registered service marks of The McGraw-Hill Companies, Inc. and have been licensed for use by Fidelity Distributors Corporation.
Other third-party marks appearing herein are the property of their respective owners.
All other marks appearing herein are registered or unregistered trademarks or service marks of FMR LLC or an affiliated company. © 2019 FMR LLC. All rights reserved.
This report and the financial statements contained herein are submitted for the general information of the shareholders of the Fund. This report is not authorized for distribution to prospective investors in the Fund unless preceded or accompanied by an effective prospectus.
A fund files its complete schedule of portfolio holdings with the SEC for the first and third quarters of each fiscal year on Form N-PORT. Forms N-PORT are available on the SEC’s web site at http://www.sec.gov. A fund's Forms N-PORT may be reviewed and copied at the SEC’s Public Reference Room in Washington, DC. Information regarding the operation of the SEC's Public Reference Room may be obtained by calling 1-800-SEC-0330.
For a complete list of a fund's portfolio holdings, view the most recent holdings listing, semiannual report, or annual report on Fidelity's web site at http://www.fidelity.com, http://www.institutional.fidelity.com, or http://www.401k.com, as applicable.
NOT FDIC INSURED •MAY LOSE VALUE •NO BANK GUARANTEE
Neither the Fund nor Fidelity Distributors Corporation is a bank.
Investment Summary (Unaudited)
Geographic Diversification (% of fund's net assets)
| As of April 30, 2019 |
| | United States of America* | 22.7% |
| | Japan | 13.3% |
| | Switzerland | 9.9% |
| | Germany | 8.8% |
| | United Kingdom | 5.9% |
| | Sweden | 4.7% |
| | France | 3.9% |
| | Hong Kong | 3.5% |
| | Spain | 3.4% |
| | Other | 23.9% |

* Includes Short-Term Investments and Net Other Assets (Liabilities).
Percentages are based on country or territory of incorporation and are adjusted for the effect of futures contracts, if applicable.
Asset Allocation as of April 30, 2019
| | % of fund's net assets |
| Stocks | 96.3 |
| Short-Term Investments and Net Other Assets (Liabilities) | 3.7 |
Top Ten Stocks as of April 30, 2019
| | % of fund's net assets |
| Nestle SA (Reg. S) (Switzerland, Food Products) | 5.4 |
| SAP SE (Germany, Software) | 3.9 |
| AIA Group Ltd. (Hong Kong, Insurance) | 3.5 |
| Roche Holding AG (participation certificate) (Switzerland, Pharmaceuticals) | 3.3 |
| CSL Ltd. (Australia, Biotechnology) | 3.3 |
| ASML Holding NV (Netherlands) (Netherlands, Semiconductors & Semiconductor Equipment) | 3.3 |
| Keyence Corp. (Japan, Electronic Equipment & Components) | 3.0 |
| MasterCard, Inc. Class A (United States of America, IT Services) | 2.9 |
| Visa, Inc. Class A (United States of America, IT Services) | 2.6 |
| Amadeus IT Holding SA Class A (Spain, IT Services) | 2.3 |
| | 33.5 |
Top Market Sectors as of April 30, 2019
| | % of fund's net assets |
| Industrials | 22.3 |
| Information Technology | 21.9 |
| Financials | 15.1 |
| Health Care | 9.5 |
| Consumer Discretionary | 8.0 |
| Materials | 7.4 |
| Consumer Staples | 7.1 |
| Communication Services | 3.4 |
| Real Estate | 1.2 |
| Energy | 0.4 |
Schedule of Investments April 30, 2019 (Unaudited)
Showing Percentage of Net Assets
| Common Stocks - 95.9% | | | |
| | | Shares | Value |
| Australia - 3.3% | | | |
| CSL Ltd. | | 672,255 | $94,103,547 |
| Austria - 1.0% | | | |
| Andritz AG (a) | | 580,421 | 27,667,508 |
| Bailiwick of Jersey - 1.1% | | | |
| Experian PLC | | 1,052,800 | 30,645,864 |
| Belgium - 0.7% | | | |
| KBC Groep NV | | 263,108 | 19,482,630 |
| Brazil - 0.5% | | | |
| BM&F BOVESPA SA | | 1,179,300 | 10,361,094 |
| Itau Unibanco Holding SA | | 346,350 | 2,592,480 |
|
| TOTAL BRAZIL | | | 12,953,574 |
|
| Canada - 2.5% | | | |
| Alimentation Couche-Tard, Inc. Class B (sub. vtg.) | | 257,200 | 15,164,759 |
| Canadian National Railway Co. | | 168,500 | 15,651,370 |
| Canadian Pacific Railway Ltd. | | 69,100 | 15,482,382 |
| Franco-Nevada Corp. | | 171,800 | 12,309,533 |
| Pason Systems, Inc. | | 362,800 | 5,402,598 |
| PrairieSky Royalty Ltd. | | 384,700 | 5,544,941 |
|
| TOTAL CANADA | | | 69,555,583 |
|
| Cayman Islands - 1.3% | | | |
| Alibaba Group Holding Ltd. sponsored ADR (a) | | 204,800 | 38,004,736 |
| Denmark - 0.3% | | | |
| Jyske Bank A/S (Reg.) | | 211,600 | 8,522,747 |
| Finland - 0.2% | | | |
| Tikkurila Oyj | | 294,104 | 4,921,616 |
| France - 3.9% | | | |
| Edenred SA (b) | | 555,800 | 26,188,416 |
| Elis SA | | 384,036 | 6,848,683 |
| Legrand SA | | 333,600 | 24,515,341 |
| Safran SA | | 352,800 | 51,424,525 |
|
| TOTAL FRANCE | | | 108,976,965 |
|
| Germany - 8.8% | | | |
| Deutsche Borse AG | | 188,200 | 25,147,727 |
| Linde PLC | | 313,679 | 56,432,308 |
| MTU Aero Engines Holdings AG | | 147,200 | 34,621,369 |
| SAP SE | | 851,001 | 109,701,047 |
| Vonovia SE | | 425,000 | 21,197,960 |
|
| TOTAL GERMANY | | | 247,100,411 |
|
| Hong Kong - 3.5% | | | |
| AIA Group Ltd. | | 9,587,200 | 98,167,517 |
| India - 1.2% | | | |
| Housing Development Finance Corp. Ltd. | | 1,197,878 | 34,313,416 |
| Ireland - 2.2% | | | |
| CRH PLC sponsored ADR | | 1,426,666 | 48,007,311 |
| James Hardie Industries PLC CDI | | 1,023,489 | 13,910,685 |
|
| TOTAL IRELAND | | | 61,917,996 |
|
| Italy - 0.7% | | | |
| Interpump Group SpA | | 527,526 | 19,809,218 |
| Japan - 13.3% | | | |
| Azbil Corp. | | 645,800 | 15,461,633 |
| DENSO Corp. | | 623,000 | 27,141,425 |
| East Japan Railway Co. | | 348,200 | 32,711,639 |
| Fanuc Corp. (c) | | 167,100 | 31,394,007 |
| Hoya Corp. | | 569,700 | 39,967,732 |
| Keyence Corp. (c) | | 137,524 | 85,332,904 |
| Komatsu Ltd. | | 936,400 | 24,187,596 |
| Misumi Group, Inc. | | 1,236,100 | 31,935,866 |
| Nabtesco Corp. | | 525,100 | 15,979,972 |
| OSG Corp. | | 691,300 | 13,832,826 |
| SHO-BOND Holdings Co. Ltd. | | 237,400 | 16,282,023 |
| USS Co. Ltd. | | 2,169,400 | 41,403,514 |
|
| TOTAL JAPAN | | | 375,631,137 |
|
| Kenya - 0.4% | | | |
| Safaricom Ltd. | | 40,556,800 | 11,286,939 |
| Korea (South) - 0.4% | | | |
| BGF Retail Co. Ltd. | | 56,572 | 10,619,309 |
| Netherlands - 3.3% | | | |
| ASML Holding NV (Netherlands) | | 444,500 | 92,501,190 |
| New Zealand - 0.5% | | | |
| Auckland International Airport Ltd. | | 2,518,940 | 13,408,728 |
| Norway - 0.7% | | | |
| Adevinta ASA Class B | | 813,800 | 8,006,461 |
| Schibsted ASA (B Shares) | | 538,000 | 12,870,918 |
|
| TOTAL NORWAY | | | 20,877,379 |
|
| South Africa - 1.9% | | | |
| Clicks Group Ltd. | | 1,269,838 | 17,368,508 |
| Naspers Ltd. Class N | | 139,900 | 35,989,350 |
|
| TOTAL SOUTH AFRICA | | | 53,357,858 |
|
| Spain - 3.4% | | | |
| Amadeus IT Holding SA Class A | | 818,000 | 65,066,887 |
| Grifols SA ADR | | 524,341 | 10,035,887 |
| Merlin Properties Socimi SA | | 500,000 | 6,813,720 |
| Prosegur Compania de Seguridad SA (Reg.) | | 2,675,749 | 13,919,195 |
|
| TOTAL SPAIN | | | 95,835,689 |
|
| Sweden - 4.7% | | | |
| ASSA ABLOY AB (B Shares) | | 2,916,583 | 62,349,450 |
| Atlas Copco AB (A Shares) (b) | | 1,276,200 | 39,835,698 |
| Epiroc AB Class A | | 1,801,600 | 18,624,224 |
| Fagerhult AB | | 552,394 | 4,718,261 |
| Loomis AB (B Shares) | | 224,000 | 8,287,393 |
|
| TOTAL SWEDEN | | | 133,815,026 |
|
| Switzerland - 9.9% | | | |
| Nestle SA (Reg. S) | | 1,572,649 | 151,410,952 |
| Roche Holding AG (participation certificate) | | 358,183 | 94,511,372 |
| Schindler Holding AG: | | | |
| (participation certificate) | | 138,558 | 29,888,658 |
| (Reg.) | | 18,350 | 3,897,090 |
|
| TOTAL SWITZERLAND | | | 279,708,072 |
|
| Taiwan - 1.3% | | | |
| Taiwan Semiconductor Manufacturing Co. Ltd. | | 4,332,000 | 36,370,434 |
| United Kingdom - 5.9% | | | |
| BAE Systems PLC | | 1,637,000 | 10,521,461 |
| Elementis PLC | | 2,617,462 | 5,546,402 |
| Informa PLC | | 1,468,666 | 14,918,944 |
| InterContinental Hotel Group PLC ADR | | 769,970 | 50,902,717 |
| Prudential PLC | | 2,067,865 | 46,984,750 |
| Rightmove PLC | | 1,892,200 | 13,338,920 |
| Shaftesbury PLC | | 601,533 | 6,741,910 |
| Spectris PLC | | 518,557 | 18,581,930 |
|
| TOTAL UNITED KINGDOM | | | 167,537,034 |
|
| United States of America - 19.0% | | | |
| Alphabet, Inc. Class A (a) | | 37,336 | 44,764,371 |
| Autoliv, Inc. (b) | | 256,369 | 20,122,403 |
| Berkshire Hathaway, Inc. Class B (a) | | 156,684 | 33,954,990 |
| Black Knight, Inc. (a) | | 318,400 | 17,964,128 |
| Marsh & McLennan Companies, Inc. | | 311,551 | 29,376,144 |
| Martin Marietta Materials, Inc. | | 142,200 | 31,554,180 |
| MasterCard, Inc. Class A | | 317,600 | 80,746,624 |
| Mohawk Industries, Inc. (a) | | 83,000 | 11,308,750 |
| Moody's Corp. | | 157,900 | 31,046,298 |
| MSCI, Inc. | | 171,400 | 38,630,132 |
| PayPal Holdings, Inc. (a) | | 147,900 | 16,678,683 |
| PriceSmart, Inc. | | 114,931 | 6,874,023 |
| ResMed, Inc. | | 294,500 | 30,778,195 |
| S&P Global, Inc. | | 149,400 | 32,966,604 |
| Sherwin-Williams Co. | | 79,200 | 36,022,536 |
| Visa, Inc. Class A | | 440,960 | 72,507,053 |
|
| TOTAL UNITED STATES OF AMERICA | | | 535,295,114 |
|
| TOTAL COMMON STOCKS | | | |
| (Cost $2,040,789,587) | | | 2,702,387,237 |
|
| Nonconvertible Preferred Stocks - 0.4% | | | |
| Brazil - 0.4% | | | |
| Itau Unibanco Holding SA | | | |
| (Cost $10,655,232) | | 1,240,550 | 10,703,070 |
|
| Money Market Funds - 5.7% | | | |
| Fidelity Cash Central Fund, 2.49% (d) | | 93,430,336 | 93,449,022 |
| Fidelity Securities Lending Cash Central Fund 2.49% (d)(e) | | 68,462,880 | 68,469,727 |
| TOTAL MONEY MARKET FUNDS | | | |
| (Cost $161,917,606) | | | 161,918,749 |
| TOTAL INVESTMENT IN SECURITIES - 102.0% | | | |
| (Cost $2,213,362,425) | | | 2,875,009,056 |
| NET OTHER ASSETS (LIABILITIES) - (2.0)% | | | (57,589,738) |
| NET ASSETS - 100% | | | $2,817,419,318 |
Categorizations in the Schedule of Investments are based on country or territory of incorporation.
Legend
(a) Non-income producing
(b) Security or a portion of the security is on loan at period end.
(c) Security or a portion of the security purchased on a delayed delivery or when-issued basis.
(d) Affiliated fund that is generally available only to investment companies and other accounts managed by Fidelity Investments. The rate quoted is the annualized seven-day yield of the fund at period end. A complete unaudited listing of the fund's holdings as of its most recent quarter end is available upon request. In addition, each Fidelity Central Fund's financial statements are available on the SEC's website or upon request.
(e) Investment made with cash collateral received from securities on loan.
Affiliated Central Funds
Information regarding fiscal year to date income earned by the Fund from investments in Fidelity Central Funds is as follows:
| Fund | Income earned |
| Fidelity Cash Central Fund | $1,324,426 |
| Fidelity Securities Lending Cash Central Fund | 61,375 |
| Total | $1,385,801 |
Amounts in the income column in the above table include any capital gain distributions from underlying funds, which are presented in the corresponding line-item in the Statement of Operations, if applicable.
Investment Valuation
The following is a summary of the inputs used, as of April 30, 2019, involving the Fund's assets and liabilities carried at fair value. The inputs or methodology used for valuing securities may not be an indication of the risk associated with investing in those securities. For more information on valuation inputs, and their aggregation into the levels used below, please refer to the Investment Valuation section in the accompanying Notes to Financial Statements.
| | Valuation Inputs at Reporting Date: |
| Description | Total | Level 1 | Level 2 | Level 3 |
| Investments in Securities: | | | | |
| Equities: | | | | |
| Communication Services | $97,180,092 | $97,180,092 | $-- | $-- |
| Consumer Discretionary | 224,872,895 | 188,883,545 | 35,989,350 | -- |
| Consumer Staples | 201,437,551 | 50,026,599 | 151,410,952 | -- |
| Energy | 10,947,539 | 10,947,539 | -- | -- |
| Financials | 422,249,599 | 251,949,605 | 170,299,994 | -- |
| Health Care | 269,396,733 | 174,885,361 | 94,511,372 | -- |
| Industrials | 624,628,763 | 342,640,284 | 281,988,479 | -- |
| Information Technology | 618,918,974 | 472,847,493 | 146,071,481 | -- |
| Materials | 208,704,571 | 208,704,571 | -- | -- |
| Real Estate | 34,753,590 | 34,753,590 | -- | -- |
| Money Market Funds | 161,918,749 | 161,918,749 | -- | -- |
| Total Investments in Securities: | $2,875,009,056 | $1,994,737,428 | $880,271,628 | $-- |
See accompanying notes which are an integral part of the financial statements.
Financial Statements
Statement of Assets and Liabilities
| | | April 30, 2019 (Unaudited) |
| Assets | | |
Investment in securities, at value (including securities loaned of $65,251,206) — See accompanying schedule:
Unaffiliated issuers (cost $2,051,444,819) | $2,713,090,307 | |
| Fidelity Central Funds (cost $161,917,606) | 161,918,749 | |
| Total Investment in Securities (cost $2,213,362,425) | | $2,875,009,056 |
| Foreign currency held at value (cost $14,870) | | 14,515 |
| Receivable for investments sold | | 223,659 |
| Receivable for fund shares sold | | 3,500,119 |
| Dividends receivable | | 14,485,937 |
| Distributions receivable from Fidelity Central Funds | | 184,463 |
| Prepaid expenses | | 1,167 |
| Other receivables | | 55,819 |
| Total assets | | 2,893,474,735 |
| Liabilities | | |
| Payable for investments purchased | | |
| Regular delivery | $1,357,806 | |
| Delayed delivery | 1,437,192 | |
| Payable for fund shares redeemed | 2,221,842 | |
| Accrued management fee | 1,773,870 | |
| Distribution and service plan fees payable | 91,462 | |
| Other affiliated payables | 452,892 | |
| Other payables and accrued expenses | 258,293 | |
| Collateral on securities loaned | 68,462,060 | |
| Total liabilities | | 76,055,417 |
| Net Assets | | $2,817,419,318 |
| Net Assets consist of: | | |
| Paid in capital | | $2,239,555,318 |
| Total distributable earnings (loss) | | 577,864,000 |
| Net Assets | | $2,817,419,318 |
| Net Asset Value and Maximum Offering Price | | |
| Class A: | | |
| Net Asset Value and redemption price per share ($155,739,434 ÷ 11,057,787 shares) | | $14.08 |
| Maximum offering price per share (100/94.25 of $14.08) | | $14.94 |
| Class M: | | |
| Net Asset Value and redemption price per share ($28,289,390 ÷ 2,012,147 shares) | | $14.06 |
| Maximum offering price per share (100/96.50 of $14.06) | | $14.57 |
| Class C: | | |
| Net Asset Value and offering price per share ($57,814,202 ÷ 4,187,025 shares)(a) | | $13.81 |
| International Growth: | | |
| Net Asset Value, offering price and redemption price per share ($994,841,112 ÷ 70,159,207 shares) | | $14.18 |
| Class I: | | |
| Net Asset Value, offering price and redemption price per share ($804,394,117 ÷ 56,852,347 shares) | | $14.15 |
| Class Z: | | |
| Net Asset Value, offering price and redemption price per share ($776,341,063 ÷ 54,800,503 shares) | | $14.17 |
(a) Redemption price per share is equal to net asset value less any applicable contingent deferred sales charge.
See accompanying notes which are an integral part of the financial statements.
Statement of Operations
| | | Six months ended April 30, 2019 (Unaudited) |
| Investment Income | | |
| Dividends | | $26,102,055 |
| Non-Cash dividends | | 5,193,386 |
| Income from Fidelity Central Funds | | 1,385,801 |
| Income before foreign taxes withheld | | 32,681,242 |
| Less foreign taxes withheld | | (2,483,715) |
| Total income | | 30,197,527 |
| Expenses | | |
| Management fee | | |
| Basic fee | $8,376,320 | |
| Performance adjustment | 478,197 | |
| Transfer agent fees | 1,869,298 | |
| Distribution and service plan fees | 531,889 | |
| Accounting and security lending fees | 532,526 | |
| Custodian fees and expenses | 112,574 | |
| Independent trustees' fees and expenses | 6,568 | |
| Registration fees | 118,387 | |
| Audit | 42,839 | |
| Legal | 3,410 | |
| Miscellaneous | 7,390 | |
| Total expenses before reductions | 12,079,398 | |
| Expense reductions | (59,743) | |
| Total expenses after reductions | | 12,019,655 |
| Net investment income (loss) | | 18,177,872 |
| Realized and Unrealized Gain (Loss) | | |
| Net realized gain (loss) on: | | |
| Investment securities: | | |
| Unaffiliated issuers | (12,504,361) | |
| Fidelity Central Funds | (1,217) | |
| Foreign currency transactions | (83,121) | |
| Total net realized gain (loss) | | (12,588,699) |
| Change in net unrealized appreciation (depreciation) on: | | |
| Investment securities: | | |
| Unaffiliated issuers (net of increase in deferred foreign taxes of $132,578) | 320,503,556 | |
| Fidelity Central Funds | 1,143 | |
| Assets and liabilities in foreign currencies | (51,345) | |
| Total change in net unrealized appreciation (depreciation) | | 320,453,354 |
| Net gain (loss) | | 307,864,655 |
| Net increase (decrease) in net assets resulting from operations | | $326,042,527 |
See accompanying notes which are an integral part of the financial statements.
Statement of Changes in Net Assets
| | Six months ended April 30, 2019 (Unaudited) | Year ended October 31, 2018 |
| Increase (Decrease) in Net Assets | | |
| Operations | | |
| Net investment income (loss) | $18,177,872 | $22,322,204 |
| Net realized gain (loss) | (12,588,699) | 5,803,153 |
| Change in net unrealized appreciation (depreciation) | 320,453,354 | (175,511,752) |
| Net increase (decrease) in net assets resulting from operations | 326,042,527 | (147,386,395) |
| Distributions to shareholders | (19,640,106) | (16,636,167) |
| Share transactions - net increase (decrease) | 256,626,872 | 95,038,479 |
| Total increase (decrease) in net assets | 563,029,295 | (68,984,084) |
| Net Assets | | |
| Beginning of period | 2,254,390,023 | 2,323,374,107 |
| End of period | $2,817,419,318 | $2,254,390,023 |
See accompanying notes which are an integral part of the financial statements.
Financial Highlights
Fidelity International Growth Fund Class A
| | Six months ended (Unaudited) April 30, | Years endedOctober 31, | | | | |
| | 2019 | 2018 | 2017 | 2016 | 2015 | 2014 |
| Selected Per–Share Data | | | | | | |
| Net asset value, beginning of period | $12.47 | $13.34 | $10.88 | $11.30 | $11.01 | $10.78 |
| Income from Investment Operations | | | | | | |
| Net investment income (loss)A | .08 | .09 | .07 | .12B | .07 | .09 |
| Net realized and unrealized gain (loss) | 1.60 | (.90) | 2.49 | (.48) | .28 | .18 |
| Total from investment operations | 1.68 | (.81) | 2.56 | (.36) | .35 | .27 |
| Distributions from net investment income | (.07) | (.04) | (.10) | (.05) | (.06) | (.03) |
| Distributions from net realized gain | – | (.02) | – | (.01) | – | (.01) |
| Total distributions | (.07) | (.06) | (.10) | (.06) | (.06) | (.04) |
| Redemption fees added to paid in capitalA | – | – | –C | –C | –C | –C |
| Net asset value, end of period | $14.08 | $12.47 | $13.34 | $10.88 | $11.30 | $11.01 |
| Total ReturnD,E,F | 13.58% | (6.12)% | 23.80% | (3.22)% | 3.20% | 2.54% |
| Ratios to Average Net AssetsG,H | | | | | | |
| Expenses before reductions | 1.28%I | 1.24% | 1.28% | 1.27% | 1.26% | 1.35% |
| Expenses net of fee waivers, if any | 1.28%I | 1.23% | 1.28% | 1.27% | 1.26% | 1.35% |
| Expenses net of all reductions | 1.27%I | 1.22% | 1.27% | 1.27% | 1.25% | 1.34% |
| Net investment income (loss) | 1.21%I | .64% | .62% | 1.05%B | .66% | .84% |
| Supplemental Data | | | | | | |
| Net assets, end of period (000 omitted) | $155,739 | $138,802 | $156,988 | $221,861 | $184,878 | $119,017 |
| Portfolio turnover rateJ | 21%I | 34% | 22% | 29% | 26% | 27% |
A Calculated based on average shares outstanding during the period.
B Net investment income per share reflects a large, non-recurring dividend which amounted to $.04 per share. Excluding this non-recurring dividend, the ratio of net investment income (loss) to average net assets would have been .68%.
C Amount represents less than $.005 per share.
D Total returns for periods of less than one year are not annualized.
E Total returns would have been lower if certain expenses had not been reduced during the applicable periods shown.
F Total returns do not include the effect of the sales charges.
G Fees and expenses of any underlying Fidelity Central Funds are not included in the Fund's expense ratio. The Fund indirectly bears its proportionate share of the expenses of any underlying Fidelity Central Funds.
H Expense ratios reflect operating expenses of the class. Expenses before reductions do not reflect amounts reimbursed by the investment adviser or reductions from brokerage service arrangements or reductions from other expense offset arrangements and do not represent the amount paid by the class during periods when reimbursements or reductions occur. Expenses net of fee waivers reflect expenses after reimbursement by the investment adviser but prior to reductions from brokerage service arrangements or other expense offset arrangements. Expenses net of all reductions represent the net expenses paid by the class.
I Annualized
J Amount does not include the portfolio activity of any underlying Fidelity Central Funds.
See accompanying notes which are an integral part of the financial statements.
Fidelity International Growth Fund Class M
| | Six months ended (Unaudited) April 30, | Years endedOctober 31, | | | | |
| | 2019 | 2018 | 2017 | 2016 | 2015 | 2014 |
| Selected Per–Share Data | | | | | | |
| Net asset value, beginning of period | $12.43 | $13.30 | $10.84 | $11.26 | $10.96 | $10.75 |
| Income from Investment Operations | | | | | | |
| Net investment income (loss)A | .06 | .05 | .04 | .08B | .04 | .06 |
| Net realized and unrealized gain (loss) | 1.60 | (.90) | 2.49 | (.48) | .27 | .18 |
| Total from investment operations | 1.66 | (.85) | 2.53 | (.40) | .31 | .24 |
| Distributions from net investment income | (.03) | (.01) | (.07) | (.01) | (.01) | (.02) |
| Distributions from net realized gain | – | (.02) | – | (.01) | – | (.01) |
| Total distributions | (.03) | (.02)C | (.07) | (.02) | (.01) | (.03) |
| Redemption fees added to paid in capitalA | – | – | –D | –D | –D | –D |
| Net asset value, end of period | $14.06 | $12.43 | $13.30 | $10.84 | $11.26 | $10.96 |
| Total ReturnE,F,G | 13.41% | (6.40)% | 23.51% | (3.58)% | 2.85% | 2.21% |
| Ratios to Average Net AssetsH,I | | | | | | |
| Expenses before reductions | 1.59%J | 1.54% | 1.59% | 1.61% | 1.58% | 1.65% |
| Expenses net of fee waivers, if any | 1.58%J | 1.53% | 1.59% | 1.61% | 1.58% | 1.65% |
| Expenses net of all reductions | 1.58%J | 1.52% | 1.58% | 1.61% | 1.58% | 1.65% |
| Net investment income (loss) | .90%J | .34% | .31% | .71%B | .33% | .53% |
| Supplemental Data | | | | | | |
| Net assets, end of period (000 omitted) | $28,289 | $26,479 | $33,597 | $27,966 | $28,833 | $26,369 |
| Portfolio turnover rateK | 21%J | 34% | 22% | 29% | 26% | 27% |
A Calculated based on average shares outstanding during the period.
B Net investment income per share reflects a large, non-recurring dividend which amounted to $.04 per share. Excluding this non-recurring dividend, the ratio of net investment income (loss) to average net assets would have been .34%.
C Total distributions of $.02 per share is comprised of distributions from net investment income of $.005 and distributions from net realized gain of $.015 per share.
D Amount represents less than $.005 per share.
E Total returns for periods of less than one year are not annualized.
F Total returns would have been lower if certain expenses had not been reduced during the applicable periods shown.
G Total returns do not include the effect of the sales charges.
H Fees and expenses of any underlying Fidelity Central Funds are not included in the Fund's expense ratio. The Fund indirectly bears its proportionate share of the expenses of any underlying Fidelity Central Funds.
I Expense ratios reflect operating expenses of the class. Expenses before reductions do not reflect amounts reimbursed by the investment adviser or reductions from brokerage service arrangements or reductions from other expense offset arrangements and do not represent the amount paid by the class during periods when reimbursements or reductions occur. Expenses net of fee waivers reflect expenses after reimbursement by the investment adviser but prior to reductions from brokerage service arrangements or other expense offset arrangements. Expenses net of all reductions represent the net expenses paid by the class.
J Annualized
K Amount does not include the portfolio activity of any underlying Fidelity Central Funds.
See accompanying notes which are an integral part of the financial statements.
Fidelity International Growth Fund Class C
| | Six months ended (Unaudited) April 30, | Years endedOctober 31, | | | | |
| | 2019 | 2018 | 2017 | 2016 | 2015 | 2014 |
| Selected Per–Share Data | | | | | | |
| Net asset value, beginning of period | $12.20 | $13.10 | $10.67 | $11.12 | $10.87 | $10.69 |
| Income from Investment Operations | | | | | | |
| Net investment income (loss)A | .03 | (.01) | (.02) | .03B | (.02) | .01 |
| Net realized and unrealized gain (loss) | 1.58 | (.89) | 2.47 | (.47) | .27 | .18 |
| Total from investment operations | 1.61 | (.90) | 2.45 | (.44) | .25 | .19 |
| Distributions from net investment income | – | – | (.02) | – | – | – |
| Distributions from net realized gain | – | – | – | (.01) | – | (.01) |
| Total distributions | – | – | (.02) | (.01) | – | (.01) |
| Redemption fees added to paid in capitalA | – | – | –C | –C | –C | –C |
| Net asset value, end of period | $13.81 | $12.20 | $13.10 | $10.67 | $11.12 | $10.87 |
| Total ReturnD,E,F | 13.20% | (6.87)% | 22.96% | (3.98)% | 2.30% | 1.77% |
| Ratios to Average Net AssetsG,H | | | | | | |
| Expenses before reductions | 2.04%I | 1.99% | 2.04% | 2.07% | 2.06% | 2.12% |
| Expenses net of fee waivers, if any | 2.04%I | 1.99% | 2.04% | 2.07% | 2.06% | 2.12% |
| Expenses net of all reductions | 2.03%I | 1.98% | 2.04% | 2.06% | 2.05% | 2.12% |
| Net investment income (loss) | .45%I | (.11)% | (.15)% | .26%B | (.15)% | .06% |
| Supplemental Data | | | | | | |
| Net assets, end of period (000 omitted) | $57,814 | $60,489 | $68,908 | $52,738 | $52,378 | $32,737 |
| Portfolio turnover rateJ | 21%I | 34% | 22% | 29% | 26% | 27% |
A Calculated based on average shares outstanding during the period.
B Net investment income per share reflects a large, non-recurring dividend which amounted to $.04 per share. Excluding this non-recurring dividend, the ratio of net investment income (loss) to average net assets would have been (.12) %.
C Amount represents less than $.005 per share.
D Total returns for periods of less than one year are not annualized.
E Total returns would have been lower if certain expenses had not been reduced during the applicable periods shown.
F Total returns do not include the effect of the contingent deferred sales charge.
G Fees and expenses of any underlying Fidelity Central Funds are not included in the Fund's expense ratio. The Fund indirectly bears its proportionate share of the expenses of any underlying Fidelity Central Funds.
H Expense ratios reflect operating expenses of the class. Expenses before reductions do not reflect amounts reimbursed by the investment adviser or reductions from brokerage service arrangements or reductions from other expense offset arrangements and do not represent the amount paid by the class during periods when reimbursements or reductions occur. Expenses net of fee waivers reflect expenses after reimbursement by the investment adviser but prior to reductions from brokerage service arrangements or other expense offset arrangements. Expenses net of all reductions represent the net expenses paid by the class.
I Annualized
J Amount does not include the portfolio activity of any underlying Fidelity Central Funds.
See accompanying notes which are an integral part of the financial statements.
Fidelity International Growth Fund
| | Six months ended (Unaudited) April 30, | Years endedOctober 31, | | | | |
| | 2019 | 2018 | 2017 | 2016 | 2015 | 2014 |
| Selected Per–Share Data | | | | | | |
| Net asset value, beginning of period | $12.57 | $13.45 | $10.97 | $11.38 | $11.10 | $10.84 |
| Income from Investment Operations | | | | | | |
| Net investment income (loss)A | .10 | .13 | .10 | .15B | .11 | .13 |
| Net realized and unrealized gain (loss) | 1.62 | (.92) | 2.51 | (.47) | .26 | .19 |
| Total from investment operations | 1.72 | (.79) | 2.61 | (.32) | .37 | .32 |
| Distributions from net investment income | (.11) | (.08) | (.13) | (.08) | (.09) | (.05) |
| Distributions from net realized gain | – | (.02) | – | (.01) | – | (.01) |
| Total distributions | (.11) | (.09)C | (.13) | (.09) | (.09) | (.06) |
| Redemption fees added to paid in capitalA | – | – | –D | –D | –D | –D |
| Net asset value, end of period | $14.18 | $12.57 | $13.45 | $10.97 | $11.38 | $11.10 |
| Total ReturnE,F | 13.79% | (5.89)% | 24.14% | (2.87)% | 3.36% | 2.96% |
| Ratios to Average Net AssetsG,H | | | | | | |
| Expenses before reductions | .99%I | .95% | 1.03% | .99% | .97% | 1.04% |
| Expenses net of fee waivers, if any | .99%I | .95% | 1.03% | .99% | .97% | 1.04% |
| Expenses net of all reductions | .99%I | .94% | 1.03% | .98% | .96% | 1.04% |
| Net investment income (loss) | 1.49%I | .93% | .87% | 1.34%B | .94% | 1.14% |
| Supplemental Data | | | | | | |
| Net assets, end of period (000 omitted) | $994,841 | $811,101 | $961,775 | $1,038,771 | $938,348 | $635,607 |
| Portfolio turnover rateJ | 21%I | 34% | 22% | 29% | 26% | 27% |
A Calculated based on average shares outstanding during the period.
B Net investment income per share reflects a large, non-recurring dividend which amounted to $.04 per share. Excluding this non-recurring dividend, the ratio of net investment income (loss) to average net assets would have been .96%.
C Total distributions of $.09 per share is comprised of distributions from net investment income of $.079 and distributions from net realized gain of $.015 per share.
D Amount represents less than $.005 per share.
E Total returns for periods of less than one year are not annualized.
F Total returns would have been lower if certain expenses had not been reduced during the applicable periods shown.
G Fees and expenses of any underlying Fidelity Central Funds are not included in the Fund's expense ratio. The Fund indirectly bears its proportionate share of the expenses of any underlying Fidelity Central Funds.
H Expense ratios reflect operating expenses of the class. Expenses before reductions do not reflect amounts reimbursed by the investment adviser or reductions from brokerage service arrangements or reductions from other expense offset arrangements and do not represent the amount paid by the class during periods when reimbursements or reductions occur. Expenses net of fee waivers reflect expenses after reimbursement by the investment adviser but prior to reductions from brokerage service arrangements or other expense offset arrangements. Expenses net of all reductions represent the net expenses paid by the class.
I Annualized
J Amount does not include the portfolio activity of any underlying Fidelity Central Funds.
See accompanying notes which are an integral part of the financial statements.
Fidelity International Growth Fund Class I
| | Six months ended (Unaudited) April 30, | Years endedOctober 31, | | | | |
| | 2019 | 2018 | 2017 | 2016 | 2015 | 2014 |
| Selected Per–Share Data | | | | | | |
| Net asset value, beginning of period | $12.55 | $13.43 | $10.95 | $11.36 | $11.08 | $10.84 |
| Income from Investment Operations | | | | | | |
| Net investment income (loss)A | .10 | .13 | .11 | .15B | .11 | .13 |
| Net realized and unrealized gain (loss) | 1.61 | (.91) | 2.51 | (.47) | .27 | .18 |
| Total from investment operations | 1.71 | (.78) | 2.62 | (.32) | .38 | .31 |
| Distributions from net investment income | (.11) | (.09) | (.14) | (.08) | (.10) | (.06) |
| Distributions from net realized gain | – | (.02) | – | (.01) | – | (.01) |
| Total distributions | (.11) | (.10)C | (.14) | (.09) | (.10) | (.07) |
| Redemption fees added to paid in capitalA | – | – | –D | –D | –D | –D |
| Net asset value, end of period | $14.15 | $12.55 | $13.43 | $10.95 | $11.36 | $11.08 |
| Total ReturnE,F | 13.76% | (5.83)% | 24.23% | (2.87)% | 3.41% | 2.84% |
| Ratios to Average Net AssetsG,H | | | | | | |
| Expenses before reductions | .97%I | .93% | .98% | .98% | .98% | 1.04% |
| Expenses net of fee waivers, if any | .97%I | .93% | .98% | .98% | .98% | 1.04% |
| Expenses net of all reductions | .96%I | .92% | .97% | .98% | .97% | 1.04% |
| Net investment income (loss) | 1.52%I | .94% | .92% | 1.34%B | .94% | 1.14% |
| Supplemental Data | | | | | | |
| Net assets, end of period (000 omitted) | $804,394 | $660,961 | $728,227 | $359,676 | $267,745 | $121,554 |
| Portfolio turnover rateJ | 21%I | 34% | 22% | 29% | 26% | 27% |
A Calculated based on average shares outstanding during the period.
B Net investment income per share reflects a large, non-recurring dividend which amounted to $.04 per share. Excluding this non-recurring dividend, the ratio of net investment income (loss) to average net assets would have been .97%.
C Total distributions of $.10 per share is comprised of distributions from net investment income of $.089 and distributions from net realized gain of $.015 per share.
D Amount represents less than $.005 per share.
E Total returns for periods of less than one year are not annualized.
F Total returns would have been lower if certain expenses had not been reduced during the applicable periods shown.
G Fees and expenses of any underlying Fidelity Central Funds are not included in the Fund's expense ratio. The Fund indirectly bears its proportionate share of the expenses of any underlying Fidelity Central Funds.
H Expense ratios reflect operating expenses of the class. Expenses before reductions do not reflect amounts reimbursed by the investment adviser or reductions from brokerage service arrangements or reductions from other expense offset arrangements and do not represent the amount paid by the class during periods when reimbursements or reductions occur. Expenses net of fee waivers reflect expenses after reimbursement by the investment adviser but prior to reductions from brokerage service arrangements or other expense offset arrangements. Expenses net of all reductions represent the net expenses paid by the class.
I Annualized
J Amount does not include the portfolio activity of any underlying Fidelity Central Funds.
See accompanying notes which are an integral part of the financial statements.
Fidelity International Growth Fund Class Z
| | Six months ended (Unaudited) April 30, | Years endedOctober 31, | | | | |
| | 2019 | 2018 | 2017 | 2016 | 2015 | 2014 |
| Selected Per–Share Data | | | | | | |
| Net asset value, beginning of period | $12.57 | $13.45 | $10.97 | $11.38 | $11.10 | $10.84 |
| Income from Investment Operations | | | | | | |
| Net investment income (loss)A | .11 | .15 | .13 | .16B | .12 | .14 |
| Net realized and unrealized gain (loss) | 1.62 | (.91) | 2.50 | (.47) | .27 | .19 |
| Total from investment operations | 1.73 | (.76) | 2.63 | (.31) | .39 | .33 |
| Distributions from net investment income | (.13) | (.10) | (.15) | (.09) | (.11) | (.06) |
| Distributions from net realized gain | – | (.02) | – | (.01) | – | (.01) |
| Total distributions | (.13) | (.12) | (.15) | (.10) | (.11) | (.07) |
| Redemption fees added to paid in capitalA | – | – | –C | –C | –C | –C |
| Net asset value, end of period | $14.17 | $12.57 | $13.45 | $10.97 | $11.38 | $11.10 |
| Total ReturnD,E | 13.89% | (5.71)% | 24.33% | (2.73)% | 3.52% | 3.07% |
| Ratios to Average Net AssetsF,G | | | | | | |
| Expenses before reductions | .84%H | .80% | .84% | .85% | .84% | .88% |
| Expenses net of fee waivers, if any | .84%H | .80% | .84% | .85% | .84% | .88% |
| Expenses net of all reductions | .84%H | .79% | .84% | .84% | .83% | .88% |
| Net investment income (loss) | 1.64%H | 1.08% | 1.05% | 1.48%B | 1.07% | 1.30% |
| Supplemental Data | | | | | | |
| Net assets, end of period (000 omitted) | $776,341 | $556,558 | $373,878 | $16,977 | $897 | $104 |
| Portfolio turnover rateI | 21%H | 34% | 22% | 29% | 26% | 27% |
A Calculated based on average shares outstanding during the period.
B Net investment income per share reflects a large, non-recurring dividend which amounted to $.04 per share. Excluding this non-recurring dividend, the ratio of net investment income (loss) to average net assets would have been 1.10%.
C Amount represents less than $.005 per share.
D Total returns for periods of less than one year are not annualized.
E Total returns would have been lower if certain expenses had not been reduced during the applicable periods shown.
F Fees and expenses of any underlying Fidelity Central Funds are not included in the Fund's expense ratio. The Fund indirectly bears its proportionate share of the expenses of any underlying Fidelity Central Funds.
G Expense ratios reflect operating expenses of the class. Expenses before reductions do not reflect amounts reimbursed by the investment adviser or reductions from brokerage service arrangements or reductions from other expense offset arrangements and do not represent the amount paid by the class during periods when reimbursements or reductions occur. Expenses net of fee waivers reflect expenses after reimbursement by the investment adviser but prior to reductions from brokerage service arrangements or other expense offset arrangements. Expenses net of all reductions represent the net expenses paid by the class.
H Annualized
I Amount does not include the portfolio activity of any underlying Fidelity Central Funds.
See accompanying notes which are an integral part of the financial statements.
Notes to Financial Statements (Unaudited)
For the period ended April 30, 2019
1. Organization.
Fidelity International Growth Fund (the Fund) is a fund of Fidelity Investment Trust (the Trust) and is authorized to issue an unlimited number of shares. The Trust is registered under the Investment Company Act of 1940, as amended (the 1940 Act), as an open-end management investment company organized as a Massachusetts business trust. The Fund offers Class A, Class M, Class C, International Growth, Class I and Class Z shares, each of which has equal rights as to assets and voting privileges. Each class has exclusive voting rights with respect to matters that affect that class. Effective March 1, 2019, Class C shares will automatically convert to Class A shares after a holding period of ten years from the initial date of purchase, with certain exceptions.
2. Investments in Fidelity Central Funds.
The Fund invests in Fidelity Central Funds, which are open-end investment companies generally available only to other investment companies and accounts managed by the investment adviser and its affiliates. The Fund's Schedule of Investments lists each of the Fidelity Central Funds held as of period end, if any, as an investment of the Fund, but does not include the underlying holdings of each Fidelity Central Fund. As an Investing Fund, the Fund indirectly bears its proportionate share of the expenses of the underlying Fidelity Central Funds.
The Money Market Central Funds seek preservation of capital and current income and are managed by Fidelity Investments Money Management, Inc. (FIMM), an affiliate of the investment adviser. Annualized expenses of the Money Market Central Funds as of their most recent shareholder report date are less than .005%.
A complete unaudited list of holdings for each Fidelity Central Fund is available upon request or at the Securities and Exchange Commission (the SEC) website at www.sec.gov. In addition, the financial statements of the Fidelity Central Funds are available on the SEC website or upon request.
3. Significant Accounting Policies.
The Fund is an investment company and applies the accounting and reporting guidance of the Financial Accounting Standards Board (FASB) Accounting Standards Codification Topic 946 Financial Services – Investments Companies. The financial statements have been prepared in conformity with accounting principles generally accepted in the United States of America (GAAP), which require management to make certain estimates and assumptions at the date of the financial statements. Actual results could differ from those estimates. Subsequent events, if any, through the date that the financial statements were issued have been evaluated in the preparation of the financial statements. The following summarizes the significant accounting policies of the Fund:
Investment Valuation. Investments are valued as of 4:00 p.m. Eastern time on the last calendar day of the period. The Board of Trustees (the Board) has delegated the day to day responsibility for the valuation of the Fund's investments to the Fair Value Committee (the Committee) established by the Fund's investment adviser. In accordance with valuation policies and procedures approved by the Board, the Fund attempts to obtain prices from one or more third party pricing vendors or brokers to value its investments. When current market prices, quotations or currency exchange rates are not readily available or reliable, investments will be fair valued in good faith by the Committee, in accordance with procedures adopted by the Board. Factors used in determining fair value vary by investment type and may include market or investment specific events. The frequency with which these procedures are used cannot be predicted and they may be utilized to a significant extent. The Committee oversees the Fund's valuation policies and procedures and reports to the Board on the Committee's activities and fair value determinations. The Board monitors the appropriateness of the procedures used in valuing the Fund's investments and ratifies the fair value determinations of the Committee.
The Fund categorizes the inputs to valuation techniques used to value its investments into a disclosure hierarchy consisting of three levels as shown below:
- Level 1 – quoted prices in active markets for identical investments
- Level 2 – other significant observable inputs (including quoted prices for similar investments, interest rates, prepayment speeds, etc.)
- Level 3 – unobservable inputs (including the Fund's own assumptions based on the best information available)
Valuation techniques used to value the Fund's investments by major category are as follows:
Equity securities, including restricted securities, for which market quotations are readily available, are valued at the last reported sale price or official closing price as reported by a third party pricing vendor on the primary market or exchange on which they are traded and are categorized as Level 1 in the hierarchy. In the event there were no sales during the day or closing prices are not available, securities are valued at the last quoted bid price or may be valued using the last available price and are generally categorized as Level 2 in the hierarchy. For foreign equity securities, when market or security specific events arise, comparisons to the valuation of American Depositary Receipts (ADRs), futures contracts, Exchange-Traded Funds (ETFs) and certain indexes as well as quoted prices for similar securities may be used and would be categorized as Level 2 in the hierarchy. For equity securities, including restricted securities, where observable inputs are limited, assumptions about market activity and risk are used and these securities may be categorized as Level 3 in the hierarchy.
Investments in open-end mutual funds, including the Fidelity Central Funds, are valued at their closing net asset value (NAV) each business day and are categorized as Level 1 in the hierarchy.
Changes in valuation techniques may result in transfers in or out of an assigned level within the disclosure hierarchy. The aggregate value of investments by input level as of April 30, 2019 is included at the end of the Fund's Schedule of Investments.
Foreign Currency. The Fund may use foreign currency contracts to facilitate transactions in foreign-denominated securities. Gains and losses from these transactions may arise from changes in the value of the foreign currency or if the counterparties do not perform under the contracts' terms.
Foreign-denominated assets, including investment securities, and liabilities are translated into U.S. dollars at the exchange rates at period end. Purchases and sales of investment securities, income and dividends received and expenses denominated in foreign currencies are translated into U.S. dollars at the exchange rate in effect on the transaction date.
The effects of exchange rate fluctuations on investments are included with the net realized and unrealized gain (loss) on investment securities. Other foreign currency transactions resulting in realized and unrealized gain (loss) are disclosed separately.
Investment Transactions and Income. For financial reporting purposes, the Fund's investment holdings and NAV include trades executed through the end of the last business day of the period. The NAV per share for processing shareholder transactions is calculated as of the close of business of the New York Stock Exchange (NYSE), normally 4:00 p.m. Eastern time and includes trades executed through the end of the prior business day. Gains and losses on securities sold are determined on the basis of identified cost and include proceeds received from litigation. Dividend income is recorded on the ex-dividend date, except for certain dividends from foreign securities where the ex-dividend date may have passed, which are recorded as soon as the Fund is informed of the ex-dividend date. Non-cash dividends included in dividend income, if any, are recorded at the fair market value of the securities received. Income and capital gain distributions from Fidelity Central Funds, if any, are recorded on the ex-dividend date. Certain distributions received by the Fund represent a return of capital or capital gain. The Fund determines the components of these distributions subsequent to the ex-dividend date, based upon receipt of tax filings or other correspondence relating to the underlying investment. These distributions are recorded as a reduction of cost of investments and/or as a realized gain. Interest income is accrued as earned and includes coupon interest and amortization of premium and accretion of discount on debt securities as applicable. Investment income is recorded net of foreign taxes withheld where recovery of such taxes is uncertain.
Class Allocations and Expenses. Investment income, realized and unrealized capital gains and losses, common expenses of the Fund, and certain fund-level expense reductions, if any, are allocated daily on a pro-rata basis to each class based on the relative net assets of each class to the total net assets of the Fund. Each class differs with respect to transfer agent and distribution and service plan fees incurred. Certain expense reductions may also differ by class. For the reporting period, the allocated portion of income and expenses to each class as a percent of its average net assets may vary due to the timing of recording these transactions in relation to fluctuating net assets of the classes. Expenses directly attributable to a fund are charged to that fund. Expenses attributable to more than one fund are allocated among the respective funds on the basis of relative net assets or other appropriate methods. Expense estimates are accrued in the period to which they relate and adjustments are made when actual amounts are known.
Income Tax Information and Distributions to Shareholders. Each year, the Fund intends to qualify as a regulated investment company under Subchapter M of the Internal Revenue Code, including distributing substantially all of its taxable income and realized gains. As a result, no provision for U.S. Federal income taxes is required. The Fund files a U.S. federal tax return, in addition to state and local tax returns as required. The Fund's federal income tax returns are subject to examination by the Internal Revenue Service (IRS) for a period of three fiscal years after they are filed. State and local tax returns may be subject to examination for an additional fiscal year depending on the jurisdiction. Foreign taxes are provided for based on the Fund's understanding of the tax rules and rates that exist in the foreign markets in which it invests. The Fund is subject to a tax imposed on capital gains by certain countries in which it invests. An estimated deferred tax liability for net unrealized appreciation on the applicable securities is included in Other payables and accrued expenses on the Statement of Assets & Liabilities.
Distributions are declared and recorded on the ex-dividend date. Income and capital gain distributions are declared separately for each class. Income and capital gain distributions are determined in accordance with income tax regulations, which may differ from GAAP.
Capital accounts within the financial statements are adjusted for permanent book-tax differences. These adjustments have no impact on net assets or the results of operations. Capital accounts are not adjusted for temporary book-tax differences which will reverse in a subsequent period.
Book-tax differences are primarily due to foreign currency transactions, certain foreign taxes, passive foreign investment companies (PFIC), capital loss carryforwards and losses deferred due to wash sales.
As of period end, the cost and unrealized appreciation (depreciation) in securities, and derivatives if applicable, for federal income tax purposes were as follows:
| Gross unrealized appreciation | $705,998,642 |
| Gross unrealized depreciation | (48,389,032) |
| Net unrealized appreciation (depreciation) | $657,609,610 |
| Tax cost | $2,217,399,446 |
Capital loss carryforwards are only available to offset future capital gains of the Fund to the extent provided by regulations and may be limited. Under the Regulated Investment Company Modernization Act of 2010 (the Act), the Fund is permitted to carry forward capital losses incurred in taxable years beginning after December 22, 2010 for an unlimited period and such capital losses are required to be used prior to any losses that expire. The capital loss carryforward information presented below, including any applicable limitation, is estimated as of prior fiscal period end and is subject to adjustment.
| No expiration | |
| Short-term | $(75,102,155) |
| Long-term | (9,162,055) |
| Total no expiration | $(84,264,210) |
Delayed Delivery Transactions and When-Issued Securities. During the period, the Fund transacted in securities on a delayed delivery or when-issued basis. Payment and delivery may take place after the customary settlement period for that security. The price of the underlying securities and the date when the securities will be delivered and paid for are fixed at the time the transaction is negotiated. The securities purchased on a delayed delivery or when-issued basis are identified as such in the Fund's Schedule of Investments. Losses may arise due to changes in the value of the underlying securities or if the counterparty does not perform under the contract's terms, or if the issuer does not issue the securities due to political, economic, or other factors.
4. Purchases and Sales of Investments.
Purchases and sales of securities, other than short-term securities, aggregated $527,699,280 and $248,391,648, respectively.
5. Fees and Other Transactions with Affiliates.
Management Fee. Fidelity Management & Research Company (the investment adviser) and its affiliates provide the Fund with investment management related services for which the Fund pays a monthly management fee. The management fee is the sum of an individual fund fee rate that is based on an annual rate of .45% of the Fund's average net assets and an annualized group fee rate that averaged .24% during the period. The group fee rate is based upon the average net assets of all the mutual funds advised by the investment adviser, including any mutual funds previously advised by the investment adviser that are currently advised by Fidelity SelectCo, LLC, an affiliate of the investment adviser. The group fee rate decreases as assets under management increase and increases as assets under management decrease. In addition, the management fee is subject to a performance adjustment (up to a maximum of +/- .20% of the Fund's average net assets over a 36 month performance period). The upward or downward adjustment to the management fee is based on the relative investment performance of International Growth as compared to its benchmark index, the MSCI EAFE Growth Index, over the same 36 month performance period. For the reporting period, the total annualized management fee rate, including the performance adjustment, was .73% of the Fund's average net assets. The performance adjustment included in the management fee rate may be higher or lower than the maximum performance adjustment rate due to the difference between the average net assets for the reporting and performance periods.
Distribution and Service Plan Fees. In accordance with Rule 12b-1 of the 1940 Act, the Fund has adopted separate Distribution and Service Plans for each class of shares. Certain classes pay Fidelity Distributors Corporation (FDC), an affiliate of the investment adviser, separate Distribution and Service Fees, each of which is based on an annual percentage of each class' average net assets. In addition, FDC may pay financial intermediaries for selling shares of the Fund and providing shareholder support services. For the period, the Distribution and Service Fee rates, total fees and amounts retained by FDC were as follows:
| | Distribution Fee | Service Fee | Total Fees | Retained by FDC |
| Class A | -% | .25% | $178,289 | $5,334 |
| Class M | .25% | .25% | 66,916 | 776 |
| Class C | .75% | .25% | 286,684 | 41,610 |
| | | | $531,889 | $47,720 |
Sales Load. FDC may receive a front-end sales charge of up to 5.75% for selling Class A shares and 3.50% for selling Class M shares, some of which is paid to financial intermediaries for selling shares of the Fund. Depending on the holding period, FDC may receive contingent deferred sales charges levied on Class A, Class M and Class C redemptions. The deferred sales charges are 1.00% for Class C shares, 1.00% for certain purchases of Class A shares and .25% for certain purchases of Class M shares.
For the period, sales charge amounts retained by FDC were as follows:
| | Retained by FDC |
| Class A | $26,959 |
| Class M | 1,580 |
| Class CA | 2,272 |
| | $30,811 |
A When Class C shares are initially sold, FDC pays commissions from its own resources to financial intermediaries through which the sales are made.
Transfer Agent Fees. Fidelity Investments Institutional Operations Company, Inc., (FIIOC), an affiliate of the investment adviser, is the transfer, dividend disbursing and shareholder servicing agent for each class of the Fund. FIIOC receives account fees and asset-based fees that vary according to the account size and type of account of the shareholders of the respective classes of the Fund, except for Class Z. FIIOC receives an asset-based fee of Class Z's average net assets. FIIOC pays for typesetting, printing and mailing of shareholder reports, except proxy statements.
For the period, transfer agent fees for each class were as follows:
| | Amount | % of Class-Level Average Net Assets(a) |
| Class A | $166,289 | .23 |
| Class M | 38,962 | .29 |
| Class C | 69,381 | .24 |
| International Growth | 836,081 | .20 |
| Class I | 608,898 | .17 |
| Class Z | 149,687 | .05 |
| | $1,869,298 | |
(a) Annualized
Accounting and Security Lending Fees. Fidelity Service Company, Inc. (FSC), an affiliate of the investment adviser, maintains the Fund's accounting records. The accounting fee is based on the level of average net assets for each month. Prior to April 1, 2019, FSC had a separate agreement with the Fund for administration of the security lending program, based on the number and duration of lending transactions. For the period, the total fees paid for accounting and administration of securities lending were equivalent to an annualized rate of .04%.
Brokerage Commissions. The Fund placed a portion of its portfolio transactions with brokerage firms which are affiliates of the investment adviser. Brokerage commissions are included in net realized gain (loss) and change in net unrealized appreciation (depreciation) in the Statement of Operations. The commissions paid to these affiliated firms were $1,105 for the period.
Interfund Trades. The Fund may purchase from or sell securities to other Fidelity Funds under procedures adopted by the Board. The procedures have been designed to ensure these interfund trades are executed in accordance with Rule 17a-7 of the 1940 Act. Interfund trades are included within the respective purchases and sales amounts shown in the Purchases and Sales of Investments note.
6. Committed Line of Credit.
The Fund participates with other funds managed by the investment adviser or an affiliate in a $4.25 billion credit facility (the "line of credit") to be utilized for temporary or emergency purposes to fund shareholder redemptions or for other short-term liquidity purposes. The Fund has agreed to pay commitment fees on its pro-rata portion of the line of credit, which amounted to $3,387 and is reflected in Miscellaneous expenses on the Statement of Operations. During the period, the Fund did not borrow on this line of credit.
7. Security Lending.
The Fund lends portfolio securities through a lending agent from time to time in order to earn additional income. For equity securities, a lending agent is used and may loan securities to certain qualified borrowers, including Fidelity Capital Markets (FCM), a broker-dealer affiliated with the Fund. On the settlement date of the loan, the Fund receives collateral (in the form of U.S. Treasury obligations, letters of credit and/or cash) against the loaned securities and maintains collateral in an amount not less than 100% of the market value of the loaned securities during the period of the loan. The market value of the loaned securities is determined at the close of business of the Fund and any additional required collateral is delivered to the Fund on the next business day. The Fund or borrower may terminate the loan at any time, and if the borrower defaults on its obligation to return the securities loaned because of insolvency or other reasons, the Fund may apply collateral received from the borrower against the obligation. The Fund may experience delays and costs in recovering the securities loaned. Any cash collateral received is invested in the Fidelity Securities Lending Cash Central Fund. The value of loaned securities and cash collateral at period end are disclosed on the Fund's Statement of Assets and Liabilities. Security lending income represents the income earned on investing cash collateral, less rebates paid to borrowers and any lending agent fees associated with the loan, plus any premium payments received for lending certain types of securities. Security lending income is presented in the Statement of Operations as a component of income from Fidelity Central Funds. Total security lending income during the period amounted to $61,375. During the period, there were no securities loaned to FCM.
8. Expense Reductions.
Commissions paid to certain brokers with whom the investment adviser, or its affiliates, places trades on behalf of the Fund include an amount in addition to trade execution, which may be rebated back to the Fund to offset certain expenses. This amount totaled $50,437 for the period. In addition, through arrangements with the Fund's custodian credits realized as a result of certain uninvested cash balances were used to reduce the Fund's expenses. During the period, these credits reduced the Fund's custody expenses by $340.
In addition, during the period the investment adviser reimbursed and/or waived a portion of fund-level operating expenses in the amount of $8,966.
9. Distributions to Shareholders.
Distributions to shareholders of each class were as follows:
| | Six months ended
April 30, 2019 | Year ended
October 31, 2018 |
| Distributions to shareholders | | |
| Class A | $799,140 | $667,281 |
| Class M | 67,406 | 48,590 |
| International Growth | 6,773,948 | 6,746,881 |
| Class I | 5,925,234 | 5,822,889 |
| Class Z | 6,074,378 | 3,350,526 |
| Total | $19,640,106 | $16,636,167 |
10. Share Transactions.
Share transactions for each class were as follows and may contain automatic conversions between classes or exchanges between affiliated funds:
| | Shares | Shares | Dollars | Dollars |
| | Six months ended April 30, 2019 | Year ended October 31, 2018 | Six months ended April 30, 2019 | Year ended October 31, 2018 |
| Class A | | | | |
| Shares sold | 1,183,527 | 2,575,636 | $15,297,478 | $35,129,838 |
| Reinvestment of distributions | 65,987 | 49,581 | 797,127 | 663,775 |
| Shares redeemed | (1,320,811) | (3,261,091) | (17,068,962) | (44,291,373) |
| Net increase (decrease) | (71,297) | (635,874) | $(974,357) | $(8,497,760) |
| Class M | | | | |
| Shares sold | 113,493 | 349,635 | $1,431,122 | $4,771,254 |
| Reinvestment of distributions | 5,584 | 3,624 | 67,395 | 48,527 |
| Shares redeemed | (237,491) | (748,765) | (3,069,327) | (10,142,042) |
| Net increase (decrease) | (118,414) | (395,506) | $(1,570,810) | $(5,322,261) |
| Class C | | | | |
| Shares sold | 290,970 | 1,082,980 | $3,638,114 | $14,574,249 |
| Shares redeemed | (1,061,562) | (1,386,849) | (13,338,766) | (18,440,770) |
| Net increase (decrease) | (770,592) | (303,869) | $(9,700,652) | $(3,866,521) |
| International Growth | | | | |
| Shares sold | 14,794,877 | 19,748,706 | $195,354,827 | $271,435,270 |
| Reinvestment of distributions | 517,780 | 469,327 | 6,291,030 | 6,314,733 |
| Shares redeemed | (9,662,550) | (27,217,331) | (123,568,775) | (371,174,329) |
| Net increase (decrease) | 5,650,107 | (6,999,298) | $78,077,082 | $(93,424,326) |
| Class I | | | | |
| Shares sold | 15,439,824 | 23,675,678 | $197,188,451 | $322,195,941 |
| Reinvestment of distributions | 473,993 | 352,717 | 5,744,799 | 4,735,014 |
| Shares redeemed | (11,737,678) | (25,574,189) | (148,493,410) | (351,174,190) |
| Net increase (decrease) | 4,176,139 | (1,545,794) | $54,439,840 | $(24,243,235) |
| Class Z | | | | |
| Shares sold | 26,918,551 | 27,518,013 | $337,838,520 | $376,275,009 |
| Reinvestment of distributions | 188,590 | 140,992 | 2,287,593 | 1,894,059 |
| Shares redeemed | (16,576,558) | (11,179,068) | (203,770,344) | (147,776,486) |
| Net increase (decrease) | 10,530,583 | 16,479,937 | $136,355,769 | $230,392,582 |
11. Other.
The Fund's organizational documents provide former and current trustees and officers with a limited indemnification against liabilities arising in connection with the performance of their duties to the Fund. In the normal course of business, the Fund may also enter into contracts that provide general indemnifications. The Fund's maximum exposure under these arrangements is unknown as this would be dependent on future claims that may be made against the Fund. The risk of material loss from such claims is considered remote.
Shareholder Expense Example
As a shareholder of the Fund, you incur two types of costs: (1) transaction costs, including sales charges (loads) on purchase payments or redemption proceeds, and (2) ongoing costs, including management fees, distribution and/or service (12b-1) fees and other Fund expenses. This Example is intended to help you understand your ongoing costs (in dollars) of investing in the Fund and to compare these costs with the ongoing costs of investing in other mutual funds.
The Example is based on an investment of $1,000 invested at the beginning of the period and held for the entire period (November 1, 2018 to April 30, 2019).
Actual Expenses
The first line of the accompanying table for each class of the Fund provides information about actual account values and actual expenses. You may use the information in this line, together with the amount you invested, to estimate the expenses that you paid over the period. Simply divide your account value by $1,000.00 (for example, an $8,600 account value divided by $1,000.00 = 8.6), then multiply the result by the number in the first line for a class of the Fund under the heading entitled "Expenses Paid During Period" to estimate the expenses you paid on your account during this period. In addition, the Fund, as a shareholder in the underlying Fidelity Central Funds, will indirectly bear its pro-rata share of the fees and expenses incurred by the underlying Fidelity Central Funds. These fees and expenses are not included in the Fund's annualized expense ratio used to calculate the expense estimate in the table below.
Hypothetical Example for Comparison Purposes
The second line of the accompanying table for each class of the Fund provides information about hypothetical account values and hypothetical expenses based on a Class' actual expense ratio and an assumed rate of return of 5% per year before expenses, which is not the Class' actual return. The hypothetical account values and expenses may not be used to estimate the actual ending account balance or expenses you paid for the period. You may use this information to compare the ongoing costs of investing in the Fund and other funds. To do so, compare this 5% hypothetical example with the 5% hypothetical examples that appear in the shareholder reports of the other funds. In addition, the Fund, as a shareholder in the underlying Fidelity Central Funds, will indirectly bear its pro-rata share of the fees and expenses incurred by the underlying Fidelity Central Funds. These fees and expenses are not included in the Fund's annualized expense ratio used to calculate the expense estimate in the table below.
Please note that the expenses shown in the table are meant to highlight your ongoing costs only and do not reflect any transaction costs. Therefore, the second line of the table is useful in comparing ongoing costs only, and will not help you determine the relative total costs of owning different funds. In addition, if these transactional costs were included, your costs would have been higher.
| | Annualized Expense Ratio-A | Beginning
Account Value
November 1, 2018 | Ending
Account Value
April 30, 2019 | Expenses Paid
During Period-B
November 1, 2018
to April 30, 2019 |
| Class A | 1.28% | | | |
| Actual | | $1,000.00 | $1,135.80 | $6.78 |
| Hypothetical-C | | $1,000.00 | $1,018.45 | $6.41 |
| Class M | 1.58% | | | |
| Actual | | $1,000.00 | $1,134.10 | $8.36 |
| Hypothetical-C | | $1,000.00 | $1,016.96 | $7.90 |
| Class C | 2.04% | | | |
| Actual | | $1,000.00 | $1,132.00 | $10.78 |
| Hypothetical-C | | $1,000.00 | $1,014.68 | $10.19 |
| International Growth | .99% | | | |
| Actual | | $1,000.00 | $1,137.90 | $5.25 |
| Hypothetical-C | | $1,000.00 | $1,019.89 | $4.96 |
| Class I | .97% | | | |
| Actual | | $1,000.00 | $1,137.60 | $5.14 |
| Hypothetical-C | | $1,000.00 | $1,019.98 | $4.86 |
| Class Z | .84% | | | |
| Actual | | $1,000.00 | $1,138.90 | $4.45 |
| Hypothetical-C | | $1,000.00 | $1,020.63 | $4.21 |
A Annualized expense ratio reflects expenses net of applicable fee waivers.
B Expenses are equal to each Class' annualized expense ratio, multiplied by the average account value over the period, multiplied by 181/365 (to reflect the one-half year period).
C 5% return per year before expenses
Board Approval of Investment Advisory Contracts and Management Fees
Fidelity International Growth Fund
Each year, the Board of Trustees, including the Independent Trustees (together, the Board), votes on the renewal of the management contract with Fidelity Management & Research Company (FMR) and the sub-advisory agreements (together, the Advisory Contracts) for the fund. FMR and the sub-advisers are referred to herein as the Investment Advisers. The Board, assisted by the advice of fund counsel and Independent Trustees' counsel, requests and considers a broad range of information relevant to the renewal of the Advisory Contracts throughout the year.
The Board meets regularly and, at each of its meetings, covers an extensive agenda of topics and materials and considers factors that are relevant to its annual consideration of the renewal of the fund's Advisory Contracts, including the services and support provided to the fund and its shareholders. The Board has established various standing committees (Committees), each composed of and chaired by Independent Trustees with varying backgrounds, to which the Board has assigned specific subject matter responsibilities in order to enhance effective decision-making by the Board. The Board, acting directly and through its Committees, requests and receives information concerning the annual consideration of the renewal of the fund's Advisory Contracts. The Board also meets as needed to review matters specifically related to the Board's annual consideration of the renewal of the Advisory Contracts. Members of the Board may also meet with trustees of other Fidelity funds through joint ad hoc committees to discuss certain matters relevant to all of the Fidelity funds.
At its January 2019 meeting, the Board unanimously determined to renew the fund's Advisory Contracts. In reaching its determination, the Board considered all factors it believed relevant, including (i) the nature, extent, and quality of the services to be provided to the fund and its shareholders (including the investment performance of the fund); (ii) the competitiveness of the fund's management fee and total expense ratio relative to peer funds; (iii) the total costs of the services to be provided by and the profits to be realized by Fidelity from its relationships with the fund; and (iv) the extent to which, if any, economies of scale exist and would be realized as the fund grows, and whether any economies of scale are appropriately shared with fund shareholders.
In considering whether to renew the Advisory Contracts for the fund, the Board reached a determination, with the assistance of fund counsel and Independent Trustees' counsel and through the exercise of its business judgment, that the renewal of the Advisory Contracts was in the best interests of the fund and its shareholders and that the compensation payable under the Advisory Contracts was fair and reasonable. The Board's decision to renew the Advisory Contracts was not based on any single factor, but rather was based on a comprehensive consideration of all the information provided to the Board at its meetings throughout the year. The Board, in reaching its determination to renew the Advisory Contracts, was aware that shareholders of the fund have a broad range of investment choices available to them, including a wide choice among funds offered by Fidelity's competitors, and that the fund's shareholders, who have the opportunity to review and weigh the disclosure provided by the fund in its prospectus and other public disclosures, have chosen to invest in this fund, which is part of the Fidelity family of funds.
Nature, Extent, and Quality of Services Provided. The Board considered Fidelity's staffing as it relates to the fund, including the backgrounds of investment personnel of Fidelity, and also considered the fund's investment objective, strategies, and related investment philosophy. The Independent Trustees also had discussions with senior management of Fidelity's investment operations and investment groups. The Board considered the structure of the investment personnel compensation program and whether this structure provides appropriate incentives to act in the best interests of the fund. Additionally, the Board considered the portfolio managers' investments, if any, in the funds that they manage.
Resources Dedicated to Investment Management and Support Services. The Board and the Fund Oversight and Research Committees reviewed the general qualifications and capabilities of Fidelity's investment staff, including its size, education, experience, and resources, as well as Fidelity's approach to recruiting, training, managing, and compensating investment personnel. The Board noted that Fidelity has continued to increase the resources devoted to non-U.S. offices, including expansion of Fidelity's global investment organization. The Board also noted that Fidelity's analysts have extensive resources, tools and capabilities that allow them to conduct sophisticated quantitative and fundamental analysis, as well as credit analysis of issuers, counterparties and guarantors. Further, the Board considered that Fidelity's investment professionals have sufficient access to global information and data so as to provide competitive investment results over time, and that those professionals also have access to sophisticated tools that permit them to assess portfolio construction and risk and performance attribution characteristics continuously, as well as to transmit new information and research conclusions rapidly around the world. Additionally, in its deliberations, the Board considered Fidelity's trading, risk management, compliance, and technology and operations capabilities and resources, which are integral parts of the investment management process.
Shareholder and Administrative Services. The Board considered (i) the nature, extent, quality, and cost of advisory, administrative, and shareholder services performed by the Investment Advisers and their affiliates under the Advisory Contracts and under separate agreements covering transfer agency, pricing and bookkeeping, and securities lending services for the fund; (ii) the nature and extent of the supervision of third party service providers, principally custodians, subcustodians, and pricing vendors; and (iii) the resources devoted to, and the record of compliance with, the fund's compliance policies and procedures. The Board also reviewed the allocation of fund brokerage, including allocations to brokers affiliated with the Investment Advisers, the use of brokerage commissions to pay fund expenses, and the use of "soft" commission dollars to pay for research services.
The Board noted that the growth of fund assets over time across the complex allows Fidelity to reinvest in the development of services designed to enhance the value and convenience of the Fidelity funds as investment vehicles. These services include 24-hour access to account information and market information through telephone representatives and over the Internet, investor education materials and asset allocation tools, and the expanded availability of Fidelity Investor Centers.
The Board noted that it and the boards of certain other Fidelity funds had formed an ad hoc Committee on Transfer Agency Fees to review the variety of transfer agency fee structures throughout the industry and Fidelity's competitive positioning with respect to industry participants.
Investment in a Large Fund Family. The Board considered the benefits to shareholders of investing in a Fidelity fund, including the benefits of investing in a fund that is part of a large family of funds offering a variety of investment disciplines and providing a large variety of mutual fund investor services. The Board noted that Fidelity had taken, or had made recommendations that resulted in the Fidelity funds taking, a number of actions over the previous year that benefited particular funds, including: (i) continuing to dedicate additional resources to Fidelity's investment research process, which includes meetings with management of issuers of securities in which the funds invest, and to the support of the senior management team that oversees asset management; (ii) continuing efforts to enhance Fidelity's global research capabilities; (iii) launching new funds and making other enhancements to meet client needs; (iv) launching new share classes of existing funds; (v) eliminating purchase minimums and broadening eligibility requirements for certain funds and share classes; (vi) reducing management fees and total expenses for certain growth equity funds and index funds; (vii) lowering expense caps for certain existing funds and classes, and converting certain voluntary expense caps to contractual caps, to reduce expenses borne by shareholders; (viii) eliminating short-term redemption fees for funds that had such fees; (ix) rationalizing product lines and gaining increased efficiencies from fund mergers and share class consolidations; (x) continuing to develop, acquire and implement systems and technology to improve services to the funds and shareholders, strengthen information security, and increase efficiency; and (xi) continuing to implement enhancements to further strengthen Fidelity's product line to increase investors' probability of success in achieving their investment goals, including retirement income goals.
Investment Performance. The Board considered whether the fund has operated in accordance with its investment objective, as well as its record of compliance with its investment restrictions and its performance history.
The Board took into account discussions that occur at Board meetings throughout the year with representatives of the Investment Advisers about fund investment performance. In this regard the Board noted that as part of regularly scheduled fund reviews and other reports to the Board on fund performance, the Board considers annualized return information for the fund for different time periods, measured against an appropriate securities market index ("benchmark index") and a peer group of funds with similar objectives ("peer group"), if any. In its evaluation of fund investment performance, the Board gave particular attention to information indicating changes in performance of certain Fidelity funds for specific time periods and discussed with the Investment Advisers the reasons for any overperformance or underperformance.
In addition to reviewing absolute and relative fund performance, the Independent Trustees periodically consider the appropriateness of fund performance metrics in evaluating the results achieved. In general, the Independent Trustees believe that fund performance should be evaluated based on net performance (after fees and expenses) of both the highest performing and lowest performing fund share classes, where applicable, compared to appropriate benchmark indices, over appropriate time periods that may include full market cycles, and compared to peer groups, as applicable, over the same periods, taking into account relevant factors including the following: general market conditions; issuer-specific information; and fund cash flows and other factors.
The Independent Trustees recognize that shareholders evaluate performance on a net basis over their own holding periods, for which one-, three-, and five-year periods are often used as a proxy. For this reason, the performance information reviewed by the Board also included net cumulative total return information for the fund and an appropriate benchmark index and peer group for the most recent one-, three-, and five-year periods ended June 30, 2018, as shown below. Returns are shown compared to the 25th percentile (top of box, 75% beaten) and 75th percentile (bottom of box, 25% beaten) of the peer universe. Returns of the benchmark index are "net MA,"
i.e., adjusted for tax withholding rates applicable to U.S.-based funds organized as Massachusetts business trusts.
Fidelity International Growth Fund

The Board also considered that the fund's management fee is subject to upward or downward adjustment depending upon whether, and to what extent, the fund's investment performance for the performance period (a rolling 36-month period) exceeds, or is exceeded by, a securities index, thus leading to a performance adjustment for the same period. The Board noted that the performance adjustment provides FMR with a strong economic incentive to seek to achieve superior long-term performance for the fund's shareholders and helps to more closely align the interests of FMR and the shareholders of the fund.
Based on its review, the Board concluded that the nature, extent, and quality of services provided to the fund under the Advisory Contracts should continue to benefit the shareholders of the fund.
Competitiveness of Management Fee and Total Expense Ratio. The Board considered the fund's management fee and total expense ratio compared to "mapped groups" of competitive funds and classes created for the purpose of facilitating the Trustees' competitive analysis of management fees and total expenses. Fidelity creates "mapped groups" by combining similar Lipper investment objective categories that have comparable investment mandates. Combining Lipper investment objective categories aids the Board's management fee and total expense ratio comparisons by broadening the competitive group used for comparison.
Management Fee. The Board considered two proprietary management fee comparisons for the 12-month periods (ended June 30 for 2018 and December 31 for prior periods) shown in basis points (BP) in the chart below. The group of Lipper funds used by the Board for management fee comparisons is referred to below as the "Total Mapped Group." The Total Mapped Group comparison focuses on a fund's standing in terms of gross management fees before expense reimbursements or caps, and without giving effect to the fund's performance adjustment, relative to the total universe of funds with comparable investment mandates, regardless of whether their management fee structures also are comparable. Funds with comparable investment mandates offer exposure to similar types of securities. Funds with comparable management fee structures have similar management fee contractual arrangements (
e.g., flat rate charged for advisory services, all-inclusive fee rate,
etc.). "TMG %" represents the percentage of funds in the Total Mapped Group that had management fees that were lower than the fund's. For example, a hypothetical TMG % of 20% would mean that 80% of the funds in the Total Mapped Group had higher, and 20% had lower, management fees than the fund. The fund's actual TMG %s and the number of funds in the Total Mapped Group are in the chart below. The "Asset-Size Peer Group" (ASPG) comparison focuses on a fund's standing relative to a subset of non-Fidelity funds within the Total Mapped Group that are similar in size and management fee structure without taking into account performance adjustments, if any. For example, if a fund is in the first quartile of the ASPG, the fund's management fee ranks in the least expensive or lowest 25% of funds in the ASPG. The ASPG represents at least 15% of the funds in the Total Mapped Group with comparable asset size and management fee structures, subject to a minimum of 50 funds (or all funds in the Total Mapped Group if fewer than 50). Additional information, such as the ASPG quartile in which the fund's management fee rate ranked and the impact of the fund's performance adjustment, is also included in the chart and was considered by the Board.
Fidelity International Growth Fund
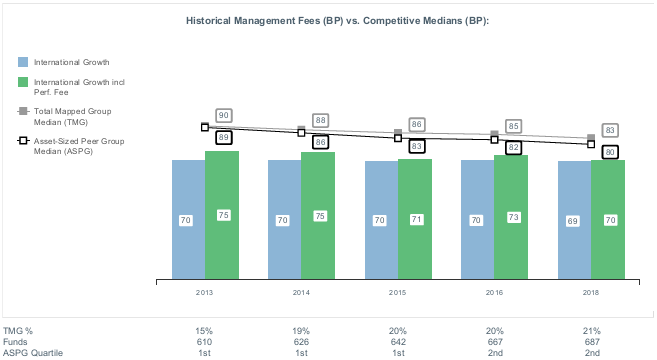
The Board noted that the fund's management fee rate ranked below the median of its Total Mapped Group and below the median of its ASPG for the 12-month period ended June 30, 2018. The Board also noted the effect of the fund's performance adjustment, if any, on the fund's management fee ranking.
The Board noted that it and the boards of other Fidelity funds formed an ad hoc Committee on Group Fee, which meets periodically, to conduct an in-depth review of the "group fee" component of the management fee of funds with such management fee structures. The Committee's focus included the mechanics of the group fee, the competitive landscape of group fee structures, Fidelity funds with no group fee component and investment products not included in group fee assets. The Board also considered that, for funds subject to the group fee, FMR agreed to voluntarily waive fees over a specified period of time in amounts designed to account for assets converted from certain funds to certain collective investment trusts.
The Board also noted that, in 2013, the ad hoc Committee on Management Fees was formed to conduct an in-depth review of the management fee rates of Fidelity's active equity mutual funds. The Committee focused on the following areas: (i) standard fee structures; (ii) research consumption and trading evolution; (iii) management fee competitiveness/profitability by category; and (iv) factors that drive institutional pricing.
Based on its review, the Board concluded that the fund's management fee is fair and reasonable in light of the services that the fund receives and the other factors considered.
Total Expense Ratio. In its review of each class's total expense ratio, the Board considered the fund's management fee rate as well as other fund or class expenses, as applicable, such as transfer agent fees, pricing and bookkeeping fees, fund-paid 12b-1 fees, and custodial, legal, and audit fees. The Board noted the impact of the fund's performance adjustment. The Board also noted that Fidelity may agree to waive fees and expenses from time to time, and the extent to which, if any, it has done so for the fund. As part of its review, the Board also considered the current and historical total expense ratios of each class of the fund compared to competitive fund median expenses. Each class of the fund is compared to those funds and classes in the Total Mapped Group (used by the Board for management fee comparisons) that have a similar sales load structure.
The Board noted that the total expense ratio of each of Class A, Class I, Class Z, and the retail class ranked below the competitive median for the 12-month period ended June 30, 2018, the total expense ratio of Class C ranked equal to the competitive median for the 12-month period ended June 30, 2018, and the total expense ratio of Class M ranked above the competitive median for the 12-month period ended June 30, 2018. The Board considered that, in general, various factors can affect total expense ratios. The Board noted that the total expense ratio of Class M was above the competitive median primarily because of higher 12b-1 fees on Class M as compared to most competitor funds. Class M has a higher 12b-1 fee, but a lower front-end sales charge, than traditionally priced front-end sales charge classes. The Board considered that Class M is primarily sold load-waived to retirement plans and intermediary wrap programs where its 0.50% 12b-1 fee is comparable to competing no-load, higher 12b-1 fee classes designed specifically for retirement plans and wrap programs. The Board noted that the fund offers multiple classes, each of which has a different sales load and 12b-1 fee structure, and that the multiple structures are intended to offer a range of pricing options for the intermediary market. The Board also noted that the total expense ratios of the classes vary primarily by the level of their 12b-1 fees, although differences in transfer agent fees may also cause expenses to vary from class to class.
Fees Charged to Other Fidelity Clients. The Board also considered Fidelity fee structures and other information with respect to clients of Fidelity, such as other funds advised or subadvised by Fidelity, pension plan clients, and other institutional clients with similar mandates. The Board noted that a joint ad hoc committee created by it and the boards of other Fidelity funds periodically reviews and compares Fidelity's institutional investment advisory business with its business of providing services to the Fidelity funds and also noted the most recent findings of the committee. The Board noted that the committee's review included a consideration of the differences in services provided, fees charged, and costs incurred, as well as competition in the markets serving the different categories of clients.
Based on its review of total expense ratios and fees charged to other Fidelity clients, the Board concluded that the total expense ratio of each class of the fund was reasonable in light of the services that the fund and its shareholders receive and the other factors considered.
Costs of the Services and Profitability. The Board considered the revenues earned and the expenses incurred by Fidelity in conducting the business of developing, marketing, distributing, managing, administering and servicing the fund and servicing the fund's shareholders. The Board also considered the level of Fidelity's profits in respect of all the Fidelity funds.
On an annual basis, Fidelity presents to the Board information about the profitability of its relationships with the fund. Fidelity calculates profitability information for each fund, as well as aggregate profitability information for groups of Fidelity funds and all Fidelity funds, using a series of detailed revenue and cost allocation methodologies which originate with the books and records of Fidelity on which Fidelity's audited financial statements are based. The Audit Committee of the Board reviews any significant changes from the prior year's methodologies.
PricewaterhouseCoopers LLP (PwC), auditor to Fidelity and certain Fidelity funds, has been engaged annually by the Board as part of the Board's assessment of Fidelity's profitability analysis. PwC's engagement includes the review and assessment of the methodologies used by Fidelity in determining the revenues and expenses attributable to Fidelity's mutual fund business, and completion of agreed-upon procedures in respect of the mathematical accuracy of the fund profitability information and its conformity to established allocation methodologies. After considering PwC's reports issued under the engagement and information provided by Fidelity, the Board concluded that while other allocation methods may also be reasonable, Fidelity's profitability methodologies are reasonable in all material respects.
The Board also reviewed Fidelity's non-fund businesses and potential indirect benefits such businesses may have received as a result of their association with Fidelity's mutual fund business (i.e., fall-out benefits) as well as cases where Fidelity's affiliates may benefit from the fund's business. The Board noted that changes to fall-out benefits year-over-year reflect business developments at Fidelity's various businesses.
The Board considered the costs of the services provided by and the profits realized by Fidelity in connection with the operation of the fund and was satisfied that the profitability was not excessive.
Economies of Scale. The Board considered whether there have been economies of scale in respect of the management of the Fidelity funds, whether the Fidelity funds (including the fund) have appropriately benefited from any such economies of scale, and whether there is potential for realization of any further economies of scale. The Board considered the extent to which the fund will benefit from economies of scale as assets grow through increased services to the fund, through waivers or reimbursements, or through fee or expense ratio reductions. The Board also noted that a committee (the Economies of Scale Committee) created by it and the boards of other Fidelity funds periodically analyzes whether Fidelity attains economies of scale in respect of the management and servicing of the Fidelity funds, whether the Fidelity funds have appropriately benefited from such economies of scale, and whether there is potential for realization of any further economies of scale.
The Board recognized that the fund's management contract incorporates a "group fee" structure, which provides for lower group fee rates as total group assets increase, and for higher group fee rates as total group assets decrease (with "group assets" defined to include fund assets under FMR's management plus the assets of sector funds previously under FMR's management). FMR calculates the group fee rates based on a tiered asset "breakpoint" schedule that varies based on asset class. The Board considered that the group fee is designed to deliver the benefits of economies of scale to fund shareholders when total Fidelity fund assets increase, even if assets of any particular fund are unchanged or have declined, because some portion of Fidelity's costs are attributable to services provided to all Fidelity funds, and all funds benefit if those costs can be allocated among more assets. The Board concluded that, given the group fee structure, fund shareholders will benefit from lower management fees as group assets increase at the fund complex level, regardless of whether Fidelity achieves any such economies of scale.
The Board concluded, taking into account the analysis of the Economies of Scale Committee, that economies of scale, if any, are being appropriately shared between fund shareholders and Fidelity.
Additional Information Requested by the Board. In order to develop fully the factual basis for consideration of the Fidelity funds' advisory contracts, the Board requested and received additional information on certain topics, including: (i) fund performance trends, in particular the underperformance of certain funds, and Fidelity's long-term strategies for certain funds; (ii) Fidelity's fund profitability methodology, profitability trends for certain funds, and the impact of certain factors on fund profitability results; (iii) metrics for evaluating index fund and ETF performance and information about ETF trading characteristics; (iv) the methodology with respect to the evaluation of competitive fund data and peer group classifications and fee comparisons; (v) the expense structures for different funds and classes; (vi) information regarding other accounts managed by Fidelity, including collective investment trusts; and (vii) Fidelity's philosophies and strategies for evaluating funds and classes with lower or declining asset levels.
Based on its evaluation of all of the conclusions noted above, and after considering all factors it believed relevant, the Board concluded that the advisory fee arrangements are fair and reasonable, and that the fund's Advisory Contracts should be renewed.
IGF-SANN-0619
1.912353.109
Fidelity® International Discovery Fund
Semi-Annual Report April 30, 2019 Includes Fidelity and Fidelity Advisor share classes |
|
Beginning on January 1, 2021, as permitted by regulations adopted by the Securities and Exchange Commission, paper copies of a fund’s shareholder reports will no longer be sent by mail, unless you specifically request paper copies of the reports from the fund or from your financial intermediary, such as a financial advisor, broker-dealer or bank. Instead, the reports will be made available on a website, and you will be notified by mail each time a report is posted and provided with a website link to access the report.
If you already elected to receive shareholder reports electronically, you will not be affected by this change and you need not take any action. You may elect to receive shareholder reports and other communications from a fund electronically, by contacting your financial intermediary. For Fidelity customers, visit Fidelity's web site or call Fidelity using the contact information listed below.
You may elect to receive all future reports in paper free of charge. If you wish to continue receiving paper copies of your shareholder reports, you may contact your financial intermediary or, if you are a Fidelity customer, visit Fidelity’s website, or call Fidelity at the applicable toll-free number listed below. Your election to receive reports in paper will apply to all funds held with the fund complex/your financial intermediary.
| Account Type | Website | Phone Number |
| Brokerage, Mutual Fund, or Annuity Contracts: | fidelity.com/mailpreferences | 1-800-343-3548 |
| Employer Provided Retirement Accounts: | netbenefits.fidelity.com/preferences (choose 'no' under Required Disclosures to continue to print) | 1-800-343-0860 |
| Advisor Sold Accounts Serviced Through Your Financial Intermediary: | Contact Your Financial Intermediary | Your Financial Intermediary's phone number |
| Advisor Sold Accounts Serviced by Fidelity: | institutional.fidelity.com | 1-877-208-0098 |
Contents
To view a fund's proxy voting guidelines and proxy voting record for the 12-month period ended June 30, visit http://www.fidelity.com/proxyvotingresults or visit the Securities and Exchange Commission's (SEC) web site at http://www.sec.gov.
You may also call 1-800-544-8544 if you’re an individual investing directly with Fidelity, call 1-800-835-5092 if you’re a plan sponsor or participant with Fidelity as your recordkeeper or call 1-877-208-0098 on institutional accounts or if you’re an advisor or invest through one to request a free copy of the proxy voting guidelines.
Standard & Poor's, S&P and S&P 500 are registered service marks of The McGraw-Hill Companies, Inc. and have been licensed for use by Fidelity Distributors Corporation.
Other third-party marks appearing herein are the property of their respective owners.
All other marks appearing herein are registered or unregistered trademarks or service marks of FMR LLC or an affiliated company. © 2019 FMR LLC. All rights reserved.
This report and the financial statements contained herein are submitted for the general information of the shareholders of the Fund. This report is not authorized for distribution to prospective investors in the Fund unless preceded or accompanied by an effective prospectus.
A fund files its complete schedule of portfolio holdings with the SEC for the first and third quarters of each fiscal year on Form N-PORT. Forms N-PORT are available on the SEC’s web site at http://www.sec.gov. A fund's Forms N-PORT may be reviewed and copied at the SEC’s Public Reference Room in Washington, DC. Information regarding the operation of the SEC's Public Reference Room may be obtained by calling 1-800-SEC-0330.
For a complete list of a fund's portfolio holdings, view the most recent holdings listing, semiannual report, or annual report on Fidelity's web site at http://www.fidelity.com, http://www.institutional.fidelity.com, or http://www.401k.com, as applicable.
NOT FDIC INSURED •MAY LOSE VALUE •NO BANK GUARANTEE
Neither the Fund nor Fidelity Distributors Corporation is a bank.
Investment Summary (Unaudited)
Geographic Diversification (% of fund's net assets)
| As of April 30, 2019 |
| | Japan | 12.5% |
| | United Kingdom | 12.2% |
| | Switzerland | 10.5% |
| | Germany | 9.3% |
| | France | 8.0% |
| | United States of America* | 5.3% |
| | Netherlands | 5.3% |
| | India | 3.9% |
| | Norway | 3.2% |
| | Other | 29.8% |
* Includes Short-Term investments and Net Other Assets (Liabilities).
Percentages are based on country or territory of incorporation and are adjusted for the effect of futures contracts, if applicable.
Asset Allocation as of April 30, 2019
| | % of fund's net assets |
| Stocks and Investment Companies | 98.4 |
| Short-Term Investments and Net Other Assets (Liabilities) | 1.6 |
Top Ten Stocks as of April 30, 2019
| | % of fund's net assets |
| Nestle SA (Reg. S) (Switzerland, Food Products) | 3.2 |
| Total SA (France, Oil, Gas & Consumable Fuels) | 2.7 |
| Roche Holding AG (participation certificate) (Switzerland, Pharmaceuticals) | 2.5 |
| SAP SE (Germany, Software) | 2.2 |
| Equinor ASA (Norway, Oil, Gas & Consumable Fuels) | 2.2 |
| Unilever NV (Certificaten Van Aandelen) (Bearer) (Netherlands, Personal Products) | 1.8 |
| AIA Group Ltd. (Hong Kong, Insurance) | 1.8 |
| Keyence Corp. (Japan, Electronic Equipment & Components) | 1.6 |
| Hoya Corp. (Japan, Health Care Equipment & Supplies) | 1.5 |
| AstraZeneca PLC (United Kingdom) (United Kingdom, Pharmaceuticals) | 1.5 |
| | 21.0 |
Top Market Sectors as of April 30, 2019
| | % of fund's net assets |
| Financials | 16.9 |
| Industrials | 15.6 |
| Information Technology | 14.0 |
| Health Care | 12.6 |
| Consumer Staples | 10.7 |
| Consumer Discretionary | 10.2 |
| Energy | 5.9 |
| Materials | 4.1 |
| Communication Services | 4.0 |
| Real Estate | 2.8 |
Schedule of Investments April 30, 2019 (Unaudited)
Showing Percentage of Net Assets
| Common Stocks - 97.0% | | | |
| | | Shares | Value (000s) |
| Australia - 2.3% | | | |
| Bapcor Ltd. | | 8,952,247 | $35,909 |
| Blue Sky Alternative Investments Ltd. (a) | | 2,941,055 | 560 |
| CSL Ltd. | | 526,290 | 73,671 |
| Inghams Group Ltd. (b) | | 10,237,684 | 32,116 |
| Magellan Financial Group Ltd. | | 1,191,627 | 37,474 |
| National Storage (REIT) unit | | 21,436,150 | 27,049 |
| Pro Medicus Ltd. | | 237,648 | 3,424 |
| Rio Tinto Ltd. | | 4,247 | 286 |
|
| TOTAL AUSTRALIA | | | 210,489 |
|
| Austria - 1.1% | | | |
| Erste Group Bank AG | | 1,739,100 | 69,636 |
| Wienerberger AG | | 1,431,800 | 32,857 |
|
| TOTAL AUSTRIA | | | 102,493 |
|
| Bailiwick of Jersey - 0.7% | | | |
| Experian PLC | | 2,205,827 | 64,209 |
| Belgium - 1.1% | | | |
| KBC Groep NV | | 1,372,459 | 101,628 |
| Bermuda - 0.6% | | | |
| Haier Electronics Group Co. Ltd. | | 7,419,000 | 21,231 |
| Hiscox Ltd. | | 1,751,420 | 38,232 |
|
| TOTAL BERMUDA | | | 59,463 |
|
| Brazil - 0.8% | | | |
| BM&F BOVESPA SA | | 4,216,900 | 37,049 |
| Notre Dame Intermedica Participacoes SA | | 4,518,688 | 40,472 |
|
| TOTAL BRAZIL | | | 77,521 |
|
| Canada - 2.9% | | | |
| Alimentation Couche-Tard, Inc. Class B (sub. vtg.) | | 1,331,200 | 78,489 |
| Cenovus Energy, Inc. (Canada) | | 3,255,700 | 32,273 |
| Constellation Software, Inc. | | 73,200 | 64,587 |
| Dollarama, Inc. | | 1,034,500 | 31,073 |
| Suncor Energy, Inc. | | 1,795,700 | 59,218 |
|
| TOTAL CANADA | | | 265,640 |
|
| Cayman Islands - 2.8% | | | |
| Alibaba Group Holding Ltd. sponsored ADR (a) | | 272,600 | 50,586 |
| Meituan Dianping Class B | | 5,958,244 | 43,292 |
| Momo, Inc. ADR | | 750,200 | 26,310 |
| Sands China Ltd. | | 4,774,800 | 26,233 |
| Sea Ltd. ADR (a) | | 421,500 | 10,491 |
| Tencent Holdings Ltd. | | 2,023,500 | 99,734 |
|
| TOTAL CAYMAN ISLANDS | | | 256,646 |
|
| China - 1.7% | | | |
| Hangzhou Hikvision Digital Technology Co. Ltd. (A Shares) | | 5,234,300 | 25,399 |
| Kweichow Moutai Co. Ltd. (A Shares) | | 422,200 | 61,058 |
| Shanghai International Airport Co. Ltd. (A Shares) | | 4,964,000 | 52,058 |
| SKSHU Paint Co. Ltd. (A Shares) | | 2,441,289 | 23,964 |
|
| TOTAL CHINA | | | 162,479 |
|
| Denmark - 1.6% | | | |
| DONG Energy A/S (c) | | 731,400 | 55,995 |
| Netcompany Group A/S (c) | | 1,089,134 | 38,844 |
| Novo Nordisk A/S Series B | | 319,624 | 15,660 |
| SimCorp A/S | | 364,500 | 35,731 |
|
| TOTAL DENMARK | | | 146,230 |
|
| France - 8.0% | | | |
| ALTEN | | 198,075 | 21,616 |
| Capgemini SA | | 734,612 | 89,068 |
| Cegedim SA (a) | | 576,944 | 16,792 |
| LVMH Moet Hennessy - Louis Vuitton SA | | 300,924 | 118,148 |
| Sartorius Stedim Biotech | | 312,230 | 42,374 |
| SR Teleperformance SA | | 376,102 | 72,261 |
| Total SA | | 4,457,446 | 247,793 |
| VINCI SA (b) | | 1,310,767 | 132,383 |
|
| TOTAL FRANCE | | | 740,435 |
|
| Germany - 9.3% | | | |
| adidas AG | | 447,917 | 115,096 |
| Akasol AG (c) | | 279,844 | 14,532 |
| Allianz SE | | 384,266 | 92,883 |
| Daimler AG (Germany) | | 636,800 | 41,668 |
| Deutsche Borse AG | | 162,846 | 21,760 |
| Deutsche Post AG | | 1,941,355 | 67,482 |
| Instone Real Estate Group BV (a)(c) | | 1,004,165 | 24,496 |
| Linde PLC | | 373,921 | 67,270 |
| MTU Aero Engines Holdings AG | | 382,068 | 89,862 |
| Nexus AG | | 598,207 | 17,109 |
| Rational AG | | 36,375 | 24,561 |
| Rheinmetall AG | | 300,250 | 34,451 |
| SAP SE | | 1,594,987 | 205,607 |
| Vonovia SE | | 918,403 | 45,808 |
|
| TOTAL GERMANY | | | 862,585 |
|
| Hong Kong - 2.6% | | | |
| AIA Group Ltd. | | 16,017,400 | 164,009 |
| Techtronic Industries Co. Ltd. | | 10,264,500 | 74,189 |
|
| TOTAL HONG KONG | | | 238,198 |
|
| India - 3.9% | | | |
| Avenue Supermarts Ltd. (a)(c) | | 595,148 | 11,070 |
| HDFC Bank Ltd. | | 1,745,291 | 57,901 |
| HDFC Bank Ltd. sponsored ADR | | 934,584 | 107,150 |
| Housing Development Finance Corp. Ltd. | | 4,636,915 | 132,825 |
| Sunteck Realty Ltd. (a) | | 3,638,783 | 24,109 |
| TCNS Clothing Co. Ltd. (a)(c) | | 2,290,991 | 27,018 |
|
| TOTAL INDIA | | | 360,073 |
|
| Indonesia - 0.4% | | | |
| PT Bank Central Asia Tbk | | 9,452,500 | 19,071 |
| PT Bank Rakyat Indonesia Tbk | | 65,767,900 | 20,169 |
|
| TOTAL INDONESIA | | | 39,240 |
|
| Ireland - 1.8% | | | |
| Cairn Homes PLC (a) | | 24,177,263 | 34,764 |
| Dalata Hotel Group PLC | | 3,684,907 | 24,343 |
| DCC PLC (United Kingdom) | | 234,700 | 20,958 |
| Green REIT PLC | | 9,492,200 | 18,035 |
| Kerry Group PLC Class A | | 646,400 | 72,355 |
|
| TOTAL IRELAND | | | 170,455 |
|
| Italy - 0.8% | | | |
| Recordati SpA | | 1,803,100 | 72,785 |
| Japan - 12.5% | | | |
| AEON Financial Service Co. Ltd. | | 1,288,800 | 26,599 |
| Fanuc Corp. | | 431,000 | 80,974 |
| Hoya Corp. | | 2,059,200 | 144,465 |
| Kao Corp. | | 553,800 | 42,541 |
| Keyence Corp. | | 233,020 | 144,588 |
| Minebea Mitsumi, Inc. | | 3,076,300 | 54,404 |
| Misumi Group, Inc. | | 1,127,000 | 29,117 |
| Monex Group, Inc. | | 3,471,749 | 10,534 |
| MonotaRO Co. Ltd. | | 1,060,700 | 24,395 |
| Nidec Corp. | | 347,800 | 49,284 |
| Nitori Holdings Co. Ltd. | | 191,900 | 22,826 |
| ORIX Corp. | | 8,432,400 | 118,960 |
| Persol Holdings Co., Ltd. (d) | | 1,303,000 | 24,377 |
| Recruit Holdings Co. Ltd. | | 1,420,200 | 42,442 |
| Relo Group, Inc. | | 2,588,800 | 70,417 |
| Shimadzu Corp. | | 881,500 | 23,534 |
| Shiseido Co. Ltd. | | 387,200 | 30,303 |
| SMC Corp. | | 227,000 | 93,861 |
| SoftBank Corp. | | 1,006,200 | 106,689 |
| Terumo Corp. | | 759,000 | 22,805 |
|
| TOTAL JAPAN | | | 1,163,115 |
|
| Korea (South) - 0.6% | | | |
| AMOREPACIFIC Corp. | | 161,870 | 28,925 |
| Cafe24 Corp. (a) | | 223,645 | 18,445 |
| Hyundai Fire & Marine Insurance Co. Ltd. | | 331,774 | 10,902 |
|
| TOTAL KOREA (SOUTH) | | | 58,272 |
|
| Malta - 0.2% | | | |
| Kambi Group PLC (a) | | 873,700 | 17,407 |
| Mexico - 0.3% | | | |
| Grupo Financiero Banorte S.A.B. de CV Series O | | 4,260,200 | 26,928 |
| Netherlands - 5.3% | | | |
| Adyen BV (c) | | 21,390 | 17,408 |
| Airbus Group NV | | 555,666 | 76,087 |
| ASML Holding NV (Netherlands) | | 558,100 | 116,142 |
| Basic-Fit NV (a)(c) | | 893,400 | 31,664 |
| IMCD Group BV | | 537,945 | 43,442 |
| NXP Semiconductors NV | | 284,900 | 30,091 |
| Unilever NV (Certificaten Van Aandelen) (Bearer) | | 2,838,132 | 171,720 |
| Van Lanschot NV (Bearer) | | 221,300 | 5,746 |
|
| TOTAL NETHERLANDS | | | 492,300 |
|
| New Zealand - 1.5% | | | |
| EBOS Group Ltd. | | 3,122,113 | 44,666 |
| Fisher & Paykel Healthcare Corp. | | 3,792,388 | 40,046 |
| Ryman Healthcare Group Ltd. | | 6,735,732 | 54,660 |
|
| TOTAL NEW ZEALAND | | | 139,372 |
|
| Norway - 3.2% | | | |
| Adevinta ASA: | | | |
| Class A (a) | | 2,397,500 | 24,182 |
| Class B | | 733,400 | 7,215 |
| Equinor ASA | | 9,005,013 | 200,872 |
| Schibsted ASA (A Shares) | | 2,351,000 | 61,695 |
|
| TOTAL NORWAY | | | 293,964 |
|
| Poland - 0.1% | | | |
| Bank Polska Kasa Opieki SA | | 194,600 | 5,790 |
| South Africa - 1.0% | | | |
| Clicks Group Ltd. | | 1,678,500 | 22,958 |
| Naspers Ltd. Class N | | 273,200 | 70,281 |
|
| TOTAL SOUTH AFRICA | | | 93,239 |
|
| Spain - 1.1% | | | |
| Grifols SA ADR | | 1,587,850 | 30,391 |
| Masmovil Ibercom SA (a) | | 3,203,840 | 70,216 |
|
| TOTAL SPAIN | | | 100,607 |
|
| Sweden - 2.7% | | | |
| ASSA ABLOY AB (B Shares) | | 2,163,800 | 46,257 |
| Indutrade AB | | 2,476,800 | 75,727 |
| Securitas AB (B Shares) | | 2,262,800 | 39,569 |
| Telefonaktiebolaget LM Ericsson (B Shares) | | 8,903,800 | 88,078 |
|
| TOTAL SWEDEN | | | 249,631 |
|
| Switzerland - 10.5% | | | |
| Alcon, Inc. (a) | | 925,920 | 53,323 |
| Compagnie Financiere Richemont SA Series A | | 234,730 | 17,159 |
| Forbo Holding AG (Reg.) | | 19,913 | 31,991 |
| Kaba Holding AG (B Shares) (Reg.) | | 40,966 | 30,917 |
| Lonza Group AG | | 258,958 | 79,974 |
| Medacta Group SA (c) | | 98,400 | 9,015 |
| Nestle SA (Reg. S) | | 3,065,820 | 295,171 |
| Partners Group Holding AG | | 104,586 | 78,787 |
| Roche Holding AG (participation certificate) | | 867,268 | 228,840 |
| Schindler Holding AG (participation certificate) | | 167,947 | 36,228 |
| Sika AG | | 361,265 | 55,309 |
| Swiss Re Ltd. | | 564,650 | 54,340 |
|
| TOTAL SWITZERLAND | | | 971,054 |
|
| Taiwan - 0.7% | | | |
| Taiwan Semiconductor Manufacturing Co. Ltd. | | 8,378,000 | 70,340 |
| United Kingdom - 12.2% | | | |
| Anglo American PLC (United Kingdom) | | 1,917,745 | 49,550 |
| AstraZeneca PLC (United Kingdom) | | 1,908,791 | 142,205 |
| Beazley PLC | | 6,729,100 | 50,543 |
| BHP Billiton PLC | | 3,503,904 | 82,708 |
| Big Yellow Group PLC | | 2,521,500 | 34,228 |
| Bunzl PLC | | 3,299,544 | 99,347 |
| Compass Group PLC | | 2,401,265 | 54,638 |
| Cranswick PLC | | 668,096 | 25,247 |
| Dechra Pharmaceuticals PLC | | 1,338,176 | 46,417 |
| Diageo PLC | | 2,826,774 | 119,170 |
| Fever-Tree Drinks PLC | | 264,000 | 10,823 |
| JTC PLC (c) | | 4,784,900 | 24,771 |
| Keywords Studios PLC | | 1,166,700 | 23,688 |
| Lloyds Banking Group PLC | | 68,251,100 | 55,818 |
| London Stock Exchange Group PLC | | 331,136 | 21,710 |
| Micro Focus International PLC | | 1,717,442 | 43,398 |
| Network International Holdings PLC (c) | | 2,263,100 | 15,375 |
| Ocado Group PLC (a) | | 2,190,702 | 38,922 |
| Prudential PLC | | 2,173,400 | 49,383 |
| Rio Tinto PLC | | 1,227,472 | 71,610 |
| Rotork PLC | | 7,933,500 | 32,267 |
| Standard Life PLC | | 10,919,700 | 39,713 |
|
| TOTAL UNITED KINGDOM | | | 1,131,531 |
|
| United States of America - 2.7% | | | |
| Marsh & McLennan Companies, Inc. | | 504,700 | 47,588 |
| MasterCard, Inc. Class A | | 397,800 | 101,137 |
| Visa, Inc. Class A | | 613,100 | 100,812 |
|
| TOTAL UNITED STATES OF AMERICA | | | 249,537 |
|
| TOTAL COMMON STOCKS | | | |
| (Cost $7,379,717) | | | 8,993,656 |
|
| Nonconvertible Preferred Stocks - 0.4% | | | |
| Brazil - 0.4% | | | |
| Itausa-Investimentos Itau SA (PN) | | | |
| (Cost $43,626) | | 12,549,400 | 38,118 |
|
| Investment Companies - 1.0% | | | |
| United States of America - 1.0% | | | |
| iShares MSCI Japan ETF | | | |
| (Cost $88,093) | | 1,620,200 | 89,791 |
| | | Principal Amount (000s) | Value (000s) |
|
| Government Obligations - 0.0% | | | |
| United States of America - 0.0% | | | |
U.S. Treasury Bills, yield at date of purchase 2.39% to 2.4% 5/16/19 to 5/23/19
(Cost $729) | | 730 | 729 |
| | | Shares | Value (000s) |
|
| Money Market Funds - 2.0% | | | |
| Fidelity Cash Central Fund, 2.49% (e) | | 145,130,847 | 145,160 |
| Fidelity Securities Lending Cash Central Fund 2.49% (e)(f) | | 42,179,014 | 42,183 |
| TOTAL MONEY MARKET FUNDS | | | |
| (Cost $187,343) | | | 187,343 |
| TOTAL INVESTMENT IN SECURITIES - 100.4% | | | |
| (Cost $7,699,508) | | | 9,309,637 |
| NET OTHER ASSETS (LIABILITIES) - (0.4)% | | | (34,417) |
| NET ASSETS - 100% | | | $9,275,220 |
Security Type Abbreviations
ETF – Exchange-Traded Fund
Categorizations in the Schedule of Investments are based on country or territory of incorporation.
Legend
(a) Non-income producing
(b) Security or a portion of the security is on loan at period end.
(c) Security exempt from registration under Rule 144A of the Securities Act of 1933. These securities may be resold in transactions exempt from registration, normally to qualified institutional buyers. At the end of the period, the value of these securities amounted to $270,188,000 or 2.9% of net assets.
(d) Security or a portion of the security purchased on a delayed delivery or when-issued basis.
(e) Affiliated fund that is generally available only to investment companies and other accounts managed by Fidelity Investments. The rate quoted is the annualized seven-day yield of the fund at period end. A complete unaudited listing of the fund's holdings as of its most recent quarter end is available upon request. In addition, each Fidelity Central Fund's financial statements are available on the SEC's website or upon request.
(f) Investment made with cash collateral received from securities on loan.
Affiliated Central Funds
Information regarding fiscal year to date income earned by the Fund from investments in Fidelity Central Funds is as follows:
| Fund | Income earned |
| | (Amounts in thousands) |
| Fidelity Cash Central Fund | $5,838 |
| Fidelity Securities Lending Cash Central Fund | 1,657 |
| Total | $7,495 |
Amounts in the income column in the above table include any capital gain distributions from underlying funds, which are presented in the corresponding line-item in the Statement of Operations, if applicable.
Investment Valuation
The following is a summary of the inputs used, as of April 30, 2019, involving the Fund's assets and liabilities carried at fair value. The inputs or methodology used for valuing securities may not be an indication of the risk associated with investing in those securities. For more information on valuation inputs, and their aggregation into the levels used below, please refer to the Investment Valuation section in the accompanying Notes to Financial Statements.
| | Valuation Inputs at Reporting Date: |
| Description | Total | Level 1 | Level 2 | Level 3 |
| (Amounts in thousands) | | | | |
| Investments in Securities: | | | | |
| Equities: | | | | |
| Communication Services | $364,644 | $158,221 | $206,423 | $-- |
| Consumer Discretionary | 964,531 | 686,898 | 277,633 | -- |
| Consumer Staples | 990,876 | 404,815 | 586,061 | -- |
| Energy | 540,156 | 292,363 | 247,793 | -- |
| Financials | 1,581,952 | 1,118,488 | 463,464 | -- |
| Health Care | 1,179,094 | 667,749 | 511,345 | -- |
| Industrials | 1,436,920 | 854,232 | 582,688 | -- |
| Information Technology | 1,289,910 | 925,885 | 364,025 | -- |
| Materials | 383,554 | 229,236 | 154,318 | -- |
| Real Estate | 244,142 | 244,142 | -- | -- |
| Utilities | 55,995 | 55,995 | -- | -- |
| Investment Companies | 89,791 | 89,791 | -- | -- |
| Government Obligations | 729 | -- | 729 | -- |
| Money Market Funds | 187,343 | 187,343 | -- | -- |
| Total Investments in Securities: | $9,309,637 | $5,915,158 | $3,394,479 | $-- |
See accompanying notes which are an integral part of the financial statements.
Financial Statements
Statement of Assets and Liabilities
| Amounts in thousands (except per-share amounts) | | April 30, 2019 (Unaudited) |
| Assets | | |
Investment in securities, at value (including securities loaned of $40,570) — See accompanying schedule:
Unaffiliated issuers (cost $7,512,165) | $9,122,294 | |
| Fidelity Central Funds (cost $187,343) | 187,343 | |
| Total Investment in Securities (cost $7,699,508) | | $9,309,637 |
| Foreign currency held at value (cost $135) | | 135 |
| Receivable for investments sold | | 30,572 |
| Receivable for fund shares sold | | 4,136 |
| Dividends receivable | | 45,843 |
| Distributions receivable from Fidelity Central Funds | | 320 |
| Prepaid expenses | | 5 |
| Other receivables | | 5,750 |
| Total assets | | 9,396,398 |
| Liabilities | | |
| Payable for investments purchased | | |
| Regular delivery | $35,348 | |
| Delayed delivery | 6,296 | |
| Payable for fund shares redeemed | 30,473 | |
| Accrued management fee | 4,873 | |
| Distribution and service plan fees payable | 64 | |
| Other affiliated payables | 1,217 | |
| Other payables and accrued expenses | 726 | |
| Collateral on securities loaned | 42,181 | |
| Total liabilities | | 121,178 |
| Net Assets | | $9,275,220 |
| Net Assets consist of: | | |
| Paid in capital | | $7,772,006 |
| Total distributable earnings (loss) | | 1,503,214 |
| Net Assets | | $9,275,220 |
| Net Asset Value and Maximum Offering Price | | |
| Class A: | | |
| Net Asset Value and redemption price per share ($195,711 ÷ 4,697.4 shares) | | $41.66 |
| Maximum offering price per share (100/94.25 of $41.66) | | $44.20 |
| Class M: | | |
| Net Asset Value and redemption price per share ($26,720 ÷ 644.9 shares) | | $41.43 |
| Maximum offering price per share (100/96.50 of $41.43) | | $42.93 |
| Class C: | | |
| Net Asset Value and offering price per share ($13,820 ÷ 335.9 shares)(a) | | $41.14 |
| International Discovery: | | |
| Net Asset Value, offering price and redemption price per share ($6,605,566 ÷ 157,611.7 shares) | | $41.91 |
| Class K: | | |
| Net Asset Value, offering price and redemption price per share ($1,819,516 ÷ 43,530.4 shares) | | $41.80 |
| Class I: | | |
| Net Asset Value, offering price and redemption price per share ($526,186 ÷ 12,587.7 shares) | | $41.80 |
| Class Z: | | |
| Net Asset Value, offering price and redemption price per share ($87,701 ÷ 2,099.8 shares) | | $41.77 |
(a) Redemption price per share is equal to net asset value less any applicable contingent deferred sales charge.
See accompanying notes which are an integral part of the financial statements.
Statement of Operations
| Amounts in thousands | | Six months ended April 30, 2019 (Unaudited) |
| Investment Income | | |
| Dividends | | $119,750 |
| Non-Cash dividends | | 24,555 |
| Interest | | 119 |
| Income from Fidelity Central Funds | | 7,495 |
| Income before foreign taxes withheld | | 151,919 |
| Less foreign taxes withheld | | (11,080) |
| Total income | | 140,839 |
| Expenses | | |
| Management fee | | |
| Basic fee | $30,348 | |
| Performance adjustment | (5,763) | |
| Transfer agent fees | 6,389 | |
| Distribution and service plan fees | 392 | |
| Accounting and security lending fees | 879 | |
| Custodian fees and expenses | 468 | |
| Independent trustees' fees and expenses | 26 | |
| Registration fees | 122 | |
| Audit | 85 | |
| Legal | 28 | |
| Interest | 17 | |
| Miscellaneous | 31 | |
| Total expenses before reductions | 33,022 | |
| Expense reductions | (2,996) | |
| Total expenses after reductions | | 30,026 |
| Net investment income (loss) | | 110,813 |
| Realized and Unrealized Gain (Loss) | | |
| Net realized gain (loss) on: | | |
| Investment securities: | | |
| Unaffiliated issuers | (161,737) | |
| Foreign currency transactions | (538) | |
| Futures contracts | (11,901) | |
| Total net realized gain (loss) | | (174,176) |
| Change in net unrealized appreciation (depreciation) on: | | |
| Investment securities: | | |
| Unaffiliated issuers | 741,795 | |
| Assets and liabilities in foreign currencies | 150 | |
| Futures contracts | 7,547 | |
| Total change in net unrealized appreciation (depreciation) | | 749,492 |
| Net gain (loss) | | 575,316 |
| Net increase (decrease) in net assets resulting from operations | | $686,129 |
See accompanying notes which are an integral part of the financial statements.
Statement of Changes in Net Assets
| Amounts in thousands | Six months ended April 30, 2019 (Unaudited) | Year ended October 31, 2018 |
| Increase (Decrease) in Net Assets | | |
| Operations | | |
| Net investment income (loss) | $110,813 | $126,802 |
| Net realized gain (loss) | (174,176) | 277,712 |
| Change in net unrealized appreciation (depreciation) | 749,492 | (1,430,353) |
| Net increase (decrease) in net assets resulting from operations | 686,129 | (1,025,839) |
| Distributions to shareholders | (328,610) | (535,941) |
| Share transactions - net increase (decrease) | (597,708) | 427,927 |
| Total increase (decrease) in net assets | (240,189) | (1,133,853) |
| Net Assets | | |
| Beginning of period | 9,515,409 | 10,649,262 |
| End of period | $9,275,220 | $9,515,409 |
See accompanying notes which are an integral part of the financial statements.
Financial Highlights
Fidelity International Discovery Fund Class A
| | Six months ended (Unaudited) April 30, | Years endedOctober 31, | | | | |
| | 2019 | 2018 | 2017 | 2016 | 2015 | 2014 |
| Selected Per–Share Data | | | | | | |
| Net asset value, beginning of period | $39.99 | $46.66 | $37.60 | $39.78 | $38.70 | $39.49 |
| Income from Investment Operations | | | | | | |
| Net investment income (loss)A | .40 | .37 | .36 | .47B | .40C | .53D |
| Net realized and unrealized gain (loss) | 2.51 | (4.87) | 9.22 | (2.38) | .79 | (.67) |
| Total from investment operations | 2.91 | (4.50) | 9.58 | (1.91) | 1.19 | (.14) |
| Distributions from net investment income | (.33) | (.34) | (.47) | (.27) | (.11) | (.33) |
| Distributions from net realized gain | (.91) | (1.83) | (.05) | (.01) | – | (.31) |
| Total distributions | (1.24) | (2.17) | (.52) | (.27)E | (.11) | (.65)F |
| Redemption fees added to paid in capitalA | – | – | –G | –G | –G | –G |
| Net asset value, end of period | $41.66 | $39.99 | $46.66 | $37.60 | $39.78 | $38.70 |
| Total ReturnH,I,J | 7.64% | (10.11)% | 25.87% | (4.83)% | 3.09% | (.36)% |
| Ratios to Average Net AssetsK,L | | | | | | |
| Expenses before reductions | 1.08%M | 1.22% | 1.29% | 1.35% | 1.33% | 1.28% |
| Expenses net of fee waivers, if any | 1.08%M | 1.22% | 1.29% | 1.35% | 1.33% | 1.28% |
| Expenses net of all reductions | 1.02%M | 1.21% | 1.27% | 1.34% | 1.32% | 1.28% |
| Net investment income (loss) | 2.06%M | .83% | .88% | 1.26%B | 1.00%C | 1.35%D |
| Supplemental Data | | | | | | |
| Net assets, end of period (in millions) | $196 | $191 | $248 | $236 | $283 | $297 |
| Portfolio turnover rateN | 73%M,O | 45%O | 42% | 50%O | 60%O | 57% |
A Calculated based on average shares outstanding during the period.
B Net investment income per share reflects a large, non-recurring dividend which amounted to $.14 per share. Excluding this non-recurring dividend, the ratio of net investment income (loss) to average net assets would have been .88%.
C Net investment income per share reflects a large, non-recurring dividend which amounted to $.12 per share. Excluding this non-recurring dividend, the ratio of net investment income (loss) to average net assets would have been .69%.
D Net investment income per share reflects a large, non-recurring dividend which amounted to $.22 per share. Excluding this non-recurring dividend, the ratio of net investment income (loss) to average net assets would have been .80%.
E Total distributions of $.27 per share is comprised of distributions from net investment income of $.269 and distributions from net realized gain of $.005 per share.
F Total distributions of $.65 per share is comprised of distributions from net investment income of $.334 and distributions from net realized gain of $.311 per share.
G Amount represents less than $.005 per share.
H Total returns for periods of less than one year are not annualized.
I Total returns would have been lower if certain expenses had not been reduced during the applicable periods shown.
J Total returns do not include the effect of the sales charges.
K Fees and expenses of any underlying Fidelity Central Funds are not included in the Fund's expense ratio. The Fund indirectly bears its proportionate share of the expenses of any underlying Fidelity Central Funds.
L Expense ratios reflect operating expenses of the class. Expenses before reductions do not reflect amounts reimbursed by the investment adviser or reductions from brokerage service arrangements or reductions from other expense offset arrangements and do not represent the amount paid by the class during periods when reimbursements or reductions occur. Expenses net of fee waivers reflect expenses after reimbursement by the investment adviser but prior to reductions from brokerage service arrangements or other expense offset arrangements. Expenses net of all reductions represent the net expenses paid by the class.
M Annualized
N Amount does not include the portfolio activity of any underlying Fidelity Central Funds.
O Portfolio turnover rate excludes securities received or delivered in-kind.
See accompanying notes which are an integral part of the financial statements.
Fidelity International Discovery Fund Class M
| | Six months ended (Unaudited) April 30, | Years endedOctober 31, | | | | |
| | 2019 | 2018 | 2017 | 2016 | 2015 | 2014 |
| Selected Per–Share Data | | | | | | |
| Net asset value, beginning of period | $39.71 | $46.35 | $37.34 | $39.51 | $38.43 | $39.23 |
| Income from Investment Operations | | | | | | |
| Net investment income (loss)A | .35 | .27 | .26 | .38B | .30C | .44D |
| Net realized and unrealized gain (loss) | 2.51 | (4.84) | 9.17 | (2.37) | .80 | (.68) |
| Total from investment operations | 2.86 | (4.57) | 9.43 | (1.99) | 1.10 | (.24) |
| Distributions from net investment income | (.22) | (.24) | (.37) | (.17) | (.02) | (.25) |
| Distributions from net realized gain | (.91) | (1.83) | (.05) | (.01) | – | (.31) |
| Total distributions | (1.14)E | (2.07) | (.42) | (.18) | (.02) | (.56) |
| Redemption fees added to paid in capitalA | – | – | –F | –F | –F | –F |
| Net asset value, end of period | $41.43 | $39.71 | $46.35 | $37.34 | $39.51 | $38.43 |
| Total ReturnG,H,I | 7.52% | (10.31)% | 25.57% | (5.07)% | 2.86% | (.60)% |
| Ratios to Average Net AssetsJ,K | | | | | | |
| Expenses before reductions | 1.32%L | 1.46% | 1.53% | 1.58% | 1.57% | 1.51% |
| Expenses net of fee waivers, if any | 1.32%L | 1.46% | 1.52% | 1.58% | 1.57% | 1.51% |
| Expenses net of all reductions | 1.26%L | 1.45% | 1.51% | 1.57% | 1.56% | 1.51% |
| Net investment income (loss) | 1.82%L | .59% | .64% | 1.02%B | .76%C | 1.11%D |
| Supplemental Data | | | | | | |
| Net assets, end of period (in millions) | $27 | $28 | $35 | $35 | $43 | $49 |
| Portfolio turnover rateM | 73%L,N | 45%N | 42% | 50%N | 60%N | 57% |
A Calculated based on average shares outstanding during the period.
B Net investment income per share reflects a large, non-recurring dividend which amounted to $.14 per share. Excluding this non-recurring dividend, the ratio of net investment income (loss) to average net assets would have been .64%.
C Net investment income per share reflects a large, non-recurring dividend which amounted to $.12 per share. Excluding this non-recurring dividend, the ratio of net investment income (loss) to average net assets would have been .45%.
D Net investment income per share reflects a large, non-recurring dividend which amounted to $.21 per share. Excluding this non-recurring dividend, the ratio of net investment income (loss) to average net assets would have been .56%.
E Total distributions of $1.14 per share is comprised of distributions from net investment income of $.222 and distributions from net realized gain of $.913 per share.
F Amount represents less than $.005 per share.
G Total returns for periods of less than one year are not annualized.
H Total returns would have been lower if certain expenses had not been reduced during the applicable periods shown.
I Total returns do not include the effect of the sales charges.
J Fees and expenses of any underlying Fidelity Central Funds are not included in the Fund's expense ratio. The Fund indirectly bears its proportionate share of the expenses of any underlying Fidelity Central Funds.
K Expense ratios reflect operating expenses of the class. Expenses before reductions do not reflect amounts reimbursed by the investment adviser or reductions from brokerage service arrangements or reductions from other expense offset arrangements and do not represent the amount paid by the class during periods when reimbursements or reductions occur. Expenses net of fee waivers reflect expenses after reimbursement by the investment adviser but prior to reductions from brokerage service arrangements or other expense offset arrangements. Expenses net of all reductions represent the net expenses paid by the class.
L Annualized
M Amount does not include the portfolio activity of any underlying Fidelity Central Funds.
N Portfolio turnover rate excludes securities received or delivered in-kind.
See accompanying notes which are an integral part of the financial statements.
Fidelity International Discovery Fund Class C
| | Six months ended (Unaudited) April 30, | Years endedOctober 31, | | | | |
| | 2019 | 2018 | 2017 | 2016 | 2015 | 2014 |
| Selected Per–Share Data | | | | | | |
| Net asset value, beginning of period | $39.32 | $45.94 | $36.96 | $39.14 | $38.25 | $39.07 |
| Income from Investment Operations | | | | | | |
| Net investment income (loss)A | .25 | .02 | .04 | .19B | .10C | .23D |
| Net realized and unrealized gain (loss) | 2.48 | (4.79) | 9.12 | (2.37) | .79 | (.66) |
| Total from investment operations | 2.73 | (4.77) | 9.16 | (2.18) | .89 | (.43) |
| Distributions from net investment income | – | (.02) | (.13) | – | – | (.08) |
| Distributions from net realized gain | (.91) | (1.83) | (.05) | – | – | (.31) |
| Total distributions | (.91) | (1.85) | (.18) | – | – | (.39) |
| Redemption fees added to paid in capitalA | – | – | –E | –E | –E | –E |
| Net asset value, end of period | $41.14 | $39.32 | $45.94 | $36.96 | $39.14 | $38.25 |
| Total ReturnF,G,H | 7.21% | (10.80)% | 24.93% | (5.57)% | 2.33% | (1.10)% |
| Ratios to Average Net AssetsI,J | | | | | | |
| Expenses before reductions | 1.86%K | 2.00% | 2.05% | 2.10% | 2.09% | 2.03% |
| Expenses net of fee waivers, if any | 1.86%K | 2.00% | 2.05% | 2.10% | 2.09% | 2.03% |
| Expenses net of all reductions | 1.80%K | 1.99% | 2.04% | 2.09% | 2.08% | 2.02% |
| Net investment income (loss) | 1.28%K | .05% | .11% | .50%B | .24%C | .60%D |
| Supplemental Data | | | | | | |
| Net assets, end of period (in millions) | $14 | $22 | $28 | $26 | $32 | $35 |
| Portfolio turnover rateL | 73%K,M | 45%M | 42% | 50%M | 60%M | 57% |
A Calculated based on average shares outstanding during the period.
B Net investment income per share reflects a large, non-recurring dividend which amounted to $.14 per share. Excluding this non-recurring dividend, the ratio of net investment income (loss) to average net assets would have been .13%.
C Net investment income per share reflects a large, non-recurring dividend which amounted to $.12 per share. Excluding this non-recurring dividend, the ratio of net investment income (loss) to average net assets would have been (.06) %.
D Net investment income per share reflects a large, non-recurring dividend which amounted to $.21 per share. Excluding this non-recurring dividend, the ratio of net investment income (loss) to average net assets would have been .05%.
E Amount represents less than $.005 per share.
F Total returns for periods of less than one year are not annualized.
G Total returns would have been lower if certain expenses had not been reduced during the applicable periods shown.
H Total returns do not include the effect of the contingent deferred sales charge.
I Fees and expenses of any underlying Fidelity Central Funds are not included in the Fund's expense ratio. The Fund indirectly bears its proportionate share of the expenses of any underlying Fidelity Central Funds.
J Expense ratios reflect operating expenses of the class. Expenses before reductions do not reflect amounts reimbursed by the investment adviser or reductions from brokerage service arrangements or reductions from other expense offset arrangements and do not represent the amount paid by the class during periods when reimbursements or reductions occur. Expenses net of fee waivers reflect expenses after reimbursement by the investment adviser but prior to reductions from brokerage service arrangements or other expense offset arrangements. Expenses net of all reductions represent the net expenses paid by the class.
K Annualized
L Amount does not include the portfolio activity of any underlying Fidelity Central Funds.
M Portfolio turnover rate excludes securities received or delivered in-kind.
See accompanying notes which are an integral part of the financial statements.
Fidelity International Discovery Fund
| | Six months ended (Unaudited) April 30, | Years endedOctober 31, | | | | |
| | 2019 | 2018 | 2017 | 2016 | 2015 | 2014 |
| Selected Per–Share Data | | | | | | |
| Net asset value, beginning of period | $40.32 | $47.04 | $37.91 | $40.12 | $39.03 | $39.82 |
| Income from Investment Operations | | | | | | |
| Net investment income (loss)A | .47 | .53 | .50 | .61B | .54C | .67D |
| Net realized and unrealized gain (loss) | 2.52 | (4.92) | 9.29 | (2.41) | .81 | (.68) |
| Total from investment operations | 2.99 | (4.39) | 9.79 | (1.80) | 1.35 | (.01) |
| Distributions from net investment income | (.49) | (.50) | (.61) | (.41) | (.26) | (.47) |
| Distributions from net realized gain | (.91) | (1.83) | (.05) | (.01) | – | (.31) |
| Total distributions | (1.40) | (2.33) | (.66) | (.41)E | (.26) | (.78) |
| Redemption fees added to paid in capitalA | – | – | –F | –F | –F | –F |
| Net asset value, end of period | $41.91 | $40.32 | $47.04 | $37.91 | $40.12 | $39.03 |
| Total ReturnG,H | 7.84% | (9.81)% | 26.33% | (4.53)% | 3.47% | (.01)% |
| Ratios to Average Net AssetsI,J | | | | | | |
| Expenses before reductions | .73%K | .88% | .94% | 1.00% | .99% | .93% |
| Expenses net of fee waivers, if any | .73%K | .88% | .94% | 1.00% | .99% | .93% |
| Expenses net of all reductions | .67%K | .87% | .92% | .99% | .98% | .93% |
| Net investment income (loss) | 2.41%K | 1.17% | 1.22% | 1.61%B | 1.34%C | 1.69%D |
| Supplemental Data | | | | | | |
| Net assets, end of period (in millions) | $6,606 | $6,515 | $7,351 | $6,421 | $7,209 | $7,464 |
| Portfolio turnover rateL | 73%K,M | 45%M | 42% | 50%M | 60%M | 57% |
A Calculated based on average shares outstanding during the period.
B Net investment income per share reflects a large, non-recurring dividend which amounted to $.14 per share. Excluding this non-recurring dividend, the ratio of net investment income (loss) to average net assets would have been 1.23%.
C Net investment income per share reflects a large, non-recurring dividend which amounted to $.12 per share. Excluding this non-recurring dividend, the ratio of net investment income (loss) to average net assets would have been 1.03%.
D Net investment income per share reflects a large, non-recurring dividend which amounted to $.22 per share. Excluding this non-recurring dividend, the ratio of net investment income (loss) to average net assets would have been 1.15%.
E Total distributions of $.41 per share is comprised of distributions from net investment income of $.409 and distributions from net realized gain of $.005 per share.
F Amount represents less than $.005 per share.
G Total returns for periods of less than one year are not annualized.
H Total returns would have been lower if certain expenses had not been reduced during the applicable periods shown.
I Fees and expenses of any underlying Fidelity Central Funds are not included in the Fund's expense ratio. The Fund indirectly bears its proportionate share of the expenses of any underlying Fidelity Central Funds.
J Expense ratios reflect operating expenses of the class. Expenses before reductions do not reflect amounts reimbursed by the investment adviser or reductions from brokerage service arrangements or reductions from other expense offset arrangements and do not represent the amount paid by the class during periods when reimbursements or reductions occur. Expenses net of fee waivers reflect expenses after reimbursement by the investment adviser but prior to reductions from brokerage service arrangements or other expense offset arrangements. Expenses net of all reductions represent the net expenses paid by the class.
K Annualized
L Amount does not include the portfolio activity of any underlying Fidelity Central Funds.
M Portfolio turnover rate excludes securities received or delivered in-kind.
See accompanying notes which are an integral part of the financial statements.
Fidelity International Discovery Fund Class K
| | Six months ended (Unaudited) April 30, | Years endedOctober 31, | | | | |
| | 2019 | 2018 | 2017 | 2016 | 2015 | 2014 |
| Selected Per–Share Data | | | | | | |
| Net asset value, beginning of period | $40.25 | $46.96 | $37.86 | $40.06 | $38.97 | $39.76 |
| Income from Investment Operations | | | | | | |
| Net investment income (loss)A | .50 | .58 | .55 | .66B | .59C | .72D |
| Net realized and unrealized gain (loss) | 2.50 | (4.90) | 9.26 | (2.39) | .81 | (.67) |
| Total from investment operations | 3.00 | (4.32) | 9.81 | (1.73) | 1.40 | .05 |
| Distributions from net investment income | (.54) | (.55) | (.66) | (.46) | (.31) | (.53) |
| Distributions from net realized gain | (.91) | (1.83) | (.05) | (.01) | – | (.31) |
| Total distributions | (1.45) | (2.39)E | (.71) | (.47) | (.31) | (.84) |
| Redemption fees added to paid in capitalA | – | – | –F | –F | –F | –F |
| Net asset value, end of period | $41.80 | $40.25 | $46.96 | $37.86 | $40.06 | $38.97 |
| Total ReturnG,H | 7.89% | (9.70)% | 26.47% | (4.38)% | 3.61% | .13% |
| Ratios to Average Net AssetsI,J | | | | | | |
| Expenses before reductions | .62%K | .77% | .82% | .86% | .86% | .80% |
| Expenses net of fee waivers, if any | .62%K | .77% | .82% | .86% | .86% | .80% |
| Expenses net of all reductions | .55%K | .76% | .80% | .85% | .85% | .79% |
| Net investment income (loss) | 2.52%K | 1.29% | 1.35% | 1.74%B | 1.47%C | 1.83%D |
| Supplemental Data | | | | | | |
| Net assets, end of period (in millions) | $1,820 | $2,064 | $2,228 | $1,880 | $2,308 | $2,464 |
| Portfolio turnover rateL | 73%K,M | 45%M | 42% | 50%M | 60%M | 57% |
A Calculated based on average shares outstanding during the period.
B Net investment income per share reflects a large, non-recurring dividend which amounted to $.14 per share. Excluding this non-recurring dividend, the ratio of net investment income (loss) to average net assets would have been 1.36%.
C Net investment income per share reflects a large, non-recurring dividend which amounted to $.12 per share. Excluding this non-recurring dividend, the ratio of net investment income (loss) to average net assets would have been 1.16%.
D Net investment income per share reflects a large, non-recurring dividend which amounted to $.22 per share. Excluding this non-recurring dividend, the ratio of net investment income (loss) to average net assets would have been 1.28%.
E Total distributions of $2.39 per share is comprised of distributions from net investment income of $.554 and distributions from net realized gain of $1.832 per share.
F Amount represents less than $.005 per share.
G Total returns for periods of less than one year are not annualized.
H Total returns would have been lower if certain expenses had not been reduced during the applicable periods shown.
I Fees and expenses of any underlying Fidelity Central Funds are not included in the Fund's expense ratio. The Fund indirectly bears its proportionate share of the expenses of any underlying Fidelity Central Funds.
J Expense ratios reflect operating expenses of the class. Expenses before reductions do not reflect amounts reimbursed by the investment adviser or reductions from brokerage service arrangements or reductions from other expense offset arrangements and do not represent the amount paid by the class during periods when reimbursements or reductions occur. Expenses net of fee waivers reflect expenses after reimbursement by the investment adviser but prior to reductions from brokerage service arrangements or other expense offset arrangements. Expenses net of all reductions represent the net expenses paid by the class.
K Annualized
L Amount does not include the portfolio activity of any underlying Fidelity Central Funds.
M Portfolio turnover rate excludes securities received or delivered in-kind.
See accompanying notes which are an integral part of the financial statements.
Fidelity International Discovery Fund Class I
| | Six months ended (Unaudited) April 30, | Years endedOctober 31, | | | | |
| | 2019 | 2018 | 2017 | 2016 | 2015 | 2014 |
| Selected Per–Share Data | | | | | | |
| Net asset value, beginning of period | $40.22 | $46.92 | $37.82 | $40.03 | $38.96 | $39.76 |
| Income from Investment Operations | | | | | | |
| Net investment income (loss)A | .47 | .52 | .49 | .61B | .53C | .67D |
| Net realized and unrealized gain (loss) | 2.50 | (4.90) | 9.27 | (2.40) | .80 | (.68) |
| Total from investment operations | 2.97 | (4.38) | 9.76 | (1.79) | 1.33 | (.01) |
| Distributions from net investment income | (.48) | (.49) | (.61) | (.42) | (.26) | (.48) |
| Distributions from net realized gain | (.91) | (1.83) | (.05) | (.01) | – | (.31) |
| Total distributions | (1.39) | (2.32) | (.66) | (.42)E | (.26) | (.79) |
| Redemption fees added to paid in capitalA | – | – | –F | –F | –F | –F |
| Net asset value, end of period | $41.80 | $40.22 | $46.92 | $37.82 | $40.03 | $38.96 |
| Total ReturnG,H | 7.80% | (9.81)% | 26.29% | (4.52)% | 3.44% | (.01)% |
| Ratios to Average Net AssetsI,J | | | | | | |
| Expenses before reductions | .76%K | .91% | .96% | 1.00% | 1.00% | .93% |
| Expenses net of fee waivers, if any | .76%K | .91% | .96% | 1.00% | .99% | .93% |
| Expenses net of all reductions | .70%K | .90% | .94% | .99% | .98% | .93% |
| Net investment income (loss) | 2.38%K | 1.15% | 1.21% | 1.60%B | 1.33%C | 1.69%D |
| Supplemental Data | | | | | | |
| Net assets, end of period (in millions) | $526 | $579 | $658 | $745 | $1,061 | $650 |
| Portfolio turnover rateL | 73%K,M | 45%M | 42% | 50%M | 60%M | 57% |
A Calculated based on average shares outstanding during the period.
B Net investment income per share reflects a large, non-recurring dividend which amounted to $.14 per share. Excluding this non-recurring dividend, the ratio of net investment income (loss) to average net assets would have been 1.22%.
C Net investment income per share reflects a large, non-recurring dividend which amounted to $.12 per share. Excluding this non-recurring dividend, the ratio of net investment income (loss) to average net assets would have been 1.03%.
D Net investment income per share reflects a large, non-recurring dividend which amounted to $.22 per share. Excluding this non-recurring dividend, the ratio of net investment income (loss) to average net assets would have been 1.14%.
E Total distributions of $.42 per share is comprised of distributions from net investment income of $.418 and distributions from net realized gain of $.005 per share.
F Amount represents less than $.005 per share.
G Total returns for periods of less than one year are not annualized.
H Total returns would have been lower if certain expenses had not been reduced during the applicable periods shown.
I Fees and expenses of any underlying Fidelity Central Funds are not included in the Fund's expense ratio. The Fund indirectly bears its proportionate share of the expenses of any underlying Fidelity Central Funds.
J Expense ratios reflect operating expenses of the class. Expenses before reductions do not reflect amounts reimbursed by the investment adviser or reductions from brokerage service arrangements or reductions from other expense offset arrangements and do not represent the amount paid by the class during periods when reimbursements or reductions occur. Expenses net of fee waivers reflect expenses after reimbursement by the investment adviser but prior to reductions from brokerage service arrangements or other expense offset arrangements. Expenses net of all reductions represent the net expenses paid by the class.
K Annualized
L Amount does not include the portfolio activity of any underlying Fidelity Central Funds.
M Portfolio turnover rate excludes securities received or delivered in-kind.
See accompanying notes which are an integral part of the financial statements.
Fidelity International Discovery Fund Class Z
| | Six months ended (Unaudited) April 30, | Years endedOctober 31, | | | | |
| | 2019 | 2018 | 2017 | 2016 | 2015 | 2014 |
| Selected Per–Share Data | | | | | | |
| Net asset value, beginning of period | $40.22 | $46.92 | $37.84 | $40.03 | $38.96 | $39.77 |
| Income from Investment Operations | | | | | | |
| Net investment income (loss)A | .50 | .58 | .56 | .66B | .59C | .72D |
| Net realized and unrealized gain (loss) | 2.51 | (4.89) | 9.24 | (2.38) | .80 | (.68) |
| Total from investment operations | 3.01 | (4.31) | 9.80 | (1.72) | 1.39 | .04 |
| Distributions from net investment income | (.54) | (.56) | (.67) | (.46) | (.32) | (.54) |
| Distributions from net realized gain | (.91) | (1.83) | (.05) | (.01) | – | (.31) |
| Total distributions | (1.46)E | (2.39) | (.72) | (.47) | (.32) | (.85) |
| Redemption fees added to paid in capitalA | – | – | –F | –F | –F | –F |
| Net asset value, end of period | $41.77 | $40.22 | $46.92 | $37.84 | $40.03 | $38.96 |
| Total ReturnG,H | 7.90% | (9.68)% | 26.44% | (4.36)% | 3.58% | .12% |
| Ratios to Average Net AssetsI,J | | | | | | |
| Expenses before reductions | .62%K | .77% | .82% | .86% | .86% | .80% |
| Expenses net of fee waivers, if any | .62%K | .77% | .82% | .86% | .86% | .80% |
| Expenses net of all reductions | .55%K | .76% | .80% | .85% | .85% | .79% |
| Net investment income (loss) | 2.52%K | 1.29% | 1.35% | 1.74%B | 1.47%C | 1.83%D |
| Supplemental Data | | | | | | |
| Net assets, end of period (in millions) | $88 | $118 | $101 | $38 | $30 | $35 |
| Portfolio turnover rateL | 73%K,M | 45%M | 42% | 50%M | 60%M | 57% |
A Calculated based on average shares outstanding during the period.
B Net investment income per share reflects a large, non-recurring dividend which amounted to $.14 per share. Excluding this non-recurring dividend, the ratio of net investment income (loss) to average net assets would have been 1.36%.
C Net investment income per share reflects a large, non-recurring dividend which amounted to $.12 per share. Excluding this non-recurring dividend, the ratio of net investment income (loss) to average net assets would have been 1.16%.
D Net investment income per share reflects a large, non-recurring dividend which amounted to $.21 per share. Excluding this non-recurring dividend, the ratio of net investment income (loss) to average net assets would have been 1.28%.
E Total distributions of $1.46 per share is comprised of distributions from net investment income of $.542 and distributions from net realized gain of $.913 per share.
F Amount represents less than $.005 per share.
G Total returns for periods of less than one year are not annualized.
H Total returns would have been lower if certain expenses had not been reduced during the applicable periods shown.
I Fees and expenses of any underlying Fidelity Central Funds are not included in the Fund's expense ratio. The Fund indirectly bears its proportionate share of the expenses of any underlying Fidelity Central Funds.
J Expense ratios reflect operating expenses of the class. Expenses before reductions do not reflect amounts reimbursed by the investment adviser or reductions from brokerage service arrangements or reductions from other expense offset arrangements and do not represent the amount paid by the class during periods when reimbursements or reductions occur. Expenses net of fee waivers reflect expenses after reimbursement by the investment adviser but prior to reductions from brokerage service arrangements or other expense offset arrangements. Expenses net of all reductions represent the net expenses paid by the class.
K Annualized
L Amount does not include the portfolio activity of any underlying Fidelity Central Funds.
M Portfolio turnover rate excludes securities received or delivered in-kind.
See accompanying notes which are an integral part of the financial statements.
Notes to Financial Statements (Unaudited)
For the period ended April 30, 2019
(Amounts in thousands except percentages)
1. Organization.
Fidelity International Discovery Fund (the Fund) is a fund of Fidelity Investment Trust (the Trust) and is authorized to issue an unlimited number of shares. The Trust is registered under the Investment Company Act of 1940, as amended (the 1940 Act), as an open-end management investment company organized as a Massachusetts business trust. The Fund offers Class A, Class M, Class C, International Discovery, Class K, Class I and Class Z shares, each of which has equal rights as to assets and voting privileges. Each class has exclusive voting rights with respect to matters that affect that class. Effective March 1, 2019, Class C shares will automatically convert to Class A shares after a holding period of ten years from the initial date of purchase, with certain exceptions.
2. Investments in Fidelity Central Funds.
The Fund invests in Fidelity Central Funds, which are open-end investment companies generally available only to other investment companies and accounts managed by the investment adviser and its affiliates. The Fund's Schedule of Investments lists each of the Fidelity Central Funds held as of period end, if any, as an investment of the Fund, but does not include the underlying holdings of each Fidelity Central Fund. As an Investing Fund, the Fund indirectly bears its proportionate share of the expenses of the underlying Fidelity Central Funds.
The Money Market Central Funds seek preservation of capital and current income and are managed by Fidelity Investments Money Management, Inc. (FIMM), an affiliate of the investment adviser. Annualized expenses of the Money Market Central Funds as of their most recent shareholder report date are less than .005%.
A complete unaudited list of holdings for each Fidelity Central Fund is available upon request or at the Securities and Exchange Commission (the SEC) website at www.sec.gov. In addition, the financial statements of the Fidelity Central Funds are available on the SEC website or upon request.
3. Significant Accounting Policies.
The Fund is an investment company and applies the accounting and reporting guidance of the Financial Accounting Standards Board (FASB) Accounting Standards Codification Topic 946 Financial Services – Investments Companies. The financial statements have been prepared in conformity with accounting principles generally accepted in the United States of America (GAAP), which require management to make certain estimates and assumptions at the date of the financial statements. Actual results could differ from those estimates. Subsequent events, if any, through the date that the financial statements were issued have been evaluated in the preparation of the financial statements. The following summarizes the significant accounting policies of the Fund:
Investment Valuation. Investments are valued as of 4:00 p.m. Eastern time on the last calendar day of the period. The Board of Trustees (the Board) has delegated the day to day responsibility for the valuation of the Fund's investments to the Fair Value Committee (the Committee) established by the Fund's investment adviser. In accordance with valuation policies and procedures approved by the Board, the Fund attempts to obtain prices from one or more third party pricing vendors or brokers to value its investments. When current market prices, quotations or currency exchange rates are not readily available or reliable, investments will be fair valued in good faith by the Committee, in accordance with procedures adopted by the Board. Factors used in determining fair value vary by investment type and may include market or investment specific events, changes in interest rates and credit quality. The frequency with which these procedures are used cannot be predicted and they may be utilized to a significant extent. The Committee oversees the Fund's valuation policies and procedures and reports to the Board on the Committee's activities and fair value determinations. The Board monitors the appropriateness of the procedures used in valuing the Fund's investments and ratifies the fair value determinations of the Committee.
The Fund categorizes the inputs to valuation techniques used to value its investments into a disclosure hierarchy consisting of three levels as shown below:
- Level 1 – quoted prices in active markets for identical investments
- Level 2 – other significant observable inputs (including quoted prices for similar investments, interest rates, prepayment speeds, etc.)
- Level 3 – unobservable inputs (including the Fund's own assumptions based on the best information available)
Valuation techniques used to value the Fund's investments by major category are as follows:
Equity securities, including restricted securities, for which market quotations are readily available, are valued at the last reported sale price or official closing price as reported by a third party pricing vendor on the primary market or exchange on which they are traded and are categorized as Level 1 in the hierarchy. In the event there were no sales during the day or closing prices are not available, securities are valued at the last quoted bid price or may be valued using the last available price and are generally categorized as Level 2 in the hierarchy. For foreign equity securities, when market or security specific events arise, comparisons to the valuation of American Depositary Receipts (ADRs), futures contracts, Exchange-Traded Funds (ETFs) and certain indexes as well as quoted prices for similar securities may be used and would be categorized as Level 2 in the hierarchy. For equity securities, including restricted securities, where observable inputs are limited, assumptions about market activity and risk are used and these securities may be categorized as Level 3 in the hierarchy.
Debt securities, including restricted securities, are valued based on evaluated prices received from third party pricing vendors or from brokers who make markets in such securities. U.S. government and government agency obligations are valued by pricing vendors who utilize matrix pricing which considers yield or price of bonds of comparable quality, coupon, maturity and type or by broker-supplied prices. When independent prices are unavailable or unreliable, debt securities may be valued utilizing pricing methodologies which consider similar factors that would be used by third party pricing vendors. Debt securities are generally categorized as Level 2 in the hierarchy but may be Level 3 depending on the circumstances. Exchange-Traded Funds (ETFs) are valued at their last sale price or official closing price as reported by a third party pricing vendor on the primary market or exchange on which they are traded and are categorized as Level 1 in the hierarchy. In the event there were no sales during the day but the exchange reports a closing bid level, ETFs are valued at the closing bid and would be categorized as Level 1 in the hierarchy. In the event there was no closing bid, ETFs may be valued by another method that the Board believes reflects fair value in accordance with the Board's fair value pricing policies and may be categorized as Level 2 in the hierarchy.
Investments in open-end mutual funds, including the Fidelity Central Funds, are valued at their closing net asset value (NAV) each business day and are categorized as Level 1 in the hierarchy.
Changes in valuation techniques may result in transfers in or out of an assigned level within the disclosure hierarchy. The aggregate value of investments by input level as of April 30, 2019 is included at the end of the Fund's Schedule of Investments.
Foreign Currency. The Fund may use foreign currency contracts to facilitate transactions in foreign-denominated securities. Gains and losses from these transactions may arise from changes in the value of the foreign currency or if the counterparties do not perform under the contracts' terms.
Foreign-denominated assets, including investment securities, and liabilities are translated into U.S. dollars at the exchange rates at period end. Purchases and sales of investment securities, income and dividends received and expenses denominated in foreign currencies are translated into U.S. dollars at the exchange rate in effect on the transaction date.
The effects of exchange rate fluctuations on investments are included with the net realized and unrealized gain (loss) on investment securities. Other foreign currency transactions resulting in realized and unrealized gain (loss) are disclosed separately.
Investment Transactions and Income. For financial reporting purposes, the Fund's investment holdings and NAV include trades executed through the end of the last business day of the period. The NAV per share for processing shareholder transactions is calculated as of the close of business of the New York Stock Exchange (NYSE), normally 4:00 p.m. Eastern time and includes trades executed through the end of the prior business day. Gains and losses on securities sold are determined on the basis of identified cost and include proceeds received from litigation. Dividend income is recorded on the ex-dividend date, except for certain dividends from foreign securities where the ex-dividend date may have passed, which are recorded as soon as the Fund is informed of the ex-dividend date. Non-cash dividends included in dividend income, if any, are recorded at the fair market value of the securities received. Income and capital gain distributions from Fidelity Central Funds, if any, are recorded on the ex-dividend date. Certain distributions received by the Fund represent a return of capital or capital gain. The Fund determines the components of these distributions subsequent to the ex-dividend date, based upon receipt of tax filings or other correspondence relating to the underlying investment. These distributions are recorded as a reduction of cost of investments and/or as a realized gain. Interest income is accrued as earned and includes coupon interest and amortization of premium and accretion of discount on debt securities as applicable. Investment income is recorded net of foreign taxes withheld where recovery of such taxes is uncertain.
Class Allocations and Expenses. Investment income, realized and unrealized capital gains and losses, common expenses of the Fund, and certain fund-level expense reductions, if any, are allocated daily on a pro-rata basis to each class based on the relative net assets of each class to the total net assets of the Fund. Each class differs with respect to transfer agent and distribution and service plan fees incurred. Certain expense reductions may also differ by class. For the reporting period, the allocated portion of income and expenses to each class as a percent of its average net assets may vary due to the timing of recording these transactions in relation to fluctuating net assets of the classes. Expenses directly attributable to a fund are charged to that fund. Expenses attributable to more than one fund are allocated among the respective funds on the basis of relative net assets or other appropriate methods. Expense estimates are accrued in the period to which they relate and adjustments are made when actual amounts are known.
Deferred Trustee Compensation. Under a Deferred Compensation Plan (the Plan) for the Fund, certain independent Trustees have elected to defer receipt of a portion of their annual compensation. Deferred amounts are invested in a cross-section of Fidelity funds, are marked-to-market and remain in the Fund until distributed in accordance with the Plan. The investment of deferred amounts and the offsetting payable to the Trustees of $436 are included in the accompanying Statement of Assets and Liabilities in other receivables and other payables and accrued expenses, respectively.
Income Tax Information and Distributions to Shareholders. Each year, the Fund intends to qualify as a regulated investment company under Subchapter M of the Internal Revenue Code, including distributing substantially all of its taxable income and realized gains. As a result, no provision for U.S. Federal income taxes is required. The Fund files a U.S. federal tax return, in addition to state and local tax returns as required. The Fund's federal income tax returns are subject to examination by the Internal Revenue Service (IRS) for a period of three fiscal years after they are filed. State and local tax returns may be subject to examination for an additional fiscal year depending on the jurisdiction. Foreign taxes are provided for based on the Fund's understanding of the tax rules and rates that exist in the foreign markets in which it invests.
Distributions are declared and recorded on the ex-dividend date. Income and capital gain distributions are declared separately for each class. Income and capital gain distributions are determined in accordance with income tax regulations, which may differ from GAAP.
Capital accounts within the financial statements are adjusted for permanent book-tax differences. These adjustments have no impact on net assets or the results of operations. Capital accounts are not adjusted for temporary book-tax differences which will reverse in a subsequent period.
Book-tax differences are primarily due to foreign currency transactions, passive foreign investment companies (PFIC), market discount, redemptions in kind, deferred trustees compensation and losses deferred due to wash sales.
As of period end, the cost and unrealized appreciation (depreciation) in securities, and derivatives if applicable, for federal income tax purposes were as follows:
| Gross unrealized appreciation | $1,800,267 |
| Gross unrealized depreciation | (196,371) |
| Net unrealized appreciation (depreciation) | $1,603,896 |
| Tax Cost | $7,705,741 |
Delayed Delivery Transactions and When-Issued Securities. During the period, the Fund transacted in securities on a delayed delivery or when-issued basis. Payment and delivery may take place after the customary settlement period for that security. The price of the underlying securities and the date when the securities will be delivered and paid for are fixed at the time the transaction is negotiated. The securities purchased on a delayed delivery or when-issued basis are identified as such in the Fund's Schedule of Investments. Losses may arise due to changes in the value of the underlying securities or if the counterparty does not perform under the contract's terms, or if the issuer does not issue the securities due to political, economic, or other factors.
Restricted Securities. The Fund may invest in securities that are subject to legal or contractual restrictions on resale. These securities generally may be resold in transactions exempt from registration or to the public if the securities are registered. Disposal of these securities may involve time-consuming negotiations and expense, and prompt sale at an acceptable price may be difficult. Information regarding restricted securities is included at the end of the Fund's Schedule of Investments.
4. Derivative Instruments.
Risk Exposures and the Use of Derivative Instruments. The Fund's investment objective allows the Fund to enter into various types of derivative contracts, including futures contracts. Derivatives are investments whose value is primarily derived from underlying assets, indices or reference rates and may be transacted on an exchange or over-the-counter (OTC). Derivatives may involve a future commitment to buy or sell a specified asset based on specified terms, to exchange future cash flows at periodic intervals based on a notional principal amount, or for one party to make one or more payments upon the occurrence of specified events in exchange for periodic payments from the other party.
The Fund used derivatives to increase returns and to manage exposure to certain risks as defined below. The success of any strategy involving derivatives depends on analysis of numerous economic factors, and if the strategies for investment do not work as intended, the Fund may not achieve its objectives.
The Fund's use of derivatives increased or decreased its exposure to the following risk:
| Equity Risk | Equity risk relates to the fluctuations in the value of financial instruments as a result of changes in market prices (other than those arising from interest rate risk or foreign exchange risk), whether caused by factors specific to an individual investment, its issuer, or all factors affecting all instruments traded in a market or market segment.
|
The Fund is also exposed to additional risks from investing in derivatives, such as liquidity risk and counterparty credit risk. Liquidity risk is the risk that the Fund will be unable to close out the derivative in the open market in a timely manner. Counterparty credit risk is the risk that the counterparty will not be able to fulfill its obligation to the Fund. Counterparty credit risk related to exchange-traded futures contracts may be mitigated by the protection provided by the exchange on which they trade.
Investing in derivatives may involve greater risks than investing in the underlying assets directly and, to varying degrees, may involve risk of loss in excess of any initial investment and collateral received and amounts recognized in the Statement of Assets and Liabilities. In addition, there may be the risk that the change in value of the derivative contract does not correspond to the change in value of the underlying instrument.
Futures Contracts. A futures contract is an agreement between two parties to buy or sell a specified underlying instrument for a fixed price at a specified future date. The Fund used futures contracts to manage its exposure to the stock market.
Upon entering into a futures contract, a fund is required to deposit either cash or securities (initial margin) with a clearing broker in an amount equal to a certain percentage of the face value of the contract. Futures contracts are marked-to-market daily and subsequent daily payments (variation margin) are made or received by a fund depending on the daily fluctuations in the value of the futures contracts and are recorded as unrealized appreciation or (depreciation). This receivable and/or payable, if any, is included in daily variation margin on futures contracts in the Statement of Assets and Liabilities. Realized gain or (loss) is recorded upon the expiration or closing of a futures contract. The net realized gain (loss) and change in net unrealized appreciation (depreciation) on futures contracts during the period is presented in the Statement of Operations.
Any open futures contracts at period end are presented in the Schedule of Investments under the caption "Futures Contracts". The notional amount at value reflects each contract's exposure to the underlying instrument or index at period end. Securities deposited to meet initial margin requirements are identified in the Schedule of Investments.
5. Purchases and Sales of Investments.
Purchases and sales of securities, other than short-term securities and in-kind transactions, aggregated $3,387,042 and $3,122,900, respectively.
Unaffiliated Redemptions In-Kind. During the period, 181 shares of the Fund were redeemed in-kind for investments and cash with a value of $7,175. The net realized gain of $1,669 on investments delivered through in-kind redemptions is included in the accompanying Statement of Operations. The amount of the in-kind redemptions is included in share transactions in the accompanying Statement of Changes in Net Assets as well as the Notes to Financial Statements. The Fund recognized no gain or loss for federal income tax purposes.
Prior Fiscal Year Redemptions In-Kind. During the prior period, 2,145 shares of the Fund held by unaffiliated entities were redeemed in-kind for investments and cash with a value of $96,039. The Fund had a net realized gain of $24,574 on investments delivered through the in-kind redemptions. The amount of the redemptions is included in share transactions activity shown in the accompanying Statement of Changes in Net Assets as well as the Notes to Financial Statements. The Fund recognized no gain or loss for federal income tax purposes.
6. Fees and Other Transactions with Affiliates.
Management Fee. Fidelity Management & Research Company (the investment adviser) and its affiliates provide the Fund with investment management related services for which the Fund pays a monthly management fee. The management fee is the sum of an individual fund fee rate that is based on an annual rate of .424% of the Fund's average net assets and an annualized group fee rate that averaged .24% during the period. The group fee rate is based upon the average net assets of all the mutual funds advised by the investment adviser, including any mutual funds previously advised by the investment adviser that are currently advised by Fidelity SelectCo, LLC, an affiliate of the investment adviser. The group fee rate decreases as assets under management increase and increases as assets under management decrease. In addition, the management fee is subject to a performance adjustment (up to a maximum of +/- .20% of the Fund's average net assets over a 36 month performance period). The upward or downward adjustment to the management fee is based on the relative investment performance of International Discovery as compared to its benchmark index, the MSCI EAFE Index, over the same 36 month performance period. For the reporting period, the total annualized management fee rate, including the performance adjustment, was .54% of the Fund's average net assets. The performance adjustment included in the management fee rate may be higher or lower than the maximum performance adjustment rate due to the difference between the average net assets for the reporting and performance periods.
Distribution and Service Plan Fees. In accordance with Rule 12b-1 of the 1940 Act, the Fund has adopted separate Distribution and Service Plans for each class of shares. Certain classes pay Fidelity Distributors Corporation (FDC), an affiliate of the investment adviser, separate Distribution and Service Fees, each of which is based on an annual percentage of each class' average net assets. In addition, FDC may pay financial intermediaries for selling shares of the Fund and providing shareholder support services. For the period, the Distribution and Service Fee rates, total fees and amounts retained by FDC were as follows:
| | Distribution Fee | Service Fee | Total Fees | Retained by FDC |
| Class A | -% | .25% | $231 | $3 |
| Class M | .25% | .25% | 66 | 1 |
| Class C | .75% | .25% | 95 | 8 |
| | | | $392 | $12 |
Sales Load. FDC may receive a front-end sales charge of up to 5.75% for selling Class A shares and 3.50% for selling Class M shares, some of which is paid to financial intermediaries for selling shares of the Fund. Depending on the holding period, FDC may receive contingent deferred sales charges levied on Class A, Class M and Class C redemptions. The deferred sales charges are 1.00% for Class C shares, 1.00% for certain purchases of Class A shares and .25% for certain purchases of Class M shares.
For the period, sales charge amounts retained by FDC were as follows:
| | Retained by FDC |
| Class A | $10 |
| Class M | 1 |
| Class C(a) | 1 |
| | $12 |
(a) When Class C shares are initially sold, FDC pays commissions from its own resources to financial intermediaries through which the sales are made.
Transfer Agent Fees. Fidelity Investments Institutional Operations Company, Inc., (FIIOC), an affiliate of the investment adviser, is the transfer, dividend disbursing and shareholder servicing agent for each class of the Fund. FIIOC receives account fees and asset-based fees that vary according to the account size and type of account of the shareholders of the respective classes of the Fund, except for Class K and Class Z. FIIOC receives an asset-based fee of Class K's and Class Z's average net assets. FIIOC pays for typesetting, printing and mailing of shareholder reports, except proxy statements.
For the period, transfer agent fees for each class were as follows:
| | Amount | % of Class-Level Average Net Assets(a) |
| Class A | $240 | .26 |
| Class M | 33 | .25 |
| Class C | 27 | .29 |
| International Discovery | 5,114 | .16 |
| Class K | 441 | .05 |
| Class I | 508 | .19 |
| Class Z | 26 | .05 |
| | $6,389 | |
(a) Annualized
Accounting and Security Lending Fees. Fidelity Service Company, Inc. (FSC), an affiliate of the investment adviser, maintains the Fund's accounting records. The accounting fee is based on the level of average net assets for each month. Prior to April 1, 2019, FSC had a separate agreement with the Fund for administration of the security lending program, based on the number and duration of lending transactions. For the period, the total fees paid for accounting and administration of securities lending were equivalent to an annualized rate of .02%.
Brokerage Commissions. The Fund placed a portion of its portfolio transactions with brokerage firms which are affiliates of the investment adviser. Brokerage commissions are included in net realized gain (loss) and change in net unrealized appreciation (depreciation) in the Statement of Operations. The commissions paid to these affiliated firms were $5 for the period.
Interfund Lending Program. Pursuant to an Exemptive Order issued by the SEC, the Fund, along with other registered investment companies having management contracts with Fidelity Management & Research Company (FMR) or other affiliated entities of FMR, may participate in an interfund lending program. This program provides an alternative credit facility allowing the funds to borrow from, or lend money to, other participating affiliated funds. At period end, there were no interfund loans outstanding. The Fund's activity in this program during the period for which loans were outstanding was as follows:
| Borrower or Lender | Average Loan Balance | Weighted Average Interest Rate | Interest Expense |
| Borrower | $26,050 | 2.67% | $17 |
Interfund Trades. The Fund may purchase from or sell securities to other Fidelity Funds under procedures adopted by the Board. The procedures have been designed to ensure these interfund trades are executed in accordance with Rule 17a-7 of the 1940 Act. Interfund trades are included within the respective purchases and sales amounts shown in the Purchases and Sales of Investments note.
7. Committed Line of Credit.
The Fund participates with other funds managed by the investment adviser or an affiliate in a $4.25 billion credit facility (the "line of credit") to be utilized for temporary or emergency purposes to fund shareholder redemptions or for other short-term liquidity purposes. The Fund has agreed to pay commitment fees on its pro-rata portion of the line of credit, which amounted to $13 and is reflected in Miscellaneous expenses on the Statement of Operations. During the period, the Fund did not borrow on this line of credit.
8. Security Lending.
The Fund lends portfolio securities through a lending agent from time to time in order to earn additional income. For equity securities, a lending agent is used and may loan securities to certain qualified borrowers, including Fidelity Capital Markets (FCM), a broker-dealer affiliated with the Fund. On the settlement date of the loan, the Fund receives collateral (in the form of U.S. Treasury obligations, letters of credit and/or cash) against the loaned securities and maintains collateral in an amount not less than 100% of the market value of the loaned securities during the period of the loan. The market value of the loaned securities is determined at the close of business of the Fund and any additional required collateral is delivered to the Fund on the next business day. The Fund or borrower may terminate the loan at any time, and if the borrower defaults on its obligation to return the securities loaned because of insolvency or other reasons, the Fund may apply collateral received from the borrower against the obligation. The Fund may experience delays and costs in recovering the securities loaned. Any cash collateral received is invested in the Fidelity Securities Lending Cash Central Fund. The value of loaned securities and cash collateral at period end are disclosed on the Fund's Statement of Assets and Liabilities. At period end, there were no security loans outstanding with FCM. Security lending income represents the income earned on investing cash collateral, less rebates paid to borrowers and any lending agent fees associated with the loan, plus any premium payments received for lending certain types of securities. Security lending income is presented in the Statement of Operations as a component of income from Fidelity Central Funds. Total security lending income during the period amounted to $1,657, including less than five hundred dollars from securities loaned to FCM.
9. Expense Reductions.
Commissions paid to certain brokers with whom the investment adviser, or its affiliates, places trades on behalf of the Fund include an amount in addition to trade execution, which may be rebated back to the Fund to offset certain expenses. This amount totaled $2,961 for the period.
In addition, during the period the investment adviser reimbursed and/or waived a portion of fund-level operating expenses in the amount of $35.
10. Distributions to Shareholders.
Distributions to shareholders of each class were as follows:
| | Six months ended
April 30, 2019 | Year ended
October 31, 2018 |
| Distributions to shareholders | | |
| Class A | $5,794 | $11,257 |
| Class M | 790 | 1,557 |
| Class C | 484 | 1,132 |
| International Discovery | 224,705 | 368,791 |
| Class K | 72,802 | 115,669 |
| Class I | 19,866 | 32,390 |
| Class Z | 4,169 | 5,145 |
| Total | $328,610 | $535,941 |
11. Share Transactions.
Share transactions for each class were as follows and may contain automatic conversions between classes or exchanges between affiliated funds:
| | Shares | Shares | Dollars | Dollars |
| | Six months ended April 30, 2019 | Year ended October 31, 2018 | Six months ended April 30, 2019 | Year ended October 31, 2018 |
| Class A | | | | |
| Shares sold | 350 | 601 | $13,878 | $27,288 |
| Reinvestment of distributions | 154 | 252 | 5,740 | 11,177 |
| Shares redeemed | (576) | (1,390) | (22,580) | (62,507) |
| Net increase (decrease) | (72) | (537) | $(2,962) | $(24,042) |
| Class M | | | | |
| Shares sold | 31 | 91 | $1,177 | $4,077 |
| Reinvestment of distributions | 21 | 35 | 785 | 1,549 |
| Shares redeemed | (108) | (177) | (4,141) | (7,916) |
| Net increase (decrease) | (56) | (51) | $(2,179) | $(2,290) |
| Class C | | | | |
| Shares sold | 16 | 57 | $612 | $2,552 |
| Reinvestment of distributions | 13 | 25 | 478 | 1,083 |
| Shares redeemed | (241) | (152) | (9,498) | (6,753) |
| Net increase (decrease) | (212) | (70) | $(8,408) | $(3,118) |
| International Discovery | | | | |
| Shares sold | 7,413 | 18,511 | $291,151 | $834,070 |
| Reinvestment of distributions | 4,741 | 7,869 | 177,779 | 351,491 |
| Shares redeemed | (16,102) | (21,100) | (634,874) | (952,137) |
| Net increase (decrease) | (3,948) | 5,280 | $(165,944) | $233,424 |
| Class K | | | | |
| Shares sold | 4,402 | 15,085 | $170,392 | $683,626 |
| Reinvestment of distributions | 1,948 | 2,597 | 72,802 | 115,669 |
| Shares redeemed | (14,091)(a) | (13,867)(b) | (556,056)(a) | (624,849)(b) |
| Net increase (decrease) | (7,741) | 3,815 | $(312,862) | $174,446 |
| Class I | | | | |
| Shares sold | 2,415 | 3,244 | $92,808 | $143,374 |
| Reinvestment of distributions | 164 | 224 | 6,118 | 9,992 |
| Shares redeemed | (4,391) | (3,099) | (169,674) | (138,824) |
| Net increase (decrease) | (1,812) | 369 | $(70,748) | $14,542 |
| Class Z | | | | |
| Shares sold | 540 | 1,231 | $20,296 | $55,218 |
| Reinvestment of distributions | 60 | 67 | 2,239 | 2,993 |
| Shares redeemed | (1,436) | (517) | (57,140) | (23,246) |
| Net increase (decrease) | (836) | 781 | $(34,605) | $34,965 |
(a) Amount includes in-kind redemptions (see the Unaffiliated Redemptions In-Kind note for additional details).
(b) Amount includes in-kind redemptions (see the Prior Fiscal Year Redemptions In-Kind note for additional details).
12. Other.
The Fund's organizational documents provide former and current trustees and officers with a limited indemnification against liabilities arising in connection with the performance of their duties to the Fund. In the normal course of business, the Fund may also enter into contracts that provide general indemnifications. The Fund's maximum exposure under these arrangements is unknown as this would be dependent on future claims that may be made against the Fund. The risk of material loss from such claims is considered remote.
At the end of the period, Strategic Advisers International Fund and Strategic Advisers Fidelity International Fund were the owners of record of approximately 11% and 11%, respectively, of the total outstanding shares of the Fund. Mutual funds managed by the investment adviser or its affiliates were the owners of record, in the aggregate, of approximately 24% of the total outstanding shares of the Fund.
Shareholder Expense Example
As a shareholder of the Fund, you incur two types of costs: (1) transaction costs, including sales charges (loads) on purchase payments or redemption proceeds, and (2) ongoing costs, including management fees, distribution and/or service (12b-1) fees and other Fund expenses. This Example is intended to help you understand your ongoing costs (in dollars) of investing in the Fund and to compare these costs with the ongoing costs of investing in other mutual funds.
The Example is based on an investment of $1,000 invested at the beginning of the period and held for the entire period (November 1, 2018 to April 30, 2019).
Actual Expenses
The first line of the accompanying table for each class of the Fund provides information about actual account values and actual expenses. You may use the information in this line, together with the amount you invested, to estimate the expenses that you paid over the period. Simply divide your account value by $1,000.00 (for example, an $8,600 account value divided by $1,000.00 = 8.6), then multiply the result by the number in the first line for a class of the Fund under the heading entitled "Expenses Paid During Period" to estimate the expenses you paid on your account during this period. In addition, the Fund, as a shareholder in the underlying Fidelity Central Funds, will indirectly bear its pro-rata share of the fees and expenses incurred by the underlying Fidelity Central Funds. These fees and expenses are not included in the Fund's annualized expense ratio used to calculate the expense estimate in the table below.
Hypothetical Example for Comparison Purposes
The second line of the accompanying table for each class of the Fund provides information about hypothetical account values and hypothetical expenses based on a Class' actual expense ratio and an assumed rate of return of 5% per year before expenses, which is not the Class' actual return. The hypothetical account values and expenses may not be used to estimate the actual ending account balance or expenses you paid for the period. You may use this information to compare the ongoing costs of investing in the Fund and other funds. To do so, compare this 5% hypothetical example with the 5% hypothetical examples that appear in the shareholder reports of the other funds. In addition, the Fund, as a shareholder in the underlying Fidelity Central Funds, will indirectly bear its pro-rata share of the fees and expenses incurred by the underlying Fidelity Central Funds. These fees and expenses are not included in the Fund's annualized expense ratio used to calculate the expense estimate in the table below.
Please note that the expenses shown in the table are meant to highlight your ongoing costs only and do not reflect any transaction costs. Therefore, the second line of the table is useful in comparing ongoing costs only, and will not help you determine the relative total costs of owning different funds. In addition, if these transactional costs were included, your costs would have been higher.
| | Annualized Expense Ratio-A | Beginning
Account Value
November 1, 2018 | Ending
Account Value
April 30, 2019 | Expenses Paid
During Period-B
November 1, 2018
to April 30, 2019 |
| Class A | 1.08% | | | |
| Actual | | $1,000.00 | $1,076.40 | $5.56 |
| Hypothetical-C | | $1,000.00 | $1,019.44 | $5.41 |
| Class M | 1.32% | | | |
| Actual | | $1,000.00 | $1,075.20 | $6.79 |
| Hypothetical-C | | $1,000.00 | $1,018.25 | $6.61 |
| Class C | 1.86% | | | |
| Actual | | $1,000.00 | $1,072.10 | $9.56 |
| Hypothetical-C | | $1,000.00 | $1,015.57 | $9.30 |
| International Discovery | .73% | | | |
| Actual | | $1,000.00 | $1,078.40 | $3.76 |
| Hypothetical-C | | $1,000.00 | $1,021.17 | $3.66 |
| Class K | .62% | | | |
| Actual | | $1,000.00 | $1,078.90 | $3.20 |
| Hypothetical-C | | $1,000.00 | $1,021.72 | $3.11 |
| Class I | .76% | | | |
| Actual | | $1,000.00 | $1,078.00 | $3.92 |
| Hypothetical-C | | $1,000.00 | $1,021.03 | $3.81 |
| Class Z | .62% | | | |
| Actual | | $1,000.00 | $1,079.00 | $3.20 |
| Hypothetical-C | | $1,000.00 | $1,021.72 | $3.11 |
A Annualized expense ratio reflects expenses net of applicable fee waivers.
B Expenses are equal to each Class' annualized expense ratio, multiplied by the average account value over the period, multiplied by 181/365 (to reflect the one-half year period).
C 5% return per year before expenses
Board Approval of Investment Advisory Contracts and Management Fees
Fidelity International Discovery Fund
Each year, the Board of Trustees, including the Independent Trustees (together, the Board), votes on the renewal of the management contract with Fidelity Management & Research Company (FMR) and the sub-advisory agreements (together, the Advisory Contracts) for the fund. FMR and the sub-advisers are referred to herein as the Investment Advisers. The Board, assisted by the advice of fund counsel and Independent Trustees' counsel, requests and considers a broad range of information relevant to the renewal of the Advisory Contracts throughout the year.
The Board meets regularly and, at each of its meetings, covers an extensive agenda of topics and materials and considers factors that are relevant to its annual consideration of the renewal of the fund's Advisory Contracts, including the services and support provided to the fund and its shareholders. The Board has established various standing committees (Committees), each composed of and chaired by Independent Trustees with varying backgrounds, to which the Board has assigned specific subject matter responsibilities in order to enhance effective decision-making by the Board. The Board, acting directly and through its Committees, requests and receives information concerning the annual consideration of the renewal of the fund's Advisory Contracts. The Board also meets as needed to review matters specifically related to the Board's annual consideration of the renewal of the Advisory Contracts. Members of the Board may also meet with trustees of other Fidelity funds through joint ad hoc committees to discuss certain matters relevant to all of the Fidelity funds.
At its January 2019 meeting, the Board unanimously determined to renew the fund's Advisory Contracts. In reaching its determination, the Board considered all factors it believed relevant, including (i) the nature, extent, and quality of the services to be provided to the fund and its shareholders (including the investment performance of the fund); (ii) the competitiveness of the fund's management fee and total expense ratio relative to peer funds; (iii) the total costs of the services to be provided by and the profits to be realized by Fidelity from its relationships with the fund; and (iv) the extent to which, if any, economies of scale exist and would be realized as the fund grows, and whether any economies of scale are appropriately shared with fund shareholders.
In considering whether to renew the Advisory Contracts for the fund, the Board reached a determination, with the assistance of fund counsel and Independent Trustees' counsel and through the exercise of its business judgment, that the renewal of the Advisory Contracts was in the best interests of the fund and its shareholders and that the compensation payable under the Advisory Contracts was fair and reasonable. The Board's decision to renew the Advisory Contracts was not based on any single factor, but rather was based on a comprehensive consideration of all the information provided to the Board at its meetings throughout the year. The Board, in reaching its determination to renew the Advisory Contracts, was aware that shareholders of the fund have a broad range of investment choices available to them, including a wide choice among funds offered by Fidelity's competitors, and that the fund's shareholders, who have the opportunity to review and weigh the disclosure provided by the fund in its prospectus and other public disclosures, have chosen to invest in this fund, which is part of the Fidelity family of funds.
Nature, Extent, and Quality of Services Provided. The Board considered Fidelity's staffing as it relates to the fund, including the backgrounds of investment personnel of Fidelity, and also considered the fund's investment objective, strategies, and related investment philosophy. The Independent Trustees also had discussions with senior management of Fidelity's investment operations and investment groups. The Board considered the structure of the investment personnel compensation program and whether this structure provides appropriate incentives to act in the best interests of the fund. Additionally, the Board considered the portfolio managers' investments, if any, in the funds that they manage.
Resources Dedicated to Investment Management and Support Services. The Board and the Fund Oversight and Research Committees reviewed the general qualifications and capabilities of Fidelity's investment staff, including its size, education, experience, and resources, as well as Fidelity's approach to recruiting, training, managing, and compensating investment personnel. The Board noted that Fidelity has continued to increase the resources devoted to non-U.S. offices, including expansion of Fidelity's global investment organization. The Board also noted that Fidelity's analysts have extensive resources, tools and capabilities that allow them to conduct sophisticated quantitative and fundamental analysis, as well as credit analysis of issuers, counterparties and guarantors. Further, the Board considered that Fidelity's investment professionals have sufficient access to global information and data so as to provide competitive investment results over time, and that those professionals also have access to sophisticated tools that permit them to assess portfolio construction and risk and performance attribution characteristics continuously, as well as to transmit new information and research conclusions rapidly around the world. Additionally, in its deliberations, the Board considered Fidelity's trading, risk management, compliance, and technology and operations capabilities and resources, which are integral parts of the investment management process.
Shareholder and Administrative Services. The Board considered (i) the nature, extent, quality, and cost of advisory, administrative, and shareholder services performed by the Investment Advisers and their affiliates under the Advisory Contracts and under separate agreements covering transfer agency, pricing and bookkeeping, and securities lending services for the fund; (ii) the nature and extent of the supervision of third party service providers, principally custodians, subcustodians, and pricing vendors; and (iii) the resources devoted to, and the record of compliance with, the fund's compliance policies and procedures. The Board also reviewed the allocation of fund brokerage, including allocations to brokers affiliated with the Investment Advisers, the use of brokerage commissions to pay fund expenses, and the use of "soft" commission dollars to pay for research services.
The Board noted that the growth of fund assets over time across the complex allows Fidelity to reinvest in the development of services designed to enhance the value and convenience of the Fidelity funds as investment vehicles. These services include 24-hour access to account information and market information through telephone representatives and over the Internet, investor education materials and asset allocation tools, and the expanded availability of Fidelity Investor Centers.
The Board noted that it and the boards of certain other Fidelity funds had formed an ad hoc Committee on Transfer Agency Fees to review the variety of transfer agency fee structures throughout the industry and Fidelity's competitive positioning with respect to industry participants.
Investment in a Large Fund Family. The Board considered the benefits to shareholders of investing in a Fidelity fund, including the benefits of investing in a fund that is part of a large family of funds offering a variety of investment disciplines and providing a large variety of mutual fund investor services. The Board noted that Fidelity had taken, or had made recommendations that resulted in the Fidelity funds taking, a number of actions over the previous year that benefited particular funds, including: (i) continuing to dedicate additional resources to Fidelity's investment research process, which includes meetings with management of issuers of securities in which the funds invest, and to the support of the senior management team that oversees asset management; (ii) continuing efforts to enhance Fidelity's global research capabilities; (iii) launching new funds and making other enhancements to meet client needs; (iv) launching new share classes of existing funds; (v) eliminating purchase minimums and broadening eligibility requirements for certain funds and share classes; (vi) reducing management fees and total expenses for certain growth equity funds and index funds; (vii) lowering expense caps for certain existing funds and classes, and converting certain voluntary expense caps to contractual caps, to reduce expenses borne by shareholders; (viii) eliminating short-term redemption fees for funds that had such fees; (ix) rationalizing product lines and gaining increased efficiencies from fund mergers and share class consolidations; (x) continuing to develop, acquire and implement systems and technology to improve services to the funds and shareholders, strengthen information security, and increase efficiency; and (xi) continuing to implement enhancements to further strengthen Fidelity's product line to increase investors' probability of success in achieving their investment goals, including retirement income goals.
Investment Performance. The Board considered whether the fund has operated in accordance with its investment objective, as well as its record of compliance with its investment restrictions and its performance history.
The Board took into account discussions that occur at Board meetings throughout the year with representatives of the Investment Advisers about fund investment performance. In this regard the Board noted that as part of regularly scheduled fund reviews and other reports to the Board on fund performance, the Board considers annualized return information for the fund for different time periods, measured against an appropriate securities market index ("benchmark index") and a peer group of funds with similar objectives ("peer group"), if any. In its evaluation of fund investment performance, the Board gave particular attention to information indicating changes in performance of certain Fidelity funds for specific time periods and discussed with the Investment Advisers the reasons for any overperformance or underperformance.
In addition to reviewing absolute and relative fund performance, the Independent Trustees periodically consider the appropriateness of fund performance metrics in evaluating the results achieved. In general, the Independent Trustees believe that fund performance should be evaluated based on net performance (after fees and expenses) of both the highest performing and lowest performing fund share classes, where applicable, compared to appropriate benchmark indices, over appropriate time periods that may include full market cycles, and compared to peer groups, as applicable, over the same periods, taking into account relevant factors including the following: general market conditions; issuer-specific information; and fund cash flows and other factors.
The Independent Trustees recognize that shareholders evaluate performance on a net basis over their own holding periods, for which one-, three-, and five-year periods are often used as a proxy. For this reason, the performance information reviewed by the Board also included net cumulative total return information for the fund and an appropriate benchmark index and peer group for the most recent
one-, three-, and five-year periods ended June 30, 2018, as shown below. Returns are shown compared to the 25th percentile (top of box, 75% beaten) and 75th percentile (bottom of box, 25% beaten) of the peer universe. Returns of the benchmark index are "net MA," i.e., adjusted for tax withholding rates applicable to U.S.-based funds organized as Massachusetts business trusts.Fidelity International Discovery Fund
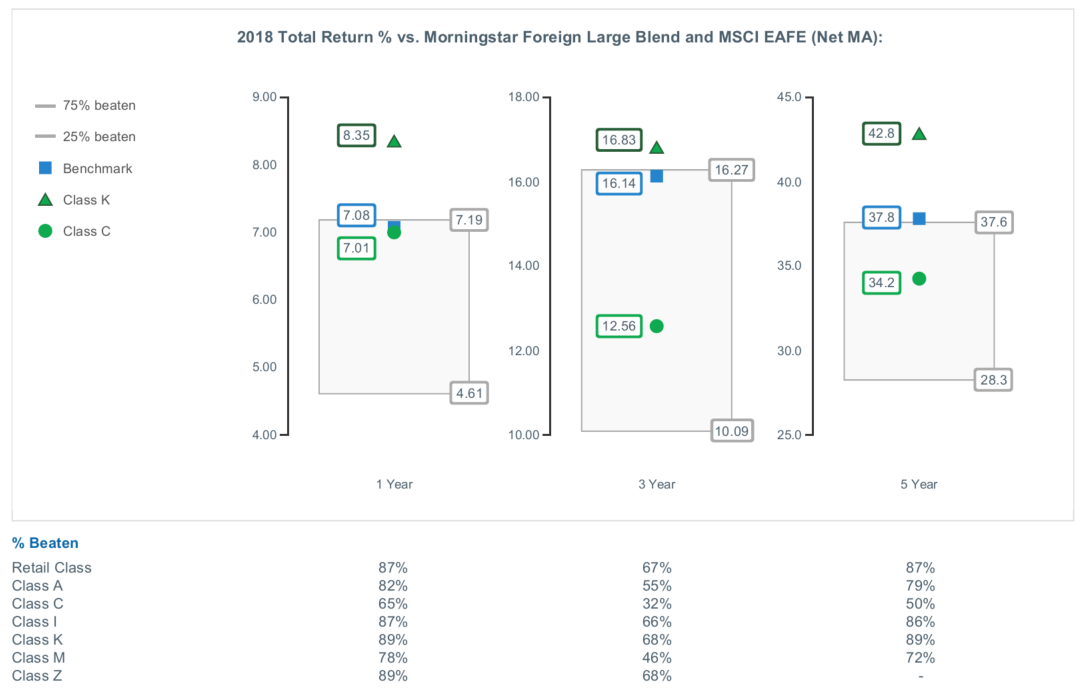
The Board also considered that the fund's management fee is subject to upward or downward adjustment depending upon whether, and to what extent, the fund's investment performance for the performance period (a rolling 36-month period) exceeds, or is exceeded by, a securities index, thus leading to a performance adjustment for the same period. The Board noted that the performance adjustment provides FMR with a strong economic incentive to seek to achieve superior long-term performance for the fund's shareholders and helps to more closely align the interests of FMR and the shareholders of the fund.
Based on its review, the Board concluded that the nature, extent, and quality of services provided to the fund under the Advisory Contracts should continue to benefit the shareholders of the fund.
Competitiveness of Management Fee and Total Expense Ratio. The Board considered the fund's management fee and total expense ratio compared to "mapped groups" of competitive funds and classes created for the purpose of facilitating the Trustees' competitive analysis of management fees and total expenses. Fidelity creates "mapped groups" by combining similar Lipper investment objective categories that have comparable investment mandates. Combining Lipper investment objective categories aids the Board's management fee and total expense ratio comparisons by broadening the competitive group used for comparison.
Management Fee. The Board considered two proprietary management fee comparisons for the 12-month periods (ended June 30 for 2018 and December 31 for prior periods) shown in basis points (BP) in the chart below. The group of Lipper funds used by the Board for management fee comparisons is referred to below as the "Total Mapped Group." The Total Mapped Group comparison focuses on a fund's standing in terms of gross management fees before expense reimbursements or caps, and without giving effect to the fund's performance adjustment, relative to the total universe of funds with comparable investment mandates, regardless of whether their management fee structures also are comparable. Funds with comparable investment mandates offer exposure to similar types of securities. Funds with comparable management fee structures have similar management fee contractual arrangements (
e.g., flat rate charged for advisory services, all-inclusive fee rate,
etc.). "TMG %" represents the percentage of funds in the Total Mapped Group that had management fees that were lower than the fund's. For example, a hypothetical TMG % of 20% would mean that 80% of the funds in the Total Mapped Group had higher, and 20% had lower, management fees than the fund. The fund's actual TMG %s and the number of funds in the Total Mapped Group are in the chart below. The "Asset-Size Peer Group" (ASPG) comparison focuses on a fund's standing relative to a subset of non-Fidelity funds within the Total Mapped Group that are similar in size and management fee structure without taking into account performance adjustments, if any. For example, if a fund is in the first quartile of the ASPG, the fund's management fee ranks in the least expensive or lowest 25% of funds in the ASPG. The ASPG represents at least 15% of the funds in the Total Mapped Group with comparable asset size and management fee structures, subject to a minimum of 50 funds (or all funds in the Total Mapped Group if fewer than 50). Additional information, such as the ASPG quartile in which the fund's management fee rate ranked and the impact of the fund's performance adjustment, is also included in the chart and was considered by the Board.
Fidelity International Discovery Fund
The Board considered that effective August 1, 2014, the fund's individual fund fee rate was reduced from 0.450% to 0.424%. The Board considered that the chart below reflects the fund's lower management fee rate for 2014, as if the lower fee rate were in effect for the entire year.
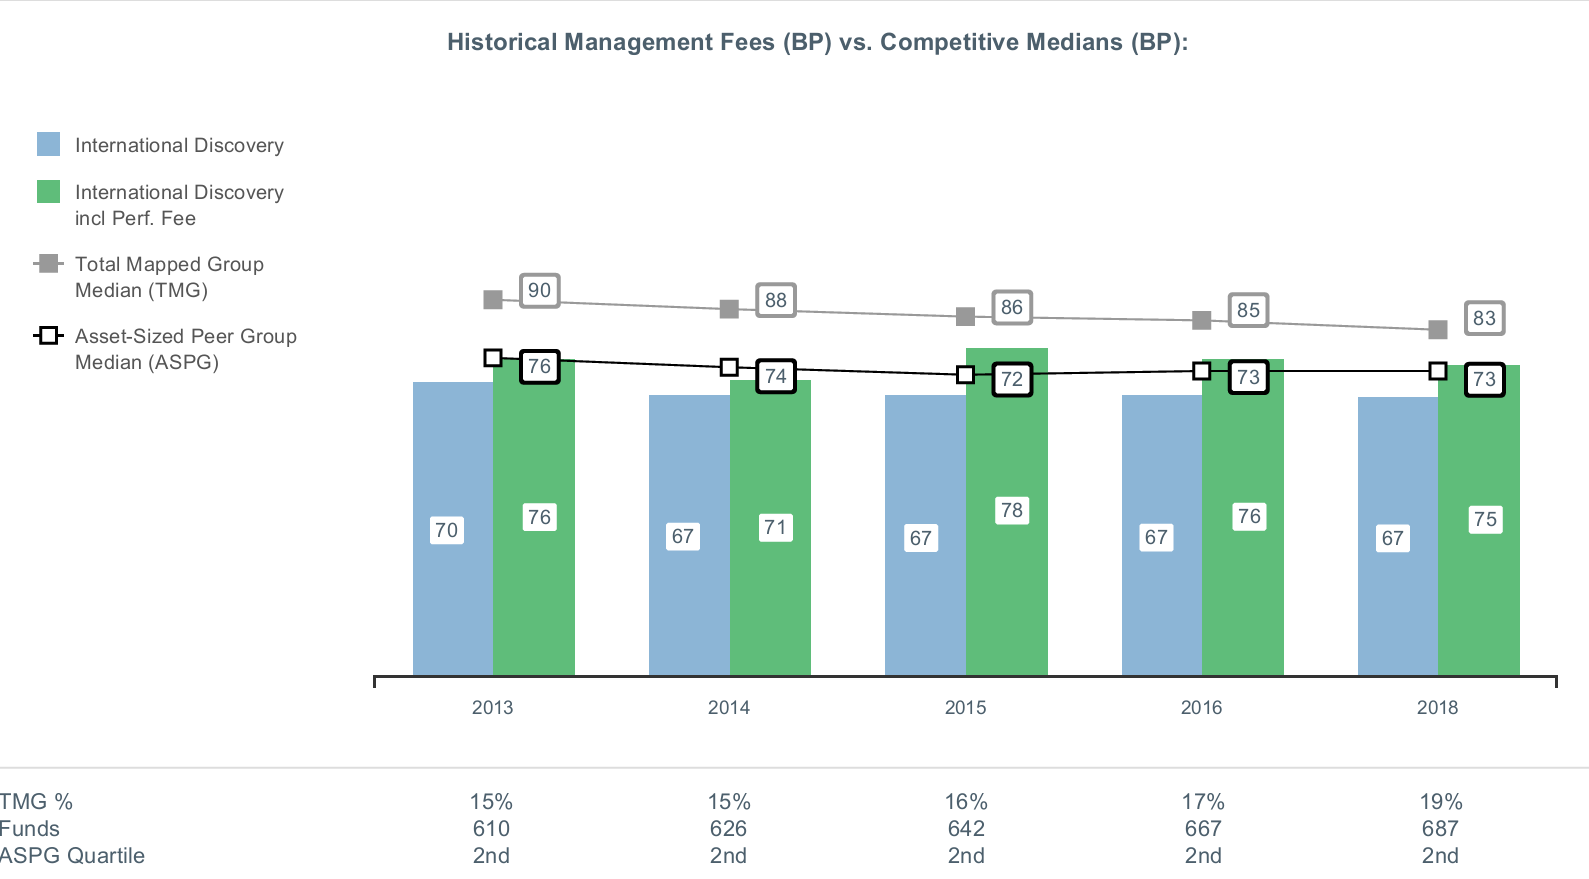
The Board noted that the fund's management fee rate ranked below the median of its Total Mapped Group and below the median of its ASPG for the 12-month period ended June 30, 2018. The Board also noted the effect of the fund's performance adjustment, if any, on the fund's management fee ranking.
The Board noted that it and the boards of other Fidelity funds formed an ad hoc Committee on Group Fee, which meets periodically, to conduct an in-depth review of the "group fee" component of the management fee of funds with such management fee structures. The Committee's focus included the mechanics of the group fee, the competitive landscape of group fee structures, Fidelity funds with no group fee component and investment products not included in group fee assets. The Board also considered that, for funds subject to the group fee, FMR agreed to voluntarily waive fees over a specified period of time in amounts designed to account for assets converted from certain funds to certain collective investment trusts.
The Board also noted that, in 2013, the ad hoc Committee on Management Fees was formed to conduct an in-depth review of the management fee rates of Fidelity's active equity mutual funds. The Committee focused on the following areas: (i) standard fee structures; (ii) research consumption and trading evolution; (iii) management fee competitiveness/profitability by category; and (iv) factors that drive institutional pricing.
Based on its review, the Board concluded that the fund's management fee is fair and reasonable in light of the services that the fund receives and the other factors considered.
Total Expense Ratio. In its review of each class's total expense ratio, the Board considered the fund's management fee rate as well as other fund or class expenses, as applicable, such as transfer agent fees, pricing and bookkeeping fees, fund-paid 12b-1 fees, and custodial, legal, and audit fees. The Board noted the impact of the fund's performance adjustment. The Board also noted that Fidelity may agree to waive fees and expenses from time to time, and the extent to which, if any, it has done so for the fund. As part of its review, the Board also considered the current and historical total expense ratios of each class of the fund compared to competitive fund median expenses. Each class of the fund is compared to those funds and classes in the Total Mapped Group (used by the Board for management fee comparisons) that have a similar sales load structure.
The Board noted that the total expense ratio of each of Class A, Class Z, the retail class, and Class K ranked below the competitive median for the 12-month period ended June 30, 2018, the total expense ratio of Class I ranked equal to the competitive median for the 12-month period ended June 30, 2018, and the total expense ratio of each of Class M and Class C ranked above the competitive median for the 12-month period ended June 30, 2018. The Board considered that, in general, various factors can affect total expense ratios. The Board noted that the total expense ratio of Class M was above the competitive median primarily because of higher 12b-1 fees on Class M as compared to most competitor funds. Class M has a higher 12b-1 fee, but a lower front-end sales charge, than traditionally priced front-end sales charge classes. The Board considered that Class M is primarily sold load-waived to retirement plans and intermediary wrap programs where its 0.50% 12b-1 fee is comparable to competing no-load, higher 12b-1 fee classes designed specifically for retirement plans and wrap programs. The Board noted that the total expense ratio of Class C was above the competitive median primarily because of its 1.00% 12b-1 fee. The Board noted that the fund offers multiple classes, each of which has a different sales load and 12b-1 fee structure, and that the multiple structures are intended to offer a range of pricing options for the intermediary market. The Board also noted that the total expense ratios of the classes vary primarily by the level of their 12b-1 fees, although differences in transfer agent fees may also cause expenses to vary from class to class.
Fees Charged to Other Fidelity Clients. The Board also considered Fidelity fee structures and other information with respect to clients of Fidelity, such as other funds advised or subadvised by Fidelity, pension plan clients, and other institutional clients with similar mandates. The Board noted that a joint ad hoc committee created by it and the boards of other Fidelity funds periodically reviews and compares Fidelity's institutional investment advisory business with its business of providing services to the Fidelity funds and also noted the most recent findings of the committee. The Board noted that the committee's review included a consideration of the differences in services provided, fees charged, and costs incurred, as well as competition in the markets serving the different categories of clients.
Based on its review of total expense ratios and fees charged to other Fidelity clients, the Board concluded that the total expense ratio of each class of the fund was reasonable in light of the services that the fund and its shareholders receive and the other factors considered.
Costs of the Services and Profitability. The Board considered the revenues earned and the expenses incurred by Fidelity in conducting the business of developing, marketing, distributing, managing, administering and servicing the fund and servicing the fund's shareholders. The Board also considered the level of Fidelity's profits in respect of all the Fidelity funds.
On an annual basis, Fidelity presents to the Board information about the profitability of its relationships with the fund. Fidelity calculates profitability information for each fund, as well as aggregate profitability information for groups of Fidelity funds and all Fidelity funds, using a series of detailed revenue and cost allocation methodologies which originate with the books and records of Fidelity on which Fidelity's audited financial statements are based. The Audit Committee of the Board reviews any significant changes from the prior year's methodologies.
PricewaterhouseCoopers LLP (PwC), auditor to Fidelity and certain Fidelity funds, has been engaged annually by the Board as part of the Board's assessment of Fidelity's profitability analysis. PwC's engagement includes the review and assessment of the methodologies used by Fidelity in determining the revenues and expenses attributable to Fidelity's mutual fund business, and completion of agreed-upon procedures in respect of the mathematical accuracy of the fund profitability information and its conformity to established allocation methodologies. After considering PwC's reports issued under the engagement and information provided by Fidelity, the Board concluded that while other allocation methods may also be reasonable, Fidelity's profitability methodologies are reasonable in all material respects.
The Board also reviewed Fidelity's non-fund businesses and potential indirect benefits such businesses may have received as a result of their association with Fidelity's mutual fund business (i.e., fall-out benefits) as well as cases where Fidelity's affiliates may benefit from the fund's business. The Board noted that changes to fall-out benefits year-over-year reflect business developments at Fidelity's various businesses.
The Board considered the costs of the services provided by and the profits realized by Fidelity in connection with the operation of the fund and was satisfied that the profitability was not excessive.
Economies of Scale. The Board considered whether there have been economies of scale in respect of the management of the Fidelity funds, whether the Fidelity funds (including the fund) have appropriately benefited from any such economies of scale, and whether there is potential for realization of any further economies of scale. The Board considered the extent to which the fund will benefit from economies of scale as assets grow through increased services to the fund, through waivers or reimbursements, or through fee or expense ratio reductions. The Board also noted that a committee (the Economies of Scale Committee) created by it and the boards of other Fidelity funds periodically analyzes whether Fidelity attains economies of scale in respect of the management and servicing of the Fidelity funds, whether the Fidelity funds have appropriately benefited from such economies of scale, and whether there is potential for realization of any further economies of scale.
The Board recognized that the fund's management contract incorporates a "group fee" structure, which provides for lower group fee rates as total group assets increase, and for higher group fee rates as total group assets decrease (with "group assets" defined to include fund assets under FMR's management plus the assets of sector funds previously under FMR's management). FMR calculates the group fee rates based on a tiered asset "breakpoint" schedule that varies based on asset class. The Board considered that the group fee is designed to deliver the benefits of economies of scale to fund shareholders when total Fidelity fund assets increase, even if assets of any particular fund are unchanged or have declined, because some portion of Fidelity's costs are attributable to services provided to all Fidelity funds, and all funds benefit if those costs can be allocated among more assets. The Board concluded that, given the group fee structure, fund shareholders will benefit from lower management fees as group assets increase at the fund complex level, regardless of whether Fidelity achieves any such economies of scale.
The Board concluded, taking into account the analysis of the Economies of Scale Committee, that economies of scale, if any, are being appropriately shared between fund shareholders and Fidelity.
Additional Information Requested by the Board. In order to develop fully the factual basis for consideration of the Fidelity funds' advisory contracts, the Board requested and received additional information on certain topics, including: (i) fund performance trends, in particular the underperformance of certain funds, and Fidelity's long-term strategies for certain funds; (ii) Fidelity's fund profitability methodology, profitability trends for certain funds, and the impact of certain factors on fund profitability results; (iii) metrics for evaluating index fund and ETF performance and information about ETF trading characteristics; (iv) the methodology with respect to the evaluation of competitive fund data and peer group classifications and fee comparisons; (v) the expense structures for different funds and classes; (vi) information regarding other accounts managed by Fidelity, including collective investment trusts; and (vii) Fidelity's philosophies and strategies for evaluating funds and classes with lower or declining asset levels.
Based on its evaluation of all of the conclusions noted above, and after considering all factors it believed relevant, the Board concluded that the advisory fee arrangements are fair and reasonable, and that the fund's Advisory Contracts should be renewed.
IGI-SANN-0619
1.807261.114
Fidelity® International Small Cap Opportunities Fund
Semi-Annual Report April 30, 2019 Includes Fidelity and Fidelity Advisor share classes |
|
Beginning on January 1, 2021, as permitted by regulations adopted by the Securities and Exchange Commission, paper copies of a fund’s shareholder reports will no longer be sent by mail, unless you specifically request paper copies of the reports from the fund or from your financial intermediary, such as a financial advisor, broker-dealer or bank. Instead, the reports will be made available on a website, and you will be notified by mail each time a report is posted and provided with a website link to access the report.
If you already elected to receive shareholder reports electronically, you will not be affected by this change and you need not take any action. You may elect to receive shareholder reports and other communications from a fund electronically, by contacting your financial intermediary. For Fidelity customers, visit Fidelity's web site or call Fidelity using the contact information listed below.
You may elect to receive all future reports in paper free of charge. If you wish to continue receiving paper copies of your shareholder reports, you may contact your financial intermediary or, if you are a Fidelity customer, visit Fidelity’s website, or call Fidelity at the applicable toll-free number listed below. Your election to receive reports in paper will apply to all funds held with the fund complex/your financial intermediary.
| Account Type | Website | Phone Number |
| Brokerage, Mutual Fund, or Annuity Contracts: | fidelity.com/mailpreferences | 1-800-343-3548 |
| Employer Provided Retirement Accounts: | netbenefits.fidelity.com/preferences (choose 'no' under Required Disclosures to continue to print) | 1-800-343-0860 |
| Advisor Sold Accounts Serviced Through Your Financial Intermediary: | Contact Your Financial Intermediary | Your Financial Intermediary's phone number |
| Advisor Sold Accounts Serviced by Fidelity: | institutional.fidelity.com | 1-877-208-0098 |
Contents
To view a fund's proxy voting guidelines and proxy voting record for the 12-month period ended June 30, visit http://www.fidelity.com/proxyvotingresults or visit the Securities and Exchange Commission's (SEC) web site at http://www.sec.gov.
You may also call 1-800-544-8544 if you’re an individual investing directly with Fidelity, call 1-800-835-5092 if you’re a plan sponsor or participant with Fidelity as your recordkeeper or call 1-877-208-0098 on institutional accounts or if you’re an advisor or invest through one to request a free copy of the proxy voting guidelines.
Standard & Poor's, S&P and S&P 500 are registered service marks of The McGraw-Hill Companies, Inc. and have been licensed for use by Fidelity Distributors Corporation.
Other third-party marks appearing herein are the property of their respective owners.
All other marks appearing herein are registered or unregistered trademarks or service marks of FMR LLC or an affiliated company. © 2019 FMR LLC. All rights reserved.
This report and the financial statements contained herein are submitted for the general information of the shareholders of the Fund. This report is not authorized for distribution to prospective investors in the Fund unless preceded or accompanied by an effective prospectus.
A fund files its complete schedule of portfolio holdings with the SEC for the first and third quarters of each fiscal year on Form N-PORT. Forms N-PORT are available on the SEC’s web site at http://www.sec.gov. A fund's Forms N-PORT may be reviewed and copied at the SEC’s Public Reference Room in Washington, DC. Information regarding the operation of the SEC's Public Reference Room may be obtained by calling 1-800-SEC-0330.
For a complete list of a fund's portfolio holdings, view the most recent holdings listing, semiannual report, or annual report on Fidelity's web site at http://www.fidelity.com, http://www.institutional.fidelity.com, or http://www.401k.com, as applicable.
NOT FDIC INSURED •MAY LOSE VALUE •NO BANK GUARANTEE
Neither the Fund nor Fidelity Distributors Corporation is a bank.
Investment Summary (Unaudited)
Geographic Diversification (% of fund's net assets)
| As of April 30, 2019 |
| | Japan | 34.5% |
| | United Kingdom | 16.3% |
| | United States of America* | 13.8% |
| | Germany | 5.4% |
| | Sweden | 5.2% |
| | Israel | 2.5% |
| | Denmark | 2.4% |
| | Belgium | 2.1% |
| | Netherlands | 2.1% |
| | Other | 15.7% |

* Includes Short-Term investments and Net Other Assets (Liabilities).
Percentages are based on country or territory of incorporation and are adjusted for the effect of futures contracts, if applicable.
Asset Allocation as of April 30, 2019
| | % of fund's net assets |
| Stocks and Investment Companies | 92.9 |
| Short-Term Investments and Net Other Assets (Liabilities) | 7.1 |
Top Ten Stocks as of April 30, 2019
| | % of fund's net assets |
| iShares MSCI EAFE Small-Cap ETF (United States of America, Investment Companies) | 4.8 |
| Spirax-Sarco Engineering PLC (United Kingdom, Machinery) | 2.7 |
| Azbil Corp. (Japan, Electronic Equipment & Components) | 2.7 |
| OBIC Co. Ltd. (Japan, IT Services) | 2.6 |
| Spectris PLC (United Kingdom, Electronic Equipment & Components) | 2.5 |
| CompuGroup Medical AG (Germany, Health Care Technology) | 2.2 |
| USS Co. Ltd. (Japan, Specialty Retail) | 2.0 |
| Lasertec Corp. (Japan, Semiconductors & Semiconductor Equipment) | 1.7 |
| Dechra Pharmaceuticals PLC (United Kingdom, Pharmaceuticals) | 1.7 |
| Nihon Parkerizing Co. Ltd. (Japan, Chemicals) | 1.6 |
| | 24.5 |
Top Market Sectors as of April 30, 2019
| | % of fund's net assets |
| Industrials | 23.2 |
| Information Technology | 15.6 |
| Health Care | 12.8 |
| Consumer Discretionary | 9.1 |
| Consumer Staples | 7.2 |
| Communication Services | 5.8 |
| Materials | 4.9 |
| Financials | 3.9 |
| Real Estate | 3.8 |
| Energy | 1.8 |
Schedule of Investments April 30, 2019 (Unaudited)
Showing Percentage of Net Assets
| Common Stocks - 87.2% | | | |
| | | Shares | Value |
| Australia - 0.4% | | | |
| Beacon Lighting Group Ltd. (a) | | 2,785,250 | $2,037,092 |
| Imdex Ltd. | | 3,874,130 | 2,840,311 |
| Quintis Ltd. (a)(b)(c) | | 2,011,191 | 14 |
|
| TOTAL AUSTRALIA | | | 4,877,417 |
|
| Austria - 0.7% | | | |
| Andritz AG | | 192,700 | 9,185,624 |
| Bailiwick of Jersey - 0.5% | | | |
| Integrated Diagnostics Holdings PLC (d) | | 1,483,779 | 7,196,328 |
| Belgium - 2.1% | | | |
| Barco NV | | 62,400 | 11,086,074 |
| KBC Ancora | | 337,156 | 17,168,199 |
|
| TOTAL BELGIUM | | | 28,254,273 |
|
| Canada - 1.2% | | | |
| McCoy Global, Inc. (b) | | 632,115 | 377,467 |
| New Look Vision Group, Inc. | | 227,200 | 5,233,554 |
| Pason Systems, Inc. | | 318,800 | 4,747,376 |
| PrairieSky Royalty Ltd. | | 202,700 | 2,921,652 |
| ShawCor Ltd. Class A | | 164,900 | 2,446,975 |
|
| TOTAL CANADA | | | 15,727,024 |
|
| China - 0.5% | | | |
| Zhejiang Sanhua Intelligent Controls Co. Ltd. (A Shares) | | 2,545,325 | 6,009,097 |
| Denmark - 2.4% | | | |
| Jyske Bank A/S (Reg.) | | 158,927 | 6,401,203 |
| Netcompany Group A/S (d) | | 144,697 | 5,160,685 |
| SimCorp A/S | | 116,400 | 11,410,393 |
| Spar Nord Bank A/S | | 1,015,822 | 8,729,327 |
|
| TOTAL DENMARK | | | 31,701,608 |
|
| Finland - 0.4% | | | |
| Tikkurila Oyj | | 337,888 | 5,654,310 |
| France - 1.8% | | | |
| Elis SA | | 638,842 | 11,392,751 |
| Laurent-Perrier Group SA | | 51,163 | 5,417,089 |
| Vetoquinol SA | | 116,884 | 7,341,437 |
|
| TOTAL FRANCE | | | 24,151,277 |
|
| Germany - 4.5% | | | |
| CompuGroup Medical AG | | 444,921 | 29,442,380 |
| CTS Eventim AG | | 242,193 | 12,397,817 |
| Nexus AG | | 291,358 | 8,333,072 |
| WashTec AG | | 116,925 | 9,193,130 |
|
| TOTAL GERMANY | | | 59,366,399 |
|
| Greece - 0.3% | | | |
| Motor Oil (HELLAS) Corinth Refineries SA | | 161,800 | 4,126,739 |
| India - 0.5% | | | |
| Embassy Office Parks (REIT) (b) | | 781,600 | 3,595,852 |
| Jyothy Laboratories Ltd. | | 1,221,776 | 3,150,616 |
|
| TOTAL INDIA | | | 6,746,468 |
|
| Ireland - 0.6% | | | |
| FBD Holdings PLC | | 243,128 | 2,459,685 |
| James Hardie Industries PLC CDI | | 432,240 | 5,874,762 |
|
| TOTAL IRELAND | | | 8,334,447 |
|
| Israel - 2.5% | | | |
| Azrieli Group | | 54,105 | 3,079,727 |
| Ituran Location & Control Ltd. | | 475,008 | 17,466,044 |
| Strauss Group Ltd. | | 513,644 | 13,095,392 |
|
| TOTAL ISRAEL | | | 33,641,163 |
|
| Italy - 1.5% | | | |
| Interpump Group SpA | | 514,843 | 19,332,956 |
| Japan - 34.5% | | | |
| Ai Holdings Corp. | | 202,400 | 3,288,693 |
| Aoki Super Co. Ltd. | | 175,000 | 4,053,144 |
| Artnature, Inc. | | 511,600 | 2,879,601 |
| Aucnet, Inc. | | 216,320 | 2,450,701 |
| Azbil Corp. (e) | | 1,475,700 | 35,330,957 |
| Broadleaf Co. Ltd. (e) | | 1,241,298 | 6,362,774 |
| Central Automotive Products Ltd. | | 135,400 | 2,068,771 |
| Century21 Real Estate Japan Ltd. | | 66,500 | 721,145 |
| Coca-Cola West Co. Ltd. | | 147,475 | 3,623,494 |
| Daiichikosho Co. Ltd. (e) | | 307,000 | 14,992,414 |
| Daikokutenbussan Co. Ltd. | | 195,900 | 6,709,085 |
| Funai Soken Holdings, Inc. (f) | | 280,950 | 7,246,011 |
| GCA Savvian Group Corp. | | 496,961 | 3,653,764 |
| Goldcrest Co. Ltd. | | 661,630 | 8,677,602 |
| Iwatsuka Confectionary Co. Ltd. | | 18,900 | 693,936 |
| Kobayashi Pharmaceutical Co. Ltd. | | 129,500 | 10,300,013 |
| Koshidaka Holdings Co. Ltd. (e) | | 1,144,800 | 15,929,261 |
| Kusuri No Aoki Holdings Co. Ltd. | | 122,800 | 8,620,638 |
| Lasertec Corp. | | 499,672 | 22,562,504 |
| Medikit Co. Ltd. | | 111,100 | 5,674,932 |
| Miroku Jyoho Service Co., Ltd. | | 173,500 | 4,653,871 |
| Misumi Group, Inc. | | 464,650 | 12,004,692 |
| Mitsuboshi Belting Ltd. (e) | | 184,000 | 3,478,648 |
| Nabtesco Corp. | | 495,900 | 15,091,351 |
| Nagaileben Co. Ltd. | | 632,000 | 14,178,087 |
| ND Software Co. Ltd. | | 97,942 | 1,488,539 |
| Nihon Parkerizing Co. Ltd. (e) | | 1,639,600 | 21,298,094 |
| NS Tool Co. Ltd. (e) | | 204,800 | 4,667,958 |
| OBIC Co. Ltd. | | 297,300 | 34,321,810 |
| OSG Corp. | | 1,044,800 | 20,906,317 |
| Paramount Bed Holdings Co. Ltd. | | 355,400 | 16,654,141 |
| ProNexus, Inc. (f) | | 450,500 | 5,350,433 |
| San-Ai Oil Co. Ltd. | | 1,064,200 | 8,961,081 |
| SHO-BOND Holdings Co. Ltd. | | 302,800 | 20,767,467 |
| Shoei Co. Ltd. | | 420,926 | 18,307,702 |
| SK Kaken Co. Ltd. | | 20,700 | 8,492,212 |
| Software Service, Inc. | | 97,700 | 8,674,115 |
| Techno Medica Co. Ltd. | | 80,791 | 1,528,861 |
| The Monogatari Corp. | | 56,600 | 4,522,106 |
| TKC Corp. | | 176,100 | 6,868,841 |
| Tocalo Co. Ltd. | | 615,636 | 5,034,736 |
| USS Co. Ltd. | | 1,361,500 | 25,984,550 |
| Welcia Holdings Co. Ltd. | | 156,700 | 6,154,338 |
| Workman Co. Ltd. (a) | | 251,800 | 12,161,084 |
| Yamada Consulting Group Co. Ltd. | | 260,500 | 5,642,861 |
| Yamato Kogyo Co. Ltd. | | 137,700 | 3,801,136 |
|
| TOTAL JAPAN | | | 456,834,471 |
|
| Korea (South) - 1.0% | | | |
| BGF Retail Co. Ltd. | | 51,126 | 9,597,023 |
| Leeno Industrial, Inc. | | 66,328 | 3,259,389 |
|
| TOTAL KOREA (SOUTH) | | | 12,856,412 |
|
| Mexico - 0.2% | | | |
| Consorcio ARA S.A.B. de CV | | 8,644,378 | 2,316,385 |
| Netherlands - 2.1% | | | |
| Aalberts Industries NV | | 461,701 | 18,124,535 |
| Takeaway.com Holding BV (b)(d) | | 108,487 | 9,332,781 |
|
| TOTAL NETHERLANDS | | | 27,457,316 |
|
| Norway - 1.5% | | | |
| Kongsberg Gruppen ASA | | 892,559 | 12,931,964 |
| Skandiabanken ASA (d) | | 646,460 | 6,361,608 |
|
| TOTAL NORWAY | | | 19,293,572 |
|
| Philippines - 0.5% | | | |
| Jollibee Food Corp. | | 1,209,740 | 7,119,142 |
| South Africa - 1.0% | | | |
| Clicks Group Ltd. | | 945,129 | 12,927,224 |
| Spain - 1.8% | | | |
| Merlin Properties Socimi SA | | 538,500 | 7,338,376 |
| Prosegur Compania de Seguridad SA (Reg.) | | 3,249,090 | 16,901,704 |
|
| TOTAL SPAIN | | | 24,240,080 |
|
| Sweden - 5.2% | | | |
| Addlife AB | | 396,114 | 10,626,834 |
| AddTech AB (B Shares) | | 636,043 | 15,470,388 |
| Fagerhult AB (a) | | 935,139 | 7,987,469 |
| Lagercrantz Group AB (B Shares) | | 919,775 | 11,204,238 |
| Loomis AB (B Shares) | | 334,600 | 12,379,293 |
| Saab AB (B Shares) (a) | | 326,125 | 10,735,996 |
|
| TOTAL SWEDEN | | | 68,404,218 |
|
| Switzerland - 0.9% | | | |
| Tecan Group AG | | 55,920 | 12,600,453 |
| Taiwan - 0.4% | | | |
| Addcn Technology Co. Ltd. | | 638,435 | 5,619,517 |
| United Kingdom - 16.3% | | | |
| Alliance Pharma PLC | | 6,549,541 | 6,712,913 |
| Ascential PLC | | 2,109,186 | 9,807,850 |
| Avon Rubber PLC | | 426,500 | 8,197,739 |
| Cineworld Group PLC | | 1,291,500 | 5,355,489 |
| Dechra Pharmaceuticals PLC | | 631,509 | 21,904,774 |
| DP Poland PLC (a)(b) | | 9,954,100 | 1,187,683 |
| Elementis PLC | | 5,452,137 | 11,553,078 |
| Great Portland Estates PLC | | 1,166,242 | 11,475,803 |
| Hilton Food Group PLC | | 318,426 | 4,218,711 |
| Howden Joinery Group PLC | | 710,900 | 4,709,229 |
| Informa PLC | | 879,056 | 8,929,591 |
| InterContinental Hotel Group PLC ADR | | 87,585 | 5,790,244 |
| ITE Group PLC | | 6,477,493 | 6,115,375 |
| Network International Holdings PLC (d) | | 317,700 | 2,158,403 |
| Rightmove PLC | | 1,934,170 | 13,634,784 |
| Shaftesbury PLC | | 1,287,173 | 14,426,480 |
| Spectris PLC | | 929,778 | 33,317,590 |
| Spirax-Sarco Engineering PLC | | 338,991 | 36,468,652 |
| Topps Tiles PLC | | 3,398,115 | 3,341,081 |
| Ultra Electronics Holdings PLC | | 312,658 | 6,490,680 |
|
| TOTAL UNITED KINGDOM | | | 215,796,149 |
|
| United States of America - 1.9% | | | |
| Autoliv, Inc. | | 39,300 | 3,084,657 |
| Martin Marietta Materials, Inc. | | 27,320 | 6,062,308 |
| Morningstar, Inc. | | 26,100 | 3,744,045 |
| PriceSmart, Inc. | | 100,460 | 6,008,513 |
| ResMed, Inc. | | 57,495 | 6,008,802 |
|
| TOTAL UNITED STATES OF AMERICA | | | 24,908,325 |
|
| TOTAL COMMON STOCKS | | | |
| (Cost $881,101,830) | | | 1,154,678,394 |
|
| Nonconvertible Preferred Stocks - 0.9% | | | |
| Germany - 0.9% | | | |
| Sartorius AG (non-vtg.) | | | |
| (Cost $1,774,352) | | 64,280 | 11,766,140 |
|
| Investment Companies - 4.8% | | | |
| United States of America - 4.8% | | | |
| iShares MSCI EAFE Small-Cap ETF (a) | | | |
| (Cost $66,935,722) | | 1,070,000 | 63,461,702 |
|
| Money Market Funds - 9.0% | | | |
| Fidelity Cash Central Fund, 2.49% (g) | | 92,129,962 | 92,148,388 |
| Fidelity Securities Lending Cash Central Fund 2.49% (g)(h) | | 27,496,472 | 27,499,221 |
| TOTAL MONEY MARKET FUNDS | | | |
| (Cost $119,647,580) | | | 119,647,609 |
| TOTAL INVESTMENT IN SECURITIES - 101.9% | | | |
| (Cost $1,069,459,484) | | | 1,349,553,845 |
| NET OTHER ASSETS (LIABILITIES) - (1.9)% | | | (25,074,146) |
| NET ASSETS - 100% | | | $1,324,479,699 |
Security Type Abbreviations
ETF – Exchange-Traded Fund
Legend
(a) Security or a portion of the security is on loan at period end.
(b) Non-income producing
(c) Level 3 security
(d) Security exempt from registration under Rule 144A of the Securities Act of 1933. These securities may be resold in transactions exempt from registration, normally to qualified institutional buyers. At the end of the period, the value of these securities amounted to $30,209,805 or 2.3% of net assets.
(e) Security or a portion of the security purchased on a delayed delivery or when-issued basis.
(f) A portion of the security sold on a delayed delivery basis.
(g) Affiliated fund that is generally available only to investment companies and other accounts managed by Fidelity Investments. The rate quoted is the annualized seven-day yield of the fund at period end. A complete unaudited listing of the fund's holdings as of its most recent quarter end is available upon request. In addition, each Fidelity Central Fund's financial statements are available on the SEC's website or upon request.
(h) Investment made with cash collateral received from securities on loan.
Affiliated Central Funds
Information regarding fiscal year to date income earned by the Fund from investments in Fidelity Central Funds is as follows:
| Fund | Income earned |
| Fidelity Cash Central Fund | $960,018 |
| Fidelity Securities Lending Cash Central Fund | 126,609 |
| Total | $1,086,627 |
Amounts in the income column in the above table include any capital gain distributions from underlying funds, which are presented in the corresponding line-item in the Statement of Operations, if applicable.
Investment Valuation
The following is a summary of the inputs used, as of April 30, 2019, involving the Fund's assets and liabilities carried at fair value. The inputs or methodology used for valuing securities may not be an indication of the risk associated with investing in those securities. For more information on valuation inputs, and their aggregation into the levels used below, please refer to the Investment Valuation section in the accompanying Notes to Financial Statements.
| | Valuation Inputs at Reporting Date: |
| Description | Total | Level 1 | Level 2 | Level 3 |
| Investments in Securities: | | | | |
| Equities: | | | | |
| Communication Services | $76,852,837 | $76,852,837 | $-- | $-- |
| Consumer Discretionary | 120,866,794 | 120,866,794 | -- | -- |
| Consumer Staples | 97,448,817 | 97,448,817 | -- | -- |
| Energy | 23,581,290 | 23,581,290 | -- | -- |
| Financials | 50,676,234 | 50,676,234 | -- | -- |
| Health Care | 170,131,808 | 159,504,974 | 10,626,834 | -- |
| Industrials | 305,701,681 | 259,128,535 | 46,573,146 | -- |
| Information Technology | 206,293,863 | 195,089,625 | 11,204,238 | -- |
| Materials | 65,576,225 | 65,576,211 | -- | 14 |
| Real Estate | 49,314,985 | 49,314,985 | -- | -- |
| Investment Companies | 63,461,702 | 63,461,702 | -- | -- |
| Money Market Funds | 119,647,609 | 119,647,609 | -- | -- |
| Total Investments in Securities: | $1,349,553,845 | $1,281,149,613 | $68,404,218 | $14 |
See accompanying notes which are an integral part of the financial statements.
Financial Statements
Statement of Assets and Liabilities
| | | April 30, 2019 (Unaudited) |
| Assets | | |
Investment in securities, at value (including securities loaned of $26,345,656) — See accompanying schedule:
Unaffiliated issuers (cost $949,811,904) | $1,229,906,236 | |
| Fidelity Central Funds (cost $119,647,580) | 119,647,609 | |
| Total Investment in Securities (cost $1,069,459,484) | | $1,349,553,845 |
| Receivable for investments sold | | |
| Regular delivery | | 120,830 |
| Delayed delivery | | 307,546 |
| Receivable for fund shares sold | | 1,464,120 |
| Dividends receivable | | 5,248,752 |
| Distributions receivable from Fidelity Central Funds | | 190,886 |
| Prepaid expenses | | 637 |
| Other receivables | | 15,891 |
| Total assets | | 1,356,902,507 |
| Liabilities | | |
| Payable for investments purchased | | |
| Regular delivery | $445,573 | |
| Delayed delivery | 1,388,494 | |
| Payable for fund shares redeemed | 1,429,637 | |
| Accrued management fee | 1,075,332 | |
| Distribution and service plan fees payable | 24,160 | |
| Other affiliated payables | 245,698 | |
| Other payables and accrued expenses | 310,750 | |
| Collateral on securities loaned | 27,503,164 | |
| Total liabilities | | 32,422,808 |
| Net Assets | | $1,324,479,699 |
| Net Assets consist of: | | |
| Paid in capital | | $1,052,922,829 |
| Total distributable earnings (loss) | | 271,556,870 |
| Net Assets | | $1,324,479,699 |
| Net Asset Value and Maximum Offering Price | | |
| Class A: | | |
| Net Asset Value and redemption price per share ($44,958,110 ÷ 2,430,436 shares) | | $18.50 |
| Maximum offering price per share (100/94.25 of $18.50) | | $19.63 |
| Class M: | | |
| Net Asset Value and redemption price per share ($13,888,961 ÷ 756,504 shares) | | $18.36 |
| Maximum offering price per share (100/96.50 of $18.36) | | $19.03 |
| Class C: | | |
| Net Asset Value and offering price per share ($10,735,353 ÷ 600,485 shares)(a) | | $17.88 |
| International Small Cap Opportunities: | | |
| Net Asset Value, offering price and redemption price per share ($1,032,447,009 ÷ 55,255,459 shares) | | $18.68 |
| Class I: | | |
| Net Asset Value, offering price and redemption price per share ($193,037,356 ÷ 10,340,936 shares) | | $18.67 |
| Class Z: | | |
| Net Asset Value, offering price and redemption price per share ($29,412,910 ÷ 1,578,603 shares) | | $18.63 |
(a) Redemption price per share is equal to net asset value less any applicable contingent deferred sales charge.
See accompanying notes which are an integral part of the financial statements.
Statement of Operations
| | | Six months ended April 30, 2019 (Unaudited) |
| Investment Income | | |
| Dividends | | $10,093,371 |
| Non-Cash dividends | | 1,883,300 |
| Income from Fidelity Central Funds | | 1,086,627 |
| Income before foreign taxes withheld | | 13,063,298 |
| Less foreign taxes withheld | | (1,069,042) |
| Total income | | 11,994,256 |
| Expenses | | |
| Management fee | | |
| Basic fee | $5,118,386 | |
| Performance adjustment | 290,789 | |
| Transfer agent fees | 1,217,116 | |
| Distribution and service plan fees | 149,877 | |
| Accounting and security lending fees | 280,792 | |
| Custodian fees and expenses | 71,475 | |
| Independent trustees' fees and expenses | 3,370 | |
| Registration fees | 62,962 | |
| Audit | 43,672 | |
| Legal | 1,744 | |
| Miscellaneous | 4,864 | |
| Total expenses before reductions | 7,245,047 | |
| Expense reductions | (20,588) | |
| Total expenses after reductions | | 7,224,459 |
| Net investment income (loss) | | 4,769,797 |
| Realized and Unrealized Gain (Loss) | | |
| Net realized gain (loss) on: | | |
| Investment securities: | | |
| Unaffiliated issuers | 795,861 | |
| Fidelity Central Funds | (2,739) | |
| Foreign currency transactions | 346 | |
| Total net realized gain (loss) | | 793,468 |
| Change in net unrealized appreciation (depreciation) on: | | |
| Investment securities: | | |
| Unaffiliated issuers (net of increase in deferred foreign taxes of $38,597) | 112,156,053 | |
| Fidelity Central Funds | 29 | |
| Assets and liabilities in foreign currencies | (3,345) | |
| Total change in net unrealized appreciation (depreciation) | | 112,152,737 |
| Net gain (loss) | | 112,946,205 |
| Net increase (decrease) in net assets resulting from operations | | $117,716,002 |
See accompanying notes which are an integral part of the financial statements.
Statement of Changes in Net Assets
| | Six months ended April 30, 2019 (Unaudited) | Year ended October 31, 2018 |
| Increase (Decrease) in Net Assets | | |
| Operations | | |
| Net investment income (loss) | $4,769,797 | $11,392,924 |
| Net realized gain (loss) | 793,468 | 25,470,687 |
| Change in net unrealized appreciation (depreciation) | 112,152,737 | (105,507,125) |
| Net increase (decrease) in net assets resulting from operations | 117,716,002 | (68,643,514) |
| Distributions to shareholders | (32,407,290) | (23,288,503) |
| Share transactions - net increase (decrease) | 40,232,535 | 138,801,633 |
| Redemption fees | – | 14,959 |
| Total increase (decrease) in net assets | 125,541,247 | 46,884,575 |
| Net Assets | | |
| Beginning of period | 1,198,938,452 | 1,152,053,877 |
| End of period | $1,324,479,699 | $1,198,938,452 |
See accompanying notes which are an integral part of the financial statements.
Financial Highlights
Fidelity International Small Cap Opportunities Fund Class A
| | Six months ended (Unaudited) April 30, | Years endedOctober 31, | | | | |
| | 2019 | 2018 | 2017 | 2016 | 2015 | 2014 |
| Selected Per–Share Data | | | | | | |
| Net asset value, beginning of period | $17.33 | $18.47 | $14.82 | $14.75 | $13.65 | $13.68 |
| Income from Investment Operations | | | | | | |
| Net investment income (loss)A | .05 | .12 | .10 | .09 | .06 | .05 |
| Net realized and unrealized gain (loss) | 1.55 | (.92) | 3.71 | .10 | 1.11 | .05 |
| Total from investment operations | 1.60 | (.80) | 3.81 | .19 | 1.17 | .10 |
| Distributions from net investment income | (.11) | (.09) | (.12) | (.05) | (.05) | (.06) |
| Distributions from net realized gain | (.31) | (.24) | (.04) | (.07) | (.02) | (.08) |
| Total distributions | (.43)B | (.34)C | (.16) | (.12) | (.07) | (.13)D |
| Redemption fees added to paid in capitalA | – | –E | –E | –E | –E | –E |
| Net asset value, end of period | $18.50 | $17.33 | $18.47 | $14.82 | $14.75 | $13.65 |
| Total ReturnF,G,H | 9.53% | (4.48)% | 26.00% | 1.30% | 8.62% | .78% |
| Ratios to Average Net AssetsI,J | | | | | | |
| Expenses before reductions | 1.44%K | 1.38% | 1.43% | 1.45% | 1.52% | 1.63% |
| Expenses net of fee waivers, if any | 1.44%K | 1.38% | 1.43% | 1.45% | 1.52% | 1.63% |
| Expenses net of all reductions | 1.44%K | 1.37% | 1.43% | 1.45% | 1.51% | 1.63% |
| Net investment income (loss) | .52%K | .65% | .61% | .62% | .38% | .33% |
| Supplemental Data | | | | | | |
| Net assets, end of period (000 omitted) | $44,958 | $41,164 | $41,324 | $45,151 | $42,289 | $25,041 |
| Portfolio turnover rateL | 20%K | 19% | 11% | 24% | 21% | 18% |
A Calculated based on average shares outstanding during the period.
B Total distributions of $.43 per share is comprised of distributions from net investment income of $.113 and distributions from net realized gain of $.313 per share.
C Total distributions of $.34 per share is comprised of distributions from net investment income of $.093 and distributions from net realized gain of $.243 per share.
D Total distributions of $.13 per share is comprised of distributions from net investment income of $.055 and distributions from net realized gain of $.079 per share.
E Amount represents less than $.005 per share.
F Total returns for periods of less than one year are not annualized.
G Total returns would have been lower if certain expenses had not been reduced during the applicable periods shown.
H Total returns do not include the effect of the sales charges.
I Fees and expenses of any underlying Fidelity Central Funds are not included in the Fund's expense ratio. The Fund indirectly bears its proportionate share of the expenses of any underlying Fidelity Central Funds.
J Expense ratios reflect operating expenses of the class. Expenses before reductions do not reflect amounts reimbursed by the investment adviser or reductions from brokerage service arrangements or reductions from other expense offset arrangements and do not represent the amount paid by the class during periods when reimbursements or reductions occur. Expenses net of fee waivers reflect expenses after reimbursement by the investment adviser but prior to reductions from brokerage service arrangements or other expense offset arrangements. Expenses net of all reductions represent the net expenses paid by the class.
K Annualized
L Amount does not include the portfolio activity of any underlying Fidelity Central Funds.
See accompanying notes which are an integral part of the financial statements.
Fidelity International Small Cap Opportunities Fund Class M
| | Six months ended (Unaudited) April 30, | Years endedOctober 31, | | | | |
| | 2019 | 2018 | 2017 | 2016 | 2015 | 2014 |
| Selected Per–Share Data | | | | | | |
| Net asset value, beginning of period | $17.17 | $18.32 | $14.68 | $14.62 | $13.53 | $13.56 |
| Income from Investment Operations | | | | | | |
| Net investment income (loss)A | .02 | .07 | .05 | .04 | .01 | .01 |
| Net realized and unrealized gain (loss) | 1.54 | (.92) | 3.69 | .10 | 1.11 | .06 |
| Total from investment operations | 1.56 | (.85) | 3.74 | .14 | 1.12 | .07 |
| Distributions from net investment income | (.06) | (.06) | (.06) | (.01) | (.01) | (.02) |
| Distributions from net realized gain | (.31) | (.24) | (.04) | (.07) | (.02) | (.08) |
| Total distributions | (.37) | (.30) | (.10) | (.08) | (.03) | (.10) |
| Redemption fees added to paid in capitalA | – | –B | –B | –B | –B | –B |
| Net asset value, end of period | $18.36 | $17.17 | $18.32 | $14.68 | $14.62 | $13.53 |
| Total ReturnC,D,E | 9.37% | (4.74)% | 25.63% | .95% | 8.27% | .55% |
| Ratios to Average Net AssetsF,G | | | | | | |
| Expenses before reductions | 1.74%H | 1.67% | 1.73% | 1.77% | 1.80% | 1.89% |
| Expenses net of fee waivers, if any | 1.73%H | 1.67% | 1.73% | 1.77% | 1.80% | 1.89% |
| Expenses net of all reductions | 1.73%H | 1.66% | 1.73% | 1.77% | 1.80% | 1.89% |
| Net investment income (loss) | .23%H | .36% | .31% | .30% | .10% | .07% |
| Supplemental Data | | | | | | |
| Net assets, end of period (000 omitted) | $13,889 | $13,245 | $14,422 | $12,308 | $13,296 | $9,913 |
| Portfolio turnover rateI | 20%H | 19% | 11% | 24% | 21% | 18% |
A Calculated based on average shares outstanding during the period.
B Amount represents less than $.005 per share.
C Total returns for periods of less than one year are not annualized.
D Total returns would have been lower if certain expenses had not been reduced during the applicable periods shown.
E Total returns do not include the effect of the sales charges.
F Fees and expenses of any underlying Fidelity Central Funds are not included in the Fund's expense ratio. The Fund indirectly bears its proportionate share of the expenses of any underlying Fidelity Central Funds.
G Expense ratios reflect operating expenses of the class. Expenses before reductions do not reflect amounts reimbursed by the investment adviser or reductions from brokerage service arrangements or reductions from other expense offset arrangements and do not represent the amount paid by the class during periods when reimbursements or reductions occur. Expenses net of fee waivers reflect expenses after reimbursement by the investment adviser but prior to reductions from brokerage service arrangements or other expense offset arrangements. Expenses net of all reductions represent the net expenses paid by the class.
H Annualized
I Amount does not include the portfolio activity of any underlying Fidelity Central Funds.
See accompanying notes which are an integral part of the financial statements.
Fidelity International Small Cap Opportunities Fund Class C
| | Six months ended (Unaudited) April 30, | Years endedOctober 31, | | | | |
| | 2019 | 2018 | 2017 | 2016 | 2015 | 2014 |
| Selected Per–Share Data | | | | | | |
| Net asset value, beginning of period | $16.69 | $17.84 | $14.27 | $14.26 | $13.23 | $13.28 |
| Income from Investment Operations | | | | | | |
| Net investment income (loss)A | (.02) | (.02) | (.03) | (.03) | (.05) | (.06) |
| Net realized and unrealized gain (loss) | 1.50 | (.89) | 3.60 | .09 | 1.08 | .06 |
| Total from investment operations | 1.48 | (.91) | 3.57 | .06 | 1.03 | – |
| Distributions from net investment income | – | – | – | – | – | – |
| Distributions from net realized gain | (.29) | (.24) | – | (.05) | – | (.05) |
| Total distributions | (.29) | (.24) | – | (.05) | – | (.05) |
| Redemption fees added to paid in capitalA | – | –B | –B | –B | –B | –B |
| Net asset value, end of period | $17.88 | $16.69 | $17.84 | $14.27 | $14.26 | $13.23 |
| Total ReturnC,D,E | 9.11% | (5.19)% | 25.02% | .44% | 7.79% | .03% |
| Ratios to Average Net AssetsF,G | | | | | | |
| Expenses before reductions | 2.22%H | 2.15% | 2.22% | 2.26% | 2.27% | 2.38% |
| Expenses net of fee waivers, if any | 2.22%H | 2.15% | 2.22% | 2.26% | 2.27% | 2.38% |
| Expenses net of all reductions | 2.22%H | 2.14% | 2.21% | 2.25% | 2.26% | 2.38% |
| Net investment income (loss) | (.25)%H | (.12)% | (.17)% | (.19)% | (.36)% | (.42)% |
| Supplemental Data | | | | | | |
| Net assets, end of period (000 omitted) | $10,735 | $14,461 | $14,547 | $12,625 | $17,370 | $8,438 |
| Portfolio turnover rateI | 20%H | 19% | 11% | 24% | 21% | 18% |
A Calculated based on average shares outstanding during the period.
B Amount represents less than $.005 per share.
C Total returns for periods of less than one year are not annualized.
D Total returns would have been lower if certain expenses had not been reduced during the applicable periods shown.
E Total returns do not include the effect of the contingent deferred sales charge.
F Fees and expenses of any underlying Fidelity Central Funds are not included in the Fund's expense ratio. The Fund indirectly bears its proportionate share of the expenses of any underlying Fidelity Central Funds.
G Expense ratios reflect operating expenses of the class. Expenses before reductions do not reflect amounts reimbursed by the investment adviser or reductions from brokerage service arrangements or reductions from other expense offset arrangements and do not represent the amount paid by the class during periods when reimbursements or reductions occur. Expenses net of fee waivers reflect expenses after reimbursement by the investment adviser but prior to reductions from brokerage service arrangements or other expense offset arrangements. Expenses net of all reductions represent the net expenses paid by the class.
H Annualized
I Amount does not include the portfolio activity of any underlying Fidelity Central Funds.
See accompanying notes which are an integral part of the financial statements.
Fidelity International Small Cap Opportunities Fund
| | Six months ended (Unaudited) April 30, | Years endedOctober 31, | | | | |
| | 2019 | 2018 | 2017 | 2016 | 2015 | 2014 |
| Selected Per–Share Data | | | | | | |
| Net asset value, beginning of period | $17.53 | $18.69 | $15.00 | $14.91 | $13.80 | $13.82 |
| Income from Investment Operations | | | | | | |
| Net investment income (loss)A | .07 | .18 | .15 | .13 | .10 | .09 |
| Net realized and unrealized gain (loss) | 1.56 | (.95) | 3.75 | .11 | 1.12 | .06 |
| Total from investment operations | 1.63 | (.77) | 3.90 | .24 | 1.22 | .15 |
| Distributions from net investment income | (.17) | (.15) | (.17) | (.08) | (.09) | (.09) |
| Distributions from net realized gain | (.31) | (.24) | (.04) | (.07) | (.02) | (.08) |
| Total distributions | (.48) | (.39) | (.21) | (.15) | (.11) | (.17) |
| Redemption fees added to paid in capitalA | – | –B | –B | –B | –B | –B |
| Net asset value, end of period | $18.68 | $17.53 | $18.69 | $15.00 | $14.91 | $13.80 |
| Total ReturnC,D | 9.68% | (4.25)% | 26.39% | 1.58% | 8.92% | 1.11% |
| Ratios to Average Net AssetsE,F | | | | | | |
| Expenses before reductions | 1.16%G | 1.10% | 1.13% | 1.17% | 1.23% | 1.30% |
| Expenses net of fee waivers, if any | 1.16%G | 1.10% | 1.13% | 1.17% | 1.22% | 1.30% |
| Expenses net of all reductions | 1.16%G | 1.09% | 1.13% | 1.16% | 1.22% | 1.30% |
| Net investment income (loss) | .80%G | .93% | .91% | .90% | .68% | .65% |
| Supplemental Data | | | | | | |
| Net assets, end of period (000 omitted) | $1,032,447 | $965,482 | $916,882 | $809,952 | $762,563 | $584,253 |
| Portfolio turnover rateH | 20%G | 19% | 11% | 24% | 21% | 18% |
A Calculated based on average shares outstanding during the period.
B Amount represents less than $.005 per share.
C Total returns for periods of less than one year are not annualized.
D Total returns would have been lower if certain expenses had not been reduced during the applicable periods shown.
E Fees and expenses of any underlying Fidelity Central Funds are not included in the Fund's expense ratio. The Fund indirectly bears its proportionate share of the expenses of any underlying Fidelity Central Funds.
F Expense ratios reflect operating expenses of the class. Expenses before reductions do not reflect amounts reimbursed by the investment adviser or reductions from brokerage service arrangements or reductions from other expense offset arrangements and do not represent the amount paid by the class during periods when reimbursements or reductions occur. Expenses net of fee waivers reflect expenses after reimbursement by the investment adviser but prior to reductions from brokerage service arrangements or other expense offset arrangements. Expenses net of all reductions represent the net expenses paid by the class.
G Annualized
H Amount does not include the portfolio activity of any underlying Fidelity Central Funds.
See accompanying notes which are an integral part of the financial statements.
Fidelity International Small Cap Opportunities Fund Class I
| | Six months ended (Unaudited) April 30, | Years endedOctober 31, | | | | |
| | 2019 | 2018 | 2017 | 2016 | 2015 | 2014 |
| Selected Per–Share Data | | | | | | |
| Net asset value, beginning of period | $17.51 | $18.66 | $14.99 | $14.91 | $13.81 | $13.83 |
| Income from Investment Operations | | | | | | |
| Net investment income (loss)A | .07 | .18 | .15 | .13 | .10 | .08 |
| Net realized and unrealized gain (loss) | 1.57 | (.94) | 3.74 | .10 | 1.13 | .07 |
| Total from investment operations | 1.64 | (.76) | 3.89 | .23 | 1.23 | .15 |
| Distributions from net investment income | (.16) | (.15) | (.18) | (.08) | (.11) | (.09) |
| Distributions from net realized gain | (.31) | (.24) | (.04) | (.07) | (.02) | (.08) |
| Total distributions | (.48)B | (.39) | (.22) | (.15) | (.13) | (.17) |
| Redemption fees added to paid in capitalA | – | –C | –C | –C | –C | –C |
| Net asset value, end of period | $18.67 | $17.51 | $18.66 | $14.99 | $14.91 | $13.81 |
| Total ReturnD,E | 9.70% | (4.21)% | 26.34% | 1.56% | 8.98% | 1.11% |
| Ratios to Average Net AssetsF,G | | | | | | |
| Expenses before reductions | 1.15%H | 1.12% | 1.14% | 1.16% | 1.19% | 1.36% |
| Expenses net of fee waivers, if any | 1.15%H | 1.12% | 1.14% | 1.16% | 1.19% | 1.36% |
| Expenses net of all reductions | 1.15%H | 1.11% | 1.14% | 1.16% | 1.18% | 1.36% |
| Net investment income (loss) | .81%H | .91% | .90% | .91% | .71% | .60% |
| Supplemental Data | | | | | | |
| Net assets, end of period (000 omitted) | $193,037 | $159,968 | $164,878 | $155,551 | $120,723 | $29,822 |
| Portfolio turnover rateI | 20%H | 19% | 11% | 24% | 21% | 18% |
A Calculated based on average shares outstanding during the period.
B Total distributions of $.48 per share is comprised of distributions from net investment income of $.162 and distributions from net realized gain of $.313 per share.
C Amount represents less than $.005 per share.
D Total returns for periods of less than one year are not annualized.
E Total returns would have been lower if certain expenses had not been reduced during the applicable periods shown.
F Fees and expenses of any underlying Fidelity Central Funds are not included in the Fund's expense ratio. The Fund indirectly bears its proportionate share of the expenses of any underlying Fidelity Central Funds.
G Expense ratios reflect operating expenses of the class. Expenses before reductions do not reflect amounts reimbursed by the investment adviser or reductions from brokerage service arrangements or reductions from other expense offset arrangements and do not represent the amount paid by the class during periods when reimbursements or reductions occur. Expenses net of fee waivers reflect expenses after reimbursement by the investment adviser but prior to reductions from brokerage service arrangements or other expense offset arrangements. Expenses net of all reductions represent the net expenses paid by the class.
H Annualized
I Amount does not include the portfolio activity of any underlying Fidelity Central Funds.
See accompanying notes which are an integral part of the financial statements.
Fidelity International Small Cap Opportunities Fund Class Z
| | Six months ended (Unaudited) April 30, | Years endedOctober 31, |
| | 2019 | 2018 A |
| Selected Per–Share Data | | |
| Net asset value, beginning of period | $17.51 | $19.11 |
| Income from Investment Operations | | |
| Net investment income (loss)B | .08 | –C |
| Net realized and unrealized gain (loss) | 1.56 | (1.60) |
| Total from investment operations | 1.64 | (1.60) |
| Distributions from net investment income | (.20) | – |
| Distributions from net realized gain | (.31) | – |
| Total distributions | (.52)D | – |
| Net asset value, end of period | $18.63 | $17.51 |
| Total ReturnE,F | 9.74% | (8.37)% |
| Ratios to Average Net AssetsB,G | | |
| Expenses before reductions | 1.01%H | 1.03%H |
| Expenses net of fee waivers, if any | 1.00%H | 1.03%H |
| Expenses net of all reductions | 1.00%H | 1.02%H |
| Net investment income (loss) | .96%H | .16%H |
| Supplemental Data | | |
| Net assets, end of period (000 omitted) | $29,413 | $4,617 |
| Portfolio turnover rateI | 20%H | 19% |
A For the period October 2, 2018 (commencement of sale of shares) to October 31, 2018.
B Fees and expenses of any underlying Fidelity Central Funds are not included in the Fund's expense ratio. The Fund indirectly bears its proportionate share of the expenses of any underlying Fidelity Central Funds.
C Amount represents less than $.005 per share.
D Total distributions of $.52 per share is comprised of distributions from net investment income of $.204 and distributions from net realized gain of $.313 per share.
E Total returns for periods of less than one year are not annualized.
F Total returns would have been lower if certain expenses had not been reduced during the applicable periods shown.
G Expense ratios reflect operating expenses of the class. Expenses before reductions do not reflect amounts reimbursed by the investment adviser or reductions from brokerage service arrangements or reductions from other expense offset arrangements and do not represent the amount paid by the class during periods when reimbursements or reductions occur. Expense ratios before reductions for start-up periods may not be representative of longer-term operating periods. Expenses net of fee waivers reflect expenses after reimbursement by the investment adviser but prior to reductions from brokerage service arrangements or other expense offset arrangements. Expenses net of all reductions represent the net expenses paid by the class.
H Annualized
I Amount does not include the portfolio activity of any underlying Fidelity Central Funds.
See accompanying notes which are an integral part of the financial statements.
Notes to Financial Statements (Unaudited)
For the period ended April 30, 2019
1. Organization.
Fidelity International Small Cap Opportunities Fund (the Fund) is a fund of Fidelity Investment Trust (the Trust) and is authorized to issue an unlimited number of shares. The Trust is registered under the Investment Company Act of 1940, as amended (the 1940 Act), as an open-end management investment company organized as a Massachusetts business trust. The Fund offers Class A, Class M, Class C, International Small Cap Opportunities, Class I and Class Z shares, each of which has equal rights as to assets and voting privileges. Each class has exclusive voting rights with respect to matters that affect that class. Effective March 1, 2019, Class C shares will automatically convert to Class A shares after a holding period of ten years from the initial date of purchase, with certain exceptions.
In May 2019, the Board approved to close the Fund to new accounts with certain exceptions effective after the close of business on May 31, 2019.
2. Investments in Fidelity Central Funds.
The Fund invests in Fidelity Central Funds, which are open-end investment companies generally available only to other investment companies and accounts managed by the investment adviser and its affiliates. The Fund's Schedule of Investments lists each of the Fidelity Central Funds held as of period end, if any, as an investment of the Fund, but does not include the underlying holdings of each Fidelity Central Fund. As an Investing Fund, the Fund indirectly bears its proportionate share of the expenses of the underlying Fidelity Central Funds.
The Money Market Central Funds seek preservation of capital and current income and are managed by Fidelity Investments Money Management, Inc. (FIMM), an affiliate of the investment adviser. Annualized expenses of the Money Market Central Funds as of their most recent shareholder report date are less than .005%.
A complete unaudited list of holdings for each Fidelity Central Fund is available upon request or at the Securities and Exchange Commission (the SEC) website at www.sec.gov. In addition, the financial statements of the Fidelity Central Funds are available on the SEC website or upon request.
3. Significant Accounting Policies.
The Fund is an investment company and applies the accounting and reporting guidance of the Financial Accounting Standards Board (FASB) Accounting Standards Codification Topic 946 Financial Services – Investments Companies. The financial statements have been prepared in conformity with accounting principles generally accepted in the United States of America (GAAP), which require management to make certain estimates and assumptions at the date of the financial statements. Actual results could differ from those estimates. Subsequent events, if any, through the date that the financial statements were issued have been evaluated in the preparation of the financial statements. The following summarizes the significant accounting policies of the Fund:
Investment Valuation. Investments are valued as of 4:00 p.m. Eastern time on the last calendar day of the period. The Board of Trustees (the Board) has delegated the day to day responsibility for the valuation of the Fund's investments to the Fair Value Committee (the Committee) established by the Fund's investment adviser. In accordance with valuation policies and procedures approved by the Board, the Fund attempts to obtain prices from one or more third party pricing vendors or brokers to value its investments. When current market prices, quotations or currency exchange rates are not readily available or reliable, investments will be fair valued in good faith by the Committee, in accordance with procedures adopted by the Board. Factors used in determining fair value vary by investment type and may include market or investment specific events. The frequency with which these procedures are used cannot be predicted and they may be utilized to a significant extent. The Committee oversees the Fund's valuation policies and procedures and reports to the Board on the Committee's activities and fair value determinations. The Board monitors the appropriateness of the procedures used in valuing the Fund's investments and ratifies the fair value determinations of the Committee.
The Fund categorizes the inputs to valuation techniques used to value its investments into a disclosure hierarchy consisting of three levels as shown below:
- Level 1 – quoted prices in active markets for identical investments
- Level 2 – other significant observable inputs (including quoted prices for similar investments, interest rates, prepayment speeds, etc.)
- Level 3 – unobservable inputs (including the Fund's own assumptions based on the best information available)
Valuation techniques used to value the Fund's investments by major category are as follows:
Equity securities, including restricted securities, for which market quotations are readily available, are valued at the last reported sale price or official closing price as reported by a third party pricing vendor on the primary market or exchange on which they are traded and are categorized as Level 1 in the hierarchy. In the event there were no sales during the day or closing prices are not available, securities are valued at the last quoted bid price or may be valued using the last available price and are generally categorized as Level 2 in the hierarchy. For foreign equity securities, when market or security specific events arise, comparisons to the valuation of American Depositary Receipts (ADRs), futures contracts, Exchange-Traded Funds (ETFs) and certain indexes as well as quoted prices for similar securities may be used and would be categorized as Level 2 in the hierarchy. For equity securities, including restricted securities, where observable inputs are limited, assumptions about market activity and risk are used and these securities may be categorized as Level 3 in the hierarchy.
ETFs are valued at their last sale price or official closing price as reported by a third party pricing vendor on the primary market or exchange on which they are traded and are categorized as Level 1 in the hierarchy. In the event there were no sales during the day but the exchange reports a closing bid level, ETFs may be valued by another method that the Board believes reflects fair value in accordance with the Board's fair value pricing policies and may be categorized as Level 2 in the hierarchy.
Investments in open-end mutual funds, including the Fidelity Central Funds, are valued at their closing net asset value (NAV) each business day and are categorized as Level 1 in the hierarchy.
Changes in valuation techniques may result in transfers in or out of an assigned level within the disclosure hierarchy. The aggregate value of investments by input level as of April 30, 2019 is included at the end of the Fund's Schedule of Investments.
Foreign Currency. The Fund may use foreign currency contracts to facilitate transactions in foreign-denominated securities. Gains and losses from these transactions may arise from changes in the value of the foreign currency or if the counterparties do not perform under the contracts' terms.
Foreign-denominated assets, including investment securities, and liabilities are translated into U.S. dollars at the exchange rates at period end. Purchases and sales of investment securities, income and dividends received and expenses denominated in foreign currencies are translated into U.S. dollars at the exchange rate in effect on the transaction date.
The effects of exchange rate fluctuations on investments are included with the net realized and unrealized gain (loss) on investment securities. Other foreign currency transactions resulting in realized and unrealized gain (loss) are disclosed separately.
Investment Transactions and Income. For financial reporting purposes, the Fund's investment holdings and NAV include trades executed through the end of the last business day of the period. The NAV per share for processing shareholder transactions is calculated as of the close of business of the New York Stock Exchange (NYSE), normally 4:00 p.m. Eastern time and includes trades executed through the end of the prior business day. Gains and losses on securities sold are determined on the basis of identified cost. Dividend income is recorded on the ex-dividend date, except for certain dividends from foreign securities where the ex-dividend date may have passed, which are recorded as soon as the Fund is informed of the ex-dividend date. Non-cash dividends included in dividend income, if any, are recorded at the fair market value of the securities received. Income and capital gain distributions from Fidelity Central Funds, if any, are recorded on the ex-dividend date. Certain distributions received by the Fund represent a return of capital or capital gain. The Fund determines the components of these distributions subsequent to the ex-dividend date, based upon receipt of tax filings or other correspondence relating to the underlying investment. These distributions are recorded as a reduction of cost of investments and/or as a realized gain. Investment income is recorded net of foreign taxes withheld where recovery of such taxes is uncertain.
Class Allocations and Expenses. Investment income, realized and unrealized capital gains and losses, common expenses of the Fund, and certain fund-level expense reductions, if any, are allocated daily on a pro-rata basis to each class based on the relative net assets of each class to the total net assets of the Fund. Each class differs with respect to transfer agent and distribution and service plan fees incurred. Certain expense reductions may also differ by class. For the reporting period, the allocated portion of income and expenses to each class as a percent of its average net assets may vary due to the timing of recording these transactions in relation to fluctuating net assets of the classes. Expenses directly attributable to a fund are charged to that fund. Expenses attributable to more than one fund are allocated among the respective funds on the basis of relative net assets or other appropriate methods. Expense estimates are accrued in the period to which they relate and adjustments are made when actual amounts are known.
Income Tax Information and Distributions to Shareholders. Each year, the Fund intends to qualify as a regulated investment company under Subchapter M of the Internal Revenue Code, including distributing substantially all of its taxable income and realized gains. As a result, no provision for U.S. Federal income taxes is required. The Fund files a U.S. federal tax return, in addition to state and local tax returns as required. The Fund's federal income tax returns are subject to examination by the Internal Revenue Service (IRS) for a period of three fiscal years after they are filed. State and local tax returns may be subject to examination for an additional fiscal year depending on the jurisdiction. Foreign taxes are provided for based on the Fund's understanding of the tax rules and rates that exist in the foreign markets in which it invests. The Fund is subject to a tax imposed on capital gains by certain countries in which it invests. An estimated deferred tax liability for net unrealized appreciation on the applicable securities is included in Other payables and accrued expenses on the Statement of Assets & Liabilities.
Distributions are declared and recorded on the ex-dividend date. Income and capital gain distributions are declared separately for each class. Income and capital gain distributions are determined in accordance with income tax regulations, which may differ from GAAP.
Capital accounts within the financial statements are adjusted for permanent book-tax differences. These adjustments have no impact on net assets or the results of operations. Capital accounts are not adjusted for temporary book-tax differences which will reverse in a subsequent period.
Book-tax differences are primarily due to foreign currency transactions, passive foreign investment companies (PFIC), and losses deferred due to wash sales.
As of period end, the cost and unrealized appreciation (depreciation) in securities, and derivatives if applicable, for federal income tax purposes were as follows:
| Gross unrealized appreciation | $347,245,206 |
| Gross unrealized depreciation | (76,881,354) |
| Net unrealized appreciation (depreciation) | $270,363,852 |
| Tax cost | $1,079,189,993 |
Delayed Delivery Transactions and When-Issued Securities. During the period, the Fund transacted in securities on a delayed delivery or when-issued basis. Payment and delivery may take place after the customary settlement period for that security. The price of the underlying securities and the date when the securities will be delivered and paid for are fixed at the time the transaction is negotiated. The securities purchased on a delayed delivery or when-issued basis are identified as such in the Fund's Schedule of Investments. Losses may arise due to changes in the value of the underlying securities or if the counterparty does not perform under the contract's terms, or if the issuer does not issue the securities due to political, economic, or other factors.
Restricted Securities. The Fund may invest in securities that are subject to legal or contractual restrictions on resale. These securities generally may be resold in transactions exempt from registration or to the public if the securities are registered. Disposal of these securities may involve time-consuming negotiations and expense, and prompt sale at an acceptable price may be difficult. Information regarding restricted securities is included at the end of the Fund's Schedule of Investments.
4. Purchases and Sales of Investments.
Purchases and sales of securities, other than short-term securities, aggregated $117,207,073 and $111,943,071, respectively.
5. Fees and Other Transactions with Affiliates.
Management Fee. Fidelity Management & Research Company (the investment adviser) and its affiliates provide the Fund with investment management related services for which the Fund pays a monthly management fee. The management fee is the sum of an individual fund fee rate that is based on an annual rate of .60% of the Fund's average net assets and an annualized group fee rate that averaged .24% during the period. The group fee rate is based upon the average net assets of all the mutual funds advised by the investment adviser, including any mutual funds previously advised by the investment adviser that are currently advised by Fidelity SelectCo, LLC, an affiliate of the investment adviser. The group fee rate decreases as assets under management increase and increases as assets under management decrease. In addition, the management fee is subject to a performance adjustment (up to a maximum of +/- .20% of the Fund's average net assets over a 36 month performance period). The upward or downward adjustment to the management fee is based on the relative investment performance of International Small Cap Opportunities as compared to its benchmark index, the MSCI EAFE Small Cap Index, over the same 36 month performance period. For the reporting period, the total annualized management fee rate, including the performance adjustment, was .89% of the Fund's average net assets. The performance adjustment included in the management fee rate may be higher or lower than the maximum performance adjustment rate due to the difference between the average net assets for the reporting and performance periods.
Distribution and Service Plan Fees. In accordance with Rule 12b-1 of the 1940 Act, the Fund has adopted separate Distribution and Service Plans for each class of shares. Certain classes pay Fidelity Distributors Corporation (FDC), an affiliate of the investment adviser, separate Distribution and Service Fees, each of which is based on an annual percentage of each class' average net assets. In addition, FDC may pay financial intermediaries for selling shares of the Fund and providing shareholder support services. For the period, the Distribution and Service Fee rates, total fees and amounts retained by FDC were as follows:
| | Distribution Fee | Service Fee | Total Fees | Retained by FDC |
| Class A | -% | .25% | $50,703 | $1,607 |
| Class M | .25% | .25% | 32,538 | 446 |
| Class C | .75% | .25% | 66,636 | 7,100 |
| | | | $149,877 | $9,153 |
Sales Load. FDC may receive a front-end sales charge of up to 5.75% for selling Class A shares and 3.50% for selling Class M shares, some of which is paid to financial intermediaries for selling shares of the Fund. Depending on the holding period, FDC may receive contingent deferred sales charges levied on Class A, Class M and Class C redemptions. The deferred sales charges are 1.00% for Class C shares, 1.00% for certain purchases of Class A shares and .25% for certain purchases of Class M shares.
For the period, sales charge amounts retained by FDC were as follows:
| | Retained by FDC |
| Class A | $1,949 |
| Class M | 1,348 |
| Class C(a) | – |
| | $3,297 |
(a) When Class C shares are initially sold, FDC pays commissions from its own resources to financial intermediaries through which the sales are made.
Transfer Agent Fees. Fidelity Investments Institutional Operations Company, Inc., (FIIOC), an affiliate of the investment adviser, is the transfer, dividend disbursing and shareholder servicing agent for each class of the Fund. FIIOC receives account fees and asset-based fees that vary according to the account size and type of account of the shareholders of the respective classes of the Fund, except for Class Z. FIIOC receives an asset-based fee of Class Z's average net assets. FIIOC pays for typesetting, printing and mailing of shareholder reports, except proxy statements.
For the period, transfer agent fees for each class were as follows:
| | Amount | % of Class-Level Average Net Assets(a) |
| Class A | $47,173 | .23 |
| Class M | 17,863 | .27 |
| Class C | 17,133 | .26 |
| International Small Cap Opportunities | 966,598 | .20 |
| Class I | 163,893 | .19 |
| Class Z | 4,456 | .05 |
| | $1,217,116 | |
(a) Annualized
Accounting and Security Lending Fees. Fidelity Service Company, Inc. (FSC), an affiliate of the investment adviser, maintains the Fund's accounting records. The accounting fee is based on the level of average net assets for each month. Prior to April 1, 2019, FSC had a separate agreement with the Fund for administration of the security lending program, based on the number and duration of lending transactions. For the period, the total fees paid for accounting and administration of securities lending were equivalent to an annualized rate of .05%.
Brokerage Commissions. The Fund placed a portion of its portfolio transactions with brokerage firms which are affiliates of the investment adviser. Brokerage commissions are included in net realized gain (loss) and change in net unrealized appreciation (depreciation) in the Statement of Operations. The commissions paid to these affiliated firms were $327 for the period.
Interfund Trades. The Fund may purchase from or sell securities to other Fidelity Funds under procedures adopted by the Board. The procedures have been designed to ensure these interfund trades are executed in accordance with Rule 17a-7 of the 1940 Act. Interfund trades are included within the respective purchases and sales amounts shown in the Purchases and Sales of Investments note.
6. Committed Line of Credit.
The Fund participates with other funds managed by the investment adviser or an affiliate in a $4.25 billion credit facility (the "line of credit") to be utilized for temporary or emergency purposes to fund shareholder redemptions or for other short-term liquidity purposes. The Fund has agreed to pay commitment fees on its pro-rata portion of the line of credit, which amounted to $1,730 and is reflected in Miscellaneous expenses on the Statement of Operations. During the period, the Fund did not borrow on this line of credit.
7. Security Lending.
The Fund lends portfolio securities through a lending agent from time to time in order to earn additional income. For equity securities, a lending agent is used and may loan securities to certain qualified borrowers, including Fidelity Capital Markets (FCM), a broker-dealer affiliated with the Fund. On the settlement date of the loan, the Fund receives collateral (in the form of U.S. Treasury obligations, letters of credit and/or cash) against the loaned securities and maintains collateral in an amount not less than 100% of the market value of the loaned securities during the period of the loan. The market value of the loaned securities is determined at the close of business of the Fund and any additional required collateral is delivered to the Fund on the next business day. The Fund or borrower may terminate the loan at any time, and if the borrower defaults on its obligation to return the securities loaned because of insolvency or other reasons, the Fund may apply collateral received from the borrower against the obligation. The Fund may experience delays and costs in recovering the securities loaned. Any cash collateral received is invested in the Fidelity Securities Lending Cash Central Fund. The value of loaned securities and cash collateral at period end are disclosed on the Fund's Statement of Assets and Liabilities. Security lending income represents the income earned on investing cash collateral, less rebates paid to borrowers and any lending agent fees associated with the loan, plus any premium payments received for lending certain types of securities. Security lending income is presented in the Statement of Operations as a component of income from Fidelity Central Funds. Total security lending income during the period amounted to $126,609. During the period, there were no securities loaned to FCM.
8. Expense Reductions.
Commissions paid to certain brokers with whom the investment adviser, or its affiliates, places trades on behalf of the Fund include an amount in addition to trade execution, which may be rebated back to the Fund to offset certain expenses. Through arrangements with the Fund's custodian, credits realized as a result of certain uninvested cash balances were used to reduce the Fund's expenses. During the period, these credits reduced the Fund's custody expenses by $74.
In addition, during the period the investment adviser reimbursed and/or waived a portion of fund-level operating expenses in the amount of $4,514 and a portion of class-level operating expenses as follows:
| | Amount |
| Class A | $506 |
| Class M | 167 |
| Class C | 180 |
| International Small Cap Opportunities | 12,450 |
| Class I | 2,374 |
| Class Z | 323 |
| | $16,000 |
9. Distributions to Shareholders.
Distributions to shareholders of each class were as follows:
| | Six months ended
April 30, 2019 | Year ended
October 31, 2018 |
| Distributions to shareholders | | |
| Class A | $994,541 | $756,833 |
| Class M | 282,415 | 237,606 |
| Class C | 249,469 | 199,761 |
| International Small Cap Opportunities | 26,356,595 | 18,505,353 |
| Class I | 4,287,454 | 3,588,950 |
| Class Z | 236,816 | – |
| Total | $32,407,290 | $23,288,503 |
10. Share Transactions.
Share transactions for each class were as follows and may contain automatic conversions between classes or exchanges between affiliated funds:
| | Shares | Shares | Dollars | Dollars |
| | Six months ended April 30, 2019 | Year ended October 31, 2018(a) | Six months ended April 30, 2019 | Year ended October 31, 2018(a) |
| Class A | | | | |
| Shares sold | 361,372 | 659,827 | $6,284,402 | $12,815,405 |
| Reinvestment of distributions | 59,448 | 39,412 | 971,383 | 734,649 |
| Shares redeemed | (366,220) | (560,866) | (6,259,868) | (10,795,406) |
| Net increase (decrease) | 54,600 | 138,373 | $995,917 | $2,754,648 |
| Class M | | | | |
| Shares sold | 41,531 | 195,023 | $721,730 | $3,737,868 |
| Reinvestment of distributions | 17,248 | 12,748 | 280,108 | 235,975 |
| Shares redeemed | (73,840) | (223,377) | (1,257,180) | (4,246,469) |
| Net increase (decrease) | (15,061) | (15,606) | $(255,342) | $(272,626) |
| Class C | | | | |
| Shares sold | 41,963 | 289,466 | $683,263 | $5,517,711 |
| Reinvestment of distributions | 15,575 | 10,900 | 246,701 | 196,970 |
| Shares redeemed | (323,711) | (248,989) | (5,489,218) | (4,607,733) |
| Net increase (decrease) | (266,173) | 51,377 | $(4,559,254) | $1,106,948 |
| International Small Cap Opportunities | | | | |
| Shares sold | 5,880,874 | 18,665,452 | $100,847,215 | $367,097,669 |
| Reinvestment of distributions | 1,247,133 | 814,355 | 20,565,227 | 15,335,912 |
| Shares redeemed | (6,942,503) | (13,474,898) | (119,630,694) | (259,980,891) |
| Net increase (decrease) | 185,504 | 6,004,909 | $1,781,748 | $122,452,690 |
| Class I | | | | |
| Shares sold | 3,797,528 | 5,599,350 | $65,783,665 | $109,721,452 |
| Reinvestment of distributions | 211,847 | 153,156 | 3,489,125 | 2,881,165 |
| Shares redeemed | (2,806,037) | (5,449,347) | (48,983,901) | (104,456,236) |
| Net increase (decrease) | 1,203,338 | 303,159 | $20,288,889 | $8,146,381 |
| Class Z | | | | |
| Shares sold | 1,447,658 | 265,126 | $24,271,665 | $4,637,404 |
| Reinvestment of distributions | 12,712 | – | 208,865 | – |
| Shares redeemed | (145,508) | (1,385) | (2,499,953) | (23,812) |
| Net increase (decrease) | 1,314,862 | 263,741 | $21,980,577 | $4,613,592 |
(a) Share transactions for Class Z are for the period October 2, 2018 (commencement of sale of shares) to October 31, 2018
11. Other.
The Fund's organizational documents provide former and current trustees and officers with a limited indemnification against liabilities arising in connection with the performance of their duties to the Fund. In the normal course of business, the Fund may also enter into contracts that provide general indemnifications. The Fund's maximum exposure under these arrangements is unknown as this would be dependent on future claims that may be made against the Fund. The risk of material loss from such claims is considered remote.
Shareholder Expense Example
As a shareholder of the Fund, you incur two types of costs: (1) transaction costs, including sales charges (loads) on purchase payments and (2) ongoing costs, including management fees, distribution and/or service (12b-1) fees and other Fund expenses. This Example is intended to help you understand your ongoing costs (in dollars) of investing in the Fund and to compare these costs with the ongoing costs of investing in other mutual funds.
The Example is based on an investment of $1,000 invested at the beginning of the period and held for the entire period (November 1, 2018 to April 30, 2019).
Actual Expenses
The first line of the accompanying table for each class of the Fund provides information about actual account values and actual expenses. You may use the information in this line, together with the amount you invested, to estimate the expenses that you paid over the period. Simply divide your account value by $1,000.00 (for example, an $8,600 account value divided by $1,000.00 = 8.6), then multiply the result by the number in the first line for a class of the Fund under the heading entitled "Expenses Paid During Period" to estimate the expenses you paid on your account during this period. In addition, the Fund, as a shareholder in the underlying Fidelity Central Funds, will indirectly bear its pro-rata share of the fees and expenses incurred by the underlying Fidelity Central Funds. These fees and expenses are not included in the Fund's annualized expense ratio used to calculate the expense estimate in the table below.
Hypothetical Example for Comparison Purposes
The second line of the accompanying table for each class of the Fund provides information about hypothetical account values and hypothetical expenses based on a Class' actual expense ratio and an assumed rate of return of 5% per year before expenses, which is not the Class' actual return. The hypothetical account values and expenses may not be used to estimate the actual ending account balance or expenses you paid for the period. You may use this information to compare the ongoing costs of investing in the Fund and other funds. To do so, compare this 5% hypothetical example with the 5% hypothetical examples that appear in the shareholder reports of the other funds. In addition, the Fund, as a shareholder in the underlying Fidelity Central Funds, will indirectly bear its pro-rata share of the fees and expenses incurred by the underlying Fidelity Central Funds. These fees and expenses are not included in the Fund's annualized expense ratio used to calculate the expense estimate in the table below.
Please note that the expenses shown in the table are meant to highlight your ongoing costs only and do not reflect any transaction costs. Therefore, the second line of the table is useful in comparing ongoing costs only, and will not help you determine the relative total costs of owning different funds. In addition, if these transactional costs were included, your costs would have been higher.
| | Annualized Expense Ratio-A | Beginning
Account Value
November 1, 2018 | Ending
Account Value
April 30, 2019 | Expenses Paid
During Period-B
November 1, 2018
to April 30, 2019 |
| Class A | 1.44% | | | |
| Actual | | $1,000.00 | $1,095.30 | $7.48 |
| Hypothetical-C | | $1,000.00 | $1,017.65 | $7.20 |
| Class M | 1.73% | | | |
| Actual | | $1,000.00 | $1,093.70 | $8.98 |
| Hypothetical-C | | $1,000.00 | $1,016.22 | $8.65 |
| Class C | 2.22% | | | |
| Actual | | $1,000.00 | $1,091.10 | $11.51 |
| Hypothetical-C | | $1,000.00 | $1,013.79 | $11.08 |
| International Small Cap Opportunities | 1.16% | | | |
| Actual | | $1,000.00 | $1,096.80 | $6.03 |
| Hypothetical-C | | $1,000.00 | $1,019.04 | $5.81 |
| Class I | 1.15% | | | |
| Actual | | $1,000.00 | $1,097.00 | $5.98 |
| Hypothetical-C | | $1,000.00 | $1,019.09 | $5.76 |
| Class Z | 1.00% | | | |
| Actual | | $1,000.00 | $1,097.40 | $5.20 |
| Hypothetical-C | | $1,000.00 | $1,019.84 | $5.01 |
A Annualized expense ratio reflects expenses net of applicable fee waivers.
B Expenses are equal to each Class' annualized expense ratio, multiplied by the average account value over the period, multiplied by 181/365 (to reflect the one-half year period).
C 5% return per year before expenses
Board Approval of Investment Advisory Contracts and Management Fees
Fidelity International Small Cap Opportunities Fund
Each year, the Board of Trustees, including the Independent Trustees (together, the Board), votes on the renewal of the management contract with Fidelity Management & Research Company (FMR) and the sub-advisory agreements (together, the Advisory Contracts) for the fund. FMR and the sub-advisers are referred to herein as the Investment Advisers. The Board, assisted by the advice of fund counsel and Independent Trustees' counsel, requests and considers a broad range of information relevant to the renewal of the Advisory Contracts throughout the year.
The Board meets regularly and, at each of its meetings, covers an extensive agenda of topics and materials and considers factors that are relevant to its annual consideration of the renewal of the fund's Advisory Contracts, including the services and support provided to the fund and its shareholders. The Board has established various standing committees (Committees), each composed of and chaired by Independent Trustees with varying backgrounds, to which the Board has assigned specific subject matter responsibilities in order to enhance effective decision-making by the Board. The Board, acting directly and through its Committees, requests and receives information concerning the annual consideration of the renewal of the fund's Advisory Contracts. The Board also meets as needed to review matters specifically related to the Board's annual consideration of the renewal of the Advisory Contracts. Members of the Board may also meet with trustees of other Fidelity funds through joint ad hoc committees to discuss certain matters relevant to all of the Fidelity funds.
At its January 2019 meeting, the Board unanimously determined to renew the fund's Advisory Contracts. In reaching its determination, the Board considered all factors it believed relevant, including (i) the nature, extent, and quality of the services to be provided to the fund and its shareholders (including the investment performance of the fund); (ii) the competitiveness of the fund's management fee and total expense ratio relative to peer funds; (iii) the total costs of the services to be provided by and the profits to be realized by Fidelity from its relationships with the fund; and (iv) the extent to which, if any, economies of scale exist and would be realized as the fund grows, and whether any economies of scale are appropriately shared with fund shareholders.
In considering whether to renew the Advisory Contracts for the fund, the Board reached a determination, with the assistance of fund counsel and Independent Trustees' counsel and through the exercise of its business judgment, that the renewal of the Advisory Contracts was in the best interests of the fund and its shareholders and that the compensation payable under the Advisory Contracts was fair and reasonable. The Board's decision to renew the Advisory Contracts was not based on any single factor, but rather was based on a comprehensive consideration of all the information provided to the Board at its meetings throughout the year. The Board, in reaching its determination to renew the Advisory Contracts, was aware that shareholders of the fund have a broad range of investment choices available to them, including a wide choice among funds offered by Fidelity's competitors, and that the fund's shareholders, who have the opportunity to review and weigh the disclosure provided by the fund in its prospectus and other public disclosures, have chosen to invest in this fund, which is part of the Fidelity family of funds.
Nature, Extent, and Quality of Services Provided. The Board considered Fidelity's staffing as it relates to the fund, including the backgrounds of investment personnel of Fidelity, and also considered the fund's investment objective, strategies, and related investment philosophy. The Independent Trustees also had discussions with senior management of Fidelity's investment operations and investment groups. The Board considered the structure of the investment personnel compensation program and whether this structure provides appropriate incentives to act in the best interests of the fund. Additionally, the Board considered the portfolio managers' investments, if any, in the funds that they manage.
Resources Dedicated to Investment Management and Support Services. The Board and the Fund Oversight and Research Committees reviewed the general qualifications and capabilities of Fidelity's investment staff, including its size, education, experience, and resources, as well as Fidelity's approach to recruiting, training, managing, and compensating investment personnel. The Board noted that Fidelity has continued to increase the resources devoted to non-U.S. offices, including expansion of Fidelity's global investment organization. The Board also noted that Fidelity's analysts have extensive resources, tools and capabilities that allow them to conduct sophisticated quantitative and fundamental analysis, as well as credit analysis of issuers, counterparties and guarantors. Further, the Board considered that Fidelity's investment professionals have sufficient access to global information and data so as to provide competitive investment results over time, and that those professionals also have access to sophisticated tools that permit them to assess portfolio construction and risk and performance attribution characteristics continuously, as well as to transmit new information and research conclusions rapidly around the world. Additionally, in its deliberations, the Board considered Fidelity's trading, risk management, compliance, and technology and operations capabilities and resources, which are integral parts of the investment management process.
Shareholder and Administrative Services. The Board considered (i) the nature, extent, quality, and cost of advisory, administrative, and shareholder services performed by the Investment Advisers and their affiliates under the Advisory Contracts and under separate agreements covering transfer agency, pricing and bookkeeping, and securities lending services for the fund; (ii) the nature and extent of the supervision of third party service providers, principally custodians, subcustodians, and pricing vendors; and (iii) the resources devoted to, and the record of compliance with, the fund's compliance policies and procedures. The Board also reviewed the allocation of fund brokerage, including allocations to brokers affiliated with the Investment Advisers, the use of brokerage commissions to pay fund expenses, and the use of "soft" commission dollars to pay for research services.
The Board noted that the growth of fund assets over time across the complex allows Fidelity to reinvest in the development of services designed to enhance the value and convenience of the Fidelity funds as investment vehicles. These services include 24-hour access to account information and market information through telephone representatives and over the Internet, investor education materials and asset allocation tools, and the expanded availability of Fidelity Investor Centers.
The Board noted that it and the boards of certain other Fidelity funds had formed an ad hoc Committee on Transfer Agency Fees to review the variety of transfer agency fee structures throughout the industry and Fidelity's competitive positioning with respect to industry participants.
Investment in a Large Fund Family. The Board considered the benefits to shareholders of investing in a Fidelity fund, including the benefits of investing in a fund that is part of a large family of funds offering a variety of investment disciplines and providing a large variety of mutual fund investor services. The Board noted that Fidelity had taken, or had made recommendations that resulted in the Fidelity funds taking, a number of actions over the previous year that benefited particular funds, including: (i) continuing to dedicate additional resources to Fidelity's investment research process, which includes meetings with management of issuers of securities in which the funds invest, and to the support of the senior management team that oversees asset management; (ii) continuing efforts to enhance Fidelity's global research capabilities; (iii) launching new funds and making other enhancements to meet client needs; (iv) launching new share classes of existing funds; (v) eliminating purchase minimums and broadening eligibility requirements for certain funds and share classes; (vi) reducing management fees and total expenses for certain growth equity funds and index funds; (vii) lowering expense caps for certain existing funds and classes, and converting certain voluntary expense caps to contractual caps, to reduce expenses borne by shareholders; (viii) eliminating short-term redemption fees for funds that had such fees; (ix) rationalizing product lines and gaining increased efficiencies from fund mergers and share class consolidations; (x) continuing to develop, acquire and implement systems and technology to improve services to the funds and shareholders, strengthen information security, and increase efficiency; and (xi) continuing to implement enhancements to further strengthen Fidelity's product line to increase investors' probability of success in achieving their investment goals, including retirement income goals.
Investment Performance. The Board considered whether the fund has operated in accordance with its investment objective, as well as its record of compliance with its investment restrictions and its performance history. The Board noted that there were portfolio management changes for the fund in March 2017 and January 2018. The Board will continue to monitor closely the fund's performance, taking into account the portfolio manager changes.
The Board took into account discussions that occur at Board meetings throughout the year with representatives of the Investment Advisers about fund investment performance. In this regard the Board noted that as part of regularly scheduled fund reviews and other reports to the Board on fund performance, the Board considers annualized return information for the fund for different time periods, measured against an appropriate securities market index ("benchmark index") and a peer group of funds with similar objectives ("peer group"), if any. In its evaluation of fund investment performance, the Board gave particular attention to information indicating changes in performance of certain Fidelity funds for specific time periods and discussed with the Investment Advisers the reasons for any overperformance or underperformance.
In addition to reviewing absolute and relative fund performance, the Independent Trustees periodically consider the appropriateness of fund performance metrics in evaluating the results achieved. In general, the Independent Trustees believe that fund performance should be evaluated based on net performance (after fees and expenses) of both the highest performing and lowest performing fund share classes, where applicable, compared to appropriate benchmark indices, over appropriate time periods that may include full market cycles, and compared to peer groups, as applicable, over the same periods, taking into account relevant factors including the following: general market conditions; issuer-specific information; and fund cash flows and other factors.
The Independent Trustees recognize that shareholders evaluate performance on a net basis over their own holding periods, for which one-, three-, and five-year periods are often used as a proxy. For this reason, the performance information reviewed by the Board also included net cumulative total return information for the fund and an appropriate benchmark index and peer group for the most recent
one-, three-, and five-year periods ended June 30, 2018, as shown below. Returns are shown compared to the 25th percentile (top of box, 75% beaten) and 75th percentile (bottom of box, 25% beaten) of the peer universe. Returns of the benchmark index are "net MA," i.e., adjusted for tax withholding rates applicable to U.S.-based funds organized as Massachusetts business trusts.Fidelity International Small Cap Opportunities Fund

The Board also considered that the fund's management fee is subject to upward or downward adjustment depending upon whether, and to what extent, the fund's investment performance for the performance period (a rolling 36-month period) exceeds, or is exceeded by, a securities index, thus leading to a performance adjustment for the same period. The Board noted that the performance adjustment provides FMR with a strong economic incentive to seek to achieve superior long-term performance for the fund's shareholders and helps to more closely align the interests of FMR and the shareholders of the fund.
Based on its review, the Board concluded that the nature, extent, and quality of services provided to the fund under the Advisory Contracts should continue to benefit the shareholders of the fund.
Competitiveness of Management Fee and Total Expense Ratio. The Board considered the fund's management fee and total expense ratio compared to "mapped groups" of competitive funds and classes created for the purpose of facilitating the Trustees' competitive analysis of management fees and total expenses. Fidelity creates "mapped groups" by combining similar Lipper investment objective categories that have comparable investment mandates. Combining Lipper investment objective categories aids the Board's management fee and total expense ratio comparisons by broadening the competitive group used for comparison.
Management Fee. The Board considered two proprietary management fee comparisons for the 12-month periods (ended June 30 for 2018 and December 31 for prior periods) shown in basis points (BP) in the chart below. The group of Lipper funds used by the Board for management fee comparisons is referred to below as the "Total Mapped Group." The Total Mapped Group is broader than the Lipper peer group used by the Board for performance comparisons because the Total Mapped Group combines several Lipper investment objective categories while the Lipper peer group does not. The Total Mapped Group comparison focuses on a fund's standing in terms of gross management fees before expense reimbursements or caps, and without giving effect to the fund's performance adjustment, relative to the total universe of funds with comparable investment mandates, regardless of whether their management fee structures also are comparable. Funds with comparable investment mandates offer exposure to similar types of securities. Funds with comparable management fee structures have similar management fee contractual arrangements (
e.g., flat rate charged for advisory services, all-inclusive fee rate,
etc.). "TMG %" represents the percentage of funds in the Total Mapped Group that had management fees that were lower than the fund's. For example, a hypothetical TMG % of 20% would mean that 80% of the funds in the Total Mapped Group had higher, and 20% had lower, management fees than the fund. The fund's actual TMG %s and the number of funds in the Total Mapped Group are in the chart below. The "Asset-Size Peer Group" (ASPG) comparison focuses on a fund's standing relative to a subset of non-Fidelity funds within the Total Mapped Group that are similar in size and management fee structure without taking into account performance adjustments, if any. For example, if a fund is in the first quartile of the ASPG, the fund's management fee ranks in the least expensive or lowest 25% of funds in the ASPG. The ASPG represents at least 15% of the funds in the Total Mapped Group with comparable asset size and management fee structures, subject to a minimum of 50 funds (or all funds in the Total Mapped Group if fewer than 50). Additional information, such as the ASPG quartile in which the fund's management fee rate ranked and the impact of the fund's performance adjustment, is also included in the chart and was considered by the Board.
Fidelity International Small Cap Opportunities Fund
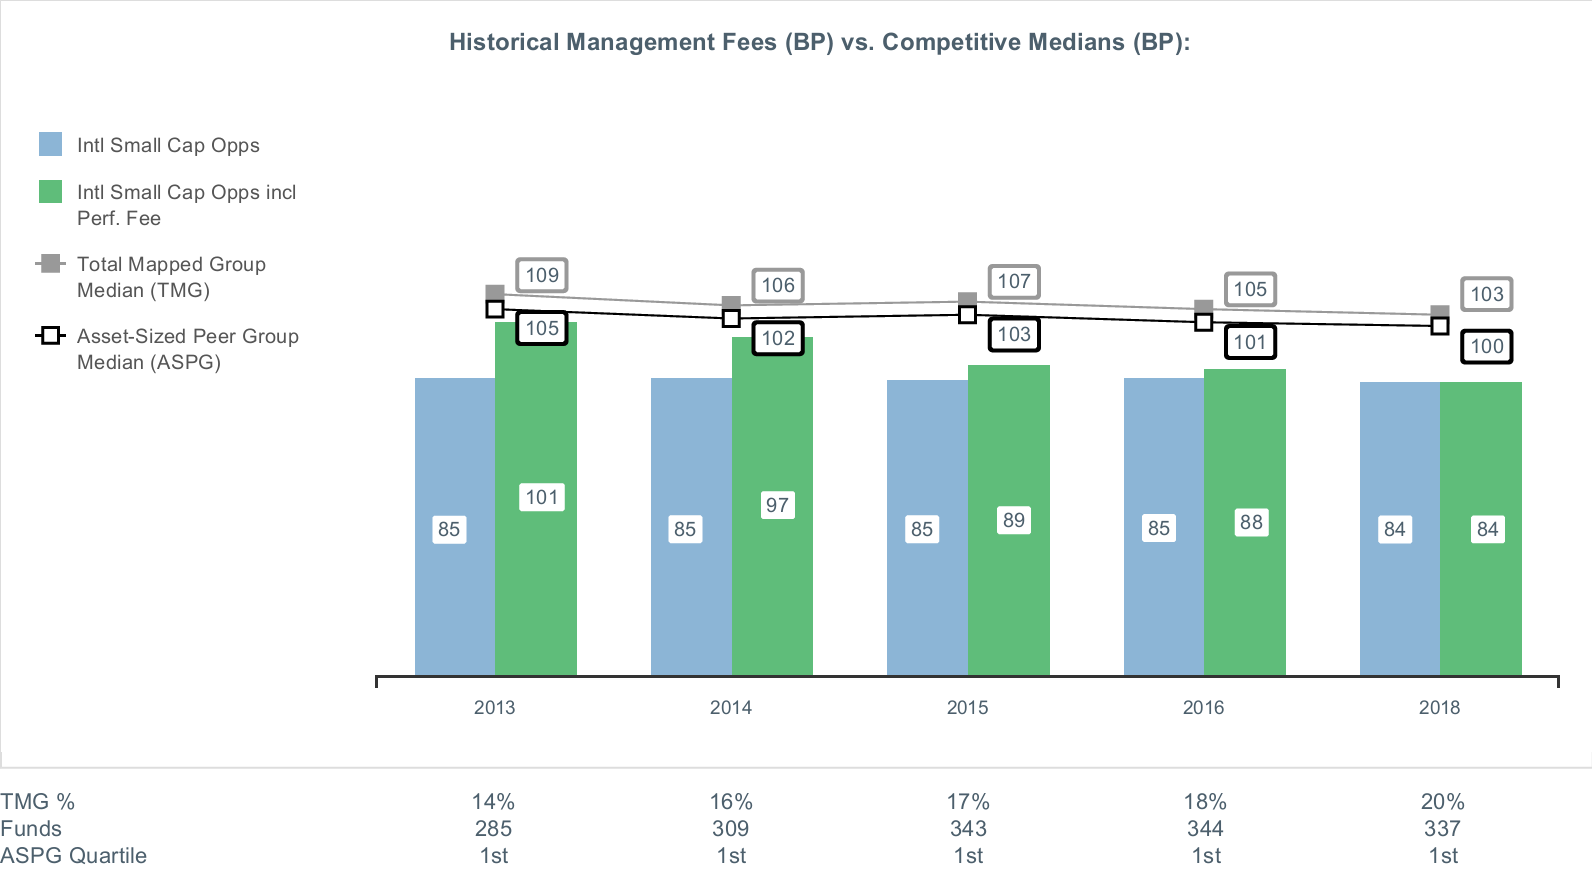
The Board noted that the fund's management fee rate ranked below the median of its Total Mapped Group and below the median of its ASPG for the 12-month period ended June 30, 2018. The Board also noted the effect of the fund's performance adjustment, if any, on the fund's management fee ranking.
The Board noted that it and the boards of other Fidelity funds formed an ad hoc Committee on Group Fee, which meets periodically, to conduct an in-depth review of the "group fee" component of the management fee of funds with such management fee structures. The Committee's focus included the mechanics of the group fee, the competitive landscape of group fee structures, Fidelity funds with no group fee component and investment products not included in group fee assets. The Board also considered that, for funds subject to the group fee, FMR agreed to voluntarily waive fees over a specified period of time in amounts designed to account for assets converted from certain funds to certain collective investment trusts.
The Board also noted that, in 2013, the ad hoc Committee on Management Fees was formed to conduct an in-depth review of the management fee rates of Fidelity's active equity mutual funds. The Committee focused on the following areas: (i) standard fee structures; (ii) research consumption and trading evolution; (iii) management fee competitiveness/profitability by category; and (iv) factors that drive institutional pricing.
Based on its review, the Board concluded that the fund's management fee is fair and reasonable in light of the services that the fund receives and the other factors considered.
Total Expense Ratio. In its review of each class's total expense ratio, the Board considered the fund's management fee rate as well as other fund or class expenses, as applicable, such as transfer agent fees, pricing and bookkeeping fees, fund-paid 12b-1 fees, and custodial, legal, and audit fees. The Board noted the impact of the fund's performance adjustment. The Board also noted that Fidelity may agree to waive fees and expenses from time to time, and the extent to which, if any, it has done so for the fund. As part of its review, the Board also considered the current and historical total expense ratios of each class of the fund compared to competitive fund median expenses. Each class of the fund is compared to those funds and classes in the Total Mapped Group (used by the Board for management fee comparisons) that have a similar sales load structure.
The Board noted that the total expense ratio of each of Class A, Class C, Class I, and the retail class ranked below the competitive median for the 12-month period ended June 30, 2018, and the total expense ratio of Class M ranked above the competitive median for the 12-month period ended June 30, 2018. The Board considered that, in general, various factors can affect total expense ratios. The Board noted that the total expense ratio of Class M was above the competitive median primarily because of higher 12b-1 fees on Class M as compared to most competitor funds. Class M has a higher 12b-1 fee, but a lower front-end sales charge, than traditionally priced front-end sales charge classes. The Board considered that Class M is primarily sold load-waived to retirement plans and intermediary wrap programs where its 0.50% 12b-1 fee is comparable to competing no-load, higher 12b-1 fee classes designed specifically for retirement plans and wrap programs. The Board noted that, when compared with competitor funds that charge a 0.50% 12b-1 fee, the total expense ratio of Class M is below median. The Board noted that the fund offers multiple classes, each of which has a different sales load and 12b-1 fee structure, and that the multiple structures are intended to offer a range of pricing options for the intermediary market. The Board also noted that the total expense ratios of the classes vary primarily by the level of their 12b-1 fees, although differences in transfer agent fees may also cause expenses to vary from class to class.
Fees Charged to Other Fidelity Clients. The Board also considered Fidelity fee structures and other information with respect to clients of Fidelity, such as other funds advised or subadvised by Fidelity, pension plan clients, and other institutional clients with similar mandates. The Board noted that a joint ad hoc committee created by it and the boards of other Fidelity funds periodically reviews and compares Fidelity's institutional investment advisory business with its business of providing services to the Fidelity funds and also noted the most recent findings of the committee. The Board noted that the committee's review included a consideration of the differences in services provided, fees charged, and costs incurred, as well as competition in the markets serving the different categories of clients.
Based on its review of total expense ratios and fees charged to other Fidelity clients, the Board concluded that the total expense ratio of each class of the fund was reasonable in light of the services that the fund and its shareholders receive and the other factors considered.
Costs of the Services and Profitability. The Board considered the revenues earned and the expenses incurred by Fidelity in conducting the business of developing, marketing, distributing, managing, administering and servicing the fund and servicing the fund's shareholders. The Board also considered the level of Fidelity's profits in respect of all the Fidelity funds.
On an annual basis, Fidelity presents to the Board information about the profitability of its relationships with the fund. Fidelity calculates profitability information for each fund, as well as aggregate profitability information for groups of Fidelity funds and all Fidelity funds, using a series of detailed revenue and cost allocation methodologies which originate with the books and records of Fidelity on which Fidelity's audited financial statements are based. The Audit Committee of the Board reviews any significant changes from the prior year's methodologies.
PricewaterhouseCoopers LLP (PwC), auditor to Fidelity and certain Fidelity funds, has been engaged annually by the Board as part of the Board's assessment of Fidelity's profitability analysis. PwC's engagement includes the review and assessment of the methodologies used by Fidelity in determining the revenues and expenses attributable to Fidelity's mutual fund business, and completion of agreed-upon procedures in respect of the mathematical accuracy of the fund profitability information and its conformity to established allocation methodologies. After considering PwC's reports issued under the engagement and information provided by Fidelity, the Board concluded that while other allocation methods may also be reasonable, Fidelity's profitability methodologies are reasonable in all material respects.
The Board also reviewed Fidelity's non-fund businesses and potential indirect benefits such businesses may have received as a result of their association with Fidelity's mutual fund business (i.e., fall-out benefits) as well as cases where Fidelity's affiliates may benefit from the fund's business. The Board noted that changes to fall-out benefits year-over-year reflect business developments at Fidelity's various businesses.
The Board considered the costs of the services provided by and the profits realized by Fidelity in connection with the operation of the fund and was satisfied that the profitability was not excessive.
Economies of Scale. The Board considered whether there have been economies of scale in respect of the management of the Fidelity funds, whether the Fidelity funds (including the fund) have appropriately benefited from any such economies of scale, and whether there is potential for realization of any further economies of scale. The Board considered the extent to which the fund will benefit from economies of scale as assets grow through increased services to the fund, through waivers or reimbursements, or through fee or expense ratio reductions. The Board also noted that a committee (the Economies of Scale Committee) created by it and the boards of other Fidelity funds periodically analyzes whether Fidelity attains economies of scale in respect of the management and servicing of the Fidelity funds, whether the Fidelity funds have appropriately benefited from such economies of scale, and whether there is potential for realization of any further economies of scale.
The Board recognized that the fund's management contract incorporates a "group fee" structure, which provides for lower group fee rates as total group assets increase, and for higher group fee rates as total group assets decrease (with "group assets" defined to include fund assets under FMR's management plus the assets of sector funds previously under FMR's management). FMR calculates the group fee rates based on a tiered asset "breakpoint" schedule that varies based on asset class. The Board considered that the group fee is designed to deliver the benefits of economies of scale to fund shareholders when total Fidelity fund assets increase, even if assets of any particular fund are unchanged or have declined, because some portion of Fidelity's costs are attributable to services provided to all Fidelity funds, and all funds benefit if those costs can be allocated among more assets. The Board concluded that, given the group fee structure, fund shareholders will benefit from lower management fees as group assets increase at the fund complex level, regardless of whether Fidelity achieves any such economies of scale.
The Board concluded, taking into account the analysis of the Economies of Scale Committee, that economies of scale, if any, are being appropriately shared between fund shareholders and Fidelity.
Additional Information Requested by the Board. In order to develop fully the factual basis for consideration of the Fidelity funds' advisory contracts, the Board requested and received additional information on certain topics, including: (i) fund performance trends, in particular the underperformance of certain funds, and Fidelity's long-term strategies for certain funds; (ii) Fidelity's fund profitability methodology, profitability trends for certain funds, and the impact of certain factors on fund profitability results; (iii) metrics for evaluating index fund and ETF performance and information about ETF trading characteristics; (iv) the methodology with respect to the evaluation of competitive fund data and peer group classifications and fee comparisons; (v) the expense structures for different funds and classes; (vi) information regarding other accounts managed by Fidelity, including collective investment trusts; and (vii) Fidelity's philosophies and strategies for evaluating funds and classes with lower or declining asset levels.
Based on its evaluation of all of the conclusions noted above, and after considering all factors it believed relevant, the Board concluded that the advisory fee arrangements are fair and reasonable, and that the fund's Advisory Contracts should be renewed.
ILS-SANN-0619
1.815078.113
Fidelity® International Small Cap Fund
Semi-Annual Report April 30, 2019 Includes Fidelity and Fidelity Advisor share classes |
|
Beginning on January 1, 2021, as permitted by regulations adopted by the Securities and Exchange Commission, paper copies of a fund’s shareholder reports will no longer be sent by mail, unless you specifically request paper copies of the reports from the fund or from your financial intermediary, such as a financial advisor, broker-dealer or bank. Instead, the reports will be made available on a website, and you will be notified by mail each time a report is posted and provided with a website link to access the report.
If you already elected to receive shareholder reports electronically, you will not be affected by this change and you need not take any action. You may elect to receive shareholder reports and other communications from a fund electronically, by contacting your financial intermediary. For Fidelity customers, visit Fidelity's web site or call Fidelity using the contact information listed below.
You may elect to receive all future reports in paper free of charge. If you wish to continue receiving paper copies of your shareholder reports, you may contact your financial intermediary or, if you are a Fidelity customer, visit Fidelity’s website, or call Fidelity at the applicable toll-free number listed below. Your election to receive reports in paper will apply to all funds held with the fund complex/your financial intermediary.
| Account Type | Website | Phone Number |
| Brokerage, Mutual Fund, or Annuity Contracts: | fidelity.com/mailpreferences | 1-800-343-3548 |
| Employer Provided Retirement Accounts: | netbenefits.fidelity.com/preferences (choose 'no' under Required Disclosures to continue to print) | 1-800-343-0860 |
| Advisor Sold Accounts Serviced Through Your Financial Intermediary: | Contact Your Financial Intermediary | Your Financial Intermediary's phone number |
| Advisor Sold Accounts Serviced by Fidelity: | institutional.fidelity.com | 1-877-208-0098 |
Contents
To view a fund's proxy voting guidelines and proxy voting record for the 12-month period ended June 30, visit http://www.fidelity.com/proxyvotingresults or visit the Securities and Exchange Commission's (SEC) web site at http://www.sec.gov.
You may also call 1-800-544-8544 if you’re an individual investing directly with Fidelity, call 1-800-835-5092 if you’re a plan sponsor or participant with Fidelity as your recordkeeper or call 1-877-208-0098 on institutional accounts or if you’re an advisor or invest through one to request a free copy of the proxy voting guidelines.
Standard & Poor's, S&P and S&P 500 are registered service marks of The McGraw-Hill Companies, Inc. and have been licensed for use by Fidelity Distributors Corporation.
Other third-party marks appearing herein are the property of their respective owners.
All other marks appearing herein are registered or unregistered trademarks or service marks of FMR LLC or an affiliated company. © 2019 FMR LLC. All rights reserved.
This report and the financial statements contained herein are submitted for the general information of the shareholders of the Fund. This report is not authorized for distribution to prospective investors in the Fund unless preceded or accompanied by an effective prospectus.
A fund files its complete schedule of portfolio holdings with the SEC for the first and third quarters of each fiscal year on Form N-PORT. Forms N-PORT are available on the SEC’s web site at http://www.sec.gov. A fund's Forms N-PORT may be reviewed and copied at the SEC’s Public Reference Room in Washington, DC. Information regarding the operation of the SEC's Public Reference Room may be obtained by calling 1-800-SEC-0330.
For a complete list of a fund's portfolio holdings, view the most recent holdings listing, semiannual report, or annual report on Fidelity's web site at http://www.fidelity.com, http://www.institutional.fidelity.com, or http://www.401k.com, as applicable.
NOT FDIC INSURED •MAY LOSE VALUE •NO BANK GUARANTEE
Neither the Fund nor Fidelity Distributors Corporation is a bank.
Investment Summary (Unaudited)
Geographic Diversification (% of fund's net assets)
| As of April 30, 2019 |
| | Japan | 23.5% |
| | United Kingdom | 14.2% |
| | Canada | 5.7% |
| | United States of America* | 5.3% |
| | Australia | 4.8% |
| | Cayman Islands | 4.1% |
| | Taiwan | 3.8% |
| | Netherlands | 3.3% |
| | France | 3.3% |
| | Other | 32.0% |
* Includes Short-Term investments and Net Other Assets (Liabilities).
Percentages are based on country or territory of incorporation and are adjusted for the effect of futures contracts, if applicable.
Asset Allocation as of April 30, 2019
| | % of fund's net assets |
| Stocks | 94.7 |
| Short-Term Investments and Net Other Assets (Liabilities) | 5.3 |
Top Ten Stocks as of April 30, 2019
| | % of fund's net assets |
| Luxfer Holdings PLC sponsored (United Kingdom, Machinery) | 1.1 |
| JSR Corp. (Japan, Chemicals) | 1.1 |
| Cineworld Group PLC (United Kingdom, Entertainment) | 1.0 |
| SITC International Holdings Co. Ltd. (Cayman Islands, Marine) | 1.0 |
| S Foods, Inc. (Japan, Food Products) | 1.0 |
| John Wood Group PLC (United Kingdom, Energy Equipment & Services) | 0.9 |
| Mytilineos Holdings SA (Greece, Industrial Conglomerates) | 0.9 |
| GUD Holdings Ltd. (Australia, Auto Components) | 0.9 |
| Paramount Bed Holdings Co. Ltd. (Japan, Health Care Equipment & Supplies) | 0.9 |
| Arata Corp. (Japan, Distributors) | 0.8 |
| | 9.6 |
Top Market Sectors as of April 30, 2019
| | % of fund's net assets |
| Industrials | 20.4 |
| Consumer Discretionary | 14.2 |
| Financials | 13.7 |
| Information Technology | 9.0 |
| Consumer Staples | 8.9 |
| Materials | 8.8 |
| Real Estate | 6.7 |
| Health Care | 6.4 |
| Energy | 3.3 |
| Communication Services | 2.5 |
Schedule of Investments April 30, 2019 (Unaudited)
Showing Percentage of Net Assets
| Common Stocks - 94.2% | | | |
| | | Shares | Value |
| Australia - 4.8% | | | |
| Aub Group Ltd. | | 831,940 | $7,413,058 |
| Challenger Ltd. | | 1,628,192 | 9,434,866 |
| GUD Holdings Ltd. | | 2,349,411 | 19,576,488 |
| Hansen Technologies Ltd. | | 4,090,611 | 8,679,865 |
| Imdex Ltd. | | 11,745,983 | 8,611,544 |
| Inghams Group Ltd. (a) | | 5,593,948 | 17,548,369 |
| Nanosonics Ltd. (b) | | 3,273,157 | 11,398,615 |
| Pact Group Holdings Ltd. | | 3,229,912 | 5,988,317 |
| Reckon Ltd. | | 5,193,683 | 2,581,207 |
| Servcorp Ltd. (c) | | 4,998,615 | 10,853,223 |
| SomnoMed Ltd. (a)(b) | | 2,686,358 | 3,314,059 |
|
| TOTAL AUSTRALIA | | | 105,399,611 |
|
| Austria - 2.0% | | | |
| IMMOFINANZ Immobilien Anlagen AG | | 608,174 | 15,586,624 |
| Mayr-Melnhof Karton AG | | 89,900 | 11,635,994 |
| Wienerberger AG | | 720,100 | 16,524,809 |
|
| TOTAL AUSTRIA | | | 43,747,427 |
|
| Belgium - 0.6% | | | |
| Barco NV | | 70,083 | 12,451,047 |
| Bermuda - 1.0% | | | |
| China Resource Gas Group Ltd. | | 2,146,000 | 9,930,119 |
| Hiscox Ltd. | | 605,125 | 13,209,249 |
|
| TOTAL BERMUDA | | | 23,139,368 |
|
| Brazil - 1.5% | | | |
| Estacio Participacoes SA | | 2,557,200 | 17,725,816 |
| Sul America SA unit | | 1,909,800 | 15,196,185 |
|
| TOTAL BRAZIL | | | 32,922,001 |
|
| Canada - 5.7% | | | |
| Dorel Industries, Inc. Class B (sub. vtg.) | | 426,803 | 3,756,070 |
| ECN Capital Corp. | | 2,622,700 | 8,398,435 |
| Genesis Land Development Corp. (c) | | 2,346,922 | 4,256,938 |
| Lassonde Industries, Inc. Class A (sub. vtg.) | | 130,869 | 16,753,029 |
| McCoy Global, Inc. (b) | | 1,331,570 | 795,145 |
| North West Co., Inc. | | 828,900 | 17,509,793 |
| Open Text Corp. | | 352,096 | 13,535,078 |
| Pinnacle Renewable Energy, Inc. | | 965,825 | 8,773,673 |
| Richelieu Hardware Ltd. | | 590,200 | 9,167,770 |
| Total Energy Services, Inc. | | 620,900 | 4,541,927 |
| TransForce, Inc. | | 368,100 | 12,089,572 |
| Western Forest Products, Inc. | | 11,630,900 | 16,321,633 |
| Whitecap Resources, Inc. | | 2,457,353 | 9,886,641 |
|
| TOTAL CANADA | | | 125,785,704 |
|
| Cayman Islands - 4.1% | | | |
| AMVIG Holdings Ltd. | | 32,132,000 | 7,782,327 |
| Best Pacific International Holdings Ltd. | | 17,964,000 | 6,549,184 |
| China Metal Recycling (Holdings) Ltd. (b)(d) | | 436,800 | 1 |
| Haitian International Holdings Ltd. | | 3,878,000 | 9,708,842 |
| Pico Far East Holdings Ltd. | | 26,394,000 | 9,656,177 |
| Precision Tsugami China Corp. Ltd. | | 8,896,000 | 9,502,917 |
| SITC International Holdings Co. Ltd. | | 21,248,000 | 22,562,186 |
| Value Partners Group Ltd. | | 14,996,000 | 11,278,350 |
| Xingda International Holdings Ltd. | | 44,177,909 | 14,022,409 |
|
| TOTAL CAYMAN ISLANDS | | | 91,062,393 |
|
| China - 1.2% | | | |
| Qingdao Port International Co. Ltd. (H Shares) (b)(e) | | 21,709,000 | 15,081,844 |
| Weifu High-Technology Group Co. Ltd. (B Shares) | | 6,122,887 | 11,949,495 |
|
| TOTAL CHINA | | | 27,031,339 |
|
| Denmark - 1.4% | | | |
| Jyske Bank A/S (Reg.) | | 236,103 | 9,509,670 |
| Scandinavian Tobacco Group A/S (e) | | 823,128 | 9,800,173 |
| Spar Nord Bank A/S | | 1,407,326 | 12,093,663 |
|
| TOTAL DENMARK | | | 31,403,506 |
|
| Finland - 2.8% | | | |
| Ahlstrom-Munksjo OYJ | | 841,398 | 12,645,741 |
| Asiakastieto Group Oyj (a)(e) | | 527,523 | 15,856,751 |
| Cramo Oyj (B Shares) | | 476,610 | 10,023,108 |
| Kojamo OYJ | | 1,016,800 | 12,065,886 |
| Olvi PLC (A Shares) | | 310,138 | 11,496,468 |
|
| TOTAL FINLAND | | | 62,087,954 |
|
| France - 3.3% | | | |
| Altarea SCA | | 65,230 | 13,783,715 |
| Maisons du Monde SA (e) | | 561,407 | 12,077,149 |
| Rexel SA | | 963,900 | 12,951,701 |
| The Vicat Group | | 226,256 | 11,952,507 |
| Thermador Groupe SA | | 167,666 | 9,553,153 |
| Wendel SA | | 84,835 | 11,741,626 |
|
| TOTAL FRANCE | | | 72,059,851 |
|
| Germany - 2.0% | | | |
| Bertrandt AG | | 140,300 | 10,936,553 |
| JOST Werke AG (e) | | 47,467 | 1,748,901 |
| SHW Group (c) | | 329,939 | 7,660,233 |
| Takkt AG | | 588,300 | 9,250,919 |
| Talanx AG | | 337,500 | 13,483,595 |
|
| TOTAL GERMANY | | | 43,080,201 |
|
| Greece - 0.9% | | | |
| Mytilineos Holdings SA | | 1,813,916 | 19,663,328 |
| Hong Kong - 2.1% | | | |
| Dah Sing Banking Group Ltd. | | 8,769,200 | 16,767,540 |
| Far East Horizon Ltd. | | 7,881,000 | 8,750,192 |
| Magnificent Hotel Investment Ltd. | | 302,094,000 | 7,239,658 |
| Sino Land Ltd. | | 7,409,193 | 13,033,712 |
|
| TOTAL HONG KONG | | | 45,791,102 |
|
| India - 1.2% | | | |
| Embassy Office Parks (REIT) (b) | | 1,498,000 | 6,891,742 |
| LIC Housing Finance Ltd. | | 1,175,800 | 8,386,271 |
| Torrent Pharmaceuticals Ltd. | | 431,558 | 11,103,260 |
|
| TOTAL INDIA | | | 26,381,273 |
|
| Indonesia - 0.6% | | | |
| PT ACE Hardware Indonesia Tbk | | 57,526,400 | 6,660,952 |
| PT Media Nusantara Citra Tbk | | 100,800,300 | 6,649,283 |
|
| TOTAL INDONESIA | | | 13,310,235 |
|
| Ireland - 1.6% | | | |
| Irish Residential Properties REIT PLC | | 7,510,700 | 13,309,922 |
| Mincon Group PLC | | 7,331,044 | 9,373,649 |
| Origin Enterprises PLC | | 920,300 | 5,687,469 |
| United Drug PLC (United Kingdom) | | 904,049 | 7,745,241 |
|
| TOTAL IRELAND | | | 36,116,281 |
|
| Italy - 1.6% | | | |
| Banca Generali SpA | | 508,200 | 14,341,128 |
| Banco di Desio e della Brianza SpA | | 2,376,445 | 5,410,804 |
| Recordati SpA | | 378,700 | 15,286,750 |
|
| TOTAL ITALY | | | 35,038,682 |
|
| Japan - 23.5% | | | |
| A/S One Corp. | | 144,400 | 11,524,000 |
| Aeon Delight Co. Ltd. | | 334,400 | 11,242,228 |
| Arata Corp. | | 515,000 | 18,377,171 |
| Arc Land Sakamoto Co. Ltd. | | 1,043,000 | 13,510,921 |
| Aucnet, Inc. | | 832,900 | 9,435,969 |
| Broadleaf Co. Ltd. | | 727,800 | 3,730,632 |
| Central Automotive Products Ltd. | | 339,100 | 5,181,096 |
| DaikyoNishikawa Corp. | | 1,060,500 | 10,634,037 |
| Daiwa Industries Ltd. | | 1,179,400 | 13,732,051 |
| Dexerials Corp. | | 1,635,600 | 10,307,385 |
| Funai Soken Holdings, Inc. (f) | | 63,080 | 1,626,903 |
| GMO Internet, Inc. | | 1,016,000 | 15,678,477 |
| Hitachi High-Technologies Corp. | | 224,700 | 9,984,874 |
| Iida Group Holdings Co. Ltd. | | 585,851 | 9,882,078 |
| Isuzu Motors Ltd. | | 1,133,700 | 16,237,877 |
| Japan Meat Co. Ltd. | | 691,300 | 10,599,582 |
| JSR Corp. (g) | | 1,565,500 | 23,722,465 |
| Kenedix, Inc. (g) | | 2,082,700 | 9,871,768 |
| KH Neochem Co. Ltd. | | 68,000 | 1,968,670 |
| Kirindo Holdings Co. Ltd. (c) | | 647,909 | 10,015,704 |
| Meitec Corp. | | 244,000 | 11,302,482 |
| Mitani Shoji Co. Ltd. (g) | | 288,000 | 15,021,141 |
| Morinaga & Co. Ltd. | | 279,200 | 11,592,082 |
| Nihon Parkerizing Co. Ltd. | | 1,230,000 | 15,977,468 |
| Nishimoto Co. Ltd. (g) | | 242,900 | 8,743,920 |
| NSD Co. Ltd. | | 292,600 | 7,241,781 |
| Otsuka Corp. | | 273,400 | 10,725,419 |
| PALTAC Corp. | | 294,500 | 16,153,283 |
| Paramount Bed Holdings Co. Ltd. | | 415,900 | 19,489,187 |
| Persol Holdings Co., Ltd. | | 747,700 | 13,988,122 |
| Renesas Electronics Corp. (b) | | 3,010,500 | 16,026,092 |
| Ricoh Leasing Co. Ltd. | | 262,900 | 7,646,627 |
| S Foods, Inc. | | 625,600 | 21,509,475 |
| San-Ai Oil Co. Ltd. | | 1,480,700 | 12,468,213 |
| Santen Pharmaceutical Co. Ltd. | | 729,800 | 11,098,175 |
| Shinsei Bank Ltd. | | 1,077,000 | 14,908,515 |
| Ship Healthcare Holdings, Inc. | | 338,700 | 13,880,026 |
| Taiheiyo Cement Corp. | | 369,100 | 11,828,960 |
| TKC Corp. | | 277,100 | 10,808,380 |
| Toshiba Plant Systems & Services Corp. | | 762,200 | 13,629,897 |
| Tsuruha Holdings, Inc. | | 153,500 | 13,049,464 |
| VT Holdings Co. Ltd. | | 1,655,600 | 6,658,367 |
| Welcia Holdings Co. Ltd. | | 89,300 | 3,507,227 |
| Yamada Consulting Group Co. Ltd. | | 580,680 | 12,578,490 |
|
| TOTAL JAPAN | | | 517,096,681 |
|
| Korea (South) - 1.0% | | | |
| Hyundai Fire & Marine Insurance Co. Ltd. | | 401,226 | 13,184,504 |
| NS Shopping Co. Ltd. | | 755,079 | 9,276,234 |
|
| TOTAL KOREA (SOUTH) | | | 22,460,738 |
|
| Luxembourg - 0.3% | | | |
| Shurgard Self Storage Europe SARL | | 185,677 | 6,143,532 |
| Mexico - 0.9% | | | |
| Credito Real S.A.B. de CV | | 6,947,800 | 7,927,149 |
| Genomma Lab Internacional SA de CV (b) | | 13,814,100 | 11,105,056 |
|
| TOTAL MEXICO | | | 19,032,205 |
|
| Netherlands - 3.3% | | | |
| Amsterdam Commodities NV | | 530,855 | 12,086,761 |
| Arcadis NV (a) | | 716,689 | 13,528,600 |
| Arcadis NV rights (b)(g) | | 716,689 | 377,804 |
| Basic-Fit NV (b)(e) | | 255,500 | 9,055,574 |
| Intertrust NV (e) | | 616,900 | 11,700,283 |
| Philips Lighting NV (e) | | 370,000 | 11,092,736 |
| RHI Magnesita NV | | 230,610 | 14,238,802 |
|
| TOTAL NETHERLANDS | | | 72,080,560 |
|
| New Zealand - 1.1% | | | |
| Air New Zealand Ltd. | | 7,136,271 | 12,797,557 |
| EBOS Group Ltd. | | 818,065 | 11,703,580 |
|
| TOTAL NEW ZEALAND | | | 24,501,137 |
|
| Norway - 0.5% | | | |
| ABG Sundal Collier ASA | | 9,702,926 | 4,836,027 |
| Skandiabanken ASA (e) | | 736,574 | 7,248,391 |
|
| TOTAL NORWAY | | | 12,084,418 |
|
| Philippines - 0.8% | | | |
| Century Pacific Food, Inc. | | 26,147,000 | 7,749,130 |
| Robinsons Land Corp. | | 20,418,600 | 9,664,909 |
|
| TOTAL PHILIPPINES | | | 17,414,039 |
|
| Romania - 0.6% | | | |
| Banca Transilvania SA | | 24,554,661 | 12,762,358 |
| Singapore - 1.9% | | | |
| Boustead Singapore Ltd. | | 10,688,669 | 6,326,284 |
| Hour Glass Ltd. | | 9,904,600 | 5,716,573 |
| Mapletree Industrial (REIT) | | 10,432,325 | 15,800,742 |
| Wing Tai Holdings Ltd. | | 9,498,500 | 14,316,539 |
|
| TOTAL SINGAPORE | | | 42,160,138 |
|
| South Africa - 0.4% | | | |
| Clicks Group Ltd. | | 600,218 | 8,209,623 |
| Spain - 0.1% | | | |
| Laboratorios Farmaceuticos ROVI SA | | 75,986 | 1,568,157 |
| Sweden - 2.1% | | | |
| AddTech AB (B Shares) | | 443,719 | 10,792,517 |
| Coor Service Management Holding AB (e) | | 829,400 | 7,169,826 |
| Dustin Group AB (e) | | 1,697,479 | 15,214,713 |
| Granges AB | | 1,144,421 | 12,425,528 |
|
| TOTAL SWEDEN | | | 45,602,584 |
|
| Taiwan - 3.8% | | | |
| King's Town Bank | | 10,796,000 | 11,546,431 |
| Lumax International Corp. Ltd. | | 4,466,600 | 10,392,484 |
| Makalot Industrial Co. Ltd. | | 1,153,540 | 7,951,072 |
| Sporton International, Inc. | | 2,571,740 | 15,229,707 |
| Test Research, Inc. | | 6,278,000 | 10,929,920 |
| Tripod Technology Corp. | | 4,233,000 | 13,547,463 |
| United Microelectronics Corp. | | 20,968,000 | 9,142,758 |
| Yung Chi Paint & Varnish Manufacturing Co. Ltd. | | 2,243,000 | 5,327,688 |
|
| TOTAL TAIWAN | | | 84,067,523 |
|
| Thailand - 1.2% | | | |
| Star Petroleum Refining PCL | | 47,994,800 | 15,939,371 |
| TISCO Financial Group PCL | | 4,198,500 | 11,016,664 |
|
| TOTAL THAILAND | | | 26,956,035 |
|
| Turkey - 0.1% | | | |
| Aygaz A/S | | 2,129,000 | 3,293,280 |
| United Kingdom - 14.2% | | | |
| Alliance Pharma PLC | | 13,043,065 | 13,368,411 |
| Bond International Software PLC (b)(d) | | 899,666 | 12 |
| Cineworld Group PLC | | 5,534,180 | 22,948,695 |
| Close Brothers Group PLC | | 427,566 | 8,653,115 |
| Countrywide PLC (b) | | 60,307,977 | 5,111,704 |
| Diploma PLC | | 516,151 | 10,768,974 |
| Elementis PLC | | 6,428,125 | 13,621,197 |
| Informa PLC | | 393,024 | 3,992,401 |
| ITE Group PLC | | 15,051,230 | 14,209,806 |
| John Wood Group PLC | | 3,393,500 | 20,820,208 |
| Knights Group Holdings PLC | | 2,524,402 | 9,315,851 |
| Luxfer Holdings PLC sponsored | | 1,042,909 | 25,040,249 |
| McColl's Retail Group PLC (c) | | 9,140,781 | 10,238,918 |
| Mears Group PLC | | 3,745,740 | 11,722,668 |
| Melrose Industries PLC | | 4,079,170 | 10,755,499 |
| Micro Focus International PLC | | 631,026 | 15,945,340 |
| Moneysupermarket.com Group PLC | | 2,590,579 | 12,286,204 |
| PayPoint PLC | | 732,711 | 9,611,879 |
| Sabre Insurance Group PLC (e) | | 2,852,122 | 9,892,984 |
| Spectris PLC | | 411,891 | 14,759,669 |
| Ten Entertainment Group PLC (c) | | 4,277,819 | 13,053,166 |
| The Weir Group PLC | | 705,938 | 15,276,414 |
| Topps Tiles PLC | | 6,514,537 | 6,405,197 |
| Tullett Prebon PLC | | 4,288,044 | 15,723,605 |
| Ultra Electronics Holdings PLC | | 393,345 | 8,165,716 |
| Volution Group PLC | | 5,418,401 | 12,223,479 |
|
| TOTAL UNITED KINGDOM | | | 313,911,361 |
|
| TOTAL COMMON STOCKS | | | |
| (Cost $1,991,501,892) | | | 2,075,815,672 |
|
| Nonconvertible Preferred Stocks - 0.5% | | | |
| Brazil - 0.5% | | | |
| Banco ABC Brasil SA | | | |
| (Cost $8,601,852) | | 2,151,426 | 10,671,810 |
|
| Money Market Funds - 5.8% | | | |
| Fidelity Cash Central Fund, 2.49% (h) | | 104,176,063 | 104,196,898 |
| Fidelity Securities Lending Cash Central Fund 2.49% (h)(i) | | 24,192,334 | 24,194,753 |
| TOTAL MONEY MARKET FUNDS | | | |
| (Cost $128,382,752) | | | 128,391,651 |
| TOTAL INVESTMENT IN SECURITIES - 100.5% | | | |
| (Cost $2,128,486,496) | | | 2,214,879,133 |
| NET OTHER ASSETS (LIABILITIES) - (0.5)% | | | (11,499,037) |
| NET ASSETS - 100% | | | $2,203,380,096 |
Categorizations in the Schedule of Investments are based on country or territory of incorporation.
Legend
(a) Security or a portion of the security is on loan at period end.
(b) Non-income producing
(c) Affiliated company
(d) Level 3 security
(e) Security exempt from registration under Rule 144A of the Securities Act of 1933. These securities may be resold in transactions exempt from registration, normally to qualified institutional buyers. At the end of the period, the value of these securities amounted to $125,939,325 or 5.7% of net assets.
(f) A portion of the security sold on a delayed delivery basis.
(g) Security or a portion of the security purchased on a delayed delivery or when-issued basis.
(h) Affiliated fund that is generally available only to investment companies and other accounts managed by Fidelity Investments. The rate quoted is the annualized seven-day yield of the fund at period end. A complete unaudited listing of the fund's holdings as of its most recent quarter end is available upon request. In addition, each Fidelity Central Fund's financial statements are available on the SEC's website or upon request.
(i) Investment made with cash collateral received from securities on loan.
Affiliated Central Funds
Information regarding fiscal year to date income earned by the Fund from investments in Fidelity Central Funds is as follows:
| Fund | Income earned |
| Fidelity Cash Central Fund | $1,071,283 |
| Fidelity Securities Lending Cash Central Fund | 152,540 |
| Total | $1,223,823 |
Amounts in the income column in the above table include any capital gain distributions from underlying funds, which are presented in the corresponding line-item in the Statement of Operations, if applicable.
Other Affiliated Issuers
An affiliated company is a company in which the Fund has ownership of at least 5% of the voting securities. Fiscal year to date transactions with companies which are or were affiliates are as follows:
| Affiliate | Value, beginning of period | Purchases | Sales Proceeds | Dividend Income | Realized Gain (loss) | Change in Unrealized appreciation (depreciation) | Value, end of period |
| Genesis Land Development Corp. | $5,698,551 | $188,474 | $-- | $-- | $-- | $(1,630,087) | $4,256,938 |
| Kirindo Holdings Co. Ltd. | 9,066,764 | -- | -- | 92,295 | -- | 948,940 | 10,015,704 |
| Knights Group Holdings PLC | 9,077,384 | 26,190 | 4,677,615 | 22,006 | 2,113,652 | 2,776,240 | -- |
| McColl's Retail Group PLC | 11,518,286 | 1,658,146 | -- | 70,711 | -- | (2,937,514) | 10,238,918 |
| Servcorp Ltd. | 8,399,066 | 3,313,084 | -- | 350,414 | -- | (858,927) | 10,853,223 |
| SHW Group | 6,787,336 | 1,325,267 | -- | -- | -- | (452,370) | 7,660,233 |
| Ten Entertainment Group PLC | 11,133,306 | 1,307,668 | -- | 159,645 | -- | 612,192 | 13,053,166 |
| Total | $61,680,693 | $7,818,829 | $4,677,615 | $695,071 | $2,113,652 | $(1,541,526) | $56,078,182 |
Investment Valuation
The following is a summary of the inputs used, as of April 30, 2019, involving the Fund's assets and liabilities carried at fair value. The inputs or methodology used for valuing securities may not be an indication of the risk associated with investing in those securities. For more information on valuation inputs, and their aggregation into the levels used below, please refer to the Investment Valuation section in the accompanying Notes to Financial Statements.
| | Valuation Inputs at Reporting Date: |
| Description | Total | Level 1 | Level 2 | Level 3 |
| Investments in Securities: | | | | |
| Equities: | | | | |
| Communication Services | $57,456,362 | $57,456,362 | $-- | $-- |
| Consumer Discretionary | 312,562,657 | 297,347,944 | 15,214,713 | -- |
| Consumer Staples | 196,097,187 | 196,097,187 | -- | -- |
| Energy | 73,225,178 | 73,225,178 | -- | -- |
| Financials | 301,432,812 | 301,432,812 | -- | -- |
| Health Care | 142,584,517 | 130,880,937 | 11,703,580 | -- |
| Industrials | 451,472,628 | 433,510,285 | 17,962,343 | -- |
| Information Technology | 197,168,135 | 188,025,365 | 9,142,758 | 12 |
| Materials | 190,573,651 | 178,148,122 | 12,425,528 | 1 |
| Real Estate | 150,690,956 | 150,690,956 | -- | -- |
| Utilities | 13,223,399 | 13,223,399 | -- | -- |
| Money Market Funds | 128,391,651 | 128,391,651 | -- | -- |
| Total Investments in Securities: | $2,214,879,133 | $2,148,430,198 | $66,448,922 | $13 |
See accompanying notes which are an integral part of the financial statements.
Financial Statements
Statement of Assets and Liabilities
| | | April 30, 2019 (Unaudited) |
| Assets | | |
Investment in securities, at value (including securities loaned of $23,003,140) — See accompanying schedule:
Unaffiliated issuers (cost $1,929,804,165) | $2,030,409,300 | |
| Fidelity Central Funds (cost $128,382,752) | 128,391,651 | |
| Other affiliated issuers (cost $70,299,579) | 56,078,182 | |
| Total Investment in Securities (cost $2,128,486,496) | | $2,214,879,133 |
| Foreign currency held at value (cost $2,745,564) | | 2,748,815 |
| Receivable for investments sold | | |
| Regular delivery | | 4,956,349 |
| Delayed delivery | | 66,955 |
| Receivable for fund shares sold | | 2,741,712 |
| Dividends receivable | | 14,715,608 |
| Distributions receivable from Fidelity Central Funds | | 231,873 |
| Prepaid expenses | | 1,062 |
| Other receivables | | 89,288 |
| Total assets | | 2,240,430,795 |
| Liabilities | | |
| Payable for investments purchased | | |
| Regular delivery | $3,266,534 | |
| Delayed delivery | 3,069,356 | |
| Payable for fund shares redeemed | 3,885,261 | |
| Accrued management fee | 1,765,638 | |
| Distribution and service plan fees payable | 53,118 | |
| Other affiliated payables | 403,909 | |
| Other payables and accrued expenses | 409,918 | |
| Collateral on securities loaned | 24,196,965 | |
| Total liabilities | | 37,050,699 |
| Net Assets | | $2,203,380,096 |
| Net Assets consist of: | | |
| Paid in capital | | $2,118,508,042 |
| Total distributable earnings (loss) | | 84,872,054 |
| Net Assets | | $2,203,380,096 |
| Net Asset Value and Maximum Offering Price | | |
| Class A: | | |
| Net Asset Value and redemption price per share ($108,655,520 ÷ 4,201,565 shares) | | $25.86 |
| Maximum offering price per share (100/94.25 of $25.86) | | $27.44 |
| Class M: | | |
| Net Asset Value and redemption price per share ($16,321,899 ÷ 633,436 shares) | | $25.77 |
| Maximum offering price per share (100/96.50 of $25.77) | | $26.70 |
| Class C: | | |
| Net Asset Value and offering price per share ($27,768,334 ÷ 1,114,179 shares)(a) | | $24.92 |
| International Small Cap: | | |
| Net Asset Value, offering price and redemption price per share ($1,287,911,519 ÷ 48,858,313 shares) | | $26.36 |
| Class I: | | |
| Net Asset Value, offering price and redemption price per share ($682,641,914 ÷ 25,735,111 shares) | | $26.53 |
| Class Z: | | |
| Net Asset Value, offering price and redemption price per share ($80,080,910 ÷ 3,021,761 shares) | | $26.50 |
(a) Redemption price per share is equal to net asset value less any applicable contingent deferred sales charge.
See accompanying notes which are an integral part of the financial statements.
Statement of Operations
| | | Six months ended April 30, 2019 (Unaudited) |
| Investment Income | | |
| Dividends (including $695,071 earned from other affiliated issuers) | | $33,626,919 |
| Income from Fidelity Central Funds | | 1,223,823 |
| Income before foreign taxes withheld | | 34,850,742 |
| Less foreign taxes withheld | | (2,725,035) |
| Total income | | 32,125,707 |
| Expenses | | |
| Management fee | | |
| Basic fee | $8,564,484 | |
| Performance adjustment | 1,114,116 | |
| Transfer agent fees | 1,882,047 | |
| Distribution and service plan fees | 345,143 | |
| Accounting and security lending fees | 450,950 | |
| Custodian fees and expenses | 244,284 | |
| Independent trustees' fees and expenses | 5,626 | |
| Registration fees | 144,343 | |
| Audit | 57,232 | |
| Legal | 2,911 | |
| Miscellaneous | 6,495 | |
| Total expenses before reductions | 12,817,631 | |
| Expense reductions | (74,838) | |
| Total expenses after reductions | | 12,742,793 |
| Net investment income (loss) | | 19,382,914 |
| Realized and Unrealized Gain (Loss) | | |
| Net realized gain (loss) on: | | |
| Investment securities: | | |
| Unaffiliated issuers | 6,772,632 | |
| Fidelity Central Funds | (56) | |
| Other affiliated issuers | 2,113,652 | |
| Foreign currency transactions | (144,314) | |
| Total net realized gain (loss) | | 8,741,914 |
| Change in net unrealized appreciation (depreciation) on: | | |
| Investment securities: | | |
| Unaffiliated issuers (net of increase in deferred foreign taxes of $179,321) | 102,482,579 | |
| Fidelity Central Funds | 92 | |
| Other affiliated issuers | (1,541,526) | |
| Assets and liabilities in foreign currencies | 42,470 | |
| Total change in net unrealized appreciation (depreciation) | | 100,983,615 |
| Net gain (loss) | | 109,725,529 |
| Net increase (decrease) in net assets resulting from operations | | $129,108,443 |
See accompanying notes which are an integral part of the financial statements.
Statement of Changes in Net Assets
| | Six months ended April 30, 2019 (Unaudited) | Year ended October 31, 2018 |
| Increase (Decrease) in Net Assets | | |
| Operations | | |
| Net investment income (loss) | $19,382,914 | $33,373,258 |
| Net realized gain (loss) | 8,741,914 | 76,767,034 |
| Change in net unrealized appreciation (depreciation) | 100,983,615 | (322,624,797) |
| Net increase (decrease) in net assets resulting from operations | 129,108,443 | (212,484,505) |
| Distributions to shareholders | (106,530,936) | (61,553,254) |
| Share transactions - net increase (decrease) | 213,524,361 | 477,734,571 |
| Redemption fees | – | 48,167 |
| Total increase (decrease) in net assets | 236,101,868 | 203,744,979 |
| Net Assets | | |
| Beginning of period | 1,967,278,228 | 1,763,533,249 |
| End of period | $2,203,380,096 | $1,967,278,228 |
See accompanying notes which are an integral part of the financial statements.
Financial Highlights
Fidelity International Small Cap Fund Class A
| | Six months ended (Unaudited) April 30, | Years endedOctober 31, | | | | |
| | 2019 | 2018 | 2017 | 2016 | 2015 | 2014 |
| Selected Per–Share Data | | | | | | |
| Net asset value, beginning of period | $25.78 | $29.24 | $23.81 | $22.69 | $24.98 | $26.34 |
| Income from Investment Operations | | | | | | |
| Net investment income (loss)A | .21 | .38 | .29 | .34 | .27 | .17 |
| Net realized and unrealized gain (loss) | 1.25 | (2.87) | 5.70 | 1.64 | 1.05 | (.89) |
| Total from investment operations | 1.46 | (2.49) | 5.99 | 1.98 | 1.32 | (.72) |
| Distributions from net investment income | (.38) | (.23) | (.28) | (.25) | (.16) | (.05) |
| Distributions from net realized gain | (1.00) | (.74) | (.29) | (.62) | (3.45) | (.60) |
| Total distributions | (1.38) | (.97) | (.57) | (.87) | (3.61) | (.65) |
| Redemption fees added to paid in capitalA | – | –B | .01 | .01 | –B | .01 |
| Net asset value, end of period | $25.86 | $25.78 | $29.24 | $23.81 | $22.69 | $24.98 |
| Total ReturnC,D,E | 6.11% | (8.83)% | 25.83% | 9.11% | 6.21% | (2.79)% |
| Ratios to Average Net AssetsF,G | | | | | | |
| Expenses before reductions | 1.50%H | 1.49% | 1.55% | 1.61% | 1.59% | 1.50% |
| Expenses net of fee waivers, if any | 1.50%H | 1.49% | 1.55% | 1.61% | 1.58% | 1.50% |
| Expenses net of all reductions | 1.49%H | 1.48% | 1.55% | 1.61% | 1.58% | 1.50% |
| Net investment income (loss) | 1.65%H | 1.33% | 1.11% | 1.50% | 1.18% | .65% |
| Supplemental Data | | | | | | |
| Net assets, end of period (000 omitted) | $108,656 | $80,395 | $63,459 | $36,480 | $28,238 | $24,572 |
| Portfolio turnover rateI | 28%H | 25% | 22% | 29% | 36% | 102% |
A Calculated based on average shares outstanding during the period.
B Amount represents less than $.005 per share.
C Total returns for periods of less than one year are not annualized.
D Total returns would have been lower if certain expenses had not been reduced during the applicable periods shown.
E Total returns do not include the effect of the sales charges.
F Fees and expenses of any underlying Fidelity Central Funds are not included in the Fund's expense ratio. The Fund indirectly bears its proportionate share of the expenses of any underlying Fidelity Central Funds.
G Expense ratios reflect operating expenses of the class. Expenses before reductions do not reflect amounts reimbursed by the investment adviser or reductions from brokerage service arrangements or reductions from other expense offset arrangements and do not represent the amount paid by the class during periods when reimbursements or reductions occur. Expenses net of fee waivers reflect expenses after reimbursement by the investment adviser but prior to reductions from brokerage service arrangements or other expense offset arrangements. Expenses net of all reductions represent the net expenses paid by the class.
H Annualized
I Amount does not include the portfolio activity of any underlying Fidelity Central Funds.
See accompanying notes which are an integral part of the financial statements.
Fidelity International Small Cap Fund Class M
| | Six months ended (Unaudited) April 30, | Years endedOctober 31, | | | | |
| | 2019 | 2018 | 2017 | 2016 | 2015 | 2014 |
| Selected Per–Share Data | | | | | | |
| Net asset value, beginning of period | $25.62 | $29.07 | $23.65 | $22.55 | $24.81 | $26.17 |
| Income from Investment Operations | | | | | | |
| Net investment income (loss)A | .17 | .30 | .21 | .27 | .21 | .10 |
| Net realized and unrealized gain (loss) | 1.26 | (2.86) | 5.69 | 1.63 | 1.04 | (.87) |
| Total from investment operations | 1.43 | (2.56) | 5.90 | 1.90 | 1.25 | (.77) |
| Distributions from net investment income | (.27) | (.15) | (.19) | (.19) | (.06) | – |
| Distributions from net realized gain | (1.00) | (.74) | (.29) | (.62) | (3.45) | (.60) |
| Total distributions | (1.28)B | (.89) | (.48) | (.81) | (3.51) | (.60) |
| Redemption fees added to paid in capitalA | – | –C | –C | .01 | –C | .01 |
| Net asset value, end of period | $25.77 | $25.62 | $29.07 | $23.65 | $22.55 | $24.81 |
| Total ReturnD,E,F | 5.96% | (9.10)% | 25.47% | 8.79% | 5.90% | (3.00)% |
| Ratios to Average Net AssetsG,H | | | | | | |
| Expenses before reductions | 1.81%I | 1.77% | 1.84% | 1.90% | 1.87% | 1.77% |
| Expenses net of fee waivers, if any | 1.81%I | 1.77% | 1.84% | 1.90% | 1.86% | 1.77% |
| Expenses net of all reductions | 1.80%I | 1.76% | 1.84% | 1.90% | 1.86% | 1.76% |
| Net investment income (loss) | 1.34%I | 1.05% | .82% | 1.21% | .90% | .38% |
| Supplemental Data | | | | | | |
| Net assets, end of period (000 omitted) | $16,322 | $16,362 | $18,148 | $13,331 | $12,400 | $12,296 |
| Portfolio turnover rateJ | 28%I | 25% | 22% | 29% | 36% | 102% |
A Calculated based on average shares outstanding during the period.
B Total distributions of $1.28 per share is comprised of distributions from net investment income of $.274 and distributions from net realized gain of $1.002 per share.
C Amount represents less than $.005 per share.
D Total returns for periods of less than one year are not annualized.
E Total returns would have been lower if certain expenses had not been reduced during the applicable periods shown.
F Total returns do not include the effect of the sales charges.
G Fees and expenses of any underlying Fidelity Central Funds are not included in the Fund's expense ratio. The Fund indirectly bears its proportionate share of the expenses of any underlying Fidelity Central Funds.
H Expense ratios reflect operating expenses of the class. Expenses before reductions do not reflect amounts reimbursed by the investment adviser or reductions from brokerage service arrangements or reductions from other expense offset arrangements and do not represent the amount paid by the class during periods when reimbursements or reductions occur. Expenses net of fee waivers reflect expenses after reimbursement by the investment adviser but prior to reductions from brokerage service arrangements or other expense offset arrangements. Expenses net of all reductions represent the net expenses paid by the class.
I Annualized
J Amount does not include the portfolio activity of any underlying Fidelity Central Funds.
See accompanying notes which are an integral part of the financial statements.
Fidelity International Small Cap Fund Class C
| | Six months ended (Unaudited) April 30, | Years endedOctober 31, | | | | |
| | 2019 | 2018 | 2017 | 2016 | 2015 | 2014 |
| Selected Per–Share Data | | | | | | |
| Net asset value, beginning of period | $24.77 | $28.21 | $22.97 | $21.96 | $24.27 | $25.68 |
| Income from Investment Operations | | | | | | |
| Net investment income (loss)A | .11 | .16 | .08 | .16 | .09 | (.02) |
| Net realized and unrealized gain (loss) | 1.21 | (2.76) | 5.53 | 1.59 | 1.02 | (.85) |
| Total from investment operations | 1.32 | (2.60) | 5.61 | 1.75 | 1.11 | (.87) |
| Distributions from net investment income | (.17) | (.10) | (.08) | (.13) | – | – |
| Distributions from net realized gain | (1.00) | (.74) | (.29) | (.62) | (3.42) | (.55) |
| Total distributions | (1.17) | (.84) | (.37) | (.75) | (3.42) | (.55) |
| Redemption fees added to paid in capitalA | – | –B | –B | .01 | –B | .01 |
| Net asset value, end of period | $24.92 | $24.77 | $28.21 | $22.97 | $21.96 | $24.27 |
| Total ReturnC,D,E | 5.69% | (9.51)% | 24.85% | 8.26% | 5.37% | (3.43)% |
| Ratios to Average Net AssetsF,G | | | | | | |
| Expenses before reductions | 2.26%H | 2.24% | 2.33% | 2.40% | 2.36% | 2.23% |
| Expenses net of fee waivers, if any | 2.26%H | 2.24% | 2.33% | 2.40% | 2.35% | 2.22% |
| Expenses net of all reductions | 2.26%H | 2.23% | 2.32% | 2.39% | 2.35% | 2.22% |
| Net investment income (loss) | .89%H | .58% | .33% | .71% | .41% | (.07)% |
| Supplemental Data | | | | | | |
| Net assets, end of period (000 omitted) | $27,768 | $41,918 | $26,005 | $12,187 | $11,359 | $12,576 |
| Portfolio turnover rateI | 28%H | 25% | 22% | 29% | 36% | 102% |
A Calculated based on average shares outstanding during the period.
B Amount represents less than $.005 per share.
C Total returns for periods of less than one year are not annualized.
D Total returns would have been lower if certain expenses had not been reduced during the applicable periods shown.
E Total returns do not include the effect of the contingent deferred sales charge.
F Fees and expenses of any underlying Fidelity Central Funds are not included in the Fund's expense ratio. The Fund indirectly bears its proportionate share of the expenses of any underlying Fidelity Central Funds.
G Expense ratios reflect operating expenses of the class. Expenses before reductions do not reflect amounts reimbursed by the investment adviser or reductions from brokerage service arrangements or reductions from other expense offset arrangements and do not represent the amount paid by the class during periods when reimbursements or reductions occur. Expenses net of fee waivers reflect expenses after reimbursement by the investment adviser but prior to reductions from brokerage service arrangements or other expense offset arrangements. Expenses net of all reductions represent the net expenses paid by the class.
H Annualized
I Amount does not include the portfolio activity of any underlying Fidelity Central Funds.
See accompanying notes which are an integral part of the financial statements.
Fidelity International Small Cap Fund
| | Six months ended (Unaudited) April 30, | Years endedOctober 31, | | | | |
| | 2019 | 2018 | 2017 | 2016 | 2015 | 2014 |
| Selected Per–Share Data | | | | | | |
| Net asset value, beginning of period | $26.29 | $29.77 | $24.23 | $23.06 | $25.34 | $26.67 |
| Income from Investment Operations | | | | | | |
| Net investment income (loss)A | .25 | .48 | .37 | .40 | .34 | .25 |
| Net realized and unrealized gain (loss) | 1.27 | (2.93) | 5.79 | 1.67 | 1.07 | (.90) |
| Total from investment operations | 1.52 | (2.45) | 6.16 | 2.07 | 1.41 | (.65) |
| Distributions from net investment income | (.45) | (.29) | (.34) | (.29) | (.24) | (.09) |
| Distributions from net realized gain | (1.00) | (.74) | (.29) | (.62) | (3.45) | (.60) |
| Total distributions | (1.45) | (1.03) | (.63) | (.91) | (3.69) | (.69) |
| Redemption fees added to paid in capitalA | – | –B | .01 | .01 | –B | .01 |
| Net asset value, end of period | $26.36 | $26.29 | $29.77 | $24.23 | $23.06 | $25.34 |
| Total ReturnC,D | 6.25% | (8.54)% | 26.18% | 9.39% | 6.53% | (2.48)% |
| Ratios to Average Net AssetsE,F | | | | | | |
| Expenses before reductions | 1.22%G | 1.20% | 1.25% | 1.34% | 1.31% | 1.21% |
| Expenses net of fee waivers, if any | 1.22%G | 1.20% | 1.25% | 1.34% | 1.31% | 1.20% |
| Expenses net of all reductions | 1.21%G | 1.19% | 1.24% | 1.33% | 1.31% | 1.20% |
| Net investment income (loss) | 1.93%G | 1.62% | 1.41% | 1.77% | 1.45% | .95% |
| Supplemental Data | | | | | | |
| Net assets, end of period (000 omitted) | $1,287,912 | $1,256,193 | $1,418,452 | $906,420 | $811,534 | $842,031 |
| Portfolio turnover rateH | 28%G | 25% | 22% | 29% | 36% | 102% |
A Calculated based on average shares outstanding during the period.
B Amount represents less than $.005 per share.
C Total returns for periods of less than one year are not annualized.
D Total returns would have been lower if certain expenses had not been reduced during the applicable periods shown.
E Fees and expenses of any underlying Fidelity Central Funds are not included in the Fund's expense ratio. The Fund indirectly bears its proportionate share of the expenses of any underlying Fidelity Central Funds.
F Expense ratios reflect operating expenses of the class. Expenses before reductions do not reflect amounts reimbursed by the investment adviser or reductions from brokerage service arrangements or reductions from other expense offset arrangements and do not represent the amount paid by the class during periods when reimbursements or reductions occur. Expenses net of fee waivers reflect expenses after reimbursement by the investment adviser but prior to reductions from brokerage service arrangements or other expense offset arrangements. Expenses net of all reductions represent the net expenses paid by the class.
G Annualized
H Amount does not include the portfolio activity of any underlying Fidelity Central Funds.
See accompanying notes which are an integral part of the financial statements.
Fidelity International Small Cap Fund Class I
| | Six months ended (Unaudited) April 30, | Years endedOctober 31, | | | | |
| | 2019 | 2018 | 2017 | 2016 | 2015 | 2014 |
| Selected Per–Share Data | | | | | | |
| Net asset value, beginning of period | $26.45 | $29.97 | $24.42 | $23.24 | $25.34 | $26.67 |
| Income from Investment Operations | | | | | | |
| Net investment income (loss)A | .25 | .47 | .38 | .41 | .36 | .29 |
| Net realized and unrealized gain (loss) | 1.29 | (2.95) | 5.82 | 1.69 | 1.07 | (.90) |
| Total from investment operations | 1.54 | (2.48) | 6.20 | 2.10 | 1.43 | (.61) |
| Distributions from net investment income | (.46) | (.30) | (.37) | (.31) | (.08) | (.13) |
| Distributions from net realized gain | (1.00) | (.74) | (.29) | (.62) | (3.45) | (.60) |
| Total distributions | (1.46) | (1.04) | (.66) | (.93) | (3.53) | (.73) |
| Redemption fees added to paid in capitalA | – | –B | .01 | .01 | –B | .01 |
| Net asset value, end of period | $26.53 | $26.45 | $29.97 | $24.42 | $23.24 | $25.34 |
| Total ReturnC,D | 6.28% | (8.58)% | 26.17% | 9.43% | 6.60% | (2.35)% |
| Ratios to Average Net AssetsE,F | | | | | | |
| Expenses before reductions | 1.22%G | 1.21% | 1.28% | 1.31% | 1.24% | 1.08% |
| Expenses net of fee waivers, if any | 1.22%G | 1.21% | 1.28% | 1.31% | 1.23% | 1.08% |
| Expenses net of all reductions | 1.21%G | 1.20% | 1.27% | 1.31% | 1.23% | 1.08% |
| Net investment income (loss) | 1.93%G | 1.61% | 1.39% | 1.80% | 1.53% | 1.07% |
| Supplemental Data | | | | | | |
| Net assets, end of period (000 omitted) | $682,642 | $564,988 | $237,469 | $22,727 | $10,070 | $8,092 |
| Portfolio turnover rateH | 28%G | 25% | 22% | 29% | 36% | 102% |
A Calculated based on average shares outstanding during the period.
B Amount represents less than $.005 per share.
C Total returns for periods of less than one year are not annualized.
D Total returns would have been lower if certain expenses had not been reduced during the applicable periods shown.
E Fees and expenses of any underlying Fidelity Central Funds are not included in the Fund's expense ratio. The Fund indirectly bears its proportionate share of the expenses of any underlying Fidelity Central Funds.
F Expense ratios reflect operating expenses of the class. Expenses before reductions do not reflect amounts reimbursed by the investment adviser or reductions from brokerage service arrangements or reductions from other expense offset arrangements and do not represent the amount paid by the class during periods when reimbursements or reductions occur. Expenses net of fee waivers reflect expenses after reimbursement by the investment adviser but prior to reductions from brokerage service arrangements or other expense offset arrangements. Expenses net of all reductions represent the net expenses paid by the class.
G Annualized
H Amount does not include the portfolio activity of any underlying Fidelity Central Funds.
See accompanying notes which are an integral part of the financial statements.
Fidelity International Small Cap Fund Class Z
| | Six months ended (Unaudited) April 30, | Years endedOctober 31, |
| | 2019 | 2018 A |
| Selected Per–Share Data | | |
| Net asset value, beginning of period | $26.46 | $28.78 |
| Income from Investment Operations | | |
| Net investment income (loss)B | .26 | .03 |
| Net realized and unrealized gain (loss) | 1.29 | (2.35) |
| Total from investment operations | 1.55 | (2.32) |
| Distributions from net investment income | (.50) | – |
| Distributions from net realized gain | (1.00) | – |
| Total distributions | (1.51)C | – |
| Net asset value, end of period | $26.50 | $26.46 |
| Total ReturnD,E | 6.31% | (8.06)% |
| Ratios to Average Net AssetsF,G | | |
| Expenses before reductions | 1.08%H | 1.15%H |
| Expenses net of fee waivers, if any | 1.08%H | 1.15%H |
| Expenses net of all reductions | 1.07%H | 1.14%H |
| Net investment income (loss) | 2.07%H | 2.01%H |
| Supplemental Data | | |
| Net assets, end of period (000 omitted) | $80,081 | $7,421 |
| Portfolio turnover rateI | 28%H | 25%H |
A For the period October 2, 2018 (commencement of sale of shares) to October 31, 2018.
B Calculated based on average shares outstanding during the period.
C Total distributions of $1.51 per share is comprised of distributions from net investment income of $.504 and distributions from net realized gain of $1.002 per share.
D Total returns for periods of less than one year are not annualized.
E Total returns would have been lower if certain expenses had not been reduced during the applicable periods shown.
F Fees and expenses of any underlying Fidelity Central Funds are not included in the Fund's expense ratio. The Fund indirectly bears its proportionate share of the expenses of any underlying Fidelity Central Funds.
G Expense ratios reflect operating expenses of the class. Expenses before reductions do not reflect amounts reimbursed by the investment adviser or reductions from brokerage service arrangements or reductions from other expense offset arrangements and do not represent the amount paid by the class during periods when reimbursements or reductions occur. Expense ratios before reductions for start-up periods may not be representative of longer-term operating periods. Expenses net of fee waivers reflect expenses after reimbursement by the investment adviser but prior to reductions from brokerage service arrangements or other expense offset arrangements. Expenses net of all reductions represent the net expenses paid by the class.
H Annualized
I Amount does not include the portfolio activity of any underlying Fidelity Central Funds.
See accompanying notes which are an integral part of the financial statements.
Notes to Financial Statements (Unaudited)
For the period ended April 30, 2019
1. Organization.
Fidelity International Small Cap Fund (the Fund) is a fund of Fidelity Investment Trust (the Trust) and is authorized to issue an unlimited number of shares. The Trust is registered under the Investment Company Act of 1940, as amended (the 1940 Act), as an open-end management investment company organized as a Massachusetts business trust. The Fund offers Class A, Class M, Class C, International Small Cap, Class I and Class Z shares, each of which has equal rights as to assets and voting privileges. Each class has exclusive voting rights with respect to matters that affect that class. Effective March 1, 2019, Class C shares will automatically convert to Class A shares after a holding period of ten years from the initial date of purchase, with certain exceptions. The Fund's investments in emerging markets can be subject to social, economic, regulatory, and political uncertainties and can be extremely volatile.
2. Investments in Fidelity Central Funds.
The Fund invests in Fidelity Central Funds, which are open-end investment companies generally available only to other investment companies and accounts managed by the investment adviser and its affiliates. The Fund's Schedule of Investments lists each of the Fidelity Central Funds held as of period end, if any, as an investment of the Fund, but does not include the underlying holdings of each Fidelity Central Fund. As an Investing Fund, the Fund indirectly bears its proportionate share of the expenses of the underlying Fidelity Central Funds.
The Money Market Central Funds seek preservation of capital and current income and are managed by Fidelity Investments Money Management, Inc. (FIMM), an affiliate of the investment adviser. Annualized expenses of the Money Market Central Funds as of their most recent shareholder report date are less than .005%.
A complete unaudited list of holdings for each Fidelity Central Fund is available upon request or at the Securities and Exchange Commission (the SEC) website at www.sec.gov. In addition, the financial statements of the Fidelity Central Funds are available on the SEC website or upon request.
3. Significant Accounting Policies.
The Fund is an investment company and applies the accounting and reporting guidance of the Financial Accounting Standards Board (FASB) Accounting Standards Codification Topic 946 Financial Services – Investments Companies. The financial statements have been prepared in conformity with accounting principles generally accepted in the United States of America (GAAP), which require management to make certain estimates and assumptions at the date of the financial statements. Actual results could differ from those estimates. Subsequent events, if any, through the date that the financial statements were issued have been evaluated in the preparation of the financial statements. The following summarizes the significant accounting policies of the Fund:
Investment Valuation. Investments are valued as of 4:00 p.m. Eastern time on the last calendar day of the period. The Board of Trustees (the Board) has delegated the day to day responsibility for the valuation of the Fund's investments to the Fair Value Committee (the Committee) established by the Fund's investment adviser. In accordance with valuation policies and procedures approved by the Board, the Fund attempts to obtain prices from one or more third party pricing vendors or brokers to value its investments. When current market prices, quotations or currency exchange rates are not readily available or reliable, investments will be fair valued in good faith by the Committee, in accordance with procedures adopted by the Board. Factors used in determining fair value vary by investment type and may include market or investment specific events. The frequency with which these procedures are used cannot be predicted and they may be utilized to a significant extent. The Committee oversees the Fund's valuation policies and procedures and reports to the Board on the Committee's activities and fair value determinations. The Board monitors the appropriateness of the procedures used in valuing the Fund's investments and ratifies the fair value determinations of the Committee.
The Fund categorizes the inputs to valuation techniques used to value its investments into a disclosure hierarchy consisting of three levels as shown below:
- Level 1 – quoted prices in active markets for identical investments
- Level 2 – other significant observable inputs (including quoted prices for similar investments, interest rates, prepayment speeds, etc.)
- Level 3 – unobservable inputs (including the Fund's own assumptions based on the best information available)
Valuation techniques used to value the Fund's investments by major category are as follows:
Equity securities, including restricted securities, for which market quotations are readily available, are valued at the last reported sale price or official closing price as reported by a third party pricing vendor on the primary market or exchange on which they are traded and are categorized as Level 1 in the hierarchy. In the event there were no sales during the day or closing prices are not available, securities are valued at the last quoted bid price or may be valued using the last available price and are generally categorized as Level 2 in the hierarchy. For foreign equity securities, when market or security specific events arise, comparisons to the valuation of American Depositary Receipts (ADRs), futures contracts, Exchange-Traded Funds (ETFs) and certain indexes as well as quoted prices for similar securities may be used and would be categorized as Level 2 in the hierarchy. For equity securities, including restricted securities, where observable inputs are limited, assumptions about market activity and risk are used and these securities may be categorized as Level 3 in the hierarchy.
Investments in open-end mutual funds, including the Fidelity Central Funds, are valued at their closing net asset value (NAV) each business day and are categorized as Level 1 in the hierarchy.
Changes in valuation techniques may result in transfers in or out of an assigned level within the disclosure hierarchy. The aggregate value of investments by input level as of April 30, 2019 is included at the end of the Fund's Schedule of Investments.
Foreign Currency. The Fund may use foreign currency contracts to facilitate transactions in foreign-denominated securities. Gains and losses from these transactions may arise from changes in the value of the foreign currency or if the counterparties do not perform under the contracts' terms.
Foreign-denominated assets, including investment securities, and liabilities are translated into U.S. dollars at the exchange rates at period end. Purchases and sales of investment securities, income and dividends received and expenses denominated in foreign currencies are translated into U.S. dollars at the exchange rate in effect on the transaction date.
The effects of exchange rate fluctuations on investments are included with the net realized and unrealized gain (loss) on investment securities. Other foreign currency transactions resulting in realized and unrealized gain (loss) are disclosed separately.
Investment Transactions and Income. For financial reporting purposes, the Fund's investment holdings and NAV include trades executed through the end of the last business day of the period. The NAV per share for processing shareholder transactions is calculated as of the close of business of the New York Stock Exchange (NYSE), normally 4:00 p.m. Eastern time and includes trades executed through the end of the prior business day. Gains and losses on securities sold are determined on the basis of identified cost and include proceeds received from litigation. Dividend income is recorded on the ex-dividend date, except for certain dividends from foreign securities where the ex-dividend date may have passed, which are recorded as soon as the Fund is informed of the ex-dividend date. Non-cash dividends included in dividend income, if any, are recorded at the fair market value of the securities received. Income and capital gain distributions from Fidelity Central Funds, if any, are recorded on the ex-dividend date. Certain distributions received by the Fund represent a return of capital or capital gain. The Fund determines the components of these distributions subsequent to the ex-dividend date, based upon receipt of tax filings or other correspondence relating to the underlying investment. These distributions are recorded as a reduction of cost of investments and/or as a realized gain. Investment income is recorded net of foreign taxes withheld where recovery of such taxes is uncertain.
Class Allocations and Expenses. Investment income, realized and unrealized capital gains and losses, common expenses of the Fund, and certain fund-level expense reductions, if any, are allocated daily on a pro-rata basis to each class based on the relative net assets of each class to the total net assets of the Fund. Each class differs with respect to transfer agent and distribution and service plan fees incurred. Certain expense reductions may also differ by class. For the reporting period, the allocated portion of income and expenses to each class as a percent of its average net assets may vary due to the timing of recording these transactions in relation to fluctuating net assets of the classes. Expenses directly attributable to a fund are charged to that fund. Expenses attributable to more than one fund are allocated among the respective funds on the basis of relative net assets or other appropriate methods. Expense estimates are accrued in the period to which they relate and adjustments are made when actual amounts are known.
Income Tax Information and Distributions to Shareholders. Each year, the Fund intends to qualify as a regulated investment company under Subchapter M of the Internal Revenue Code, including distributing substantially all of its taxable income and realized gains. As a result, no provision for U.S. Federal income taxes is required. The Fund files a U.S. federal tax return, in addition to state and local tax returns as required. The Fund's federal income tax returns are subject to examination by the Internal Revenue Service (IRS) for a period of three fiscal years after they are filed. State and local tax returns may be subject to examination for an additional fiscal year depending on the jurisdiction. Foreign taxes are provided for based on the Fund's understanding of the tax rules and rates that exist in the foreign markets in which it invests. The Fund is subject to a tax imposed on capital gains by certain countries in which it invests. An estimated deferred tax liability for net unrealized appreciation on the applicable securities is included in Other payables and accrued expenses on the Statement of Assets & Liabilities.
Distributions are declared and recorded on the ex-dividend date. Income and capital gain distributions are declared separately for each class. Income and capital gain distributions are determined in accordance with income tax regulations, which may differ from GAAP.
Capital accounts within the financial statements are adjusted for permanent book-tax differences. These adjustments have no impact on net assets or the results of operations. Capital accounts are not adjusted for temporary book-tax differences which will reverse in a subsequent period.
Book-tax differences are primarily due to foreign currency transactions, certain foreign taxes, passive foreign investment companies (PFIC) and losses deferred due to wash sales.
As of period end, the cost and unrealized appreciation (depreciation) in securities, and derivatives if applicable, for federal income tax purposes were as follows:
| Gross unrealized appreciation | $315,166,590 |
| Gross unrealized depreciation | (243,378,517) |
| Net unrealized appreciation (depreciation) | $71,788,073 |
| Tax cost | $2,143,091,060 |
Delayed Delivery Transactions and When-Issued Securities. During the period, the Fund transacted in securities on a delayed delivery or when-issued basis. Payment and delivery may take place after the customary settlement period for that security. The price of the underlying securities and the date when the securities will be delivered and paid for are fixed at the time the transaction is negotiated. The securities purchased on a delayed delivery or when-issued basis are identified as such in the Fund's Schedule of Investments. Losses may arise due to changes in the value of the underlying securities or if the counterparty does not perform under the contract's terms, or if the issuer does not issue the securities due to political, economic, or other factors.
Restricted Securities. The Fund may invest in securities that are subject to legal or contractual restrictions on resale. These securities generally may be resold in transactions exempt from registration or to the public if the securities are registered. Disposal of these securities may involve time-consuming negotiations and expense, and prompt sale at an acceptable price may be difficult. Information regarding restricted securities is included at the end of the Fund's Schedule of Investments.
4. Purchases and Sales of Investments.
Purchases and sales of securities, other than short-term securities, aggregated $358,403,048 and $272,836,840, respectively.
5. Fees and Other Transactions with Affiliates.
Management Fee. Fidelity Management & Research Company (the investment adviser) and its affiliates provide the Fund with investment management related services for which the Fund pays a monthly management fee. The management fee is the sum of an individual fund fee rate that is based on an annual rate of .60% of the Fund's average net assets and an annualized group fee rate that averaged .24% during the period. The group fee rate is based upon the average net assets of all the mutual funds advised by the investment adviser, including any mutual funds previously advised by the investment adviser that are currently advised by Fidelity SelectCo, LLC, an affiliate of the investment adviser. The group fee rate decreases as assets under management increase and increases as assets under management decrease. In addition, the management fee is subject to a performance adjustment (up to a maximum of +/- .20% of the Fund's average net assets over a 36 month performance period). The upward or downward adjustment to the management fee is based on the investment performance of the asset-weighted return of all classes relative investment performance of International Small Cap as compared to its benchmark index, the MSCI ACWI (All Country World Index) ex USA Small Cap Index, over the same 36 month performance period. For the reporting period, the total annualized management fee rate, including the performance adjustment, was .95% of the Fund's average net assets. The performance adjustment included in the management fee rate may be higher or lower than the maximum performance adjustment rate due to the difference between the average net assets for the reporting and performance periods.
Distribution and Service Plan Fees. In accordance with Rule 12b-1 of the 1940 Act, the Fund has adopted separate Distribution and Service Plans for each class of shares. Certain classes pay Fidelity Distributors Corporation (FDC), an affiliate of the investment adviser, separate Distribution and Service Fees, each of which is based on an annual percentage of each class' average net assets. In addition, FDC may pay financial intermediaries for selling shares of the Fund and providing shareholder support services. For the period, the Distribution and Service Fee rates, total fees and amounts retained by FDC were as follows:
| | Distribution Fee | Service Fee | Total Fees | Retained by FDC |
| Class A | -% | .25% | $120,688 | $4,700 |
| Class M | .25% | .25% | 39,774 | 392 |
| Class C | .75% | .25% | 184,681 | 52,808 |
| | | | $345,143 | $57,900 |
Sales Load. FDC may receive a front-end sales charge of up to 5.75% for selling Class A shares and 3.50% for selling Class M shares, some of which is paid to financial intermediaries for selling shares of the Fund. Depending on the holding period, FDC may receive contingent deferred sales charges levied on Class A, Class M and Class C redemptions. The deferred sales charges are 1.00% for Class C shares, 1.00% for certain purchases of Class A shares and .25% for certain purchases of Class M shares.
For the period, sales charge amounts retained by FDC were as follows:
| | Retained by FDC |
| Class A | $13,433 |
| Class M | 1,478 |
| Class C(a) | 5,563 |
| | $20,474 |
(a) When Class C shares are initially sold, FDC pays commissions from its own resources to financial intermediaries through which the sales are made.
Transfer Agent Fees. Fidelity Investments Institutional Operations Company, Inc., (FIIOC), an affiliate of the investment adviser, is the transfer, dividend disbursing and shareholder servicing agent for each class of the Fund. FIIOC receives account fees and asset-based fees that vary according to the account size and type of account of the shareholders of the respective classes of the Fund, except for Class Z. FIIOC receives an asset-based fee of Class Z's average net assets. FIIOC pays for typesetting, printing and mailing of shareholder reports, except proxy statements.
For the period, transfer agent fees for each class were as follows:
| | Amount | % of Class-Level Average Net Assets(a) |
| Class A | $102,743 | .21 |
| Class M | 21,956 | .28 |
| Class C | 41,960 | .23 |
| International Small Cap | 1,164,766 | .19 |
| Class I | 541,423 | .18 |
| Class Z | 9,199 | .05 |
| | $1,882,047 | |
(a) Annualized
Accounting and Security Lending Fees. Fidelity Service Company, Inc. (FSC), an affiliate of the investment adviser, maintains the Fund's accounting records. The accounting fee is based on the level of average net assets for each month. Prior to April 1, 2019, FSC had a separate agreement with the Fund for administration of the security lending program, based on the number and duration of lending transactions. For the period, the total fees paid for accounting and administration of securities lending were equivalent to an annualized rate of .04%.
Brokerage Commissions. The Fund placed a portion of its portfolio transactions with brokerage firms which are affiliates of the investment adviser. Brokerage commissions are included in net realized gain (loss) and change in net unrealized appreciation (depreciation) in the Statement of Operations. The commissions paid to these affiliated firms were $1,453 for the period.
Interfund Trades. The Fund may purchase from or sell securities to other Fidelity Funds under procedures adopted by the Board. The procedures have been designed to ensure these interfund trades are executed in accordance with Rule 17a-7 of the 1940 Act. Interfund trades are included within the respective purchases and sales amounts shown in the Purchases and Sales of Investments note.
6. Committed Line of Credit.
The Fund participates with other funds managed by the investment adviser or an affiliate in a $4.25 billion credit facility (the "line of credit") to be utilized for temporary or emergency purposes to fund shareholder redemptions or for other short-term liquidity purposes. The Fund has agreed to pay commitment fees on its pro-rata portion of the line of credit, which amounted to $2,890 and is reflected in Miscellaneous expenses on the Statement of Operations. During the period, the Fund did not borrow on this line of credit.
7. Security Lending.
The Fund lends portfolio securities through a lending agent from time to time in order to earn additional income. For equity securities, a lending agent is used and may loan securities to certain qualified borrowers, including Fidelity Capital Markets (FCM), a broker-dealer affiliated with the Fund. On the settlement date of the loan, the Fund receives collateral (in the form of U.S. Treasury obligations, letters of credit and/or cash) against the loaned securities and maintains collateral in an amount not less than 100% of the market value of the loaned securities during the period of the loan. The market value of the loaned securities is determined at the close of business of the Fund and any additional required collateral is delivered to the Fund on the next business day. The Fund or borrower may terminate the loan at any time, and if the borrower defaults on its obligation to return the securities loaned because of insolvency or other reasons, the Fund may apply collateral received from the borrower against the obligation. The Fund may experience delays and costs in recovering the securities loaned. Any cash collateral received is invested in the Fidelity Securities Lending Cash Central Fund. The value of loaned securities and cash collateral at period end are disclosed on the Fund's Statement of Assets and Liabilities. Security lending income represents the income earned on investing cash collateral, less rebates paid to borrowers and any lending agent fees associated with the loan, plus any premium payments received for lending certain types of securities. Security lending income is presented in the Statement of Operations as a component of income from Fidelity Central Funds. Total security lending income during the period amounted to $152,540. During the period, there were no securities loaned to FCM.
8. Expense Reductions.
Commissions paid to certain brokers with whom the investment adviser, or its affiliates, places trades on behalf of the Fund include an amount in addition to trade execution, which may be rebated back to the Fund to offset certain expenses. This amount totaled $49,403 for the period. In addition, through arrangements with the Fund's custodian, credits realized as a result of certain uninvested cash balances were used to reduce the Fund's expenses. During the period, these credits reduced the Fund's custody expenses by $1,885.
In addition, during the period the investment adviser reimbursed and/or waived a portion of fund-level operating expenses in the amount of $7,549 and a portion of class-level operating expenses as follows:
| | Amount |
| Class A | $778 |
| Class M | 122 |
| Class C | 297 |
| International Small Cap | 9,783 |
| Class I | 4,713 |
| Class Z | 308 |
| | $16,001 |
9. Distributions to Shareholders.
Distributions to shareholders of each class were as follows:
| | Six months ended
April 30, 2019 | Year ended
October 31, 2018 |
| Distributions to shareholders | | |
| Class A | $4,227,272 | $2,150,704 |
| Class M | 800,268 | 588,707 |
| Class C | 1,885,292 | 853,838 |
| International Small Cap | 68,518,204 | 49,080,231 |
| Class I | 29,933,675 | 8,879,774 |
| Class Z | 1,166,225 | – |
| Total | $106,530,936 | $61,553,254 |
10. Share Transactions.
Share transactions for each class were as follows and may contain automatic conversions between classes or exchanges between affiliated funds:
| | Shares | Shares | Dollars | Dollars |
| | Six months ended April 30, 2019 | Year ended October 31, 2018(a) | Six months ended April 30, 2019 | Year ended October 31, 2018(a) |
| Class A | | | | |
| Shares sold | 1,758,198 | 1,993,812 | $42,720,521 | $57,935,672 |
| Reinvestment of distributions | 171,183 | 72,621 | 4,094,693 | 2,060,979 |
| Shares redeemed | (846,275) | (1,118,217) | (21,102,709) | (32,145,224) |
| Net increase (decrease) | 1,083,106 | 948,216 | $25,712,505 | $27,851,427 |
| Class M | | | | |
| Shares sold | 52,796 | 265,293 | $1,308,925 | $7,711,211 |
| Reinvestment of distributions | 33,142 | 20,707 | 790,760 | 585,586 |
| Shares redeemed | (91,170) | (271,709) | (2,248,094) | (7,811,190) |
| Net increase (decrease) | (5,232) | 14,291 | $(148,409) | $485,607 |
| Class C | | | | |
| Shares sold | 115,413 | 1,115,556 | $2,768,845 | $31,833,791 |
| Reinvestment of distributions | 81,104 | 30,679 | 1,875,122 | 842,145 |
| Shares redeemed | (774,771) | (375,660) | (18,744,391) | (10,374,137) |
| Net increase (decrease) | (578,254) | 770,575 | $(14,100,424) | $22,301,799 |
| International Small Cap | | | | |
| Shares sold | 7,684,229 | 16,219,665 | $191,149,288 | $484,453,648 |
| Reinvestment of distributions | 2,618,248 | 1,616,727 | 63,754,337 | 46,674,910 |
| Shares redeemed | (9,232,470) | (17,690,156) | (232,390,740) | (519,774,089) |
| Net increase (decrease) | 1,070,007 | 146,236 | $22,512,885 | $11,354,469 |
| Class I | | | | |
| Shares sold | 13,317,123 | 19,548,705 | $337,438,043 | $583,254,206 |
| Reinvestment of distributions | 1,167,331 | 286,614 | 28,611,283 | 8,326,151 |
| Shares redeemed | (10,108,540) | (6,400,003) | (256,914,526) | (183,131,200) |
| Net increase (decrease) | 4,375,914 | 13,435,316 | $109,134,800 | $408,449,157 |
| Class Z | | | | |
| Shares sold | 3,152,763 | 280,979 | $81,198,206 | $7,304,519 |
| Reinvestment of distributions | 39,558 | – | 967,979 | – |
| Shares redeemed | (451,063) | (476) | (11,753,181) | (12,407) |
| Net increase (decrease) | 2,741,258 | 280,503 | $70,413,004 | $7,292,112 |
(a) Share transactions for Class Z are for the period October 2, 2018 (commencement of sale of shares) to October 31, 2018
11. Other.
The Fund's organizational documents provide former and current trustees and officers with a limited indemnification against liabilities arising in connection with the performance of their duties to the Fund. In the normal course of business, the Fund may also enter into contracts that provide general indemnifications. The Fund's maximum exposure under these arrangements is unknown as this would be dependent on future claims that may be made against the Fund. The risk of material loss from such claims is considered remote.
Shareholder Expense Example
As a shareholder of the Fund, you incur two types of costs: (1) transaction costs, including sales charges (loads) on purchase payments or redemption proceeds, and (2) ongoing costs, including management fees, distribution and/or service (12b-1) fees and other Fund expenses. This Example is intended to help you understand your ongoing costs (in dollars) of investing in the Fund and to compare these costs with the ongoing costs of investing in other mutual funds.
The Example is based on an investment of $1,000 invested at the beginning of the period and held for the entire period (November 1, 2018 to April 30, 2019).
Actual Expenses
The first line of the accompanying table for each class of the Fund provides information about actual account values and actual expenses. You may use the information in this line, together with the amount you invested, to estimate the expenses that you paid over the period. Simply divide your account value by $1,000.00 (for example, an $8,600 account value divided by $1,000.00 = 8.6), then multiply the result by the number in the first line for a class of the Fund under the heading entitled "Expenses Paid During Period" to estimate the expenses you paid on your account during this period. In addition, the Fund, as a shareholder in the underlying Fidelity Central Funds, will indirectly bear its pro-rata share of the fees and expenses incurred by the underlying Fidelity Central Funds. These fees and expenses are not included in the Fund's annualized expense ratio used to calculate the expense estimate in the table below.
Hypothetical Example for Comparison Purposes
The second line of the accompanying table for each class of the Fund provides information about hypothetical account values and hypothetical expenses based on a Class' actual expense ratio and an assumed rate of return of 5% per year before expenses, which is not the Class' actual return. The hypothetical account values and expenses may not be used to estimate the actual ending account balance or expenses you paid for the period. You may use this information to compare the ongoing costs of investing in the Fund and other funds. To do so, compare this 5% hypothetical example with the 5% hypothetical examples that appear in the shareholder reports of the other funds. In addition, the Fund, as a shareholder in the underlying Fidelity Central Funds, will indirectly bear its pro-rata share of the fees and expenses incurred by the underlying Fidelity Central Funds. These fees and expenses are not included in the Fund's annualized expense ratio used to calculate the expense estimate in the table below.
Please note that the expenses shown in the table are meant to highlight your ongoing costs only and do not reflect any transaction costs. Therefore, the second line of the table is useful in comparing ongoing costs only, and will not help you determine the relative total costs of owning different funds. In addition, if these transactional costs were included, your costs would have been higher.
| | Annualized Expense Ratio-A | Beginning
Account Value
November 1, 2018 | Ending
Account Value
April 30, 2019 | Expenses Paid
During Period-B
November 1, 2018
to April 30, 2019 |
| Class A | 1.50% | | | |
| Actual | | $1,000.00 | $1,061.10 | $7.67 |
| Hypothetical-C | | $1,000.00 | $1,017.36 | $7.50 |
| Class M | 1.81% | | | |
| Actual | | $1,000.00 | $1,059.60 | $9.24 |
| Hypothetical-C | | $1,000.00 | $1,015.82 | $9.05 |
| Class C | 2.26% | | | |
| Actual | | $1,000.00 | $1,056.90 | $11.53 |
| Hypothetical-C | | $1,000.00 | $1,013.59 | $11.28 |
| International Small Cap | 1.22% | | | |
| Actual | | $1,000.00 | $1,062.50 | $6.24 |
| Hypothetical-C | | $1,000.00 | $1,018.74 | $6.11 |
| Class I | 1.22% | | | |
| Actual | | $1,000.00 | $1,062.80 | $6.24 |
| Hypothetical-C | | $1,000.00 | $1,018.74 | $6.11 |
| Class Z | 1.08% | | | |
| Actual | | $1,000.00 | $1,063.10 | $5.52 |
| Hypothetical-C | | $1,000.00 | $1,019.44 | $5.41 |
A Annualized expense ratio reflects expenses net of applicable fee waivers.
B Expenses are equal to each Class' annualized expense ratio, multiplied by the average account value over the period, multiplied by 181/365 (to reflect the one-half year period).
C 5% return per year before expenses
Board Approval of Investment Advisory Contracts and Management Fees
Fidelity International Small Cap Fund
Each year, the Board of Trustees, including the Independent Trustees (together, the Board), votes on the renewal of the management contract with Fidelity Management & Research Company (FMR) and the sub-advisory agreements (together, the Advisory Contracts) for the fund. FMR and the sub-advisers are referred to herein as the Investment Advisers. The Board, assisted by the advice of fund counsel and Independent Trustees' counsel, requests and considers a broad range of information relevant to the renewal of the Advisory Contracts throughout the year.
The Board meets regularly and, at each of its meetings, covers an extensive agenda of topics and materials and considers factors that are relevant to its annual consideration of the renewal of the fund's Advisory Contracts, including the services and support provided to the fund and its shareholders. The Board has established various standing committees (Committees), each composed of and chaired by Independent Trustees with varying backgrounds, to which the Board has assigned specific subject matter responsibilities in order to enhance effective decision-making by the Board. The Board, acting directly and through its Committees, requests and receives information concerning the annual consideration of the renewal of the fund's Advisory Contracts. The Board also meets as needed to review matters specifically related to the Board's annual consideration of the renewal of the Advisory Contracts. Members of the Board may also meet with trustees of other Fidelity funds through joint ad hoc committees to discuss certain matters relevant to all of the Fidelity funds.
At its January 2019 meeting, the Board unanimously determined to renew the fund's Advisory Contracts. In reaching its determination, the Board considered all factors it believed relevant, including (i) the nature, extent, and quality of the services to be provided to the fund and its shareholders (including the investment performance of the fund); (ii) the competitiveness of the fund's management fee and total expense ratio relative to peer funds; (iii) the total costs of the services to be provided by and the profits to be realized by Fidelity from its relationships with the fund; and (iv) the extent to which, if any, economies of scale exist and would be realized as the fund grows, and whether any economies of scale are appropriately shared with fund shareholders.
In considering whether to renew the Advisory Contracts for the fund, the Board reached a determination, with the assistance of fund counsel and Independent Trustees' counsel and through the exercise of its business judgment, that the renewal of the Advisory Contracts was in the best interests of the fund and its shareholders and that the compensation payable under the Advisory Contracts was fair and reasonable. The Board's decision to renew the Advisory Contracts was not based on any single factor, but rather was based on a comprehensive consideration of all the information provided to the Board at its meetings throughout the year. The Board, in reaching its determination to renew the Advisory Contracts, was aware that shareholders of the fund have a broad range of investment choices available to them, including a wide choice among funds offered by Fidelity's competitors, and that the fund's shareholders, who have the opportunity to review and weigh the disclosure provided by the fund in its prospectus and other public disclosures, have chosen to invest in this fund, which is part of the Fidelity family of funds.
Nature, Extent, and Quality of Services Provided. The Board considered Fidelity's staffing as it relates to the fund, including the backgrounds of investment personnel of Fidelity, and also considered the fund's investment objective, strategies, and related investment philosophy. The Independent Trustees also had discussions with senior management of Fidelity's investment operations and investment groups. The Board considered the structure of the investment personnel compensation program and whether this structure provides appropriate incentives to act in the best interests of the fund. Additionally, the Board considered the portfolio managers' investments, if any, in the funds that they manage.
Resources Dedicated to Investment Management and Support Services. The Board and the Fund Oversight and Research Committees reviewed the general qualifications and capabilities of Fidelity's investment staff, including its size, education, experience, and resources, as well as Fidelity's approach to recruiting, training, managing, and compensating investment personnel. The Board noted that Fidelity has continued to increase the resources devoted to non-U.S. offices, including expansion of Fidelity's global investment organization. The Board also noted that Fidelity's analysts have extensive resources, tools and capabilities that allow them to conduct sophisticated quantitative and fundamental analysis, as well as credit analysis of issuers, counterparties and guarantors. Further, the Board considered that Fidelity's investment professionals have sufficient access to global information and data so as to provide competitive investment results over time, and that those professionals also have access to sophisticated tools that permit them to assess portfolio construction and risk and performance attribution characteristics continuously, as well as to transmit new information and research conclusions rapidly around the world. Additionally, in its deliberations, the Board considered Fidelity's trading, risk management, compliance, and technology and operations capabilities and resources, which are integral parts of the investment management process.
Shareholder and Administrative Services. The Board considered (i) the nature, extent, quality, and cost of advisory, administrative, and shareholder services performed by the Investment Advisers and their affiliates under the Advisory Contracts and under separate agreements covering transfer agency, pricing and bookkeeping, and securities lending services for the fund; (ii) the nature and extent of the supervision of third party service providers, principally custodians, subcustodians, and pricing vendors; and (iii) the resources devoted to, and the record of compliance with, the fund's compliance policies and procedures. The Board also reviewed the allocation of fund brokerage, including allocations to brokers affiliated with the Investment Advisers, the use of brokerage commissions to pay fund expenses, and the use of "soft" commission dollars to pay for research services.
The Board noted that the growth of fund assets over time across the complex allows Fidelity to reinvest in the development of services designed to enhance the value and convenience of the Fidelity funds as investment vehicles. These services include 24-hour access to account information and market information through telephone representatives and over the Internet, investor education materials and asset allocation tools, and the expanded availability of Fidelity Investor Centers.
The Board noted that it and the boards of certain other Fidelity funds had formed an ad hoc Committee on Transfer Agency Fees to review the variety of transfer agency fee structures throughout the industry and Fidelity's competitive positioning with respect to industry participants.
Investment in a Large Fund Family. The Board considered the benefits to shareholders of investing in a Fidelity fund, including the benefits of investing in a fund that is part of a large family of funds offering a variety of investment disciplines and providing a large variety of mutual fund investor services. The Board noted that Fidelity had taken, or had made recommendations that resulted in the Fidelity funds taking, a number of actions over the previous year that benefited particular funds, including: (i) continuing to dedicate additional resources to Fidelity's investment research process, which includes meetings with management of issuers of securities in which the funds invest, and to the support of the senior management team that oversees asset management; (ii) continuing efforts to enhance Fidelity's global research capabilities; (iii) launching new funds and making other enhancements to meet client needs; (iv) launching new share classes of existing funds; (v) eliminating purchase minimums and broadening eligibility requirements for certain funds and share classes; (vi) reducing management fees and total expenses for certain growth equity funds and index funds; (vii) lowering expense caps for certain existing funds and classes, and converting certain voluntary expense caps to contractual caps, to reduce expenses borne by shareholders; (viii) eliminating short-term redemption fees for funds that had such fees; (ix) rationalizing product lines and gaining increased efficiencies from fund mergers and share class consolidations; (x) continuing to develop, acquire and implement systems and technology to improve services to the funds and shareholders, strengthen information security, and increase efficiency; and (xi) continuing to implement enhancements to further strengthen Fidelity's product line to increase investors' probability of success in achieving their investment goals, including retirement income goals.
Investment Performance. The Board considered whether the fund has operated in accordance with its investment objective, as well as its record of compliance with its investment restrictions and its performance history.
The Board took into account discussions that occur at Board meetings throughout the year with representatives of the Investment Advisers about fund investment performance. In this regard the Board noted that as part of regularly scheduled fund reviews and other reports to the Board on fund performance, the Board considers annualized return information for the fund for different time periods, measured against an appropriate securities market index ("benchmark index") and a peer group of funds with similar objectives ("peer group"), if any. In its evaluation of fund investment performance, the Board gave particular attention to information indicating changes in performance of certain Fidelity funds for specific time periods and discussed with the Investment Advisers the reasons for any overperformance or underperformance.
In addition to reviewing absolute and relative fund performance, the Independent Trustees periodically consider the appropriateness of fund performance metrics in evaluating the results achieved. In general, the Independent Trustees believe that fund performance should be evaluated based on net performance (after fees and expenses) of both the highest performing and lowest performing fund share classes, where applicable, compared to appropriate benchmark indices, over appropriate time periods that may include full market cycles, and compared to peer groups, as applicable, over the same periods, taking into account relevant factors including the following: general market conditions; issuer-specific information; and fund cash flows and other factors.
The Independent Trustees recognize that shareholders evaluate performance on a net basis over their own holding periods, for which one-, three-, and five-year periods are often used as a proxy. For this reason, the performance information reviewed by the Board also included net cumulative total return information for the fund and an appropriate benchmark index and peer group for the most recentone-, three-, and five-year periods ended June 30, 2018, as shown below. Returns are shown compared to the 25th percentile (top of box, 75% beaten) and 75th percentile (bottom of box, 25% beaten) of the peer universe. Returns of the benchmark index are "net MA,"
i.e., adjusted for tax withholding rates applicable to U.S.-based funds organized as Massachusetts business trusts.
Fidelity International Small Cap Fund

The Board also considered that the fund's management fee is subject to upward or downward adjustment depending upon whether, and to what extent, the fund's investment performance for the performance period (a rolling 36-month period) exceeds, or is exceeded by, a securities index, thus leading to a performance adjustment for the same period. The Board noted that the performance adjustment provides FMR with a strong economic incentive to seek to achieve superior long-term performance for the fund's shareholders and helps to more closely align the interests of FMR and the shareholders of the fund.
Based on its review, the Board concluded that the nature, extent, and quality of services provided to the fund under the Advisory Contracts should continue to benefit the shareholders of the fund.
Competitiveness of Management Fee and Total Expense Ratio. The Board considered the fund's management fee and total expense ratio compared to "mapped groups" of competitive funds and classes created for the purpose of facilitating the Trustees' competitive analysis of management fees and total expenses. Fidelity creates "mapped groups" by combining similar Lipper investment objective categories that have comparable investment mandates. Combining Lipper investment objective categories aids the Board's management fee and total expense ratio comparisons by broadening the competitive group used for comparison.
Management Fee. The Board considered two proprietary management fee comparisons for the 12-month periods (ended June 30 for 2018 and December 31 for prior periods) shown in basis points (BP) in the chart below. The group of Lipper funds used by the Board for management fee comparisons is referred to below as the "Total Mapped Group." The Total Mapped Group is broader than the Lipper peer group used by the Board for performance comparisons because the Total Mapped Group combines several Lipper investment objective categories while the Lipper peer group does not. The Total Mapped Group comparison focuses on a fund's standing in terms of gross management fees before expense reimbursements or caps, and without giving effect to the fund's performance adjustment, relative to the total universe of funds with comparable investment mandates, regardless of whether their management fee structures also are comparable. Funds with comparable investment mandates offer exposure to similar types of securities. Funds with comparable management fee structures have similar management fee contractual arrangements (
e.g., flat rate charged for advisory services, all-inclusive fee rate,
etc.). "TMG %" represents the percentage of funds in the Total Mapped Group that had management fees that were lower than the fund's. For example, a hypothetical TMG % of 20% would mean that 80% of the funds in the Total Mapped Group had higher, and 20% had lower, management fees than the fund. The fund's actual TMG %s and the number of funds in the Total Mapped Group are in the chart below. The "Asset-Size Peer Group" (ASPG) comparison focuses on a fund's standing relative to a subset of non-Fidelity funds within the Total Mapped Group that are similar in size and management fee structure without taking into account performance adjustments, if any. For example, if a fund is in the first quartile of the ASPG, the fund's management fee ranks in the least expensive or lowest 25% of funds in the ASPG. The ASPG represents at least 15% of the funds in the Total Mapped Group with comparable asset size and management fee structures, subject to a minimum of 50 funds (or all funds in the Total Mapped Group if fewer than 50). Additional information, such as the ASPG quartile in which the fund's management fee rate ranked and the impact of the fund's performance adjustment, is also included in the chart and was considered by the Board.
Fidelity International Small Cap Fund
The Board considered that shareholders approved a prospective change in the index used to calculate the fund's performance adjustment, beginning April 1, 2014. The Board also considered that, because the performance adjustment is based on a rolling 36-month measurement period, during a transition period the fund's performance is compared to a blended index return that reflects the performance of the former index for the portion of the measurement period prior to April 1, 2014 and the performance of the current index for the remainder of the measurement period. The Board noted that the fund's performance adjustments for 2014 through 2016 shown in the chart below reflect the effect of using the blended index return to calculate the fund's performance adjustment.
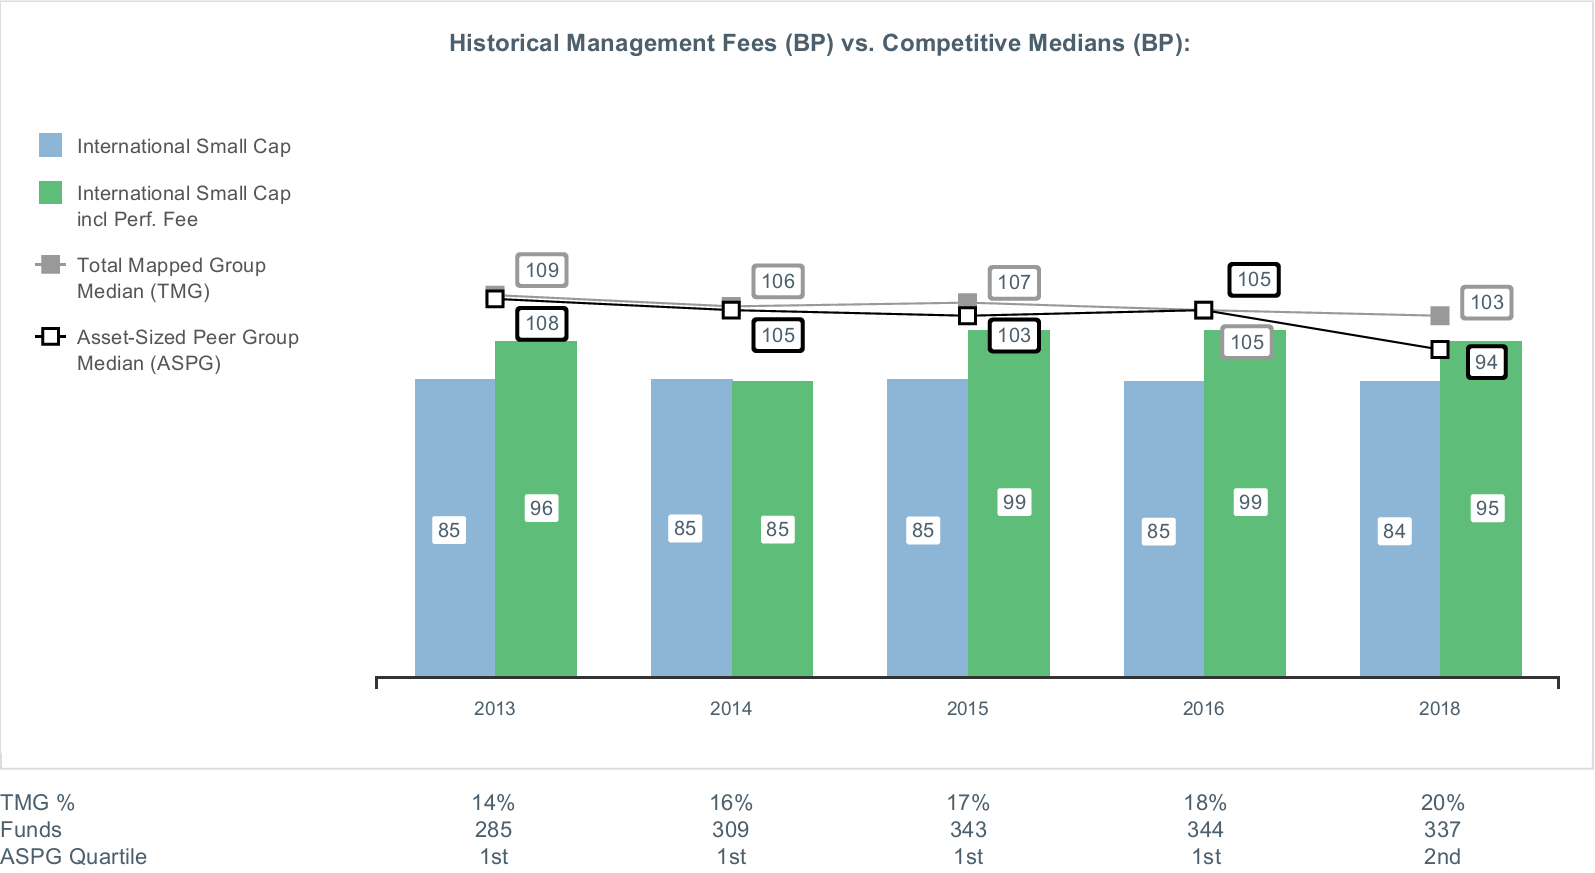
The Board noted that the fund's management fee rate ranked below the median of its Total Mapped Group and below the median of its ASPG for the 12-month period ended June 30, 2018. The Board also noted the effect of the fund's performance adjustment, if any, on the fund's management fee ranking.
The Board noted that it and the boards of other Fidelity funds formed an ad hoc Committee on Group Fee, which meets periodically, to conduct an in-depth review of the "group fee" component of the management fee of funds with such management fee structures. The Committee's focus included the mechanics of the group fee, the competitive landscape of group fee structures, Fidelity funds with no group fee component and investment products not included in group fee assets. The Board also considered that, for funds subject to the group fee, FMR agreed to voluntarily waive fees over a specified period of time in amounts designed to account for assets converted from certain funds to certain collective investment trusts.
The Board also noted that, in 2013, the ad hoc Committee on Management Fees was formed to conduct an in-depth review of the management fee rates of Fidelity's active equity mutual funds. The Committee focused on the following areas: (i) standard fee structures; (ii) research consumption and trading evolution; (iii) management fee competitiveness/profitability by category; and (iv) factors that drive institutional pricing.
Total Expense Ratio. Based on its review, the Board concluded that the fund's management fee is fair and reasonable in light of the services that the fund receives and the other factors considered.
In its review of each class's total expense ratio, the Board considered the fund's management fee rate as well as other fund or class expenses, as applicable, such as transfer agent fees, pricing and bookkeeping fees, fund-paid 12b-1 fees, and custodial, legal, and audit fees. The Board noted the impact of the fund's performance adjustment. The Board also noted that Fidelity may agree to waive fees and expenses from time to time, and the extent to which, if any, it has done so for the fund. As part of its review, the Board also considered the current and historical total expense ratios of each class of the fund compared to competitive fund median expenses. Each class of the fund is compared to those funds and classes in the Total Mapped Group (used by the Board for management fee comparisons) that have a similar sales load structure.
The Board noted that the total expense ratio of each of Class A and the retail class ranked below the competitive median for the 12-month period ended June 30, 2018, and the total expense ratio of each of Class M, Class C, and Class I ranked above the competitive median for the 12-month period ended June 30, 2018. The Board considered that, in general, various factors can affect total expense ratios. The Board noted that the total expense ratio of Class M was above the competitive median primarily because of higher 12b-1 fees on Class M as compared to most competitor funds. Class M has a higher 12b-1 fee, but a lower front-end sales charge, than traditionally priced front-end sales charge classes. The Board considered that Class M is primarily sold load-waived to retirement plans and intermediary wrap programs where its 0.50% 12b-1 fee is comparable to competing no-load, higher 12b-1 fee classes designed specifically for retirement plans and wrap programs. The Board noted that the total expense ratio of Class C was above the competitive median primarily because of its 1.00% 12b-1 fee. The Board noted that, although Class I is categorized by Lipper as an institutional class, Class I has a significantly lower investment minimum than most other funds and classes categorized as institutional. As a result, FMR believes that Class I is generally more comparable to retail funds and classes. The Board considered that, when compared to retail funds and classes, Class I would not be above the competitive median for the 12-month period ended June 30, 2018. The Board noted that the fund offers multiple classes, each of which has a different sales load and 12b-1 fee structure, and that the multiple structures are intended to offer a range of pricing options for the intermediary market. The Board also noted that the total expense ratios of the classes vary primarily by the level of their 12b-1 fees, although differences in transfer agent fees may also cause expenses to vary from class to class.
Fees Charged to Other Fidelity Clients. The Board also considered Fidelity fee structures and other information with respect to clients of Fidelity, such as other funds advised or subadvised by Fidelity, pension plan clients, and other institutional clients with similar mandates. The Board noted that a joint ad hoc committee created by it and the boards of other Fidelity funds periodically reviews and compares Fidelity's institutional investment advisory business with its business of providing services to the Fidelity funds and also noted the most recent findings of the committee. The Board noted that the committee's review included a consideration of the differences in services provided, fees charged, and costs incurred, as well as competition in the markets serving the different categories of clients.
Based on its review of total expense ratios and fees charged to other Fidelity clients, the Board concluded that the total expense ratio of each class of the fund was reasonable in light of the services that the fund and its shareholders receive and the other factors considered.
Costs of the Services and Profitability. The Board considered the revenues earned and the expenses incurred by Fidelity in conducting the business of developing, marketing, distributing, managing, administering and servicing the fund and servicing the fund's shareholders. The Board also considered the level of Fidelity's profits in respect of all the Fidelity funds.
On an annual basis, Fidelity presents to the Board information about the profitability of its relationships with the fund. Fidelity calculates profitability information for each fund, as well as aggregate profitability information for groups of Fidelity funds and all Fidelity funds, using a series of detailed revenue and cost allocation methodologies which originate with the books and records of Fidelity on which Fidelity's audited financial statements are based. The Audit Committee of the Board reviews any significant changes from the prior year's methodologies.
PricewaterhouseCoopers LLP (PwC), auditor to Fidelity and certain Fidelity funds, has been engaged annually by the Board as part of the Board's assessment of Fidelity's profitability analysis. PwC's engagement includes the review and assessment of the methodologies used by Fidelity in determining the revenues and expenses attributable to Fidelity's mutual fund business, and completion of agreed-upon procedures in respect of the mathematical accuracy of the fund profitability information and its conformity to established allocation methodologies. After considering PwC's reports issued under the engagement and information provided by Fidelity, the Board concluded that while other allocation methods may also be reasonable, Fidelity's profitability methodologies are reasonable in all material respects.
The Board also reviewed Fidelity's non-fund businesses and potential indirect benefits such businesses may have received as a result of their association with Fidelity's mutual fund business (i.e., fall-out benefits) as well as cases where Fidelity's affiliates may benefit from the fund's business. The Board noted that changes to fall-out benefits year-over-year reflect business developments at Fidelity's various businesses.
The Board considered the costs of the services provided by and the profits realized by Fidelity in connection with the operation of the fund and was satisfied that the profitability was not excessive.
Economies of Scale. The Board considered whether there have been economies of scale in respect of the management of the Fidelity funds, whether the Fidelity funds (including the fund) have appropriately benefited from any such economies of scale, and whether there is potential for realization of any further economies of scale. The Board considered the extent to which the fund will benefit from economies of scale as assets grow through increased services to the fund, through waivers or reimbursements, or through fee or expense ratio reductions. The Board also noted that a committee (the Economies of Scale Committee) created by it and the boards of other Fidelity funds periodically analyzes whether Fidelity attains economies of scale in respect of the management and servicing of the Fidelity funds, whether the Fidelity funds have appropriately benefited from such economies of scale, and whether there is potential for realization of any further economies of scale.
The Board recognized that the fund's management contract incorporates a "group fee" structure, which provides for lower group fee rates as total group assets increase, and for higher group fee rates as total group assets decrease (with "group assets" defined to include fund assets under FMR's management plus the assets of sector funds previously under FMR's management). FMR calculates the group fee rates based on a tiered asset "breakpoint" schedule that varies based on asset class. The Board considered that the group fee is designed to deliver the benefits of economies of scale to fund shareholders when total Fidelity fund assets increase, even if assets of any particular fund are unchanged or have declined, because some portion of Fidelity's costs are attributable to services provided to all Fidelity funds, and all funds benefit if those costs can be allocated among more assets. The Board concluded that, given the group fee structure, fund shareholders will benefit from lower management fees as group assets increase at the fund complex level, regardless of whether Fidelity achieves any such economies of scale.
The Board concluded, taking into account the analysis of the Economies of Scale Committee, that economies of scale, if any, are being appropriately shared between fund shareholders and Fidelity.
Additional Information Requested by the Board. In order to develop fully the factual basis for consideration of the Fidelity funds' advisory contracts, the Board requested and received additional information on certain topics, including: (i) fund performance trends, in particular the underperformance of certain funds, and Fidelity's long-term strategies for certain funds; (ii) Fidelity's fund profitability methodology, profitability trends for certain funds, and the impact of certain factors on fund profitability results; (iii) metrics for evaluating index fund and ETF performance and information about ETF trading characteristics; (iv) the methodology with respect to the evaluation of competitive fund data and peer group classifications and fee comparisons; (v) the expense structures for different funds and classes; (vi) information regarding other accounts managed by Fidelity, including collective investment trusts; and (vii) Fidelity's philosophies and strategies for evaluating funds and classes with lower or declining asset levels.
Based on its evaluation of all of the conclusions noted above, and after considering all factors it believed relevant, the Board concluded that the advisory fee arrangements are fair and reasonable, and that the fund's Advisory Contracts should be renewed.
ISC-SANN-0619
1.800662.115
Fidelity® SAI International SMA Completion Fund
Offered exclusively to certain clients of the Adviser or its affiliates - not available for sale to the general public. Fidelity SAI is a product name of Fidelity® funds dedicated to certain programs affiliated with Strategic Advisers LLC.
Semi-Annual Report April 30, 2019 |
|
Beginning on January 1, 2021, as permitted by regulations adopted by the Securities and Exchange Commission, paper copies of a fund’s shareholder reports will no longer be sent by mail, unless you specifically request paper copies of the reports from the fund or from your financial intermediary, such as a financial advisor, broker-dealer or bank. Instead, the reports will be made available on a website, and you will be notified by mail each time a report is posted and provided with a website link to access the report.
If you already elected to receive shareholder reports electronically, you will not be affected by this change and you need not take any action. You may elect to receive shareholder reports and other communications from a fund electronically, by contacting your financial intermediary. For Fidelity customers, visit Fidelity's web site or call Fidelity using the contact information listed below.
You may elect to receive all future reports in paper free of charge. If you wish to continue receiving paper copies of your shareholder reports, you may contact your financial intermediary or, if you are a Fidelity customer, visit Fidelity’s website, or call Fidelity at the applicable toll-free number listed below. Your election to receive reports in paper will apply to all funds held with the fund complex/your financial intermediary.
| Account Type | Website | Phone Number |
| Brokerage, Mutual Fund, or Annuity Contracts: | fidelity.com/mailpreferences | 1-800-343-3548 |
| Employer Provided Retirement Accounts: | netbenefits.fidelity.com/preferences (choose 'no' under Required Disclosures to continue to print) | 1-800-343-0860 |
| Advisor Sold Accounts Serviced Through Your Financial Intermediary: | Contact Your Financial Intermediary | Your Financial Intermediary's phone number |
| Advisor Sold Accounts Serviced by Fidelity: | institutional.fidelity.com | 1-877-208-0098 |
Contents
To view a fund's proxy voting guidelines and proxy voting record for the 12-month period ended June 30, visit http://www.fidelity.com/proxyvotingresults or visit the Securities and Exchange Commission's (SEC) web site at http://www.sec.gov.
You may also call 1-800-544-3455 to request a free copy of the proxy voting guidelines.
Standard & Poor's, S&P and S&P 500 are registered service marks of The McGraw-Hill Companies, Inc. and have been licensed for use by Fidelity Distributors Corporation.
Other third-party marks appearing herein are the property of their respective owners.
All other marks appearing herein are registered or unregistered trademarks or service marks of FMR LLC or an affiliated company. © 2019 FMR LLC. All rights reserved.
This report and the financial statements contained herein are submitted for the general information of the shareholders of the Fund. This report is not authorized for distribution to prospective investors in the Fund unless preceded or accompanied by an effective prospectus.
A fund files its complete schedule of portfolio holdings with the SEC for the first and third quarters of each fiscal year on Form N-PORT. Forms N-PORT are available on the SEC’s web site at http://www.sec.gov. A fund's Forms N-PORT may be reviewed and copied at the SEC’s Public Reference Room in Washington, DC. Information regarding the operation of the SEC's Public Reference Room may be obtained by calling 1-800-SEC-0330.
For a complete list of a fund's portfolio holdings, view the most recent holdings listing, semiannual report, or annual report on Fidelity's web site at http://www.fidelity.com, http://www.institutional.fidelity.com, or http://www.401k.com, as applicable.
NOT FDIC INSURED •MAY LOSE VALUE •NO BANK GUARANTEE
Neither the Fund nor Fidelity Distributors Corporation is a bank.
Investment Summary (Unaudited)
Geographic Diversification (% of fund's net assets)
| As of April 30, 2019 |
| | Japan | 27.0% |
| | United Kingdom | 9.0% |
| | India | 8.0% |
| | United States of America* | 6.7% |
| | Canada | 6.6% |
| | France | 5.7% |
| | Ireland | 5.0% |
| | Germany | 4.7% |
| | Spain | 4.1% |
| | Other | 23.2% |

* Includes Short-Term investments and Net Other Assets (Liabilities).
Percentages are based on country or territory of incorporation and are adjusted for the effect of futures contracts, if applicable.
Asset Allocation as of April 30, 2019
| | % of fund's net assets |
| Stocks | 93.3 |
| Short-Term Investments and Net Other Assets (Liabilities) | 6.7 |
Top Ten Stocks as of April 30, 2019
| | % of fund's net assets |
| Keyence Corp. (Japan, Electronic Equipment & Components) | 6.0 |
| HDFC Bank Ltd. sponsored ADR (India, Banks) | 5.4 |
| Alimentation Couche-Tard, Inc. Class B (sub. vtg.) (Canada, Food & Staples Retailing) | 5.1 |
| Minebea Mitsumi, Inc. (Japan, Machinery) | 4.0 |
| Sika AG (Switzerland, Chemicals) | 3.2 |
| Recruit Holdings Co. Ltd. (Japan, Professional Services) | 3.1 |
| SR Teleperformance SA (France, Professional Services) | 3.0 |
| Capitec Bank Holdings Ltd. (South Africa, Banks) | 2.9 |
| Hannover Reuck SE (Germany, Insurance) | 2.9 |
| Kingspan Group PLC (Ireland) (Ireland, Building Products) | 2.6 |
| | 38.2 |
Top Market Sectors as of April 30, 2019
| | % of fund's net assets |
| Financials | 28.2 |
| Industrials | 21.9 |
| Information Technology | 12.1 |
| Consumer Staples | 11.0 |
| Consumer Discretionary | 8.3 |
| Materials | 3.8 |
| Communication Services | 3.4 |
| Utilities | 1.9 |
| Real Estate | 1.8 |
| Health Care | 0.9 |
Schedule of Investments April 30, 2019 (Unaudited)
Showing Percentage of Net Assets
| Common Stocks - 93.3% | | | |
| | | Shares | Value |
| Australia - 1.6% | | | |
| Magellan Financial Group Ltd. | | 2,503 | $78,714 |
| Bermuda - 2.0% | | | |
| Hiscox Ltd. | | 4,711 | 102,836 |
| Canada - 6.6% | | | |
| Alimentation Couche-Tard, Inc. Class B (sub. vtg.) | | 4,338 | 255,773 |
| Constellation Software, Inc. | | 87 | 76,764 |
|
| TOTAL CANADA | | | 332,537 |
|
| Denmark - 1.9% | | | |
| DONG Energy A/S (a) | | 1,247 | 95,469 |
| France - 5.7% | | | |
| Amundi SA (a) | | 1,344 | 96,551 |
| Capgemini SA | | 314 | 38,071 |
| SR Teleperformance SA | | 798 | 153,320 |
|
| TOTAL FRANCE | | | 287,942 |
|
| Germany - 4.7% | | | |
| Hannover Reuck SE | | 975 | 146,974 |
| Vonovia SE | | 1,844 | 91,974 |
|
| TOTAL GERMANY | | | 238,948 |
|
| India - 8.0% | | | |
| HDFC Bank Ltd. sponsored ADR | | 2,375 | 272,294 |
| Infosys Ltd. sponsored ADR | | 12,094 | 130,131 |
|
| TOTAL INDIA | | | 402,425 |
|
| Indonesia - 4.0% | | | |
| PT Bank Central Asia Tbk | | 50,230 | 101,341 |
| PT Bank Rakyat Indonesia Tbk | | 329,947 | 101,184 |
|
| TOTAL INDONESIA | | | 202,525 |
|
| Ireland - 5.0% | | | |
| Kerry Group PLC Class A | | 1,087 | 121,674 |
| Kingspan Group PLC (Ireland) | | 2,526 | 132,819 |
|
| TOTAL IRELAND | | | 254,493 |
|
| Italy - 0.9% | | | |
| Recordati SpA | | 1,179 | 47,592 |
| Japan - 27.0% | | | |
| Itochu Corp. | | 5,346 | 95,983 |
| Keyence Corp. | | 488 | 302,798 |
| Minebea Mitsumi, Inc. | | 11,241 | 198,795 |
| Misumi Group, Inc. | | 2,351 | 60,740 |
| Nabtesco Corp. | | 1,678 | 51,065 |
| Nitori Holdings Co. Ltd. | | 887 | 105,505 |
| PALTAC Corp. | | 1,775 | 97,359 |
| Recruit Holdings Co. Ltd. | | 5,266 | 157,373 |
| Suzuki Motor Corp. | | 1,734 | 78,843 |
| Tsuruha Holdings, Inc. | | 1,300 | 110,517 |
| Welcia Holdings Co. Ltd. | | 1,699 | 66,728 |
| Zozo, Inc. | | 2,036 | 35,915 |
|
| TOTAL JAPAN | | | 1,361,621 |
|
| Luxembourg - 2.0% | | | |
| B&M European Value Retail SA | | 19,852 | 102,124 |
| Norway - 2.5% | | | |
| Schibsted ASA (A Shares) | | 4,911 | 128,874 |
| South Africa - 2.9% | | | |
| Capitec Bank Holdings Ltd. | | 1,576 | 147,265 |
| Spain - 4.1% | | | |
| CaixaBank SA | | 29,169 | 92,976 |
| Prosegur Cash SA (a) | | 52,419 | 112,413 |
|
| TOTAL SPAIN | | | 205,389 |
|
| Sweden - 2.2% | | | |
| HEXPOL AB (B Shares) | | 3,855 | 30,112 |
| Indutrade AB | | 2,666 | 81,512 |
|
| TOTAL SWEDEN | | | 111,624 |
|
| Switzerland - 3.2% | | | |
| Sika AG | | 1,051 | 160,907 |
| United Kingdom - 9.0% | | | |
| Ascential PLC | | 9,172 | 42,650 |
| Bunzl PLC | | 3,402 | 102,432 |
| Halma PLC | | 2,656 | 62,324 |
| St. James's Place Capital PLC | | 4,851 | 70,943 |
| Standard Life PLC | | 28,004 | 101,847 |
| The Weir Group PLC | | 3,347 | 72,429 |
|
| TOTAL UNITED KINGDOM | | | 452,625 |
|
| TOTAL COMMON STOCKS | | | |
| (Cost $4,687,120) | | | 4,713,910 |
|
| Money Market Funds - 6.1% | | | |
| Fidelity Cash Central Fund, 2.49% (b) | | | |
| (Cost $306,473) | | 306,411 | 306,473 |
| TOTAL INVESTMENT IN SECURITIES - 99.4% | | | |
| (Cost $4,993,593) | | | 5,020,383 |
| NET OTHER ASSETS (LIABILITIES) - 0.6% | | | 29,502 |
| NET ASSETS - 100% | | | $5,049,885 |
Categorizations in the Schedule of Investments are based on country or territory of incorporation.
Legend
(a) Security exempt from registration under Rule 144A of the Securities Act of 1933. These securities may be resold in transactions exempt from registration, normally to qualified institutional buyers. At the end of the period, the value of these securities amounted to $304,433 or 6.0% of net assets.
(b) Affiliated fund that is generally available only to investment companies and other accounts managed by Fidelity Investments. The rate quoted is the annualized seven-day yield of the fund at period end. A complete unaudited listing of the fund's holdings as of its most recent quarter end is available upon request. In addition, each Fidelity Central Fund's financial statements are available on the SEC's website or upon request.
Affiliated Central Funds
Information regarding fiscal year to date income earned by the Fund from investments in Fidelity Central Funds is as follows:
| Fund | Income earned |
| Fidelity Cash Central Fund | $1,787 |
| Total | $1,787 |
Amounts in the income column in the above table include any capital gain distributions from underlying funds, which are presented in the corresponding line-item in the Statement of Operations, if applicable.
Investment Valuation
The following is a summary of the inputs used, as of April 30, 2019, involving the Fund's assets and liabilities carried at fair value. The inputs or methodology used for valuing securities may not be an indication of the risk associated with investing in those securities. For more information on valuation inputs, and their aggregation into the levels used below, please refer to the Investment Valuation section in the accompanying Notes to Financial Statements.
| | Valuation Inputs at Reporting Date: |
| Description | Total | Level 1 | Level 2 | Level 3 |
| Investments in Securities: | | | | |
| Equities: | | | | |
| Communication Services | $171,524 | $171,524 | $-- | $-- |
| Consumer Discretionary | 419,746 | 419,746 | -- | -- |
| Consumer Staples | 554,692 | 554,692 | -- | -- |
| Financials | 1,425,338 | 1,332,362 | 92,976 | -- |
| Health Care | 47,592 | 47,592 | -- | -- |
| Industrials | 1,106,468 | 1,024,956 | 81,512 | -- |
| Information Technology | 610,088 | 610,088 | -- | -- |
| Materials | 191,019 | 160,907 | 30,112 | -- |
| Real Estate | 91,974 | 91,974 | -- | -- |
| Utilities | 95,469 | 95,469 | -- | -- |
| Money Market Funds | 306,473 | 306,473 | -- | -- |
| Total Investments in Securities: | $5,020,383 | $4,815,783 | $204,600 | $-- |
See accompanying notes which are an integral part of the financial statements.
Financial Statements
Statement of Assets and Liabilities
| | | April 30, 2019 (Unaudited) |
| Assets | | |
Investment in securities, at value — See accompanying schedule:
Unaffiliated issuers (cost $4,687,120) | $4,713,910 | |
| Fidelity Central Funds (cost $306,473) | 306,473 | |
| Total Investment in Securities (cost $4,993,593) | | $5,020,383 |
| Cash | | 24,846 |
| Foreign currency held at value (cost $717) | | 717 |
| Dividends receivable | | 2,150 |
| Distributions receivable from Fidelity Central Funds | | 1,787 |
| Other receivables | | 2 |
| Total assets | | 5,049,885 |
| Net Assets | | $5,049,885 |
| Net Assets consist of: | | |
| Paid in capital | | $5,023,414 |
| Total distributable earnings (loss) | | 26,471 |
| Net Assets, for 502,325 shares outstanding | | $5,049,885 |
| Net Asset Value, offering price and redemption price per share ($5,049,885 ÷ 502,325 shares) | | $10.05 |
See accompanying notes which are an integral part of the financial statements.
Statement of Operations
| | | For the period
April 11, 2019 (commencement of operations) to
April 30, 2019 (Unaudited) |
| Investment Income | | |
| Dividends | | $5,013 |
| Income from Fidelity Central Funds | | 1,787 |
| Income before foreign taxes withheld | | 6,800 |
| Less foreign taxes withheld | | (685) |
| Total income | | 6,115 |
| Net investment income (loss) | | 6,115 |
| Realized and Unrealized Gain (Loss) | | |
| Net realized gain (loss) on: | | |
| Foreign currency transactions | $(6,450) | |
| Total net realized gain (loss) | | (6,450) |
| Change in net unrealized appreciation (depreciation) on: | | |
| Investment securities: | | |
| Unaffiliated issuers | 26,790 | |
| Assets and liabilities in foreign currencies | 16 | |
| Total change in net unrealized appreciation (depreciation) | | 26,806 |
| Net gain (loss) | | 20,356 |
| Net increase (decrease) in net assets resulting from operations | | $26,471 |
See accompanying notes which are an integral part of the financial statements.
Statement of Changes in Net Assets
| | For the period
April 11, 2019 (commencement of operations) to
April 30, 2019 (Unaudited) |
| Increase (Decrease) in Net Assets | |
| Operations | |
| Net investment income (loss) | $6,115 |
| Net realized gain (loss) | (6,450) |
| Change in net unrealized appreciation (depreciation) | 26,806 |
| Net increase (decrease) in net assets resulting from operations | 26,471 |
| Share transactions | |
| Proceeds from sales of shares | 5,023,946 |
| Cost of shares redeemed | (532) |
| Net increase (decrease) in net assets resulting from share transactions | 5,023,414 |
| Total increase (decrease) in net assets | 5,049,885 |
| Net Assets | |
| Beginning of period | – |
| End of period | $5,049,885 |
| Other Information | |
| Shares | |
| Sold | 502,378 |
| Redeemed | (53) |
| Net increase (decrease) | 502,325 |
See accompanying notes which are an integral part of the financial statements.
Financial Highlights
Fidelity SAI International SMA Completion Fund
| | Six months ended (Unaudited) April 30, |
| | 2019 A |
| Selected Per–Share Data | |
| Net asset value, beginning of period | $10.00 |
| Income from Investment Operations | |
| Net investment income (loss)B | .01 |
| Net realized and unrealized gain (loss) | .04 |
| Total from investment operations | .05 |
| Net asset value, end of period | $10.05 |
| Total ReturnC | .50% |
| Ratios to Average Net AssetsD,E | |
| Expenses before reductions | -% |
| Expenses net of fee waivers, if any | -% |
| Expenses net of all reductions | -% |
| Net investment income (loss) | 2.36%F |
| Supplemental Data | |
| Net assets, end of period (000 omitted) | $5,050 |
| Portfolio turnover rateG | 0% |
A For the period April 11, 2019 (commencement of operations) to April 30, 2019.
B Calculated based on average shares outstanding during the period.
C Total returns for periods of less than one year are not annualized.
D Fees and expenses of any underlying Fidelity Central Funds are not included in the Fund's expense ratio. The Fund indirectly bears its proportionate share of the expenses of any underlying Fidelity Central Funds.
E Expense ratios reflect operating expenses of the Fund. Expenses before reductions do not reflect amounts reimbursed by the investment adviser or reductions from expense offset arrangements and do not represent the amount paid by the Fund during periods when reimbursements or reductions occur. Expenses net of fee waivers reflect expenses after reimbursement by the investment adviser but prior to reductions from expense offset arrangements. Expenses net of all reductions represent the net expenses paid by the Fund.
F Annualized
G Amount does not include the portfolio activity of any underlying Fidelity Central Funds.
See accompanying notes which are an integral part of the financial statements.
Notes to Financial Statements (Unaudited)
For the period ended April 30, 2019
(Amounts in thousands except percentages)
1. Organization.
Fidelity SAI International SMA Completion Fund (the Fund) is a fund of Fidelity Investment Trust (the Trust) and is authorized to issue an unlimited number of shares. Shares are offered exclusively to certain clients of Fidelity Management & Research Company (FMR) or its affiliates. The Trust is registered under the Investment Company Act of 1940, as amended (the 1940 Act), as an open-end management investment company organized as a Massachusetts business trust. The Fund's investments in emerging markets can be subject to social, economic, regulatory, and political uncertainties and can be extremely volatile.
2. Investments in Fidelity Central Funds.
The Fund invests in Fidelity Central Funds, which are open-end investment companies generally available only to other investment companies and accounts managed by the investment adviser and its affiliates. The Fund's Schedule of Investments lists each of the Fidelity Central Funds held as of period end, if any, as an investment of the Fund, but does not include the underlying holdings of each Fidelity Central Fund. As an Investing Fund, the Fund indirectly bears its proportionate share of the expenses of the underlying Fidelity Central Funds.
The Money Market Central Funds seek preservation of capital and current income and are managed by Fidelity Investments Money Management, Inc. (FIMM), an affiliate of the investment adviser. Annualized expenses of the Money Market Central Funds as of their most recent shareholder report date are less than .005%.
A complete unaudited list of holdings for each Fidelity Central Fund is available upon request or at the Securities and Exchange Commission (the SEC) website at www.sec.gov. In addition, the financial statements of the Fidelity Central Funds are available on the SEC website or upon request.
3. Significant Accounting Policies.
The Fund is an investment company and applies the accounting and reporting guidance of the Financial Accounting Standards Board (FASB) Accounting Standards Codification Topic 946 Financial Services – Investments Companies. The financial statements have been prepared in conformity with accounting principles generally accepted in the United States of America (GAAP), which require management to make certain estimates and assumptions at the date of the financial statements. Actual results could differ from those estimates. Subsequent events, if any, through the date that the financial statements were issued have been evaluated in the preparation of the financial statements. The following summarizes the significant accounting policies of the Fund:
Investment Valuation. Investments are valued as of 4:00 p.m. Eastern time on the last calendar day of the period. The Board of Trustees (the Board) has delegated the day to day responsibility for the valuation of the Fund's investments to the Fair Value Committee (the Committee) established by the Fund's investment adviser. In accordance with valuation policies and procedures approved by the Board, the Fund attempts to obtain prices from one or more third party pricing vendors or brokers to value its investments. When current market prices, quotations or currency exchange rates are not readily available or reliable, investments will be fair valued in good faith by the Committee, in accordance with procedures adopted by the Board. Factors used in determining fair value vary by investment type and may include market or investment specific events. The frequency with which these procedures are used cannot be predicted and they may be utilized to a significant extent. The Committee oversees the Fund's valuation policies and procedures and reports to the Board on the Committee's activities and fair value determinations. The Board monitors the appropriateness of the procedures used in valuing the Fund's investments and ratifies the fair value determinations of the Committee.
The Fund categorizes the inputs to valuation techniques used to value its investments into a disclosure hierarchy consisting of three levels as shown below:
- Level 1 – quoted prices in active markets for identical investments
- Level 2 – other significant observable inputs (including quoted prices for similar investments, interest rates, prepayment speeds, etc.)
- Level 3 – unobservable inputs (including the Fund's own assumptions based on the best information available)
Valuation techniques used to value the Fund's investments by major category are as follows:
Equity securities, including restricted securities, for which market quotations are readily available, are valued at the last reported sale price or official closing price as reported by a third party pricing vendor on the primary market or exchange on which they are traded and are categorized as Level 1 in the hierarchy. In the event there were no sales during the day or closing prices are not available, securities are valued at the last quoted bid price or may be valued using the last available price and are generally categorized as Level 2 in the hierarchy. For foreign equity securities, when market or security specific events arise, comparisons to the valuation of American Depositary Receipts (ADRs), futures contracts, Exchange-Traded Funds (ETFs) and certain indexes as well as quoted prices for similar securities may be used and would be categorized as Level 2 in the hierarchy. For equity securities, including restricted securities, where observable inputs are limited, assumptions about market activity and risk are used and these securities may be categorized as Level 3 in the hierarchy.
Investments in open-end mutual funds, including the Fidelity Central Funds, are valued at their closing net asset value (NAV) each business day and are categorized as Level 1 in the hierarchy.
Changes in valuation techniques may result in transfers in or out of an assigned level within the disclosure hierarchy. The aggregate value of investments by input level as of April 30, 2019 is included at the end of the Fund's Schedule of Investments.
Foreign Currency. The Fund may use foreign currency contracts to facilitate transactions in foreign-denominated securities. Gains and losses from these transactions may arise from changes in the value of the foreign currency or if the counterparties do not perform under the contracts' terms.
Foreign-denominated assets, including investment securities, and liabilities are translated into U.S. dollars at the exchange rates at period end. Purchases and sales of investment securities, income and dividends received and expenses denominated in foreign currencies are translated into U.S. dollars at the exchange rate in effect on the transaction date.
The effects of exchange rate fluctuations on investments are included with the net realized and unrealized gain (loss) on investment securities. Other foreign currency transactions resulting in realized and unrealized gain (loss) are disclosed separately.
Investment Transactions and Income. For financial reporting purposes, the Fund's investment holdings and NAV include trades executed through the end of the last business day of the period. The NAV per share for processing shareholder transactions is calculated as of the close of business of the New York Stock Exchange (NYSE), normally 4:00 p.m. Eastern time and includes trades executed through the end of the prior business day. Gains and losses on securities sold are determined on the basis of identified cost. Dividend income is recorded on the ex-dividend date, except for certain dividends from foreign securities where the ex-dividend date may have passed, which are recorded as soon as the Fund is informed of the ex-dividend date. Non-cash dividends included in dividend income, if any, are recorded at the fair market value of the securities received. Income and capital gain distributions from Fidelity Central Funds, if any, are recorded on the ex-dividend date. Investment income is recorded net of foreign taxes withheld where recovery of such taxes is uncertain.
Expenses. Expenses directly attributable to a fund are charged to that fund. Expenses attributable to more than one fund are allocated among the respective funds on the basis of relative net assets or other appropriate methods. Expense estimates are accrued in the period to which they relate and adjustments are made when actual amounts are known.
Income Tax Information and Distributions to Shareholders. Each year, the Fund intends to qualify as a regulated investment company under Subchapter M of the Internal Revenue Code, including distributing substantially all of its taxable income and realized gains. As a result, no provision for U.S. Federal income taxes is required. The Fund files a U.S. federal tax return, in addition to state and local tax returns as required. The Fund's federal income tax returns are subject to examination by the Internal Revenue Service (IRS) for a period of three fiscal years after they are filed. State and local tax returns may be subject to examination for an additional fiscal year depending on the jurisdiction. Foreign taxes are provided for based on the Fund's understanding of the tax rules and rates that exist in the foreign markets in which it invests.
Distributions are declared and recorded on the ex-dividend date. Income and capital gain distributions are determined in accordance with income tax regulations, which may differ from GAAP.
Capital accounts within the financial statements are adjusted for permanent book-tax differences. These adjustments have no impact on net assets or the results of operations. Capital accounts are not adjusted for temporary book-tax differences which will reverse in a subsequent period.
As of period end, the cost and unrealized appreciation (depreciation) in securities, and derivatives if applicable, for federal income tax purposes were as follows:
| Gross unrealized appreciation | $95,413 |
| Gross unrealized depreciation | (68,623) |
| Net unrealized appreciation (depreciation) | $26,790 |
| Tax cost | $4,993,593 |
Restricted Securities. The Fund may invest in securities that are subject to legal or contractual restrictions on resale. These securities generally may be resold in transactions exempt from registration or to the public if the securities are registered. Disposal of these securities may involve time-consuming negotiations and expense, and prompt sale at an acceptable price may be difficult. Information regarding restricted securities is included at the end of the Fund's Schedule of Investments.
4. Purchases and Sales of Investments.
Purchases and sales of securities, other than short-term securities, aggregated $4,687,120 and $0, respectively.
5. Fees and Other Transactions with Affiliates.
Management Fee. Fidelity Management & Research Company (the investment adviser) and its affiliates provide the Fund with investment management related services and the Fund does not pay any fees for these services. Under the management contract, the investment adviser or an affiliate pays all other expenses of the Fund, excluding fees and expenses of the independent Trustees, and certain miscellaneous expenses such as proxy and shareholder meeting expenses.
Interfund Trades. The Fund may purchase from or sell securities to other Fidelity Funds under procedures adopted by the Board. The procedures have been designed to ensure these interfund trades are executed in accordance with Rule 17a-7 of the 1940 Act. Interfund trades are included within the respective purchases and sales amounts shown in the Purchases and Sales of Investments note.
6. Other.
The Fund's organizational documents provide former and current trustees and officers with a limited indemnification against liabilities arising in connection with the performance of their duties to the Fund. In the normal course of business, the Fund may also enter into contracts that provide general indemnifications. The Fund's maximum exposure under these arrangements is unknown as this would be dependent on future claims that may be made against the Fund. The risk of material loss from such claims is considered remote.
At the end of the period, the investment adviser or its affiliates were the owners of record of 100% of the total outstanding shares of the Fund.
Shareholder Expense Example
As a shareholder of the Fund, you incur two types of costs: (1) transaction costs and (2) ongoing costs, including management fees and other Fund expenses. This Example is intended to help you understand your ongoing costs (in dollars) of investing in the Fund and to compare these costs with the ongoing costs of investing in other mutual funds.
The actual expense Example is based on an investment of $1,000 invested at the beginning of the period and held for the entire period (April 11, 2019 to April 30, 2019). The hypothetical expense Example is based on an investment of $1,000 invested for the one-half year period (November 1, 2018 to April 30, 2019).
Actual Expenses
The first line of the accompanying table provides information about actual account values and actual expenses. You may use the information in this line, together with the amount you invested, to estimate the expenses that you paid over the period. Simply divide your account value by $1,000.00 (for example, an $8,600 account value divided by $1,000.00 = 8.6), then multiply the result by the number in the first line under the heading entitled "Expenses Paid During Period" to estimate the expenses you paid on your account during this period. In addition, the Fund, as a shareholder in the underlying Fidelity Central Funds, will indirectly bear its pro-rata share of the fees and expenses incurred by the underlying Fidelity Central Funds. These fees and expenses are not included in the Fund's annualized expense ratio used to calculate the expense estimate in the table below.
Hypothetical Example for Comparison Purposes
The second line of the accompanying table provides information about hypothetical account values and hypothetical expenses based on the Fund's actual expense ratio and an assumed rate of return of 5% per year before expenses, which is not the Fund's actual return. The hypothetical account values and expenses may not be used to estimate the actual ending account balance or expenses you paid for the period. You may use this information to compare the ongoing costs of investing in the Fund and other funds. To do so, compare this 5% hypothetical example with the 5% hypothetical examples that appear in the shareholder reports of the other funds. In addition, the Fund, as a shareholder in the underlying Fidelity Central Funds, will indirectly bear its pro-rata share of the fees and expenses incurred by the underlying Fidelity Central Funds. These fees and expenses are not included in the Fund's annualized expense ratio used to calculate the expense estimate in the table below.
Please note that the expenses shown in the table are meant to highlight your ongoing costs only and do not reflect any transaction costs. Therefore, the second line of the table is useful in comparing ongoing costs only, and will not help you determine the relative total costs of owning different funds.
| | Annualized Expense Ratio-A | Beginning
Account Value | Ending
Account Value
April 30, 2019 | Expenses Paid
During Period |
| Actual | - % | $1,000.00 | $1,005.00 | $--B |
| Hypothetical-C | | $1,000.00 | $1,024.79 | $--D |
A Annualized expense ratio reflects expenses net of applicable fee waivers.
B Actual expenses are equal to the Fund's annualized expense ratio, multiplied by the average account value over the period, multiplied by 20/365 (to reflect the period April 11, 2019 to April 30, 2019).
C 5% return per year before expenses
D Hypothetical expenses are equal to the Fund's annualized expense ratio, multiplied by the average account value over the period, multiplied by 181/365 (to reflect the one-half year period).
Board Approval of Investment Advisory Contracts and Management Fees
Fidelity SAI International SMA Completion Fund
On January 23, 2019, the Board of Trustees, including the Independent Trustees (together, the Board), voted to approve the management contract with Fidelity Management & Research Company (FMR) and the sub-advisory agreements with affiliates of FMR (together, the Advisory Contracts) for the fund. FMR and the sub-advisers are collectively referred to herein as the Investment Advisers. The Board, assisted by the advice of fund counsel and Independent Trustees' counsel, considered a broad range of information.
Nature, Extent, and Quality of Services Provided. The Board considered Fidelity's staffing as it relates to the fund, including the backgrounds of investment personnel of Fidelity, and also considered the fund's investment objective, strategies, and related investment philosophy. The Board considered the structure of the investment personnel compensation program and whether this structure provides appropriate incentives to act in the best interests of the fund.
Resources Dedicated to Investment Management and Support Services. The Board and the Fund Oversight and Research Committees reviewed the general qualifications and capabilities of Fidelity's investment staff, including its size, education, experience, and resources, as well as Fidelity's approach to recruiting, training, managing, and compensating investment personnel. The Board noted that Fidelity has continued to increase the resources devoted to non-U.S. offices, including expansion of Fidelity's global investment organization. The Board also noted that Fidelity's analysts have extensive resources, tools and capabilities that allow them to conduct sophisticated quantitative and fundamental analysis, as well as credit analysis of issuers, counterparties and guarantors. Further, the Board considered that Fidelity's investment professionals have sufficient access to global information and data so as to provide competitive investment results over time, and that those professionals also have access to sophisticated tools that permit them to assess portfolio construction and risk and performance attribution characteristics continuously, as well as to transmit new information and research conclusions rapidly around the world. Additionally, in its deliberations, the Board considered Fidelity's trading, risk management, compliance, and technology and operations
capabilities and resources, which are integral parts of the investment management process.Administrative Services. The Board considered the nature, extent, quality, and cost of advisory, administrative, and shareholder services to be performed by the Investment Advisers and their affiliates under the Advisory Contracts and under separate agreements covering transfer agency, and pricing and bookkeeping, and securities lending services for the fund. The Board also considered the nature and extent of the supervision of third party service providers, principally custodians, subcustodians, and pricing vendors.
The Board noted that the growth of fund assets over time across the complex allows Fidelity to reinvest in the development of services designed to enhance the value and convenience of the Fidelity funds as investment vehicles. These services include 24-hour access to account information and market information through telephone representatives and over the Internet, investor education materials and asset allocation tools, and the expanded availability of Fidelity Investor Centers.
Investment Performance. The fund is a new fund and therefore had no historical performance for the Board to review at the time it approved the fund's Advisory Contracts. The Board considered the Investment Advisers' strength in fundamental, research-driven security selection, which the Board is familiar with through its supervision of other Fidelity funds.
Based on its review, the Board concluded that the nature, extent, and quality of services to be provided to the fund under the Advisory Contracts should benefit the shareholders of the fund.
Competitiveness of Management Fee and Total Expense Ratio. The Board noted that the fund is available exclusively certain Fidelity fee-based programs. The Board considered that while the fund does not pay a management fee, FMR is indirectly compensated for its services out of revenues received from certain fee-based programs or products offered by Fidelity. The Board noted that FMR or an affiliate pays all operating expenses, with certain limited exceptions, on behalf of the fund. Based on its review, the Board concluded that the fund's management fee and projected total expense ratio were reasonable in light of the services that the fund and its shareholders will receive and the other factors considered.
Costs of the Services and Profitability. The fund is a new fund and therefore no revenue, cost, or profitability data was available for the Board to review in respect of the fund at the time it approved the Advisory Contracts. In connection with its future renewal of the fund's Advisory Contracts, the Board will consider the revenues earned and the expenses incurred by Fidelity in conducting the business of developing, marketing, distributing, managing, administering and servicing the fund and servicing the fund's shareholders.
Economies of Scale. The Board concluded that because the fund will pay no advisory fees and FMR or an affiliate will bear all expenses of the fund, with certain limited exceptions, the realization of economies of scale was not a material factor in the Board's decision to approve the fund's Advisory Contracts.
Based on its evaluation of all of the conclusions noted above, and after considering all factors it believed relevant, the Board concluded that the advisory fee arrangements are fair and reasonable, and that the fund's Advisory Contracts should be approved.
ISM-SANN-0619
1.9893099.100
Fidelity® International Capital Appreciation K6 Fund
Semi-Annual Report April 30, 2019 |
|
Beginning on January 1, 2021, as permitted by regulations adopted by the Securities and Exchange Commission, paper copies of a fund’s shareholder reports will no longer be sent by mail, unless you specifically request paper copies of the reports from the fund or from your financial intermediary, such as a financial advisor, broker-dealer or bank. Instead, the reports will be made available on a website, and you will be notified by mail each time a report is posted and provided with a website link to access the report.
If you already elected to receive shareholder reports electronically, you will not be affected by this change and you need not take any action. You may elect to receive shareholder reports and other communications from a fund electronically, by contacting your financial intermediary. For Fidelity customers, visit Fidelity's web site or call Fidelity using the contact information listed below.
You may elect to receive all future reports in paper free of charge. If you wish to continue receiving paper copies of your shareholder reports, you may contact your financial intermediary or, if you are a Fidelity customer, visit Fidelity’s website, or call Fidelity at the applicable toll-free number listed below. Your election to receive reports in paper will apply to all funds held with the fund complex/your financial intermediary.
| Account Type | Website | Phone Number |
| Brokerage, Mutual Fund, or Annuity Contracts: | fidelity.com/mailpreferences | 1-800-343-3548 |
| Employer Provided Retirement Accounts: | netbenefits.fidelity.com/preferences (choose 'no' under Required Disclosures to continue to print) | 1-800-343-0860 |
| Advisor Sold Accounts Serviced Through Your Financial Intermediary: | Contact Your Financial Intermediary | Your Financial Intermediary's phone number |
| Advisor Sold Accounts Serviced by Fidelity: | institutional.fidelity.com | 1-877-208-0098 |
Contents
To view a fund's proxy voting guidelines and proxy voting record for the 12-month period ended June 30, visit http://www.fidelity.com/proxyvotingresults or visit the Securities and Exchange Commission's (SEC) web site at http://www.sec.gov.
You may also call 1-800-835-5092 to request a free copy of the proxy voting guidelines.
Standard & Poor's, S&P and S&P 500 are registered service marks of The McGraw-Hill Companies, Inc. and have been licensed for use by Fidelity Distributors Corporation.
Other third-party marks appearing herein are the property of their respective owners.
All other marks appearing herein are registered or unregistered trademarks or service marks of FMR LLC or an affiliated company. © 2019 FMR LLC. All rights reserved.
This report and the financial statements contained herein are submitted for the general information of the shareholders of the Fund. This report is not authorized for distribution to prospective investors in the Fund unless preceded or accompanied by an effective prospectus.
A fund files its complete schedule of portfolio holdings with the SEC for the first and third quarters of each fiscal year on Form N-PORT. Forms N-PORT are available on the SEC’s web site at http://www.sec.gov. A fund's Forms N-PORT may be reviewed and copied at the SEC’s Public Reference Room in Washington, DC. Information regarding the operation of the SEC's Public Reference Room may be obtained by calling 1-800-SEC-0330.
For a complete list of a fund's portfolio holdings, view the most recent holdings listing, semiannual report, or annual report on Fidelity's web site at http://www.fidelity.com, http://www.institutional.fidelity.com, or http://www.401k.com, as applicable.
NOT FDIC INSURED •MAY LOSE VALUE •NO BANK GUARANTEE
Neither the Fund nor Fidelity Distributors Corporation is a bank.
Investment Summary (Unaudited)
Geographic Diversification (% of fund's net assets)
| As of April 30, 2019 |
| | United States of America* | 18.2% |
| | France | 10.2% |
| | United Kingdom | 7.6% |
| | Germany | 7.0% |
| | Netherlands | 6.3% |
| | Switzerland | 5.8% |
| | Canada | 5.8% |
| | Cayman Islands | 4.9% |
| | Japan | 4.5% |
| | Other | 29.7% |
* Includes Short-Term investments and Net Other Assets (Liabilities).
Percentages are based on country or territory of incorporation and are adjusted for the effect of futures contracts, if applicable.
Asset Allocation as of April 30, 2019
| | % of fund's net assets |
| Stocks | 97.1 |
| Short-Term Investments and Net Other Assets (Liabilities) | 2.9 |
Top Ten Stocks as of April 30, 2019
| | % of fund's net assets |
| Nestle SA (Reg. S) (Switzerland, Food Products) | 2.2 |
| Tencent Holdings Ltd. (Cayman Islands, Interactive Media & Services) | 2.1 |
| Alibaba Group Holding Ltd. sponsored ADR (Cayman Islands, Internet & Direct Marketing Retail) | 1.9 |
| Taiwan Semiconductor Manufacturing Co. Ltd. sponsored ADR (Taiwan, Semiconductors & Semiconductor Equipment) | 1.8 |
| Unilever NV (Certificaten Van Aandelen) (Bearer) (Netherlands, Personal Products) | 1.6 |
| SAP SE (Germany, Software) | 1.5 |
| Naspers Ltd. Class N (South Africa, Internet & Direct Marketing Retail) | 1.4 |
| AIA Group Ltd. (Hong Kong, Insurance) | 1.4 |
| LVMH Moet Hennessy - Louis Vuitton SA (France, Textiles, Apparel & Luxury Goods) | 1.4 |
| Diageo PLC (United Kingdom, Beverages) | 1.3 |
| | 16.6 |
Top Market Sectors as of April 30, 2019
| | % of fund's net assets |
| Information Technology | 19.9 |
| Industrials | 15.6 |
| Financials | 14.8 |
| Consumer Staples | 12.6 |
| Consumer Discretionary | 12.1 |
| Health Care | 8.1 |
| Materials | 4.3 |
| Real Estate | 3.9 |
| Utilities | 2.6 |
| Communication Services | 2.1 |
Schedule of Investments April 30, 2019 (Unaudited)
Showing Percentage of Net Assets
| Common Stocks - 96.1% | | | |
| | | Shares | Value |
| Australia - 1.1% | | | |
| CSL Ltd. | | 33,745 | $4,723,690 |
| Bailiwick of Jersey - 0.9% | | | |
| Experian PLC | | 134,494 | 3,914,974 |
| Bermuda - 0.9% | | | |
| Credicorp Ltd. (United States) | | 15,700 | 3,719,330 |
| Brazil - 2.7% | | | |
| BM&F BOVESPA SA | | 469,800 | 4,127,569 |
| Equatorial Energia SA | | 175,500 | 3,674,619 |
| Rumo SA (a) | | 764,100 | 3,527,125 |
|
| TOTAL BRAZIL | | | 11,329,313 |
|
| Canada - 5.8% | | | |
| Alimentation Couche-Tard, Inc. Class B (sub. vtg.) | | 67,818 | 3,998,614 |
| Brookfield Asset Management, Inc. | | 85,300 | 4,110,607 |
| Canadian National Railway Co. | | 50,308 | 4,672,932 |
| Canadian Pacific Railway Ltd. | | 18,483 | 4,141,257 |
| Constellation Software, Inc. | | 4,219 | 3,722,590 |
| Waste Connection, Inc. (Canada) | | 41,327 | 3,835,634 |
|
| TOTAL CANADA | | | 24,481,634 |
|
| Cayman Islands - 4.9% | | | |
| Alibaba Group Holding Ltd. sponsored ADR (a) | | 43,630 | 8,096,419 |
| Shenzhou International Group Holdings Ltd. | | 269,400 | 3,616,130 |
| Tencent Holdings Ltd. | | 181,200 | 8,930,924 |
|
| TOTAL CAYMAN ISLANDS | | | 20,643,473 |
|
| China - 0.8% | | | |
| Kweichow Moutai Co. Ltd. (A Shares) | | 24,047 | 3,477,673 |
| Denmark - 1.8% | | | |
| DONG Energy A/S (b) | | 48,500 | 3,713,114 |
| DSV de Sammensluttede Vognmaend A/S | | 42,800 | 3,954,449 |
|
| TOTAL DENMARK | | | 7,667,563 |
|
| France - 10.2% | | | |
| Dassault Systemes SA | | 25,422 | 4,021,803 |
| Hermes International SCA | | 5,523 | 3,885,251 |
| Kering SA | | 7,281 | 4,303,677 |
| L'Oreal SA | | 17,247 | 4,741,272 |
| LVMH Moet Hennessy - Louis Vuitton SA | | 14,620 | 5,740,064 |
| Orpea | | 30,753 | 3,749,342 |
| Pernod Ricard SA | | 23,593 | 4,110,858 |
| Safran SA | | 30,827 | 4,493,378 |
| SR Teleperformance SA | | 18,630 | 3,579,383 |
| VINCI SA | | 44,409 | 4,485,142 |
|
| TOTAL FRANCE | | | 43,110,170 |
|
| Germany - 7.0% | | | |
| adidas AG | | 16,462 | 4,230,052 |
| Deutsche Borse AG | | 29,300 | 3,915,135 |
| Linde PLC | | 19,100 | 3,436,179 |
| SAP SE | | 49,500 | 6,380,958 |
| Symrise AG | | 37,008 | 3,557,250 |
| Vonovia SE | | 79,700 | 3,975,241 |
| Wirecard AG (c) | | 27,374 | 4,104,948 |
|
| TOTAL GERMANY | | | 29,599,763 |
|
| Hong Kong - 1.4% | | | |
| AIA Group Ltd. | | 564,800 | 5,783,233 |
| India - 3.6% | | | |
| HDFC Bank Ltd. | | 62,257 | 2,065,419 |
| HDFC Bank Ltd. sponsored ADR | | 10,810 | 1,239,367 |
| Housing Development Finance Corp. Ltd. | | 138,873 | 3,978,040 |
| Kotak Mahindra Bank Ltd. | | 172,445 | 3,433,078 |
| Reliance Industries Ltd. | | 233,185 | 4,663,231 |
|
| TOTAL INDIA | | | 15,379,135 |
|
| Indonesia - 0.9% | | | |
| PT Bank Central Asia Tbk | | 1,960,000 | 3,954,386 |
| Ireland - 2.6% | | | |
| Accenture PLC Class A | | 19,553 | 3,571,747 |
| Kerry Group PLC Class A | | 32,900 | 3,682,684 |
| Kingspan Group PLC (Ireland) | | 71,500 | 3,759,513 |
|
| TOTAL IRELAND | | | 11,013,944 |
|
| Israel - 0.9% | | | |
| NICE Systems Ltd. sponsored ADR (a) | | 28,700 | 3,956,582 |
| Italy - 1.7% | | | |
| Amplifon SpA | | 174,674 | 3,356,013 |
| Moncler SpA | | 90,000 | 3,691,522 |
|
| TOTAL ITALY | | | 7,047,535 |
|
| Japan - 4.5% | | | |
| Hoya Corp. | | 57,700 | 4,047,987 |
| Kao Corp. | | 57,518 | 4,418,345 |
| Keyence Corp. | | 7,432 | 4,611,516 |
| OBIC Co. Ltd. | | 35,300 | 4,075,210 |
| Relo Group, Inc. (d) | | 69,130 | 1,880,371 |
|
| TOTAL JAPAN | | | 19,033,429 |
|
| Netherlands - 6.3% | | | |
| ASML Holding NV (Netherlands) | | 25,520 | 5,310,754 |
| Ferrari NV | | 26,200 | 3,548,350 |
| Heineken NV (Bearer) | | 38,000 | 4,101,826 |
| Interxion Holding N.V. (a) | | 50,615 | 3,502,052 |
| Unilever NV (Certificaten Van Aandelen) (Bearer) | | 111,000 | 6,716,009 |
| Wolters Kluwer NV | | 53,100 | 3,703,252 |
|
| TOTAL NETHERLANDS | | | 26,882,243 |
|
| Philippines - 0.9% | | | |
| SM Prime Holdings, Inc. | | 4,706,900 | 3,769,339 |
| South Africa - 3.1% | | | |
| Capitec Bank Holdings Ltd. | | 36,703 | 3,429,607 |
| FirstRand Ltd. | | 802,200 | 3,808,277 |
| Naspers Ltd. Class N | | 22,901 | 5,891,295 |
|
| TOTAL SOUTH AFRICA | | | 13,129,179 |
|
| Spain - 1.0% | | | |
| Amadeus IT Holding SA Class A | | 52,324 | 4,162,054 |
| Sweden - 2.6% | | | |
| ASSA ABLOY AB (B Shares) | | 179,500 | 3,837,273 |
| Hexagon AB (B Shares) | | 68,359 | 3,734,605 |
| Swedish Match Co. AB | | 73,900 | 3,603,335 |
|
| TOTAL SWEDEN | | | 11,175,213 |
|
| Switzerland - 5.8% | | | |
| Givaudan SA | | 1,478 | 3,827,903 |
| Nestle SA (Reg. S) | | 96,200 | 9,261,910 |
| Partners Group Holding AG | | 4,736 | 3,567,745 |
| Sika AG | | 25,681 | 3,931,730 |
| Temenos Group AG | | 23,576 | 3,919,500 |
|
| TOTAL SWITZERLAND | | | 24,508,788 |
|
| Taiwan - 1.8% | | | |
| Taiwan Semiconductor Manufacturing Co. Ltd. sponsored ADR | | 177,539 | 7,779,759 |
| United Kingdom - 7.6% | | | |
| Bunzl PLC | | 119,001 | 3,583,044 |
| Compass Group PLC | | 177,479 | 4,038,332 |
| Croda International PLC | | 52,226 | 3,528,401 |
| Diageo PLC | | 130,572 | 5,504,617 |
| InterContinental Hotel Group PLC | | 56,086 | 3,633,404 |
| London Stock Exchange Group PLC | | 59,447 | 3,897,542 |
| RELX PLC (London Stock Exchange) | | 191,792 | 4,399,202 |
| Rentokil Initial PLC | | 709,790 | 3,609,708 |
|
| TOTAL UNITED KINGDOM | | | 32,194,250 |
|
| United States of America - 15.3% | | | |
| Adobe, Inc. (a) | | 12,623 | 3,651,203 |
| American Tower Corp. | | 18,900 | 3,691,170 |
| Becton, Dickinson & Co. | | 14,800 | 3,562,952 |
| Boston Scientific Corp. (a) | | 97,800 | 3,630,336 |
| Crown Castle International Corp. | | 28,500 | 3,584,730 |
| Fiserv, Inc. (a) | | 39,400 | 3,437,256 |
| HEICO Corp. Class A | | 37,815 | 3,381,795 |
| Intuitive Surgical, Inc. (a) | | 6,900 | 3,523,347 |
| Marsh & McLennan Companies, Inc. | | 36,200 | 3,413,298 |
| MasterCard, Inc. Class A | | 14,282 | 3,631,056 |
| Microsoft Corp. | | 28,691 | 3,747,045 |
| Moody's Corp. | | 18,458 | 3,629,212 |
| NextEra Energy, Inc. | | 18,100 | 3,519,364 |
| Salesforce.com, Inc. (a) | | 22,300 | 3,687,305 |
| Stryker Corp. | | 19,400 | 3,664,854 |
| Thermo Fisher Scientific, Inc. | | 13,688 | 3,797,736 |
| TransDigm Group, Inc. (a) | | 7,065 | 3,409,004 |
| Visa, Inc. Class A | | 21,933 | 3,606,443 |
|
| TOTAL UNITED STATES OF AMERICA | | | 64,568,106 |
|
| TOTAL COMMON STOCKS | | | |
| (Cost $349,506,055) | | | 407,004,758 |
|
| Nonconvertible Preferred Stocks - 1.0% | | | |
| Brazil - 1.0% | | | |
| Itau Unibanco Holding SA sponsored ADR | | | |
| (Cost $4,169,907) | | 503,017 | 4,351,097 |
|
| Money Market Funds - 3.5% | | | |
| Fidelity Cash Central Fund, 2.49% (e) | | 10,972,806 | 10,975,001 |
| Fidelity Securities Lending Cash Central Fund 2.49% (e)(f) | | 3,647,435 | 3,647,800 |
| TOTAL MONEY MARKET FUNDS | | | |
| (Cost $14,622,801) | | | 14,622,801 |
| TOTAL INVESTMENT IN SECURITIES - 100.6% | | | |
| (Cost $368,298,763) | | | 425,978,656 |
| NET OTHER ASSETS (LIABILITIES) - (0.6)% | | | (2,670,784) |
| NET ASSETS - 100% | | | $423,307,872 |
Categorizations in the Schedule of Investments are based on country or territory of incorporation.
Legend
(a) Non-income producing
(b) Security exempt from registration under Rule 144A of the Securities Act of 1933. These securities may be resold in transactions exempt from registration, normally to qualified institutional buyers. At the end of the period, the value of these securities amounted to $3,713,114 or 0.9% of net assets.
(c) Security or a portion of the security is on loan at period end.
(d) A portion of the security sold on a delayed delivery basis.
(e) Affiliated fund that is generally available only to investment companies and other accounts managed by Fidelity Investments. The rate quoted is the annualized seven-day yield of the fund at period end. A complete unaudited listing of the fund's holdings as of its most recent quarter end is available upon request. In addition, each Fidelity Central Fund's financial statements are available on the SEC's website or upon request.
(f) Investment made with cash collateral received from securities on loan.
Affiliated Central Funds
Information regarding fiscal year to date income earned by the Fund from investments in Fidelity Central Funds is as follows:
| Fund | Income earned |
| Fidelity Cash Central Fund | $58,290 |
| Fidelity Securities Lending Cash Central Fund | 79,980 |
| Total | $138,270 |
Amounts in the income column in the above table include any capital gain distributions from underlying funds, which are presented in the corresponding line-item in the Statement of Operations, if applicable.
Investment Valuation
The following is a summary of the inputs used, as of April 30, 2019, involving the Fund's assets and liabilities carried at fair value. The inputs or methodology used for valuing securities may not be an indication of the risk associated with investing in those securities. For more information on valuation inputs, and their aggregation into the levels used below, please refer to the Investment Valuation section in the accompanying Notes to Financial Statements.
| | Valuation Inputs at Reporting Date: |
| Description | Total | Level 1 | Level 2 | Level 3 |
| Investments in Securities: | | | | |
| Equities: | | | | |
| Communication Services | $8,930,924 | $-- | $8,930,924 | $-- |
| Consumer Discretionary | 50,674,496 | 35,004,805 | 15,669,691 | -- |
| Consumer Staples | 53,617,143 | 28,531,272 | 25,085,871 | -- |
| Energy | 4,663,231 | 4,663,231 | -- | -- |
| Financials | 62,422,942 | 46,761,613 | 15,661,329 | -- |
| Health Care | 34,056,257 | 34,056,257 | -- | -- |
| Industrials | 66,287,065 | 49,556,298 | 16,730,767 | -- |
| Information Technology | 84,614,386 | 74,498,823 | 10,115,563 | -- |
| Materials | 18,281,463 | 18,281,463 | -- | -- |
| Real Estate | 16,900,851 | 16,900,851 | -- | -- |
| Utilities | 10,907,097 | 10,907,097 | -- | -- |
| Money Market Funds | 14,622,801 | 14,622,801 | -- | -- |
| Total Investments in Securities: | $425,978,656 | $333,784,511 | $92,194,145 | $-- |
See accompanying notes which are an integral part of the financial statements.
Financial Statements
Statement of Assets and Liabilities
| | | April 30, 2019 (Unaudited) |
| Assets | | |
Investment in securities, at value (including securities loaned of $3,446,266) — See accompanying schedule:
Unaffiliated issuers (cost $353,675,962) | $411,355,855 | |
| Fidelity Central Funds (cost $14,622,801) | 14,622,801 | |
| Total Investment in Securities (cost $368,298,763) | | $425,978,656 |
| Foreign currency held at value (cost $94,308) | | 94,309 |
| Receivable for investments sold | | |
| Regular delivery | | 323,738 |
| Delayed delivery | | 382,651 |
| Receivable for fund shares sold | | 348,437 |
| Dividends receivable | | 839,143 |
| Distributions receivable from Fidelity Central Funds | | 17,836 |
| Other receivables | | 54,631 |
| Total assets | | 428,039,401 |
| Liabilities | | |
| Payable for investments purchased | $509,522 | |
| Payable for fund shares redeemed | 274,704 | |
| Accrued management fee | 224,355 | |
| Other payables and accrued expenses | 75,148 | |
| Collateral on securities loaned | 3,647,800 | |
| Total liabilities | | 4,731,529 |
| Net Assets | | $423,307,872 |
| Net Assets consist of: | | |
| Paid in capital | | $390,788,144 |
| Total distributable earnings (loss) | | 32,519,728 |
| Net Assets, for 36,029,516 shares outstanding | | $423,307,872 |
| Net Asset Value, offering price and redemption price per share ($423,307,872 ÷ 36,029,516 shares) | | $11.75 |
See accompanying notes which are an integral part of the financial statements.
Statement of Operations
| | | Six months ended April 30, 2019 (Unaudited) |
| Investment Income | | |
| Dividends | | $2,982,388 |
| Income from Fidelity Central Funds | | 138,270 |
| Income before foreign taxes withheld | | 3,120,658 |
| Less foreign taxes withheld | | (289,833) |
| Total income | | 2,830,825 |
| Expenses | | |
| Management fee | $1,246,654 | |
| Independent trustees' fees and expenses | 1,036 | |
| Interest | 2,046 | |
| Commitment fees | 537 | |
| Total expenses before reductions | 1,250,273 | |
| Expense reductions | (55,115) | |
| Total expenses after reductions | | 1,195,158 |
| Net investment income (loss) | | 1,635,667 |
| Realized and Unrealized Gain (Loss) | | |
| Net realized gain (loss) on: | | |
| Investment securities: | | |
| Unaffiliated issuers | (11,911,304) | |
| Fidelity Central Funds | (24) | |
| Foreign currency transactions | (11,258) | |
| Total net realized gain (loss) | | (11,922,586) |
| Change in net unrealized appreciation (depreciation) on: | | |
| Investment securities: | | |
| Unaffiliated issuers (net of increase in deferred foreign taxes of $75,144) | 70,192,015 | |
| Assets and liabilities in foreign currencies | (3,581) | |
| Total change in net unrealized appreciation (depreciation) | | 70,188,434 |
| Net gain (loss) | | 58,265,848 |
| Net increase (decrease) in net assets resulting from operations | | $59,901,515 |
See accompanying notes which are an integral part of the financial statements.
Statement of Changes in Net Assets
| | Six months ended April 30, 2019 (Unaudited) | Year ended October 31, 2018 |
| Increase (Decrease) in Net Assets | | |
| Operations | | |
| Net investment income (loss) | $1,635,667 | $2,875,932 |
| Net realized gain (loss) | (11,922,586) | (14,641,962) |
| Change in net unrealized appreciation (depreciation) | 70,188,434 | (23,009,341) |
| Net increase (decrease) in net assets resulting from operations | 59,901,515 | (34,775,371) |
| Distributions to shareholders | (2,841,028) | (556,479) |
| Share transactions | | |
| Proceeds from sales of shares | 57,761,814 | 284,114,051 |
| Reinvestment of distributions | 2,841,028 | 556,479 |
| Cost of shares redeemed | (55,318,171) | (63,779,612) |
| Net increase (decrease) in net assets resulting from share transactions | 5,284,671 | 220,890,918 |
| Total increase (decrease) in net assets | 62,345,158 | 185,559,068 |
| Net Assets | | |
| Beginning of period | 360,962,714 | 175,403,646 |
| End of period | $423,307,872 | $360,962,714 |
| Other Information | | |
| Shares | | |
| Sold | 5,449,359 | 25,176,612 |
| Issued in reinvestment of distributions | 283,819 | 50,133 |
| Redeemed | (5,189,465) | (5,674,611) |
| Net increase (decrease) | 543,713 | 19,552,134 |
See accompanying notes which are an integral part of the financial statements.
Financial Highlights
Fidelity International Capital Appreciation K6 Fund
| | Six months ended (Unaudited) April 30, | Years endedOctober 31, | |
| | 2019 | 2018 | 2017 A |
| Selected Per–Share Data | | | |
| Net asset value, beginning of period | $10.17 | $11.01 | $10.00 |
| Income from Investment Operations | | | |
| Net investment income (loss)B | .05 | .11 | .02 |
| Net realized and unrealized gain (loss) | 1.61 | (.92) | .99 |
| Total from investment operations | 1.66 | (.81) | 1.01 |
| Distributions from net investment income | (.08) | (.02) | – |
| Distributions from net realized gain | – | (.01) | – |
| Total distributions | (.08) | (.03) | – |
| Net asset value, end of period | $11.75 | $10.17 | $11.01 |
| Total ReturnC,D | 16.46% | (7.36)% | 10.10% |
| Ratios to Average Net AssetsE,F | | | |
| Expenses before reductions | .65%G | .65% | .65%G |
| Expenses net of fee waivers, if any | .65%G | .65% | .65%G |
| Expenses net of all reductions | .62%G | .58% | .65%G |
| Net investment income (loss) | .85%G | .99% | .51%G |
| Supplemental Data | | | |
| Net assets, end of period (000 omitted) | $423,308 | $360,963 | $175,404 |
| Portfolio turnover rateH | 168%G,I | 158%I | 81%I,J |
A For the period May 25, 2017 (commencement of operations) to October 31, 2017.
B Calculated based on average shares outstanding during the period.
C Total returns for periods of less than one year are not annualized.
D Total returns would have been lower if certain expenses had not been reduced during the applicable periods shown.
E Fees and expenses of any underlying Fidelity Central Funds are not included in the Fund's expense ratio. The Fund indirectly bears its proportionate share of the expenses of any underlying Fidelity Central Funds.
F Expense ratios reflect operating expenses of the Fund. Expenses before reductions do not reflect amounts reimbursed by the investment adviser or reductions from brokerage service arrangements or reductions from other expense offset arrangements and do not represent the amount paid by the Fund during periods when reimbursements or reductions occur. Expense ratios before reductions for start-up periods may not be representative of longer term operating periods. Expenses net of fee waivers reflect expenses after reimbursement by the investment adviser but prior to reductions from brokerage service arrangements or other expense offset arrangements. Expenses net of all reductions represent the net expenses paid by the Fund.
G Annualized
H Amount does not include the portfolio activity of any underlying Fidelity Central Funds.
I Portfolio turnover rate excludes securities received or delivered in-kind.
J Amount not annualized.
See accompanying notes which are an integral part of the financial statements.
Notes to Financial Statements (Unaudited)
For the period ended April 30, 2019
1. Organization.
Fidelity International Capital Appreciation K6 Fund (the Fund) is a fund of Fidelity Investment Trust (the Trust) and is authorized to issue an unlimited number of shares. Share transactions on the Statement of Changes in Net Assets may contain exchanges between affiliated funds. The Trust is registered under the Investment Company Act of 1940, as amended (the 1940 Act), as an open-end management investment company organized as a Massachusetts business trust. Shares generally are available only to employer-sponsored retirement plans that are recordkept by Fidelity, or to certain employer-sponsored retirement plans that are not recordkept by Fidelity. The Fund's investments in emerging markets can be subject to social, economic, regulatory, and political uncertainties and can be extremely volatile.
2. Investments in Fidelity Central Funds.
The Fund invests in Fidelity Central Funds, which are open-end investment companies generally available only to other investment companies and accounts managed by the investment adviser and its affiliates. The Fund's Schedule of Investments lists each of the Fidelity Central Funds held as of period end, if any, as an investment of the Fund, but does not include the underlying holdings of each Fidelity Central Fund. As an Investing Fund, the Fund indirectly bears its proportionate share of the expenses of the underlying Fidelity Central Funds.
The Money Market Central Funds seek preservation of capital and current income and are managed by Fidelity Investments Money Management, Inc. (FIMM), an affiliate of the investment adviser. Annualized expenses of the Money Market Central Funds as of their most recent shareholder report date are less than .005%.
A complete unaudited list of holdings for each Fidelity Central Fund is available upon request or at the Securities and Exchange Commission (the SEC) website at www.sec.gov. In addition, the financial statements of the Fidelity Central Funds are available on the SEC website or upon request.
3. Significant Accounting Policies.
The Fund is an investment company and applies the accounting and reporting guidance of the Financial Accounting Standards Board (FASB) Accounting Standards Codification Topic 946 Financial Services – Investments Companies. The financial statements have been prepared in conformity with accounting principles generally accepted in the United States of America (GAAP), which require management to make certain estimates and assumptions at the date of the financial statements. Actual results could differ from those estimates. Subsequent events, if any, through the date that the financial statements were issued have been evaluated in the preparation of the financial statements. The following summarizes the significant accounting policies of the Fund:
Investment Valuation. Investments are valued as of 4:00 p.m. Eastern time on the last calendar day of the period. The Board of Trustees (the Board) has delegated the day to day responsibility for the valuation of the Fund's investments to the Fair Value Committee (the Committee) established by the Fund's investment adviser. In accordance with valuation policies and procedures approved by the Board, the Fund attempts to obtain prices from one or more third party pricing vendors or brokers to value its investments. When current market prices, quotations or currency exchange rates are not readily available or reliable, investments will be fair valued in good faith by the Committee, in accordance with procedures adopted by the Board. Factors used in determining fair value vary by investment type and may include market or investment specific events. The frequency with which these procedures are used cannot be predicted and they may be utilized to a significant extent. The Committee oversees the Fund's valuation policies and procedures and reports to the Board on the Committee's activities and fair value determinations. The Board monitors the appropriateness of the procedures used in valuing the Fund's investments and ratifies the fair value determinations of the Committee.
The Fund categorizes the inputs to valuation techniques used to value its investments into a disclosure hierarchy consisting of three levels as shown below:
- Level 1 – quoted prices in active markets for identical investments
- Level 2 – other significant observable inputs (including quoted prices for similar investments, interest rates, prepayment speeds, etc.)
- Level 3 – unobservable inputs (including the Fund's own assumptions based on the best information available)
Valuation techniques used to value the Fund's investments by major category are as follows:
Equity securities, including restricted securities, for which market quotations are readily available, are valued at the last reported sale price or official closing price as reported by a third party pricing vendor on the primary market or exchange on which they are traded and are categorized as Level 1 in the hierarchy. In the event there were no sales during the day or closing prices are not available, securities are valued at the last quoted bid price or may be valued using the last available price and are generally categorized as Level 2 in the hierarchy. For foreign equity securities, when market or security specific events arise, comparisons to the valuation of American Depositary Receipts (ADRs), futures contracts, Exchange-Traded Funds (ETFs) and certain indexes as well as quoted prices for similar securities may be used and would be categorized as Level 2 in the hierarchy. For equity securities, including restricted securities, where observable inputs are limited, assumptions about market activity and risk are used and these securities may be categorized as Level 3 in the hierarchy.
Investments in open-end mutual funds, including the Fidelity Central Funds, are valued at their closing net asset value (NAV) each business day and are categorized as Level 1 in the hierarchy.
Changes in valuation techniques may result in transfers in or out of an assigned level within the disclosure hierarchy. The aggregate value of investments by input level as of April 30, 2019 is included at the end of the Fund's Schedule of Investments.
Foreign Currency. The Fund may use foreign currency contracts to facilitate transactions in foreign-denominated securities. Gains and losses from these transactions may arise from changes in the value of the foreign currency or if the counterparties do not perform under the contracts' terms.
Foreign-denominated assets, including investment securities, and liabilities are translated into U.S. dollars at the exchange rates at period end. Purchases and sales of investment securities, income and dividends received and expenses denominated in foreign currencies are translated into U.S. dollars at the exchange rate in effect on the transaction date.
The effects of exchange rate fluctuations on investments are included with the net realized and unrealized gain (loss) on investment securities. Other foreign currency transactions resulting in realized and unrealized gain (loss) are disclosed separately.
Investment Transactions and Income. For financial reporting purposes, the Fund's investment holdings and NAV include trades executed through the end of the last business day of the period. The NAV per share for processing shareholder transactions is calculated as of the close of business of the New York Stock Exchange (NYSE), normally 4:00 p.m. Eastern time and includes trades executed through the end of the prior business day. Gains and losses on securities sold are determined on the basis of identified cost. Dividend income is recorded on the ex-dividend date, except for certain dividends from foreign securities where the ex-dividend date may have passed, which are recorded as soon as the Fund is informed of the ex-dividend date. Non-cash dividends included in dividend income, if any, are recorded at the fair market value of the securities received. Income and capital gain distributions from Fidelity Central Funds, if any, are recorded on the ex-dividend date. Investment income is recorded net of foreign taxes withheld where recovery of such taxes is uncertain.
Expenses. Expenses directly attributable to a fund are charged to that fund. Expenses attributable to more than one fund are allocated among the respective funds on the basis of relative net assets or other appropriate methods. Expense estimates are accrued in the period to which they relate and adjustments are made when actual amounts are known.
Income Tax Information and Distributions to Shareholders. Each year, the Fund intends to qualify as a regulated investment company under Subchapter M of the Internal Revenue Code, including distributing substantially all of its taxable income and realized gains. As a result, no provision for U.S. Federal income taxes is required. The Fund files a U.S. federal tax return, in addition to state and local tax returns as required. The Fund's federal income tax returns are subject to examination by the Internal Revenue Service (IRS) for a period of three fiscal years after they are filed. State and local tax returns may be subject to examination for an additional fiscal year depending on the jurisdiction. Foreign taxes are provided for based on the Fund's understanding of the tax rules and rates that exist in the foreign markets in which it invests. The Fund is subject to a tax imposed on capital gains by certain countries in which it invests. An estimated deferred tax liability for net unrealized appreciation on the applicable securities is included in Other payables and accrued expenses on the Statement of Assets & Liabilities.
Distributions are declared and recorded on the ex-dividend date. Income and capital gain distributions are determined in accordance with income tax regulations, which may differ from GAAP.
Capital accounts within the financial statements are adjusted for permanent book-tax differences. These adjustments have no impact on net assets or the results of operations. Capital accounts are not adjusted for temporary book-tax differences which will reverse in a subsequent period.
Book-tax differences are primarily due to foreign currency transactions, certain foreign taxes, passive foreign investment companies (PFIC), capital loss carryforwards and losses deferred due to wash sales.
As of period end, the cost and unrealized appreciation (depreciation) in securities, and derivatives if applicable, for federal income tax purposes were as follows:
| Gross unrealized appreciation | $58,270,711 |
| Gross unrealized depreciation | (1,921,049) |
| Net unrealized appreciation (depreciation) | $56,349,662 |
| Tax cost | $369,628,994 |
Capital loss carryforwards are only available to offset future capital gains of the Fund to the extent provided by regulations and may be limited. Under the Regulated Investment Company Modernization Act of 2010 (the Act), the Fund is permitted to carry forward capital losses incurred in taxable years beginning after December 22, 2010 for an unlimited period and such capital losses are required to be used prior to any losses that expire. The capital loss carryforward information presented below, including any applicable limitation, is estimated as of prior fiscal period end and is subject to adjustment.
| No expiration | |
| Short-term | $(12,971,090) |
Delayed Delivery Transactions and When-Issued Securities. During the period, the Fund transacted in securities on a delayed delivery or when-issued basis. Payment and delivery may take place after the customary settlement period for that security. The price of the underlying securities and the date when the securities will be delivered and paid for are fixed at the time the transaction is negotiated. Losses may arise due to changes in the value of the underlying securities or if the counterparty does not perform under the contract's terms, or if the issuer does not issue the securities due to political, economic, or other factors.
Restricted Securities. The Fund may invest in securities that are subject to legal or contractual restrictions on resale. These securities generally may be resold in transactions exempt from registration or to the public if the securities are registered. Disposal of these securities may involve time-consuming negotiations and expense, and prompt sale at an acceptable price may be difficult. Information regarding restricted securities is included at the end of the Fund's Schedule of Investments.
4. Purchases and Sales of Investments.
Purchases and sales of securities, other than short-term securities and in-kind transactions, aggregated $319,196,915 and $327,011,306, respectively.
Unaffiliated Exchanges In-Kind. During the period, the Fund received investments and cash valued at $3,486,102 in exchange for 334,880 shares of the Fund. The amount of in-kind exchanges is included in share transactions in the accompanying Statement of Changes in Net Assets.
Prior Fiscal Year Exchanges In-Kind. During the prior period, investments and cash received in-kind through subscriptions totaled $29,374,572 in exchange for 2,605,896 shares of the Fund. The amount of in-kind exchanges is included in share transactions in the accompanying Statement of Changes in Net Assets. The Fund recognized no gain or loss for federal income tax purposes.
5. Fees and Other Transactions with Affiliates.
Management Fee. Fidelity Management & Research Company (the investment adviser) and its affiliates provide the Fund with investment management related services for which the Fund pays a monthly management fee that is based on an annual rate of .65% of average net assets. Under the management contract, the investment adviser or an affiliate pays all other expenses of the Fund, excluding fees and expenses of the independent Trustees, and certain miscellaneous expenses such as proxy and shareholder meeting expenses.
Brokerage Commissions. The Fund placed a portion of its portfolio transactions with brokerage firms which are affiliates of the investment adviser. Brokerage commissions are included in net realized gain (loss) and change in net unrealized appreciation (depreciation) in the Statement of Operations. The commissions paid to these affiliated firms were $1,749 for the period.
Interfund Lending Program. Pursuant to an Exemptive Order issued by the SEC, the Fund, along with other registered investment companies having management contracts with Fidelity Management & Research Company (FMR) or other affiliated entities of FMR, may participate in an interfund lending program. This program provides an alternative credit facility allowing the funds to borrow from, or lend money to, other participating affiliated funds. At period end, there were no interfund loans outstanding. The Fund's activity in this program during the period for which loans were outstanding was as follows:
| Borrower or Lender | Average Loan Balance | Weighted Average Interest Rate | Interest Expense |
| Borrower | $4,012,143 | 2.62% | $2,046 |
Interfund Trades. The Fund may purchase from or sell securities to other Fidelity Funds under procedures adopted by the Board. The procedures have been designed to ensure these interfund trades are executed in accordance with Rule 17a-7 of the 1940 Act. Interfund trades are included within the respective purchases and sales amounts shown in the Purchases and Sales of Investments note.
6. Committed Line of Credit.
The Fund participates with other funds managed by the investment adviser or an affiliate in a $4.25 billion credit facility (the "line of credit") to be utilized for temporary or emergency purposes to fund shareholder redemptions or for other short-term liquidity purposes. The Fund has agreed to pay commitment fees on its pro-rata portion of the line of credit, which amounted to $537 and is reflected in Commitment fees on the Statement of Operations. During the period, the Fund did not borrow on this line of credit.
7. Security Lending.
The Fund lends portfolio securities through a lending agent from time to time in order to earn additional income. For equity securities, a lending agent is used and may loan securities to certain qualified borrowers, including Fidelity Capital Markets (FCM), a broker-dealer affiliated with the Fund. On the settlement date of the loan, the Fund receives collateral (in the form of U.S. Treasury obligations, letters of credit and/or cash) against the loaned securities and maintains collateral in an amount not less than 100% of the market value of the loaned securities during the period of the loan. The market value of the loaned securities is determined at the close of business of the Fund and any additional required collateral is delivered to the Fund on the next business day. The Fund or borrower may terminate the loan at any time, and if the borrower defaults on its obligation to return the securities loaned because of insolvency or other reasons, the Fund may apply collateral received from the borrower against the obligation. The Fund may experience delays and costs in recovering the securities loaned. Any cash collateral received is invested in the Fidelity Securities Lending Cash Central Fund. At period end, there were no security loans outstanding. Security lending income represents the income earned on investing cash collateral, less rebates paid to borrowers and any lending agent fees associated with the loan, plus any premium payments received for lending certain types of securities. Security lending income is presented in the Statement of Operations as a component of income from Fidelity Central Funds. Total security lending income during the period amounted to $79,980, including $27,501 from securities loaned to FCM.
8. Expense Reductions.
Commissions paid to certain brokers with whom the investment adviser, or its affiliates, places trades on behalf of the Fund include an amount in addition to trade execution, which may be rebated back to the Fund to offset certain expenses. This amount totaled $54,956 for the period. In addition, through arrangements with the Fund's custodian, credits realized as a result of certain uninvested cash balances were used to reduce the Fund's expenses. During the period, these credits reduced the Fund's expenses by $159.
9. Other.
The Fund's organizational documents provide former and current trustees and officers with a limited indemnification against liabilities arising in connection with the performance of their duties to the Fund. In the normal course of business, the Fund may also enter into contracts that provide general indemnifications. The Fund's maximum exposure under these arrangements is unknown as this would be dependent on future claims that may be made against the Fund. The risk of material loss from such claims is considered remote.
Shareholder Expense Example
As a shareholder of the Fund, you incur two types of costs: (1) transaction costs and (2) ongoing costs, including management fees and other Fund expenses. This Example is intended to help you understand your ongoing costs (in dollars) of investing in the Fund and to compare these costs with the ongoing costs of investing in other mutual funds.
The Example is based on an investment of $1,000 invested at the beginning of the period and held for the entire period (November 1, 2018 to April 30, 2019).
Actual Expenses
The first line of the accompanying table provides information about actual account values and actual expenses. You may use the information in this line, together with the amount you invested, to estimate the expenses that you paid over the period. Simply divide your account value by $1,000.00 (for example, an $8,600 account value divided by $1,000.00 = 8.6), then multiply the result by the number in the first line under the heading entitled "Expenses Paid During Period" to estimate the expenses you paid on your account during this period. In addition, the Fund, as a shareholder in the underlying Fidelity Central Funds, will indirectly bear its pro-rata share of the fees and expenses incurred by the underlying Fidelity Central Funds. These fees and expenses are not included in the Fund's annualized expense ratio used to calculate the expense estimate in the table below.
Hypothetical Example for Comparison Purposes
The second line of the accompanying table provides information about hypothetical account values and hypothetical expenses based on the Fund's actual expense ratio and an assumed rate of return of 5% per year before expenses, which is not the Fund's actual return. The hypothetical account values and expenses may not be used to estimate the actual ending account balance or expenses you paid for the period. You may use this information to compare the ongoing costs of investing in the Fund and other funds. To do so, compare this 5% hypothetical example with the 5% hypothetical examples that appear in the shareholder reports of the other funds. In addition, the Fund, as a shareholder in the underlying Fidelity Central Funds, will indirectly bear its pro-rata share of the fees and expenses incurred by the underlying Fidelity Central Funds. These fees and expenses are not included in the Fund's annualized expense ratio used to calculate the expense estimate in the table below.
Please note that the expenses shown in the table are meant to highlight your ongoing costs only and do not reflect any transaction costs. Therefore, the second line of the table is useful in comparing ongoing costs only, and will not help you determine the relative total costs of owning different funds.
| | Annualized Expense Ratio-A | Beginning
Account Value
November 1, 2018 | Ending
Account Value
April 30, 2019 | Expenses Paid
During Period-B
November 1, 2018
to April 30, 2019 |
| Actual | .65% | $1,000.00 | $1,164.60 | $3.49 |
| Hypothetical-C | | $1,000.00 | $1,021.57 | $3.26 |
A Annualized expense ratio reflects expenses net of applicable fee waivers.
B Expenses are equal to the Fund's annualized expense ratio, multiplied by the average account value over the period, multiplied by 181/365 (to reflect the one-half year period).
C 5% return per year before expenses
Board Approval of Investment Advisory Contracts and Management Fees
Fidelity International Capital Appreciation K6 Fund
Each year, the Board of Trustees, including the Independent Trustees (together, the Board), votes on the renewal of the management contract with Fidelity Management & Research Company (FMR) and the sub-advisory agreements (together, the Advisory Contracts) for the fund. FMR and the sub-advisers are referred to herein as the Investment Advisers. The Board, assisted by the advice of fund counsel and Independent Trustees' counsel, requests and considers a broad range of information relevant to the renewal of the Advisory Contracts throughout the year.
The Board meets regularly and, at each of its meetings, covers an extensive agenda of topics and materials and considers factors that are relevant to its annual consideration of the renewal of the fund's Advisory Contracts, including the services and support provided to the fund and its shareholders. The Board has established various standing committees (Committees), each composed of and chaired by Independent Trustees with varying backgrounds, to which the Board has assigned specific subject matter responsibilities in order to enhance effective decision-making by the Board. The Board, acting directly and through its Committees, requests and receives information concerning the annual consideration of the renewal of the fund's Advisory Contracts. The Board also meets as needed to review matters specifically related to the Board's annual consideration of the renewal of the Advisory Contracts. Members of the Board may also meet with trustees of other Fidelity funds through joint ad hoc committees to discuss certain matters relevant to all of the Fidelity funds.
At its January 2019 meeting, the Board unanimously determined to renew the fund's Advisory Contracts. In reaching its determination, the Board considered all factors it believed relevant, including (i) the nature, extent, and quality of the services to be provided to the fund and its shareholders (including the investment performance of the fund); (ii) the competitiveness of the fund's management fee and total expense ratio relative to peer funds; (iii) the total costs of the services to be provided by and the profits to be realized by Fidelity from its relationships with the fund; and (iv) the extent to which, if any, economies of scale exist and would be realized as the fund grows, and whether any economies of scale are appropriately shared with fund shareholders.
In considering whether to renew the Advisory Contracts for the fund, the Board reached a determination, with the assistance of fund counsel and Independent Trustees' counsel and through the exercise of its business judgment, that the renewal of the Advisory Contracts was in the best interests of the fund and its shareholders and that the compensation payable under the Advisory Contracts was fair and reasonable. The Board's decision to renew the Advisory Contracts was not based on any single factor, but rather was based on a comprehensive consideration of all the information provided to the Board at its meetings throughout the year. The Board, in reaching its determination to renew the Advisory Contracts, was aware that shareholders of the fund have a broad range of investment choices available to them, including a wide choice among funds offered by Fidelity's competitors, and that the fund's shareholders, who have the opportunity to review and weigh the disclosure provided by the fund in its prospectus and other public disclosures, have chosen to invest in this fund, which is part of the Fidelity family of funds.
Nature, Extent, and Quality of Services Provided. The Board considered Fidelity's staffing as it relates to the fund, including the backgrounds of investment personnel of Fidelity, and also considered the fund's investment objective, strategies, and related investment philosophy. The Independent Trustees also had discussions with senior management of Fidelity's investment operations and investment groups. The Board considered the structure of the investment personnel compensation program and whether this structure provides appropriate incentives to act in the best interests of the fund. Additionally, the Board considered the portfolio managers' investments, if any, in the funds that they manage.
Resources Dedicated to Investment Management and Support Services. The Board and the Fund Oversight and Research Committees reviewed the general qualifications and capabilities of Fidelity's investment staff, including its size, education, experience, and resources, as well as Fidelity's approach to recruiting, training, managing, and compensating investment personnel. The Board noted that Fidelity has continued to increase the resources devoted to non-U.S. offices, including expansion of Fidelity's global investment organization. The Board also noted that Fidelity's analysts have extensive resources, tools and capabilities that allow them to conduct sophisticated quantitative and fundamental analysis, as well as credit analysis of issuers, counterparties and guarantors. Further, the Board considered that Fidelity's investment professionals have sufficient access to global information and data so as to provide competitive investment results over time, and that those professionals also have access to sophisticated tools that permit them to assess portfolio construction and risk and performance attribution characteristics continuously, as well as to transmit new information and research conclusions rapidly around the world. Additionally, in its deliberations, the Board considered Fidelity's trading, risk management, compliance, and technology and operations capabilities and resources, which are integral parts of the investment management process.
Shareholder and Administrative Services. The Board considered (i) the nature, extent, quality, and cost of advisory, administrative, and shareholder services performed by the Investment Advisers and their affiliates under the Advisory Contracts and under separate agreements covering transfer agency, pricing and bookkeeping, and securities lending services for the fund; (ii) the nature and extent of the supervision of third party service providers, principally custodians, subcustodians, and pricing vendors; and (iii) the resources devoted to, and the record of compliance with, the fund's compliance policies and procedures. The Board also reviewed the allocation of fund brokerage, including allocations to brokers affiliated with the Investment Advisers, the use of brokerage commissions to pay fund expenses, and the use of "soft" commission dollars to pay for research services.
The Board noted that the growth of fund assets over time across the complex allows Fidelity to reinvest in the development of services designed to enhance the value and convenience of the Fidelity funds as investment vehicles. These services include 24-hour access to account information and market information through telephone representatives and over the Internet, investor education materials and asset allocation tools, and the expanded availability of Fidelity Investor Centers.
The Board noted that it and the boards of certain other Fidelity funds had formed an ad hoc Committee on Transfer Agency Fees to review the variety of transfer agency fee structures throughout the industry and Fidelity's competitive positioning with respect to industry participants.
Investment in a Large Fund Family. The Board considered the benefits to shareholders of investing in a Fidelity fund, including the benefits of investing in a fund that is part of a large family of funds offering a variety of investment disciplines and providing a large variety of mutual fund investor services. The Board noted that Fidelity had taken, or had made recommendations that resulted in the Fidelity funds taking, a number of actions over the previous year that benefited particular funds, including: (i) continuing to dedicate additional resources to Fidelity's investment research process, which includes meetings with management of issuers of securities in which the funds invest, and to the support of the senior management team that oversees asset management; (ii) continuing efforts to enhance Fidelity's global research capabilities; (iii) launching new funds and making other enhancements to meet client needs; (iv) launching new share classes of existing funds; (v) eliminating purchase minimums and broadening eligibility requirements for certain funds and share classes; (vi) reducing management fees and total expenses for certain growth equity funds and index funds; (vii) lowering expense caps for certain existing funds and classes, and converting certain voluntary expense caps to contractual caps, to reduce expenses borne by shareholders; (viii) eliminating short-term redemption fees for funds that had such fees; (ix) rationalizing product lines and gaining increased efficiencies from fund mergers and share class consolidations; (x) continuing to develop, acquire and implement systems and technology to improve services to the funds and shareholders, strengthen information security, and increase efficiency; and (xi) continuing to implement enhancements to further strengthen Fidelity's product line to increase investors' probability of success in achieving their investment goals, including retirement income goals.
Investment Performance. The Board considered whether the fund has operated in accordance with its investment objective, as well as its record of compliance with its investment restrictions and its performance history.
The Board took into account discussions that occur at Board meetings throughout the year with representatives of the Investment Advisers about fund investment performance. In this regard the Board noted that as part of regularly scheduled fund reviews and other reports to the Board on fund performance, the Board considers annualized return information for the fund for different time periods, measured against an appropriate securities market index ("benchmark index") and a peer group of funds with similar objectives ("peer group"), if any. In its evaluation of fund investment performance, the Board gave particular attention to information indicating changes in performance of certain Fidelity funds for specific time periods and discussed with the Investment Advisers the reasons for any overperformance or underperformance.
In addition to reviewing absolute and relative fund performance, the Independent Trustees periodically consider the appropriateness of fund performance metrics in evaluating the results achieved. In general, the Independent Trustees believe that fund performance should be evaluated based on net performance (after fees and expenses) of both the highest performing and lowest performing fund share classes, where applicable, compared to appropriate benchmark indices, over appropriate time periods that may include full market cycles, and compared to peer groups, as applicable, over the same periods, taking into account relevant factors including the following: general market conditions; issuer-specific information; and fund cash flows and other factors.
The Independent Trustees recognize that shareholders evaluate performance on a net basis over their own holding periods, for which one-, three-, and five-year periods are often used as a proxy. For this reason, the performance information reviewed by the Board also included net total return information for the fund and an appropriate benchmark index and peer group for the most recent one-year period ended June 30, 2018, as shown below. Returns are shown compared to the 25th percentile (top of box, 75% beaten) and 75th percentile (bottom of box, 25% beaten) of the peer universe. Returns of the benchmark index are "net MA,"
i.e., adjusted for tax withholding rates applicable to U.S.-based funds organized as Massachusetts business trusts.
Fidelity International Capital Appreciation K6 Fund

Based on its review, the Board concluded that the nature, extent, and quality of services provided to the fund under the Advisory Contracts should continue to benefit the shareholders of the fund.
Competitiveness of Management Fee and Total Expense Ratio. The Board considered the fund's management fee and total expense ratio compared to "mapped groups" of competitive funds and classes created for the purpose of facilitating the Trustees' competitive analysis of management fees and total expenses. Fidelity creates "mapped groups" by combining similar Lipper investment objective categories that have comparable investment mandates. Combining Lipper investment objective categories aids the Board's management fee and total expense ratio comparisons by broadening the competitive group used for comparison.
Management Fee. The Board considered two proprietary management fee comparisons for the 12-month period ended June 30 shown in basis points (BP) in the chart below. The group of Lipper funds used by the Board for management fee comparisons is referred to below as the "Total Mapped Group." The Total Mapped Group comparison focuses on a fund's standing in terms of gross management fees before expense reimbursements or caps relative to the total universe of funds with comparable investment mandates, regardless of whether their management fee structures also are comparable. Funds with comparable investment mandates offer exposure to similar types of securities. Funds with comparable management fee structures have similar management fee contractual arrangements (
e.g., flat rate charged for advisory services, all-inclusive fee rate,
etc.). "TMG %" represents the percentage of funds in the Total Mapped Group that had management fees that were lower than the fund's. For example, a hypothetical TMG % of 20% would mean that 80% of the funds in the Total Mapped Group had higher, and 20% had lower, management fees than the fund. The fund's actual TMG % and the number of funds in the Total Mapped Group are in the chart below. The "Asset-Size Peer Group" (ASPG) comparison focuses on a fund's standing relative to a subset of non-Fidelity funds within the Total Mapped Group that are similar in size and management fee structure. For example, if a fund is in the first quartile of the ASPG, the fund's management fee ranks in the least expensive or lowest 25% of funds in the ASPG. The ASPG represents at least 15% of the funds in the Total Mapped Group with comparable asset size and management fee structures, subject to a minimum of 50 funds (or all funds in the Total Mapped Group if fewer than 50). Additional information, such as the ASPG quartile in which the fund's management fee rate ranked, is also included in the chart and was considered by the Board.
Fidelity International Capital Appreciation K6 Fund
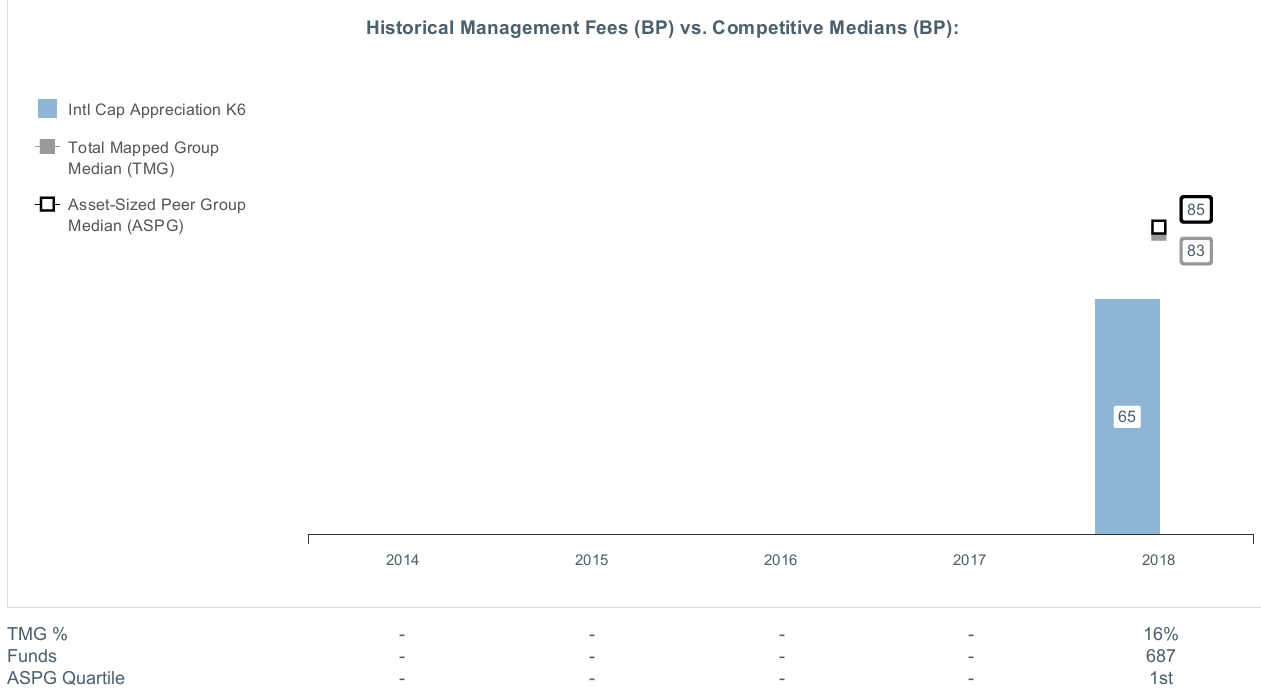
The Board noted that the fund's management fee rate ranked below the median of its Total Mapped Group and below the median of its ASPG for the 12-month period ended June 30, 2018.
The Board noted that it and the boards of other Fidelity funds formed an ad hoc Committee on Group Fee, which meets periodically, to conduct an in-depth review of the "group fee" component of the management fee of funds with such management fee structures. The Committee's focus included the mechanics of the group fee, the competitive landscape of group fee structures, Fidelity funds with no group fee component (such as the fund) and investment products not included in group fee assets. The Board also considered that, for funds subject to the group fee, FMR agreed to voluntarily waive fees over a specified period of time in amounts designed to account for assets converted from certain funds to certain collective investment trusts.
The Board also noted that, in 2013, the ad hoc Committee on Management Fees was formed to conduct an in-depth review of the management fee rates of Fidelity's active equity mutual funds. The Committee focused on the following areas: (i) standard fee structures; (ii) research consumption and trading evolution; (iii) management fee competitiveness/profitability by category; and (iv) factors that drive institutional pricing.
Based on its review, the Board concluded that the fund's management fee is fair and reasonable in light of the services that the fund receives and the other factors considered.
Total Expense Ratio. In its review of the fund's total expense ratio, the Board considered the fund's unitary fee rate as well as other fund expenses paid by FMR under the fund's management contract, such as transfer agent fees, pricing and bookkeeping fees, and custodial, legal, and audit fees. The Board also noted that Fidelity may agree to waive fees and expenses from time to time, and the extent to which, if any, it has done so for the fund. As part of its review, the Board also considered the current total expense ratio of the fund compared to competitive fund median expenses. The fund is compared to those funds in the Total Mapped Group (used by the Board for management fee comparisons) that have a similar sales load structure.
In connection with the renewal of the Advisory Contracts, the Board also approved amendments to the management contract for the fund to clarify that the fund pays its non-operating expenses, including brokerage commissions and fees and expenses associated with the fund's securities lending program. The Board considered that the amendments would not change the services provided to the fund or the party responsible for making such payments under the current management contract.
The Board noted that the fund's total expense ratio ranked below the competitive median for the 12-month period ended June 30, 2018.
Fees Charged to Other Fidelity Clients. The Board also considered Fidelity fee structures and other information with respect to clients of Fidelity, such as other funds advised or subadvised by Fidelity, pension plan clients, and other institutional clients with similar mandates. The Board noted that a joint ad hoc committee created by it and the boards of other Fidelity funds periodically reviews and compares Fidelity's institutional investment advisory business with its business of providing services to the Fidelity funds and also noted the most recent findings of the committee. The Board noted that the committee's review included a consideration of the differences in services provided, fees charged, and costs incurred, as well as competition in the markets serving the different categories of clients.
Based on its review of total expense ratios and fees charged to other Fidelity clients, the Board concluded that the fund's total expense ratio was reasonable in light of the services that the fund and its shareholders receive and the other factors considered.
Costs of the Services and Profitability. The Board considered the revenues earned and the expenses incurred by Fidelity in conducting the business of developing, marketing, distributing, managing, administering and servicing the fund and servicing the fund's shareholders. The Board also considered the level of Fidelity's profits in respect of all the Fidelity funds.
On an annual basis, Fidelity presents to the Board information about the profitability of its relationships with the fund. Fidelity calculates profitability information for each fund, as well as aggregate profitability information for groups of Fidelity funds and all Fidelity funds, using a series of detailed revenue and cost allocation methodologies which originate with the books and records of Fidelity on which Fidelity's audited financial statements are based. The Audit Committee of the Board reviews any significant changes from the prior year's methodologies.
PricewaterhouseCoopers LLP (PwC), auditor to Fidelity and certain Fidelity funds, has been engaged annually by the Board as part of the Board's assessment of Fidelity's profitability analysis. PwC's engagement includes the review and assessment of the methodologies used by Fidelity in determining the revenues and expenses attributable to Fidelity's mutual fund business, and completion of agreed-upon procedures in respect of the mathematical accuracy of the fund profitability information and its conformity to established allocation methodologies. After considering PwC's reports issued under the engagement and information provided by Fidelity, the Board concluded that while other allocation methods may also be reasonable, Fidelity's profitability methodologies are reasonable in all material respects.
The Board also reviewed Fidelity's non-fund businesses and potential indirect benefits such businesses may have received as a result of their association with Fidelity's mutual fund business (i.e., fall-out benefits) as well as cases where Fidelity's affiliates may benefit from the fund's business. The Board noted that changes to fall-out benefits year-over-year reflect business developments at Fidelity's various businesses.
The Board considered the costs of the services provided by and the profits realized by Fidelity in connection with the operation of the fund and was satisfied that the profitability was not excessive.
Economies of Scale. The Board considered whether there have been economies of scale in respect of the management of the Fidelity funds, whether the Fidelity funds (including the fund) have appropriately benefited from any such economies of scale, and whether there is potential for realization of any further economies of scale. The Board considered the extent to which the fund will benefit from economies of scale as assets grow through increased services to the fund, through waivers or reimbursements, or through fee or expense ratio reductions. The Board recognized that, due to the fund's current contractual arrangements, its expense ratio will not decline if the fund's operating costs decrease as assets grow, or rise as assets decrease. The Board also noted that a committee (the Economies of Scale Committee) created by it and the boards of other Fidelity funds periodically analyzes whether Fidelity attains economies of scale in respect of the management and servicing of the Fidelity funds, whether the Fidelity funds have appropriately benefited from such economies of scale, and whether there is potential for realization of any further economies of scale.
The Board concluded, taking into account the analysis of the Economies of Scale Committee, that economies of scale, if any, are being appropriately shared between fund shareholders and Fidelity.
Additional Information Requested by the Board. In order to develop fully the factual basis for consideration of the Fidelity funds' advisory contracts, the Board requested and received additional information on certain topics, including: (i) fund performance trends, in particular the underperformance of certain funds, and Fidelity's long-term strategies for certain funds; (ii) Fidelity's fund profitability methodology, profitability trends for certain funds, and the impact of certain factors on fund profitability results; (iii) metrics for evaluating index fund and ETF performance and information about ETF trading characteristics; (iv) the methodology with respect to the evaluation of competitive fund data and peer group classifications and fee comparisons; (v) the expense structures for different funds and classes; (vi) information regarding other accounts managed by Fidelity, including collective investment trusts; and (vii) Fidelity's philosophies and strategies for evaluating funds and classes with lower or declining asset levels.
Based on its evaluation of all of the conclusions noted above, and after considering all factors it believed relevant, the Board concluded that the advisory fee arrangements are fair and reasonable, and that the fund's Advisory Contracts should be renewed.
IVFK6-SANN-0619
1.9883990.101
Fidelity® Series Canada Fund
Semi-Annual Report April 30, 2019 |
|
Beginning on January 1, 2021, as permitted by regulations adopted by the Securities and Exchange Commission, paper copies of a fund’s shareholder reports will no longer be sent by mail, unless you specifically request paper copies of the reports from the fund or from your financial intermediary, such as a financial advisor, broker-dealer or bank. Instead, the reports will be made available on a website, and you will be notified by mail each time a report is posted and provided with a website link to access the report.
If you already elected to receive shareholder reports electronically, you will not be affected by this change and you need not take any action. You may elect to receive shareholder reports and other communications from a fund electronically, by contacting your financial intermediary. For Fidelity customers, visit Fidelity's web site or call Fidelity using the contact information listed below.
You may elect to receive all future reports in paper free of charge. If you wish to continue receiving paper copies of your shareholder reports, you may contact your financial intermediary or, if you are a Fidelity customer, visit Fidelity’s website, or call Fidelity at the applicable toll-free number listed below. Your election to receive reports in paper will apply to all funds held with the fund complex/your financial intermediary.
| Account Type | Website | Phone Number |
| Brokerage, Mutual Fund, or Annuity Contracts: | fidelity.com/mailpreferences | 1-800-343-3548 |
| Employer Provided Retirement Accounts: | netbenefits.fidelity.com/preferences (choose 'no' under Required Disclosures to continue to print) | 1-800-343-0860 |
| Advisor Sold Accounts Serviced Through Your Financial Intermediary: | Contact Your Financial Intermediary | Your Financial Intermediary's phone number |
| Advisor Sold Accounts Serviced by Fidelity: | institutional.fidelity.com | 1-877-208-0098 |
Contents
To view a fund's proxy voting guidelines and proxy voting record for the 12-month period ended June 30, visit http://www.fidelity.com/proxyvotingresults or visit the Securities and Exchange Commission's (SEC) web site at http://www.sec.gov.
You may also call 1-800-544-8544 to request a free copy of the proxy voting guidelines.
Standard & Poor's, S&P and S&P 500 are registered service marks of The McGraw-Hill Companies, Inc. and have been licensed for use by Fidelity Distributors Corporation.
Other third-party marks appearing herein are the property of their respective owners.
All other marks appearing herein are registered or unregistered trademarks or service marks of FMR LLC or an affiliated company. © 2019 FMR LLC. All rights reserved.
This report and the financial statements contained herein are submitted for the general information of the shareholders of the Fund. This report is not authorized for distribution to prospective investors in the Fund unless preceded or accompanied by an effective prospectus.
A fund files its complete schedule of portfolio holdings with the SEC for the first and third quarters of each fiscal year on Form N-PORT. Forms N-PORT are available on the SEC’s web site at http://www.sec.gov. A fund's Forms N-PORT may be reviewed and copied at the SEC’s Public Reference Room in Washington, DC. Information regarding the operation of the SEC's Public Reference Room may be obtained by calling 1-800-SEC-0330.
For a complete list of a fund's portfolio holdings, view the most recent holdings listing, semiannual report, or annual report on Fidelity's web site at http://www.fidelity.com, http://www.institutional.fidelity.com, or http://www.401k.com, as applicable.
NOT FDIC INSURED •MAY LOSE VALUE •NO BANK GUARANTEE
Neither the Fund nor Fidelity Distributors Corporation is a bank.
Investment Summary (Unaudited)
Geographic Diversification (% of fund's net assets)
| As of April 30, 2019 |
| | Canada | 98.1% |
| | United States of America* | 1.9% |

* Includes Short-Term investments and Net Other Assets (Liabilities).
Percentages are based on country or territory of incorporation and are adjusted for the effect of futures contracts, if applicable.
Asset Allocation as of April 30, 2019
| | % of fund's net assets |
| Stocks | 98.1 |
| Short-Term Investments and Net Other Assets (Liabilities) | 1.9 |
Top Ten Stocks as of April 30, 2019
| | % of fund's net assets |
| The Toronto-Dominion Bank (Banks) | 10.0 |
| Suncor Energy, Inc. (Oil, Gas & Consumable Fuels) | 5.4 |
| Canadian Pacific Railway Ltd. (Road & Rail) | 5.1 |
| Bank of Nova Scotia (Banks) | 5.1 |
| Royal Bank of Canada (Banks) | 5.0 |
| Canadian Natural Resources Ltd. (Oil, Gas & Consumable Fuels) | 4.7 |
| Sun Life Financial, Inc. (Insurance) | 4.5 |
| Bank of Montreal (Banks) | 4.4 |
| Alimentation Couche-Tard, Inc. Class B (sub. vtg.) (Food & Staples Retailing) | 4.3 |
| Canadian National Railway Co. (Road & Rail) | 4.1 |
| | 52.6 |
Top Market Sectors as of April 30, 2019
| | % of fund's net assets |
| Financials | 35.3 |
| Energy | 18.5 |
| Industrials | 12.4 |
| Materials | 9.7 |
| Consumer Staples | 7.1 |
| Information Technology | 5.6 |
| Communication Services | 5.3 |
| Consumer Discretionary | 3.7 |
| Real Estate | 0.5 |
Market Sectors may include more than one industry category.
The Fund may invest up to 35% of its total assets in any industry that represents more than 20% of the Canadian market. As of April 30, 2019, the Fund did not have more than 25% of its total assets invested in any one industry.
Schedule of Investments April 30, 2019 (Unaudited)
Showing Percentage of Net Assets
| Common Stocks - 98.1% | | | |
| | | Shares | Value |
| COMMUNICATION SERVICES - 5.3% | | | |
| Diversified Telecommunication Services - 2.5% | | | |
| TELUS Corp. | | 1,060,700 | $39,056,752 |
| Media - 0.9% | | | |
| Cogeco Communications, Inc. | | 217,400 | 14,437,619 |
| Wireless Telecommunication Services - 1.9% | | | |
| Rogers Communications, Inc. Class B (non-vtg.) | | 595,300 | 29,971,624 |
|
| TOTAL COMMUNICATION SERVICES | | | 83,465,995 |
|
| CONSUMER DISCRETIONARY - 3.7% | | | |
| Hotels, Restaurants & Leisure - 0.4% | | | |
| Recipe Unlimited Corp. | | 284,100 | 5,725,685 |
| Leisure Products - 1.2% | | | |
| BRP, Inc. | | 283,000 | 8,796,089 |
| Spin Master Corp. (a)(b) | | 314,000 | 10,436,978 |
| | | | 19,233,067 |
| Multiline Retail - 2.1% | | | |
| Dollarama, Inc. | | 1,110,200 | 33,346,606 |
|
| TOTAL CONSUMER DISCRETIONARY | | | 58,305,358 |
|
| CONSUMER STAPLES - 7.1% | | | |
| Food & Staples Retailing - 7.1% | | | |
| Alimentation Couche-Tard, Inc. Class B (sub. vtg.) | | 1,150,100 | 67,811,002 |
| George Weston Ltd. | | 469,700 | 35,070,606 |
| North West Co., Inc. | | 457,400 | 9,662,178 |
| | | | 112,543,786 |
| ENERGY - 18.5% | | | |
| Energy Equipment & Services - 0.4% | | | |
| Canadian Energy Services & Technology Corp. | | 3,085,600 | 6,011,358 |
| Computer Modelling Group Ltd. | | 2,700 | 11,891 |
| | | | 6,023,249 |
| Oil, Gas & Consumable Fuels - 18.1% | | | |
| Canadian Natural Resources Ltd. | | 2,484,400 | 74,585,779 |
| Cenovus Energy, Inc. (Canada) | | 2,093,000 | 20,747,212 |
| Enbridge, Inc. | | 1,311,600 | 48,451,955 |
| Peyto Exploration & Development Corp. (c) | | 760,300 | 3,433,466 |
| Pinnacle Renewable Energy, Inc. | | 674,053 | 6,123,181 |
| PrairieSky Royalty Ltd. (c) | | 3,321,900 | 47,880,786 |
| Suncor Energy, Inc. | | 2,605,000 | 85,906,472 |
| | | | 287,128,851 |
|
| TOTAL ENERGY | | | 293,152,100 |
|
| FINANCIALS - 35.3% | | | |
| Banks - 24.5% | | | |
| Bank of Montreal | | 886,800 | 70,046,410 |
| Bank of Nova Scotia | | 1,458,000 | 80,295,021 |
| Royal Bank of Canada | | 1,004,700 | 80,071,523 |
| The Toronto-Dominion Bank | | 2,774,000 | 158,236,231 |
| | | | 388,649,185 |
| Capital Markets - 1.0% | | | |
| IGM Financial, Inc. | | 552,000 | 15,245,204 |
| Insurance - 9.8% | | | |
| Intact Financial Corp. | | 541,500 | 44,303,811 |
| Power Corp. of Canada (sub. vtg.) | | 1,774,000 | 40,705,203 |
| Sun Life Financial, Inc. | | 1,713,400 | 71,185,970 |
| | | | 156,194,984 |
|
| TOTAL FINANCIALS | | | 560,089,373 |
|
| INDUSTRIALS - 12.4% | | | |
| Aerospace & Defense - 0.8% | | | |
| CAE, Inc. | | 581,800 | 13,532,050 |
| Professional Services - 2.4% | | | |
| Thomson Reuters Corp. | | 607,700 | 37,554,291 |
| Road & Rail - 9.2% | | | |
| Canadian National Railway Co. | | 694,800 | 64,537,517 |
| Canadian Pacific Railway Ltd. | | 364,000 | 81,556,975 |
| | | | 146,094,492 |
|
| TOTAL INDUSTRIALS | | | 197,180,833 |
|
| INFORMATION TECHNOLOGY - 5.6% | | | |
| IT Services - 2.1% | | | |
| CGI Group, Inc. Class A (sub. vtg.) (a) | | 454,900 | 32,743,157 |
| Software - 3.5% | | | |
| Constellation Software, Inc. | | 34,000 | 29,999,537 |
| Open Text Corp. | | 675,500 | 25,967,194 |
| | | | 55,966,731 |
|
| TOTAL INFORMATION TECHNOLOGY | | | 88,709,888 |
|
| MATERIALS - 9.7% | | | |
| Chemicals - 3.8% | | | |
| Nutrien Ltd. | | 1,118,178 | 60,645,528 |
| Containers & Packaging - 1.4% | | | |
| CCL Industries, Inc. Class B | | 506,600 | 21,610,950 |
| Metals & Mining - 4.1% | | | |
| Franco-Nevada Corp. | | 443,400 | 31,769,774 |
| Lundin Mining Corp. | | 2,288,500 | 12,282,089 |
| OceanaGold Corp. | | 389,200 | 1,092,328 |
| Wheaton Precious Metals Corp. | | 915,000 | 19,793,013 |
| | | | 64,937,204 |
| Paper & Forest Products - 0.4% | | | |
| Western Forest Products, Inc. | | 5,162,900 | 7,245,094 |
|
| TOTAL MATERIALS | | | 154,438,776 |
|
| REAL ESTATE - 0.5% | | | |
| Equity Real Estate Investment Trusts (REITs) - 0.5% | | | |
| Allied Properties (REIT) | | 244,900 | 8,670,305 |
| TOTAL COMMON STOCKS | | | |
| (Cost $1,496,987,516) | | | 1,556,556,414 |
|
| Money Market Funds - 4.5% | | | |
| Fidelity Cash Central Fund, 2.49% (d) | | 27,198,171 | 27,203,611 |
| Fidelity Securities Lending Cash Central Fund 2.49% (d)(e) | | 44,325,689 | 44,330,122 |
| TOTAL MONEY MARKET FUNDS | | | |
| (Cost $71,532,874) | | | 71,533,733 |
| TOTAL INVESTMENT IN SECURITIES - 102.6% | | | |
| (Cost $1,568,520,390) | | | 1,628,090,147 |
| NET OTHER ASSETS (LIABILITIES) - (2.6)% | | | (41,399,614) |
| NET ASSETS - 100% | | | $1,586,690,533 |
Legend
(a) Non-income producing
(b) Security exempt from registration under Rule 144A of the Securities Act of 1933. These securities may be resold in transactions exempt from registration, normally to qualified institutional buyers. At the end of the period, the value of these securities amounted to $10,436,978 or 0.7% of net assets.
(c) Security or a portion of the security is on loan at period end.
(d) Affiliated fund that is generally available only to investment companies and other accounts managed by Fidelity Investments. The rate quoted is the annualized seven-day yield of the fund at period end. A complete unaudited listing of the fund's holdings as of its most recent quarter end is available upon request. In addition, each Fidelity Central Fund's financial statements are available on the SEC's website or upon request.
(e) Investment made with cash collateral received from securities on loan.
Affiliated Central Funds
Information regarding fiscal year to date income earned by the Fund from investments in Fidelity Central Funds is as follows:
| Fund | Income earned |
| Fidelity Cash Central Fund | $195,905 |
| Fidelity Securities Lending Cash Central Fund | 229,712 |
| Total | $425,617 |
Amounts in the income column in the above table include any capital gain distributions from underlying funds, which are presented in the corresponding line-item in the Statement of Operations, if applicable.
Investment Valuation
All investments are categorized as Level 1 under the Fair Value Hierarchy. The inputs or methodology used for valuing securities may not be an indication of the risk associated with investing in those securities. For more information on valuation inputs please refer to the Investment Valuation section in the accompanying Notes to Financial Statements.
See accompanying notes which are an integral part of the financial statements.
Financial Statements
Statement of Assets and Liabilities
| | | April 30, 2019 (Unaudited) |
| Assets | | |
Investment in securities, at value (including securities loaned of $41,931,116) — See accompanying schedule:
Unaffiliated issuers (cost $1,496,987,516) | $1,556,556,414 | |
| Fidelity Central Funds (cost $71,532,874) | 71,533,733 | |
| Total Investment in Securities (cost $1,568,520,390) | | $1,628,090,147 |
| Foreign currency held at value (cost $602,450) | | 602,658 |
| Receivable for fund shares sold | | 221,102 |
| Dividends receivable | | 3,107,705 |
| Distributions receivable from Fidelity Central Funds | | 63,984 |
| Total assets | | 1,632,085,596 |
| Liabilities | | |
| Payable for investments purchased | $12,497 | |
| Payable for fund shares redeemed | 1,052,986 | |
| Other payables and accrued expenses | 5,133 | |
| Collateral on securities loaned | 44,324,447 | |
| Total liabilities | | 45,395,063 |
| Net Assets | | $1,586,690,533 |
| Net Assets consist of: | | |
| Paid in capital | | $1,520,221,624 |
| Total distributable earnings (loss) | | 66,468,909 |
| Net Assets, for 147,998,760 shares outstanding | | $1,586,690,533 |
| Net Asset Value, offering price and redemption price per share ($1,586,690,533 ÷ 147,998,760 shares) | | $10.72 |
See accompanying notes which are an integral part of the financial statements.
Statement of Operations
| | | Six months ended April 30, 2019 (Unaudited) |
| Investment Income | | |
| Dividends | | $22,008,873 |
| Income from Fidelity Central Funds | | 425,617 |
| Income before foreign taxes withheld | | 22,434,490 |
| Less foreign taxes withheld | | (3,488,861) |
| Total income | | 18,945,629 |
| Expenses | | |
| Custodian fees and expenses | $8,071 | |
| Independent trustees' fees and expenses | 4,005 | |
| Commitment fees | 2,069 | |
| Total expenses before reductions | 14,145 | |
| Expense reductions | (16) | |
| Total expenses after reductions | | 14,129 |
| Net investment income (loss) | | 18,931,500 |
| Realized and Unrealized Gain (Loss) | | |
| Net realized gain (loss) on: | | |
| Investment securities: | | |
| Unaffiliated issuers | 2,232,613 | |
| Fidelity Central Funds | 6,000 | |
| Foreign currency transactions | 3,634 | |
| Total net realized gain (loss) | | 2,242,247 |
| Change in net unrealized appreciation (depreciation) on: | | |
| Investment securities: | | |
| Unaffiliated issuers | 120,131,779 | |
| Fidelity Central Funds | 859 | |
| Assets and liabilities in foreign currencies | 12,402 | |
| Total change in net unrealized appreciation (depreciation) | | 120,145,040 |
| Net gain (loss) | | 122,387,287 |
| Net increase (decrease) in net assets resulting from operations | | $141,318,787 |
See accompanying notes which are an integral part of the financial statements.
Statement of Changes in Net Assets
| | Six months ended April 30, 2019 (Unaudited) | Year ended October 31, 2018 |
| Increase (Decrease) in Net Assets | | |
| Operations | | |
| Net investment income (loss) | $18,931,500 | $36,082,028 |
| Net realized gain (loss) | 2,242,247 | (5,450,709) |
| Change in net unrealized appreciation (depreciation) | 120,145,040 | (102,733,008) |
| Net increase (decrease) in net assets resulting from operations | 141,318,787 | (72,101,689) |
| Distributions to shareholders | (33,015,477) | (16,111,554) |
| Share transactions | | |
| Proceeds from sales of shares | 150,554,784 | 164,696,337 |
| Reinvestment of distributions | 33,015,477 | 16,111,554 |
| Cost of shares redeemed | (90,681,673) | (184,063,223) |
| Net increase (decrease) in net assets resulting from share transactions | 92,888,588 | (3,255,332) |
| Total increase (decrease) in net assets | 201,191,898 | (91,468,575) |
| Net Assets | | |
| Beginning of period | 1,385,498,635 | 1,476,967,210 |
| End of period | $1,586,690,533 | $1,385,498,635 |
| Other Information | | |
| Shares | | |
| Sold | 14,882,322 | 15,644,674 |
| Issued in reinvestment of distributions | 3,482,645 | 1,522,831 |
| Redeemed | (9,050,710) | (17,094,786) |
| Net increase (decrease) | 9,314,257 | 72,719 |
See accompanying notes which are an integral part of the financial statements.
Financial Highlights
Fidelity Series Canada Fund
| | Six months ended (Unaudited) April 30, | Years endedOctober 31, | |
| | 2019 | 2018 | 2017 A |
| Selected Per–Share Data | | | |
| Net asset value, beginning of period | $9.99 | $10.66 | $10.00 |
| Income from Investment Operations | | | |
| Net investment income (loss)B | .13 | .26 | .06 |
| Net realized and unrealized gain (loss) | .83 | (.81) | .60 |
| Total from investment operations | .96 | (.55) | .66 |
| Distributions from net investment income | (.23) | (.10) | – |
| Distributions from net realized gain | – | (.02) | – |
| Total distributions | (.23) | (.12) | – |
| Net asset value, end of period | $10.72 | $9.99 | $10.66 |
| Total ReturnC,D | 9.88% | (5.26)% | 6.60% |
| Ratios to Average Net AssetsE,F | | | |
| Expenses before reductionsG | - %H | -% | - %H |
| Expenses net of fee waivers, if anyG | - %H | -% | - %H |
| Expenses net of all reductionsG | - %H | -% | - %H |
| Net investment income (loss) | 2.58%H | 2.42% | 2.62%H |
| Supplemental Data | | | |
| Net assets, end of period (000 omitted) | $1,586,691 | $1,385,499 | $1,476,967 |
| Portfolio turnover rateI | 8%H | 36% | 3%J |
A For the period August 15, 2017 (commencement of operations) to October 31, 2017.
B Calculated based on average shares outstanding during the period.
C Total returns for periods of less than one year are not annualized.
D Total returns would have been lower if certain expenses had not been reduced during the applicable periods shown.
E Fees and expenses of any underlying Fidelity Central Funds are not included in the Fund's expense ratio. The Fund indirectly bears its proportionate share of the expenses of any underlying Fidelity Central Funds.
F Expense ratios reflect operating expenses of the Fund. Expenses before reductions do not reflect amounts reimbursed by the investment adviser or reductions from expense offset arrangements and do not represent the amount paid by the Fund during periods when reimbursements or reductions occur. Expense ratios before reductions for start-up periods may not be representative of longer term operating periods. Expenses net of fee waivers reflect expenses after reimbursement by the investment adviser but prior to reductions from expense offset arrangements. Expenses net of all reductions represent the net expenses paid by the Fund.
G Amount represents less than .005%.
H Annualized
I Amount does not include the portfolio activity of any underlying Fidelity Central Funds.
J Amount not annualized.
See accompanying notes which are an integral part of the financial statements.
Notes to Financial Statements (Unaudited)
For the period ended April 30, 2019
1. Organization.
Fidelity Series Canada Fund (the Fund) is a fund of Fidelity Investment Trust (the Trust) and is authorized to issue an unlimited number of shares. Shares of the Fund are only available for purchase by mutual funds for which Fidelity Management & Research Company (FMR) or an affiliate serves as an investment manager. The Trust is registered under the Investment Company Act of 1940, as amended (the 1940 Act), as an open-end management investment company organized as a Massachusetts business trust.
2. Investments in Fidelity Central Funds.
The Fund invests in Fidelity Central Funds, which are open-end investment companies generally available only to other investment companies and accounts managed by the investment adviser and its affiliates. The Fund's Schedule of Investments lists each of the Fidelity Central Funds held as of period end, if any, as an investment of the Fund, but does not include the underlying holdings of each Fidelity Central Fund. As an Investing Fund, the Fund indirectly bears its proportionate share of the expenses of the underlying Fidelity Central Funds.
The Money Market Central Funds seek preservation of capital and current income and are managed by Fidelity Investments Money Management, Inc. (FIMM), an affiliate of the investment adviser. Annualized expenses of the Money Market Central Funds as of their most recent shareholder report date are less than .005%.
A complete unaudited list of holdings for each Fidelity Central Fund is available upon request or at the Securities and Exchange Commission (the SEC) website at www.sec.gov. In addition, the financial statements of the Fidelity Central Funds are available on the SEC website or upon request.
3. Significant Accounting Policies.
The Fund is an investment company and applies the accounting and reporting guidance of the Financial Accounting Standards Board (FASB) Accounting Standards Codification Topic 946 Financial Services – Investments Companies. The financial statements have been prepared in conformity with accounting principles generally accepted in the United States of America (GAAP), which require management to make certain estimates and assumptions at the date of the financial statements. Actual results could differ from those estimates. Subsequent events, if any, through the date that the financial statements were issued have been evaluated in the preparation of the financial statements. The following summarizes the significant accounting policies of the Fund:
Investment Valuation. Investments are valued as of 4:00 p.m. Eastern time on the last calendar day of the period. The Board of Trustees (the Board) has delegated the day to day responsibility for the valuation of the Fund's investments to the Fair Value Committee (the Committee) established by the Fund's investment adviser. In accordance with valuation policies and procedures approved by the Board, the Fund attempts to obtain prices from one or more third party pricing vendors or brokers to value its investments. When current market prices, quotations or currency exchange rates are not readily available or reliable, investments will be fair valued in good faith by the Committee, in accordance with procedures adopted by the Board. Factors used in determining fair value vary by investment type and may include market or investment specific events. The frequency with which these procedures are used cannot be predicted and they may be utilized to a significant extent. The Committee oversees the Fund's valuation policies and procedures and reports to the Board on the Committee's activities and fair value determinations. The Board monitors the appropriateness of the procedures used in valuing the Fund's investments and ratifies the fair value determinations of the Committee.
The Fund categorizes the inputs to valuation techniques used to value its investments into a disclosure hierarchy consisting of three levels as shown below:
- Level 1 – quoted prices in active markets for identical investments
- Level 2 – other significant observable inputs (including quoted prices for similar investments, interest rates, prepayment speeds, etc.)
- Level 3 – unobservable inputs (including the Fund's own assumptions based on the best information available)
Valuation techniques used to value the Fund's investments by major category are as follows:
Equity securities, including restricted securities, for which market quotations are readily available, are valued at the last reported sale price or official closing price as reported by a third party pricing vendor on the primary market or exchange on which they are traded and are categorized as Level 1 in the hierarchy. In the event there were no sales during the day or closing prices are not available, securities are valued at the last quoted bid price or may be valued using the last available price and are generally categorized as Level 2 in the hierarchy. For foreign equity securities, when market or security specific events arise, comparisons to the valuation of American Depositary Receipts (ADRs), futures contracts, Exchange-Traded Funds (ETFs) and certain indexes as well as quoted prices for similar securities may be used and would be categorized as Level 2 in the hierarchy. For equity securities, including restricted securities, where observable inputs are limited, assumptions about market activity and risk are used and these securities may be categorized as Level 3 in the hierarchy.
Investments in open-end mutual funds, including the Fidelity Central Funds, are valued at their closing net asset value (NAV) each business day and are categorized as Level 1 in the hierarchy.
Changes in valuation techniques may result in transfers in or out of an assigned level within the disclosure hierarchy.
Foreign Currency. The Fund may use foreign currency contracts to facilitate transactions in foreign-denominated securities. Gains and losses from these transactions may arise from changes in the value of the foreign currency or if the counterparties do not perform under the contracts' terms.
Foreign-denominated assets, including investment securities, and liabilities are translated into U.S. dollars at the exchange rates at period end. Purchases and sales of investment securities, income and dividends received and expenses denominated in foreign currencies are translated into U.S. dollars at the exchange rate in effect on the transaction date.
The effects of exchange rate fluctuations on investments are included with the net realized and unrealized gain (loss) on investment securities. Other foreign currency transactions resulting in realized and unrealized gain (loss) are disclosed separately.
Investment Transactions and Income. For financial reporting purposes, the Fund's investment holdings and NAV include trades executed through the end of the last business day of the period. The NAV per share for processing shareholder transactions is calculated as of the close of business of the New York Stock Exchange (NYSE), normally 4:00 p.m. Eastern time and includes trades executed through the end of the prior business day. Gains and losses on securities sold are determined on the basis of identified cost. Dividend income is recorded on the ex-dividend date, except for certain dividends from foreign securities where the ex-dividend date may have passed, which are recorded as soon as the Fund is informed of the ex-dividend date. Non-cash dividends included in dividend income, if any, are recorded at the fair market value of the securities received. Income and capital gain distributions from Fidelity Central Funds, if any, are recorded on the ex-dividend date. Certain distributions received by the Fund represent a return of capital or capital gain. The Fund determines the components of these distributions subsequent to the ex-dividend date, based upon receipt of tax filings or other correspondence relating to the underlying investment. These distributions are recorded as a reduction of cost of investments and/or as a realized gain. Investment income is recorded net of foreign taxes withheld where recovery of such taxes is uncertain.
Expenses. Expenses directly attributable to a fund are charged to that fund. Expenses attributable to more than one fund are allocated among the respective funds on the basis of relative net assets or other appropriate methods. Expense estimates are accrued in the period to which they relate and adjustments are made when actual amounts are known.
Income Tax Information and Distributions to Shareholders. Each year, the Fund intends to qualify as a regulated investment company under Subchapter M of the Internal Revenue Code, including distributing substantially all of its taxable income and realized gains. As a result, no provision for U.S. Federal income taxes is required. The Fund files a U.S. federal tax return, in addition to state and local tax returns as required. The Fund's federal income tax returns are subject to examination by the Internal Revenue Service (IRS) for a period of three fiscal years after they are filed. State and local tax returns may be subject to examination for an additional fiscal year depending on the jurisdiction. Foreign taxes are provided for based on the Fund's understanding of the tax rules and rates that exist in the foreign markets in which it invests.
Distributions are declared and recorded on the ex-dividend date. Income and capital gain distributions are determined in accordance with income tax regulations, which may differ from GAAP.
Capital accounts within the financial statements are adjusted for permanent book-tax differences. These adjustments have no impact on net assets or the results of operations. Capital accounts are not adjusted for temporary book-tax differences which will reverse in a subsequent period.
Book-tax differences are primarily due to foreign currency transactions, passive foreign investment companies (PFIC), capital loss carryforwards and losses deferred due to wash sales.
As of period end, the cost and unrealized appreciation (depreciation) in securities, and derivatives if applicable, for federal income tax purposes were as follows:
| Gross unrealized appreciation | $134,042,554 |
| Gross unrealized depreciation | (75,519,058) |
| Net unrealized appreciation (depreciation) | $58,523,496 |
| Tax cost | $1,569,566,651 |
Capital loss carryforwards are only available to offset future capital gains of the Fund to the extent provided by regulations and may be limited. Under the Regulated Investment Company Modernization Act of 2010 (the Act), the Fund is permitted to carry forward capital losses incurred in taxable years beginning after December 22, 2010 for an unlimited period and such capital losses are required to be used prior to any losses that expire. The capital loss carryforward information presented below, including any applicable limitation, is estimated as of prior fiscal period end and is subject to adjustment.
Restricted Securities. The Fund may invest in securities that are subject to legal or contractual restrictions on resale. These securities generally may be resold in transactions exempt from registration or to the public if the securities are registered. Disposal of these securities may involve time-consuming negotiations and expense, and prompt sale at an acceptable price may be difficult. Information regarding restricted securities is included at the end of the Fund's Schedule of Investments.
4. Purchases and Sales of Investments.
Purchases and sales of securities, other than short-term securities, aggregated $139,201,678 and $61,000,111, respectively.
5. Fees and Other Transactions with Affiliates.
Management Fee. Fidelity Management & Research Company (the investment adviser) and its affiliates provide the Fund with investment management related services for which the Fund does not pay a management fee. Under the management contract, the investment adviser or an affiliate pays all ordinary operating expenses of the Fund, except custody fees, fees and expenses of the independent Trustees, and certain miscellaneous expenses such as proxy and shareholder meeting expenses.
Interfund Trades. The Fund may purchase from or sell securities to other Fidelity Funds under procedures adopted by the Board. The procedures have been designed to ensure these interfund trades are executed in accordance with Rule 17a-7 of the 1940 Act. Interfund trades are included within the respective purchases and sales amounts shown in the Purchases and Sales of Investments note.
6. Committed Line of Credit.
The Fund participates with other funds managed by the investment adviser or an affiliate in a $4.25 billion credit facility (the "line of credit") to be utilized for temporary or emergency purposes to fund shareholder redemptions or for other short-term liquidity purposes. The Fund has agreed to pay commitment fees on its pro-rata portion of the line of credit, which amounted to $2,069 and is reflected in Commitment fees on the Statement of Operations. During the period, the Fund did not borrow on this line of credit.
7. Security Lending.
The Fund lends portfolio securities through a lending agent from time to time in order to earn additional income. For equity securities, a lending agent is used and may loan securities to certain qualified borrowers, including Fidelity Capital Markets (FCM), a broker-dealer affiliated with the Fund. On the settlement date of the loan, the Fund receives collateral (in the form of U.S. Treasury obligations, letters of credit and/or cash) against the loaned securities and maintains collateral in an amount not less than 100% of the market value of the loaned securities during the period of the loan. The market value of the loaned securities is determined at the close of business of the Fund and any additional required collateral is delivered to the Fund on the next business day. The Fund or borrower may terminate the loan at any time, and if the borrower defaults on its obligation to return the securities loaned because of insolvency or other reasons, the Fund may apply collateral received from the borrower against the obligation. The Fund may experience delays and costs in recovering the securities loaned. Any cash collateral received is invested in the Fidelity Securities Lending Cash Central Fund. The value of loaned securities and cash collateral at period end are disclosed on the Fund's Statement of Assets and Liabilities. Security lending income represents the income earned on investing cash collateral, less rebates paid to borrowers and any lending agent fees associated with the loan, plus any premium payments received for lending certain types of securities. Security lending income is presented in the Statement of Operations as a component of income from Fidelity Central Funds. Total security lending income during the period amounted to $229,712. During the period, there were no securities loaned to FCM.
8. Expense Reductions.
Through arrangements with the Fund's custodian, credits realized as a result of certain uninvested cash balances were used to reduce the Fund's expenses. During the period, these credits reduced the Fund's custody expenses by $16.
9. Other.
The Fund's organizational documents provide former and current trustees and officers with a limited indemnification against liabilities arising in connection with the performance of their duties to the Fund. In the normal course of business, the Fund may also enter into contracts that provide general indemnifications. The Fund's maximum exposure under these arrangements is unknown as this would be dependent on future claims that may be made against the Fund. The risk of material loss from such claims is considered remote.
At the end of the period, mutual funds managed by the investment adviser or its affiliates were the owners of record of all of the outstanding shares of the Fund.
Shareholder Expense Example
As a shareholder of the Fund, you incur two types of costs: (1) transaction costs, and (2) ongoing costs, including other Fund expenses. This Example is intended to help you understand your ongoing costs (in dollars) of investing in the Fund and to compare these costs with the ongoing costs of investing in other mutual funds.
The Example is based on an investment of $1,000 invested at the beginning of the period and held for the entire period (November 1, 2018 to April 30, 2019).
Actual Expenses
The first line of the accompanying table provides information about actual account values and actual expenses. You may use the information in this line, together with the amount you invested, to estimate the expenses that you paid over the period. Simply divide your account value by $1,000.00 (for example, an $8,600 account value divided by $1,000.00 = 8.6), then multiply the result by the number in the first line under the heading entitled "Expenses Paid During Period" to estimate the expenses you paid on your account during this period. In addition, the Fund, as a shareholder in the underlying Fidelity Central Funds, will indirectly bear its pro-rata share of the fees and expenses incurred by the underlying Fidelity Central Funds. These fees and expenses are not included in the Fund's annualized expense ratio used to calculate the expense estimate in the table below.
Hypothetical Example for Comparison Purposes
The second line of the accompanying table provides information about hypothetical account values and hypothetical expenses based on the Fund's actual expense ratio and an assumed rate of return of 5% per year before expenses, which is not the Fund's actual return. The hypothetical account values and expenses may not be used to estimate the actual ending account balance or expenses you paid for the period. You may use this information to compare the ongoing costs of investing in the Fund and other funds. To do so, compare this 5% hypothetical example with the 5% hypothetical examples that appear in the shareholder reports of the other funds. In addition, the Fund, as a shareholder in the underlying Fidelity Central Funds, will indirectly bear its pro-rata share of the fees and expenses incurred by the underlying Fidelity Central Funds. These fees and expenses are not included in the Fund's annualized expense ratio used to calculate the expense estimate in the table below.
Please note that the expenses shown in the table are meant to highlight your ongoing costs only and do not reflect any transaction costs. Therefore, the second line of the table is useful in comparing ongoing costs only, and will not help you determine the relative total costs of owning different funds.
| | Annualized Expense Ratio-A | Beginning
Account Value
November 1, 2018 | Ending
Account Value
April 30, 2019 | Expenses Paid
During Period-B
November 1, 2018
to April 30, 2019 |
| Actual | - %-C | $1,000.00 | $1,098.80 | $--D |
| Hypothetical-E | | $1,000.00 | $1,024.79 | $--D |
A Annualized expense ratio reflects expenses net of applicable fee waivers.
B Expenses are equal to the Fund's annualized expense ratio, multiplied by the average account value over the period, multiplied by 181/365 (to reflect the one-half year period).
C Amount represents less than .005%.
D Amount represents less than $.005.
E 5% return per year before expenses
Board Approval of Investment Advisory Contracts and Management Fees
Fidelity Series Canada Fund
Each year, the Board of Trustees, including the Independent Trustees (together, the Board), votes on the renewal of the management contract with Fidelity Management & Research Company (FMR) and the sub-advisory agreements (together, the Advisory Contracts) for the fund. FMR and the sub-advisers are referred to herein as the Investment Advisers. The Board, assisted by the advice of fund counsel and Independent Trustees' counsel, requests and considers a broad range of information relevant to the renewal of the Advisory Contracts throughout the year.
The Board meets regularly and, at each of its meetings, covers an extensive agenda of topics and materials and considers factors that are relevant to its annual consideration of the renewal of the fund's Advisory Contracts, including the services and support provided to the fund and its shareholders. The Board has established various standing committees (Committees), each composed of and chaired by Independent Trustees with varying backgrounds, to which the Board has assigned specific subject matter responsibilities in order to enhance effective decision-making by the Board. The Board, acting directly and through its Committees, requests and receives information concerning the annual consideration of the renewal of the fund's Advisory Contracts. The Board also meets as needed to review matters specifically related to the Board's annual consideration of the renewal of the Advisory Contracts. Members of the Board may also meet with trustees of other Fidelity funds through joint ad hoc committees to discuss certain matters relevant to all of the Fidelity funds.
At its January 2019 meeting, the Board unanimously determined to renew the fund's Advisory Contracts. In considering whether to renew the Advisory Contracts for the fund, the Board considered all factors it believed relevant and reached a determination, with the assistance of fund counsel and Independent Trustees' counsel and through the exercise of its business judgment, that the renewal of the Advisory Contracts was in the best interests of the fund and its shareholders and the fact that no fee is payable under the management contract was fair and reasonable.
Nature, Extent, and Quality of Services Provided. The Board considered Fidelity's staffing as it relates to the fund, including the backgrounds of investment personnel of Fidelity, and also considered the fund's investment objective, strategies, and related investment philosophy. The Independent Trustees also had discussions with senior management of Fidelity's investment operations and investment groups. The Board considered the structure of the investment personnel compensation program and whether this structure provides appropriate incentives to act in the best interests of the fund.
Resources Dedicated to Investment Management and Support Services. The Board and the Fund Oversight and Research Committees reviewed the general qualifications and capabilities of Fidelity's investment staff, including its size, education, experience, and resources, as well as Fidelity's approach to recruiting, training, managing, and compensating investment personnel. The Board noted that Fidelity has continued to increase the resources devoted to non-U.S. offices, including expansion of Fidelity's global investment organization. The Board also noted that Fidelity's analysts have extensive resources, tools and capabilities that allow them to conduct sophisticated quantitative and fundamental analysis, as well as credit analysis of issuers, counterparties and guarantors. Further, the Board considered that Fidelity's investment professionals have sufficient access to global information and data so as to provide competitive investment results over time, and that those professionals also have access to sophisticated tools that permit them to assess portfolio construction and risk and performance attribution characteristics continuously, as well as to transmit new information and research conclusions rapidly around the world. Additionally, in its deliberations, the Board considered Fidelity's trading, risk management, compliance, and technology and operations capabilities and resources, which are integral parts of the investment management process.
Administrative Services. The Board considered (i) the nature, extent, quality, and cost of advisory and administrative services performed by the Investment Advisers and their affiliates under the Advisory Contracts and under separate agreements covering transfer agency, pricing and bookkeeping, and securities lending services for the fund; (ii) the nature and extent of the supervision of third party service providers, principally custodians, subcustodians, and pricing vendors; and (iii) the resources devoted to, and the record of compliance with, the fund's compliance policies and procedures. The Board also reviewed the allocation of fund brokerage, including allocations to brokers affiliated with the Investment Advisers, the use of brokerage commissions to pay fund expenses, and the use of "soft" commission dollars to pay for research services.
Investment Performance. The Board considered whether the fund has operated in accordance with its investment objective, as well as its record of compliance with its investment restrictions. The Board reviewed the fund's absolute investment performance, as well as the fund's relative investment performance, but did not consider performance to be a material factor in its decision to renew the fund's Advisory Contracts, as the fund is not publicly offered as a stand-alone investment product. In this regard, the Board noted that the fund is designed to offer an investment option for other investment companies managed by Fidelity and ultimately to enhance the performance of those investment companies.
Based on its review, the Board concluded that the nature, extent, and quality of services provided to the fund under the Advisory Contracts should continue to benefit the shareholders of the fund.
Competitiveness of Management Fee and Total Expense Ratio. The Board considered that the fund does not pay FMR a management fee for investment advisory services. The Board also noted that FMR or an affiliate undertakes to pay all operating expenses of the fund with certain exceptions.
In connection with the renewal of the Advisory Contracts, the Board also approved amendments to the management contract for the fund to clarify that the fund pays its non-operating expenses, including brokerage commissions and fees and expenses associated with the fund's securities lending program. The Board considered that the amendments would not change the services provided to the fund or the party responsible for making such payments under the current management contract.
The Board further considered that FMR has contractually agreed to reimburse the fund to the extent that total operating expenses, with certain exceptions, as a percentage of its average net assets, exceed 0.014% through December 31, 2020.
Based on its review, the Board considered that the fund does not pay a management fee and concluded that the total expense ratio of each class of the fund was reasonable in light of the services that the fund and its shareholders receive and the other factors considered.
Costs of the Services and Profitability. The Board considered the level of Fidelity's profits in respect of all the Fidelity funds.
PricewaterhouseCoopers LLP (PwC), auditor to Fidelity and certain Fidelity funds, has been engaged annually by the Board as part of the Board's assessment of Fidelity's profitability analysis. PwC's engagement includes the review and assessment of the methodologies used by Fidelity in determining the revenues and expenses attributable to Fidelity's mutual fund business, and completion of agreed-upon procedures in respect of the mathematical accuracy of the fund profitability information and its conformity to established allocation methodologies. After considering PwC's reports issued under the engagement and information provided by Fidelity, the Board concluded that while other allocation methods may also be reasonable, Fidelity's profitability methodologies are reasonable in all material respects.
The Board also reviewed Fidelity's non-fund businesses and potential indirect benefits such businesses may have received as a result of their association with Fidelity's mutual fund business (i.e., fall-out benefits) as well as cases where Fidelity's affiliates may benefit from the fund's business. The Board noted that changes to fall-out benefits year-over-year reflect business developments at Fidelity's various businesses.
The Board concluded that the costs of the services provided by and the profits realized by Fidelity in connection with the operation of the fund were not relevant to the renewal of the Advisory Contracts because the fund pays no advisory fees and FMR or an affiliate bears all expenses of the fund with certain exceptions.
Economies of Scale. The Board concluded that because the fund pays no advisory fees and FMR or an affiliate bears all expenses of the fund with certain exceptions, the realization of economies of scale was not a material factor in the Board's decision to renew the fund's Advisory Contracts.
Additional Information Requested by the Board. In order to develop fully the factual basis for consideration of the Fidelity funds' advisory contracts, the Board requested and received additional information on certain topics, including: (i) fund performance trends, in particular the underperformance of certain funds, and Fidelity's long-term strategies for certain funds; (ii) Fidelity's fund profitability methodology, profitability trends for certain funds, and the impact of certain factors on fund profitability results; (iii) metrics for evaluating index fund and ETF performance and information about ETF trading characteristics; (iv) the methodology with respect to the evaluation of competitive fund data and peer group classifications and fee comparisons; (v) the expense structures for different funds and classes; (vi) information regarding other accounts managed by Fidelity, including collective investment trusts; and (vii) Fidelity's philosophies and strategies for evaluating funds and classes with lower or declining asset levels.
Based on its evaluation of all of the conclusions noted above, and after considering all factors it believed relevant, the Board concluded that the advisory fee arrangements are fair and reasonable, and that the fund's Advisory Contracts should be renewed.
SAD-SANN-0619
1.9883883.101
Fidelity® Total International Equity Fund
Semi-Annual Report April 30, 2019 Includes Fidelity and Fidelity Advisor share classes |
|
Beginning on January 1, 2021, as permitted by regulations adopted by the Securities and Exchange Commission, paper copies of a fund’s shareholder reports will no longer be sent by mail, unless you specifically request paper copies of the reports from the fund or from your financial intermediary, such as a financial advisor, broker-dealer or bank. Instead, the reports will be made available on a website, and you will be notified by mail each time a report is posted and provided with a website link to access the report.
If you already elected to receive shareholder reports electronically, you will not be affected by this change and you need not take any action. You may elect to receive shareholder reports and other communications from a fund electronically, by contacting your financial intermediary. For Fidelity customers, visit Fidelity's web site or call Fidelity using the contact information listed below.
You may elect to receive all future reports in paper free of charge. If you wish to continue receiving paper copies of your shareholder reports, you may contact your financial intermediary or, if you are a Fidelity customer, visit Fidelity’s website, or call Fidelity at the applicable toll-free number listed below. Your election to receive reports in paper will apply to all funds held with the fund complex/your financial intermediary.
| Account Type | Website | Phone Number |
| Brokerage, Mutual Fund, or Annuity Contracts: | fidelity.com/mailpreferences | 1-800-343-3548 |
| Employer Provided Retirement Accounts: | netbenefits.fidelity.com/preferences (choose 'no' under Required Disclosures to continue to print) | 1-800-343-0860 |
| Advisor Sold Accounts Serviced Through Your Financial Intermediary: | Contact Your Financial Intermediary | Your Financial Intermediary's phone number |
| Advisor Sold Accounts Serviced by Fidelity: | institutional.fidelity.com | 1-877-208-0098 |
Contents
To view a fund's proxy voting guidelines and proxy voting record for the 12-month period ended June 30, visit http://www.fidelity.com/proxyvotingresults or visit the Securities and Exchange Commission's (SEC) web site at http://www.sec.gov.
You may also call 1-800-544-8544 if you’re an individual investing directly with Fidelity, call 1-800-835-5092 if you’re a plan sponsor or participant with Fidelity as your recordkeeper or call 1-877-208-0098 on institutional accounts or if you’re an advisor or invest through one to request a free copy of the proxy voting guidelines.
Standard & Poor's, S&P and S&P 500 are registered service marks of The McGraw-Hill Companies, Inc. and have been licensed for use by Fidelity Distributors Corporation.
Other third-party marks appearing herein are the property of their respective owners.
All other marks appearing herein are registered or unregistered trademarks or service marks of FMR LLC or an affiliated company. © 2019 FMR LLC. All rights reserved.
This report and the financial statements contained herein are submitted for the general information of the shareholders of the Fund. This report is not authorized for distribution to prospective investors in the Fund unless preceded or accompanied by an effective prospectus.
A fund files its complete schedule of portfolio holdings with the SEC for the first and third quarters of each fiscal year on Form N-PORT. Forms N-PORT are available on the SEC’s web site at http://www.sec.gov. A fund's Forms N-PORT may be reviewed and copied at the SEC’s Public Reference Room in Washington, DC. Information regarding the operation of the SEC's Public Reference Room may be obtained by calling 1-800-SEC-0330.
For a complete list of a fund's portfolio holdings, view the most recent holdings listing, semiannual report, or annual report on Fidelity's web site at http://www.fidelity.com, http://www.institutional.fidelity.com, or http://www.401k.com, as applicable.
NOT FDIC INSURED •MAY LOSE VALUE •NO BANK GUARANTEE
Neither the Fund nor Fidelity Distributors Corporation is a bank.
Investment Summary (Unaudited)
Geographic Diversification (% of fund's net assets)
| As of April 30, 2019 |
| | Japan | 13.8% |
| | United States of America* | 9.3% |
| | United Kingdom | 8.6% |
| | France | 6.7% |
| | Canada | 6.4% |
| | Germany | 5.8% |
| | Cayman Islands | 4.8% |
| | Switzerland | 4.6% |
| | India | 3.8% |
| | Other | 36.2% |

* Includes Short-Term investments and Net Other Assets (Liabilities).
Percentages are based on country or territory of incorporation and are adjusted for the effect of futures contracts, if applicable.
Asset Allocation as of April 30, 2019
| | % of fund's net assets |
| Stocks | 98.9 |
| Short-Term Investments and Net Other Assets (Liabilities) | 1.1 |
Top Ten Stocks as of April 30, 2019
| | % of fund's net assets |
| Alibaba Group Holding Ltd. sponsored ADR (Cayman Islands, Internet & Direct Marketing Retail) | 1.9 |
| Tencent Holdings Ltd. (Cayman Islands, Interactive Media & Services) | 1.8 |
| Taiwan Semiconductor Manufacturing Co. Ltd. (Taiwan, Semiconductors & Semiconductor Equipment) | 1.7 |
| Nestle SA (Reg. S) (Switzerland, Food Products) | 1.6 |
| SAP SE (Germany, Software) | 1.5 |
| AIA Group Ltd. (Hong Kong, Insurance) | 1.3 |
| Naspers Ltd. Class N (South Africa, Internet & Direct Marketing Retail) | 1.3 |
| ASML Holding NV (Netherlands) (Netherlands, Semiconductors & Semiconductor Equipment) | 1.3 |
| Keyence Corp. (Japan, Electronic Equipment & Components) | 1.2 |
| MasterCard, Inc. Class A (United States of America, IT Services) | 1.2 |
| | 14.8 |
Top Market Sectors as of April 30, 2019
| | % of fund's net assets |
| Financials | 23.3 |
| Information Technology | 16.0 |
| Industrials | 14.5 |
| Consumer Discretionary | 9.7 |
| Materials | 8.6 |
| Health Care | 6.9 |
| Consumer Staples | 6.7 |
| Energy | 5.9 |
| Communication Services | 4.7 |
| Real Estate | 1.8 |
Schedule of Investments April 30, 2019 (Unaudited)
Showing Percentage of Net Assets
| Common Stocks - 97.6% | | | |
| | | Shares | Value |
| Australia - 2.1% | | | |
| Beacon Lighting Group Ltd. | | 15,420 | $11,278 |
| Commonwealth Bank of Australia | | 10,876 | 571,348 |
| CSL Ltd. | | 7,394 | 1,035,026 |
| Imdex Ltd. | | 15,311 | 11,225 |
| Insurance Australia Group Ltd. | | 40,438 | 224,633 |
| Macquarie Group Ltd. | | 2,988 | 283,731 |
|
| TOTAL AUSTRALIA | | | 2,137,241 |
|
| Austria - 0.6% | | | |
| Andritz AG | | 7,272 | 346,642 |
| Erste Group Bank AG | | 6,300 | 252,259 |
|
| TOTAL AUSTRIA | | | 598,901 |
|
| Bailiwick of Jersey - 0.9% | | | |
| Experian PLC | | 11,500 | 334,753 |
| Glencore Xstrata PLC | | 107,000 | 424,529 |
| Integrated Diagnostics Holdings PLC (a) | | 7,500 | 36,375 |
| WPP PLC | | 8,300 | 103,566 |
|
| TOTAL BAILIWICK OF JERSEY | | | 899,223 |
|
| Belgium - 0.7% | | | |
| Barco NV | | 310 | 55,075 |
| KBC Ancora | | 1,311 | 66,757 |
| KBC Groep NV | | 7,512 | 556,249 |
|
| TOTAL BELGIUM | | | 678,081 |
|
| Bermuda - 0.3% | | | |
| Credicorp Ltd. (United States) | | 1,212 | 287,123 |
| Brazil - 2.6% | | | |
| Atacadao Distribuicao Comercio e Industria Ltda | | 27,700 | 149,764 |
| BM&F BOVESPA SA | | 51,500 | 452,469 |
| Equatorial Energia SA | | 12,300 | 257,537 |
| Itau Unibanco Holding SA | | 4,050 | 30,315 |
| Localiza Rent A Car SA | | 20,500 | 189,258 |
| Lojas Renner SA | | 26,900 | 321,612 |
| Natura Cosmeticos SA | | 12,800 | 170,532 |
| Notre Dame Intermedica Participacoes SA | | 14,800 | 132,559 |
| Rumo SA (b) | | 44,300 | 204,491 |
| Suzano Papel e Celulose SA | | 21,400 | 222,290 |
| Vale SA sponsored ADR | | 36,183 | 462,419 |
|
| TOTAL BRAZIL | | | 2,593,246 |
|
| Canada - 6.4% | | | |
| Alimentation Couche-Tard, Inc. Class B (sub. vtg.) | | 13,749 | 810,654 |
| Canadian National Railway Co. | | 10,236 | 950,786 |
| Canadian Pacific Railway Ltd. | | 3,216 | 720,569 |
| CCL Industries, Inc. Class B | | 9,976 | 425,564 |
| Constellation Software, Inc. | | 872 | 769,400 |
| Franco-Nevada Corp. | | 6,234 | 446,668 |
| McCoy Global, Inc. (b) | | 7,000 | 4,180 |
| New Look Vision Group, Inc. | | 1,300 | 29,946 |
| Nutrien Ltd. | | 13,986 | 758,545 |
| Pason Systems, Inc. | | 15,045 | 224,041 |
| PrairieSky Royalty Ltd. | | 13,458 | 193,979 |
| ShawCor Ltd. Class A | | 800 | 11,871 |
| Suncor Energy, Inc. | | 12,294 | 405,426 |
| The Toronto-Dominion Bank | | 12,000 | 684,511 |
|
| TOTAL CANADA | | | 6,436,140 |
|
| Cayman Islands - 4.8% | | | |
| Airtac International Group | | 17,000 | 226,652 |
| Alibaba Group Holding Ltd. sponsored ADR (b) | | 10,519 | 1,952,004 |
| New Oriental Education & Technology Group, Inc. sponsored ADR (b) | | 3,692 | 352,438 |
| Shenzhou International Group Holdings Ltd. | | 24,400 | 327,519 |
| TAL Education Group ADR (b) | | 5,125 | 197,159 |
| Tencent Holdings Ltd. | | 35,700 | 1,759,570 |
|
| TOTAL CAYMAN ISLANDS | | | 4,815,342 |
|
| Chile - 0.4% | | | |
| Banco Santander Chile sponsored ADR | | 8,800 | 246,400 |
| Sociedad Quimica y Minera de Chile SA (PN-B) sponsored ADR | | 3,515 | 125,275 |
|
| TOTAL CHILE | | | 371,675 |
|
| China - 3.2% | | | |
| Foshan Haitian Flavouring & Food Co. Ltd. (A Shares) | | 20,700 | 274,406 |
| Inner Mongoli Yili Industries Co. Ltd. (A Shares) | | 56,400 | 259,603 |
| Jiangsu Yanghe Brewery Joint-Stock Co. Ltd. (A Shares) | | 15,600 | 272,535 |
| Kweichow Moutai Co. Ltd. (A Shares) | | 2,394 | 346,220 |
| Midea Group Co. Ltd. (A Shares) | | 37,500 | 291,764 |
| Ping An Insurance (Group) Co. of China Ltd. (H Shares) | | 70,000 | 847,327 |
| Shanghai International Airport Co. Ltd. (A Shares) | | 28,700 | 300,982 |
| Shenzhen Inovance Technology Co. Ltd. (A Shares) | | 67,200 | 251,143 |
| Wuliangye Yibin Co. Ltd. (A Shares) | | 20,600 | 313,088 |
| Zhejiang Sanhua Intelligent Controls Co. Ltd. (A Shares) | | 10,600 | 25,025 |
|
| TOTAL CHINA | | | 3,182,093 |
|
| Denmark - 0.4% | | | |
| A.P. Moller - Maersk A/S Series B | | 147 | 189,497 |
| Jyske Bank A/S (Reg.) | | 3,054 | 123,008 |
| Netcompany Group A/S (a) | | 700 | 24,966 |
| SimCorp A/S | | 520 | 50,974 |
| Spar Nord Bank A/S | | 4,231 | 36,359 |
|
| TOTAL DENMARK | | | 424,804 |
|
| Finland - 0.6% | | | |
| Nokia Corp. | | 47,600 | 250,119 |
| Sampo Oyj (A Shares) | | 6,353 | 290,892 |
| Tikkurila Oyj | | 4,880 | 81,663 |
|
| TOTAL FINLAND | | | 622,674 |
|
| France - 6.7% | | | |
| Atos Origin SA | | 1,397 | 143,808 |
| AXA SA (c) | | 20,406 | 544,157 |
| Bouygues SA | | 4,079 | 153,446 |
| Capgemini SA | | 2,102 | 254,857 |
| Dassault Systemes SA | | 1,700 | 268,943 |
| Edenred SA | | 6,100 | 287,422 |
| Elis SA | | 7,051 | 125,744 |
| Hermes International SCA | | 372 | 261,690 |
| Kering SA | | 458 | 270,716 |
| Laurent-Perrier Group SA | | 259 | 27,423 |
| Legrand SA | | 3,700 | 271,903 |
| LVMH Moet Hennessy - Louis Vuitton SA | | 730 | 286,611 |
| Natixis SA | | 38,800 | 228,383 |
| Pernod Ricard SA | | 1,300 | 226,513 |
| Safran SA | | 3,900 | 568,468 |
| Sanofi SA | | 6,428 | 560,839 |
| Societe Generale Series A | | 6,500 | 206,125 |
| SR Teleperformance SA | | 1,100 | 211,343 |
| Total SA (c) | | 16,315 | 906,963 |
| Vetoquinol SA | | 600 | 37,686 |
| VINCI SA | | 5,600 | 565,579 |
| Vivendi SA | | 9,552 | 277,255 |
|
| TOTAL FRANCE | | | 6,685,874 |
|
| Germany - 5.5% | | | |
| Bayer AG | | 6,375 | 424,293 |
| Brenntag AG | | 2,200 | 118,589 |
| CompuGroup Medical AG | | 2,146 | 142,010 |
| Continental AG | | 1,600 | 264,446 |
| CTS Eventim AG | | 1,062 | 54,364 |
| Deutsche Borse AG | | 2,100 | 280,607 |
| Hannover Reuck SE | | 2,200 | 331,635 |
| HeidelbergCement Finance AG | | 3,200 | 258,417 |
| Linde PLC | | 5,252 | 944,859 |
| MTU Aero Engines Holdings AG | | 1,600 | 376,319 |
| Nexus AG | | 1,420 | 40,613 |
| Rheinmetall AG | | 900 | 103,266 |
| SAP SE | | 11,433 | 1,473,808 |
| Vonovia SE | | 12,370 | 616,985 |
| WashTec AG | | 450 | 35,381 |
|
| TOTAL GERMANY | | | 5,465,592 |
|
| Greece - 0.0% | | | |
| Motor Oil (HELLAS) Corinth Refineries SA | | 900 | 22,955 |
| Hong Kong - 1.3% | | | |
| AIA Group Ltd. | | 131,800 | 1,349,558 |
| India - 3.8% | | | |
| Asian Paints Ltd. | | 13,246 | 278,273 |
| Axis Bank Ltd. (b) | | 32,300 | 355,640 |
| Embassy Office Parks (REIT) (b) | | 4,800 | 22,083 |
| Godrej Consumer Products Ltd. | | 27,487 | 257,240 |
| HDFC Bank Ltd. | | 8,257 | 273,932 |
| Housing Development Finance Corp. Ltd. | | 29,994 | 859,183 |
| Infosys Ltd. sponsored ADR | | 39,311 | 422,986 |
| Jyothy Laboratories Ltd. | | 5,588 | 14,410 |
| Kotak Mahindra Bank Ltd. | | 13,886 | 276,446 |
| Reliance Industries Ltd. | | 28,201 | 563,963 |
| Tata Consultancy Services Ltd. | | 13,400 | 434,889 |
|
| TOTAL INDIA | | | 3,759,045 |
|
| Indonesia - 0.8% | | | |
| PT Bank Central Asia Tbk | | 167,145 | 337,222 |
| PT Bank Rakyat Indonesia Tbk | | 1,498,500 | 459,540 |
|
| TOTAL INDONESIA | | | 796,762 |
|
| Ireland - 1.3% | | | |
| Accenture PLC Class A | | 1,434 | 261,949 |
| CRH PLC | | 8,718 | 293,280 |
| CRH PLC sponsored ADR | | 15,629 | 525,916 |
| FBD Holdings PLC | | 1,972 | 19,950 |
| James Hardie Industries PLC CDI | | 13,084 | 177,830 |
|
| TOTAL IRELAND | | | 1,278,925 |
|
| Israel - 0.3% | | | |
| Azrieli Group | | 232 | 13,206 |
| Elbit Systems Ltd. (Israel) | | 1,100 | 153,109 |
| Ituran Location & Control Ltd. | | 2,261 | 83,137 |
| Strauss Group Ltd. | | 2,559 | 65,242 |
|
| TOTAL ISRAEL | | | 314,694 |
|
| Italy - 1.5% | | | |
| Assicurazioni Generali SpA | | 12,200 | 236,725 |
| Enel SpA | | 80,000 | 506,573 |
| Interpump Group SpA | | 7,991 | 300,071 |
| Intesa Sanpaolo SpA | | 107,600 | 281,914 |
| Mediobanca SpA | | 16,534 | 175,246 |
|
| TOTAL ITALY | | | 1,500,529 |
|
| Japan - 13.8% | | | |
| Ai Holdings Corp. | | 1,100 | 17,873 |
| Aoki Super Co. Ltd. | | 1,000 | 23,161 |
| Artnature, Inc. | | 2,600 | 14,634 |
| Aucnet, Inc. | | 1,200 | 13,595 |
| Azbil Corp. | | 13,800 | 330,397 |
| Broadleaf Co. Ltd. | | 6,200 | 31,781 |
| Central Automotive Products Ltd. | | 2,400 | 36,670 |
| Coca-Cola West Co. Ltd. | | 800 | 19,656 |
| Daiichikosho Co. Ltd. (d) | | 1,300 | 63,486 |
| Daikokutenbussan Co. Ltd. | | 700 | 23,973 |
| DENSO Corp. | | 12,000 | 522,788 |
| East Japan Railway Co. | | 3,800 | 356,991 |
| Fanuc Corp. | | 1,800 | 338,176 |
| Funai Soken Holdings, Inc. | | 1,150 | 29,660 |
| GCA Savvian Group Corp. | | 2,200 | 16,175 |
| Goldcrest Co. Ltd. | | 2,960 | 38,822 |
| Hitachi High-Technologies Corp. | | 2,900 | 128,866 |
| Honda Motor Co. Ltd. | | 15,300 | 426,915 |
| Hoya Corp. | | 13,600 | 954,118 |
| Idemitsu Kosan Co. Ltd. | | 4,200 | 135,922 |
| INPEX Corp. | | 13,500 | 131,007 |
| Itochu Corp. | | 20,200 | 362,673 |
| Japan Tobacco, Inc. (e) | | 9,720 | 224,606 |
| Kao Corp. | | 3,000 | 230,450 |
| Keyence Corp. | | 1,942 | 1,205,001 |
| Kobayashi Pharmaceutical Co. Ltd. | | 500 | 39,768 |
| Komatsu Ltd. | | 10,400 | 268,636 |
| Koshidaka Holdings Co. Ltd. | | 5,000 | 69,572 |
| Kusuri No Aoki Holdings Co. Ltd. | | 600 | 42,120 |
| Lasertec Corp. | | 2,100 | 94,825 |
| Makita Corp. | | 4,200 | 152,700 |
| Medikit Co. Ltd. | | 600 | 30,648 |
| Minebea Mitsumi, Inc. | | 14,900 | 263,504 |
| Miroku Jyoho Service Co., Ltd. | | 700 | 18,776 |
| Misumi Group, Inc. | | 15,800 | 408,209 |
| Mitsubishi UFJ Financial Group, Inc. | | 91,500 | 453,980 |
| Mitsuboshi Belting Ltd. | | 1,500 | 28,359 |
| Mitsui Fudosan Co. Ltd. | | 11,800 | 271,921 |
| Nabtesco Corp. | | 8,100 | 246,501 |
| Nagaileben Co. Ltd. | | 2,900 | 65,058 |
| ND Software Co. Ltd. | | 1,300 | 19,758 |
| Nihon Parkerizing Co. Ltd. | | 7,500 | 97,424 |
| Nintendo Co. Ltd. | | 300 | 103,325 |
| NS Tool Co. Ltd. | | 1,100 | 25,072 |
| OBIC Co. Ltd. (e) | | 3,800 | 438,691 |
| Oracle Corp. Japan | | 2,300 | 157,126 |
| ORIX Corp. | | 21,500 | 303,310 |
| OSG Corp. | | 12,000 | 240,119 |
| Paramount Bed Holdings Co. Ltd. | | 1,600 | 74,976 |
| ProNexus, Inc. (e) | | 1,700 | 20,190 |
| Recruit Holdings Co. Ltd. | | 5,900 | 176,319 |
| San-Ai Oil Co. Ltd. | | 5,000 | 42,102 |
| Shin-Etsu Chemical Co. Ltd. | | 3,100 | 293,646 |
| Shinsei Bank Ltd. | | 11,500 | 159,190 |
| SHO-BOND Holdings Co. Ltd. | | 5,240 | 359,384 |
| Shoei Co. Ltd. | | 2,000 | 86,988 |
| SK Kaken Co. Ltd. | | 20 | 8,205 |
| SoftBank Corp. | | 1,500 | 159,047 |
| Software Service, Inc. | | 500 | 44,392 |
| Sony Corp. | | 2,300 | 115,847 |
| Sony Financial Holdings, Inc. | | 12,300 | 250,317 |
| Subaru Corp. | | 6,400 | 156,301 |
| Sumitomo Mitsui Financial Group, Inc. | | 11,500 | 417,982 |
| Suzuki Motor Corp. (e) | | 2,200 | 100,031 |
| T&D Holdings, Inc. | | 12,600 | 135,337 |
| Takeda Pharmaceutical Co. Ltd. | | 9,761 | 360,198 |
| Techno Medica Co. Ltd. | | 500 | 9,462 |
| The Monogatari Corp. | | 280 | 22,371 |
| TKC Corp. | | 700 | 27,304 |
| Tocalo Co. Ltd. | | 2,500 | 20,445 |
| Tokio Marine Holdings, Inc. | | 8,200 | 412,374 |
| Tokyo Electron Ltd. | | 700 | 110,880 |
| USS Co. Ltd. | | 31,400 | 599,276 |
| Welcia Holdings Co. Ltd. | | 600 | 23,565 |
| Workman Co. Ltd. | | 1,000 | 48,297 |
| Yamada Consulting Group Co. Ltd. | | 1,100 | 23,828 |
| Yamato Kogyo Co. Ltd. | | 700 | 19,323 |
|
| TOTAL JAPAN | | | 13,794,375 |
|
| Kenya - 0.1% | | | |
| Safaricom Ltd. | | 444,800 | 123,788 |
| Korea (South) - 1.2% | | | |
| BGF Retail Co. Ltd. | | 735 | 137,969 |
| Db Insurance Co. Ltd. (b) | | 2,460 | 144,555 |
| Leeno Industrial, Inc. | | 264 | 12,973 |
| LG Household & Health Care Ltd. | | 131 | 160,035 |
| Samsung Electronics Co. Ltd. | | 17,167 | 676,203 |
| Shinhan Financial Group Co. Ltd. | | 1,830 | 69,411 |
|
| TOTAL KOREA (SOUTH) | | | 1,201,146 |
|
| Mexico - 0.0% | | | |
| Consorcio ARA S.A.B. de CV | | 39,855 | 10,680 |
| Netherlands - 2.9% | | | |
| Aalberts Industries NV | | 2,000 | 78,512 |
| AerCap Holdings NV (b) | | 3,600 | 178,704 |
| ASML Holding NV (Netherlands) | | 6,100 | 1,269,420 |
| ING Groep NV (Certificaten Van Aandelen) | | 27,076 | 345,491 |
| Koninklijke Philips Electronics NV | | 5,215 | 223,952 |
| Takeaway.com Holding BV (a)(b) | | 500 | 43,013 |
| Unilever NV (Certificaten Van Aandelen) (Bearer) | | 4,100 | 248,069 |
| Wolters Kluwer NV | | 3,300 | 230,146 |
| Yandex NV Series A (b) | | 7,697 | 288,099 |
|
| TOTAL NETHERLANDS | | | 2,905,406 |
|
| New Zealand - 0.1% | | | |
| Auckland International Airport Ltd. | | 27,637 | 147,116 |
| Norway - 0.7% | | | |
| Adevinta ASA Class B | | 8,633 | 84,935 |
| Equinor ASA | | 16,285 | 363,265 |
| Kongsberg Gruppen ASA | | 4,200 | 60,852 |
| Schibsted ASA (B Shares) | | 5,833 | 139,547 |
| Skandiabanken ASA (a) | | 3,000 | 29,522 |
|
| TOTAL NORWAY | | | 678,121 |
|
| Peru - 0.2% | | | |
| Compania de Minas Buenaventura SA sponsored ADR | | 9,400 | 152,374 |
| Philippines - 0.6% | | | |
| Ayala Land, Inc. | | 236,800 | 223,944 |
| Jollibee Food Corp. | | 5,250 | 30,895 |
| SM Prime Holdings, Inc. | | 370,200 | 296,460 |
|
| TOTAL PHILIPPINES | | | 551,299 |
|
| Portugal - 0.2% | | | |
| Galp Energia SGPS SA Class B | | 11,492 | 192,955 |
| Russia - 1.5% | | | |
| Alrosa Co. Ltd. | | 181,600 | 264,664 |
| Lukoil PJSC sponsored ADR | | 5,200 | 440,856 |
| NOVATEK OAO GDR (Reg. S) | | 1,900 | 366,130 |
| Sberbank of Russia | | 128,790 | 451,197 |
|
| TOTAL RUSSIA | | | 1,522,847 |
|
| Singapore - 0.2% | | | |
| United Overseas Bank Ltd. | | 11,200 | 229,171 |
| South Africa - 2.5% | | | |
| Capitec Bank Holdings Ltd. | | 2,824 | 263,881 |
| Clicks Group Ltd. | | 17,599 | 240,714 |
| FirstRand Ltd. | | 72,340 | 343,419 |
| Mondi Ltd. | | 10,914 | 240,551 |
| Mr Price Group Ltd. | | 5,200 | 78,747 |
| Naspers Ltd. Class N | | 5,095 | 1,310,691 |
|
| TOTAL SOUTH AFRICA | | | 2,478,003 |
|
| Spain - 2.5% | | | |
| Amadeus IT Holding SA Class A | | 12,000 | 954,526 |
| Banco Santander SA (Spain) | | 127,130 | 643,290 |
| CaixaBank SA | | 46,306 | 147,600 |
| Cellnex Telecom SA (a) | | 3,800 | 116,866 |
| Grifols SA ADR | | 5,700 | 109,098 |
| Masmovil Ibercom SA (b) | | 5,405 | 118,456 |
| Merlin Properties Socimi SA | | 8,200 | 111,745 |
| Prosegur Compania de Seguridad SA (Reg.) | | 43,976 | 228,762 |
| Unicaja Banco SA (a) | | 60,300 | 69,256 |
|
| TOTAL SPAIN | | | 2,499,599 |
|
| Sweden - 2.9% | | | |
| Addlife AB | | 1,814 | 48,665 |
| AddTech AB (B Shares) | | 3,000 | 72,969 |
| Alfa Laval AB | | 7,600 | 176,409 |
| ASSA ABLOY AB (B Shares) | | 32,000 | 684,082 |
| Atlas Copco AB (A Shares) | | 14,000 | 437,000 |
| Epiroc AB Class A | | 18,900 | 195,381 |
| Fagerhult AB | | 10,485 | 89,557 |
| Hexagon AB (B Shares) | | 3,300 | 180,286 |
| Investor AB (B Shares) | | 7,955 | 379,388 |
| Lagercrantz Group AB (B Shares) | | 4,300 | 52,380 |
| Loomis AB (B Shares) | | 4,200 | 155,389 |
| Saab AB (B Shares) | | 1,500 | 49,380 |
| Swedbank AB (A Shares) | | 7,600 | 124,178 |
| Telefonaktiebolaget LM Ericsson (B Shares) | | 27,900 | 275,992 |
|
| TOTAL SWEDEN | | | 2,921,056 |
|
| Switzerland - 4.6% | | | |
| Credit Suisse Group AG | | 12,093 | 160,824 |
| Nestle SA (Reg. S) | | 16,966 | 1,633,447 |
| Roche Holding AG (participation certificate) | | 3,874 | 1,022,207 |
| Schindler Holding AG: | | | |
| (participation certificate) | | 1,499 | 323,353 |
| (Reg.) | | 180 | 38,228 |
| Sika AG | | 1,334 | 204,234 |
| Swiss Life Holding AG | | 610 | 286,816 |
| Tecan Group AG | | 240 | 54,079 |
| UBS Group AG | | 28,689 | 385,580 |
| Zurich Insurance Group Ltd. | | 1,522 | 485,301 |
|
| TOTAL SWITZERLAND | | | 4,594,069 |
|
| Taiwan - 2.1% | | | |
| Addcn Technology Co. Ltd. | | 3,772 | 33,201 |
| E.SUN Financial Holdings Co. Ltd. | | 365,000 | 299,422 |
| Sporton International, Inc. | | 12,000 | 71,063 |
| Taiwan Semiconductor Manufacturing Co. Ltd. | | 207,035 | 1,738,216 |
|
| TOTAL TAIWAN | | | 2,141,902 |
|
| Thailand - 0.1% | | | |
| Siam Cement PCL (For. Reg.) | | 10,000 | 144,748 |
| Turkey - 0.1% | | | |
| Tupras Turkiye Petrol Rafinerileri A/S | | 7,000 | 144,648 |
| United Arab Emirates - 0.3% | | | |
| National Bank of Abu Dhabi PJSC (b) | | 72,800 | 317,112 |
| United Kingdom - 8.6% | | | |
| Alliance Pharma PLC | | 30,514 | 31,275 |
| Ascential PLC | | 9,062 | 42,139 |
| AstraZeneca PLC (United Kingdom) | | 4,889 | 364,230 |
| Aviva PLC | | 55,613 | 312,330 |
| Avon Rubber PLC | | 1,800 | 34,598 |
| BAE Systems PLC | | 18,300 | 117,619 |
| BHP Billiton PLC | | 35,465 | 837,136 |
| BP PLC | | 110,847 | 806,047 |
| British American Tobacco PLC (United Kingdom) | | 7,137 | 279,406 |
| Bunzl PLC | | 6,411 | 193,031 |
| Cineworld Group PLC | | 5,600 | 23,222 |
| Dechra Pharmaceuticals PLC | | 2,600 | 90,185 |
| DP Poland PLC (b) | | 52,800 | 6,300 |
| Elementis PLC | | 54,935 | 116,407 |
| Great Portland Estates PLC | | 5,606 | 55,163 |
| Hilton Food Group PLC | | 2,654 | 35,162 |
| Howden Joinery Group PLC | | 3,400 | 22,523 |
| Imperial Tobacco Group PLC | | 7,247 | 230,204 |
| Informa PLC | | 39,515 | 401,400 |
| InterContinental Hotel Group PLC ADR | | 8,925 | 590,032 |
| ITE Group PLC | | 30,100 | 28,417 |
| ITV PLC | | 62,688 | 111,705 |
| Lloyds Banking Group PLC | | 612,100 | 500,597 |
| Micro Focus International PLC | | 7,182 | 181,481 |
| Network International Holdings PLC (a) | | 3,700 | 25,137 |
| NMC Health PLC | | 7,162 | 263,554 |
| Prudential PLC | | 22,640 | 514,412 |
| Rightmove PLC | | 28,800 | 203,023 |
| Royal Dutch Shell PLC Class B sponsored ADR | | 7,600 | 493,164 |
| RSA Insurance Group PLC | | 27,800 | 196,482 |
| Shaftesbury PLC | | 12,937 | 144,996 |
| Spectris PLC | | 9,970 | 357,264 |
| Spirax-Sarco Engineering PLC | | 1,899 | 204,294 |
| Standard Chartered PLC (United Kingdom) | | 35,938 | 328,042 |
| Standard Life PLC | | 70,368 | 255,918 |
| The Weir Group PLC | | 6,804 | 147,238 |
| Topps Tiles PLC | | 16,600 | 16,321 |
| Ultra Electronics Holdings PLC | | 1,301 | 27,008 |
|
| TOTAL UNITED KINGDOM | | | 8,587,462 |
|
| United States of America - 8.2% | | | |
| Adobe, Inc. (b) | | 944 | 273,052 |
| Alphabet, Inc. Class A (b) | | 409 | 490,375 |
| Autoliv, Inc. | | 3,074 | 241,278 |
| Berkshire Hathaway, Inc. Class B (b) | | 1,716 | 371,874 |
| Black Knight, Inc. (b) | | 3,500 | 197,470 |
| ConocoPhillips Co. | | 2,700 | 170,424 |
| Marsh & McLennan Companies, Inc. | | 3,700 | 348,873 |
| Martin Marietta Materials, Inc. | | 1,730 | 383,887 |
| MasterCard, Inc. Class A | | 4,585 | 1,165,690 |
| MercadoLibre, Inc. (b) | | 369 | 178,648 |
| Microsoft Corp. | | 2,123 | 277,264 |
| Mohawk Industries, Inc. (b) | | 885 | 120,581 |
| Moody's Corp. | | 3,087 | 606,966 |
| Morningstar, Inc. | | 200 | 28,690 |
| MSCI, Inc. | | 1,900 | 428,222 |
| PayPal Holdings, Inc. (b) | | 1,600 | 180,432 |
| PriceSmart, Inc. | | 1,725 | 103,172 |
| ResMed, Inc. | | 3,460 | 361,605 |
| S&P Global, Inc. | | 1,600 | 353,056 |
| Sherwin-Williams Co. | | 900 | 409,347 |
| Thermo Fisher Scientific, Inc. | | 900 | 249,705 |
| TransDigm Group, Inc. (b) | | 556 | 268,281 |
| Visa, Inc. Class A | | 6,331 | 1,041,006 |
|
| TOTAL UNITED STATES OF AMERICA | | | 8,249,898 |
|
| TOTAL COMMON STOCKS | | | |
| (Cost $82,692,614) | | | 97,808,252 |
|
| Nonconvertible Preferred Stocks - 1.3% | | | |
| Brazil - 0.9% | | | |
| Itau Unibanco Holding SA | | 64,155 | 553,509 |
| Petroleo Brasileiro SA - Petrobras sponsored ADR | | 19,224 | 292,782 |
|
| TOTAL BRAZIL | | | 846,291 |
|
| Germany - 0.3% | | | |
| Porsche Automobil Holding SE (Germany) | | 3,976 | 276,402 |
| Sartorius AG (non-vtg.) | | 280 | 51,253 |
|
| TOTAL GERMANY | | | 327,655 |
|
| Spain - 0.1% | | | |
| Grifols SA Class B | | 4,300 | 82,781 |
| TOTAL NONCONVERTIBLE PREFERRED STOCKS | | | |
| (Cost $1,183,354) | | | 1,256,727 |
|
| Money Market Funds - 1.2% | | | |
| Fidelity Cash Central Fund, 2.49% (f) | | 724,915 | 725,060 |
| Fidelity Securities Lending Cash Central Fund 2.49% (f)(g) | | 481,444 | 481,492 |
| TOTAL MONEY MARKET FUNDS | | | |
| (Cost $1,206,533) | | | 1,206,552 |
| TOTAL INVESTMENT IN SECURITIES - 100.1% | | | |
| (Cost $85,082,501) | | | 100,271,531 |
| NET OTHER ASSETS (LIABILITIES) - (0.1)% | | | (55,632) |
| NET ASSETS - 100% | | | $100,215,899 |
Categorizations in the Schedule of Investments are based on country or territory of incorporation.
Legend
(a) Security exempt from registration under Rule 144A of the Securities Act of 1933. These securities may be resold in transactions exempt from registration, normally to qualified institutional buyers. At the end of the period, the value of these securities amounted to $345,135 or 0.3% of net assets.
(b) Non-income producing
(c) Security or a portion of the security is on loan at period end.
(d) Security or a portion of the security purchased on a delayed delivery or when-issued basis.
(e) A portion of the security sold on a delayed delivery basis.
(f) Affiliated fund that is generally available only to investment companies and other accounts managed by Fidelity Investments. The rate quoted is the annualized seven-day yield of the fund at period end. A complete unaudited listing of the fund's holdings as of its most recent quarter end is available upon request. In addition, each Fidelity Central Fund's financial statements are available on the SEC's website or upon request.
(g) Investment made with cash collateral received from securities on loan.
Affiliated Central Funds
Information regarding fiscal year to date income earned by the Fund from investments in Fidelity Central Funds is as follows:
| Fund | Income earned |
| Fidelity Cash Central Fund | $11,348 |
| Fidelity Securities Lending Cash Central Fund | 6,322 |
| Total | $17,670 |
Amounts in the income column in the above table include any capital gain distributions from underlying funds, which are presented in the corresponding line-item in the Statement of Operations, if applicable.
Other Affiliated Issuers
An affiliated company is a company in which the Fund has ownership of at least 5% of the voting securities. Fiscal year to date transactions with companies which are or were affiliates are as follows:
| Affiliate | Value, beginning of period | Purchases | Sales Proceeds | Dividend Income | Realized Gain (loss) | Change in Unrealized appreciation (depreciation) | Value, end of period |
| SK Kaken Co. Ltd. | $8,481 | $-- | $-- | $53 | $-- | $(276) | $-- |
| Total | $8,481 | $-- | $-- | $53 | $-- | $(276) | $-- |
Investment Valuation
The following is a summary of the inputs used, as of April 30, 2019, involving the Fund's assets and liabilities carried at fair value. The inputs or methodology used for valuing securities may not be an indication of the risk associated with investing in those securities. For more information on valuation inputs, and their aggregation into the levels used below, please refer to the Investment Valuation section in the accompanying Notes to Financial Statements.
| | Valuation Inputs at Reporting Date: |
| Description | Total | Level 1 | Level 2 | Level 3 |
| Investments in Securities: | | | | |
| Equities: | | | | |
| Communication Services | $4,640,851 | $2,238,088 | $2,402,763 | $-- |
| Consumer Discretionary | 9,669,422 | 7,252,956 | 2,416,466 | -- |
| Consumer Staples | 6,897,741 | 4,512,213 | 2,385,528 | -- |
| Energy | 5,912,680 | 4,199,670 | 1,713,010 | -- |
| Financials | 23,317,831 | 15,365,929 | 7,951,902 | -- |
| Health Care | 6,920,600 | 4,257,728 | 2,662,872 | -- |
| Industrials | 14,562,699 | 10,319,804 | 4,242,895 | -- |
| Information Technology | 15,975,021 | 12,004,220 | 3,970,801 | -- |
| Materials | 8,608,699 | 6,760,108 | 1,848,591 | -- |
| Real Estate | 1,795,325 | 1,795,325 | -- | -- |
| Utilities | 764,110 | 257,537 | 506,573 | -- |
| Money Market Funds | 1,206,552 | 1,206,552 | -- | -- |
| Total Investments in Securities: | $100,271,531 | $70,170,130 | $30,101,401 | $-- |
See accompanying notes which are an integral part of the financial statements.
Financial Statements
Statement of Assets and Liabilities
| | | April 30, 2019 (Unaudited) |
| Assets | | |
Investment in securities, at value (including securities loaned of $461,050) — See accompanying schedule:
Unaffiliated issuers (cost $83,875,968) | $99,064,979 | |
| Fidelity Central Funds (cost $1,206,533) | 1,206,552 | |
| Total Investment in Securities (cost $85,082,501) | | $100,271,531 |
| Cash | | 34,430 |
| Foreign currency held at value (cost $54,494) | | 54,386 |
| Receivable for investments sold | | |
| Regular delivery | | 31,748 |
| Delayed delivery | | 55,102 |
| Receivable for fund shares sold | | 21,583 |
| Dividends receivable | | 909,733 |
| Distributions receivable from Fidelity Central Funds | | 6,004 |
| Prepaid expenses | | 56 |
| Receivable from investment adviser for expense reductions | | 14,796 |
| Other receivables | | 28,187 |
| Total assets | | 101,427,556 |
| Liabilities | | |
| Payable for investments purchased | | |
| Regular delivery | $246,471 | |
| Delayed delivery | 4,922 | |
| Payable for fund shares redeemed | 287,779 | |
| Accrued management fee | 62,044 | |
| Distribution and service plan fees payable | 8,760 | |
| Other affiliated payables | 19,673 | |
| Other payables and accrued expenses | 100,516 | |
| Collateral on securities loaned | 481,492 | |
| Total liabilities | | 1,211,657 |
| Net Assets | | $100,215,899 |
| Net Assets consist of: | | |
| Paid in capital | | $91,686,362 |
| Total distributable earnings (loss) | | 8,529,537 |
| Net Assets | | $100,215,899 |
| Net Asset Value and Maximum Offering Price | | |
| Class A: | | |
| Net Asset Value and redemption price per share ($7,809,498 ÷ 858,328 shares) | | $9.10 |
| Maximum offering price per share (100/94.25 of $9.10) | | $9.66 |
| Class M: | | |
| Net Asset Value and redemption price per share ($12,494,261 ÷ 1,365,429 shares) | | $9.15 |
| Maximum offering price per share (100/96.50 of $9.15) | | $9.48 |
| Class C: | | |
| Net Asset Value and offering price per share ($2,317,488 ÷ 254,812 shares)(a) | | $9.09 |
| Total International Equity: | | |
| Net Asset Value, offering price and redemption price per share ($74,604,298 ÷ 8,182,291 shares) | | $9.12 |
| Class I: | | |
| Net Asset Value, offering price and redemption price per share ($2,571,008 ÷ 282,908 shares) | | $9.09 |
| Class Z: | | |
| Net Asset Value, offering price and redemption price per share ($419,346 ÷ 46,091 shares) | | $9.10 |
(a) Redemption price per share is equal to net asset value less any applicable contingent deferred sales charge.
See accompanying notes which are an integral part of the financial statements.
Statement of Operations
| | | Six months ended April 30, 2019 (Unaudited) |
| Investment Income | | |
| Dividends (including $53 earned from other affiliated issuers) | | $1,262,397 |
| Non-Cash dividends | | 67,254 |
| Income from Fidelity Central Funds | | 17,670 |
| Income before foreign taxes withheld | | 1,347,321 |
| Less foreign taxes withheld | | (118,515) |
| Total income | | 1,228,806 |
| Expenses | | |
| Management fee | | |
| Basic fee | $333,527 | |
| Performance adjustment | (65,161) | |
| Transfer agent fees | 91,631 | |
| Distribution and service plan fees | 51,971 | |
| Accounting and security lending fees | 25,076 | |
| Custodian fees and expenses | 98,158 | |
| Independent trustees' fees and expenses | 277 | |
| Registration fees | 39,196 | |
| Audit | 74,578 | |
| Legal | 921 | |
| Miscellaneous | 334 | |
| Total expenses before reductions | 650,508 | |
| Expense reductions | (26,998) | |
| Total expenses after reductions | | 623,510 |
| Net investment income (loss) | | 605,296 |
| Realized and Unrealized Gain (Loss) | | |
| Net realized gain (loss) on: | | |
| Investment securities: | | |
| Unaffiliated issuers | (1,744,204) | |
| Fidelity Central Funds | (19) | |
| Foreign currency transactions | (7,790) | |
| Total net realized gain (loss) | | (1,752,013) |
| Change in net unrealized appreciation (depreciation) on: | | |
| Investment securities: | | |
| Unaffiliated issuers (net of increase in deferred foreign taxes of $6,201) | 11,873,343 | |
| Fidelity Central Funds | 19 | |
| Other affiliated issuers | (276) | |
| Assets and liabilities in foreign currencies | (3,588) | |
| Total change in net unrealized appreciation (depreciation) | | 11,869,498 |
| Net gain (loss) | | 10,117,485 |
| Net increase (decrease) in net assets resulting from operations | | $10,722,781 |
See accompanying notes which are an integral part of the financial statements.
Statement of Changes in Net Assets
| | Six months ended April 30, 2019 (Unaudited) | Year ended October 31, 2018 |
| Increase (Decrease) in Net Assets | | |
| Operations | | |
| Net investment income (loss) | $605,296 | $1,241,108 |
| Net realized gain (loss) | (1,752,013) | 1,021,879 |
| Change in net unrealized appreciation (depreciation) | 11,869,498 | (12,603,126) |
| Net increase (decrease) in net assets resulting from operations | 10,722,781 | (10,340,139) |
| Distributions to shareholders | (764,299) | (4,673,480) |
| Share transactions - net increase (decrease) | (12,645,473) | 419,996 |
| Redemption fees | – | 13 |
| Total increase (decrease) in net assets | (2,686,991) | (14,593,610) |
| Net Assets | | |
| Beginning of period | 102,902,890 | 117,496,500 |
| End of period | $100,215,899 | $102,902,890 |
See accompanying notes which are an integral part of the financial statements.
Financial Highlights
Fidelity Total International Equity Fund Class A
| | Six months ended (Unaudited) April 30, | Years endedOctober 31, | | | | |
| | 2019 | 2018 | 2017 | 2016 | 2015 | 2014 |
| Selected Per–Share Data | | | | | | |
| Net asset value, beginning of period | $8.20 | $9.39 | $7.67 | $7.79 | $8.00 | $8.27 |
| Income from Investment Operations | | | | | | |
| Net investment income (loss)A | .05 | .08 | .09 | .08 | .07 | .13 |
| Net realized and unrealized gain (loss) | .90 | (.89) | 1.71 | (.14) | (.14) | (.12) |
| Total from investment operations | .95 | (.81) | 1.80 | (.06) | (.07) | .01 |
| Distributions from net investment income | (.05) | (.15) | (.08) | (.06) | (.10) | (.10) |
| Distributions from net realized gain | – | (.23) | – | – | (.04) | (.18) |
| Total distributions | (.05) | (.38) | (.08) | (.06) | (.14) | (.28) |
| Redemption fees added to paid in capitalA | – | –B | –B | –B | –B | –B |
| Net asset value, end of period | $9.10 | $8.20 | $9.39 | $7.67 | $7.79 | $8.00 |
| Total ReturnC,D,E | 11.69% | (9.04)% | 23.78% | (.76)% | (.89)% | .19% |
| Ratios to Average Net AssetsF,G | | | | | | |
| Expenses before reductions | 1.53%H | 1.60% | 1.67% | 1.52% | 1.48% | 1.44% |
| Expenses net of fee waivers, if any | 1.45%H | 1.45% | 1.45% | 1.45% | 1.45% | 1.44% |
| Expenses net of all reductions | 1.43%H | 1.44% | 1.43% | 1.45% | 1.44% | 1.44% |
| Net investment income (loss) | 1.11%H | .90% | 1.02% | 1.10% | .86% | 1.63% |
| Supplemental Data | | | | | | |
| Net assets, end of period (000 omitted) | $7,809 | $7,526 | $9,292 | $8,576 | $9,163 | $9,164 |
| Portfolio turnover rateI | 56%H | 52% | 66%J | 51% | 53% | 85% |
A Calculated based on average shares outstanding during the period.
B Amount represents less than $.005 per share.
C Total returns for periods of less than one year are not annualized.
D Total returns would have been lower if certain expenses had not been reduced during the applicable periods shown.
E Total returns do not include the effect of the sales charges.
F Fees and expenses of any underlying Fidelity Central Funds are not included in the Fund's expense ratio. The Fund indirectly bears its proportionate share of the expenses of any underlying Fidelity Central Funds.
G Expense ratios reflect operating expenses of the class. Expenses before reductions do not reflect amounts reimbursed by the investment adviser or reductions from brokerage service arrangements or reductions from other expense offset arrangements and do not represent the amount paid by the class during periods when reimbursements or reductions occur. Expenses net of fee waivers reflect expenses after reimbursement by the investment adviser but prior to reductions from brokerage service arrangements or other expense offset arrangements. Expenses net of all reductions represent the net expenses paid by the class.
H Annualized
I Amount does not include the portfolio activity of any underlying Fidelity Central Funds.
J Portfolio turnover rate excludes securities received or delivered in-kind.
See accompanying notes which are an integral part of the financial statements.
Fidelity Total International Equity Fund Class M
| | Six months ended (Unaudited) April 30, | Years endedOctober 31, | | | | |
| | 2019 | 2018 | 2017 | 2016 | 2015 | 2014 |
| Selected Per–Share Data | | | | | | |
| Net asset value, beginning of period | $8.22 | $9.42 | $7.70 | $7.81 | $8.04 | $8.32 |
| Income from Investment Operations | | | | | | |
| Net investment income (loss)A | .04 | .06 | .06 | .06 | .05 | .11 |
| Net realized and unrealized gain (loss) | .91 | (.90) | 1.73 | (.13) | (.15) | (.12) |
| Total from investment operations | .95 | (.84) | 1.79 | (.07) | (.10) | (.01) |
| Distributions from net investment income | (.02) | (.13) | (.07) | (.04) | (.09) | (.09) |
| Distributions from net realized gain | – | (.23) | – | – | (.04) | (.18) |
| Total distributions | (.02) | (.36) | (.07) | (.04) | (.13) | (.27) |
| Redemption fees added to paid in capitalA | – | –B | –B | –B | –B | –B |
| Net asset value, end of period | $9.15 | $8.22 | $9.42 | $7.70 | $7.81 | $8.04 |
| Total ReturnC,D,E | 11.58% | (9.30)% | 23.41% | (.86)% | (1.26)% | (.06)% |
| Ratios to Average Net AssetsF,G | | | | | | |
| Expenses before reductions | 1.78%H | 1.85% | 1.90% | 1.73% | 1.70% | 1.68% |
| Expenses net of fee waivers, if any | 1.70%H | 1.70% | 1.70% | 1.70% | 1.70% | 1.68% |
| Expenses net of all reductions | 1.68%H | 1.69% | 1.68% | 1.69% | 1.69% | 1.68% |
| Net investment income (loss) | .86%H | .65% | .77% | .85% | .61% | 1.38% |
| Supplemental Data | | | | | | |
| Net assets, end of period (000 omitted) | $12,494 | $11,882 | $15,894 | $13,893 | $13,962 | $10,282 |
| Portfolio turnover rateI | 56%H | 52% | 66%J | 51% | 53% | 85% |
A Calculated based on average shares outstanding during the period.
B Amount represents less than $.005 per share.
C Total returns for periods of less than one year are not annualized.
D Total returns would have been lower if certain expenses had not been reduced during the applicable periods shown.
E Total returns do not include the effect of the sales charges.
F Fees and expenses of any underlying Fidelity Central Funds are not included in the Fund's expense ratio. The Fund indirectly bears its proportionate share of the expenses of any underlying Fidelity Central Funds.
G Expense ratios reflect operating expenses of the class. Expenses before reductions do not reflect amounts reimbursed by the investment adviser or reductions from brokerage service arrangements or reductions from other expense offset arrangements and do not represent the amount paid by the class during periods when reimbursements or reductions occur. Expenses net of fee waivers reflect expenses after reimbursement by the investment adviser but prior to reductions from brokerage service arrangements or other expense offset arrangements. Expenses net of all reductions represent the net expenses paid by the class.
H Annualized
I Amount does not include the portfolio activity of any underlying Fidelity Central Funds.
J Portfolio turnover rate excludes securities received or delivered in-kind.
See accompanying notes which are an integral part of the financial statements.
Fidelity Total International Equity Fund Class C
| | Six months ended (Unaudited) April 30, | Years endedOctober 31, | | | | |
| | 2019 | 2018 | 2017 | 2016 | 2015 | 2014 |
| Selected Per–Share Data | | | | | | |
| Net asset value, beginning of period | $8.17 | $9.37 | $7.66 | $7.77 | $8.00 | $8.28 |
| Income from Investment Operations | | | | | | |
| Net investment income (loss)A | .01 | .01 | .02 | .03 | .01 | .07 |
| Net realized and unrealized gain (loss) | .91 | (.89) | 1.71 | (.14) | (.15) | (.12) |
| Total from investment operations | .92 | (.88) | 1.73 | (.11) | (.14) | (.05) |
| Distributions from net investment income | – | (.10) | (.02) | – | (.05) | (.05) |
| Distributions from net realized gain | – | (.23) | – | – | (.04) | (.18) |
| Total distributions | – | (.32)B | (.02) | – | (.09) | (.23) |
| Redemption fees added to paid in capitalA | – | –C | –C | –C | –C | –C |
| Net asset value, end of period | $9.09 | $8.17 | $9.37 | $7.66 | $7.77 | $8.00 |
| Total ReturnD,E,F | 11.26% | (9.72)% | 22.70% | (1.42)% | (1.73)% | (.57)% |
| Ratios to Average Net AssetsG,H | | | | | | |
| Expenses before reductions | 2.34%I | 2.43% | 2.48% | 2.30% | 2.26% | 2.22% |
| Expenses net of fee waivers, if any | 2.20%I | 2.20% | 2.20% | 2.20% | 2.20% | 2.20% |
| Expenses net of all reductions | 2.18%I | 2.19% | 2.18% | 2.20% | 2.19% | 2.20% |
| Net investment income (loss) | .35%I | .14% | .27% | .35% | .11% | .87% |
| Supplemental Data | | | | | | |
| Net assets, end of period (000 omitted) | $2,317 | $2,705 | $3,211 | $2,713 | $3,311 | $4,028 |
| Portfolio turnover rateJ | 56%I | 52% | 66%K | 51% | 53% | 85% |
A Calculated based on average shares outstanding during the period.
B Total distributions of $.32 per share is comprised of distributions from net investment income of $.097 and distributions from net realized gain of $.226 per share.
C Amount represents less than $.005 per share.
D Total returns for periods of less than one year are not annualized.
E Total returns would have been lower if certain expenses had not been reduced during the applicable periods shown.
F Total returns do not include the effect of the contingent deferred sales charge.
G Fees and expenses of any underlying Fidelity Central Funds are not included in the Fund's expense ratio. The Fund indirectly bears its proportionate share of the expenses of any underlying Fidelity Central Funds.
H Expense ratios reflect operating expenses of the class. Expenses before reductions do not reflect amounts reimbursed by the investment adviser or reductions from brokerage service arrangements or reductions from other expense offset arrangements and do not represent the amount paid by the class during periods when reimbursements or reductions occur. Expenses net of fee waivers reflect expenses after reimbursement by the investment adviser but prior to reductions from brokerage service arrangements or other expense offset arrangements. Expenses net of all reductions represent the net expenses paid by the class.
I Annualized
J Amount does not include the portfolio activity of any underlying Fidelity Central Funds.
K Portfolio turnover rate excludes securities received or delivered in-kind.
See accompanying notes which are an integral part of the financial statements.
Fidelity Total International Equity Fund
| | Six months ended (Unaudited) April 30, | Years endedOctober 31, | | | | |
| | 2019 | 2018 | 2017 | 2016 | 2015 | 2014 |
| Selected Per–Share Data | | | | | | |
| Net asset value, beginning of period | $8.23 | $9.40 | $7.70 | $7.82 | $8.03 | $8.29 |
| Income from Investment Operations | | | | | | |
| Net investment income (loss)A | .06 | .11 | .11 | .11 | .10 | .16 |
| Net realized and unrealized gain (loss) | .91 | (.90) | 1.70 | (.13) | (.14) | (.12) |
| Total from investment operations | .97 | (.79) | 1.81 | (.02) | (.04) | .04 |
| Distributions from net investment income | (.08) | (.15) | (.11) | (.10) | (.13) | (.12) |
| Distributions from net realized gain | – | (.23) | – | – | (.04) | (.18) |
| Total distributions | (.08) | (.38) | (.11) | (.10) | (.17) | (.30) |
| Redemption fees added to paid in capitalA | – | –B | –B | –B | –B | –B |
| Net asset value, end of period | $9.12 | $8.23 | $9.40 | $7.70 | $7.82 | $8.03 |
| Total ReturnC,D | 11.90% | (8.84)% | 23.86% | (.32)% | (.51)% | .55% |
| Ratios to Average Net AssetsE,F | | | | | | |
| Expenses before reductions | 1.22%G | 1.29% | 1.15% | 1.11% | 1.07% | 1.04% |
| Expenses net of fee waivers, if any | 1.20%G | 1.20% | 1.14% | 1.11% | 1.07% | 1.04% |
| Expenses net of all reductions | 1.18%G | 1.19% | 1.13% | 1.10% | 1.06% | 1.04% |
| Net investment income (loss) | 1.36%G | 1.15% | 1.33% | 1.44% | 1.24% | 2.03% |
| Supplemental Data | | | | | | |
| Net assets, end of period (000 omitted) | $74,604 | $71,170 | $82,077 | $280,672 | $307,035 | $324,438 |
| Portfolio turnover rateH | 56%G | 52% | 66%I | 51% | 53% | 85% |
A Calculated based on average shares outstanding during the period.
B Amount represents less than $.005 per share.
C Total returns for periods of less than one year are not annualized.
D Total returns would have been lower if certain expenses had not been reduced during the applicable periods shown.
E Fees and expenses of any underlying Fidelity Central Funds are not included in the Fund's expense ratio. The Fund indirectly bears its proportionate share of the expenses of any underlying Fidelity Central Funds.
F Expense ratios reflect operating expenses of the class. Expenses before reductions do not reflect amounts reimbursed by the investment adviser or reductions from brokerage service arrangements or reductions from other expense offset arrangements and do not represent the amount paid by the class during periods when reimbursements or reductions occur. Expenses net of fee waivers reflect expenses after reimbursement by the investment adviser but prior to reductions from brokerage service arrangements or other expense offset arrangements. Expenses net of all reductions represent the net expenses paid by the class.
G Annualized
H Amount does not include the portfolio activity of any underlying Fidelity Central Funds.
I Portfolio turnover rate excludes securities received or delivered in-kind.
See accompanying notes which are an integral part of the financial statements.
Fidelity Total International Equity Fund Class I
| | Six months ended (Unaudited) April 30, | Years endedOctober 31, | | | | |
| | 2019 | 2018 | 2017 | 2016 | 2015 | 2014 |
| Selected Per–Share Data | | | | | | |
| Net asset value, beginning of period | $8.19 | $9.38 | $7.66 | $7.78 | $7.99 | $8.26 |
| Income from Investment Operations | | | | | | |
| Net investment income (loss)A | .06 | .10 | .11 | .10 | .09 | .15 |
| Net realized and unrealized gain (loss) | .91 | (.89) | 1.71 | (.13) | (.14) | (.12) |
| Total from investment operations | .97 | (.79) | 1.82 | (.03) | (.05) | .03 |
| Distributions from net investment income | (.07) | (.17) | (.10) | (.09) | (.12) | (.12) |
| Distributions from net realized gain | – | (.23) | – | – | (.04) | (.18) |
| Total distributions | (.07) | (.40) | (.10) | (.09) | (.16) | (.30) |
| Redemption fees added to paid in capitalA | – | –B | –B | –B | –B | –B |
| Net asset value, end of period | $9.09 | $8.19 | $9.38 | $7.66 | $7.78 | $7.99 |
| Total ReturnC,D | 11.91% | (8.86)% | 24.08% | (.43)% | (.64)% | .37% |
| Ratios to Average Net AssetsE,F | | | | | | |
| Expenses before reductions | 1.18%G | 1.29% | 1.42% | 1.22% | 1.17% | 1.15% |
| Expenses net of fee waivers, if any | 1.18%G | 1.20% | 1.20% | 1.20% | 1.17% | 1.15% |
| Expenses net of all reductions | 1.16%G | 1.19% | 1.18% | 1.20% | 1.16% | 1.15% |
| Net investment income (loss) | 1.37%G | 1.15% | 1.28% | 1.35% | 1.14% | 1.91% |
| Supplemental Data | | | | | | |
| Net assets, end of period (000 omitted) | $2,571 | $9,405 | $6,776 | $2,156 | $2,602 | $2,240 |
| Portfolio turnover rateH | 56%G | 52% | 66%I | 51% | 53% | 85% |
A Calculated based on average shares outstanding during the period.
B Amount represents less than $.005 per share.
C Total returns for periods of less than one year are not annualized.
D Total returns would have been lower if certain expenses had not been reduced during the applicable periods shown.
E Fees and expenses of any underlying Fidelity Central Funds are not included in the Fund's expense ratio. The Fund indirectly bears its proportionate share of the expenses of any underlying Fidelity Central Funds.
F Expense ratios reflect operating expenses of the class. Expenses before reductions do not reflect amounts reimbursed by the investment adviser or reductions from brokerage service arrangements or reductions from other expense offset arrangements and do not represent the amount paid by the class during periods when reimbursements or reductions occur. Expenses net of fee waivers reflect expenses after reimbursement by the investment adviser but prior to reductions from brokerage service arrangements or other expense offset arrangements. Expenses net of all reductions represent the net expenses paid by the class.
G Annualized
H Amount does not include the portfolio activity of any underlying Fidelity Central Funds.
I Portfolio turnover rate excludes securities received or delivered in-kind.
See accompanying notes which are an integral part of the financial statements.
Fidelity Total International Equity Fund Class Z
| | Six months ended (Unaudited) April 30, | Years endedOctober 31, | |
| | 2019 | 2018 | 2017 A |
| Selected Per–Share Data | | | |
| Net asset value, beginning of period | $8.22 | $9.39 | $7.73 |
| Income from Investment Operations | | | |
| Net investment income (loss)B | .06 | .12 | .08 |
| Net realized and unrealized gain (loss) | .91 | (.89) | 1.58 |
| Total from investment operations | .97 | (.77) | 1.66 |
| Distributions from net investment income | (.09) | (.17) | – |
| Distributions from net realized gain | – | (.23) | – |
| Total distributions | (.09) | (.40) | – |
| Redemption fees added to paid in capitalB | – | –C | –C |
| Net asset value, end of period | $9.10 | $8.22 | $9.39 |
| Total ReturnD,E | 11.93% | (8.63)% | 21.47% |
| Ratios to Average Net AssetsF,G | | | |
| Expenses before reductions | 1.12%H | 1.16% | 1.32%H |
| Expenses net of fee waivers, if any | 1.05%H | 1.05% | 1.05%H |
| Expenses net of all reductions | 1.03%H | 1.04% | 1.04%H |
| Net investment income (loss) | 1.51%H | 1.30% | 1.27%H |
| Supplemental Data | | | |
| Net assets, end of period (000 omitted) | $419 | $216 | $246 |
| Portfolio turnover rateI | 56%H | 52% | 66%J |
A For the period February 1, 2017 (commencement of sale of shares) to October 31, 2017.
B Calculated based on average shares outstanding during the period.
C Amount represents less than $.005 per share.
D Total returns for periods of less than one year are not annualized.
E Total returns would have been lower if certain expenses had not been reduced during the applicable periods shown.
F Fees and expenses of any underlying Fidelity Central Funds are not included in the Fund's expense ratio. The Fund indirectly bears its proportionate share of the expenses of any underlying Fidelity Central Funds.
G Expense ratios reflect operating expenses of the class. Expenses before reductions do not reflect amounts reimbursed by the investment adviser or reductions from brokerage service arrangements or reductions from other expense offset arrangements and do not represent the amount paid by the class during periods when reimbursements or reductions occur. Expense ratios before reductions for start-up periods may not be representative of longer-term operating periods. Expenses net of fee waivers reflect expenses after reimbursement by the investment adviser but prior to reductions from brokerage service arrangements or other expense offset arrangements. Expenses net of all reductions represent the net expenses paid by the class.
H Annualized
I Amount does not include the portfolio activity of any underlying Fidelity Central Funds.
J Portfolio turnover rate excludes securities received or delivered in-kind.
See accompanying notes which are an integral part of the financial statements.
Notes to Financial Statements (Unaudited)
For the period ended April 30, 2019
1. Organization.
Fidelity Total International Equity Fund (the Fund) is a fund of Fidelity Investment Trust (the Trust) and is authorized to issue an unlimited number of shares. The Trust is registered under the Investment Company Act of 1940, as amended (the 1940 Act), as an open-end management investment company organized as a Massachusetts business trust. The Fund offers Class A, Class M, Class C, Total International Equity, Class I and Class Z shares, each of which has equal rights as to assets and voting privileges. Each class has exclusive voting rights with respect to matters that affect that class. Effective March 1, 2019, Class C shares will automatically convert to Class A shares after a holding period of ten years from the initial date of purchase, with certain exceptions. The Fund's investments in emerging markets can be subject to social, economic, regulatory, and political uncertainties and can be extremely volatile.
2. Investments in Fidelity Central Funds.
The Fund invests in Fidelity Central Funds, which are open-end investment companies generally available only to other investment companies and accounts managed by the investment adviser and its affiliates. The Fund's Schedule of Investments lists each of the Fidelity Central Funds held as of period end, if any, as an investment of the Fund, but does not include the underlying holdings of each Fidelity Central Fund. As an Investing Fund, the Fund indirectly bears its proportionate share of the expenses of the underlying Fidelity Central Funds.
The Money Market Central Funds seek preservation of capital and current income and are managed by Fidelity Investments Money Management, Inc. (FIMM), an affiliate of the investment adviser. Annualized expenses of the Money Market Central Funds as of their most recent shareholder report date are less than .005%.
A complete unaudited list of holdings for each Fidelity Central Fund is available upon request or at the Securities and Exchange Commission (the SEC) website at www.sec.gov. In addition, the financial statements of the Fidelity Central Funds are available on the SEC website or upon request.
3. Significant Accounting Policies.
The Fund is an investment company and applies the accounting and reporting guidance of the Financial Accounting Standards Board (FASB) Accounting Standards Codification Topic 946 Financial Services – Investments Companies. The financial statements have been prepared in conformity with accounting principles generally accepted in the United States of America (GAAP), which require management to make certain estimates and assumptions at the date of the financial statements. Actual results could differ from those estimates. Subsequent events, if any, through the date that the financial statements were issued have been evaluated in the preparation of the financial statements. The following summarizes the significant accounting policies of the Fund:
Investment Valuation. Investments are valued as of 4:00 p.m. Eastern time on the last calendar day of the period. The Board of Trustees (the Board) has delegated the day to day responsibility for the valuation of the Fund's investments to the Fair Value Committee (the Committee) established by the Fund's investment adviser. In accordance with valuation policies and procedures approved by the Board, the Fund attempts to obtain prices from one or more third party pricing vendors or brokers to value its investments. When current market prices, quotations or currency exchange rates are not readily available or reliable, investments will be fair valued in good faith by the Committee, in accordance with procedures adopted by the Board. Factors used in determining fair value vary by investment type and may include market or investment specific events. The frequency with which these procedures are used cannot be predicted and they may be utilized to a significant extent. The Committee oversees the Fund's valuation policies and procedures and reports to the Board on the Committee's activities and fair value determinations. The Board monitors the appropriateness of the procedures used in valuing the Fund's investments and ratifies the fair value determinations of the Committee.
The Fund categorizes the inputs to valuation techniques used to value its investments into a disclosure hierarchy consisting of three levels as shown below:
- Level 1 – quoted prices in active markets for identical investments
- Level 2 – other significant observable inputs (including quoted prices for similar investments, interest rates, prepayment speeds, etc.)
- Level 3 – unobservable inputs (including the Fund's own assumptions based on the best information available)
Valuation techniques used to value the Fund's investments by major category are as follows:
Equity securities, including restricted securities, for which market quotations are readily available, are valued at the last reported sale price or official closing price as reported by a third party pricing vendor on the primary market or exchange on which they are traded and are categorized as Level 1 in the hierarchy. In the event there were no sales during the day or closing prices are not available, securities are valued at the last quoted bid price or may be valued using the last available price and are generally categorized as Level 2 in the hierarchy. For foreign equity securities, when market or security specific events arise, comparisons to the valuation of American Depositary Receipts (ADRs), futures contracts, Exchange-Traded Funds (ETFs) and certain indexes as well as quoted prices for similar securities may be used and would be categorized as Level 2 in the hierarchy. For equity securities, including restricted securities, where observable inputs are limited, assumptions about market activity and risk are used and these securities may be categorized as Level 3 in the hierarchy.
Investments in open-end mutual funds, including the Fidelity Central Funds, are valued at their closing net asset value (NAV) each business day and are categorized as Level 1 in the hierarchy.
Changes in valuation techniques may result in transfers in or out of an assigned level within the disclosure hierarchy. The aggregate value of investments by input level as of April 30, 2019 is included at the end of the Fund's Schedule of Investments.
Foreign Currency. The Fund may use foreign currency contracts to facilitate transactions in foreign-denominated securities. Gains and losses from these transactions may arise from changes in the value of the foreign currency or if the counterparties do not perform under the contracts' terms.
Foreign-denominated assets, including investment securities, and liabilities are translated into U.S. dollars at the exchange rates at period end. Purchases and sales of investment securities, income and dividends received and expenses denominated in foreign currencies are translated into U.S. dollars at the exchange rate in effect on the transaction date.
The effects of exchange rate fluctuations on investments are included with the net realized and unrealized gain (loss) on investment securities. Other foreign currency transactions resulting in realized and unrealized gain (loss) are disclosed separately.
Investment Transactions and Income. For financial reporting purposes, the Fund's investment holdings and NAV include trades executed through the end of the last business day of the period. The NAV per share for processing shareholder transactions is calculated as of the close of business of the New York Stock Exchange (NYSE), normally 4:00 p.m. Eastern time and includes trades executed through the end of the prior business day. Gains and losses on securities sold are determined on the basis of identified cost and include proceeds received from litigation. Dividend income is recorded on the ex-dividend date, except for certain dividends from foreign securities where the ex-dividend date may have passed, which are recorded as soon as the Fund is informed of the ex-dividend date. Non-cash dividends included in dividend income, if any, are recorded at the fair market value of the securities received. Income and capital gain distributions from Fidelity Central Funds, if any, are recorded on the ex-dividend date. Certain distributions received by the Fund represent a return of capital or capital gain. The Fund determines the components of these distributions subsequent to the ex-dividend date, based upon receipt of tax filings or other correspondence relating to the underlying investment. These distributions are recorded as a reduction of cost of investments and/or as a realized gain. Investment income is recorded net of foreign taxes withheld where recovery of such taxes is uncertain.
Class Allocations and Expenses. Investment income, realized and unrealized capital gains and losses, common expenses of the Fund, and certain fund-level expense reductions, if any, are allocated daily on a pro-rata basis to each class based on the relative net assets of each class to the total net assets of the Fund. Each class differs with respect to transfer agent and distribution and service plan fees incurred. Certain expense reductions may also differ by class. For the reporting period, the allocated portion of income and expenses to each class as a percent of its average net assets may vary due to the timing of recording these transactions in relation to fluctuating net assets of the classes. Expenses directly attributable to a fund are charged to that fund. Expenses attributable to more than one fund are allocated among the respective funds on the basis of relative net assets or other appropriate methods. Expense estimates are accrued in the period to which they relate and adjustments are made when actual amounts are known.
Income Tax Information and Distributions to Shareholders. Each year, the Fund intends to qualify as a regulated investment company under Subchapter M of the Internal Revenue Code, including distributing substantially all of its taxable income and realized gains. As a result, no provision for U.S. Federal income taxes is required. The Fund files a U.S. federal tax return, in addition to state and local tax returns as required. The Fund's federal income tax returns are subject to examination by the Internal Revenue Service (IRS) for a period of three fiscal years after they are filed. State and local tax returns may be subject to examination for an additional fiscal year depending on the jurisdiction. Foreign taxes are provided for based on the Fund's understanding of the tax rules and rates that exist in the foreign markets in which it invests. The Fund is subject to a tax imposed on capital gains by certain countries in which it invests. An estimated deferred tax liability for net unrealized appreciation on the applicable securities is included in Other payables and accrued expenses on the Statement of Assets & Liabilities.
Distributions are declared and recorded on the ex-dividend date. Income and capital gain distributions are declared separately for each class. Income and capital gain distributions are determined in accordance with income tax regulations, which may differ from GAAP.
Capital accounts within the financial statements are adjusted for permanent book-tax differences. These adjustments have no impact on net assets or the results of operations. Capital accounts are not adjusted for temporary book-tax differences which will reverse in a subsequent period.
Book-tax differences are primarily due to foreign currency transactions, certain foreign taxes, passive foreign investment companies (PFIC), capital loss carryforwards and losses deferred due to wash sales.
As of period end, the cost and unrealized appreciation (depreciation) in securities, and derivatives if applicable, for federal income tax purposes were as follows:
| Gross unrealized appreciation | $18,904,221 |
| Gross unrealized depreciation | (4,360,030) |
| Net unrealized appreciation (depreciation) | $14,544,191 |
| Tax cost | $85,727,340 |
Delayed Delivery Transactions and When-Issued Securities. During the period, the Fund transacted in securities on a delayed delivery or when-issued basis. Payment and delivery may take place after the customary settlement period for that security. The price of the underlying securities and the date when the securities will be delivered and paid for are fixed at the time the transaction is negotiated. The securities purchased on a delayed delivery or when-issued basis are identified as such in the Fund's Schedule of Investments. Losses may arise due to changes in the value of the underlying securities or if the counterparty does not perform under the contract's terms, or if the issuer does not issue the securities due to political, economic, or other factors.
Restricted Securities. The Fund may invest in securities that are subject to legal or contractual restrictions on resale. These securities generally may be resold in transactions exempt from registration or to the public if the securities are registered. Disposal of these securities may involve time-consuming negotiations and expense, and prompt sale at an acceptable price may be difficult. Information regarding restricted securities is included at the end of the Fund's Schedule of Investments.
4. Purchases and Sales of Investments.
Purchases and sales of securities, other than short-term securities, aggregated $26,971,787 and $38,273,768, respectively.
5. Fees and Other Transactions with Affiliates.
Management Fee. Fidelity Management & Research Company (the investment adviser) and its affiliates provide the Fund with investment management related services for which the Fund pays a monthly management fee. The management fee is the sum of an individual fund fee rate that is based on an annual rate of .45% of the Fund's average net assets and an annualized group fee rate that averaged .24% during the period. The group fee rate is based upon the average net assets of all the mutual funds advised by the investment adviser, including any mutual funds previously advised by the investment adviser that are currently advised by Fidelity SelectCo, LLC, an affiliate of the investment adviser. The group fee rate decreases as assets under management increase and increases as assets under management decrease. In addition, the management fee is subject to a performance adjustment (up to a maximum of +/- .20% of the Fund's average net assets over a 36 month performance period). The upward or downward adjustment to the management fee is based on the relative investment performance of Total International Equity as compared to its benchmark index, the MSCI All Country World ex USA Index, over the same 36 month performance period. For the reporting period, the total annualized management fee rate, including the performance adjustment, was .55% of the Fund's average net assets. The performance adjustment included in the management fee rate may be higher or lower than the maximum performance adjustment rate due to the difference between the average net assets for the reporting and performance periods.
Distribution and Service Plan Fees. In accordance with Rule 12b-1 of the 1940 Act, the Fund has adopted separate Distribution and Service Plans for each class of shares. Certain classes pay Fidelity Distributors Corporation (FDC), an affiliate of the investment adviser, separate Distribution and Service Fees, each of which is based on an annual percentage of each class' average net assets. In addition, FDC may pay financial intermediaries for selling shares of the Fund and providing shareholder support services. For the period, the Distribution and Service Fee rates, total fees and amounts retained by FDC were as follows:
| | Distribution Fee | Service Fee | Total Fees | Retained by FDC |
| Class A | -% | .25% | $9,462 | $322 |
| Class M | .25% | .25% | 29,722 | 404 |
| Class C | .75% | .25% | 12,787 | 2,152 |
| | | | $51,971 | $2,878 |
Sales Load. FDC may receive a front-end sales charge of up to 5.75% for selling Class A shares and 3.50% for selling Class M shares, some of which is paid to financial intermediaries for selling shares of the Fund. Depending on the holding period, FDC may receive contingent deferred sales charges levied on Class A, Class M and Class C redemptions. The deferred sales charges are 1.00% for Class C shares, 1.00% for certain purchases of Class A shares and .25% for certain purchases of Class M shares.
For the period, sales charge amounts retained by FDC were as follows:
| | Retained by FDC |
| Class A | $1,027 |
| Class M | 370 |
| Class C(a) | 450 |
| | $1,847 |
(a) When Class C shares are initially sold, FDC pays commissions from its own resources to financial intermediaries through which the sales are made.
Transfer Agent Fees. Fidelity Investments Institutional Operations Company, Inc., (FIIOC), an affiliate of the investment adviser, is the transfer, dividend disbursing and shareholder servicing agent for each class of the Fund. FIIOC receives account fees and asset-based fees that vary according to the account size and type of account of the shareholders of the respective classes of the Fund, except for Class Z. FIIOC receives an asset-based fee of Class Z's average net assets. FIIOC pays for typesetting, printing and mailing of shareholder reports, except proxy statements.
For the period, transfer agent fees for each class were as follows:
| | Amount | % of Class-Level Average Net Assets(a) |
| Class A | $8,669 | .23 |
| Class M | 13,884 | .23 |
| Class C | 3,876 | .30 |
| Total International Equity | 62,015 | .18 |
| Class I | 3,118 | .16 |
| Class Z | 69 | .05 |
| | $91,631 | |
(a) Annualized
Accounting and Security Lending Fees. Fidelity Service Company, Inc. (FSC), an affiliate of the investment adviser, maintains the Fund's accounting records. The accounting fee is based on the level of average net assets for each month. Prior to April 1, 2019, FSC had a separate agreement with the Fund for administration of the security lending program, based on the number and duration of lending transactions. For the period, the total fees paid for accounting and administration of securities lending were equivalent to an annualized rate of .05%.
Brokerage Commissions. The Fund placed a portion of its portfolio transactions with brokerage firms which are affiliates of the investment adviser. Brokerage commissions are included in net realized gain (loss) and change in net unrealized appreciation (depreciation) in the Statement of Operations. The commissions paid to these affiliated firms were $156 for the period.
Interfund Trades. The Fund may purchase from or sell securities to other Fidelity Funds under procedures adopted by the Board. The procedures have been designed to ensure these interfund trades are executed in accordance with Rule 17a-7 of the 1940 Act. Interfund trades are included within the respective purchases and sales amounts shown in the Purchases and Sales of Investments note.
6. Committed Line of Credit.
The Fund participates with other funds managed by the investment adviser or an affiliate in a $4.25 billion credit facility (the "line of credit") to be utilized for temporary or emergency purposes to fund shareholder redemptions or for other short-term liquidity purposes. The Fund has agreed to pay commitment fees on its pro-rata portion of the line of credit, which amounted to $140 and is reflected in Miscellaneous expenses on the Statement of Operations. During the period, the Fund did not borrow on this line of credit.
7. Security Lending.
The Fund lends portfolio securities through a lending agent from time to time in order to earn additional income. For equity securities, a lending agent is used and may loan securities to certain qualified borrowers, including Fidelity Capital Markets (FCM), a broker-dealer affiliated with the Fund. On the settlement date of the loan, the Fund receives collateral (in the form of U.S. Treasury obligations, letters of credit and/or cash) against the loaned securities and maintains collateral in an amount not less than 100% of the market value of the loaned securities during the period of the loan. The market value of the loaned securities is determined at the close of business of the Fund and any additional required collateral is delivered to the Fund on the next business day. The Fund or borrower may terminate the loan at any time, and if the borrower defaults on its obligation to return the securities loaned because of insolvency or other reasons, the Fund may apply collateral received from the borrower against the obligation. The Fund may experience delays and costs in recovering the securities loaned. Any cash collateral received is invested in the Fidelity Securities Lending Cash Central Fund. The value of loaned securities and cash collateral at period end are disclosed on the Fund's Statement of Assets and Liabilities. Security lending income represents the income earned on investing cash collateral, less rebates paid to borrowers and any lending agent fees associated with the loan, plus any premium payments received for lending certain types of securities. Security lending income is presented in the Statement of Operations as a component of income from Fidelity Central Funds. Total security lending income during the period amounted to $6,322. During the period, there were no securities loaned to FCM.
8. Expense Reductions.
The investment adviser contractually agreed to reimburse each class to the extent annual operating expenses exceeded certain levels of class-level average net assets as noted in the table below. This reimbursement will remain in place through February 29, 2020. Some expenses, for example the compensation of the independent Trustees, and certain miscellaneous expenses such as proxy and shareholder meeting expenses, are excluded from this reimbursement.
The following classes were in reimbursement during the period:
| | Expense Limitations | Reimbursement |
| Class A | 1.45% | $2,883 |
| Class M | 1.70% | 4,770 |
| Class C | 2.20% | 1,792 |
| Total International Equity | 1.20% | 8,145 |
| Class I | 1.20% | – |
| Class Z | 1.05% | 107 |
| | | $17,697 |
Commissions paid to certain brokers with whom the investment adviser, or its affiliates, places trades on behalf of the Fund include an amount in addition to trade execution, which may be rebated back to the Fund to offset certain expenses. This amount totaled $8,935 for the period.
In addition, during the period the investment adviser reimbursed and/or waived a portion of fund-level operating expenses in the amount of $366.
9. Distributions to Shareholders.
Distributions to shareholders of each class were as follows:
| | Six months ended
April 30, 2019 | Year ended
October 31, 2018 |
| Distributions to shareholders | | |
| Class A | $46,299 | $376,652 |
| Class M | 27,216 | 591,842 |
| Class C | – | 110,403 |
| Total International Equity | 657,302 | 3,248,285 |
| Class I | 31,377 | 335,651 |
| Class Z | 2,105 | 10,647 |
| Total | $764,299 | $4,673,480 |
10. Share Transactions.
Share transactions for each class were as follows and may contain automatic conversions between classes or exchanges between affiliated funds:
| | Shares | Shares | Dollars | Dollars |
| | Six months ended April 30, 2019 | Year ended October 31, 2018 | Six months ended April 30, 2019 | Year ended October 31, 2018 |
| Class A | | | | |
| Shares sold | 95,221 | 173,804 | $798,989 | $1,606,034 |
| Reinvestment of distributions | 5,828 | 41,465 | 46,279 | 376,502 |
| Shares redeemed | (160,542) | (286,968) | (1,367,593) | (2,649,748) |
| Net increase (decrease) | (59,493) | (71,699) | $(522,325) | $(667,212) |
| Class M | | | | |
| Shares sold | 33,841 | 87,344 | $283,146 | $814,151 |
| Reinvestment of distributions | 3,402 | 64,894 | 27,216 | 591,835 |
| Shares redeemed | (116,604) | (394,904) | (983,518) | (3,617,064) |
| Net increase (decrease) | (79,361) | (242,666) | $(673,156) | $(2,211,078) |
| Class C | | | | |
| Shares sold | 24,904 | 70,398 | $206,809 | $654,074 |
| Reinvestment of distributions | – | 12,119 | – | 110,403 |
| Shares redeemed | (101,005) | (94,138) | (854,687) | (860,312) |
| Net increase (decrease) | (76,101) | (11,621) | $(647,878) | $(95,835) |
| Total International Equity | | | | |
| Shares sold | 485,098 | 1,403,656 | $4,036,462 | $13,127,907 |
| Reinvestment of distributions | 76,720 | 329,975 | 609,928 | 3,002,772 |
| Shares redeemed | (1,023,574) | (1,820,863) | (8,515,511) | (16,667,911) |
| Net increase (decrease) | (461,756) | (87,232) | $(3,869,121) | $(537,232) |
| Class I | | | | |
| Shares sold | 185,975 | 551,397 | $1,571,135 | $5,085,051 |
| Reinvestment of distributions | 3,542 | 36,520 | 28,087 | 330,507 |
| Shares redeemed | (1,054,306) | (162,650) | (8,699,966) | (1,487,088) |
| Net increase (decrease) | (864,789) | 425,267 | $(7,100,744) | $3,928,470 |
| Class Z | | | | |
| Shares sold | 43,310 | 15,939 | $363,096 | $147,844 |
| Reinvestment of distributions | 257 | 1,174 | 2,035 | 10,647 |
| Shares redeemed | (23,707) | (17,109) | (197,380) | (155,608) |
| Net increase (decrease) | 19,860 | 4 | $167,751 | $2,883 |
11. Other.
The Fund's organizational documents provide former and current trustees and officers with a limited indemnification against liabilities arising in connection with the performance of their duties to the Fund. In the normal course of business, the Fund may also enter into contracts that provide general indemnifications. The Fund's maximum exposure under these arrangements is unknown as this would be dependent on future claims that may be made against the Fund. The risk of material loss from such claims is considered remote.
Shareholder Expense Example
As a shareholder of the Fund, you incur two types of costs: (1) transaction costs, including sales charges (loads) on purchase payments or redemption proceeds, and (2) ongoing costs, including management fees, distribution and/or service (12b-1) fees and other Fund expenses. This Example is intended to help you understand your ongoing costs (in dollars) of investing in the Fund and to compare these costs with the ongoing costs of investing in other mutual funds.
The Example is based on an investment of $1,000 invested at the beginning of the period and held for the entire period (November 1, 2018 to April 30, 2019).
Actual Expenses
The first line of the accompanying table for each class of the Fund provides information about actual account values and actual expenses. You may use the information in this line, together with the amount you invested, to estimate the expenses that you paid over the period. Simply divide your account value by $1,000.00 (for example, an $8,600 account value divided by $1,000.00 = 8.6), then multiply the result by the number in the first line for a class of the Fund under the heading entitled "Expenses Paid During Period" to estimate the expenses you paid on your account during this period. In addition, the Fund, as a shareholder in the underlying Fidelity Central Funds, will indirectly bear its pro-rata share of the fees and expenses incurred by the underlying Fidelity Central Funds. These fees and expenses are not included in the Fund's annualized expense ratio used to calculate the expense estimate in the table below.
Hypothetical Example for Comparison Purposes
The second line of the accompanying table for each class of the Fund provides information about hypothetical account values and hypothetical expenses based on a Class' actual expense ratio and an assumed rate of return of 5% per year before expenses, which is not the Class' actual return. The hypothetical account values and expenses may not be used to estimate the actual ending account balance or expenses you paid for the period. You may use this information to compare the ongoing costs of investing in the Fund and other funds. To do so, compare this 5% hypothetical example with the 5% hypothetical examples that appear in the shareholder reports of the other funds. In addition, the Fund, as a shareholder in the underlying Fidelity Central Funds, will indirectly bear its pro-rata share of the fees and expenses incurred by the underlying Fidelity Central Funds. These fees and expenses are not included in the Fund's annualized expense ratio used to calculate the expense estimate in the table below.
Please note that the expenses shown in the table are meant to highlight your ongoing costs only and do not reflect any transaction costs. Therefore, the second line of the table is useful in comparing ongoing costs only, and will not help you determine the relative total costs of owning different funds. In addition, if these transactional costs were included, your costs would have been higher.
| | Annualized Expense Ratio-A | Beginning
Account Value
November 1, 2018 | Ending
Account Value
April 30, 2019 | Expenses Paid
During Period-B
November 1, 2018
to April 30, 2019 |
| Class A | 1.45% | | | |
| Actual | | $1,000.00 | $1,116.90 | $7.61 |
| Hypothetical-C | | $1,000.00 | $1,017.60 | $7.25 |
| Class M | 1.70% | | | |
| Actual | | $1,000.00 | $1,115.80 | $8.92 |
| Hypothetical-C | | $1,000.00 | $1,016.36 | $8.50 |
| Class C | 2.20% | | | |
| Actual | | $1,000.00 | $1,112.60 | $11.52 |
| Hypothetical-C | | $1,000.00 | $1,013.88 | $10.99 |
| Total International Equity | 1.20% | | | |
| Actual | | $1,000.00 | $1,119.00 | $6.30 |
| Hypothetical-C | | $1,000.00 | $1,018.84 | $6.01 |
| Class I | 1.18% | | | |
| Actual | | $1,000.00 | $1,119.10 | $6.20 |
| Hypothetical-C | | $1,000.00 | $1,018.94 | $5.91 |
| Class Z | 1.05% | | | |
| Actual | | $1,000.00 | $1,119.30 | $5.52 |
| Hypothetical-C | | $1,000.00 | $1,019.59 | $5.26 |
A Annualized expense ratio reflects expenses net of applicable fee waivers.
B Expenses are equal to each Class' annualized expense ratio, multiplied by the average account value over the period, multiplied by 181/365 (to reflect the one-half year period).
C 5% return per year before expenses
Board Approval of Investment Advisory Contracts and Management Fees
Fidelity Total International Equity Fund
Each year, the Board of Trustees, including the Independent Trustees (together, the Board), votes on the renewal of the management contract with Fidelity Management & Research Company (FMR) and the sub-advisory agreements (together, the Advisory Contracts) for the fund. FMR and the sub-advisers are referred to herein as the Investment Advisers. The Board, assisted by the advice of fund counsel and Independent Trustees' counsel, requests and considers a broad range of information relevant to the renewal of the Advisory Contracts throughout the year.
The Board meets regularly and, at each of its meetings, covers an extensive agenda of topics and materials and considers factors that are relevant to its annual consideration of the renewal of the fund's Advisory Contracts, including the services and support provided to the fund and its shareholders. The Board has established various standing committees (Committees), each composed of and chaired by Independent Trustees with varying backgrounds, to which the Board has assigned specific subject matter responsibilities in order to enhance effective decision-making by the Board. The Board, acting directly and through its Committees, requests and receives information concerning the annual consideration of the renewal of the fund's Advisory Contracts. The Board also meets as needed to review matters specifically related to the Board's annual consideration of the renewal of the Advisory Contracts. Members of the Board may also meet with trustees of other Fidelity funds through joint ad hoc committees to discuss certain matters relevant to all of the Fidelity funds.
At its January 2019 meeting, the Board unanimously determined to renew the fund's Advisory Contracts. In reaching its determination, the Board considered all factors it believed relevant, including (i) the nature, extent, and quality of the services to be provided to the fund and its shareholders (including the investment performance of the fund); (ii) the competitiveness of the fund's management fee and total expense ratio relative to peer funds; (iii) the total costs of the services to be provided by and the profits to be realized by Fidelity from its relationships with the fund; and (iv) the extent to which, if any, economies of scale exist and would be realized as the fund grows, and whether any economies of scale are appropriately shared with fund shareholders.
In considering whether to renew the Advisory Contracts for the fund, the Board reached a determination, with the assistance of fund counsel and Independent Trustees' counsel and through the exercise of its business judgment, that the renewal of the Advisory Contracts was in the best interests of the fund and its shareholders and that the compensation payable under the Advisory Contracts was fair and reasonable. The Board's decision to renew the Advisory Contracts was not based on any single factor, but rather was based on a comprehensive consideration of all the information provided to the Board at its meetings throughout the year. The Board, in reaching its determination to renew the Advisory Contracts, was aware that shareholders of the fund have a broad range of investment choices available to them, including a wide choice among funds offered by Fidelity's competitors, and that the fund's shareholders, who have the opportunity to review and weigh the disclosure provided by the fund in its prospectus and other public disclosures, have chosen to invest in this fund, which is part of the Fidelity family of funds.
Nature, Extent, and Quality of Services Provided. The Board considered Fidelity's staffing as it relates to the fund, including the backgrounds of investment personnel of Fidelity, and also considered the fund's investment objective, strategies, and related investment philosophy. The Independent Trustees also had discussions with senior management of Fidelity's investment operations and investment groups. The Board considered the structure of the investment personnel compensation program and whether this structure provides appropriate incentives to act in the best interests of the fund. Additionally, the Board considered the portfolio managers' investments, if any, in the funds that they manage.
Resources Dedicated to Investment Management and Support Services. The Board and the Fund Oversight and Research Committees reviewed the general qualifications and capabilities of Fidelity's investment staff, including its size, education, experience, and resources, as well as Fidelity's approach to recruiting, training, managing, and compensating investment personnel. The Board noted that Fidelity has continued to increase the resources devoted to non-U.S. offices, including expansion of Fidelity's global investment organization. The Board also noted that Fidelity's analysts have extensive resources, tools and capabilities that allow them to conduct sophisticated quantitative and fundamental analysis, as well as credit analysis of issuers, counterparties and guarantors. Further, the Board considered that Fidelity's investment professionals have sufficient access to global information and data so as to provide competitive investment results over time, and that those professionals also have access to sophisticated tools that permit them to assess portfolio construction and risk and performance attribution characteristics continuously, as well as to transmit new information and research conclusions rapidly around the world. Additionally, in its deliberations, the Board considered Fidelity's trading, risk management, compliance, and technology and operations capabilities and resources, which are integral parts of the investment management process.
Shareholder and Administrative Services. The Board considered (i) the nature, extent, quality, and cost of advisory, administrative, and shareholder services performed by the Investment Advisers and their affiliates under the Advisory Contracts and under separate agreements covering transfer agency, pricing and bookkeeping, and securities lending services for the fund; (ii) the nature and extent of the supervision of third party service providers, principally custodians, subcustodians, and pricing vendors; and (iii) the resources devoted to, and the record of compliance with, the fund's compliance policies and procedures. The Board also reviewed the allocation of fund brokerage, including allocations to brokers affiliated with the Investment Advisers, the use of brokerage commissions to pay fund expenses, and the use of "soft" commission dollars to pay for research services.
The Board noted that the growth of fund assets over time across the complex allows Fidelity to reinvest in the development of services designed to enhance the value and convenience of the Fidelity funds as investment vehicles. These services include 24-hour access to account information and market information through telephone representatives and over the Internet, investor education materials and asset allocation tools, and the expanded availability of Fidelity Investor Centers.
The Board noted that it and the boards of certain other Fidelity funds had formed an ad hoc Committee on Transfer Agency Fees to review the variety of transfer agency fee structures throughout the industry and Fidelity's competitive positioning with respect to industry participants.
Investment in a Large Fund Family. The Board considered the benefits to shareholders of investing in a Fidelity fund, including the benefits of investing in a fund that is part of a large family of funds offering a variety of investment disciplines and providing a large variety of mutual fund investor services. The Board noted that Fidelity had taken, or had made recommendations that resulted in the Fidelity funds taking, a number of actions over the previous year that benefited particular funds, including: (i) continuing to dedicate additional resources to Fidelity's investment research process, which includes meetings with management of issuers of securities in which the funds invest, and to the support of the senior management team that oversees asset management; (ii) continuing efforts to enhance Fidelity's global research capabilities; (iii) launching new funds and making other enhancements to meet client needs; (iv) launching new share classes of existing funds; (v) eliminating purchase minimums and broadening eligibility requirements for certain funds and share classes; (vi) reducing management fees and total expenses for certain growth equity funds and index funds; (vii) lowering expense caps for certain existing funds and classes, and converting certain voluntary expense caps to contractual caps, to reduce expenses borne by shareholders; (viii) eliminating short-term redemption fees for funds that had such fees; (ix) rationalizing product lines and gaining increased efficiencies from fund mergers and share class consolidations; (x) continuing to develop, acquire and implement systems and technology to improve services to the funds and shareholders, strengthen information security, and increase efficiency; and (xi) continuing to implement enhancements to further strengthen Fidelity's product line to increase investors' probability of success in achieving their investment goals, including retirement income goals.
Investment Performance. The Board considered whether the fund has operated in accordance with its investment objective, as well as its record of compliance with its investment restrictions and its performance history.
The Board took into account discussions that occur at Board meetings throughout the year with representatives of the Investment Advisers about fund investment performance. In this regard the Board noted that as part of regularly scheduled fund reviews and other reports to the Board on fund performance, the Board considers annualized return information for the fund for different time periods, measured against an appropriate securities market index ("benchmark index") and a peer group of funds with similar objectives ("peer group"), if any. In its evaluation of fund investment performance, the Board gave particular attention to information indicating changes in performance of certain Fidelity funds for specific time periods and discussed with the Investment Advisers the reasons for any overperformance or underperformance.
In addition to reviewing absolute and relative fund performance, the Independent Trustees periodically consider the appropriateness of fund performance metrics in evaluating the results achieved. In general, the Independent Trustees believe that fund performance should be evaluated based on net performance (after fees and expenses) of both the highest performing and lowest performing fund share classes, where applicable, compared to appropriate benchmark indices, over appropriate time periods that may include full market cycles, and compared to peer groups, as applicable, over the same periods, taking into account relevant factors including the following: general market conditions; issuer-specific information; and fund cash flows and other factors.
The Independent Trustees recognize that shareholders evaluate performance on a net basis over their own holding periods, for which one-, three-, and five-year periods are often used as a proxy. For this reason, the performance information reviewed by the Board also included net cumulative total return information for the fund and an appropriate benchmark index and peer group for the most recent one-, three-, and five-year periods ended June 30, 2018, as shown below. Returns are shown compared to the 25th percentile (top of box, 75% beaten) and 75th percentile (bottom of box, 25% beaten) of the peer universe. Returns of the benchmark index are "net MA,"
i.e., adjusted for tax withholding rates applicable to U.S.-based funds organized as Massachusetts business trusts.
Fidelity Total International Equity Fund

The Board also considered that the fund's management fee is subject to upward or downward adjustment depending upon whether, and to what extent, the fund's investment performance for the performance period (a rolling 36-month period) exceeds, or is exceeded by, a securities index, thus leading to a performance adjustment for the same period. The Board noted that the performance adjustment provides FMR with a strong economic incentive to seek to achieve superior long-term performance for the fund's shareholders and helps to more closely align the interests of FMR and the shareholders of the fund.
Based on its review, the Board concluded that the nature, extent, and quality of services provided to the fund under the Advisory Contracts should continue to benefit the shareholders of the fund.
Competitiveness of Management Fee and Total Expense Ratio. The Board considered the fund's management fee and total expense ratio compared to "mapped groups" of competitive funds and classes created for the purpose of facilitating the Trustees' competitive analysis of management fees and total expenses. Fidelity creates "mapped groups" by combining similar Lipper investment objective categories that have comparable investment mandates. Combining Lipper investment objective categories aids the Board's management fee and total expense ratio comparisons by broadening the competitive group used for comparison.
Management Fee. The Board considered two proprietary management fee comparisons for the 12-month periods (ended June 30 for 2018 and December 31 for prior periods) shown in basis points (BP) in the chart below. The group of Lipper funds used by the Board for management fee comparisons is referred to below as the "Total Mapped Group." The Total Mapped Group comparison focuses on a fund's standing in terms of gross management fees before expense reimbursements or caps, and without giving effect to the fund's performance adjustment, relative to the total universe of funds with comparable investment mandates, regardless of whether their management fee structures also are comparable. Funds with comparable investment mandates offer exposure to similar types of securities. Funds with comparable management fee structures have similar management fee contractual arrangements (
e.g., flat rate charged for advisory services, all-inclusive fee rate,
etc.). "TMG %" represents the percentage of funds in the Total Mapped Group that had management fees that were lower than the fund's. For example, a hypothetical TMG % of 20% would mean that 80% of the funds in the Total Mapped Group had higher, and 20% had lower, management fees than the fund. The fund's actual TMG %s and the number of funds in the Total Mapped Group are in the chart below. The "Asset-Size Peer Group" (ASPG) comparison focuses on a fund's standing relative to a subset of non-Fidelity funds within the Total Mapped Group that are similar in size and management fee structure without taking into account performance adjustments, if any. For example, if a fund is in the first quartile of the ASPG, the fund's management fee ranks in the least expensive or lowest 25% of funds in the ASPG. The ASPG represents at least 15% of the funds in the Total Mapped Group with comparable asset size and management fee structures, subject to a minimum of 50 funds (or all funds in the Total Mapped Group if fewer than 50). Additional information, such as the ASPG quartile in which the fund's management fee rate ranked and the impact of the fund's performance adjustment, is also included in the chart and was considered by the Board.
Fidelity Total International Equity Fund
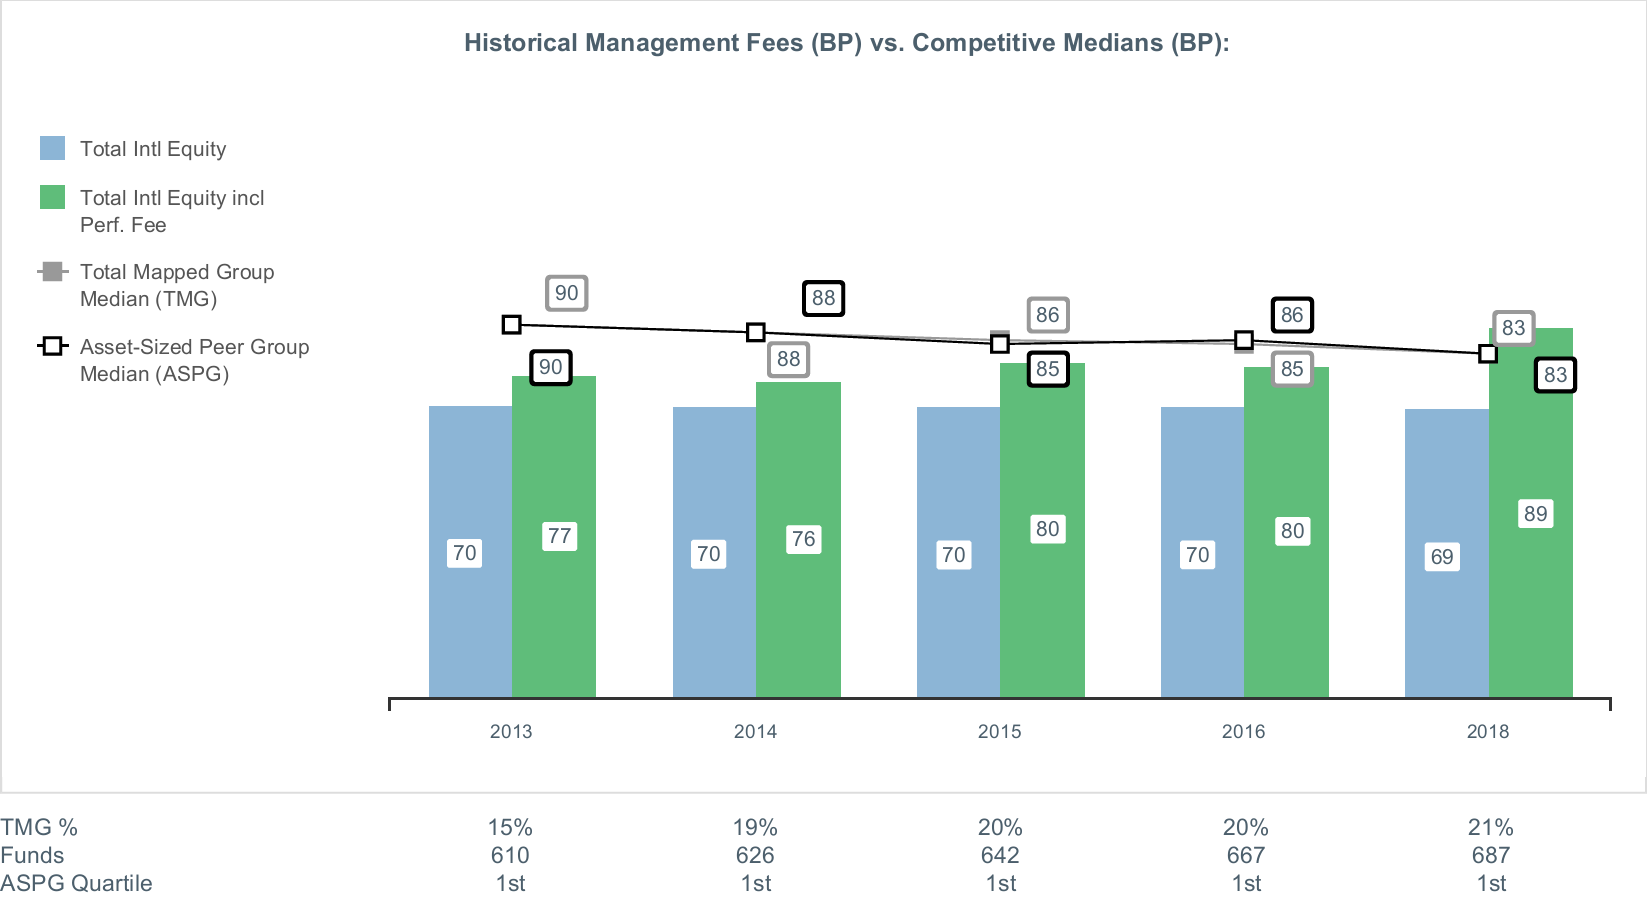
The Board noted that the fund's management fee rate ranked below the median of its Total Mapped Group and below the median of its ASPG for the 12-month period ended June 30, 2018. The Board also noted the effect of the fund's performance adjustment, if any, on the fund's management fee ranking.
The Board noted that it and the boards of other Fidelity funds formed an ad hoc Committee on Group Fee, which meets periodically, to conduct an in-depth review of the "group fee" component of the management fee of funds with such management fee structures. The Committee's focus included the mechanics of the group fee, the competitive landscape of group fee structures, Fidelity funds with no group fee component and investment products not included in group fee assets. The Board also considered that, for funds subject to the group fee, FMR agreed to voluntarily waive fees over a specified period of time in amounts designed to account for assets converted from certain funds to certain collective investment trusts.
The Board also noted that, in 2013, the ad hoc Committee on Management Fees was formed to conduct an in-depth review of the management fee rates of Fidelity's active equity mutual funds. The Committee focused on the following areas: (i) standard fee structures; (ii) research consumption and trading evolution; (iii) management fee competitiveness/profitability by category; and (iv) factors that drive institutional pricing.
Based on its review, the Board concluded that the fund's management fee is fair and reasonable in light of the services that the fund receives and the other factors considered.
Total Expense Ratio. In its review of each class's total expense ratio, the Board considered the fund's management fee rate as well as other fund or class expenses, as applicable, such as transfer agent fees, pricing and bookkeeping fees, fund-paid 12b-1 fees, and custodial, legal, and audit fees. The Board noted the impact of the fund's performance adjustment. The Board also noted that Fidelity may agree to waive fees and expenses from time to time, and the extent to which, if any, it has done so for the fund. As part of its review, the Board also considered the current and historical total expense ratios of each class of the fund compared to competitive fund median expenses. Each class of the fund is compared to those funds and classes in the Total Mapped Group (used by the Board for management fee comparisons) that have a similar sales load structure.
The Board noted that the total expense ratio of each class ranked above the competitive median for the 12-month period ended June 30, 2018. The Board considered that, in general, various factors can affect total expense ratios. The Board noted that the total expense ratio of Class A was above the competitive median because of positive performance fees. Excluding performance fees, the total expense ratio of Class A ranked below the median. The Board noted that the total expense ratio of Class M was above the competitive median primarily because of higher 12b-1 fees on Class M as compared to most competitor funds. Class M has a higher 12b-1 fee, but a lower front-end sales charge, than traditionally priced front-end sales charge classes. The Board considered that Class M is primarily sold load-waived to retirement plans and intermediary wrap programs where its 0.50% 12b-1 fee is comparable to competing no-load, higher 12b-1 fee classes designed specifically for retirement plans and wrap programs. The Board noted that the total expense ratio of Class C was above the competitive median primarily because of its 1.00% 12b-1 fee. The Board noted that, although Class I is categorized by Lipper as an institutional class, Class I has a significantly lower investment minimum than most other funds and classes categorized as institutional. As a result, FMR believes Class I is generally more comparable to retail funds and classes. The Board noted that the total expense ratio of Class Z was above the competitive median because of relatively higher other expenses due to low asset levels. The Board noted that the total expense ratio of the retail class was above the competitive median due to higher transfer agent fees from small average account sizes. The Board noted that the fund offers multiple classes, each of which has a different sales load and 12b-1 fee structure, and that the multiple structures are intended to offer a range of pricing options for the intermediary market. The Board also noted that the total expense ratios of the classes vary primarily by the level of their 12b-1 fees, although differences in transfer agent fees may also cause expenses to vary from class to class.
The Board further considered that FMR has contractually agreed to reimburse Class A, Class M, Class C, Class I, Class Z, and the retail class of the fund to the extent that total operating expenses, with certain exceptions, as a percentage of their respective average net assets, exceed 1.45%, 1.70%, 2.20%, 1.20%, 1.05%, and 1.20% through February 29, 2020.
Fees Charged to Other Fidelity Clients. The Board also considered Fidelity fee structures and other information with respect to clients of Fidelity, such as other funds advised or subadvised by Fidelity, pension plan clients, and other institutional clients with similar mandates. The Board noted that a joint ad hoc committee created by it and the boards of other Fidelity funds periodically reviews and compares Fidelity's institutional investment advisory business with its business of providing services to the Fidelity funds and also noted the most recent findings of the committee. The Board noted that the committee's review included a consideration of the differences in services provided, fees charged, and costs incurred, as well as competition in the markets serving the different categories of clients.
Based on its review of total expense ratios and fees charged to other Fidelity clients, the Board concluded that the total expense ratio of each class of the fund was reasonable in light of the services that the fund and its shareholders receive and the other factors considered.
Costs of the Services and Profitability. The Board considered the revenues earned and the expenses incurred by Fidelity in conducting the business of developing, marketing, distributing, managing, administering and servicing the fund and servicing the fund's shareholders. The Board also considered the level of Fidelity's profits in respect of all the Fidelity funds.
On an annual basis, Fidelity presents to the Board information about the profitability of its relationships with the fund. Fidelity calculates profitability information for each fund, as well as aggregate profitability information for groups of Fidelity funds and all Fidelity funds, using a series of detailed revenue and cost allocation methodologies which originate with the books and records of Fidelity on which Fidelity's audited financial statements are based. The Audit Committee of the Board reviews any significant changes from the prior year's methodologies.
PricewaterhouseCoopers LLP (PwC), auditor to Fidelity and certain Fidelity funds, has been engaged annually by the Board as part of the Board's assessment of Fidelity's profitability analysis. PwC's engagement includes the review and assessment of the methodologies used by Fidelity in determining the revenues and expenses attributable to Fidelity's mutual fund business, and completion of agreed-upon procedures in respect of the mathematical accuracy of the fund profitability information and its conformity to established allocation methodologies. After considering PwC's reports issued under the engagement and information provided by Fidelity, the Board concluded that while other allocation methods may also be reasonable, Fidelity's profitability methodologies are reasonable in all material respects.
The Board also reviewed Fidelity's non-fund businesses and potential indirect benefits such businesses may have received as a result of their association with Fidelity's mutual fund business (i.e., fall-out benefits) as well as cases where Fidelity's affiliates may benefit from the fund's business. The Board noted that changes to fall-out benefits year-over-year reflect business developments at Fidelity's various businesses.
The Board considered the costs of the services provided by and the profits realized by Fidelity in connection with the operation of the fund and was satisfied that the profitability was not excessive.
Economies of Scale. The Board considered whether there have been economies of scale in respect of the management of the Fidelity funds, whether the Fidelity funds (including the fund) have appropriately benefited from any such economies of scale, and whether there is potential for realization of any further economies of scale. The Board considered the extent to which the fund will benefit from economies of scale as assets grow through increased services to the fund, through waivers or reimbursements, or through fee or expense ratio reductions. The Board also noted that a committee (the Economies of Scale Committee) created by it and the boards of other Fidelity funds periodically analyzes whether Fidelity attains economies of scale in respect of the management and servicing of the Fidelity funds, whether the Fidelity funds have appropriately benefited from such economies of scale, and whether there is potential for realization of any further economies of scale.
The Board recognized that the fund's management contract incorporates a "group fee" structure, which provides for lower group fee rates as total group assets increase, and for higher group fee rates as total group assets decrease (with "group assets" defined to include fund assets under FMR's management plus the assets of sector funds previously under FMR's management). FMR calculates the group fee rates based on a tiered asset "breakpoint" schedule that varies based on asset class. The Board considered that the group fee is designed to deliver the benefits of economies of scale to fund shareholders when total Fidelity fund assets increase, even if assets of any particular fund are unchanged or have declined, because some portion of Fidelity's costs are attributable to services provided to all Fidelity funds, and all funds benefit if those costs can be allocated among more assets. The Board concluded that, given the group fee structure, fund shareholders will benefit from lower management fees as group assets increase at the fund complex level, regardless of whether Fidelity achieves any such economies of scale.
The Board concluded, taking into account the analysis of the Economies of Scale Committee, that economies of scale, if any, are being appropriately shared between fund shareholders and Fidelity.
Additional Information Requested by the Board. In order to develop fully the factual basis for consideration of the Fidelity funds' advisory contracts, the Board requested and received additional information on certain topics, including: (i) fund performance trends, in particular the underperformance of certain funds, and Fidelity's long-term strategies for certain funds; (ii) Fidelity's fund profitability methodology, profitability trends for certain funds, and the impact of certain factors on fund profitability results; (iii) metrics for evaluating index fund and ETF performance and information about ETF trading characteristics; (iv) the methodology with respect to the evaluation of competitive fund data and peer group classifications and fee comparisons; (v) the expense structures for different funds and classes; (vi) information regarding other accounts managed by Fidelity, including collective investment trusts; and (vii) Fidelity's philosophies and strategies for evaluating funds and classes with lower or declining asset levels.
Based on its evaluation of all of the conclusions noted above, and after considering all factors it believed relevant, the Board concluded that the advisory fee arrangements are fair and reasonable, and that the fund's Advisory Contracts should be renewed.
TIE-SANN-0619
1.912361.109
Fidelity's Targeted International Equity Funds® Fidelity® Canada Fund
Fidelity® China Region Fund
Fidelity® Emerging Asia Fund
Fidelity® Emerging Markets Fund
Fidelity® Europe Fund
Fidelity® Japan Fund
Fidelity® Japan Smaller Companies Fund
Fidelity® Latin America Fund
Fidelity® Nordic Fund
Fidelity® Pacific Basin Fund
Semi-Annual Report April 30, 2019 Includes Fidelity and Fidelity Advisor share classes |
|
Beginning on January 1, 2021, as permitted by regulations adopted by the Securities and Exchange Commission, paper copies of a fund’s shareholder reports will no longer be sent by mail, unless you specifically request paper copies of the reports from the fund or from your financial intermediary, such as a financial advisor, broker-dealer or bank. Instead, the reports will be made available on a website, and you will be notified by mail each time a report is posted and provided with a website link to access the report.
If you already elected to receive shareholder reports electronically, you will not be affected by this change and you need not take any action. You may elect to receive shareholder reports and other communications from a fund electronically, by contacting your financial intermediary. For Fidelity customers, visit Fidelity's web site or call Fidelity using the contact information listed below.
You may elect to receive all future reports in paper free of charge. If you wish to continue receiving paper copies of your shareholder reports, you may contact your financial intermediary or, if you are a Fidelity customer, visit Fidelity’s website, or call Fidelity at the applicable toll-free number listed below. Your election to receive reports in paper will apply to all funds held with the fund complex/your financial intermediary.
| Account Type | Website | Phone Number |
| Brokerage, Mutual Fund, or Annuity Contracts: | fidelity.com/mailpreferences | 1-800-343-3548 |
| Employer Provided Retirement Accounts: | netbenefits.fidelity.com/preferences (choose 'no' under Required Disclosures to continue to print) | 1-800-343-0860 |
| Advisor Sold Accounts Serviced Through Your Financial Intermediary: | Contact Your Financial Intermediary | Your Financial Intermediary's phone number |
| Advisor Sold Accounts Serviced by Fidelity: | institutional.fidelity.com | 1-877-208-0098 |
Contents
To view a fund's proxy voting guidelines and proxy voting record for the 12-month period ended June 30, visit http://www.fidelity.com/proxyvotingresults or visit the Securities and Exchange Commission's (SEC) web site at http://www.sec.gov.
You may also call 1-800-544-8544 if you’re an individual investing directly with Fidelity, call 1-800-835-5092 if you’re a plan sponsor or participant with Fidelity as your recordkeeper or call 1-877-208-0098 on institutional accounts or if you’re an advisor or invest through one to request a free copy of the proxy voting guidelines.
Standard & Poor's, S&P and S&P 500 are registered service marks of The McGraw-Hill Companies, Inc. and have been licensed for use by Fidelity Distributors Corporation.
Other third-party marks appearing herein are the property of their respective owners.
All other marks appearing herein are registered or unregistered trademarks or service marks of FMR LLC or an affiliated company. © 2019 FMR LLC. All rights reserved.
This report and the financial statements contained herein are submitted for the general information of the shareholders of the Funds. This report is not authorized for distribution to prospective investors in the Funds unless preceded or accompanied by an effective prospectus.
A fund files its complete schedule of portfolio holdings with the SEC for the first and third quarters of each fiscal year on Form N-PORT. Forms N-PORT are available on the SEC’s web site at http://www.sec.gov. A fund's Forms N-PORT may be reviewed and copied at the SEC’s Public Reference Room in Washington, DC. Information regarding the operation of the SEC's Public Reference Room may be obtained by calling 1-800-SEC-0330.
For a complete list of a fund's portfolio holdings, view the most recent holdings listing, semiannual report, or annual report on Fidelity's web site at http://www.fidelity.com, http://www.institutional.fidelity.com, or http://www.401k.com, as applicable.
NOT FDIC INSURED •MAY LOSE VALUE •NO BANK GUARANTEE
Neither the Funds nor Fidelity Distributors Corporation is a bank.
Fidelity® Canada Fund
Investment Summary (Unaudited)
Geographic Diversification (% of fund's net assets)
| As of April 30, 2019 |
| | Canada | 98.1% |
| | United States of America* | 1.9% |

* Includes Short-Term investments and Net Other Assets (Liabilities).
Percentages are based on country or territory of incorporation and are adjusted for the effect of futures contracts, if applicable.
Asset Allocation as of April 30, 2019
| | % of fund's net assets |
| Stocks | 98.4 |
| Short-Term Investments and Net Other Assets (Liabilities) | 1.6 |
Top Ten Stocks as of April 30, 2019
| | % of fund's net assets |
| Royal Bank of Canada (Banks) | 10.6 |
| The Toronto-Dominion Bank (Banks) | 10.3 |
| Suncor Energy, Inc. (Oil, Gas & Consumable Fuels) | 5.9 |
| Canadian Pacific Railway Ltd. (Road & Rail) | 4.8 |
| Sun Life Financial, Inc. (Insurance) | 4.4 |
| TELUS Corp. (Diversified Telecommunication Services) | 4.3 |
| Alimentation Couche-Tard, Inc. Class B (sub. vtg.) (Food & Staples Retailing) | 4.3 |
| Nutrien Ltd. (Chemicals) | 3.9 |
| Canadian National Railway Co. (Road & Rail) | 3.5 |
| Canadian Natural Resources Ltd. (Oil, Gas & Consumable Fuels) | 3.4 |
| | 55.4 |
Top Market Sectors as of April 30, 2019
| | % of fund's net assets |
| Financials | 31.4 |
| Energy | 17.6 |
| Industrials | 11.4 |
| Materials | 11.3 |
| Consumer Staples | 8.3 |
| Communication Services | 7.6 |
| Information Technology | 5.7 |
| Consumer Discretionary | 3.9 |
| Real Estate | 0.9 |
| Health Care | 0.3 |
Market Sectors may include more than one industry category.
The Fund may invest up to 35% of its total assets in any industry that represents more than 20% of the Canadian market. As of April 30, 2019, the Fund did not have more than 25% of its total assets invested in any one industry.
Fidelity® Canada Fund
Schedule of Investments April 30, 2019 (Unaudited)
Showing Percentage of Net Assets
| Common Stocks - 98.4% | | | |
| | | Shares | Value |
| COMMUNICATION SERVICES - 7.6% | | | |
| Diversified Telecommunication Services - 4.3% | | | |
| TELUS Corp. | | 1,200,300 | $44,197,058 |
| Media - 1.1% | | | |
| Cogeco Communications, Inc. | | 164,300 | 10,911,227 |
| Wireless Telecommunication Services - 2.2% | | | |
| Rogers Communications, Inc. Class B (non-vtg.) | | 457,900 | 23,053,934 |
|
| TOTAL COMMUNICATION SERVICES | | | 78,162,219 |
|
| CONSUMER DISCRETIONARY - 3.9% | | | |
| Hotels, Restaurants & Leisure - 0.5% | | | |
| Recipe Unlimited Corp. | | 222,000 | 4,474,136 |
| Leisure Products - 1.4% | | | |
| BRP, Inc. | | 210,400 | 6,539,566 |
| Spin Master Corp. (a)(b) | | 240,500 | 7,993,928 |
| | | | 14,533,494 |
| Multiline Retail - 2.0% | | | |
| Dollarama, Inc. | | 689,400 | 20,707,215 |
|
| TOTAL CONSUMER DISCRETIONARY | | | 39,714,845 |
|
| CONSUMER STAPLES - 8.3% | | | |
| Food & Staples Retailing - 8.3% | | | |
| Alimentation Couche-Tard, Inc. Class B (sub. vtg.) | | 740,700 | 43,672,384 |
| George Weston Ltd. | | 263,200 | 19,652,083 |
| Metro, Inc. Class A (sub. vtg.) | | 375,295 | 13,586,480 |
| North West Co., Inc. | | 359,900 | 7,602,575 |
| | | | 84,513,522 |
| ENERGY - 17.6% | | | |
| Energy Equipment & Services - 0.5% | | | |
| Canadian Energy Services & Technology Corp. | | 2,417,400 | 4,709,572 |
| Computer Modelling Group Ltd. | | 1,700 | 7,487 |
| | | | 4,717,059 |
| Oil, Gas & Consumable Fuels - 17.1% | | | |
| Canadian Natural Resources Ltd. | | 1,174,898 | 35,272,373 |
| Cenovus Energy, Inc. (Canada) | | 1,295,700 | 12,843,843 |
| Enbridge, Inc. | | 779,200 | 28,784,510 |
| Peyto Exploration & Development Corp. (c) | | 608,900 | 2,749,754 |
| Pinnacle Renewable Energy, Inc. | | 509,300 | 4,626,544 |
| PrairieSky Royalty Ltd. (c) | | 2,119,718 | 30,552,926 |
| Suncor Energy, Inc. | | 1,842,600 | 60,764,401 |
| | | | 175,594,351 |
|
| TOTAL ENERGY | | | 180,311,410 |
|
| FINANCIALS - 31.4% | | | |
| Banks - 20.9% | | | |
| Royal Bank of Canada (c) | | 1,357,700 | 108,204,544 |
| The Toronto-Dominion Bank | | 1,859,700 | 106,082,163 |
| | | | 214,286,707 |
| Capital Markets - 1.0% | | | |
| IGM Financial, Inc. | | 385,600 | 10,649,548 |
| Insurance - 9.5% | | | |
| Intact Financial Corp. | | 329,225 | 26,936,144 |
| Power Corp. of Canada (sub. vtg.) | | 1,087,000 | 24,941,688 |
| Sun Life Financial, Inc. | | 1,087,200 | 45,169,480 |
| | | | 97,047,312 |
|
| TOTAL FINANCIALS | | | 321,983,567 |
|
| HEALTH CARE - 0.3% | | | |
| Biotechnology - 0.3% | | | |
| Amgen, Inc. | | 19,400 | 3,478,808 |
| INDUSTRIALS - 11.4% | | | |
| Aerospace & Defense - 0.9% | | | |
| CAE, Inc. | | 411,000 | 9,559,424 |
| Professional Services - 2.2% | | | |
| Thomson Reuters Corp. | | 357,100 | 22,067,858 |
| Road & Rail - 8.3% | | | |
| Canadian National Railway Co. | | 387,400 | 35,984,217 |
| Canadian Pacific Railway Ltd. | | 219,900 | 49,270,272 |
| | | | 85,254,489 |
|
| TOTAL INDUSTRIALS | | | 116,881,771 |
|
| INFORMATION TECHNOLOGY - 5.7% | | | |
| IT Services - 1.9% | | | |
| CGI Group, Inc. Class A (sub. vtg.) (a) | | 264,700 | 19,052,789 |
| Software - 3.8% | | | |
| Constellation Software, Inc. | | 22,800 | 20,117,337 |
| Open Text Corp. | | 487,928 | 18,756,656 |
| | | | 38,873,993 |
|
| TOTAL INFORMATION TECHNOLOGY | | | 57,926,782 |
|
| MATERIALS - 11.3% | | | |
| Chemicals - 3.9% | | | |
| Nutrien Ltd. | | 737,581 | 40,003,460 |
| Containers & Packaging - 1.4% | | | |
| CCL Industries, Inc. Class B | | 327,800 | 13,983,556 |
| Metals & Mining - 5.5% | | | |
| Franco-Nevada Corp. | | 405,600 | 29,061,390 |
| Lundin Mining Corp. | | 1,694,600 | 9,094,703 |
| OceanaGold Corp. | | 620,900 | 1,742,617 |
| Wheaton Precious Metals Corp. | | 785,300 | 16,987,381 |
| | | | 56,886,091 |
| Paper & Forest Products - 0.5% | | | |
| Western Forest Products, Inc. | | 3,717,600 | 5,216,905 |
|
| TOTAL MATERIALS | | | 116,090,012 |
|
| REAL ESTATE - 0.9% | | | |
| Equity Real Estate Investment Trusts (REITs) - 0.9% | | | |
| Allied Properties (REIT) | | 259,000 | 9,169,493 |
| TOTAL COMMON STOCKS | | | |
| (Cost $721,396,029) | | | 1,008,232,429 |
|
| Money Market Funds - 10.9% | | | |
| Fidelity Cash Central Fund, 2.49% (d) | | 17,670,994 | 17,674,528 |
| Fidelity Securities Lending Cash Central Fund 2.49% (d)(e) | | 94,329,633 | 94,339,066 |
| TOTAL MONEY MARKET FUNDS | | | |
| (Cost $112,013,365) | | | 112,013,594 |
| TOTAL INVESTMENT IN SECURITIES - 109.3% | | | |
| (Cost $833,409,394) | | | 1,120,246,023 |
| NET OTHER ASSETS (LIABILITIES) - (9.3)% | | | (95,384,114) |
| NET ASSETS - 100% | | | $1,024,861,909 |
Legend
(a) Non-income producing
(b) Security exempt from registration under Rule 144A of the Securities Act of 1933. These securities may be resold in transactions exempt from registration, normally to qualified institutional buyers. At the end of the period, the value of these securities amounted to $7,993,928 or 0.8% of net assets.
(c) Security or a portion of the security is on loan at period end.
(d) Affiliated fund that is generally available only to investment companies and other accounts managed by Fidelity Investments. The rate quoted is the annualized seven-day yield of the fund at period end. A complete unaudited listing of the fund's holdings as of its most recent quarter end is available upon request. In addition, each Fidelity Central Fund's financial statements are available on the SEC's website or upon request.
(e) Investment made with cash collateral received from securities on loan.
Affiliated Central Funds
Information regarding fiscal year to date income earned by the Fund from investments in Fidelity Central Funds is as follows:
| Fund | Income earned |
| Fidelity Cash Central Fund | $90,347 |
| Fidelity Securities Lending Cash Central Fund | 176,989 |
| Total | $267,336 |
Amounts in the income column in the above table include any capital gain distributions from underlying funds, which are presented in the corresponding line-item in the Statement of Operations, if applicable.
Investment Valuation
All investments are categorized as Level 1 under the Fair Value Hierarchy. The inputs or methodology used for valuing securities may not be an indication of the risk associated with investing in those securities. For more information on valuation inputs please refer to the Investment Valuation section in the accompanying Notes to Financial Statements.
See accompanying notes which are an integral part of the financial statements.
Fidelity® Canada Fund
Financial Statements
Statement of Assets and Liabilities
| | | April 30, 2019 (Unaudited) |
| Assets | | |
Investment in securities, at value (including securities loaned of $90,209,207) — See accompanying schedule:
Unaffiliated issuers (cost $721,396,029) | $1,008,232,429 | |
| Fidelity Central Funds (cost $112,013,365) | 112,013,594 | |
| Total Investment in Securities (cost $833,409,394) | | $1,120,246,023 |
| Foreign currency held at value (cost $366,640) | | 366,640 |
| Receivable for fund shares sold | | 222,423 |
| Dividends receivable | | 1,741,260 |
| Distributions receivable from Fidelity Central Funds | | 37,080 |
| Prepaid expenses | | 513 |
| Other receivables | | 5,562 |
| Total assets | | 1,122,619,501 |
| Liabilities | | |
| Payable for investments purchased | $7,859 | |
| Payable for fund shares redeemed | 2,605,294 | |
| Accrued management fee | 539,918 | |
| Distribution and service plan fees payable | 16,704 | |
| Other affiliated payables | 212,273 | |
| Other payables and accrued expenses | 36,297 | |
| Collateral on securities loaned | 94,339,247 | |
| Total liabilities | | 97,757,592 |
| Net Assets | | $1,024,861,909 |
| Net Assets consist of: | | |
| Paid in capital | | $718,323,571 |
| Total distributable earnings (loss) | | 306,538,338 |
| Net Assets | | $1,024,861,909 |
| Net Asset Value and Maximum Offering Price | | |
| Class A: | | |
| Net Asset Value and redemption price per share ($31,232,201 ÷ 610,620 shares) | | $51.15 |
| Maximum offering price per share (100/94.25 of $51.15) | | $54.27 |
| Class M: | | |
| Net Asset Value and redemption price per share ($8,099,094 ÷ 158,988 shares) | | $50.94 |
| Maximum offering price per share (100/96.50 of $50.94) | | $52.79 |
| Class C: | | |
| Net Asset Value and offering price per share ($8,120,053 ÷ 162,381 shares)(a) | | $50.01 |
| Canada: | | |
| Net Asset Value, offering price and redemption price per share ($926,229,515 ÷ 18,048,066 shares) | | $51.32 |
| Class I: | | |
| Net Asset Value, offering price and redemption price per share ($50,907,319 ÷ 993,987 shares) | | $51.22 |
| Class Z: | | |
| Net Asset Value, offering price and redemption price per share ($273,727 ÷ 5,352 shares) | | $51.14 |
(a) Redemption price per share is equal to net asset value less any applicable contingent deferred sales charge.
See accompanying notes which are an integral part of the financial statements.
Statement of Operations
| | | Six months ended April 30, 2019 (Unaudited) |
| Investment Income | | |
| Dividends | | $14,048,858 |
| Income from Fidelity Central Funds | | 267,336 |
| Income before foreign taxes withheld | | 14,316,194 |
| Less foreign taxes withheld | | (2,231,266) |
| Total income | | 12,084,928 |
| Expenses | | |
| Management fee | | |
| Basic fee | $3,374,566 | |
| Performance adjustment | (571,072) | |
| Transfer agent fees | 1,028,463 | |
| Distribution and service plan fees | 105,372 | |
| Accounting and security lending fees | 232,739 | |
| Custodian fees and expenses | 5,428 | |
| Independent trustees' fees and expenses | 2,742 | |
| Registration fees | 81,976 | |
| Audit | 44,295 | |
| Legal | 2,040 | |
| Miscellaneous | 3,188 | |
| Total expenses before reductions | 4,309,737 | |
| Expense reductions | (40,463) | |
| Total expenses after reductions | | 4,269,274 |
| Net investment income (loss) | | 7,815,654 |
| Realized and Unrealized Gain (Loss) | | |
| Net realized gain (loss) on: | | |
| Investment securities: | | |
| Unaffiliated issuers | 17,753,607 | |
| Fidelity Central Funds | (905) | |
| Foreign currency transactions | (31,156) | |
| Total net realized gain (loss) | | 17,721,546 |
| Change in net unrealized appreciation (depreciation) on: | | |
| Investment securities: | | |
| Unaffiliated issuers | 67,422,693 | |
| Fidelity Central Funds | 229 | |
| Assets and liabilities in foreign currencies | 14,497 | |
| Total change in net unrealized appreciation (depreciation) | | 67,437,419 |
| Net gain (loss) | | 85,158,965 |
| Net increase (decrease) in net assets resulting from operations | | $92,974,619 |
See accompanying notes which are an integral part of the financial statements.
Statement of Changes in Net Assets
| | Six months ended April 30, 2019 (Unaudited) | Year ended October 31, 2018 |
| Increase (Decrease) in Net Assets | | |
| Operations | | |
| Net investment income (loss) | $7,815,654 | $15,980,423 |
| Net realized gain (loss) | 17,721,546 | 57,232,871 |
| Change in net unrealized appreciation (depreciation) | 67,437,419 | (134,481,756) |
| Net increase (decrease) in net assets resulting from operations | 92,974,619 | (61,268,462) |
| Distributions to shareholders | (61,875,999) | (27,476,751) |
| Share transactions - net increase (decrease) | 14,590,907 | (157,321,221) |
| Redemption fees | – | 5,144 |
| Total increase (decrease) in net assets | 45,689,527 | (246,061,290) |
| Net Assets | | |
| Beginning of period | 979,172,382 | 1,225,233,672 |
| End of period | $1,024,861,909 | $979,172,382 |
See accompanying notes which are an integral part of the financial statements.
Financial Highlights
Fidelity Canada Fund Class A
| | Six months ended (Unaudited) April 30, | Years endedOctober 31, | | | | |
| | 2019 | 2018 | 2017 | 2016 | 2015 | 2014 |
| Selected Per–Share Data | | | | | | |
| Net asset value, beginning of period | $49.75 | $54.11 | $48.09 | $45.25 | $60.56 | $57.31 |
| Income from Investment Operations | | | | | | |
| Net investment income (loss)A | .31 | .60 | .50 | .48 | .45 | .47 |
| Net realized and unrealized gain (loss) | 4.11 | (3.88) | 6.16 | 2.84 | (8.04) | 3.13 |
| Total from investment operations | 4.42 | (3.28) | 6.66 | 3.32 | (7.59) | 3.60 |
| Distributions from net investment income | (.39) | (.59) | (.45) | (.42) | (.50) | (.03) |
| Distributions from net realized gain | (2.63) | (.49) | (.19) | (.06) | (7.22) | (.32) |
| Total distributions | (3.02) | (1.08) | (.64) | (.48) | (7.72) | (.35) |
| Redemption fees added to paid in capitalA | – | –B | –B | –B | –B | –B |
| Net asset value, end of period | $51.15 | $49.75 | $54.11 | $48.09 | $45.25 | $60.56 |
| Total ReturnC,D,E | 9.62% | (6.19)% | 13.98% | 7.45% | (14.32)% | 6.32% |
| Ratios to Average Net AssetsF,G | | | | | | |
| Expenses before reductions | 1.18%H | 1.21% | 1.34% | 1.48% | 1.43% | 1.29% |
| Expenses net of fee waivers, if any | 1.17%H | 1.21% | 1.34% | 1.48% | 1.43% | 1.29% |
| Expenses net of all reductions | 1.17%H | 1.20% | 1.34% | 1.48% | 1.43% | 1.29% |
| Net investment income (loss) | 1.30%H | 1.13% | .98% | 1.06% | .90% | .79% |
| Supplemental Data | | | | | | |
| Net assets, end of period (000 omitted) | $31,232 | $29,420 | $37,557 | $44,144 | $58,286 | $95,004 |
| Portfolio turnover rateI | 8%H | 29% | 26% | 44% | 24% | 85% |
A Calculated based on average shares outstanding during the period.
B Amount represents less than $.005 per share.
C Total returns for periods of less than one year are not annualized.
D Total returns would have been lower if certain expenses had not been reduced during the applicable periods shown.
E Total returns do not include the effect of the sales charges.
F Fees and expenses of any underlying Fidelity Central Funds are not included in the Fund's expense ratio. The Fund indirectly bears its proportionate share of the expenses of any underlying Fidelity Central Funds.
G Expense ratios reflect operating expenses of the class. Expenses before reductions do not reflect amounts reimbursed by the investment adviser or reductions from brokerage service arrangements or reductions from other expense offset arrangements and do not represent the amount paid by the class during periods when reimbursements or reductions occur. Expenses net of fee waivers reflect expenses after reimbursement by the investment adviser but prior to reductions from brokerage service arrangements or other expense offset arrangements. Expenses net of all reductions represent the net expenses paid by the class.
H Annualized
I Amount does not include the portfolio activity of any underlying Fidelity Central Funds.
See accompanying notes which are an integral part of the financial statements.
Fidelity Canada Fund Class M
| | Six months ended (Unaudited) April 30, | Years endedOctober 31, | | | | |
| | 2019 | 2018 | 2017 | 2016 | 2015 | 2014 |
| Selected Per–Share Data | | | | | | |
| Net asset value, beginning of period | $49.46 | $53.77 | $47.82 | $44.99 | $60.22 | $57.14 |
| Income from Investment Operations | | | | | | |
| Net investment income (loss)A | .24 | .44 | .35 | .35 | .29 | .29 |
| Net realized and unrealized gain (loss) | 4.09 | (3.86) | 6.13 | 2.83 | (8.00) | 3.11 |
| Total from investment operations | 4.33 | (3.42) | 6.48 | 3.18 | (7.71) | 3.40 |
| Distributions from net investment income | (.22) | (.40) | (.34) | (.29) | (.30) | – |
| Distributions from net realized gain | (2.63) | (.49) | (.19) | (.06) | (7.22) | (.32) |
| Total distributions | (2.85) | (.89) | (.53) | (.35) | (7.52) | (.32) |
| Redemption fees added to paid in capitalA | – | –B | –B | –B | –B | –B |
| Net asset value, end of period | $50.94 | $49.46 | $53.77 | $47.82 | $44.99 | $60.22 |
| Total ReturnC,D,E | 9.45% | (6.47)% | 13.64% | 7.14% | (14.58)% | 5.99% |
| Ratios to Average Net AssetsF,G | | | | | | |
| Expenses before reductions | 1.46%H | 1.51% | 1.63% | 1.77% | 1.75% | 1.59% |
| Expenses net of fee waivers, if any | 1.46%H | 1.51% | 1.63% | 1.77% | 1.75% | 1.59% |
| Expenses net of all reductions | 1.45%H | 1.51% | 1.63% | 1.77% | 1.75% | 1.59% |
| Net investment income (loss) | 1.01%H | .83% | .69% | .78% | .58% | .48% |
| Supplemental Data | | | | | | |
| Net assets, end of period (000 omitted) | $8,099 | $7,844 | $10,356 | $11,140 | $12,820 | $21,989 |
| Portfolio turnover rateI | 8%H | 29% | 26% | 44% | 24% | 85% |
A Calculated based on average shares outstanding during the period.
B Amount represents less than $.005 per share.
C Total returns for periods of less than one year are not annualized.
D Total returns would have been lower if certain expenses had not been reduced during the applicable periods shown.
E Total returns do not include the effect of the sales charges.
F Fees and expenses of any underlying Fidelity Central Funds are not included in the Fund's expense ratio. The Fund indirectly bears its proportionate share of the expenses of any underlying Fidelity Central Funds.
G Expense ratios reflect operating expenses of the class. Expenses before reductions do not reflect amounts reimbursed by the investment adviser or reductions from brokerage service arrangements or reductions from other expense offset arrangements and do not represent the amount paid by the class during periods when reimbursements or reductions occur. Expenses net of fee waivers reflect expenses after reimbursement by the investment adviser but prior to reductions from brokerage service arrangements or other expense offset arrangements. Expenses net of all reductions represent the net expenses paid by the class.
H Annualized
I Amount does not include the portfolio activity of any underlying Fidelity Central Funds.
See accompanying notes which are an integral part of the financial statements.
Fidelity Canada Fund Class C
| | Six months ended (Unaudited) April 30, | Years endedOctober 31, | | | | |
| | 2019 | 2018 | 2017 | 2016 | 2015 | 2014 |
| Selected Per–Share Data | | | | | | |
| Net asset value, beginning of period | $48.48 | $52.72 | $46.87 | $44.02 | $59.04 | $56.27 |
| Income from Investment Operations | | | | | | |
| Net investment income (loss)A | .14 | .21 | .13 | .15 | .07 | .02 |
| Net realized and unrealized gain (loss) | 4.02 | (3.78) | 6.01 | 2.78 | (7.85) | 3.07 |
| Total from investment operations | 4.16 | (3.57) | 6.14 | 2.93 | (7.78) | 3.09 |
| Distributions from net investment income | – | (.18) | (.11) | (.02) | (.02) | – |
| Distributions from net realized gain | (2.63) | (.49) | (.19) | (.06) | (7.22) | (.32) |
| Total distributions | (2.63) | (.67) | (.29)B | (.08) | (7.24) | (.32) |
| Redemption fees added to paid in capitalA | – | –C | –C | –C | –C | –C |
| Net asset value, end of period | $50.01 | $48.48 | $52.72 | $46.87 | $44.02 | $59.04 |
| Total ReturnD,E,F | 9.22% | (6.85)% | 13.16% | 6.67% | (14.96)% | 5.53% |
| Ratios to Average Net AssetsG,H | | | | | | |
| Expenses before reductions | 1.89%I | 1.94% | 2.06% | 2.21% | 2.19% | 2.03% |
| Expenses net of fee waivers, if any | 1.89%I | 1.93% | 2.06% | 2.21% | 2.19% | 2.03% |
| Expenses net of all reductions | 1.88%I | 1.93% | 2.06% | 2.21% | 2.18% | 2.03% |
| Net investment income (loss) | .58%I | .40% | .26% | .33% | .14% | .04% |
| Supplemental Data | | | | | | |
| Net assets, end of period (000 omitted) | $8,120 | $11,196 | $15,938 | $18,489 | $21,610 | $38,749 |
| Portfolio turnover rateJ | 8%I | 29% | 26% | 44% | 24% | 85% |
A Calculated based on average shares outstanding during the period.
B Total distributions of $.29 per share is comprised of distributions from net investment income of $.105 and distributions from net realized gain of $.188 per share.
C Amount represents less than $.005 per share.
D Total returns for periods of less than one year are not annualized.
E Total returns would have been lower if certain expenses had not been reduced during the applicable periods shown.
F Total returns do not include the effect of the contingent deferred sales charge.
G Fees and expenses of any underlying Fidelity Central Funds are not included in the Fund's expense ratio. The Fund indirectly bears its proportionate share of the expenses of any underlying Fidelity Central Funds.
H Expense ratios reflect operating expenses of the class. Expenses before reductions do not reflect amounts reimbursed by the investment adviser or reductions from brokerage service arrangements or reductions from other expense offset arrangements and do not represent the amount paid by the class during periods when reimbursements or reductions occur. Expenses net of fee waivers reflect expenses after reimbursement by the investment adviser but prior to reductions from brokerage service arrangements or other expense offset arrangements. Expenses net of all reductions represent the net expenses paid by the class.
I Annualized
J Amount does not include the portfolio activity of any underlying Fidelity Central Funds.
See accompanying notes which are an integral part of the financial statements.
Fidelity Canada Fund
| | Six months ended (Unaudited) April 30, | Years endedOctober 31, | | | | |
| | 2019 | 2018 | 2017 | 2016 | 2015 | 2014 |
| Selected Per–Share Data | | | | | | |
| Net asset value, beginning of period | $50.02 | $54.41 | $48.35 | $45.55 | $60.95 | $57.72 |
| Income from Investment Operations | | | | | | |
| Net investment income (loss)A | .39 | .77 | .66 | .62 | .60 | .66 |
| Net realized and unrealized gain (loss) | 4.12 | (3.90) | 6.20 | 2.85 | (8.09) | 3.13 |
| Total from investment operations | 4.51 | (3.13) | 6.86 | 3.47 | (7.49) | 3.79 |
| Distributions from net investment income | (.58) | (.77) | (.61) | (.61) | (.69) | (.24) |
| Distributions from net realized gain | (2.63) | (.49) | (.19) | (.06) | (7.22) | (.32) |
| Total distributions | (3.21) | (1.26) | (.80) | (.67) | (7.91) | (.56) |
| Redemption fees added to paid in capitalA | – | –B | –B | –B | –B | –B |
| Net asset value, end of period | $51.32 | $50.02 | $54.41 | $48.35 | $45.55 | $60.95 |
| Total ReturnC,D | 9.80% | (5.89)% | 14.35% | 7.79% | (14.08)% | 6.64% |
| Ratios to Average Net AssetsE,F | | | | | | |
| Expenses before reductions | .86%G | .89% | 1.02% | 1.17% | 1.15% | .98% |
| Expenses net of fee waivers, if any | .85%G | .89% | 1.02% | 1.17% | 1.15% | .98% |
| Expenses net of all reductions | .85%G | .88% | 1.02% | 1.17% | 1.14% | .98% |
| Net investment income (loss) | 1.62%G | 1.45% | 1.30% | 1.37% | 1.18% | 1.09% |
| Supplemental Data | | | | | | |
| Net assets, end of period (000 omitted) | $926,230 | $903,662 | $1,130,803 | $1,233,050 | $1,279,488 | $2,057,843 |
| Portfolio turnover rateH | 8%G | 29% | 26% | 44% | 24% | 85% |
A Calculated based on average shares outstanding during the period.
B Amount represents less than $.005 per share.
C Total returns for periods of less than one year are not annualized.
D Total returns would have been lower if certain expenses had not been reduced during the applicable periods shown.
E Fees and expenses of any underlying Fidelity Central Funds are not included in the Fund's expense ratio. The Fund indirectly bears its proportionate share of the expenses of any underlying Fidelity Central Funds.
F Expense ratios reflect operating expenses of the class. Expenses before reductions do not reflect amounts reimbursed by the investment adviser or reductions from brokerage service arrangements or reductions from other expense offset arrangements and do not represent the amount paid by the class during periods when reimbursements or reductions occur. Expenses net of fee waivers reflect expenses after reimbursement by the investment adviser but prior to reductions from brokerage service arrangements or other expense offset arrangements. Expenses net of all reductions represent the net expenses paid by the class.
G Annualized
H Amount does not include the portfolio activity of any underlying Fidelity Central Funds.
See accompanying notes which are an integral part of the financial statements.
Fidelity Canada Fund Class I
| | Six months ended (Unaudited) April 30, | Years endedOctober 31, | | | | |
| | 2019 | 2018 | 2017 | 2016 | 2015 | 2014 |
| Selected Per–Share Data | | | | | | |
| Net asset value, beginning of period | $49.93 | $54.29 | $48.28 | $45.44 | $60.80 | $57.57 |
| Income from Investment Operations | | | | | | |
| Net investment income (loss)A | .41 | .79 | .67 | .66 | .61 | .65 |
| Net realized and unrealized gain (loss) | 4.10 | (3.90) | 6.19 | 2.83 | (8.07) | 3.12 |
| Total from investment operations | 4.51 | (3.11) | 6.86 | 3.49 | (7.46) | 3.77 |
| Distributions from net investment income | (.59) | (.77) | (.66) | (.59) | (.68) | (.22) |
| Distributions from net realized gain | (2.63) | (.49) | (.19) | (.06) | (7.22) | (.32) |
| Total distributions | (3.22) | (1.25)B | (.85) | (.65) | (7.90) | (.54) |
| Redemption fees added to paid in capitalA | – | –C | –C | –C | –C | –C |
| Net asset value, end of period | $51.22 | $49.93 | $54.29 | $48.28 | $45.44 | $60.80 |
| Total ReturnD,E | 9.83% | (5.86)% | 14.38% | 7.83% | (14.05)% | 6.62% |
| Ratios to Average Net AssetsF,G | | | | | | |
| Expenses before reductions | .80%H | .86% | 1.00% | 1.14% | 1.13% | 1.00% |
| Expenses net of fee waivers, if any | .80%H | .85% | .99% | 1.13% | 1.12% | 1.00% |
| Expenses net of all reductions | .79%H | .85% | .99% | 1.13% | 1.12% | 1.00% |
| Net investment income (loss) | 1.67%H | 1.49% | 1.33% | 1.41% | 1.21% | 1.08% |
| Supplemental Data | | | | | | |
| Net assets, end of period (000 omitted) | $50,907 | $26,923 | $30,581 | $41,217 | $14,846 | $30,165 |
| Portfolio turnover rateI | 8%H | 29% | 26% | 44% | 24% | 85% |
A Calculated based on average shares outstanding during the period.
B Total distributions of $1.25 per share is comprised of distributions from net investment income of $.765 and distributions from net realized gain of $.487 per share.
C Amount represents less than $.005 per share.
D Total returns for periods of less than one year are not annualized.
E Total returns would have been lower if certain expenses had not been reduced during the applicable periods shown.
F Fees and expenses of any underlying Fidelity Central Funds are not included in the Fund's expense ratio. The Fund indirectly bears its proportionate share of the expenses of any underlying Fidelity Central Funds.
G Expense ratios reflect operating expenses of the class. Expenses before reductions do not reflect amounts reimbursed by the investment adviser or reductions from brokerage service arrangements or reductions from other expense offset arrangements and do not represent the amount paid by the class during periods when reimbursements or reductions occur. Expenses net of fee waivers reflect expenses after reimbursement by the investment adviser but prior to reductions from brokerage service arrangements or other expense offset arrangements. Expenses net of all reductions represent the net expenses paid by the class.
H Annualized
I Amount does not include the portfolio activity of any underlying Fidelity Central Funds.
See accompanying notes which are an integral part of the financial statements.
Fidelity Canada Fund Class Z
| | Six months ended (Unaudited) April 30, | Year endedOctober 31, |
| | 2019 | 2018 A |
| Selected Per–Share Data | | |
| Net asset value, beginning of period | $49.94 | $53.92 |
| Income from Investment Operations | | |
| Net investment income (loss)B | .43 | .06 |
| Net realized and unrealized gain (loss) | 4.09 | (4.04) |
| Total from investment operations | 4.52 | (3.98) |
| Distributions from net investment income | (.69) | – |
| Distributions from net realized gain | (2.63) | – |
| Total distributions | (3.32) | – |
| Net asset value, end of period | $51.14 | $49.94 |
| Total ReturnC,D | 9.87% | (7.38)% |
| Ratios to Average Net AssetsE,F | | |
| Expenses before reductions | .69%G | .80%G |
| Expenses net of fee waivers, if any | .69%G | .80%G |
| Expenses net of all reductions | .69%G | .79%G |
| Net investment income (loss) | 1.78%G | 1.48%G |
| Supplemental Data | | |
| Net assets, end of period (000 omitted) | $274 | $128 |
| Portfolio turnover rateH | 8%G | 29% |
A For the period October 2, 2018 (commencement of sale of shares) to October 31, 2018.
B Calculated based on average shares outstanding during the period.
C Total returns for periods of less than one year are not annualized.
D Total returns would have been lower if certain expenses had not been reduced during the applicable periods shown.
E Fees and expenses of any underlying Fidelity Central Funds are not included in the Fund's expense ratio. The Fund indirectly bears its proportionate share of the expenses of any underlying Fidelity Central Funds.
F Expense ratios reflect operating expenses of the class. Expenses before reductions do not reflect amounts reimbursed by the investment adviser or reductions from brokerage service arrangements or reductions from other expense offset arrangements and do not represent the amount paid by the class during periods when reimbursements or reductions occur. Expense ratios before reductions for start-up periods may not be representative of longer-term operating periods. Expenses net of fee waivers reflect expenses after reimbursement by the investment adviser but prior to reductions from brokerage service arrangements or other expense offset arrangements. Expenses net of all reductions represent the net expenses paid by the class.
G Annualized
H Amount does not include the portfolio activity of any underlying Fidelity Central Funds.
See accompanying notes which are an integral part of the financial statements.
Notes to Financial Statements (Unaudited)
For the period ended April 30, 2019
1. Organization.
Fidelity Canada Fund (the Fund) is a fund of Fidelity Investment Trust (the Trust) and is authorized to issue an unlimited number of shares. The Trust is registered under the Investment Company Act of 1940, as amended (the 1940 Act), as an open-end management investment company organized as a Massachusetts business trust. The Fund offers Class A, Class M, Class C, Canada, Class I and Class Z shares, each of which has equal rights as to assets and voting privileges. Each class has exclusive voting rights with respect to matters that affect that class. Effective March 1, 2019, Class C shares will automatically convert to Class A shares after a holding period of ten years from the initial date of purchase, with certain exceptions.
2. Investments in Fidelity Central Funds.
The Fund invests in Fidelity Central Funds, which are open-end investment companies generally available only to other investment companies and accounts managed by the investment adviser and its affiliates. The Fund's Schedule of Investments lists each of the Fidelity Central Funds held as of period end, if any, as an investment of the Fund, but does not include the underlying holdings of each Fidelity Central Fund. As an Investing Fund, the Fund indirectly bears its proportionate share of the expenses of the underlying Fidelity Central Funds.
The Money Market Central Funds seek preservation of capital and current income and are managed by Fidelity Investments Money Management, Inc. (FIMM), an affiliate of the investment adviser. Annualized expenses of the Money Market Central Funds as of their most recent shareholder report date are less than .005%.
A complete unaudited list of holdings for each Fidelity Central Fund is available upon request or at the Securities and Exchange Commission (the SEC) website at www.sec.gov. In addition, the financial statements of the Fidelity Central Funds are available on the SEC website or upon request.
3. Significant Accounting Policies.
The Fund is an investment company and applies the accounting and reporting guidance of the Financial Accounting Standards Board (FASB) Accounting Standards Codification Topic 946 Financial Services – Investments Companies. The financial statements have been prepared in conformity with accounting principles generally accepted in the United States of America (GAAP), which require management to make certain estimates and assumptions at the date of the financial statements. Actual results could differ from those estimates. Subsequent events, if any, through the date that the financial statements were issued have been evaluated in the preparation of the financial statements. The following summarizes the significant accounting policies of the Fund:
Investment Valuation. Investments are valued as of 4:00 p.m. Eastern time on the last calendar day of the period. The Board of Trustees (the Board) has delegated the day to day responsibility for the valuation of the Fund's investments to the Fair Value Committee (the Committee) established by the Fund's investment adviser. In accordance with valuation policies and procedures approved by the Board, the Fund attempts to obtain prices from one or more third party pricing vendors or brokers to value its investments. When current market prices, quotations or currency exchange rates are not readily available or reliable, investments will be fair valued in good faith by the Committee, in accordance with procedures adopted by the Board. Factors used in determining fair value vary by investment type and may include market or investment specific events. The frequency with which these procedures are used cannot be predicted and they may be utilized to a significant extent. The Committee oversees the Fund's valuation policies and procedures and reports to the Board on the Committee's activities and fair value determinations. The Board monitors the appropriateness of the procedures used in valuing the Fund's investments and ratifies the fair value determinations of the Committee.
The Fund categorizes the inputs to valuation techniques used to value its investments into a disclosure hierarchy consisting of three levels as shown below:
- Level 1 – quoted prices in active markets for identical investments
- Level 2 – other significant observable inputs (including quoted prices for similar investments, interest rates, prepayment speeds, etc.)
- Level 3 – unobservable inputs (including the Fund's own assumptions based on the best information available)
Valuation techniques used to value the Fund's investments by major category are as follows:
Equity securities, including restricted securities, for which market quotations are readily available, are valued at the last reported sale price or official closing price as reported by a third party pricing vendor on the primary market or exchange on which they are traded and are categorized as Level 1 in the hierarchy. In the event there were no sales during the day or closing prices are not available, securities are valued at the last quoted bid price or may be valued using the last available price and are generally categorized as Level 2 in the hierarchy. For foreign equity securities, when market or security specific events arise, comparisons to the valuation of American Depositary Receipts (ADRs), futures contracts, Exchange-Traded Funds (ETFs) and certain indexes as well as quoted prices for similar securities may be used and would be categorized as Level 2 in the hierarchy. For equity securities, including restricted securities, where observable inputs are limited, assumptions about market activity and risk are used and these securities may be categorized as Level 3 in the hierarchy.
Investments in open-end mutual funds, including the Fidelity Central Funds, are valued at their closing net asset value (NAV) each business day and are categorized as Level 1 in the hierarchy.
Changes in valuation techniques may result in transfers in or out of an assigned level within the disclosure hierarchy.
Foreign Currency. The Fund may use foreign currency contracts to facilitate transactions in foreign-denominated securities. Gains and losses from these transactions may arise from changes in the value of the foreign currency or if the counterparties do not perform under the contracts' terms.
Foreign-denominated assets, including investment securities, and liabilities are translated into U.S. dollars at the exchange rates at period end. Purchases and sales of investment securities, income and dividends received and expenses denominated in foreign currencies are translated into U.S. dollars at the exchange rate in effect on the transaction date.
The effects of exchange rate fluctuations on investments are included with the net realized and unrealized gain (loss) on investment securities. Other foreign currency transactions resulting in realized and unrealized gain (loss) are disclosed separately.
Investment Transactions and Income. For financial reporting purposes, the Fund's investment holdings and NAV include trades executed through the end of the last business day of the period. The NAV per share for processing shareholder transactions is calculated as of the close of business of the New York Stock Exchange (NYSE), normally 4:00 p.m. Eastern time and includes trades executed through the end of the prior business day. Gains and losses on securities sold are determined on the basis of identified cost and include proceeds received from litigation. Dividend income is recorded on the ex-dividend date, except for certain dividends from foreign securities where the ex-dividend date may have passed, which are recorded as soon as the Fund is informed of the ex-dividend date. Non-cash dividends included in dividend income, if any, are recorded at the fair market value of the securities received. Income and capital gain distributions from Fidelity Central Funds, if any, are recorded on the ex-dividend date. Certain distributions received by the Fund represent a return of capital or capital gain. The Fund determines the components of these distributions subsequent to the ex-dividend date, based upon receipt of tax filings or other correspondence relating to the underlying investment. These distributions are recorded as a reduction of cost of investments and/or as a realized gain. Investment income is recorded net of foreign taxes withheld where recovery of such taxes is uncertain.
Class Allocations and Expenses. Investment income, realized and unrealized capital gains and losses, common expenses of the Fund, and certain fund-level expense reductions, if any, are allocated daily on a pro-rata basis to each class based on the relative net assets of each class to the total net assets of the Fund. Each class differs with respect to transfer agent and distribution and service plan fees incurred. Certain expense reductions may also differ by class. For the reporting period, the allocated portion of income and expenses to each class as a percent of its average net assets may vary due to the timing of recording these transactions in relation to fluctuating net assets of the classes. Expenses directly attributable to a fund are charged to that fund. Expenses attributable to more than one fund are allocated among the respective funds on the basis of relative net assets or other appropriate methods. Expense estimates are accrued in the period to which they relate and adjustments are made when actual amounts are known.
Income Tax Information and Distributions to Shareholders. Each year, the Fund intends to qualify as a regulated investment company under Subchapter M of the Internal Revenue Code, including distributing substantially all of its taxable income and realized gains. As a result, no provision for U.S. Federal income taxes is required. The Fund files a U.S. federal tax return, in addition to state and local tax returns as required. The Fund's federal income tax returns are subject to examination by the Internal Revenue Service (IRS) for a period of three fiscal years after they are filed. State and local tax returns may be subject to examination for an additional fiscal year depending on the jurisdiction. Foreign taxes are provided for based on the Fund's understanding of the tax rules and rates that exist in the foreign markets in which it invests.
Distributions are declared and recorded on the ex-dividend date. Income and capital gain distributions are declared separately for each class. Income and capital gain distributions are determined in accordance with income tax regulations, which may differ from GAAP.
Capital accounts within the financial statements are adjusted for permanent book-tax differences. These adjustments have no impact on net assets or the results of operations. Capital accounts are not adjusted for temporary book-tax differences which will reverse in a subsequent period.
Book-tax differences are primarily due to foreign currency transactions, passive foreign investment companies (PFIC), deferred trustees compensation and losses deferred due to wash sales.
As of period end, the cost and unrealized appreciation (depreciation) in securities, and derivatives if applicable, for federal income tax purposes were as follows:
| Gross unrealized appreciation | $321,421,724 |
| Gross unrealized depreciation | (36,869,856) |
| Net unrealized appreciation (depreciation) | $284,551,868 |
| Tax cost | $835,694,155 |
Restricted Securities. The Fund may invest in securities that are subject to legal or contractual restrictions on resale. These securities generally may be resold in transactions exempt from registration or to the public if the securities are registered. Disposal of these securities may involve time-consuming negotiations and expense, and prompt sale at an acceptable price may be difficult. Information regarding restricted securities is included at the end of the Fund's Schedule of Investments.
4. Purchases and Sales of Investments.
Purchases and sales of securities, other than short-term securities, aggregated $37,881,230 and $83,193,004, respectively.
5. Fees and Other Transactions with Affiliates.
Management Fee. Fidelity Management & Research Company (the investment adviser) and its affiliates provide the Fund with investment management related services for which the Fund pays a monthly management fee. The management fee is the sum of an individual fund fee rate that is based on an annual rate of .45% of the Fund's average net assets and an annualized group fee rate that averaged .24% during the period. The group fee rate is based upon the average net assets of all the mutual funds advised by the investment adviser, including any mutual funds previously advised by the investment adviser that are currently advised by Fidelity SelectCo, LLC, an affiliate of the investment adviser. The group fee rate decreases as assets under management increase and increases as assets under management decrease. In addition, the management fee is subject to a performance adjustment (up to a maximum of +/- .20% of the Fund's average net assets over a 36 month performance period). The upward or downward adjustment to the management fee is based on the relative investment performance of Canada as compared to its benchmark index, the S&P/TSX Composite Index, over the same 36 month performance period. For the reporting period, the total annualized management fee rate, including the performance adjustment, was .57% of the Fund's average net assets. The performance adjustment included in the management fee rate may be higher or lower than the maximum performance adjustment rate due to the difference between the average net assets for the reporting and performance periods.
Distribution and Service Plan Fees. In accordance with Rule 12b-1 of the 1940 Act, the Fund has adopted separate Distribution and Service Plans for each class of shares. Certain classes pay Fidelity Distributors Corporation (FDC), an affiliate of the investment adviser, separate Distribution and Service Fees, each of which is based on an annual percentage of each class' average net assets. In addition, FDC may pay financial intermediaries for selling shares of the Fund and providing shareholder support services. For the period, the Distribution and Service Fee rates, total fees and amounts retained by FDC were as follows:
| | Distribution Fee | Service Fee | Total Fees | Retained by FDC |
| Class A | -% | .25% | $35,949 | $548 |
| Class M | .25% | .25% | 19,344 | 260 |
| Class C | .75% | .25% | 50,079 | 2,076 |
| | | | $105,372 | $2,884 |
Sales Load. FDC may receive a front-end sales charge of up to 5.75% for selling Class A shares and 3.50% for selling Class M shares, some of which is paid to financial intermediaries for selling shares of the Fund. Depending on the holding period, FDC may receive contingent deferred sales charges levied on Class A, Class M and Class C redemptions. The deferred sales charges are 1.00% for Class C shares, 1.00% for certain purchases of Class A shares and .25% for certain purchases of Class M shares.
For the period, sales charge amounts retained by FDC were as follows:
| | Retained by FDC |
| Class A | $1,312 |
| Class M | 649 |
| Class C(a) | 202 |
| | $2,163 |
(a) When Class C shares are initially sold, FDC pays commissions from its own resources to financial intermediaries through which the sales are made.
Transfer Agent Fees. Fidelity Investments Institutional Operations Company, Inc., (FIIOC), an affiliate of the investment adviser, is the transfer, dividend disbursing and shareholder servicing agent for each class of the Fund. FIIOC receives account fees and asset-based fees that vary according to the account size and type of account of the shareholders of the respective classes of the Fund, except for Class Z. FIIOC receives an asset-based fee of Class Z's average net assets. FIIOC pays for typesetting, printing and mailing of shareholder reports, except proxy statements.
For the period, transfer agent fees for each class were as follows:
| | Amount | % of Class-Level Average Net Assets(a) |
| Class A | $40,251 | .28 |
| Class M | 12,175 | .31 |
| Class C | 12,065 | .24 |
| Canada | 934,329 | .21 |
| Class I | 29,595 | .15 |
| Class Z | 48 | .05 |
| | $1,028,463 | |
(a) Annualized
Accounting and Security Lending Fees. Fidelity Service Company, Inc. (FSC), an affiliate of the investment adviser, maintains the Fund's accounting records. The accounting fee is based on the level of average net assets for each month. Prior to April 1, 2019, FSC had a separate agreement with the Fund for administration of the security lending program, based on the number and duration of lending transactions. For the period, the total fees paid for accounting and administration of securities lending were equivalent to an annualized rate of .05%.
Interfund Trades. The Fund may purchase from or sell securities to other Fidelity Funds under procedures adopted by the Board. The procedures have been designed to ensure these interfund trades are executed in accordance with Rule 17a-7 of the 1940 Act. Interfund trades are included within the respective purchases and sales amounts shown in the Purchases and Sales of Investments note.
6. Committed Line of Credit.
The Fund participates with other funds managed by the investment adviser or an affiliate in a $4.25 billion credit facility (the "line of credit") to be utilized for temporary or emergency purposes to fund shareholder redemptions or for other short-term liquidity purposes. The Fund has agreed to pay commitment fees on its pro-rata portion of the line of credit, which amounted to $1,404 and is reflected in Miscellaneous expenses on the Statement of Operations. During the period, the Fund did not borrow on this line of credit.
7. Security Lending.
The Fund lends portfolio securities through a lending agent from time to time in order to earn additional income. For equity securities, a lending agent is used and may loan securities to certain qualified borrowers, including Fidelity Capital Markets (FCM), a broker-dealer affiliated with the Fund. On the settlement date of the loan, the Fund receives collateral (in the form of U.S. Treasury obligations, letters of credit and/or cash) against the loaned securities and maintains collateral in an amount not less than 100% of the market value of the loaned securities during the period of the loan. The market value of the loaned securities is determined at the close of business of the Fund and any additional required collateral is delivered to the Fund on the next business day. The Fund or borrower may terminate the loan at any time, and if the borrower defaults on its obligation to return the securities loaned because of insolvency or other reasons, the Fund may apply collateral received from the borrower against the obligation. The Fund may experience delays and costs in recovering the securities loaned. Any cash collateral received is invested in the Fidelity Securities Lending Cash Central Fund. The value of loaned securities and cash collateral at period end are disclosed on the Fund's Statement of Assets and Liabilities. Security lending income represents the income earned on investing cash collateral, less rebates paid to borrowers and any lending agent fees associated with the loan, plus any premium payments received for lending certain types of securities. Security lending income is presented in the Statement of Operations as a component of income from Fidelity Central Funds. Total security lending income during the period amounted to $176,989. During the period, there were no securities loaned to FCM.
8. Expense Reductions.
Commissions paid to certain brokers with whom the investment adviser, or its affiliates, places trades on behalf of the Fund include an amount in addition to trade execution, which may be rebated back to the Fund to offset certain expenses. This amount totaled $20,384 for the period. In addition, through arrangements with the Fund's custodian, credits realized as a result of certain uninvested cash balances were used to reduce the Fund's expenses. During the period, these credits reduced the Fund's custody expenses by $61. During the period, credits reduced each class' transfer agent expense as noted in the table below.
| | Transfer Agent expense reduction |
| Canada | $363 |
In addition, during the period the investment adviser reimbursed and/or waived a portion of fund-level operating expenses in the amount of $3,654 and a portion of class-level operating expenses as follows:
| | Amount |
| Class A | $458 |
| Class M | 128 |
| Class C | 168 |
| Canada | 14,543 |
| Class I | 700 |
| Class Z | 4 |
| | $16,001 |
9. Distributions to Shareholders.
Distributions to shareholders of each class were as follows:
| | Six months ended
April 30, 2019 | Year ended
October 31, 2018(a) |
| Distributions to shareholders | | |
| Class A | $1,725,249 | $734,732 |
| Class M | 438,995 | 166,749 |
| Class C | 599,233 | 198,725 |
| Canada | 57,337,031 | 25,679,409 |
| Class I | 1,761,950 | 697,136 |
| Class Z | 13,541 | – |
| Total | $61,875,999 | $27,476,751 |
(a) Distributions for Class Z are for the period October 2, 2018 (commencement of sale of shares) to October 31, 2018.
10. Share Transactions.
Share transactions for each class were as follows and may contain automatic conversions between classes or exchanges between affiliated funds:
| | Shares | Shares | Dollars | Dollars |
| | Six months ended April 30, 2019 | Year ended October 31, 2018(a) | Six months ended April 30, 2019 | Year ended October 31, 2018(a) |
| Class A | | | | |
| Shares sold | 60,489 | 46,971 | $2,973,794 | $2,500,808 |
| Reinvestment of distributions | 34,965 | 12,714 | 1,594,742 | 672,936 |
| Shares redeemed | (76,146) | (162,467) | (3,688,944) | (8,569,248) |
| Net increase (decrease) | 19,308 | (102,782) | $879,592 | $(5,395,504) |
| Class M | | | | |
| Shares sold | 5,251 | 8,442 | $253,295 | $442,723 |
| Reinvestment of distributions | 9,616 | 3,154 | 437,340 | 166,353 |
| Shares redeemed | (14,467) | (45,613) | (703,835) | (2,414,584) |
| Net increase (decrease) | 400 | (34,017) | $(13,200) | $(1,805,508) |
| Class C | | | | |
| Shares sold | 3,770 | 9,399 | $178,815 | $481,011 |
| Reinvestment of distributions | 12,492 | 3,474 | 558,623 | 180,309 |
| Shares redeemed | (84,837) | (84,247) | (4,025,632) | (4,355,073) |
| Net increase (decrease) | (68,575) | (71,374) | $(3,288,194) | $(3,693,753) |
| Canada | | | | |
| Shares sold | 480,135 | 711,176 | $23,237,820 | $37,797,009 |
| Reinvestment of distributions | 1,185,764 | 457,772 | 54,201,287 | 24,289,363 |
| Shares redeemed | (1,682,275) | (3,887,975) | (81,158,623) | (207,409,511) |
| Net increase (decrease) | (16,376) | (2,719,027) | $(3,719,516) | $(145,323,139) |
| Class I | | | | |
| Shares sold | 535,682 | 160,132 | $24,498,105 | $8,478,569 |
| Reinvestment of distributions | 37,998 | 12,538 | 1,732,719 | 663,882 |
| Shares redeemed | (118,878) | (196,779) | (5,636,737) | (10,381,577) |
| Net increase (decrease) | 454,802 | (24,109) | $20,594,087 | $(1,239,126) |
| Class Z | | | | |
| Shares sold | 3,167 | 2,572 | $158,158 | $135,809 |
| Reinvestment of distributions | 266 | – | 12,119 | – |
| Shares redeemed | (653) | – | (32,139) | – |
| Net increase (decrease) | 2,780 | 2,572 | $138,138 | $135,809 |
(a) Share transactions for Class Z are for the period October 2, 2018 (commencement of sale of shares) to October 31, 2018.
11. Other.
The Fund's organizational documents provide former and current trustees and officers with a limited indemnification against liabilities arising in connection with the performance of their duties to the Fund. In the normal course of business, the Fund may also enter into contracts that provide general indemnifications. The Fund's maximum exposure under these arrangements is unknown as this would be dependent on future claims that may be made against the Fund. The risk of material loss from such claims is considered remote.
Fidelity® China Region Fund
Investment Summary (Unaudited)
Geographic Diversification (% of fund's net assets)
| As of April 30, 2019 |
| | Cayman Islands | 42.4% |
| | China | 21.7% |
| | Taiwan | 12.5% |
| | Hong Kong | 12.1% |
| | Bermuda | 4.4% |
| | Austria | 1.3% |
| | Korea (South) | 1.2% |
| | Luxembourg | 1.0% |
| | United States of America* | 0.9% |
| | Other | 2.5% |
* Includes Short-Term investments and Net Other Assets (Liabilities).
Percentages are based on country or territory of incorporation and are adjusted for the effect of futures contracts, if applicable.
Asset Allocation as of April 30, 2019
| | % of fund's net assets |
| Stocks | 99.2 |
| Short-Term Investments and Net Other Assets (Liabilities) | 0.8 |
Top Ten Stocks as of April 30, 2019
| | % of fund's net assets |
| Tencent Holdings Ltd. (Interactive Media & Services) | 11.8 |
| Alibaba Group Holding Ltd. sponsored ADR (Internet & Direct Marketing Retail) | 9.8 |
| Taiwan Semiconductor Manufacturing Co. Ltd. (Semiconductors & Semiconductor Equipment) | 4.7 |
| AIA Group Ltd. (Insurance) | 4.7 |
| China Construction Bank Corp. (H Shares) (Banks) | 3.8 |
| Meituan Dianping Class B (Internet & Direct Marketing Retail) | 2.8 |
| Industrial & Commercial Bank of China Ltd. (H Shares) (Banks) | 2.6 |
| Ping An Insurance (Group) Co. of China Ltd. (H Shares) (Insurance) | 2.0 |
| China Unicom Ltd. (Diversified Telecommunication Services) | 1.9 |
| New Oriental Education & Technology Group, Inc. sponsored ADR (Diversified Consumer Services) | 1.8 |
| | 45.9 |
Top Market Sectors as of April 30, 2019
| | % of fund's net assets |
| Consumer Discretionary | 23.2 |
| Financials | 19.1 |
| Communication Services | 17.1 |
| Information Technology | 13.1 |
| Industrials | 6.4 |
| Real Estate | 5.3 |
| Materials | 4.9 |
| Health Care | 3.5 |
| Consumer Staples | 3.1 |
| Energy | 2.0 |
Market Sectors may include more than one industry category.
The Fund may invest up to 35% of its total assets in any industry that represents more than 20% of the Hong Kong, Taiwanese and Chinese markets. As of April 30, 2019, the Fund did not have more than 25% of its total assets invested in any one industry.
Fidelity® China Region Fund
Schedule of Investments April 30, 2019 (Unaudited)
Showing Percentage of Net Assets
| Common Stocks - 99.2% | | | |
| | | Shares | Value |
| COMMUNICATION SERVICES - 17.1% | | | |
| Diversified Telecommunication Services - 1.9% | | | |
| China Unicom Ltd. | | 20,936,000 | $24,858,853 |
| Entertainment - 1.0% | | | |
| NetEase, Inc. ADR | | 44,400 | 12,633,132 |
| Interactive Media & Services - 13.9% | | | |
| 58.com, Inc. ADR (a) | | 45,000 | 3,230,550 |
| Bitauto Holdings Ltd. ADR (a)(b) | | 762,024 | 9,784,388 |
| Momo, Inc. ADR | | 396,700 | 13,912,269 |
| Tencent Holdings Ltd. | | 3,101,100 | 152,845,961 |
| | | | 179,773,168 |
| Wireless Telecommunication Services - 0.3% | | | |
| SmarTone Telecommunications Holdings Ltd. | | 3,208,000 | 3,340,985 |
|
| TOTAL COMMUNICATION SERVICES | | | 220,606,138 |
|
| CONSUMER DISCRETIONARY - 23.2% | | | |
| Automobiles - 1.3% | | | |
| BYD Co. Ltd. (A Shares) | | 788,097 | 6,658,261 |
| SAIC Motor Corp. Ltd. (A Shares) | | 2,454,735 | 9,979,457 |
| | | | 16,637,718 |
| Diversified Consumer Services - 3.0% | | | |
| New Oriental Education & Technology Group, Inc. sponsored ADR (a) | | 242,400 | 23,139,504 |
| TAL Education Group ADR (a) | | 407,200 | 15,664,984 |
| | | | 38,804,488 |
| Hotels, Restaurants & Leisure - 0.8% | | | |
| SJM Holdings Ltd. | | 8,979,000 | 10,839,171 |
| Household Durables - 0.5% | | | |
| Gree Electric Appliances, Inc. of Zhuhai (A Shares) | | 48 | 396 |
| Sundart Holdings Ltd. | | 13,258,000 | 6,388,339 |
| | | | 6,388,735 |
| Internet & Direct Marketing Retail - 16.6% | | | |
| Alibaba Group Holding Ltd. sponsored ADR (a) | | 680,800 | 126,336,056 |
| Baozun, Inc. sponsored ADR (a)(b) | | 142,400 | 6,906,400 |
| Ctrip.com International Ltd. ADR (a) | | 387,800 | 17,082,590 |
| JD.com, Inc. sponsored ADR (a) | | 526,737 | 15,944,329 |
| Meituan Dianping Class B | | 4,995,788 | 36,299,194 |
| Pinduoduo, Inc. ADR (b) | | 228,800 | 5,086,224 |
| Secoo Holding Ltd. ADR (a) | | 787,967 | 7,556,604 |
| | | | 215,211,397 |
| Textiles, Apparel & Luxury Goods - 1.0% | | | |
| Samsonite International SA (c) | | 4,429,500 | 12,704,435 |
|
| TOTAL CONSUMER DISCRETIONARY | | | 300,585,944 |
|
| CONSUMER STAPLES - 3.1% | | | |
| Food & Staples Retailing - 0.4% | | | |
| Dairy Farm International Holdings Ltd. | | 190,200 | 1,489,266 |
| President Chain Store Corp. | | 250,000 | 2,329,946 |
| Taiwan FamilyMart Co. Ltd. | | 159,000 | 1,137,111 |
| | | | 4,956,323 |
| Food Products - 2.7% | | | |
| Bunge Ltd. | | 251,800 | 13,196,838 |
| Inner Mongoli Yili Industries Co. Ltd. (A Shares) | | 4,440,146 | 20,437,501 |
| Unified-President Enterprises Corp. | | 617,000 | 1,465,530 |
| | | | 35,099,869 |
|
| TOTAL CONSUMER STAPLES | | | 40,056,192 |
|
| ENERGY - 2.0% | | | |
| Energy Equipment & Services - 1.7% | | | |
| China Oilfield Services Ltd. (H Shares) | | 17,392,000 | 18,622,884 |
| Yantai Jereh Oilfield Services (A Shares) | | 966,517 | 3,264,824 |
| | | | 21,887,708 |
| Oil, Gas & Consumable Fuels - 0.3% | | | |
| PetroChina Co. Ltd. (H Shares) | | 7,332,000 | 4,647,709 |
|
| TOTAL ENERGY | | | 26,535,417 |
|
| FINANCIALS - 19.1% | | | |
| Banks - 9.8% | | | |
| BOC Hong Kong (Holdings) Ltd. | | 3,422,000 | 15,311,060 |
| China Construction Bank Corp. (H Shares) | | 55,877,000 | 49,259,249 |
| Dah Sing Banking Group Ltd. | | 3,656,800 | 6,992,148 |
| Dah Sing Financial Holdings Ltd. | | 820,800 | 4,305,517 |
| E.SUN Financial Holdings Co. Ltd. | | 21,812,109 | 17,893,242 |
| Industrial & Commercial Bank of China Ltd. (H Shares) | | 44,569,000 | 33,463,111 |
| | | | 127,224,327 |
| Capital Markets - 0.6% | | | |
| China Petroleum Engineering Corp. ELS (UBS Bank Warrant Program) warrants 10/28/19 (a)(c) | | 7,356,276 | 4,729,495 |
| Value Partners Group Ltd. | | 3,137,000 | 2,359,308 |
| | | | 7,088,803 |
| Consumer Finance - 0.3% | | | |
| 360 Finance, Inc. ADR (b) | | 50,300 | 999,461 |
| LexinFintech Holdings Ltd. ADR (a) | | 169,800 | 2,190,420 |
| PPDAI Group, Inc. ADR | | 188,594 | 984,461 |
| | | | 4,174,342 |
| Insurance - 8.4% | | | |
| AIA Group Ltd. | | 5,920,200 | 60,619,507 |
| China Life Insurance Co. Ltd. (H Shares) | | 3,749,000 | 10,653,197 |
| China Pacific Insurance (Group) Co. Ltd. (H Shares) | | 1,333,000 | 5,462,975 |
| PICC Property & Casualty Co. Ltd. (H Shares) | | 5,067,000 | 5,690,428 |
| Ping An Insurance (Group) Co. of China Ltd. (H Shares) | | 2,113,000 | 25,577,158 |
| | | | 108,003,265 |
|
| TOTAL FINANCIALS | | | 246,490,737 |
|
| HEALTH CARE - 3.5% | | | |
| Biotechnology - 1.5% | | | |
| China Biologic Products Holdings, Inc. (a)(b) | | 131,852 | 13,219,482 |
| Jinyu Bio-Technology Co. Ltd. (A Shares) | | 2,750,303 | 6,566,522 |
| | | | 19,786,004 |
| Health Care Equipment & Supplies - 0.3% | | | |
| Shenzhen Mindray Bio-Medical Electronics Co. Ltd. (A Shares) (a) | | 167,315 | 3,498,886 |
| Pharmaceuticals - 1.7% | | | |
| CStone Pharmaceuticals Co. Ltd. (a)(c) | | 5,406,000 | 9,468,494 |
| Hutchison China Meditech Ltd. sponsored ADR (a) | | 51,262 | 1,541,961 |
| Tonghua Dongbao Pharmaceutical Co. Ltd. (A Shares) | | 3,056,120 | 7,169,623 |
| Yunnan Baiyao Group Co. Ltd. (A Shares) | | 254,490 | 3,344,128 |
| | | | 21,524,206 |
|
| TOTAL HEALTH CARE | | | 44,809,096 |
|
| INDUSTRIALS - 6.4% | | | |
| Construction & Engineering - 0.8% | | | |
| Sinopec Engineering Group Co. Ltd. (H Shares) | | 11,310,500 | 10,928,716 |
| Industrial Conglomerates - 1.5% | | | |
| CK Hutchison Holdings Ltd. | | 1,903,500 | 19,993,932 |
| Machinery - 2.2% | | | |
| Airtac International Group | | 321,000 | 4,279,723 |
| Cimc Enric Holdings Ltd. | | 5,798,000 | 5,631,853 |
| Haitian International Holdings Ltd. | | 442,000 | 1,106,578 |
| HIWIN Technologies Corp. | | 1,190,000 | 11,302,343 |
| Shenzhen Inovance Technology Co. Ltd. (A Shares) | | 1,626,309 | 6,077,922 |
| | | | 28,398,419 |
| Marine - 0.5% | | | |
| Pacific Basin Shipping Ltd. | | 28,971,000 | 5,945,762 |
| Professional Services - 0.3% | | | |
| Sporton International, Inc. | | 556,000 | 3,292,602 |
| Transportation Infrastructure - 1.1% | | | |
| Shanghai International Airport Co. Ltd. (A Shares) | | 758,345 | 7,952,888 |
| Shenzhen Airport Co. Ltd. (A Shares) | | 4,660,671 | 6,193,560 |
| | | | 14,146,448 |
|
| TOTAL INDUSTRIALS | | | 82,705,879 |
|
| INFORMATION TECHNOLOGY - 13.1% | | | |
| Communications Equipment - 0.2% | | | |
| Shenzhen Sunway Communication Co. Ltd. (A Shares) | | 680,597 | 2,707,270 |
| Electronic Equipment & Components - 2.0% | | | |
| AVIC Jonhon OptronicTechnology Co. Ltd. | | 1,094,040 | 6,757,645 |
| FLEXium Interconnect, Inc. | | 1,085,000 | 3,402,256 |
| Hon Hai Precision Industry Co. Ltd. (Foxconn) | | 3,105,000 | 8,731,619 |
| Nan Ya Printed Circuit Board Corp. | | 2,226,000 | 3,349,589 |
| Sunny Optical Technology Group Co. Ltd. | | 324,600 | 3,957,780 |
| | | | 26,198,889 |
| Internet Software & Services - 0.2% | | | |
| Wise Talent Information Technology Co. Ltd. (a) | | 761,000 | 1,993,493 |
| Semiconductors & Semiconductor Equipment - 9.2% | | | |
| ams AG (b) | | 394,880 | 16,660,181 |
| NXP Semiconductors NV | | 98,500 | 10,403,570 |
| Parade Technologies Ltd. | | 175,000 | 2,961,782 |
| Phison Electronics Corp. | | 417,000 | 3,920,086 |
| Semiconductor Manufacturing International Corp. (a)(b) | | 1,282,000 | 1,372,650 |
| Silergy Corp. | | 221,000 | 3,618,730 |
| Silicon Motion Technology Corp. sponsored ADR | | 14,437 | 552,071 |
| Sino-American Silicon Products, Inc. | | 3,551,000 | 7,676,099 |
| Taiwan Semiconductor Manufacturing Co. Ltd. | | 7,267,000 | 61,011,992 |
| Win Semiconductors Corp. | | 1,698,000 | 11,374,215 |
| | | | 119,551,376 |
| Software - 0.6% | | | |
| Koolearn Technology Holding Ltd. (a)(c) | | 4,660,500 | 6,546,848 |
| Xunlei Ltd. sponsored ADR (a)(b) | | 388,276 | 1,358,966 |
| | | | 7,905,814 |
| Technology Hardware, Storage & Peripherals - 0.9% | | | |
| Ennoconn Corp. | | 1,022,031 | 8,995,937 |
| Giga-Byte Technology Co. Ltd. | | 1,674,000 | 2,689,603 |
| | | | 11,685,540 |
|
| TOTAL INFORMATION TECHNOLOGY | | | 170,042,382 |
|
| MATERIALS - 4.9% | | | |
| Chemicals - 2.2% | | | |
| Formosa Chemicals & Fibre Corp. | | 1,475,000 | 5,298,201 |
| LG Chemical Ltd. | | 50,808 | 15,757,329 |
| Nan Ya Plastics Corp. | | 2,169,000 | 5,481,810 |
| Olin Corp. | | 71,836 | 1,558,123 |
| | | | 28,095,463 |
| Construction Materials - 1.1% | | | |
| BBMG Corp. (H Shares) | | 9,772,000 | 3,438,038 |
| West China Cement Ltd. | | 76,304,000 | 10,699,368 |
| | | | 14,137,406 |
| Metals & Mining - 1.6% | | | |
| Maanshan Iron & Steel Co. Ltd. (H Shares) | | 19,964,000 | 9,186,982 |
| Zijin Mng Group Co. Ltd. (H Shares) | | 29,330,000 | 11,440,674 |
| | | | 20,627,656 |
|
| TOTAL MATERIALS | | | 62,860,525 |
|
| REAL ESTATE - 5.3% | | | |
| Real Estate Management & Development - 5.3% | | | |
| Cheung Kong Property Holdings Ltd. | | 982,500 | 7,890,259 |
| China Jinmao Holdings Group Ltd. | | 12,476,000 | 8,078,992 |
| China Overseas Land and Investment Ltd. | | 2,706,000 | 10,124,044 |
| Hongkong Land Holdings Ltd. | | 1,955,000 | 13,626,350 |
| Longfor Properties Co. Ltd. | | 3,386,000 | 12,473,919 |
| Sino Land Ltd. | | 9,227,630 | 16,232,574 |
| | | | 68,426,138 |
| UTILITIES - 1.5% | | | |
| Gas Utilities - 1.5% | | | |
| China Gas Holdings Ltd. | | 2,361,600 | 7,601,265 |
| China Resource Gas Group Ltd. | | 2,490,000 | 11,521,900 |
| | | | 19,123,165 |
| TOTAL COMMON STOCKS | | | |
| (Cost $985,115,838) | | | 1,282,241,613 |
|
| Money Market Funds - 4.9% | | | |
| Fidelity Cash Central Fund, 2.49% (d) | | 19,182,283 | 19,186,119 |
| Fidelity Securities Lending Cash Central Fund 2.49% (d)(e) | | 43,317,224 | 43,321,556 |
| TOTAL MONEY MARKET FUNDS | | | |
| (Cost $62,507,675) | | | 62,507,675 |
| TOTAL INVESTMENT IN SECURITIES - 104.1% | | | |
| (Cost $1,047,623,513) | | | 1,344,749,288 |
| NET OTHER ASSETS (LIABILITIES) - (4.1)% | | | (52,411,328) |
| NET ASSETS - 100% | | | $1,292,337,960 |
Security Type Abbreviations
ELS – Equity-Linked Security
Legend
(a) Non-income producing
(b) Security or a portion of the security is on loan at period end.
(c) Security exempt from registration under Rule 144A of the Securities Act of 1933. These securities may be resold in transactions exempt from registration, normally to qualified institutional buyers. At the end of the period, the value of these securities amounted to $33,449,272 or 2.6% of net assets.
(d) Affiliated fund that is generally available only to investment companies and other accounts managed by Fidelity Investments. The rate quoted is the annualized seven-day yield of the fund at period end. A complete unaudited listing of the fund's holdings as of its most recent quarter end is available upon request. In addition, each Fidelity Central Fund's financial statements are available on the SEC's website or upon request.
(e) Investment made with cash collateral received from securities on loan.
Affiliated Central Funds
Information regarding fiscal year to date income earned by the Fund from investments in Fidelity Central Funds is as follows:
| Fund | Income earned |
| Fidelity Cash Central Fund | $227,478 |
| Fidelity Securities Lending Cash Central Fund | 503,823 |
| Total | $731,301 |
Amounts in the income column in the above table include any capital gain distributions from underlying funds, which are presented in the corresponding line-item in the Statement of Operations, if applicable.
Investment Valuation
The following is a summary of the inputs used, as of April 30, 2019, involving the Fund's assets and liabilities carried at fair value. The inputs or methodology used for valuing securities may not be an indication of the risk associated with investing in those securities. For more information on valuation inputs, and their aggregation into the levels used below, please refer to the Investment Valuation section in the accompanying Notes to Financial Statements.
| | Valuation Inputs at Reporting Date: |
| Description | Total | Level 1 | Level 2 | Level 3 |
| Investments in Securities: | | | | |
| Equities: | | | | |
| Communication Services | $220,606,138 | $42,901,324 | $177,704,814 | $-- |
| Consumer Discretionary | 300,585,944 | 300,585,944 | -- | -- |
| Consumer Staples | 40,056,192 | 40,056,192 | -- | -- |
| Energy | 26,535,417 | 21,887,708 | 4,647,709 | -- |
| Financials | 246,490,737 | 95,652,131 | 150,838,606 | -- |
| Health Care | 44,809,096 | 44,809,096 | -- | -- |
| Industrials | 82,705,879 | 82,705,879 | -- | -- |
| Information Technology | 170,042,382 | 107,657,740 | 62,384,642 | -- |
| Materials | 62,860,525 | 62,860,525 | -- | -- |
| Real Estate | 68,426,138 | 68,426,138 | -- | -- |
| Utilities | 19,123,165 | 19,123,165 | -- | -- |
| Money Market Funds | 62,507,675 | 62,507,675 | -- | -- |
| Total Investments in Securities: | $1,344,749,288 | $949,173,517 | $395,575,771 | $-- |
See accompanying notes which are an integral part of the financial statements.
Fidelity® China Region Fund
Financial Statements
Statement of Assets and Liabilities
| | | April 30, 2019 (Unaudited) |
| Assets | | |
Investment in securities, at value (including securities loaned of $44,935,976) — See accompanying schedule:
Unaffiliated issuers (cost $985,115,838) | $1,282,241,613 | |
| Fidelity Central Funds (cost $62,507,675) | 62,507,675 | |
| Total Investment in Securities (cost $1,047,623,513) | | $1,344,749,288 |
| Receivable for investments sold | | 5,866,009 |
| Receivable for fund shares sold | | 1,134,416 |
| Dividends receivable | | 482,537 |
| Distributions receivable from Fidelity Central Funds | | 92,268 |
| Prepaid expenses | | 703 |
| Other receivables | | 75,565 |
| Total assets | | 1,352,400,786 |
| Liabilities | | |
| Payable for investments purchased | $12,946,308 | |
| Payable for fund shares redeemed | 2,691,236 | |
| Accrued management fee | 740,257 | |
| Distribution and service plan fees payable | 18,892 | |
| Other affiliated payables | 233,034 | |
| Other payables and accrued expenses | 111,315 | |
| Collateral on securities loaned | 43,321,784 | |
| Total liabilities | | 60,062,826 |
| Net Assets | | $1,292,337,960 |
| Net Assets consist of: | | |
| Paid in capital | | $1,035,969,498 |
| Total distributable earnings (loss) | | 256,368,462 |
| Net Assets | | $1,292,337,960 |
| Net Asset Value and Maximum Offering Price | | |
| Class A: | | |
| Net Asset Value and redemption price per share ($29,074,192 ÷ 818,734 shares) | | $35.51 |
| Maximum offering price per share (100/94.25 of $35.51) | | $37.68 |
| Class M: | | |
| Net Asset Value and redemption price per share ($9,508,921 ÷ 268,847 shares) | | $35.37 |
| Maximum offering price per share (100/96.50 of $35.37) | | $36.65 |
| Class C: | | |
| Net Asset Value and offering price per share ($10,659,926 ÷ 309,006 shares)(a) | | $34.50 |
| China Region: | | |
| Net Asset Value, offering price and redemption price per share ($1,211,923,926 ÷ 33,767,906 shares) | | $35.89 |
| Class I: | | |
| Net Asset Value, offering price and redemption price per share ($30,219,354 ÷ 847,821 shares) | | $35.64 |
| Class Z: | | |
| Net Asset Value, offering price and redemption price per share ($951,641 ÷ 26,751 shares) | | $35.57 |
(a) Redemption price per share is equal to net asset value less any applicable contingent deferred sales charge.
See accompanying notes which are an integral part of the financial statements.
Statement of Operations
| | | Six months ended April 30, 2019 (Unaudited) |
| Investment Income | | |
| Dividends | | $2,258,227 |
| Income from Fidelity Central Funds (including $503,823 from security lending) | | 731,301 |
| Income before foreign taxes withheld | | 2,989,528 |
| Less foreign taxes withheld | | (89,708) |
| Total income | | 2,899,820 |
| Expenses | | |
| Management fee | $3,943,451 | |
| Transfer agent fees | 1,052,900 | |
| Distribution and service plan fees | 105,165 | |
| Accounting and security lending fees | 265,286 | |
| Custodian fees and expenses | 117,280 | |
| Independent trustees' fees and expenses | 3,103 | |
| Registration fees | 93,884 | |
| Audit | 56,836 | |
| Legal | 2,500 | |
| Miscellaneous | 54,519 | |
| Total expenses before reductions | 5,694,924 | |
| Expense reductions | (20,738) | |
| Total expenses after reductions | | 5,674,186 |
| Net investment income (loss) | | (2,774,366) |
| Realized and Unrealized Gain (Loss) | | |
| Net realized gain (loss) on: | | |
| Investment securities: | | |
| Unaffiliated issuers | 8,377,634 | |
| Fidelity Central Funds | (66) | |
| Foreign currency transactions | 22,120 | |
| Total net realized gain (loss) | | 8,399,688 |
| Change in net unrealized appreciation (depreciation) on: | | |
| Investment securities: | | |
| Unaffiliated issuers | 239,558,411 | |
| Assets and liabilities in foreign currencies | 4,120 | |
| Total change in net unrealized appreciation (depreciation) | | 239,562,531 |
| Net gain (loss) | | 247,962,219 |
| Net increase (decrease) in net assets resulting from operations | | $245,187,853 |
See accompanying notes which are an integral part of the financial statements.
Statement of Changes in Net Assets
| | Six months ended April 30, 2019 (Unaudited) | Year ended October 31, 2018 |
| Increase (Decrease) in Net Assets | | |
| Operations | | |
| Net investment income (loss) | $(2,774,366) | $10,227,987 |
| Net realized gain (loss) | 8,399,688 | 94,015,398 |
| Change in net unrealized appreciation (depreciation) | 239,562,531 | (301,946,605) |
| Net increase (decrease) in net assets resulting from operations | 245,187,853 | (197,703,220) |
| Distributions to shareholders | (8,434,846) | (5,632,793) |
| Share transactions - net increase (decrease) | 23,035,212 | (145,112,080) |
| Redemption fees | – | 88,494 |
| Total increase (decrease) in net assets | 259,788,219 | (348,359,599) |
| Net Assets | | |
| Beginning of period | 1,032,549,741 | 1,380,909,340 |
| End of period | $1,292,337,960 | $1,032,549,741 |
See accompanying notes which are an integral part of the financial statements.
Financial Highlights
Fidelity China Region Fund Class A
| | Six months ended (Unaudited) April 30, | Years endedOctober 31, | | | | |
| | 2019 | 2018 | 2017 | 2016 | 2015 | 2014 |
| Selected Per–Share Data | | | | | | |
| Net asset value, beginning of period | $28.73 | $34.22 | $25.46 | $29.34 | $34.18 | $35.56 |
| Income from Investment Operations | | | | | | |
| Net investment income (loss)A | (.12) | .15 | .08 | .18 | .40B | .21 |
| Net realized and unrealized gain (loss) | 7.02 | (5.56) | 8.90 | (.20) | (.83) | 2.01C |
| Total from investment operations | 6.90 | (5.41) | 8.98 | (.02) | (.43) | 2.22 |
| Distributions from net investment income | (.12) | (.08) | (.18) | (.27) | (.22) | (.30) |
| Distributions from net realized gain | – | – | (.05) | (3.59) | (4.24) | (3.31) |
| Total distributions | (.12) | (.08) | (.23) | (3.86) | (4.46) | (3.61) |
| Redemption fees added to paid in capitalA | – | –D | .01 | –D | .05 | .01 |
| Net asset value, end of period | $35.51 | $28.73 | $34.22 | $25.46 | $29.34 | $34.18 |
| Total ReturnE,F,G | 24.08% | (15.86)% | 35.67% | (.13)% | (1.45)% | 6.45%C |
| Ratios to Average Net AssetsH,I | | | | | | |
| Expenses before reductions | 1.29%J | 1.27% | 1.30% | 1.33% | 1.28% | 1.35% |
| Expenses net of fee waivers, if any | 1.28%J | 1.27% | 1.30% | 1.33% | 1.28% | 1.35% |
| Expenses net of all reductions | 1.28%J | 1.24% | 1.29% | 1.32% | 1.26% | 1.35% |
| Net investment income (loss) | (.78)%J | .43% | .28% | .75% | 1.26%B | .64% |
| Supplemental Data | | | | | | |
| Net assets, end of period (000 omitted) | $29,074 | $23,424 | $35,539 | $22,937 | $32,761 | $21,728 |
| Portfolio turnover rateK | 71%J | 60% | 68% | 70% | 151% | 87% |
A Calculated based on average shares outstanding during the period.
B Net investment income per share reflects a large, non-recurring dividend which amounted to $.13 per share. Excluding this non-recurring dividend, the ratio of net investment income (loss) to average net assets would have been .85%.
C Amount includes a reimbursement from the investment adviser for an operational error which amounted to less than $.01 per share. Excluding this reimbursement, the total return would have been 6.42%.
D Amount represents less than $.005 per share.
E Total returns for periods of less than one year are not annualized.
F Total returns would have been lower if certain expenses had not been reduced during the applicable periods shown.
G Total returns do not include the effect of the sales charges.
H Fees and expenses of any underlying Fidelity Central Funds are not included in the Fund's expense ratio. The Fund indirectly bears its proportionate share of the expenses of any underlying Fidelity Central Funds.
I Expense ratios reflect operating expenses of the class. Expenses before reductions do not reflect amounts reimbursed by the investment adviser or reductions from brokerage service arrangements or reductions from other expense offset arrangements and do not represent the amount paid by the class during periods when reimbursements or reductions occur. Expenses net of fee waivers reflect expenses after reimbursement by the investment adviser but prior to reductions from brokerage service arrangements or other expense offset arrangements. Expenses net of all reductions represent the net expenses paid by the class.
J Annualized
K Amount does not include the portfolio activity of any underlying Fidelity Central Funds.
See accompanying notes which are an integral part of the financial statements.
Fidelity China Region Fund Class M
| | Six months ended (Unaudited) April 30, | Years endedOctober 31, | | | | |
| | 2019 | 2018 | 2017 | 2016 | 2015 | 2014 |
| Selected Per–Share Data | | | | | | |
| Net asset value, beginning of period | $28.55 | $34.05 | $25.34 | $29.18 | $34.02 | $35.40 |
| Income from Investment Operations | | | | | | |
| Net investment income (loss)A | (.18) | .03 | (.02) | .10 | .30B | .12 |
| Net realized and unrealized gain (loss) | 7.00 | (5.53) | 8.88 | (.22) | (.83) | 1.99C |
| Total from investment operations | 6.82 | (5.50) | 8.86 | (.12) | (.53) | 2.11 |
| Distributions from net investment income | – | – | (.11) | (.13) | (.12) | (.19) |
| Distributions from net realized gain | – | – | (.05) | (3.59) | (4.24) | (3.31) |
| Total distributions | – | – | (.16) | (3.72) | (4.36) | (3.50) |
| Redemption fees added to paid in capitalA | – | –D | .01 | –D | .05 | .01 |
| Net asset value, end of period | $35.37 | $28.55 | $34.05 | $25.34 | $29.18 | $34.02 |
| Total ReturnE,F,G | 23.89% | (16.15)% | 35.25% | (.50)% | (1.79)% | 6.15%C |
| Ratios to Average Net AssetsH,I | | | | | | |
| Expenses before reductions | 1.61%J | 1.62% | 1.65% | 1.67% | 1.62% | 1.65% |
| Expenses net of fee waivers, if any | 1.60%J | 1.62% | 1.65% | 1.67% | 1.62% | 1.65% |
| Expenses net of all reductions | 1.60%J | 1.58% | 1.64% | 1.67% | 1.60% | 1.65% |
| Net investment income (loss) | (1.10)%J | .08% | (.07)% | .40% | .92%B | .35% |
| Supplemental Data | | | | | | |
| Net assets, end of period (000 omitted) | $9,509 | $8,132 | $9,763 | $5,644 | $6,409 | $6,305 |
| Portfolio turnover rateK | 71%J | 60% | 68% | 70% | 151% | 87% |
A Calculated based on average shares outstanding during the period.
B Net investment income per share reflects a large, non-recurring dividend which amounted to $.13 per share. Excluding this non-recurring dividend, the ratio of net investment income (loss) to average net assets would have been .51%.
C Amount includes a reimbursement from the investment adviser for an operational error which amounted to less than $.01 per share. Excluding this reimbursement, the total return would have been 6.12%.
D Amount represents less than $.005 per share.
E Total returns for periods of less than one year are not annualized.
F Total returns would have been lower if certain expenses had not been reduced during the applicable periods shown.
G Total returns do not include the effect of the sales charges.
H Fees and expenses of any underlying Fidelity Central Funds are not included in the Fund's expense ratio. The Fund indirectly bears its proportionate share of the expenses of any underlying Fidelity Central Funds.
I Expense ratios reflect operating expenses of the class. Expenses before reductions do not reflect amounts reimbursed by the investment adviser or reductions from brokerage service arrangements or reductions from other expense offset arrangements and do not represent the amount paid by the class during periods when reimbursements or reductions occur. Expenses net of fee waivers reflect expenses after reimbursement by the investment adviser but prior to reductions from brokerage service arrangements or other expense offset arrangements. Expenses net of all reductions represent the net expenses paid by the class.
J Annualized
K Amount does not include the portfolio activity of any underlying Fidelity Central Funds.
See accompanying notes which are an integral part of the financial statements.
Fidelity China Region Fund Class C
| | Six months ended (Unaudited) April 30, | Years endedOctober 31, | | | | |
| | 2019 | 2018 | 2017 | 2016 | 2015 | 2014 |
| Selected Per–Share Data | | | | | | |
| Net asset value, beginning of period | $27.90 | $33.41 | $24.82 | $28.68 | $33.56 | $34.99 |
| Income from Investment Operations | | | | | | |
| Net investment income (loss)A | (.23) | (.11) | (.13) | –B | .15C | (.02) |
| Net realized and unrealized gain (loss) | 6.83 | (5.40) | 8.73 | (.21) | (.80) | 1.97D |
| Total from investment operations | 6.60 | (5.51) | 8.60 | (.21) | (.65) | 1.95 |
| Distributions from net investment income | – | – | – | (.06) | (.04) | (.08) |
| Distributions from net realized gain | – | – | (.02) | (3.59) | (4.24) | (3.31) |
| Total distributions | – | – | (.02) | (3.65) | (4.28) | (3.39) |
| Redemption fees added to paid in capitalA | – | –B | .01 | –B | .05 | .01 |
| Net asset value, end of period | $34.50 | $27.90 | $33.41 | $24.82 | $28.68 | $33.56 |
| Total ReturnE,F,G | 23.66% | (16.49)% | 34.71% | (.88)% | (2.21)% | 5.71%D |
| Ratios to Average Net AssetsH,I | | | | | | |
| Expenses before reductions | 2.01%J | 2.01% | 2.05% | 2.07% | 2.05% | 2.07% |
| Expenses net of fee waivers, if any | 2.01%J | 2.01% | 2.05% | 2.07% | 2.05% | 2.07% |
| Expenses net of all reductions | 2.01%J | 1.98% | 2.03% | 2.06% | 2.02% | 2.07% |
| Net investment income (loss) | (1.50)%J | (.31)% | (.46)% | .01% | .49%C | (.07)% |
| Supplemental Data | | | | | | |
| Net assets, end of period (000 omitted) | $10,660 | $10,138 | $12,952 | $11,218 | $14,355 | $10,445 |
| Portfolio turnover rateK | 71%J | 60% | 68% | 70% | 151% | 87% |
A Calculated based on average shares outstanding during the period.
B Amount represents less than $.005 per share.
C Net investment income per share reflects a large, non-recurring dividend which amounted to $.13 per share. Excluding this non-recurring dividend, the ratio of net investment income (loss) to average net assets would have been .09%.
D Amount includes a reimbursement from the investment adviser for an operational error which amounted to less than $.01 per share. Excluding this reimbursement, the total return would have been 5.68%.
E Total returns for periods of less than one year are not annualized.
F Total returns would have been lower if certain expenses had not been reduced during the applicable periods shown.
G Total returns do not include the effect of the contingent deferred sales charge.
H Fees and expenses of any underlying Fidelity Central Funds are not included in the Fund's expense ratio. The Fund indirectly bears its proportionate share of the expenses of any underlying Fidelity Central Funds.
I Expense ratios reflect operating expenses of the class. Expenses before reductions do not reflect amounts reimbursed by the investment adviser or reductions from brokerage service arrangements or reductions from other expense offset arrangements and do not represent the amount paid by the class during periods when reimbursements or reductions occur. Expenses net of fee waivers reflect expenses after reimbursement by the investment adviser but prior to reductions from brokerage service arrangements or other expense offset arrangements. Expenses net of all reductions represent the net expenses paid by the class.
J Annualized
K Amount does not include the portfolio activity of any underlying Fidelity Central Funds.
See accompanying notes which are an integral part of the financial statements.
Fidelity China Region Fund
| | Six months ended (Unaudited) April 30, | Years endedOctober 31, | | | | |
| | 2019 | 2018 | 2017 | 2016 | 2015 | 2014 |
| Selected Per–Share Data | | | | | | |
| Net asset value, beginning of period | $29.11 | $34.64 | $25.78 | $29.66 | $34.51 | $35.83 |
| Income from Investment Operations | | | | | | |
| Net investment income (loss)A | (.08) | .26 | .17 | .26 | .51B | .33 |
| Net realized and unrealized gain (loss) | 7.11 | (5.65) | 9.00 | (.21) | (.84) | 2.03C |
| Total from investment operations | 7.03 | (5.39) | 9.17 | .05 | (.33) | 2.36 |
| Distributions from net investment income | (.25) | (.14) | (.27) | (.35) | (.33) | (.38) |
| Distributions from net realized gain | – | – | (.05) | (3.59) | (4.24) | (3.31) |
| Total distributions | (.25) | (.14) | (.32) | (3.93)D | (4.57) | (3.69) |
| Redemption fees added to paid in capitalA | – | –E | .01 | –E | .05 | .01 |
| Net asset value, end of period | $35.89 | $29.11 | $34.64 | $25.78 | $29.66 | $34.51 |
| Total ReturnF,G | 24.30% | (15.62)% | 36.10% | .15% | (1.14)% | 6.83%C |
| Ratios to Average Net AssetsH,I | | | | | | |
| Expenses before reductions | .97%J | .96% | 1.00% | 1.02% | .99% | 1.01% |
| Expenses net of fee waivers, if any | .97%J | .96% | 1.00% | 1.02% | .98% | 1.01% |
| Expenses net of all reductions | .97%J | .93% | .99% | 1.01% | .96% | 1.01% |
| Net investment income (loss) | (.46)%J | .74% | .58% | 1.06% | 1.55%B | .99% |
| Supplemental Data | | | | | | |
| Net assets, end of period (000 omitted) | $1,211,924 | $969,679 | $1,294,775 | $1,004,985 | $1,262,274 | $1,352,761 |
| Portfolio turnover rateK | 71%J | 60% | 68% | 70% | 151% | 87% |
A Calculated based on average shares outstanding during the period.
B Net investment income per share reflects a large, non-recurring dividend which amounted to $.13 per share. Excluding this non-recurring dividend, the ratio of net investment income (loss) to average net assets would have been 1.15%.
C Amount includes a reimbursement from the investment adviser for an operational error which amounted to less than $.01 per share. Excluding this reimbursement, the total return would have been 6.80%.
D Total distributions of $3.93 per share is comprised of distributions from net investment income of $.345 and distributions from net realized gain of $3.588 per share.
E Amount represents less than $.005 per share.
F Total returns for periods of less than one year are not annualized.
G Total returns would have been lower if certain expenses had not been reduced during the applicable periods shown.
H Fees and expenses of any underlying Fidelity Central Funds are not included in the Fund's expense ratio. The Fund indirectly bears its proportionate share of the expenses of any underlying Fidelity Central Funds.
I Expense ratios reflect operating expenses of the class. Expenses before reductions do not reflect amounts reimbursed by the investment adviser or reductions from brokerage service arrangements or reductions from other expense offset arrangements and do not represent the amount paid by the class during periods when reimbursements or reductions occur. Expenses net of fee waivers reflect expenses after reimbursement by the investment adviser but prior to reductions from brokerage service arrangements or other expense offset arrangements. Expenses net of all reductions represent the net expenses paid by the class.
J Annualized
K Amount does not include the portfolio activity of any underlying Fidelity Central Funds.
See accompanying notes which are an integral part of the financial statements.
Fidelity China Region Fund Class I
| | Six months ended (Unaudited) April 30, | Years endedOctober 31, | | | | |
| | 2019 | 2018 | 2017 | 2016 | 2015 | 2014 |
| Selected Per–Share Data | | | | | | |
| Net asset value, beginning of period | $28.90 | $34.41 | $25.62 | $29.51 | $34.39 | $35.75 |
| Income from Investment Operations | | | | | | |
| Net investment income (loss)A | (.08) | .26 | .16 | .26 | .51B | .34 |
| Net realized and unrealized gain (loss) | 7.05 | (5.61) | 8.95 | (.20) | (.84) | 2.02C |
| Total from investment operations | 6.97 | (5.35) | 9.11 | .06 | (.33) | 2.36 |
| Distributions from net investment income | (.23) | (.16) | (.28) | (.36) | (.36) | (.43) |
| Distributions from net realized gain | – | – | (.05) | (3.59) | (4.24) | (3.31) |
| Total distributions | (.23) | (.16) | (.33) | (3.95) | (4.60) | (3.73)D |
| Redemption fees added to paid in capitalA | – | –E | .01 | –E | .05 | .01 |
| Net asset value, end of period | $35.64 | $28.90 | $34.41 | $25.62 | $29.51 | $34.39 |
| Total ReturnF,G | 24.28% | (15.63)% | 36.11% | .16% | (1.14)% | 6.87%C |
| Ratios to Average Net AssetsH,I | | | | | | |
| Expenses before reductions | .98%J | .98% | 1.01% | 1.00% | .97% | .98% |
| Expenses net of fee waivers, if any | .98%J | .98% | 1.01% | 1.00% | .97% | .98% |
| Expenses net of all reductions | .98%J | .95% | .99% | .99% | .95% | .98% |
| Net investment income (loss) | (.47)%J | .72% | .57% | 1.07% | 1.57%B | 1.01% |
| Supplemental Data | | | | | | |
| Net assets, end of period (000 omitted) | $30,219 | $20,854 | $27,880 | $19,334 | $26,961 | $19,404 |
| Portfolio turnover rateK | 71%J | 60% | 68% | 70% | 151% | 87% |
A Calculated based on average shares outstanding during the period.
B Net investment income per share reflects a large, non-recurring dividend which amounted to $.13 per share. Excluding this non-recurring dividend, the ratio of net investment income (loss) to average net assets would have been 1.16%.
C Amount includes a reimbursement from the investment adviser for an operational error which amounted to less than $.01 per share. Excluding this reimbursement, the total return would have been 6.84%.
D Total distributions of $3.73 per share is comprised of distributions from net investment income of $.425 and distributions from net realized gain of $3.306 per share.
E Amount represents less than $.005 per share.
F Total returns for periods of less than one year are not annualized.
G Total returns would have been lower if certain expenses had not been reduced during the applicable periods shown.
H Fees and expenses of any underlying Fidelity Central Funds are not included in the Fund's expense ratio. The Fund indirectly bears its proportionate share of the expenses of any underlying Fidelity Central Funds.
I Expense ratios reflect operating expenses of the class. Expenses before reductions do not reflect amounts reimbursed by the investment adviser or reductions from brokerage service arrangements or reductions from other expense offset arrangements and do not represent the amount paid by the class during periods when reimbursements or reductions occur. Expenses net of fee waivers reflect expenses after reimbursement by the investment adviser but prior to reductions from brokerage service arrangements or other expense offset arrangements. Expenses net of all reductions represent the net expenses paid by the class.
J Annualized
K Amount does not include the portfolio activity of any underlying Fidelity Central Funds.
See accompanying notes which are an integral part of the financial statements.
Fidelity China Region Fund Class Z
| | Six months ended (Unaudited) April 30, | Year endedOctober 31, |
| | 2019 | 2018 A |
| Selected Per–Share Data | | |
| Net asset value, beginning of period | $28.91 | $32.63 |
| Income from Investment Operations | | |
| Net investment income (loss)B | (.05) | .01 |
| Net realized and unrealized gain (loss) | 7.03 | (3.73) |
| Total from investment operations | 6.98 | (3.72) |
| Distributions from net investment income | (.32) | – |
| Distributions from net realized gain | – | – |
| Total distributions | (.32) | – |
| Net asset value, end of period | $35.57 | $28.91 |
| Total ReturnC,D | 24.35% | (11.40)% |
| Ratios to Average Net AssetsE,F | | |
| Expenses before reductions | .84%G | .91%G |
| Expenses net of fee waivers, if any | .83%G | .90%G |
| Expenses net of all reductions | .83%G | .87%G |
| Net investment income (loss) | (.33)%G | .57%G |
| Supplemental Data | | |
| Net assets, end of period (000 omitted) | $952 | $323 |
| Portfolio turnover rateH | 71%G | 60% |
A For the period October 2, 2018 (commencement of sale of shares) to October 31, 2018.
B Calculated based on average shares outstanding during the period.
C Total returns for periods of less than one year are not annualized.
D Total returns would have been lower if certain expenses had not been reduced during the applicable periods shown.
E Fees and expenses of any underlying Fidelity Central Funds are not included in the Fund's expense ratio. The Fund indirectly bears its proportionate share of the expenses of any underlying Fidelity Central Funds.
F Expense ratios reflect operating expenses of the class. Expenses before reductions do not reflect amounts reimbursed by the investment adviser or reductions from brokerage service arrangements or reductions from other expense offset arrangements and do not represent the amount paid by the class during periods when reimbursements or reductions occur. Expense ratios before reductions for start-up periods may not be representative of longer-term operating periods. Expenses net of fee waivers reflect expenses after reimbursement by the investment adviser but prior to reductions from brokerage service arrangements or other expense offset arrangements. Expenses net of all reductions represent the net expenses paid by the class.
G Annualized
H Amount does not include the portfolio activity of any underlying Fidelity Central Funds.
See accompanying notes which are an integral part of the financial statements.
Notes to Financial Statements (Unaudited)
For the period ended April 30, 2019
1. Organization.
Fidelity China Region Fund (the Fund) is a fund of Fidelity Investment Trust (the Trust) and is authorized to issue an unlimited number of shares. The Trust is registered under the Investment Company Act of 1940, as amended (the 1940 Act), as an open-end management investment company organized as a Massachusetts business trust. The Fund offers Class A, Class M, Class C, China Region, Class I and Class Z shares, each of which has equal rights as to assets and voting privileges. Each class has exclusive voting rights with respect to matters that affect that class. Effective March 1, 2019, Class C shares will automatically convert to Class A shares after a holding period of ten years from the initial date of purchase, with certain exceptions. The Fund's investments in emerging markets can be subject to social, economic, regulatory, and political uncertainties and can be extremely volatile.
2. Investments in Fidelity Central Funds.
The Fund invests in Fidelity Central Funds, which are open-end investment companies generally available only to other investment companies and accounts managed by the investment adviser and its affiliates. The Fund's Schedule of Investments lists each of the Fidelity Central Funds held as of period end, if any, as an investment of the Fund, but does not include the underlying holdings of each Fidelity Central Fund. As an Investing Fund, the Fund indirectly bears its proportionate share of the expenses of the underlying Fidelity Central Funds.
The Money Market Central Funds seek preservation of capital and current income and are managed by Fidelity Investments Money Management, Inc. (FIMM), an affiliate of the investment adviser. Annualized expenses of the Money Market Central Funds as of their most recent shareholder report date are less than .005%.
A complete unaudited list of holdings for each Fidelity Central Fund is available upon request or at the Securities and Exchange Commission (the SEC) website at www.sec.gov. In addition, the financial statements of the Fidelity Central Funds are available on the SEC website or upon request.
3. Significant Accounting Policies.
The Fund is an investment company and applies the accounting and reporting guidance of the Financial Accounting Standards Board (FASB) Accounting Standards Codification Topic 946 Financial Services – Investments Companies. The financial statements have been prepared in conformity with accounting principles generally accepted in the United States of America (GAAP), which require management to make certain estimates and assumptions at the date of the financial statements. Actual results could differ from those estimates. Subsequent events, if any, through the date that the financial statements were issued have been evaluated in the preparation of the financial statements. The following summarizes the significant accounting policies of the Fund:
Investment Valuation. Investments are valued as of 4:00 p.m. Eastern time on the last calendar day of the period. The Board of Trustees (the Board) has delegated the day to day responsibility for the valuation of the Fund's investments to the Fair Value Committee (the Committee) established by the Fund's investment adviser. In accordance with valuation policies and procedures approved by the Board, the Fund attempts to obtain prices from one or more third party pricing vendors or brokers to value its investments. When current market prices, quotations or currency exchange rates are not readily available or reliable, investments will be fair valued in good faith by the Committee, in accordance with procedures adopted by the Board. Factors used in determining fair value vary by investment type and may include market or investment specific events. The frequency with which these procedures are used cannot be predicted and they may be utilized to a significant extent. The Committee oversees the Fund's valuation policies and procedures and reports to the Board on the Committee's activities and fair value determinations. The Board monitors the appropriateness of the procedures used in valuing the Fund's investments and ratifies the fair value determinations of the Committee.
The Fund categorizes the inputs to valuation techniques used to value its investments into a disclosure hierarchy consisting of three levels as shown below:
- Level 1 – quoted prices in active markets for identical investments
- Level 2 – other significant observable inputs (including quoted prices for similar investments, interest rates, prepayment speeds, etc.)
- Level 3 – unobservable inputs (including the Fund's own assumptions based on the best information available)
Valuation techniques used to value the Fund's investments by major category are as follows:
Equity securities, including restricted securities, for which market quotations are readily available, are valued at the last reported sale price or official closing price as reported by a third party pricing vendor on the primary market or exchange on which they are traded and are categorized as Level 1 in the hierarchy. In the event there were no sales during the day or closing prices are not available, securities are valued at the last quoted bid price or may be valued using the last available price and are generally categorized as Level 2 in the hierarchy. For foreign equity securities, when market or security specific events arise, comparisons to the valuation of American Depositary Receipts (ADRs), futures contracts, Exchange-Traded Funds (ETFs) and certain indexes as well as quoted prices for similar securities may be used and would be categorized as Level 2 in the hierarchy. For equity securities, including restricted securities, where observable inputs are limited, assumptions about market activity and risk are used and these securities may be categorized as Level 3 in the hierarchy.
Investments in open-end mutual funds, including the Fidelity Central Funds, are valued at their closing net asset value (NAV) each business day and are categorized as Level 1 in the hierarchy.
Changes in valuation techniques may result in transfers in or out of an assigned level within the disclosure hierarchy. The aggregate value of investments by input level as of April 30, 2019 is included at the end of the Fund's Schedule of Investments.
Foreign Currency. The Fund may use foreign currency contracts to facilitate transactions in foreign-denominated securities. Gains and losses from these transactions may arise from changes in the value of the foreign currency or if the counterparties do not perform under the contracts' terms.
Foreign-denominated assets, including investment securities, and liabilities are translated into U.S. dollars at the exchange rates at period end. Purchases and sales of investment securities, income and dividends received and expenses denominated in foreign currencies are translated into U.S. dollars at the exchange rate in effect on the transaction date.
The effects of exchange rate fluctuations on investments are included with the net realized and unrealized gain (loss) on investment securities. Other foreign currency transactions resulting in realized and unrealized gain (loss) are disclosed separately.
Investment Transactions and Income. For financial reporting purposes, the Fund's investment holdings and NAV include trades executed through the end of the last business day of the period. The NAV per share for processing shareholder transactions is calculated as of the close of business of the New York Stock Exchange (NYSE), normally 4:00 p.m. Eastern time and includes trades executed through the end of the prior business day. Gains and losses on securities sold are determined on the basis of identified cost. Dividend income is recorded on the ex-dividend date, except for certain dividends from foreign securities where the ex-dividend date may have passed, which are recorded as soon as the Fund is informed of the ex-dividend date. Non-cash dividends included in dividend income, if any, are recorded at the fair market value of the securities received. Income and capital gain distributions from Fidelity Central Funds, if any, are recorded on the ex-dividend date. Investment income is recorded net of foreign taxes withheld where recovery of such taxes is uncertain.
Class Allocations and Expenses. Investment income, realized and unrealized capital gains and losses, common expenses of the Fund, and certain fund-level expense reductions, if any, are allocated daily on a pro-rata basis to each class based on the relative net assets of each class to the total net assets of the Fund. Each class differs with respect to transfer agent and distribution and service plan fees incurred. Certain expense reductions may also differ by class. For the reporting period, the allocated portion of income and expenses to each class as a percent of its average net assets may vary due to the timing of recording these transactions in relation to fluctuating net assets of the classes. Expenses directly attributable to a fund are charged to that fund. Expenses attributable to more than one fund are allocated among the respective funds on the basis of relative net assets or other appropriate methods. Expense estimates are accrued in the period to which they relate and adjustments are made when actual amounts are known.
Income Tax Information and Distributions to Shareholders. Each year, the Fund intends to qualify as a regulated investment company under Subchapter M of the Internal Revenue Code, including distributing substantially all of its taxable income and realized gains. As a result, no provision for U.S. Federal income taxes is required. The Fund files a U.S. federal tax return, in addition to state and local tax returns as required. The Fund's federal income tax returns are subject to examination by the Internal Revenue Service (IRS) for a period of three fiscal years after they are filed. State and local tax returns may be subject to examination for an additional fiscal year depending on the jurisdiction. Foreign taxes are provided for based on the Fund's understanding of the tax rules and rates that exist in the foreign markets in which it invests.
Distributions are declared and recorded on the ex-dividend date. Income and capital gain distributions are declared separately for each class. Income and capital gain distributions are determined in accordance with income tax regulations, which may differ from GAAP.
Capital accounts within the financial statements are adjusted for permanent book-tax differences. These adjustments have no impact on net assets or the results of operations. Capital accounts are not adjusted for temporary book-tax differences which will reverse in a subsequent period.
Book-tax differences are primarily due to foreign currency transactions, deferred trustees compensation, capital loss carryforwards and losses deferred due to wash sales.
As of period end, the cost and unrealized appreciation (depreciation) in securities, and derivatives if applicable, for federal income tax purposes were as follows:
| Gross unrealized appreciation | $327,412,368 |
| Gross unrealized depreciation | (31,495,003) |
| Net unrealized appreciation (depreciation) | $295,917,365 |
| Tax cost | $1,048,831,923 |
Capital loss carryforwards are only available to offset future capital gains of the Fund to the extent provided by regulations and may be limited. Under the Regulated Investment Company Modernization Act of 2010 (the Act), the Fund is permitted to carry forward capital losses incurred in taxable years beginning after December 22, 2010 for an unlimited period and such capital losses are required to be used prior to any losses that expire. The capital loss carryforward information presented below, including any applicable limitation, is estimated as of prior fiscal period end and is subject to adjustment.
| No expiration | |
| Short-term | $(45,021,541) |
Restricted Securities. The Fund may invest in securities that are subject to legal or contractual restrictions on resale. These securities generally may be resold in transactions exempt from registration or to the public if the securities are registered. Disposal of these securities may involve time-consuming negotiations and expense, and prompt sale at an acceptable price may be difficult. Information regarding restricted securities is included at the end of the Fund's Schedule of Investments.
4. Purchases and Sales of Investments.
Purchases and sales of securities, other than short-term securities, aggregated $446,769,375 and $398,836,745, respectively.
5. Fees and Other Transactions with Affiliates.
Management Fee. Fidelity Management & Research Company (the investment adviser) and its affiliates provide the Fund with investment management related services for which the Fund pays a monthly management fee. The management fee is the sum of an individual fund fee rate that is based on an annual rate of .45% of the Fund's average net assets and an annualized group fee rate that averaged .24% during the period. The group fee rate is based upon the average net assets of all the mutual funds advised by the investment adviser, including any mutual funds previously advised by the investment adviser that are currently advised by Fidelity SelectCo, LLC, an affiliate of the investment adviser. The group fee rate decreases as assets under management increase and increases as assets under management decrease. For the reporting period, the total annualized management fee rate was .69% of the Fund's average net assets.
Distribution and Service Plan Fees. In accordance with Rule 12b-1 of the 1940 Act, the Fund has adopted separate Distribution and Service Plans for each class of shares. Certain classes pay Fidelity Distributors Corporation (FDC), an affiliate of the investment adviser, separate Distribution and Service Fees, each of which is based on an annual percentage of each class' average net assets. In addition, FDC may pay financial intermediaries for selling shares of the Fund and providing shareholder support services. For the period, the Distribution and Service Fee rates, total fees and amounts retained by FDC were as follows:
| | Distribution Fee | Service Fee | Total Fees | Retained by FDC |
| Class A | -% | .25% | $31,749 | $1,200 |
| Class M | .25% | .25% | 21,516 | 430 |
| Class C | .75% | .25% | 51,900 | 7,604 |
| | | | $105,165 | $9,234 |
Sales Load. FDC may receive a front-end sales charge of up to 5.75% for selling Class A shares and 3.50% for selling Class M shares, some of which is paid to financial intermediaries for selling shares of the Fund. Depending on the holding period, FDC may receive contingent deferred sales charges levied on Class A, Class M and Class C redemptions. The deferred sales charges are 1.00% for Class C shares, 1.00% for certain purchases of Class A shares and .25% for certain purchases of Class M shares.
For the period, sales charge amounts retained by FDC were as follows:
| | Retained by FDC |
| Class A | $5,124 |
| Class M | 1,112 |
| Class C(a) | 1,270 |
| | $7,506 |
(a) When Class C shares are initially sold, FDC pays commissions from its own resources to financial intermediaries through which the sales are made.
Transfer Agent Fees. Fidelity Investments Institutional Operations Company, Inc., (FIIOC), an affiliate of the investment adviser, is the transfer, dividend disbursing and shareholder servicing agent for each class of the Fund. FIIOC receives account fees and asset-based fees that vary according to the account size and type of account of the shareholders of the respective classes of the Fund, except for Class Z. FIIOC receives an asset-based fee of Class Z's average net assets. FIIOC pays for typesetting, printing and mailing of shareholder reports, except proxy statements.
For the period, transfer agent fees for each class were as follows:
| | Amount | % of Class-Level Average Net Assets(a) |
| Class A | $31,302 | .25 |
| Class M | 13,631 | .32 |
| Class C | 11,562 | .22 |
| China Region | 972,342 | .18 |
| Class I | 23,875 | .19 |
| Class Z | 188 | .05 |
| | $1,052,900 | |
(a) Annualized
Accounting and Security Lending Fees. Fidelity Service Company, Inc. (FSC), an affiliate of the investment adviser, maintains the Fund's accounting records. The accounting fee is based on the level of average net assets for each month. Prior to April 1, 2019, FSC had a separate agreement with the Fund for administration of the security lending program, based on the number and duration of lending transactions. For the period, the total fees paid for accounting and administration of securities lending were equivalent to an annualized rate of .05%.
Brokerage Commissions. The Fund placed a portion of its portfolio transactions with brokerage firms which are affiliates of the investment adviser. Brokerage commissions are included in net realized gain (loss) and change in net unrealized appreciation (depreciation) in the Statement of Operations. The commissions paid to these affiliated firms were $10,541 for the period.
Interfund Trades. The Fund may purchase from or sell securities to other Fidelity Funds under procedures adopted by the Board. The procedures have been designed to ensure these interfund trades are executed in accordance with Rule 17a-7 of the 1940 Act. Interfund trades are included within the respective purchases and sales amounts shown in the Purchases and Sales of Investments note.
6. Committed Line of Credit.
The Fund participates with other funds managed by the investment adviser or an affiliate in a $4.25 billion credit facility (the "line of credit") to be utilized for temporary or emergency purposes to fund shareholder redemptions or for other short-term liquidity purposes. The Fund has agreed to pay commitment fees on its pro-rata portion of the line of credit, which amounted to $1,592 and is reflected in Miscellaneous expenses on the Statement of Operations. During the period, the Fund did not borrow on this line of credit.
7. Security Lending.
The Fund lends portfolio securities through a lending agent from time to time in order to earn additional income. For equity securities, a lending agent is used and may loan securities to certain qualified borrowers, including Fidelity Capital Markets (FCM), a broker-dealer affiliated with the Fund. On the settlement date of the loan, the Fund receives collateral (in the form of U.S. Treasury obligations, letters of credit and/or cash) against the loaned securities and maintains collateral in an amount not less than 100% of the market value of the loaned securities during the period of the loan. The market value of the loaned securities is determined at the close of business of the Fund and any additional required collateral is delivered to the Fund on the next business day. The Fund or borrower may terminate the loan at any time, and if the borrower defaults on its obligation to return the securities loaned because of insolvency or other reasons, the Fund may apply collateral received from the borrower against the obligation. The Fund may experience delays and costs in recovering the securities loaned. Any cash collateral received is invested in the Fidelity Securities Lending Cash Central Fund. The value of loaned securities and cash collateral at period end are disclosed on the Fund's Statement of Assets and Liabilities. At period end, there were no security loans outstanding with FCM. Security lending income represents the income earned on investing cash collateral, less rebates paid to borrowers and any lending agent fees associated with the loan, plus any premium payments received for lending certain types of securities. Security lending income is presented in the Statement of Operations as a component of income from Fidelity Central Funds, and includes $365 from securities loaned to FCM.
8. Expense Reductions.
Through arrangements with the Fund's custodian and each class' transfer agent, credits realized as a result of certain uninvested cash balances were used to reduce the Fund's expenses. During the period, these credits reduced the Fund's custody expenses by $422. During the period, credits reduced each class' transfer agent expense as noted in the table below.
| | Transfer Agent expense reduction |
| China Region | $87 |
In addition, during the period the investment adviser reimbursed and/or waived a portion of fund-level operating expenses in the amount of $4,229 and a portion of class-level operating expenses as follows:
| | Amount |
| Class A | $350 |
| Class M | 118 |
| Class C | 145 |
| China Region | 15,020 |
| Class I | 355 |
| Class Z | 12 |
| | $16,000 |
9. Distributions to Shareholders.
Distributions to shareholders of each class were as follows:
| | Six months ended
April 30, 2019 | Year ended
October 31, 2018(a) |
| Distributions to shareholders | | |
| Class A | $92,117 | $79,937 |
| China Region | 8,164,383 | 5,380,060 |
| Class I | 170,585 | 172,796 |
| Class Z | 7,761 | – |
| Total | $8,434,846 | $5,632,793 |
(a) Distributions for Class Z are for the period October 2, 2018 (commencement of sale of shares) to October 31, 2018.
10. Share Transactions.
Share transactions for each class were as follows and may contain automatic conversions between classes or exchanges between affiliated funds:
| | Shares | Shares | Dollars | Dollars |
| | Six months ended April 30, 2019 | Year ended October 31, 2018(a) | Six months ended April 30, 2019 | Year ended October 31, 2018(a) |
| Class A | | | | |
| Shares sold | 102,971 | 281,109 | $3,428,814 | $9,945,540 |
| Reinvestment of distributions | 3,062 | 2,311 | 90,830 | 78,690 |
| Shares redeemed | (102,714) | (506,416) | (3,206,973) | (18,191,086) |
| Net increase (decrease) | 3,319 | (222,996) | $312,671 | $(8,166,856) |
| Class M | | | | |
| Shares sold | 24,532 | 116,652 | $812,192 | $4,199,988 |
| Shares redeemed | (40,535) | (118,515) | (1,278,265) | (4,110,606) |
| Net increase (decrease) | (16,003) | (1,863) | $(466,073) | $89,382 |
| Class C | | | | |
| Shares sold | 29,699 | 141,748 | $961,418 | $4,961,864 |
| Shares redeemed | (84,068) | (166,005) | (2,632,501) | (5,613,368) |
| Net increase (decrease) | (54,369) | (24,257) | $(1,671,083) | $(651,504) |
| China Region | | | | |
| Shares sold | 3,987,067 | 9,405,338 | $134,240,256 | $342,970,076 |
| Reinvestment of distributions | 260,477 | 150,399 | 7,798,692 | 5,175,224 |
| Shares redeemed | (3,787,862) | (13,622,290) | (121,863,781) | (481,771,408) |
| Net increase (decrease) | 459,682 | (4,066,553) | $20,175,167 | $(133,626,108) |
| Class I | | | | |
| Shares sold | 259,254 | 748,387 | $8,459,218 | $26,698,679 |
| Reinvestment of distributions | 4,738 | 4,532 | 140,863 | 154,844 |
| Shares redeemed | (137,704) | (841,495) | (4,379,378) | (29,947,068) |
| Net increase (decrease) | 126,288 | (88,576) | $4,220,703 | $(3,093,545) |
| Class Z | | | | |
| Shares sold | 17,323 | 11,185 | $523,332 | $336,639 |
| Reinvestment of distributions | 262 | – | 7,761 | – |
| Shares redeemed | (2,016) | (3) | (67,266) | (88) |
| Net increase (decrease) | 15,569 | 11,182 | $463,827 | $336,551 |
(a) Share transactions for Class Z are for the period October 2, 2018 (commencement of sale of shares) to October 31, 2018.
11. Other.
The Fund's organizational documents provide former and current trustees and officers with a limited indemnification against liabilities arising in connection with the performance of their duties to the Fund. In the normal course of business, the Fund may also enter into contracts that provide general indemnifications. The Fund's maximum exposure under these arrangements is unknown as this would be dependent on future claims that may be made against the Fund. The risk of material loss from such claims is considered remote.
Fidelity® Emerging Asia Fund
Investment Summary (Unaudited)
Geographic Diversification (% of fund's net assets)
| As of April 30, 2019 |
| | Cayman Islands | 19.8% |
| | China | 19.5% |
| | India | 15.8% |
| | Taiwan | 9.2% |
| | Hong Kong | 8.8% |
| | United States of America* | 6.6% |
| | Korea (South) | 6.6% |
| | Indonesia | 2.9% |
| | Bermuda | 1.9% |
| | Other | 8.9% |
* Includes Short-Term investments and Net Other Assets (Liabilities).
Percentages are based on country or territory of incorporation and are adjusted for the effect of futures contracts, if applicable.
Asset Allocation as of April 30, 2019
| | % of fund's net assets |
| Stocks | 94.3 |
| Short-Term Investments and Net Other Assets (Liabilities) | 5.7 |
Top Ten Stocks as of April 30, 2019
| | % of fund's net assets |
| Tencent Holdings Ltd. (Cayman Islands, Interactive Media & Services) | 8.7 |
| Taiwan Semiconductor Manufacturing Co. Ltd. (Taiwan, Semiconductors & Semiconductor Equipment) | 6.6 |
| Alibaba Group Holding Ltd. sponsored ADR (Cayman Islands, Internet & Direct Marketing Retail) | 6.3 |
| AIA Group Ltd. (Hong Kong, Insurance) | 4.7 |
| Reliance Industries Ltd. (India, Oil, Gas & Consumable Fuels) | 3.1 |
| Kweichow Moutai Co. Ltd. (A Shares) (China, Beverages) | 3.1 |
| Housing Development Finance Corp. Ltd. (India, Thrifts & Mortgage Finance) | 2.5 |
| Ping An Insurance (Group) Co. of China Ltd. (H Shares) (China, Insurance) | 2.2 |
| HDFC Bank Ltd. (India, Banks) | 1.9 |
| HKT Trust/HKT Ltd. unit (Multi-National, Diversified Telecommunication Services) | 1.7 |
| | 40.8 |
Top Market Sectors as of April 30, 2019
| | % of fund's net assets |
| Financials | 23.6 |
| Information Technology | 13.2 |
| Consumer Discretionary | 13.0 |
| Communication Services | 12.8 |
| Industrials | 8.7 |
| Consumer Staples | 7.2 |
| Real Estate | 5.1 |
| Energy | 4.6 |
| Health Care | 2.8 |
| Utilities | 1.8 |
Fidelity® Emerging Asia Fund
Schedule of Investments April 30, 2019 (Unaudited)
Showing Percentage of Net Assets
| Common Stocks - 93.3% | | | |
| | | Shares | Value |
| Australia - 1.5% | | | |
| Blue Sky Alternative Investments Ltd. (a) | | 1,183,786 | $225,318 |
| HUB24 Ltd. (b) | | 550,557 | 5,821,727 |
| Pro Medicus Ltd. | | 28,423 | 409,552 |
| SpeedCast International Ltd. | | 1,464,414 | 4,005,474 |
| Woodside Petroleum Ltd. | | 236,307 | 5,895,430 |
|
| TOTAL AUSTRALIA | | | 16,357,501 |
|
| Bermuda - 1.9% | | | |
| Hongkong Land Holdings Ltd. | | 1,600,500 | 11,155,485 |
| Tai Cheung Holdings Ltd. | | 5,610,000 | 5,942,675 |
| Vtech Holdings Ltd. | | 466,800 | 4,257,539 |
|
| TOTAL BERMUDA | | | 21,355,699 |
|
| Cayman Islands - 19.8% | | | |
| 51job, Inc. sponsored ADR (a) | | 102,200 | 9,437,148 |
| Alibaba Group Holding Ltd. sponsored ADR (a) | | 374,500 | 69,495,965 |
| International Housewares Retail Co. Ltd. | | 23,055,400 | 6,054,217 |
| NetEase, Inc. ADR | | 38,800 | 11,039,764 |
| Shenzhou International Group Holdings Ltd. | | 1,152,800 | 15,473,924 |
| SITC International Holdings Co. Ltd. | | 5,655,000 | 6,004,761 |
| Tencent Holdings Ltd. | | 1,940,700 | 95,652,573 |
| Value Partners Group Ltd. | | 6,796,383 | 5,111,495 |
|
| TOTAL CAYMAN ISLANDS | | | 218,269,847 |
|
| China - 19.5% | | | |
| China Pacific Insurance (Group) Co. Ltd. (H Shares) | | 1,897,200 | 7,775,212 |
| Chongqing Fuling Zhacai Group Co. Ltd. Group (A Shares) | | 1,287,600 | 5,485,047 |
| Foshan Haitian Flavouring & Food Co. Ltd. (A Shares) | | 758,400 | 10,053,594 |
| Gree Electric Appliances, Inc. of Zhuhai (A Shares) | | 1,284,700 | 10,602,032 |
| Hangzhou Tigermed Consulting Co. Ltd. (A Shares) | | 953,798 | 9,403,582 |
| Inner Mongoli Yili Industries Co. Ltd. (A Shares) | | 1,254,622 | 5,774,886 |
| Kweichow Moutai Co. Ltd. (A Shares) | | 238,881 | 34,546,926 |
| Midea Group Co. Ltd. (A Shares) | | 1,180,400 | 9,183,946 |
| PICC Property & Casualty Co. Ltd. (H Shares) | | 5,835,680 | 6,553,684 |
| Ping An Insurance (Group) Co. of China Ltd. (H Shares) | | 2,030,000 | 24,572,471 |
| Qingdao Port International Co. Ltd. (H Shares) (a)(c) | | 13,679,000 | 9,503,180 |
| Shanghai International Airport Co. Ltd. (A Shares) | | 1,608,769 | 16,871,424 |
| Shanghai M&G Stationery, Inc. (A Shares) | | 1,293,554 | 7,185,237 |
| Shenzhen Expressway Co. (H Shares) | | 12,018,000 | 14,630,316 |
| Sinopec Engineering Group Co. Ltd. (H Shares) | | 7,181,000 | 6,938,606 |
| Tonghua Dongbao Pharmaceutical Co. Ltd. (A Shares) | | 3,624,752 | 8,503,628 |
| Wuliangye Yibin Co. Ltd. (A Shares) | | 680,421 | 10,341,340 |
| Yunnan Baiyao Group Co. Ltd. (A Shares) | | 816,721 | 10,732,128 |
| Zhejiang Sanhua Intelligent Controls Co. Ltd. (A Shares) | | 2,534,800 | 5,984,249 |
|
| TOTAL CHINA | | | 214,641,488 |
|
| Hong Kong - 8.8% | | | |
| AIA Group Ltd. | | 5,025,400 | 51,457,260 |
| Dah Sing Banking Group Ltd. | | 4,246,800 | 8,120,284 |
| Hong Kong Exchanges and Clearing Ltd. | | 406,732 | 14,102,476 |
| Sino Land Ltd. | | 4,624,147 | 8,134,462 |
| Techtronic Industries Co. Ltd. | | 2,126,500 | 15,369,742 |
|
| TOTAL HONG KONG | | | 97,184,224 |
|
| India - 15.8% | | | |
| Axis Bank Ltd. (a) | | 1,218,557 | 13,416,952 |
| Bharti Infratel Ltd. | | 521,962 | 1,967,653 |
| CCL Products (India) Ltd. | | 1,695,830 | 6,303,938 |
| Havells India Ltd. (a) | | 544,441 | 6,055,555 |
| HDFC Asset Management Co. Ltd. (c) | | 230,843 | 5,618,195 |
| HDFC Bank Ltd. | | 644,419 | 21,379,041 |
| Housing Development Finance Corp. Ltd. | | 976,264 | 27,965,246 |
| Indraprastha Gas Ltd. (a) | | 1,495,627 | 6,717,190 |
| Oberoi Realty Ltd. | | 1,299,217 | 9,463,333 |
| Petronet LNG Ltd. | | 3,241,160 | 11,222,389 |
| Power Grid Corp. of India Ltd. | | 5,033,838 | 13,472,331 |
| Reliance Industries Ltd. | | 1,730,254 | 34,601,602 |
| TCNS Clothing Co. Ltd. (a)(c) | | 612,592 | 7,224,323 |
| UPL Ltd. (a) | | 595,732 | 8,289,713 |
|
| TOTAL INDIA | | | 173,697,461 |
|
| Indonesia - 2.9% | | | |
| PT Bank Central Asia Tbk | | 9,412,000 | 18,989,123 |
| PT Bank Rakyat Indonesia Tbk | | 43,615,300 | 13,375,359 |
|
| TOTAL INDONESIA | | | 32,364,482 |
|
| Israel - 0.1% | | | |
| Sarine Technologies Ltd. | | 3,360,700 | 901,886 |
| Japan - 1.4% | | | |
| Keyence Corp. | | 11,500 | 7,135,688 |
| SoftBank Corp. | | 82,700 | 8,768,796 |
|
| TOTAL JAPAN | | | 15,904,484 |
|
| Korea (South) - 5.6% | | | |
| Cafe24 Corp. (a) | | 7,758 | 639,830 |
| Cuckoo Holdings Co. Ltd. | | 19,176 | 2,396,979 |
| Hyundai Fire & Marine Insurance Co. Ltd. | | 185,021 | 6,079,890 |
| KB Financial Group, Inc. | | 293,764 | 11,640,638 |
| LG Chemical Ltd. | | 24,363 | 7,555,814 |
| Samsung Electronics Co. Ltd. | | 385,290 | 15,176,456 |
| SK Hynix, Inc. | | 273,106 | 18,535,385 |
|
| TOTAL KOREA (SOUTH) | | | 62,024,992 |
|
| Malaysia - 0.3% | | | |
| Bursa Malaysia Bhd | | 2,156,100 | 3,520,057 |
| Multi-National - 1.7% | | | |
| HKT Trust/HKT Ltd. unit | | 12,373,300 | 19,179,498 |
| Philippines - 1.3% | | | |
| Ayala Land, Inc. | | 15,194,500 | 14,369,605 |
| Singapore - 0.7% | | | |
| Wing Tai Holdings Ltd. | | 5,055,300 | 7,619,561 |
| Taiwan - 9.2% | | | |
| E.SUN Financial Holdings Co. Ltd. | | 15,064,131 | 12,357,638 |
| Micro-Star International Co. Ltd. | | 2,101,000 | 5,819,869 |
| Taiwan Semiconductor Manufacturing Co. Ltd. | | 8,642,892 | 72,563,651 |
| Voltronic Power Technology Corp. | | 545,000 | 10,758,203 |
|
| TOTAL TAIWAN | | | 101,499,361 |
|
| Thailand - 1.9% | | | |
| Bangkok Bank PCL (For. Reg.) | | 800,800 | 5,243,744 |
| Home Product Center PCL (For. Reg.) | | 15,130,200 | 7,442,442 |
| Thai Beverage PCL | | 12,884,100 | 7,957,241 |
|
| TOTAL THAILAND | | | 20,643,427 |
|
| United States of America - 0.9% | | | |
| IPG Photonics Corp. (a) | | 58,200 | 10,169,286 |
| TOTAL COMMON STOCKS | | | |
| (Cost $710,883,351) | | | 1,029,702,859 |
|
| Nonconvertible Preferred Stocks - 1.0% | | | |
| Korea (South) - 1.0% | | | |
| Samsung Electronics Co. Ltd. | | | |
| (Cost $11,948,927) | | 335,850 | 10,733,258 |
|
| Money Market Funds - 5.7% | | | |
| Fidelity Cash Central Fund, 2.49% (d) | | 58,171,987 | 58,183,622 |
| Fidelity Securities Lending Cash Central Fund 2.49% (d)(e) | | 4,368,890 | 4,369,327 |
| TOTAL MONEY MARKET FUNDS | | | |
| (Cost $62,551,973) | | | 62,552,949 |
| TOTAL INVESTMENT IN SECURITIES - 100.0% | | | |
| (Cost $785,384,251) | | | 1,102,989,066 |
| NET OTHER ASSETS (LIABILITIES) - 0.0% | | | 235,690 |
| NET ASSETS - 100% | | | $1,103,224,756 |
Categorizations in the Schedule of Investments are based on country or territory of incorporation.
Legend
(a) Non-income producing
(b) Security or a portion of the security is on loan at period end.
(c) Security exempt from registration under Rule 144A of the Securities Act of 1933. These securities may be resold in transactions exempt from registration, normally to qualified institutional buyers. At the end of the period, the value of these securities amounted to $22,345,698 or 2.0% of net assets.
(d) Affiliated fund that is generally available only to investment companies and other accounts managed by Fidelity Investments. The rate quoted is the annualized seven-day yield of the fund at period end. A complete unaudited listing of the fund's holdings as of its most recent quarter end is available upon request. In addition, each Fidelity Central Fund's financial statements are available on the SEC's website or upon request.
(e) Investment made with cash collateral received from securities on loan.
Affiliated Central Funds
Information regarding fiscal year to date income earned by the Fund from investments in Fidelity Central Funds is as follows:
| Fund | Income earned |
| Fidelity Cash Central Fund | $393,412 |
| Fidelity Securities Lending Cash Central Fund | 25,604 |
| Total | $419,016 |
Amounts in the income column in the above table include any capital gain distributions from underlying funds, which are presented in the corresponding line-item in the Statement of Operations, if applicable.
Investment Valuation
The following is a summary of the inputs used, as of April 30, 2019, involving the Fund's assets and liabilities carried at fair value. The inputs or methodology used for valuing securities may not be an indication of the risk associated with investing in those securities. For more information on valuation inputs, and their aggregation into the levels used below, please refer to the Investment Valuation section in the accompanying Notes to Financial Statements.
| | Valuation Inputs at Reporting Date: |
| Description | Total | Level 1 | Level 2 | Level 3 |
| Investments in Securities: | | | | |
| Equities: | | | | |
| Communication Services | $140,613,758 | $36,192,389 | $104,421,369 | $-- |
| Consumer Discretionary | 143,243,570 | 143,243,570 | -- | -- |
| Consumer Staples | 80,462,972 | 80,462,972 | -- | -- |
| Energy | 51,719,421 | 51,719,421 | -- | -- |
| Financials | 263,325,810 | 154,276,400 | 109,049,410 | -- |
| Health Care | 29,048,890 | 29,048,890 | -- | -- |
| Industrials | 94,270,565 | 94,270,565 | -- | -- |
| Information Technology | 145,030,962 | 72,467,311 | 72,563,651 | -- |
| Materials | 15,845,527 | 15,845,527 | -- | -- |
| Real Estate | 56,685,121 | 56,685,121 | -- | -- |
| Utilities | 20,189,521 | 20,189,521 | -- | -- |
| Money Market Funds | 62,552,949 | 62,552,949 | -- | -- |
| Total Investments in Securities: | $1,102,989,066 | $816,954,636 | $286,034,430 | $-- |
See accompanying notes which are an integral part of the financial statements.
Fidelity® Emerging Asia Fund
Financial Statements
Statement of Assets and Liabilities
| | | April 30, 2019 (Unaudited) |
| Assets | | |
Investment in securities, at value (including securities loaned of $4,153,143) — See accompanying schedule:
Unaffiliated issuers (cost $722,832,278) | $1,040,436,117 | |
| Fidelity Central Funds (cost $62,551,973) | 62,552,949 | |
| Total Investment in Securities (cost $785,384,251) | | $1,102,989,066 |
| Foreign currency held at value (cost $3,714,250) | | 3,714,250 |
| Receivable for investments sold | | 4,271,187 |
| Receivable for fund shares sold | | 676,252 |
| Dividends receivable | | 822,786 |
| Distributions receivable from Fidelity Central Funds | | 105,907 |
| Prepaid expenses | | 631 |
| Other receivables | | 391,416 |
| Total assets | | 1,112,971,495 |
| Liabilities | | |
| Payable for investments purchased | $3,118,457 | |
| Payable for fund shares redeemed | 1,005,109 | |
| Accrued management fee | 798,779 | |
| Other affiliated payables | 191,713 | |
| Other payables and accrued expenses | 263,521 | |
| Collateral on securities loaned | 4,369,160 | |
| Total liabilities | | 9,746,739 |
| Net Assets | | $1,103,224,756 |
| Net Assets consist of: | | |
| Paid in capital | | $801,995,239 |
| Total distributable earnings (loss) | | 301,229,517 |
| Net Assets, for 25,031,823 shares outstanding | | $1,103,224,756 |
| Net Asset Value, offering price and redemption price per share ($1,103,224,756 ÷ 25,031,823 shares) | | $44.07 |
See accompanying notes which are an integral part of the financial statements.
Statement of Operations
| | | Six months ended April 30, 2019 (Unaudited) |
| Investment Income | | |
| Dividends | | $5,073,843 |
| Income from Fidelity Central Funds | | 419,016 |
| Income before foreign taxes withheld | | 5,492,859 |
| Less foreign taxes withheld | | (397,541) |
| Total income | | 5,095,318 |
| Expenses | | |
| Management fee | | |
| Basic fee | $3,401,034 | |
| Performance adjustment | 446,487 | |
| Transfer agent fees | 854,713 | |
| Accounting and security lending fees | 230,832 | |
| Custodian fees and expenses | 157,797 | |
| Independent trustees' fees and expenses | 2,712 | |
| Registration fees | 26,825 | |
| Audit | 67,364 | |
| Legal | 2,216 | |
| Miscellaneous | 18,557 | |
| Total expenses before reductions | 5,208,537 | |
| Expense reductions | (3,698) | |
| Total expenses after reductions | | 5,204,839 |
| Net investment income (loss) | | (109,521) |
| Realized and Unrealized Gain (Loss) | | |
| Net realized gain (loss) on: | | |
| Investment securities: | | |
| Unaffiliated issuers | (13,232,821) | |
| Fidelity Central Funds | (976) | |
| Foreign currency transactions | (191,123) | |
| Total net realized gain (loss) | | (13,424,920) |
| Change in net unrealized appreciation (depreciation) on: | | |
| Investment securities: | | |
| Unaffiliated issuers (net of increase in deferred foreign taxes of $145,685) | 227,611,982 | |
| Fidelity Central Funds | 976 | |
| Assets and liabilities in foreign currencies | 26,750 | |
| Total change in net unrealized appreciation (depreciation) | | 227,639,708 |
| Net gain (loss) | | 214,214,788 |
| Net increase (decrease) in net assets resulting from operations | | $214,105,267 |
See accompanying notes which are an integral part of the financial statements.
Statement of Changes in Net Assets
| | Six months ended April 30, 2019 (Unaudited) | Year ended October 31, 2018 |
| Increase (Decrease) in Net Assets | | |
| Operations | | |
| Net investment income (loss) | $(109,521) | $11,853,453 |
| Net realized gain (loss) | (13,424,920) | 65,607,429 |
| Change in net unrealized appreciation (depreciation) | 227,639,708 | (262,687,708) |
| Net increase (decrease) in net assets resulting from operations | 214,105,267 | (185,226,826) |
| Distributions to shareholders | (30,935,746) | (11,209,950) |
| Share transactions | | |
| Proceeds from sales of shares | 75,985,753 | 413,143,734 |
| Reinvestment of distributions | 27,229,181 | 9,352,064 |
| Cost of shares redeemed | (97,099,676) | (598,473,348) |
| Net increase (decrease) in net assets resulting from share transactions | 6,115,258 | (175,977,550) |
| Redemption fees | – | 23,229 |
| Total increase (decrease) in net assets | 189,284,779 | (372,391,097) |
| Net Assets | | |
| Beginning of period | 913,939,977 | 1,286,331,074 |
| End of period | $1,103,224,756 | $913,939,977 |
| Other Information | | |
| Shares | | |
| Sold | 1,857,795 | 9,234,180 |
| Issued in reinvestment of distributions | 736,521 | 215,039 |
| Redeemed | (2,469,705) | (13,816,562) |
| Net increase (decrease) | 124,611 | (4,367,343) |
See accompanying notes which are an integral part of the financial statements.
Financial Highlights
Fidelity Emerging Asia Fund
| | Six months ended (Unaudited) April 30, | Years endedOctober 31, | | | | |
| | 2019 | 2018 | 2017 | 2016 | 2015 | 2014 |
| Selected Per–Share Data | | | | | | |
| Net asset value, beginning of period | $36.69 | $43.94 | $33.37 | $31.20 | $33.03 | $30.91 |
| Income from Investment Operations | | | | | | |
| Net investment income (loss)A | –B | .41 | .40 | .39 | .42 | .43 |
| Net realized and unrealized gain (loss) | 8.65 | (7.27) | 10.56 | 1.91 | (1.96) | 2.08 |
| Total from investment operations | 8.65 | (6.86) | 10.96 | 2.30 | (1.54) | 2.51 |
| Distributions from net investment income | (.39) | (.37) | (.34) | (.13) | (.29) | (.39) |
| Distributions from net realized gain | (.88) | (.02) | (.05) | – | – | – |
| Total distributions | (1.27) | (.39) | (.39) | (.13) | (.29) | (.39) |
| Redemption fees added to paid in capitalA | – | –B | –B | –B | –B | –B |
| Net asset value, end of period | $44.07 | $36.69 | $43.94 | $33.37 | $31.20 | $33.03 |
| Total ReturnC,D | 24.24% | (15.75)% | 33.28% | 7.42% | (4.69)% | 8.21% |
| Ratios to Average Net AssetsE,F | | | | | | |
| Expenses before reductions | 1.05%G | 1.02% | 1.10% | 1.16% | 1.09% | 1.04% |
| Expenses net of fee waivers, if any | 1.05%G | 1.02% | 1.10% | 1.16% | 1.09% | 1.04% |
| Expenses net of all reductions | 1.05%G | 1.00% | 1.08% | 1.16% | 1.09% | 1.04% |
| Net investment income (loss) | (.02)%G | .93% | 1.07% | 1.25% | 1.26% | 1.36% |
| Supplemental Data | | | | | | |
| Net assets, end of period (000 omitted) | $1,103,225 | $913,940 | $1,286,331 | $922,265 | $1,008,178 | $1,111,277 |
| Portfolio turnover rateH | 37%G | 36% | 40% | 77% | 68% | 90% |
A Calculated based on average shares outstanding during the period.
B Amount represents less than $.005 per share.
C Total returns for periods of less than one year are not annualized.
D Total returns would have been lower if certain expenses had not been reduced during the applicable periods shown.
E Fees and expenses of any underlying Fidelity Central Funds are not included in the Fund's expense ratio. The Fund indirectly bears its proportionate share of the expenses of any underlying Fidelity Central Funds.
F Expense ratios reflect operating expenses of the Fund. Expenses before reductions do not reflect amounts reimbursed by the investment adviser or reductions from brokerage service arrangements or reductions from other expense offset arrangements and do not represent the amount paid by the Fund during periods when reimbursements or reductions occur. Expenses net of fee waivers reflect expenses after reimbursement by the investment adviser but prior to reductions from brokerage service arrangements or other expense offset arrangements. Expenses net of all reductions represent the net expenses paid by the Fund.
G Annualized
H Amount does not include the portfolio activity of any underlying Fidelity Central Funds.
See accompanying notes which are an integral part of the financial statements.
Notes to Financial Statements (Unaudited)
For the period ended April 30, 2019
1. Organization.
Fidelity Emerging Asia Fund (the Fund) is a fund of Fidelity Investment Trust (the Trust) and is authorized to issue an unlimited number of shares. Share transactions on the Statement of Changes in Net Assets may contain exchanges between affiliated funds. The Trust is registered under the Investment Company Act of 1940, as amended (the 1940 Act), as an open-end management investment company organized as a Massachusetts business trust. The Fund's investments in emerging markets can be subject to social, economic, regulatory, and political uncertainties and can be extremely volatile.
2. Investments in Fidelity Central Funds.
The Fund invests in Fidelity Central Funds, which are open-end investment companies generally available only to other investment companies and accounts managed by the investment adviser and its affiliates. The Fund's Schedule of Investments lists each of the Fidelity Central Funds held as of period end, if any, as an investment of the Fund, but does not include the underlying holdings of each Fidelity Central Fund. As an Investing Fund, the Fund indirectly bears its proportionate share of the expenses of the underlying Fidelity Central Funds.
The Money Market Central Funds seek preservation of capital and current income and are managed by Fidelity Investments Money Management, Inc. (FIMM), an affiliate of the investment adviser. Annualized expenses of the Money Market Central Funds as of their most recent shareholder report date are less than .005%.
A complete unaudited list of holdings for each Fidelity Central Fund is available upon request or at the Securities and Exchange Commission (the SEC) website at www.sec.gov. In addition, the financial statements of the Fidelity Central Funds are available on the SEC website or upon request.
3. Significant Accounting Policies.
The Fund is an investment company and applies the accounting and reporting guidance of the Financial Accounting Standards Board (FASB) Accounting Standards Codification Topic 946 Financial Services – Investments Companies. The financial statements have been prepared in conformity with accounting principles generally accepted in the United States of America (GAAP), which require management to make certain estimates and assumptions at the date of the financial statements. Actual results could differ from those estimates. Subsequent events, if any, through the date that the financial statements were issued have been evaluated in the preparation of the financial statements. The following summarizes the significant accounting policies of the Fund:
Investment Valuation. Investments are valued as of 4:00 p.m. Eastern time on the last calendar day of the period. The Board of Trustees (the Board) has delegated the day to day responsibility for the valuation of the Fund's investments to the Fair Value Committee (the Committee) established by the Fund's investment adviser. In accordance with valuation policies and procedures approved by the Board, the Fund attempts to obtain prices from one or more third party pricing vendors or brokers to value its investments. When current market prices, quotations or currency exchange rates are not readily available or reliable, investments will be fair valued in good faith by the Committee, in accordance with procedures adopted by the Board. Factors used in determining fair value vary by investment type and may include market or investment specific events. The frequency with which these procedures are used cannot be predicted and they may be utilized to a significant extent. The Committee oversees the Fund's valuation policies and procedures and reports to the Board on the Committee's activities and fair value determinations. The Board monitors the appropriateness of the procedures used in valuing the Fund's investments and ratifies the fair value determinations of the Committee.
The Fund categorizes the inputs to valuation techniques used to value its investments into a disclosure hierarchy consisting of three levels as shown below:
- Level 1 – quoted prices in active markets for identical investments
- Level 2 – other significant observable inputs (including quoted prices for similar investments, interest rates, prepayment speeds, etc.)
- Level 3 – unobservable inputs (including the Fund's own assumptions based on the best information available)
Valuation techniques used to value the Fund's investments by major category are as follows:
Equity securities, including restricted securities, for which market quotations are readily available, are valued at the last reported sale price or official closing price as reported by a third party pricing vendor on the primary market or exchange on which they are traded and are categorized as Level 1 in the hierarchy. In the event there were no sales during the day or closing prices are not available, securities are valued at the last quoted bid price or may be valued using the last available price and are generally categorized as Level 2 in the hierarchy. For foreign equity securities, when market or security specific events arise, comparisons to the valuation of American Depositary Receipts (ADRs), futures contracts, Exchange-Traded Funds (ETFs) and certain indexes as well as quoted prices for similar securities may be used and would be categorized as Level 2 in the hierarchy. For equity securities, including restricted securities, where observable inputs are limited, assumptions about market activity and risk are used and these securities may be categorized as Level 3 in the hierarchy.
Investments in open-end mutual funds, including the Fidelity Central Funds, are valued at their closing net asset value (NAV) each business day and are categorized as Level 1 in the hierarchy.
Changes in valuation techniques may result in transfers in or out of an assigned level within the disclosure hierarchy. The aggregate value of investments by input level as of April 30, 2019 is included at the end of the Fund's Schedule of Investments.
Foreign Currency. The Fund may use foreign currency contracts to facilitate transactions in foreign-denominated securities. Gains and losses from these transactions may arise from changes in the value of the foreign currency or if the counterparties do not perform under the contracts' terms.
Foreign-denominated assets, including investment securities, and liabilities are translated into U.S. dollars at the exchange rates at period end. Purchases and sales of investment securities, income and dividends received and expenses denominated in foreign currencies are translated into U.S. dollars at the exchange rate in effect on the transaction date.
The effects of exchange rate fluctuations on investments are included with the net realized and unrealized gain (loss) on investment securities. Other foreign currency transactions resulting in realized and unrealized gain (loss) are disclosed separately.
Investment Transactions and Income. For financial reporting purposes, the Fund's investment holdings and NAV include trades executed through the end of the last business day of the period. The NAV per share for processing shareholder transactions is calculated as of the close of business of the New York Stock Exchange (NYSE), normally 4:00 p.m. Eastern time and includes trades executed through the end of the prior business day. Gains and losses on securities sold are determined on the basis of identified cost and include proceeds received from litigation. Dividend income is recorded on the ex-dividend date, except for certain dividends from foreign securities where the ex-dividend date may have passed, which are recorded as soon as the Fund is informed of the ex-dividend date. Non-cash dividends included in dividend income, if any, are recorded at the fair market value of the securities received. Income and capital gain distributions from Fidelity Central Funds, if any, are recorded on the ex-dividend date. Certain distributions received by the Fund represent a return of capital or capital gain. The Fund determines the components of these distributions subsequent to the ex-dividend date, based upon receipt of tax filings or other correspondence relating to the underlying investment. These distributions are recorded as a reduction of cost of investments and/or as a realized gain. Investment income is recorded net of foreign taxes withheld where recovery of such taxes is uncertain.
Expenses. Expenses directly attributable to a fund are charged to that fund. Expenses attributable to more than one fund are allocated among the respective funds on the basis of relative net assets or other appropriate methods. Expense estimates are accrued in the period to which they relate and adjustments are made when actual amounts are known.
Income Tax Information and Distributions to Shareholders. Each year, the Fund intends to qualify as a regulated investment company under Subchapter M of the Internal Revenue Code, including distributing substantially all of its taxable income and realized gains. As a result, no provision for U.S. Federal income taxes is required. The Fund files a U.S. federal tax return, in addition to state and local tax returns as required. The Fund's federal income tax returns are subject to examination by the Internal Revenue Service (IRS) for a period of three fiscal years after they are filed. State and local tax returns may be subject to examination for an additional fiscal year depending on the jurisdiction. Foreign taxes are provided for based on the Fund's understanding of the tax rules and rates that exist in the foreign markets in which it invests. The Fund is subject to a tax imposed on capital gains by certain countries in which it invests. An estimated deferred tax liability for net unrealized appreciation on the applicable securities is included in Other payables and accrued expenses on the Statement of Assets & Liabilities.
Distributions are declared and recorded on the ex-dividend date. Income and capital gain distributions are determined in accordance with income tax regulations, which may differ from GAAP.
Capital accounts within the financial statements are adjusted for permanent book-tax differences. These adjustments have no impact on net assets or the results of operations. Capital accounts are not adjusted for temporary book-tax differences which will reverse in a subsequent period.
Book-tax differences are primarily due to foreign currency transactions, passive foreign investment companies (PFIC), deferred trustees compensation, capital loss carryforwards and losses deferred due to wash sales.
As of period end, the cost and unrealized appreciation (depreciation) in securities, and derivatives if applicable, for federal income tax purposes were as follows:
| Gross unrealized appreciation | $346,846,438 |
| Gross unrealized depreciation | (33,118,912) |
| Net unrealized appreciation (depreciation) | $313,727,526 |
| Tax cost | $789,261,540 |
Restricted Securities. The Fund may invest in securities that are subject to legal or contractual restrictions on resale. These securities generally may be resold in transactions exempt from registration or to the public if the securities are registered. Disposal of these securities may involve time-consuming negotiations and expense, and prompt sale at an acceptable price may be difficult. Information regarding restricted securities is included at the end of the Fund's Schedule of Investments.
4. Purchases and Sales of Investments.
Purchases and sales of securities, other than short-term securities, aggregated $174,692,350 and $199,717,203, respectively.
5. Fees and Other Transactions with Affiliates.
Management Fee. Fidelity Management & Research Company (the investment adviser) and its affiliates provide the Fund with investment management related services for which the Fund pays a monthly management fee. The management fee is the sum of an individual fund fee rate that is based on an annual rate of .45% of the Fund's average net assets and an annualized group fee rate that averaged .24% during the period. The group fee rate is based upon the average net assets of all the mutual funds advised by the investment adviser, including any mutual funds previously advised by the investment adviser that are currently advised by Fidelity SelectCo, LLC, an affiliate of the investment adviser. The group fee rate decreases as assets under management increase and increases as assets under management decrease. In addition, the management fee is subject to a performance adjustment (up to a maximum of +/- .20% of the Fund's average net assets over a 36 month performance period). The upward or downward adjustment to the management fee is based on the Fund's relative investment performance as compared to its benchmark index, the MSCI All Country Asia ex Japan Index, over the same 36 month performance period. For the reporting period, the total annualized management fee rate, including the performance adjustment, was .78% of the Fund's average net assets. The performance adjustment included in the management fee rate may be higher or lower than the maximum performance adjustment rate due to the difference between the average net assets for the reporting and performance periods.
Transfer Agent Fees. Fidelity Investments Institutional Operations Company, Inc. (FIIOC), an affiliate of the investment adviser, is the Fund's transfer, dividend disbursing and shareholder servicing agent. FIIOC receives account fees and asset-based fees that vary according to account size and type of account. FIIOC pays for typesetting, printing and mailing of shareholder reports, except proxy statements. For the period, the transfer agent fees were equivalent to an annualized rate of .17% of average net assets.
Accounting and Security Lending Fees. Fidelity Service Company, Inc. (FSC), an affiliate of the investment adviser, maintains the Fund's accounting records. The accounting fee is based on the level of average net assets for each month. Prior to April 1, 2019, FSC had a separate agreement with the Fund for administration of the security lending program, based on the number and duration of lending transactions. For the period, the total fees paid for accounting and administration of securities lending were equivalent to an annualized rate of .05%.
Brokerage Commissions. The Fund placed a portion of its portfolio transactions with brokerage firms which are affiliates of the investment adviser. Brokerage commissions are included in net realized gain (loss) and change in net unrealized appreciation (depreciation) in the Statement of Operations. The commissions paid to these affiliated firms were $377 for the period.
Interfund Trades. The Fund may purchase from or sell securities to other Fidelity Funds under procedures adopted by the Board. The procedures have been designed to ensure these interfund trades are executed in accordance with Rule 17a-7 of the 1940 Act. Interfund trades are included within the respective purchases and sales amounts shown in the Purchases and Sales of Investments note.
6. Committed Line of Credit.
The Fund participates with other funds managed by the investment adviser or an affiliate in a $4.25 billion credit facility (the "line of credit") to be utilized for temporary or emergency purposes to fund shareholder redemptions or for other short-term liquidity purposes. The Fund has agreed to pay commitment fees on its pro-rata portion of the line of credit, which amounted to $1,383 and is reflected in Miscellaneous expenses on the Statement of Operations. During the period, the Fund did not borrow on this line of credit.
7. Security Lending.
The Fund lends portfolio securities through a lending agent from time to time in order to earn additional income. For equity securities, a lending agent is used and may loan securities to certain qualified borrowers, including Fidelity Capital Markets (FCM), a broker-dealer affiliated with the Fund. On the settlement date of the loan, the Fund receives collateral (in the form of U.S. Treasury obligations, letters of credit and/or cash) against the loaned securities and maintains collateral in an amount not less than 100% of the market value of the loaned securities during the period of the loan. The market value of the loaned securities is determined at the close of business of the Fund and any additional required collateral is delivered to the Fund on the next business day. The Fund or borrower may terminate the loan at any time, and if the borrower defaults on its obligation to return the securities loaned because of insolvency or other reasons, the Fund may apply collateral received from the borrower against the obligation. The Fund may experience delays and costs in recovering the securities loaned. Any cash collateral received is invested in the Fidelity Securities Lending Cash Central Fund. The value of loaned securities and cash collateral at period end are disclosed on the Fund's Statement of Assets and Liabilities. Security lending income represents the income earned on investing cash collateral, less rebates paid to borrowers and any lending agent fees associated with the loan, plus any premium payments received for lending certain types of securities. Security lending income is presented in the Statement of Operations as a component of income from Fidelity Central Funds. Total security lending income during the period amounted to $25,604. During the period, there were no securities loaned to FCM.
8. Expense Reductions.
Through arrangements with the Fund's transfer agent, credits realized as a result of certain uninvested cash balances were used to reduce the Fund's expenses. During the period, these credits reduced the Fund's transfer agent expenses by $3.
In addition, during the period the investment adviser reimbursed and/or waived a portion of operating expenses in the amount of $3,695.
9. Other.
The Fund's organizational documents provide former and current trustees and officers with a limited indemnification against liabilities arising in connection with the performance of their duties to the Fund. In the normal course of business, the Fund may also enter into contracts that provide general indemnifications. The Fund's maximum exposure under these arrangements is unknown as this would be dependent on future claims that may be made against the Fund. The risk of material loss from such claims is considered remote.
Fidelity® Emerging Markets Fund
Investment Summary (Unaudited)
Geographic Diversification (% of fund's net assets)
| As of April 30, 2019 |
| | Cayman Islands | 13.5% |
| | India | 11.9% |
| | Brazil | 11.4% |
| | China | 9.9% |
| | United States of America* | 9.0% |
| | South Africa | 5.9% |
| | Taiwan | 5.8% |
| | Russia | 5.1% |
| | France | 4.4% |
| | Other | 23.1% |

* Includes Short-Term investments and Net Other Assets (Liabilities).
Percentages are based on country or territory of incorporation and are adjusted for the effect of futures contracts, if applicable.
Asset Allocation as of April 30, 2019
| | % of fund's net assets |
| Stocks | 97.9 |
| Short-Term Investments and Net Other Assets (Liabilities) | 2.1 |
Top Ten Stocks as of April 30, 2019
| | % of fund's net assets |
| Tencent Holdings Ltd. (Cayman Islands, Interactive Media & Services) | 6.0 |
| Alibaba Group Holding Ltd. sponsored ADR (Cayman Islands, Internet & Direct Marketing Retail) | 5.2 |
| Taiwan Semiconductor Manufacturing Co. Ltd. (Taiwan, Semiconductors & Semiconductor Equipment) | 4.8 |
| Naspers Ltd. Class N (South Africa, Internet & Direct Marketing Retail) | 3.1 |
| Samsung Electronics Co. Ltd. (Korea (South), Technology Hardware, Storage & Peripherals) | 2.6 |
| Ping An Insurance (Group) Co. of China Ltd. (H Shares) (China, Insurance) | 2.2 |
| Reliance Industries Ltd. (India, Oil, Gas & Consumable Fuels) | 2.0 |
| Housing Development Finance Corp. Ltd. (India, Thrifts & Mortgage Finance) | 1.7 |
| Petroleo Brasileiro SA - Petrobras sponsored ADR (Brazil, Oil, Gas & Consumable Fuels) | 1.7 |
| Sberbank of Russia (Russia, Banks) | 1.5 |
| | 30.8 |
Top Market Sectors as of April 30, 2019
| | % of fund's net assets |
| Financials | 22.8 |
| Information Technology | 19.2 |
| Consumer Discretionary | 16.0 |
| Consumer Staples | 8.2 |
| Materials | 7.0 |
| Communication Services | 7.0 |
| Energy | 6.4 |
| Industrials | 4.7 |
| Health Care | 3.7 |
| Real Estate | 2.0 |
Fidelity® Emerging Markets Fund
Schedule of Investments April 30, 2019 (Unaudited)
Showing Percentage of Net Assets
| Common Stocks - 94.7% | | | |
| | | Shares | Value |
| Belgium - 0.5% | | | |
| Umicore SA | | 595,938 | $23,059,940 |
| Bermuda - 1.1% | | | |
| Credicorp Ltd. (United States) | | 207,232 | 49,093,261 |
| Brazil - 8.2% | | | |
| BM&F BOVESPA SA | | 6,071,700 | 53,344,741 |
| Equatorial Energia SA | | 1,896,100 | 39,700,546 |
| Localiza Rent A Car SA | | 5,710,700 | 52,721,772 |
| Lojas Renner SA | | 4,140,500 | 49,503,109 |
| Notre Dame Intermedica Participacoes SA | | 4,871,800 | 43,635,106 |
| Rumo SA (a) | | 9,223,300 | 42,575,229 |
| Suzano Papel e Celulose SA | | 3,294,900 | 34,225,416 |
| Vale SA sponsored ADR | | 4,950,400 | 63,266,112 |
|
| TOTAL BRAZIL | | | 378,972,031 |
|
| Cayman Islands - 13.5% | | | |
| Alibaba Group Holding Ltd. sponsored ADR (a) | | 1,303,800 | 241,946,166 |
| New Oriental Education & Technology Group, Inc. sponsored ADR (a) | | 578,683 | 55,241,079 |
| Shenzhou International Group Holdings Ltd. | | 3,835,300 | 51,480,865 |
| Tencent Holdings Ltd. | | 5,643,700 | 278,164,782 |
|
| TOTAL CAYMAN ISLANDS | | | 626,832,892 |
|
| Chile - 1.7% | | | |
| Banco Santander Chile sponsored ADR | | 1,353,800 | 37,906,400 |
| Sociedad Quimica y Minera de Chile SA (PN-B) sponsored ADR (b) | | 1,177,800 | 41,976,792 |
|
| TOTAL CHILE | | | 79,883,192 |
|
| China - 9.9% | | | |
| Foshan Haitian Flavouring & Food Co. Ltd. (A Shares) | | 3,184,390 | 42,213,298 |
| Inner Mongoli Yili Industries Co. Ltd. (A Shares) | | 8,665,600 | 39,886,799 |
| Jiangsu Yanghe Brewery JSC Ltd. (A Shares) | | 2,395,606 | 41,851,698 |
| Kweichow Moutai Co. Ltd. (A Shares) | | 464,030 | 67,107,933 |
| Midea Group Co. Ltd. (A Shares) | | 5,760,648 | 44,819,961 |
| Ping An Insurance (Group) Co. of China Ltd. (H Shares) | | 8,233,000 | 99,657,710 |
| Shanghai International Airport Co. Ltd. (A Shares) | | 4,413,700 | 46,287,195 |
| Shenzhen Inovance Technology Co. Ltd. (A Shares) | | 10,329,062 | 38,602,279 |
| Wuliangye Yibin Co. Ltd. (A Shares) | | 2,427,350 | 36,891,943 |
|
| TOTAL CHINA | | | 457,318,816 |
|
| France - 4.4% | | | |
| Dassault Systemes SA | | 267,900 | 42,382,230 |
| Hermes International SCA | | 57,184 | 40,227,087 |
| Kering SA | | 70,387 | 41,604,573 |
| LVMH Moet Hennessy - Louis Vuitton SA | | 111,458 | 43,760,333 |
| Pernod Ricard SA | | 203,400 | 35,440,530 |
|
| TOTAL FRANCE | | | 203,414,753 |
|
| Hong Kong - 1.7% | | | |
| AIA Group Ltd. | | 4,271,600 | 43,738,773 |
| Hong Kong Exchanges and Clearing Ltd. | | 1,045,000 | 36,232,919 |
|
| TOTAL HONG KONG | | | 79,971,692 |
|
| India - 11.9% | | | |
| Asian Paints Ltd. | | 2,037,545 | 42,804,916 |
| Axis Bank Ltd. (a) | | 5,697,900 | 62,736,868 |
| Godrej Consumer Products Ltd. | | 4,223,696 | 39,527,978 |
| HDFC Bank Ltd. | | 1,583,997 | 52,550,184 |
| Housing Development Finance Corp. Ltd. | | 2,749,546 | 78,761,206 |
| Infosys Ltd. sponsored ADR | | 6,160,800 | 66,290,208 |
| Kotak Mahindra Bank Ltd. | | 2,543,648 | 50,639,584 |
| Reliance Industries Ltd. | | 4,634,618 | 92,683,044 |
| Tata Consultancy Services Ltd. | | 2,098,800 | 68,115,247 |
|
| TOTAL INDIA | | | 554,109,235 |
|
| Indonesia - 2.5% | | | |
| PT Bank Central Asia Tbk | | 30,544,500 | 61,624,868 |
| PT Bank Rakyat Indonesia Tbk | | 173,389,400 | 53,172,749 |
|
| TOTAL INDONESIA | | | 114,797,617 |
|
| Ireland - 0.9% | | | |
| Accenture PLC Class A | | 224,700 | 41,045,949 |
| Japan - 1.7% | | | |
| Hoya Corp. | | 536,900 | 37,666,623 |
| Keyence Corp. | | 64,300 | 39,897,805 |
|
| TOTAL JAPAN | | | 77,564,428 |
|
| Korea (South) - 3.5% | | | |
| LG Household & Health Care Ltd. | | 34,440 | 42,073,247 |
| Samsung Electronics Co. Ltd. | | 3,015,627 | 118,784,631 |
|
| TOTAL KOREA (SOUTH) | | | 160,857,878 |
|
| Netherlands - 2.7% | | | |
| ASML Holding NV (Netherlands) | | 199,300 | 41,474,662 |
| Unilever NV (Certificaten Van Aandelen) (Bearer) | | 639,800 | 38,710,833 |
| Yandex NV Series A (a) | | 1,185,900 | 44,388,237 |
|
| TOTAL NETHERLANDS | | | 124,573,732 |
|
| Philippines - 2.0% | | | |
| Ayala Land, Inc. | | 49,362,300 | 46,682,469 |
| SM Prime Holdings, Inc. | | 58,018,500 | 46,461,878 |
|
| TOTAL PHILIPPINES | | | 93,144,347 |
|
| Russia - 5.1% | | | |
| Alrosa Co. Ltd. | | 27,919,200 | 40,689,434 |
| Lukoil PJSC sponsored ADR | | 810,600 | 68,722,668 |
| NOVATEK OAO GDR (Reg. S) | | 297,722 | 57,371,029 |
| Sberbank of Russia | | 20,176,310 | 70,684,775 |
|
| TOTAL RUSSIA | | | 237,467,906 |
|
| South Africa - 5.9% | | | |
| Capitec Bank Holdings Ltd. | | 440,900 | 41,198,645 |
| FirstRand Ltd. | | 11,337,100 | 53,820,515 |
| Mondi Ltd. | | 1,674,941 | 36,916,613 |
| Naspers Ltd. Class N | | 555,612 | 142,931,485 |
|
| TOTAL SOUTH AFRICA | | | 274,867,258 |
|
| Spain - 0.8% | | | |
| Amadeus IT Holding SA Class A | | 470,300 | 37,409,483 |
| Sweden - 0.9% | | | |
| Hexagon AB (B Shares) | | 730,400 | 39,903,382 |
| Switzerland - 0.9% | | | |
| Sika AG | | 281,990 | 43,172,324 |
| Taiwan - 5.8% | | | |
| E.SUN Financial Holdings Co. Ltd. | | 56,133,000 | 46,047,879 |
| Taiwan Semiconductor Manufacturing Co. Ltd. | | 26,431,000 | 221,908,346 |
|
| TOTAL TAIWAN | | | 267,956,225 |
|
| United Arab Emirates - 1.1% | | | |
| National Bank of Abu Dhabi PJSC (a) | | 11,414,800 | 49,722,119 |
| United Kingdom - 1.1% | | | |
| NMC Health PLC | | 1,455,751 | 53,570,006 |
| United States of America - 6.9% | | | |
| Adobe, Inc. (a) | | 147,900 | 42,780,075 |
| MasterCard, Inc. Class A | | 165,300 | 42,025,872 |
| MercadoLibre, Inc. (a) | | 57,800 | 27,983,292 |
| Microsoft Corp. | | 332,700 | 43,450,620 |
| Moody's Corp. | | 217,300 | 42,725,526 |
| Thermo Fisher Scientific, Inc. | | 140,000 | 38,843,000 |
| TransDigm Group, Inc. (a) | | 87,200 | 42,075,744 |
| Visa, Inc. Class A | | 249,300 | 40,992,399 |
|
| TOTAL UNITED STATES OF AMERICA | | | 320,876,528 |
|
| TOTAL COMMON STOCKS | | | |
| (Cost $2,968,930,943) | | | 4,389,584,994 |
|
| Nonconvertible Preferred Stocks - 3.2% | | | |
| Brazil - 3.2% | | | |
| Itau Unibanco Holding SA | | 8,017,365 | 69,171,268 |
| Petroleo Brasileiro SA - Petrobras sponsored ADR | | 5,034,500 | 76,675,435 |
| TOTAL NONCONVERTIBLE PREFERRED STOCKS | | | |
| (Cost $117,731,627) | | | 145,846,703 |
|
| Money Market Funds - 3.6% | | | |
| Fidelity Cash Central Fund, 2.49% (c) | | 122,724,661 | 122,749,206 |
| Fidelity Securities Lending Cash Central Fund 2.49% (c)(d) | | 43,278,645 | 43,282,973 |
| TOTAL MONEY MARKET FUNDS | | | |
| (Cost $166,032,179) | | | 166,032,179 |
| TOTAL INVESTMENT IN SECURITIES - 101.5% | | | |
| (Cost $3,252,694,749) | | | 4,701,463,876 |
| NET OTHER ASSETS (LIABILITIES) - (1.5)% | | | (67,425,398) |
| NET ASSETS - 100% | | | $4,634,038,478 |
Categorizations in the Schedule of Investments are based on country or territory of incorporation.
Legend
(a) Non-income producing
(b) Security or a portion of the security is on loan at period end.
(c) Affiliated fund that is generally available only to investment companies and other accounts managed by Fidelity Investments. The rate quoted is the annualized seven-day yield of the fund at period end. A complete unaudited listing of the fund's holdings as of its most recent quarter end is available upon request. In addition, each Fidelity Central Fund's financial statements are available on the SEC's website or upon request.
(d) Investment made with cash collateral received from securities on loan.
Affiliated Central Funds
Information regarding fiscal year to date income earned by the Fund from investments in Fidelity Central Funds is as follows:
| Fund | Income earned |
| Fidelity Cash Central Fund | $578,160 |
| Fidelity Securities Lending Cash Central Fund | 1,956,641 |
| Total | $2,534,801 |
Amounts in the income column in the above table include any capital gain distributions from underlying funds, which are presented in the corresponding line-item in the Statement of Operations, if applicable.
Investment Valuation
The following is a summary of the inputs used, as of April 30, 2019, involving the Fund's assets and liabilities carried at fair value. The inputs or methodology used for valuing securities may not be an indication of the risk associated with investing in those securities. For more information on valuation inputs, and their aggregation into the levels used below, please refer to the Investment Valuation section in the accompanying Notes to Financial Statements.
| | Valuation Inputs at Reporting Date: |
| Description | Total | Level 1 | Level 2 | Level 3 |
| Investments in Securities: | | | | |
| Equities: | | | | |
| Communication Services | $322,553,019 | $44,388,237 | $278,164,782 | $-- |
| Consumer Discretionary | 739,497,950 | 552,806,132 | 186,691,818 | -- |
| Consumer Staples | 383,704,259 | 344,993,426 | 38,710,833 | -- |
| Energy | 295,452,176 | 295,452,176 | -- | -- |
| Financials | 1,052,829,990 | 786,198,548 | 266,631,442 | -- |
| Health Care | 173,714,735 | 173,714,735 | -- | -- |
| Industrials | 222,262,219 | 222,262,219 | -- | -- |
| Information Technology | 886,460,909 | 624,649,181 | 261,811,728 | -- |
| Materials | 326,111,547 | 326,111,547 | -- | -- |
| Real Estate | 93,144,347 | 93,144,347 | -- | -- |
| Utilities | 39,700,546 | 39,700,546 | -- | -- |
| Money Market Funds | 166,032,179 | 166,032,179 | -- | -- |
| Total Investments in Securities: | $4,701,463,876 | $3,669,453,273 | $1,032,010,603 | $-- |
See accompanying notes which are an integral part of the financial statements.
Fidelity® Emerging Markets Fund
Financial Statements
Statement of Assets and Liabilities
| | | April 30, 2019 (Unaudited) |
| Assets | | |
Investment in securities, at value (including securities loaned of $41,967,775) — See accompanying schedule:
Unaffiliated issuers (cost $3,086,662,570) | $4,535,431,697 | |
| Fidelity Central Funds (cost $166,032,179) | 166,032,179 | |
| Total Investment in Securities (cost $3,252,694,749) | | $4,701,463,876 |
| Foreign currency held at value (cost $39,156) | | 39,118 |
| Receivable for investments sold | | 8,715,238 |
| Receivable for fund shares sold | | 2,727,610 |
| Dividends receivable | | 8,131,555 |
| Distributions receivable from Fidelity Central Funds | | 784,438 |
| Prepaid expenses | | 2,367 |
| Other receivables | | 2,699,470 |
| Total assets | | 4,724,563,672 |
| Liabilities | | |
| Payable for investments purchased | $22,648,235 | |
| Payable for fund shares redeemed | 20,668,861 | |
| Accrued management fee | 2,623,812 | |
| Other affiliated payables | 684,118 | |
| Other payables and accrued expenses | 625,316 | |
| Collateral on securities loaned | 43,274,852 | |
| Total liabilities | | 90,525,194 |
| Net Assets | | $4,634,038,478 |
| Net Assets consist of: | | |
| Paid in capital | | $3,375,035,355 |
| Total distributable earnings (loss) | | 1,259,003,123 |
| Net Assets | | $4,634,038,478 |
| Net Asset Value and Maximum Offering Price | | |
| Emerging Markets: | | |
| Net Asset Value, offering price and redemption price per share ($3,644,127,741 ÷ 114,362,313 shares) | | $31.86 |
| Class K: | | |
| Net Asset Value, offering price and redemption price per share ($989,910,737 ÷ 31,052,946 shares) | | $31.88 |
See accompanying notes which are an integral part of the financial statements.
Statement of Operations
| | | Six months ended April 30, 2019 (Unaudited) |
| Investment Income | | |
| Dividends | | $27,951,065 |
| Income from Fidelity Central Funds (including $1,956,641 from security lending) | | 2,534,801 |
| Income before foreign taxes withheld | | 30,485,866 |
| Less foreign taxes withheld | | (2,735,606) |
| Total income | | 27,750,260 |
| Expenses | | |
| Management fee | $14,563,055 | |
| Transfer agent fees | 3,245,969 | |
| Accounting and security lending fees | 772,215 | |
| Custodian fees and expenses | 793,233 | |
| Independent trustees' fees and expenses | 11,825 | |
| Registration fees | 80,940 | |
| Audit | 83,313 | |
| Legal | 6,917 | |
| Interest | 98,754 | |
| Miscellaneous | 14,159 | |
| Total expenses before reductions | 19,670,380 | |
| Expense reductions | (1,081,798) | |
| Total expenses after reductions | | 18,588,582 |
| Net investment income (loss) | | 9,161,678 |
| Realized and Unrealized Gain (Loss) | | |
| Net realized gain (loss) on: | | |
| Investment securities: | | |
| Unaffiliated issuers | 107,657,653 | |
| Fidelity Central Funds | (164) | |
| Foreign currency transactions | (774,524) | |
| Total net realized gain (loss) | | 106,882,965 |
| Change in net unrealized appreciation (depreciation) on: | | |
| Investment securities: | | |
| Unaffiliated issuers | 665,359,340 | |
| Assets and liabilities in foreign currencies | 84,182 | |
| Total change in net unrealized appreciation (depreciation) | | 665,443,522 |
| Net gain (loss) | | 772,326,487 |
| Net increase (decrease) in net assets resulting from operations | | $781,488,165 |
See accompanying notes which are an integral part of the financial statements.
Statement of Changes in Net Assets
| | Six months ended April 30, 2019 (Unaudited) | Year ended October 31, 2018 |
| Increase (Decrease) in Net Assets | | |
| Operations | | |
| Net investment income (loss) | $9,161,678 | $39,764,335 |
| Net realized gain (loss) | 106,882,965 | (46,242,124) |
| Change in net unrealized appreciation (depreciation) | 665,443,522 | (732,988,757) |
| Net increase (decrease) in net assets resulting from operations | 781,488,165 | (739,466,546) |
| Distributions to shareholders | (35,645,109) | (31,488,954) |
| Share transactions - net increase (decrease) | (476,247,041) | 277,115,896 |
| Redemption fees | – | 97,832 |
| Total increase (decrease) in net assets | 269,596,015 | (493,741,772) |
| Net Assets | | |
| Beginning of period | 4,364,442,463 | 4,858,184,235 |
| End of period | $4,634,038,478 | $4,364,442,463 |
See accompanying notes which are an integral part of the financial statements.
Financial Highlights
Fidelity Emerging Markets Fund
| | Six months ended (Unaudited) April 30, | Years endedOctober 31, | | | | |
| | 2019 | 2018 | 2017 | 2016 | 2015 | 2014 |
| Selected Per–Share Data | | | | | | |
| Net asset value, beginning of period | $26.66 | $31.37 | $24.25 | $22.55 | $25.44 | $24.43 |
| Income from Investment Operations | | | | | | |
| Net investment income (loss)A | .06 | .24 | .22 | .14 | .19 | .17 |
| Net realized and unrealized gain (loss) | 5.36 | (4.76) | 7.05 | 1.66 | (2.91) | .86 |
| Total from investment operations | 5.42 | (4.52) | 7.27 | 1.80 | (2.72) | 1.03 |
| Distributions from net investment income | (.22) | (.16) | (.15) | (.11) | (.14) | (.02) |
| Distributions from net realized gain | –B | (.03) | – | – | (.03) | – |
| Total distributions | (.22) | (.19) | (.15) | (.11) | (.17) | (.02) |
| Redemption fees added to paid in capitalA | – | –B | –B | .01 | –B | –B |
| Net asset value, end of period | $31.86 | $26.66 | $31.37 | $24.25 | $22.55 | $25.44 |
| Total ReturnC,D | 20.48% | (14.51)% | 30.21% | 8.07% | (10.76)% | 4.22% |
| Ratios to Average Net AssetsE,F | | | | | | |
| Expenses before reductions | .96%G | .96% | .97% | 1.01% | 1.05% | 1.07% |
| Expenses net of fee waivers, if any | .96%G | .96% | .97% | 1.01% | 1.05% | 1.07% |
| Expenses net of all reductions | .91%G | .92% | .96% | 1.00% | 1.03% | 1.07% |
| Net investment income (loss) | .40%G | .75% | .83% | .61% | .78% | .71% |
| Supplemental Data | | | | | | |
| Net assets, end of period (000 omitted) | $3,644,128 | $3,493,583 | $3,933,401 | $3,014,957 | $2,738,934 | $2,370,927 |
| Portfolio turnover rateH | 119%G | 86% | 81% | 79% | 107% | 94% |
A Calculated based on average shares outstanding during the period.
B Amount represents less than $.005 per share.
C Total returns for periods of less than one year are not annualized.
D Total returns would have been lower if certain expenses had not been reduced during the applicable periods shown.
E Fees and expenses of any underlying Fidelity Central Funds are not included in the Fund's expense ratio. The Fund indirectly bears its proportionate share of the expenses of any underlying Fidelity Central Funds.
F Expense ratios reflect operating expenses of the class. Expenses before reductions do not reflect amounts reimbursed by the investment adviser or reductions from brokerage service arrangements or reductions from other expense offset arrangements and do not represent the amount paid by the class during periods when reimbursements or reductions occur. Expenses net of fee waivers reflect expenses after reimbursement by the investment adviser but prior to reductions from brokerage service arrangements or other expense offset arrangements. Expenses net of all reductions represent the net expenses paid by the class.
G Annualized
H Amount does not include the portfolio activity of any underlying Fidelity Central Funds.
See accompanying notes which are an integral part of the financial statements.
Fidelity Emerging Markets Fund Class K
| | Six months ended (Unaudited) April 30, | Years endedOctober 31, | | | | |
| | 2019 | 2018 | 2017 | 2016 | 2015 | 2014 |
| Selected Per–Share Data | | | | | | |
| Net asset value, beginning of period | $26.70 | $31.41 | $24.28 | $22.58 | $25.48 | $24.42 |
| Income from Investment Operations | | | | | | |
| Net investment income (loss)A | .08 | .28 | .26 | .18 | .24 | .23 |
| Net realized and unrealized gain (loss) | 5.37 | (4.76) | 7.06 | 1.66 | (2.92) | .86 |
| Total from investment operations | 5.45 | (4.48) | 7.32 | 1.84 | (2.68) | 1.09 |
| Distributions from net investment income | (.26) | (.20) | (.19) | (.15) | (.20) | (.03) |
| Distributions from net realized gain | –B | (.03) | – | – | (.03) | – |
| Total distributions | (.27)C | (.23) | (.19) | (.15) | (.22)D | (.03) |
| Redemption fees added to paid in capitalA | – | –B | –B | .01 | –B | –B |
| Net asset value, end of period | $31.88 | $26.70 | $31.41 | $24.28 | $22.58 | $25.48 |
| Total ReturnE,F | 20.58% | (14.39)% | 30.44% | 8.27% | (10.60)% | 4.47% |
| Ratios to Average Net AssetsG,H | | | | | | |
| Expenses before reductions | .82%I | .82% | .83% | .84% | .85% | .86% |
| Expenses net of fee waivers, if any | .82%I | .82% | .82% | .84% | .85% | .85% |
| Expenses net of all reductions | .77%I | .78% | .81% | .83% | .83% | .85% |
| Net investment income (loss) | .54%I | .89% | .98% | .78% | .98% | .92% |
| Supplemental Data | | | | | | |
| Net assets, end of period (000 omitted) | $989,911 | $870,859 | $924,783 | $658,276 | $554,041 | $623,430 |
| Portfolio turnover rateJ | 119%I | 86% | 81% | 79% | 107% | 94% |
A Calculated based on average shares outstanding during the period.
B Amount represents less than $.005 per share.
C Total distributions of $.27 per share is comprised of distributions from net investment income of $.263 and distributions from net realized gain of $.003 per share.
D Total distributions of $.22 per share is comprised of distributions from net investment income of $.195 and distributions from net realized gain of $.025 per share.
E Total returns for periods of less than one year are not annualized.
F Total returns would have been lower if certain expenses had not been reduced during the applicable periods shown.
G Fees and expenses of any underlying Fidelity Central Funds are not included in the Fund's expense ratio. The Fund indirectly bears its proportionate share of the expenses of any underlying Fidelity Central Funds.
H Expense ratios reflect operating expenses of the class. Expenses before reductions do not reflect amounts reimbursed by the investment adviser or reductions from brokerage service arrangements or reductions from other expense offset arrangements and do not represent the amount paid by the class during periods when reimbursements or reductions occur. Expenses net of fee waivers reflect expenses after reimbursement by the investment adviser but prior to reductions from brokerage service arrangements or other expense offset arrangements. Expenses net of all reductions represent the net expenses paid by the class.
I Annualized
J Amount does not include the portfolio activity of any underlying Fidelity Central Funds.
See accompanying notes which are an integral part of the financial statements.
Notes to Financial Statements (Unaudited)
For the period ended April 30, 2019
1. Organization.
Fidelity Emerging Markets Fund (the Fund) is a fund of Fidelity Investment Trust (the Trust) and is authorized to issue an unlimited number of shares. The Trust is registered under the Investment Company Act of 1940, as amended (the 1940 Act), as an open-end management investment company organized as a Massachusetts business trust. The Fund offers Emerging Markets and Class K shares, each of which has equal rights as to assets and voting privileges. Each class has exclusive voting rights with respect to matters that affect that class. The Fund's investments in emerging markets can be subject to social, economic, regulatory, and political uncertainties and can be extremely volatile.
2. Investments in Fidelity Central Funds.
The Fund invests in Fidelity Central Funds, which are open-end investment companies generally available only to other investment companies and accounts managed by the investment adviser and its affiliates. The Fund's Schedule of Investments lists each of the Fidelity Central Funds held as of period end, if any, as an investment of the Fund, but does not include the underlying holdings of each Fidelity Central Fund. As an Investing Fund, the Fund indirectly bears its proportionate share of the expenses of the underlying Fidelity Central Funds.
The Money Market Central Funds seek preservation of capital and current income and are managed by Fidelity Investments Money Management, Inc. (FIMM), an affiliate of the investment adviser. Annualized expenses of the Money Market Central Funds as of their most recent shareholder report date are less than .005%.
A complete unaudited list of holdings for each Fidelity Central Fund is available upon request or at the Securities and Exchange Commission (the SEC) website at www.sec.gov. In addition, the financial statements of the Fidelity Central Funds are available on the SEC website or upon request.
3. Significant Accounting Policies.
The Fund is an investment company and applies the accounting and reporting guidance of the Financial Accounting Standards Board (FASB) Accounting Standards Codification Topic 946 Financial Services – Investments Companies. The financial statements have been prepared in conformity with accounting principles generally accepted in the United States of America (GAAP), which require management to make certain estimates and assumptions at the date of the financial statements. Actual results could differ from those estimates. Subsequent events, if any, through the date that the financial statements were issued have been evaluated in the preparation of the financial statements. The following summarizes the significant accounting policies of the Fund:
Investment Valuation. Investments are valued as of 4:00 p.m. Eastern time on the last calendar day of the period. The Board of Trustees (the Board) has delegated the day to day responsibility for the valuation of the Fund's investments to the Fair Value Committee (the Committee) established by the Fund's investment adviser. In accordance with valuation policies and procedures approved by the Board, the Fund attempts to obtain prices from one or more third party pricing vendors or brokers to value its investments. When current market prices, quotations or currency exchange rates are not readily available or reliable, investments will be fair valued in good faith by the Committee, in accordance with procedures adopted by the Board. Factors used in determining fair value vary by investment type and may include market or investment specific events. The frequency with which these procedures are used cannot be predicted and they may be utilized to a significant extent. The Committee oversees the Fund's valuation policies and procedures and reports to the Board on the Committee's activities and fair value determinations. The Board monitors the appropriateness of the procedures used in valuing the Fund's investments and ratifies the fair value determinations of the Committee.
The Fund categorizes the inputs to valuation techniques used to value its investments into a disclosure hierarchy consisting of three levels as shown below:
- Level 1 – quoted prices in active markets for identical investments
- Level 2 – other significant observable inputs (including quoted prices for similar investments, interest rates, prepayment speeds, etc.)
- Level 3 – unobservable inputs (including the Fund's own assumptions based on the best information available)
Valuation techniques used to value the Fund's investments by major category are as follows:
Equity securities, including restricted securities, for which market quotations are readily available, are valued at the last reported sale price or official closing price as reported by a third party pricing vendor on the primary market or exchange on which they are traded and are categorized as Level 1 in the hierarchy. In the event there were no sales during the day or closing prices are not available, securities are valued at the last quoted bid price or may be valued using the last available price and are generally categorized as Level 2 in the hierarchy. For foreign equity securities, when market or security specific events arise, comparisons to the valuation of American Depositary Receipts (ADRs), futures contracts, Exchange-Traded Funds (ETFs) and certain indexes as well as quoted prices for similar securities may be used and would be categorized as Level 2 in the hierarchy. For equity securities, including restricted securities, where observable inputs are limited, assumptions about market activity and risk are used and these securities may be categorized as Level 3 in the hierarchy.
Investments in open-end mutual funds, including the Fidelity Central Funds, are valued at their closing net asset value (NAV) each business day and are categorized as Level 1 in the hierarchy.
Changes in valuation techniques may result in transfers in or out of an assigned level within the disclosure hierarchy. The aggregate value of investments by input level as of April 30, 2019 is included at the end of the Fund's Schedule of Investments.
Foreign Currency. The Fund may use foreign currency contracts to facilitate transactions in foreign-denominated securities. Gains and losses from these transactions may arise from changes in the value of the foreign currency or if the counterparties do not perform under the contracts' terms.
Foreign-denominated assets, including investment securities, and liabilities are translated into U.S. dollars at the exchange rates at period end. Purchases and sales of investment securities, income and dividends received and expenses denominated in foreign currencies are translated into U.S. dollars at the exchange rate in effect on the transaction date.
The effects of exchange rate fluctuations on investments are included with the net realized and unrealized gain (loss) on investment securities. Other foreign currency transactions resulting in realized and unrealized gain (loss) are disclosed separately.
Investment Transactions and Income. For financial reporting purposes, the Fund's investment holdings and NAV include trades executed through the end of the last business day of the period. The NAV per share for processing shareholder transactions is calculated as of the close of business of the New York Stock Exchange (NYSE), normally 4:00 p.m. Eastern time and includes trades executed through the end of the prior business day. Gains and losses on securities sold are determined on the basis of identified cost and include proceeds received from litigation. Dividend income is recorded on the ex-dividend date, except for certain dividends from foreign securities where the ex-dividend date may have passed, which are recorded as soon as the Fund is informed of the ex-dividend date. Non-cash dividends included in dividend income, if any, are recorded at the fair market value of the securities received. Income and capital gain distributions from Fidelity Central Funds, if any, are recorded on the ex-dividend date. Certain distributions received by the Fund represent a return of capital or capital gain. The Fund determines the components of these distributions subsequent to the ex-dividend date, based upon receipt of tax filings or other correspondence relating to the underlying investment. These distributions are recorded as a reduction of cost of investments and/or as a realized gain. Investment income is recorded net of foreign taxes withheld where recovery of such taxes is uncertain.
Class Allocations and Expenses. Investment income, realized and unrealized capital gains and losses, common expenses of the Fund, and certain fund-level expense reductions, if any, are allocated daily on a pro-rata basis to each class based on the relative net assets of each class to the total net assets of the Fund. Each class differs with respect to transfer agent fees incurred. Certain expense reductions may also differ by class. For the reporting period, the allocated portion of income and expenses to each class as a percent of its average net assets may vary due to the timing of recording these transactions in relation to fluctuating net assets of the classes. Expenses directly attributable to a fund are charged to that fund. Expenses attributable to more than one fund are allocated among the respective funds on the basis of relative net assets or other appropriate methods. Expense estimates are accrued in the period to which they relate and adjustments are made when actual amounts are known.
Income Tax Information and Distributions to Shareholders. Each year, the Fund intends to qualify as a regulated investment company under Subchapter M of the Internal Revenue Code, including distributing substantially all of its taxable income and realized gains. As a result, no provision for U.S. Federal income taxes is required. The Fund files a U.S. federal tax return, in addition to state and local tax returns as required. The Fund's federal income tax returns are subject to examination by the Internal Revenue Service (IRS) for a period of three fiscal years after they are filed. State and local tax returns may be subject to examination for an additional fiscal year depending on the jurisdiction. Foreign taxes are provided for based on the Fund's understanding of the tax rules and rates that exist in the foreign markets in which it invests.
Distributions are declared and recorded on the ex-dividend date. Income and capital gain distributions are declared separately for each class. Income and capital gain distributions are determined in accordance with income tax regulations, which may differ from GAAP.
Capital accounts within the financial statements are adjusted for permanent book-tax differences. These adjustments have no impact on net assets or the results of operations. Capital accounts are not adjusted for temporary book-tax differences which will reverse in a subsequent period.
Book-tax differences are primarily due to foreign currency transactions, passive foreign investment companies (PFIC), capital loss carryforwards, deferred trustees compensation and losses deferred due to wash sales.
As of period end, the cost and unrealized appreciation (depreciation) in securities, and derivatives if applicable, for federal income tax purposes were as follows:
| Gross unrealized appreciation | $1,463,915,720 |
| Gross unrealized depreciation | (35,746,826) |
| Net unrealized appreciation (depreciation) | $1,428,168,894 |
| Tax cost | $3,273,294,982 |
Capital loss carryforwards are only available to offset future capital gains of the Fund to the extent provided by regulations and may be limited. Under the Regulated Investment Company Modernization Act of 2010 (the Act), the Fund is permitted to carry forward capital losses incurred in taxable years beginning after December 22, 2010 for an unlimited period and such capital losses are required to be used prior to any losses that expire. The capital loss carryforward information presented below, including any applicable limitation, is estimated as of prior fiscal period end and is subject to adjustment.
| No expiration | |
| Short-term | $(283,030,927) |
4. Purchases and Sales of Investments.
Purchases and sales of securities, other than short-term securities, aggregated $2,508,417,133 and $3,043,085,388, respectively.
5. Fees and Other Transactions with Affiliates.
Management Fee. Fidelity Management & Research Company (the investment adviser) and its affiliates provide the Fund with investment management related services for which the Fund pays a monthly management fee. The management fee is the sum of an individual fund fee rate that is based on an annual rate of .45% of the Fund's average net assets and an annualized group fee rate that averaged .24% during the period. The group fee rate is based upon the average net assets of all the mutual funds advised by the investment adviser, including any mutual funds previously advised by the investment adviser that are currently advised by Fidelity SelectCo, LLC, an affiliate of the investment adviser. The group fee rate decreases as assets under management increase and increases as assets under management decrease. For the reporting period, the total annualized management fee rate was .69% of the Fund's average net assets.
Transfer Agent Fees. Fidelity Investments Institutional Operations Company, Inc., (FIIOC), an affiliate of the investment adviser, is the transfer, dividend disbursing and shareholder servicing agent for each class of the Fund. FIIOC receives account fees and asset-based fees that vary according to the account size and type of account of the shareholders of Emerging Markets, except for Class K. FIIOC receives an asset-based fee of Class K's average net assets. FIIOC pays for typesetting, printing and mailing of shareholder reports, except proxy statements.
For the period, transfer agent fees for each class were as follows:
| | Amount | % of Class-Level Average Net Assets(a) |
| Emerging Markets | $3,034,392 | .18 |
| Class K | 211,577 | .05 |
| | $3,245,969 | |
(a) Annualized
Accounting and Security Lending Fees. Fidelity Service Company, Inc. (FSC), an affiliate of the investment adviser, maintains the Fund's accounting records. The accounting fee is based on the level of average net assets for each month. Prior to April 1, 2019, FSC had a separate agreement with the Fund for administration of the security lending program, based on the number and duration of lending transactions. For the period, the total fees paid for accounting and administration of securities lending were equivalent to an annualized rate of .04%.
Brokerage Commissions. The Fund placed a portion of its portfolio transactions with brokerage firms which are affiliates of the investment adviser. Brokerage commissions are included in net realized gain (loss) and change in net unrealized appreciation (depreciation) in the Statement of Operations. The commissions paid to these affiliated firms were $14,408 for the period.
Interfund Lending Program. Pursuant to an Exemptive Order issued by the SEC, the Fund, along with other registered investment companies having management contracts with Fidelity Management & Research Company (FMR) or other affiliated entities of FMR, may participate in an interfund lending program. This program provides an alternative credit facility allowing the funds to borrow from, or lend money to, other participating affiliated funds. At period end, there were no interfund loans outstanding. The Fund's activity in this program during the period for which loans were outstanding was as follows:
| Borrower or Lender | Average Loan Balance | Weighted Average Interest Rate | Interest Expense |
| Borrower | $38,196,588 | 2.49% | $89,914 |
Interfund Trades. The Fund may purchase from or sell securities to other Fidelity Funds under procedures adopted by the Board. The procedures have been designed to ensure these interfund trades are executed in accordance with Rule 17a-7 of the 1940 Act. Interfund trades are included within the respective purchases and sales amounts shown in the Purchases and Sales of Investments note.
6. Committed Line of Credit.
The Fund participates with other funds managed by the investment adviser or an affiliate in a $4.25 billion credit facility (the "line of credit") to be utilized for temporary or emergency purposes to fund shareholder redemptions or for other short-term liquidity purposes. The Fund has agreed to pay commitment fees on its pro-rata portion of the line of credit, which amounted to $6,002 and is reflected in Miscellaneous expenses on the Statement of Operations. During the period, the Fund did not borrow on this line of credit.
7. Security Lending.
The Fund lends portfolio securities through a lending agent from time to time in order to earn additional income. For equity securities, a lending agent is used and may loan securities to certain qualified borrowers, including Fidelity Capital Markets (FCM), a broker-dealer affiliated with the Fund. On the settlement date of the loan, the Fund receives collateral (in the form of U.S. Treasury obligations, letters of credit and/or cash) against the loaned securities and maintains collateral in an amount not less than 100% of the market value of the loaned securities during the period of the loan. The market value of the loaned securities is determined at the close of business of the Fund and any additional required collateral is delivered to the Fund on the next business day. The Fund or borrower may terminate the loan at any time, and if the borrower defaults on its obligation to return the securities loaned because of insolvency or other reasons, the Fund may apply collateral received from the borrower against the obligation. The Fund may experience delays and costs in recovering the securities loaned. Any cash collateral received is invested in the Fidelity Securities Lending Cash Central Fund. The value of loaned securities and cash collateral at period end are disclosed on the Fund's Statement of Assets and Liabilities. At period end, there were no security loans outstanding with FCM. Security lending income represents the income earned on investing cash collateral, less rebates paid to borrowers and any lending agent fees associated with the loan, plus any premium payments received for lending certain types of securities. Security lending income is presented in the Statement of Operations as a component of income from Fidelity Central Funds and includes $116,515 from securities loaned to FCM.
8. Bank Borrowings.
The Fund is permitted to have bank borrowings for temporary or emergency purposes to fund shareholder redemptions or for other short-term liquidity requirements. The Fund has established borrowing arrangements with certain banks. The interest rate on the borrowings is the bank's base rate, as revised from time to time. The average loan balance during the period for which loans were outstanding amounted to $27,433,250. The weighted average interest rate was 2.90%. The interest expense amounted to $8,840 under the bank borrowing program. At period end, there were no bank borrowings outstanding.
9. Expense Reductions.
Commissions paid to certain brokers with whom the investment adviser, or its affiliates, places trades on behalf of the Fund include an amount in addition to trade execution, which may be rebated back to the Fund to offset certain expenses. This amount totaled $1,056,980 for the period. In addition, through arrangements with the Fund's custodian and each class' transfer agent, credits realized as a result of certain uninvested cash balances were used to reduce the Fund's expenses. During the period, these credits reduced the Fund's custody expenses by $8,850. During the period, credits reduced each class' transfer agent expense as noted in the table below.
| | Transfer Agent expense reduction |
| Emerging Markets | $158 |
In addition, during the period the investment adviser reimbursed and/or waived a portion of fund-level operating expenses in the amount of $15,810.
10. Distributions to Shareholders.
Distributions to shareholders of each class were as follows:
| | Six months ended
April 30, 2019 | Year ended
October 31, 2018 |
| Distributions to shareholders | | |
| Emerging Markets | $27,210,630 | $24,827,626 |
| Class K | 8,434,479 | 6,661,328 |
| Total | $35,645,109 | $31,488,954 |
11. Share Transactions.
Share transactions for each class were as follows and may contain automatic conversions between classes or exchanges between affiliated funds:
| | Shares | Shares | Dollars | Dollars |
| | Six months ended April 30, 2019 | Year ended October 31, 2018 | Six months ended April 30, 2019 | Year ended October 31, 2018 |
| Emerging Markets | | | | |
| Shares sold | 51,280,889 | 49,869,535 | $1,452,534,091 | $1,579,168,818 |
| Reinvestment of distributions | 956,493 | 746,970 | 25,710,532 | 23,634,137 |
| Shares redeemed | (68,913,241) | (44,964,469) | (1,908,633,530) | (1,422,584,142) |
| Net increase (decrease) | (16,675,859) | 5,652,036 | $(430,388,907) | $180,218,813 |
| Class K | | | | |
| Shares sold | 4,142,329 | 12,153,123 | $119,037,767 | $380,393,513 |
| Reinvestment of distributions | 313,899 | 210,535 | 8,434,479 | 6,661,328 |
| Shares redeemed | (6,021,076) | (9,189,434) | (173,330,380) | (290,157,758) |
| Net increase (decrease) | (1,564,848) | 3,174,224 | $(45,858,134) | $96,897,083 |
12. Other.
The Fund's organizational documents provide former and current trustees and officers with a limited indemnification against liabilities arising in connection with the performance of their duties to the Fund. In the normal course of business, the Fund may also enter into contracts that provide general indemnifications. The Fund's maximum exposure under these arrangements is unknown as this would be dependent on future claims that may be made against the Fund. The risk of material loss from such claims is considered remote.
At the end of the period, mutual funds managed by the investment adviser or its affiliates were the owners of record, in the aggregate, of approximately 19% of the total outstanding shares of the Fund.
Fidelity® Europe Fund
Investment Summary (Unaudited)
Geographic Diversification (% of fund's net assets)
| As of April 30, 2019 |
| | United Kingdom | 31.8% |
| | France | 11.4% |
| | Sweden | 11.2% |
| | Germany | 10.2% |
| | Switzerland | 6.2% |
| | Italy | 4.9% |
| | Denmark | 4.1% |
| | Spain | 3.3% |
| | United States of America* | 2.6% |
| | Other | 14.3% |

* Includes Short-Term investments and Net Other Assets (Liabilities).
Percentages are based on country or territory of incorporation and are adjusted for the effect of futures contracts, if applicable.
Asset Allocation as of April 30, 2019
| | % of fund's net assets |
| Stocks | 98.4 |
| Short-Term Investments and Net Other Assets (Liabilities) | 1.6 |
Top Ten Stocks as of April 30, 2019
| | % of fund's net assets |
| BP PLC (United Kingdom, Oil, Gas & Consumable Fuels) | 3.8 |
| Roche Holding AG (participation certificate) (Switzerland, Pharmaceuticals) | 3.7 |
| Unilever PLC (United Kingdom, Personal Products) | 3.3 |
| Total SA (France, Oil, Gas & Consumable Fuels) | 3.2 |
| SAP SE (Germany, Software) | 2.2 |
| Lloyds Banking Group PLC (United Kingdom, Banks) | 2.2 |
| Sanofi SA (France, Pharmaceuticals) | 2.0 |
| AstraZeneca PLC (United Kingdom) (United Kingdom, Pharmaceuticals) | 2.0 |
| Deutsche Post AG (Germany, Air Freight & Logistics) | 1.8 |
| Swedbank AB (A Shares) (Sweden, Banks) | 1.8 |
| | 26.0 |
Top Market Sectors as of April 30, 2019
| | % of fund's net assets |
| Financials | 21.3 |
| Industrials | 16.2 |
| Health Care | 14.7 |
| Consumer Staples | 9.8 |
| Information Technology | 8.9 |
| Energy | 7.5 |
| Consumer Discretionary | 6.4 |
| Materials | 5.0 |
| Communication Services | 3.8 |
| Real Estate | 3.3 |
Fidelity® Europe Fund
Schedule of Investments April 30, 2019 (Unaudited)
Showing Percentage of Net Assets
| Common Stocks - 95.4% | | | |
| | | Shares | Value |
| Austria - 1.5% | | | |
| Andritz AG | | 91,999 | $4,385,408 |
| Mayr-Melnhof Karton AG | | 81,400 | 10,535,817 |
|
| TOTAL AUSTRIA | | | 14,921,225 |
|
| Bailiwick of Jersey - 1.6% | | | |
| Glencore Xstrata PLC | | 3,848,700 | 15,269,948 |
| Belgium - 1.3% | | | |
| KBC Groep NV | | 171,400 | 12,691,833 |
| Bermuda - 1.0% | | | |
| Vostok New Ventures Ltd. (depositary receipt) | | 1,745,431 | 10,214,823 |
| Canada - 1.0% | | | |
| Lundin Mining Corp. (Sweden) | | 1,812,094 | 9,784,468 |
| Denmark - 4.1% | | | |
| A.P. Moller - Maersk A/S Series B | | 12,912 | 16,644,783 |
| DONG Energy A/S (a) | | 191,300 | 14,645,746 |
| Scandinavian Tobacco Group A/S (a) | | 721,700 | 8,592,570 |
|
| TOTAL DENMARK | | | 39,883,099 |
|
| Finland - 1.5% | | | |
| Nokian Tyres PLC | | 426,200 | 14,254,733 |
| France - 11.4% | | | |
| Altarea SCA | | 47,600 | 10,058,329 |
| Amundi SA (a) | | 174,600 | 12,542,999 |
| Capgemini SA | | 111,000 | 13,458,191 |
| Compagnie de St. Gobain | | 321,100 | 13,165,080 |
| Natixis SA | | 2,007,800 | 11,818,226 |
| Sanofi SA | | 229,000 | 19,980,090 |
| Total SA | | 556,807 | 30,953,319 |
|
| TOTAL FRANCE | | | 111,976,234 |
|
| Germany - 10.2% | | | |
| Axel Springer Verlag AG | | 253,200 | 14,341,451 |
| Bertrandt AG | | 182,700 | 14,241,684 |
| Deutsche Post AG | | 521,500 | 18,127,565 |
| Instone Real Estate Group BV (a)(b) | | 465,776 | 11,362,512 |
| JOST Werke AG (a) | | 197,400 | 7,273,116 |
| LEG Immobilien AG | | 95,947 | 11,164,969 |
| SAP SE | | 168,937 | 21,777,373 |
| WashTec AG | | 29,300 | 2,303,688 |
|
| TOTAL GERMANY | | | 100,592,358 |
|
| Ireland - 1.2% | | | |
| United Drug PLC (United Kingdom) | | 1,420,241 | 12,167,602 |
| Italy - 3.6% | | | |
| Banca Generali SpA | | 468,100 | 13,209,527 |
| Prada SpA | | 2,537,100 | 7,163,569 |
| Recordati SpA | | 377,300 | 15,230,237 |
|
| TOTAL ITALY | | | 35,603,333 |
|
| Malta - 1.1% | | | |
| Kambi Group PLC (b) | | 542,559 | 10,809,649 |
| Netherlands - 1.7% | | | |
| Heineken NV (Bearer) | | 4,900 | 528,920 |
| Intertrust NV (a) | | 843,741 | 16,002,608 |
|
| TOTAL NETHERLANDS | | | 16,531,528 |
|
| Norway - 2.4% | | | |
| Adevinta ASA: | | | |
| Class A (b) | | 522,650 | 5,271,662 |
| Class B | | 1,098,100 | 10,803,508 |
| Schibsted ASA (A Shares) | | 272,533 | 7,151,762 |
|
| TOTAL NORWAY | | | 23,226,932 |
|
| Spain - 1.6% | | | |
| Prosegur Cash SA (a) | | 7,417,400 | 15,906,608 |
| Sweden - 11.2% | | | |
| Arjo AB | | 3,919,701 | 14,550,843 |
| Essity AB Class B | | 472,500 | 14,010,057 |
| Indutrade AB | | 298,400 | 9,123,498 |
| Investor AB (B Shares) | | 301,171 | 14,363,361 |
| Securitas AB (B Shares) | | 809,200 | 14,150,104 |
| Swedbank AB (A Shares) | | 1,078,200 | 17,616,949 |
| Swedish Match Co. AB | | 224,500 | 10,946,531 |
| Telefonaktiebolaget LM Ericsson (B Shares) | | 1,564,600 | 15,477,301 |
|
| TOTAL SWEDEN | | | 110,238,644 |
|
| Switzerland - 6.2% | | | |
| Julius Baer Group Ltd. | | 303,610 | 14,665,852 |
| Roche Holding AG (participation certificate) | | 139,810 | 36,890,737 |
| Sonova Holding AG Class B | | 47,917 | 9,663,814 |
|
| TOTAL SWITZERLAND | | | 61,220,403 |
|
| United Kingdom - 31.8% | | | |
| Aggreko PLC | | 1,095,400 | 12,187,122 |
| Ascential PLC | | 1,313,100 | 6,105,999 |
| AstraZeneca PLC (United Kingdom) | | 259,100 | 19,302,900 |
| BCA Marketplace PLC | | 5,248,600 | 14,112,688 |
| BP PLC | | 5,200,800 | 37,818,680 |
| Close Brothers Group PLC | | 527,400 | 10,673,563 |
| Cranswick PLC | | 325,700 | 12,308,177 |
| Diageo PLC | | 399,700 | 16,850,438 |
| John Wood Group PLC | | 858,300 | 5,265,945 |
| Keywords Studios PLC | | 305,576 | 6,204,195 |
| Lloyds Banking Group PLC | | 25,862,500 | 21,151,268 |
| Micro Focus International PLC | | 536,221 | 13,549,721 |
| Prudential PLC | | 648,805 | 14,741,746 |
| Rightmove PLC | | 1,325,800 | 9,346,126 |
| Rolls-Royce Holdings PLC | | 1,435,729 | 17,193,621 |
| Rotork PLC | | 2,224,100 | 9,045,806 |
| Sabre Insurance Group PLC (a) | | 3,300,000 | 11,446,512 |
| St. James's Place Capital PLC | | 944,900 | 13,818,558 |
| Standard Life PLC | | 3,682,975 | 13,394,450 |
| The Weir Group PLC | | 503,900 | 10,904,335 |
| Unilever PLC | | 540,400 | 32,756,394 |
| Volution Group PLC | | 1,827,100 | 4,121,791 |
|
| TOTAL UNITED KINGDOM | | | 312,300,035 |
|
| United States of America - 1.0% | | | |
| Autoliv, Inc. (depositary receipt) | | 126,400 | 10,241,629 |
| TOTAL COMMON STOCKS | | | |
| (Cost $899,047,015) | | | 937,835,084 |
|
| Nonconvertible Preferred Stocks - 3.0% | | | |
| Italy - 1.3% | | | |
| Buzzi Unicem SpA (Risparmio Shares) | | 861,312 | 13,118,926 |
| Spain - 1.7% | | | |
| Grifols SA Class B | | 840,750 | 16,185,515 |
| United Kingdom - 0.0% | | | |
| Rolls-Royce Holdings PLC (C Shares) (b) | | 106,010,100 | 138,237 |
| TOTAL NONCONVERTIBLE PREFERRED STOCKS | | | |
| (Cost $23,183,872) | | | 29,442,678 |
|
| Money Market Funds - 1.0% | | | |
| Fidelity Cash Central Fund, 2.49% (c) | | | |
| (Cost $9,764,920) | | 9,762,967 | 9,764,920 |
| TOTAL INVESTMENT IN SECURITIES - 99.4% | | | |
| (Cost $931,995,807) | | | 977,042,682 |
| NET OTHER ASSETS (LIABILITIES) - 0.6% | | | 5,825,823 |
| NET ASSETS - 100% | | | $982,868,505 |
Categorizations in the Schedule of Investments are based on country or territory of incorporation.
Legend
(a) Security exempt from registration under Rule 144A of the Securities Act of 1933. These securities may be resold in transactions exempt from registration, normally to qualified institutional buyers. At the end of the period, the value of these securities amounted to $97,772,671 or 9.9% of net assets.
(b) Non-income producing
(c) Affiliated fund that is generally available only to investment companies and other accounts managed by Fidelity Investments. The rate quoted is the annualized seven-day yield of the fund at period end. A complete unaudited listing of the fund's holdings as of its most recent quarter end is available upon request. In addition, each Fidelity Central Fund's financial statements are available on the SEC's website or upon request.
Affiliated Central Funds
Information regarding fiscal year to date income earned by the Fund from investments in Fidelity Central Funds is as follows:
| Fund | Income earned |
| Fidelity Cash Central Fund | $88,064 |
| Fidelity Securities Lending Cash Central Fund | 186,572 |
| Total | $274,636 |
Amounts in the income column in the above table include any capital gain distributions from underlying funds, which are presented in the corresponding line-item in the Statement of Operations, if applicable.
Investment Valuation
The following is a summary of the inputs used, as of April 30, 2019, involving the Fund's assets and liabilities carried at fair value. The inputs or methodology used for valuing securities may not be an indication of the risk associated with investing in those securities. For more information on valuation inputs, and their aggregation into the levels used below, please refer to the Investment Valuation section in the accompanying Notes to Financial Statements.
| | Valuation Inputs at Reporting Date: |
| Description | Total | Level 1 | Level 2 | Level 3 |
| Investments in Securities: | | | | |
| Equities: | | | | |
| Communication Services | $36,945,338 | $36,945,338 | $-- | $-- |
| Consumer Discretionary | 63,855,384 | 42,804,106 | 21,051,278 | -- |
| Consumer Staples | 95,993,087 | 21,429,667 | 74,563,420 | -- |
| Energy | 74,037,944 | 5,265,945 | 68,771,999 | -- |
| Financials | 208,256,275 | 115,502,276 | 92,753,999 | -- |
| Health Care | 143,971,738 | 37,061,653 | 106,910,085 | -- |
| Industrials | 161,735,330 | 73,330,679 | 88,404,651 | -- |
| Information Technology | 86,541,951 | 49,287,277 | 37,254,674 | -- |
| Materials | 48,709,159 | 23,654,743 | 25,054,416 | -- |
| Real Estate | 32,585,810 | 32,585,810 | -- | -- |
| Utilities | 14,645,746 | 14,645,746 | -- | -- |
| Money Market Funds | 9,764,920 | 9,764,920 | -- | -- |
| Total Investments in Securities: | $977,042,682 | $462,278,160 | $514,764,522 | $-- |
See accompanying notes which are an integral part of the financial statements.
Fidelity® Europe Fund
Financial Statements
Statement of Assets and Liabilities
| | | April 30, 2019 (Unaudited) |
| Assets | | |
Investment in securities, at value — See accompanying schedule:
Unaffiliated issuers (cost $922,230,887) | $967,277,762 | |
| Fidelity Central Funds (cost $9,764,920) | 9,764,920 | |
| Total Investment in Securities (cost $931,995,807) | | $977,042,682 |
| Cash | | 612 |
| Foreign currency held at value (cost $256,348) | | 256,340 |
| Receivable for investments sold | | 32,280,516 |
| Receivable for fund shares sold | | 182,126 |
| Dividends receivable | | 9,236,493 |
| Distributions receivable from Fidelity Central Funds | | 89,307 |
| Prepaid expenses | | 546 |
| Other receivables | | 270,692 |
| Total assets | | 1,019,359,314 |
| Liabilities | | |
| Payable for investments purchased | $34,202,094 | |
| Payable for fund shares redeemed | 1,564,481 | |
| Accrued management fee | 469,263 | |
| Distribution and service plan fees payable | 13,511 | |
| Other affiliated payables | 179,761 | |
| Other payables and accrued expenses | 61,699 | |
| Total liabilities | | 36,490,809 |
| Net Assets | | $982,868,505 |
| Net Assets consist of: | | |
| Paid in capital | | $913,158,891 |
| Total distributable earnings (loss) | | 69,709,614 |
| Net Assets | | $982,868,505 |
| Net Asset Value and Maximum Offering Price | | |
| Class A: | | |
| Net Asset Value and redemption price per share ($20,892,825 ÷ 571,115 shares) | | $36.58 |
| Maximum offering price per share (100/94.25 of $36.58) | | $38.81 |
| Class M: | | |
| Net Asset Value and redemption price per share ($6,787,600 ÷ 185,139 shares) | | $36.66 |
| Maximum offering price per share (100/96.50 of $36.66) | | $37.99 |
| Class C: | | |
| Net Asset Value and offering price per share ($7,578,139 ÷ 208,763 shares)(a) | | $36.30 |
| Europe: | | |
| Net Asset Value, offering price and redemption price per share ($939,851,212 ÷ 25,745,951 shares) | | $36.50 |
| Class I: | | |
| Net Asset Value, offering price and redemption price per share ($7,569,141 ÷ 207,445 shares) | | $36.49 |
| Class Z: | | |
| Net Asset Value, offering price and redemption price per share ($189,588 ÷ 5,206 shares) | | $36.42 |
(a) Redemption price per share is equal to net asset value less any applicable contingent deferred sales charge.
See accompanying notes which are an integral part of the financial statements.
Statement of Operations
| | | Six months ended April 30, 2019 (Unaudited) |
| Investment Income | | |
| Dividends | | $19,664,374 |
| Non-Cash dividends | | 10,173,510 |
| Income from Fidelity Central Funds | | 274,636 |
| Income before foreign taxes withheld | | 30,112,520 |
| Less foreign taxes withheld | | (1,283,519) |
| Total income | | 28,829,001 |
| Expenses | | |
| Management fee | | |
| Basic fee | $3,261,083 | |
| Performance adjustment | (632,657) | |
| Transfer agent fees | 839,125 | |
| Distribution and service plan fees | 85,038 | |
| Accounting and security lending fees | 222,762 | |
| Custodian fees and expenses | 41,351 | |
| Independent trustees' fees and expenses | 2,683 | |
| Registration fees | 84,126 | |
| Audit | 52,958 | |
| Legal | 2,847 | |
| Miscellaneous | 3,262 | |
| Total expenses before reductions | 3,962,578 | |
| Expense reductions | (461,664) | |
| Total expenses after reductions | | 3,500,914 |
| Net investment income (loss) | | 25,328,087 |
| Realized and Unrealized Gain (Loss) | | |
| Net realized gain (loss) on: | | |
| Investment securities: | | |
| Unaffiliated issuers | 8,454,962 | |
| Foreign currency transactions | (99,763) | |
| Total net realized gain (loss) | | 8,355,199 |
| Change in net unrealized appreciation (depreciation) on: | | |
| Investment securities: | | |
| Unaffiliated issuers | 39,907,878 | |
| Assets and liabilities in foreign currencies | 22,906 | |
| Total change in net unrealized appreciation (depreciation) | | 39,930,784 |
| Net gain (loss) | | 48,285,983 |
| Net increase (decrease) in net assets resulting from operations | | $73,614,070 |
See accompanying notes which are an integral part of the financial statements.
Statement of Changes in Net Assets
| | Six months ended April 30, 2019 (Unaudited) | Year ended October 31, 2018 |
| Increase (Decrease) in Net Assets | | |
| Operations | | |
| Net investment income (loss) | $25,328,087 | $13,390,463 |
| Net realized gain (loss) | 8,355,199 | 96,763,866 |
| Change in net unrealized appreciation (depreciation) | 39,930,784 | (208,563,140) |
| Net increase (decrease) in net assets resulting from operations | 73,614,070 | (98,408,811) |
| Distributions to shareholders | (96,043,890) | (31,260,216) |
| Share transactions - net increase (decrease) | 19,357,976 | (276,592,457) |
| Total increase (decrease) in net assets | (3,071,844) | (406,261,484) |
| Net Assets | | |
| Beginning of period | 985,940,349 | 1,392,201,833 |
| End of period | $982,868,505 | $985,940,349 |
See accompanying notes which are an integral part of the financial statements.
Financial Highlights
Fidelity Europe Fund Class A
| | Six months ended (Unaudited) April 30, | Years endedOctober 31, | | | | |
| | 2019 | 2018 | 2017 | 2016 | 2015 | 2014 A |
| Selected Per–Share Data | | | | | | |
| Net asset value, beginning of period | $37.61 | $42.47 | $34.17 | $37.06 | $36.24 | $39.45 |
| Income from Investment Operations | | | | | | |
| Net investment income (loss)B | .88 | .34 | .26 | .22 | .37 | .47 |
| Net realized and unrealized gain (loss) | 1.63 | (4.21)C | 8.39 | (2.67) | 1.29 | (3.68) |
| Total from investment operations | 2.51 | (3.87) | 8.65 | (2.45) | 1.66 | (3.21) |
| Distributions from net investment income | (.11) | (.33) | (.22) | (.29) | (.84) | – |
| Distributions from net realized gain | (3.43) | (.66) | (.13) | (.15) | – | – |
| Total distributions | (3.54) | (.99) | (.35) | (.44) | (.84) | – |
| Redemption fees added to paid in capitalB | – | – | –D | –D | –D | –D |
| Net asset value, end of period | $36.58 | $37.61 | $42.47 | $34.17 | $37.06 | $36.24 |
| Total ReturnE,F,G | 8.03% | (9.31)%C | 25.61% | (6.69)% | 4.63% | (8.14)% |
| Ratios to Average Net AssetsH,I | | | | | | |
| Expenses before reductions | 1.13%J | 1.28% | 1.32% | 1.39% | 1.33% | 1.35%J |
| Expenses net of fee waivers, if any | 1.12%J | 1.28% | 1.32% | 1.39% | 1.33% | 1.35%J |
| Expenses net of all reductions | 1.03%J | 1.28% | 1.28% | 1.38% | 1.31% | 1.35%J |
| Net investment income (loss) | 5.06% | .82% | .70% | .62% | .98% | 1.94%J |
| Supplemental Data | | | | | | |
| Net assets, end of period (000 omitted) | $20,893 | $19,531 | $20,925 | $17,267 | $23,381 | $23,633 |
| Portfolio turnover rateK | 56%J | 57% | 73% | 62% | 87% | 80%L |
A For the period March 18, 2014 (commencement of sale of shares) to October 31, 2014.
B Calculated based on average shares outstanding during the period.
C Net realized and unrealized gain (loss) per share reflects proceeds received from litigation which amounted to $.18 per share. Excluding these litigation proceeds, the total return would have been (9.74)%.
D Amount represents less than $.005 per share.
E Total returns for periods of less than one year are not annualized.
F Total returns would have been lower if certain expenses had not been reduced during the applicable periods shown.
G Total returns do not include the effect of the sales charges.
H Fees and expenses of any underlying Fidelity Central Funds are not included in the Fund's expense ratio. The Fund indirectly bears its proportionate share of the expenses of any underlying Fidelity Central Funds.
I Expense ratios reflect operating expenses of the class. Expenses before reductions do not reflect amounts reimbursed by the investment adviser or reductions from brokerage service arrangements or reductions from other expense offset arrangements and do not represent the amount paid by the class during periods when reimbursements or reductions occur. Expense ratios before reductions for start-up periods may not be representative of longer-term operating periods. Expenses net of fee waivers reflect expenses after reimbursement by the investment adviser but prior to reductions from brokerage service arrangements or other expense offset arrangements. Expenses net of all reductions represent the net expenses paid by the class.
J Annualized
K Amount does not include the portfolio activity of any underlying Fidelity Central Funds.
L The portfolio turnover rate does not include the assets acquired in the merger.
See accompanying notes which are an integral part of the financial statements.
Fidelity Europe Fund Class M
| | Six months ended (Unaudited) April 30, | Years endedOctober 31, | | | | |
| | 2019 | 2018 | 2017 | 2016 | 2015 | 2014 A |
| Selected Per–Share Data | | | | | | |
| Net asset value, beginning of period | $37.57 | $42.47 | $34.13 | $36.94 | $36.18 | $39.45 |
| Income from Investment Operations | | | | | | |
| Net investment income (loss)B | .83 | .21 | .15 | .11 | .26 | .40 |
| Net realized and unrealized gain (loss) | 1.64 | (4.23)C | 8.41 | (2.67) | 1.29 | (3.67) |
| Total from investment operations | 2.47 | (4.02) | 8.56 | (2.56) | 1.55 | (3.27) |
| Distributions from net investment income | – | (.23) | (.09) | (.09) | (.79) | – |
| Distributions from net realized gain | (3.38) | (.66) | (.13) | (.15) | – | – |
| Total distributions | (3.38) | (.88)D | (.22) | (.25)E | (.79) | – |
| Redemption fees added to paid in capitalB | – | – | –F | –F | –F | –F |
| Net asset value, end of period | $36.66 | $37.57 | $42.47 | $34.13 | $36.94 | $36.18 |
| Total ReturnG,H,I | 7.88% | (9.63)%C | 25.25% | (6.99)% | 4.33% | (8.29)% |
| Ratios to Average Net AssetsJ,K | | | | | | |
| Expenses before reductions | 1.44%L | 1.61% | 1.63% | 1.70% | 1.61% | 1.62%L |
| Expenses net of fee waivers, if any | 1.44%L | 1.61% | 1.63% | 1.70% | 1.61% | 1.61%L |
| Expenses net of all reductions | 1.35%L | 1.61% | 1.59% | 1.68% | 1.59% | 1.61%L |
| Net investment income (loss) | 4.74%L | .50% | .39% | .31% | .70% | 1.68%L |
| Supplemental Data | | | | | | |
| Net assets, end of period (000 omitted) | $6,788 | $7,257 | $8,874 | $6,980 | $9,632 | $13,679 |
| Portfolio turnover rateM | 56%L | 57% | 73% | 62% | 87% | 80%N |
A For the period March 18, 2014 (commencement of sale of shares) to October 31, 2014.
B Calculated based on average shares outstanding during the period.
C Net realized and unrealized gain (loss) per share reflects proceeds received from litigation which amounted to $.18 per share. Excluding these litigation proceeds, the total return would have been (10.06)%.
D Total distributions of $.88 per share is comprised of distributions from net investment income of $.227 and distributions from net realized gain of $.657 per share.
E Total distributions of $.25 per share is comprised of distributions from net investment income of $.092 and distributions from net realized gain of $.154 per share.
F Amount represents less than $.005 per share.
G Total returns for periods of less than one year are not annualized.
H Total returns would have been lower if certain expenses had not been reduced during the applicable periods shown.
I Total returns do not include the effect of the sales charges.
J Fees and expenses of any underlying Fidelity Central Funds are not included in the Fund's expense ratio. The Fund indirectly bears its proportionate share of the expenses of any underlying Fidelity Central Funds.
K Expense ratios reflect operating expenses of the class. Expenses before reductions do not reflect amounts reimbursed by the investment adviser or reductions from brokerage service arrangements or reductions from other expense offset arrangements and do not represent the amount paid by the class during periods when reimbursements or reductions occur. Expense ratios before reductions for start-up periods may not be representative of longer-term operating periods. Expenses net of fee waivers reflect expenses after reimbursement by the investment adviser but prior to reductions from brokerage service arrangements or other expense offset arrangements. Expenses net of all reductions represent the net expenses paid by the class.
L Annualized
M Amount does not include the portfolio activity of any underlying Fidelity Central Funds.
N The portfolio turnover rate does not include the assets acquired in the merger.
See accompanying notes which are an integral part of the financial statements.
Fidelity Europe Fund Class C
| | Six months ended (Unaudited) April 30, | Years endedOctober 31, | | | | |
| | 2019 | 2018 | 2017 | 2016 | 2015 | 2014 A |
| Selected Per–Share Data | | | | | | |
| Net asset value, beginning of period | $37.23 | $42.15 | $33.82 | $36.81 | $36.07 | $39.45 |
| Income from Investment Operations | | | | | | |
| Net investment income (loss)B | .74 | .02 | (.03) | (.06) | .07 | .29 |
| Net realized and unrealized gain (loss) | 1.63 | (4.18)C | 8.36 | (2.65) | 1.29 | (3.67) |
| Total from investment operations | 2.37 | (4.16) | 8.33 | (2.71) | 1.36 | (3.38) |
| Distributions from net investment income | – | (.10) | – | (.12) | (.62) | – |
| Distributions from net realized gain | (3.30) | (.66) | – | (.15) | – | – |
| Total distributions | (3.30) | (.76) | – | (.28)D | (.62) | – |
| Redemption fees added to paid in capitalB | – | – | –E | –E | –E | –E |
| Net asset value, end of period | $36.30 | $37.23 | $42.15 | $33.82 | $36.81 | $36.07 |
| Total ReturnF,G,H | 7.62% | (10.04)%C | 24.63% | (7.43)% | 3.79% | (8.57)% |
| Ratios to Average Net AssetsI,J | | | | | | |
| Expenses before reductions | 1.93%K | 2.06% | 2.11% | 2.18% | 2.13% | 2.10%K |
| Expenses net of fee waivers, if any | 1.93%K | 2.06% | 2.11% | 2.18% | 2.13% | 2.10%K |
| Expenses net of all reductions | 1.84%K | 2.06% | 2.07% | 2.17% | 2.11% | 2.10%K |
| Net investment income (loss) | 4.25%K | .04% | (.09)% | (.17)% | .18% | 1.19%K |
| Supplemental Data | | | | | | |
| Net assets, end of period (000 omitted) | $7,578 | $10,060 | $10,721 | $9,007 | $11,151 | $6,818 |
| Portfolio turnover rateL | 56%K | 57% | 73% | 62% | 87% | 80%M |
A For the period March 18, 2014 (commencement of sale of shares) to October 31, 2014.
B Calculated based on average shares outstanding during the period.
C Net realized and unrealized gain (loss) per share reflects proceeds received from litigation which amounted to $.18 per share. Excluding these litigation proceeds, the total return would have been (10.47)%.
D Total distributions of $.28 per share is comprised of distributions from net investment income of $.123 and distributions from net realized gain of $.154 per share.
E Amount represents less than $.005 per share.
F Total returns for periods of less than one year are not annualized.
G Total returns would have been lower if certain expenses had not been reduced during the applicable periods shown.
H Total returns do not include the effect of the contingent deferred sales charge.
I Fees and expenses of any underlying Fidelity Central Funds are not included in the Fund's expense ratio. The Fund indirectly bears its proportionate share of the expenses of any underlying Fidelity Central Funds.
J Expense ratios reflect operating expenses of the class. Expenses before reductions do not reflect amounts reimbursed by the investment adviser or reductions from brokerage service arrangements or reductions from other expense offset arrangements and do not represent the amount paid by the class during periods when reimbursements or reductions occur. Expense ratios before reductions for start-up periods may not be representative of longer-term operating periods. Expenses net of fee waivers reflect expenses after reimbursement by the investment adviser but prior to reductions from brokerage service arrangements or other expense offset arrangements. Expenses net of all reductions represent the net expenses paid by the class.
K Annualized
L Amount does not include the portfolio activity of any underlying Fidelity Central Funds.
M The portfolio turnover rate does not include the assets acquired in the merger.
See accompanying notes which are an integral part of the financial statements.
Fidelity Europe Fund
| | Six months ended (Unaudited) April 30, | Years endedOctober 31, | | | | |
| | 2019 | 2018 | 2017 | 2016 | 2015 | 2014 |
| Selected Per–Share Data | | | | | | |
| Net asset value, beginning of period | $37.70 | $42.53 | $34.26 | $37.19 | $36.32 | $37.92 |
| Income from Investment Operations | | | | | | |
| Net investment income (loss)A | .93 | .48 | .38 | .33 | .48 | .94B |
| Net realized and unrealized gain (loss) | 1.62 | (4.24)C | 8.40 | (2.68) | 1.30 | (2.00) |
| Total from investment operations | 2.55 | (3.76) | 8.78 | (2.35) | 1.78 | (1.06) |
| Distributions from net investment income | (.32) | (.41) | (.38) | (.43) | (.91) | (.52) |
| Distributions from net realized gain | (3.43) | (.66) | (.13) | (.15) | – | (.02) |
| Total distributions | (3.75) | (1.07) | (.51) | (.58) | (.91) | (.54) |
| Redemption fees added to paid in capitalA | – | – | –D | –D | –D | –D |
| Net asset value, end of period | $36.50 | $37.70 | $42.53 | $34.26 | $37.19 | $36.32 |
| Total ReturnE,F | 8.21% | (9.05)%C | 26.05% | (6.42)% | 4.97% | (2.82)% |
| Ratios to Average Net AssetsG,H | | | | | | |
| Expenses before reductions | .82%I | .96% | 1.00% | 1.07% | 1.03% | .97% |
| Expenses net of fee waivers, if any | .81%I | .96% | 1.00% | 1.07% | 1.03% | .97% |
| Expenses net of all reductions | .72%I | .96% | .96% | 1.06% | 1.01% | .96% |
| Net investment income (loss) | 5.37%I | 1.14% | 1.02% | .94% | 1.28% | 2.43%B |
| Supplemental Data | | | | | | |
| Net assets, end of period (000 omitted) | $939,851 | $941,670 | $1,343,213 | $1,066,488 | $1,384,134 | $1,237,047 |
| Portfolio turnover rateJ | 56%I | 57% | 73% | 62% | 87% | 80%K |
A Calculated based on average shares outstanding during the period.
B Net investment income per share reflects a large, non-recurring dividend which amounted to $.19 per share. Excluding this non-recurring dividend, the ratio of net investment income (loss) to average net assets would have been 1.93%.
C Net realized and unrealized gain (loss) per share reflects proceeds received from litigation which amounted to $.18 per share. Excluding these litigation proceeds, the total return would have been (9.48)%.
D Amount represents less than $.005 per share.
E Total returns for periods of less than one year are not annualized.
F Total returns would have been lower if certain expenses had not been reduced during the applicable periods shown.
G Fees and expenses of any underlying Fidelity Central Funds are not included in the Fund's expense ratio. The Fund indirectly bears its proportionate share of the expenses of any underlying Fidelity Central Funds.
H Expense ratios reflect operating expenses of the class. Expenses before reductions do not reflect amounts reimbursed by the investment adviser or reductions from brokerage service arrangements or reductions from other expense offset arrangements and do not represent the amount paid by the class during periods when reimbursements or reductions occur. Expenses net of fee waivers reflect expenses after reimbursement by the investment adviser but prior to reductions from brokerage service arrangements or other expense offset arrangements. Expenses net of all reductions represent the net expenses paid by the class.
I Annualized
J Amount does not include the portfolio activity of any underlying Fidelity Central Funds.
K The portfolio turnover rate does not include the assets acquired in the merger.
See accompanying notes which are an integral part of the financial statements.
Fidelity Europe Fund Class I
| | Six months ended (Unaudited) April 30, | Years endedOctober 31, | | | | |
| | 2019 | 2018 | 2017 | 2016 | 2015 | 2014 A |
| Selected Per–Share Data | | | | | | |
| Net asset value, beginning of period | $37.69 | $42.53 | $34.29 | $37.21 | $36.32 | $39.45 |
| Income from Investment Operations | | | | | | |
| Net investment income (loss)B | .94 | .48 | .39 | .35 | .50 | .56 |
| Net realized and unrealized gain (loss) | 1.61 | (4.23)C | 8.38 | (2.67) | 1.30 | (3.69) |
| Total from investment operations | 2.55 | (3.75) | 8.77 | (2.32) | 1.80 | (3.13) |
| Distributions from net investment income | (.32) | (.43) | (.41) | (.45) | (.91) | – |
| Distributions from net realized gain | (3.43) | (.66) | (.13) | (.15) | – | – |
| Total distributions | (3.75) | (1.09) | (.53)D | (.60) | (.91) | – |
| Redemption fees added to paid in capitalB | – | – | –E | –E | –E | –E |
| Net asset value, end of period | $36.49 | $37.69 | $42.53 | $34.29 | $37.21 | $36.32 |
| Total ReturnF,G | 8.23% | (9.02)%C | 26.04% | (6.33)% | 5.02% | (7.93)% |
| Ratios to Average Net AssetsH,I | | | | | | |
| Expenses before reductions | .79%J | .95% | .98% | 1.01% | .98% | .97%J |
| Expenses net of fee waivers, if any | .78%J | .95% | .98% | 1.01% | .98% | .97%J |
| Expenses net of all reductions | .69%J | .95% | .94% | 1.00% | .96% | .96%J |
| Net investment income (loss) | 5.40%J | 1.16% | 1.04% | 1.00% | 1.33% | 2.33%J |
| Supplemental Data | | | | | | |
| Net assets, end of period (000 omitted) | $7,569 | $7,318 | $8,469 | $5,340 | $6,552 | $5,666 |
| Portfolio turnover rateK | 56%J | 57% | 73% | 62% | 87% | 80%L |
A For the period March 18, 2014 (commencement of sale of shares) to October 31, 2014.
B Calculated based on average shares outstanding during the period.
C Net realized and unrealized gain (loss) per share reflects proceeds received from litigation which amounted to $.18 per share. Excluding these litigation proceeds, the total return would have been (9.45)%.
D Total distributions of $.53 per share is comprised of distributions from net investment income of $.408 and distributions from net realized gain of $.126 per share.
E Amount represents less than $.005 per share.
F Total returns for periods of less than one year are not annualized.
G Total returns would have been lower if certain expenses had not been reduced during the applicable periods shown.
H Fees and expenses of any underlying Fidelity Central Funds are not included in the Fund's expense ratio. The Fund indirectly bears its proportionate share of the expenses of any underlying Fidelity Central Funds.
I Expense ratios reflect operating expenses of the class. Expenses before reductions do not reflect amounts reimbursed by the investment adviser or reductions from brokerage service arrangements or reductions from other expense offset arrangements and do not represent the amount paid by the class during periods when reimbursements or reductions occur. Expense ratios before reductions for start-up periods may not be representative of longer-term operating periods. Expenses net of fee waivers reflect expenses after reimbursement by the investment adviser but prior to reductions from brokerage service arrangements or other expense offset arrangements. Expenses net of all reductions represent the net expenses paid by the class.
J Annualized
K Amount does not include the portfolio activity of any underlying Fidelity Central Funds.
L The portfolio turnover rate does not include the assets acquired in the merger.
See accompanying notes which are an integral part of the financial statements.
Fidelity Europe Fund Class Z
| | Six months ended (Unaudited) April 30, | Year endedOctober 31, |
| | 2019 | 2018 A |
| Selected Per–Share Data | | |
| Net asset value, beginning of period | $37.69 | $41.00 |
| Income from Investment Operations | | |
| Net investment income (loss)B | .95 | .06 |
| Net realized and unrealized gain (loss) | 1.61 | (3.37)C |
| Total from investment operations | 2.56 | (3.31) |
| Distributions from net investment income | (.41) | – |
| Distributions from net realized gain | (3.43) | – |
| Total distributions | (3.83)D | – |
| Net asset value, end of period | $36.42 | $37.69 |
| Total ReturnE,F | 8.30% | (8.07)%C |
| Ratios to Average Net AssetsG,H | | |
| Expenses before reductions | .69%I | .91%I |
| Expenses net of fee waivers, if any | .68%I | .90%I |
| Expenses net of all reductions | .59%I | .90%I |
| Net investment income (loss) | 5.50%I | 2.04%I |
| Supplemental Data | | |
| Net assets, end of period (000 omitted) | $190 | $104 |
| Portfolio turnover rateJ | 56%I | 57% |
A For the period October 2, 2018 (commencement of sale of shares) to October 31, 2018.
B Calculated based on average shares outstanding during the period.
C Net realized and unrealized gain (loss) per share reflects proceeds received from litigation which amounted to $.16 per share. Excluding these litigation proceeds, the total return would have been (8.50)%.
D Total distributions of $3.83 per share is comprised of distributions from net investment income of $.405 and distributions from net realized gain of $3.427 per share.
E Total returns for periods of less than one year are not annualized.
F Total returns would have been lower if certain expenses had not been reduced during the applicable periods shown.
G Fees and expenses of any underlying Fidelity Central Funds are not included in the Fund's expense ratio. The Fund indirectly bears its proportionate share of the expenses of any underlying Fidelity Central Funds.
H Expense ratios reflect operating expenses of the class. Expenses before reductions do not reflect amounts reimbursed by the investment adviser or reductions from brokerage service arrangements or reductions from other expense offset arrangements and do not represent the amount paid by the class during periods when reimbursements or reductions occur. Expense ratios before reductions for start-up periods may not be representative of longer-term operating periods. Expenses net of fee waivers reflect expenses after reimbursement by the investment adviser but prior to reductions from brokerage service arrangements or other expense offset arrangements. Expenses net of all reductions represent the net expenses paid by the class.
I Annualized
J Amount does not include the portfolio activity of any underlying Fidelity Central Funds.
See accompanying notes which are an integral part of the financial statements.
Notes to Financial Statements (Unaudited)
For the period ended April 30, 2019
1. Organization.
Fidelity Europe Fund (the Fund) is a fund of Fidelity Investment Trust (the Trust) and is authorized to issue an unlimited number of shares. The Trust is registered under the Investment Company Act of 1940, as amended (the 1940 Act), as an open-end management investment company organized as a Massachusetts business trust. The Fund offers Class A, Class M, Class C, Europe, Class I and Class Z shares, each of which has equal rights as to assets and voting privileges. Each class has exclusive voting rights with respect to matters that affect that class. Effective March 1, 2019, Class C shares will automatically convert to Class A shares after a holding period of ten years from the initial date of purchase, with certain exceptions.
2. Investments in Fidelity Central Funds.
The Fund invests in Fidelity Central Funds, which are open-end investment companies generally available only to other investment companies and accounts managed by the investment adviser and its affiliates. The Fund's Schedule of Investments lists each of the Fidelity Central Funds held as of period end, if any, as an investment of the Fund, but does not include the underlying holdings of each Fidelity Central Fund. As an Investing Fund, the Fund indirectly bears its proportionate share of the expenses of the underlying Fidelity Central Funds.
The Money Market Central Funds seek preservation of capital and current income and are managed by Fidelity Investments Money Management, Inc. (FIMM), an affiliate of the investment adviser. Annualized expenses of the Money Market Central Funds as of their most recent shareholder report date are less than .005%.
A complete unaudited list of holdings for each Fidelity Central Fund is available upon request or at the Securities and Exchange Commission (the SEC) website at www.sec.gov. In addition, the financial statements of the Fidelity Central Funds are available on the SEC website or upon request.
3. Significant Accounting Policies.
The Fund is an investment company and applies the accounting and reporting guidance of the Financial Accounting Standards Board (FASB) Accounting Standards Codification Topic 946 Financial Services – Investments Companies. The financial statements have been prepared in conformity with accounting principles generally accepted in the United States of America (GAAP), which require management to make certain estimates and assumptions at the date of the financial statements. Actual results could differ from those estimates. Subsequent events, if any, through the date that the financial statements were issued have been evaluated in the preparation of the financial statements. The following summarizes the significant accounting policies of the Fund:
Investment Valuation. Investments are valued as of 4:00 p.m. Eastern time on the last calendar day of the period. The Board of Trustees (the Board) has delegated the day to day responsibility for the valuation of the Fund's investments to the Fair Value Committee (the Committee) established by the Fund's investment adviser. In accordance with valuation policies and procedures approved by the Board, the Fund attempts to obtain prices from one or more third party pricing vendors or brokers to value its investments. When current market prices, quotations or currency exchange rates are not readily available or reliable, investments will be fair valued in good faith by the Committee, in accordance with procedures adopted by the Board. Factors used in determining fair value vary by investment type and may include market or investment specific events. The frequency with which these procedures are used cannot be predicted and they may be utilized to a significant extent. The Committee oversees the Fund's valuation policies and procedures and reports to the Board on the Committee's activities and fair value determinations. The Board monitors the appropriateness of the procedures used in valuing the Fund's investments and ratifies the fair value determinations of the Committee.
The Fund categorizes the inputs to valuation techniques used to value its investments into a disclosure hierarchy consisting of three levels as shown below:
- Level 1 – quoted prices in active markets for identical investments
- Level 2 – other significant observable inputs (including quoted prices for similar investments, interest rates, prepayment speeds, etc.)
- Level 3 – unobservable inputs (including the Fund's own assumptions based on the best information available)
Valuation techniques used to value the Fund's investments by major category are as follows:
Equity securities, including restricted securities, for which market quotations are readily available, are valued at the last reported sale price or official closing price as reported by a third party pricing vendor on the primary market or exchange on which they are traded and are categorized as Level 1 in the hierarchy. In the event there were no sales during the day or closing prices are not available, securities are valued at the last quoted bid price or may be valued using the last available price and are generally categorized as Level 2 in the hierarchy. For foreign equity securities, when market or security specific events arise, comparisons to the valuation of American Depositary Receipts (ADRs), futures contracts, Exchange-Traded Funds (ETFs) and certain indexes as well as quoted prices for similar securities may be used and would be categorized as Level 2 in the hierarchy. For equity securities, including restricted securities, where observable inputs are limited, assumptions about market activity and risk are used and these securities may be categorized as Level 3 in the hierarchy.
Investments in open-end mutual funds, including the Fidelity Central Funds, are valued at their closing net asset value (NAV) each business day and are categorized as Level 1 in the hierarchy.
Changes in valuation techniques may result in transfers in or out of an assigned level within the disclosure hierarchy. The aggregate value of investments by input level as of April 30, 2019 is included at the end of the Fund's Schedule of Investments.
Foreign Currency. The Fund may use foreign currency contracts to facilitate transactions in foreign-denominated securities. Gains and losses from these transactions may arise from changes in the value of the foreign currency or if the counterparties do not perform under the contracts' terms.
Foreign-denominated assets, including investment securities, and liabilities are translated into U.S. dollars at the exchange rates at period end. Purchases and sales of investment securities, income and dividends received and expenses denominated in foreign currencies are translated into U.S. dollars at the exchange rate in effect on the transaction date.
The effects of exchange rate fluctuations on investments are included with the net realized and unrealized gain (loss) on investment securities. Other foreign currency transactions resulting in realized and unrealized gain (loss) are disclosed separately.
Investment Transactions and Income. For financial reporting purposes, the Fund's investment holdings and NAV include trades executed through the end of the last business day of the period. The NAV per share for processing shareholder transactions is calculated as of the close of business of the New York Stock Exchange (NYSE), normally 4:00 p.m. Eastern time and includes trades executed through the end of the prior business day. Gains and losses on securities sold are determined on the basis of identified cost and include proceeds received from litigation. Dividend income is recorded on the ex-dividend date, except for certain dividends from foreign securities where the ex-dividend date may have passed, which are recorded as soon as the Fund is informed of the ex-dividend date. Non-cash dividends included in dividend income, if any, are recorded at the fair market value of the securities received. Income and capital gain distributions from Fidelity Central Funds, if any, are recorded on the ex-dividend date. Investment income is recorded net of foreign taxes withheld where recovery of such taxes is uncertain.
Class Allocations and Expenses. Investment income, realized and unrealized capital gains and losses, common expenses of the Fund, and certain fund-level expense reductions, if any, are allocated daily on a pro-rata basis to each class based on the relative net assets of each class to the total net assets of the Fund. Each class differs with respect to transfer agent and distribution and service plan fees incurred. Certain expense reductions may also differ by class. For the reporting period, the allocated portion of income and expenses to each class as a percent of its average net assets may vary due to the timing of recording these transactions in relation to fluctuating net assets of the classes. Expenses directly attributable to a fund are charged to that fund. Expenses attributable to more than one fund are allocated among the respective funds on the basis of relative net assets or other appropriate methods. Expense estimates are accrued in the period to which they relate and adjustments are made when actual amounts are known.
Income Tax Information and Distributions to Shareholders. Each year, the Fund intends to qualify as a regulated investment company under Subchapter M of the Internal Revenue Code, including distributing substantially all of its taxable income and realized gains. As a result, no provision for U.S. Federal income taxes is required. The Fund files a U.S. federal tax return, in addition to state and local tax returns as required. The Fund's federal income tax returns are subject to examination by the Internal Revenue Service (IRS) for a period of three fiscal years after they are filed. State and local tax returns may be subject to examination for an additional fiscal year depending on the jurisdiction. Foreign taxes are provided for based on the Fund's understanding of the tax rules and rates that exist in the foreign markets in which it invests.
Distributions are declared and recorded on the ex-dividend date. Income and capital gain distributions are declared separately for each class. Income and capital gain distributions are determined in accordance with income tax regulations, which may differ from GAAP.
Capital accounts within the financial statements are adjusted for permanent book-tax differences. These adjustments have no impact on net assets or the results of operations. Capital accounts are not adjusted for temporary book-tax differences which will reverse in a subsequent period.
Book-tax differences are primarily due to foreign currency transactions, passive foreign investment companies (PFIC), deferred trustees compensation and losses deferred due to wash sales.
As of period end, the cost and unrealized appreciation (depreciation) in securities, and derivatives if applicable, for federal income tax purposes were as follows:
| Gross unrealized appreciation | $87,404,251 |
| Gross unrealized depreciation | (47,849,815) |
| Net unrealized appreciation (depreciation) | $39,554,436 |
| Tax cost | $937,488,246 |
Restricted Securities. The Fund may invest in securities that are subject to legal or contractual restrictions on resale. These securities generally may be resold in transactions exempt from registration or to the public if the securities are registered. Disposal of these securities may involve time-consuming negotiations and expense, and prompt sale at an acceptable price may be difficult. Information regarding restricted securities is included at the end of the Fund's Schedule of Investments.
4. Purchases and Sales of Investments.
Purchases and sales of securities, other than short-term securities, aggregated $265,795,776 and $313,517,920, respectively.
5. Fees and Other Transactions with Affiliates.
Management Fee. Fidelity Management & Research Company (the investment adviser) and its affiliates provide the Fund with investment management related services for which the Fund pays a monthly management fee. The management fee is the sum of an individual fund fee rate that is based on an annual rate of .45% of the Fund's average net assets and an annualized group fee rate that averaged .24% during the period. The group fee rate is based upon the average net assets of all the mutual funds advised by the investment adviser, including any mutual funds previously advised by the investment adviser that are currently advised by Fidelity SelectCo, LLC, an affiliate of the investment adviser. The group fee rate decreases as assets under management increase and increases as assets under management decrease. In addition, the management fee is subject to a performance adjustment (up to a maximum of +/- .20% of the Fund's average net assets over a 36 month performance period). The upward or downward adjustment to the management fee is based on the relative investment performance of Europe as compared to its benchmark index, the MSCI Europe Index, over the same 36 month performance period. For the reporting period, the total annualized management fee rate, including the performance adjustment, was .56% of the Fund's average net assets. The performance adjustment included in the management fee rate may be higher or lower than the maximum performance adjustment rate due to the difference between the average net assets for the reporting and performance periods.
Distribution and Service Plan Fees. In accordance with Rule 12b-1 of the 1940 Act, the Fund has adopted separate Distribution and Service Plans for each class of shares. Certain classes pay Fidelity Distributors Corporation (FDC), an affiliate of the investment adviser, separate Distribution and Service Fees, each of which is based on an annual percentage of each class' average net assets. In addition, FDC may pay financial intermediaries for selling shares of the Fund and providing shareholder support services. For the period, the Distribution and Service Fee rates, total fees and amounts retained by FDC were as follows:
| | Distribution Fee | Service Fee | Total Fees | Retained by FDC |
| Class A | -% | .25% | $24,350 | $2,097 |
| Class M | .25% | .25% | 16,560 | 239 |
| Class C | .75% | .25% | 44,128 | 8,475 |
| | | | $85,038 | $10,811 |
Sales Load. FDC may receive a front-end sales charge of up to 5.75% for selling Class A shares and 3.50% for selling Class M shares, some of which is paid to financial intermediaries for selling shares of the Fund. Depending on the holding period, FDC may receive contingent deferred sales charges levied on Class A, Class M and Class C redemptions. The deferred sales charges are 1.00% for Class C shares, 1.00% for certain purchases of Class A shares and .25% for certain purchases of Class M shares.
For the period, sales charge amounts retained by FDC were as follows:
| | Retained by FDC |
| Class A | $5,766 |
| Class M | 149 |
| Class C(a) | 317 |
| | $6,232 |
(a) When Class C shares are initially sold, FDC pays commissions from its own resources to financial intermediaries through which the sales are made.
Transfer Agent Fees. Fidelity Investments Institutional Operations Company, Inc., (FIIOC), an affiliate of the investment adviser, is the transfer, dividend disbursing and shareholder servicing agent for each class of the Fund. FIIOC receives account fees and asset-based fees that vary according to the account size and type of account of the shareholders of the respective classes of the Fund, except for Class Z. FIIOC receives an asset-based fee of Class Z's average net assets. FIIOC pays for typesetting, printing and mailing of shareholder reports, except proxy statements.
For the period, transfer agent fees for each class were as follows:
| | Amount | % of Class-Level Average Net Assets(a) |
| Class A | $23,020 | .24 |
| Class M | 10,058 | .30 |
| Class C | 12,863 | .29 |
| Europe | 788,108 | .17 |
| Class I | 5,030 | .15 |
| Class Z | 46 | .05 |
| | $839,125 | |
(a) Annualized
Accounting and Security Lending Fees. Fidelity Service Company, Inc. (FSC), an affiliate of the investment adviser, maintains the Fund's accounting records. The accounting fee is based on the level of average net assets for each month. Prior to April 1, 2019, FSC had a separate agreement with the Fund for administration of the security lending program, based on the number and duration of lending transactions. For the period, the total fees paid for accounting and administration of securities lending were equivalent to an annualized rate of .05%.
Interfund Trades. The Fund may purchase from or sell securities to other Fidelity Funds under procedures adopted by the Board. The procedures have been designed to ensure these interfund trades are executed in accordance with Rule 17a-7 of the 1940 Act. Interfund trades are included within the respective purchases and sales amounts shown in the Purchases and Sales of Investments note.
6. Committed Line of Credit.
The Fund participates with other funds managed by the investment adviser or an affiliate in a $4.25 billion credit facility (the "line of credit") to be utilized for temporary or emergency purposes to fund shareholder redemptions or for other short-term liquidity purposes. The Fund has agreed to pay commitment fees on its pro-rata portion of the line of credit, which amounted to $1,364 and is reflected in Miscellaneous expenses on the Statement of Operations. During the period, the Fund did not borrow on this line of credit.
7. Security Lending.
The Fund lends portfolio securities through a lending agent from time to time in order to earn additional income. For equity securities, a lending agent is used and may loan securities to certain qualified borrowers, including Fidelity Capital Markets (FCM), a broker-dealer affiliated with the Fund. On the settlement date of the loan, the Fund receives collateral (in the form of U.S. Treasury obligations, letters of credit and/or cash) against the loaned securities and maintains collateral in an amount not less than 100% of the market value of the loaned securities during the period of the loan. The market value of the loaned securities is determined at the close of business of the Fund and any additional required collateral is delivered to the Fund on the next business day. The Fund or borrower may terminate the loan at any time, and if the borrower defaults on its obligation to return the securities loaned because of insolvency or other reasons, the Fund may apply collateral received from the borrower against the obligation. The Fund may experience delays and costs in recovering the securities loaned. Any cash collateral received is invested in the Fidelity Securities Lending Cash Central Fund. At period end, there were no security loans outstanding. Security lending income represents the income earned on investing cash collateral, less rebates paid to borrowers and any lending agent fees associated with the loan, plus any premium payments received for lending certain types of securities. Security lending income is presented in the Statement of Operations as a component of income from Fidelity Central Funds. Total security lending income during the period amounted to $186,572. During the period, there were no securities loaned to FCM.
8. Expense Reductions.
Commissions paid to certain brokers with whom the investment adviser, or its affiliates, places trades on behalf of the Fund include an amount in addition to trade execution, which may be rebated back to the Fund to offset certain expenses. This amount totaled $441,461 for the period. In addition, through arrangements with each class' transfer agent, credits realized as a result of certain uninvested cash balances were used to reduce the Fund's expenses. During the period, credits reduced each class' transfer agent expense as noted in the table below.
| | Transfer Agent expense reduction |
| Europe | $598 |
In addition, during the period the investment adviser reimbursed and/or waived a portion of fund-level operating expenses in the amount of $3,604 and a portion of class-level operating expenses as follows:
| | Amount |
| Class A | $329 |
| Class M | 111 |
| Class C | 151 |
| Europe | 15,290 |
| Class I | 116 |
| Class Z | 4 |
| | $16,001 |
9. Distributions to Shareholders.
Distributions to shareholders of each class were as follows:
| | Six months ended
April 30, 2019 | Year ended
October 31, 2018(a) |
| Distributions to shareholders | | |
| Class A | $1,831,498 | $501,208 |
| Class M | 614,305 | 186,202 |
| Class C | 867,653 | 200,227 |
| Europe | 92,001,047 | 30,143,621 |
| Class I | 707,340 | 228,958 |
| Class Z | 22,047 | – |
| Total | $96,043,890 | $31,260,216 |
(a) Distributions for Class Z are for the period October 2, 2018 (commencement of sale of shares) to October 31, 2018.
10. Share Transactions.
Share transactions for each class were as follows and may contain automatic conversions between classes or exchanges between affiliated funds:
| | Shares | Shares | Dollars | Dollars |
| | Six months ended April 30, 2019 | Year ended October 31, 2018(a) | Six months ended April 30, 2019 | Year ended October 31, 2018(a) |
| Class A | | | | |
| Shares sold | 94,453 | 219,725 | $3,161,158 | $9,120,083 |
| Reinvestment of distributions | 55,527 | 11,776 | 1,772,425 | 482,917 |
| Shares redeemed | (98,233) | (204,787) | (3,321,716) | (8,469,723) |
| Net increase (decrease) | 51,747 | 26,714 | $1,611,867 | $1,133,277 |
| Class M | | | | |
| Shares sold | 2,653 | 32,492 | $92,217 | $1,375,839 |
| Reinvestment of distributions | 19,078 | 4,513 | 611,073 | 185,442 |
| Shares redeemed | (29,775) | (52,789) | (1,051,648) | (2,166,691) |
| Net increase (decrease) | (8,044) | (15,784) | $(348,358) | $(605,410) |
| Class C | | | | |
| Shares sold | 4,297 | 79,985 | $146,790 | $3,363,120 |
| Reinvestment of distributions | 27,024 | 4,833 | 858,558 | 197,576 |
| Shares redeemed | (92,770) | (68,943) | (3,171,112) | (2,831,033) |
| Net increase (decrease) | (61,449) | 15,875 | $(2,165,764) | $729,663 |
| Europe | | | | |
| Shares sold | 677,236 | 2,475,476 | $23,120,327 | $104,461,482 |
| Reinvestment of distributions | 2,737,998 | 696,409 | 87,123,097 | 28,552,790 |
| Shares redeemed | (2,645,492) | (9,777,479) | (90,515,350) | (410,827,963) |
| Net increase (decrease) | 769,742 | (6,605,594) | $19,728,074 | $(277,813,691) |
| Class I | | | | |
| Shares sold | 55,607 | 129,107 | $1,917,627 | $5,438,702 |
| Reinvestment of distributions | 20,748 | 5,434 | 659,789 | 222,682 |
| Shares redeemed | (63,081) | (139,490) | (2,136,025) | (5,809,512) |
| Net increase (decrease) | 13,274 | (4,949) | $441,391 | $(148,128) |
| Class Z | | | | |
| Shares sold | 4,209 | 2,761 | $152,323 | $111,832 |
| Reinvestment of distributions | 695 | – | 22,047 | – |
| Shares redeemed | (2,459) | – | (83,604) | – |
| Net increase (decrease) | 2,445 | 2,761 | $90,766 | $111,832 |
(a) Share transactions for Class Z are for the period October 2, 2018 (commencement of sale of shares) to October 31, 2018.
11. Other.
The Fund's organizational documents provide former and current trustees and officers with a limited indemnification against liabilities arising in connection with the performance of their duties to the Fund. In the normal course of business, the Fund may also enter into contracts that provide general indemnifications. The Fund's maximum exposure under these arrangements is unknown as this would be dependent on future claims that may be made against the Fund. The risk of material loss from such claims is considered remote.
Fidelity® Japan Fund
Investment Summary (Unaudited)
Geographic Diversification (% of fund's net assets)
| As of April 30, 2019 |
| | Japan | 97.6% |
| | United States of America* | 1.8% |
| | Bermuda | 0.6% |

* Includes Short-Term investments and Net Other Assets (Liabilities).
Percentages are based on country or territory of incorporation and are adjusted for the effect of futures contracts, if applicable.
Asset Allocation as of April 30, 2019
| | % of fund's net assets |
| Stocks | 98.6 |
| Short-Term Investments and Net Other Assets (Liabilities) | 1.4 |
Top Ten Stocks as of April 30, 2019
| | % of fund's net assets |
| SoftBank Corp. (Wireless Telecommunication Services) | 7.0 |
| Hoya Corp. (Health Care Equipment & Supplies) | 3.9 |
| Sony Corp. (Household Durables) | 3.6 |
| Mitsubishi UFJ Financial Group, Inc. (Banks) | 3.4 |
| Shimadzu Corp. (Electronic Equipment & Components) | 3.0 |
| Nidec Corp. (Electrical Equipment) | 2.6 |
| ORIX Corp. (Diversified Financial Services) | 2.5 |
| Suzuki Motor Corp. (Automobiles) | 2.4 |
| Takeda Pharmaceutical Co. Ltd. (Pharmaceuticals) | 2.3 |
| Tokio Marine Holdings, Inc. (Insurance) | 2.1 |
| | 32.8 |
Top Market Sectors as of April 30, 2019
| | % of fund's net assets |
| Industrials | 21.4 |
| Information Technology | 13.5 |
| Consumer Discretionary | 13.3 |
| Financials | 11.4 |
| Communication Services | 10.1 |
| Health Care | 9.9 |
| Consumer Staples | 9.7 |
| Materials | 8.1 |
| Real Estate | 1.2 |
Fidelity® Japan Fund
Schedule of Investments April 30, 2019 (Unaudited)
Showing Percentage of Net Assets
| Common Stocks - 98.6% | | | |
| | | Shares | Value |
| COMMUNICATION SERVICES - 10.1% | | | |
| Entertainment - 1.5% | | | |
| Nintendo Co. Ltd. | | 29,900 | $10,298,032 |
| Interactive Media & Services - 0.6% | | | |
| LIFULL Co. Ltd. | | 778,300 | 4,192,109 |
| Media - 1.0% | | | |
| Dentsu, Inc. | | 163,500 | 6,656,246 |
| Wireless Telecommunication Services - 7.0% | | | |
| SoftBank Corp. | | 443,500 | 47,024,920 |
|
| TOTAL COMMUNICATION SERVICES | | | 68,171,307 |
|
| CONSUMER DISCRETIONARY - 13.3% | | | |
| Auto Components - 0.8% | | | |
| Aisin Seiki Co. Ltd. | | 78,400 | 3,029,867 |
| DaikyoNishikawa Corp. | | 267,100 | 2,678,313 |
| | | | 5,708,180 |
| Automobiles - 4.2% | | | |
| Subaru Corp. | | 484,200 | 11,825,182 |
| Suzuki Motor Corp. | | 361,600 | 16,441,528 |
| | | | 28,266,710 |
| Distributors - 0.6% | | | |
| Arata Corp. | | 112,800 | 4,025,136 |
| Hotels, Restaurants & Leisure - 0.9% | | | |
| Koshidaka Holdings Co. Ltd. | | 462,200 | 6,431,258 |
| Household Durables - 4.0% | | | |
| Sekisui Chemical Co. Ltd. | | 183,100 | 2,927,430 |
| Sony Corp. | | 481,100 | 24,232,097 |
| | | | 27,159,527 |
| Internet & Direct Marketing Retail - 0.8% | | | |
| Zozo, Inc. | | 289,200 | 5,101,468 |
| Leisure Products - 0.8% | | | |
| Bandai Namco Holdings, Inc. | | 117,800 | 5,604,740 |
| Specialty Retail - 1.2% | | | |
| Nitori Holdings Co. Ltd. | | 43,200 | 5,138,471 |
| USS Co. Ltd. | | 148,400 | 2,832,249 |
| | | | 7,970,720 |
|
| TOTAL CONSUMER DISCRETIONARY | | | 90,267,739 |
|
| CONSUMER STAPLES - 9.7% | | | |
| Food & Staples Retailing - 4.8% | | | |
| Ain Holdings, Inc. | | 57,300 | 4,547,170 |
| Nishimoto Co. Ltd. | | 113,700 | 4,092,975 |
| San-A Co. Ltd. (a) | | 29,600 | 1,158,544 |
| Seven & i Holdings Co. Ltd. | | 301,100 | 10,420,261 |
| Sundrug Co. Ltd. | | 81,100 | 2,166,647 |
| Tsuruha Holdings, Inc. | | 61,300 | 5,211,284 |
| Welcia Holdings Co. Ltd. | | 129,800 | 5,097,850 |
| | | | 32,694,731 |
| Food Products - 0.8% | | | |
| Morinaga & Co. Ltd. | | 124,000 | 5,148,346 |
| Personal Products - 4.1% | | | |
| Kao Corp. | | 170,400 | 13,089,571 |
| Kose Corp. | | 33,500 | 6,270,255 |
| Shiseido Co. Ltd. | | 110,500 | 8,647,955 |
| | | | 28,007,781 |
|
| TOTAL CONSUMER STAPLES | | | 65,850,858 |
|
| FINANCIALS - 11.4% | | | |
| Banks - 3.4% | | | |
| Mitsubishi UFJ Financial Group, Inc. | | 4,680,500 | 23,222,423 |
| Capital Markets - 1.1% | | | |
| JAFCO Co. Ltd. | | 93,100 | 3,497,675 |
| SBI Holdings, Inc. Japan | | 188,400 | 4,013,405 |
| | | | 7,511,080 |
| Consumer Finance - 0.9% | | | |
| AEON Financial Service Co. Ltd. | | 287,500 | 5,933,502 |
| Diversified Financial Services - 2.5% | | | |
| ORIX Corp. | | 1,218,600 | 17,191,345 |
| Insurance - 3.5% | | | |
| AFLAC, Inc. | | 55,500 | 2,796,090 |
| Sony Financial Holdings, Inc. | | 307,400 | 6,255,898 |
| Tokio Marine Holdings, Inc. | | 284,900 | 14,327,481 |
| | | | 23,379,469 |
|
| TOTAL FINANCIALS | | | 77,237,819 |
|
| HEALTH CARE - 9.9% | | | |
| Health Care Equipment & Supplies - 6.7% | | | |
| Hoya Corp. | | 382,200 | 26,813,528 |
| Nakanishi, Inc. | | 137,600 | 2,634,775 |
| Olympus Corp. | | 768,800 | 8,585,549 |
| Paramount Bed Holdings Co. Ltd. | | 120,400 | 5,641,977 |
| Sysmex Corp. | | 37,300 | 2,126,932 |
| | | | 45,802,761 |
| Health Care Providers & Services - 0.9% | | | |
| N Field Co. Ltd. (b) | | 188,800 | 1,222,001 |
| Ship Healthcare Holdings, Inc. | | 118,700 | 4,864,361 |
| | | | 6,086,362 |
| Pharmaceuticals - 2.3% | | | |
| Takeda Pharmaceutical Co. Ltd. | | 416,341 | 15,363,701 |
|
| TOTAL HEALTH CARE | | | 67,252,824 |
|
| INDUSTRIALS - 21.4% | | | |
| Building Products - 2.8% | | | |
| Daikin Industries Ltd. | | 100,300 | 12,770,143 |
| Toto Ltd. | | 152,600 | 6,424,831 |
| | | | 19,194,974 |
| Commercial Services & Supplies - 0.8% | | | |
| Sohgo Security Services Co., Ltd. | | 128,300 | 5,706,957 |
| Construction & Engineering - 1.5% | | | |
| Mirait Holdings Corp. | | 315,000 | 4,612,101 |
| Toshiba Plant Systems & Services Corp. | | 293,900 | 5,255,611 |
| | | | 9,867,712 |
| Electrical Equipment - 2.6% | | | |
| Nidec Corp. | | 123,700 | 17,528,655 |
| Machinery - 6.2% | | | |
| Fanuc Corp. | | 42,100 | 7,909,561 |
| Hoshizaki Corp. (c) | | 131,100 | 8,473,630 |
| Kitz Corp. | | 330,900 | 2,518,993 |
| Minebea Mitsumi, Inc. | | 461,500 | 8,161,542 |
| Misumi Group, Inc. | | 450,460 | 11,638,080 |
| Nabtesco Corp. | | 40,000 | 1,217,290 |
| Shima Seiki Manufacturing Ltd. | | 55,400 | 1,852,552 |
| | | | 41,771,648 |
| Professional Services - 3.3% | | | |
| Outsourcing, Inc. | | 357,700 | 4,665,722 |
| Persol Holdings Co., Ltd. | | 337,400 | 6,312,147 |
| Recruit Holdings Co. Ltd. | | 208,300 | 6,224,972 |
| SMS Co., Ltd. | | 269,900 | 5,165,643 |
| | | | 22,368,484 |
| Road & Rail - 2.3% | | | |
| East Japan Railway Co. | | 124,500 | 11,696,149 |
| Hitachi Transport System Ltd. | | 150,800 | 4,169,523 |
| | | | 15,865,672 |
| Trading Companies & Distributors - 1.9% | | | |
| Itochu Corp. | | 371,400 | 6,668,163 |
| MonotaRO Co. Ltd. | | 44,600 | 1,025,766 |
| Trusco Nakayama Corp. | | 196,900 | 4,958,073 |
| | | | 12,652,002 |
|
| TOTAL INDUSTRIALS | | | 144,956,104 |
|
| INFORMATION TECHNOLOGY - 13.5% | | | |
| Electronic Equipment & Components - 7.1% | | | |
| Azbil Corp. | | 238,000 | 5,698,155 |
| Dexerials Corp. | | 511,800 | 3,225,312 |
| Ibiden Co. Ltd. | | 104,700 | 1,869,458 |
| Iriso Electronics Co. Ltd. | | 118,600 | 6,132,555 |
| Murata Manufacturing Co. Ltd. | | 101,100 | 5,076,601 |
| Shimadzu Corp. | | 753,400 | 20,114,113 |
| TDK Corp. | | 71,200 | 6,193,528 |
| | | | 48,309,722 |
| IT Services - 4.4% | | | |
| GMO Internet, Inc. | | 457,800 | 7,064,574 |
| IT Holdings Corp. | | 83,900 | 3,811,069 |
| ITOCHU Techno-Solutions Corp. | | 273,900 | 6,690,443 |
| Net One Systems Co. Ltd. | | 47,300 | 1,217,796 |
| NSD Co. Ltd. | | 170,500 | 4,219,835 |
| NTT Data Corp. | | 250,600 | 2,911,050 |
| Otsuka Corp. | | 92,200 | 3,616,985 |
| | | | 29,531,752 |
| Semiconductors & Semiconductor Equipment - 0.8% | | | |
| Renesas Electronics Corp. (d) | | 952,200 | 5,068,940 |
| Software - 1.2% | | | |
| Money Forward, Inc. (b)(d) | | 98,700 | 4,027,034 |
| Oracle Corp. Japan | | 61,900 | 4,228,727 |
| | | | 8,255,761 |
|
| TOTAL INFORMATION TECHNOLOGY | | | 91,166,175 |
|
| MATERIALS - 8.1% | | | |
| Chemicals - 8.1% | | | |
| Axalta Coating Systems Ltd. (d) | | 154,700 | 4,173,806 |
| JSR Corp. | | 338,900 | 5,135,448 |
| Kansai Paint Co. Ltd. | | 429,100 | 8,147,103 |
| KH Neochem Co. Ltd. | | 174,800 | 5,060,640 |
| Nissan Chemical Corp. | | 133,500 | 5,908,299 |
| Nitto Denko Corp. | | 71,700 | 3,855,496 |
| NOF Corp. | | 128,400 | 4,558,750 |
| Okamoto Industries, Inc. | | 42,800 | 2,209,255 |
| Shin-Etsu Chemical Co. Ltd. | | 131,300 | 12,437,331 |
| Tokyo Ohka Kogyo Co. Ltd. | | 118,500 | 3,765,788 |
| | | | 55,251,916 |
| REAL ESTATE - 1.2% | | | |
| Equity Real Estate Investment Trusts (REITs) - 0.8% | | | |
| Invincible Investment Corp. | | 11,276 | 5,698,988 |
| Real Estate Management & Development - 0.4% | | | |
| Daiwa House Industry Co. Ltd. | | 91,600 | 2,558,172 |
|
| TOTAL REAL ESTATE | | | 8,257,160 |
|
| TOTAL COMMON STOCKS | | | |
| (Cost $593,019,231) | | | 668,411,902 |
|
| Money Market Funds - 0.8% | | | |
| Fidelity Cash Central Fund, 2.49% (e) | | 4,099,229 | 4,100,049 |
| Fidelity Securities Lending Cash Central Fund 2.49% (e)(f) | | 1,152,908 | 1,153,023 |
| TOTAL MONEY MARKET FUNDS | | | |
| (Cost $5,253,144) | | | 5,253,072 |
| TOTAL INVESTMENT IN SECURITIES - 99.4% | | | |
| (Cost $598,272,375) | | | 673,664,974 |
| NET OTHER ASSETS (LIABILITIES) - 0.6% | | | 3,901,009 |
| NET ASSETS - 100% | | | $677,565,983 |
Legend
(a) A portion of the security sold on a delayed delivery basis.
(b) Security or a portion of the security is on loan at period end.
(c) Security or a portion of the security purchased on a delayed delivery or when-issued basis.
(d) Non-income producing
(e) Affiliated fund that is generally available only to investment companies and other accounts managed by Fidelity Investments. The rate quoted is the annualized seven-day yield of the fund at period end. A complete unaudited listing of the fund's holdings as of its most recent quarter end is available upon request. In addition, each Fidelity Central Fund's financial statements are available on the SEC's website or upon request.
(f) Investment made with cash collateral received from securities on loan.
Affiliated Central Funds
Information regarding fiscal year to date income earned by the Fund from investments in Fidelity Central Funds is as follows:
| Fund | Income earned |
| Fidelity Cash Central Fund | $121,494 |
| Fidelity Securities Lending Cash Central Fund | 84,105 |
| Total | $205,599 |
Amounts in the income column in the above table include any capital gain distributions from underlying funds, which are presented in the corresponding line-item in the Statement of Operations, if applicable.
Investment Valuation
The following is a summary of the inputs used, as of April 30, 2019, involving the Fund's assets and liabilities carried at fair value. The inputs or methodology used for valuing securities may not be an indication of the risk associated with investing in those securities. For more information on valuation inputs, and their aggregation into the levels used below, please refer to the Investment Valuation section in the accompanying Notes to Financial Statements.
| | Valuation Inputs at Reporting Date: |
| Description | Total | Level 1 | Level 2 | Level 3 |
| Investments in Securities: | | | | |
| Equities: | | | | |
| Communication Services | $68,171,307 | $10,848,355 | $57,322,952 | $-- |
| Consumer Discretionary | 90,267,739 | 66,035,642 | 24,232,097 | -- |
| Consumer Staples | 65,850,858 | 55,430,597 | 10,420,261 | -- |
| Financials | 77,237,819 | 54,015,396 | 23,222,423 | -- |
| Health Care | 67,252,824 | 51,889,123 | 15,363,701 | -- |
| Industrials | 144,956,104 | 124,276,400 | 20,679,704 | -- |
| Information Technology | 91,166,175 | 86,089,574 | 5,076,601 | -- |
| Materials | 55,251,916 | 42,814,585 | 12,437,331 | -- |
| Real Estate | 8,257,160 | 8,257,160 | -- | -- |
| Money Market Funds | 5,253,072 | 5,253,072 | -- | -- |
| Total Investments in Securities: | $673,664,974 | $504,909,904 | $168,755,070 | $-- |
See accompanying notes which are an integral part of the financial statements.
Fidelity® Japan Fund
Financial Statements
Statement of Assets and Liabilities
| | | April 30, 2019 (Unaudited) |
| Assets | | |
Investment in securities, at value (including securities loaned of $1,091,938) — See accompanying schedule:
Unaffiliated issuers (cost $593,019,231) | $668,411,902 | |
| Fidelity Central Funds (cost $5,253,144) | 5,253,072 | |
| Total Investment in Securities (cost $598,272,375) | | $673,664,974 |
| Receivable for securities sold on a delayed delivery basis | | 1,176,122 |
| Receivable for fund shares sold | | 73,238 |
| Dividends receivable | | 5,082,926 |
| Distributions receivable from Fidelity Central Funds | | 17,712 |
| Prepaid expenses | | 193 |
| Other receivables | | 32,707 |
| Total assets | | 680,047,872 |
| Liabilities | | |
| Payable for investments purchased | | |
| Regular delivery | $3,050 | |
| Delayed delivery | 336,519 | |
| Payable for fund shares redeemed | 350,981 | |
| Accrued management fee | 448,454 | |
| Distribution and service plan fees payable | 13,668 | |
| Other affiliated payables | 122,284 | |
| Other payables and accrued expenses | 55,583 | |
| Collateral on securities loaned | 1,151,350 | |
| Total liabilities | | 2,481,889 |
| Net Assets | | $677,565,983 |
| Net Assets consist of: | | |
| Paid in capital | | $703,007,686 |
| Total distributable earnings (loss) | | (25,441,703) |
| Net Assets | | $677,565,983 |
| Net Asset Value and Maximum Offering Price | | |
| Class A: | | |
| Net Asset Value and redemption price per share ($15,176,231 ÷ 1,025,561 shares) | | $14.80 |
| Maximum offering price per share (100/94.25 of $14.80) | | $15.70 |
| Class M: | | |
| Net Asset Value and redemption price per share ($3,888,640 ÷ 263,880 shares) | | $14.74 |
| Maximum offering price per share (100/96.50 of $14.74) | | $15.27 |
| Class C: | | |
| Net Asset Value and offering price per share ($10,689,288 ÷ 734,360 shares)(a) | | $14.56 |
| Japan: | | |
| Net Asset Value, offering price and redemption price per share ($397,522,432 ÷ 26,813,312 shares) | | $14.83 |
| Class I: | | |
| Net Asset Value, offering price and redemption price per share ($249,970,058 ÷ 16,876,906 shares) | | $14.81 |
| Class Z: | | |
| Net Asset Value, offering price and redemption price per share ($319,334 ÷ 21,577 shares) | | $14.80 |
(a) Redemption price per share is equal to net asset value less any applicable contingent deferred sales charge.
See accompanying notes which are an integral part of the financial statements.
Statement of Operations
| | | Six months ended April 30, 2019 (Unaudited) |
| Investment Income | | |
| Dividends | | $7,090,033 |
| Interest | | 1,436 |
| Income from Fidelity Central Funds | | 205,599 |
| Income before foreign taxes withheld | | 7,297,068 |
| Less foreign taxes withheld | | (708,668) |
| Total income | | 6,588,400 |
| Expenses | | |
| Management fee | | |
| Basic fee | $2,247,054 | |
| Performance adjustment | 93,054 | |
| Transfer agent fees | 573,305 | |
| Distribution and service plan fees | 85,472 | |
| Accounting and security lending fees | 161,938 | |
| Custodian fees and expenses | 32,271 | |
| Independent trustees' fees and expenses | 1,618 | |
| Registration fees | 80,588 | |
| Audit | 48,655 | |
| Legal | 893 | |
| Interest | 3,879 | |
| Miscellaneous | 1,533 | |
| Total expenses before reductions | 3,330,260 | |
| Expense reductions | (70,484) | |
| Total expenses after reductions | | 3,259,776 |
| Net investment income (loss) | | 3,328,624 |
| Realized and Unrealized Gain (Loss) | | |
| Net realized gain (loss) on: | | |
| Investment securities: | | |
| Unaffiliated issuers | (133,601) | |
| Fidelity Central Funds | (74) | |
| Foreign currency transactions | 30,681 | |
| Futures contracts | 124,181 | |
| Total net realized gain (loss) | | 21,187 |
| Change in net unrealized appreciation (depreciation) on: | | |
| Investment securities: | | |
| Unaffiliated issuers | 26,809,894 | |
| Fidelity Central Funds | 90 | |
| Assets and liabilities in foreign currencies | (447,022) | |
| Total change in net unrealized appreciation (depreciation) | | 26,362,962 |
| Net gain (loss) | | 26,384,149 |
| Net increase (decrease) in net assets resulting from operations | | $29,712,773 |
See accompanying notes which are an integral part of the financial statements.
Statement of Changes in Net Assets
| | Six months ended April 30, 2019 (Unaudited) | Year ended October 31, 2018 |
| Increase (Decrease) in Net Assets | | |
| Operations | | |
| Net investment income (loss) | $3,328,624 | $1,758,486 |
| Net realized gain (loss) | 21,187 | 41,576,809 |
| Change in net unrealized appreciation (depreciation) | 26,362,962 | (63,407,131) |
| Net increase (decrease) in net assets resulting from operations | 29,712,773 | (20,071,836) |
| Distributions to shareholders | (2,139,920) | (3,858,691) |
| Share transactions - net increase (decrease) | 128,538,324 | 88,029,029 |
| Redemption fees | – | 7,512 |
| Total increase (decrease) in net assets | 156,111,177 | 64,106,014 |
| Net Assets | | |
| Beginning of period | 521,454,806 | 457,348,792 |
| End of period | $677,565,983 | $521,454,806 |
See accompanying notes which are an integral part of the financial statements.
Financial Highlights
Fidelity Japan Fund Class A
| | Six months ended (Unaudited) April 30, | Years endedOctober 31, | | | | |
| | 2019 | 2018 | 2017 | 2016 | 2015 | 2014 |
| Selected Per–Share Data | | | | | | |
| Net asset value, beginning of period | $14.15 | $15.08 | $12.59 | $11.87 | $11.65 | $12.00 |
| Income from Investment Operations | | | | | | |
| Net investment income (loss)A | .05 | .03 | .06 | .06 | .04 | .05 |
| Net realized and unrealized gain (loss) | .60 | (.85) | 2.52 | .72 | .23 | (.31) |
| Total from investment operations | .65 | (.82) | 2.58 | .78 | .27 | (.26) |
| Distributions from net investment income | – | (.08) | (.06) | (.05) | (.05) | (.08) |
| Distributions from net realized gain | – | (.04) | (.03) | (.01) | – | (.01) |
| Total distributions | – | (.11)B | (.09) | (.06) | (.05) | (.09) |
| Redemption fees added to paid in capitalA | – | –C | –C | –C | –C | –C |
| Net asset value, end of period | $14.80 | $14.15 | $15.08 | $12.59 | $11.87 | $11.65 |
| Total ReturnD,E,F | 4.59% | (5.48)% | 20.70% | 6.56% | 2.31% | (2.18)% |
| Ratios to Average Net AssetsG,H | | | | | | |
| Expenses before reductions | 1.32%I | 1.33% | 1.11% | 1.08% | 1.10% | 1.23% |
| Expenses net of fee waivers, if any | 1.32%I | 1.33% | 1.11% | 1.08% | 1.10% | 1.23% |
| Expenses net of all reductions | 1.30%I | 1.32% | 1.11% | 1.08% | 1.09% | 1.23% |
| Net investment income (loss) | .72%I | .17% | .45% | .51% | .37% | .41% |
| Supplemental Data | | | | | | |
| Net assets, end of period (000 omitted) | $15,176 | $14,587 | $16,155 | $23,910 | $23,918 | $21,352 |
| Portfolio turnover rateJ | 33%I | 40% | 23% | 15% | 35% | 112% |
A Calculated based on average shares outstanding during the period.
B Total distributions of $.11 per share is comprised of distributions from net investment income of $.078 and distributions from net realized gain of $.035 per share.
C Amount represents less than $.005 per share.
D Total returns for periods of less than one year are not annualized.
E Total returns would have been lower if certain expenses had not been reduced during the applicable periods shown.
F Total returns do not include the effect of the sales charges.
G Fees and expenses of any underlying Fidelity Central Funds are not included in the Fund's expense ratio. The Fund indirectly bears its proportionate share of the expenses of any underlying Fidelity Central Funds.
H Expense ratios reflect operating expenses of the class. Expenses before reductions do not reflect amounts reimbursed by the investment adviser or reductions from brokerage service arrangements or reductions from other expense offset arrangements and do not represent the amount paid by the class during periods when reimbursements or reductions occur. Expenses net of fee waivers reflect expenses after reimbursement by the investment adviser but prior to reductions from brokerage service arrangements or other expense offset arrangements. Expenses net of all reductions represent the net expenses paid by the class.
I Annualized
J Amount does not include the portfolio activity of any underlying Fidelity Central Funds.
See accompanying notes which are an integral part of the financial statements.
Fidelity Japan Fund Class M
| | Six months ended (Unaudited) April 30, | Years endedOctober 31, | | | | |
| | 2019 | 2018 | 2017 | 2016 | 2015 | 2014 |
| Selected Per–Share Data | | | | | | |
| Net asset value, beginning of period | $14.11 | $15.06 | $12.57 | $11.85 | $11.62 | $11.96 |
| Income from Investment Operations | | | | | | |
| Net investment income (loss)A | .03 | (.03) | .01 | .02 | –B | .01 |
| Net realized and unrealized gain (loss) | .60 | (.84) | 2.52 | .71 | .23 | (.30) |
| Total from investment operations | .63 | (.87) | 2.53 | .73 | .23 | (.29) |
| Distributions from net investment income | – | (.05) | (.01) | –B | – | (.04) |
| Distributions from net realized gain | – | (.04) | (.03) | (.01) | – | (.01) |
| Total distributions | – | (.08)C | (.04) | (.01) | – | (.05) |
| Redemption fees added to paid in capitalA | – | –B | –B | –B | –B | –B |
| Net asset value, end of period | $14.74 | $14.11 | $15.06 | $12.57 | $11.85 | $11.62 |
| Total ReturnD,E,F | 4.46% | (5.81)% | 20.24% | 6.15% | 1.98% | (2.42)% |
| Ratios to Average Net AssetsG,H | | | | | | |
| Expenses before reductions | 1.64%I | 1.67% | 1.46% | 1.44% | 1.43% | 1.54% |
| Expenses net of fee waivers, if any | 1.64%I | 1.67% | 1.46% | 1.44% | 1.43% | 1.54% |
| Expenses net of all reductions | 1.62%I | 1.66% | 1.46% | 1.44% | 1.42% | 1.54% |
| Net investment income (loss) | .40%I | (.17)% | .10% | .16% | .04% | .10% |
| Supplemental Data | | | | | | |
| Net assets, end of period (000 omitted) | $3,889 | $3,993 | $4,464 | $4,193 | $4,809 | $4,104 |
| Portfolio turnover rateJ | 33%I | 40% | 23% | 15% | 35% | 112% |
A Calculated based on average shares outstanding during the period.
B Amount represents less than $.005 per share.
C Total distributions of $.08 per share is comprised of distributions from net investment income of $.047 and distributions from net realized gain of $.035 per share.
D Total returns for periods of less than one year are not annualized.
E Total returns would have been lower if certain expenses had not been reduced during the applicable periods shown.
F Total returns do not include the effect of the sales charges.
G Fees and expenses of any underlying Fidelity Central Funds are not included in the Fund's expense ratio. The Fund indirectly bears its proportionate share of the expenses of any underlying Fidelity Central Funds.
H Expense ratios reflect operating expenses of the class. Expenses before reductions do not reflect amounts reimbursed by the investment adviser or reductions from brokerage service arrangements or reductions from other expense offset arrangements and do not represent the amount paid by the class during periods when reimbursements or reductions occur. Expenses net of fee waivers reflect expenses after reimbursement by the investment adviser but prior to reductions from brokerage service arrangements or other expense offset arrangements. Expenses net of all reductions represent the net expenses paid by the class.
I Annualized
J Amount does not include the portfolio activity of any underlying Fidelity Central Funds.
See accompanying notes which are an integral part of the financial statements.
Fidelity Japan Fund Class C
| | Six months ended (Unaudited) April 30, | Years endedOctober 31, | | | | |
| | 2019 | 2018 | 2017 | 2016 | 2015 | 2014 |
| Selected Per–Share Data | | | | | | |
| Net asset value, beginning of period | $13.97 | $14.92 | $12.44 | $11.77 | $11.58 | $11.96 |
| Income from Investment Operations | | | | | | |
| Net investment income (loss)A | –B | (.08) | (.03) | (.02) | (.04) | (.03) |
| Net realized and unrealized gain (loss) | .59 | (.83) | 2.51 | .69 | .23 | (.32) |
| Total from investment operations | .59 | (.91) | 2.48 | .67 | .19 | (.35) |
| Distributions from net investment income | – | –B | – | – | – | (.03) |
| Distributions from net realized gain | – | (.04) | – | – | – | (.01) |
| Total distributions | – | (.04) | – | – | – | (.03)C |
| Redemption fees added to paid in capitalA | – | –B | –B | –B | –B | –B |
| Net asset value, end of period | $14.56 | $13.97 | $14.92 | $12.44 | $11.77 | $11.58 |
| Total ReturnD,E,F | 4.22% | (6.13)% | 19.94% | 5.69% | 1.64% | (2.90)% |
| Ratios to Average Net AssetsG,H | | | | | | |
| Expenses before reductions | 2.00%I | 2.04% | 1.81% | 1.81% | 1.81% | 1.93% |
| Expenses net of fee waivers, if any | 2.00%I | 2.03% | 1.81% | 1.81% | 1.81% | 1.93% |
| Expenses net of all reductions | 1.98%I | 2.03% | 1.81% | 1.81% | 1.80% | 1.93% |
| Net investment income (loss) | .04%I | (.53)% | (.25)% | (.21)% | (.34)% | (.29)% |
| Supplemental Data | | | | | | |
| Net assets, end of period (000 omitted) | $10,689 | $12,586 | $13,542 | $15,077 | $18,491 | $13,162 |
| Portfolio turnover rateJ | 33%I | 40% | 23% | 15% | 35% | 112% |
A Calculated based on average shares outstanding during the period.
B Amount represents less than $.005 per share.
C Total distributions of $.03 per share is comprised of distributions from net investment income of $.025 and distributions from net realized gain of $.009 per share.
D Total returns for periods of less than one year are not annualized.
E Total returns would have been lower if certain expenses had not been reduced during the applicable periods shown.
F Total returns do not include the effect of the contingent deferred sales charge.
G Fees and expenses of any underlying Fidelity Central Funds are not included in the Fund's expense ratio. The Fund indirectly bears its proportionate share of the expenses of any underlying Fidelity Central Funds.
H Expense ratios reflect operating expenses of the class. Expenses before reductions do not reflect amounts reimbursed by the investment adviser or reductions from brokerage service arrangements or reductions from other expense offset arrangements and do not represent the amount paid by the class during periods when reimbursements or reductions occur. Expenses net of fee waivers reflect expenses after reimbursement by the investment adviser but prior to reductions from brokerage service arrangements or other expense offset arrangements. Expenses net of all reductions represent the net expenses paid by the class.
I Annualized
J Amount does not include the portfolio activity of any underlying Fidelity Central Funds.
See accompanying notes which are an integral part of the financial statements.
Fidelity Japan Fund
| | Six months ended (Unaudited) April 30, | Years endedOctober 31, | | | | |
| | 2019 | 2018 | 2017 | 2016 | 2015 | 2014 |
| Selected Per–Share Data | | | | | | |
| Net asset value, beginning of period | $14.20 | $15.13 | $12.64 | $11.91 | $11.69 | $12.03 |
| Income from Investment Operations | | | | | | |
| Net investment income (loss)A | .07 | .07 | .10 | .09 | .08 | .09 |
| Net realized and unrealized gain (loss) | .61 | (.86) | 2.54 | .72 | .23 | (.32) |
| Total from investment operations | .68 | (.79) | 2.64 | .81 | .31 | (.23) |
| Distributions from net investment income | (.05) | (.11) | (.11) | (.07) | (.09) | (.11) |
| Distributions from net realized gain | – | (.04) | (.03) | (.01) | – | (.01) |
| Total distributions | (.05) | (.14)B | (.15)C | (.08) | (.09) | (.11)D |
| Redemption fees added to paid in capitalA | – | –E | –E | –E | –E | –E |
| Net asset value, end of period | $14.83 | $14.20 | $15.13 | $12.64 | $11.91 | $11.69 |
| Total ReturnF,G | 4.82% | (5.28)% | 21.13% | 6.80% | 2.66% | (1.90)% |
| Ratios to Average Net AssetsH,I | | | | | | |
| Expenses before reductions | 1.01%J | 1.05% | .82% | .78% | .80% | .90% |
| Expenses net of fee waivers, if any | 1.00%J | 1.05% | .82% | .78% | .80% | .90% |
| Expenses net of all reductions | .99%J | 1.04% | .82% | .78% | .79% | .90% |
| Net investment income (loss) | 1.03%J | .45% | .74% | .81% | .67% | .74% |
| Supplemental Data | | | | | | |
| Net assets, end of period (000 omitted) | $397,522 | $297,644 | $247,372 | $352,936 | $485,803 | $415,612 |
| Portfolio turnover rateK | 33%J | 40% | 23% | 15% | 35% | 112% |
A Calculated based on average shares outstanding during the period.
B Total distributions of $.14 per share is comprised of distributions from net investment income of $.107 and distributions from net realized gain of $.035 per share.
C Total distributions of $.15 per share is comprised of distributions from net investment income of $.112 and distributions from net realized gain of $.034 per share.
D Total distributions of $.11 per share is comprised of distributions from net investment income of $.105 and distributions from net realized gain of $.009 per share.
E Amount represents less than $.005 per share.
F Total returns for periods of less than one year are not annualized.
G Total returns would have been lower if certain expenses had not been reduced during the applicable periods shown.
H Fees and expenses of any underlying Fidelity Central Funds are not included in the Fund's expense ratio. The Fund indirectly bears its proportionate share of the expenses of any underlying Fidelity Central Funds.
I Expense ratios reflect operating expenses of the class. Expenses before reductions do not reflect amounts reimbursed by the investment adviser or reductions from brokerage service arrangements or reductions from other expense offset arrangements and do not represent the amount paid by the class during periods when reimbursements or reductions occur. Expenses net of fee waivers reflect expenses after reimbursement by the investment adviser but prior to reductions from brokerage service arrangements or other expense offset arrangements. Expenses net of all reductions represent the net expenses paid by the class.
J Annualized
K Amount does not include the portfolio activity of any underlying Fidelity Central Funds.
See accompanying notes which are an integral part of the financial statements.
Fidelity Japan Fund Class I
| | Six months ended (Unaudited) April 30, | Years endedOctober 31, | | | | |
| | 2019 | 2018 | 2017 | 2016 | 2015 | 2014 |
| Selected Per–Share Data | | | | | | |
| Net asset value, beginning of period | $14.18 | $15.12 | $12.62 | $11.89 | $11.67 | $12.02 |
| Income from Investment Operations | | | | | | |
| Net investment income (loss)A | .08 | .08 | .11 | .10 | .08 | .09 |
| Net realized and unrealized gain (loss) | .59 | (.85) | 2.53 | .70 | .23 | (.32) |
| Total from investment operations | .67 | (.77) | 2.64 | .80 | .31 | (.23) |
| Distributions from net investment income | (.04) | (.14) | (.11) | (.07) | (.09) | (.12) |
| Distributions from net realized gain | – | (.04) | (.03) | (.01) | – | (.01) |
| Total distributions | (.04) | (.17)B | (.14) | (.07)C | (.09) | (.12)D |
| Redemption fees added to paid in capitalA | – | –E | –E | –E | –E | –E |
| Net asset value, end of period | $14.81 | $14.18 | $15.12 | $12.62 | $11.89 | $11.67 |
| Total ReturnF,G | 4.76% | (5.18)% | 21.22% | 6.77% | 2.72% | (1.90)% |
| Ratios to Average Net AssetsH,I | | | | | | |
| Expenses before reductions | .96%J | .98% | .76% | .77% | .80% | .89% |
| Expenses net of fee waivers, if any | .95%J | .98% | .76% | .77% | .80% | .89% |
| Expenses net of all reductions | .94%J | .97% | .76% | .76% | .79% | .89% |
| Net investment income (loss) | 1.08%J | .52% | .80% | .83% | .67% | .76% |
| Supplemental Data | | | | | | |
| Net assets, end of period (000 omitted) | $249,970 | $192,555 | $175,816 | $7,032 | $13,957 | $20,253 |
| Portfolio turnover rateK | 33%J | 40% | 23% | 15% | 35% | 112% |
A Calculated based on average shares outstanding during the period.
B Total distributions of $.17 per share is comprised of distributions from net investment income of $.135 and distributions from net realized gain of $.035 per share.
C Total distributions of $.07 per share is comprised of distributions from net investment income of $.065 and distributions from net realized gain of $.006 per share.
D Total distributions of $.12 per share is comprised of distributions from net investment income of $.115 and distributions from net realized gain of $.009 per share.
E Amount represents less than $.005 per share.
F Total returns for periods of less than one year are not annualized.
G Total returns would have been lower if certain expenses had not been reduced during the applicable periods shown.
H Fees and expenses of any underlying Fidelity Central Funds are not included in the Fund's expense ratio. The Fund indirectly bears its proportionate share of the expenses of any underlying Fidelity Central Funds.
I Expense ratios reflect operating expenses of the class. Expenses before reductions do not reflect amounts reimbursed by the investment adviser or reductions from brokerage service arrangements or reductions from other expense offset arrangements and do not represent the amount paid by the class during periods when reimbursements or reductions occur. Expenses net of fee waivers reflect expenses after reimbursement by the investment adviser but prior to reductions from brokerage service arrangements or other expense offset arrangements. Expenses net of all reductions represent the net expenses paid by the class.
J Annualized
K Amount does not include the portfolio activity of any underlying Fidelity Central Funds.
See accompanying notes which are an integral part of the financial statements.
Fidelity Japan Fund Class Z
| | Six months ended (Unaudited) April 30, | Year endedOctober 31, |
| | 2019 | 2018 A |
| Selected Per–Share Data | | |
| Net asset value, beginning of period | $14.19 | $15.77 |
| Income from Investment Operations | | |
| Net investment income (loss)B | .08 | (.01) |
| Net realized and unrealized gain (loss) | .59 | (1.57) |
| Total from investment operations | .67 | (1.58) |
| Distributions from net investment income | (.06) | – |
| Distributions from net realized gain | – | – |
| Total distributions | (.06) | – |
| Net asset value, end of period | $14.80 | $14.19 |
| Total ReturnC,D | 4.78% | (10.02)% |
| Ratios to Average Net AssetsE,F | | |
| Expenses before reductions | .87%G | .96%G |
| Expenses net of fee waivers, if any | .86%G | .96%G |
| Expenses net of all reductions | .84%G | .95%G |
| Net investment income (loss) | 1.18%G | (.73)%G |
| Supplemental Data | | |
| Net assets, end of period (000 omitted) | $319 | $90 |
| Portfolio turnover rateH | 33%G | 40% |
A For the period October 2, 2018 (commencement of sale of shares) to October 31, 2018.
B Calculated based on average shares outstanding during the period.
C Total returns for periods of less than one year are not annualized.
D Total returns would have been lower if certain expenses had not been reduced during the applicable periods shown.
E Fees and expenses of any underlying Fidelity Central Funds are not included in the Fund's expense ratio. The Fund indirectly bears its proportionate share of the expenses of any underlying Fidelity Central Funds.
F Expense ratios reflect operating expenses of the class. Expenses before reductions do not reflect amounts reimbursed by the investment adviser or reductions from brokerage service arrangements or reductions from other expense offset arrangements and do not represent the amount paid by the class during periods when reimbursements or reductions occur. Expense ratios before reductions for start-up periods may not be representative of longer-term operating periods. Expenses net of fee waivers reflect expenses after reimbursement by the investment adviser but prior to reductions from brokerage service arrangements or other expense offset arrangements. Expenses net of all reductions represent the net expenses paid by the class.
G Annualized
H Amount does not include the portfolio activity of any underlying Fidelity Central Funds.
See accompanying notes which are an integral part of the financial statements.
Notes to Financial Statements (Unaudited)
For the period ended April 30, 2019
1. Organization.
Fidelity Japan Fund (the Fund) is a fund of Fidelity Investment Trust (the Trust) and is authorized to issue an unlimited number of shares. The Trust is registered under the Investment Company Act of 1940, as amended (the 1940 Act), as an open-end management investment company organized as a Massachusetts business trust. The Fund offers Class A, Class M, Class C, Japan, Class I and Class Z shares, each of which has equal rights as to assets and voting privileges. Each class has exclusive voting rights with respect to matters that affect that class. Effective March 1, 2019, Class C shares will automatically convert to Class A shares after a holding period of ten years from the initial date of purchase, with certain exceptions.
2. Investments in Fidelity Central Funds.
The Fund invests in Fidelity Central Funds, which are open-end investment companies generally available only to other investment companies and accounts managed by the investment adviser and its affiliates. The Fund's Schedule of Investments lists each of the Fidelity Central Funds held as of period end, if any, as an investment of the Fund, but does not include the underlying holdings of each Fidelity Central Fund. As an Investing Fund, the Fund indirectly bears its proportionate share of the expenses of the underlying Fidelity Central Funds.
The Money Market Central Funds seek preservation of capital and current income and are managed by Fidelity Investments Money Management, Inc. (FIMM), an affiliate of the investment adviser. Annualized expenses of the Money Market Central Funds as of their most recent shareholder report date are less than .005%.
A complete unaudited list of holdings for each Fidelity Central Fund is available upon request or at the Securities and Exchange Commission (the SEC) website at www.sec.gov. In addition, the financial statements of the Fidelity Central Funds are available on the SEC website or upon request.
3. Significant Accounting Policies.
The Fund is an investment company and applies the accounting and reporting guidance of the Financial Accounting Standards Board (FASB) Accounting Standards Codification Topic 946 Financial Services – Investments Companies. The financial statements have been prepared in conformity with accounting principles generally accepted in the United States of America (GAAP), which require management to make certain estimates and assumptions at the date of the financial statements. Actual results could differ from those estimates. Subsequent events, if any, through the date that the financial statements were issued have been evaluated in the preparation of the financial statements. The following summarizes the significant accounting policies of the Fund:
Investment Valuation. Investments are valued as of 4:00 p.m. Eastern time on the last calendar day of the period. The Board of Trustees (the Board) has delegated the day to day responsibility for the valuation of the Fund's investments to the Fair Value Committee (the Committee) established by the Fund's investment adviser. In accordance with valuation policies and procedures approved by the Board, the Fund attempts to obtain prices from one or more third party pricing vendors or brokers to value its investments. When current market prices, quotations or currency exchange rates are not readily available or reliable, investments will be fair valued in good faith by the Committee, in accordance with procedures adopted by the Board. Factors used in determining fair value vary by investment type and may include market or investment specific events. The frequency with which these procedures are used cannot be predicted and they may be utilized to a significant extent. The Committee oversees the Fund's valuation policies and procedures and reports to the Board on the Committee's activities and fair value determinations. The Board monitors the appropriateness of the procedures used in valuing the Fund's investments and ratifies the fair value determinations of the Committee.
The Fund categorizes the inputs to valuation techniques used to value its investments into a disclosure hierarchy consisting of three levels as shown below:
- Level 1 – quoted prices in active markets for identical investments
- Level 2 – other significant observable inputs (including quoted prices for similar investments, interest rates, prepayment speeds, etc.)
- Level 3 – unobservable inputs (including the Fund's own assumptions based on the best information available)
Valuation techniques used to value the Fund's investments by major category are as follows:
Equity securities, including restricted securities, for which market quotations are readily available, are valued at the last reported sale price or official closing price as reported by a third party pricing vendor on the primary market or exchange on which they are traded and are categorized as Level 1 in the hierarchy. In the event there were no sales during the day or closing prices are not available, securities are valued at the last quoted bid price or may be valued using the last available price and are generally categorized as Level 2 in the hierarchy. For foreign equity securities, when market or security specific events arise, comparisons to the valuation of American Depositary Receipts (ADRs), futures contracts, Exchange-Traded Funds (ETFs) and certain indexes as well as quoted prices for similar securities may be used and would be categorized as Level 2 in the hierarchy. For equity securities, including restricted securities, where observable inputs are limited, assumptions about market activity and risk are used and these securities may be categorized as Level 3 in the hierarchy.
Investments in open-end mutual funds, including the Fidelity Central Funds, are valued at their closing net asset value (NAV) each business day and are categorized as Level 1 in the hierarchy.
Changes in valuation techniques may result in transfers in or out of an assigned level within the disclosure hierarchy. The aggregate value of investments by input level as of April 30, 2019 is included at the end of the Fund's Schedule of Investments.
Foreign Currency. The Fund may use foreign currency contracts to facilitate transactions in foreign-denominated securities. Gains and losses from these transactions may arise from changes in the value of the foreign currency or if the counterparties do not perform under the contracts' terms.
Foreign-denominated assets, including investment securities, and liabilities are translated into U.S. dollars at the exchange rates at period end. Purchases and sales of investment securities, income and dividends received and expenses denominated in foreign currencies are translated into U.S. dollars at the exchange rate in effect on the transaction date.
The effects of exchange rate fluctuations on investments are included with the net realized and unrealized gain (loss) on investment securities. Other foreign currency transactions resulting in realized and unrealized gain (loss) are disclosed separately.
Investment Transactions and Income. For financial reporting purposes, the Fund's investment holdings and NAV include trades executed through the end of the last business day of the period. The NAV per share for processing shareholder transactions is calculated as of the close of business of the New York Stock Exchange (NYSE), normally 4:00 p.m. Eastern time and includes trades executed through the end of the prior business day. Gains and losses on securities sold are determined on the basis of identified cost. Dividend income is recorded on the ex-dividend date, except for certain dividends from foreign securities where the ex-dividend date may have passed, which are recorded as soon as the Fund is informed of the ex-dividend date. Non-cash dividends included in dividend income, if any, are recorded at the fair market value of the securities received. Income and capital gain distributions from Fidelity Central Funds, if any, are recorded on the ex-dividend date. Interest income is accrued as earned and includes coupon interest and amortization of premium and accretion of discount on debt securities as applicable. Investment income is recorded net of foreign taxes withheld where recovery of such taxes is uncertain.
Class Allocations and Expenses. Investment income, realized and unrealized capital gains and losses, common expenses of the Fund, and certain fund-level expense reductions, if any, are allocated daily on a pro-rata basis to each class based on the relative net assets of each class to the total net assets of the Fund. Each class differs with respect to transfer agent and distribution and service plan fees incurred. Certain expense reductions may also differ by class. For the reporting period, the allocated portion of income and expenses to each class as a percent of its average net assets may vary due to the timing of recording these transactions in relation to fluctuating net assets of the classes. Expenses directly attributable to a fund are charged to that fund. Expenses attributable to more than one fund are allocated among the respective funds on the basis of relative net assets or other appropriate methods. Expense estimates are accrued in the period to which they relate and adjustments are made when actual amounts are known.
Income Tax Information and Distributions to Shareholders. Each year, the Fund intends to qualify as a regulated investment company under Subchapter M of the Internal Revenue Code, including distributing substantially all of its taxable income and realized gains. As a result, no provision for U.S. Federal income taxes is required. The Fund files a U.S. federal tax return, in addition to state and local tax returns as required. The Fund's federal income tax returns are subject to examination by the Internal Revenue Service (IRS) for a period of three fiscal years after they are filed. State and local tax returns may be subject to examination for an additional fiscal year depending on the jurisdiction. Foreign taxes are provided for based on the Fund's understanding of the tax rules and rates that exist in the foreign markets in which it invests.
Distributions are declared and recorded on the ex-dividend date. Income and capital gain distributions are declared separately for each class. Income and capital gain distributions are determined in accordance with income tax regulations, which may differ from GAAP.
Capital accounts within the financial statements are adjusted for permanent book-tax differences. These adjustments have no impact on net assets or the results of operations. Capital accounts are not adjusted for temporary book-tax differences which will reverse in a subsequent period.
Book-tax differences are primarily due to foreign currency transactions, passive foreign investment companies (PFIC), deferred trustees compensation, capital loss carryforwards, expiring capital loss carryforwards and losses deferred due to wash sales.
As of period end, the cost and unrealized appreciation (depreciation) in securities, and derivatives if applicable, for federal income tax purposes were as follows:
| Gross unrealized appreciation | $110,303,366 |
| Gross unrealized depreciation | (38,312,700) |
| Net unrealized appreciation (depreciation) | $71,990,666 |
| Tax cost | $601,674,308 |
Capital loss carryforwards are only available to offset future capital gains of the Fund to the extent provided by regulations and may be limited. Under the Regulated Investment Company Modernization Act of 2010 (the Act), the Fund is permitted to carry forward capital losses incurred in taxable years beginning after December 22, 2010 for an unlimited period and such capital losses are required to be used prior to any losses that expire. The capital loss carryforward information presented below, including any applicable limitation, is estimated as of prior fiscal period end and is subject to adjustment.
| Fiscal year of expiration | |
| 2019 | $(98,806,038) |
Delayed Delivery Transactions and When-Issued Securities. During the period, the Fund transacted in securities on a delayed delivery or when-issued basis. Payment and delivery may take place after the customary settlement period for that security. The price of the underlying securities and the date when the securities will be delivered and paid for are fixed at the time the transaction is negotiated. The securities purchased on a delayed delivery or when-issued basis are identified as such in the Fund's Schedule of Investments. Losses may arise due to changes in the value of the underlying securities or if the counterparty does not perform under the contract's terms, or if the issuer does not issue the securities due to political, economic, or other factors.
4. Derivative Instruments.
Risk Exposures and the Use of Derivative Instruments. The Fund's investment objective allows the Fund to enter into various types of derivative contracts, including futures contracts. Derivatives are investments whose value is primarily derived from underlying assets, indices or reference rates and may be transacted on an exchange or over-the-counter (OTC). Derivatives may involve a future commitment to buy or sell a specified asset based on specified terms, to exchange future cash flows at periodic intervals based on a notional principal amount, or for one party to make one or more payments upon the occurrence of specified events in exchange for periodic payments from the other party.
The Fund used derivatives to increase returns and to manage exposure to certain risks as defined below. The success of any strategy involving derivatives depends on analysis of numerous economic factors, and if the strategies for investment do not work as intended, the Fund may not achieve its objectives.
The Fund's use of derivatives increased or decreased its exposure to the following risk:
| Equity Risk | Equity risk relates to the fluctuations in the value of financial instruments as a result of changes in market prices (other than those arising from interest rate risk or foreign exchange risk), whether caused by factors specific to an individual investment, its issuer, or all factors affecting all instruments traded in a market or market segment.
|
The Fund is also exposed to additional risks from investing in derivatives, such as liquidity risk and counterparty credit risk. Liquidity risk is the risk that the Fund will be unable to close out the derivative in the open market in a timely manner. Counterparty credit risk is the risk that the counterparty will not be able to fulfill its obligation to the Fund. Counterparty credit risk related to exchange-traded futures contracts may be mitigated by the protection provided by the exchange on which they trade.
Investing in derivatives may involve greater risks than investing in the underlying assets directly and, to varying degrees, may involve risk of loss in excess of any initial investment and collateral received and amounts recognized in the Statement of Assets and Liabilities. In addition, there may be the risk that the change in value of the derivative contract does not correspond to the change in value of the underlying instrument.
Futures Contracts. A futures contract is an agreement between two parties to buy or sell a specified underlying instrument for a fixed price at a specified future date. The Fund used futures contracts to manage its exposure to the stock market.
Upon entering into a futures contract, a fund is required to deposit either cash or securities (initial margin) with a clearing broker in an amount equal to a certain percentage of the face value of the contract. Futures contracts are marked-to-market daily and subsequent daily payments (variation margin) are made or received by a fund depending on the daily fluctuations in the value of the futures contracts and are recorded as unrealized appreciation or (depreciation). This receivable and/or payable, if any, is included in daily variation margin on futures contracts in the Statement of Assets and Liabilities. Realized gain or (loss) is recorded upon the expiration or closing of a futures contract. The net realized gain (loss) and change in net unrealized appreciation (depreciation) on futures contracts during the period is presented in the Statement of Operations.
Any open futures contracts at period end are presented in the Schedule of Investments under the caption "Futures Contracts". The notional amount at value reflects each contract's exposure to the underlying instrument or index at period end.
5. Purchases and Sales of Investments.
Purchases and sales of securities, other than short-term securities, aggregated $241,106,550 and $103,892,276, respectively.
6. Fees and Other Transactions with Affiliates.
Management Fee. Fidelity Management & Research Company (the investment adviser) and its affiliates provide the Fund with investment management related services for which the Fund pays a monthly management fee. The management fee is the sum of an individual fund fee rate that is based on an annual rate of .45% of the Fund's average net assets and an annualized group fee rate that averaged .24% during the period. The group fee rate is based upon the average net assets of all the mutual funds advised by the investment adviser, including any mutual funds previously advised by the investment adviser that are currently advised by Fidelity SelectCo, LLC, an affiliate of the investment adviser. The group fee rate decreases as assets under management increase and increases as assets under management decrease. In addition, the management fee is subject to a performance adjustment (up to a maximum of +/- .20% of the Fund's average net assets over a 36 month performance period). The upward or downward adjustment to the management fee is based on the relative investment performance of Japan as compared to its benchmark index, the TOPIX, over the same 36 month performance period. For the reporting period, the total annualized management fee rate, including the performance adjustment, was .72% of the Fund's average net assets. The performance adjustment included in the management fee rate may be higher or lower than the maximum performance adjustment rate due to the difference between the average net assets for the reporting and performance periods.
Distribution and Service Plan Fees. In accordance with Rule 12b-1 of the 1940 Act, the Fund has adopted separate Distribution and Service Plans for each class of shares. Certain classes pay Fidelity Distributors Corporation (FDC), an affiliate of the investment adviser, separate Distribution and Service Fees, each of which is based on an annual percentage of each class' average net assets. In addition, FDC may pay financial intermediaries for selling shares of the Fund and providing shareholder support services. For the period, the Distribution and Service Fee rates, total fees and amounts retained by FDC were as follows:
| | Distribution Fee | Service Fee | Total Fees | Retained by FDC |
| Class A | -% | .25% | $17,551 | $658 |
| Class M | .25% | .25% | 9,478 | 205 |
| Class C | .75% | .25% | 58,443 | 7,379 |
| | | | $85,472 | $8,242 |
Sales Load. FDC may receive a front-end sales charge of up to 5.75% for selling Class A shares and 3.50% for selling Class M shares, some of which is paid to financial intermediaries for selling shares of the Fund. Depending on the holding period, FDC may receive contingent deferred sales charges levied on Class A, Class M and Class C redemptions. The deferred sales charges are 1.00% for Class C shares, 1.00% for certain purchases of Class A shares and .25% for certain purchases of Class M shares.
For the period, sales charge amounts retained by FDC were as follows:
| | Retained by FDC |
| Class A | $2,700 |
| Class M | 152 |
| Class C(a) | 648 |
| | $3,500 |
(a) When Class C shares are initially sold, FDC pays commissions from its own resources to financial intermediaries through which the sales are made.
Transfer Agent Fees. Fidelity Investments Institutional Operations Company, Inc., (FIIOC), an affiliate of the investment adviser, is the transfer, dividend disbursing and shareholder servicing agent for each class of the Fund. FIIOC receives account fees and asset-based fees that vary according to the account size and type of account of the shareholders of the respective classes of the Fund, except for Class Z. FIIOC receives an asset-based fee of Class Z's average net assets. FIIOC pays for typesetting, printing and mailing of shareholder reports, except proxy statements.
For the period, transfer agent fees for each class were as follows:
| | Amount | % of Class-Level Average Net Assets(a) |
| Class A | $17,860 | .25 |
| Class M | 6,137 | .32 |
| Class C | 10,764 | .18 |
| Japan | 388,537 | .19 |
| Class I | 149,939 | .14 |
| Class Z | 68 | .05 |
| | $573,305 | |
(a) Annualized
Accounting and Security Lending Fees. Fidelity Service Company, Inc. (FSC), an affiliate of the investment adviser, maintains the Fund's accounting records. The accounting fee is based on the level of average net assets for each month. Prior to April 1, 2019, FSC had a separate agreement with the Fund for administration of the security lending program, based on the number and duration of lending transactions. For the period, the total fees paid for accounting and administration of securities lending were equivalent to an annualized rate of .05%.
Brokerage Commissions. The Fund placed a portion of its portfolio transactions with brokerage firms which are affiliates of the investment adviser. Brokerage commissions are included in net realized gain (loss) and change in net unrealized appreciation (depreciation) in the Statement of Operations. The commissions paid to these affiliated firms were $11 for the period.
Interfund Lending Program. Pursuant to an Exemptive Order issued by the SEC, the Fund, along with other registered investment companies having management contracts with Fidelity Management & Research Company (FMR) or other affiliated entities of FMR, may participate in an interfund lending program. This program provides an alternative credit facility allowing the funds to borrow from, or lend money to, other participating affiliated funds. At period end, there were no interfund loans outstanding. The Fund's activity in this program during the period for which loans were outstanding was as follows:
| Borrower or Lender | Average Loan Balance | Weighted Average Interest Rate | Interest Expense |
| Borrower | $17,680,333 | 2.63% | $3,879 |
Interfund Trades. The Fund may purchase from or sell securities to other Fidelity Funds under procedures adopted by the Board. The procedures have been designed to ensure these interfund trades are executed in accordance with Rule 17a-7 of the 1940 Act. Interfund trades are included within the respective purchases and sales amounts shown in the Purchases and Sales of Investments note.
7. Committed Line of Credit.
The Fund participates with other funds managed by the investment adviser or an affiliate in a $4.25 billion credit facility (the "line of credit") to be utilized for temporary or emergency purposes to fund shareholder redemptions or for other short-term liquidity purposes. The Fund has agreed to pay commitment fees on its pro-rata portion of the line of credit, which amounted to $867 and is reflected in Miscellaneous expenses on the Statement of Operations. During the period, the Fund did not borrow on this line of credit.
8. Security Lending.
The Fund lends portfolio securities through a lending agent from time to time in order to earn additional income. For equity securities, a lending agent is used and may loan securities to certain qualified borrowers, including Fidelity Capital Markets (FCM), a broker-dealer affiliated with the Fund. On the settlement date of the loan, the Fund receives collateral (in the form of U.S. Treasury obligations, letters of credit and/or cash) against the loaned securities and maintains collateral in an amount not less than 100% of the market value of the loaned securities during the period of the loan. The market value of the loaned securities is determined at the close of business of the Fund and any additional required collateral is delivered to the Fund on the next business day. The Fund or borrower may terminate the loan at any time, and if the borrower defaults on its obligation to return the securities loaned because of insolvency or other reasons, the Fund may apply collateral received from the borrower against the obligation. The Fund may experience delays and costs in recovering the securities loaned. Any cash collateral received is invested in the Fidelity Securities Lending Cash Central Fund. The value of loaned securities and cash collateral at period end are disclosed on the Fund's Statement of Assets and Liabilities. Security lending income represents the income earned on investing cash collateral, less rebates paid to borrowers and any lending agent fees associated with the loan, plus any premium payments received for lending certain types of securities. Security lending income is presented in the Statement of Operations as a component of income from Fidelity Central Funds. Total security lending income during the period amounted to $84,105. During the period, there were no securities loaned to FCM.
9. Expense Reductions.
Commissions paid to certain brokers with whom the investment adviser, or its affiliates, places trades on behalf of the Fund include an amount in addition to trade execution, which may be rebated back to the Fund to offset certain expenses. This amount totaled $51,949 for the period.
In addition, during the period the investment adviser reimbursed and/or waived a portion of fund-level operating expenses in the amount of $2,535 and a portion of class-level operating expenses as follows:
| | Amount |
| Class A | $325 |
| Class M | 91 |
| Class C | 286 |
| Japan | 10,002 |
| Class I | 5,288 |
| Class Z | 8 |
| | $16,000 |
10. Distributions to Shareholders.
Distributions to shareholders of each class were as follows:
| | Six months ended
April 30, 2019 | Year ended
October 31, 2018(a) |
| Distributions to shareholders | | |
| Class A | $– | $121,236 |
| Class M | – | 24,538 |
| Class C | – | 35,656 |
| Japan | 1,540,617 | 1,679,410 |
| Class I | 598,003 | 1,997,851 |
| Class Z | 1,300 | – |
| Total | $2,139,920 | $3,858,691 |
(a) Distributions for Class Z are for the period October 2, 2018 (commencement of sale of shares) to October 31, 2018.
11. Share Transactions.
Share transactions for each class were as follows and may contain automatic conversions between classes or exchanges between affiliated funds:
| | Shares | Shares | Dollars | Dollars |
| | Six months ended April 30, 2019 | Year ended October 31, 2018(a) | Six months ended April 30, 2019 | Year ended October 31, 2018(a) |
| Class A | | | | |
| Shares sold | 165,607 | 227,462 | $2,333,852 | $3,578,036 |
| Reinvestment of distributions | – | 7,603 | – | 116,628 |
| Shares redeemed | (170,838) | (275,394) | (2,353,824) | (4,276,195) |
| Net increase (decrease) | (5,231) | (40,329) | $(19,972) | $(581,531) |
| Class M | | | | |
| Shares sold | 4,785 | 26,530 | $66,458 | $416,546 |
| Reinvestment of distributions | – | 1,589 | – | 24,389 |
| Shares redeemed | (23,826) | (41,543) | (336,383) | (648,170) |
| Net increase (decrease) | (19,041) | (13,424) | $(269,925) | $(207,235) |
| Class C | | | | |
| Shares sold | 22,795 | 247,078 | $308,906 | $3,881,516 |
| Reinvestment of distributions | – | 2,227 | – | 33,918 |
| Shares redeemed | (189,538) | (255,967) | (2,626,188) | (3,954,581) |
| Net increase (decrease) | (166,743) | (6,662) | $(2,317,282) | $(39,147) |
| Japan | | | | |
| Shares sold | 10,517,954 | 13,428,936 | $149,618,291 | $195,751,878 |
| Reinvestment of distributions | 110,302 | 102,752 | 1,507,832 | 1,578,266 |
| Shares redeemed | (4,770,033) | (8,929,520) | (66,583,019) | (137,886,513) |
| Net increase (decrease) | 5,858,223 | 4,602,168 | $84,543,104 | $59,443,631 |
| Class I | | | | |
| Shares sold | 3,478,941 | 2,319,602 | $48,897,950 | $34,952,986 |
| Reinvestment of distributions | 43,742 | 129,754 | 597,082 | 1,987,832 |
| Shares redeemed | (223,302) | (501,872) | (3,103,646) | (7,627,507) |
| Net increase (decrease) | 3,299,381 | 1,947,484 | $46,391,386 | $29,313,311 |
| Class Z | | | | |
| Shares sold | 18,951 | 6,341 | $263,149 | $100,000 |
| Reinvestment of distributions | 64 | – | 875 | – |
| Shares redeemed | (3,779) | – | (53,011) | – |
| Net increase (decrease) | 15,236 | 6,341 | $211,013 | $100,000 |
(a) Share transactions for Class Z are for the period October 2, 2018 (commencement of sale of shares) to October 31, 2018.
12. Other.
The Fund's organizational documents provide former and current trustees and officers with a limited indemnification against liabilities arising in connection with the performance of their duties to the Fund. In the normal course of business, the Fund may also enter into contracts that provide general indemnifications. The Fund's maximum exposure under these arrangements is unknown as this would be dependent on future claims that may be made against the Fund. The risk of material loss from such claims is considered remote.
At the end of the period, Strategic Advisers International Fund was the owner of record of approximately 28% of the total outstanding shares of the Fund. Mutual funds managed by the investment adviser or its affiliates were the owners of record, in the aggregate, of approximately 35% of the total outstanding shares of the Fund.
Fidelity® Japan Smaller Companies Fund
Investment Summary (Unaudited)
Geographic Diversification (% of fund's net assets)
| As of April 30, 2019 |
| | Japan | 95.7% |
| | United States of America* | 4.3% |

* Includes Short-Term investments and Net Other Assets (Liabilities).
Percentages are based on country or territory of incorporation and are adjusted for the effect of futures contracts, if applicable.
Asset Allocation as of April 30, 2019
| | % of fund's net assets |
| Stocks | 95.7 |
| Short-Term Investments and Net Other Assets (Liabilities) | 4.3 |
Top Ten Stocks as of April 30, 2019
| | % of fund's net assets |
| Yamada Consulting Group Co. Ltd. (Professional Services) | 2.5 |
| Central Automotive Products Ltd. (Distributors) | 2.0 |
| Amano Corp. (Electronic Equipment & Components) | 2.0 |
| A/S One Corp. (Health Care Providers & Services) | 1.8 |
| Tokyo Gas Co. Ltd. (Gas Utilities) | 1.8 |
| Sumitomo Electric Industries Ltd. (Auto Components) | 1.7 |
| Mitsubishi Chemical Holdings Corp. (Chemicals) | 1.7 |
| Otsuka Corp. (IT Services) | 1.7 |
| Mitsubishi Heavy Industries Ltd. (Machinery) | 1.7 |
| Hakuhodo DY Holdings, Inc. (Media) | 1.6 |
| | 18.5 |
Top Market Sectors as of April 30, 2019
| | % of fund's net assets |
| Industrials | 25.8 |
| Consumer Discretionary | 18.3 |
| Information Technology | 11.2 |
| Materials | 9.3 |
| Financials | 7.9 |
| Consumer Staples | 7.4 |
| Health Care | 5.7 |
| Communication Services | 4.7 |
| Utilities | 2.9 |
| Energy | 1.8 |
Fidelity® Japan Smaller Companies Fund
Schedule of Investments April 30, 2019 (Unaudited)
Showing Percentage of Net Assets
| Common Stocks - 95.7% | | | |
| | | Shares | Value |
| COMMUNICATION SERVICES - 4.7% | | | |
| Entertainment - 2.1% | | | |
| Daiichikosho Co. Ltd. | | 167,900 | $8,199,434 |
| DeNA Co. Ltd. | | 367,300 | 5,720,773 |
| | | | 13,920,207 |
| Interactive Media & Services - 1.0% | | | |
| Yahoo! Japan Corp. | | 2,470,000 | 6,563,311 |
| Media - 1.6% | | | |
| Hakuhodo DY Holdings, Inc. | | 650,000 | 10,929,126 |
|
| TOTAL COMMUNICATION SERVICES | | | 31,412,644 |
|
| CONSUMER DISCRETIONARY - 18.3% | | | |
| Auto Components - 4.7% | | | |
| Aisin Seiki Co. Ltd. | | 160,000 | 6,183,401 |
| Bridgestone Corp. | | 244,900 | 9,686,516 |
| DaikyoNishikawa Corp. | | 385,900 | 3,869,566 |
| Sumitomo Electric Industries Ltd. | | 869,500 | 11,509,294 |
| | | | 31,248,777 |
| Automobiles - 2.2% | | | |
| Isuzu Motors Ltd. | | 761,000 | 10,899,731 |
| Subaru Corp. | | 146,000 | 3,565,627 |
| | | | 14,465,358 |
| Distributors - 3.6% | | | |
| Central Automotive Products Ltd. | | 885,000 | 13,521,882 |
| Chori Co. Ltd. | | 196,100 | 2,918,747 |
| PALTAC Corp. | | 136,000 | 7,459,581 |
| | | | 23,900,210 |
| Hotels, Restaurants & Leisure - 1.6% | | | |
| Koshidaka Holdings Co. Ltd. | | 782,000 | 10,881,099 |
| Internet & Direct Marketing Retail - 1.0% | | | |
| Aucnet, Inc. | | 575,000 | 6,514,206 |
| Specialty Retail - 4.1% | | | |
| Arc Land Sakamoto Co. Ltd. | | 493,700 | 6,395,342 |
| Fuji Corp. | | 340,600 | 6,861,227 |
| Nitori Holdings Co. Ltd. | | 68,600 | 8,159,702 |
| Workman Co. Ltd. | | 116,000 | 5,602,406 |
| | | | 27,018,677 |
| Textiles, Apparel & Luxury Goods - 1.1% | | | |
| Hagihara Industries, Inc. (a) | | 565,600 | 7,377,502 |
|
| TOTAL CONSUMER DISCRETIONARY | | | 121,405,829 |
|
| CONSUMER STAPLES - 7.4% | | | |
| Food & Staples Retailing - 2.3% | | | |
| Kirindo Holdings Co. Ltd. | | 301,100 | 4,654,555 |
| Mitsubishi Shokuhin Co. Ltd. | | 142,300 | 3,679,016 |
| San-A Co. Ltd. | | 184,000 | 7,201,760 |
| | | | 15,535,331 |
| Food Products - 5.1% | | | |
| Japan Meat Co. Ltd. | | 347,400 | 5,326,623 |
| Kotobuki Spirits Co. Ltd. | | 217,000 | 9,710,894 |
| Morinaga & Co. Ltd. | | 209,700 | 8,706,517 |
| S Foods, Inc. | | 294,569 | 10,127,917 |
| | | | 33,871,951 |
|
| TOTAL CONSUMER STAPLES | | | 49,407,282 |
|
| ENERGY - 1.8% | | | |
| Oil, Gas & Consumable Fuels - 1.8% | | | |
| Idemitsu Kosan Co. Ltd. | | 147,000 | 4,757,260 |
| San-Ai Oil Co. Ltd. | | 860,800 | 7,248,354 |
| | | | 12,005,614 |
| FINANCIALS - 7.9% | | | |
| Banks - 2.3% | | | |
| Mitsubishi UFJ Financial Group, Inc. | | 1,374,600 | 6,820,114 |
| Shinsei Bank Ltd. | | 603,300 | 8,351,260 |
| | | | 15,171,374 |
| Consumer Finance - 1.1% | | | |
| AEON Financial Service Co. Ltd. | | 341,600 | 7,050,033 |
| Diversified Financial Services - 2.0% | | | |
| ORIX Corp. | | 676,800 | 9,547,926 |
| Ricoh Leasing Co. Ltd. | | 125,000 | 3,635,711 |
| | | | 13,183,637 |
| Insurance - 2.5% | | | |
| T&D Holdings, Inc. | | 878,000 | 9,430,648 |
| Tokio Marine Holdings, Inc. (b) | | 149,500 | 7,518,282 |
| | | | 16,948,930 |
|
| TOTAL FINANCIALS | | | 52,353,974 |
|
| HEALTH CARE - 5.7% | | | |
| Health Care Equipment & Supplies - 2.1% | | | |
| Medikit Co. Ltd. | | 141,100 | 7,207,316 |
| Paramount Bed Holdings Co. Ltd. | | 138,900 | 6,508,892 |
| | | | 13,716,208 |
| Health Care Providers & Services - 1.8% | | | |
| A/S One Corp. | | 148,000 | 11,811,302 |
| Pharmaceuticals - 1.8% | | | |
| Santen Pharmaceutical Co. Ltd. | | 450,000 | 6,843,216 |
| Shionogi & Co. Ltd. | | 93,000 | 5,406,598 |
| | | | 12,249,814 |
|
| TOTAL HEALTH CARE | | | 37,777,324 |
|
| INDUSTRIALS - 25.8% | | | |
| Air Freight & Logistics - 0.8% | | | |
| AIT Corp. | | 573,220 | 5,567,791 |
| Airlines - 1.4% | | | |
| Japan Airlines Co. Ltd. | | 284,600 | 9,527,119 |
| Building Products - 1.6% | | | |
| Sekisui Jushi Corp. | | 546,300 | 10,534,157 |
| Commercial Services & Supplies - 3.0% | | | |
| Aeon Delight Co. Ltd. | | 173,800 | 5,843,000 |
| ProNexus, Inc. (b) | | 416,400 | 4,945,439 |
| Secom Joshinetsu Co. Ltd. | | 290,000 | 9,385,071 |
| | | | 20,173,510 |
| Construction & Engineering - 1.6% | | | |
| Hokuriku Electrical Construction Co. Ltd. | | 859,300 | 7,042,874 |
| Toshiba Plant Systems & Services Corp. | | 184,500 | 3,299,286 |
| | | | 10,342,160 |
| Electrical Equipment - 1.7% | | | |
| Aichi Electric Co. Ltd. (c) | | 193,100 | 4,680,372 |
| Denyo Co. Ltd. | | 522,600 | 6,624,276 |
| | | | 11,304,648 |
| Machinery - 2.8% | | | |
| Mitsubishi Heavy Industries Ltd. | | 266,700 | 11,063,519 |
| NGK Insulators Ltd. | | 515,000 | 7,600,521 |
| | | | 18,664,040 |
| Marine - 0.9% | | | |
| Nippon Concept Corp. | | 645,000 | 6,293,954 |
| Professional Services - 4.3% | | | |
| Funai Soken Holdings, Inc. (b) | | 257,880 | 6,651,010 |
| Persol Holdings Co., Ltd. | | 285,000 | 5,331,837 |
| Yamada Consulting Group Co. Ltd. | | 752,700 | 16,304,723 |
| | | | 28,287,570 |
| Trading Companies & Distributors - 6.4% | | | |
| Inaba Denki Sangyo Co. Ltd. | | 268,800 | 10,918,982 |
| Itochu Corp. | | 505,000 | 9,066,834 |
| Mitani Shoji Co. Ltd. | | 143,100 | 7,463,629 |
| Trusco Nakayama Corp. | | 242,550 | 6,107,570 |
| Yuasa Trading Co. Ltd. | | 305,800 | 8,688,514 |
| | | | 42,245,529 |
| Transportation Infrastructure - 1.3% | | | |
| Kamigumi Co. Ltd. | | 352,000 | 8,380,125 |
|
| TOTAL INDUSTRIALS | | | 171,320,603 |
|
| INFORMATION TECHNOLOGY - 11.2% | | | |
| Electronic Equipment & Components - 4.2% | | | |
| Amano Corp. (b) | | 497,200 | 12,899,215 |
| Dexerials Corp. | | 856,500 | 5,397,576 |
| Hitachi High-Technologies Corp. | | 215,000 | 9,553,840 |
| | | | 27,850,631 |
| IT Services - 3.7% | | | |
| GMO Internet, Inc. | | 285,000 | 4,397,998 |
| Otsuka Corp. | | 287,000 | 11,258,943 |
| TKC Corp. | | 224,200 | 8,744,998 |
| | | | 24,401,939 |
| Semiconductors & Semiconductor Equipment - 1.0% | | | |
| Renesas Electronics Corp. (d) | | 1,260,000 | 6,707,482 |
| Software - 1.3% | | | |
| Broadleaf Co. Ltd. | | 592,200 | 3,035,560 |
| Oracle Corp. Japan | | 77,200 | 5,273,953 |
| | | | 8,309,513 |
| Technology Hardware, Storage & Peripherals - 1.0% | | | |
| Elecom Co. Ltd. (b) | | 203,500 | 6,795,817 |
|
| TOTAL INFORMATION TECHNOLOGY | | | 74,065,382 |
|
| MATERIALS - 9.3% | | | |
| Chemicals - 6.3% | | | |
| C. Uyemura & Co. Ltd. | | 131,400 | 8,115,553 |
| Lintec Corp. | | 408,000 | 8,786,678 |
| Mitsubishi Chemical Holdings Corp. | | 1,604,800 | 11,368,084 |
| Nihon Parkerizing Co. Ltd. | | 300,000 | 3,896,943 |
| SK Kaken Co. Ltd. | | 23,600 | 9,681,943 |
| | | | 41,849,201 |
| Construction Materials - 1.6% | | | |
| Taiheiyo Cement Corp. | | 328,500 | 10,527,806 |
| Metals & Mining - 1.4% | | | |
| JFE Holdings, Inc. | | 547,000 | 9,354,414 |
|
| TOTAL MATERIALS | | | 61,731,421 |
|
| REAL ESTATE - 0.7% | | | |
| Real Estate Management & Development - 0.7% | | | |
| Century21 Real Estate Japan Ltd. | | 415,400 | 4,504,719 |
| UTILITIES - 2.9% | | | |
| Electric Utilities - 1.1% | | | |
| The Okinawa Electric Power Co., Inc. | | 445,740 | 7,358,641 |
| Gas Utilities - 1.8% | | | |
| Tokyo Gas Co. Ltd. | | 457,200 | 11,602,894 |
|
| TOTAL UTILITIES | | | 18,961,535 |
|
| TOTAL COMMON STOCKS | | | |
| (Cost $512,703,921) | | | 634,946,327 |
|
| Money Market Funds - 2.8% | | | |
| Fidelity Cash Central Fund, 2.49% (e) | | 18,395,458 | 18,399,137 |
| Fidelity Securities Lending Cash Central Fund 2.49% (e)(f) | | 136,515 | 136,529 |
| TOTAL MONEY MARKET FUNDS | | | |
| (Cost $18,535,592) | | | 18,535,666 |
| TOTAL INVESTMENT IN SECURITIES - 98.5% | | | |
| (Cost $531,239,513) | | | 653,481,993 |
| NET OTHER ASSETS (LIABILITIES) - 1.5% | | | 10,104,942 |
| NET ASSETS - 100% | | | $663,586,935 |
Legend
(a) Security or a portion of the security is on loan at period end.
(b) A portion of the security sold on a delayed delivery basis.
(c) Security or a portion of the security purchased on a delayed delivery or when-issued basis.
(d) Non-income producing
(e) Affiliated fund that is generally available only to investment companies and other accounts managed by Fidelity Investments. The rate quoted is the annualized seven-day yield of the fund at period end. A complete unaudited listing of the fund's holdings as of its most recent quarter end is available upon request. In addition, each Fidelity Central Fund's financial statements are available on the SEC's website or upon request.
(f) Investment made with cash collateral received from securities on loan.
Affiliated Central Funds
Information regarding fiscal year to date income earned by the Fund from investments in Fidelity Central Funds is as follows:
| Fund | Income earned |
| Fidelity Cash Central Fund | $294,616 |
| Fidelity Securities Lending Cash Central Fund | 25,894 |
| Total | $320,510 |
Amounts in the income column in the above table include any capital gain distributions from underlying funds, which are presented in the corresponding line-item in the Statement of Operations, if applicable.
Investment Valuation
The following is a summary of the inputs used, as of April 30, 2019, involving the Fund's assets and liabilities carried at fair value. The inputs or methodology used for valuing securities may not be an indication of the risk associated with investing in those securities. For more information on valuation inputs, and their aggregation into the levels used below, please refer to the Investment Valuation section in the accompanying Notes to Financial Statements.
| | Valuation Inputs at Reporting Date: |
| Description | Total | Level 1 | Level 2 | Level 3 |
| Investments in Securities: | | | | |
| Equities: | | | | |
| Communication Services | $31,412,644 | $31,412,644 | $-- | $-- |
| Consumer Discretionary | 121,405,829 | 121,405,829 | -- | -- |
| Consumer Staples | 49,407,282 | 49,407,282 | -- | -- |
| Energy | 12,005,614 | 12,005,614 | -- | -- |
| Financials | 52,353,974 | 45,533,860 | 6,820,114 | -- |
| Health Care | 37,777,324 | 37,777,324 | -- | -- |
| Industrials | 171,320,603 | 171,320,603 | -- | -- |
| Information Technology | 74,065,382 | 74,065,382 | -- | -- |
| Materials | 61,731,421 | 61,731,421 | -- | -- |
| Real Estate | 4,504,719 | 4,504,719 | -- | -- |
| Utilities | 18,961,535 | 18,961,535 | -- | -- |
| Money Market Funds | 18,535,666 | 18,535,666 | -- | -- |
| Total Investments in Securities: | $653,481,993 | $646,661,879 | $6,820,114 | $-- |
See accompanying notes which are an integral part of the financial statements.
Fidelity® Japan Smaller Companies Fund
Financial Statements
Statement of Assets and Liabilities
| | | April 30, 2019 (Unaudited) |
| Assets | | |
Investment in securities, at value (including securities loaned of $129,947) — See accompanying schedule:
Unaffiliated issuers (cost $512,703,921) | $634,946,327 | |
| Fidelity Central Funds (cost $18,535,592) | 18,535,666 | |
| Total Investment in Securities (cost $531,239,513) | | $653,481,993 |
| Receivable for securities sold on a delayed delivery basis | | 3,772,081 |
| Receivable for fund shares sold | | 237,405 |
| Dividends receivable | | 7,147,350 |
| Distributions receivable from Fidelity Central Funds | | 33,861 |
| Prepaid expenses | | 401 |
| Other receivables | | 5,410 |
| Total assets | | 664,678,501 |
| Liabilities | | |
| Payable for investments purchased | | |
| Regular delivery | $13,350 | |
| Delayed delivery | 15,007 | |
| Payable for fund shares redeemed | 376,926 | |
| Accrued management fee | 380,545 | |
| Transfer agent fee payable | 97,378 | |
| Other affiliated payables | 27,253 | |
| Other payables and accrued expenses | 44,607 | |
| Collateral on securities loaned | 136,500 | |
| Total liabilities | | 1,091,566 |
| Net Assets | | $663,586,935 |
| Net Assets consist of: | | |
| Paid in capital | | $536,612,211 |
| Total distributable earnings (loss) | | 126,974,724 |
| Net Assets, for 40,369,310 shares outstanding | | $663,586,935 |
| Net Asset Value, offering price and redemption price per share ($663,586,935 ÷ 40,369,310 shares) | | $16.44 |
See accompanying notes which are an integral part of the financial statements.
Statement of Operations
| | | Six months ended April 30, 2019 (Unaudited) |
| Investment Income | | |
| Dividends | | $8,961,567 |
| Income from Fidelity Central Funds | | 320,510 |
| Income before foreign taxes withheld | | 9,282,077 |
| Less foreign taxes withheld | | (896,157) |
| Total income | | 8,385,920 |
| Expenses | | |
| Management fee | $2,297,696 | |
| Transfer agent fees | 590,433 | |
| Accounting and security lending fees | 164,367 | |
| Custodian fees and expenses | 29,734 | |
| Independent trustees' fees and expenses | 1,918 | |
| Registration fees | 15,553 | |
| Audit | 34,084 | |
| Legal | 1,007 | |
| Miscellaneous | 2,344 | |
| Total expenses before reductions | 3,137,136 | |
| Expense reductions | (5,602) | |
| Total expenses after reductions | | 3,131,534 |
| Net investment income (loss) | | 5,254,386 |
| Realized and Unrealized Gain (Loss) | | |
| Net realized gain (loss) on: | | |
| Investment securities: | | |
| Unaffiliated issuers | 22,689,630 | |
| Fidelity Central Funds | (69) | |
| Foreign currency transactions | (60,743) | |
| Futures contracts | (1,808,185) | |
| Total net realized gain (loss) | | 20,820,633 |
| Change in net unrealized appreciation (depreciation) on: | | |
| Investment securities: | | |
| Unaffiliated issuers | (20,000,690) | |
| Fidelity Central Funds | 62 | |
| Assets and liabilities in foreign currencies | (47,340) | |
| Futures contracts | (93,523) | |
| Total change in net unrealized appreciation (depreciation) | | (20,141,491) |
| Net gain (loss) | | 679,142 |
| Net increase (decrease) in net assets resulting from operations | | $5,933,528 |
See accompanying notes which are an integral part of the financial statements.
Statement of Changes in Net Assets
| | Six months ended April 30, 2019 (Unaudited) | Year ended October 31, 2018 |
| Increase (Decrease) in Net Assets | | |
| Operations | | |
| Net investment income (loss) | $5,254,386 | $7,601,888 |
| Net realized gain (loss) | 20,820,633 | 32,636,042 |
| Change in net unrealized appreciation (depreciation) | (20,141,491) | (80,999,571) |
| Net increase (decrease) in net assets resulting from operations | 5,933,528 | (40,761,641) |
| Distributions to shareholders | (34,049,418) | (35,635,448) |
| Share transactions | | |
| Proceeds from sales of shares | 20,221,721 | 220,739,615 |
| Reinvestment of distributions | 31,582,463 | 32,808,433 |
| Cost of shares redeemed | (75,503,464) | (225,809,121) |
| Net increase (decrease) in net assets resulting from share transactions | (23,699,280) | 27,738,927 |
| Redemption fees | – | 8,581 |
| Total increase (decrease) in net assets | (51,815,170) | (48,649,581) |
| Net Assets | | |
| Beginning of period | 715,402,105 | 764,051,686 |
| End of period | $663,586,935 | $715,402,105 |
| Other Information | | |
| Shares | | |
| Sold | 1,262,654 | 11,538,209 |
| Issued in reinvestment of distributions | 1,977,612 | 1,763,894 |
| Redeemed | (4,648,625) | (12,068,741) |
| Net increase (decrease) | (1,408,359) | 1,233,362 |
See accompanying notes which are an integral part of the financial statements.
Financial Highlights
Fidelity Japan Smaller Companies Fund
| | Six months ended (Unaudited) April 30, | Years endedOctober 31, | | | | |
| | 2019 | 2018 | 2017 | 2016 | 2015 | 2014 |
| Selected Per–Share Data | | | | | | |
| Net asset value, beginning of period | $17.12 | $18.84 | $15.66 | $13.76 | $13.10 | $13.86 |
| Income from Investment Operations | | | | | | |
| Net investment income (loss)A | .13 | .18 | .17 | .17 | .10 | .09 |
| Net realized and unrealized gain (loss) | .03 | (1.00) | 3.42 | 1.93 | .78 | (.53) |
| Total from investment operations | .16 | (.82) | 3.59 | 2.10 | .88 | (.44) |
| Distributions from net investment income | (.11) | (.16) | (.17) | (.09) | (.03) | (.02) |
| Distributions from net realized gain | (.73) | (.74) | (.25) | (.11) | (.19) | (.31) |
| Total distributions | (.84) | (.90) | (.41)B | (.20) | (.22) | (.33) |
| Redemption fees added to paid in capitalA | – | –C | –C | –C | –C | .01 |
| Net asset value, end of period | $16.44 | $17.12 | $18.84 | $15.66 | $13.76 | $13.10 |
| Total ReturnD,E | 1.08% | (4.71)% | 23.68% | 15.44% | 6.93% | (3.16)% |
| Ratios to Average Net AssetsF,G | | | | | | |
| Expenses before reductions | .94%H | .94% | .95% | .96% | .98% | 1.00% |
| Expenses net of fee waivers, if any | .94%H | .93% | .95% | .96% | .98% | 1.00% |
| Expenses net of all reductions | .94%H | .93% | .94% | .96% | .97% | 1.00% |
| Net investment income (loss) | 1.58%H | .95% | 1.04% | 1.18% | .77% | .70% |
| Supplemental Data | | | | | | |
| Net assets, end of period (000 omitted) | $663,587 | $715,402 | $764,052 | $587,034 | $502,842 | $416,052 |
| Portfolio turnover rateI | 22%H | 17% | 20% | 30% | 41% | 112% |
A Calculated based on average shares outstanding during the period.
B Total distributions of $.41 per share is comprised of distributions from net investment income of $.169 and distributions from net realized gain of $.245 per share.
C Amount represents less than $.005 per share.
D Total returns for periods of less than one year are not annualized.
E Total returns would have been lower if certain expenses had not been reduced during the applicable periods shown.
F Fees and expenses of any underlying Fidelity Central Funds are not included in the Fund's expense ratio. The Fund indirectly bears its proportionate share of the expenses of any underlying Fidelity Central Funds.
G Expense ratios reflect operating expenses of the Fund. Expenses before reductions do not reflect amounts reimbursed by the investment adviser or reductions from brokerage service arrangements or reductions from other expense offset arrangements and do not represent the amount paid by the Fund during periods when reimbursements or reductions occur. Expenses net of fee waivers reflect expenses after reimbursement by the investment adviser but prior to reductions from brokerage service arrangements or other expense offset arrangements. Expenses net of all reductions represent the net expenses paid by the Fund.
H Annualized
I Amount does not include the portfolio activity of any underlying Fidelity Central Funds.
See accompanying notes which are an integral part of the financial statements.
Notes to Financial Statements (Unaudited)
For the period ended April 30, 2019
1. Organization.
Fidelity Japan Smaller Companies Fund (the Fund) is a fund of Fidelity Investment Trust (the Trust) and is authorized to issue an unlimited number of shares. Share transactions on the Statement of Changes in Net Assets may contain exchanges between affiliated funds. The Trust is registered under the Investment Company Act of 1940, as amended (the 1940 Act), as an open-end management investment company organized as a Massachusetts business trust.
2. Investments in Fidelity Central Funds.
The Fund invests in Fidelity Central Funds, which are open-end investment companies generally available only to other investment companies and accounts managed by the investment adviser and its affiliates. The Fund's Schedule of Investments lists each of the Fidelity Central Funds held as of period end, if any, as an investment of the Fund, but does not include the underlying holdings of each Fidelity Central Fund. As an Investing Fund, the Fund indirectly bears its proportionate share of the expenses of the underlying Fidelity Central Funds.
The Money Market Central Funds seek preservation of capital and current income and are managed by Fidelity Investments Money Management, Inc. (FIMM), an affiliate of the investment adviser. Annualized expenses of the Money Market Central Funds as of their most recent shareholder report date are less than .005%.
A complete unaudited list of holdings for each Fidelity Central Fund is available upon request or at the Securities and Exchange Commission (the SEC) website at www.sec.gov. In addition, the financial statements of the Fidelity Central Funds are available on the SEC website or upon request.
3. Significant Accounting Policies.
The Fund is an investment company and applies the accounting and reporting guidance of the Financial Accounting Standards Board (FASB) Accounting Standards Codification Topic 946 Financial Services – Investments Companies. The financial statements have been prepared in conformity with accounting principles generally accepted in the United States of America (GAAP), which require management to make certain estimates and assumptions at the date of the financial statements. Actual results could differ from those estimates. Subsequent events, if any, through the date that the financial statements were issued have been evaluated in the preparation of the financial statements. The following summarizes the significant accounting policies of the Fund:
Investment Valuation. Investments are valued as of 4:00 p.m. Eastern time on the last calendar day of the period. The Board of Trustees (the Board) has delegated the day to day responsibility for the valuation of the Fund's investments to the Fair Value Committee (the Committee) established by the Fund's investment adviser. In accordance with valuation policies and procedures approved by the Board, the Fund attempts to obtain prices from one or more third party pricing vendors or brokers to value its investments. When current market prices, quotations or currency exchange rates are not readily available or reliable, investments will be fair valued in good faith by the Committee, in accordance with procedures adopted by the Board. Factors used in determining fair value vary by investment type and may include market or investment specific events. The frequency with which these procedures are used cannot be predicted and they may be utilized to a significant extent. The Committee oversees the Fund's valuation policies and procedures and reports to the Board on the Committee's activities and fair value determinations. The Board monitors the appropriateness of the procedures used in valuing the Fund's investments and ratifies the fair value determinations of the Committee.
The Fund categorizes the inputs to valuation techniques used to value its investments into a disclosure hierarchy consisting of three levels as shown below:
- Level 1 – quoted prices in active markets for identical investments
- Level 2 – other significant observable inputs (including quoted prices for similar investments, interest rates, prepayment speeds, etc.)
- Level 3 – unobservable inputs (including the Fund's own assumptions based on the best information available)
Valuation techniques used to value the Fund's investments by major category are as follows:
Equity securities, including restricted securities, for which market quotations are readily available, are valued at the last reported sale price or official closing price as reported by a third party pricing vendor on the primary market or exchange on which they are traded and are categorized as Level 1 in the hierarchy. In the event there were no sales during the day or closing prices are not available, securities are valued at the last quoted bid price or may be valued using the last available price and are generally categorized as Level 2 in the hierarchy. For foreign equity securities, when market or security specific events arise, comparisons to the valuation of American Depositary Receipts (ADRs), futures contracts, Exchange-Traded Funds (ETFs) and certain indexes as well as quoted prices for similar securities may be used and would be categorized as Level 2 in the hierarchy. For equity securities, including restricted securities, where observable inputs are limited, assumptions about market activity and risk are used and these securities may be categorized as Level 3 in the hierarchy.
Investments in open-end mutual funds, including the Fidelity Central Funds, are valued at their closing net asset value (NAV) each business day and are categorized as Level 1 in the hierarchy.
Changes in valuation techniques may result in transfers in or out of an assigned level within the disclosure hierarchy. The aggregate value of investments by input level as of April 30, 2019 is included at the end of the Fund's Schedule of Investments.
Foreign Currency. The Fund may use foreign currency contracts to facilitate transactions in foreign-denominated securities. Gains and losses from these transactions may arise from changes in the value of the foreign currency or if the counterparties do not perform under the contracts' terms.
Foreign-denominated assets, including investment securities, and liabilities are translated into U.S. dollars at the exchange rates at period end. Purchases and sales of investment securities, income and dividends received and expenses denominated in foreign currencies are translated into U.S. dollars at the exchange rate in effect on the transaction date.
The effects of exchange rate fluctuations on investments are included with the net realized and unrealized gain (loss) on investment securities. Other foreign currency transactions resulting in realized and unrealized gain (loss) are disclosed separately.
Investment Transactions and Income. For financial reporting purposes, the Fund's investment holdings and NAV include trades executed through the end of the last business day of the period. The NAV per share for processing shareholder transactions is calculated as of the close of business of the New York Stock Exchange (NYSE), normally 4:00 p.m. Eastern time and includes trades executed through the end of the prior business day. Gains and losses on securities sold are determined on the basis of identified cost. Dividend income is recorded on the ex-dividend date, except for certain dividends from foreign securities where the ex-dividend date may have passed, which are recorded as soon as the Fund is informed of the ex-dividend date. Non-cash dividends included in dividend income, if any, are recorded at the fair market value of the securities received. Income and capital gain distributions from Fidelity Central Funds, if any, are recorded on the ex-dividend date. Investment income is recorded net of foreign taxes withheld where recovery of such taxes is uncertain.
Expenses. Expenses directly attributable to a fund are charged to that fund. Expenses attributable to more than one fund are allocated among the respective funds on the basis of relative net assets or other appropriate methods. Expense estimates are accrued in the period to which they relate and adjustments are made when actual amounts are known.
Income Tax Information and Distributions to Shareholders. Each year, the Fund intends to qualify as a regulated investment company under Subchapter M of the Internal Revenue Code, including distributing substantially all of its taxable income and realized gains. As a result, no provision for U.S. Federal income taxes is required. The Fund files a U.S. federal tax return, in addition to state and local tax returns as required. The Fund's federal income tax returns are subject to examination by the Internal Revenue Service (IRS) for a period of three fiscal years after they are filed. State and local tax returns may be subject to examination for an additional fiscal year depending on the jurisdiction. Foreign taxes are provided for based on the Fund's understanding of the tax rules and rates that exist in the foreign markets in which it invests.
Distributions are declared and recorded on the ex-dividend date. Income and capital gain distributions are determined in accordance with income tax regulations, which may differ from GAAP.
Capital accounts within the financial statements are adjusted for permanent book-tax differences. These adjustments have no impact on net assets or the results of operations. Capital accounts are not adjusted for temporary book-tax differences which will reverse in a subsequent period.
Book-tax differences are primarily due to foreign currency transactions, passive foreign investment companies (PFIC), deferred trustees compensation and losses deferred due to wash sales.
As of period end, the cost and unrealized appreciation (depreciation) in securities, and derivatives if applicable, for federal income tax purposes were as follows:
| Gross unrealized appreciation | $136,820,191 |
| Gross unrealized depreciation | (35,459,266) |
| Net unrealized appreciation (depreciation) | $101,360,925 |
| Tax cost | $552,121,068 |
Delayed Delivery Transactions and When-Issued Securities. During the period, the Fund transacted in securities on a delayed delivery or when-issued basis. Payment and delivery may take place after the customary settlement period for that security. The price of the underlying securities and the date when the securities will be delivered and paid for are fixed at the time the transaction is negotiated. The securities purchased on a delayed delivery or when-issued basis are identified as such in the Fund's Schedule of Investments. Losses may arise due to changes in the value of the underlying securities or if the counterparty does not perform under the contract's terms, or if the issuer does not issue the securities due to political, economic, or other factors.
4. Derivative Instruments.
Risk Exposures and the Use of Derivative Instruments. The Fund's investment objective allows the Fund to enter into various types of derivative contracts, including futures contracts. Derivatives are investments whose value is primarily derived from underlying assets, indices or reference rates and may be transacted on an exchange or over-the-counter (OTC). Derivatives may involve a future commitment to buy or sell a specified asset based on specified terms, to exchange future cash flows at periodic intervals based on a notional principal amount, or for one party to make one or more payments upon the occurrence of specified events in exchange for periodic payments from the other party.
The Fund used derivatives to increase returns and to manage exposure to certain risks as defined below. The success of any strategy involving derivatives depends on analysis of numerous economic factors, and if the strategies for investment do not work as intended, the Fund may not achieve its objectives.
The Fund's use of derivatives increased or decreased its exposure to the following risk:
| Equity Risk | Equity risk relates to the fluctuations in the value of financial instruments as a result of changes in market prices (other than those arising from interest rate risk or foreign exchange risk), whether caused by factors specific to an individual investment, its issuer, or all factors affecting all instruments traded in a market or market segment.
|
The Fund is also exposed to additional risks from investing in derivatives, such as liquidity risk and counterparty credit risk. Liquidity risk is the risk that the Fund will be unable to close out the derivative in the open market in a timely manner. Counterparty credit risk is the risk that the counterparty will not be able to fulfill its obligation to the Fund. Counterparty credit risk related to exchange-traded futures contracts may be mitigated by the protection provided by the exchange on which they trade.
Investing in derivatives may involve greater risks than investing in the underlying assets directly and, to varying degrees, may involve risk of loss in excess of any initial investment and collateral received and amounts recognized in the Statement of Assets and Liabilities. In addition, there may be the risk that the change in value of the derivative contract does not correspond to the change in value of the underlying instrument.
Futures Contracts. A futures contract is an agreement between two parties to buy or sell a specified underlying instrument for a fixed price at a specified future date. The Fund used futures contracts to manage its exposure to the stock market.
Upon entering into a futures contract, a fund is required to deposit either cash or securities (initial margin) with a clearing broker in an amount equal to a certain percentage of the face value of the contract. Futures contracts are marked-to-market daily and subsequent daily payments (variation margin) are made or received by a fund depending on the daily fluctuations in the value of the futures contracts and are recorded as unrealized appreciation or (depreciation). This receivable and/or payable, if any, is included in daily variation margin on futures contracts in the Statement of Assets and Liabilities. Realized gain or (loss) is recorded upon the expiration or closing of a futures contract. The net realized gain (loss) and change in net unrealized appreciation (depreciation) on futures contracts during the period is presented in the Statement of Operations.
Any open futures contracts at period end are presented in the Schedule of Investments under the caption "Futures Contracts". The notional amount at value reflects each contract's exposure to the underlying instrument or index at period end. For the period, the average monthly notional amount at value for futures contracts in the aggregate was $2,473,506.
5. Purchases and Sales of Investments.
Purchases and sales of securities, other than short-term securities, aggregated $71,003,425 and $104,997,345, respectively.
6. Fees and Other Transactions with Affiliates.
Management Fee. Fidelity Management & Research Company (the investment adviser) and its affiliates provide the Fund with investment management related services for which the Fund pays a monthly management fee. The management fee is the sum of an individual fund fee rate that is based on an annual rate of .45% of the Fund's average net assets and an annualized group fee rate that averaged .24% during the period. The group fee rate is based upon the average net assets of all the mutual funds advised by the investment adviser, including any mutual funds previously advised by the investment adviser that are currently advised by Fidelity SelectCo, LLC, an affiliate of the investment adviser. The group fee rate decreases as assets under management increase and increases as assets under management decrease. For the reporting period, the total annualized management fee rate was .69% of the Fund's average net assets.
Transfer Agent Fees. Fidelity Investments Institutional Operations Company, Inc. (FIIOC), an affiliate of the investment adviser, is the Fund's transfer, dividend disbursing and shareholder servicing agent. FIIOC receives account fees and asset-based fees that vary according to account size and type of account. FIIOC pays for typesetting, printing and mailing of shareholder reports, except proxy statements. For the period, the transfer agent fees were equivalent to an annualized rate of .18% of average net assets.
Accounting and Security Lending Fees. Fidelity Service Company, Inc. (FSC), an affiliate of the investment adviser, maintains the Fund's accounting records. The accounting fee is based on the level of average net assets for each month. Prior to April 1, 2019, FSC had a separate agreement with the Fund for administration of the security lending program, based on the number and duration of lending transactions. For the period, the total fees paid for accounting and administration of securities lending were equivalent to an annualized rate of .05%.
Interfund Trades. The Fund may purchase from or sell securities to other Fidelity Funds under procedures adopted by the Board. The procedures have been designed to ensure these interfund trades are executed in accordance with Rule 17a-7 of the 1940 Act. Interfund trades are included within the respective purchases and sales amounts shown in the Purchases and Sales of Investments note.
7. Committed Line of Credit.
The Fund participates with other funds managed by the investment adviser or an affiliate in a $4.25 billion credit facility (the "line of credit") to be utilized for temporary or emergency purposes to fund shareholder redemptions or for other short-term liquidity purposes. The Fund has agreed to pay commitment fees on its pro-rata portion of the line of credit, which amounted to $974 and is reflected in Miscellaneous expenses on the Statement of Operations. During the period, the Fund did not borrow on this line of credit.
8. Security Lending.
The Fund lends portfolio securities through a lending agent from time to time in order to earn additional income. For equity securities, a lending agent is used and may loan securities to certain qualified borrowers, including Fidelity Capital Markets (FCM), a broker-dealer affiliated with the Fund. On the settlement date of the loan, the Fund receives collateral (in the form of U.S. Treasury obligations, letters of credit and/or cash) against the loaned securities and maintains collateral in an amount not less than 100% of the market value of the loaned securities during the period of the loan. The market value of the loaned securities is determined at the close of business of the Fund and any additional required collateral is delivered to the Fund on the next business day. The Fund or borrower may terminate the loan at any time, and if the borrower defaults on its obligation to return the securities loaned because of insolvency or other reasons, the Fund may apply collateral received from the borrower against the obligation. The Fund may experience delays and costs in recovering the securities loaned. Any cash collateral received is invested in the Fidelity Securities Lending Cash Central Fund. The value of loaned securities and cash collateral at period end are disclosed on the Fund's Statement of Assets and Liabilities. Security lending income represents the income earned on investing cash collateral, less rebates paid to borrowers and any lending agent fees associated with the loan, plus any premium payments received for lending certain types of securities. Security lending income is presented in the Statement of Operations as a component of income from Fidelity Central Funds. Total security lending income during the period amounted to $25,894. During the period, there were no securities loaned to FCM.
9. Expense Reductions.
Commissions paid to certain brokers with whom the investment adviser, or its affiliates, places trades on behalf of the Fund include an amount in addition to trade execution, which may be rebated back to the Fund to offset certain expenses. This amount totaled $2,933 for the period. In addition, through arrangements with the Fund's custodian, credits realized as a result of certain uninvested cash balances were used to reduce the Fund's expenses. During the period, these credits reduced the Fund's custody expenses by $57.
In addition, during the period the investment adviser reimbursed and/or waived a portion of operating expenses in the amount of $2,612.
10. Other.
The Fund's organizational documents provide former and current trustees and officers with a limited indemnification against liabilities arising in connection with the performance of their duties to the Fund. In the normal course of business, the Fund may also enter into contracts that provide general indemnifications. The Fund's maximum exposure under these arrangements is unknown as this would be dependent on future claims that may be made against the Fund. The risk of material loss from such claims is considered remote.
At the end of the period, Strategic Advisers International Fund, VIP FundsManager 50% Portfolio and VIP FundsManager 60% Portfolio were the owners of record of approximately 16%, 11% and 13%, respectively, of the total outstanding shares of the Fund. Mutual funds managed by the investment adviser or its affiliates were the owners of record, in the aggregate, of approximately 51% of the total outstanding shares of the Fund.
Fidelity® Latin America Fund
Investment Summary (Unaudited)
Geographic Diversification (% of fund's net assets)
| As of April 30, 2019 |
| | Brazil | 70.2% |
| | Mexico | 19.3% |
| | Panama | 4.1% |
| | Israel | 2.1% |
| | United States of America* | 2.1% |
| | Bermuda | 1.3% |
| | Argentina | 0.8% |
| | Spain | 0.1% |

* Includes Short-Term investments and Net Other Assets (Liabilities).
Percentages are based on country or territory of incorporation and are adjusted for the effect of futures contracts, if applicable.
Asset Allocation as of April 30, 2019
| | % of fund's net assets |
| Stocks | 99.5 |
| Short-Term Investments and Net Other Assets (Liabilities) | 0.5 |
Top Ten Stocks as of April 30, 2019
| | % of fund's net assets |
| Itausa-Investimentos Itau SA (PN) (Brazil, Banks) | 11.4 |
| Petroleo Brasileiro SA - Petrobras (PN) (non-vtg.) (Brazil, Oil, Gas & Consumable Fuels) | 10.3 |
| Itau Unibanco Holding SA (Brazil, Banks) | 5.1 |
| Azul SA sponsored ADR (Brazil, Airlines) | 4.3 |
| Grupo Financiero Banorte S.A.B. de CV Series O (Mexico, Banks) | 4.2 |
| Suzano Papel e Celulose SA (Brazil, Paper & Forest Products) | 4.2 |
| Hapvida Participacoes e Investimentos SA (Brazil, Insurance) | 3.6 |
| BTG Pactual Participations Ltd. unit (Brazil, Capital Markets) | 3.3 |
| Credito Real S.A.B. de CV (Mexico, Consumer Finance) | 3.2 |
| Banco del Bajio SA (Mexico, Banks) | 3.2 |
| | 52.8 |
Top Market Sectors as of April 30, 2019
| | % of fund's net assets |
| Financials | 48.8 |
| Consumer Discretionary | 12.2 |
| Industrials | 10.9 |
| Energy | 10.3 |
| Health Care | 7.8 |
| Materials | 5.5 |
| Information Technology | 2.1 |
| Consumer Staples | 1.9 |
Market Sectors may include more than one industry category.
The Fund may invest up to 35% of its total assets in any industry that represents more than 20% of the Latin American market. As of April 30, 2019, 27.3% of the Fund’s total assets were invested in the Diversified Banks industry, which accounts for more than 20% of the Latin American market.
Fidelity® Latin America Fund
Schedule of Investments April 30, 2019 (Unaudited)
Showing Percentage of Net Assets
| Common Stocks - 71.2% | | | |
| | | Shares | Value |
| Argentina - 0.8% | | | |
| Bolsas y Mercados Argentinos SA | | 645,351 | $4,220,387 |
| Bermuda - 1.3% | | | |
| Credicorp Ltd. (United States) | | 27,585 | 6,534,887 |
| Brazil - 41.9% | | | |
| Atacadao Distribuicao Comercio e Industria Ltda | | 1,846,115 | 9,981,290 |
| Azul SA sponsored ADR (a) | | 855,473 | 22,208,079 |
| BTG Pactual Participations Ltd. unit | | 1,598,307 | 16,867,191 |
| Companhia de Locacao das Americas | | 1,494,112 | 15,622,808 |
| CVC Brasil Operadora e Agencia de Viagens SA | | 710,242 | 10,286,563 |
| Estacio Participacoes SA | | 2,270,943 | 15,741,560 |
| Hapvida Participacoes e Investimentos SA (b) | | 2,438,995 | 18,822,266 |
| IRB Brasil Resseguros SA | | 503,844 | 12,065,735 |
| Lojas Renner SA | | 1,267,622 | 15,155,472 |
| Notre Dame Intermedica Participacoes SA | | 1,230,389 | 11,020,189 |
| Qualicorp Consultoria E Corret | | 3,615,771 | 15,860,667 |
| Ser Educacional SA (b) | | 2,338,972 | 13,761,466 |
| Sul America SA unit | | 1,358,708 | 10,811,173 |
| Suzano Papel e Celulose SA | | 2,078,786 | 21,593,164 |
| Vale SA | | 542,567 | 6,932,393 |
|
| TOTAL BRAZIL | | | 216,730,016 |
|
| Israel - 2.1% | | | |
| Ituran Location & Control Ltd. | | 300,540 | 11,050,856 |
| Mexico - 19.3% | | | |
| Banco del Bajio SA (b) | | 7,594,069 | 16,327,584 |
| Credito Real S.A.B. de CV | | 14,635,664 | 16,698,681 |
| Genomma Lab Internacional SA de CV (a) | | 16,630,496 | 13,369,137 |
| Grupo Aeroportuario Norte S.A.B. de CV | | 1,330,458 | 8,197,043 |
| Grupo Financiero Banorte S.A.B. de CV Series O | | 3,476,504 | 21,974,626 |
| Qualitas Controladora S.A.B. de CV | | 4,768,593 | 12,649,842 |
| Unifin Financiera SAPI de CV | | 4,768,717 | 10,698,186 |
|
| TOTAL MEXICO | | | 99,915,099 |
|
| Panama - 4.1% | | | |
| Copa Holdings SA Class A | | 123,873 | 10,313,666 |
| Intergroup Financial Services Corp. | | 248,403 | 10,954,572 |
|
| TOTAL PANAMA | | | 21,268,238 |
|
| Spain - 0.1% | | | |
| Prosegur Cash SA (b) | | 131,005 | 280,940 |
| United States of America - 1.6% | | | |
| First Cash Financial Services, Inc. | | 84,342 | 8,238,527 |
| TOTAL COMMON STOCKS | | | |
| (Cost $325,598,990) | | | 368,238,950 |
|
| Nonconvertible Preferred Stocks - 28.3% | | | |
| Brazil - 28.3% | | | |
| Alpargatas SA (PN) | | 1,908,773 | 7,618,346 |
| Itau Unibanco Holding SA | | 3,091,293 | 26,670,690 |
| Itausa-Investimentos Itau SA (PN) | | 19,422,987 | 58,995,632 |
| Petroleo Brasileiro SA - Petrobras (PN) (non-vtg.) | | 7,683,765 | 53,124,600 |
| TOTAL NONCONVERTIBLE PREFERRED STOCKS | | | |
| (Cost $93,439,064) | | | 146,409,268 |
|
| Money Market Funds - 0.2% | | | |
| Fidelity Cash Central Fund, 2.49% (c) | | | |
| (Cost $656,385) | | 656,254 | 656,385 |
| TOTAL INVESTMENT IN SECURITIES - 99.7% | | | |
| (Cost $419,694,439) | | | 515,304,603 |
| NET OTHER ASSETS (LIABILITIES) - 0.3% | | | 1,792,417 |
| NET ASSETS - 100% | | | $517,097,020 |
Categorizations in the Schedule of Investments are based on country or territory of incorporation.
Legend
(a) Non-income producing
(b) Security exempt from registration under Rule 144A of the Securities Act of 1933. These securities may be resold in transactions exempt from registration, normally to qualified institutional buyers. At the end of the period, the value of these securities amounted to $49,192,256 or 9.5% of net assets.
(c) Affiliated fund that is generally available only to investment companies and other accounts managed by Fidelity Investments. The rate quoted is the annualized seven-day yield of the fund at period end. A complete unaudited listing of the fund's holdings as of its most recent quarter end is available upon request. In addition, each Fidelity Central Fund's financial statements are available on the SEC's website or upon request.
Affiliated Central Funds
Information regarding fiscal year to date income earned by the Fund from investments in Fidelity Central Funds is as follows:
| Fund | Income earned |
| Fidelity Cash Central Fund | $37,966 |
| Fidelity Securities Lending Cash Central Fund | 1,871 |
| Total | $39,837 |
Amounts in the income column in the above table include any capital gain distributions from underlying funds, which are presented in the corresponding line-item in the Statement of Operations, if applicable.
Investment Valuation
All investments are categorized as Level 1 under the Fair Value Hierarchy. The inputs or methodology used for valuing securities may not be an indication of the risk associated with investing in those securities. For more information on valuation inputs please refer to the Investment Valuation section in the accompanying Notes to Financial Statements.
See accompanying notes which are an integral part of the financial statements.
Fidelity® Latin America Fund
Financial Statements
Statement of Assets and Liabilities
| | | April 30, 2019 (Unaudited) |
| Assets | | |
Investment in securities, at value — See accompanying schedule:
Unaffiliated issuers (cost $419,038,054) | $514,648,218 | |
| Fidelity Central Funds (cost $656,385) | 656,385 | |
| Total Investment in Securities (cost $419,694,439) | | $515,304,603 |
| Foreign currency held at value (cost $483,513) | | 479,237 |
| Receivable for investments sold | | 20,353 |
| Receivable for fund shares sold | | 114,684 |
| Dividends receivable | | 2,867,474 |
| Distributions receivable from Fidelity Central Funds | | 5,083 |
| Prepaid expenses | | 229 |
| Other receivables | | 16,964 |
| Total assets | | 518,808,627 |
| Liabilities | | |
| Payable for investments purchased | $157,933 | |
| Payable for fund shares redeemed | 1,042,607 | |
| Accrued management fee | 294,240 | |
| Transfer agent fee payable | 104,579 | |
| Distribution and service plan fees payable | 8,006 | |
| Other affiliated payables | 22,045 | |
| Other payables and accrued expenses | 82,197 | |
| Total liabilities | | 1,711,607 |
| Net Assets | | $517,097,020 |
| Net Assets consist of: | | |
| Paid in capital | | $497,312,046 |
| Total distributable earnings (loss) | | 19,784,974 |
| Net Assets | | $517,097,020 |
| Net Asset Value and Maximum Offering Price | | |
| Class A: | | |
| Net Asset Value and redemption price per share ($15,855,452 ÷ 663,617 shares) | | $23.89 |
| Maximum offering price per share (100/94.25 of $23.89) | | $25.35 |
| Class M: | | |
| Net Asset Value and redemption price per share ($5,302,879 ÷ 221,285 shares) | | $23.96 |
| Maximum offering price per share (100/96.50 of $23.96) | | $24.83 |
| Class C: | | |
| Net Asset Value and offering price per share ($2,915,997 ÷ 120,307 shares)(a) | | $24.24 |
| Latin America: | | |
| Net Asset Value, offering price and redemption price per share ($489,162,879 ÷ 20,554,063 shares) | | $23.80 |
| Class I: | | |
| Net Asset Value, offering price and redemption price per share ($3,649,331 ÷ 153,480 shares) | | $23.78 |
| Class Z: | | |
| Net Asset Value, offering price and redemption price per share ($210,482 ÷ 8,871 shares) | | $23.73 |
(a) Redemption price per share is equal to net asset value less any applicable contingent deferred sales charge.
See accompanying notes which are an integral part of the financial statements.
Statement of Operations
| | | Six months ended April 30, 2019 (Unaudited) |
| Investment Income | | |
| Dividends | | $12,761,015 |
| Income from Fidelity Central Funds | | 39,837 |
| Income before foreign taxes withheld | | 12,800,852 |
| Less foreign taxes withheld | | (866,220) |
| Total income | | 11,934,632 |
| Expenses | | |
| Management fee | $1,760,786 | |
| Transfer agent fees | 624,238 | |
| Distribution and service plan fees | 51,823 | |
| Accounting and security lending fees | 131,361 | |
| Custodian fees and expenses | 100,469 | |
| Independent trustees' fees and expenses | 1,389 | |
| Registration fees | 62,506 | |
| Audit | 47,392 | |
| Legal | 714 | |
| Interest | 443 | |
| Miscellaneous | 17,145 | |
| Total expenses before reductions | 2,798,266 | |
| Expense reductions | (18,374) | |
| Total expenses after reductions | | 2,779,892 |
| Net investment income (loss) | | 9,154,740 |
| Realized and Unrealized Gain (Loss) | | |
| Net realized gain (loss) on: | | |
| Investment securities: | | |
| Unaffiliated issuers | 19,664,757 | |
| Foreign currency transactions | (257,107) | |
| Total net realized gain (loss) | | 19,407,650 |
| Change in net unrealized appreciation (depreciation) on: | | |
| Investment securities: | | |
| Unaffiliated issuers | 24,193,527 | |
| Assets and liabilities in foreign currencies | 742 | |
| Total change in net unrealized appreciation (depreciation) | | 24,194,269 |
| Net gain (loss) | | 43,601,919 |
| Net increase (decrease) in net assets resulting from operations | | $52,756,659 |
See accompanying notes which are an integral part of the financial statements.
Statement of Changes in Net Assets
| | Six months ended April 30, 2019 (Unaudited) | Year ended October 31, 2018 |
| Increase (Decrease) in Net Assets | | |
| Operations | | |
| Net investment income (loss) | $9,154,740 | $13,382,179 |
| Net realized gain (loss) | 19,407,650 | 40,059,458 |
| Change in net unrealized appreciation (depreciation) | 24,194,269 | (118,083,853) |
| Net increase (decrease) in net assets resulting from operations | 52,756,659 | (64,642,216) |
| Distributions to shareholders | (10,500,914) | (9,005,746) |
| Share transactions - net increase (decrease) | 1,552,020 | (88,546,151) |
| Redemption fees | – | 87,345 |
| Total increase (decrease) in net assets | 43,807,765 | (162,106,768) |
| Net Assets | | |
| Beginning of period | 473,289,255 | 635,396,023 |
| End of period | $517,097,020 | $473,289,255 |
See accompanying notes which are an integral part of the financial statements.
Financial Highlights
Fidelity Latin America Fund Class A
| | Six months ended (Unaudited) April 30, | Years endedOctober 31, | | | | |
| | 2019 | 2018 | 2017 | 2016 | 2015 | 2014 |
| Selected Per–Share Data | | | | | | |
| Net asset value, beginning of period | $21.98 | $24.93 | $22.45 | $18.09 | $30.31 | $40.71 |
| Income from Investment Operations | | | | | | |
| Net investment income (loss)A | .38 | .50 | .42 | .40 | .28 | .49 |
| Net realized and unrealized gain (loss) | 1.95 | (3.16) | 2.48 | 4.27 | (10.11) | (4.08) |
| Total from investment operations | 2.33 | (2.66) | 2.90 | 4.67 | (9.83) | (3.59) |
| Distributions from net investment income | (.42) | (.29) | (.43) | (.31) | (.31) | (.57) |
| Distributions from net realized gain | – | – | – | – | (2.08) | (6.25) |
| Total distributions | (.42) | (.29) | (.43) | (.31) | (2.39) | (6.82) |
| Redemption fees added to paid in capitalA | – | –B | .01 | –B | –B | .01 |
| Net asset value, end of period | $23.89 | $21.98 | $24.93 | $22.45 | $18.09 | $30.31 |
| Total ReturnC,D,E | 10.86% | (10.78)% | 13.55% | 26.29% | (34.60)% | (9.06)% |
| Ratios to Average Net AssetsF,G | | | | | | |
| Expenses before reductions | 1.39%H | 1.38% | 1.39% | 1.40% | 1.40% | 1.38% |
| Expenses net of fee waivers, if any | 1.38%H | 1.38% | 1.39% | 1.40% | 1.40% | 1.38% |
| Expenses net of all reductions | 1.38%H | 1.36% | 1.38% | 1.39% | 1.39% | 1.38% |
| Net investment income (loss) | 3.29%H | 2.08% | 1.90% | 2.14% | 1.26% | 1.52% |
| Supplemental Data | | | | | | |
| Net assets, end of period (000 omitted) | $15,855 | $14,157 | $17,801 | $19,115 | $16,424 | $34,898 |
| Portfolio turnover rateI | 48%H | 53% | 51% | 108% | 30% | 30% |
A Calculated based on average shares outstanding during the period.
B Amount represents less than $.005 per share.
C Total returns for periods of less than one year are not annualized.
D Total returns would have been lower if certain expenses had not been reduced during the applicable periods shown.
E Total returns do not include the effect of the sales charges.
F Fees and expenses of any underlying Fidelity Central Funds are not included in the Fund's expense ratio. The Fund indirectly bears its proportionate share of the expenses of any underlying Fidelity Central Funds.
G Expense ratios reflect operating expenses of the class. Expenses before reductions do not reflect amounts reimbursed by the investment adviser or reductions from brokerage service arrangements or reductions from other expense offset arrangements and do not represent the amount paid by the class during periods when reimbursements or reductions occur. Expenses net of fee waivers reflect expenses after reimbursement by the investment adviser but prior to reductions from brokerage service arrangements or other expense offset arrangements. Expenses net of all reductions represent the net expenses paid by the class.
H Annualized
I Amount does not include the portfolio activity of any underlying Fidelity Central Funds.
See accompanying notes which are an integral part of the financial statements.
Fidelity Latin America Fund Class M
| | Six months ended (Unaudited) April 30, | Years endedOctober 31, | | | | |
| | 2019 | 2018 | 2017 | 2016 | 2015 | 2014 |
| Selected Per–Share Data | | | | | | |
| Net asset value, beginning of period | $22.00 | $24.96 | $22.47 | $18.11 | $30.33 | $40.68 |
| Income from Investment Operations | | | | | | |
| Net investment income (loss)A | .35 | .43 | .36 | .35 | .22 | .40 |
| Net realized and unrealized gain (loss) | 1.96 | (3.16) | 2.49 | 4.27 | (10.13) | (4.08) |
| Total from investment operations | 2.31 | (2.73) | 2.85 | 4.62 | (9.91) | (3.68) |
| Distributions from net investment income | (.35) | (.23) | (.37) | (.26) | (.23) | (.43) |
| Distributions from net realized gain | – | – | – | – | (2.08) | (6.25) |
| Total distributions | (.35) | (.23) | (.37) | (.26) | (2.31) | (6.68) |
| Redemption fees added to paid in capitalA | – | –B | .01 | –B | –B | .01 |
| Net asset value, end of period | $23.96 | $22.00 | $24.96 | $22.47 | $18.11 | $30.33 |
| Total ReturnC,D,E | 10.70% | (11.04)% | 13.24% | 25.93% | (34.78)% | (9.30)% |
| Ratios to Average Net AssetsF,G | | | | | | |
| Expenses before reductions | 1.66%H | 1.66% | 1.66% | 1.68% | 1.67% | 1.65% |
| Expenses net of fee waivers, if any | 1.65%H | 1.66% | 1.66% | 1.68% | 1.67% | 1.65% |
| Expenses net of all reductions | 1.65%H | 1.63% | 1.66% | 1.68% | 1.66% | 1.65% |
| Net investment income (loss) | 3.02%H | 1.80% | 1.62% | 1.86% | .99% | 1.25% |
| Supplemental Data | | | | | | |
| Net assets, end of period (000 omitted) | $5,303 | $5,098 | $6,740 | $7,378 | $5,284 | $9,761 |
| Portfolio turnover rateI | 48%H | 53% | 51% | 108% | 30% | 30% |
A Calculated based on average shares outstanding during the period.
B Amount represents less than $.005 per share.
C Total returns for periods of less than one year are not annualized.
D Total returns would have been lower if certain expenses had not been reduced during the applicable periods shown.
E Total returns do not include the effect of the sales charges.
F Fees and expenses of any underlying Fidelity Central Funds are not included in the Fund's expense ratio. The Fund indirectly bears its proportionate share of the expenses of any underlying Fidelity Central Funds.
G Expense ratios reflect operating expenses of the class. Expenses before reductions do not reflect amounts reimbursed by the investment adviser or reductions from brokerage service arrangements or reductions from other expense offset arrangements and do not represent the amount paid by the class during periods when reimbursements or reductions occur. Expenses net of fee waivers reflect expenses after reimbursement by the investment adviser but prior to reductions from brokerage service arrangements or other expense offset arrangements. Expenses net of all reductions represent the net expenses paid by the class.
H Annualized
I Amount does not include the portfolio activity of any underlying Fidelity Central Funds.
See accompanying notes which are an integral part of the financial statements.
Fidelity Latin America Fund Class C
| | Six months ended (Unaudited) April 30, | Years endedOctober 31, | | | | |
| | 2019 | 2018 | 2017 | 2016 | 2015 | 2014 |
| Selected Per–Share Data | | | | | | |
| Net asset value, beginning of period | $22.16 | $25.12 | $22.61 | $18.18 | $30.37 | $40.59 |
| Income from Investment Operations | | | | | | |
| Net investment income (loss)A | .30 | .32 | .26 | .26 | .11 | .25 |
| Net realized and unrealized gain (loss) | 1.99 | (3.18) | 2.52 | 4.30 | (10.17) | (4.07) |
| Total from investment operations | 2.29 | (2.86) | 2.78 | 4.56 | (10.06) | (3.82) |
| Distributions from net investment income | (.21) | (.10) | (.28) | (.13) | (.05) | (.16) |
| Distributions from net realized gain | – | – | – | – | (2.08) | (6.25) |
| Total distributions | (.21) | (.10) | (.28) | (.13) | (2.13) | (6.41) |
| Redemption fees added to paid in capitalA | – | –B | .01 | –B | –B | .01 |
| Net asset value, end of period | $24.24 | $22.16 | $25.12 | $22.61 | $18.18 | $30.37 |
| Total ReturnC,D,E | 10.44% | (11.43)% | 12.71% | 25.31% | (35.08)% | (9.74)% |
| Ratios to Average Net AssetsF,G | | | | | | |
| Expenses before reductions | 2.14%H | 2.13% | 2.14% | 2.15% | 2.15% | 2.13% |
| Expenses net of fee waivers, if any | 2.14%H | 2.13% | 2.14% | 2.14% | 2.15% | 2.13% |
| Expenses net of all reductions | 2.14%H | 2.11% | 2.14% | 2.14% | 2.15% | 2.13% |
| Net investment income (loss) | 2.53%H | 1.33% | 1.15% | 1.39% | .51% | .77% |
| Supplemental Data | | | | | | |
| Net assets, end of period (000 omitted) | $2,916 | $3,498 | $5,094 | $6,590 | $5,394 | $11,349 |
| Portfolio turnover rateI | 48%H | 53% | 51% | 108% | 30% | 30% |
A Calculated based on average shares outstanding during the period.
B Amount represents less than $.005 per share.
C Total returns for periods of less than one year are not annualized.
D Total returns would have been lower if certain expenses had not been reduced during the applicable periods shown.
E Total returns do not include the effect of the contingent deferred sales charge.
F Fees and expenses of any underlying Fidelity Central Funds are not included in the Fund's expense ratio. The Fund indirectly bears its proportionate share of the expenses of any underlying Fidelity Central Funds.
G Expense ratios reflect operating expenses of the class. Expenses before reductions do not reflect amounts reimbursed by the investment adviser or reductions from brokerage service arrangements or reductions from other expense offset arrangements and do not represent the amount paid by the class during periods when reimbursements or reductions occur. Expenses net of fee waivers reflect expenses after reimbursement by the investment adviser but prior to reductions from brokerage service arrangements or other expense offset arrangements. Expenses net of all reductions represent the net expenses paid by the class.
H Annualized
I Amount does not include the portfolio activity of any underlying Fidelity Central Funds.
See accompanying notes which are an integral part of the financial statements.
Fidelity Latin America Fund
| | Six months ended (Unaudited) April 30, | Years endedOctober 31, | | | | |
| | 2019 | 2018 | 2017 | 2016 | 2015 | 2014 |
| Selected Per–Share Data | | | | | | |
| Net asset value, beginning of period | $21.94 | $24.89 | $22.41 | $18.08 | $30.34 | $40.80 |
| Income from Investment Operations | | | | | | |
| Net investment income (loss)A | .42 | .57 | .49 | .45 | .34 | .59 |
| Net realized and unrealized gain (loss) | 1.94 | (3.15) | 2.46 | 4.26 | (10.11) | (4.10) |
| Total from investment operations | 2.36 | (2.58) | 2.95 | 4.71 | (9.77) | (3.51) |
| Distributions from net investment income | (.50) | (.37) | (.48) | (.38) | (.41) | (.71) |
| Distributions from net realized gain | – | – | – | – | (2.08) | (6.25) |
| Total distributions | (.50) | (.37) | (.48) | (.38) | (2.49) | (6.96) |
| Redemption fees added to paid in capitalA | – | –B | .01 | –B | –B | .01 |
| Net asset value, end of period | $23.80 | $21.94 | $24.89 | $22.41 | $18.08 | $30.34 |
| Total ReturnC,D | 11.06% | (10.50)% | 13.87% | 26.65% | (34.45)% | (8.79)% |
| Ratios to Average Net AssetsE,F | | | | | | |
| Expenses before reductions | 1.07%G | 1.07% | 1.09% | 1.14% | 1.13% | 1.08% |
| Expenses net of fee waivers, if any | 1.07%G | 1.07% | 1.09% | 1.14% | 1.12% | 1.08% |
| Expenses net of all reductions | 1.06%G | 1.05% | 1.09% | 1.13% | 1.12% | 1.07% |
| Net investment income (loss) | 3.61%G | 2.39% | 2.19% | 2.40% | 1.53% | 1.83% |
| Supplemental Data | | | | | | |
| Net assets, end of period (000 omitted) | $489,163 | $445,845 | $597,161 | $596,514 | $481,005 | $933,298 |
| Portfolio turnover rateH | 48%G | 53% | 51% | 108% | 30% | 30% |
A Calculated based on average shares outstanding during the period.
B Amount represents less than $.005 per share.
C Total returns for periods of less than one year are not annualized.
D Total returns would have been lower if certain expenses had not been reduced during the applicable periods shown.
E Fees and expenses of any underlying Fidelity Central Funds are not included in the Fund's expense ratio. The Fund indirectly bears its proportionate share of the expenses of any underlying Fidelity Central Funds.
F Expense ratios reflect operating expenses of the class. Expenses before reductions do not reflect amounts reimbursed by the investment adviser or reductions from brokerage service arrangements or reductions from other expense offset arrangements and do not represent the amount paid by the class during periods when reimbursements or reductions occur. Expenses net of fee waivers reflect expenses after reimbursement by the investment adviser but prior to reductions from brokerage service arrangements or other expense offset arrangements. Expenses net of all reductions represent the net expenses paid by the class.
G Annualized
H Amount does not include the portfolio activity of any underlying Fidelity Central Funds.
See accompanying notes which are an integral part of the financial statements.
Fidelity Latin America Fund Class I
| | Six months ended (Unaudited) April 30, | Years endedOctober 31, | | | | |
| | 2019 | 2018 | 2017 | 2016 | 2015 | 2014 |
| Selected Per–Share Data | | | | | | |
| Net asset value, beginning of period | $21.92 | $24.88 | $22.40 | $18.08 | $30.35 | $40.79 |
| Income from Investment Operations | | | | | | |
| Net investment income (loss)A | .42 | .59 | .51 | .46 | .36 | .60 |
| Net realized and unrealized gain (loss) | 1.94 | (3.15) | 2.45 | 4.26 | (10.13) | (4.07) |
| Total from investment operations | 2.36 | (2.56) | 2.96 | 4.72 | (9.77) | (3.47) |
| Distributions from net investment income | (.50) | (.40) | (.49) | (.40) | (.42) | (.73) |
| Distributions from net realized gain | – | – | – | – | (2.08) | (6.25) |
| Total distributions | (.50) | (.40) | (.49) | (.40) | (2.50) | (6.98) |
| Redemption fees added to paid in capitalA | – | –B | .01 | –B | –B | .01 |
| Net asset value, end of period | $23.78 | $21.92 | $24.88 | $22.40 | $18.08 | $30.35 |
| Total ReturnC,D | 11.07% | (10.44)% | 13.94% | 26.77% | (34.42)% | (8.69)% |
| Ratios to Average Net AssetsE,F | | | | | | |
| Expenses before reductions | 1.03%G | 1.01% | 1.01% | 1.07% | 1.06% | 1.04% |
| Expenses net of fee waivers, if any | 1.02%G | 1.01% | 1.01% | 1.07% | 1.06% | 1.04% |
| Expenses net of all reductions | 1.02%G | .98% | 1.01% | 1.06% | 1.05% | 1.04% |
| Net investment income (loss) | 3.65%G | 2.45% | 2.27% | 2.47% | 1.60% | 1.86% |
| Supplemental Data | | | | | | |
| Net assets, end of period (000 omitted) | $3,649 | $4,546 | $8,600 | $3,825 | $1,828 | $4,531 |
| Portfolio turnover rateH | 48%G | 53% | 51% | 108% | 30% | 30% |
A Calculated based on average shares outstanding during the period.
B Amount represents less than $.005 per share.
C Total returns for periods of less than one year are not annualized.
D Total returns would have been lower if certain expenses had not been reduced during the applicable periods shown.
E Fees and expenses of any underlying Fidelity Central Funds are not included in the Fund's expense ratio. The Fund indirectly bears its proportionate share of the expenses of any underlying Fidelity Central Funds.
F Expense ratios reflect operating expenses of the class. Expenses before reductions do not reflect amounts reimbursed by the investment adviser or reductions from brokerage service arrangements or reductions from other expense offset arrangements and do not represent the amount paid by the class during periods when reimbursements or reductions occur. Expenses net of fee waivers reflect expenses after reimbursement by the investment adviser but prior to reductions from brokerage service arrangements or other expense offset arrangements. Expenses net of all reductions represent the net expenses paid by the class.
G Annualized
H Amount does not include the portfolio activity of any underlying Fidelity Central Funds.
See accompanying notes which are an integral part of the financial statements.
Fidelity Latin America Fund Class Z
| | Six months ended (Unaudited) April 30, | Year endedOctober 31, |
| | 2019 | 2018 A |
| Selected Per–Share Data | | |
| Net asset value, beginning of period | $21.92 | $21.51 |
| Income from Investment Operations | | |
| Net investment income (loss)B | .44 | (.01) |
| Net realized and unrealized gain (loss) | 1.93 | .42 |
| Total from investment operations | 2.37 | .41 |
| Distributions from net investment income | (.56) | – |
| Distributions from net realized gain | – | – |
| Total distributions | (.56) | – |
| Net asset value, end of period | $23.73 | $21.92 |
| Total ReturnC,D | 11.16% | 1.91% |
| Ratios to Average Net AssetsE,F | | |
| Expenses before reductions | .88%G | .95%G |
| Expenses net of fee waivers, if any | .87%G | .95%G |
| Expenses net of all reductions | .87%G | .93%G |
| Net investment income (loss) | 3.80%G | (.37)%G |
| Supplemental Data | | |
| Net assets, end of period (000 omitted) | $210 | $145 |
| Portfolio turnover rateH | 48%G | 53% |
A For the period October 2, 2018 (commencement of sale of shares) to October 31, 2018.
B Calculated based on average shares outstanding during the period.
C Total returns for periods of less than one year are not annualized.
D Total returns would have been lower if certain expenses had not been reduced during the applicable periods shown.
E Fees and expenses of any underlying Fidelity Central Funds are not included in the Fund's expense ratio. The Fund indirectly bears its proportionate share of the expenses of any underlying Fidelity Central Funds.
F Expense ratios reflect operating expenses of the class. Expenses before reductions do not reflect amounts reimbursed by the investment adviser or reductions from brokerage service arrangements or reductions from other expense offset arrangements and do not represent the amount paid by the class during periods when reimbursements or reductions occur. Expense ratios before reductions for start-up periods may not be representative of longer-term operating periods. Expenses net of fee waivers reflect expenses after reimbursement by the investment adviser but prior to reductions from brokerage service arrangements or other expense offset arrangements. Expenses net of all reductions represent the net expenses paid by the class.
G Annualized
H Amount does not include the portfolio activity of any underlying Fidelity Central Funds.
See accompanying notes which are an integral part of the financial statements.
Notes to Financial Statements (Unaudited)
For the period ended April 30, 2019
1. Organization.
Fidelity Latin America Fund (the Fund) is a non-diversified fund of Fidelity Investment Trust (the Trust) and is authorized to issue an unlimited number of shares. The Trust is registered under the Investment Company Act of 1940, as amended (the 1940 Act), as an open-end management investment company organized as a Massachusetts business trust. The Fund offers Class A, Class M, Class C, Latin America, Class I and Class Z shares, each of which has equal rights as to assets and voting privileges. Each class has exclusive voting rights with respect to matters that affect that class. Effective March 1, 2019, Class C shares will automatically convert to Class A shares after a holding period of ten years from the initial date of purchase, with certain exceptions. The Fund's investments in emerging markets can be subject to social, economic, regulatory, and political uncertainties and can be extremely volatile.
2. Investments in Fidelity Central Funds.
The Fund invests in Fidelity Central Funds, which are open-end investment companies generally available only to other investment companies and accounts managed by the investment adviser and its affiliates. The Fund's Schedule of Investments lists each of the Fidelity Central Funds held as of period end, if any, as an investment of the Fund, but does not include the underlying holdings of each Fidelity Central Fund. As an Investing Fund, the Fund indirectly bears its proportionate share of the expenses of the underlying Fidelity Central Funds.
The Money Market Central Funds seek preservation of capital and current income and are managed by Fidelity Investments Money Management, Inc. (FIMM), an affiliate of the investment adviser. Annualized expenses of the Money Market Central Funds as of their most recent shareholder report date are less than .005%.
A complete unaudited list of holdings for each Fidelity Central Fund is available upon request or at the Securities and Exchange Commission (the SEC) website at www.sec.gov. In addition, the financial statements of the Fidelity Central Funds are available on the SEC website or upon request.
3. Significant Accounting Policies.
The Fund is an investment company and applies the accounting and reporting guidance of the Financial Accounting Standards Board (FASB) Accounting Standards Codification Topic 946 Financial Services – Investments Companies. The financial statements have been prepared in conformity with accounting principles generally accepted in the United States of America (GAAP), which require management to make certain estimates and assumptions at the date of the financial statements. Actual results could differ from those estimates. Subsequent events, if any, through the date that the financial statements were issued have been evaluated in the preparation of the financial statements. The following summarizes the significant accounting policies of the Fund:
Investment Valuation. Investments are valued as of 4:00 p.m. Eastern time on the last calendar day of the period. The Board of Trustees (the Board) has delegated the day to day responsibility for the valuation of the Fund's investments to the Fair Value Committee (the Committee) established by the Fund's investment adviser. In accordance with valuation policies and procedures approved by the Board, the Fund attempts to obtain prices from one or more third party pricing vendors or brokers to value its investments. When current market prices, quotations or currency exchange rates are not readily available or reliable, investments will be fair valued in good faith by the Committee, in accordance with procedures adopted by the Board. Factors used in determining fair value vary by investment type and may include market or investment specific events. The frequency with which these procedures are used cannot be predicted and they may be utilized to a significant extent. The Committee oversees the Fund's valuation policies and procedures and reports to the Board on the Committee's activities and fair value determinations. The Board monitors the appropriateness of the procedures used in valuing the Fund's investments and ratifies the fair value determinations of the Committee.
The Fund categorizes the inputs to valuation techniques used to value its investments into a disclosure hierarchy consisting of three levels as shown below:
- Level 1 – quoted prices in active markets for identical investments
- Level 2 – other significant observable inputs (including quoted prices for similar investments, interest rates, prepayment speeds, etc.)
- Level 3 – unobservable inputs (including the Fund's own assumptions based on the best information available)
Valuation techniques used to value the Fund's investments by major category are as follows:
Equity securities, including restricted securities, for which market quotations are readily available, are valued at the last reported sale price or official closing price as reported by a third party pricing vendor on the primary market or exchange on which they are traded and are categorized as Level 1 in the hierarchy. In the event there were no sales during the day or closing prices are not available, securities are valued at the last quoted bid price or may be valued using the last available price and are generally categorized as Level 2 in the hierarchy. For foreign equity securities, when market or security specific events arise, comparisons to the valuation of American Depositary Receipts (ADRs), futures contracts, Exchange-Traded Funds (ETFs) and certain indexes as well as quoted prices for similar securities may be used and would be categorized as Level 2 in the hierarchy. For equity securities, including restricted securities, where observable inputs are limited, assumptions about market activity and risk are used and these securities may be categorized as Level 3 in the hierarchy.
Investments in open-end mutual funds, including the Fidelity Central Funds, are valued at their closing net asset value (NAV) each business day and are categorized as Level 1 in the hierarchy.
Changes in valuation techniques may result in transfers in or out of an assigned level within the disclosure hierarchy.
Foreign Currency. The Fund may use foreign currency contracts to facilitate transactions in foreign-denominated securities. Gains and losses from these transactions may arise from changes in the value of the foreign currency or if the counterparties do not perform under the contracts' terms.
Foreign-denominated assets, including investment securities, and liabilities are translated into U.S. dollars at the exchange rates at period end. Purchases and sales of investment securities, income and dividends received and expenses denominated in foreign currencies are translated into U.S. dollars at the exchange rate in effect on the transaction date.
The effects of exchange rate fluctuations on investments are included with the net realized and unrealized gain (loss) on investment securities. Other foreign currency transactions resulting in realized and unrealized gain (loss) are disclosed separately.
Investment Transactions and Income. For financial reporting purposes, the Fund's investment holdings and NAV include trades executed through the end of the last business day of the period. The NAV per share for processing shareholder transactions is calculated as of the close of business of the New York Stock Exchange (NYSE), normally 4:00 p.m. Eastern time and includes trades executed through the end of the prior business day. Gains and losses on securities sold are determined on the basis of identified cost. Dividend income is recorded on the ex-dividend date, except for certain dividends from foreign securities where the ex-dividend date may have passed, which are recorded as soon as the Fund is informed of the ex-dividend date. Non-cash dividends included in dividend income, if any, are recorded at the fair market value of the securities received. Income and capital gain distributions from Fidelity Central Funds, if any, are recorded on the ex-dividend date. Certain distributions received by the Fund represent a return of capital or capital gain. The Fund determines the components of these distributions subsequent to the ex-dividend date, based upon receipt of tax filings or other correspondence relating to the underlying investment. These distributions are recorded as a reduction of cost of investments and/or as a realized gain. Investment income is recorded net of foreign taxes withheld where recovery of such taxes is uncertain.
Class Allocations and Expenses. Investment income, realized and unrealized capital gains and losses, common expenses of the Fund, and certain fund-level expense reductions, if any, are allocated daily on a pro-rata basis to each class based on the relative net assets of each class to the total net assets of the Fund. Each class differs with respect to transfer agent and distribution and service plan fees incurred. Certain expense reductions may also differ by class. For the reporting period, the allocated portion of income and expenses to each class as a percent of its average net assets may vary due to the timing of recording these transactions in relation to fluctuating net assets of the classes. Expenses directly attributable to a fund are charged to that fund. Expenses attributable to more than one fund are allocated among the respective funds on the basis of relative net assets or other appropriate methods. Expense estimates are accrued in the period to which they relate and adjustments are made when actual amounts are known.
Income Tax Information and Distributions to Shareholders. Each year, the Fund intends to qualify as a regulated investment company under Subchapter M of the Internal Revenue Code, including distributing substantially all of its taxable income and realized gains. As a result, no provision for U.S. Federal income taxes is required. The Fund files a U.S. federal tax return, in addition to state and local tax returns as required. The Fund's federal income tax returns are subject to examination by the Internal Revenue Service (IRS) for a period of three fiscal years after they are filed. State and local tax returns may be subject to examination for an additional fiscal year depending on the jurisdiction. Foreign taxes are provided for based on the Fund's understanding of the tax rules and rates that exist in the foreign markets in which it invests.
Distributions are declared and recorded on the ex-dividend date. Income and capital gain distributions are declared separately for each class. Income and capital gain distributions are determined in accordance with income tax regulations, which may differ from GAAP.
Capital accounts within the financial statements are adjusted for permanent book-tax differences. These adjustments have no impact on net assets or the results of operations. Capital accounts are not adjusted for temporary book-tax differences which will reverse in a subsequent period.
Book-tax differences are primarily due to foreign currency transactions, passive foreign investment companies (PFIC), deferred trustees compensation, capital loss carryforwards and losses deferred due to wash sales.
As of period end, the cost and unrealized appreciation (depreciation) in securities, and derivatives if applicable, for federal income tax purposes were as follows:
| Gross unrealized appreciation | $125,082,712 |
| Gross unrealized depreciation | (30,296,185) |
| Net unrealized appreciation (depreciation) | $94,786,527 |
| Tax cost | $420,518,076 |
Capital loss carryforwards are only available to offset future capital gains of the Fund to the extent provided by regulations and may be limited. Under the Regulated Investment Company Modernization Act of 2010 (the Act), the Fund is permitted to carry forward capital losses incurred in taxable years beginning after December 22, 2010 for an unlimited period and such capital losses are required to be used prior to any losses that expire. The capital loss carryforward information presented below, including any applicable limitation, is estimated as of prior fiscal period end and is subject to adjustment.
| No expiration | |
| Short-term | $(63,666,720) |
| Long-term | (38,145,272) |
| Total capital loss carryforward | $(101,811,992) |
Restricted Securities. The Fund may invest in securities that are subject to legal or contractual restrictions on resale. These securities generally may be resold in transactions exempt from registration or to the public if the securities are registered. Disposal of these securities may involve time-consuming negotiations and expense, and prompt sale at an acceptable price may be difficult. Information regarding restricted securities is included at the end of the Fund's Schedule of Investments.
4. Purchases and Sales of Investments.
Purchases and sales of securities, other than short-term securities, aggregated $120,943,907 and $122,860,920, respectively.
5. Fees and Other Transactions with Affiliates.
Management Fee. Fidelity Management & Research Company (the investment adviser) and its affiliates provide the Fund with investment management related services for which the Fund pays a monthly management fee. The management fee is the sum of an individual fund fee rate that is based on an annual rate of .45% of the Fund's average net assets and an annualized group fee rate that averaged .24% during the period. The group fee rate is based upon the average net assets of all the mutual funds advised by the investment adviser, including any mutual funds previously advised by the investment adviser that are currently advised by Fidelity SelectCo, LLC, an affiliate of the investment adviser. The group fee rate decreases as assets under management increase and increases as assets under management decrease. For the reporting period, the total annualized management fee rate was .69% of the Fund's average net assets.
Distribution and Service Plan Fees. In accordance with Rule 12b-1 of the 1940 Act, the Fund has adopted separate Distribution and Service Plans for each class of shares. Certain classes pay Fidelity Distributors Corporation (FDC), an affiliate of the investment adviser, separate Distribution and Service Fees, each of which is based on an annual percentage of each class' average net assets. In addition, FDC may pay financial intermediaries for selling shares of the Fund and providing shareholder support services. For the period, the Distribution and Service Fee rates, total fees and amounts retained by FDC were as follows:
| | Distribution Fee | Service Fee | Total Fees | Retained by FDC |
| Class A | -% | .25% | $19,570 | $687 |
| Class M | .25% | .25% | 13,382 | 338 |
| Class C | .75% | .25% | 18,871 | 1,627 |
| | | | $51,823 | $2,652 |
Sales Load. FDC may receive a front-end sales charge of up to 5.75% for selling Class A shares and 3.50% for selling Class M shares, some of which is paid to financial intermediaries for selling shares of the Fund. Depending on the holding period, FDC may receive contingent deferred sales charges levied on Class A, Class M and Class C redemptions. The deferred sales charges are 1.00% for Class C shares, 1.00% for certain purchases of Class A shares and .25% for certain purchases of Class M shares.
For the period, sales charge amounts retained by FDC were as follows:
| | Retained by FDC |
| Class A | $1,069 |
| Class M | 390 |
| Class C(a) | 159 |
| | $1,618 |
(a) When Class C shares are initially sold, FDC pays commissions from its own resources to financial intermediaries through which the sales are made.
Transfer Agent Fees. Fidelity Investments Institutional Operations Company, Inc., (FIIOC), an affiliate of the investment adviser, is the transfer, dividend disbursing and shareholder servicing agent for each class of the Fund. FIIOC receives account fees and asset-based fees that vary according to the account size and type of account of the shareholders of the respective classes of the Fund, except for Class Z. FIIOC receives an asset-based fee of Class Z's average net assets. FIIOC pays for typesetting, printing and mailing of shareholder reports, except proxy statements.
For the period, transfer agent fees for each class were as follows:
| | Amount | % of Class-Level Average Net Assets(a) |
| Class A | $23,927 | .31 |
| Class M | 8,787 | .33 |
| Class C | 5,861 | .31 |
| Latin America | 581,666 | .24 |
| Class I | 3,953 | .20 |
| Class Z | 44 | .05 |
| | $624,238 | |
(a) Annualized
Accounting and Security Lending Fees. Fidelity Service Company, Inc. (FSC), an affiliate of the investment adviser, maintains the Fund's accounting records. The accounting fee is based on the level of average net assets for each month. Prior to April 1, 2019, FSC had a separate agreement with the Fund for administration of the security lending program, based on the number and duration of lending transactions. For the period, the total fees paid for accounting and administration of securities lending were equivalent to an annualized rate of .05%.
Brokerage Commissions. The Fund placed a portion of its portfolio transactions with brokerage firms which are affiliates of the investment adviser. Brokerage commissions are included in net realized gain (loss) and change in net unrealized appreciation (depreciation) in the Statement of Operations. The commissions paid to these affiliated firms were $141 for the period.
Interfund Lending Program. Pursuant to an Exemptive Order issued by the SEC, the Fund, along with other registered investment companies having management contracts with Fidelity Management & Research Company (FMR) or other affiliated entities of FMR, may participate in an interfund lending program. This program provides an alternative credit facility allowing the funds to borrow from, or lend money to, other participating affiliated funds. At period end, there were no interfund loans outstanding. The Fund's activity in this program during the period for which loans were outstanding was as follows:
| Borrower or Lender | Average Loan Balance | Weighted Average Interest Rate | Interest Expense |
| Borrower | $3,006,500 | 2.65% | $443 |
Interfund Trades. The Fund may purchase from or sell securities to other Fidelity Funds under procedures adopted by the Board. The procedures have been designed to ensure these interfund trades are executed in accordance with Rule 17a-7 of the 1940 Act. Interfund trades are included within the respective purchases and sales amounts shown in the Purchases and Sales of Investments note.
6. Committed Line of Credit.
The Fund participates with other funds managed by the investment adviser or an affiliate in a $4.25 billion credit facility (the "line of credit") to be utilized for temporary or emergency purposes to fund shareholder redemptions or for other short-term liquidity purposes. The Fund has agreed to pay commitment fees on its pro-rata portion of the line of credit, which amounted to $725 and is reflected in Miscellaneous expenses on the Statement of Operations. During the period, the Fund did not borrow on this line of credit.
7. Security Lending.
The Fund lends portfolio securities through a lending agent from time to time in order to earn additional income. For equity securities, a lending agent is used and may loan securities to certain qualified borrowers, including Fidelity Capital Markets (FCM), a broker-dealer affiliated with the Fund. On the settlement date of the loan, the Fund receives collateral (in the form of U.S. Treasury obligations, letters of credit and/or cash) against the loaned securities and maintains collateral in an amount not less than 100% of the market value of the loaned securities during the period of the loan. The market value of the loaned securities is determined at the close of business of the Fund and any additional required collateral is delivered to the Fund on the next business day. The Fund or borrower may terminate the loan at any time, and if the borrower defaults on its obligation to return the securities loaned because of insolvency or other reasons, the Fund may apply collateral received from the borrower against the obligation. The Fund may experience delays and costs in recovering the securities loaned. Any cash collateral received is invested in the Fidelity Securities Lending Cash Central Fund. At period end, there were no security loans outstanding. Security lending income represents the income earned on investing cash collateral, less rebates paid to borrowers and any lending agent fees associated with the loan, plus any premium payments received for lending certain types of securities. Security lending income is presented in the Statement of Operations as a component of income from Fidelity Central Funds. Total security lending income during the period amounted to $1,871. During the period, there were no securities loaned to FCM.
8. Expense Reductions.
Through arrangements with each class' transfer agent, credits realized as a result of certain uninvested cash balances were used to reduce the Fund's expenses. During the period, credits reduced each class' transfer agent expense as noted in the table below.
| | Transfer Agent expense reduction |
| Latin America | $550 |
In addition, during the period the investment adviser reimbursed and/or waived a portion of fund-level operating expenses in the amount of $1,825 and a portion of class-level operating expenses as follows:
| | Amount |
| Class A | $495 |
| Class M | 166 |
| Class C | 133 |
| Latin America | 15,080 |
| Class I | 119 |
| Class Z | 6 |
| | $15,999 |
9. Distributions to Shareholders.
Distributions to shareholders of each class were as follows:
| | Six months ended
April 30, 2019 | Year ended
October 31, 2018(a) |
| Distributions to shareholders | | |
| Class A | $268,347 | $203,267 |
| Class M | 80,020 | 60,223 |
| Class C | 31,875 | 19,813 |
| Latin America | 10,028,288 | 8,592,965 |
| Class I | 87,883 | 129,478 |
| Class Z | 4,501 | – |
| Total | $10,500,914 | $9,005,746 |
(a) Distributions for Class Z are for the period October 2, 2018 (commencement of sale of shares) to October 31, 2018.
10. Share Transactions.
Share transactions for each class were as follows and may contain automatic conversions between classes or exchanges between affiliated funds:
| | Shares | Shares | Dollars | Dollars |
| | Six months ended April 30, 2019 | Year ended October 31, 2018(a) | Six months ended April 30, 2019 | Year ended October 31, 2018(a) |
| Class A | | | | |
| Shares sold | 154,642 | 132,121 | $3,592,411 | $3,342,334 |
| Reinvestment of distributions | 12,291 | 8,149 | 261,098 | 198,340 |
| Shares redeemed | (147,419) | (210,293) | (3,463,077) | (4,928,726) |
| Net increase (decrease) | 19,514 | (70,023) | $390,432 | $(1,388,052) |
| Class M | | | | |
| Shares sold | 16,894 | 33,058 | $385,391 | $849,708 |
| Reinvestment of distributions | 3,725 | 2,445 | 79,471 | 59,769 |
| Shares redeemed | (31,057) | (73,856) | (722,304) | (1,749,327) |
| Net increase (decrease) | (10,438) | (38,353) | $(257,442) | $(839,850) |
| Class C | | | | |
| Shares sold | 50,093 | 28,227 | $1,226,148 | $744,605 |
| Reinvestment of distributions | 1,372 | 727 | 29,690 | 18,055 |
| Shares redeemed | (89,019) | (73,884) | (2,130,691) | (1,820,603) |
| Net increase (decrease) | (37,554) | (44,930) | $(874,853) | $(1,057,943) |
| Latin America | | | | |
| Shares sold | 2,981,083 | 4,131,542 | $67,777,194 | $102,336,398 |
| Reinvestment of distributions | 450,184 | 339,440 | 9,512,373 | 8,218,379 |
| Shares redeemed | (3,195,753) | (8,141,607) | (73,777,645) | (192,899,345) |
| Net increase (decrease) | 235,514 | (3,670,625) | $3,511,922 | $(82,344,568) |
| Class I | | | | |
| Shares sold | 27,483 | 238,869 | $627,763 | $5,842,130 |
| Reinvestment of distributions | 4,028 | 4,501 | 85,022 | 108,773 |
| Shares redeemed | (85,443) | (381,644) | (1,980,146) | (9,010,302) |
| Net increase (decrease) | (53,932) | (138,274) | $(1,267,361) | $(3,059,399) |
| Class Z | | | | |
| Shares sold | 2,876 | 6,615 | $64,318 | $143,661 |
| Reinvestment of distributions | 198 | – | 4,168 | – |
| Shares redeemed | (818) | – | (19,164) | – |
| Net increase (decrease) | 2,256 | 6,615 | $49,322 | $143,661 |
(a) Share transactions for Class Z are for the period October 2, 2018 (commencement of sale of shares) to October 31, 2018.
11. Other.
The Fund's organizational documents provide former and current trustees and officers with a limited indemnification against liabilities arising in connection with the performance of their duties to the Fund. In the normal course of business, the Fund may also enter into contracts that provide general indemnifications. The Fund's maximum exposure under these arrangements is unknown as this would be dependent on future claims that may be made against the Fund. The risk of material loss from such claims is considered remote.
Fidelity® Nordic Fund
Investment Summary (Unaudited)
Geographic Diversification (% of fund's net assets)
| As of April 30, 2019 |
| | Sweden | 47.1% |
| | Finland | 18.6% |
| | Denmark | 17.1% |
| | Norway | 9.3% |
| | United States of America* | 2.3% |
| | Malta | 2.2% |
| | Bermuda | 1.7% |
| | Canada | 1.7% |

* Includes Short-Term investments and Net Other Assets (Liabilities).
Percentages are based on country or territory of incorporation and are adjusted for the effect of futures contracts, if applicable.
Asset Allocation as of April 30, 2019
| | % of fund's net assets |
| Stocks | 99.4 |
| Short-Term Investments and Net Other Assets (Liabilities) | 0.6 |
Top Ten Stocks as of April 30, 2019
| | % of fund's net assets |
| Novo Nordisk A/S Series B (Denmark, Pharmaceuticals) | 9.1 |
| Telefonaktiebolaget LM Ericsson (B Shares) (Sweden, Communications Equipment) | 7.0 |
| Swedbank AB (A Shares) (Sweden, Banks) | 5.7 |
| Investor AB (B Shares) (Sweden, Diversified Financial Services) | 4.8 |
| Olvi PLC (A Shares) (Finland, Beverages) | 3.8 |
| Equinor ASA (Norway, Oil, Gas & Consumable Fuels) | 3.6 |
| Skandinaviska Enskilda Banken AB (A Shares) (Sweden, Banks) | 3.5 |
| DONG Energy A/S (Denmark, Electric Utilities) | 3.4 |
| UPM-Kymmene Corp. (Finland, Paper & Forest Products) | 3.4 |
| A.P. Moller - Maersk A/S Series B (Denmark, Marine) | 3.3 |
| | 47.6 |
Top Market Sectors as of April 30, 2019
| | % of fund's net assets |
| Industrials | 17.3 |
| Financials | 17.3 |
| Information Technology | 13.9 |
| Health Care | 13.5 |
| Consumer Discretionary | 12.6 |
| Consumer Staples | 9.6 |
| Materials | 6.5 |
| Energy | 3.6 |
| Utilities | 3.4 |
| Communication Services | 1.7 |
Market Sectors may include more than one industry category.
The Fund may invest up to 35% of its total assets in any industry that represents more than 20% of the Nordic market. As of April 30, 2019, the Fund did not have more than 25% of its total assets invested in any one industry.
Fidelity® Nordic Fund
Schedule of Investments April 30, 2019 (Unaudited)
Showing Percentage of Net Assets
| Common Stocks - 99.4% | | | |
| | | Shares | Value |
| Bermuda - 1.7% | | | |
| Vostok New Ventures Ltd. (depositary receipt) | | 814,271 | $4,765,376 |
| Canada - 1.7% | | | |
| Lundin Mining Corp. (Sweden) | | 874,725 | 4,723,110 |
| Denmark - 17.1% | | | |
| A.P. Moller - Maersk A/S Series B | | 6,974 | 8,990,142 |
| DONG Energy A/S (a) | | 123,400 | 9,447,387 |
| Novo Nordisk A/S Series B | | 510,300 | 25,001,920 |
| Scandinavian Tobacco Group A/S (a) | | 294,000 | 3,500,368 |
|
| TOTAL DENMARK | | | 46,939,817 |
|
| Finland - 18.6% | | | |
| Ahlstrom-Munksjo OYJ | | 253,577 | 3,811,120 |
| Caverion Corp. (b) | | 765,835 | 5,574,654 |
| Kamux Corp. | | 1,050,000 | 6,830,544 |
| Nokia Corp. | | 1,305,900 | 6,861,996 |
| Nokian Tyres PLC | | 247,900 | 8,291,291 |
| Olvi PLC (A Shares) | | 280,046 | 10,380,992 |
| UPM-Kymmene Corp. | | 331,400 | 9,333,343 |
|
| TOTAL FINLAND | | | 51,083,940 |
|
| Malta - 2.2% | | | |
| Kambi Group PLC (b)(c) | | 308,388 | 6,144,154 |
| Norway - 9.3% | | | |
| Adevinta ASA Class B | | 662,147 | 6,514,444 |
| Equinor ASA | | 439,200 | 9,797,106 |
| Schibsted ASA (B Shares) | | 192,550 | 4,606,497 |
| Skandiabanken ASA (a) | | 459,533 | 4,522,119 |
|
| TOTAL NORWAY | | | 25,440,166 |
|
| Sweden - 47.1% | | | |
| AcadeMedia AB (a)(c) | | 733,243 | 4,172,510 |
| Addlife AB | | 240,771 | 6,459,336 |
| AddTech AB (B Shares) | | 369,000 | 8,975,137 |
| Alfa Laval AB (b) | | 123,400 | 2,864,320 |
| Arjo AB | | 1,494,600 | 5,548,303 |
| Dustin Group AB (a) | | 509,600 | 4,567,608 |
| Eltel AB (a)(b)(c) | | 2,467,623 | 4,924,031 |
| Essity AB Class B | | 284,900 | 8,447,546 |
| Investor AB (B Shares) | | 273,250 | 13,031,761 |
| Lagercrantz Group AB (B Shares) | | 447,800 | 5,454,875 |
| Momentum Group AB Class B | | 323,369 | 3,343,515 |
| Saab AB (B Shares) (b) | | 187,125 | 6,160,132 |
| Securitas AB (B Shares) | | 395,600 | 6,917,673 |
| Skandinaviska Enskilda Banken AB (A Shares) | | 1,011,800 | 9,660,264 |
| Swedbank AB (A Shares) | | 963,699 | 15,746,092 |
| Swedish Match Co. AB | | 76,600 | 3,734,986 |
| Telefonaktiebolaget LM Ericsson (B Shares) | | 1,944,300 | 19,233,360 |
|
| TOTAL SWEDEN | | | 129,241,449 |
|
| United States of America - 1.7% | | | |
| Autoliv, Inc. (depositary receipt) | | 57,200 | 4,634,661 |
| TOTAL COMMON STOCKS | | | |
| (Cost $264,469,472) | | | 272,972,673 |
|
| Money Market Funds - 3.8% | | | |
| Fidelity Cash Central Fund, 2.49% (d) | | 1,257,452 | 1,257,703 |
| Fidelity Securities Lending Cash Central Fund 2.49% (d)(e) | | 9,092,739 | 9,093,648 |
| TOTAL MONEY MARKET FUNDS | | | |
| (Cost $10,351,351) | | | 10,351,351 |
| TOTAL INVESTMENT IN SECURITIES - 103.2% | | | |
| (Cost $274,820,823) | | | 283,324,024 |
| NET OTHER ASSETS (LIABILITIES) - (3.2)% | | | (8,722,889) |
| NET ASSETS - 100% | | | $274,601,135 |
Categorizations in the Schedule of Investments are based on country or territory of incorporation.
Legend
(a) Security exempt from registration under Rule 144A of the Securities Act of 1933. These securities may be resold in transactions exempt from registration, normally to qualified institutional buyers. At the end of the period, the value of these securities amounted to $31,134,023 or 11.3% of net assets.
(b) Security or a portion of the security is on loan at period end.
(c) Non-income producing
(d) Affiliated fund that is generally available only to investment companies and other accounts managed by Fidelity Investments. The rate quoted is the annualized seven-day yield of the fund at period end. A complete unaudited listing of the fund's holdings as of its most recent quarter end is available upon request. In addition, each Fidelity Central Fund's financial statements are available on the SEC's website or upon request.
(e) Investment made with cash collateral received from securities on loan.
Affiliated Central Funds
Information regarding fiscal year to date income earned by the Fund from investments in Fidelity Central Funds is as follows:
| Fund | Income earned |
| Fidelity Cash Central Fund | $30,519 |
| Fidelity Securities Lending Cash Central Fund | 217,548 |
| Total | $248,067 |
Amounts in the income column in the above table include any capital gain distributions from underlying funds, which are presented in the corresponding line-item in the Statement of Operations, if applicable.
Investment Valuation
The following is a summary of the inputs used, as of April 30, 2019, involving the Fund's assets and liabilities carried at fair value. The inputs or methodology used for valuing securities may not be an indication of the risk associated with investing in those securities. For more information on valuation inputs, and their aggregation into the levels used below, please refer to the Investment Valuation section in the accompanying Notes to Financial Statements.
| | Valuation Inputs at Reporting Date: |
| Description | Total | Level 1 | Level 2 | Level 3 |
| Investments in Securities: | | | | |
| Equities: | | | | |
| Communication Services | $4,606,497 | $4,606,497 | $-- | $-- |
| Consumer Discretionary | 34,640,768 | 15,121,835 | 19,518,933 | -- |
| Consumer Staples | 26,063,892 | 13,881,360 | 12,182,532 | -- |
| Energy | 9,797,106 | 9,797,106 | -- | -- |
| Financials | 47,725,612 | 4,522,119 | 43,203,493 | -- |
| Health Care | 37,009,559 | -- | 37,009,559 | -- |
| Industrials | 47,749,604 | 5,574,654 | 42,174,950 | -- |
| Information Technology | 38,064,675 | 6,514,444 | 31,550,231 | -- |
| Materials | 17,867,573 | 13,144,463 | 4,723,110 | -- |
| Utilities | 9,447,387 | 9,447,387 | -- | -- |
| Money Market Funds | 10,351,351 | 10,351,351 | -- | -- |
| Total Investments in Securities: | $283,324,024 | $92,961,216 | $190,362,808 | $-- |
See accompanying notes which are an integral part of the financial statements.
Fidelity® Nordic Fund
Financial Statements
Statement of Assets and Liabilities
| | | April 30, 2019 (Unaudited) |
| Assets | | |
Investment in securities, at value (including securities loaned of $8,662,346) — See accompanying schedule:
Unaffiliated issuers (cost $264,469,472) | $272,972,673 | |
| Fidelity Central Funds (cost $10,351,351) | 10,351,351 | |
| Total Investment in Securities (cost $274,820,823) | | $283,324,024 |
| Receivable for investments sold | | 526,726 |
| Receivable for fund shares sold | | 58,548 |
| Dividends receivable | | 803,860 |
| Distributions receivable from Fidelity Central Funds | | 109,121 |
| Prepaid expenses | | 151 |
| Other receivables | | 55,276 |
| Total assets | | 284,877,706 |
| Liabilities | | |
| Payable for investments purchased | $559,199 | |
| Payable for fund shares redeemed | 373,400 | |
| Accrued management fee | 159,135 | |
| Other affiliated payables | 55,660 | |
| Other payables and accrued expenses | 37,112 | |
| Collateral on securities loaned | 9,092,065 | |
| Total liabilities | | 10,276,571 |
| Net Assets | | $274,601,135 |
| Net Assets consist of: | | |
| Paid in capital | | $267,325,117 |
| Total distributable earnings (loss) | | 7,276,018 |
| Net Assets, for 5,896,389 shares outstanding | | $274,601,135 |
| Net Asset Value, offering price and redemption price per share ($274,601,135 ÷ 5,896,389 shares) | | $46.57 |
See accompanying notes which are an integral part of the financial statements.
Statement of Operations
| | | Six months ended April 30, 2019 (Unaudited) |
| Investment Income | | |
| Dividends | | $5,715,301 |
| Non-Cash dividends | | 4,818,016 |
| Income from Fidelity Central Funds | | 248,067 |
| Income before foreign taxes withheld | | 10,781,384 |
| Less foreign taxes withheld | | (880,305) |
| Total income | | 9,901,079 |
| Expenses | | |
| Management fee | $956,124 | |
| Transfer agent fees | 262,495 | |
| Accounting and security lending fees | 73,041 | |
| Custodian fees and expenses | 18,432 | |
| Independent trustees' fees and expenses | 788 | |
| Registration fees | 13,295 | |
| Audit | 49,571 | |
| Legal | 414 | |
| Miscellaneous | 926 | |
| Total expenses before reductions | 1,375,086 | |
| Expense reductions | (97,775) | |
| Total expenses after reductions | | 1,277,311 |
| Net investment income (loss) | | 8,623,768 |
| Realized and Unrealized Gain (Loss) | | |
| Net realized gain (loss) on: | | |
| Investment securities: | | |
| Unaffiliated issuers | (4,746,737) | |
| Fidelity Central Funds | (43) | |
| Foreign currency transactions | 23,950 | |
| Total net realized gain (loss) | | (4,722,830) |
| Change in net unrealized appreciation (depreciation) on: | | |
| Investment securities: | | |
| Unaffiliated issuers | 5,889,181 | |
| Assets and liabilities in foreign currencies | (4,243) | |
| Total change in net unrealized appreciation (depreciation) | | 5,884,938 |
| Net gain (loss) | | 1,162,108 |
| Net increase (decrease) in net assets resulting from operations | | $9,785,876 |
See accompanying notes which are an integral part of the financial statements.
Statement of Changes in Net Assets
| | Six months ended April 30, 2019 (Unaudited) | Year ended October 31, 2018 |
| Increase (Decrease) in Net Assets | | |
| Operations | | |
| Net investment income (loss) | $8,623,768 | $2,921,247 |
| Net realized gain (loss) | (4,722,830) | 29,401,950 |
| Change in net unrealized appreciation (depreciation) | 5,884,938 | (46,626,675) |
| Net increase (decrease) in net assets resulting from operations | 9,785,876 | (14,303,478) |
| Distributions to shareholders | (26,423,359) | (13,759,103) |
| Share transactions | | |
| Proceeds from sales of shares | 9,531,263 | 18,566,517 |
| Reinvestment of distributions | 24,699,755 | 12,909,432 |
| Cost of shares redeemed | (33,176,262) | (90,024,441) |
| Net increase (decrease) in net assets resulting from share transactions | 1,054,756 | (58,548,492) |
| Redemption fees | – | 47,618 |
| Total increase (decrease) in net assets | (15,582,727) | (86,563,455) |
| Net Assets | | |
| Beginning of period | 290,183,862 | 376,747,317 |
| End of period | $274,601,135 | $290,183,862 |
| Other Information | | |
| Shares | | |
| Sold | 207,139 | 350,130 |
| Issued in reinvestment of distributions | 565,212 | 250,523 |
| Redeemed | (721,561) | (1,688,296) |
| Net increase (decrease) | 50,790 | (1,087,643) |
See accompanying notes which are an integral part of the financial statements.
Financial Highlights
Fidelity Nordic Fund
| | Six months ended (Unaudited) April 30, | Years endedOctober 31, | | | | |
| | 2019 | 2018 | 2017 | 2016 | 2015 | 2014 |
| Selected Per–Share Data | | | | | | |
| Net asset value, beginning of period | $49.64 | $54.34 | $45.28 | $44.99 | $43.36 | $43.91 |
| Income from Investment Operations | | | | | | |
| Net investment income (loss)A | 1.42B | .47 | .51 | .64 | .56 | .71 |
| Net realized and unrealized gain (loss) | .11 | (3.01) | 9.32 | .27 | 1.06 | 1.35 |
| Total from investment operations | 1.53 | (2.54) | 9.83 | .91 | 1.62 | 2.06 |
| Distributions from net investment income | (.05) | (.50) | (.65) | (.57) | – | (.83) |
| Distributions from net realized gain | (4.55) | (1.67) | (.12) | (.05) | – | (1.80) |
| Total distributions | (4.60) | (2.17) | (.77) | (.62) | – | (2.63) |
| Redemption fees added to paid in capitalA | – | .01 | –C | –C | .01 | .02 |
| Net asset value, end of period | $46.57 | $49.64 | $54.34 | $45.28 | $44.99 | $43.36 |
| Total ReturnD,E | 3.69% | (4.80)% | 22.14% | 1.97% | 3.76% | 4.88% |
| Ratios to Average Net AssetsF,G | | | | | | |
| Expenses before reductions | .99%H | .98% | .99% | .99% | 1.00% | .99% |
| Expenses net of fee waivers, if any | .99%H | .97% | .99% | .98% | 1.00% | .99% |
| Expenses net of all reductions | .92%H | .97% | .96% | .98% | .99% | .98% |
| Net investment income (loss) | 4.48%B,H | .89% | 1.04% | 1.37% | 1.26% | 1.56% |
| Supplemental Data | | | | | | |
| Net assets, end of period (000 omitted) | $274,601 | $290,184 | $376,747 | $430,020 | $405,726 | $487,582 |
| Portfolio turnover rateI | 38%H | 56% | 69% | 63% | 80% | 103% |
A Calculated based on average shares outstanding during the period.
B Net investment income per share reflects large, non-recurring dividends which amounted to $.80 per share. These dividends are not annualized in the ratio of net investment income (loss) to average net assets. Excluding these dividends the ratio would have been 2.74%.
C Amount represents less than $.005 per share.
D Total returns for periods of less than one year are not annualized.
E Total returns would have been lower if certain expenses had not been reduced during the applicable periods shown.
F Fees and expenses of any underlying Fidelity Central Funds are not included in the Fund's expense ratio. The Fund indirectly bears its proportionate share of the expenses of any underlying Fidelity Central Funds.
G Expense ratios reflect operating expenses of the Fund. Expenses before reductions do not reflect amounts reimbursed by the investment adviser or reductions from brokerage service arrangements or reductions from other expense offset arrangements and do not represent the amount paid by the Fund during periods when reimbursements or reductions occur. Expenses net of fee waivers reflect expenses after reimbursement by the investment adviser but prior to reductions from brokerage service arrangements or other expense offset arrangements. Expenses net of all reductions represent the net expenses paid by the Fund.
H Annualized
I Amount does not include the portfolio activity of any underlying Fidelity Central Funds.
See accompanying notes which are an integral part of the financial statements.
Notes to Financial Statements (Unaudited)
For the period ended April 30, 2019
1. Organization.
Fidelity Nordic Fund (the Fund) is a fund of Fidelity Investment Trust (the Trust) and is authorized to issue an unlimited number of shares. Share transactions on the Statement of Changes in Net Assets may contain exchanges between affiliated funds. The Trust is registered under the Investment Company Act of 1940, as amended (the 1940 Act), as an open-end management investment company organized as a Massachusetts business trust.
2. Investments in Fidelity Central Funds.
The Fund invests in Fidelity Central Funds, which are open-end investment companies generally available only to other investment companies and accounts managed by the investment adviser and its affiliates. The Fund's Schedule of Investments lists each of the Fidelity Central Funds held as of period end, if any, as an investment of the Fund, but does not include the underlying holdings of each Fidelity Central Fund. As an Investing Fund, the Fund indirectly bears its proportionate share of the expenses of the underlying Fidelity Central Funds.
The Money Market Central Funds seek preservation of capital and current income and are managed by Fidelity Investments Money Management, Inc. (FIMM), an affiliate of the investment adviser. Annualized expenses of the Money Market Central Funds as of their most recent shareholder report date are less than .005%.
A complete unaudited list of holdings for each Fidelity Central Fund is available upon request or at the Securities and Exchange Commission (the SEC) website at www.sec.gov. In addition, the financial statements of the Fidelity Central Funds are available on the SEC website or upon request.
3. Significant Accounting Policies.
The Fund is an investment company and applies the accounting and reporting guidance of the Financial Accounting Standards Board (FASB) Accounting Standards Codification Topic 946 Financial Services – Investments Companies. The financial statements have been prepared in conformity with accounting principles generally accepted in the United States of America (GAAP), which require management to make certain estimates and assumptions at the date of the financial statements. Actual results could differ from those estimates. Subsequent events, if any, through the date that the financial statements were issued have been evaluated in the preparation of the financial statements. The following summarizes the significant accounting policies of the Fund:
Investment Valuation. Investments are valued as of 4:00 p.m. Eastern time on the last calendar day of the period. The Board of Trustees (the Board) has delegated the day to day responsibility for the valuation of the Fund's investments to the Fair Value Committee (the Committee) established by the Fund's investment adviser. In accordance with valuation policies and procedures approved by the Board, the Fund attempts to obtain prices from one or more third party pricing vendors or brokers to value its investments. When current market prices, quotations or currency exchange rates are not readily available or reliable, investments will be fair valued in good faith by the Committee, in accordance with procedures adopted by the Board. Factors used in determining fair value vary by investment type and may include market or investment specific events. The frequency with which these procedures are used cannot be predicted and they may be utilized to a significant extent. The Committee oversees the Fund's valuation policies and procedures and reports to the Board on the Committee's activities and fair value determinations. The Board monitors the appropriateness of the procedures used in valuing the Fund's investments and ratifies the fair value determinations of the Committee.
The Fund categorizes the inputs to valuation techniques used to value its investments into a disclosure hierarchy consisting of three levels as shown below:
- Level 1 – quoted prices in active markets for identical investments
- Level 2 – other significant observable inputs (including quoted prices for similar investments, interest rates, prepayment speeds, etc.)
- Level 3 – unobservable inputs (including the Fund's own assumptions based on the best information available)
Valuation techniques used to value the Fund's investments by major category are as follows:
Equity securities, including restricted securities, for which market quotations are readily available, are valued at the last reported sale price or official closing price as reported by a third party pricing vendor on the primary market or exchange on which they are traded and are categorized as Level 1 in the hierarchy. In the event there were no sales during the day or closing prices are not available, securities are valued at the last quoted bid price or may be valued using the last available price and are generally categorized as Level 2 in the hierarchy. For foreign equity securities, when market or security specific events arise, comparisons to the valuation of American Depositary Receipts (ADRs), futures contracts, Exchange-Traded Funds (ETFs) and certain indexes as well as quoted prices for similar securities may be used and would be categorized as Level 2 in the hierarchy. For equity securities, including restricted securities, where observable inputs are limited, assumptions about market activity and risk are used and these securities may be categorized as Level 3 in the hierarchy.
Investments in open-end mutual funds, including the Fidelity Central Funds, are valued at their closing net asset value (NAV) each business day and are categorized as Level 1 in the hierarchy.
Changes in valuation techniques may result in transfers in or out of an assigned level within the disclosure hierarchy. The aggregate value of investments by input level as of April 30, 2019 is included at the end of the Fund's Schedule of Investments.
Foreign Currency. The Fund may use foreign currency contracts to facilitate transactions in foreign-denominated securities. Gains and losses from these transactions may arise from changes in the value of the foreign currency or if the counterparties do not perform under the contracts' terms.
Foreign-denominated assets, including investment securities, and liabilities are translated into U.S. dollars at the exchange rates at period end. Purchases and sales of investment securities, income and dividends received and expenses denominated in foreign currencies are translated into U.S. dollars at the exchange rate in effect on the transaction date.
The effects of exchange rate fluctuations on investments are included with the net realized and unrealized gain (loss) on investment securities. Other foreign currency transactions resulting in realized and unrealized gain (loss) are disclosed separately.
Investment Transactions and Income. For financial reporting purposes, the Fund's investment holdings and NAV include trades executed through the end of the last business day of the period. The NAV per share for processing shareholder transactions is calculated as of the close of business of the New York Stock Exchange (NYSE), normally 4:00 p.m. Eastern time and includes trades executed through the end of the prior business day. Gains and losses on securities sold are determined on the basis of identified cost. Dividend income is recorded on the ex-dividend date, except for certain dividends from foreign securities where the ex-dividend date may have passed, which are recorded as soon as the Fund is informed of the ex-dividend date. Non-cash dividends included in dividend income, if any, are recorded at the fair market value of the securities received. Income and capital gain distributions from Fidelity Central Funds, if any, are recorded on the ex-dividend date. Large, non-recurring dividends recognized by the Fund are presented separately on the Statement of Operations as "Non-cash dividends" and the impact of these dividends is presented in the Financial Highlights. Investment income is recorded net of foreign taxes withheld where recovery of such taxes is uncertain.
Expenses. Expenses directly attributable to a fund are charged to that fund. Expenses attributable to more than one fund are allocated among the respective funds on the basis of relative net assets or other appropriate methods. Expense estimates are accrued in the period to which they relate and adjustments are made when actual amounts are known.
Income Tax Information and Distributions to Shareholders. Each year, the Fund intends to qualify as a regulated investment company under Subchapter M of the Internal Revenue Code, including distributing substantially all of its taxable income and realized gains. As a result, no provision for U.S. Federal income taxes is required. The Fund files a U.S. federal tax return, in addition to state and local tax returns as required. The Fund's federal income tax returns are subject to examination by the Internal Revenue Service (IRS) for a period of three fiscal years after they are filed. State and local tax returns may be subject to examination for an additional fiscal year depending on the jurisdiction. Foreign taxes are provided for based on the Fund's understanding of the tax rules and rates that exist in the foreign markets in which it invests.
Distributions are declared and recorded on the ex-dividend date. Income and capital gain distributions are determined in accordance with income tax regulations, which may differ from GAAP.
Capital accounts within the financial statements are adjusted for permanent book-tax differences. These adjustments have no impact on net assets or the results of operations. Capital accounts are not adjusted for temporary book-tax differences which will reverse in a subsequent period.
Book-tax differences are primarily due to foreign currency transactions, passive foreign investment companies (PFIC), deferred trustees compensation and losses deferred due to wash sales.
As of period end, the cost and unrealized appreciation (depreciation) in securities, and derivatives if applicable, for federal income tax purposes were as follows:
| Gross unrealized appreciation | $30,634,028 |
| Gross unrealized depreciation | (24,597,933) |
| Net unrealized appreciation (depreciation) | $6,036,095 |
| Tax cost | $277,287,929 |
Restricted Securities. The Fund may invest in securities that are subject to legal or contractual restrictions on resale. These securities generally may be resold in transactions exempt from registration or to the public if the securities are registered. Disposal of these securities may involve time-consuming negotiations and expense, and prompt sale at an acceptable price may be difficult. Information regarding restricted securities is included at the end of the Fund's Schedule of Investments.
4. Purchases and Sales of Investments.
Purchases and sales of securities, other than short-term securities, aggregated $51,886,489 and $61,508,207, respectively.
5. Fees and Other Transactions with Affiliates.
Management Fee. Fidelity Management & Research Company (the investment adviser) and its affiliates provide the Fund with investment management related services for which the Fund pays a monthly management fee. The management fee is the sum of an individual fund fee rate that is based on an annual rate of .45% of the Fund's average net assets and an annualized group fee rate that averaged .24% during the period. The group fee rate is based upon the average net assets of all the mutual funds advised by the investment adviser, including any mutual funds previously advised by the investment adviser that are currently advised by Fidelity SelectCo, LLC, an affiliate of the investment adviser. The group fee rate decreases as assets under management increase and increases as assets under management decrease. For the reporting period, the total annualized management fee rate was .69% of the Fund's average net assets.
Transfer Agent Fees. Fidelity Investments Institutional Operations Company, Inc. (FIIOC), an affiliate of the investment adviser, is the Fund's transfer, dividend disbursing and shareholder servicing agent. FIIOC receives account fees and asset-based fees that vary according to account size and type of account. FIIOC pays for typesetting, printing and mailing of shareholder reports, except proxy statements. For the period, the transfer agent fees were equivalent to an annualized rate of .19% of average net assets.
Accounting and Security Lending Fees. Fidelity Service Company, Inc. (FSC), an affiliate of the investment adviser, maintains the Fund's accounting records. The accounting fee is based on the level of average net assets for each month. Prior to April 1, 2019, FSC had a separate agreement with the Fund for administration of the security lending program, based on the number and duration of lending transactions. For the period, the total fees paid for accounting and administration of securities lending were equivalent to an annualized rate of .05%.
Interfund Trades. The Fund may purchase from or sell securities to other Fidelity Funds under procedures adopted by the Board. The procedures have been designed to ensure these interfund trades are executed in accordance with Rule 17a-7 of the 1940 Act. Interfund trades are included within the respective purchases and sales amounts shown in the Purchases and Sales of Investments note.
6. Committed Line of Credit.
The Fund participates with other funds managed by the investment adviser or an affiliate in a $4.25 billion credit facility (the "line of credit") to be utilized for temporary or emergency purposes to fund shareholder redemptions or for other short-term liquidity purposes. The Fund has agreed to pay commitment fees on its pro-rata portion of the line of credit, which amounted to $402 and is reflected in Miscellaneous expenses on the Statement of Operations. During the period, the Fund did not borrow on this line of credit.
7. Security Lending.
The Fund lends portfolio securities through a lending agent from time to time in order to earn additional income. For equity securities, a lending agent is used and may loan securities to certain qualified borrowers, including Fidelity Capital Markets (FCM), a broker-dealer affiliated with the Fund. On the settlement date of the loan, the Fund receives collateral (in the form of U.S. Treasury obligations, letters of credit and/or cash) against the loaned securities and maintains collateral in an amount not less than 100% of the market value of the loaned securities during the period of the loan. The market value of the loaned securities is determined at the close of business of the Fund and any additional required collateral is delivered to the Fund on the next business day. The Fund or borrower may terminate the loan at any time, and if the borrower defaults on its obligation to return the securities loaned because of insolvency or other reasons, the Fund may apply collateral received from the borrower against the obligation. The Fund may experience delays and costs in recovering the securities loaned. Any cash collateral received is invested in the Fidelity Securities Lending Cash Central Fund. The value of loaned securities and cash collateral at period end are disclosed on the Fund's Statement of Assets and Liabilities. Security lending income represents the income earned on investing cash collateral, less rebates paid to borrowers and any lending agent fees associated with the loan, plus any premium payments received for lending certain types of securities. Security lending income is presented in the Statement of Operations as a component of income from Fidelity Central Funds. Total security lending income during the period amounted to $217,548. During the period, there were no securities loaned to FCM.
8. Expense Reductions.
Commissions paid to certain brokers with whom the investment adviser, or its affiliates, places trades on behalf of the Fund include an amount in addition to trade execution, which may be rebated back to the Fund to offset certain expenses. This amount totaled $96,644 for the period. In addition, through arrangements with the Fund's custodian, credits realized as a result of certain uninvested cash balances were used to reduce the Fund's expenses. During the period, these credits reduced the Fund's custody expenses by $54.
In addition, during the period the investment adviser reimbursed and/or waived a portion of operating expenses in the amount of $1,077.
9. Other.
The Fund's organizational documents provide former and current trustees and officers with a limited indemnification against liabilities arising in connection with the performance of their duties to the Fund. In the normal course of business, the Fund may also enter into contracts that provide general indemnifications. The Fund's maximum exposure under these arrangements is unknown as this would be dependent on future claims that may be made against the Fund. The risk of material loss from such claims is considered remote.
Fidelity® Pacific Basin Fund
Investment Summary (Unaudited)
Geographic Diversification (% of fund's net assets)
| As of April 30, 2019 |
| | Japan | 34.1% |
| | Australia | 12.7% |
| | Cayman Islands | 11.6% |
| | China | 9.6% |
| | India | 7.1% |
| | Taiwan | 5.3% |
| | Hong Kong | 5.1% |
| | United States of America* | 4.2% |
| | Korea (South) | 2.5% |
| | Other | 7.8% |

* Includes Short-Term investments and Net Other Assets (Liabilities).
Percentages are based on country or territory of incorporation and are adjusted for the effect of futures contracts, if applicable.
Asset Allocation as of April 30, 2019
| | % of fund's net assets |
| Stocks | 97.6 |
| Short-Term Investments and Net Other Assets (Liabilities) | 2.4 |
Top Ten Stocks as of April 30, 2019
| | % of fund's net assets |
| Tencent Holdings Ltd. (Cayman Islands, Interactive Media & Services) | 5.0 |
| Taiwan Semiconductor Manufacturing Co. Ltd. (Taiwan, Semiconductors & Semiconductor Equipment) | 3.9 |
| Alibaba Group Holding Ltd. sponsored ADR (Cayman Islands, Internet & Direct Marketing Retail) | 3.9 |
| Kweichow Moutai Co. Ltd. (A Shares) (China, Beverages) | 2.9 |
| AIA Group Ltd. (Hong Kong, Insurance) | 2.6 |
| SoftBank Corp. (Japan, Wireless Telecommunication Services) | 2.6 |
| Keyence Corp. (Japan, Electronic Equipment & Components) | 2.3 |
| Hoya Corp. (Japan, Health Care Equipment & Supplies) | 1.8 |
| Commonwealth Bank of Australia (Australia, Banks) | 1.6 |
| CSL Ltd. (Australia, Biotechnology) | 1.6 |
| | 28.2 |
Top Market Sectors as of April 30, 2019
| | % of fund's net assets |
| Financials | 17.5 |
| Information Technology | 14.5 |
| Consumer Discretionary | 13.6 |
| Industrials | 13.4 |
| Communication Services | 11.5 |
| Health Care | 11.1 |
| Consumer Staples | 8.5 |
| Real Estate | 2.8 |
| Energy | 2.2 |
| Materials | 1.4 |
Fidelity® Pacific Basin Fund
Schedule of Investments April 30, 2019 (Unaudited)
Showing Percentage of Net Assets
| Common Stocks - 97.0% | | | |
| | | Shares | Value |
| Australia - 12.7% | | | |
| Amcor Ltd. | | 749,158 | $8,465,746 |
| Aristocrat Leisure Ltd. | | 351,724 | 6,466,480 |
| Blue Sky Alternative Investments Ltd. (a) | | 1,733,447 | 329,938 |
| BWX Ltd. (b) | | 2,523,963 | 3,843,218 |
| Commonwealth Bank of Australia | | 271,245 | 14,249,279 |
| CSL Ltd. | | 99,807 | 13,971,176 |
| Hansen Technologies Ltd. | | 2,942,633 | 6,243,972 |
| HUB24 Ltd. (b) | | 800,830 | 8,468,177 |
| Macquarie Group Ltd. | | 83,345 | 7,914,172 |
| Magellan Financial Group Ltd. | | 381,318 | 11,991,620 |
| Netwealth Group Ltd. | | 1,055,748 | 7,070,371 |
| NIB Holdings Ltd. | | 826,366 | 3,349,644 |
| Pro Medicus Ltd. | | 24,200 | 348,702 |
| realestate.com.au Ltd. | | 172,850 | 9,735,864 |
| SpeedCast International Ltd. | | 1,171,597 | 3,204,559 |
| Woodside Petroleum Ltd. | | 287,298 | 7,167,562 |
|
| TOTAL AUSTRALIA | | | 112,820,480 |
|
| Bermuda - 0.7% | | | |
| Hongkong Land Holdings Ltd. | | 875,100 | 6,099,447 |
| Cayman Islands - 11.6% | | | |
| 51job, Inc. sponsored ADR (a) | | 88,100 | 8,135,154 |
| Alibaba Group Holding Ltd. sponsored ADR (a) | | 184,200 | 34,181,994 |
| China High Precision Automation Group Ltd. (a)(c) | | 1,875,000 | 2 |
| China Metal Recycling (Holdings) Ltd. (a)(c) | | 2,572,200 | 3 |
| International Housewares Retail Co. Ltd. | | 19,363,700 | 5,084,798 |
| Shenzhou International Group Holdings Ltd. | | 547,500 | 7,349,040 |
| SITC International Holdings Co. Ltd. | | 3,415,000 | 3,626,217 |
| Tencent Holdings Ltd. | | 899,800 | 44,349,037 |
|
| TOTAL CAYMAN ISLANDS | | | 102,726,245 |
|
| China - 9.6% | | | |
| Foshan Haitian Flavouring & Food Co. Ltd. (A Shares) | | 606,010 | 8,033,463 |
| Gree Electric Appliances, Inc. of Zhuhai (A Shares) | | 722,194 | 5,959,931 |
| Hangzhou Tigermed Consulting Co. Ltd. (A Shares) | | 474,600 | 4,679,125 |
| Kweichow Moutai Co. Ltd. (A Shares) | | 179,050 | 25,894,178 |
| Midea Group Co. Ltd. (A Shares) | | 773,400 | 6,017,337 |
| Shanghai International Airport Co. Ltd. (A Shares) | | 951,913 | 9,982,868 |
| Shenzhen Expressway Co. (H Shares) | | 6,230,000 | 7,584,196 |
| Sinopec Engineering Group Co. Ltd. (H Shares) | | 4,098,500 | 3,960,156 |
| Tonghua Dongbao Pharmaceutical Co. Ltd. (A Shares) | | 2,327,325 | 5,459,878 |
| Yunnan Baiyao Group Co. Ltd. (A Shares) | | 622,433 | 8,179,085 |
|
| TOTAL CHINA | | | 85,750,217 |
|
| Hong Kong - 5.1% | | | |
| AIA Group Ltd. | | 2,285,400 | 23,401,206 |
| Dah Sing Banking Group Ltd. | | 2,182,800 | 4,173,720 |
| Hong Kong Exchanges and Clearing Ltd. | | 234,427 | 8,128,205 |
| Techtronic Industries Co. Ltd. | | 1,282,000 | 9,265,934 |
|
| TOTAL HONG KONG | | | 44,969,065 |
|
| India - 7.1% | | | |
| Axis Bank Ltd. (a) | | 590,198 | 6,498,390 |
| Bharti Infratel Ltd. | | 26 | 98 |
| CCL Products (India) Ltd. | | 1,250,367 | 4,648,011 |
| HDFC Asset Management Co. Ltd. (d) | | 139,820 | 3,402,902 |
| HDFC Bank Ltd. | | 274,966 | 9,122,185 |
| Housing Development Finance Corp. Ltd. | | 332,684 | 9,529,789 |
| Indraprastha Gas Ltd. (a) | | 927,400 | 4,165,157 |
| Oberoi Realty Ltd. | | 352,703 | 2,569,044 |
| Power Grid Corp. of India Ltd. | | 2,008,492 | 5,375,435 |
| Reliance Industries Ltd. | | 611,475 | 12,228,271 |
| TCNS Clothing Co. Ltd. (a)(d) | | 476,790 | 5,622,805 |
|
| TOTAL INDIA | | | 63,162,087 |
|
| Indonesia - 2.2% | | | |
| PT Bank Central Asia Tbk | | 5,423,200 | 10,941,544 |
| PT Bank Rakyat Indonesia Tbk | | 27,733,200 | 8,504,848 |
|
| TOTAL INDONESIA | | | 19,446,392 |
|
| Israel - 0.1% | | | |
| Sarine Technologies Ltd. | | 4,391,400 | 1,178,488 |
| Japan - 34.1% | | | |
| Azbil Corp. | | 282,200 | 6,756,384 |
| Bank of Kyoto Ltd. | | 101,100 | 4,356,389 |
| Coca-Cola West Co. Ltd. | | 157,300 | 3,864,896 |
| Create SD Holdings Co. Ltd. | | 211,800 | 4,875,041 |
| Daikin Industries Ltd. | | 61,000 | 7,766,488 |
| Fukushima Industries Corp. | | 68,000 | 2,350,195 |
| Hoshizaki Corp. | | 61,200 | 3,955,653 |
| Hoya Corp. | | 221,600 | 15,546,515 |
| Iriso Electronics Co. Ltd. | | 135,100 | 6,985,735 |
| Kao Corp. | | 154,200 | 11,845,140 |
| Keyence Corp. | | 33,000 | 20,476,323 |
| Kyowa Hakko Kirin Co., Ltd. | | 298,500 | 5,777,333 |
| Lasertec Corp. | | 101,800 | 4,596,741 |
| Minebea Mitsumi, Inc. | | 428,500 | 7,577,943 |
| Misumi Group, Inc. | | 219,000 | 5,658,082 |
| Morinaga & Co. Ltd. | | 71,400 | 2,964,451 |
| Murata Manufacturing Co. Ltd. | | 130,200 | 6,537,818 |
| Nakanishi, Inc. | | 242,800 | 4,649,153 |
| Nidec Corp. | | 84,000 | 11,903,048 |
| Nihon M&A Center, Inc. | | 238,600 | 6,747,071 |
| Nintendo Co. Ltd. | | 33,100 | 11,400,162 |
| Nissan Chemical Corp. | | 84,000 | 3,717,582 |
| Nitori Holdings Co. Ltd. | | 54,700 | 6,506,351 |
| NSD Co. Ltd. | | 260,400 | 6,444,839 |
| Open House Co. Ltd. | | 178,500 | 6,513,780 |
| ORIX Corp. | | 577,400 | 8,145,645 |
| PALTAC Corp. | | 156,600 | 8,589,488 |
| Pilot Corp. | | 145,500 | 6,008,349 |
| ProNexus, Inc. (e) | | 109,300 | 1,298,118 |
| Recruit Holdings Co. Ltd. | | 295,100 | 8,818,959 |
| Shimadzu Corp. | | 288,000 | 7,688,963 |
| Shionogi & Co. Ltd. | | 187,400 | 10,894,586 |
| SMC Corp. | | 23,500 | 9,716,863 |
| SMS Co., Ltd. | | 285,500 | 5,464,213 |
| SoftBank Corp. | | 217,400 | 23,051,223 |
| Subaru Corp. | | 313,300 | 7,651,444 |
| Terumo Corp. | | 264,800 | 7,956,242 |
| Tsuruha Holdings, Inc. | | 75,400 | 6,409,965 |
| Zozo, Inc. | | 663,600 | 11,705,858 |
|
| TOTAL JAPAN | | | 303,173,029 |
|
| Korea (South) - 1.9% | | | |
| Cafe24 Corp. (a) | | 6,145 | 506,800 |
| KB Financial Group, Inc. | | 160,640 | 6,365,491 |
| SK Hynix, Inc. | | 150,648 | 10,224,304 |
|
| TOTAL KOREA (SOUTH) | | | 17,096,595 |
|
| Multi-National - 1.1% | | | |
| HKT Trust/HKT Ltd. unit | | 6,213,000 | 9,630,594 |
| New Zealand - 1.5% | | | |
| EBOS Group Ltd. | | 408,279 | 5,841,010 |
| Ryman Healthcare Group Ltd. | | 978,040 | 7,936,780 |
|
| TOTAL NEW ZEALAND | | | 13,777,790 |
|
| Philippines - 1.1% | | | |
| Ayala Land, Inc. | | 10,263,500 | 9,706,305 |
| Taiwan - 5.3% | | | |
| Micro-Star International Co. Ltd. | | 1,674,000 | 4,637,059 |
| Taiwan Semiconductor Manufacturing Co. Ltd. | | 4,159,000 | 34,917,968 |
| Voltronic Power Technology Corp. | | 380,703 | 7,515,010 |
|
| TOTAL TAIWAN | | | 47,070,037 |
|
| Thailand - 1.1% | | | |
| Home Product Center PCL (For. Reg.) | | 10,933,100 | 5,377,917 |
| Thai Beverage PCL | | 7,190,200 | 4,440,679 |
|
| TOTAL THAILAND | | | 9,818,596 |
|
| United States of America - 1.8% | | | |
| GI Dynamics, Inc. CDI (a) | | 5,561,290 | 90,170 |
| IPG Photonics Corp. (a) | | 48,100 | 8,404,513 |
| ResMed, Inc. CDI | | 746,362 | 7,718,590 |
|
| TOTAL UNITED STATES OF AMERICA | | | 16,213,273 |
|
| TOTAL COMMON STOCKS | | | |
| (Cost $665,516,208) | | | 862,638,640 |
|
| Nonconvertible Preferred Stocks - 0.6% | | | |
| Korea (South) - 0.6% | | | |
| Samsung Electronics Co. Ltd. | | | |
| (Cost $6,433,279) | | 182,390 | 5,828,909 |
|
| Money Market Funds - 2.6% | | | |
| Fidelity Cash Central Fund, 2.49% (f) | | 16,889,993 | 16,893,371 |
| Fidelity Securities Lending Cash Central Fund 2.49% (f)(g) | | 5,966,298 | 5,966,894 |
| TOTAL MONEY MARKET FUNDS | | | |
| (Cost $22,860,265) | | | 22,860,265 |
| TOTAL INVESTMENT IN SECURITIES - 100.2% | | | |
| (Cost $694,809,752) | | | 891,327,814 |
| NET OTHER ASSETS (LIABILITIES) - (0.2)% | | | (1,952,092) |
| NET ASSETS - 100% | | | $889,375,722 |
Categorizations in the Schedule of Investments are based on country or territory of incorporation.
Legend
(a) Non-income producing
(b) Security or a portion of the security is on loan at period end.
(c) Level 3 security
(d) Security exempt from registration under Rule 144A of the Securities Act of 1933. These securities may be resold in transactions exempt from registration, normally to qualified institutional buyers. At the end of the period, the value of these securities amounted to $9,025,707 or 1.0% of net assets.
(e) A portion of the security sold on a delayed delivery basis.
(f) Affiliated fund that is generally available only to investment companies and other accounts managed by Fidelity Investments. The rate quoted is the annualized seven-day yield of the fund at period end. A complete unaudited listing of the fund's holdings as of its most recent quarter end is available upon request. In addition, each Fidelity Central Fund's financial statements are available on the SEC's website or upon request.
(g) Investment made with cash collateral received from securities on loan.
Affiliated Central Funds
Information regarding fiscal year to date income earned by the Fund from investments in Fidelity Central Funds is as follows:
| Fund | Income earned |
| Fidelity Cash Central Fund | $206,154 |
| Fidelity Securities Lending Cash Central Fund | 211,868 |
| Total | $418,022 |
Amounts in the income column in the above table include any capital gain distributions from underlying funds, which are presented in the corresponding line-item in the Statement of Operations, if applicable.
Investment Valuation
The following is a summary of the inputs used, as of April 30, 2019, involving the Fund's assets and liabilities carried at fair value. The inputs or methodology used for valuing securities may not be an indication of the risk associated with investing in those securities. For more information on valuation inputs, and their aggregation into the levels used below, please refer to the Investment Valuation section in the accompanying Notes to Financial Statements.
| | Valuation Inputs at Reporting Date: |
| Description | Total | Level 1 | Level 2 | Level 3 |
| Investments in Securities: | | | | |
| Equities: | | | | |
| Communication Services | $101,371,537 | $22,571,115 | $78,800,422 | $-- |
| Consumer Discretionary | 119,779,377 | 119,779,377 | -- | -- |
| Consumer Staples | 76,819,042 | 76,819,042 | -- | -- |
| Energy | 19,395,833 | 19,395,833 | -- | -- |
| Financials | 155,943,515 | 117,054,633 | 38,888,882 | -- |
| Health Care | 99,048,345 | 93,207,335 | 5,841,010 | -- |
| Industrials | 119,247,071 | 111,480,583 | 7,766,488 | -- |
| Information Technology | 130,250,330 | 88,794,542 | 41,455,786 | 2 |
| Materials | 12,183,331 | 12,183,328 | -- | 3 |
| Real Estate | 24,888,576 | 24,888,576 | -- | -- |
| Utilities | 9,540,592 | 9,540,592 | -- | -- |
| Money Market Funds | 22,860,265 | 22,860,265 | -- | -- |
| Total Investments in Securities: | $891,327,814 | $718,575,221 | $172,752,588 | $5 |
See accompanying notes which are an integral part of the financial statements.
Fidelity® Pacific Basin Fund
Financial Statements
Statement of Assets and Liabilities
| | | April 30, 2019 (Unaudited) |
| Assets | | |
Investment in securities, at value (including securities loaned of $5,668,949) — See accompanying schedule:
Unaffiliated issuers (cost $671,949,487) | $868,467,549 | |
| Fidelity Central Funds (cost $22,860,265) | 22,860,265 | |
| Total Investment in Securities (cost $694,809,752) | | $891,327,814 |
| Receivable for investments sold | | |
| Regular delivery | | 6,013,566 |
| Delayed delivery | | 12,433 |
| Receivable for fund shares sold | | 413,346 |
| Dividends receivable | | 2,150,983 |
| Distributions receivable from Fidelity Central Funds | | 64,902 |
| Prepaid expenses | | 472 |
| Other receivables | | 64,729 |
| Total assets | | 900,048,245 |
| Liabilities | | |
| Payable for investments purchased | $2,996,077 | |
| Payable for fund shares redeemed | 668,347 | |
| Accrued management fee | 578,934 | |
| Other affiliated payables | 151,197 | |
| Other payables and accrued expenses | 312,540 | |
| Collateral on securities loaned | 5,965,428 | |
| Total liabilities | | 10,672,523 |
| Net Assets | | $889,375,722 |
| Net Assets consist of: | | |
| Paid in capital | | $711,425,220 |
| Total distributable earnings (loss) | | 177,950,502 |
| Net Assets, for 28,658,842 shares outstanding | | $889,375,722 |
| Net Asset Value, offering price and redemption price per share ($889,375,722 ÷ 28,658,842 shares) | | $31.03 |
See accompanying notes which are an integral part of the financial statements.
Statement of Operations
| | | Six months ended April 30, 2019 (Unaudited) |
| Investment Income | | |
| Dividends | | $5,850,492 |
| Income from Fidelity Central Funds | | 418,022 |
| Income before foreign taxes withheld | | 6,268,514 |
| Less foreign taxes withheld | | (403,064) |
| Total income | | 5,865,450 |
| Expenses | | |
| Management fee | | |
| Basic fee | $2,831,286 | |
| Performance adjustment | (9,525) | |
| Transfer agent fees | 685,124 | |
| Accounting and security lending fees | 197,405 | |
| Custodian fees and expenses | 92,710 | |
| Independent trustees' fees and expenses | 2,290 | |
| Registration fees | 20,526 | |
| Audit | 51,454 | |
| Legal | 2,077 | |
| Miscellaneous | 2,791 | |
| Total expenses before reductions | 3,876,138 | |
| Expense reductions | (53,294) | |
| Total expenses after reductions | | 3,822,844 |
| Net investment income (loss) | | 2,042,606 |
| Realized and Unrealized Gain (Loss) | | |
| Net realized gain (loss) on: | | |
| Investment securities: | | |
| Unaffiliated issuers | (13,560,788) | |
| Fidelity Central Funds | (10) | |
| Foreign currency transactions | (46,255) | |
| Total net realized gain (loss) | | (13,607,053) |
| Change in net unrealized appreciation (depreciation) on: | | |
| Investment securities: | | |
| Unaffiliated issuers (net of increase in deferred foreign taxes of $215,585) | 135,604,093 | |
| Assets and liabilities in foreign currencies | 8,188 | |
| Total change in net unrealized appreciation (depreciation) | | 135,612,281 |
| Net gain (loss) | | 122,005,228 |
| Net increase (decrease) in net assets resulting from operations | | $124,047,834 |
See accompanying notes which are an integral part of the financial statements.
Statement of Changes in Net Assets
| | Six months ended April 30, 2019 (Unaudited) | Year ended October 31, 2018 |
| Increase (Decrease) in Net Assets | | |
| Operations | | |
| Net investment income (loss) | $2,042,606 | $6,163,967 |
| Net realized gain (loss) | (13,607,053) | 80,755,805 |
| Change in net unrealized appreciation (depreciation) | 135,612,281 | (211,680,575) |
| Net increase (decrease) in net assets resulting from operations | 124,047,834 | (124,760,803) |
| Distributions to shareholders | (77,993,885) | (42,947,398) |
| Share transactions | | |
| Proceeds from sales of shares | 52,489,452 | 182,924,589 |
| Reinvestment of distributions | 60,437,260 | 41,121,006 |
| Cost of shares redeemed | (77,236,742) | (223,982,513) |
| Net increase (decrease) in net assets resulting from share transactions | 35,689,970 | 63,082 |
| Redemption fees | – | 17,913 |
| Total increase (decrease) in net assets | 81,743,919 | (167,627,206) |
| Net Assets | | |
| Beginning of period | 807,631,803 | 975,259,009 |
| End of period | $889,375,722 | $807,631,803 |
| Other Information | | |
| Shares | | |
| Sold | 1,789,547 | 5,193,865 |
| Issued in reinvestment of distributions | 2,238,417 | 1,184,702 |
| Redeemed | (2,740,915) | (6,457,678) |
| Net increase (decrease) | 1,287,049 | (79,111) |
See accompanying notes which are an integral part of the financial statements.
Financial Highlights
Fidelity Pacific Basin Fund
| | Six months ended (Unaudited) April 30, | Years endedOctober 31, | | | | |
| | 2019 | 2018 | 2017 | 2016 | 2015 | 2014 |
| Selected Per–Share Data | | | | | | |
| Net asset value, beginning of period | $29.51 | $35.53 | $28.82 | $27.01 | $28.92 | $31.47 |
| Income from Investment Operations | | | | | | |
| Net investment income (loss)A | .07 | .22 | .25 | .24 | .37B | .31 |
| Net realized and unrealized gain (loss) | 4.31 | (4.69) | 7.09 | 2.88 | (.49) | 1.25 |
| Total from investment operations | 4.38 | (4.47) | 7.34 | 3.12 | (.12) | 1.56 |
| Distributions from net investment income | (.20) | (.23) | (.17) | (.36) | (.18) | (.18) |
| Distributions from net realized gain | (2.67) | (1.32) | (.46) | (.95) | (1.61) | (3.93) |
| Total distributions | (2.86)C | (1.55) | (.63) | (1.31) | (1.79) | (4.11) |
| Redemption fees added to paid in capitalA | – | –D | –D | –D | –D | –D |
| Net asset value, end of period | $31.03 | $29.51 | $35.53 | $28.82 | $27.01 | $28.92 |
| Total ReturnE,F | 16.30% | (13.24)% | 26.22% | 12.05% | (.29)% | 5.68% |
| Ratios to Average Net AssetsG,H | | | | | | |
| Expenses before reductions | .94%I | 1.07% | 1.11% | 1.19% | 1.17% | 1.18% |
| Expenses net of fee waivers, if any | .94%I | 1.07% | 1.11% | 1.19% | 1.17% | 1.18% |
| Expenses net of all reductions | .93%I | 1.06% | 1.10% | 1.19% | 1.17% | 1.18% |
| Net investment income (loss) | .50%I | .62% | .84% | .87% | 1.34%B | 1.09% |
| Supplemental Data | | | | | | |
| Net assets, end of period (000 omitted) | $889,376 | $807,632 | $975,259 | $688,318 | $654,032 | $697,202 |
| Portfolio turnover rateJ | 35%I | 37% | 36% | 30% | 36% | 30% |
A Calculated based on average shares outstanding during the period.
B Net investment income per share reflects a large, non-recurring dividend which amounted to $.10 per share. Excluding this non-recurring dividend, the ratio of net investment income (loss) to average net assets would have been .99%.
C Total distributions of $2.86 per share is comprised of distributions from net investment income of $.195 and distributions from net realized gain of $2.668 per share.
D Amount represents less than $.005 per share.
E Total returns for periods of less than one year are not annualized.
F Total returns would have been lower if certain expenses had not been reduced during the applicable periods shown.
G Fees and expenses of any underlying Fidelity Central Funds are not included in the Fund's expense ratio. The Fund indirectly bears its proportionate share of the expenses of any underlying Fidelity Central Funds.
H Expense ratios reflect operating expenses of the Fund. Expenses before reductions do not reflect amounts reimbursed by the investment adviser or reductions from brokerage service arrangements or reductions from other expense offset arrangements and do not represent the amount paid by the Fund during periods when reimbursements or reductions occur. Expenses net of fee waivers reflect expenses after reimbursement by the investment adviser but prior to reductions from brokerage service arrangements or other expense offset arrangements. Expenses net of all reductions represent the net expenses paid by the Fund.
I Annualized
J Amount does not include the portfolio activity of any underlying Fidelity Central Funds.
See accompanying notes which are an integral part of the financial statements.
Notes to Financial Statements (Unaudited)
For the period ended April 30, 2019
1. Organization.
Fidelity Pacific Basin Fund (the Fund) is a fund of Fidelity Investment Trust (the Trust) and is authorized to issue an unlimited number of shares. Share transactions on the Statement of Changes in Net Assets may contain exchanges between affiliated funds. The Trust is registered under the Investment Company Act of 1940, as amended (the 1940 Act), as an open-end management investment company organized as a Massachusetts business trust. The Fund's investments in emerging markets can be subject to social, economic, regulatory, and political uncertainties and can be extremely volatile.
2. Investments in Fidelity Central Funds.
The Fund invests in Fidelity Central Funds, which are open-end investment companies generally available only to other investment companies and accounts managed by the investment adviser and its affiliates. The Fund's Schedule of Investments lists each of the Fidelity Central Funds held as of period end, if any, as an investment of the Fund, but does not include the underlying holdings of each Fidelity Central Fund. As an Investing Fund, the Fund indirectly bears its proportionate share of the expenses of the underlying Fidelity Central Funds.
The Money Market Central Funds seek preservation of capital and current income and are managed by Fidelity Investments Money Management, Inc. (FIMM), an affiliate of the investment adviser. Annualized expenses of the Money Market Central Funds as of their most recent shareholder report date are less than .005%.
A complete unaudited list of holdings for each Fidelity Central Fund is available upon request or at the Securities and Exchange Commission (the SEC) website at www.sec.gov. In addition, the financial statements of the Fidelity Central Funds are available on the SEC website or upon request.
3. Significant Accounting Policies.
The Fund is an investment company and applies the accounting and reporting guidance of the Financial Accounting Standards Board (FASB) Accounting Standards Codification Topic 946 Financial Services – Investments Companies. The financial statements have been prepared in conformity with accounting principles generally accepted in the United States of America (GAAP), which require management to make certain estimates and assumptions at the date of the financial statements. Actual results could differ from those estimates. Subsequent events, if any, through the date that the financial statements were issued have been evaluated in the preparation of the financial statements. The following summarizes the significant accounting policies of the Fund:
Investment Valuation. Investments are valued as of 4:00 p.m. Eastern time on the last calendar day of the period. The Board of Trustees (the Board) has delegated the day to day responsibility for the valuation of the Fund's investments to the Fair Value Committee (the Committee) established by the Fund's investment adviser. In accordance with valuation policies and procedures approved by the Board, the Fund attempts to obtain prices from one or more third party pricing vendors or brokers to value its investments. When current market prices, quotations or currency exchange rates are not readily available or reliable, investments will be fair valued in good faith by the Committee, in accordance with procedures adopted by the Board. Factors used in determining fair value vary by investment type and may include market or investment specific events. The frequency with which these procedures are used cannot be predicted and they may be utilized to a significant extent. The Committee oversees the Fund's valuation policies and procedures and reports to the Board on the Committee's activities and fair value determinations. The Board monitors the appropriateness of the procedures used in valuing the Fund's investments and ratifies the fair value determinations of the Committee.
The Fund categorizes the inputs to valuation techniques used to value its investments into a disclosure hierarchy consisting of three levels as shown below:
- Level 1 – quoted prices in active markets for identical investments
- Level 2 – other significant observable inputs (including quoted prices for similar investments, interest rates, prepayment speeds, etc.)
- Level 3 – unobservable inputs (including the Fund's own assumptions based on the best information available)
Valuation techniques used to value the Fund's investments by major category are as follows:
Equity securities, including restricted securities, for which market quotations are readily available, are valued at the last reported sale price or official closing price as reported by a third party pricing vendor on the primary market or exchange on which they are traded and are categorized as Level 1 in the hierarchy. In the event there were no sales during the day or closing prices are not available, securities are valued at the last quoted bid price or may be valued using the last available price and are generally categorized as Level 2 in the hierarchy. For foreign equity securities, when market or security specific events arise, comparisons to the valuation of American Depositary Receipts (ADRs), futures contracts, Exchange-Traded Funds (ETFs) and certain indexes as well as quoted prices for similar securities may be used and would be categorized as Level 2 in the hierarchy. For equity securities, including restricted securities, where observable inputs are limited, assumptions about market activity and risk are used and these securities may be categorized as Level 3 in the hierarchy.
Investments in open-end mutual funds, including the Fidelity Central Funds, are valued at their closing net asset value (NAV) each business day and are categorized as Level 1 in the hierarchy.
Changes in valuation techniques may result in transfers in or out of an assigned level within the disclosure hierarchy. The aggregate value of investments by input level as of April 30, 2019 is included at the end of the Fund's Schedule of Investments.
Foreign Currency. The Fund may use foreign currency contracts to facilitate transactions in foreign-denominated securities. Gains and losses from these transactions may arise from changes in the value of the foreign currency or if the counterparties do not perform under the contracts' terms.
Foreign-denominated assets, including investment securities, and liabilities are translated into U.S. dollars at the exchange rates at period end. Purchases and sales of investment securities, income and dividends received and expenses denominated in foreign currencies are translated into U.S. dollars at the exchange rate in effect on the transaction date.
The effects of exchange rate fluctuations on investments are included with the net realized and unrealized gain (loss) on investment securities. Other foreign currency transactions resulting in realized and unrealized gain (loss) are disclosed separately.
Investment Transactions and Income. For financial reporting purposes, the Fund's investment holdings and NAV include trades executed through the end of the last business day of the period. The NAV per share for processing shareholder transactions is calculated as of the close of business of the New York Stock Exchange (NYSE), normally 4:00 p.m. Eastern time and includes trades executed through the end of the prior business day. Gains and losses on securities sold are determined on the basis of identified cost. Dividend income is recorded on the ex-dividend date, except for certain dividends from foreign securities where the ex-dividend date may have passed, which are recorded as soon as the Fund is informed of the ex-dividend date. Non-cash dividends included in dividend income, if any, are recorded at the fair market value of the securities received. Income and capital gain distributions from Fidelity Central Funds, if any, are recorded on the ex-dividend date. Investment income is recorded net of foreign taxes withheld where recovery of such taxes is uncertain.
Expenses. Expenses directly attributable to a fund are charged to that fund. Expenses attributable to more than one fund are allocated among the respective funds on the basis of relative net assets or other appropriate methods. Expense estimates are accrued in the period to which they relate and adjustments are made when actual amounts are known.
Income Tax Information and Distributions to Shareholders. Each year, the Fund intends to qualify as a regulated investment company under Subchapter M of the Internal Revenue Code, including distributing substantially all of its taxable income and realized gains. As a result, no provision for U.S. Federal income taxes is required. The Fund files a U.S. federal tax return, in addition to state and local tax returns as required. The Fund's federal income tax returns are subject to examination by the Internal Revenue Service (IRS) for a period of three fiscal years after they are filed. State and local tax returns may be subject to examination for an additional fiscal year depending on the jurisdiction. Foreign taxes are provided for based on the Fund's understanding of the tax rules and rates that exist in the foreign markets in which it invests. The Fund is subject to a tax imposed on capital gains by certain countries in which it invests. An estimated deferred tax liability for net unrealized appreciation on the applicable securities is included in Other payables and accrued expenses on the Statement of Assets & Liabilities.
Distributions are declared and recorded on the ex-dividend date. Income and capital gain distributions are determined in accordance with income tax regulations, which may differ from GAAP.
Capital accounts within the financial statements are adjusted for permanent book-tax differences. These adjustments have no impact on net assets or the results of operations. Capital accounts are not adjusted for temporary book-tax differences which will reverse in a subsequent period.
Book-tax differences are primarily due to foreign currency transactions, passive foreign investment companies (PFIC), deferred trustees compensation and losses deferred due to wash sales.
As of period end, the cost and unrealized appreciation (depreciation) in securities, and derivatives if applicable, for federal income tax purposes were as follows:
| Gross unrealized appreciation | $246,735,320 |
| Gross unrealized depreciation | (57,129,934) |
| Net unrealized appreciation (depreciation) | $189,605,386 |
| Tax cost | $701,722,428 |
Delayed Delivery Transactions and When-Issued Securities. During the period, the Fund transacted in securities on a delayed delivery or when-issued basis. Payment and delivery may take place after the customary settlement period for that security. The price of the underlying securities and the date when the securities will be delivered and paid for are fixed at the time the transaction is negotiated. Losses may arise due to changes in the value of the underlying securities or if the counterparty does not perform under the contract's terms, or if the issuer does not issue the securities due to political, economic, or other factors.
Restricted Securities. The Fund may invest in securities that are subject to legal or contractual restrictions on resale. These securities generally may be resold in transactions exempt from registration or to the public if the securities are registered. Disposal of these securities may involve time-consuming negotiations and expense, and prompt sale at an acceptable price may be difficult. Information regarding restricted securities is included at the end of the Fund's Schedule of Investments.
4. Purchases and Sales of Investments.
Purchases and sales of securities, other than short-term securities, aggregated $139,774,067 and $142,426,482, respectively.
5. Fees and Other Transactions with Affiliates.
Management Fee. Fidelity Management & Research Company (the investment adviser) and its affiliates provide the Fund with investment management related services for which the Fund pays a monthly management fee. The management fee is the sum of an individual fund fee rate that is based on an annual rate of .45% of the Fund's average net assets and an annualized group fee rate that averaged .24% during the period. The group fee rate is based upon the average net assets of all the mutual funds advised by the investment adviser, including any mutual funds previously advised by the investment adviser that are currently advised by Fidelity SelectCo, LLC, an affiliate of the investment adviser. The group fee rate decreases as assets under management increase and increases as assets under management decrease. In addition, the management fee is subject to a performance adjustment (up to a maximum of +/- .20% of the Fund's average net assets over a 36 month performance period). The upward or downward adjustment to the management fee is based on the Fund's relative investment performance as compared to its benchmark index, the MSCI All Country Pacific Index, over the same 36 month performance period. For the reporting period, the total annualized management fee rate, including the performance adjustment, was .69% of the Fund's average net assets. The performance adjustment included in the management fee rate may be higher or lower than the maximum performance adjustment rate due to the difference between the average net assets for the reporting and performance periods.
Transfer Agent Fees. Fidelity Investments Institutional Operations Company, Inc. (FIIOC), an affiliate of the investment adviser, is the Fund's transfer, dividend disbursing and shareholder servicing agent. FIIOC receives account fees and asset-based fees that vary according to account size and type of account. FIIOC pays for typesetting, printing and mailing of shareholder reports, except proxy statements. For the period, the transfer agent fees were equivalent to an annualized rate of .17% of average net assets.
Accounting and Security Lending Fees. Fidelity Service Company, Inc. (FSC), an affiliate of the investment adviser, maintains the Fund's accounting records. The accounting fee is based on the level of average net assets for each month. Prior to April 1, 2019, FSC had a separate agreement with the Fund for administration of the security lending program, based on the number and duration of lending transactions. For the period, the total fees paid for accounting and administration of securities lending were equivalent to an annualized rate of .05%.
Brokerage Commissions. The Fund placed a portion of its portfolio transactions with brokerage firms which are affiliates of the investment adviser. Brokerage commissions are included in net realized gain (loss) and change in net unrealized appreciation (depreciation) in the Statement of Operations. The commissions paid to these affiliated firms were $324 for the period.
Interfund Trades. The Fund may purchase from or sell securities to other Fidelity Funds under procedures adopted by the Board. The procedures have been designed to ensure these interfund trades are executed in accordance with Rule 17a-7 of the 1940 Act. Interfund trades are included within the respective purchases and sales amounts shown in the Purchases and Sales of Investments note.
6. Committed Line of Credit.
The Fund participates with other funds managed by the investment adviser or an affiliate in a $4.25 billion credit facility (the "line of credit") to be utilized for temporary or emergency purposes to fund shareholder redemptions or for other short-term liquidity purposes. The Fund has agreed to pay commitment fees on its pro-rata portion of the line of credit, which amounted to $1,168 and is reflected in Miscellaneous expenses on the Statement of Operations. During the period, the Fund did not borrow on this line of credit.
7. Security Lending.
The Fund lends portfolio securities through a lending agent from time to time in order to earn additional income. For equity securities, a lending agent is used and may loan securities to certain qualified borrowers, including Fidelity Capital Markets (FCM), a broker-dealer affiliated with the Fund. On the settlement date of the loan, the Fund receives collateral (in the form of U.S. Treasury obligations, letters of credit and/or cash) against the loaned securities and maintains collateral in an amount not less than 100% of the market value of the loaned securities during the period of the loan. The market value of the loaned securities is determined at the close of business of the Fund and any additional required collateral is delivered to the Fund on the next business day. The Fund or borrower may terminate the loan at any time, and if the borrower defaults on its obligation to return the securities loaned because of insolvency or other reasons, the Fund may apply collateral received from the borrower against the obligation. The Fund may experience delays and costs in recovering the securities loaned. Any cash collateral received is invested in the Fidelity Securities Lending Cash Central Fund. The value of loaned securities and cash collateral at period end are disclosed on the Fund's Statement of Assets and Liabilities. Security lending income represents the income earned on investing cash collateral, less rebates paid to borrowers and any lending agent fees associated with the loan, plus any premium payments received for lending certain types of securities. Security lending income is presented in the Statement of Operations as a component of income from Fidelity Central Funds. Total security lending income during the period amounted to $211,868. During the period, there were no securities loaned to FCM.
8. Expense Reductions.
Commissions paid to certain brokers with whom the investment adviser, or its affiliates, places trades on behalf of the Fund include an amount in addition to trade execution, which may be rebated back to the Fund to offset certain expenses. This amount totaled $49,164 for the period. In addition, through arrangements with the Fund's custodian, credits realized as a result of certain uninvested cash balances were used to reduce the Fund's expenses. During the period, these credits reduced the Fund's custody expenses by $968.
In addition, during the period the investment adviser reimbursed and/or waived a portion of operating expenses in the amount of $3,162.
9. Other.
The Fund's organizational documents provide former and current trustees and officers with a limited indemnification against liabilities arising in connection with the performance of their duties to the Fund. In the normal course of business, the Fund may also enter into contracts that provide general indemnifications. The Fund's maximum exposure under these arrangements is unknown as this would be dependent on future claims that may be made against the Fund. The risk of material loss from such claims is considered remote.
At the end of the period, Strategic Advisers Fidelity International Fund was the owner of record of approximately 17% of the total outstanding shares of the Fund. Mutual funds managed by the investment adviser or its affiliates were the owners of record, in the aggregate, of approximately 23% of the total outstanding shares of the Fund.
Shareholder Expense Example
As a shareholder of a Fund, you incur two types of costs: (1) transaction costs, including sales charges (loads) on purchase payments or redemption proceeds, and (2) ongoing costs, including management fees, distribution and/or service (12b-1) fees and other Fund expenses. This Example is intended to help you understand your ongoing costs (in dollars) of investing in the Funds and to compare these costs with the ongoing costs of investing in other mutual funds.
The Example is based on an investment of $1,000 invested at the beginning of the period and held for the entire period (November 1, 2018 to April 30, 2019).
Actual Expenses
The first line of the accompanying table for each Class of each fund provides information about actual account values and actual expenses. You may use the information in this line, together with the amount you invested, to estimate the expenses that you paid over the period. Simply divide your account value by $1,000.00 (for example, an $8,600 account value divided by $1,000.00 = 8.6), then multiply the result by the number in the first line for a Class of the fund under the heading entitled "Expenses Paid During Period" to estimate the expenses you paid on your account during this period. In addition, each Fund, as a shareholder in the underlying Fidelity Central Funds, will indirectly bear its pro-rata share of the fees and expenses incurred by the underlying Fidelity Central Funds. These fees and expenses are not included in the Fund's annualized expense ratio used to calculate the expense estimate in the table below.
Hypothetical Example for Comparison Purposes
The second line of the accompanying table for each Class of each fund provides information about hypothetical account values and hypothetical expenses based on a Class' actual expense ratio and an assumed rate of return of 5% per year before expenses, which is not the Class' actual return. The hypothetical account values and expenses may not be used to estimate the actual ending account balance or expenses you paid for the period. You may use this information to compare the ongoing costs of investing in the Fund and other funds. To do so, compare this 5% hypothetical example with the 5% hypothetical examples that appear in the shareholder reports of the other funds. In addition, each Fund, as a shareholder in the underlying Fidelity Central Funds, will indirectly bear its pro-rata share of the fees and expenses incurred by the underlying Fidelity Central Funds. These fees and expenses are not included in the Fund's annualized expense ratio used to calculate the expense estimate in the table below.
Please note that the expenses shown in the table are meant to highlight your ongoing costs only and do not reflect any transaction costs. Therefore, the second line of the table is useful in comparing ongoing costs only, and will not help you determine the relative total costs of owning different funds. In addition, if these transactional costs were included, your costs would have been higher.
| | Annualized Expense Ratio-A | Beginning
Account Value
November 1, 2018 | Ending
Account Value
April 30, 2019 | Expenses Paid
During Period-B
November 1, 2018
to April 30, 2019 |
| Fidelity Canada Fund | | | | |
| Class A | 1.17% | | | |
| Actual | | $1,000.00 | $1,096.20 | $6.08 |
| Hypothetical-C | | $1,000.00 | $1,018.99 | $5.86 |
| Class M | 1.46% | | | |
| Actual | | $1,000.00 | $1,094.50 | $7.58 |
| Hypothetical-C | | $1,000.00 | $1,017.55 | $7.30 |
| Class C | 1.89% | | | |
| Actual | | $1,000.00 | $1,092.20 | $9.80 |
| Hypothetical-C | | $1,000.00 | $1,015.42 | $9.44 |
| Canada | .85% | | | |
| Actual | | $1,000.00 | $1,098.00 | $4.42 |
| Hypothetical-C | | $1,000.00 | $1,020.58 | $4.26 |
| Class I | .80% | | | |
| Actual | | $1,000.00 | $1,098.30 | $4.16 |
| Hypothetical-C | | $1,000.00 | $1,020.83 | $4.01 |
| Class Z | .69% | | | |
| Actual | | $1,000.00 | $1,098.70 | $3.59 |
| Hypothetical-C | | $1,000.00 | $1,021.37 | $3.46 |
| Fidelity China Region Fund | | | | |
| Class A | 1.28% | | | |
| Actual | | $1,000.00 | $1,240.80 | $7.11 |
| Hypothetical-C | | $1,000.00 | $1,018.45 | $6.41 |
| Class M | 1.60% | | | |
| Actual | | $1,000.00 | $1,238.90 | $8.88 |
| Hypothetical-C | | $1,000.00 | $1,016.86 | $8.00 |
| Class C | 2.01% | | | |
| Actual | | $1,000.00 | $1,236.60 | $11.15 |
| Hypothetical-C | | $1,000.00 | $1,014.83 | $10.04 |
| China Region | .97% | | | |
| Actual | | $1,000.00 | $1,243.00 | $5.39 |
| Hypothetical-C | | $1,000.00 | $1,019.98 | $4.86 |
| Class I | .98% | | | |
| Actual | | $1,000.00 | $1,242.80 | $5.45 |
| Hypothetical-C | | $1,000.00 | $1,019.93 | $4.91 |
| Class Z | .83% | | | |
| Actual | | $1,000.00 | $1,243.50 | $4.62 |
| Hypothetical-C | | $1,000.00 | $1,020.68 | $4.16 |
| Fidelity Emerging Asia Fund | 1.05% | | | |
| Actual | | $1,000.00 | $1,242.40 | $5.84 |
| Hypothetical-C | | $1,000.00 | $1,019.59 | $5.26 |
| Fidelity Emerging Markets Fund | | | | |
| Emerging Markets | .96% | | | |
| Actual | | $1,000.00 | $1,204.80 | $5.25 |
| Hypothetical-C | | $1,000.00 | $1,020.03 | $4.81 |
| Class K | .82% | | | |
| Actual | | $1,000.00 | $1,205.80 | $4.48 |
| Hypothetical-C | | $1,000.00 | $1,020.73 | $4.11 |
| Europe | | | | |
| Class A | 1.12% | | | |
| Actual | | $1,000.00 | $1,080.30 | $5.78 |
| Hypothetical-C | | $1,000.00 | $1,019.24 | $5.61 |
| Class M | 1.44% | | | |
| Actual | | $1,000.00 | $1,078.80 | $7.42 |
| Hypothetical-C | | $1,000.00 | $1,017.65 | $7.20 |
| Class C | 1.93% | | | |
| Actual | | $1,000.00 | $1,076.20 | $9.94 |
| Hypothetical-C | | $1,000.00 | $1,015.22 | $9.64 |
| Fidelity Europe Fund | .81% | | | |
| Actual | | $1,000.00 | $1,082.10 | $4.18 |
| Hypothetical-C | | $1,000.00 | $1,020.78 | $4.06 |
| Class I | .78% | | | |
| Actual | | $1,000.00 | $1,082.30 | $4.03 |
| Hypothetical-C | | $1,000.00 | $1,020.93 | $3.91 |
| Class Z | .68% | | | |
| Actual | | $1,000.00 | $1,083.00 | $3.51 |
| Hypothetical-C | | $1,000.00 | $1,021.42 | $3.41 |
| Fidelity Japan Fund | | | | |
| Class A | 1.32% | | | |
| Actual | | $1,000.00 | $1,045.90 | $6.70 |
| Hypothetical-C | | $1,000.00 | $1,018.25 | $6.61 |
| Class M | 1.64% | | | |
| Actual | | $1,000.00 | $1,044.60 | $8.31 |
| Hypothetical-C | | $1,000.00 | $1,016.66 | $8.20 |
| Class C | 2.00% | | | |
| Actual | | $1,000.00 | $1,042.20 | $10.13 |
| Hypothetical-C | | $1,000.00 | $1,014.88 | $9.99 |
| Japan | 1.00% | | | |
| Actual | | $1,000.00 | $1,048.20 | $5.08 |
| Hypothetical-C | | $1,000.00 | $1,019.84 | $5.01 |
| Class I | .95% | | | |
| Actual | | $1,000.00 | $1,047.60 | $4.82 |
| Hypothetical-C | | $1,000.00 | $1,020.08 | $4.76 |
| Class Z | .86% | | | |
| Actual | | $1,000.00 | $1,047.80 | $4.37 |
| Hypothetical-C | | $1,000.00 | $1,020.53 | $4.31 |
| Fidelity Japan Smaller Companies Fund | .94% | | | |
| Actual | | $1,000.00 | $1,010.80 | $4.69 |
| Hypothetical-C | | $1,000.00 | $1,020.13 | $4.71 |
| Fidelity Latin America Fund | | | | |
| Class A | 1.38% | | | |
| Actual | | $1,000.00 | $1,108.60 | $7.21 |
| Hypothetical-C | | $1,000.00 | $1,017.95 | $6.90 |
| Class M | 1.65% | | | |
| Actual | | $1,000.00 | $1,107.00 | $8.62 |
| Hypothetical-C | | $1,000.00 | $1,016.61 | $8.25 |
| Class C | 2.14% | | | |
| Actual | | $1,000.00 | $1,104.40 | $11.17 |
| Hypothetical-C | | $1,000.00 | $1,014.18 | $10.69 |
| Latin America | 1.07% | | | |
| Actual | | $1,000.00 | $1,110.60 | $5.60 |
| Hypothetical-C | | $1,000.00 | $1,019.49 | $5.36 |
| Class I | 1.02% | | | |
| Actual | | $1,000.00 | $1,110.70 | $5.34 |
| Hypothetical-C | | $1,000.00 | $1,019.74 | $5.11 |
| Class Z | .87% | | | |
| Actual | | $1,000.00 | $1,111.60 | $4.55 |
| Hypothetical-C | | $1,000.00 | $1,020.48 | $4.36 |
| Fidelity Nordic Fund | .99% | | | |
| Actual | | $1,000.00 | $1,036.90 | $5.00 |
| Hypothetical-C | | $1,000.00 | $1,019.89 | $4.96 |
| Fidelity Pacific Basin Fund | .94% | | | |
| Actual | | $1,000.00 | $1,163.00 | $5.04 |
| Hypothetical-C | | $1,000.00 | $1,020.13 | $4.71 |
A Annualized expense ratio reflects expenses net of applicable fee waivers.
B Expenses are equal to each Class' annualized expense ratio, multiplied by the average account value over the period, multiplied by 181/ 365 (to reflect the one-half year period).
C 5% return per year before expenses
Board Approval of Investment Advisory Contracts and Management Fees
Targeted International Equity Funds
Each year, the Board of Trustees, including the Independent Trustees (together, the Board), votes on the renewal of the management contract with Fidelity Management & Research Company (FMR) and the sub-advisory agreements (together, the Advisory Contracts) for each fund. FMR and the sub-advisers are referred to herein as the Investment Advisers. The Board, assisted by the advice of fund counsel and Independent Trustees' counsel, requests and considers a broad range of information relevant to the renewal of the Advisory Contracts throughout the year.
The Board meets regularly and, at each of its meetings, covers an extensive agenda of topics and materials and considers factors that are relevant to its annual consideration of the renewal of each fund's Advisory Contracts, including the services and support provided to each fund and its shareholders. The Board has established various standing committees (Committees), each composed of and chaired by Independent Trustees with varying backgrounds, to which the Board has assigned specific subject matter responsibilities in order to enhance effective decision-making by the Board. The Board, acting directly and through its Committees, requests and receives information concerning the annual consideration of the renewal of each fund's Advisory Contracts. The Board also meets as needed to review matters specifically related to the Board's annual consideration of the renewal of the Advisory Contracts. Members of the Board may also meet with trustees of other Fidelity funds through joint ad hoc committees to discuss certain matters relevant to all of the Fidelity funds.
At its January 2019 meeting, the Board unanimously determined to renew each fund's Advisory Contracts. In reaching its determination, the Board considered all factors it believed relevant, including (i) the nature, extent, and quality of the services to be provided to each fund and its shareholders (including the investment performance of each fund); (ii) the competitiveness of each fund's management fee and total expense ratio relative to peer funds; (iii) the total costs of the services to be provided by and the profits to be realized by Fidelity from its relationships with each fund; and (iv) the extent to which, if any, economies of scale exist and would be realized as each fund grows, and whether any economies of scale are appropriately shared with fund shareholders.
In considering whether to renew the Advisory Contracts for each fund, the Board reached a determination, with the assistance of fund counsel and Independent Trustees' counsel and through the exercise of its business judgment, that the renewal of the Advisory Contracts was in the best interests of each fund and its shareholders and that the compensation payable under the Advisory Contracts was fair and reasonable. The Board's decision to renew the Advisory Contracts was not based on any single factor, but rather was based on a comprehensive consideration of all the information provided to the Board at its meetings throughout the year. The Board, in reaching its determination to renew the Advisory Contracts, was aware that shareholders of each fund have a broad range of investment choices available to them, including a wide choice among funds offered by Fidelity's competitors, and that each fund's shareholders, who have the opportunity to review and weigh the disclosure provided by the fund in its prospectus and other public disclosures, have chosen to invest in that fund, which is part of the Fidelity family of funds.
Nature, Extent, and Quality of Services Provided. The Board considered Fidelity's staffing as it relates to the funds, including the backgrounds of investment personnel of Fidelity, and also considered the funds' investment objectives, strategies, and related investment philosophies. The Independent Trustees also had discussions with senior management of Fidelity's investment operations and investment groups. The Board considered the structure of the investment personnel compensation program and whether this structure provides appropriate incentives to act in the best interests of each fund. Additionally, the Board considered the portfolio managers' investments, if any, in the funds that they manage.
Resources Dedicated to Investment Management and Support Services. The Board and the Fund Oversight and Research Committees reviewed the general qualifications and capabilities of Fidelity's investment staff, including its size, education, experience, and resources, as well as Fidelity's approach to recruiting, training, managing, and compensating investment personnel. The Board noted that Fidelity has continued to increase the resources devoted to non-U.S. offices, including expansion of Fidelity's global investment organization. The Board also noted that Fidelity's analysts have extensive resources, tools and capabilities that allow them to conduct sophisticated quantitative and fundamental analysis, as well as credit analysis of issuers, counterparties and guarantors. Further, the Board considered that Fidelity's investment professionals have sufficient access to global information and data so as to provide competitive investment results over time, and that those professionals also have access to sophisticated tools that permit them to assess portfolio construction and risk and performance attribution characteristics continuously, as well as to transmit new information and research conclusions rapidly around the world. Additionally, in its deliberations, the Board considered Fidelity's trading, risk management, compliance, and technology and operations capabilities and resources, which are integral parts of the investment management process.
Shareholder and Administrative Services. The Board considered (i) the nature, extent, quality, and cost of advisory, administrative, and shareholder services performed by the Investment Advisers and their affiliates under the Advisory Contracts and under separate agreements covering transfer agency, pricing and bookkeeping, and securities lending services for each fund; (ii) the nature and extent of the supervision of third party service providers, principally custodians, subcustodians, and pricing vendors; and (iii) the resources devoted to, and the record of compliance with, each fund's compliance policies and procedures. The Board also reviewed the allocation of fund brokerage, including allocations to brokers affiliated with the Investment Advisers, the use of brokerage commissions to pay fund expenses, and the use of "soft" commission dollars to pay for research services.
The Board noted that the growth of fund assets over time across the complex allows Fidelity to reinvest in the development of services designed to enhance the value and convenience of the Fidelity funds as investment vehicles. These services include 24-hour access to account information and market information through telephone representatives and over the Internet, investor education materials and asset allocation tools, and the expanded availability of Fidelity Investor Centers.
The Board noted that it and the boards of certain other Fidelity funds had formed an ad hoc Committee on Transfer Agency Fees to review the variety of transfer agency fee structures throughout the industry and Fidelity's competitive positioning with respect to industry participants.
Investment in a Large Fund Family. The Board considered the benefits to shareholders of investing in a Fidelity fund, including the benefits of investing in a fund that is part of a large family of funds offering a variety of investment disciplines and providing a large variety of mutual fund investor services. The Board noted that Fidelity had taken, or had made recommendations that resulted in the Fidelity funds taking, a number of actions over the previous year that benefited particular funds, including: (i) continuing to dedicate additional resources to Fidelity's investment research process, which includes meetings with management of issuers of securities in which the funds invest, and to the support of the senior management team that oversees asset management; (ii) continuing efforts to enhance Fidelity's global research capabilities; (iii) launching new funds and making other enhancements to meet client needs; (iv) launching new share classes of existing funds; (v) eliminating purchase minimums and broadening eligibility requirements for certain funds and share classes; (vi) reducing management fees and total expenses for certain growth equity funds and index funds; (vii) lowering expense caps for certain existing funds and classes, and converting certain voluntary expense caps to contractual caps, to reduce expenses borne by shareholders; (viii) eliminating short-term redemption fees for funds that had such fees; (ix) rationalizing product lines and gaining increased efficiencies from fund mergers and share class consolidations; (x) continuing to develop, acquire and implement systems and technology to improve services to the funds and shareholders, strengthen information security, and increase efficiency; and (xi) continuing to implement enhancements to further strengthen Fidelity's product line to increase investors' probability of success in achieving their investment goals, including retirement income goals.
Investment Performance. The Board considered whether each fund has operated in accordance with its investment objective, as well as its record of compliance with its investment restrictions and its performance history. Fidelity Canada Fund had a portfolio manager change in July 2018. Fidelity China Region Fund had a portfolio manager change in June 2018. Fidelity Emerging Asia Fund had a portfolio manager change in September 2016 and December 2016. Fidelity Europe Fund had a portfolio manager change in August 2018. Fidelity Latin America Fund had a portfolio manager change in October 2015 and December 2015. Fidelity Nordic Fund had a portfolio manager change in August 2018. The Board will continue to monitor closely each fund's performance, taking into account the portfolio manager changes.
The Board took into account discussions that occur at Board meetings throughout the year with representatives of the Investment Advisers about fund investment performance. In this regard the Board noted that as part of regularly scheduled fund reviews and other reports to the Board on fund performance, the Board considers annualized return information for each fund for different time periods, measured against an appropriate securities market index ("benchmark index") and a peer group of funds with similar objectives ("peer group"), if any. In its evaluation of fund investment performance, the Board gave particular attention to information indicating changes in performance of certain Fidelity funds for specific time periods and discussed with the Investment Advisers the reasons for any overperformance or underperformance.
In addition to reviewing absolute and relative fund performance, the Independent Trustees periodically consider the appropriateness of fund performance metrics in evaluating the results achieved. In general, the Independent Trustees believe that fund performance should be evaluated based on net performance (after fees and expenses) of both the highest performing and lowest performing fund share classes, where applicable, compared to appropriate benchmark indices, over appropriate time periods that may include full market cycles, and compared to peer groups, as applicable, over the same periods, taking into account relevant factors including the following: general market conditions; issuer-specific information; and fund cash flows and other factors.
The Independent Trustees recognize that shareholders evaluate performance on a net basis over their own holding periods, for which one-, three-, and five-year periods are often used as a proxy. For this reason, the performance information reviewed by the Board also included net cumulative total return information for each fund and an appropriate benchmark index and peer group for the most recent one-, three-, and five-year periods ended June 30, 2018, as shown below. For Fidelity Emerging Markets Fund, Fidelity Europe Fund, and Fidelity Japan Fund, returns are shown compared to the 25th percentile (top of box, 75% beaten) and 75th percentile (bottom of box, 25% beaten) of the peer universe. For Fidelity Canada Fund, Fidelity China Region Fund, Fidelity Emerging Asia Fund, Fidelity Japan Smaller Companies Fund, Fidelity Latin America Fund, Fidelity Nordic Fund, and Fidelity Pacific Basin Fund, a peer group is not shown below because the funds do not generally utilize a peer group for performance comparison purposes. For Fidelity Emerging Asia Fund, Fidelity Europe Fund, and Fidelity Pacific Basin Fund, returns of the benchmark index are "net MA,"
i.e., adjusted for tax withholding rates applicable to U.S.-based funds organized as Massachusetts business trusts.
Fidelity Canada Fund
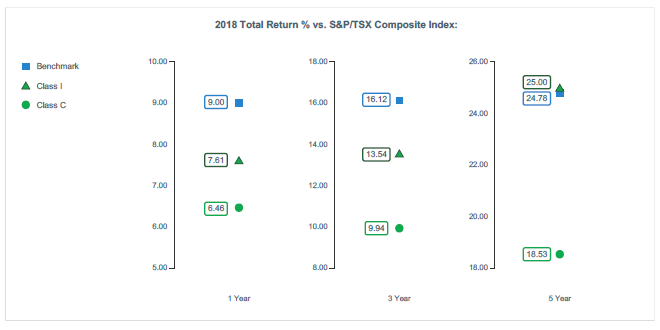
Fidelity China Region Fund

Fidelity Emerging Asia Fund

Fidelity Emerging Markets Fund

Fidelity Europe Fund

The Board considered the fund's underperformance for different time periods based on the June 30, 2018 data presented above. The Board's discussions with FMR regarding underperformance cover topics including, but not limited to: the longer-term track record of a fund's portfolio manager(s); broader trends in the market that may adversely impact a fund's performance; attribution reports on contributors to the fund's underperformance; and the applicable portfolio manager's explanation of his or her underperformance. The Board engages with FMR on steps that might be taken to address a fund's underperformance.
Fidelity Japan Fund
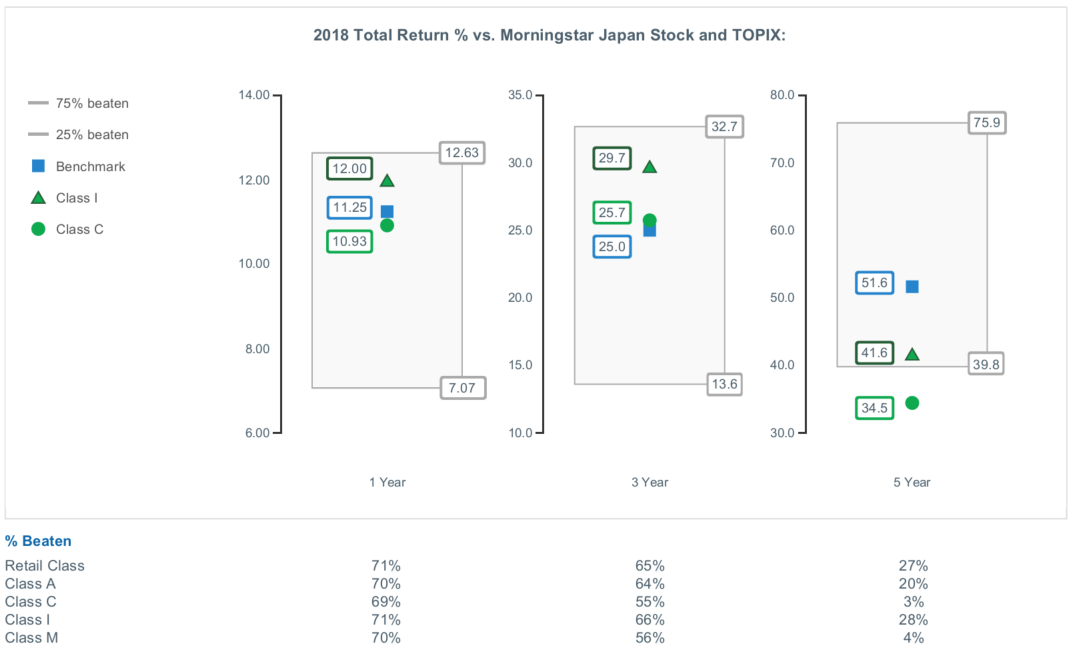
Fidelity Japan Smaller Companies Fund

Fidelity Latin America Fund

The Board considered the fund's underperformance for different time periods based on the June 30, 2018 data presented above and noted that the fund's underperformance has continued since the Board approved the management contract in 2016 and 2017. The Board's discussions with FMR regarding underperformance cover topics including, but not limited to: the longer-term track record of a fund's portfolio manager(s); broader trends in the market that may adversely impact a fund's performance; attribution reports on contributors to the fund's underperformance; and the applicable portfolio manager's explanation of his or her underperformance. The Board engages with FMR on steps that might be taken to address a fund's underperformance. For a fund with underperformance over longer periods of time, the Board typically monitors the effect of any remedial actions and other relevant factors.
Fidelity Nordic Fund

Fidelity Pacific Basin Fund
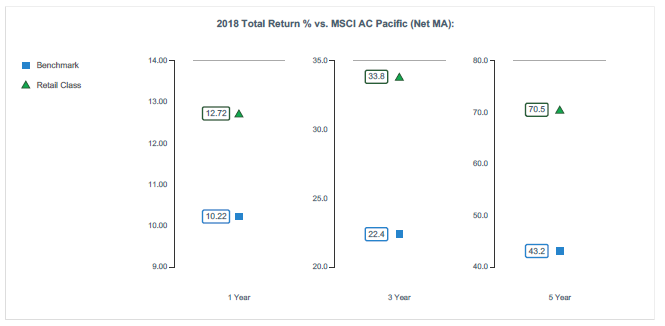
The Board also considered that each of Fidelity Canada Fund's, Fidelity Emerging Asia Fund's, Fidelity Europe Fund's, Fidelity Japan Fund's, and Fidelity Pacific Basin Fund's management fee is subject to upward or downward adjustment depending upon whether, and to what extent, the fund's investment performance for the performance period (a rolling 36-month period) exceeds, or is exceeded by, a securities index, thus leading to a performance adjustment for the same period. The Board noted that the performance adjustment provides FMR with a strong economic incentive to seek to achieve superior long-term performance for each fund's shareholders and helps to more closely align the interests of FMR and the shareholders of each fund.
Based on its review, the Board concluded that the nature, extent, and quality of services provided to each fund under the Advisory Contracts should continue to benefit the shareholders of each fund.
Competitiveness of Management Fee and Total Expense Ratio. The Board considered each fund's management fee and total expense ratio compared to "mapped groups" of competitive funds and classes created for the purpose of facilitating the Trustees' competitive analysis of management fees and total expenses. Fidelity creates "mapped groups" by combining similar Lipper investment objective categories that have comparable investment mandates. Combining Lipper investment objective categories aids the Board's management fee and total expense ratio comparisons by broadening the competitive group used for comparison.
Management Fee. The Board considered two proprietary management fee comparisons for the 12-month periods (ended June 30 for 2018 and December 31 for prior periods) shown in basis points (BP) in the charts below. The group of Lipper funds used by the Board for management fee comparisons is referred to below as the "Total Mapped Group." The Total Mapped Group comparison focuses on a fund's standing in terms of gross management fees before expense reimbursements or caps, and without giving effect to a fund's performance adjustment (if applicable), relative to the total universe of funds with comparable investment mandates, regardless of whether their management fee structures also are comparable. Funds with comparable investment mandates offer exposure to similar types of securities. Funds with comparable management fee structures have similar management fee contractual arrangements (
e.g., flat rate charged for advisory services, all-inclusive fee rate,
etc.). "TMG %" represents the percentage of funds in the Total Mapped Group that had management fees that were lower than a fund's. For example, a hypothetical TMG % of 20% would mean that 80% of the funds in the Total Mapped Group had higher, and 20% had lower, management fees than a fund. The funds' actual TMG %s and the number of funds in the Total Mapped Group are in the charts below. The "Asset-Size Peer Group" (ASPG) comparison focuses on a fund's standing relative to a subset of non-Fidelity funds within the Total Mapped Group that are similar in size and management fee structure without taking into account performance adjustments, if any. For example, if a fund is in the first quartile of the ASPG, the fund's management fee ranks in the least expensive or lowest 25% of funds in the ASPG. The ASPG represents at least 15% of the funds in the Total Mapped Group with comparable asset size and management fee structures, subject to a minimum of 50 funds (or all funds in the Total Mapped Group if fewer than 50). Additional information, such as the ASPG quartile in which a fund's management fee rate ranked and the impact of a fund's performance adjustment (if applicable), is also included in the charts and was considered by the Board.
Fidelity Canada Fund

The Board noted that the fund's management fee rate ranked below the median of its Total Mapped Group and below the median of its ASPG for the 12-month period ended June 30, 2018. The Board also noted the effect of the fund's performance adjustment, if any, on the fund's management fee ranking.
Fidelity China Region Fund
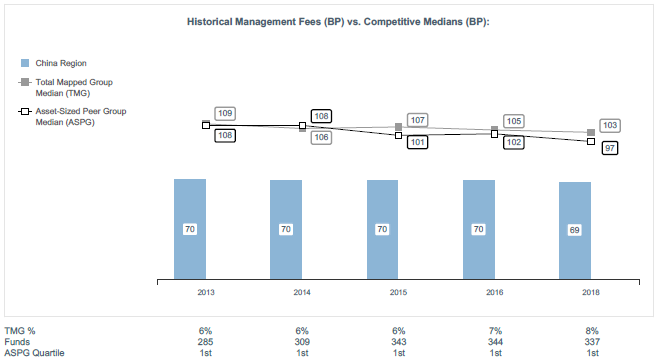
The Board noted that the fund's management fee rate ranked below the median of its Total Mapped Group and below the median of its ASPG for the 12-month period ended June 30, 2018.
Fidelity Emerging Asia Fund
The Board considered that shareholders of Fidelity Emerging Asia Fund approved a prospective change in the index used to calculate the fund’s performance adjustment, beginning December 1, 2010. The Board also considered that, because the performance adjustment is based on a rolling 36-month measurement period, during a transition period the fund’s performance is compared to a blended index return that reflects the performance of the former index for the portion of the measurement period prior to December 1, 2010 and the performance of the current index for the remainder of the measurement period. The Board noted that the fund’s performance adjustment for 2013 shown in the chart below reflects the effect of using the blended index return to calculate the fund’s performance adjustment.

The Board noted that the fund’s management fee rate ranked below the median of its Total Mapped Group and below the median of its ASPG for the 12-month period ended June 30, 2018. The Board also noted the effect of the fund’s performance adjustment, if any, on the fund’s management fee ranking.
Fidelity Emerging Markets Fund
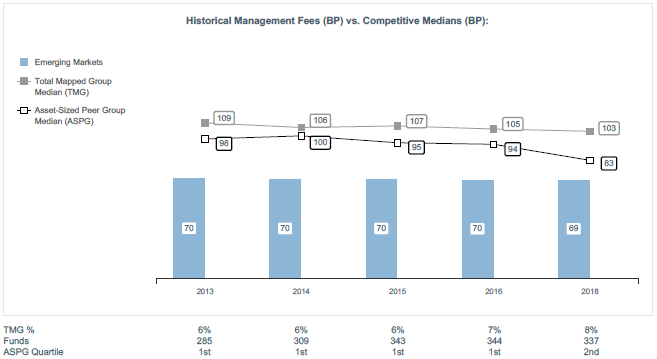
The Board noted that the fund’s management fee rate ranked below the median of its Total Mapped Group and below the median of its ASPG for the 12-month period ended June 30, 2018.
Fidelity Europe Fund
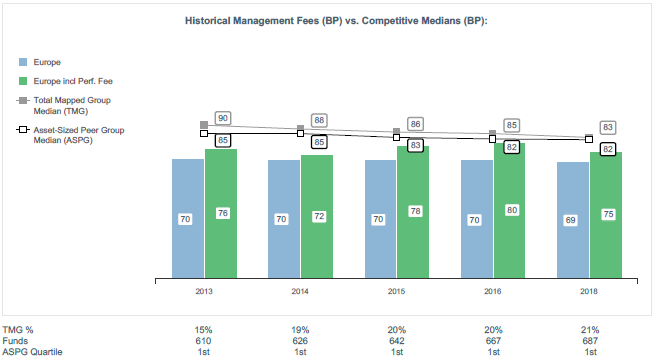
The Board noted that the fund’s management fee rate ranked below the median of its Total Mapped Group and below the median of its ASPG for the 12-month period ended June 30, 2018. The Board also noted the effect of the fund’s performance adjustment, if any, on the fund’s management fee ranking.
Fidelity Japan Fund
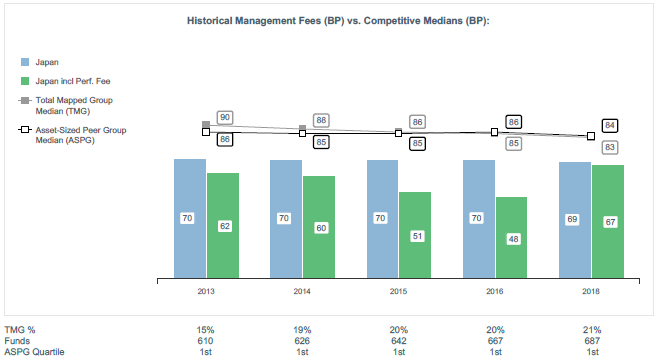
The Board noted that the fund’s management fee rate ranked below the median of its Total Mapped Group and below the median of its ASPG for the 12-month period ended June 30, 2018. The Board also noted the effect of the fund’s performance adjustment, if any, on the fund’s management fee ranking.
Fidelity Japan Smaller Companies Fund

The Board noted that the fund’s management fee rate ranked below the median of its Total Mapped Group and below the median of its ASPG for the 12-month period ended June 30, 2018.
Fidelity Latin America Fund

The Board noted that the fund’s management fee rate ranked below the median of its Total Mapped Group and below the median of its ASPG for the 12-month period ended June 30, 2018.
Fidelity Nordic Fund

The Board noted that the fund’s management fee rate ranked below the median of its Total Mapped Group and below the median of its ASPG for the 12-month period ended June 30, 2018.
Fidelity Pacific Basin Fund
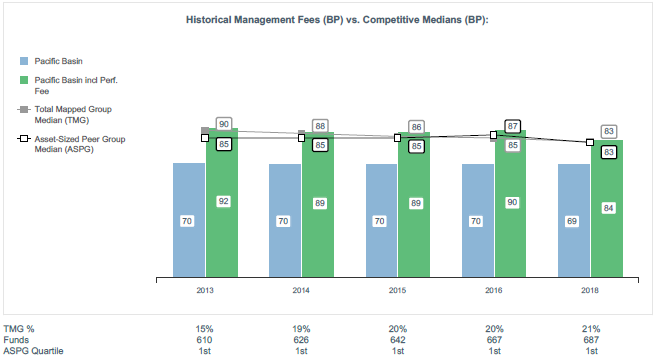
The Board noted that the fund’s management fee rate ranked below the median of its Total Mapped Group and below the median of its ASPG for the 12-month period ended June 30, 2018. The Board also noted the effect of the fund’s performance adjustment, if any, on the fund’s management fee ranking.
The Board noted that it and the boards of other Fidelity funds formed an ad hoc Committee on Group Fee, which meets periodically, to conduct an in-depth review of the "group fee" component of the management fee of funds with such management fee structures. The Committee's focus included the mechanics of the group fee, the competitive landscape of group fee structures, Fidelity funds with no group fee component and investment products not included in group fee assets. The Board also considered that, for funds subject to the group fee, FMR agreed to voluntarily waive fees over a specified period of time in amounts designed to account for assets converted from certain funds to certain collective investment trusts.
The Board also noted that, in 2013, the ad hoc Committee on Management Fees was formed to conduct an in-depth review of the management fee rates of Fidelity's active equity mutual funds. The Committee focused on the following areas: (i) standard fee structures; (ii) research consumption and trading evolution; (iii) management fee competitiveness/profitability by category; and (iv) factors that drive institutional pricing.
Based on its review, the Board concluded that each fund's management fee is fair and reasonable in light of the services that the fund receives and the other factors considered.
Total Expense Ratio (for Fidelity Canada Fund, Fidelity China Region Fund, Fidelity Emerging Markets Fund, Fidelity Europe Fund, Fidelity Japan Fund, and Fidelity Latin America Fund). In its review of the total expense ratio of each class of each fund, the Board considered the fund's management fee rate as well as other fund or class expenses, as applicable, such as transfer agent fees, pricing and bookkeeping fees, fund-paid 12b-1 fees, and custodial, legal, and audit fees. The Board noted the impact of Fidelity Canada Fund's, Fidelity Europe Fund's, and Fidelity Japan Fund's performance adjustment. The Board also noted that Fidelity may agree to waive fees and expenses from time to time, and the extent to which, if any, it has done so for each fund. As part of its review, the Board also considered the current and historical total expense ratios of each class of each fund compared to competitive fund median expenses. Each class of each fund is compared to those funds and classes in the Total Mapped Group (used by the Board for management fee comparisons) that have a similar sales load structure.
The Board noted that the funds offer multiple classes, each of which has a different sales load and 12b-1 fee structure, and that the multiple structures are intended to offer a range of pricing options for the intermediary market. The Board also noted that the total expense ratios of the classes of each fund vary primarily by the level of their 12b-1 fees, although differences in transfer agent fees may also cause expenses to vary from class to class.
For Fidelity Europe Fund, the Board noted that the total expense ratio of the retail class ranked below the competitive median for the 12-month period ended June 30, 2018, and the total expense ratio of each of Class A, Class M, Class C, and Class I ranked above the competitive median for the 12-month period ended June 30, 2018. The Board considered that, in general, various factors can affect total expense ratios. The Board noted that the total expense ratio of Class A was above the competitive median because of positive performance fees. Excluding performance fees, the total expense ratio of Class A ranked below the median. The Board noted that the total expense ratio of Class M was above the competitive median primarily because of higher 12b-1 fees on Class M as compared to most competitor funds. Class M has a higher 12b-1 fee, but a lower front-end sales charge, than traditionally priced front-end sales charge classes. The Board considered that Class M is primarily sold load-waived to retirement plans and intermediary wrap programs where its 0.50% 12b-1 fee is comparable to competing no-load, higher 12b-1 fee classes designed specifically for retirement plans and wrap programs. The Board noted that the total expense ratio of Class C was above the competitive median primarily because of its 1.00% 12b-1 fee. The Board noted that, although Class I is categorized by Lipper as an institutional class, Class I has a significantly lower investment minimum than most other funds and classes categorized as institutional. As a result, FMR believes Class I is generally more comparable to retail funds and classes.
For Fidelity Canada Fund, the Board noted that the total expense ratio of each of Class A, Class I, and the retail class ranked below the competitive median for the 12-month period ended June 30, 2018, the total expense ratio of Class C ranked equal to the competitive median for the 12-month period ended June 30, 2018, and the total expense ratio of Class M ranked above the competitive median for the 12-month period ended June 30, 2018. The Board considered that, in general, various factors can affect total expense ratios. The Board noted that the total expense ratio of Class M was above the competitive median primarily because of higher 12b-1 fees on Class M as compared to most competitor funds. Class M has a higher 12b-1 fee, but a lower front-end sales charge, than traditionally priced front-end sales charge classes. The Board considered that Class M is primarily sold load-waived to retirement plans and intermediary wrap programs where its 0.50% 12b-1 fee is comparable to competing no-load, higher 12b-1 fee classes designed specifically for retirement plans and wrap programs.
For each of Fidelity China Region Fund, Fidelity Japan Fund, and Fidelity Latin America Fund, the Board noted that the total expense ratio of each of Class A, Class C, Class I, and the retail class ranked below the competitive median for the 12-month period ended June 30, 2018, and the total expense ratio of Class M ranked above the competitive median for the 12-month period ended June 30, 2018. The Board considered that, in general, various factors can affect total expense ratios. The Board noted that the total expense ratio of Class M was above the competitive median primarily because of higher 12b-1 fees on Class M as compared to most competitor funds. Class M has a higher 12b-1 fee, but a lower front-end sales charge, than traditionally priced front-end sales charge classes. The Board considered that Class M is primarily sold load-waived to retirement plans and intermediary wrap programs where its 0.50% 12b-1 fee is comparable to competing no-load, higher 12b-1 fee classes designed specifically for retirement plans and wrap programs. For each of Fidelity China Region Fund and Fidelity Latin America Fund, the Board noted that, when compared with competitor funds that charge a 0.50% 12b-1 fee, the total expense ratio of Class M is below median.
The Board noted that the total expense ratio of each class of Fidelity Emerging Markets Fund ranked below the competitive median for the 12-month period ended June 30, 2018.
Total Expense Ratio (for Fidelity Emerging Asia Fund, Fidelity Japan Smaller Companies Fund, Fidelity Nordic Fund, and Fidelity Pacific Basin Fund). In its review of each fund's total expense ratio, the Board considered the fund's management fee rate as well as other fund expenses, such as transfer agent fees, pricing and bookkeeping fees, and custodial, legal, and audit fees. The Board noted the impact of Fidelity Emerging Asia Fund's and Fidelity Pacific Basin Fund's performance adjustment. The Board also noted that Fidelity may agree to waive fees and expenses from time to time, and the extent to which, if any, it has done so for each fund. As part of its review, the Board also considered the current and historical total expense ratios of each fund compared to competitive fund median expenses. Each fund is compared to those funds and classes in the Total Mapped Group (used by the Board for management fee comparisons) that have a similar sales load structure.
The Board noted that the total expense ratio of each of Fidelity Emerging Asia Fund, Fidelity Japan Smaller Companies Fund, Fidelity Nordic Fund, and Fidelity Pacific Basin Fund ranked below the competitive median for the 12-month period ended June 30, 2018.
Fees Charged to Other Fidelity Clients. The Board also considered Fidelity fee structures and other information with respect to clients of Fidelity, such as other funds advised or subadvised by Fidelity, pension plan clients, and other institutional clients with similar mandates. The Board noted that a joint ad hoc committee created by it and the boards of other Fidelity funds periodically reviews and compares Fidelity's institutional investment advisory business with its business of providing services to the Fidelity funds and also noted the most recent findings of the committee. The Board noted that the committee's review included a consideration of the differences in services provided, fees charged, and costs incurred, as well as competition in the markets serving the different categories of clients.
Based on its review of total expense ratios and fees charged to other Fidelity clients, the Board concluded that the total expense ratio of each fund or each class of each fund, as applicable, was reasonable in light of the services that the fund and its shareholders receive and the other factors considered.
Costs of the Services and Profitability. The Board considered the revenues earned and the expenses incurred by Fidelity in conducting the business of developing, marketing, distributing, managing, administering and servicing each fund and servicing each fund's shareholders. The Board also considered the level of Fidelity's profits in respect of all the Fidelity funds.
On an annual basis, Fidelity presents to the Board information about the profitability of its relationships with each fund. Fidelity calculates profitability information for each fund, as well as aggregate profitability information for groups of Fidelity funds and all Fidelity funds, using a series of detailed revenue and cost allocation methodologies which originate with the books and records of Fidelity on which Fidelity's audited financial statements are based. The Audit Committee of the Board reviews any significant changes from the prior year's methodologies.
PricewaterhouseCoopers LLP (PwC), auditor to Fidelity and certain Fidelity funds, has been engaged annually by the Board as part of the Board's assessment of Fidelity's profitability analysis. PwC's engagement includes the review and assessment of the methodologies used by Fidelity in determining the revenues and expenses attributable to Fidelity's mutual fund business, and completion of agreed-upon procedures in respect of the mathematical accuracy of the fund profitability information and its conformity to established allocation methodologies. After considering PwC's reports issued under the engagement and information provided by Fidelity, the Board concluded that while other allocation methods may also be reasonable, Fidelity's profitability methodologies are reasonable in all material respects.
The Board also reviewed Fidelity's non-fund businesses and potential indirect benefits such businesses may have received as a result of their association with Fidelity's mutual fund business (i.e., fall-out benefits) as well as cases where Fidelity's affiliates may benefit from the funds' business. The Board noted that changes to fall-out benefits year-over-year reflect business developments at Fidelity's various businesses.
The Board considered the costs of the services provided by and the profits realized by Fidelity in connection with the operation of each fund and was satisfied that the profitability was not excessive.
Economies of Scale. The Board considered whether there have been economies of scale in respect of the management of the Fidelity funds, whether the Fidelity funds (including each fund) have appropriately benefited from any such economies of scale, and whether there is potential for realization of any further economies of scale. The Board considered the extent to which each fund will benefit from economies of scale as assets grow through increased services to the fund, through waivers or reimbursements, or through fee or expense ratio reductions. The Board also noted that a committee (the Economies of Scale Committee) created by it and the boards of other Fidelity funds periodically analyzes whether Fidelity attains economies of scale in respect of the management and servicing of the Fidelity funds, whether the Fidelity funds have appropriately benefited from such economies of scale, and whether there is potential for realization of any further economies of scale.
The Board recognized that each fund's management contract incorporates a "group fee" structure, which provides for lower group fee rates as total group assets increase, and for higher group fee rates as total group assets decrease (with "group assets" defined to include fund assets under FMR's management plus the assets of sector funds previously under FMR's management). FMR calculates the group fee rates based on a tiered asset "breakpoint" schedule that varies based on asset class. The Board considered that the group fee is designed to deliver the benefits of economies of scale to fund shareholders when total Fidelity fund assets increase, even if assets of any particular fund are unchanged or have declined, because some portion of Fidelity's costs are attributable to services provided to all Fidelity funds, and all funds benefit if those costs can be allocated among more assets. The Board concluded that, given the group fee structure, fund shareholders will benefit from lower management fees as group assets increase at the fund complex level, regardless of whether Fidelity achieves any such economies of scale.
The Board concluded, taking into account the analysis of the Economies of Scale Committee, that economies of scale, if any, are being appropriately shared between fund shareholders and Fidelity.
Additional Information Requested by the Board. In order to develop fully the factual basis for consideration of the Fidelity funds' advisory contracts, the Board requested and received additional information on certain topics, including: (i) fund performance trends, in particular the underperformance of certain funds, and Fidelity's long-term strategies for certain funds; (ii) Fidelity's fund profitability methodology, profitability trends for certain funds, and the impact of certain factors on fund profitability results; (iii) metrics for evaluating index fund and ETF performance and information about ETF trading characteristics; (iv) the methodology with respect to the evaluation of competitive fund data and peer group classifications and fee comparisons; (v) the expense structures for different funds and classes; (vi) information regarding other accounts managed by Fidelity, including collective investment trusts; and (vii) Fidelity's philosophies and strategies for evaluating funds and classes with lower or declining asset levels.
Based on its evaluation of all of the conclusions noted above, and after considering all factors it believed relevant, the Board concluded that the advisory fee arrangements are fair and reasonable, and that each fund's Advisory Contracts should be renewed.
TIF-SANN-0619
1.703611.121
Fidelity Flex℠ Funds Fidelity Flex℠ International Fund
Semi-Annual Report April 30, 2019 |
|
Beginning on January 1, 2021, as permitted by regulations adopted by the Securities and Exchange Commission, paper copies of a fund’s shareholder reports will no longer be sent by mail, unless you specifically request paper copies of the reports from the fund or from your financial intermediary, such as a financial advisor, broker-dealer or bank. Instead, the reports will be made available on a website, and you will be notified by mail each time a report is posted and provided with a website link to access the report.
If you already elected to receive shareholder reports electronically, you will not be affected by this change and you need not take any action. You may elect to receive shareholder reports and other communications from a fund electronically, by contacting your financial intermediary. For Fidelity customers, visit Fidelity's web site or call Fidelity using the contact information listed below.
You may elect to receive all future reports in paper free of charge. If you wish to continue receiving paper copies of your shareholder reports, you may contact your financial intermediary or, if you are a Fidelity customer, visit Fidelity’s website, or call Fidelity at the applicable toll-free number listed below. Your election to receive reports in paper will apply to all funds held with the fund complex/your financial intermediary.
| Account Type | Website | Phone Number |
| Brokerage, Mutual Fund, or Annuity Contracts: | fidelity.com/mailpreferences | 1-800-343-3548 |
| Employer Provided Retirement Accounts: | netbenefits.fidelity.com/preferences (choose 'no' under Required Disclosures to continue to print) | 1-800-343-0860 |
| Advisor Sold Accounts Serviced Through Your Financial Intermediary: | Contact Your Financial Intermediary | Your Financial Intermediary's phone number |
| Advisor Sold Accounts Serviced by Fidelity: | institutional.fidelity.com | 1-877-208-0098 |
Contents
To view a fund's proxy voting guidelines and proxy voting record for the 12-month period ended June 30, visit http://www.fidelity.com/proxyvotingresults or visit the Securities and Exchange Commission's (SEC) web site at http://www.sec.gov.
You may also call 1-800-544-3455 (for managed account clients) or 1-800-835-5092 (for retirement plan participants) to request a free copy of the proxy voting guidelines.
The funds or securities referred to herein are not sponsored, endorsed, or promoted by MSCI, and MSCI bears no liability with respect to any such funds or securities or any index on which such funds or securities are based. The prospectus contains a more detailed description of the limited relationship MSCI has with Fidelity and any related funds.
Standard & Poor's, S&P and S&P 500 are registered service marks of The McGraw-Hill Companies, Inc. and have been licensed for use by Fidelity Distributors Corporation.
Other third-party marks appearing herein are the property of their respective owners.
All other marks appearing herein are registered or unregistered trademarks or service marks of FMR LLC or an affiliated company. © 2019 FMR LLC. All rights reserved.
This report and the financial statements contained herein are submitted for the general information of the shareholders of the Fund. This report is not authorized for distribution to prospective investors in the Fund unless preceded or accompanied by an effective prospectus.
A fund files its complete schedule of portfolio holdings with the SEC for the first and third quarters of each fiscal year on Form N-PORT. Forms N-PORT are available on the SEC’s web site at http://www.sec.gov. A fund's Forms N-PORT may be reviewed and copied at the SEC’s Public Reference Room in Washington, DC. Information regarding the operation of the SEC's Public Reference Room may be obtained by calling 1-800-SEC-0330.
For a complete list of a fund's portfolio holdings, view the most recent holdings listing, semiannual report, or annual report on Fidelity's web site at http://www.fidelity.com, http://www.institutional.fidelity.com, or http://www.401k.com, as applicable.
NOT FDIC INSURED •MAY LOSE VALUE •NO BANK GUARANTEE
Neither the Fund nor Fidelity Distributors Corporation is a bank.
Investment Summary (Unaudited)
Geographic Diversification (% of fund's net assets)
| As of April 30, 2019 |
| | Japan | 13.9% |
| | United States of America* | 10.3% |
| | United Kingdom | 8.5% |
| | France | 6.6% |
| | Canada | 6.3% |
| | Germany | 5.7% |
| | Switzerland | 4.6% |
| | Cayman Islands | 4.6% |
| | Brazil | 3.4% |
| | Other | 36.1% |
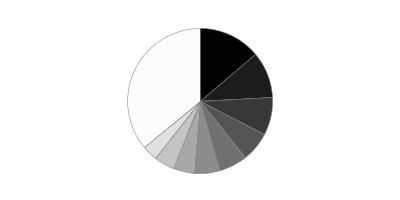
* Includes Short-Term investments and Net Other Assets (Liabilities).
Percentages are based on country or territory of incorporation and are adjusted for the effect of futures contracts, if applicable.
Asset Allocation as of April 30, 2019
| | % of fund's net assets |
| Stocks | 97.9 |
| Short-Term Investments and Net Other Assets (Liabilities) | 2.1 |
Top Ten Stocks as of April 30, 2019
| | % of fund's net assets |
| Alibaba Group Holding Ltd. sponsored ADR (Cayman Islands, Internet & Direct Marketing Retail) | 2.0 |
| Tencent Holdings Ltd. (Cayman Islands, Interactive Media & Services) | 1.8 |
| Taiwan Semiconductor Manufacturing Co. Ltd. (Taiwan, Semiconductors & Semiconductor Equipment) | 1.7 |
| Nestle SA (Reg. S) (Switzerland, Food Products) | 1.7 |
| SAP SE (Germany, Software) | 1.5 |
| Naspers Ltd. Class N (South Africa, Internet & Direct Marketing Retail) | 1.3 |
| AIA Group Ltd. (Hong Kong, Insurance) | 1.3 |
| Keyence Corp. (Japan, Electronic Equipment & Components) | 1.3 |
| ASML Holding NV (Netherlands) (Netherlands, Semiconductors & Semiconductor Equipment) | 1.3 |
| MasterCard, Inc. Class A (United States of America, IT Services) | 1.1 |
| | 15.0 |
Top Market Sectors as of April 30, 2019
| | % of fund's net assets |
| Financials | 23.1 |
| Information Technology | 16.0 |
| Industrials | 14.0 |
| Consumer Discretionary | 9.6 |
| Materials | 8.5 |
| Health Care | 6.9 |
| Consumer Staples | 6.9 |
| Energy | 5.7 |
| Communication Services | 4.7 |
| Real Estate | 1.7 |
Schedule of Investments April 30, 2019 (Unaudited)
Showing Percentage of Net Assets
| Common Stocks - 96.6% | | | |
| | | Shares | Value |
| Australia - 2.1% | | | |
| Beacon Lighting Group Ltd. | | 4,875 | $3,566 |
| Commonwealth Bank of Australia | | 4,120 | 216,435 |
| CSL Ltd. | | 2,874 | 402,308 |
| Imdex Ltd. | | 6,728 | 4,933 |
| Insurance Australia Group Ltd. | | 15,258 | 84,758 |
| Macquarie Group Ltd. | | 1,178 | 111,859 |
|
| TOTAL AUSTRALIA | | | 823,859 |
|
| Austria - 0.6% | | | |
| Andritz AG | | 2,778 | 132,422 |
| Erste Group Bank AG | | 2,373 | 95,018 |
|
| TOTAL AUSTRIA | | | 227,440 |
|
| Bailiwick of Jersey - 0.9% | | | |
| Experian PLC | | 4,389 | 127,759 |
| Glencore Xstrata PLC | | 40,618 | 161,154 |
| Integrated Diagnostics Holdings PLC (a) | | 2,590 | 12,562 |
| WPP PLC | | 2,975 | 37,121 |
|
| TOTAL BAILIWICK OF JERSEY | | | 338,596 |
|
| Belgium - 0.7% | | | |
| Barco NV | | 109 | 19,365 |
| KBC Ancora | | 733 | 37,325 |
| KBC Groep NV | | 2,999 | 222,070 |
|
| TOTAL BELGIUM | | | 278,760 |
|
| Bermuda - 0.3% | | | |
| Credicorp Ltd. (United States) | | 494 | 117,029 |
| Brazil - 2.5% | | | |
| Atacadao Distribuicao Comercio e Industria Ltda | | 10,633 | 57,489 |
| BM&F BOVESPA SA | | 19,800 | 173,959 |
| Equatorial Energia SA | | 4,700 | 98,409 |
| Itau Unibanco Holding SA | | 1,450 | 10,853 |
| Localiza Rent A Car SA | | 7,715 | 71,226 |
| Lojas Renner SA | | 10,200 | 121,949 |
| Natura Cosmeticos SA | | 4,902 | 65,308 |
| Notre Dame Intermedica Participacoes SA | | 5,126 | 45,912 |
| Rumo SA (b) | | 16,718 | 77,171 |
| Suzano Papel e Celulose SA | | 8,000 | 83,099 |
| Vale SA sponsored ADR | | 13,997 | 178,882 |
|
| TOTAL BRAZIL | | | 984,257 |
|
| Canada - 6.3% | | | |
| Alimentation Couche-Tard, Inc. Class B (sub. vtg.) | | 5,101 | 300,760 |
| Canadian National Railway Co. | | 4,006 | 372,103 |
| Canadian Pacific Railway Ltd. | | 1,281 | 287,018 |
| CCL Industries, Inc. Class B | | 3,807 | 162,402 |
| Constellation Software, Inc. | | 321 | 283,231 |
| Franco-Nevada Corp. | | 2,308 | 165,369 |
| McCoy Global, Inc. (b) | | 50 | 30 |
| New Look Vision Group, Inc. | | 397 | 9,145 |
| Nutrien Ltd. | | 5,189 | 281,431 |
| Pason Systems, Inc. | | 5,726 | 85,268 |
| PrairieSky Royalty Ltd. | | 5,299 | 76,378 |
| ShawCor Ltd. Class A | | 350 | 5,194 |
| Suncor Energy, Inc. | | 4,531 | 149,421 |
| The Toronto-Dominion Bank | | 4,600 | 262,396 |
|
| TOTAL CANADA | | | 2,440,146 |
|
| Cayman Islands - 4.6% | | | |
| Alibaba Group Holding Ltd. sponsored ADR (b) | | 4,067 | 754,712 |
| New Oriental Education & Technology Group, Inc. sponsored ADR (b) | | 1,377 | 131,448 |
| Shenzhou International Group Holdings Ltd. | | 9,500 | 127,518 |
| TAL Education Group ADR (b) | | 1,980 | 76,171 |
| Tencent Holdings Ltd. | | 13,800 | 680,170 |
|
| TOTAL CAYMAN ISLANDS | | | 1,770,019 |
|
| Chile - 0.4% | | | |
| Banco Santander Chile sponsored ADR | | 3,310 | 92,680 |
| Sociedad Quimica y Minera de Chile SA (PN-B) sponsored ADR (c) | | 1,359 | 48,435 |
|
| TOTAL CHILE | | | 141,115 |
|
| China - 3.1% | | | |
| Foshan Haitian Flavouring & Food Co. Ltd. (A Shares) | | 7,800 | 103,399 |
| Inner Mongoli Yili Industries Co. Ltd. (A Shares) | | 21,400 | 98,502 |
| Jiangsu Yanghe Brewery JSC Ltd. (A Shares) | | 5,912 | 103,284 |
| Kweichow Moutai Co. Ltd. (A Shares) | | 900 | 130,158 |
| Midea Group Co. Ltd. (A Shares) | | 14,200 | 110,481 |
| Ping An Insurance (Group) Co. of China Ltd. (H Shares) | | 27,000 | 326,826 |
| Shanghai International Airport Co. Ltd. (A Shares) | | 10,800 | 113,261 |
| Shenzhen Inovance Technology Co. Ltd. (A Shares) | | 25,000 | 93,431 |
| Wuliangye Yibin Co. Ltd. (A Shares) | | 8,000 | 121,588 |
| Zhejiang Sanhua Intelligent Controls Co. Ltd. (A Shares) | | 4,400 | 10,388 |
|
| TOTAL CHINA | | | 1,211,318 |
|
| Denmark - 0.5% | | | |
| A.P. Moller - Maersk A/S Series B | | 56 | 72,189 |
| Jyske Bank A/S (Reg.) | | 1,336 | 53,811 |
| Netcompany Group A/S (a) | | 300 | 10,700 |
| SimCorp A/S | | 204 | 19,998 |
| Spar Nord Bank A/S | | 2,222 | 19,094 |
|
| TOTAL DENMARK | | | 175,792 |
|
| Finland - 0.6% | | | |
| Nokia Corp. | | 18,130 | 95,266 |
| Sampo Oyj (A Shares) | | 2,453 | 112,318 |
| Tikkurila Oyj | | 1,912 | 31,996 |
|
| TOTAL FINLAND | | | 239,580 |
|
| France - 6.6% | | | |
| Atos Origin SA | | 535 | 55,073 |
| AXA SA | | 7,756 | 206,826 |
| Bouygues SA | | 1,598 | 60,114 |
| Capgemini SA | | 785 | 95,177 |
| Dassault Systemes SA | | 649 | 102,673 |
| Edenred SA | | 2,338 | 110,163 |
| Elis SA | | 2,707 | 48,275 |
| Hermes International SCA | | 138 | 97,079 |
| Kering SA | | 174 | 102,848 |
| Laurent-Perrier Group SA | | 89 | 9,423 |
| Legrand SA | | 1,403 | 103,103 |
| LVMH Moet Hennessy - Louis Vuitton SA | | 270 | 106,007 |
| Natixis SA | | 14,735 | 86,733 |
| Pernod Ricard SA | | 500 | 87,120 |
| Safran SA | | 1,484 | 216,310 |
| Sanofi SA | | 2,467 | 215,244 |
| Societe Generale Series A | | 2,435 | 77,218 |
| SR Teleperformance SA | | 439 | 84,345 |
| Total SA | | 6,202 | 344,774 |
| Vetoquinol SA | | 205 | 12,876 |
| VINCI SA | | 2,140 | 216,132 |
| Vivendi SA | | 3,638 | 105,596 |
|
| TOTAL FRANCE | | | 2,543,109 |
|
| Germany - 5.4% | | | |
| Bayer AG | | 2,396 | 159,468 |
| Brenntag AG | | 883 | 47,597 |
| CompuGroup Medical AG | | 777 | 51,418 |
| Continental AG | | 627 | 103,630 |
| CTS Eventim AG | | 394 | 20,169 |
| Deutsche Borse AG | | 792 | 105,829 |
| Hannover Reuck SE | | 833 | 125,569 |
| HeidelbergCement Finance AG | | 1,274 | 102,882 |
| Linde PLC | | 2,025 | 364,307 |
| MTU Aero Engines Holdings AG | | 550 | 129,360 |
| Nexus AG | | 419 | 11,984 |
| Rheinmetall AG | | 400 | 45,896 |
| SAP SE | | 4,350 | 560,751 |
| Vonovia SE | | 4,616 | 230,235 |
| WashTec AG | | 204 | 16,039 |
|
| TOTAL GERMANY | | | 2,075,134 |
|
| Greece - 0.0% | | | |
| Motor Oil (HELLAS) Corinth Refineries SA | | 300 | 7,652 |
| Hong Kong - 1.3% | | | |
| AIA Group Ltd. | | 48,600 | 497,637 |
| India - 3.4% | | | |
| Asian Paints Ltd. | | 5,016 | 105,377 |
| Embassy Office Parks (REIT) (b) | | 800 | 3,681 |
| Godrej Consumer Products Ltd. | | 10,463 | 97,919 |
| HDFC Bank Ltd. | | 3,220 | 106,826 |
| Housing Development Finance Corp. Ltd. | | 11,537 | 330,479 |
| Infosys Ltd. sponsored ADR | | 15,211 | 163,670 |
| Jyothy Laboratories Ltd. | | 2,152 | 5,549 |
| Kotak Mahindra Bank Ltd. | | 5,152 | 102,567 |
| Reliance Industries Ltd. | | 10,905 | 218,078 |
| Tata Consultancy Services Ltd. | | 5,200 | 168,763 |
|
| TOTAL INDIA | | | 1,302,909 |
|
| Indonesia - 0.8% | | | |
| PT Bank Central Asia Tbk | | 64,500 | 130,132 |
| PT Bank Rakyat Indonesia Tbk | | 577,000 | 176,947 |
|
| TOTAL INDONESIA | | | 307,079 |
|
| Ireland - 1.3% | | | |
| Accenture PLC Class A | | 544 | 99,372 |
| CRH PLC | | 3,318 | 111,620 |
| CRH PLC sponsored ADR | | 6,000 | 201,900 |
| FBD Holdings PLC | | 500 | 5,058 |
| James Hardie Industries PLC CDI | | 5,266 | 71,573 |
|
| TOTAL IRELAND | | | 489,523 |
|
| Israel - 0.3% | | | |
| Azrieli Group | | 94 | 5,351 |
| Elbit Systems Ltd. (Israel) | | 409 | 56,929 |
| Ituran Location & Control Ltd. | | 1,158 | 42,580 |
| Strauss Group Ltd. | | 897 | 22,869 |
|
| TOTAL ISRAEL | | | 127,729 |
|
| Italy - 1.5% | | | |
| Assicurazioni Generali SpA | | 4,641 | 90,052 |
| Enel SpA | | 30,419 | 192,618 |
| Interpump Group SpA | | 3,101 | 116,446 |
| Intesa Sanpaolo SpA | | 41,087 | 107,649 |
| Mediobanca SpA | | 6,327 | 67,061 |
|
| TOTAL ITALY | | | 573,826 |
|
| Japan - 13.9% | | | |
| Ai Holdings Corp. | | 400 | 6,499 |
| Aoki Super Co. Ltd. | | 400 | 9,264 |
| Artnature, Inc. | | 900 | 5,066 |
| Aucnet, Inc. | | 500 | 5,665 |
| Azbil Corp. | | 5,200 | 124,498 |
| Broadleaf Co. Ltd. | | 2,400 | 12,302 |
| Central Automotive Products Ltd. | | 100 | 1,528 |
| Century21 Real Estate Japan Ltd. | | 100 | 1,084 |
| Coca-Cola West Co. Ltd. | | 300 | 7,371 |
| Daiichikosho Co. Ltd. | | 500 | 24,418 |
| Daikokutenbussan Co. Ltd. | | 500 | 17,124 |
| DENSO Corp. | | 4,546 | 198,050 |
| East Japan Railway Co. | | 1,500 | 140,917 |
| Fanuc Corp. | | 700 | 131,513 |
| Funai Soken Holdings, Inc. | | 600 | 15,475 |
| GCA Savvian Group Corp. | | 900 | 6,617 |
| Goldcrest Co. Ltd. | | 1,100 | 14,427 |
| Hitachi High-Technologies Corp. | | 1,100 | 48,880 |
| Honda Motor Co. Ltd. | | 5,780 | 161,279 |
| Hoya Corp. | | 5,235 | 367,265 |
| Idemitsu Kosan Co. Ltd. | | 1,621 | 52,459 |
| INPEX Corp. | | 5,131 | 49,792 |
| Itochu Corp. | | 7,713 | 138,480 |
| Japan Tobacco, Inc. (d) | | 3,683 | 85,105 |
| Kao Corp. | | 1,135 | 87,187 |
| Keyence Corp. | | 800 | 496,396 |
| Kobayashi Pharmaceutical Co. Ltd. | | 200 | 15,907 |
| Komatsu Ltd. | | 3,600 | 92,989 |
| Koshidaka Holdings Co. Ltd. | | 2,000 | 27,829 |
| Kusuri No Aoki Holdings Co. Ltd. | | 200 | 14,040 |
| Lasertec Corp. | | 900 | 40,639 |
| Makita Corp. | | 1,637 | 59,517 |
| Medikit Co. Ltd. | | 200 | 10,216 |
| Minebea Mitsumi, Inc. | | 5,609 | 99,194 |
| Miroku Jyoho Service Co., Ltd. | | 300 | 8,047 |
| Misumi Group, Inc. | | 5,650 | 145,973 |
| Mitsubishi UFJ Financial Group, Inc. | | 34,760 | 172,463 |
| Mitsuboshi Belting Ltd. | | 300 | 5,672 |
| Mitsui Fudosan Co. Ltd. | | 4,458 | 102,731 |
| Nabtesco Corp. | | 3,200 | 97,383 |
| Nagaileben Co. Ltd. | | 1,100 | 24,677 |
| ND Software Co. Ltd. | | 100 | 1,520 |
| Nihon Parkerizing Co. Ltd. | | 2,800 | 36,371 |
| Nintendo Co. Ltd. | | 110 | 37,886 |
| NS Tool Co. Ltd. | | 300 | 6,838 |
| OBIC Co. Ltd. | | 1,511 | 174,437 |
| Oracle Corp. Japan | | 909 | 62,099 |
| ORIX Corp. | | 8,203 | 115,723 |
| OSG Corp. | | 4,700 | 94,046 |
| Paramount Bed Holdings Co. Ltd. | | 700 | 32,802 |
| ProNexus, Inc. (d) | | 687 | 8,159 |
| Recruit Holdings Co. Ltd. | | 2,244 | 67,061 |
| San-Ai Oil Co. Ltd. | | 1,800 | 15,157 |
| Shin-Etsu Chemical Co. Ltd. | | 1,193 | 113,006 |
| Shinsei Bank Ltd. | | 4,375 | 60,562 |
| SHO-BOND Holdings Co. Ltd. | | 2,260 | 155,002 |
| Shoei Co. Ltd. | | 1,000 | 43,494 |
| SoftBank Corp. | | 583 | 61,816 |
| Software Service, Inc. | | 200 | 17,757 |
| Sony Corp. | | 915 | 46,087 |
| Sony Financial Holdings, Inc. | | 4,681 | 95,263 |
| Subaru Corp. | | 2,449 | 59,810 |
| Sumitomo Mitsui Financial Group, Inc. | | 4,316 | 156,870 |
| Suzuki Motor Corp. (d) | | 807 | 36,693 |
| T&D Holdings, Inc. | | 4,803 | 51,589 |
| Takeda Pharmaceutical Co. Ltd. | | 3,726 | 137,496 |
| The Monogatari Corp. | | 100 | 7,990 |
| TKC Corp. | | 300 | 11,702 |
| Tokio Marine Holdings, Inc. | | 3,146 | 158,211 |
| Tokyo Electron Ltd. | | 300 | 47,520 |
| USS Co. Ltd. | | 13,900 | 265,285 |
| Welcia Holdings Co. Ltd. | | 300 | 11,782 |
| Workman Co. Ltd. | | 400 | 19,319 |
| Yamada Consulting Group Co. Ltd. | | 700 | 15,163 |
| Yamato Kogyo Co. Ltd. | | 200 | 5,521 |
|
| TOTAL JAPAN | | | 5,355,975 |
|
| Kenya - 0.1% | | | |
| Safaricom Ltd. | | 180,000 | 50,094 |
| Korea (South) - 1.3% | | | |
| BGF Retail Co. Ltd. | | 375 | 70,392 |
| Db Insurance Co. Ltd. (b) | | 945 | 55,530 |
| Leeno Industrial, Inc. | | 139 | 6,831 |
| LG Household & Health Care Ltd. | | 51 | 62,304 |
| Samsung Electronics Co. Ltd. | | 6,613 | 260,484 |
| Shinhan Financial Group Co. Ltd. | | 702 | 26,626 |
|
| TOTAL KOREA (SOUTH) | | | 482,167 |
|
| Mexico - 0.0% | | | |
| Consorcio ARA S.A.B. de CV | | 15,114 | 4,050 |
| Netherlands - 2.9% | | | |
| Aalberts Industries NV | | 807 | 31,680 |
| AerCap Holdings NV (b) | | 1,342 | 66,617 |
| ASML Holding NV (Netherlands) | | 2,378 | 494,866 |
| ING Groep NV (Certificaten Van Aandelen) | | 10,330 | 131,811 |
| Koninklijke Philips Electronics NV | | 2,020 | 86,746 |
| Takeaway.com Holding BV (a)(b) | | 195 | 16,775 |
| Unilever NV (Certificaten Van Aandelen) (Bearer) | | 1,580 | 95,597 |
| Wolters Kluwer NV | | 1,303 | 90,873 |
| Yandex NV Series A (b) | | 2,928 | 109,595 |
|
| TOTAL NETHERLANDS | | | 1,124,560 |
|
| New Zealand - 0.1% | | | |
| Auckland International Airport Ltd. | | 10,468 | 55,723 |
| Norway - 0.7% | | | |
| Adevinta ASA Class B | | 4,476 | 44,037 |
| Equinor ASA | | 6,119 | 136,495 |
| Kongsberg Gruppen ASA | | 1,561 | 22,617 |
| Schibsted ASA (B Shares) | | 2,276 | 54,450 |
| Skandiabanken ASA (a) | | 1,474 | 14,505 |
|
| TOTAL NORWAY | | | 272,104 |
|
| Peru - 0.2% | | | |
| Compania de Minas Buenaventura SA sponsored ADR | | 3,628 | 58,810 |
| Philippines - 0.5% | | | |
| Ayala Land, Inc. | | 88,560 | 83,752 |
| Jollibee Food Corp. | | 2,100 | 12,358 |
| SM Prime Holdings, Inc. | | 142,100 | 113,795 |
|
| TOTAL PHILIPPINES | | | 209,905 |
|
| Portugal - 0.2% | | | |
| Galp Energia SGPS SA Class B | | 4,377 | 73,491 |
| Russia - 1.5% | | | |
| Alrosa Co. Ltd. | | 67,600 | 98,520 |
| Lukoil PJSC sponsored ADR | | 2,001 | 169,645 |
| NOVATEK OAO GDR (Reg. S) | | 699 | 134,697 |
| Sberbank of Russia | | 49,810 | 174,502 |
|
| TOTAL RUSSIA | | | 577,364 |
|
| Singapore - 0.2% | | | |
| United Overseas Bank Ltd. | | 4,300 | 87,985 |
| South Africa - 2.5% | | | |
| Capitec Bank Holdings Ltd. | | 1,089 | 101,759 |
| Clicks Group Ltd. | | 7,073 | 96,743 |
| FirstRand Ltd. | | 27,935 | 132,616 |
| Mondi Ltd. | | 4,126 | 90,939 |
| Mr Price Group Ltd. | | 2,005 | 30,363 |
| Naspers Ltd. Class N | | 1,952 | 502,153 |
|
| TOTAL SOUTH AFRICA | | | 954,573 |
|
| Spain - 2.5% | | | |
| Amadeus IT Holding SA Class A | | 4,601 | 365,981 |
| Banco Santander SA (Spain) | | 48,356 | 244,686 |
| CaixaBank SA | | 17,658 | 56,285 |
| Cellnex Telecom SA (a) | | 1,400 | 43,056 |
| Grifols SA ADR | | 2,331 | 44,615 |
| Masmovil Ibercom SA (b) | | 2,054 | 45,016 |
| Merlin Properties Socimi SA | | 3,011 | 41,032 |
| Prosegur Compania de Seguridad SA (Reg.) | | 16,675 | 86,743 |
| Unicaja Banco SA (a) | | 23,309 | 26,771 |
|
| TOTAL SPAIN | | | 954,185 |
|
| Sweden - 2.9% | | | |
| Addlife AB | | 693 | 18,592 |
| AddTech AB (B Shares) | | 1,112 | 27,047 |
| Alfa Laval AB | | 2,948 | 68,428 |
| ASSA ABLOY AB (B Shares) | | 12,267 | 262,239 |
| Atlas Copco AB (A Shares) | | 5,368 | 167,558 |
| Epiroc AB Class A | | 7,504 | 77,573 |
| Fagerhult AB | | 4,052 | 34,610 |
| Hexagon AB (B Shares) | | 1,288 | 70,366 |
| Investor AB (B Shares) | | 3,003 | 143,218 |
| Lagercrantz Group AB (B Shares) | | 1,606 | 19,563 |
| Loomis AB (B Shares) | | 1,512 | 55,940 |
| Saab AB (B Shares) | | 569 | 18,731 |
| Swedbank AB (A Shares) | | 2,856 | 46,665 |
| Telefonaktiebolaget LM Ericsson (B Shares) | | 10,564 | 104,501 |
|
| TOTAL SWEDEN | | | 1,115,031 |
|
| Switzerland - 4.6% | | | |
| Credit Suisse Group AG | | 4,624 | 61,494 |
| Nestle SA (Reg. S) | | 6,680 | 643,135 |
| Roche Holding AG (participation certificate) | | 1,506 | 397,378 |
| Schindler Holding AG: | | | |
| (participation certificate) | | 583 | 125,760 |
| (Reg.) | | 80 | 16,990 |
| Sika AG | | 489 | 74,865 |
| Swiss Life Holding AG | | 228 | 107,203 |
| Tecan Group AG | | 100 | 22,533 |
| UBS Group AG | | 10,891 | 146,375 |
| Zurich Insurance Group Ltd. | | 561 | 178,879 |
|
| TOTAL SWITZERLAND | | | 1,774,612 |
|
| Taiwan - 2.1% | | | |
| Addcn Technology Co. Ltd. | | 1,000 | 8,802 |
| E.SUN Financial Holdings Co. Ltd. | | 136,000 | 111,566 |
| Sporton International, Inc. | | 4,663 | 27,614 |
| Taiwan Semiconductor Manufacturing Co. Ltd. | | 78,000 | 654,869 |
|
| TOTAL TAIWAN | | | 802,851 |
|
| Thailand - 0.1% | | | |
| Siam Cement PCL (For. Reg.) | | 3,852 | 55,757 |
| Turkey - 0.1% | | | |
| Tupras Turkiye Petrol Rafinerileri A/S | | 2,686 | 55,503 |
| United Arab Emirates - 0.3% | | | |
| National Bank of Abu Dhabi PJSC (b) | | 28,200 | 122,837 |
| United Kingdom - 8.5% | | | |
| Alliance Pharma PLC | | 14,136 | 14,489 |
| Ascential PLC | | 3,669 | 17,061 |
| AstraZeneca PLC (United Kingdom) | | 1,859 | 138,495 |
| Aviva PLC | | 21,079 | 118,382 |
| Avon Rubber PLC | | 719 | 13,820 |
| BAE Systems PLC | | 6,900 | 44,348 |
| BHP Billiton PLC | | 13,539 | 319,582 |
| BP PLC | | 42,090 | 306,066 |
| British American Tobacco PLC (United Kingdom) | | 2,741 | 107,307 |
| Bunzl PLC | | 2,417 | 72,774 |
| Cineworld Group PLC | | 2,163 | 8,969 |
| Dechra Pharmaceuticals PLC | | 1,638 | 56,816 |
| DP Poland PLC (b) | | 18,304 | 2,184 |
| Elementis PLC | | 20,374 | 43,173 |
| Great Portland Estates PLC | | 2,036 | 20,034 |
| Hilton Food Group PLC | | 368 | 4,876 |
| Howden Joinery Group PLC | | 1,219 | 8,075 |
| Imperial Tobacco Group PLC | | 2,744 | 87,164 |
| Informa PLC | | 17,205 | 174,771 |
| InterContinental Hotel Group PLC ADR | | 3,391 | 224,179 |
| ITE Group PLC | | 11,252 | 10,623 |
| ITV PLC | | 23,754 | 42,328 |
| Lloyds Banking Group PLC | | 232,467 | 190,120 |
| Micro Focus International PLC | | 2,694 | 68,074 |
| Network International Holdings PLC (a) | | 1,400 | 9,511 |
| NMC Health PLC | | 2,760 | 101,565 |
| Prudential PLC | | 8,697 | 197,608 |
| Rightmove PLC | | 11,255 | 79,341 |
| Royal Dutch Shell PLC Class B sponsored ADR | | 2,847 | 184,742 |
| RSA Insurance Group PLC | | 10,591 | 74,854 |
| Shaftesbury PLC | | 4,738 | 53,103 |
| Spectris PLC | | 3,768 | 135,022 |
| Spirax-Sarco Engineering PLC | | 592 | 63,687 |
| Standard Chartered PLC (United Kingdom) | | 13,530 | 123,502 |
| Standard Life PLC | | 26,774 | 97,373 |
| The Weir Group PLC | | 2,612 | 56,523 |
| Ultra Electronics Holdings PLC | | 737 | 15,300 |
|
| TOTAL UNITED KINGDOM | | | 3,285,841 |
|
| United States of America - 8.2% | | | |
| Adobe, Inc. (b) | | 335 | 96,899 |
| Alphabet, Inc. Class A (b) | | 157 | 188,237 |
| Autoliv, Inc. | | 1,147 | 90,028 |
| Berkshire Hathaway, Inc. Class B (b) | | 659 | 142,812 |
| Black Knight, Inc. (b) | | 1,318 | 74,362 |
| ConocoPhillips Co. | | 1,065 | 67,223 |
| Marsh & McLennan Companies, Inc. | | 1,414 | 133,326 |
| Martin Marietta Materials, Inc. | | 646 | 143,347 |
| MasterCard, Inc. Class A | | 1,694 | 430,683 |
| MercadoLibre, Inc. (b) | | 182 | 88,113 |
| Microsoft Corp. | | 862 | 112,577 |
| Mohawk Industries, Inc. (b) | | 370 | 50,413 |
| Moody's Corp. | | 1,154 | 226,899 |
| Morningstar, Inc. | | 47 | 6,742 |
| MSCI, Inc. | | 721 | 162,499 |
| PayPal Holdings, Inc. (b) | | 622 | 70,143 |
| PriceSmart, Inc. | | 660 | 39,475 |
| ResMed, Inc. | | 1,339 | 139,939 |
| S&P Global, Inc. | | 628 | 138,574 |
| Sherwin-Williams Co. | | 333 | 151,458 |
| Thermo Fisher Scientific, Inc. | | 346 | 95,998 |
| TransDigm Group, Inc. (b) | | 235 | 113,392 |
| Visa, Inc. Class A | | 2,450 | 402,854 |
|
| TOTAL UNITED STATES OF AMERICA | | | 3,165,993 |
|
| TOTAL COMMON STOCKS | | | |
| (Cost $34,263,118) | | | 37,311,920 |
|
| Nonconvertible Preferred Stocks - 1.3% | | | |
| Brazil - 0.9% | | | |
| Itau Unibanco Holding SA | | 25,000 | 215,692 |
| Petroleo Brasileiro SA - Petrobras sponsored ADR | | 7,363 | 112,138 |
|
| TOTAL BRAZIL | | | 327,830 |
|
| Germany - 0.3% | | | |
| Porsche Automobil Holding SE (Germany) | | 1,518 | 105,528 |
| Sartorius AG (non-vtg.) | | 137 | 25,077 |
|
| TOTAL GERMANY | | | 130,605 |
|
| Spain - 0.1% | | | |
| Grifols SA Class B | | 1,646 | 31,688 |
| TOTAL NONCONVERTIBLE PREFERRED STOCKS | | | |
| (Cost $476,190) | | | 490,123 |
|
| Money Market Funds - 1.6% | | | |
| Fidelity Cash Central Fund, 2.49% (e) | | 581,943 | 582,059 |
| Fidelity Securities Lending Cash Central Fund 2.49% (e)(f) | | 33,072 | 33,075 |
| TOTAL MONEY MARKET FUNDS | | | |
| (Cost $615,128) | | | 615,134 |
| TOTAL INVESTMENT IN SECURITIES - 99.5% | | | |
| (Cost $35,354,436) | | | 38,417,177 |
| NET OTHER ASSETS (LIABILITIES) - 0.5% | | | 206,576 |
| NET ASSETS - 100% | | | $38,623,753 |
Categorizations in the Schedule of Investments are based on country or territory of incorporation.
Legend
(a) Security exempt from registration under Rule 144A of the Securities Act of 1933. These securities may be resold in transactions exempt from registration, normally to qualified institutional buyers. At the end of the period, the value of these securities amounted to $133,880 or 0.3% of net assets.
(b) Non-income producing
(c) Security or a portion of the security is on loan at period end.
(d) A portion of the security sold on a delayed delivery basis.
(e) Affiliated fund that is generally available only to investment companies and other accounts managed by Fidelity Investments. The rate quoted is the annualized seven-day yield of the fund at period end. A complete unaudited listing of the fund's holdings as of its most recent quarter end is available upon request. In addition, each Fidelity Central Fund's financial statements are available on the SEC's website or upon request.
(f) Investment made with cash collateral received from securities on loan.
Affiliated Central Funds
Information regarding fiscal year to date income earned by the Fund from investments in Fidelity Central Funds is as follows:
| Fund | Income earned |
| Fidelity Cash Central Fund | $6,085 |
| Fidelity Securities Lending Cash Central Fund | 1,257 |
| Total | $7,342 |
Amounts in the income column in the above table include any capital gain distributions from underlying funds, which are presented in the corresponding line-item in the Statement of Operations, if applicable.
Investment Valuation
The following is a summary of the inputs used, as of April 30, 2019, involving the Fund's assets and liabilities carried at fair value. The inputs or methodology used for valuing securities may not be an indication of the risk associated with investing in those securities. For more information on valuation inputs, and their aggregation into the levels used below, please refer to the Investment Valuation section in the accompanying Notes to Financial Statements.
| | Valuation Inputs at Reporting Date: |
| Description | Total | Level 1 | Level 2 | Level 3 |
| Investments in Securities: | | | | |
| Equities: | | | | |
| Communication Services | $1,799,519 | $876,930 | $922,589 | $-- |
| Consumer Discretionary | 3,743,727 | 2,822,673 | 921,054 | -- |
| Consumer Staples | 2,663,207 | 1,732,063 | 931,144 | -- |
| Energy | 2,244,203 | 1,593,363 | 650,840 | -- |
| Financials | 8,779,519 | 5,762,346 | 3,017,173 | -- |
| Health Care | 2,677,436 | 1,651,797 | 1,025,639 | -- |
| Industrials | 5,505,721 | 3,892,355 | 1,613,366 | -- |
| Information Technology | 6,161,750 | 4,656,434 | 1,505,316 | -- |
| Materials | 3,266,709 | 2,561,347 | 705,362 | -- |
| Real Estate | 669,225 | 669,225 | -- | -- |
| Utilities | 291,027 | 98,409 | 192,618 | -- |
| Money Market Funds | 615,134 | 615,134 | -- | -- |
| Total Investments in Securities: | $38,417,177 | $26,932,076 | $11,485,101 | $-- |
See accompanying notes which are an integral part of the financial statements.
Financial Statements
Statement of Assets and Liabilities
| | | April 30, 2019 (Unaudited) |
| Assets | | |
Investment in securities, at value (including securities loaned of $32,076) — See accompanying schedule:
Unaffiliated issuers (cost $34,739,308) | $37,802,043 | |
| Fidelity Central Funds (cost $615,128) | 615,134 | |
| Total Investment in Securities (cost $35,354,436) | | $38,417,177 |
| Cash | | 94,110 |
| Foreign currency held at value (cost $8,078) | | 8,087 |
| Receivable for securities sold on a delayed delivery basis | | 19,427 |
| Receivable for fund shares sold | | 24,277 |
| Dividends receivable | | 188,300 |
| Distributions receivable from Fidelity Central Funds | | 2,568 |
| Total assets | | 38,753,946 |
| Liabilities | | |
| Payable for investments purchased | $91,430 | |
| Payable for fund shares redeemed | 532 | |
| Other payables and accrued expenses | 5,156 | |
| Collateral on securities loaned | 33,075 | |
| Total liabilities | | 130,193 |
| Net Assets | | $38,623,753 |
| Net Assets consist of: | | |
| Paid in capital | | $39,800,073 |
| Total distributable earnings (loss) | | (1,176,320) |
| Net Assets, for 3,233,670 shares outstanding | | $38,623,753 |
| Net Asset Value, offering price and redemption price per share ($38,623,753 ÷ 3,233,670 shares) | | $11.94 |
See accompanying notes which are an integral part of the financial statements.
Statement of Operations
| | | Six months ended April 30, 2019 (Unaudited) |
| Investment Income | | |
| Dividends | | $464,258 |
| Non-Cash dividends | | 25,258 |
| Income from Fidelity Central Funds | | 7,342 |
| Income before foreign taxes withheld | | 496,858 |
| Less foreign taxes withheld | | (41,986) |
| Total income | | 454,872 |
| Expenses | | |
| Independent trustees' fees and expenses | $110 | |
| Commitment fees | 55 | |
| Total expenses | | 165 |
| Net investment income (loss) | | 454,707 |
| Realized and Unrealized Gain (Loss) | | |
| Net realized gain (loss) on: | | |
| Investment securities: | | |
| Unaffiliated issuers | (2,264,956) | |
| Fidelity Central Funds | (6) | |
| Foreign currency transactions | (3,437) | |
| Total net realized gain (loss) | | (2,268,399) |
| Change in net unrealized appreciation (depreciation) on: | | |
| Investment securities: | | |
| Unaffiliated issuers (net of increase in deferred foreign taxes of $5,147) | 6,074,979 | |
| Fidelity Central Funds | 6 | |
| Assets and liabilities in foreign currencies | (203) | |
| Total change in net unrealized appreciation (depreciation) | | 6,074,782 |
| Net gain (loss) | | 3,806,383 |
| Net increase (decrease) in net assets resulting from operations | | $4,261,090 |
See accompanying notes which are an integral part of the financial statements.
Statement of Changes in Net Assets
| | Six months ended April 30, 2019 (Unaudited) | Year ended October 31, 2018 |
| Increase (Decrease) in Net Assets | | |
| Operations | | |
| Net investment income (loss) | $454,707 | $1,180,382 |
| Net realized gain (loss) | (2,268,399) | (2,303,267) |
| Change in net unrealized appreciation (depreciation) | 6,074,782 | (4,149,405) |
| Net increase (decrease) in net assets resulting from operations | 4,261,090 | (5,272,290) |
| Distributions to shareholders | (958,596) | (243,461) |
| Share transactions | | |
| Proceeds from sales of shares | 6,249,352 | 61,885,506 |
| Reinvestment of distributions | 958,596 | 243,461 |
| Cost of shares redeemed | (18,278,708) | (24,832,406) |
| Net increase (decrease) in net assets resulting from share transactions | (11,070,760) | 37,296,561 |
| Total increase (decrease) in net assets | (7,768,266) | 31,780,810 |
| Net Assets | | |
| Beginning of period | 46,392,019 | 14,611,209 |
| End of period | $38,623,753 | $46,392,019 |
| Other Information | | |
| Shares | | |
| Sold | 560,571 | 5,081,975 |
| Issued in reinvestment of distributions | 92,439 | 20,407 |
| Redeemed | (1,675,180) | (2,068,952) |
| Net increase (decrease) | (1,022,170) | 3,033,430 |
See accompanying notes which are an integral part of the financial statements.
Financial Highlights
Fidelity Flex International Fund
| | Six months ended (Unaudited) April 30, | Years endedOctober 31, | |
| | 2019 | 2018 | 2017 A |
| Selected Per–Share Data | | | |
| Net asset value, beginning of period | $10.90 | $11.95 | $10.00 |
| Income from Investment Operations | | | |
| Net investment income (loss)B | .14 | .30 | .16 |
| Net realized and unrealized gain (loss) | 1.18 | (1.24) | 1.79 |
| Total from investment operations | 1.32 | (.94) | 1.95 |
| Distributions from net investment income | (.28) | (.07) | – |
| Distributions from net realized gain | – | (.03) | – |
| Total distributions | (.28) | (.11)C | – |
| Net asset value, end of period | $11.94 | $10.90 | $11.95 |
| Total ReturnD | 12.49% | (7.98)% | 19.50% |
| Ratios to Average Net AssetsE,F | | | |
| Expenses before reductionsG | - %H | -% | - %H |
| Expenses net of fee waivers, if anyG | - %H | -% | - %H |
| Expenses net of all reductionsG | - %H | -% | - %H |
| Net investment income (loss) | 2.49%H | 2.53% | 2.24%H |
| Supplemental Data | | | |
| Net assets, end of period (000 omitted) | $38,624 | $46,392 | $14,611 |
| Portfolio turnover rateI | 57%H | 69% | 35%H |
A For the period March 7, 2017 (commencement of operations) to October 31, 2017.
B Calculated based on average shares outstanding during the period.
C Total distributions of $.11 per share is comprised of distributions from net investment income of $.073 and distributions from net realized gain of $.032 per share.
D Total returns for periods of less than one year are not annualized.
E Fees and expenses of any underlying Fidelity Central Funds are not included in the Fund's expense ratio. The Fund indirectly bears its proportionate share of the expenses of any underlying Fidelity Central Funds.
F Expense ratios reflect operating expenses of the Fund. Expenses before reductions do not reflect amounts reimbursed by the investment adviser or reductions from expense offset arrangements and do not represent the amount paid by the Fund during periods when reimbursements or reductions occur. Expenses net of fee waivers reflect expenses after reimbursement by the investment adviser but prior to reductions from expense offset arrangements. Expenses net of all reductions represent the net expenses paid by the Fund.
G Amount represents less than .005%.
H Annualized
I Amount does not include the portfolio activity of any underlying Fidelity Central Funds.
See accompanying notes which are an integral part of the financial statements.
Notes to Financial Statements (Unaudited)
For the period ended April 30, 2019
1. Organization.
Fidelity Flex International Fund (the Fund) is a fund of Fidelity Investment Trust (the Trust) and is authorized to issue an unlimited number of shares. Share transactions on the Statement of Changes in Net Assets may contain exchanges between affiliated funds. The Trust is registered under the Investment Company Act of 1940, as amended (the 1940 Act), as an open-end management investment company organized as a Massachusetts business trust. The Fund is available only to certain fee-based accounts offered by Fidelity. The Fund's investments in emerging markets can be subject to social, economic, regulatory, and political uncertainties and can be extremely volatile.
2. Investments in Fidelity Central Funds.
The Fund invests in Fidelity Central Funds, which are open-end investment companies generally available only to other investment companies and accounts managed by the investment adviser and its affiliates. The Fund's Schedule of Investments lists each of the Fidelity Central Funds held as of period end, if any, as an investment of the Fund, but does not include the underlying holdings of each Fidelity Central Fund. As an Investing Fund, the Fund indirectly bears its proportionate share of the expenses of the underlying Fidelity Central Funds.
The Money Market Central Funds seek preservation of capital and current income and are managed by Fidelity Investments Money Management, Inc. (FIMM), an affiliate of the investment adviser. Annualized expenses of the Money Market Central Funds as of their most recent shareholder report date are less than .005%.
A complete unaudited list of holdings for each Fidelity Central Fund is available upon request or at the Securities and Exchange Commission (the SEC) website at www.sec.gov. In addition, the financial statements of the Fidelity Central Funds are available on the SEC website or upon request.
3. Significant Accounting Policies.
The Fund is an investment company and applies the accounting and reporting guidance of the Financial Accounting Standards Board (FASB) Accounting Standards Codification Topic 946 Financial Services – Investments Companies. The financial statements have been prepared in conformity with accounting principles generally accepted in the United States of America (GAAP), which require management to make certain estimates and assumptions at the date of the financial statements. Actual results could differ from those estimates. Subsequent events, if any, through the date that the financial statements were issued have been evaluated in the preparation of the financial statements. The following summarizes the significant accounting policies of the Fund:
Investment Valuation. Investments are valued as of 4:00 p.m. Eastern time on the last calendar day of the period. The Board of Trustees (the Board) has delegated the day to day responsibility for the valuation of the Fund's investments to the Fair Value Committee (the Committee) established by the Fund's investment adviser. In accordance with valuation policies and procedures approved by the Board, the Fund attempts to obtain prices from one or more third party pricing vendors or brokers to value its investments. When current market prices, quotations or currency exchange rates are not readily available or reliable, investments will be fair valued in good faith by the Committee, in accordance with procedures adopted by the Board. Factors used in determining fair value vary by investment type and may include market or investment specific events. The frequency with which these procedures are used cannot be predicted and they may be utilized to a significant extent. The Committee oversees the Fund's valuation policies and procedures and reports to the Board on the Committee's activities and fair value determinations. The Board monitors the appropriateness of the procedures used in valuing the Fund's investments and ratifies the fair value determinations of the Committee.
The Fund categorizes the inputs to valuation techniques used to value its investments into a disclosure hierarchy consisting of three levels as shown below:
- Level 1 – quoted prices in active markets for identical investments
- Level 2 – other significant observable inputs (including quoted prices for similar investments, interest rates, prepayment speeds, etc.)
- Level 3 – unobservable inputs (including the Fund's own assumptions based on the best information available)
Valuation techniques used to value the Fund's investments by major category are as follows:
Equity securities, including restricted securities, for which market quotations are readily available, are valued at the last reported sale price or official closing price as reported by a third party pricing vendor on the primary market or exchange on which they are traded and are categorized as Level 1 in the hierarchy. In the event there were no sales during the day or closing prices are not available, securities are valued at the last quoted bid price or may be valued using the last available price and are generally categorized as Level 2 in the hierarchy. For foreign equity securities, when market or security specific events arise, comparisons to the valuation of American Depositary Receipts (ADRs), futures contracts, Exchange-Traded Funds (ETFs) and certain indexes as well as quoted prices for similar securities may be used and would be categorized as Level 2 in the hierarchy. For equity securities, including restricted securities, where observable inputs are limited, assumptions about market activity and risk are used and these securities may be categorized as Level 3 in the hierarchy.
Investments in open-end mutual funds, including the Fidelity Central Funds, are valued at their closing net asset value (NAV) each business day and are categorized as Level 1 in the hierarchy.
Changes in valuation techniques may result in transfers in or out of an assigned level within the disclosure hierarchy. The aggregate value of investments by input level as of April 30, 2019 is included at the end of the Fund's Schedule of Investments.
Foreign Currency. The Fund may use foreign currency contracts to facilitate transactions in foreign-denominated securities. Gains and losses from these transactions may arise from changes in the value of the foreign currency or if the counterparties do not perform under the contracts' terms.
Foreign-denominated assets, including investment securities, and liabilities are translated into U.S. dollars at the exchange rates at period end. Purchases and sales of investment securities, income and dividends received and expenses denominated in foreign currencies are translated into U.S. dollars at the exchange rate in effect on the transaction date.
The effects of exchange rate fluctuations on investments are included with the net realized and unrealized gain (loss) on investment securities. Other foreign currency transactions resulting in realized and unrealized gain (loss) are disclosed separately.
Investment Transactions and Income. For financial reporting purposes, the Fund's investment holdings and NAV include trades executed through the end of the last business day of the period. The NAV per share for processing shareholder transactions is calculated as of the close of business of the New York Stock Exchange (NYSE), normally 4:00 p.m. Eastern time and includes trades executed through the end of the prior business day. Gains and losses on securities sold are determined on the basis of identified cost. Dividend income is recorded on the ex-dividend date, except for certain dividends from foreign securities where the ex-dividend date may have passed, which are recorded as soon as the Fund is informed of the ex-dividend date. Non-cash dividends included in dividend income, if any, are recorded at the fair market value of the securities received. Income and capital gain distributions from Fidelity Central Funds, if any, are recorded on the ex-dividend date. Certain distributions received by the Fund represent a return of capital or capital gain. The Fund determines the components of these distributions subsequent to the ex-dividend date, based upon receipt of tax filings or other correspondence relating to the underlying investment. These distributions are recorded as a reduction of cost of investments and/or as a realized gain. Investment income is recorded net of foreign taxes withheld where recovery of such taxes is uncertain.
Expenses. Expenses directly attributable to a fund are charged to that fund. Expenses attributable to more than one fund are allocated among the respective funds on the basis of relative net assets or other appropriate methods. Expense estimates are accrued in the period to which they relate and adjustments are made when actual amounts are known.
Income Tax Information and Distributions to Shareholders. Each year, the Fund intends to qualify as a regulated investment company under Subchapter M of the Internal Revenue Code, including distributing substantially all of its taxable income and realized gains. As a result, no provision for U.S. Federal income taxes is required. The Fund files a U.S. federal tax return, in addition to state and local tax returns as required. The Fund's federal income tax returns are subject to examination by the Internal Revenue Service (IRS) for a period of three fiscal years after they are filed. State and local tax returns may be subject to examination for an additional fiscal year depending on the jurisdiction. Foreign taxes are provided for based on the Fund's understanding of the tax rules and rates that exist in the foreign markets in which it invests. The Fund is subject to a tax imposed on capital gains by certain countries in which it invests. An estimated deferred tax liability for net unrealized appreciation on the applicable securities is included in Other payables and accrued expenses on the Statement of Assets & Liabilities.
Distributions are declared and recorded on the ex-dividend date. Income and capital gain distributions are determined in accordance with income tax regulations, which may differ from GAAP.
Capital accounts within the financial statements are adjusted for permanent book-tax differences. These adjustments have no impact on net assets or the results of operations. Capital accounts are not adjusted for temporary book-tax differences which will reverse in a subsequent period.
Book-tax differences are primarily due to foreign currency transactions, passive foreign investment companies (PFIC), capital loss carryforwards and losses deferred due to wash sales.
As of period end, the cost and unrealized appreciation (depreciation) in securities, and derivatives if applicable, for federal income tax purposes were as follows:
| Gross unrealized appreciation | $4,565,988 |
| Gross unrealized depreciation | (1,841,546) |
| Net unrealized appreciation (depreciation) | $2,724,442 |
| Tax cost | $35,692,735 |
Capital loss carryforwards are only available to offset future capital gains of the Fund to the extent provided by regulations and may be limited. Under the Regulated Investment Company Modernization Act of 2010 (the Act), the Fund is permitted to carry forward capital losses incurred in taxable years beginning after December 22, 2010 for an unlimited period and such capital losses are required to be used prior to any losses that expire. The capital loss carryforward information presented below, including any applicable limitation, is estimated as of prior fiscal period end and is subject to adjustment.
| No expiration | |
| Short-term | $(2,064,682) |
| Long-term | (501) |
| Total capital loss carryforward | $(2,065,183) |
Delayed Delivery Transactions and When-Issued Securities. During the period, the Fund transacted in securities on a delayed delivery or when-issued basis. Payment and delivery may take place after the customary settlement period for that security. The price of the underlying securities and the date when the securities will be delivered and paid for are fixed at the time the transaction is negotiated. Losses may arise due to changes in the value of the underlying securities or if the counterparty does not perform under the contract's terms, or if the issuer does not issue the securities due to political, economic, or other factors.
Restricted Securities. The Fund may invest in securities that are subject to legal or contractual restrictions on resale. These securities generally may be resold in transactions exempt from registration or to the public if the securities are registered. Disposal of these securities may involve time-consuming negotiations and expense, and prompt sale at an acceptable price may be difficult. Information regarding restricted securities is included at the end of the Fund's Schedule of Investments.
4. Purchases and Sales of Investments.
Purchases and sales of securities, other than short-term securities, aggregated $10,710,706 and $22,295,589, respectively.
5. Fees and Other Transactions with Affiliates.
Management Fee. Fidelity Management & Research Company (the investment adviser) and its affiliates provide the Fund with investment management related services and the Fund does not pay any fees for these services. Under the management contract, the investment adviser or an affiliate pays all other expenses of the Fund, excluding fees and expenses of the independent Trustees, and certain miscellaneous expenses such as proxy and shareholder meeting expenses.
Brokerage Commissions. The Fund placed a portion of its portfolio transactions with brokerage firms which are affiliates of the investment adviser. Brokerage commissions are included in net realized gain (loss) and change in net unrealized appreciation (depreciation) in the Statement of Operations. The commissions paid to these affiliated firms were $64 for the period.
Interfund Trades. The Fund may purchase from or sell securities to other Fidelity Funds under procedures adopted by the Board. The procedures have been designed to ensure these interfund trades are executed in accordance with Rule 17a-7 of the 1940 Act. Interfund trades are included within the respective purchases and sales amounts shown in the Purchases and Sales of Investments note.
6. Committed Line of Credit.
The Fund participates with other funds managed by the investment adviser or an affiliate in a $4.25 billion credit facility (the "line of credit") to be utilized for temporary or emergency purposes to fund shareholder redemptions or for other short-term liquidity purposes. The Fund has agreed to pay commitment fees on its pro-rata portion of the line of credit, which amounted to $55 and is reflected in Commitment fees on the Statement of Operations. During the period, the Fund did not borrow on this line of credit.
7. Security Lending.
The Fund lends portfolio securities through a lending agent from time to time in order to earn additional income. For equity securities, a lending agent is used and may loan securities to certain qualified borrowers, including Fidelity Capital Markets (FCM), a broker-dealer affiliated with the Fund. On the settlement date of the loan, the Fund receives collateral (in the form of U.S. Treasury obligations, letters of credit and/or cash) against the loaned securities and maintains collateral in an amount not less than 100% of the market value of the loaned securities during the period of the loan. The market value of the loaned securities is determined at the close of business of the Fund and any additional required collateral is delivered to the Fund on the next business day. The Fund or borrower may terminate the loan at any time, and if the borrower defaults on its obligation to return the securities loaned because of insolvency or other reasons, the Fund may apply collateral received from the borrower against the obligation. The Fund may experience delays and costs in recovering the securities loaned. Any cash collateral received is invested in the Fidelity Securities Lending Cash Central Fund. The value of loaned securities and cash collateral at period end are disclosed on the Fund's Statement of Assets and Liabilities. Security lending income represents the income earned on investing cash collateral, less rebates paid to borrowers and any lending agent fees associated with the loan, plus any premium payments received for lending certain types of securities. Security lending income is presented in the Statement of Operations as a component of income from Fidelity Central Funds. Total security lending income during the period amounted to $1,257. During the period, there were no securities loaned to FCM.
8. Other.
The Fund's organizational documents provide former and current trustees and officers with a limited indemnification against liabilities arising in connection with the performance of their duties to the Fund. In the normal course of business, the Fund may also enter into contracts that provide general indemnifications. The Fund's maximum exposure under these arrangements is unknown as this would be dependent on future claims that may be made against the Fund. The risk of material loss from such claims is considered remote.
At the end of the period, the investment adviser or its affiliates were the owners of record of 16% of the total outstanding shares of the Fund.
Shareholder Expense Example
As a shareholder of the Fund, you incur two types of costs: (1) transaction costs and (2) ongoing costs, including other Fund expenses. This Example is intended to help you understand your ongoing costs (in dollars) of investing in the Fund and to compare these costs with the ongoing costs of investing in other mutual funds.
The Example is based on an investment of $1,000 invested at the beginning of the period and held for the entire period (November 1, 2018 to April 30, 2019).
Actual Expenses
The first line of the accompanying table provides information about actual account values and actual expenses. You may use the information in this line, together with the amount you invested, to estimate the expenses that you paid over the period. Simply divide your account value by $1,000.00 (for example, an $8,600 account value divided by $1,000.00 = 8.6), then multiply the result by the number in the first line under the heading entitled "Expenses Paid During Period" to estimate the expenses you paid on your account during this period. In addition, the Fund, as a shareholder in the underlying Fidelity Central Funds, will indirectly bear its pro-rata share of the fees and expenses incurred by the underlying Fidelity Central Funds. These fees and expenses are not included in the Fund's annualized expense ratio used to calculate the expense estimate in the table below.
Hypothetical Example for Comparison Purposes
The second line of the accompanying table provides information about hypothetical account values and hypothetical expenses based on the Fund's actual expense ratio and an assumed rate of return of 5% per year before expenses, which is not the Fund's actual return. The hypothetical account values and expenses may not be used to estimate the actual ending account balance or expenses you paid for the period. You may use this information to compare the ongoing costs of investing in the Fund and other funds. To do so, compare this 5% hypothetical example with the 5% hypothetical examples that appear in the shareholder reports of the other funds. In addition, the Fund, as a shareholder in the underlying Fidelity Central Funds, will indirectly bear its pro-rata share of the fees and expenses incurred by the underlying Fidelity Central Funds. These fees and expenses are not included in the Fund's annualized expense ratio used to calculate the expense estimate in the table below.
Please note that the expenses shown in the table are meant to highlight your ongoing costs only and do not reflect any transaction costs. Therefore, the second line of the table is useful in comparing ongoing costs only, and will not help you determine the relative total costs of owning different funds.
| | Annualized Expense Ratio-A | Beginning
Account Value
November 1, 2018 | Ending
Account Value
April 30, 2019 | Expenses Paid
During Period-B
November 1, 2018
to April 30, 2019 |
| Actual | - %-C | $1,000.00 | $1,124.90 | $--D |
| Hypothetical-E | | $1,000.00 | $1,024.79 | $--D |
A Annualized expense ratio reflects expenses net of applicable fee waivers.
B Expenses are equal to the Fund's annualized expense ratio, multiplied by the average account value over the period, multiplied by 181/365 (to reflect the one-half year period).
C Amount represents less than .005%.
D Amount represents less than $.005.
E 5% return per year before expenses
Board Approval of Investment Advisory Contracts and Management Fees
Fidelity Flex International Fund
Each year, the Board of Trustees, including the Independent Trustees (together, the Board), votes on the renewal of the management contract with Fidelity Management & Research Company (FMR) and the sub-advisory agreements (together, the Advisory Contracts) for the fund. FMR and the sub-advisers are referred to herein as the Investment Advisers. The Board, assisted by the advice of fund counsel and Independent Trustees' counsel, requests and considers a broad range of information relevant to the renewal of the Advisory Contracts throughout the year.
The Board meets regularly and, at each of its meetings, covers an extensive agenda of topics and materials and considers factors that are relevant to its annual consideration of the renewal of the fund's Advisory Contracts, including the services and support provided to the fund and its shareholders. The Board has established various standing committees (Committees), each composed of and chaired by Independent Trustees with varying backgrounds, to which the Board has assigned specific subject matter responsibilities in order to enhance effective decision-making by the Board. The Board, acting directly and through its Committees, requests and receives information concerning the annual consideration of the renewal of the fund's Advisory Contracts. The Board also meets as needed to review matters specifically related to the Board's annual consideration of the renewal of the Advisory Contracts. Members of the Board may also meet with trustees of other Fidelity funds through joint ad hoc committees to discuss certain matters relevant to all of the Fidelity funds.
At its January 2019 meeting, the Board unanimously determined to renew the fund's Advisory Contracts. In considering whether to renew the Advisory Contracts for the fund, the Board considered all factors it believed relevant and reached a determination, with the assistance of fund counsel and Independent Trustees' counsel and through the exercise of its business judgment, that the renewal of the Advisory Contracts was in the best interests of the fund and its shareholders and the fact that no fee is payable under the management contract was fair and reasonable.
Nature, Extent, and Quality of Services Provided. The Board considered Fidelity's staffing as it relates to the fund, including the backgrounds of investment personnel of Fidelity, and also considered the fund's investment objective, strategies, and related investment philosophy. The Independent Trustees also had discussions with senior management of Fidelity's investment operations and investment groups. The Board considered the structure of the investment personnel compensation program and whether this structure provides appropriate incentives to act in the best interests of the fund. Additionally, the Board considered the portfolio managers' investments, if any, in the funds that they manage.
Resources Dedicated to Investment Management and Support Services. The Board and the Fund Oversight and Research Committees reviewed the general qualifications and capabilities of Fidelity's investment staff, including its size, education, experience, and resources, as well as Fidelity's approach to recruiting, training, managing, and compensating investment personnel. The Board noted that Fidelity has continued to increase the resources devoted to non-U.S. offices, including expansion of Fidelity's global investment organization. The Board also noted that Fidelity's analysts have extensive resources, tools and capabilities that allow them to conduct sophisticated quantitative and fundamental analysis, as well as credit analysis of issuers, counterparties and guarantors. Further, the Board considered that Fidelity's investment professionals have sufficient access to global information and data so as to provide competitive investment results over time, and that those professionals also have access to sophisticated tools that permit them to assess portfolio construction and risk and performance attribution characteristics continuously, as well as to transmit new information and research conclusions rapidly around the world. Additionally, in its deliberations, the Board considered Fidelity's trading, risk management, compliance, and technology and operations capabilities and resources, which are integral parts of the investment management process.
Shareholder and Administrative Services. The Board considered (i) the nature, extent, quality, and cost of advisory, administrative, and shareholder services performed by the Investment Advisers and their affiliates under the Advisory Contracts and under separate agreements covering transfer agency, pricing and bookkeeping, and securities lending services for the fund; (ii) the nature and extent of the supervision of third party service providers, principally custodians, subcustodians, and pricing vendors; and (iii) the resources devoted to, and the record of compliance with, the fund's compliance policies and procedures. The Board also reviewed the allocation of fund brokerage, including allocations to brokers affiliated with the Investment Advisers, the use of brokerage commissions to pay fund expenses, and the use of "soft" commission dollars to pay for research services.
The Board noted that the growth of fund assets over time across the complex allows Fidelity to reinvest in the development of services designed to enhance the value and convenience of the Fidelity funds as investment vehicles. These services include 24-hour access to account information and market information through telephone representatives and over the Internet, investor education materials and asset allocation tools, and the expanded availability of Fidelity Investor Centers.
Investment in a Large Fund Family. The Board considered the benefits to shareholders of investing in a Fidelity fund, including the benefits of investing in a fund that is part of a large family of funds offering a variety of investment disciplines and providing a large variety of mutual fund investor services. The Board noted that Fidelity had taken, or had made recommendations that resulted in the Fidelity funds taking, a number of actions over the previous year that benefited particular funds, including: (i) continuing to dedicate additional resources to Fidelity's investment research process, which includes meetings with management of issuers of securities in which the funds invest, and to the support of the senior management team that oversees asset management; (ii) continuing efforts to enhance Fidelity's global research capabilities; (iii) launching new funds and making other enhancements to meet client needs; (iv) launching new share classes of existing funds; (v) eliminating purchase minimums and broadening eligibility requirements for certain funds and share classes; (vi) reducing management fees and total expenses for certain growth equity funds and index funds; (vii) lowering expense caps for certain existing funds and classes, and converting certain voluntary expense caps to contractual caps, to reduce expenses borne by shareholders; (viii) eliminating short-term redemption fees for funds that had such fees; (ix) rationalizing product lines and gaining increased efficiencies from fund mergers and share class consolidations; (x) continuing to develop, acquire and implement systems and technology to improve services to the funds and shareholders, strengthen information security, and increase efficiency; and (xi) continuing to implement enhancements to further strengthen Fidelity's product line to increase investors' probability of success in achieving their investment goals, including retirement income goals.
Investment Performance. The Board considered whether the fund has operated in accordance with its investment objective, as well as its record of compliance with its investment restrictions. As the fund recently commenced operations, the Board did not believe that it was appropriate to assign significant weight to its limited investment performance.
Based on its review, the Board concluded that the nature, extent, and quality of services provided to the fund under the Advisory Contracts should continue to benefit the shareholders of the fund.
Competitiveness of Management Fee and Total Expense Ratio. The Board noted that the fund is available exclusively to certain Fidelity fee-based programs. The Board considered that the fund does not pay FMR a management fee for investment advisory services, but that FMR is indirectly compensated for its services out of the program fees. The Board also noted that FMR or an affiliate undertakes to pay all operating expenses of the fund with limited exceptions.
In connection with the renewal of the Advisory Contracts, the Board also approved amendments to the management contract for the fund to clarify that the fund pays its non-operating expenses, including brokerage commissions and fees and expenses associated with the fund's securities lending program. The Board considered that the amendments would not change the services provided to the fund or the party responsible for making such payments under the current management contract.
Based on its review, the Board considered that the fund does not pay a management fee and concluded that the total expense ratio of the fund was reasonable in light of the services that the fund and its shareholders receive and the other factors considered.
Costs of the Services and Profitability. The Board considered the level of Fidelity's profits in respect of all the Fidelity funds.
PricewaterhouseCoopers LLP (PwC), auditor to Fidelity and certain Fidelity funds, has been engaged annually by the Board as part of the Board's assessment of Fidelity's profitability analysis. PwC's engagement includes the review and assessment of the methodologies used by Fidelity in determining the revenues and expenses attributable to Fidelity's mutual fund business, and completion of agreed-upon procedures in respect of the mathematical accuracy of the fund profitability information and its conformity to established allocation methodologies. After considering PwC's reports issued under the engagement and information provided by Fidelity, the Board concluded that while other allocation methods may also be reasonable, Fidelity's profitability methodologies are reasonable in all material respects.
The Board also reviewed Fidelity's non-fund businesses and potential indirect benefits such businesses may have received as a result of their association with Fidelity's mutual fund business (i.e., fall-out benefits) as well as cases where Fidelity's affiliates may benefit from the fund's business. The Board noted that changes to fall-out benefits year-over-year reflect business developments at Fidelity's various businesses.
The Board concluded that the costs of the services provided by and the profits realized by Fidelity in connection with the operation of the fund were not relevant to the renewal of the Advisory Contracts because the fund pays no advisory fees and FMR or an affiliate bears all expenses of the fund with limited exceptions.
Economies of Scale. The Board concluded that because the fund pays no advisory fees and FMR bears all expenses of the fund with limited exceptions, the realization of economies of scale was not a material factor in the Board's decision to renew the fund's Advisory Contract.
Additional Information Requested by the Board. In order to develop fully the factual basis for consideration of the Fidelity funds' advisory contracts, the Board requested and received additional information on certain topics, including: (i) fund performance trends, in particular the underperformance of certain funds, and Fidelity's long-term strategies for certain funds; (ii) Fidelity's fund profitability methodology, profitability trends for certain funds, and the impact of certain factors on fund profitability results; (iii) metrics for evaluating index fund and ETF performance and information about ETF trading characteristics; (iv) the methodology with respect to the evaluation of competitive fund data and peer group classifications and fee comparisons; (v) the expense structures for different funds and classes; (vi) information regarding other accounts managed by Fidelity, including collective investment trusts; and (vii) Fidelity's philosophies and strategies for evaluating funds and classes with lower or declining asset levels.
Based on its evaluation of all of the conclusions noted above, and after considering all factors it believed relevant, the Board concluded that the advisory fee arrangements are fair and reasonable, and that the fund's Advisory Contracts should be renewed.
ZNL-SANN-0619
1.9881586.102
Item 2.
Code of Ethics
Not applicable.
Item 3.
Audit Committee Financial Expert
Not applicable.
Item 4.
Principal Accountant Fees and Services
Not applicable.
Item 5.
Audit Committee of Listed Registrants
Not applicable.
Item 6.
Investments
(a)
Not applicable.
(b)
Not applicable
Item 7.
Disclosure of Proxy Voting Policies and Procedures for Closed-End Management Investment Companies
Not applicable.
Item 8.
Portfolio Managers of Closed-End Management Investment Companies
Not applicable.
Item 9.
Purchase of Equity Securities by Closed-End Management Investment Company and Affiliated Purchasers
Not applicable.
Item 10.
Submission of Matters to a Vote of Security Holders
There were no material changes to the procedures by which shareholders may recommend nominees to the Fidelity Investment Trust’s Board of Trustees.
Item 11.
Controls and Procedures
(a)(i) The President and Treasurer and the Chief Financial Officer have concluded that the Fidelity Investment Trust’s (the “Trust”) disclosure controls and procedures (as defined in Rule 30a-3(c) under the Investment Company Act) provide reasonable
assurances that material information relating to the Trust is made known to them by the appropriate persons, based on their evaluation of these controls and procedures as of a date within 90 days of the filing date of this report.
(a)(ii) There was no change in the Trust’s internal control over financial reporting (as defined in Rule 30a-3(d) under the Investment Company Act) that occurred during the period covered by this report that has materially affected, or is reasonably likely to materially affect, the Trust’s internal control over financial reporting.
Item 12.
Disclosure of Securities Lending Activities for Closed-End Management
Investment Companies
Not applicable.
Item 13.
Exhibits
| | |
(a) | (1) | Not applicable. |
(a) | (2) | Certification pursuant to Rule 30a-2(a) under the Investment Company Act of 1940 (17 CFR 270.30a-2(a)) is filed and attached hereto as Exhibit 99.CERT. |
(a) | (3) | Not applicable. |
(b) |
| Certification pursuant to Rule 30a-2(b) under the Investment Company Act of 1940 (17 CFR 270.30a-2(b)) is furnished and attached hereto as Exhibit 99.906CERT. |
SIGNATURES
Pursuant to the requirements of the Securities Exchange Act of 1934 and the Investment Company Act of 1940, the registrant has duly caused this report to be signed on its behalf by the undersigned, thereunto duly authorized.
Fidelity Investment Trust
| |
By: | /s/Stacie M. Smith |
| Stacie M. Smith |
| President and Treasurer |
|
|
Date: | June 25, 2019 |
Pursuant to the requirements of the Securities Exchange Act of 1934 and the Investment Company Act of 1940, this report has been signed below by the following persons on behalf of the registrant and in the capacities and on the dates indicated.
| |
By: | /s/Stacie M. Smith |
| Stacie M. Smith |
| President and Treasurer |
|
|
Date: | June 25, 2019 |
| |
By: | /s/John J. Burke III |
| John J. Burke III |
| Chief Financial Officer |
|
|
Date: | June 25, 2019 |