UNITED STATES
SECURITIES AND EXCHANGE COMMISSION
Washington, D.C. 20549
FORM N-CSR
CERTIFIED SHAREHOLDER REPORT OF REGISTERED
MANAGEMENT INVESTMENT COMPANIES
Investment Company Act file number 811-4008
Fidelity Investment Trust
(Exact name of registrant as specified in charter)
245 Summer St., Boston, MA 02210
(Address of principal executive offices) (Zip code)
Marc Bryant, Secretary
245 Summer St.
Boston, Massachusetts 02210
(Name and address of agent for service)
Registrant's telephone number, including area code:
617-563-7000
| |
Date of fiscal year end: | October 31 |
|
|
Date of reporting period: | April 30, 2017 |
Item 1.
Reports to Stockholders
Fidelity Advisor® International Small Cap Fund -
Class A, Class M (formerly Class T), Class C and Class I
Semi-Annual Report April 30, 2017 Class A, Class M, Class C and Class I are classes of Fidelity® International Small Cap Fund |
 |
Contents
To view a fund's proxy voting guidelines and proxy voting record for the 12-month period ended June 30, visit http://www.fidelity.com/proxyvotingresults or visit the Securities and Exchange Commission's (SEC) web site at http://www.sec.gov.
You may also call 1-877-208-0098 to request a free copy of the proxy voting guidelines.
Standard & Poor's, S&P and S&P 500 are registered service marks of The McGraw-Hill Companies, Inc. and have been licensed for use by Fidelity Distributors Corporation.
Other third-party marks appearing herein are the property of their respective owners.
All other marks appearing herein are registered or unregistered trademarks or service marks of FMR LLC or an affiliated company. © 2017 FMR LLC. All rights reserved.
This report and the financial statements contained herein are submitted for the general information of the shareholders of the Fund. This report is not authorized for distribution to prospective investors in the Fund unless preceded or accompanied by an effective prospectus.
A fund files its complete schedule of portfolio holdings with the SEC for the first and third quarters of each fiscal year on Form N-Q. Forms N-Q are available on the SEC’s web site at http://www.sec.gov. A fund's Forms N-Q may be reviewed and copied at the SEC’s Public Reference Room in Washington, DC. Information regarding the operation of the SEC's Public Reference Room may be obtained by calling 1-800-SEC-0330.
For a complete list of a fund's portfolio holdings, view the most recent holdings listing, semiannual report, or annual report on Fidelity's web site at http://www.fidelity.com, http://www.institutional.fidelity.com, or http://www.401k.com, as applicable.
NOT FDIC INSURED •MAY LOSE VALUE •NO BANK GUARANTEE
Neither the Fund nor Fidelity Distributors Corporation is a bank.
Investment Summary (Unaudited)
Geographic Diversification (% of fund's net assets)
| As of April 30, 2017 |
| | Japan | 20.1% |
| | United Kingdom | 15.0% |
| | United States of America* | 5.6% |
| | Canada | 5.0% |
| | Australia | 4.9% |
| | Cayman Islands | 3.7% |
| | France | 3.5% |
| | Austria | 3.3% |
| | Finland | 3.0% |
| | Other | 35.9% |
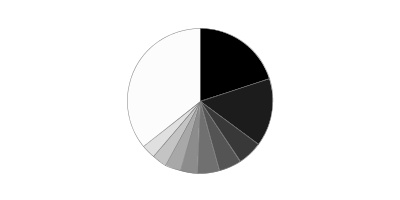
* Includes Short-Term investments and Net Other Assets (Liabilities).
Percentages are based on country or territory of incorporation and are adjusted for the effect of futures contracts, if applicable.
| As of October 31, 2016 |
| | Japan | 22.1% |
| | United Kingdom | 13.5% |
| | United States of America* | 6.0% |
| | Canada | 5.2% |
| | Australia | 4.3% |
| | Cayman Islands | 4.0% |
| | France | 3.6% |
| | Switzerland | 2.9% |
| | Finland | 2.8% |
| | Other | 35.6% |

* Includes Short-Term investments and Net Other Assets (Liabilities).
Percentages are based on country or territory of incorporation and are adjusted for the effect of futures contracts, if applicable.
Asset Allocation as of April 30, 2017
| | % of fund's net assets | % of fund's net assets 6 months ago |
| Stocks | 94.8 | 94.8 |
| Short-Term Investments and Net Other Assets (Liabilities) | 5.2 | 5.2 |
Top Ten Stocks as of April 30, 2017
| | % of fund's net assets | % of fund's net assets 6 months ago |
| Micro Focus International PLC (United Kingdom, Software) | 1.2 | 1.2 |
| S Foods, Inc. (Japan, Food Products) | 0.9 | 0.9 |
| IWG PLC (Bailiwick of Jersey, Commercial Services & Supplies) | 0.9 | 0.6 |
| JSR Corp. (Japan, Chemicals) | 0.9 | 1.0 |
| GUD Holdings Ltd. (Australia, Household Durables) | 0.8 | 0.8 |
| Kaken Pharmaceutical Co. Ltd. (Japan, Pharmaceuticals) | 0.8 | 0.8 |
| Paysafe Group PLC (Isle of Man, IT Services) | 0.8 | 0.6 |
| Tsuruha Holdings, Inc. (Japan, Food & Staples Retailing) | 0.8 | 0.8 |
| Frutarom Industries Ltd. (Israel, Chemicals) | 0.8 | 0.9 |
| SITC International Holdings Co. Ltd. (Cayman Islands, Marine) | 0.8 | 0.8 |
| | 8.7 | |
Top Market Sectors as of April 30, 2017
| | % of fund's net assets | % of fund's net assets 6 months ago |
| Industrials | 18.3 | 18.4 |
| Consumer Discretionary | 17.2 | 16.2 |
| Financials | 12.7 | 13.9 |
| Materials | 9.8 | 9.7 |
| Information Technology | 9.3 | 9.7 |
| Consumer Staples | 8.8 | 8.4 |
| Health Care | 8.6 | 9.5 |
| Real Estate | 6.1 | 4.8 |
| Energy | 3.7 | 3.9 |
| Utilities | 0.3 | 0.3 |
Investments April 30, 2017 (Unaudited)
Showing Percentage of Net Assets
| Common Stocks - 93.4% | | | |
| | | Shares | Value |
| Australia - 4.9% | | | |
| Asaleo Care Ltd. | | 3,943,545 | $5,300,503 |
| Aub Group Ltd. | | 616,464 | 5,566,995 |
| Austal Ltd. | | 3,190,191 | 4,096,818 |
| Challenger Ltd. | | 517,919 | 5,126,951 |
| GUD Holdings Ltd. | | 1,209,665 | 11,268,117 |
| Imdex Ltd. (a) | | 15,092,652 | 7,006,854 |
| Life Healthcare Group Ltd. | | 2,135,290 | 3,421,657 |
| Nanosonics Ltd. (a) | | 1,806,209 | 4,273,866 |
| Pact Group Holdings Ltd. | | 1,183,938 | 6,250,056 |
| Programmed Maintenance Services Ltd. | | 4,927,825 | 6,346,723 |
| Servcorp Ltd. | | 861,308 | 3,798,740 |
| SomnoMed Ltd. (a)(b) | | 992,506 | 2,199,838 |
|
| TOTAL AUSTRALIA | | | 64,657,118 |
|
| Austria - 3.3% | | | |
| Andritz AG | | 145,932 | 8,070,588 |
| Buwog-Gemeinnuetzige Wohnung | | 341,791 | 9,229,638 |
| IMMOFINANZ Immobilien Anlagen AG (b) | | 4,183,443 | 8,703,917 |
| Palfinger AG (a) | | 33,893 | 1,384,117 |
| RHI AG | | 308,031 | 8,975,646 |
| Wienerberger AG | | 314,200 | 7,358,548 |
|
| TOTAL AUSTRIA | | | 43,722,454 |
|
| Bailiwick of Jersey - 0.9% | | | |
| IWG PLC | | 2,779,200 | 11,695,165 |
| Belgium - 0.5% | | | |
| Barco NV | | 67,583 | 6,655,818 |
| Bermuda - 1.4% | | | |
| BW Offshore Ltd. (a) | | 1,659,938 | 4,272,610 |
| Hiscox Ltd. | | 492,381 | 7,219,125 |
| Petra Diamonds Ltd. (a) | | 4,358,474 | 7,321,689 |
|
| TOTAL BERMUDA | | | 18,813,424 |
|
| Brazil - 0.3% | | | |
| MAHLE Metal Leve SA | | 662,300 | 4,217,036 |
| British Virgin Islands - 0.3% | | | |
| Gem Diamonds Ltd. | | 3,674,562 | 4,176,279 |
| Canada - 5.0% | | | |
| AutoCanada, Inc. (b) | | 382,084 | 6,572,164 |
| Dorel Industries, Inc. Class B (sub. vtg.) | | 195,603 | 4,700,032 |
| Genesis Land Development Corp. | | 1,872,122 | 4,388,697 |
| Lassonde Industries, Inc. Class A (sub. vtg.) | | 44,669 | 7,813,353 |
| McCoy Global, Inc. (a) | | 1,341,870 | 1,916,887 |
| North West Co., Inc. | | 279,700 | 6,597,810 |
| Open Text Corp. | | 272,096 | 9,434,309 |
| ShawCor Ltd. Class A | | 164,385 | 4,124,527 |
| TransForce, Inc. | | 261,000 | 5,682,517 |
| Western Forest Products, Inc. | | 4,516,800 | 7,114,113 |
| Whitecap Resources, Inc. (b) | | 1,131,353 | 8,006,205 |
|
| TOTAL CANADA | | | 66,350,614 |
|
| Cayman Islands - 3.7% | | | |
| AMVIG Holdings Ltd. | | 17,298,000 | 5,782,049 |
| Best Pacific International Holdings Ltd. | | 5,304,000 | 4,657,327 |
| China High Precision Automation Group Ltd. (a) | | 712,000 | 1 |
| China Metal Recycling (Holdings) Ltd. (a) | | 436,800 | 1 |
| Greatview Aseptic Pack Co. Ltd. | | 6,561,000 | 3,399,285 |
| Haitian International Holdings Ltd. | | 2,703,000 | 6,623,407 |
| Lifestyle International Holdings Ltd. | | 3,561,000 | 5,081,682 |
| Pico Far East Holdings Ltd. | | 18,482,000 | 7,484,659 |
| SITC International Holdings Co. Ltd. | | 14,414,000 | 10,321,724 |
| Value Partners Group Ltd. (b) | | 6,679,000 | 6,182,391 |
|
| TOTAL CAYMAN ISLANDS | | | 49,532,526 |
|
| Chile - 0.7% | | | |
| Quinenco SA | | 2,156,335 | 5,857,666 |
| Vina San Pedro SA | | 394,698,308 | 3,844,051 |
|
| TOTAL CHILE | | | 9,701,717 |
|
| China - 0.5% | | | |
| Qingdao Port International Co. Ltd. | | 11,307,000 | 6,018,112 |
| Denmark - 1.2% | | | |
| Jyske Bank A/S (Reg.) | | 156,703 | 8,374,170 |
| Scandinavian Tobacco Group A/S | | 401,913 | 7,016,150 |
|
| TOTAL DENMARK | | | 15,390,320 |
|
| Finland - 3.0% | | | |
| Amer Group PLC (A Shares) (b) | | 386,245 | 8,561,991 |
| Asiakastieto Group Oyj | | 376,423 | 7,368,375 |
| Cramo Oyj (B Shares) | | 233,810 | 6,079,432 |
| Olvi PLC (A Shares) | | 180,338 | 5,578,958 |
| Oriola-KD Oyj | | 1,700,800 | 7,169,877 |
| Tikkurila Oyj | | 285,646 | 5,663,006 |
|
| TOTAL FINLAND | | | 40,421,639 |
|
| France - 3.5% | | | |
| Altarea SCA | | 37,300 | 7,522,809 |
| Maisons du Monde SA | | 175,000 | 6,073,392 |
| Rexel SA | | 358,500 | 6,404,430 |
| The Lisi Group | | 94,909 | 3,721,837 |
| The Vicat Group | | 124,556 | 8,861,186 |
| Thermador Groupe SA | | 47,752 | 4,805,782 |
| Wendel SA | | 66,635 | 9,338,125 |
|
| TOTAL FRANCE | | | 46,727,561 |
|
| Germany - 1.9% | | | |
| Axel Springer Verlag AG | | 165,400 | 9,280,568 |
| CompuGroup Medical AG | | 133,049 | 6,550,848 |
| mutares AG | | 188,600 | 2,876,188 |
| SHW Group | | 171,439 | 6,013,302 |
|
| TOTAL GERMANY | | | 24,720,906 |
|
| Greece - 0.5% | | | |
| Metka Industrial-Construction | | 946,716 | 7,218,804 |
| Hong Kong - 2.6% | | | |
| Dah Sing Banking Group Ltd. | | 4,430,800 | 8,909,050 |
| Far East Horizon Ltd. | | 6,811,000 | 6,269,551 |
| Magnificent Hotel Investment Ltd. | | 160,416,000 | 3,897,822 |
| Sino Land Ltd. | | 4,832,440 | 8,188,312 |
| Techtronic Industries Co. Ltd. | | 1,607,500 | 6,902,556 |
|
| TOTAL HONG KONG | | | 34,167,291 |
|
| India - 0.5% | | | |
| Edelweiss Financial Services Ltd. | | 1,069,635 | 2,789,303 |
| Torrent Pharmaceuticals Ltd. (a) | | 201,745 | 4,452,103 |
|
| TOTAL INDIA | | | 7,241,406 |
|
| Indonesia - 0.7% | | | |
| PT ACE Hardware Indonesia Tbk | | 71,443,900 | 5,011,632 |
| PT Media Nusantara Citra Tbk | | 34,093,000 | 4,667,996 |
|
| TOTAL INDONESIA | | | 9,679,628 |
|
| Ireland - 2.0% | | | |
| C&C Group PLC | | 911,912 | 3,761,800 |
| Mincon Group PLC | | 5,972,545 | 6,766,129 |
| Origin Enterprises PLC | | 866,600 | 7,032,706 |
| United Drug PLC (United Kingdom) | | 989,149 | 9,570,159 |
|
| TOTAL IRELAND | | | 27,130,794 |
|
| Isle of Man - 0.8% | | | |
| Paysafe Group PLC (a) | | 1,820,600 | 10,703,149 |
| Israel - 0.8% | | | |
| Frutarom Industries Ltd. | | 177,789 | 10,450,958 |
| Italy - 1.4% | | | |
| Banca Generali SpA | | 247,100 | 7,103,292 |
| Banco di Desio e della Brianza SpA | | 1,862,695 | 5,092,874 |
| Recordati SpA | | 169,661 | 6,285,447 |
|
| TOTAL ITALY | | | 18,481,613 |
|
| Japan - 20.1% | | | |
| A/S One Corp. | | 142,500 | 6,308,477 |
| Aeon Delight Co. Ltd. | | 254,400 | 7,759,229 |
| Arc Land Sakamoto Co. Ltd. | | 564,200 | 6,979,429 |
| Aucnet, Inc. | | 233,600 | 2,818,497 |
| Broadleaf Co. Ltd. | | 819,600 | 5,315,728 |
| Central Automotive Products Ltd. | | 337,000 | 3,491,680 |
| Daiwa Industries Ltd. | | 495,600 | 4,881,532 |
| Dexerials Corp. | | 771,000 | 6,930,182 |
| Fuji Corp. | | 149,100 | 2,677,714 |
| Funai Soken Holdings, Inc. | | 203,520 | 3,910,651 |
| GMO Internet, Inc. | | 706,500 | 8,384,835 |
| Iida Group Holdings Co. Ltd. | | 533,351 | 8,487,685 |
| Japan Meat Co. Ltd. | | 380,900 | 6,338,367 |
| JSR Corp. | | 635,300 | 11,603,237 |
| Kaken Pharmaceutical Co. Ltd. | | 183,200 | 10,862,992 |
| Kotobuki Spirits Co. Ltd. | | 137,000 | 3,693,070 |
| Meitec Corp. | | 147,000 | 6,349,451 |
| Minebea Mitsumi, Inc. | | 534,000 | 7,717,192 |
| Miraca Holdings, Inc. | | 118,300 | 5,454,694 |
| Mitani Shoji Co. Ltd. | | 251,100 | 7,827,517 |
| Morinaga & Co. Ltd. | | 169,000 | 7,989,504 |
| Nihon Parkerizing Co. Ltd. | | 785,300 | 10,080,864 |
| Nitori Holdings Co. Ltd. | | 61,200 | 7,966,019 |
| Otsuka Corp. | | 121,400 | 6,501,529 |
| PALTAC Corp. | | 224,500 | 6,625,746 |
| Paramount Bed Holdings Co. Ltd. | | 237,400 | 9,955,999 |
| Ricoh Leasing Co. Ltd. | | 236,400 | 7,655,564 |
| S Foods, Inc. (b) | | 383,000 | 11,939,224 |
| San-Ai Oil Co. Ltd. | | 617,400 | 5,239,385 |
| Shinsei Bank Ltd. | | 5,058,000 | 9,437,668 |
| Ship Healthcare Holdings, Inc. | | 265,000 | 7,124,512 |
| TKC Corp. | | 242,200 | 6,583,234 |
| Toshiba Plant Systems & Services Corp. | | 617,200 | 10,037,978 |
| Tsuruha Holdings, Inc. | | 103,100 | 10,451,043 |
| VT Holdings Co. Ltd. | | 1,312,400 | 6,675,316 |
| Welcia Holdings Co. Ltd. | | 208,300 | 6,708,204 |
| Yamada Consulting Group Co. Ltd. | | 168,200 | 7,710,267 |
|
| TOTAL JAPAN | | | 266,474,215 |
|
| Korea (South) - 1.2% | | | |
| BGFretail Co. Ltd. | | 39,299 | 3,782,736 |
| Fila Korea Ltd. | | 54,731 | 3,338,899 |
| Hy-Lok Corp. | | 125,792 | 2,476,917 |
| NS Shopping Co. Ltd. | | 38,218 | 5,711,199 |
|
| TOTAL KOREA (SOUTH) | | | 15,309,751 |
|
| Luxembourg - 0.4% | | | |
| SAF-Holland SA | | 318,400 | 5,500,773 |
| Mexico - 0.2% | | | |
| Credito Real S.A.B. de CV | | 2,307,500 | 3,234,747 |
| Netherlands - 2.9% | | | |
| Amsterdam Commodities NV | | 261,855 | 7,302,109 |
| Arcadis NV (b) | | 212,989 | 3,690,102 |
| Basic-Fit NV | | 344,300 | 6,019,488 |
| BinckBank NV | | 1,026,016 | 5,099,788 |
| IMCD Group BV | | 142,000 | 7,648,956 |
| Philips Lighting NV | | 268,100 | 9,070,804 |
|
| TOTAL NETHERLANDS | | | 38,831,247 |
|
| New Zealand - 0.7% | | | |
| EBOS Group Ltd. | | 707,802 | 8,898,236 |
| Norway - 1.6% | | | |
| ABG Sundal Collier ASA | | 8,682,510 | 5,683,171 |
| Ekornes A/S | | 398,197 | 6,260,959 |
| Kongsberg Gruppen ASA (b) | | 318,133 | 4,965,039 |
| Spectrum ASA (a) | | 795,172 | 3,658,199 |
|
| TOTAL NORWAY | | | 20,567,368 |
|
| Philippines - 0.2% | | | |
| Century Pacific Food, Inc. | | 9,401,500 | 3,093,123 |
| Romania - 0.4% | | | |
| Banca Transilvania SA | | 7,850,048 | 5,199,019 |
| Singapore - 1.6% | | | |
| Boustead Projs. Pte Ltd. (a) | | 994,106 | 608,353 |
| Boustead Singapore Ltd. | | 4,499,905 | 2,866,489 |
| Hour Glass Ltd. | | 8,087,500 | 3,994,113 |
| Mapletree Industrial (REIT) | | 4,336,794 | 5,556,212 |
| Wing Tai Holdings Ltd. | | 5,630,000 | 7,616,004 |
|
| TOTAL SINGAPORE | | | 20,641,171 |
|
| South Africa - 0.6% | | | |
| Clicks Group Ltd. | | 726,051 | 7,292,700 |
| Spain - 0.7% | | | |
| Hispania Activos Inmobiliarios SA | | 576,585 | 8,705,106 |
| Sweden - 1.4% | | | |
| Addlife AB (a) | | 99,154 | 1,886,291 |
| AddTech AB (B Shares) | | 281,419 | 5,067,722 |
| Coor Service Management Holding AB | | 515,800 | 3,217,453 |
| Granges AB | | 825,021 | 8,569,421 |
|
| TOTAL SWEDEN | | | 18,740,887 |
|
| Switzerland - 1.4% | | | |
| Daetwyler Holdings AG | | 36,603 | 6,194,920 |
| Vontobel Holdings AG | | 145,334 | 8,559,369 |
| VZ Holding AG | | 15,361 | 4,272,519 |
|
| TOTAL SWITZERLAND | | | 19,026,808 |
|
| Taiwan - 2.8% | | | |
| King's Town Bank | | 5,243,000 | 5,030,837 |
| Lumax International Corp. Ltd. | | 314,000 | 537,134 |
| Makalot Industrial Co. Ltd. | | 1,616,540 | 6,792,859 |
| Test Research, Inc. | | 2,867,000 | 3,808,690 |
| Tripod Technology Corp. | | 2,812,000 | 7,936,459 |
| Yageo Corp. | | 2,485,000 | 8,756,659 |
| Yung Chi Paint & Varnish Manufacturing Co. Ltd. | | 1,578,000 | 4,281,375 |
|
| TOTAL TAIWAN | | | 37,144,013 |
|
| Thailand - 1.1% | | | |
| Delta Electronics PCL (For. Reg.) | | 2,800,300 | 7,445,884 |
| TISCO Financial Group PCL | | 3,290,000 | 7,250,361 |
|
| TOTAL THAILAND | | | 14,696,245 |
|
| Turkey - 0.3% | | | |
| Aygaz A/S | | 989,000 | 3,945,475 |
| United Kingdom - 15.0% | | | |
| AEW UK REIT PLC (b) | | 3,009,468 | 3,902,735 |
| Alliance Pharma PLC | | 8,615,465 | 5,300,406 |
| Amec Foster Wheeler PLC | | 857,310 | 6,029,406 |
| Ashmore Group PLC | | 1,267,607 | 5,710,196 |
| Bond International Software PLC (a) | | 899,666 | 12 |
| Cineworld Group PLC | | 687,076 | 6,264,902 |
| Close Brothers Group PLC | | 341,180 | 7,476,886 |
| Countrywide PLC | | 3,323,607 | 7,307,289 |
| Diploma PLC | | 295,551 | 4,245,226 |
| Elementis PLC | | 1,348,200 | 5,311,906 |
| Empiric Student Property PLC | | 3,213,272 | 4,557,204 |
| Essentra PLC | | 1,112,800 | 7,804,632 |
| Exova Group Ltd. PLC | | 1,395,369 | 4,310,367 |
| Informa PLC | | 1,072,291 | 8,916,297 |
| ITE Group PLC | | 2,854,064 | 6,542,953 |
| James Fisher and Sons PLC | | 182,700 | 3,800,327 |
| Jardine Lloyd Thompson Group PLC | | 402,000 | 5,711,754 |
| John Wood Group PLC | | 811,800 | 7,985,712 |
| LivaNova PLC (a) | | 189,100 | 9,965,570 |
| Luxfer Holdings PLC sponsored ADR | | 843,509 | 9,860,620 |
| McColl's Retail Group PLC | | 3,083,652 | 8,267,468 |
| Mears Group PLC | | 1,465,810 | 9,891,274 |
| Melrose Industries PLC | | 2,514,228 | 7,701,452 |
| Micro Focus International PLC | | 459,944 | 15,417,225 |
| PayPoint PLC | | 352,811 | 4,647,291 |
| Sinclair Pharma PLC (a) | | 12,139,907 | 5,267,409 |
| Spectris PLC | | 195,480 | 6,987,925 |
| Ten Entertainment Group PLC | | 2,193,500 | 4,694,788 |
| The Restaurant Group PLC | | 761,100 | 3,445,290 |
| Topps Tiles PLC | | 5,532,808 | 7,434,821 |
| Ultra Electronics Holdings PLC | | 114,125 | 3,092,284 |
| Volution Group PLC | | 114,700 | 291,177 |
|
| TOTAL UNITED KINGDOM | | | 198,142,804 |
|
| United States of America - 0.4% | | | |
| Dillard's, Inc. Class A (b) | | 86,694 | 4,800,247 |
| Wecast Network, Inc. warrants 8/30/17 (a)(c) | | 27,500 | 1,612 |
|
| TOTAL UNITED STATES OF AMERICA | | | 4,801,859 |
|
| TOTAL COMMON STOCKS | | | |
| (Cost $1,081,086,065) | | | 1,238,119,879 |
|
| Preferred Stocks - 1.4% | | | |
| Convertible Preferred Stocks - 0.2% | | | |
| India - 0.2% | | | |
| PC Jeweller Ltd. 13.00% (c) | | 20,810,176 | 3,217,165 |
| Nonconvertible Preferred Stocks - 1.2% | | | |
| Brazil - 1.2% | | | |
| Alpargatas SA (PN) | | 1,841,800 | 7,717,566 |
| Banco ABC Brasil SA | | 1,390,219 | 7,805,076 |
| | | | 15,522,642 |
| TOTAL PREFERRED STOCKS | | | |
| (Cost $14,008,204) | | | 18,739,807 |
|
| Money Market Funds - 6.4% | | | |
| Fidelity Cash Central Fund, 0.85% (d) | | 65,961,149 | 65,974,342 |
| Fidelity Securities Lending Cash Central Fund 0.86% (d)(e) | | 18,369,526 | 18,371,363 |
| TOTAL MONEY MARKET FUNDS | | | |
| (Cost $84,336,820) | | | 84,345,705 |
| TOTAL INVESTMENT PORTFOLIO - 101.2% | | | |
| (Cost $1,179,431,089) | | | 1,341,205,391 |
| NET OTHER ASSETS (LIABILITIES) - (1.2)% | | | (16,009,111) |
| NET ASSETS - 100% | | | $1,325,196,280 |
Categorizations in the Schedule of Investments are based on country or territory of incorporation.
Legend
(a) Non-income producing
(b) Security or a portion of the security is on loan at period end.
(c) Restricted securities - Investment in securities not registered under the Securities Act of 1933 (excluding 144A issues). At the end of the period, the value of restricted securities (excluding 144A issues) amounted to $3,218,777 or 0.2% of net assets.
(d) Affiliated fund that is generally available only to investment companies and other accounts managed by Fidelity Investments. The rate quoted is the annualized seven-day yield of the fund at period end. A complete unaudited listing of the fund's holdings as of its most recent quarter end is available upon request. In addition, each Fidelity Central Fund's financial statements are available on the SEC's website or upon request.
(e) Investment made with cash collateral received from securities on loan.
Additional information on each restricted holding is as follows:
| Security | Acquisition Date | Acquisition Cost |
| PC Jeweller Ltd. 13.00% | 7/28/16 | $3,105,681 |
| Wecast Network, Inc. warrants 8/30/17 | 9/14/12 | $0 |
Affiliated Central Funds
Information regarding fiscal year to date income earned by the Fund from investments in Fidelity Central Funds is as follows:
| Fund | Income earned |
| Fidelity Cash Central Fund | $171,359 |
| Fidelity Securities Lending Cash Central Fund | 112,622 |
| Total | $283,981 |
Investment Valuation
The following is a summary of the inputs used, as of April 30, 2017, involving the Fund's assets and liabilities carried at fair value. The inputs or methodology used for valuing securities may not be an indication of the risk associated with investing in those securities. For more information on valuation inputs, and their aggregation into the levels used below, please refer to the Investment Valuation section in the accompanying Notes to Financial Statements.
| | Valuation Inputs at Reporting Date: |
| Description | Total | Level 1 | Level 2 | Level 3 |
| Investments in Securities: | | | | |
| Equities: | | | | |
| Consumer Discretionary | $227,947,796 | $219,017,820 | $3,218,777 | $5,711,199 |
| Consumer Staples | 116,786,729 | 116,786,729 | -- | -- |
| Energy | 47,899,747 | 47,899,747 | -- | -- |
| Financials | 169,991,120 | 169,991,120 | -- | -- |
| Health Care | 114,948,381 | 114,948,381 | -- | -- |
| Industrials | 243,101,730 | 243,101,730 | -- | -- |
| Information Technology | 122,750,940 | 122,750,927 | -- | 13 |
| Materials | 130,011,105 | 130,011,104 | -- | 1 |
| Real Estate | 79,476,663 | 79,476,663 | -- | -- |
| Utilities | 3,945,475 | 3,945,475 | -- | -- |
| Money Market Funds | 84,345,705 | 84,345,705 | -- | -- |
| Total Investments in Securities: | $1,341,205,391 | $1,332,275,401 | $3,218,777 | $5,711,213 |
See accompanying notes which are an integral part of the financial statements.
Financial Statements
Statement of Assets and Liabilities
| | | April 30, 2017 (Unaudited) |
| Assets | | |
Investment in securities, at value (including securities loaned of $17,465,466) — See accompanying schedule:
Unaffiliated issuers (cost $1,095,094,269) | $1,256,859,686 | |
| Fidelity Central Funds (cost $84,336,820) | 84,345,705 | |
| Total Investments (cost $1,179,431,089) | | $1,341,205,391 |
| Receivable for investments sold | | 3,343 |
| Receivable for fund shares sold | | 3,346,211 |
| Dividends receivable | | 6,828,862 |
| Distributions receivable from Fidelity Central Funds | | 70,707 |
| Prepaid expenses | | 575 |
| Other receivables | | 555,557 |
| Total assets | | 1,352,010,646 |
| Liabilities | | |
| Payable to custodian bank | $264,922 | |
| Payable for investments purchased | 5,616,421 | |
| Payable for fund shares redeemed | 1,045,432 | |
| Accrued management fee | 1,049,176 | |
| Distribution and service plan fees payable | 26,355 | |
| Other affiliated payables | 236,342 | |
| Other payables and accrued expenses | 202,708 | |
| Collateral on securities loaned | 18,373,010 | |
| Total liabilities | | 26,814,366 |
| Net Assets | | $1,325,196,280 |
| Net Assets consist of: | | |
| Paid in capital | | $1,156,961,463 |
| Undistributed net investment income | | 6,128,094 |
| Accumulated undistributed net realized gain (loss) on investments and foreign currency transactions | | 467,665 |
| Net unrealized appreciation (depreciation) on investments and assets and liabilities in foreign currencies | | 161,639,058 |
| Net Assets | | $1,325,196,280 |
| Calculation of Maximum Offering Price | | |
| Class A: | | |
| Net Asset Value and redemption price per share ($40,308,447 ÷ 1,560,157 shares) | | $25.84 |
| Maximum offering price per share (100/94.25 of $25.84) | | $27.42 |
| Class M: | | |
| Net Asset Value and redemption price per share ($15,096,405 ÷ 586,994 shares) | | $25.72 |
| Maximum offering price per share (100/96.50 of $25.72) | | $26.65 |
| Class C: | | |
| Net Asset Value and offering price per share ($15,352,410 ÷ 613,564 shares)(a) | | $25.02 |
| International Small Cap: | | |
| Net Asset Value, offering price and redemption price per share ($1,180,177,592 ÷ 44,928,811 shares) | | $26.27 |
| Class I: | | |
| Net Asset Value, offering price and redemption price per share ($74,261,426 ÷ 2,808,295 shares) | | $26.44 |
(a) Redemption price per share is equal to net asset value less any applicable contingent deferred sales charge.
See accompanying notes which are an integral part of the financial statements.
Statement of Operations
| | | Six months ended April 30, 2017 (Unaudited) |
| Investment Income | | |
| Dividends | | $15,017,057 |
| Income from Fidelity Central Funds | | 283,981 |
| Income before foreign taxes withheld | | 15,301,038 |
| Less foreign taxes withheld | | (1,542,244) |
| Total income | | 13,758,794 |
| Expenses | | |
| Management fee | | |
| Basic fee | $4,718,749 | |
| Performance adjustment | 769,953 | |
| Transfer agent fees | 1,076,041 | |
| Distribution and service plan fees | 146,145 | |
| Accounting and security lending fees | 257,855 | |
| Custodian fees and expenses | 169,982 | |
| Independent trustees' fees and expenses | 2,159 | |
| Registration fees | 75,025 | |
| Audit | 42,318 | |
| Legal | 1,089 | |
| Miscellaneous | 3,793 | |
| Total expenses before reductions | 7,263,109 | |
| Expense reductions | (51,181) | 7,211,928 |
| Net investment income (loss) | | 6,546,866 |
| Realized and Unrealized Gain (Loss) | | |
| Net realized gain (loss) on: | | |
| Investment securities: | | |
| Unaffiliated issuers | 9,687,148 | |
| Fidelity Central Funds | (957) | |
| Foreign currency transactions | (65,079) | |
| Total net realized gain (loss) | | 9,621,112 |
Change in net unrealized appreciation (depreciation) on:
Investment securities (net of decrease in deferred foreign taxes of $7,171) | 112,488,557 | |
| Assets and liabilities in foreign currencies | 66,516 | |
| Total change in net unrealized appreciation (depreciation) | | 112,555,073 |
| Net gain (loss) | | 122,176,185 |
| Net increase (decrease) in net assets resulting from operations | | $128,723,051 |
See accompanying notes which are an integral part of the financial statements.
Statement of Changes in Net Assets
| | Six months ended April 30, 2017 (Unaudited) | Year ended October 31, 2016 |
| Increase (Decrease) in Net Assets | | |
| Operations | | |
| Net investment income (loss) | $6,546,866 | $15,277,971 |
| Net realized gain (loss) | 9,621,112 | 12,084,769 |
| Change in net unrealized appreciation (depreciation) | 112,555,073 | 49,975,496 |
| Net increase (decrease) in net assets resulting from operations | 128,723,051 | 77,338,236 |
| Distributions to shareholders from net investment income | (14,393,212) | (10,933,091) |
| Distributions to shareholders from net realized gain | (12,478,859) | (23,540,154) |
| Total distributions | (26,872,071) | (34,473,245) |
| Share transactions - net increase (decrease) | 232,106,959 | 74,066,306 |
| Redemption fees | 93,065 | 222,176 |
| Total increase (decrease) in net assets | 334,051,004 | 117,153,473 |
| Net Assets | | |
| Beginning of period | 991,145,276 | 873,991,803 |
| End of period | $1,325,196,280 | $991,145,276 |
| Other Information | | |
| Undistributed net investment income end of period | $6,128,094 | $13,974,440 |
See accompanying notes which are an integral part of the financial statements.
Financial Highlights — Fidelity International Small Cap Fund Class A
| | Six months ended (Unaudited) April 30, | Years ended October 31, | | | | |
| | 2017 | 2016 | 2015 | 2014 | 2013 | 2012 |
| Selected Per–Share Data | | | | | | |
| Net asset value, beginning of period | $23.81 | $22.69 | $24.98 | $26.34 | $19.74 | $18.97 |
| Income from Investment Operations | | | | | | |
| Net investment income (loss)A | .11 | .34 | .27 | .17 | .06 | .06 |
| Net realized and unrealized gain (loss) | 2.49 | 1.64 | 1.05 | (.89) | 6.94 | 1.09 |
| Total from investment operations | 2.60 | 1.98 | 1.32 | (.72) | 7.00 | 1.15 |
| Distributions from net investment income | (.28) | (.25) | (.16) | (.05) | (.07) | (.11) |
| Distributions from net realized gain | (.29) | (.62) | (3.45) | (.60) | (.33) | (.27) |
| Total distributions | (.57) | (.87) | (3.61) | (.65) | (.40) | (.38) |
| Redemption fees added to paid in capitalA | –B | .01 | –B | .01 | –B | –B |
| Net asset value, end of period | $25.84 | $23.81 | $22.69 | $24.98 | $26.34 | $19.74 |
| Total ReturnC,D,E | 11.20% | 9.11% | 6.21% | (2.79)% | 36.18% | 6.28% |
| Ratios to Average Net AssetsF,G | | | | | | |
| Expenses before reductions | 1.59%H | 1.61% | 1.59% | 1.50% | 1.61% | 1.63% |
| Expenses net of fee waivers, if any | 1.59%H | 1.61% | 1.58% | 1.50% | 1.61% | 1.63% |
| Expenses net of all reductions | 1.58%H | 1.61% | 1.58% | 1.50% | 1.60% | 1.60% |
| Net investment income (loss) | .89%H | 1.50% | 1.18% | .65% | .25% | .32% |
| Supplemental Data | | | | | | |
| Net assets, end of period (000 omitted) | $40,308 | $36,480 | $28,238 | $24,572 | $24,020 | $14,125 |
| Portfolio turnover rateI | 16%H | 29% | 36% | 102% | 54% | 68% |
A Calculated based on average shares outstanding during the period.
B Amount represents less than $.005 per share.
C Total returns for periods of less than one year are not annualized.
D Total returns would have been lower if certain expenses had not been reduced during the applicable periods shown.
E Total returns do not include the effect of the sales charges.
F Fees and expenses of any underlying Fidelity Central Funds are not included in the Fund's expense ratio. The Fund indirectly bears its proportionate share of the expenses of any underlying Fidelity Central Funds.
G Expense ratios reflect operating expenses of the class. Expenses before reductions do not reflect amounts reimbursed by the investment adviser or reductions from brokerage service arrangements or reductions from other expense offset arrangements and do not represent the amount paid by the class during periods when reimbursements or reductions occur. Expenses net of fee waivers reflect expenses after reimbursement by the investment adviser but prior to reductions from brokerage service arrangements or other expense offset arrangements. Expenses net of all reductions represent the net expenses paid by the class.
H Annualized
I Amount does not include the portfolio activity of any underlying Fidelity Central Funds.
See accompanying notes which are an integral part of the financial statements.
Financial Highlights — Fidelity International Small Cap Fund Class M
| | Six months ended (Unaudited) April 30, | Years ended October 31, | | | | |
| | 2017 | 2016 | 2015 | 2014 | 2013 | 2012 |
| Selected Per–Share Data | | | | | | |
| Net asset value, beginning of period | $23.65 | $22.55 | $24.81 | $26.17 | $19.59 | $18.80 |
| Income from Investment Operations | | | | | | |
| Net investment income (loss)A | .07 | .27 | .21 | .10 | –B | .01 |
| Net realized and unrealized gain (loss) | 2.48 | 1.63 | 1.04 | (.87) | 6.90 | 1.08 |
| Total from investment operations | 2.55 | 1.90 | 1.25 | (.77) | 6.90 | 1.09 |
| Distributions from net investment income | (.19) | (.19) | (.06) | – | – | (.03) |
| Distributions from net realized gain | (.29) | (.62) | (3.45) | (.60) | (.32) | (.27) |
| Total distributions | (.48) | (.81) | (3.51) | (.60) | (.32) | (.30) |
| Redemption fees added to paid in capitalA | –B | .01 | –B | .01 | –B | –B |
| Net asset value, end of period | $25.72 | $23.65 | $22.55 | $24.81 | $26.17 | $19.59 |
| Total ReturnC,D,E | 11.01% | 8.79% | 5.90% | (3.00)% | 35.80% | 5.97% |
| Ratios to Average Net AssetsF,G | | | | | | |
| Expenses before reductions | 1.87%H | 1.90% | 1.87% | 1.77% | 1.87% | 1.88% |
| Expenses net of fee waivers, if any | 1.87%H | 1.90% | 1.86% | 1.77% | 1.87% | 1.88% |
| Expenses net of all reductions | 1.86%H | 1.90% | 1.86% | 1.76% | 1.85% | 1.85% |
| Net investment income (loss) | .61%H | 1.21% | .90% | .38% | (.01)% | .07% |
| Supplemental Data | | | | | | |
| Net assets, end of period (000 omitted) | $15,096 | $13,331 | $12,400 | $12,296 | $13,530 | $9,262 |
| Portfolio turnover rateI | 16%H | 29% | 36% | 102% | 54% | 68% |
A Calculated based on average shares outstanding during the period.
B Amount represents less than $.005 per share.
C Total returns for periods of less than one year are not annualized.
D Total returns would have been lower if certain expenses had not been reduced during the applicable periods shown.
E Total returns do not include the effect of the sales charges.
F Fees and expenses of any underlying Fidelity Central Funds are not included in the Fund's expense ratio. The Fund indirectly bears its proportionate share of the expenses of any underlying Fidelity Central Funds.
G Expense ratios reflect operating expenses of the class. Expenses before reductions do not reflect amounts reimbursed by the investment adviser or reductions from brokerage service arrangements or reductions from other expense offset arrangements and do not represent the amount paid by the class during periods when reimbursements or reductions occur. Expenses net of fee waivers reflect expenses after reimbursement by the investment adviser but prior to reductions from brokerage service arrangements or other expense offset arrangements. Expenses net of all reductions represent the net expenses paid by the class.
H Annualized
I Amount does not include the portfolio activity of any underlying Fidelity Central Funds.
See accompanying notes which are an integral part of the financial statements.
Financial Highlights — Fidelity International Small Cap Fund Class C
| | Six months ended (Unaudited) April 30, | Years ended October 31, | | | | |
| | 2017 | 2016 | 2015 | 2014 | 2013 | 2012 |
| Selected Per–Share Data | | | | | | |
| Net asset value, beginning of period | $22.97 | $21.96 | $24.27 | $25.68 | $19.18 | $18.38 |
| Income from Investment Operations | | | | | | |
| Net investment income (loss)A | .01 | .16 | .09 | (.02) | (.11) | (.08) |
| Net realized and unrealized gain (loss) | 2.41 | 1.59 | 1.02 | (.85) | 6.79 | 1.07 |
| Total from investment operations | 2.42 | 1.75 | 1.11 | (.87) | 6.68 | .99 |
| Distributions from net investment income | (.08) | (.13) | – | – | – | – |
| Distributions from net realized gain | (.29) | (.62) | (3.42) | (.55) | (.18) | (.19) |
| Total distributions | (.37) | (.75) | (3.42) | (.55) | (.18) | (.19) |
| Redemption fees added to paid in capitalA | –B | .01 | –B | .01 | –B | –B |
| Net asset value, end of period | $25.02 | $22.97 | $21.96 | $24.27 | $25.68 | $19.18 |
| Total ReturnC,D,E | 10.73% | 8.26% | 5.37% | (3.43)% | 35.15% | 5.46% |
| Ratios to Average Net AssetsF,G | | | | | | |
| Expenses before reductions | 2.38%H | 2.40% | 2.36% | 2.23% | 2.33% | 2.38% |
| Expenses net of fee waivers, if any | 2.38%H | 2.40% | 2.35% | 2.22% | 2.33% | 2.38% |
| Expenses net of all reductions | 2.37%H | 2.39% | 2.35% | 2.22% | 2.32% | 2.35% |
| Net investment income (loss) | .10%H | .71% | .41% | (.07)% | (.47)% | (.43)% |
| Supplemental Data | | | | | | |
| Net assets, end of period (000 omitted) | $15,352 | $12,187 | $11,359 | $12,576 | $13,426 | $6,799 |
| Portfolio turnover rateI | 16%H | 29% | 36% | 102% | 54% | 68% |
A Calculated based on average shares outstanding during the period.
B Amount represents less than $.005 per share.
C Total returns for periods of less than one year are not annualized.
D Total returns would have been lower if certain expenses had not been reduced during the applicable periods shown.
E Total returns do not include the effect of the contingent deferred sales charge.
F Fees and expenses of any underlying Fidelity Central Funds are not included in the Fund's expense ratio. The Fund indirectly bears its proportionate share of the expenses of any underlying Fidelity Central Funds.
G Expense ratios reflect operating expenses of the class. Expenses before reductions do not reflect amounts reimbursed by the investment adviser or reductions from brokerage service arrangements or reductions from other expense offset arrangements and do not represent the amount paid by the class during periods when reimbursements or reductions occur. Expenses net of fee waivers reflect expenses after reimbursement by the investment adviser but prior to reductions from brokerage service arrangements or other expense offset arrangements. Expenses net of all reductions represent the net expenses paid by the class.
H Annualized
I Amount does not include the portfolio activity of any underlying Fidelity Central Funds.
See accompanying notes which are an integral part of the financial statements.
Financial Highlights — Fidelity International Small Cap Fund
| | Six months ended (Unaudited) April 30, | Years ended October 31, | | | | |
| | 2017 | 2016 | 2015 | 2014 | 2013 | 2012 |
| Selected Per–Share Data | | | | | | |
| Net asset value, beginning of period | $24.23 | $23.06 | $25.34 | $26.67 | $19.99 | $19.23 |
| Income from Investment Operations | | | | | | |
| Net investment income (loss)A | .15 | .40 | .34 | .25 | .12 | .11 |
| Net realized and unrealized gain (loss) | 2.52 | 1.67 | 1.07 | (.90) | 7.02 | 1.10 |
| Total from investment operations | 2.67 | 2.07 | 1.41 | (.65) | 7.14 | 1.21 |
| Distributions from net investment income | (.34) | (.29) | (.24) | (.09) | (.14) | (.18) |
| Distributions from net realized gain | (.29) | (.62) | (3.45) | (.60) | (.33) | (.27) |
| Total distributions | (.63) | (.91) | (3.69) | (.69) | (.46)B | (.45) |
| Redemption fees added to paid in capitalA | –C | .01 | –C | .01 | –C | –C |
| Net asset value, end of period | $26.27 | $24.23 | $23.06 | $25.34 | $26.67 | $19.99 |
| Total ReturnD,E | 11.34% | 9.39% | 6.53% | (2.48)% | 36.56% | 6.55% |
| Ratios to Average Net AssetsF,G | | | | | | |
| Expenses before reductions | 1.27%H | 1.34% | 1.31% | 1.21% | 1.33% | 1.35% |
| Expenses net of fee waivers, if any | 1.27%H | 1.34% | 1.31% | 1.20% | 1.32% | 1.35% |
| Expenses net of all reductions | 1.26%H | 1.33% | 1.31% | 1.20% | 1.31% | 1.33% |
| Net investment income (loss) | 1.21%H | 1.77% | 1.45% | .95% | .53% | .59% |
| Supplemental Data | | | | | | |
| Net assets, end of period (000 omitted) | $1,180,178 | $906,420 | $811,534 | $842,031 | $1,029,629 | $692,769 |
| Portfolio turnover rateI | 16%H | 29% | 36% | 102% | 54% | 68% |
A Calculated based on average shares outstanding during the period.
B Total distributions of $.46 per share is comprised of distributions from net investment income of $.136 and distributions from net realized gain of $.327 per share.
C Amount represents less than $.005 per share.
D Total returns for periods of less than one year are not annualized.
E Total returns would have been lower if certain expenses had not been reduced during the applicable periods shown.
F Fees and expenses of any underlying Fidelity Central Funds are not included in the Fund's expense ratio. The Fund indirectly bears its proportionate share of the expenses of any underlying Fidelity Central Funds.
G Expense ratios reflect operating expenses of the class. Expenses before reductions do not reflect amounts reimbursed by the investment adviser or reductions from brokerage service arrangements or reductions from other expense offset arrangements and do not represent the amount paid by the class during periods when reimbursements or reductions occur. Expenses net of fee waivers reflect expenses after reimbursement by the investment adviser but prior to reductions from brokerage service arrangements or other expense offset arrangements. Expenses net of all reductions represent the net expenses paid by the class.
H Annualized
I Amount does not include the portfolio activity of any underlying Fidelity Central Funds.
See accompanying notes which are an integral part of the financial statements.
Financial Highlights — Fidelity International Small Cap Fund Class I
| | Six months ended (Unaudited) April 30, | Years ended October 31, | | | | |
| | 2017 | 2016 | 2015 | 2014 | 2013 | 2012 |
| Selected Per–Share Data | | | | | | |
| Net asset value, beginning of period | $24.42 | $23.24 | $25.34 | $26.67 | $20.00 | $19.24 |
| Income from Investment Operations | | | | | | |
| Net investment income (loss)A | .14 | .41 | .36 | .29 | .16 | .13 |
| Net realized and unrealized gain (loss) | 2.54 | 1.69 | 1.07 | (.90) | 7.00 | 1.10 |
| Total from investment operations | 2.68 | 2.10 | 1.43 | (.61) | 7.16 | 1.23 |
| Distributions from net investment income | (.37) | (.31) | (.08) | (.13) | (.16) | (.20) |
| Distributions from net realized gain | (.29) | (.62) | (3.45) | (.60) | (.33) | (.27) |
| Total distributions | (.66) | (.93) | (3.53) | (.73) | (.49) | (.47) |
| Redemption fees added to paid in capitalA | –B | .01 | –B | .01 | –B | –B |
| Net asset value, end of period | $26.44 | $24.42 | $23.24 | $25.34 | $26.67 | $20.00 |
| Total ReturnC,D | 11.31% | 9.43% | 6.60% | (2.35)% | 36.68% | 6.65% |
| Ratios to Average Net AssetsE,F | | | | | | |
| Expenses before reductions | 1.31%G | 1.31% | 1.24% | 1.08% | 1.20% | 1.25% |
| Expenses net of fee waivers, if any | 1.31%G | 1.31% | 1.23% | 1.08% | 1.20% | 1.25% |
| Expenses net of all reductions | 1.30%G | 1.31% | 1.23% | 1.08% | 1.18% | 1.22% |
| Net investment income (loss) | 1.17%G | 1.80% | 1.53% | 1.07% | .66% | .70% |
| Supplemental Data | | | | | | |
| Net assets, end of period (000 omitted) | $74,261 | $22,727 | $10,070 | $8,092 | $67,038 | $9,503 |
| Portfolio turnover rateH | 16%G | 29% | 36% | 102% | 54% | 68% |
A Calculated based on average shares outstanding during the period.
B Amount represents less than $.005 per share.
C Total returns for periods of less than one year are not annualized.
D Total returns would have been lower if certain expenses had not been reduced during the applicable periods shown.
E Fees and expenses of any underlying Fidelity Central Funds are not included in the Fund's expense ratio. The Fund indirectly bears its proportionate share of the expenses of any underlying Fidelity Central Funds.
F Expense ratios reflect operating expenses of the class. Expenses before reductions do not reflect amounts reimbursed by the investment adviser or reductions from brokerage service arrangements or reductions from other expense offset arrangements and do not represent the amount paid by the class during periods when reimbursements or reductions occur. Expenses net of fee waivers reflect expenses after reimbursement by the investment adviser but prior to reductions from brokerage service arrangements or other expense offset arrangements. Expenses net of all reductions represent the net expenses paid by the class.
G Annualized
H Amount does not include the portfolio activity of any underlying Fidelity Central Funds.
See accompanying notes which are an integral part of the financial statements.
Notes to Financial Statements (Unaudited)
For the period ended April 30, 2017
1. Organization.
Fidelity International Small Cap Fund (the Fund) is a fund of Fidelity Investment Trust (the Trust) and is authorized to issue an unlimited number of shares. The Trust is registered under the Investment Company Act of 1940, as amended (the 1940 Act), as an open-end management investment company organized as a Massachusetts business trust. The Fund offers Class A, Class M (formerly Class T), Class C, International Small Cap and Class I shares, each of which has equal rights as to assets and voting privileges. Each class has exclusive voting rights with respect to matters that affect that class. The Fund's investments in emerging markets can be subject to social, economic, regulatory, and political uncertainties and can be extremely volatile.
After the close of business on June 24, 2016, all outstanding Class B shares were converted to Class A shares. All prior fiscal period dollar and share amounts for Class B presented in the Notes to Financial Statements are for the period November 1, 2015 through June 24, 2016.
2. Investments in Fidelity Central Funds.
The Fund invests in Fidelity Central Funds, which are open-end investment companies generally available only to other investment companies and accounts managed by the investment adviser and its affiliates. The Fund's Schedule of Investments lists each of the Fidelity Central Funds held as of period end, if any, as an investment of the Fund, but does not include the underlying holdings of each Fidelity Central Fund. As an Investing Fund, the Fund indirectly bears its proportionate share of the expenses of the underlying Fidelity Central Funds.
The Money Market Central Funds seek preservation of capital and current income and are managed by Fidelity Investments Money Management, Inc. (FIMM), an affiliate of the investment adviser. Annualized expenses of the Money Market Central Funds as of their most recent shareholder report date are less than .005%.
A complete unaudited list of holdings for each Fidelity Central Fund is available upon request or at the Securities and Exchange Commission (the SEC) website at www.sec.gov. In addition, the financial statements of the Fidelity Central Funds are available on the SEC website or upon request.
3. Significant Accounting Policies.
The Fund is an investment company and applies the accounting and reporting guidance of the Financial Accounting Standards Board (FASB) Accounting Standards Codification Topic 946 Financial Services – Investments Companies. The financial statements have been prepared in conformity with accounting principles generally accepted in the United States of America (GAAP), which require management to make certain estimates and assumptions at the date of the financial statements. Actual results could differ from those estimates. Subsequent events, if any, through the date that the financial statements were issued have been evaluated in the preparation of the financial statements. The following summarizes the significant accounting policies of the Fund:
Investment Valuation. Investments are valued as of 4:00 p.m. Eastern time on the last calendar day of the period. The Board of Trustees (the Board) has delegated the day to day responsibility for the valuation of the Fund's investments to the Fair Value Committee (the Committee) established by the Fund's investment adviser. In accordance with valuation policies and procedures approved by the Board, the Fund attempts to obtain prices from one or more third party pricing vendors or brokers to value its investments. When current market prices, quotations or currency exchange rates are not readily available or reliable, investments will be fair valued in good faith by the Committee, in accordance with procedures adopted by the Board. Factors used in determining fair value vary by investment type and may include market or investment specific events. The frequency with which these procedures are used cannot be predicted and they may be utilized to a significant extent. The Committee oversees the Fund's valuation policies and procedures and reports to the Board on the Committee's activities and fair value determinations. The Board monitors the appropriateness of the procedures used in valuing the Fund's investments and ratifies the fair value determinations of the Committee.
The Fund categorizes the inputs to valuation techniques used to value its investments into a disclosure hierarchy consisting of three levels as shown below:
- Level 1 – quoted prices in active markets for identical investments
- Level 2 – other significant observable inputs (including quoted prices for similar investments, interest rates, prepayment speeds, etc.)
- Level 3 – unobservable inputs (including the Fund's own assumptions based on the best information available)
Valuation techniques used to value the Fund's investments by major category are as follows:
Equity securities, including restricted securities, for which market quotations are readily available, are valued at the last reported sale price or official closing price as reported by a third party pricing vendor on the primary market or exchange on which they are traded and are categorized as Level 1 in the hierarchy. In the event there were no sales during the day or closing prices are not available, securities are valued at the last quoted bid price or may be valued using the last available price and are generally categorized as Level 2 in the hierarchy. For foreign equity securities, when market or security specific events arise, comparisons to the valuation of American Depositary Receipts (ADRs), futures contracts, Exchange-Traded Funds (ETFs) and certain indexes as well as quoted prices for similar securities may be used and would be categorized as Level 2 in the hierarchy. Utilizing these techniques may result in transfers between Level 1 and Level 2. For equity securities, including restricted securities, where observable inputs are limited, assumptions about market activity and risk are used and these securities may be categorized as Level 3 in the hierarchy.
Investments in open-end mutual funds, including the Fidelity Central Funds, are valued at their closing net asset value (NAV) each business day and are categorized as Level 1 in the hierarchy.
Changes in valuation techniques may result in transfers in or out of an assigned level within the disclosure hierarchy. The aggregate value of investments by input level as of April 30, 2017 is included at the end of the Fund's Schedule of Investments.
Foreign Currency. The Fund may use foreign currency contracts to facilitate transactions in foreign-denominated securities. Gains and losses from these transactions may arise from changes in the value of the foreign currency or if the counterparties do not perform under the contracts' terms.
Foreign-denominated assets, including investment securities, and liabilities are translated into U.S. dollars at the exchange rates at period end. Purchases and sales of investment securities, income and dividends received and expenses denominated in foreign currencies are translated into U.S. dollars at the exchange rate in effect on the transaction date.
The effects of exchange rate fluctuations on investments are included with the net realized and unrealized gain (loss) on investment securities. Other foreign currency transactions resulting in realized and unrealized gain (loss) are disclosed separately.
Investment Transactions and Income. For financial reporting purposes, the Fund's investment holdings and NAV include trades executed through the end of the last business day of the period. The NAV per share for processing shareholder transactions is calculated as of the close of business of the New York Stock Exchange (NYSE), normally 4:00 p.m. Eastern time and includes trades executed through the end of the prior business day. Gains and losses on securities sold are determined on the basis of identified cost and may include proceeds received from litigation. Dividend income is recorded on the ex-dividend date, except for certain dividends from foreign securities where the ex-dividend date may have passed, which are recorded as soon as the Fund is informed of the ex-dividend date. Non-cash dividends included in dividend income, if any, are recorded at the fair market value of the securities received. Income and capital gain distributions from Fidelity Central Funds, if any, are recorded on the ex-dividend date. Certain distributions received by the Fund represent a return of capital or capital gain. The Fund determines the components of these distributions subsequent to the ex-dividend date, based upon receipt of tax filings or other correspondence relating to the underlying investment. These distributions are recorded as a reduction of cost of investments and/or as a realized gain. Investment income is recorded net of foreign taxes withheld where recovery of such taxes is uncertain.
Class Allocations and Expenses. Investment income, realized and unrealized capital gains and losses, common expenses of the Fund, and certain fund-level expense reductions, if any, are allocated daily on a pro-rata basis to each class based on the relative net assets of each class to the total net assets of the Fund. Each class differs with respect to transfer agent and distribution and service plan fees incurred. Certain expense reductions may also differ by class. For the reporting period, the allocated portion of income and expenses to each class as a percent of its average net assets may vary due to the timing of recording these transactions in relation to fluctuating net assets of the classes. Expenses directly attributable to a fund are charged to that fund. Expenses attributable to more than one fund are allocated among the respective funds on the basis of relative net assets or other appropriate methods. Expense estimates are accrued in the period to which they relate and adjustments are made when actual amounts are known.
Income Tax Information and Distributions to Shareholders. Each year, the Fund intends to qualify as a regulated investment company under Subchapter M of the Internal Revenue Code, including distributing substantially all of its taxable income and realized gains. As a result, no provision for U.S. Federal income taxes is required. The Fund files a U.S. federal tax return, in addition to state and local tax returns as required. The Fund's federal income tax returns are subject to examination by the Internal Revenue Service (IRS) for a period of three fiscal years after they are filed. State and local tax returns may be subject to examination for an additional fiscal year depending on the jurisdiction. Foreign taxes are provided for based on the Fund's understanding of the tax rules and rates that exist in the foreign markets in which it invests. The Fund is subject to a tax imposed on capital gains by certain countries in which it invests. An estimated deferred tax liability for net unrealized appreciation on the applicable securities is included in Other payables and accrued expenses on the Statement of Assets & Liabilities.
Distributions are declared and recorded on the ex-dividend date. Income dividends and capital gain distributions are declared separately for each class. Income and capital gain distributions are determined in accordance with income tax regulations, which may differ from GAAP.
Capital accounts within the financial statements are adjusted for permanent book-tax differences. These adjustments have no impact on net assets or the results of operations. Capital accounts are not adjusted for temporary book-tax differences which will reverse in a subsequent period.
Book-tax differences are primarily due to foreign currency transactions, certain foreign taxes, passive foreign investment companies (PFIC) and losses deferred due to wash sales.
The federal tax cost of investment securities and unrealized appreciation (depreciation) as of period end were as follows:
| Gross unrealized appreciation | $238,432,680 |
| Gross unrealized depreciation | (77,233,134) |
| Net unrealized appreciation (depreciation) on securities | $161,199,546 |
| Tax cost | $1,180,005,845 |
Short-Term Trading (Redemption) Fees. Shares held by investors in the Fund less than 90 days may have been subject to a redemption fee equal to 2.00% of the NAV of shares redeemed. All redemption fees, which reduce the proceeds of the shareholder redemption, are retained by the Fund and accounted for as an addition to paid in capital.
Restricted Securities. The Fund may invest in securities that are subject to legal or contractual restrictions on resale. These securities generally may be resold in transactions exempt from registration or to the public if the securities are registered. Disposal of these securities may involve time-consuming negotiations and expense, and prompt sale at an acceptable price may be difficult. Information regarding restricted securities is included at the end of the Fund's Schedule of Investments.
4. Purchases and Sales of Investments.
Purchases and sales of securities, other than short-term securities, aggregated $278,457,187 and $82,932,855, respectively.
5. Fees and Other Transactions with Affiliates.
Management Fee. Fidelity Management & Research Company (the investment adviser) and its affiliates provide the Fund with investment management related services for which the Fund pays a monthly management fee. The management fee is the sum of an individual fund fee rate that is based on an annual rate of .60% of the Fund's average net assets and an annualized group fee rate that averaged .25% during the period. The group fee rate is based upon the average net assets of all the mutual funds advised by the investment adviser, including any mutual funds previously advised by the investment adviser that are currently advised by Fidelity SelectCo, LLC, an affiliate of the investment adviser. The group fee rate decreases as assets under management increase and increases as assets under management decrease. In addition, the management fee is subject to a performance adjustment (up to a maximum of +/- .20% of the Fund's average net assets over a 36 month performance period). The upward or downward adjustment to the management fee is based on the relative investment performance of International Small Cap as compared to its benchmark index, the MSCI ACWI (All Country World Index) ex USA Small Cap Index effective April 1, 2014 (the MSCI EAFE Small Cap Index prior to April 1, 2014), over the same 36 month performance period. For the reporting period, the total annualized management fee rate, including the performance adjustment, was .99% of the Fund's average net assets. The performance adjustment included in the management fee rate may be higher or lower than the maximum performance adjustment rate due to the difference between the average net assets for the reporting and performance periods.
Distribution and Service Plan Fees. In accordance with Rule 12b-1 of the 1940 Act, the Fund has adopted separate Distribution and Service Plans for each class of shares. Certain classes pay Fidelity Distributors Corporation (FDC), an affiliate of the investment adviser, separate Distribution and Service Fees, each of which is based on an annual percentage of each class' average net assets. In addition, FDC may pay financial intermediaries for selling shares of the Fund and providing shareholder support services. For the period, the Distribution and Service Fee rates, total fees and amounts retained by FDC were as follows:
| | Distribution
Fee | Service
Fee | Total Fees | Retained
by FDC |
| Class A | -% | .25% | $48,310 | $– |
| Class M | .25% | .25% | 34,852 | – |
| Class C | .75% | .25% | 62,983 | 11,728 |
| | | | $146,145 | $11,728 |
Sales Load. FDC may receive a front-end sales charge of up to 5.75% for selling Class A shares and 3.50% for selling Class M shares, some of which is paid to financial intermediaries for selling shares of the Fund. Depending on the holding period, FDC may receive contingent deferred sales charges levied on Class A, Class M and Class C redemptions. The deferred sales charges range from 1.00% for Class C shares, 1.00% for certain purchases of Class A shares and .25% for certain purchases of Class M shares.
For the period, sales charge amounts retained by FDC were as follows:
| | Retained
by FDC |
| Class A | $16,871 |
| Class M | 1,880 |
| Class C(a) | 1,020 |
| | $19,771 |
(a) When Class C shares are initially sold, FDC pays commissions from its own resources to financial intermediaries through which the sales are made.
Transfer Agent Fees. Fidelity Investments Institutional Operations Company, Inc., (FIIOC), an affiliate of the investment adviser, is the transfer, dividend disbursing and shareholder servicing agent for each class of the Fund. FIIOC receives account fees and asset-based fees that vary according to the account size and type of account of the shareholders of the respective classes of the Fund. IIOC pays for typesetting, printing and mailing of shareholder reports, except proxy statements.
For the period, transfer agent fees for each class were as follows:
| | Amount | % of
Class-Level Average
Net Assets(a) |
| Class A | $48,648 | .25 |
| Class M | 19,975 | .29 |
| Class C | 18,483 | .29 |
| International Small Cap | 939,656 | .19 |
| Class I | 49,279 | .23 |
| | $1,076,041 | |
(a) Annualized
Accounting and Security Lending Fees. Fidelity Service Company, Inc. (FSC), an affiliate of the investment adviser, maintains the Fund's accounting records. The accounting fee is based on the level of average net assets for each month. Under a separate contract, FSC administers the security lending program. The security lending fee is based on the number and duration of lending transactions.
Brokerage Commissions. The Fund placed a portion of its portfolio transactions with brokerage firms which are affiliates of the investment adviser. Brokerage commissions are included in net realized gain (loss) and change in net unrealized appreciation (depreciation) in the Statement of Operations. The commissions paid to these affiliated firms were $2,789 for the period.
Interfund Trades. The Fund may purchase from or sell securities to other Fidelity Funds under procedures adopted by the Board. The procedures have been designed to ensure these interfund trades are executed in accordance with Rule 17a-7 of the 1940 Act. Interfund trades are included within the respective purchases and sales amounts shown in the Purchases and Sales of Investments note.
6. Committed Line of Credit.
The Fund participates with other funds managed by the investment adviser or an affiliate in a $4.25 billion credit facility (the "line of credit") to be utilized for temporary or emergency purposes to fund shareholder redemptions or for other short-term liquidity purposes. The Fund has agreed to pay commitment fees on its pro-rata portion of the line of credit, which amounted to $1,807 and is reflected in Miscellaneous expenses on the Statement of Operations. During the period, the Fund did not borrow on this line of credit.
7. Security Lending.
The Fund lends portfolio securities through a lending agent from time to time in order to earn additional income. For equity securities, a lending agent is used and may loan securities to certain qualified borrowers, including Fidelity Capital Markets (FCM), a broker-dealer affiliated with the Fund. On the settlement date of the loan, the Fund receives collateral (in the form of U.S. Treasury obligations, letters of credit and/or cash) against the loaned securities and maintains collateral in an amount not less than 100% of the market value of the loaned securities during the period of the loan. The market value of the loaned securities is determined at the close of business of the Fund and any additional required collateral is delivered to the Fund on the next business day. The Fund or borrower may terminate the loan at any time, and if the borrower defaults on its obligation to return the securities loaned because of insolvency or other reasons, the Fund may apply collateral received from the borrower against the obligation. The Fund may experience delays and costs in recovering the securities loaned. Any cash collateral received is invested in the Fidelity Securities Lending Cash Central Fund. The value of loaned securities and cash collateral at period end are disclosed on the Fund's Statement of Assets and Liabilities. The value of securities loaned to FCM at period end was $903,189. Security lending income represents the income earned on investing cash collateral, less rebates paid to borrowers and any lending agent fees associated with the loan, plus any premium payments received for lending certain types of securities. Security lending income is presented in the Statement of Operations as a component of income from Fidelity Central Funds. Total security lending income during the period amounted to $112,622, including $11,707 from securities loaned to FCM.
8. Expense Reductions.
Commissions paid to certain brokers with whom the investment adviser, or its affiliates, places trades on behalf of the Fund include an amount in addition to trade execution, which may be rebated back to the Fund to offset certain expenses. This amount totaled $46,521 for the period. In addition, through arrangements with the Fund's custodian, credits realized as a result of certain uninvested cash balances were used to reduce the Fund's expenses. During the period, these credits reduced the Fund's expenses by $37.
In addition, during the period the investment adviser reimbursed and/or waived a portion of fund-level operating expenses in the amount of $4,623.
9. Distributions to Shareholders.
Distributions to shareholders of each class were as follows:
| | Six months ended April 30, 2017 | Year ended October 31, 2016 |
| From net investment income | | |
| Class A | $440,395 | $319,347 |
| Class M | 105,144 | 106,306 |
| Class B | – | 996 |
| Class C | 42,573 | 64,383 |
| International Small Cap | 13,342,577 | 10,307,620 |
| Class I | 462,523 | 134,439 |
| Total | $14,393,212 | $10,933,091 |
| From net realized gain | | |
| Class A | $461,138 | $788,825 |
| Class M | 163,369 | 339,739 |
| Class B | – | 10,287 |
| Class C | 151,895 | 319,340 |
| International Small Cap | 11,341,189 | 21,811,338 |
| Class I | 361,268 | 270,625 |
| Total | $12,478,859 | $23,540,154 |
10. Share Transactions.
Share transactions for each class were as follows and may contain automatic conversions between classes or exchanges between affiliated funds:
| | Shares | Shares | Dollars | Dollars |
| | Six months ended April 30, 2017 | Year ended October 31, 2016 | Six months ended April 30, 2017 | Year ended October 31, 2016 |
| Class A | | | | |
| Shares sold | 493,177 | 622,254 | $11,804,074 | $13,846,907 |
| Reinvestment of distributions | 38,390 | 49,226 | 881,445 | 1,077,561 |
| Shares redeemed | (503,251) | (383,922) | (12,141,598) | (8,560,022) |
| Net increase (decrease) | 28,316 | 287,558 | $543,921 | $6,364,446 |
| Class M | | | | |
| Shares sold | 70,799 | 133,036 | $1,669,865 | $2,846,482 |
| Reinvestment of distributions | 11,602 | 20,220 | 265,460 | 440,798 |
| Shares redeemed | (59,070) | (139,487) | (1,417,904) | (3,059,683) |
| Net increase (decrease) | 23,331 | 13,769 | $517,421 | $227,597 |
| Class B | | | | |
| Shares sold | – | 2,210 | $– | $44,410 |
| Reinvestment of distributions | – | 493 | – | 10,648 |
| Shares redeemed | – | (20,270) | – | (435,806) |
| Net increase (decrease) | – | (17,567) | $– | $(380,748) |
| Class C | | | | |
| Shares sold | 168,930 | 222,957 | $3,988,717 | $4,942,382 |
| Reinvestment of distributions | 8,175 | 16,869 | 182,379 | 358,801 |
| Shares redeemed | (93,994) | (226,514) | (2,152,912) | (4,770,771) |
| Net increase (decrease) | 83,111 | 13,312 | $2,018,184 | $530,412 |
| International Small Cap | | | | |
| Shares sold | 9,867,347 | 11,991,539 | $240,657,082 | $277,123,750 |
| Reinvestment of distributions | 1,029,746 | 1,408,054 | 24,013,687 | 31,286,953 |
| Shares redeemed | (3,376,773) | (11,188,601) | (82,018,784) | (253,612,350) |
| Net increase (decrease) | 7,520,320 | 2,210,992 | $182,651,985 | $54,798,353 |
| Class I | | | | |
| Shares sold | 2,063,330 | 924,076 | $50,964,089 | $21,994,159 |
| Reinvestment of distributions | 29,052 | 16,670 | 682,131 | 373,252 |
| Shares redeemed | (214,660) | (443,477) | (5,270,772) | (9,841,165) |
| Net increase (decrease) | 1,877,722 | 497,269 | $46,375,448 | $12,526,246 |
11. Other.
The Fund's organizational documents provide former and current trustees and officers with a limited indemnification against liabilities arising in connection with the performance of their duties to the Fund. In the normal course of business, the Fund may also enter into contracts that provide general indemnifications. The Fund's maximum exposure under these arrangements is unknown as this would be dependent on future claims that may be made against the Fund. The risk of material loss from such claims is considered remote.
Shareholder Expense Example
As a shareholder of the Fund, you incur two types of costs: (1) transaction costs, including sales charges (loads) on purchase payments or redemption proceeds, redemption fees and (2) ongoing costs, including management fees, distribution and/or service (12b-1) fees and other Fund expenses. This Example is intended to help you understand your ongoing costs (in dollars) of investing in the Fund and to compare these costs with the ongoing costs of investing in other mutual funds.
The Example is based on an investment of $1,000 invested at the beginning of the period and held for the entire period (November 1, 2016 to April 30, 2017).
Actual Expenses
The first line of the accompanying table for each class of the Fund provides information about actual account values and actual expenses. You may use the information in this line, together with the amount you invested, to estimate the expenses that you paid over the period. Simply divide your account value by $1,000.00 (for example, an $8,600 account value divided by $1,000.00 = 8.6), then multiply the result by the number in the first line for a class of the Fund under the heading entitled "Expenses Paid During Period" to estimate the expenses you paid on your account during this period. A small balance maintenance fee of $12.00 that is charged once a year may apply for certain accounts with a value of less than $2,000. This fee is not included in the table below. If it was, the estimate of expenses you paid during the period would be higher, and your ending account value lower, by this amount. In addition, the Fund, as a shareholder in the underlying Fidelity Central Funds, will indirectly bear its pro-rata share of the fees and expenses incurred by the underlying Fidelity Central Funds. These fees and expenses are not included in the Fund's annualized expense ratio used to calculate the expense estimate in the table below.
Hypothetical Example for Comparison Purposes
The second line of the accompanying table for each class of the Fund provides information about hypothetical account values and hypothetical expenses based on a Class' actual expense ratio and an assumed rate of return of 5% per year before expenses, which is not the Class' actual return. The hypothetical account values and expenses may not be used to estimate the actual ending account balance or expenses you paid for the period. You may use this information to compare the ongoing costs of investing in the Fund and other funds. To do so, compare this 5% hypothetical example with the 5% hypothetical examples that appear in the shareholder reports of the other funds. A small balance maintenance fee of $12.00 that is charged once a year may apply for certain accounts with a value of less than $2,000. This fee is not included in the table below. If it was, the estimate of expenses you paid during the period would be higher, and your ending account value lower, by this amount. In addition, the Fund, as a shareholder in the underlying Fidelity Central Funds, will indirectly bear its pro-rata share of the fees and expenses incurred by the underlying Fidelity Central Funds. These fees and expenses are not included in the Fund's annualized expense ratio used to calculate the expense estimate in the table below.
Please note that the expenses shown in the table are meant to highlight your ongoing costs only and do not reflect any transaction costs. Therefore, the second line of the table is useful in comparing ongoing costs only, and will not help you determine the relative total costs of owning different funds. In addition, if these transactional costs were included, your costs would have been higher.
| | Annualized Expense Ratio-A | Beginning
Account Value
November 1, 2016 | Ending
Account Value
April 30, 2017 | Expenses Paid
During Period-B
November 1, 2016
to April 30, 2017 |
| Class A | 1.59% | | | |
| Actual | | $1,000.00 | $1,112.00 | $8.33 |
| Hypothetical-C | | $1,000.00 | $1,016.91 | $7.95 |
| Class M | 1.87% | | | |
| Actual | | $1,000.00 | $1,110.10 | $9.78 |
| Hypothetical-C | | $1,000.00 | $1,015.52 | $9.35 |
| Class C | 2.38% | | | |
| Actual | | $1,000.00 | $1,107.30 | $12.44 |
| Hypothetical-C | | $1,000.00 | $1,012.99 | $11.88 |
| International Small Cap | 1.27% | | | |
| Actual | | $1,000.00 | $1,113.40 | $6.65 |
| Hypothetical-C | | $1,000.00 | $1,018.50 | $6.36 |
| Class I | 1.31% | | | |
| Actual | | $1,000.00 | $1,113.10 | $6.86 |
| Hypothetical-C | | $1,000.00 | $1,018.30 | $6.56 |
A Annualized expense ratio reflects expenses net of applicable fee waivers.
B Expenses are equal to each Class' annualized expense ratio, multiplied by the average account value over the period, multiplied by 181/365 (to reflect the one-half year period).
C 5% return per year before expenses

AISC-SANN-0617
1.800644.113
Fidelity® Emerging Markets Discovery Fund
Fidelity® Total Emerging Markets Fund
Semi-Annual Report April 30, 2017 |
|
Contents
To view a fund's proxy voting guidelines and proxy voting record for the 12-month period ended June 30, visit http://www.fidelity.com/proxyvotingresults or visit the Securities and Exchange Commission's (SEC) web site at http://www.sec.gov.
You may also call 1-800-544-8544 to request a free copy of the proxy voting guidelines.
Standard & Poor's, S&P and S&P 500 are registered service marks of The McGraw-Hill Companies, Inc. and have been licensed for use by Fidelity Distributors Corporation.
Other third-party marks appearing herein are the property of their respective owners.
All other marks appearing herein are registered or unregistered trademarks or service marks of FMR LLC or an affiliated company. © 2017 FMR LLC. All rights reserved.
This report and the financial statements contained herein are submitted for the general information of the shareholders of the Funds. This report is not authorized for distribution to prospective investors in the Funds unless preceded or accompanied by an effective prospectus.
A fund files its complete schedule of portfolio holdings with the SEC for the first and third quarters of each fiscal year on Form N-Q. Forms N-Q are available on the SEC’s web site at http://www.sec.gov. A fund's Forms N-Q may be reviewed and copied at the SEC’s Public Reference Room in Washington, DC. Information regarding the operation of the SEC's Public Reference Room may be obtained by calling 1-800-SEC-0330.
For a complete list of a fund's portfolio holdings, view the most recent holdings listing, semiannual report, or annual report on Fidelity's web site at http://www.fidelity.com, http://www.institutional.fidelity.com, or http://www.401k.com, as applicable.
NOT FDIC INSURED •MAY LOSE VALUE •NO BANK GUARANTEE
Neither the Funds nor Fidelity Distributors Corporation is a bank.
Fidelity® Emerging Markets Discovery Fund
Investment Summary (Unaudited)
Top Five Stocks as of April 30, 2017
| | % of fund's net assets | % of fund's net assets 6 months ago |
| Hyundai Motor Co. Series 2 (Korea (South), Automobiles) | 2.0 | 0.0 |
| Yandex NV Series A (Netherlands, Internet Software & Services) | 1.9 | 0.9 |
| Qingdao Haier Co. Ltd. (China, Household Durables) | 1.6 | 1.2 |
| Arvind Mills Ltd. (India, Textiles, Apparel & Luxury Goods) | 1.4 | 0.7 |
| Shangri-La Asia Ltd. (Bermuda, Hotels, Restaurants & Leisure) | 1.3 | 1.1 |
| | 8.2 | |
Top Five Market Sectors as of April 30, 2017
| | % of fund's net assets | % of fund's net assets 6 months ago |
| Consumer Discretionary | 16.2 | 16.3 |
| Information Technology | 14.8 | 16.3 |
| Industrials | 11.3 | 11.5 |
| Financials | 9.9 | 12.5 |
| Materials | 9.4 | 9.1 |
Top Five Countries as of April 30, 2017
| (excluding cash equivalents) | % of fund's net assets | % of fund's net assets 6 months ago |
| Korea (South) | 12.3 | 9.1 |
| United States of America | 10.6 | 5.9 |
| India | 9.2 | 12.4 |
| Cayman Islands | 9.0 | 10.5 |
| Brazil | 8.9 | 7.5 |
Percentages are adjusted for the effect of futures contracts, if applicable.
Asset Allocation (% of fund's net assets)
| As of April 30, 2017 |
| | Stocks and Equity Futures | 95.1% |
| | Short-Term Investments and Net Other Assets (Liabilities) | 4.9% |

| As of October 31, 2016 |
| | Stocks and Equity Futures | 95.9% |
| | Short-Term Investments and Net Other Assets (Liabilities) | 4.1% |

Percentages shown as 0.0% may reflect amounts less than 0.05%.
Fidelity® Emerging Markets Discovery Fund
Investments April 30, 2017 (Unaudited)
Showing Percentage of Net Assets
| Common Stocks - 81.4% | | | |
| | | Shares | Value |
| Argentina - 0.6% | | | |
| Grupo Superveille SA sponsored ADR | | 18,300 | $310,917 |
| Inversiones y Representaciones SA ADR (a)(b) | | 34,410 | 867,820 |
|
| TOTAL ARGENTINA | | | 1,178,737 |
|
| Bailiwick of Guernsey - 0.3% | | | |
| Etalon Group Ltd. GDR (Reg. S) | | 158,700 | 610,995 |
| Bailiwick of Jersey - 0.5% | | | |
| Atrium European Real Estate Ltd. | | 259,040 | 1,092,007 |
| Bangladesh - 0.2% | | | |
| BRAC Bank Ltd. | | 539,359 | 472,121 |
| Bermuda - 2.1% | | | |
| Credicorp Ltd. (United States) | | 2,600 | 399,516 |
| PAX Global Technology Ltd. | | 1,248,000 | 773,347 |
| Shangri-La Asia Ltd. | | 1,868,000 | 2,675,313 |
| Tai Cheung Holdings Ltd. | | 456,000 | 429,130 |
|
| TOTAL BERMUDA | | | 4,277,306 |
|
| Brazil - 8.0% | | | |
| Arezzo Industria e Comercio SA | | 138,200 | 1,467,318 |
| B2W Companhia Global do Varejo (a) | | 70,340 | 296,514 |
| B2W Companhia Global do Varejo rights (a) | | 23,943 | 99,044 |
| BM&F BOVESPA SA | | 51,300 | 307,246 |
| BR Malls Participacoes SA | | 163,800 | 725,064 |
| BR Properties SA (a) | | 163,600 | 486,566 |
| BTG Pactual Participations Ltd. unit | | 71,700 | 419,938 |
| Cia. Hering SA | | 139,400 | 967,089 |
| Companhia de Saneamento de Minas Gerais | | 57,200 | 648,761 |
| Cosan SA Industria e Comercio | | 92,900 | 1,086,158 |
| Direcional Engenharia SA | | 260,300 | 500,254 |
| Fibria Celulose SA | | 114,700 | 1,062,422 |
| FPC Par Corretora de Seguros | | 57,500 | 342,386 |
| Hypermarcas SA | | 196,438 | 1,860,376 |
| Localiza Rent A Car SA | | 85,900 | 1,280,090 |
| Minerva SA | | 166,300 | 529,176 |
| QGEP Participacoes SA | | 687,000 | 1,376,576 |
| Smiles SA | | 105,200 | 2,288,246 |
| Tegma Gestao Logistica SA | | 208,900 | 858,227 |
|
| TOTAL BRAZIL | | | 16,601,451 |
|
| British Virgin Islands - 0.2% | | | |
| Dolphin Capital Investors Ltd. (a) | | 2,452,257 | 247,741 |
| Mail.Ru Group Ltd. GDR (Reg. S) (a) | | 10,264 | 270,456 |
|
| TOTAL BRITISH VIRGIN ISLANDS | | | 518,197 |
|
| Canada - 1.0% | | | |
| Pan American Silver Corp. | | 60,900 | 1,021,293 |
| Torex Gold Resources, Inc. (a) | | 64,570 | 1,093,629 |
|
| TOTAL CANADA | | | 2,114,922 |
|
| Cayman Islands - 9.0% | | | |
| 51job, Inc. sponsored ADR (a) | | 25,600 | 1,049,344 |
| 58.com, Inc. ADR (a) | | 22,900 | 906,382 |
| Airtac International Group | | 79,000 | 901,797 |
| ASM Pacific Technology Ltd. | | 70,500 | 1,049,567 |
| Boyaa Interactive International Ltd. (a) | | 563,000 | 287,350 |
| Changyou.com Ltd. (A Shares) ADR (a)(b) | | 25,700 | 839,105 |
| Cheetah Mobile, Inc. ADR (a)(b) | | 24,900 | 262,446 |
| China State Construction International Holdings Ltd. | | 814,000 | 1,477,650 |
| Geely Automobile Holdings Ltd. | | 550,000 | 742,445 |
| Goodbaby International Holdings Ltd. | | 1,153,000 | 523,259 |
| Haitian International Holdings Ltd. | | 657,000 | 1,609,907 |
| IGG, Inc. | | 146,000 | 222,237 |
| JA Solar Holdings Co. Ltd. ADR (a)(b) | | 27,200 | 190,672 |
| JinkoSolar Holdings Co. Ltd. ADR (a)(b) | | 25,400 | 440,436 |
| Lee's Pharmaceutical Holdings Ltd. | | 518,500 | 514,610 |
| Pico Far East Holdings Ltd. | | 2,750,000 | 1,113,668 |
| Silicon Motion Technology Corp. sponsored ADR | | 5,100 | 247,605 |
| SINA Corp. | | 3,100 | 238,111 |
| Sinosoft Tech Group Ltd. | | 803,000 | 253,959 |
| SITC International Holdings Co. Ltd. | | 1,915,000 | 1,371,313 |
| Sunny Optical Technology Group Co. Ltd. | | 186,000 | 1,530,402 |
| TPK Holding Co. Ltd. (a) | | 59,000 | 210,833 |
| Uni-President China Holdings Ltd. | | 1,544,000 | 1,083,808 |
| Vinda International Holdings Ltd. | | 516,000 | 1,048,140 |
| Yirendai Ltd. sponsored ADR (a)(b) | | 7,300 | 182,208 |
| YY, Inc. ADR (a) | | 7,700 | 377,069 |
|
| TOTAL CAYMAN ISLANDS | | | 18,674,323 |
|
| Chile - 1.9% | | | |
| Compania Cervecerias Unidas SA sponsored ADR | | 40,500 | 1,043,685 |
| CorpBanca SA (a) | | 27,171,980 | 247,656 |
| Empresas CMPC SA | | 264,175 | 613,646 |
| Enersis SA | | 3,288,313 | 652,977 |
| Inversiones La Construccion SA | | 19,581 | 264,051 |
| Sociedad Quimica y Minera de Chile SA (PN-B) sponsored ADR | | 26,500 | 942,075 |
| Vina Concha y Toro SA | | 168,816 | 272,168 |
|
| TOTAL CHILE | | | 4,036,258 |
|
| China - 4.8% | | | |
| BBMG Corp. (H Shares) | | 1,772,000 | 949,975 |
| China Longyuan Power Grid Corp. Ltd. (H Shares) | | 833,200 | 641,636 |
| Huangshan Tourism Development Co. Ltd. | | 567,200 | 842,859 |
| Qingdao Haier Co. Ltd. | | 1,882,254 | 3,328,451 |
| Tong Ren Tang Technologies Co. Ltd. (H Shares) | | 1,022,000 | 1,721,213 |
| TravelSky Technology Ltd. (H Shares) | | 330,000 | 869,722 |
| Tsingtao Brewery Co. Ltd. (H Shares) | | 174,000 | 782,942 |
| Zhengzhou Yutong Bus Co. Ltd. | | 304,634 | 890,017 |
|
| TOTAL CHINA | | | 10,026,815 |
|
| Colombia - 0.3% | | | |
| Bancolombia SA sponsored ADR | | 7,300 | 288,277 |
| Organizacion Terpel SA | | 105,202 | 432,680 |
|
| TOTAL COLOMBIA | | | 720,957 |
|
| Cyprus - 0.4% | | | |
| Globaltrans Investment PLC GDR (Reg. S) | | 117,300 | 887,961 |
| Egypt - 0.4% | | | |
| Credit Agricole Egypt | | 208,180 | 407,133 |
| Egyptian Kuwaiti Holding | | 667,700 | 420,651 |
|
| TOTAL EGYPT | | | 827,784 |
|
| Greece - 1.2% | | | |
| National Bank of Greece SA (a) | | 1,823,300 | 567,714 |
| Titan Cement Co. SA (Reg.) | | 73,900 | 1,931,177 |
|
| TOTAL GREECE | | | 2,498,891 |
|
| Hong Kong - 1.0% | | | |
| China Resources Beer Holdings Co. Ltd. | | 522,000 | 1,256,287 |
| Far East Horizon Ltd. | | 852,584 | 784,807 |
|
| TOTAL HONG KONG | | | 2,041,094 |
|
| India - 9.2% | | | |
| ACC Ltd. | | 3,939 | 99,658 |
| Adani Ports & Special Economic Zone Ltd. (a) | | 280,199 | 1,428,235 |
| Alembic Pharmaceuticals Ltd. (a) | | 175,899 | 1,675,404 |
| Arvind Mills Ltd. | | 466,018 | 2,894,400 |
| Deccan Cements Ltd. | | 44,951 | 887,169 |
| Edelweiss Financial Services Ltd. | | 61,710 | 160,922 |
| EIH Ltd. (a) | | 542,948 | 1,114,779 |
| Federal Bank Ltd. (a) | | 509,137 | 852,125 |
| Gujarat Gas Ltd. (a) | | 1,008 | 13,243 |
| IDFC Ltd. (a) | | 383,973 | 368,504 |
| Iifl Holdings Ltd. | | 53,750 | 401,098 |
| JK Cement Ltd. | | 62,381 | 945,806 |
| LIC Housing Finance Ltd. | | 57,619 | 599,492 |
| Manappuram General Finance & Leasing Ltd. | | 573,259 | 833,272 |
| Phoenix Mills Ltd. | | 133,337 | 857,389 |
| Power Grid Corp. of India Ltd. | | 157,386 | 509,197 |
| Solar Industries India Ltd. | | 105,537 | 1,315,888 |
| Steel Authority of India Ltd. (a) | | 846,743 | 794,851 |
| The Ramco Cements Ltd. (a) | | 85,612 | 915,245 |
| Torrent Pharmaceuticals Ltd. (a) | | 90,300 | 1,992,738 |
| VST Industries Ltd. (a) | | 10,013 | 474,757 |
|
| TOTAL INDIA | | | 19,134,172 |
|
| Indonesia - 1.3% | | | |
| PT Bank Danamon Indonesia Tbk Series A | | 1,323,300 | 482,500 |
| PT Cikarang Listrindo Tbk | | 4,781,400 | 462,751 |
| PT Indo Tambangraya Megah Tbk | | 231,700 | 332,453 |
| PT Media Nusantara Citra Tbk | | 2,235,500 | 306,084 |
| PT Pakuwon Jati Tbk | | 11,890,000 | 557,525 |
| PT Panin Life Tbk (a) | | 28,314,200 | 497,076 |
|
| TOTAL INDONESIA | | | 2,638,389 |
|
| Israel - 0.1% | | | |
| Bezeq The Israel Telecommunication Corp. Ltd. | | 131,460 | 221,229 |
| Japan - 0.1% | | | |
| Rakuten, Inc. | | 25,000 | 255,887 |
| Kazakhstan - 0.1% | | | |
| JSC Halyk Bank of Kazakhstan GDR unit (a) | | 41,000 | 307,500 |
| Kenya - 0.2% | | | |
| KCB Group Ltd. | | 1,433,000 | 437,398 |
| Korea (South) - 9.6% | | | |
| AMOREPACIFIC Group, Inc. | | 6,236 | 720,846 |
| BS Financial Group, Inc. | | 160,389 | 1,347,854 |
| Com2uS Corp. | | 6,263 | 660,654 |
| Daou Technology, Inc. | | 32,066 | 584,889 |
| Dong A Eltek Co. Ltd. | | 8,503 | 175,277 |
| DOUBLEUGAMES Co. Ltd. | | 13,477 | 649,209 |
| Fila Korea Ltd. | | 28,827 | 1,758,609 |
| Hanon Systems | | 102,638 | 763,289 |
| Hyundai Fire & Marine Insurance Co. Ltd. | | 14,919 | 481,300 |
| Hyundai Glovis Co. Ltd. | | 6,053 | 771,523 |
| Hyundai HCN | | 141,419 | 486,066 |
| Hyundai Industrial Development & Construction Co. | | 19,100 | 750,501 |
| Hyundai Mipo Dockyard Co. Ltd. (a) | | 10,019 | 815,541 |
| Hyundai Wia Corp. | | 13,737 | 783,695 |
| KB Financial Group, Inc. | | 9,680 | 425,620 |
| KEPCO Plant Service & Engineering Co. Ltd. | | 15,343 | 774,163 |
| Korea Electric Power Corp. | | 14,957 | 596,347 |
| Korea Express Co. Ltd. (a) | | 6,673 | 976,665 |
| Korean Reinsurance Co. | | 42,656 | 423,710 |
| Medy-Tox, Inc. | | 4,480 | 1,969,845 |
| Minwise Co. Ltd. | | 26,163 | 443,869 |
| MK Electron Co. Ltd. | | 38,844 | 296,725 |
| NCSOFT Corp. | | 4,492 | 1,421,519 |
| Nice Information & Telecom, Inc. | | 9,861 | 235,776 |
| Samjin Pharmaceutical Co. Ltd. | | 39,142 | 1,164,695 |
| Silicon Works Co. Ltd. | | 14,647 | 377,248 |
| SundayToz Corp. | | 6,751 | 132,931 |
|
| TOTAL KOREA (SOUTH) | | | 19,988,366 |
|
| Malaysia - 1.0% | | | |
| Matrix Concepts Holdings Bhd | | 1,016,000 | 606,183 |
| Top Glove Corp. Bhd | | 1,377,600 | 1,450,272 |
|
| TOTAL MALAYSIA | | | 2,056,455 |
|
| Mexico - 3.7% | | | |
| Gruma S.A.B. de CV Series B | | 97,330 | 1,299,681 |
| Grupo Aeroportuario del Pacifico S.A.B. de CV Series B | | 130,400 | 1,341,041 |
| Grupo Comercial Chedraui S.A.B. de CV | | 456,600 | 946,659 |
| Industrias Penoles SA de CV | | 60,430 | 1,470,685 |
| Macquarie Mexican (REIT) | | 399,272 | 437,550 |
| Qualitas Controladora S.A.B. de CV | | 256,500 | 419,796 |
| Tenedora Nemak SA de CV | | 1,374,400 | 1,452,866 |
| Terrafina | | 217,900 | 367,618 |
|
| TOTAL MEXICO | | | 7,735,896 |
|
| Netherlands - 2.2% | | | |
| X5 Retail Group NV GDR (Reg. S) (a) | | 17,900 | 630,975 |
| Yandex NV Series A (a) | | 143,900 | 3,922,714 |
|
| TOTAL NETHERLANDS | | | 4,553,689 |
|
| Pakistan - 0.2% | | | |
| Habib Bank Ltd. | | 133,700 | 351,739 |
| Panama - 0.4% | | | |
| Copa Holdings SA Class A | | 6,900 | 803,298 |
| Philippines - 0.5% | | | |
| Metro Pacific Investments Corp. | | 4,497,200 | 590,044 |
| Robinsons Land Corp. | | 792,300 | 405,222 |
|
| TOTAL PHILIPPINES | | | 995,266 |
|
| Poland - 0.1% | | | |
| Asseco Poland SA | | 12,600 | 177,346 |
| Romania - 0.2% | | | |
| Banca Transilvania SA | | 497,264 | 329,334 |
| Russia - 1.8% | | | |
| Inter Rao Ues JSC (a) | | 12,651,004 | 900,012 |
| Moscow Exchange MICEX-RTS OAO (a) | | 414,500 | 837,683 |
| RusHydro PJSC (a) | | 103,912,000 | 1,633,643 |
| Sistema JSFC | | 599,200 | 224,718 |
| Sistema JSFC sponsored GDR | | 28,460 | 239,349 |
|
| TOTAL RUSSIA | | | 3,835,405 |
|
| Singapore - 0.6% | | | |
| First Resources Ltd. | | 856,800 | 1,149,841 |
| South Africa - 1.8% | | | |
| Bidvest Group Ltd. | | 111,500 | 1,330,866 |
| EOH Holdings Ltd. | | 49,400 | 522,879 |
| Imperial Holdings Ltd. | | 49,500 | 625,947 |
| Pick 'n Pay Stores Ltd. | | 100,500 | 477,542 |
| Reunert Ltd. | | 153,900 | 816,501 |
|
| TOTAL SOUTH AFRICA | | | 3,773,735 |
|
| Sri Lanka - 0.5% | | | |
| Dialog Axiata PLC | | 3,023,372 | 237,905 |
| Hatton National Bank PLC | | 465,838 | 702,575 |
|
| TOTAL SRI LANKA | | | 940,480 |
|
| Taiwan - 7.2% | | | |
| Addcn Technology Co. Ltd. | | 26,000 | 193,991 |
| Advantech Co. Ltd. | | 102,000 | 823,479 |
| Alpha Networks, Inc. | | 550,000 | 446,762 |
| Chipbond Technology Corp. | | 185,000 | 275,452 |
| Cleanaway Co. Ltd. | | 160,000 | 910,565 |
| CTCI Corp. | | 608,000 | 1,062,184 |
| Cub Elecparts, Inc. | | 97,568 | 1,020,133 |
| Elite Advanced Laser Corp. | | 92,000 | 404,857 |
| eMemory Technology, Inc. | | 44,000 | 604,904 |
| Everlight Electronics Co. Ltd. | | 319,000 | 501,357 |
| FLEXium Interconnect, Inc. | | 137,356 | 509,012 |
| Inventec Corp. | | 860,000 | 638,818 |
| Largan Precision Co. Ltd. | | 2,000 | 331,866 |
| Lite-On Technology Corp. | | 666,220 | 1,159,487 |
| Powertech Technology, Inc. | | 172,000 | 538,941 |
| Radiant Opto-Electronics Corp. | | 461,000 | 960,957 |
| Soft-World International Corp. | | 143,000 | 326,473 |
| St.Shine Optical Co. Ltd. | | 32,000 | 618,337 |
| Sunrex Technology Corp. | | 461,000 | 289,050 |
| Synnex Technology International Corp. | | 580,100 | 627,644 |
| Tong Hsing Electronics Industries Ltd. | | 92,000 | 389,637 |
| Tripod Technology Corp. | | 194,000 | 547,537 |
| Universal Cement Corp. | | 451,568 | 389,965 |
| Vanguard International Semiconductor Corp. | | 394,000 | 750,898 |
| Yuanta Financial Holding Co. Ltd. | | 1,446,000 | 617,192 |
|
| TOTAL TAIWAN | | | 14,939,498 |
|
| Thailand - 2.2% | | | |
| Delta Electronics PCL (For. Reg.) | | 338,800 | 900,855 |
| LPN Development PCL (For. Reg.) | | 940,000 | 317,861 |
| PTT Global Chemical PCL (For. Reg.) | | 767,400 | 1,663,439 |
| Sansiri PCL (For. Reg.) | | 5,400,000 | 327,746 |
| Star Petroleum Refining PCL | | 3,766,500 | 1,436,931 |
|
| TOTAL THAILAND | | | 4,646,832 |
|
| Turkey - 3.3% | | | |
| Aksa Akrilik Kimya Sanayii | | 882,000 | 2,634,615 |
| Aselsan A/S | | 283,000 | 1,556,044 |
| Bim Birlesik Magazalar A/S JSC | | 71,000 | 1,160,363 |
| Tupras Turkiye Petrol Rafinelleri A/S | | 57,828 | 1,457,117 |
|
| TOTAL TURKEY | | | 6,808,139 |
|
| United Arab Emirates - 0.9% | | | |
| Emaar Properties PJSC | | 934,134 | 1,826,050 |
| National Bank of Ras Al-Khaimah PSC | | 115,100 | 143,209 |
|
| TOTAL UNITED ARAB EMIRATES | | | 1,969,259 |
|
| United Kingdom - 1.7% | | | |
| BGEO Group PLC | | 10,940 | 510,102 |
| Mondi PLC | | 72,700 | 1,884,162 |
| Shanghai International Airport Co. Ltd. (UBS Warrant Programme) warrants 5/11/18 (a)(c) | | 181,300 | 900,780 |
| TBC Bank Group PLC (a) | | 14,953 | 314,716 |
|
| TOTAL UNITED KINGDOM | | | 3,609,760 |
|
| United States of America - 0.4% | | | |
| Net 1 UEPS Technologies, Inc. (a) | | 32,800 | 355,224 |
| The AES Corp. | | 47,800 | 540,618 |
|
| TOTAL UNITED STATES OF AMERICA | | | 895,842 |
|
| Vietnam - 0.2% | | | |
| FTP Corp. | | 163,990 | 334,924 |
| TOTAL COMMON STOCKS | | | |
| (Cost $153,174,412) | | | 169,469,498 |
|
| Nonconvertible Preferred Stocks - 4.0% | | | |
| Brazil - 0.9% | | | |
| Banco ABC Brasil SA | | 117,950 | 662,204 |
| Banco do Estado Rio Grande do Sul SA | | 91,100 | 407,848 |
| Companhia Paranaense de Energia-Copel (PN-B) sponsored ADR (b) | | 43,600 | 399,812 |
| Metalurgica Gerdau SA (PN) (a) | | 240,700 | 348,835 |
|
| TOTAL BRAZIL | | | 1,818,699 |
|
| Korea (South) - 2.7% | | | |
| Hyundai Motor Co. Series 2 | | 48,580 | 4,240,499 |
| LG Chemical Ltd. | | 5,800 | 927,918 |
| Samsung Fire & Marine Insurance Co. Ltd. | | 2,791 | 440,387 |
|
| TOTAL KOREA (SOUTH) | | | 5,608,804 |
|
| Russia - 0.4% | | | |
| Sberbank of Russia (a) | | 404,100 | 893,114 |
| TOTAL NONCONVERTIBLE PREFERRED STOCKS | | | |
| (Cost $7,753,380) | | | 8,320,617 |
| | | Principal Amount | Value |
|
| Government Obligations - 0.5% | | | |
| United States of America - 0.5% | | | |
| U.S. Treasury Bills, yield at date of purchase 0.5% to 0.76% 5/11/17 to 6/22/17(d) | | | |
| (Cost $979,028) | | 980,000 | 979,088 |
| | | Shares | Value |
|
| Money Market Funds - 14.8% | | | |
| Fidelity Cash Central Fund, 0.85% (e) | | 29,397,836 | 29,403,716 |
| Fidelity Securities Lending Cash Central Fund 0.86% (e)(f) | | 1,551,815 | 1,551,970 |
| TOTAL MONEY MARKET FUNDS | | | |
| (Cost $30,954,612) | | | 30,955,686 |
| TOTAL INVESTMENT PORTFOLIO - 100.7% | | | |
| (Cost $192,861,432) | | | 209,724,889 |
| NET OTHER ASSETS (LIABILITIES) - (0.7)% | | | (1,460,844) |
| NET ASSETS - 100% | | | $208,264,045 |
| Futures Contracts | | | |
| | Expiration Date | Underlying Face Amount at Value | Unrealized Appreciation/(Depreciation) |
| Purchased | | | |
| Equity Index Contracts | | | |
| 412 ICE E-mini MSCI Emerging Markets Index Contracts (United States) | June 2017 | 20,167,400 | $443,176 |
The face value of futures purchased as a percentage of Net Assets is 9.7%
Categorizations in the Schedule of Investments are based on country or territory of incorporation.
Legend
(a) Non-income producing
(b) Security or a portion of the security is on loan at period end.
(c) Security exempt from registration under Rule 144A of the Securities Act of 1933. These securities may be resold in transactions exempt from registration, normally to qualified institutional buyers. At the end of the period, the value of these securities amounted to $900,780 or 0.4% of net assets.
(d) Security or a portion of the security was pledged to cover margin requirements for futures contracts. At period end, the value of securities pledged amounted to $873,196.
(e) Affiliated fund that is generally available only to investment companies and other accounts managed by Fidelity Investments. The rate quoted is the annualized seven-day yield of the fund at period end. A complete unaudited listing of the fund's holdings as of its most recent quarter end is available upon request. In addition, each Fidelity Central Fund's financial statements are available on the SEC's website or upon request.
(f) Investment made with cash collateral received from securities on loan.
Affiliated Central Funds
Information regarding fiscal year to date income earned by the Fund from investments in Fidelity Central Funds is as follows:
| Fund | Income earned |
| Fidelity Cash Central Fund | $48,976 |
| Fidelity Securities Lending Cash Central Fund | 20,992 |
| Total | $69,968 |
Investment Valuation
The following is a summary of the inputs used, as of April 30, 2017, involving the Fund's assets and liabilities carried at fair value. The inputs or methodology used for valuing securities may not be an indication of the risk associated with investing in those securities. For more information on valuation inputs, and their aggregation into the levels used below, please refer to the Investment Valuation section in the accompanying Notes to Financial Statements.
| | Valuation Inputs at Reporting Date: |
| Description | Total | Level 1 | Level 2 | Level 3 |
| Investments in Securities: | | | | |
| Equities: | | | | |
| Consumer Discretionary | $33,614,009 | $33,614,009 | $-- | $-- |
| Consumer Staples | 12,876,870 | 12,876,870 | -- | -- |
| Energy | 5,689,235 | 5,689,235 | -- | -- |
| Financials | 20,971,507 | 19,077,393 | 1,894,114 | -- |
| Health Care | 12,967,490 | 12,967,490 | -- | -- |
| Industrials | 23,663,433 | 23,663,433 | -- | -- |
| Information Technology | 30,665,068 | 30,665,068 | -- | -- |
| Materials | 19,257,838 | 19,257,838 | -- | -- |
| Real Estate | 10,162,467 | 10,162,467 | -- | -- |
| Telecommunication Services | 923,201 | 923,201 | -- | -- |
| Utilities | 6,998,997 | 6,402,650 | 596,347 | -- |
| Government Obligations | 979,088 | -- | 979,088 | -- |
| Money Market Funds | 30,955,686 | 30,955,686 | -- | -- |
| Total Investments in Securities: | $209,724,889 | $206,255,340 | $3,469,549 | $-- |
| Derivative Instruments: | | | | |
| Assets | | | | |
| Futures Contracts | $443,176 | $443,176 | $-- | $-- |
| Total Assets | $443,176 | $443,176 | $-- | $-- |
| Total Derivative Instruments: | $443,176 | $443,176 | $-- | $-- |
Value of Derivative Instruments
The following table is a summary of the Fund's value of derivative instruments by primary risk exposure as of April 30, 2017. For additional information on derivative instruments, please refer to the Derivative Instruments section in the accompanying Notes to Financial Statements.
| Primary Risk Exposure / Derivative Type | Value |
| | Asset | Liability |
| Equity Risk | | |
| Futures Contracts(a) | $443,176 | $0 |
| Total Equity Risk | 443,176 | 0 |
| Total Value of Derivatives | $443,176 | $0 |
(a) Reflects gross cumulative appreciation (depreciation) on futures contracts as presented in the Schedule of Investments. In the Statement of Assets and Liabilities, the period end daily variation margin is included in receivable or payable for daily variation margin for derivative instruments, and the net cumulative appreciation (depreciation) is included in net unrealized appreciation (depreciation).
See accompanying notes which are an integral part of the financial statements.
Fidelity® Emerging Markets Discovery Fund
Financial Statements
Statement of Assets and Liabilities
| | | April 30, 2017 (Unaudited) |
| Assets | | |
Investment in securities, at value (including securities loaned of $1,516,131) — See accompanying schedule:
Unaffiliated issuers (cost $161,906,820) | $178,769,203 | |
| Fidelity Central Funds (cost $30,954,612) | 30,955,686 | |
| Total Investments (cost $192,861,432) | | $209,724,889 |
| Cash | | 174,898 |
| Foreign currency held at value (cost $134,176) | | 134,160 |
| Receivable for investments sold | | 633,326 |
| Receivable for fund shares sold | | 2,083,452 |
| Dividends receivable | | 351,679 |
| Distributions receivable from Fidelity Central Funds | | 20,940 |
| Receivable for daily variation margin for derivative instruments | | 67,980 |
| Prepaid expenses | | 45 |
| Other receivables | | 39,978 |
| Total assets | | 213,231,347 |
| Liabilities | | |
| Payable for investments purchased | $2,623,073 | |
| Payable for fund shares redeemed | 398,643 | |
| Accrued management fee | 130,320 | |
| Distribution and service plan fees payable | 8,702 | |
| Other affiliated payables | 33,120 | |
| Other payables and accrued expenses | 221,569 | |
| Collateral on securities loaned | 1,551,875 | |
| Total liabilities | | 4,967,302 |
| Net Assets | | $208,264,045 |
| Net Assets consist of: | | |
| Paid in capital | | $196,166,233 |
| Undistributed net investment income | | 483,103 |
| Accumulated undistributed net realized gain (loss) on investments and foreign currency transactions | | (5,533,048) |
| Net unrealized appreciation (depreciation) on investments and assets and liabilities in foreign currencies | | 17,147,757 |
| Net Assets | | $208,264,045 |
| Calculation of Maximum Offering Price | | |
| Class A: | | |
| Net Asset Value and redemption price per share ($9,008,987 ÷ 673,521 shares) | | $13.38 |
| Maximum offering price per share (100/94.25 of $13.38) | | $14.20 |
| Class M: | | |
| Net Asset Value and redemption price per share ($6,524,390 ÷ 490,018 shares) | | $13.31 |
| Maximum offering price per share (100/96.50 of $13.31) | | $13.79 |
| Class C: | | |
| Net Asset Value and offering price per share ($6,104,468 ÷ 466,608 shares)(a) | | $13.08 |
| Emerging Markets Discovery: | | |
| Net Asset Value, offering price and redemption price per share ($145,323,553 ÷ 10,814,938 shares) | | $13.44 |
| Class I: | | |
| Net Asset Value, offering price and redemption price per share ($41,302,647 ÷ 3,067,270 shares) | | $13.47 |
(a) Redemption price per share is equal to net asset value less any applicable contingent deferred sales charge.
See accompanying notes which are an integral part of the financial statements.
Statement of Operations
| | | Six months ended April 30, 2017 (Unaudited) |
| Investment Income | | |
| Dividends | | $1,439,687 |
| Interest | | 1,475 |
| Income from Fidelity Central Funds | | 69,968 |
| Income before foreign taxes withheld | | 1,511,130 |
| Less foreign taxes withheld | | (102,529) |
| Total income | | 1,408,601 |
| Expenses | | |
| Management fee | $491,614 | |
| Transfer agent fees | 124,250 | |
| Distribution and service plan fees | 34,016 | |
| Accounting and security lending fees | 30,258 | |
| Custodian fees and expenses | 98,366 | |
| Independent trustees' fees and expenses | 203 | |
| Registration fees | 55,315 | |
| Audit | 41,578 | |
| Legal | 88 | |
| Miscellaneous | 320 | |
| Total expenses before reductions | 876,008 | |
| Expense reductions | (17,157) | 858,851 |
| Net investment income (loss) | | 549,750 |
| Realized and Unrealized Gain (Loss) | | |
| Net realized gain (loss) on: | | |
| Investment securities: | | |
| Unaffiliated issuers (net of foreign taxes of $1,306) | (422,857) | |
| Fidelity Central Funds | (58) | |
| Foreign currency transactions | (27,472) | |
| Futures contracts | 491,569 | |
| Total net realized gain (loss) | | 41,182 |
Change in net unrealized appreciation (depreciation) on:
Investment securities (net of decrease in deferred foreign taxes of $82,216) | 12,864,578 | |
| Assets and liabilities in foreign currencies | (987) | |
| Futures contracts | 476,310 | |
| Total change in net unrealized appreciation (depreciation) | | 13,339,901 |
| Net gain (loss) | | 13,381,083 |
| Net increase (decrease) in net assets resulting from operations | | $13,930,833 |
See accompanying notes which are an integral part of the financial statements.
Statement of Changes in Net Assets
| | Six months ended April 30, 2017 (Unaudited) | Year ended October 31, 2016 |
| Increase (Decrease) in Net Assets | | |
| Operations | | |
| Net investment income (loss) | $549,750 | $715,896 |
| Net realized gain (loss) | 41,182 | (2,841,874) |
| Change in net unrealized appreciation (depreciation) | 13,339,901 | 10,693,560 |
| Net increase (decrease) in net assets resulting from operations | 13,930,833 | 8,567,582 |
| Distributions to shareholders from net investment income | (659,806) | (490,717) |
| Distributions to shareholders from net realized gain | (485,420) | – |
| Total distributions | (1,145,226) | (490,717) |
| Share transactions - net increase (decrease) | 109,579,250 | 6,360,074 |
| Redemption fees | 60,701 | 41,424 |
| Total increase (decrease) in net assets | 122,425,558 | 14,478,363 |
| Net Assets | | |
| Beginning of period | 85,838,487 | 71,360,124 |
| End of period | $208,264,045 | $85,838,487 |
| Other Information | | |
| Undistributed net investment income end of period | $483,103 | $593,159 |
See accompanying notes which are an integral part of the financial statements.
Financial Highlights — Fidelity Emerging Markets Discovery Fund Class A
| | Six months ended (Unaudited) April 30, | Years ended October 31, | | | | |
| | 2017 | 2016 | 2015 | 2014 | 2013 | 2012 A |
| Selected Per–Share Data | | | | | | |
| Net asset value, beginning of period | $12.27 | $10.92 | $12.17 | $12.49 | $11.89 | $10.00 |
| Income from Investment Operations | | | | | | |
| Net investment income (loss)B | .05 | .09 | .09C | .04 | .08 | .12 |
| Net realized and unrealized gain (loss) | 1.18 | 1.30 | (1.34) | (.01) | .75 | 1.76 |
| Total from investment operations | 1.23 | 1.39 | (1.25) | .03 | .83 | 1.88 |
| Distributions from net investment income | (.07) | (.05) | – | (.06) | (.04) | (.01) |
| Distributions from net realized gain | (.06) | – | – | (.30) | (.20) | – |
| Total distributions | (.13) | (.05) | – | (.36) | (.25)D | (.01) |
| Redemption fees added to paid in capitalB | .01 | .01 | –E | .01 | .02 | .02 |
| Net asset value, end of period | $13.38 | $12.27 | $10.92 | $12.17 | $12.49 | $11.89 |
| Total ReturnF,G,H | 10.29% | 12.93% | (10.27)% | .31% | 7.20% | 19.00% |
| Ratios to Average Net AssetsI,J | | | | | | |
| Expenses before reductions | 1.79%K | 1.89% | 1.88% | 1.82% | 1.87% | 3.49% |
| Expenses net of fee waivers, if any | 1.70%K | 1.70% | 1.70% | 1.70% | 1.70% | 1.70% |
| Expenses net of all reductions | 1.69%K | 1.70% | 1.69% | 1.70% | 1.64% | 1.64% |
| Net investment income (loss) | .76%K | .85% | .76%C | .29% | .62% | 1.16% |
| Supplemental Data | | | | | | |
| Net assets, end of period (000 omitted) | $9,009 | $5,252 | $4,660 | $4,362 | $5,065 | $1,671 |
| Portfolio turnover rateL | 42%K | 60% | 103% | 148% | 179% | 83% |
A For the period November 1, 2011 (commencement of operations) to October 31, 2012.
B Calculated based on average shares outstanding during the period.
C Net Investment income per share reflects a large, non-recurring dividend which amounted to $.06 per share. Excluding this non-recurring dividend, the ratio of net investment income (loss) to average net assets would have been .22%.
D Total distributions of $.25 per share is comprised of distributions from net investment income of $.044 and distributions from net realized gain of $.203 per share.
E Amount represents less than $.005 per share.
F Total returns for periods of less than one year are not annualized.
G Total returns would have been lower if certain expenses had not been reduced during the applicable periods shown.
H Total returns do not include the effect of the sales charges.
I Fees and expenses of any underlying Fidelity Central Funds are not included in the Fund's expense ratio. The Fund indirectly bears its proportionate share of the expenses of any underlying Fidelity Central Funds.
J Expense ratios reflect operating expenses of the class. Expenses before reductions do not reflect amounts reimbursed by the investment adviser or reductions from brokerage service arrangements or reductions from other expense offset arrangements and do not represent the amount paid by the class during periods when reimbursements or reductions occur. Expense ratios before reductions for start-up periods may not be representative of longer-term operating periods. Expenses net of fee waivers reflect expenses after reimbursement by the investment adviser but prior to reductions from brokerage service arrangements or other expense offset arrangements. Expenses net of all reductions represent the net expenses paid by the class.
K Annualized
L Amount does not include the portfolio activity of any underlying Fidelity Central Funds.
See accompanying notes which are an integral part of the financial statements.
Financial Highlights — Fidelity Emerging Markets Discovery Fund Class M
| | Six months ended (Unaudited) April 30, | Years ended October 31, | | | | |
| | 2017 | 2016 | 2015 | 2014 | 2013 | 2012 A |
| Selected Per–Share Data | | | | | | |
| Net asset value, beginning of period | $12.20 | $10.86 | $12.13 | $12.44 | $11.87 | $10.00 |
| Income from Investment Operations | | | | | | |
| Net investment income (loss)B | .03 | .07 | .06C | –D | .05 | .10 |
| Net realized and unrealized gain (loss) | 1.18 | 1.28 | (1.33) | –D | .74 | 1.75 |
| Total from investment operations | 1.21 | 1.35 | (1.27) | –D | .79 | 1.85 |
| Distributions from net investment income | (.04) | (.02) | – | (.02) | (.03) | –D |
| Distributions from net realized gain | (.06) | – | – | (.30) | (.20) | – |
| Total distributions | (.11)E | (.02) | – | (.32) | (.24)F | –D |
| Redemption fees added to paid in capitalB | .01 | .01 | –D | .01 | .02 | .02 |
| Net asset value, end of period | $13.31 | $12.20 | $10.86 | $12.13 | $12.44 | $11.87 |
| Total ReturnG,H,I | 10.14% | 12.58% | (10.47)% | .05% | 6.87% | 18.75% |
| Ratios to Average Net AssetsJ,K | | | | | | |
| Expenses before reductions | 2.05%L | 2.17% | 2.16% | 2.10% | 2.19% | 3.77% |
| Expenses net of fee waivers, if any | 1.95%L | 1.95% | 1.95% | 1.95% | 1.95% | 1.95% |
| Expenses net of all reductions | 1.94%L | 1.94% | 1.94% | 1.95% | 1.89% | 1.89% |
| Net investment income (loss) | .51%L | .60% | .51%C | .04% | .37% | .91% |
| Supplemental Data | | | | | | |
| Net assets, end of period (000 omitted) | $6,524 | $2,868 | $2,015 | $2,031 | $1,914 | $1,700 |
| Portfolio turnover rateM | 42%L | 60% | 103% | 148% | 179% | 83% |
A For the period November 1, 2011 (commencement of operations) to October 31, 2012.
B Calculated based on average shares outstanding during the period.
C Net Investment income per share reflects a large, non-recurring dividend which amounted to $.06 per share. Excluding this non-recurring dividend, the ratio of net investment income (loss) to average net assets would have been (.03) %.
D Amount represents less than $.005 per share.
E Total distributions of $.11 per share is comprised of distributions from net investment income of $.044 and distributions from net realized gain of $.064 per share.
F Total distributions of $.24 per share is comprised of distributions from net investment income of $.034 and distributions from net realized gain of $.203 per share
G Total returns for periods of less than one year are not annualized.
H Total returns would have been lower if certain expenses had not been reduced during the applicable periods shown.
I Total returns do not include the effect of the sales charges.
J Fees and expenses of any underlying Fidelity Central Funds are not included in the Fund's expense ratio. The Fund indirectly bears its proportionate share of the expenses of any underlying Fidelity Central Funds.
K Expense ratios reflect operating expenses of the class. Expenses before reductions do not reflect amounts reimbursed by the investment adviser or reductions from brokerage service arrangements or reductions from other expense offset arrangements and do not represent the amount paid by the class during periods when reimbursements or reductions occur. Expense ratios before reductions for start-up periods may not be representative of longer-term operating periods. Expenses net of fee waivers reflect expenses after reimbursement by the investment adviser but prior to reductions from brokerage service arrangements or other expense offset arrangements. Expenses net of all reductions represent the net expenses paid by the class.
L Annualized
M Amount does not include the portfolio activity of any underlying Fidelity Central Funds.
See accompanying notes which are an integral part of the financial statements.
Financial Highlights — Fidelity Emerging Markets Discovery Fund Class C
| | Six months ended (Unaudited) April 30, | Years ended October 31, | | | | |
| | 2017 | 2016 | 2015 | 2014 | 2013 | 2012 A |
| Selected Per–Share Data | | | | | | |
| Net asset value, beginning of period | $11.97 | $10.69 | $12.00 | $12.35 | $11.82 | $10.00 |
| Income from Investment Operations | | | | | | |
| Net investment income (loss)B | – | .01 | –C,D | (.06) | (.02) | .04 |
| Net realized and unrealized gain (loss) | 1.17 | 1.26 | (1.31) | –D | .74 | 1.76 |
| Total from investment operations | 1.17 | 1.27 | (1.31) | (.06) | .72 | 1.80 |
| Distributions from net investment income | (.01) | – | – | – | (.01) | – |
| Distributions from net realized gain | (.06) | – | – | (.30) | (.20) | – |
| Total distributions | (.07) | – | – | (.30) | (.21) | – |
| Redemption fees added to paid in capitalB | .01 | .01 | –E | .01 | .02 | .02 |
| Net asset value, end of period | $13.08 | $11.97 | $10.69 | $12.00 | $12.35 | $11.82 |
| Total ReturnF,G,H | 9.91% | 11.97% | (10.92)% | (.42)% | 6.32% | 18.20% |
| Ratios to Average Net AssetsI,J | | | | | | |
| Expenses before reductions | 2.54%D | 2.63% | 2.64% | 2.58% | 2.70% | 4.32% |
| Expenses net of fee waivers, if any | 2.45%D | 2.45% | 2.45% | 2.45% | 2.45% | 2.45% |
| Expenses net of all reductions | 2.44%D | 2.44% | 2.44% | 2.45% | 2.39% | 2.39% |
| Net investment income (loss) | .01%D | .10% | .01%C | (.46)% | (.13)% | .41% |
| Supplemental Data | | | | | | |
| Net assets, end of period (000 omitted) | $6,104 | $2,203 | $1,675 | $1,750 | $2,082 | $1,474 |
| Portfolio turnover rateK | 42%D | 60% | 103% | 148% | 179% | 83% |
A For the period November 1, 2011 (commencement of operations) to October 31, 2012.
B Calculated based on average shares outstanding during the period.
C Net Investment income per share reflects a large, non-recurring dividend which amounted to $.06 per share. Excluding this non-recurring dividend, the ratio of net investment income (loss) to average net assets would have been (.52) %.
D Annualized
E Amount represents less than $.005 per share.
F Total returns for periods of less than one year are not annualized.
G Total returns would have been lower if certain expenses had not been reduced during the applicable periods shown.
H Total returns do not include the effect of the contingent deferred sales charge.
I Fees and expenses of any underlying Fidelity Central Funds are not included in the Fund's expense ratio. The Fund indirectly bears its proportionate share of the expenses of any underlying Fidelity Central Funds.
J Expense ratios reflect operating expenses of the class. Expenses before reductions do not reflect amounts reimbursed by the investment adviser or reductions from brokerage service arrangements or reductions from other expense offset arrangements and do not represent the amount paid by the class during periods when reimbursements or reductions occur. Expense ratios before reductions for start-up periods may not be representative of longer-term operating periods. Expenses net of fee waivers reflect expenses after reimbursement by the investment adviser but prior to reductions from brokerage service arrangements or other expense offset arrangements. Expenses net of all reductions represent the net expenses paid by the class.
K Amount does not include the portfolio activity of any underlying Fidelity Central Funds.
See accompanying notes which are an integral part of the financial statements.
Financial Highlights — Fidelity Emerging Markets Discovery Fund
| | Six months ended (Unaudited) April 30, | Years ended October 31, | | | | |
| | 2017 | 2016 | 2015 | 2014 | 2013 | 2012 A |
| Selected Per–Share Data | | | | | | |
| Net asset value, beginning of period | $12.33 | $10.98 | $12.21 | $12.52 | $11.92 | $10.00 |
| Income from Investment Operations | | | | | | |
| Net investment income (loss)B | .06 | .12 | .12C | .07 | .11 | .15 |
| Net realized and unrealized gain (loss) | 1.20 | 1.31 | (1.35) | –D | .74 | 1.76 |
| Total from investment operations | 1.26 | 1.43 | (1.23) | .07 | .85 | 1.91 |
| Distributions from net investment income | (.09) | (.09) | – | (.09) | (.07) | (.01) |
| Distributions from net realized gain | (.06) | – | – | (.30) | (.20) | – |
| Total distributions | (.16)E | (.09) | – | (.39) | (.27) | (.01) |
| Redemption fees added to paid in capitalB | .01 | .01 | –D | .01 | .02 | .02 |
| Net asset value, end of period | $13.44 | $12.33 | $10.98 | $12.21 | $12.52 | $11.92 |
| Total ReturnF,G | 10.49% | 13.19% | (10.07)% | .61% | 7.37% | 19.35% |
| Ratios to Average Net AssetsH,I | | | | | | |
| Expenses before reductions | 1.46%J | 1.55% | 1.56% | 1.48% | 1.57% | 3.02% |
| Expenses net of fee waivers, if any | 1.45%J | 1.45% | 1.45% | 1.45% | 1.45% | 1.45% |
| Expenses net of all reductions | 1.44%J | 1.44% | 1.44% | 1.45% | 1.39% | 1.39% |
| Net investment income (loss) | 1.01%J | 1.10% | 1.01%C | .54% | .87% | 1.41% |
| Supplemental Data | | | | | | |
| Net assets, end of period (000 omitted) | $145,324 | $67,178 | $61,601 | $78,377 | $96,731 | $39,135 |
| Portfolio turnover rateK | 42%J | 60% | 103% | 148% | 179% | 83% |
A For the period November 1, 2011 (commencement of operations) to October 31, 2012.
B Calculated based on average shares outstanding during the period.
C Net Investment income per share reflects a large, non-recurring dividend which amounted to $.06 per share. Excluding this non-recurring dividend, the ratio of net investment income (loss) to average net assets would have been .48%.
D Amount represents less than $.005 per share.
E Total distributions of $.16 per share is comprised of distributions from net investment income of $.091 and distributions from net realized gain of $.064 per share.
F Total returns for periods of less than one year are not annualized.
G Total returns would have been lower if certain expenses had not been reduced during the applicable periods shown.
H Fees and expenses of any underlying Fidelity Central Funds are not included in the Fund's expense ratio. The Fund indirectly bears its proportionate share of the expenses of any underlying Fidelity Central Funds.
I Expense ratios reflect operating expenses of the class. Expenses before reductions do not reflect amounts reimbursed by the investment adviser or reductions from brokerage service arrangements or reductions from other expense offset arrangements and do not represent the amount paid by the class during periods when reimbursements or reductions occur. Expense ratios before reductions for start-up periods may not be representative of longer-term operating periods. Expenses net of fee waivers reflect expenses after reimbursement by the investment adviser but prior to reductions from brokerage service arrangements or other expense offset arrangements. Expenses net of all reductions represent the net expenses paid by the class.
J Annualized
K Amount does not include the portfolio activity of any underlying Fidelity Central Funds.
See accompanying notes which are an integral part of the financial statements.
Financial Highlights — Fidelity Emerging Markets Discovery Fund Class I
| | Six months ended (Unaudited) April 30, | Years ended October 31, | | | | |
| | 2017 | 2016 | 2015 | 2014 | 2013 | 2012 A |
| Selected Per–Share Data | | | | | | |
| Net asset value, beginning of period | $12.37 | $11.02 | $12.25 | $12.53 | $11.92 | $10.00 |
| Income from Investment Operations | | | | | | |
| Net investment income (loss)B | .06 | .13 | .12C | .07 | .11 | .15 |
| Net realized and unrealized gain (loss) | 1.20 | 1.30 | (1.35) | –D | .75 | 1.76 |
| Total from investment operations | 1.26 | 1.43 | (1.23) | .07 | .86 | 1.91 |
| Distributions from net investment income | (.10) | (.09) | – | (.06) | (.07) | (.01) |
| Distributions from net realized gain | (.06) | – | – | (.30) | (.20) | – |
| Total distributions | (.17)E | (.09) | – | (.36) | (.27) | (.01) |
| Redemption fees added to paid in capitalB | .01 | .01 | –D | .01 | .02 | .02 |
| Net asset value, end of period | $13.47 | $12.37 | $11.02 | $12.25 | $12.53 | $11.92 |
| Total ReturnF,G | 10.47% | 13.16% | (10.04)% | .61% | 7.45% | 19.35% |
| Ratios to Average Net AssetsH,I | | | | | | |
| Expenses before reductions | 1.42%J | 1.59% | 1.54% | 1.56% | 1.60% | 3.21% |
| Expenses net of fee waivers, if any | 1.42%J | 1.45% | 1.45% | 1.45% | 1.45% | 1.45% |
| Expenses net of all reductions | 1.41%J | 1.44% | 1.43% | 1.45% | 1.39% | 1.39% |
| Net investment income (loss) | 1.04%J | 1.10% | 1.01%C | .54% | .87% | 1.41% |
| Supplemental Data | | | | | | |
| Net assets, end of period (000 omitted) | $41,303 | $8,337 | $1,410 | $481 | $1,076 | $1,825 |
| Portfolio turnover rateK | 42%J | 60% | 103% | 148% | 179% | 83% |
A For the period November 1, 2011 (commencement of operations) to October 31, 2012.
B Calculated based on average shares outstanding during the period.
C Net Investment income per share reflects a large, non-recurring dividend which amounted to $.06 per share. Excluding this non-recurring dividend, the ratio of net investment income (loss) to average net assets would have been .48%.
D Amount represents less than $.005 per share.
E Total distributions of $.17 per share is comprised of distributions from net investment income of $.101 and distributions from net realized gain of $.064 per share.
F Total returns for periods of less than one year are not annualized.
G Total returns would have been lower if certain expenses had not been reduced during the applicable periods shown.
H Fees and expenses of any underlying Fidelity Central Funds are not included in the Fund's expense ratio. The Fund indirectly bears its proportionate share of the expenses of any underlying Fidelity Central Funds.
I Expense ratios reflect operating expenses of the class. Expenses before reductions do not reflect amounts reimbursed by the investment adviser or reductions from brokerage service arrangements or reductions from other expense offset arrangements and do not represent the amount paid by the class during periods when reimbursements or reductions occur. Expense ratios before reductions for start-up periods may not be representative of longer-term operating periods. Expenses net of fee waivers reflect expenses after reimbursement by the investment adviser but prior to reductions from brokerage service arrangements or other expense offset arrangements. Expenses net of all reductions represent the net expenses paid by the class.
J Annualized
K Amount does not include the portfolio activity of any underlying Fidelity Central Funds.
See accompanying notes which are an integral part of the financial statements.
Notes to Financial Statements (Unaudited)
For the period ended April 30, 2017
1. Organization.
Fidelity Emerging Markets Discovery Fund (the Fund) is a fund of Fidelity Investment Trust (the Trust) and is authorized to issue an unlimited number of shares. The Trust is registered under the Investment Company Act of 1940, as amended (the 1940 Act), as an open-end management investment company organized as a Massachusetts business trust. The Fund offers Class A, Class M (formerly Class T), Class C, Emerging Markets Discovery and Class I shares, each of which has equal rights as to assets and voting privileges. Each class has exclusive voting rights with respect to matters that affect that class. The Fund's investments in emerging markets can be subject to social, economic, regulatory, and political uncertainties and can be extremely volatile.
2. Investments in Fidelity Central Funds.
The Fund invests in Fidelity Central Funds, which are open-end investment companies generally available only to other investment companies and accounts managed by the investment adviser and its affiliates. The Fund's Schedule of Investments lists each of the Fidelity Central Funds held as of period end, if any, as an investment of the Fund, but does not include the underlying holdings of each Fidelity Central Fund. As an Investing Fund, the Fund indirectly bears its proportionate share of the expenses of the underlying Fidelity Central Funds.
The Money Market Central Funds seek preservation of capital and current income and are managed by Fidelity Investments Money Management, Inc. (FIMM), an affiliate of the investment adviser. Annualized expenses of the Money Market Central Funds as of their most recent shareholder report date are less than .005%.
A complete unaudited list of holdings for each Fidelity Central Fund is available upon request or at the Securities and Exchange Commission (the SEC) website at www.sec.gov. In addition, the financial statements of the Fidelity Central Funds are available on the SEC website or upon request.
3. Significant Accounting Policies.
The Fund is an investment company and applies the accounting and reporting guidance of the Financial Accounting Standards Board (FASB) Accounting Standards Codification Topic 946 Financial Services – Investments Companies. The financial statements have been prepared in conformity with accounting principles generally accepted in the United States of America (GAAP), which require management to make certain estimates and assumptions at the date of the financial statements. Actual results could differ from those estimates. Subsequent events, if any, through the date that the financial statements were issued have been evaluated in the preparation of the financial statements. The following summarizes the significant accounting policies of the Fund:
Investment Valuation. Investments are valued as of 4:00 p.m. Eastern time on the last calendar day of the period. The Board of Trustees (the Board) has delegated the day to day responsibility for the valuation of the Fund's investments to the Fair Value Committee (the Committee) established by the Fund's investment adviser. In accordance with valuation policies and procedures approved by the Board, the Fund attempts to obtain prices from one or more third party pricing vendors or brokers to value its investments. When current market prices, quotations or currency exchange rates are not readily available or reliable, investments will be fair valued in good faith by the Committee, in accordance with procedures adopted by the Board. Factors used in determining fair value vary by investment type and may include market or investment specific events, changes in interest rates and credit quality. The frequency with which these procedures are used cannot be predicted and they may be utilized to a significant extent. The Committee oversees the Fund's valuation policies and procedures and reports to the Board on the Committee's activities and fair value determinations. The Board monitors the appropriateness of the procedures used in valuing the Fund's investments and ratifies the fair value determinations of the Committee.
The Fund categorizes the inputs to valuation techniques used to value its investments into a disclosure hierarchy consisting of three levels as shown below:
- Level 1 – quoted prices in active markets for identical investments
- Level 2 – other significant observable inputs (including quoted prices for similar investments, interest rates, prepayment speeds, etc.)
- Level 3 – unobservable inputs (including the Fund's own assumptions based on the best information available)
Valuation techniques used to value the Fund's investments by major category are as follows:
Equity securities, including restricted securities, for which market quotations are readily available, are valued at the last reported sale price or official closing price as reported by a third party pricing vendor on the primary market or exchange on which they are traded and are categorized as Level 1 in the hierarchy. In the event there were no sales during the day or closing prices are not available, securities are valued at the last quoted bid price or may be valued using the last available price and are generally categorized as Level 2 in the hierarchy. For foreign equity securities, when market or security specific events arise, comparisons to the valuation of American Depositary Receipts (ADRs), futures contracts, Exchange-Traded Funds (ETFs) and certain indexes as well as quoted prices for similar securities may be used and would be categorized as Level 2 in the hierarchy. Utilizing these techniques may result in transfers between Level 1 and Level 2. For equity securities, including restricted securities, where observable inputs are limited, assumptions about market activity and risk are used and these securities may be categorized as Level 3 in the hierarchy.
Debt securities, including restricted securities, are valued based on evaluated prices received from third party pricing vendors or from brokers who make markets in such securities. U.S. government and government agency obligations are valued by pricing vendors who utilize matrix pricing which considers yield or price of bonds of comparable quality, coupon, maturity and type or by broker-supplied prices. When independent prices are unavailable or unreliable, debt securities may be valued utilizing pricing methodologies which consider similar factors that would be used by third party pricing vendors. Debt securities are generally categorized as Level 2 in the hierarchy but may be Level 3 depending on the circumstances.
Futures contracts are valued at the settlement price established each day by the board of trade or exchange on which they are traded and are categorized as Level 1 in the hierarchy. Investments in open-end mutual funds, including the Fidelity Central Funds, are valued at their closing net asset value (NAV) each business day and are categorized as Level 1 in the hierarchy.
Changes in valuation techniques may result in transfers in or out of an assigned level within the disclosure hierarchy. The aggregate value of investments by input level as of April 30, 2017 is included at the end of the Fund's Schedule of Investments.
Foreign Currency. The Fund may use foreign currency contracts to facilitate transactions in foreign-denominated securities. Gains and losses from these transactions may arise from changes in the value of the foreign currency or if the counterparties do not perform under the contracts' terms.
Foreign-denominated assets, including investment securities, and liabilities are translated into U.S. dollars at the exchange rates at period end. Purchases and sales of investment securities, income and dividends received and expenses denominated in foreign currencies are translated into U.S. dollars at the exchange rate in effect on the transaction date.
The effects of exchange rate fluctuations on investments are included with the net realized and unrealized gain (loss) on investment securities. Other foreign currency transactions resulting in realized and unrealized gain (loss) are disclosed separately.
Investment Transactions and Income. For financial reporting purposes, the Fund's investment holdings and NAV include trades executed through the end of the last business day of the period. The NAV per share for processing shareholder transactions is calculated as of the close of business of the New York Stock Exchange (NYSE), normally 4:00 p.m. Eastern time and includes trades executed through the end of the prior business day. Gains and losses on securities sold are determined on the basis of identified cost. Dividend income is recorded on the ex-dividend date, except for certain dividends from foreign securities where the ex-dividend date may have passed, which are recorded as soon as the Fund is informed of the ex-dividend date. Non-cash dividends included in dividend income, if any, are recorded at the fair market value of the securities received. Income and capital gain distributions from Fidelity Central Funds, if any, are recorded on the ex-dividend date. Interest income is accrued as earned and includes coupon interest and amortization of premium and accretion of discount on debt securities as applicable. Investment income is recorded net of foreign taxes withheld where recovery of such taxes is uncertain.
Class Allocations and Expenses. Investment income, realized and unrealized capital gains and losses, common expenses of the Fund, and certain fund-level expense reductions, if any, are allocated daily on a pro-rata basis to each class based on the relative net assets of each class to the total net assets of the Fund. Each class differs with respect to transfer agent and distribution and service plan fees incurred. Certain expense reductions may also differ by class. For the reporting period, the allocated portion of income and expenses to each class as a percent of its average net assets may vary due to the timing of recording these transactions in relation to fluctuating net assets of the classes. Expenses directly attributable to a fund are charged to that fund. Expenses attributable to more than one fund are allocated among the respective funds on the basis of relative net assets or other appropriate methods. Expense estimates are accrued in the period to which they relate and adjustments are made when actual amounts are known.
Income Tax Information and Distributions to Shareholders. Each year, the Fund intends to qualify as a regulated investment company under Subchapter M of the Internal Revenue Code, including distributing substantially all of its taxable income and realized gains. As a result, no provision for U.S. Federal income taxes is required. The Fund files a U.S. federal tax return, in addition to state and local tax returns as required. The Fund's federal income tax returns are subject to examination by the Internal Revenue Service (IRS) for a period of three fiscal years after they are filed. State and local tax returns may be subject to examination for an additional fiscal year depending on the jurisdiction. Foreign taxes are provided for based on the Fund's understanding of the tax rules and rates that exist in the foreign markets in which it invests. The Fund is subject to a tax imposed on capital gains by certain countries in which it invests. An estimated deferred tax liability for net unrealized appreciation on the applicable securities is included in Other payables and accrued expenses on the Statement of Assets & Liabilities.
Distributions are declared and recorded on the ex-dividend date. Income dividends and capital gain distributions are declared separately for each class. Income and capital gain distributions are determined in accordance with income tax regulations, which may differ from GAAP.
Capital accounts within the financial statements are adjusted for permanent book-tax differences. These adjustments have no impact on net assets or the results of operations. Capital accounts are not adjusted for temporary book-tax differences which will reverse in a subsequent period.
Book-tax differences are primarily due to foreign currency transactions, futures transactions, certain foreign taxes, passive foreign investment companies (PFIC), market discount, capital loss carryforwards and losses deferred due to wash sales.
The federal tax cost of investment securities and unrealized appreciation (depreciation) as of period end were as follows:
| Gross unrealized appreciation | $22,220,414 |
| Gross unrealized depreciation | (5,873,253) |
| Net unrealized appreciation (depreciation) on securities | $16,347,161 |
| Tax cost | $193,377,728 |
Capital loss carryforwards are only available to offset future capital gains of the Fund to the extent provided by regulations and may be limited. Under the Regulated Investment Company Modernization Act of 2010 (the Act), the Fund is permitted to carry forward capital losses incurred in taxable years beginning after December 22, 2010 for an unlimited period and such capital losses are required to be used prior to any losses that expire. The capital loss carryforward information presented below, including any applicable limitation, is estimated as of prior fiscal period end and is subject to adjustment.
| No expiration | |
| Short-term | $(3,072,849) |
| Long-term | (1,665,778) |
| Total capital loss carryforward | $(4,738,627) |
Short-Term Trading (Redemption) Fees. Shares held by investors in the Fund less than 90 days may have been subject to a redemption fee equal to 2.00% of the NAV of shares redeemed. All redemption fees, which reduce the proceeds of the shareholder redemption, are retained by the Fund and accounted for as an addition to paid in capital.
Restricted Securities. The Fund may invest in securities that are subject to legal or contractual restrictions on resale. These securities generally may be resold in transactions exempt from registration or to the public if the securities are registered. Disposal of these securities may involve time-consuming negotiations and expense, and prompt sale at an acceptable price may be difficult. Information regarding restricted securities is included at the end of the Fund's Schedule of Investments.
4. Derivative Instruments.
Risk Exposures and the Use of Derivative Instruments. The Fund's investment objective allows the Fund to enter into various types of derivative contracts, including futures contracts. Derivatives are investments whose value is primarily derived from underlying assets, indices or reference rates and may be transacted on an exchange or over-the-counter (OTC). Derivatives may involve a future commitment to buy or sell a specified asset based on specified terms, to exchange future cash flows at periodic intervals based on a notional principal amount, or for one party to make one or more payments upon the occurrence of specified events in exchange for periodic payments from the other party.
The Fund used derivatives to increase returns and to manage exposure to certain risks as defined below. The success of any strategy involving derivatives depends on analysis of numerous economic factors, and if the strategies for investment do not work as intended, the Fund may not achieve its objectives.
The Fund's use of derivatives increased or decreased its exposure to the following risk:
| Equity Risk | Equity risk relates to the fluctuations in the value of financial instruments as a result of changes in market prices (other than those arising from interest rate risk or foreign exchange risk), whether caused by factors specific to an individual investment, its issuer, or all factors affecting all instruments traded in a market or market segment.
|
The Fund is also exposed to additional risks from investing in derivatives, such as liquidity risk and counterparty credit risk. Liquidity risk is the risk that the Fund will be unable to close out the derivative in the open market in a timely manner. Counterparty credit risk is the risk that the counterparty will not be able to fulfill its obligation to the Fund. Counterparty credit risk related to exchange-traded futures contracts may be mitigated by the protection provided by the exchange on which they trade.
Investing in derivatives may involve greater risks than investing in the underlying assets directly and, to varying degrees, may involve risk of loss in excess of any initial investment and collateral received and amounts recognized in the Statement of Assets and Liabilities. In addition, there may be the risk that the change in value of the derivative contract does not correspond to the change in value of the underlying instrument.
Futures Contracts. A futures contract is an agreement between two parties to buy or sell a specified underlying instrument for a fixed price at a specified future date. The Fund used futures contracts to manage its exposure to the stock market.
Upon entering into a futures contract, a fund is required to deposit either cash or securities (initial margin) with a clearing broker in an amount equal to a certain percentage of the face value of the contract. Futures contracts are marked-to-market daily and subsequent daily payments (variation margin) are made or received by a fund depending on the daily fluctuations in the value of the futures contracts and are recorded as unrealized appreciation or (depreciation). This receivable and/or payable, if any, is included in daily variation margin for derivative instruments in the Statement of Assets and Liabilities. Realized gain or (loss) is recorded upon the expiration or closing of a futures contract. The net realized gain (loss) and change in net unrealized appreciation (depreciation) on futures contracts during the period is included in the Statement of Operations.
Any open futures contracts at period end are presented in the Schedule of Investments under the caption "Futures Contracts". The underlying face amount at value reflects each contract's exposure to the underlying instrument or index at period end and is representative of volume of activity during the period. Securities deposited to meet initial margin requirements are identified in the Schedule of Investments.
During the period the Fund recognized net realized gain (loss) of $491,569 and a change in net unrealized appreciation (depreciation) of $476,310 related to its investment in futures contracts. These amounts are included in the Statement of Operations.
5. Purchases and Sales of Investments.
Purchases and sales of securities, other than short-term securities, aggregated $110,597,649 and $22,612,206, respectively.
6. Fees and Other Transactions with Affiliates.
Management Fee. Fidelity Management & Research Company (the investment adviser) and its affiliates provide the Fund with investment management related services for which the Fund pays a monthly management fee. The management fee is the sum of an individual fund fee rate that is based on an annual rate of .60% of the Fund's average net assets and an annualized group fee rate that averaged .25% during the period. The group fee rate is based upon the average net assets of all the mutual funds advised by the investment adviser, including any mutual funds previously advised by the investment adviser that are currently advised by Fidelity SelectCo, LLC, an affiliate of the investment adviser. The group fee rate decreases as assets under management increase and increases as assets under management decrease. For the reporting period, the total annualized management fee rate was .85% of the Fund's average net assets.
Distribution and Service Plan Fees. In accordance with Rule 12b-1 of the 1940 Act, the Fund has adopted separate Distribution and Service Plans for each class of shares. Certain classes pay Fidelity Distributors Corporation (FDC), an affiliate of the investment adviser, separate Distribution and Service Fees, each of which is based on an annual percentage of each class' average net assets. In addition, FDC may pay financial intermediaries for selling shares of the Fund and providing shareholder support services. For the period, the Distribution and Service Fee rates, total fees and amounts retained by FDC were as follows:
| | Distribution
Fee | Service
Fee | Total Fees | Retained
by FDC |
| Class A | -% | .25% | $7,842 | $255 |
| Class M | .25% | .25% | 9,842 | 75 |
| Class C | .75% | .25% | 16,332 | 5,802 |
| | | | $34,016 | $6,132 |
Sales Load. FDC may receive a front-end sales charge of up to 5.75% for selling Class A shares and 3.50% for selling Class M shares, some of which is paid to financial intermediaries for selling shares of the Fund. Depending on the holding period, FDC may receive contingent deferred sales charges levied on Class A, Class M, and Class C redemptions. The deferred sales charges are 1.00% for Class C shares, 1.00% for certain purchases of Class A shares and .25% for certain purchases of Class M shares.
For the period, sales charge amounts retained by FDC were as follows:
| | Retained
by FDC |
| Class A | $6,914 |
| Class M | 1,430 |
| Class C(a) | 81 |
| | $8,425 |
(a) When Class C shares are initially sold, FDC pays commissions from its own resources to financial intermediaries through which the sales are made.
Transfer Agent Fees. Fidelity Investments Institutional Operations Company, Inc., (FIIOC), an affiliate of the investment adviser, is the transfer, dividend disbursing and shareholder servicing agent for each class of the Fund. FIIOC receives account fees and asset-based fees that vary according to the account size and type of account of the shareholders of the respective classes of the Fund. FIIOC pays for typesetting, printing and mailing of shareholder reports, except proxy statements.
For the period, transfer agent fees for each class were as follows:
| | Amount | % of
Class-Level Average
Net Assets(a) |
| Class A | $8,816 | .28 |
| Class M | 6,194 | .31 |
| Class C | 4,697 | .29 |
| Emerging Markets Discovery | 92,567 | .21 |
| Class I | 11,976 | .16 |
| | $124,250 | |
(a) Annualized
Accounting and Security Lending Fees. Fidelity Service Company, Inc. (FSC), an affiliate of the investment adviser, maintains the Fund's accounting records. The accounting fee is based on the level of average net assets for each month. Under a separate contract, FSC administers the security lending program. The security lending fee is based on the number and duration of lending transactions.
Brokerage Commissions. The Fund placed a portion of its portfolio transactions with brokerage firms which are affiliates of the investment adviser. Brokerage commissions are included in net realized gain (loss) and change in net unrealized appreciation (depreciation) in the Statement of Operations. The commissions paid to these affiliated firms were $466 for the period.
Interfund Trades. The Fund may purchase from or sell securities to other Fidelity Funds under procedures adopted by the Board. The procedures have been designed to ensure these interfund trades are executed in accordance with Rule 17a-7 of the 1940 Act. Interfund trades are included within the respective purchases and sales amounts shown in the Purchases and Sales of Investments note.
7. Committed Line of Credit.
The Fund participates with other funds managed by the investment adviser or an affiliate in a $4.25 billion credit facility (the "line of credit") to be utilized for temporary or emergency purposes to fund shareholder redemptions or for other short-term liquidity purposes. The Fund has agreed to pay commitment fees on its pro-rata portion of the line of credit, which amounted to $163 and is reflected in Miscellaneous expenses on the Statement of Operations. During the period, the Fund did not borrow on this line of credit.
8. Security Lending.
The Fund lends portfolio securities through a lending agent from time to time in order to earn additional income. For equity securities, a lending agent is used and may loan securities to certain qualified borrowers, including Fidelity Capital Markets (FCM), a broker-dealer affiliated with the Fund. On the settlement date of the loan, the Fund receives collateral (in the form of U.S. Treasury obligations, letters of credit and/or cash) against the loaned securities and maintains collateral in an amount not less than 100% of the market value of the loaned securities during the period of the loan. The market value of the loaned securities is determined at the close of business of the Fund and any additional required collateral is delivered to the Fund on the next business day. The Fund or borrower may terminate the loan at any time, and if the borrower defaults on its obligation to return the securities loaned because of insolvency or other reasons, the Fund may apply collateral received from the borrower against the obligation. The Fund may experience delays and costs in recovering the securities loaned. Any cash collateral received is invested in the Fidelity Securities Lending Cash Central Fund. The value of loaned securities and cash collateral at period end are disclosed on the Fund's Statement of Assets and Liabilities. At period end, there were no security loans outstanding with FCM. Security lending income represents the income earned on investing cash collateral, less rebates paid to borrowers and any lending agent fees associated with the loan, plus any premium payments received for lending certain types of securities. Security lending income is presented in the Statement of Operations as a component of income from Fidelity Central Funds. Total security lending income during the period amounted to $20,992, including $3 from securities loaned to FCM.
9. Expense Reductions.
The investment adviser contractually agreed to reimburse each class to the extent annual operating expenses exceeded certain levels of average net assets as noted in the table below. This reimbursement will remain in place through December 31, 2017. Some expenses, for example interest expense, including commitment fees, are excluded from this reimbursement.
The following classes were in reimbursement during the period:
| | Expense
Limitations | Reimbursement |
| Class A | 1.70% | $2,791 |
| Class M | 1.95% | 1,965 |
| Class C | 2.45% | 1,527 |
| Emerging Markets Discovery | 1.45% | 3,202 |
| | | $9,485 |
Commissions paid to certain brokers with whom the investment adviser, or its affiliates, places trades on behalf of the Fund include an amount in addition to trade execution, which may be rebated back to the Fund to offset certain expenses. This amount totaled $7,161 for the period. In addition, through arrangements with the Fund's custodian, credits realized as a result of certain uninvested cash balances were used to reduce the Fund's expenses. During the period, these credits reduced the Fund's custody expenses by $114.
In addition, during the period the investment adviser reimbursed and/or waived a portion of fund-level operating expenses in the amount of $397.
10. Distributions to Shareholders.
Distributions to shareholders of each class were as follows:
| | Six months ended
April 30, 2017 | Year ended October 31, 2016 |
| From net investment income | | |
| Class A | $29,900 | $22,428 |
| Class M | 10,789 | 4,316 |
| Class C | 1,070 | – |
| Emerging Markets Discovery | 534,294 | 453,104 |
| Class I | 83,753 | 10,869 |
| Total | $659,806 | $490,717 |
| From net realized gain | | |
| Class A | $29,370 | $– |
| Class M | 15,653 | – |
| Class C | 12,406 | – |
| Emerging Markets Discovery | 375,874 | – |
| Class I | 52,117 | – |
| Total | $485,420 | $– |
11. Share Transactions.
Share transactions for each class were as follows and may contain automatic conversions between classes or exchanges between affiliated funds:
| | Shares | Shares | Dollars | Dollars |
| | Six months ended April 30, 2017 | Year ended October 31, 2016 | Six months ended April 30, 2017 | Year ended October 31, 2016 |
| Class A | | | | |
| Shares sold | 404,988 | 131,085 | $5,116,680 | $1,473,088 |
| Reinvestment of distributions | 4,936 | 1,944 | 55,853 | 20,757 |
| Shares redeemed | (164,598) | (131,586) | (2,061,812) | (1,425,583) |
| Net increase (decrease) | 245,326 | 1,443 | $3,110,721 | $68,262 |
| Class M | | | | |
| Shares sold | 281,702 | 74,898 | $3,530,517 | $869,903 |
| Reinvestment of distributions | 2,312 | 389 | 26,067 | 4,146 |
| Shares redeemed | (29,087) | (25,757) | (357,128) | (281,676) |
| Net increase (decrease) | 254,927 | 49,530 | $3,199,456 | $592,373 |
| Class C | | | | |
| Shares sold | 303,778 | 58,882 | $3,764,443 | $655,298 |
| Reinvestment of distributions | 1,203 | – | 13,340 | – |
| Shares redeemed | (22,310) | (31,638) | (274,573) | (342,535) |
| Net increase (decrease) | 282,671 | 27,244 | $3,503,210 | $312,763 |
| Emerging Markets Discovery | | | | |
| Shares sold | 6,508,632 | 2,003,183 | $82,481,962 | $22,538,095 |
| Reinvestment of distributions | 74,929 | 39,922 | 850,905 | 427,569 |
| Shares redeemed | (1,215,820) | (2,204,224) | (14,587,583) | (24,359,570) |
| Net increase (decrease) | 5,367,741 | (161,119) | $68,745,284 | $(1,393,906) |
| Class I | | | | |
| Shares sold | 3,016,643 | 642,732 | $38,574,879 | $7,808,576 |
| Reinvestment of distributions | 11,894 | 981 | 135,413 | 10,531 |
| Shares redeemed | (635,470) | (97,475) | (7,689,713) | (1,038,525) |
| Net increase (decrease) | 2,393,067 | 546,238 | $31,020,579 | $6,780,582 |
12. Other.
The Fund's organizational documents provide former and current trustees and officers with a limited indemnification against liabilities arising in connection with the performance of their duties to the Fund. In the normal course of business, the Fund may also enter into contracts that provide general indemnifications. The Fund's maximum exposure under these arrangements is unknown as this would be dependent on future claims that may be made against the Fund. The risk of material loss from such claims is considered remote.
Fidelity® Total Emerging Markets Fund
Investment Summary (Unaudited)
Top Five Stocks as of April 30, 2017
| | % of fund's net assets | % of fund's net assets 6 months ago |
| Tencent Holdings Ltd. (Cayman Islands, Internet Software & Services) | 2.7 | 2.3 |
| Naspers Ltd. Class N (South Africa, Media) | 2.6 | 2.4 |
| Taiwan Semiconductor Manufacturing Co. Ltd. (Taiwan, Semiconductors & Semiconductor Equipment) | 2.1 | 2.8 |
| JD.com, Inc. sponsored ADR (Cayman Islands, Internet & Direct Marketing Retail) | 2.0 | 0.6 |
| Alibaba Group Holding Ltd. sponsored ADR (Cayman Islands, Internet Software & Services) | 1.5 | 1.4 |
| | 10.9 | |
Top Five Market Sectors as of April 30, 2017
| | % of fund's net assets | % of fund's net assets 6 months ago |
| Financials | 16.3 | 16.4 |
| Information Technology | 14.6 | 14.7 |
| Consumer Discretionary | 9.6 | 8.1 |
| Energy | 9.3 | 12.4 |
| Materials | 5.3 | 4.2 |
Top Five Countries as of April 30, 2017
| (excluding cash equivalents) | % of fund's net assets | % of fund's net assets 6 months ago |
| Cayman Islands | 10.3 | 7.1 |
| Korea (South) | 8.0 | 8.0 |
| Brazil | 6.4 | 6.7 |
| United States of America | 6.0 | 4.6 |
| Taiwan | 5.5 | 5.3 |
Percentages are adjusted for the effect of futures contracts, if applicable.
Asset Allocation (% of fund's net assets)
| As of April 30, 2017 |
| | Stocks and Equity Futures | 68.6% |
| | Bonds | 27.4% |
| | Short-Term Investments and Net Other Assets (Liabilities) | 4.0% |

| As of October 31, 2016 |
| | Stocks and Equity Futures | 68.3% |
| | Bonds | 26.6% |
| | Other Investments | 0.1% |
| | Short-Term Investments and Net Other Assets (Liabilities) | 5.0% |

Fidelity® Total Emerging Markets Fund
Investments April 30, 2017 (Unaudited)
Showing Percentage of Net Assets
| Common Stocks - 60.1% | | | |
| | | Shares | Value |
| Argentina - 0.3% | | | |
| Grupo Superveille SA sponsored ADR | | 7,700 | $130,823 |
| Telecom Argentina SA Class B sponsored ADR | | 15,034 | 340,670 |
| YPF SA Class D sponsored ADR | | 25,600 | 661,248 |
|
| TOTAL ARGENTINA | | | 1,132,741 |
|
| Australia - 0.0% | | | |
| Frontier Digital Ventures Ltd. | | 250,635 | 93,838 |
| Austria - 0.4% | | | |
| Erste Group Bank AG | | 38,975 | 1,393,388 |
| Bermuda - 0.9% | | | |
| AGTech Holdings Ltd. (a) | | 1,148,000 | 221,384 |
| Credicorp Ltd. (United States) | | 6,560 | 1,008,010 |
| GP Investments Ltd. Class A (depositary receipt) (a) | | 22,922 | 48,530 |
| PAX Global Technology Ltd. | | 574,460 | 355,975 |
| Shangri-La Asia Ltd. | | 1,022,000 | 1,463,688 |
| VimpelCom Ltd. sponsored ADR | | 72,860 | 300,912 |
|
| TOTAL BERMUDA | | | 3,398,499 |
|
| Brazil - 2.3% | | | |
| B2W Companhia Global do Varejo (a) | | 249,740 | 1,052,763 |
| B2W Companhia Global do Varejo rights (a) | | 60,623 | 250,777 |
| BB Seguridade Participacoes SA | | 83,070 | 782,269 |
| BR Malls Participacoes SA | | 172,020 | 761,450 |
| Cielo SA | | 62,073 | 471,309 |
| Companhia de Saneamento de Minas Gerais | | 56,036 | 635,559 |
| Cosan SA Industria e Comercio | | 47,455 | 554,829 |
| Direcional Engenharia SA | | 95,000 | 182,574 |
| FPC Par Corretora de Seguros | | 135,700 | 808,031 |
| Localiza Rent A Car SA | | 51,900 | 773,419 |
| Minerva SA | | 164,600 | 523,766 |
| Smiles SA | | 108,700 | 2,364,376 |
|
| TOTAL BRAZIL | | | 9,161,122 |
|
| British Virgin Islands - 0.4% | | | |
| Mail.Ru Group Ltd. GDR (Reg. S) (a) | | 58,416 | 1,539,262 |
| Canada - 0.3% | | | |
| Pacific Exploration and Production Corp. | | 1,001 | 30,066 |
| Pan American Silver Corp. | | 52,800 | 885,456 |
| Torex Gold Resources, Inc. (a) | | 17,830 | 301,989 |
|
| TOTAL CANADA | | | 1,217,511 |
|
| Cayman Islands - 10.1% | | | |
| 51job, Inc. sponsored ADR (a) | | 14,200 | 582,058 |
| 58.com, Inc. ADR (a) | | 52,250 | 2,068,055 |
| Airtac International Group | | 32,000 | 365,285 |
| Alibaba Group Holding Ltd. sponsored ADR (a) | | 49,500 | 5,717,250 |
| ASM Pacific Technology Ltd. | | 32,500 | 483,843 |
| Bitauto Holdings Ltd. ADR (a) | | 27,600 | 809,232 |
| BizLink Holding, Inc. | | 42,294 | 252,591 |
| China State Construction International Holdings Ltd. | | 392,000 | 711,596 |
| CK Hutchison Holdings Ltd. | | 26,510 | 331,104 |
| Ctrip.com International Ltd. ADR (a) | | 41,900 | 2,116,369 |
| Haitian International Holdings Ltd. | | 255,000 | 624,850 |
| JD.com, Inc. sponsored ADR (a) | | 223,000 | 7,820,610 |
| Kingsoft Corp. Ltd. | | 172,000 | 490,901 |
| Momo, Inc. ADR (a) | | 17,200 | 653,256 |
| NetEase, Inc. ADR | | 6,900 | 1,831,191 |
| Sino Biopharmaceutical Ltd. | | 688,000 | 566,084 |
| Sunny Optical Technology Group Co. Ltd. | | 80,000 | 658,237 |
| Tencent Holdings Ltd. | | 335,050 | 10,498,219 |
| Uni-President China Holdings Ltd. | | 1,675,600 | 1,176,185 |
| Vipshop Holdings Ltd. ADR (a) | | 119,100 | 1,651,917 |
|
| TOTAL CAYMAN ISLANDS | | | 39,408,833 |
|
| Chile - 1.0% | | | |
| Compania Cervecerias Unidas SA sponsored ADR | | 41,300 | 1,064,301 |
| CorpBanca SA (a) | | 59,671,766 | 543,873 |
| Enersis SA | | 3,230,006 | 641,399 |
| Inversiones La Construccion SA | | 36,325 | 489,845 |
| Sociedad Quimica y Minera de Chile SA (PN-B) sponsored ADR | | 21,300 | 757,215 |
| Vina Concha y Toro SA | | 335,968 | 541,652 |
|
| TOTAL CHILE | | | 4,038,285 |
|
| China - 4.7% | | | |
| Anhui Conch Cement Co. Ltd. (H Shares) | | 256,000 | 896,848 |
| BBMG Corp. (H Shares) | | 1,506,000 | 807,372 |
| China Life Insurance Co. Ltd. (H Shares) | | 689,834 | 2,098,658 |
| China Longyuan Power Grid Corp. Ltd. (H Shares) | | 694,960 | 535,179 |
| China Oilfield Services Ltd. (H Shares) | | 598,000 | 551,999 |
| China Pacific Insurance (Group) Co. Ltd. (H Shares) | | 481,706 | 1,780,461 |
| China Petroleum & Chemical Corp. (H Shares) | | 908,000 | 737,345 |
| China Telecom Corp. Ltd. (H Shares) | | 1,614,949 | 788,960 |
| Hangzhou Hikvision Digital Technology Co. Ltd. Class A | | 70,950 | 376,390 |
| Industrial & Commercial Bank of China Ltd. (H Shares) | | 5,608,160 | 3,662,660 |
| Inner Mongoli Yili Industries Co. Ltd. (A Shares) | | 143,158 | 379,207 |
| Kweichow Moutai Co. Ltd. (A Shares) | | 14,299 | 857,670 |
| Maanshan Iron & Steel Ltd. (H Shares) (a) | | 1,190,000 | 402,360 |
| PICC Property & Casualty Co. Ltd. (H Shares) | | 544,580 | 876,554 |
| Qingdao Haier Co. Ltd. | | 910,904 | 1,610,781 |
| Shanghai International Airport Co. Ltd. (A Shares) | | 130,014 | 645,968 |
| Tsingtao Brewery Co. Ltd. (H Shares) | | 236,000 | 1,061,922 |
| Zhengzhou Yutong Bus Co. Ltd. | | 187,171 | 546,837 |
|
| TOTAL CHINA | | | 18,617,171 |
|
| Colombia - 0.2% | | | |
| Bancolombia SA sponsored ADR | | 22,435 | 885,958 |
| Czech Republic - 0.2% | | | |
| MONETA Money Bank A/S | | 262,100 | 846,431 |
| Greece - 0.3% | | | |
| Titan Cement Co. SA (Reg.) | | 40,800 | 1,066,198 |
| Hong Kong - 3.1% | | | |
| AIA Group Ltd. | | 110,920 | 767,906 |
| China Mobile Ltd. | | 54,250 | 577,579 |
| China Mobile Ltd. sponsored ADR | | 46,292 | 2,468,289 |
| China Resources Beer Holdings Co. Ltd. | | 768,666 | 1,849,933 |
| China Resources Power Holdings Co. Ltd. | | 331,809 | 598,065 |
| China Unicom Ltd. | | 97,900 | 126,685 |
| China Unicom Ltd. sponsored ADR | | 55,220 | 716,756 |
| CNOOC Ltd. | | 1,839,000 | 2,145,374 |
| CSPC Pharmaceutical Group Ltd. | | 288,000 | 399,879 |
| Far East Horizon Ltd. | | 2,006,980 | 1,847,433 |
| Sinotruk Hong Kong Ltd. | | 722,500 | 502,513 |
|
| TOTAL HONG KONG | | | 12,000,412 |
|
| India - 5.1% | | | |
| ACC Ltd. | | 7,376 | 186,614 |
| Adani Ports & Special Economic Zone Ltd. (a) | | 170,041 | 866,736 |
| Axis Bank Ltd. | | 115,761 | 917,679 |
| Bharti Infratel Ltd. | | 89,936 | 496,194 |
| Coal India Ltd. (a) | | 196,900 | 847,292 |
| Edelweiss Financial Services Ltd. | | 127,008 | 331,201 |
| Eicher Motors Ltd. | | 2,046 | 829,602 |
| Gujarat Gas Ltd. (a) | | 9,455 | 124,221 |
| ICICI Bank Ltd. | | 135,256 | 583,596 |
| ICICI Bank Ltd. sponsored ADR | | 68,100 | 583,617 |
| Indraprastha Gas Ltd. | | 29,371 | 483,212 |
| ITC Ltd. | | 264,569 | 1,144,038 |
| JK Cement Ltd. | | 52,422 | 794,810 |
| Larsen & Toubro Ltd. | | 41,949 | 1,141,738 |
| LIC Housing Finance Ltd. | | 77,853 | 810,015 |
| Lupin Ltd. | | 72,304 | 1,505,181 |
| Petronet LNG Ltd. | | 95,922 | 632,244 |
| Phoenix Mills Ltd. | | 112,888 | 725,897 |
| Power Grid Corp. of India Ltd. | | 318,923 | 1,031,824 |
| Reliance Industries Ltd. | | 130,558 | 2,833,326 |
| SREI Infrastructure Finance Ltd. | | 116,223 | 163,786 |
| State Bank of India | | 272,083 | 1,226,257 |
| Sun Pharmaceutical Industries Ltd. | | 158,946 | 1,587,111 |
|
| TOTAL INDIA | | | 19,846,191 |
|
| Indonesia - 1.2% | | | |
| PT Astra International Tbk | | 2,468,600 | 1,657,586 |
| PT Bank Mandiri (Persero) Tbk | | 1,228,950 | 1,078,754 |
| PT Bank Rakyat Indonesia Tbk | | 1,414,500 | 1,368,974 |
| PT Kalbe Farma Tbk | | 2,851,300 | 339,058 |
| PT Link Net Tbk | | 857,400 | 347,360 |
|
| TOTAL INDONESIA | | | 4,791,732 |
|
| Israel - 0.2% | | | |
| Bezeq The Israel Telecommunication Corp. Ltd. | | 564,655 | 950,238 |
| Japan - 0.7% | | | |
| Alps Electric Co. Ltd. | | 18,300 | 537,632 |
| Nissha Printing Co. Ltd. | | 3,000 | 74,600 |
| Sumco Corp. | | 99,800 | 1,744,877 |
| Suzuki Motor Corp. | | 13,700 | 571,719 |
|
| TOTAL JAPAN | | | 2,928,828 |
|
| Korea (South) - 6.9% | | | |
| AMOREPACIFIC Group, Inc. | | 5,526 | 638,774 |
| BS Financial Group, Inc. | | 70,265 | 590,483 |
| Daou Technology, Inc. | | 51,536 | 940,025 |
| Duk San Neolux Co. Ltd. (a) | | 6,656 | 219,117 |
| EO Technics Co. Ltd. | | 1,992 | 148,489 |
| Fila Korea Ltd. | | 9,005 | 549,356 |
| Hanon Systems | | 54,935 | 408,536 |
| Hyundai Fire & Marine Insurance Co. Ltd. | | 26,866 | 866,721 |
| Hyundai Glovis Co. Ltd. | | 4,198 | 535,083 |
| Hyundai Industrial Development & Construction Co. | | 4,504 | 176,977 |
| Hyundai Mipo Dockyard Co. Ltd. (a) | | 5,941 | 483,594 |
| Hyundai Mobis | | 10,631 | 2,074,615 |
| InterPark INT Corp. | | 23,097 | 218,260 |
| KB Financial Group, Inc. | | 70,630 | 3,105,533 |
| KEPCO Plant Service & Engineering Co. Ltd. | | 8,420 | 424,849 |
| Korea Electric Power Corp. | | 28,477 | 1,135,400 |
| Korea Express Co. Ltd. (a) | | 5,574 | 815,815 |
| Korean Reinsurance Co. | | 90,338 | 897,345 |
| KT Corp. | | 9,389 | 265,720 |
| KT Corp. sponsored ADR | | 8,290 | 137,531 |
| LG Chemical Ltd. | | 3,297 | 794,109 |
| LG Telecom Ltd. | | 27,683 | 351,634 |
| Netmarble Games Corp. | | 4,253 | 586,956 |
| Samsung Electronics Co. Ltd. | | 2,279 | 4,469,452 |
| Samsung Life Insurance Co. Ltd. (a) | | 11,712 | 1,127,342 |
| Samsung SDI Co. Ltd. | | 9,986 | 1,206,993 |
| Shinhan Financial Group Co. Ltd. | | 70,249 | 2,933,769 |
| Shinhan Financial Group Co. Ltd. sponsored ADR | | 700 | 29,232 |
| SK Telecom Co. Ltd. sponsored ADR | | 25,684 | 605,886 |
| Viatron Technologies, Inc. | | 9,101 | 164,804 |
|
| TOTAL KOREA (SOUTH) | | | 26,902,400 |
|
| Mauritius - 0.2% | | | |
| MakeMyTrip Ltd. (a) | | 17,600 | 675,840 |
| Mexico - 2.7% | | | |
| America Movil S.A.B. de CV Series L sponsored ADR | | 19,253 | 296,304 |
| CEMEX S.A.B. de CV sponsored ADR | | 164,888 | 1,520,267 |
| Fibra Uno Administracion SA de CV | | 335,760 | 586,435 |
| Gruma S.A.B. de CV Series B | | 99,885 | 1,333,799 |
| Grupo Aeroportuario del Pacifico S.A.B. de CV Series B | | 83,700 | 860,776 |
| Grupo Comercial Chedraui S.A.B. de CV | | 187,876 | 389,519 |
| Grupo Financiero Banorte S.A.B. de CV Series O | | 198,829 | 1,150,711 |
| Infraestructura Energetica Nova S.A.B. de CV | | 147,600 | 689,497 |
| Macquarie Mexican (REIT) | | 1,115,270 | 1,222,189 |
| Promotora y Operadora de Infraestructura S.A.B. de CV | | 48,975 | 522,549 |
| Tenedora Nemak SA de CV | | 553,367 | 584,959 |
| Wal-Mart de Mexico SA de CV Series V (a) | | 678,100 | 1,530,883 |
|
| TOTAL MEXICO | | | 10,687,888 |
|
| Netherlands - 0.7% | | | |
| Hangzhou Hikvision Digital Technology Co. Ltd. ELS (BNP Paribas Warrant Program) warrants 9/29/17 (a)(b) | | 66,550 | 353,048 |
| X5 Retail Group NV GDR (Reg. S) (a) | | 19,200 | 676,800 |
| Yandex NV Series A (a) | | 68,187 | 1,858,778 |
|
| TOTAL NETHERLANDS | | | 2,888,626 |
|
| Nigeria - 0.1% | | | |
| Guaranty Trust Bank PLC | | 476,923 | 41,566 |
| Guaranty Trust Bank PLC GDR (Reg. S) | | 23,480 | 103,312 |
| Transnational Corp. of Nigeria PLC | | 6,036,239 | 17,385 |
| Zenith Bank PLC | | 3,605,933 | 175,842 |
|
| TOTAL NIGERIA | | | 338,105 |
|
| Pakistan - 0.2% | | | |
| Habib Bank Ltd. | | 315,000 | 828,704 |
| Panama - 0.1% | | | |
| Copa Holdings SA Class A | | 2,449 | 285,113 |
| Philippines - 0.3% | | | |
| Metropolitan Bank & Trust Co. | | 330,531 | 556,910 |
| Robinsons Land Corp. | | 1,387,380 | 709,576 |
|
| TOTAL PHILIPPINES | | | 1,266,486 |
|
| Romania - 0.1% | | | |
| Banca Transilvania SA | | 636,993 | 421,875 |
| Russia - 3.7% | | | |
| Gazprom OAO sponsored ADR (Reg. S) | | 58,300 | 276,925 |
| Lukoil PJSC sponsored ADR | | 47,300 | 2,349,155 |
| Magnit OJSC GDR (Reg. S) | | 15,500 | 541,725 |
| MegaFon PJSC (a) | | 24,000 | 252,442 |
| MegaFon PJSC GDR | | 13,220 | 141,322 |
| MMC Norilsk Nickel PJSC sponsored ADR | | 81,100 | 1,247,724 |
| Mobile TeleSystems OJSC | | 143,782 | 691,827 |
| Mobile TeleSystems OJSC sponsored ADR | | 4,700 | 48,504 |
| NOVATEK OAO GDR (Reg. S) | | 12,700 | 1,539,240 |
| RusHydro PJSC (a) | | 38,549,800 | 606,057 |
| Sberbank of Russia | | 936,970 | 2,721,484 |
| Sberbank of Russia sponsored ADR | | 243,584 | 2,896,214 |
| Sistema JSFC | | 1,492,700 | 559,808 |
| Sistema JSFC sponsored GDR | | 11,560 | 97,220 |
| Unipro PJSC | | 10,020,700 | 443,575 |
|
| TOTAL RUSSIA | | | 14,413,222 |
|
| Singapore - 0.3% | | | |
| Ascendas Real Estate Investment Trust | | 263,590 | 482,976 |
| First Resources Ltd. | | 465,300 | 624,441 |
|
| TOTAL SINGAPORE | | | 1,107,417 |
|
| South Africa - 4.3% | | | |
| Alexander Forbes Group Holdings Ltd. | | 6,830 | 3,291 |
| Aspen Pharmacare Holdings Ltd. | | 40,802 | 846,434 |
| Barclays Africa Group Ltd. | | 46,136 | 507,492 |
| Bidcorp Ltd. | | 23,256 | 492,729 |
| Bidvest Group Ltd. | | 59,656 | 712,055 |
| FirstRand Ltd. | | 331,500 | 1,236,575 |
| Imperial Holdings Ltd. | | 58,700 | 742,285 |
| JSE Ltd. | | 27,510 | 293,138 |
| Life Healthcare Group Holdings Ltd. | | 274,600 | 590,348 |
| MTN Group Ltd. | | 35,600 | 336,986 |
| Naspers Ltd. Class N | | 52,531 | 9,988,849 |
| Nedbank Group Ltd. | | 31,980 | 539,511 |
| Telkom SA Ltd. | | 79,202 | 443,193 |
|
| TOTAL SOUTH AFRICA | | | 16,732,886 |
|
| Taiwan - 5.5% | | | |
| Advantech Co. Ltd. | | 48,000 | 387,519 |
| Chroma ATE, Inc. | | 105,000 | 327,962 |
| E.SUN Financial Holdings Co. Ltd. | | 842,200 | 508,558 |
| E.SUN Financial Holdings Co. Ltd. rights 5/2/17 (a) | | 54,635 | 5,875 |
| eMemory Technology, Inc. | | 14,995 | 206,148 |
| Genius Electronic Optical Co. Ltd. (a) | | 49,000 | 573,123 |
| GlobalWafers Co. Ltd. | | 108,000 | 771,862 |
| GlobalWafers Co. Ltd. unit (a) | | 83,300 | 595,345 |
| Hon Hai Precision Industry Co. Ltd. (Foxconn) | | 93,000 | 304,020 |
| King's Town Bank | | 341,600 | 327,777 |
| LandMark Optoelectronics Corp. | | 46,000 | 403,335 |
| Largan Precision Co. Ltd. | | 29,403 | 4,878,935 |
| PChome Online, Inc. | | 49,000 | 418,291 |
| Taiwan Cement Corp. | | 1,093,000 | 1,269,374 |
| Taiwan Fertilizer Co. Ltd. | | 219,000 | 295,642 |
| Taiwan Semiconductor Manufacturing Co. Ltd. | | 1,252,000 | 8,051,376 |
| Taiwan Semiconductor Manufacturing Co. Ltd. sponsored ADR | | 7,242 | 239,493 |
| Universal Cement Corp. | | 363,320 | 313,756 |
| Vanguard International Semiconductor Corp. | | 171,000 | 325,898 |
| Wistron NeWeb Corp. | | 89,780 | 257,253 |
| Yuanta Financial Holding Co. Ltd. | | 2,772,231 | 1,183,264 |
|
| TOTAL TAIWAN | | | 21,644,806 |
|
| Thailand - 1.1% | | | |
| Delta Electronics PCL (For. Reg.) | | 150,300 | 399,642 |
| Kasikornbank PCL (For. Reg.) | | 211,880 | 1,132,884 |
| PTT Global Chemical PCL (For. Reg.) | | 646,800 | 1,402,023 |
| PTT PCL (For. Reg.) | | 100,300 | 1,127,650 |
| Star Petroleum Refining PCL | | 1,126,300 | 429,687 |
|
| TOTAL THAILAND | | | 4,491,886 |
|
| Turkey - 0.9% | | | |
| Aselsan A/S | | 113,000 | 621,318 |
| Bim Birlesik Magazalar A/S JSC | | 64,000 | 1,045,961 |
| Enka Insaat ve Sanayi A/S | | 247,030 | 379,731 |
| Tupras Turkiye Petrol Rafinelleri A/S | | 50,200 | 1,264,911 |
| Turkiye Garanti Bankasi A/S | | 51,000 | 137,696 |
|
| TOTAL TURKEY | | | 3,449,617 |
|
| United Arab Emirates - 1.1% | | | |
| DP World Ltd. | | 37,957 | 775,841 |
| Emaar Properties PJSC | | 899,504 | 1,758,355 |
| National Bank of Abu Dhabi PJSC (a) | | 579,841 | 1,736,524 |
|
| TOTAL UNITED ARAB EMIRATES | | | 4,270,720 |
|
| United Kingdom - 0.4% | | | |
| Fresnillo PLC | | 33,000 | 620,608 |
| Mondi PLC | | 36,000 | 933,010 |
| Shanghai International Airport Co. Ltd. (UBS Warrant Programme) warrants 5/11/18 (a)(b) | | 9,200 | 45,710 |
|
| TOTAL UNITED KINGDOM | | | 1,599,328 |
|
| United States of America - 0.1% | | | |
| China Biologic Products, Inc. (a) | | 2,160 | 254,880 |
| TOTAL COMMON STOCKS | | | |
| (Cost $209,743,904) | | | 235,576,437 |
|
| Nonconvertible Preferred Stocks - 4.8% | | | |
| Brazil - 3.7% | | | |
| Ambev SA sponsored ADR | | 380,000 | 2,177,400 |
| Banco do Estado Rio Grande do Sul SA | | 131,920 | 590,597 |
| Companhia Paranaense de Energia-Copel: | | | |
| (PN-B) | | 2,215 | 20,356 |
| (PN-B) sponsored ADR | | 54,752 | 502,076 |
| Fibria Celulose SA sponsored ADR | | 101,000 | 927,180 |
| Itau Unibanco Holding SA sponsored ADR | | 398,441 | 4,900,824 |
| Metalurgica Gerdau SA (PN) (a) | | 543,470 | 787,625 |
| Petroleo Brasileiro SA - Petrobras (PN) sponsored (non-vtg.) (a) | | 201,206 | 1,756,528 |
| Telefonica Brasil SA | | 77,443 | 1,153,819 |
| Vale SA (PN-A) sponsored ADR | | 228,200 | 1,873,522 |
|
| TOTAL BRAZIL | | | 14,689,927 |
|
| Korea (South) - 1.1% | | | |
| Hyundai Motor Co. Series 2 | | 18,034 | 1,574,170 |
| Samsung Electronics Co. Ltd. | | 1,270 | 1,957,024 |
| Samsung Fire & Marine Insurance Co. Ltd. | | 5,089 | 802,985 |
|
| TOTAL KOREA (SOUTH) | | | 4,334,179 |
|
| TOTAL NONCONVERTIBLE PREFERRED STOCKS | | | |
| (Cost $17,265,756) | | | 19,024,106 |
| | | Principal Amount(c) | Value |
|
| Nonconvertible Bonds - 8.3% | | | |
| Azerbaijan - 0.6% | | | |
| International Bank of Azerbaijan OJSC 5.625% 6/11/19 (Reg. S) | | 600,000 | 603,072 |
| Southern Gas Corridor CJSC 6.875% 3/24/26 (b) | | 1,180,000 | 1,302,307 |
| State Oil Co. of Azerbaijan Republic 6.95% 3/18/30 (Reg. S) | | 275,000 | 297,688 |
|
| TOTAL AZERBAIJAN | | | 2,203,067 |
|
| British Virgin Islands - 0.2% | | | |
| 1MDB Global Investments Ltd. 4.4% 3/9/23 | | 1,000,000 | 937,502 |
| Canada - 0.2% | | | |
| Evraz, Inc. NA Canada 7.5% 11/15/19 (b) | | 10,000 | 10,375 |
| First Quantum Minerals Ltd.: | | | |
| 7% 2/15/21 (b) | | 250,000 | 258,750 |
| 7.25% 4/1/23 (b) | | 400,000 | 407,250 |
| 7.5% 4/1/25 (b) | | 200,000 | 204,000 |
| Pacific Exploration and Production Corp. 10% 11/2/21 pay-in-kind (d) | | 18,000 | 20,205 |
|
| TOTAL CANADA | | | 900,580 |
|
| Cayman Islands - 0.2% | | | |
| Ksa Sukuk Ltd. 3.628% 4/20/27 (b) | | 600,000 | 602,724 |
| Odebrecht Finance Ltd. 4.375% 4/25/25 (b) | | 400,000 | 179,500 |
|
| TOTAL CAYMAN ISLANDS | | | 782,224 |
|
| Georgia - 0.4% | | | |
| Georgian Oil & Gas Corp. 6.75% 4/26/21 (b) | | 250,000 | 262,550 |
| JSC BGEO Group 6% 7/26/23 (b) | | 600,000 | 603,750 |
| JSC Georgian Railway 7.75% 7/11/22 (b) | | 600,000 | 659,502 |
|
| TOTAL GEORGIA | | | 1,525,802 |
|
| Indonesia - 0.4% | | | |
| PT Pertamina Persero: | | | |
| 4.875% 5/3/22 (b) | | 275,000 | 290,136 |
| 5.625% 5/20/43 (b) | | 200,000 | 205,896 |
| 6% 5/3/42 (b) | | 400,000 | 425,026 |
| 6.5% 5/27/41 (b) | | 700,000 | 787,553 |
|
| TOTAL INDONESIA | | | 1,708,611 |
|
| Ireland - 0.3% | | | |
| Borets Finance DAC 6.5% 4/7/22 (b) | | 200,000 | 207,000 |
| Metalloinvest Finance Designated Activity Co. 4.85% 5/2/24 (b) | | 200,000 | 199,750 |
| Vnesheconombank Via VEB Finance PLC: | | | |
| 6.8% 11/22/25 (b) | | 425,000 | 474,445 |
| 6.902% 7/9/20 (b) | | 200,000 | 219,485 |
|
| TOTAL IRELAND | | | 1,100,680 |
|
| Israel - 0.1% | | | |
| Israel Electric Corp. Ltd. 7.75% 12/15/27 (Reg. S) | | 275,000 | 342,265 |
| Kazakhstan - 0.4% | | | |
| Kazagro National Management Holding JSC 4.625% 5/24/23 (b) | | 400,000 | 394,733 |
| KazMunaiGaz Finance Sub BV: | | | |
| 3.875% 4/19/22 (b) | | 240,000 | 240,348 |
| 5.75% 4/19/47 (b) | | 290,000 | 282,779 |
| 6.375% 4/9/21 (b) | | 250,000 | 274,446 |
| 7% 5/5/20 (b) | | 200,000 | 219,555 |
|
| TOTAL KAZAKHSTAN | | | 1,411,861 |
|
| Luxembourg - 0.6% | | | |
| EVRAZ Group SA 5.375% 3/20/23 (b) | | 245,000 | 246,519 |
| Kernel Holding SA 8.75% 1/31/22 (b) | | 400,000 | 424,000 |
| MHP SA 7.75% 5/10/24 (b)(e) | | 200,000 | 202,600 |
| Petrobras International Finance Co. Ltd. 8.375% 12/10/18 | | 300,000 | 324,000 |
| Rumo Luxembourg Sarl 7.375% 2/9/24 (b) | | 400,000 | 416,800 |
| Steel Capital SA LN Partner Net Program 3.85% 8/27/21 (b) | | 400,000 | 400,580 |
| VM Holding SA 5.375% 5/4/27 (b) | | 400,000 | 398,200 |
|
| TOTAL LUXEMBOURG | | | 2,412,699 |
|
| Mexico - 0.8% | | | |
| Petroleos Mexicanos: | | | |
| 4.7696% 3/11/22 (b)(d) | | 260,000 | 282,399 |
| 5.5% 6/27/44 | | 305,000 | 267,638 |
| 6.375% 2/4/21 | | 150,000 | 163,313 |
| 6.375% 1/23/45 | | 300,000 | 293,670 |
| 6.5% 6/2/41 | | 1,300,000 | 1,301,950 |
| 6.75% 9/21/47 | | 400,000 | 406,520 |
| 6.875% 8/4/26 | | 400,000 | 447,000 |
|
| TOTAL MEXICO | | | 3,162,490 |
|
| Mongolia - 0.1% | | | |
| Trade and Development Bank of Mongolia LLC 9.375% 5/19/20 (Reg. S) | | 450,000 | 484,528 |
| Morocco - 0.1% | | | |
| OCP SA 6.875% 4/25/44 (b) | | 275,000 | 297,688 |
| Netherlands - 1.0% | | | |
| Petrobras Global Finance BV: | | | |
| 6.85% 6/5/2115 | | 965,000 | 859,333 |
| 7.25% 3/17/44 | | 705,000 | 701,240 |
| 8.375% 5/23/21 | | 325,000 | 368,063 |
| 8.75% 5/23/26 | | 1,675,000 | 1,953,050 |
|
| TOTAL NETHERLANDS | | | 3,881,686 |
|
| South Africa - 0.3% | | | |
| Eskom Holdings SOC Ltd. 6.75% 8/6/23 (b) | | 1,225,000 | 1,258,935 |
| Trinidad & Tobago - 0.3% | | | |
| Petroleum Co. of Trinidad & Tobago Ltd.: | | | |
| 6% 5/8/22 (b) | | 313,958 | 310,181 |
| 9.75% 8/14/19 (b) | | 750,000 | 796,875 |
|
| TOTAL TRINIDAD & TOBAGO | | | 1,107,056 |
|
| Tunisia - 0.3% | | | |
| Banque Centrale de Tunisie: | | | |
| 5.625% 2/17/24 (Reg. S) | EUR | 500,000 | 556,224 |
| 5.75% 1/30/25 (b) | | 600,000 | 588,600 |
|
| TOTAL TUNISIA | | | 1,144,824 |
|
| Turkey - 0.2% | | | |
| Akbank TAS/Ak Finansal Kiralama A/S 7.2% 3/16/27 (b)(d) | | 700,000 | 738,956 |
| Turkiye Ihracat Kredi Bankasi A/S 5.375% 10/24/23 (b) | | 200,000 | 200,500 |
|
| TOTAL TURKEY | | | 939,456 |
|
| United Arab Emirates - 0.2% | | | |
| DP World Ltd. 6.85% 7/2/37 (Reg. S) | | 500,000 | 587,500 |
| United Kingdom - 0.3% | | | |
| Biz Finance PLC 9.625% 4/27/22 (b) | | 750,000 | 762,375 |
| Petra Diamonds U.S. Treasury PLC 7.25% 5/1/22 (b) | | 400,000 | 418,000 |
|
| TOTAL UNITED KINGDOM | | | 1,180,375 |
|
| United States of America - 0.4% | | | |
| Pemex Project Funding Master Trust: | | | |
| 6.625% 6/15/35 | | 1,275,000 | 1,326,000 |
| 8.625% 2/1/22 | | 300,000 | 351,000 |
|
| TOTAL UNITED STATES OF AMERICA | | | 1,677,000 |
|
| Venezuela - 0.9% | | | |
| Petroleos de Venezuela SA: | | | |
| 5.5% 4/12/37 | | 500,000 | 191,250 |
| 6% 5/16/24 (b) | | 1,000,000 | 391,250 |
| 6% 11/15/26 (Reg. S) | | 2,450,000 | 934,675 |
| 8.5% 10/27/20 (Reg. S) | | 1,750,000 | 1,371,125 |
| 9% 11/17/21 (Reg. S) | | 550,000 | 289,685 |
| 12.75% 2/17/22 (b) | | 600,000 | 373,440 |
|
| TOTAL VENEZUELA | | | 3,551,425 |
|
| TOTAL NONCONVERTIBLE BONDS | | | |
| (Cost $31,873,261) | | | 32,598,254 |
|
| Government Obligations - 19.3% | | | |
| Angola - 0.1% | | | |
| Angola Republic 9.5% 11/12/25 (b) | | 250,000 | 261,815 |
| Argentina - 1.5% | | | |
| Argentine Republic: | | | |
| 0% 4/3/22 (d) | ARS | 8,000,000 | 556,804 |
| 6.625% 7/6/28 | | 150,000 | 153,345 |
| 6.875% 1/26/27 | | 1,950,000 | 2,060,175 |
| 7.5% 4/22/26 | | 1,960,000 | 2,164,722 |
| 7.82% 12/31/33 | EUR | 447,234 | 523,710 |
| 8.28% 12/31/33 | | 315,459 | 352,525 |
|
| TOTAL ARGENTINA | | | 5,811,281 |
|
| Armenia - 0.4% | | | |
| Republic of Armenia: | | | |
| 6% 9/30/20 (b) | | 325,000 | 341,640 |
| 7.15% 3/26/25 (b) | | 1,095,000 | 1,193,725 |
|
| TOTAL ARMENIA | | | 1,535,365 |
|
| Barbados - 0.3% | | | |
| Barbados Government 7% 8/4/22 (b) | | 1,313,000 | 1,066,813 |
| Belarus - 0.3% | | | |
| Belarus Republic 8.95% 1/26/18 | | 1,125,000 | 1,164,992 |
| Brazil - 0.4% | | | |
| Brazilian Federative Republic: | | | |
| 5% 1/27/45 | | 200,000 | 181,250 |
| 5.625% 2/21/47 | | 200,000 | 198,000 |
| 7.125% 1/20/37 | | 200,000 | 232,000 |
| 8.25% 1/20/34 | | 500,000 | 635,025 |
| 12.25% 3/6/30 | | 100,000 | 165,000 |
|
| TOTAL BRAZIL | | | 1,411,275 |
|
| Cameroon - 0.4% | | | |
| Cameroon Republic 9.5% 11/19/25 (b) | | 1,300,000 | 1,478,958 |
| Colombia - 0.1% | | | |
| Colombian Republic: | | | |
| 6.125% 1/18/41 | | 100,000 | 115,000 |
| 7.375% 9/18/37 | | 250,000 | 321,500 |
|
| TOTAL COLOMBIA | | | 436,500 |
|
| Costa Rica - 0.3% | | | |
| Costa Rican Republic: | | | |
| 4.375% 4/30/25 (b) | | 225,000 | 214,866 |
| 7.158% 3/12/45 (b) | | 1,100,000 | 1,144,000 |
|
| TOTAL COSTA RICA | | | 1,358,866 |
|
| Croatia - 0.3% | | | |
| Croatia Republic: | | | |
| 6% 1/26/24 (b) | | 850,000 | 946,220 |
| 6.375% 3/24/21 (b) | | 200,000 | 221,225 |
|
| TOTAL CROATIA | | | 1,167,445 |
|
| Dominican Republic - 0.5% | | | |
| Dominican Republic: | | | |
| 5.95% 1/25/27 (b) | | 125,000 | 130,843 |
| 6.6% 1/28/24 (b) | | 1,025,000 | 1,132,625 |
| 6.85% 1/27/45 (b) | | 350,000 | 372,313 |
| 7.45% 4/30/44 (b) | | 225,000 | 255,094 |
|
| TOTAL DOMINICAN REPUBLIC | | | 1,890,875 |
|
| Ecuador - 0.1% | | | |
| Ecuador Republic: | | | |
| 7.95% 6/20/24 (b) | | 200,000 | 191,000 |
| 9.65% 12/13/26 (b) | | 200,000 | 203,500 |
| 10.75% 3/28/22 (b) | | 200,000 | 217,000 |
|
| TOTAL ECUADOR | | | 611,500 |
|
| Egypt - 0.6% | | | |
| Arab Republic 5.875% 6/11/25 (b) | | 200,000 | 197,308 |
| Arab Republic of Egypt: | | | |
| 6.125% 1/31/22 (b) | | 600,000 | 623,850 |
| 7.5% 1/31/27 (b) | | 400,000 | 431,160 |
| 8.5% 1/31/47 (b) | | 1,100,000 | 1,197,075 |
|
| TOTAL EGYPT | | | 2,449,393 |
|
| El Salvador - 0.6% | | | |
| El Salvador Republic: | | | |
| 6.375% 1/18/27 (b) | | 400,000 | 357,000 |
| 7.625% 2/1/41 (b) | | 650,000 | 581,750 |
| 8.625% 2/28/29 (b) | | 1,260,000 | 1,272,600 |
|
| TOTAL EL SALVADOR | | | 2,211,350 |
|
| Ethiopia - 0.3% | | | |
| Federal Democratic Republic of Ethiopia 6.625% 12/11/24 (b) | | 1,250,000 | 1,234,375 |
| Gabon - 0.2% | | | |
| Gabonese Republic: | | | |
| 6.375% 12/12/24 (b) | | 400,000 | 391,700 |
| 6.95% 6/16/25 (b) | | 550,000 | 544,544 |
|
| TOTAL GABON | | | 936,244 |
|
| Ghana - 0.6% | | | |
| Ghana Republic: | | | |
| 7.875% 8/7/23 (Reg.S) | | 400,000 | 396,200 |
| 9.25% 9/15/22 (b) | | 1,150,000 | 1,218,540 |
| 10.75% 10/14/30 (b) | | 600,000 | 723,900 |
|
| TOTAL GHANA | | | 2,338,640 |
|
| Indonesia - 0.1% | | | |
| Indonesian Republic 8.5% 10/12/35 (b) | | 400,000 | 573,234 |
| Iraq - 0.3% | | | |
| Republic of Iraq 5.8% 1/15/28 (Reg. S) | | 1,250,000 | 1,117,188 |
| Ivory Coast - 0.1% | | | |
| Ivory Coast 5.375% 7/23/24 (b) | | 400,000 | 389,500 |
| Jamaica - 0.1% | | | |
| Jamaican Government 8% 3/15/39 | | 200,000 | 232,392 |
| Jordan - 0.4% | | | |
| Jordanian Kingdom: | | | |
| 5.75% 1/31/27 (b) | | 1,050,000 | 1,037,211 |
| 6.125% 1/29/26 (b) | | 400,000 | 408,640 |
|
| TOTAL JORDAN | | | 1,445,851 |
|
| Kenya - 0.2% | | | |
| Republic of Kenya 6.875% 6/24/24 (b) | | 900,000 | 911,430 |
| Kuwait - 0.3% | | | |
| State of Kuwait 3.5% 3/20/27 (b) | | 1,025,000 | 1,048,167 |
| Lebanon - 1.6% | | | |
| Lebanese Republic: | | | |
| 4% 12/31/17 | | 197,000 | 196,367 |
| 5% 10/12/17 | | 275,000 | 276,507 |
| 5.15% 6/12/18 | | 1,400,000 | 1,421,000 |
| 5.15% 11/12/18 | | 100,000 | 101,359 |
| 5.45% 11/28/19 | | 700,000 | 712,782 |
| 6% 5/20/19 | | 675,000 | 694,103 |
| 6.1% 10/4/22 | | 965,000 | 989,974 |
| 6.375% 3/9/20 | | 1,125,000 | 1,162,125 |
| 6.6% 11/27/26 | | 570,000 | 575,871 |
| 6.65% 2/26/30 (Reg. S) | | 105,000 | 105,296 |
|
| TOTAL LEBANON | | | 6,235,384 |
|
| Mexico - 0.7% | | | |
| United Mexican States 10% 12/5/24 | MXN | 42,885,000 | 2,658,675 |
| Mongolia - 0.3% | | | |
| Mongolian People's Republic: | | | |
| 5.125% 12/5/22 (Reg. S) | | 400,000 | 382,017 |
| 8.75% 3/9/24 (b) | | 600,000 | 666,657 |
|
| TOTAL MONGOLIA | | | 1,048,674 |
|
| Netherlands - 0.1% | | | |
| Republic of Angola 7% 8/17/19 (Issued by Northern Lights III BV for Republic of Angola) (Reg. S) | | 312,500 | 322,641 |
| Nigeria - 0.1% | | | |
| Republic of Nigeria 7.875% 2/16/32 (b) | | 400,000 | 434,400 |
| Oman - 0.6% | | | |
| Sultanate of Oman: | | | |
| 4.75% 6/15/26 (b) | | 400,000 | 402,169 |
| 5.375% 3/8/27 (b) | | 335,000 | 349,519 |
| 6.5% 3/8/47 (b) | | 1,600,000 | 1,723,510 |
|
| TOTAL OMAN | | | 2,475,198 |
|
| Pakistan - 0.2% | | | |
| Islamic Republic of Pakistan: | | | |
| 7.25% 4/15/19 (b) | | 200,000 | 211,600 |
| 8.25% 4/15/24 (b) | | 200,000 | 222,578 |
| 8.25% 9/30/25 (b) | | 200,000 | 224,544 |
|
| TOTAL PAKISTAN | | | 658,722 |
|
| Paraguay - 0.2% | | | |
| Republic of Paraguay: | | | |
| 4.7% 3/27/27 (b) | | 200,000 | 203,800 |
| 6.1% 8/11/44 (b) | | 435,000 | 468,713 |
|
| TOTAL PARAGUAY | | | 672,513 |
|
| Poland - 0.3% | | | |
| Polish Government 2.5% 7/25/27 | PLN | 4,500,000 | 1,067,230 |
| Qatar - 0.4% | | | |
| State of Qatar 9.75% 6/15/30 (Reg. S) | | 875,000 | 1,404,632 |
| Romania - 0.1% | | | |
| Romanian Republic 5.85% 4/26/23 | RON | 1,500,000 | 411,117 |
| Russia - 0.3% | | | |
| Ministry of Finance Russian Federation 4.75% 5/27/26 (b) | | 200,000 | 211,062 |
| Russian Federation: | | | |
| 5.625% 4/4/42 (b) | | 200,000 | 222,740 |
| 12.75% 6/24/28 (Reg. S) | | 425,000 | 753,556 |
|
| TOTAL RUSSIA | | | 1,187,358 |
|
| Rwanda - 0.3% | | | |
| Republic of Rwanda 6.625% 5/2/23 (b) | | 1,225,000 | 1,246,001 |
| Saudi Arabia - 0.3% | | | |
| Kingdom of Saudi Arabia 3.25% 10/26/26 (b) | | 450,000 | 439,367 |
| Saudi Arabia Kingdom of 4.5% 10/26/46 (b) | | 760,000 | 750,979 |
|
| TOTAL SAUDI ARABIA | | | 1,190,346 |
|
| Senegal - 0.1% | | | |
| Republic of Senegal 8.75% 5/13/21 (b) | | 400,000 | 457,580 |
| Serbia - 0.1% | | | |
| Republic of Serbia 4.875% 2/25/20 (b) | | 400,000 | 417,000 |
| South Africa - 0.0% | | | |
| South African Republic 5.875% 9/16/25 | | 200,000 | 216,000 |
| Sri Lanka - 0.1% | | | |
| Democratic Socialist Republic of Sri Lanka: | | | |
| 5.125% 4/11/19 (b) | | 200,000 | 205,000 |
| 6.85% 11/3/25 (b) | | 250,000 | 263,147 |
|
| TOTAL SRI LANKA | | | 468,147 |
|
| Suriname - 0.4% | | | |
| Republic of Suriname 9.25% 10/26/26 (b) | | 1,725,000 | 1,742,250 |
| Tanzania - 0.0% | | | |
| United Republic of Tanzania 7.421% 3/9/20 (d) | | 133,334 | 140,643 |
| Turkey - 1.2% | | | |
| Turkish Republic: | | | |
| 4.875% 10/9/26 | | 400,000 | 396,000 |
| 6% 3/25/27 | | 900,000 | 963,000 |
| 6.25% 9/26/22 | | 850,000 | 923,620 |
| 6.875% 3/17/36 | | 250,000 | 283,313 |
| 7% 6/5/20 | | 700,000 | 770,210 |
| 7.375% 2/5/25 | | 100,000 | 116,011 |
| 8% 2/14/34 | | 250,000 | 312,490 |
| 10.6% 2/11/26 | TRY | 1,940,000 | 559,560 |
| 11.875% 1/15/30 | | 165,000 | 263,082 |
|
| TOTAL TURKEY | | | 4,587,286 |
|
| Ukraine - 1.1% | | | |
| Ukraine Government: | | | |
| 0% 5/31/40 (b)(d) | | 430,000 | 150,139 |
| 7.75% 9/1/19 (b) | | 1,200,000 | 1,224,048 |
| 7.75% 9/1/20 (b) | | 2,100,000 | 2,115,834 |
| 7.75% 9/1/21 (b) | | 400,000 | 398,768 |
| 7.75% 9/1/24 (b) | | 300,000 | 285,498 |
|
| TOTAL UKRAINE | | | 4,174,287 |
|
| United States of America - 1.8% | | | |
| U.S. Treasury Bills, yield at date of purchase 0.5% to 0.79% 5/18/17 to 7/20/17 (f) | | 780,000 | 779,446 |
| U.S. Treasury Bonds 2.875% 11/15/46 | | 6,270,000 | 6,161,498 |
|
| TOTAL UNITED STATES OF AMERICA | | | 6,940,944 |
|
| Venezuela - 0.4% | | | |
| Venezuelan Republic: | | | |
| 7% 12/1/18 (Reg. S) | | 200,000 | 140,740 |
| 7% 3/31/38 | | 650,000 | 293,605 |
| 7.75% 10/13/19 (Reg. S) | | 300,000 | 180,510 |
| 9% 5/7/23 (Reg. S) | | 300,000 | 149,310 |
| 9.25% 9/15/27 | | 650,000 | 346,970 |
| 9.25% 5/7/28 (Reg. S) | | 1,000,000 | 476,700 |
| 12.75% 8/23/22 | | 325,000 | 199,973 |
|
| TOTAL VENEZUELA | | | 1,787,808 |
|
| Vietnam - 0.1% | | | |
| Vietnamese Socialist Republic 4.8% 11/19/24 (b) | | 300,000 | 307,974 |
| Zambia - 0.0% | | | |
| Republic of Zambia 8.97% 7/30/27 (b) | | 200,000 | 213,540 |
| TOTAL GOVERNMENT OBLIGATIONS | | | |
| (Cost $73,880,465) | | | 75,549,799 |
|
| Preferred Securities - 0.0% | | | |
| Colombia - 0.0% | | | |
| Colombia Telecomunicacines SA 8.5%(b)(d)(g) | | | |
| (Cost $49,957) | | 55,000 | 55,128 |
| | | Shares | Value |
|
| Money Market Funds - 8.1% | | | |
| Fidelity Cash Central Fund, 0.85% (h) | | | |
| (Cost $31,650,303) | | 31,645,712 | 31,652,041 |
| TOTAL INVESTMENT PORTFOLIO - 100.6% | | | |
| (Cost $364,463,646) | | | 394,455,765 |
| NET OTHER ASSETS (LIABILITIES) - (0.6)% | | | (2,421,983) |
| NET ASSETS - 100% | | | $392,033,782 |
| Futures Contracts | | | |
| | Expiration Date | Underlying Face Amount at Value | Unrealized Appreciation/(Depreciation) |
| Purchased | | | |
| Equity Index Contracts | | | |
| 297 ICE E-mini MSCI Emerging Markets Index Contracts (United States) | June 2017 | 14,538,150 | $148,060 |
The face value of futures purchased as a percentage of Net Assets is 3.7%
Currency Abbreviations
ARS – Argentine peso
EUR – European Monetary Unit
MXN – Mexican peso
PLN – Polish zloty
RON – Romanian leu
TRY – Turkish Lira
Security Type Abbreviations
ELS – Equity-Linked Security
Categorizations in the Schedule of Investments are based on country or territory of incorporation.
Legend
(a) Non-income producing
(b) Security exempt from registration under Rule 144A of the Securities Act of 1933. These securities may be resold in transactions exempt from registration, normally to qualified institutional buyers. At the end of the period, the value of these securities amounted to $55,745,682 or 14.2% of net assets.
(c) Amount is stated in United States dollars unless otherwise noted.
(d) Coupon rates for floating and adjustable rate securities reflect the rates in effect at period end.
(e) Security or a portion of the security purchased on a delayed delivery or when-issued basis.
(f) Security or a portion of the security was pledged to cover margin requirements for futures contracts. At period end, the value of securities pledged amounted to $630,700.
(g) Security is perpetual in nature with no stated maturity date.
(h) Affiliated fund that is generally available only to investment companies and other accounts managed by Fidelity Investments. The rate quoted is the annualized seven-day yield of the fund at period end. A complete unaudited listing of the fund's holdings as of its most recent quarter end is available upon request. In addition, each Fidelity Central Fund's financial statements are available on the SEC's website or upon request.
Affiliated Central Funds
Information regarding fiscal year to date income earned by the Fund from investments in Fidelity Central Funds is as follows:
| Fund | Income earned |
| Fidelity Cash Central Fund | $72,148 |
| Fidelity Securities Lending Cash Central Fund | 310 |
| Total | $72,458 |
Investment Valuation
The following is a summary of the inputs used, as of April 30, 2017, involving the Fund's assets and liabilities carried at fair value. The inputs or methodology used for valuing securities may not be an indication of the risk associated with investing in those securities. For more information on valuation inputs, and their aggregation into the levels used below, please refer to the Investment Valuation section in the accompanying Notes to Financial Statements.
| | Valuation Inputs at Reporting Date: |
| Description | Total | Level 1 | Level 2 | Level 3 |
| Investments in Securities: | | | | |
| Equities: | | | | |
| Consumer Discretionary | $37,653,868 | $27,665,019 | $9,988,849 | $-- |
| Consumer Staples | 18,050,705 | 18,050,705 | -- | -- |
| Energy | 17,737,819 | 14,855,100 | 2,882,719 | -- |
| Financials | 57,787,501 | 45,939,828 | 11,847,673 | -- |
| Health Care | 6,088,975 | 6,088,975 | -- | -- |
| Industrials | 14,842,598 | 14,842,598 | -- | -- |
| Information Technology | 57,929,736 | 38,793,185 | 19,136,551 | -- |
| Materials | 18,302,819 | 18,302,819 | -- | -- |
| Real Estate | 6,246,878 | 6,246,878 | -- | -- |
| Telecommunication Services | 12,495,839 | 10,834,028 | 1,661,811 | -- |
| Utilities | 7,463,805 | 6,328,405 | 1,135,400 | -- |
| Corporate Bonds | 32,598,254 | 398,200 | 32,200,054 | -- |
| Government Obligations | 75,549,799 | -- | 75,549,799 | -- |
| Preferred Securities | 55,128 | -- | 55,128 | -- |
| Money Market Funds | 31,652,041 | 31,652,041 | -- | -- |
| Total Investments in Securities: | $394,455,765 | $239,997,781 | $154,457,984 | $-- |
| Derivative Instruments: | | | | |
| Assets | | | | |
| Futures Contracts | $148,060 | $148,060 | $-- | $-- |
| Total Assets | $148,060 | $148,060 | $-- | $-- |
| Total Derivative Instruments: | $148,060 | $148,060 | $-- | $-- |
The following is a summary of transfers between Level 1 and Level 2 for the period ended April 30, 2017. Transfers are assumed to have occurred at the beginning of the period, and are primarily attributable to the valuation techniques used for foreign equity securities, as discussed in the accompanying Notes to Financial Statements:
| Transfers | Total |
| Level 1 to Level 2 | $4,663,529 |
| Level 2 to Level 1 | $1,655,313 |
Value of Derivative Instruments
The following table is a summary of the Fund's value of derivative instruments by primary risk exposure as of April 30, 2017. For additional information on derivative instruments, please refer to the Derivative Instruments section in the accompanying Notes to Financial Statements.
| Primary Risk Exposure / Derivative Type | Value |
| | Asset | Liability |
| Equity Risk | | |
| Futures Contracts(a) | $148,060 | $0 |
| Total Equity Risk | 148,060 | 0 |
| Total Value of Derivatives | $148,060 | $0 |
(a) Reflects gross cumulative appreciation (depreciation) on futures contracts as presented in the Schedule of Investments. In the Statement of Assets and Liabilities, the period end daily variation margin is included in receivable or payable for daily variation margin for derivative instruments, and the net cumulative appreciation (depreciation) is included in net unrealized appreciation (depreciation).
Other Information
The composition of credit quality ratings as a percentage of Total Net Assets is as follows (Unaudited):
| U.S. Government and U.S. Government Agency Obligations | 1.6% |
| AAA,AA,A | 2.2% |
| BBB | 3.2% |
| BB | 4.4% |
| B | 10.5% |
| CCC,CC,C | 3.9% |
| Not Rated | 1.6% |
| Equities | 64.9% |
| Short-Term Investments and Net Other Assets | 7.7% |
| | 100% |
We have used ratings from Moody's Investors Service, Inc. Where Moody's® ratings are not available, we have used S&P® ratings. All ratings are as of the date indicated and do not reflect subsequent changes.
See accompanying notes which are an integral part of the financial statements.
Fidelity® Total Emerging Markets Fund
Financial Statements
Statement of Assets and Liabilities
| | | April 30, 2017 (Unaudited) |
| Assets | | |
Investment in securities, at value — See accompanying schedule:
Unaffiliated issuers (cost $332,813,343) | $362,803,724 | |
| Fidelity Central Funds (cost $31,650,303) | 31,652,041 | |
| Total Investments (cost $364,463,646) | | $394,455,765 |
| Cash | | 84,220 |
| Foreign currency held at value (cost $712,275) | | 712,354 |
| Receivable for investments sold | | 2,398,500 |
| Receivable for fund shares sold | | 5,086,087 |
| Dividends receivable | | 411,371 |
| Interest receivable | | 1,912,716 |
| Distributions receivable from Fidelity Central Funds | | 19,340 |
| Receivable for daily variation margin for derivative instruments | | 49,005 |
| Prepaid expenses | | 57 |
| Other receivables | | 46,393 |
| Total assets | | 405,175,808 |
| Liabilities | | |
| Payable for investments purchased | | |
| Regular delivery | $11,241,376 | |
| Delayed delivery | 200,000 | |
| Payable for fund shares redeemed | 1,031,023 | |
| Accrued management fee | 235,114 | |
| Distribution and service plan fees payable | 20,944 | |
| Other affiliated payables | 73,534 | |
| Other payables and accrued expenses | 340,035 | |
| Total liabilities | | 13,142,026 |
| Net Assets | | $392,033,782 |
| Net Assets consist of: | | |
| Paid in capital | | $362,671,081 |
| Undistributed net investment income | | 2,130,441 |
| Accumulated undistributed net realized gain (loss) on investments | | (2,684,681) |
| Net unrealized appreciation (depreciation) on investments and assets and liabilities in foreign currencies | | 29,916,941 |
| Net Assets | | $392,033,782 |
| Calculation of Maximum Offering Price | | |
| Class A: | | |
| Net Asset Value and redemption price per share ($23,608,289 ÷ 1,951,354 shares) | | $12.10 |
| Maximum offering price per share (100/94.25 of $12.10) | | $12.84 |
| Class M: | | |
| Net Asset Value and redemption price per share ($4,091,918 ÷ 337,725 shares) | | $12.12 |
| Maximum offering price per share (100/96.50 of $12.12) | | $12.56 |
| Class C: | | |
| Net Asset Value and offering price per share ($19,010,981 ÷ 1,578,616 shares)(a) | | $12.04 |
| Total Emerging Markets: | | |
| Net Asset Value, offering price and redemption price per share ($180,949,088 ÷ 14,946,897 shares) | | $12.11 |
| Class I: | | |
| Net Asset Value, offering price and redemption price per share ($164,373,506 ÷ 13,587,382 shares) | | $12.10 |
(a) Redemption price per share is equal to net asset value less any applicable contingent deferred sales charge.
See accompanying notes which are an integral part of the financial statements.
Statement of Operations
| | | Six months ended April 30, 2017 (Unaudited) |
| Investment Income | | |
| Dividends | | $1,763,537 |
| Interest | | 2,358,307 |
| Income from Fidelity Central Funds | | 72,458 |
| Income before foreign taxes withheld | | 4,194,302 |
| Less foreign taxes withheld | | (176,361) |
| Total income | | 4,017,941 |
| Expenses | | |
| Management fee | $938,711 | |
| Transfer agent fees | 293,974 | |
| Distribution and service plan fees | 102,492 | |
| Accounting and security lending fees | 61,070 | |
| Custodian fees and expenses | 194,106 | |
| Independent trustees' fees and expenses | 406 | |
| Registration fees | 55,404 | |
| Audit | 47,413 | |
| Legal | 727 | |
| Miscellaneous | 529 | |
| Total expenses before reductions | 1,694,832 | |
| Expense reductions | (21,550) | 1,673,282 |
| Net investment income (loss) | | 2,344,659 |
| Realized and Unrealized Gain (Loss) | | |
| Net realized gain (loss) on: | | |
| Investment securities: | | |
| Unaffiliated issuers | 71,090 | |
| Fidelity Central Funds | (461) | |
| Futures contracts | 814,419 | |
| Total net realized gain (loss) | | 885,048 |
Change in net unrealized appreciation (depreciation) on:
Investment securities (net of increase in deferred foreign taxes of $161,553) | 20,408,330 | |
| Assets and liabilities in foreign currencies | 4,686 | |
| Futures contracts | 133,740 | |
| Total change in net unrealized appreciation (depreciation) | | 20,546,756 |
| Net gain (loss) | | 21,431,804 |
| Net increase (decrease) in net assets resulting from operations | | $23,776,463 |
See accompanying notes which are an integral part of the financial statements.
Statement of Changes in Net Assets
| | Six months ended April 30, 2017 (Unaudited) | Year ended October 31, 2016 |
| Increase (Decrease) in Net Assets | | |
| Operations | | |
| Net investment income (loss) | $2,344,659 | $2,170,894 |
| Net realized gain (loss) | 885,048 | (1,751,096) |
| Change in net unrealized appreciation (depreciation) | 20,546,756 | 9,508,420 |
| Net increase (decrease) in net assets resulting from operations | 23,776,463 | 9,928,218 |
| Distributions to shareholders from net investment income | (1,957,793) | (1,715,467) |
| Distributions to shareholders from net realized gain | (138,064) | – |
| Total distributions | (2,095,857) | (1,715,467) |
| Share transactions - net increase (decrease) | 215,900,351 | 80,624,262 |
| Redemption fees | 86,599 | 36,372 |
| Total increase (decrease) in net assets | 237,667,556 | 88,873,385 |
| Net Assets | | |
| Beginning of period | 154,366,226 | 65,492,841 |
| End of period | $392,033,782 | $154,366,226 |
| Other Information | | |
| Undistributed net investment income end of period | $2,130,441 | $1,743,575 |
See accompanying notes which are an integral part of the financial statements.
Financial Highlights — Fidelity Total Emerging Markets Fund Class A
| | Six months ended (Unaudited) April 30, | Years ended October 31, | | | | |
| | 2017 | 2016 | 2015 | 2014 | 2013 | 2012 A |
| Selected Per–Share Data | | | | | | |
| Net asset value, beginning of period | $11.33 | $10.35 | $11.56 | $11.37 | $10.86 | $10.00 |
| Income from Investment Operations | | | | | | |
| Net investment income (loss)B | .10 | .26 | .28 | .18 | .18 | .20 |
| Net realized and unrealized gain (loss) | .80 | .96 | (1.30) | .19 | .48 | .68 |
| Total from investment operations | .90 | 1.22 | (1.02) | .37 | .66 | .88 |
| Distributions from net investment income | (.12) | (.24) | (.17) | (.18) | (.15) | (.02) |
| Distributions from net realized gain | (.01) | – | (.02) | – | (.01) | – |
| Total distributions | (.13) | (.24) | (.19) | (.18) | (.16) | (.02) |
| Redemption fees added to paid in capitalB | –C | –C | –C | –C | .01 | –C |
| Net asset value, end of period | $12.10 | $11.33 | $10.35 | $11.56 | $11.37 | $10.86 |
| Total ReturnD,E,F | 8.09% | 12.13% | (8.92)% | 3.30% | 6.23% | 8.80% |
| Ratios to Average Net AssetsG,H | | | | | | |
| Expenses before reductions | 1.60%I | 1.87% | 1.93% | 1.98% | 1.89% | 1.87% |
| Expenses net of fee waivers, if any | 1.60%I | 1.65% | 1.65% | 1.65% | 1.65% | 1.65% |
| Expenses net of all reductions | 1.58%I | 1.64% | 1.64% | 1.65% | 1.62% | 1.62% |
| Net investment income (loss) | 1.84%I | 2.47% | 2.58% | 1.61% | 1.61% | 1.92% |
| Supplemental Data | | | | | | |
| Net assets, end of period (000 omitted) | $23,608 | $15,206 | $10,164 | $13,627 | $18,837 | $7,675 |
| Portfolio turnover rateJ | 35%I | 57% | 80% | 102% | 120% | 70% |
A For the period November 1, 2011 (commencement of operations) to October 31, 2012.
B Calculated based on average shares outstanding during the period.
C Amount represents less than $.005 per share.
D Total returns for periods of less than one year are not annualized.
E Total returns would have been lower if certain expenses had not been reduced during the applicable periods shown.
F Total returns do not include the effect of the sales charges.
G Fees and expenses of any underlying Fidelity Central Funds are not included in the Fund's expense ratio. The Fund indirectly bears its proportionate share of the expenses of any underlying Fidelity Central Funds.
H Expense ratios reflect operating expenses of the class. Expenses before reductions do not reflect amounts reimbursed by the investment adviser or reductions from brokerage service arrangements or reductions from other expense offset arrangements and do not represent the amount paid by the class during periods when reimbursements or reductions occur. Expense ratios before reductions for start-up periods may not be representative of longer-term operating periods. Expenses net of fee waivers reflect expenses after reimbursement by the investment adviser but prior to reductions from brokerage service arrangements or other expense offset arrangements. Expenses net of all reductions represent the net expenses paid by the class.
I Annualized
J Amount does not include the portfolio activity of any underlying Fidelity Central Funds.
See accompanying notes which are an integral part of the financial statements.
Financial Highlights — Fidelity Total Emerging Markets Fund Class M
| | Six months ended (Unaudited) April 30, | Years ended October 31, | | | | |
| | 2017 | 2016 | 2015 | 2014 | 2013 | 2012 A |
| Selected Per–Share Data | | | | | | |
| Net asset value, beginning of period | $11.33 | $10.33 | $11.54 | $11.34 | $10.84 | $10.00 |
| Income from Investment Operations | | | | | | |
| Net investment income (loss)B | .09 | .23 | .25 | .15 | .15 | .17 |
| Net realized and unrealized gain (loss) | .80 | .97 | (1.30) | .19 | .48 | .68 |
| Total from investment operations | .89 | 1.20 | (1.05) | .34 | .63 | .85 |
| Distributions from net investment income | (.09) | (.20) | (.14) | (.14) | (.12) | (.01) |
| Distributions from net realized gain | (.01) | – | (.02) | – | (.01) | – |
| Total distributions | (.10) | (.20) | (.16) | (.14) | (.14)C | (.01) |
| Redemption fees added to paid in capitalB | –D | –D | –D | –D | .01 | –D |
| Net asset value, end of period | $12.12 | $11.33 | $10.33 | $11.54 | $11.34 | $10.84 |
| Total ReturnE,F,G | 7.92% | 11.92% | (9.18)% | 3.04% | 5.93% | 8.56% |
| Ratios to Average Net AssetsH,I | | | | | | |
| Expenses before reductions | 1.95%J | 2.22% | 2.27% | 2.32% | 2.13% | 2.10% |
| Expenses net of fee waivers, if any | 1.90%J | 1.90% | 1.90% | 1.90% | 1.90% | 1.90% |
| Expenses net of all reductions | 1.88%J | 1.90% | 1.89% | 1.90% | 1.88% | 1.87% |
| Net investment income (loss) | 1.54%J | 2.22% | 2.33% | 1.36% | 1.36% | 1.67% |
| Supplemental Data | | | | | | |
| Net assets, end of period (000 omitted) | $4,092 | $3,019 | $3,331 | $5,277 | $5,967 | $5,823 |
| Portfolio turnover rateK | 35%J | 57% | 80% | 102% | 120% | 70% |
A For the period November 1, 2011 (commencement of operations) to October 31, 2012.
B Calculated based on average shares outstanding during the period.
C Total distributions of $.14 per share is comprised of distributions from net investment income of $1.24 and distributions from net realized gain of $.014 per share.
D Amount represents less than $.005 per share.
E Total returns for periods of less than one year are not annualized.
F Total returns would have been lower if certain expenses had not been reduced during the applicable periods shown.
G Total returns do not include the effect of the sales charges.
H Fees and expenses of any underlying Fidelity Central Funds are not included in the Fund's expense ratio. The Fund indirectly bears its proportionate share of the expenses of any underlying Fidelity Central Funds.
I Expense ratios reflect operating expenses of the class. Expenses before reductions do not reflect amounts reimbursed by the investment adviser or reductions from brokerage service arrangements or reductions from other expense offset arrangements and do not represent the amount paid by the class during periods when reimbursements or reductions occur. Expense ratios before reductions for start-up periods may not be representative of longer-term operating periods. Expenses net of fee waivers reflect expenses after reimbursement by the investment adviser but prior to reductions from brokerage service arrangements or other expense offset arrangements. Expenses net of all reductions represent the net expenses paid by the class.
J Annualized
K Amount does not include the portfolio activity of any underlying Fidelity Central Funds.
See accompanying notes which are an integral part of the financial statements.
Financial Highlights — Fidelity Total Emerging Markets Fund Class C
| | Six months ended (Unaudited) April 30, | Years ended October 31, | | | | |
| | 2017 | 2016 | 2015 | 2014 | 2013 | 2012 A |
| Selected Per–Share Data | | | | | | |
| Net asset value, beginning of period | $11.25 | $10.25 | $11.47 | $11.29 | $10.80 | $10.00 |
| Income from Investment Operations | | | | | | |
| Net investment income (loss)B | .06 | .18 | .20 | .10 | .09 | .12 |
| Net realized and unrealized gain (loss) | .80 | .97 | (1.30) | .19 | .47 | .69 |
| Total from investment operations | .86 | 1.15 | (1.10) | .29 | .56 | .81 |
| Distributions from net investment income | (.06) | (.15) | (.10) | (.11) | (.07) | (.01) |
| Distributions from net realized gain | (.01) | – | (.02) | – | (.01) | – |
| Total distributions | (.07) | (.15) | (.12) | (.11) | (.08) | (.01) |
| Redemption fees added to paid in capitalB | –C | –C | –C | –C | .01 | –C |
| Net asset value, end of period | $12.04 | $11.25 | $10.25 | $11.47 | $11.29 | $10.80 |
| Total ReturnD,E,F | 7.68% | 11.36% | (9.68)% | 2.56% | 5.31% | 8.07% |
| Ratios to Average Net AssetsG,H | | | | | | |
| Expenses before reductions | 2.34%I | 2.62% | 2.68% | 2.72% | 2.65% | 2.63% |
| Expenses net of fee waivers, if any | 2.34%I | 2.40% | 2.40% | 2.40% | 2.40% | 2.40% |
| Expenses net of all reductions | 2.32%I | 2.39% | 2.39% | 2.40% | 2.37% | 2.37% |
| Net investment income (loss) | 1.10%I | 1.72% | 1.83% | .86% | .86% | 1.17% |
| Supplemental Data | | | | | | |
| Net assets, end of period (000 omitted) | $19,011 | $10,710 | $7,736 | $10,104 | $7,436 | $5,824 |
| Portfolio turnover rateJ | 35%I | 57% | 80% | 102% | 120% | 70% |
A For the period November 1, 2011 (commencement of operations) to October 31, 2012.
B Calculated based on average shares outstanding during the period.
C Amount represents less than $.005 per share.
D Total returns for periods of less than one year are not annualized.
E Total returns would have been lower if certain expenses had not been reduced during the applicable periods shown.
F Total returns do not include the effect of the contingent deferred sales charge.
G Fees and expenses of any underlying Fidelity Central Funds are not included in the Fund's expense ratio. The Fund indirectly bears its proportionate share of the expenses of any underlying Fidelity Central Funds.
H Expense ratios reflect operating expenses of the class. Expenses before reductions do not reflect amounts reimbursed by the investment adviser or reductions from brokerage service arrangements or reductions from other expense offset arrangements and do not represent the amount paid by the class during periods when reimbursements or reductions occur. Expense ratios before reductions for start-up periods may not be representative of longer-term operating periods. Expenses net of fee waivers reflect expenses after reimbursement by the investment adviser but prior to reductions from brokerage service arrangements or other expense offset arrangements. Expenses net of all reductions represent the net expenses paid by the class.
I Annualized
J Amount does not include the portfolio activity of any underlying Fidelity Central Funds.
See accompanying notes which are an integral part of the financial statements.
Financial Highlights — Fidelity Total Emerging Markets Fund
| | Six months ended (Unaudited) April 30, | Years ended October 31, | | | | |
| | 2017 | 2016 | 2015 | 2014 | 2013 | 2012 A |
| Selected Per–Share Data | | | | | | |
| Net asset value, beginning of period | $11.34 | $10.38 | $11.60 | $11.40 | $10.89 | $10.00 |
| Income from Investment Operations | | | | | | |
| Net investment income (loss)B | .12 | .28 | .31 | .21 | .21 | .22 |
| Net realized and unrealized gain (loss) | .79 | .97 | (1.31) | .19 | .47 | .69 |
| Total from investment operations | .91 | 1.25 | (1.00) | .40 | .68 | .91 |
| Distributions from net investment income | (.14) | (.29) | (.20) | (.20) | (.17) | (.02) |
| Distributions from net realized gain | (.01) | – | (.02) | – | (.01) | – |
| Total distributions | (.14)C | (.29) | (.22) | (.20) | (.18) | (.02) |
| Redemption fees added to paid in capitalB | –D | –D | –D | –D | .01 | –D |
| Net asset value, end of period | $12.11 | $11.34 | $10.38 | $11.60 | $11.40 | $10.89 |
| Total ReturnE,F | 8.23% | 12.44% | (8.74)% | 3.56% | 6.44% | 9.15% |
| Ratios to Average Net AssetsG,H | | | | | | |
| Expenses before reductions | 1.40%I | 1.62% | 1.72% | 1.73% | 1.56% | 1.60% |
| Expenses net of fee waivers, if any | 1.40%I | 1.40% | 1.40% | 1.40% | 1.40% | 1.40% |
| Expenses net of all reductions | 1.38%I | 1.39% | 1.39% | 1.40% | 1.38% | 1.38% |
| Net investment income (loss) | 2.04%I | 2.72% | 2.83% | 1.86% | 1.85% | 2.16% |
| Supplemental Data | | | | | | |
| Net assets, end of period (000 omitted) | $180,949 | $104,332 | $37,918 | $45,763 | $49,959 | $81,416 |
| Portfolio turnover rateJ | 35%I | 57% | 80% | 102% | 120% | 70% |
A For the period November 1, 2011 (commencement of operations) to October 31, 2012.
B Calculated based on average shares outstanding during the period.
C Total distributions of $.14 per share is comprised of distributions from net investment income of $.135 and distributions from net realized gain of $.009 per share.
D Amount represents less than $.005 per share.
E Total returns for periods of less than one year are not annualized.
F Total returns would have been lower if certain expenses had not been reduced during the applicable periods shown.
G Fees and expenses of any underlying Fidelity Central Funds are not included in the Fund's expense ratio. The Fund indirectly bears its proportionate share of the expenses of any underlying Fidelity Central Funds.
H Expense ratios reflect operating expenses of the class. Expenses before reductions do not reflect amounts reimbursed by the investment adviser or reductions from brokerage service arrangements or reductions from other expense offset arrangements and do not represent the amount paid by the class during periods when reimbursements or reductions occur. Expense ratios before reductions for start-up periods may not be representative of longer-term operating periods. Expenses net of fee waivers reflect expenses after reimbursement by the investment adviser but prior to reductions from brokerage service arrangements or other expense offset arrangements. Expenses net of all reductions represent the net expenses paid by the class.
I Annualized
J Amount does not include the portfolio activity of any underlying Fidelity Central Funds.
See accompanying notes which are an integral part of the financial statements.
Financial Highlights — Fidelity Total Emerging Markets Fund Class I
| | Six months ended (Unaudited) April 30, | Years ended October 31, | | | | |
| | 2017 | 2016 | 2015 | 2014 | 2013 | 2012 A |
| Selected Per–Share Data | | | | | | |
| Net asset value, beginning of period | $11.33 | $10.37 | $11.59 | $11.40 | $10.89 | $10.00 |
| Income from Investment Operations | | | | | | |
| Net investment income (loss)B | .12 | .29 | .31 | .21 | .20 | .22 |
| Net realized and unrealized gain (loss) | .80 | .96 | (1.31) | .18 | .48 | .69 |
| Total from investment operations | .92 | 1.25 | (1.00) | .39 | .68 | .91 |
| Distributions from net investment income | (.14) | (.29) | (.20) | (.20) | (.17) | (.02) |
| Distributions from net realized gain | (.01) | – | (.02) | – | (.01) | – |
| Total distributions | (.15) | (.29) | (.22) | (.20) | (.18) | (.02) |
| Redemption fees added to paid in capitalB | –C | –C | –C | –C | .01 | –C |
| Net asset value, end of period | $12.10 | $11.33 | $10.37 | $11.59 | $11.40 | $10.89 |
| Total ReturnD,E | 8.26% | 12.48% | (8.74)% | 3.51% | 6.44% | 9.15% |
| Ratios to Average Net AssetsF,G | | | | | | |
| Expenses before reductions | 1.27%H | 1.54% | 1.58% | 1.71% | 1.63% | 1.62% |
| Expenses net of fee waivers, if any | 1.27%H | 1.40% | 1.40% | 1.40% | 1.40% | 1.40% |
| Expenses net of all reductions | 1.26%H | 1.39% | 1.39% | 1.40% | 1.37% | 1.37% |
| Net investment income (loss) | 2.16%H | 2.72% | 2.83% | 1.86% | 1.86% | 2.17% |
| Supplemental Data | | | | | | |
| Net assets, end of period (000 omitted) | $164,374 | $21,099 | $6,343 | $4,773 | $5,354 | $2,287 |
| Portfolio turnover rateI | 35%H | 57% | 80% | 102% | 120% | 70% |
A For the period November 1, 2011 (commencement of operations) to October 31, 2012.
B Calculated based on average shares outstanding during the period.
C Amount represents less than $.005 per share.
D Total returns for periods of less than one year are not annualized.
E Total returns would have been lower if certain expenses had not been reduced during the applicable periods shown.
F Fees and expenses of any underlying Fidelity Central Funds are not included in the Fund's expense ratio. The Fund indirectly bears its proportionate share of the expenses of any underlying Fidelity Central Funds.
G Expense ratios reflect operating expenses of the class. Expenses before reductions do not reflect amounts reimbursed by the investment adviser or reductions from brokerage service arrangements or reductions from other expense offset arrangements and do not represent the amount paid by the class during periods when reimbursements or reductions occur. Expense ratios before reductions for start-up periods may not be representative of longer-term operating periods. Expenses net of fee waivers reflect expenses after reimbursement by the investment adviser but prior to reductions from brokerage service arrangements or other expense offset arrangements. Expenses net of all reductions represent the net expenses paid by the class.
H Annualized
I Amount does not include the portfolio activity of any underlying Fidelity Central Funds.
See accompanying notes which are an integral part of the financial statements.
Notes to Financial Statements (Unaudited)
For the period ended April 30, 2017
1. Organization.
Fidelity Total Emerging Markets Fund (the Fund) is a fund of Fidelity Investment Trust (the Trust) and is authorized to issue an unlimited number of shares. The Trust is registered under the Investment Company Act of 1940, as amended (the 1940 Act), as an open-end management investment company organized as a Massachusetts business trust. The Fund offers Class A, Class M (formerly Class T), Class C, Total Emerging Markets and Class I shares, each of which has equal rights as to assets and voting privileges. Each class has exclusive voting rights with respect to matters that affect that class. The Fund's investments in emerging markets can be subject to social, economic, regulatory, and political uncertainties and can be extremely volatile.
2. Investments in Fidelity Central Funds.
The Fund invests in Fidelity Central Funds, which are open-end investment companies generally available only to other investment companies and accounts managed by the investment adviser and its affiliates. The Fund's Schedule of Investments lists each of the Fidelity Central Funds held as of period end, if any, as an investment of the Fund, but does not include the underlying holdings of each Fidelity Central Fund. As an Investing Fund, the Fund indirectly bears its proportionate share of the expenses of the underlying Fidelity Central Funds.
The Money Market Central Funds seek preservation of capital and current income and are managed by Fidelity Investments Money Management, Inc. (FIMM), an affiliate of the investment adviser. Annualized expenses of the Money Market Central Funds as of their most recent shareholder report date are less than .005%.
A complete unaudited list of holdings for each Fidelity Central Fund is available upon request or at the Securities and Exchange Commission (the SEC) website at www.sec.gov. In addition, the financial statements of the Fidelity Central Funds are available on the SEC website or upon request.
3. Significant Accounting Policies.
The Fund is an investment company and applies the accounting and reporting guidance of the Financial Accounting Standards Board (FASB) Accounting Standards Codification Topic 946 Financial Services – Investments Companies. The financial statements have been prepared in conformity with accounting principles generally accepted in the United States of America (GAAP), which require management to make certain estimates and assumptions at the date of the financial statements. Actual results could differ from those estimates. Subsequent events, if any, through the date that the financial statements were issued have been evaluated in the preparation of the financial statements. The following summarizes the significant accounting policies of the Fund:
Investment Valuation. Investments are valued as of 4:00 p.m. Eastern time on the last calendar day of the period. The Board of Trustees (the Board) has delegated the day to day responsibility for the valuation of the Fund's investments to the Fair Value Committee (the Committee) established by the Fund's investment adviser. In accordance with valuation policies and procedures approved by the Board, the Fund attempts to obtain prices from one or more third party pricing vendors or brokers to value its investments. When current market prices, quotations or currency exchange rates are not readily available or reliable, investments will be fair valued in good faith by the Committee, in accordance with procedures adopted by the Board. Factors used in determining fair value vary by investment type and may include market or investment specific events, changes in interest rates and credit quality. The frequency with which these procedures are used cannot be predicted and they may be utilized to a significant extent. The Committee oversees the Fund's valuation policies and procedures and reports to the Board on the Committee's activities and fair value determinations. The Board monitors the appropriateness of the procedures used in valuing the Fund's investments and ratifies the fair value determinations of the Committee.
The Fund categorizes the inputs to valuation techniques used to value its investments into a disclosure hierarchy consisting of three levels as shown below:
- Level 1 – quoted prices in active markets for identical investments
- Level 2 – other significant observable inputs (including quoted prices for similar investments, interest rates, prepayment speeds, etc.)
- Level 3 – unobservable inputs (including the Fund's own assumptions based on the best information available)
Valuation techniques used to value the Fund's investments by major category are as follows:
Equity securities, including restricted securities, for which market quotations are readily available, are valued at the last reported sale price or official closing price as reported by a third party pricing vendor on the primary market or exchange on which they are traded and are categorized as Level 1 in the hierarchy. In the event there were no sales during the day or closing prices are not available, securities are valued at the last quoted bid price or may be valued using the last available price and are generally categorized as Level 2 in the hierarchy. For foreign equity securities, when market or security specific events arise, comparisons to the valuation of American Depositary Receipts (ADRs), futures contracts, Exchange-Traded Funds (ETFs) and certain indexes as well as quoted prices for similar securities may be used and would be categorized as Level 2 in the hierarchy. Utilizing these techniques may result in transfers between Level 1 and Level 2. For equity securities, including restricted securities, where observable inputs are limited, assumptions about market activity and risk are used and these securities may be categorized as Level 3 in the hierarchy.
Debt securities, including restricted securities, are valued based on evaluated prices received from third party pricing vendors or from brokers who make markets in such securities. Corporate bonds, foreign government and government agency obligations, preferred securities and U.S. government and government agency obligations are valued by pricing vendors who utilize matrix pricing which considers yield or price of bonds of comparable quality, coupon, maturity and type or by broker-supplied prices. When independent prices are unavailable or unreliable, debt securities may be valued utilizing pricing methodologies which consider similar factors that would be used by third party pricing vendors. Debt securities are generally categorized as Level 2 in the hierarchy but may be Level 3 depending on the circumstances.
Futures contracts are valued at the settlement price established each day by the board of trade or exchange on which they are traded and are categorized as Level 1 in the hierarchy. Investments in open-end mutual funds, including the Fidelity Central Funds, are valued at their closing net asset value (NAV) each business day and are categorized as Level 1 in the hierarchy.
Changes in valuation techniques may result in transfers in or out of an assigned level within the disclosure hierarchy. The aggregate value of investments by input level as of April 30, 2017, including information on transfers between Levels 1 and 2, is included at the end of the Fund's Schedule of Investments.
Foreign Currency. The Fund may use foreign currency contracts to facilitate transactions in foreign-denominated securities. Gains and losses from these transactions may arise from changes in the value of the foreign currency or if the counterparties do not perform under the contracts' terms.
Foreign-denominated assets, including investment securities, and liabilities are translated into U.S. dollars at the exchange rates at period end. Purchases and sales of investment securities, income and dividends received and expenses denominated in foreign currencies are translated into U.S. dollars at the exchange rate in effect on the transaction date.
The effects of exchange rate fluctuations on investments are included with the net realized and unrealized gain (loss) on investment securities. Other foreign currency transactions resulting in realized and unrealized gain (loss) are disclosed separately.
Investment Transactions and Income. For financial reporting purposes, the Fund's investment holdings and NAV include trades executed through the end of the last business day of the period. The NAV per share for processing shareholder transactions is calculated as of the close of business of the New York Stock Exchange (NYSE), normally 4:00 p.m. Eastern time and includes trades executed through the end of the prior business day. Gains and losses on securities sold are determined on the basis of identified cost. Dividend income is recorded on the ex-dividend date, except for certain dividends from foreign securities where the ex-dividend date may have passed, which are recorded as soon as the Fund is informed of the ex-dividend date. Non-cash dividends included in dividend income, if any, are recorded at the fair market value of the securities received. Income and capital gain distributions from Fidelity Central Funds, if any, are recorded on the ex-dividend date. Certain distributions received by the Fund represent a return of capital or capital gain. The Fund determines the components of these distributions subsequent to the ex-dividend date, based upon receipt of tax filings or other correspondence relating to the underlying investment. These distributions are recorded as a reduction of cost of investments and/or as a realized gain. Interest income is accrued as earned and includes coupon interest and amortization of premium and accretion of discount on debt securities as applicable. Investment income is recorded net of foreign taxes withheld where recovery of such taxes is uncertain. Debt obligations may be placed on non-accrual status and related interest income may be reduced by ceasing current accruals and writing off interest receivables when the collection of all or a portion of interest has become doubtful based on consistently applied procedures. A debt obligation is removed from non-accrual status when the issuer resumes interest payments or when collectability of interest is reasonably assured.
Class Allocations and Expenses. Investment income, realized and unrealized capital gains and losses, common expenses of the Fund, and certain fund-level expense reductions, if any, are allocated daily on a pro-rata basis to each class based on the relative net assets of each class to the total net assets of the Fund. Each class differs with respect to transfer agent and distribution and service plan fees incurred. Certain expense reductions may also differ by class. For the reporting period, the allocated portion of income and expenses to each class as a percent of its average net assets may vary due to the timing of recording these transactions in relation to fluctuating net assets of the classes. Expenses directly attributable to a fund are charged to that fund. Expenses attributable to more than one fund are allocated among the respective funds on the basis of relative net assets or other appropriate methods. Expense estimates are accrued in the period to which they relate and adjustments are made when actual amounts are known.
Income Tax Information and Distributions to Shareholders. Each year, the Fund intends to qualify as a regulated investment company under Subchapter M of the Internal Revenue Code, including distributing substantially all of its taxable income and realized gains. As a result, no provision for U.S. Federal income taxes is required. The Fund files a U.S. federal tax return, in addition to state and local tax returns as required. The Fund's federal income tax returns are subject to examination by the Internal Revenue Service (IRS) for a period of three fiscal years after they are filed. State and local tax returns may be subject to examination for an additional fiscal year depending on the jurisdiction. Foreign taxes are provided for based on the Fund's understanding of the tax rules and rates that exist in the foreign markets in which it invests. The Fund is subject to a tax imposed on capital gains by certain countries in which it invests. An estimated deferred tax liability for net unrealized appreciation on the applicable securities is included in Other payables and accrued expenses on the Statement of Assets & Liabilities.
Distributions are declared and recorded on the ex-dividend date. Income dividends and capital gain distributions are declared separately for each class. Income and capital gain distributions are determined in accordance with income tax regulations, which may differ from GAAP.
Capital accounts within the financial statements are adjusted for permanent book-tax differences. These adjustments have no impact on net assets or the results of operations. Capital accounts are not adjusted for temporary book-tax differences which will reverse in a subsequent period.
Book-tax differences are primarily due to foreign currency transactions, futures contracts, certain foreign taxes, market discount, passive foreign investment companies (PFIC), defaulted bonds, capital loss carryforwards and losses deferred due to wash sales.
The federal tax cost of investment securities and unrealized appreciation (depreciation) as of period end were as follows:
| Gross unrealized appreciation | $35,683,685 |
| Gross unrealized depreciation | (6,508,852) |
| Net unrealized appreciation (depreciation) on securities | $29,174,833 |
| Tax cost | $365,280,932 |
Capital loss carryforwards are only available to offset future capital gains of the Fund to the extent provided by regulations and may be limited. Under the Regulated Investment Company Modernization Act of 2010 (the Act), the Fund is permitted to carry forward capital losses incurred in taxable years beginning after December 22, 2010 for an unlimited period and such capital losses are required to be used prior to any losses that expire. The capital loss carryforward information presented below, including any applicable limitation, is estimated as of prior fiscal period end and is subject to adjustment.
| No expiration | |
| Short-term | $(2,076,801) |
| Long-term | (482,739) |
| Total capital loss carryforward | $(2,559,540) |
Short-Term Trading (Redemption) Fees. Shares held by investors in the Fund less than 90 days may have been subject to a redemption fee equal to 1.50% of the NAV of shares redeemed. All redemption fees, which reduce the proceeds of the shareholder redemption, are retained by the Fund and accounted for as an addition to paid in capital.
Delayed Delivery Transactions and When-Issued Securities. During the period, the Fund transacted in securities on a delayed delivery or when-issued basis. Payment and delivery may take place after the customary settlement period for that security. The price of the underlying securities and the date when the securities will be delivered and paid for are fixed at the time the transaction is negotiated. The securities purchased on a delayed delivery or when-issued basis are identified as such in the Fund's Schedule of Investments. The Fund may receive compensation for interest forgone in the purchase of a delayed delivery or when-issued security. With respect to purchase commitments, the Fund identifies securities as segregated in its records with a value at least equal to the amount of the commitment. Losses may arise due to changes in the value of the underlying securities or if the counterparty does not perform under the contract's terms, or if the issuer does not issue the securities due to political, economic, or other factors.
Restricted Securities. The Fund may invest in securities that are subject to legal or contractual restrictions on resale. These securities generally may be resold in transactions exempt from registration or to the public if the securities are registered. Disposal of these securities may involve time-consuming negotiations and expense, and prompt sale at an acceptable price may be difficult. Information regarding restricted securities is included at the end of the Fund's Schedule of Investments.
4. Derivative Instruments.
Risk Exposures and the Use of Derivative Instruments. The Fund's investment objective allows the Fund to enter into various types of derivative contracts, including futures contracts. Derivatives are investments whose value is primarily derived from underlying assets, indices or reference rates and may be transacted on an exchange or over-the-counter (OTC). Derivatives may involve a future commitment to buy or sell a specified asset based on specified terms, to exchange future cash flows at periodic intervals based on a notional principal amount, or for one party to make one or more payments upon the occurrence of specified events in exchange for periodic payments from the other party.
The Fund used derivatives to increase returns and to manage exposure to certain risks as defined below. The success of any strategy involving derivatives depends on analysis of numerous economic factors, and if the strategies for investment do not work as intended, the Fund may not achieve its objectives.
The Fund's use of derivatives increased or decreased its exposure to the following risk:
| Equity Risk | Equity risk relates to the fluctuations in the value of financial instruments as a result of changes in market prices (other than those arising from interest rate risk or foreign exchange risk), whether caused by factors specific to an individual investment, its issuer, or all factors affecting all instruments traded in a market or market segment.
|
The Fund is also exposed to additional risks from investing in derivatives, such as liquidity risk and counterparty credit risk. Liquidity risk is the risk that the Fund will be unable to close out the derivative in the open market in a timely manner. Counterparty credit risk is the risk that the counterparty will not be able to fulfill its obligation to the Fund. Counterparty credit risk related to exchange-traded futures contracts may be mitigated by the protection provided by the exchange on which they trade.
Investing in derivatives may involve greater risks than investing in the underlying assets directly and, to varying degrees, may involve risk of loss in excess of any initial investment and collateral received and amounts recognized in the Statement of Assets and Liabilities. In addition, there may be the risk that the change in value of the derivative contract does not correspond to the change in value of the underlying instrument.
Futures Contracts. A futures contract is an agreement between two parties to buy or sell a specified underlying instrument for a fixed price at a specified future date. The Fund used futures contracts to manage its exposure to the stock market.
Upon entering into a futures contract, a fund is required to deposit either cash or securities (initial margin) with a clearing broker in an amount equal to a certain percentage of the face value of the contract. Futures contracts are marked-to-market daily and subsequent daily payments (variation margin) are made or received by a fund depending on the daily fluctuations in the value of the futures contracts and are recorded as unrealized appreciation or (depreciation). This receivable and/or payable, if any, is included in daily variation margin for derivative instruments in the Statement of Assets and Liabilities. Realized gain or (loss) is recorded upon the expiration or closing of a futures contract.
Any open futures contracts at period end are presented in the Schedule of Investments under the caption "Futures Contracts". The underlying face amount at value reflects each contract's exposure to the underlying instrument or index at period end and is representative of volume of activity during the period. Securities deposited to meet initial margin requirements are identified in the Schedule of Investments.
During the period the Fund recognized net realized gain (loss) of $814,419 and a change in net unrealized appreciation (depreciation) of $133,740 related to its investment in futures contracts. These amounts are included in the Statement of Operations.
5. Purchases and Sales of Investments.
Purchases and sales of securities, other than short-term securities, aggregated $232,831,436 and $38,608,922, respectively.
6. Fees and Other Transactions with Affiliates.
Management Fee. Fidelity Management & Research Company (the investment adviser) and its affiliates provide the Fund with investment management related services for which the Fund pays a monthly management fee. The management fee is the sum of an individual fund fee rate that is based on an annual rate of .55% of the Fund's average net assets and an annualized group fee rate that averaged .25% during the period. The group fee rate is based upon the average net assets of all the mutual funds advised by the investment adviser, including any mutual funds previously advised by the investment adviser that are currently advised by Fidelity SelectCo, LLC, an affiliate of the investment adviser. The group fee rate decreases as assets under management increase and increases as assets under management decrease. For the reporting period, the total annualized management fee rate was .80% of the Fund's average net assets.
Distribution and Service Plan Fees. In accordance with Rule 12b-1 of the 1940 Act, the Fund has adopted separate Distribution and Service Plans for each class of shares. Certain classes pay Fidelity Distributors Corporation (FDC), an affiliate of the investment adviser, separate Distribution and Service Fees, each of which is based on an annual percentage of each class' average net assets. In addition, FDC may pay financial intermediaries for selling shares of the Fund and providing shareholder support services. For the period, the Distribution and Service Fee rates, total fees and amounts retained by FDC were as follows:
| | Distribution
Fee | Service
Fee | Total Fees | Retained
by FDC |
| Class A | -% | .25% | $25,687 | $2,246 |
| Class M | .25% | .25% | 8,272 | 88 |
| Class C | .75% | .25% | 68,533 | 28,860 |
| | | | $102,492 | $31,194 |
Sales Load. FDC may receive a front-end sales charge of up to 5.75% for selling Class A shares and 3.50% for selling Class M shares, some of which is paid to financial intermediaries for selling shares of the Fund. Depending on the holding period, FDC may receive contingent deferred sales charges levied on Class A, Class M and Class C redemptions. The deferred sales charges are 1.00% for Class C shares, 1.00% for certain purchases of Class A shares and .25% for certain purchases of Class M shares.
For the period, sales charge amounts retained by FDC were as follows:
| | Retained
by FDC |
| Class A | $15,174 |
| Class M | 1,544 |
| Class C(a) | 3,777 |
| | $20,495 |
(a) When Class C shares are initially sold, FDC pays commissions from its own resources to financial intermediaries through which the sales are made.
Transfer Agent Fees. Fidelity Investments Institutional Operations Company, Inc., (FIIOC), an affiliate of the investment adviser, is the transfer, dividend disbursing and shareholder servicing agent for each class of the Fund. FIIOC receives account fees and asset-based fees that vary according to the account size and type of account of the shareholders of the respective classes of the Fund. FIIOC pays for typesetting, printing and mailing of shareholder reports, except proxy statements.
For the period, transfer agent fees for each class were as follows:
| | Amount | % of
Class-Level Average
Net Assets(a) |
| Class A | $23,277 | .23 |
| Class M | 5,488 | .33 |
| Class C | 15,347 | .22 |
| Total Emerging Markets | 187,352 | .29 |
| Class I | 62,510 | .18 |
| | $293,974 | |
(a) Annualized
Accounting and Security Lending Fees. Fidelity Service Company, Inc. (FSC), an affiliate of the investment adviser, maintains the Fund's accounting records. The accounting fee is based on the level of average net assets for each month. Under a separate contract, FSC administers the security lending program. The security lending fee is based on the number and duration of lending transactions.
Brokerage Commissions. The Fund placed a portion of its portfolio transactions with brokerage firms which are affiliates of the investment adviser. Brokerage commissions are included in net realized gain (loss) and change in net unrealized appreciation (depreciation) in the Statement of Operations. The commissions paid to these affiliated firms were $904 for the period.
Interfund Trades. The Fund may purchase from or sell securities to other Fidelity Funds under procedures adopted by the Board. The procedures have been designed to ensure these interfund trades are executed in accordance with Rule 17a-7 of the 1940 Act. Interfund trades are included within the respective purchases and sales amounts shown in the Purchases and Sales of Investments note.
7. Committed Line of Credit.
The Fund participates with other funds managed by the investment adviser or an affiliate in a $4.25 billion credit facility (the "line of credit") to be utilized for temporary or emergency purposes to fund shareholder redemptions or for other short-term liquidity purposes. The Fund has agreed to pay commitment fees on its pro-rata portion of the line of credit, which amounted to $332 and is reflected in Miscellaneous expenses on the Statement of Operations. During the period, the Fund did not borrow on this line of credit.
8. Security Lending.
The Fund lends portfolio securities through a lending agent from time to time in order to earn additional income. For equity securities, a lending agent is used and may loan securities to certain qualified borrowers, including Fidelity Capital Markets (FCM), a broker-dealer affiliated with the Fund. On the settlement date of the loan, the Fund receives collateral (in the form of U.S. Treasury obligations, letters of credit and/or cash) against the loaned securities and maintains collateral in an amount not less than 100% of the market value of the loaned securities during the period of the loan. The market value of the loaned securities is determined at the close of business of the Fund and any additional required collateral is delivered to the Fund on the next business day. The Fund or borrower may terminate the loan at any time, and if the borrower defaults on its obligation to return the securities loaned because of insolvency or other reasons, the Fund may apply collateral received from the borrower against the obligation. The Fund may experience delays and costs in recovering the securities loaned. Any cash collateral received is invested in the Fidelity Securities Lending Cash Central Fund. At period end, there were no security loans outstanding. Security lending income represents the income earned on investing cash collateral, less rebates paid to borrowers and any lending agent fees associated with the loan, plus any premium payments received for lending certain types of securities. Security lending income is presented in the Statement of Operations as a component of income from Fidelity Central Funds. Total security lending income during the period amounted to $310. During the period, there were no securities loaned to FCM.
9. Expense Reductions.
The investment adviser contractually agreed to reimburse each class to the extent annual operating expenses exceeded certain levels of average net assets as noted in the table below. This reimbursement will remain in place through December 2017. Some expenses, for example interest expense, including commitment fees, are excluded from this reimbursement.
The following classes were in reimbursement during the period:
| | Expense
Limitations | Reimbursement |
| Class M | 1.90% | 835 |
| Total Emerging Markets | 1.40% | 2,265 |
| | | $3,100 |
Commissions paid to certain brokers with whom the investment adviser, or its affiliates, places trades on behalf of the Fund include an amount in addition to trade execution, which may be rebated back to the Fund to offset certain expenses. This amount totaled $15,875 for the period. In addition, through arrangements with the Fund's custodian, credits realized as a result of certain uninvested cash balances were used to reduce the Fund's expenses. During the period, these credits reduced the Fund's custody by $1,831.
In addition, during the period the investment adviser reimbursed and/or waived a portion of fund-level operating expenses in the amount of $744.
10. Distributions to Shareholders.
Distributions to shareholders of each class were as follows:
| | Six months ended
April 30, 2017 | Year ended October 31, 2016 |
| From net investment income | | |
| Class A | $195,255 | $214,855 |
| Class M | 23,027 | 63,597 |
| Class C | 57,828 | 107,081 |
| Total Emerging Markets | 1,274,142 | 1,155,874 |
| Class I | 407,541 | 174,060 |
| Total | $1,957,793 | $1,715,467 |
| From net realized gain | | |
| Class A | $14,644 | $– |
| Class M | 2,410 | – |
| Class C | 9,294 | – |
| Total Emerging Markets | 84,943 | – |
| Class I | 26,773 | – |
| Total | $138,064 | $– |
11. Share Transactions.
Share transactions for each class were as follows and may contain automatic conversions between classes or exchanges between affiliated funds:
| | Shares | Shares | Dollars | Dollars |
| | Six months ended April 30, 2017 | Year ended October 31, 2016 | Six months ended April 30, 2017 | Year ended October 31, 2016 |
| Class A | | | | |
| Shares sold | 2,125,263 | 982,236 | $24,122,900 | $10,454,988 |
| Reinvestment of distributions | 19,523 | 21,375 | 207,918 | 212,465 |
| Shares redeemed | (1,535,685) | (643,855) | (17,669,486) | (6,609,703) |
| Net increase (decrease) | 609,101 | 359,756 | $6,661,332 | $4,057,750 |
| Class M | | | | |
| Shares sold | 117,904 | 99,943 | $1,354,652 | $1,053,182 |
| Reinvestment of distributions | 2,361 | 6,356 | 25,216 | 63,302 |
| Shares redeemed | (49,032) | (162,291) | (556,768) | (1,643,320) |
| Net increase (decrease) | 71,233 | (55,992) | $823,100 | $(526,836) |
| Class C | | | | |
| Shares sold | 753,843 | 381,071 | $8,593,757 | $4,073,862 |
| Reinvestment of distributions | 6,299 | 10,753 | 66,954 | 106,882 |
| Shares redeemed | (133,281) | (194,422) | (1,514,257) | (1,922,472) |
| Net increase (decrease) | 626,861 | 197,402 | $7,146,454 | $2,258,272 |
| Total Emerging Markets | | | | |
| Shares sold | 8,320,653 | 7,221,843 | $94,441,401 | $77,958,709 |
| Reinvestment of distributions | 124,771 | 112,410 | 1,328,813 | 1,116,229 |
| Shares redeemed | (2,697,559) | (1,787,997) | (29,872,845) | (18,222,997) |
| Net increase (decrease) | 5,747,865 | 5,546,256 | $65,897,369 | $60,851,941 |
| Class I | | | | |
| Shares sold | 12,464,199 | 1,936,878 | $143,914,514 | $21,178,679 |
| Reinvestment of distributions | 38,174 | 14,612 | 405,784 | 144,954 |
| Shares redeemed | (776,996) | (700,942) | (8,948,202) | (7,340,498) |
| Net increase (decrease) | 11,725,377 | 1,250,548 | $135,372,096 | $13,983,135 |
12. Other.
The Fund's organizational documents provide former and current trustees and officers with a limited indemnification against liabilities arising in connection with the performance of their duties to the Fund. In the normal course of business, the Fund may also enter into contracts that provide general indemnifications. The Fund's maximum exposure under these arrangements is unknown as this would be dependent on future claims that may be made against the Fund. The risk of material loss from such claims is considered remote.
Shareholder Expense Example
As a shareholder of a Fund, you incur two types of costs: (1) transaction costs, including sales charges (loads) on purchase payments or redemption proceeds, redemption fees and (2) ongoing costs, including management fees, distribution and/or service (12b-1) fees and other Fund expenses. This Example is intended to help you understand your ongoing costs (in dollars) of investing in the Funds and to compare these costs with the ongoing costs of investing in other mutual funds.
The Example is based on an investment of $1,000 invested at the beginning of the period and held for the entire period (November 1, 2016 to April 30, 2017).
Actual Expenses
The first line of the accompanying table for each class of the Fund provides information about actual account values and actual expenses. You may use the information in this line, together with the amount you invested, to estimate the expenses that you paid over the period. Simply divide your account value by $1,000.00 (for example, an $8,600 account value divided by $1,000.00 = 8.6), then multiply the result by the number in the first line for a class of the Fund under the heading entitled "Expenses Paid During Period" to estimate the expenses you paid on your account during this period. A small balance maintenance fee of $12.00 that is charged once a year may apply for certain accounts with a value of less than $2,000. This fee is not included in the table below. If it was, the estimate of expenses you paid during the period would be higher, and your ending account value lower, by this amount. In addition, the Fund, as a shareholder in the underlying Fidelity Central Funds, will indirectly bear its pro-rata share of the fees and expenses incurred by the underlying Fidelity Central Funds. These fees and expenses are not included in the Fund's annualized expense ratio used to calculate the expense estimate in the table below.
Hypothetical Example for Comparison Purposes
The second line of the accompanying table for each Class of each fund provides information about hypothetical account values and hypothetical expenses based on a Class' actual expense ratio and an assumed rate of return of 5% per year before expenses, which is not the Class' actual return. The hypothetical account values and expenses may not be used to estimate the actual ending account balance or expenses you paid for the period. You may use this information to compare the ongoing costs of investing in the Fund and other funds. To do so, compare this 5% hypothetical example with the 5% hypothetical examples that appear in the shareholder reports of the other funds. A small balance maintenance fee of $12.00 that is charged once a year may apply for certain accounts with a value of less than $2,000. This fee is not included in the table below. If it was, the estimate of expenses you paid during the period would be higher, and your ending account value lower, by this amount. In addition, each Fund, as a shareholder in the underlying Fidelity Central Funds, will indirectly bear its pro-rata share of the fees and expenses incurred by the underlying Fidelity Central Funds. These fees and expenses are not included in the Fund's annualized expense ratio used to calculate the expense estimate in the table below.
Please note that the expenses shown in the table are meant to highlight your ongoing costs only and do not reflect any transaction costs. Therefore, the second line of the table is useful in comparing ongoing costs only, and will not help you determine the relative total costs of owning different funds. In addition, if these transactional costs were included, your costs would have been higher.
| | Annualized Expense Ratio-A | Beginning
Account Value
November 1, 2016 | Ending
Account Value
April 30, 2017 | Expenses Paid
During Period-B
November 1, 2016
to April 30, 2017 |
| Fidelity Emerging Markets Discovery Fund | | | | |
| Class A | 1.70% | | | |
| Actual | | $1,000.00 | $1,102.90 | $8.86 |
| Hypothetical-C | | $1,000.00 | $1,016.36 | $8.50 |
| Class M | 1.95% | | | |
| Actual | | $1,000.00 | $1,101.40 | $10.16 |
| Hypothetical-C | | $1,000.00 | $1,015.12 | $9.74 |
| Class C | 2.45% | | | |
| Actual | | $1,000.00 | $1,099.10 | $12.75 |
| Hypothetical-C | | $1,000.00 | $1,012.65 | $12.23 |
| Emerging Markets Discovery | 1.45% | | | |
| Actual | | $1,000.00 | $1,104.90 | $7.57 |
| Hypothetical-C | | $1,000.00 | $1,017.60 | $7.25 |
| Class I | 1.42% | | | |
| Actual | | $1,000.00 | $1,104.70 | $7.41 |
| Hypothetical-C | | $1,000.00 | $1,017.75 | $7.10 |
| Fidelity Total Emerging Markets Fund | | | | |
| Class A | 1.60% | | | |
| Actual | | $1,000.00 | $1,080.90 | $8.26 |
| Hypothetical-C | | $1,000.00 | $1,016.86 | $8.00 |
| Class M | 1.90% | | | |
| Actual | | $1,000.00 | $1,079.20 | $9.80 |
| Hypothetical-C | | $1,000.00 | $1,015.37 | $9.49 |
| Class C | 2.34% | | | |
| Actual | | $1,000.00 | $1,076.80 | $12.05 |
| Hypothetical-C | | $1,000.00 | $1,013.19 | $11.68 |
| Total Emerging Markets | 1.40% | | | |
| Actual | | $1,000.00 | $1,082.30 | $7.23 |
| Hypothetical-C | | $1,000.00 | $1,017.85 | $7.00 |
| Class I | 1.27% | | | |
| Actual | | $1,000.00 | $1,082.60 | $6.56 |
| Hypothetical-C | | $1,000.00 | $1,018.50 | $6.36 |
A Annualized expense ratio reflects expenses net of applicable fee waivers.
B Expenses are equal to each Class' annualized expense ratio, multiplied by the average account value over the period, multiplied by 181/ 365 (to reflect the one-half year period).
C 5% return per year before expenses
Corporate Headquarters
245 Summer St.
Boston, MA 02210
www.fidelity.com
EMD-TEK-SANN-0617
1.931240.105
Fidelity® International Growth Fund
Semi-Annual Report April 30, 2017 |
|
Contents
To view a fund's proxy voting guidelines and proxy voting record for the 12-month period ended June 30, visit http://www.fidelity.com/proxyvotingresults or visit the Securities and Exchange Commission's (SEC) web site at http://www.sec.gov.
You may also call 1-800-544-8544 to request a free copy of the proxy voting guidelines.
Standard & Poor's, S&P and S&P 500 are registered service marks of The McGraw-Hill Companies, Inc. and have been licensed for use by Fidelity Distributors Corporation.
Other third-party marks appearing herein are the property of their respective owners.
All other marks appearing herein are registered or unregistered trademarks or service marks of FMR LLC or an affiliated company. © 2017 FMR LLC. All rights reserved.
This report and the financial statements contained herein are submitted for the general information of the shareholders of the Fund. This report is not authorized for distribution to prospective investors in the Fund unless preceded or accompanied by an effective prospectus.
A fund files its complete schedule of portfolio holdings with the SEC for the first and third quarters of each fiscal year on Form N-Q. Forms N-Q are available on the SEC’s web site at http://www.sec.gov. A fund's Forms N-Q may be reviewed and copied at the SEC’s Public Reference Room in Washington, DC. Information regarding the operation of the SEC's Public Reference Room may be obtained by calling 1-800-SEC-0330.
For a complete list of a fund's portfolio holdings, view the most recent holdings listing, semiannual report, or annual report on Fidelity's web site at http://www.fidelity.com, http://www.institutional.fidelity.com, or http://www.401k.com, as applicable.
NOT FDIC INSURED •MAY LOSE VALUE •NO BANK GUARANTEE
Neither the Fund nor Fidelity Distributors Corporation is a bank.
Investment Summary (Unaudited)
Geographic Diversification (% of fund's net assets)
| As of April 30, 2017 |
| | United States of America* | 20.3% |
| | Japan | 11.7% |
| | United Kingdom | 11.5% |
| | Switzerland | 10.7% |
| | Sweden | 5.9% |
| | Germany | 4.8% |
| | Spain | 4.6% |
| | Belgium | 3.9% |
| | Australia | 3.6% |
| | Other | 23.0% |

* Includes Short-Term investments and Net Other Assets (Liabilities).
Percentages are based on country or territory of incorporation and are adjusted for the effect of futures contracts, if applicable.
| As of October 31, 2016 |
| | United States of America* | 23.5% |
| | Japan | 13.9% |
| | Switzerland | 12.4% |
| | United Kingdom | 8.7% |
| | Spain | 5.2% |
| | Sweden | 4.1% |
| | Australia | 4.0% |
| | Belgium | 4.0% |
| | Germany | 3.9% |
| | Other | 20.3% |

* Includes Short-Term investments and Net Other Assets (Liabilities).
Percentages are based on country or territory of incorporation and are adjusted for the effect of futures contracts, if applicable.
Asset Allocation as of April 30, 2017
| | % of fund's net assets | % of fund's net assets 6 months ago |
| Stocks | 97.0 | 95.4 |
| Short-Term Investments and Net Other Assets (Liabilities) | 3.0 | 4.6 |
Top Ten Stocks as of April 30, 2017
| | % of fund's net assets | % of fund's net assets 6 months ago |
| Nestle SA ( Reg. S) (Switzerland, Food Products) | 5.7 | 5.5 |
| Anheuser-Busch InBev SA NV (Belgium, Beverages) | 3.4 | 3.5 |
| CSL Ltd. (Australia, Biotechnology) | 2.9 | 3.0 |
| SAP AG (Germany, Software) | 2.7 | 2.2 |
| Roche Holding AG (participation certificate) (Switzerland, Pharmaceuticals) | 2.6 | 3.1 |
| Visa, Inc. Class A (United States of America, IT Services) | 2.4 | 2.4 |
| Reckitt Benckiser Group PLC (United Kingdom, Household Products) | 2.3 | 2.4 |
| British American Tobacco PLC (United Kingdom) (United Kingdom, Tobacco) | 2.2 | 0.0 |
| Inditex SA (Spain, Specialty Retail) | 2.2 | 2.7 |
| AIA Group Ltd. (Hong Kong, Insurance) | 2.2 | 2.1 |
| | 28.6 | |
Top Market Sectors as of April 30, 2017
| | % of fund's net assets | % of fund's net assets 6 months ago |
| Consumer Staples | 19.0 | 19.8 |
| Information Technology | 18.1 | 16.2 |
| Health Care | 14.5 | 17.8 |
| Industrials | 14.0 | 11.1 |
| Consumer Discretionary | 10.7 | 12.7 |
| Financials | 10.7 | 9.2 |
| Materials | 6.9 | 5.4 |
| Real Estate | 2.1 | 2.5 |
| Energy | 0.6 | 0.3 |
| Telecommunication Services | 0.4 | 0.4 |
Percentages shown as 0.0% may reflect amounts less than 0.05%.
Investments April 30, 2017 (Unaudited)
Showing Percentage of Net Assets
| Common Stocks - 96.6% | | | |
| | | Shares | Value |
| Australia - 3.6% | | | |
| CSL Ltd. | | 556,249 | $55,209,627 |
| Transurban Group unit | | 1,441,115 | 13,165,104 |
|
| TOTAL AUSTRALIA | | | 68,374,731 |
|
| Austria - 1.7% | | | |
| Andritz AG | | 410,121 | 22,681,234 |
| Buwog-Gemeinnuetzige Wohnung | | 348,328 | 9,406,161 |
|
| TOTAL AUSTRIA | | | 32,087,395 |
|
| Belgium - 3.9% | | | |
| Anheuser-Busch InBev SA NV | | 566,391 | 63,872,122 |
| KBC Groep NV | | 131,139 | 9,468,079 |
|
| TOTAL BELGIUM | | | 73,340,201 |
|
| Brazil - 0.1% | | | |
| Itau Unibanco Holding SA | | 141,900 | 1,522,696 |
| Canada - 1.3% | | | |
| Alimentation Couche-Tard, Inc. Class B (sub. vtg.) | | 176,600 | 8,122,009 |
| Franco-Nevada Corp. | | 135,400 | 9,208,847 |
| Pason Systems, Inc. | | 280,500 | 4,165,221 |
| PrairieSky Royalty Ltd. | | 194,500 | 4,238,947 |
|
| TOTAL CANADA | | | 25,735,024 |
|
| Cayman Islands - 1.1% | | | |
| 58.com, Inc. ADR (a)(b) | | 150,570 | 5,959,561 |
| Alibaba Group Holding Ltd. sponsored ADR (a) | | 136,100 | 15,719,550 |
|
| TOTAL CAYMAN ISLANDS | | | 21,679,111 |
|
| Denmark - 1.3% | | | |
| Jyske Bank A/S (Reg.) | | 189,200 | 10,110,801 |
| Novo Nordisk A/S Series B sponsored ADR | | 396,800 | 15,348,224 |
|
| TOTAL DENMARK | | | 25,459,025 |
|
| Finland - 0.3% | | | |
| Tikkurila Oyj | | 298,300 | 5,913,875 |
| France - 0.9% | | | |
| Essilor International SA | | 127,039 | 16,460,727 |
| Germany - 4.8% | | | |
| Bayer AG | | 319,400 | 39,520,370 |
| SAP AG | | 515,925 | 51,678,167 |
|
| TOTAL GERMANY | | | 91,198,537 |
|
| Hong Kong - 2.2% | | | |
| AIA Group Ltd. | | 5,948,200 | 41,179,758 |
| India - 1.0% | | | |
| Housing Development Finance Corp. Ltd. | | 771,267 | 18,440,707 |
| Ireland - 3.4% | | | |
| CRH PLC sponsored ADR | | 1,025,166 | 37,234,029 |
| James Hardie Industries PLC CDI | | 1,595,097 | 27,077,244 |
|
| TOTAL IRELAND | | | 64,311,273 |
|
| Isle of Man - 0.5% | | | |
| Playtech Ltd. | | 778,125 | 9,665,066 |
| Israel - 0.2% | | | |
| Azrieli Group | | 91,600 | 4,878,690 |
| Italy - 1.1% | | | |
| Azimut Holding SpA | | 234,600 | 4,579,452 |
| Interpump Group SpA | | 589,926 | 15,647,466 |
|
| TOTAL ITALY | | | 20,226,918 |
|
| Japan - 11.7% | | | |
| Astellas Pharma, Inc. | | 928,700 | 12,246,871 |
| DENSO Corp. | | 402,700 | 17,336,240 |
| East Japan Railway Co. | | 205,500 | 18,349,827 |
| Hoya Corp. | | 412,500 | 19,700,830 |
| Keyence Corp. | | 99,924 | 40,157,840 |
| Komatsu Ltd. | | 568,700 | 15,196,542 |
| Misumi Group, Inc. | | 793,400 | 15,024,601 |
| Mitsui Fudosan Co. Ltd. | | 563,000 | 12,371,101 |
| Nintendo Co. Ltd. | | 32,400 | 8,199,325 |
| Olympus Corp. | | 486,300 | 18,714,752 |
| OSG Corp. | | 469,800 | 9,672,043 |
| SHO-BOND Holdings Co. Ltd. | | 207,600 | 9,497,735 |
| USS Co. Ltd. | | 1,385,600 | 24,486,495 |
|
| TOTAL JAPAN | | | 220,954,202 |
|
| Kenya - 0.4% | | | |
| Safaricom Ltd. | | 44,623,900 | 8,323,741 |
| Korea (South) - 1.2% | | | |
| BGFretail Co. Ltd. | | 154,843 | 14,904,455 |
| NAVER Corp. | | 10,508 | 7,389,592 |
|
| TOTAL KOREA (SOUTH) | | | 22,294,047 |
|
| Mexico - 0.5% | | | |
| Fomento Economico Mexicano S.A.B. de CV sponsored ADR | | 97,255 | 8,756,840 |
| Netherlands - 2.0% | | | |
| ASML Holding NV (Netherlands) (b) | | 286,200 | 37,831,792 |
| New Zealand - 0.3% | | | |
| Auckland International Airport Ltd. | | 1,278,623 | 6,057,528 |
| South Africa - 2.0% | | | |
| Clicks Group Ltd. | | 937,084 | 9,412,387 |
| Naspers Ltd. Class N | | 154,900 | 29,454,469 |
|
| TOTAL SOUTH AFRICA | | | 38,866,856 |
|
| Spain - 4.6% | | | |
| Amadeus IT Holding SA Class A | | 494,200 | 26,647,437 |
| Hispania Activos Inmobiliarios SA | | 365,824 | 5,523,100 |
| Inditex SA | | 1,083,159 | 41,543,754 |
| Merlin Properties Socimi SA | | 412,400 | 4,880,855 |
| Prosegur Compania de Seguridad SA (Reg.) | | 1,346,749 | 8,787,412 |
|
| TOTAL SPAIN | | | 87,382,558 |
|
| Sweden - 5.9% | | | |
| ASSA ABLOY AB (B Shares) | | 1,848,083 | 40,040,094 |
| Atlas Copco AB (A Shares) | | 703,900 | 26,320,852 |
| Fagerhult AB | | 360,544 | 14,877,991 |
| Svenska Cellulosa AB (SCA) (B Shares) | | 463,900 | 15,366,789 |
| Svenska Handelsbanken AB (A Shares) | | 1,038,920 | 14,744,024 |
|
| TOTAL SWEDEN | | | 111,349,750 |
|
| Switzerland - 10.7% | | | |
| Nestle SA (Reg. S) | | 1,409,029 | 108,524,129 |
| Novartis AG | | 339,452 | 26,132,737 |
| Roche Holding AG (participation certificate) | | 184,397 | 48,250,148 |
| Schindler Holding AG: | | | |
| (participation certificate) | | 77,451 | 15,824,913 |
| (Reg.) | | 18,350 | 3,644,181 |
|
| TOTAL SWITZERLAND | | | 202,376,108 |
|
| Taiwan - 0.9% | | | |
| Taiwan Semiconductor Manufacturing Co. Ltd. | | 2,637,000 | 16,958,049 |
| Turkey - 0.2% | | | |
| Tupras Turkiye Petrol Rafinelleri A/S | | 143,012 | 3,603,534 |
| United Kingdom - 11.5% | | | |
| BAE Systems PLC | | 2,019,000 | 16,398,270 |
| Berendsen PLC | | 798,873 | 8,681,136 |
| British American Tobacco PLC (United Kingdom) | | 630,700 | 42,612,217 |
| Elementis PLC | | 1,253,900 | 4,940,364 |
| Howden Joinery Group PLC | | 775,100 | 4,648,101 |
| Informa PLC | | 2,095,926 | 17,428,010 |
| InterContinental Hotel Group PLC ADR (b) | | 611,546 | 32,283,513 |
| Prudential PLC | | 1,422,174 | 31,563,535 |
| Reckitt Benckiser Group PLC | | 465,145 | 42,857,319 |
| Rightmove PLC | | 89,200 | 4,836,163 |
| Shaftesbury PLC | | 377,933 | 4,562,129 |
| Spectris PLC | | 178,700 | 6,388,082 |
|
| TOTAL UNITED KINGDOM | | | 217,198,839 |
|
| United States of America - 17.3% | | | |
| Alphabet, Inc. Class A (a) | | 32,736 | 30,265,087 |
| Autoliv, Inc. (b) | | 168,569 | 16,888,928 |
| Berkshire Hathaway, Inc. Class B (a) | | 134,184 | 22,168,539 |
| China Biologic Products, Inc. (a) | | 80,266 | 9,471,388 |
| Domino's Pizza, Inc. | | 36,290 | 6,582,643 |
| Martin Marietta Materials, Inc. | | 84,900 | 18,694,131 |
| MasterCard, Inc. Class A | | 320,100 | 37,234,032 |
| Mohawk Industries, Inc. (a) | | 77,900 | 18,290,141 |
| Molson Coors Brewing Co. Class B | | 103,400 | 9,915,026 |
| Moody's Corp. | | 88,700 | 10,494,984 |
| MSCI, Inc. | | 131,400 | 13,182,048 |
| Philip Morris International, Inc. | | 252,808 | 28,021,239 |
| PPG Industries, Inc. | | 80,700 | 8,864,088 |
| PriceSmart, Inc. | | 82,600 | 7,182,070 |
| ResMed, Inc. | | 181,700 | 12,353,783 |
| S&P Global, Inc. | | 110,200 | 14,787,738 |
| Sherwin-Williams Co. | | 51,600 | 17,269,488 |
| Visa, Inc. Class A | | 500,160 | 45,624,595 |
|
| TOTAL UNITED STATES OF AMERICA | | | 327,289,948 |
|
| TOTAL COMMON STOCKS | | | |
| (Cost $1,516,974,032) | | | 1,829,717,526 |
|
| Nonconvertible Preferred Stocks - 0.4% | | | |
| Brazil - 0.4% | | | |
| Itau Unibanco Holding SA | | | |
| (Cost $7,326,348) | | 549,500 | 6,796,796 |
|
| Money Market Funds - 5.7% | | | |
| Fidelity Cash Central Fund, 0.85% (c) | | 50,237,817 | 50,247,865 |
| Fidelity Securities Lending Cash Central Fund 0.86% (c)(d) | | 57,874,220 | 57,880,007 |
| TOTAL MONEY MARKET FUNDS | | | |
| (Cost $108,126,129) | | | 108,127,872 |
| TOTAL INVESTMENT PORTFOLIO - 102.7% | | | |
| (Cost $1,632,426,509) | | | 1,944,642,194 |
| NET OTHER ASSETS (LIABILITIES) - (2.7)% | | | (51,311,106) |
| NET ASSETS - 100% | | | $1,893,331,088 |
Categorizations in the Schedule of Investments are based on country or territory of incorporation.
Legend
(a) Non-income producing
(b) Security or a portion of the security is on loan at period end.
(c) Affiliated fund that is generally available only to investment companies and other accounts managed by Fidelity Investments. The rate quoted is the annualized seven-day yield of the fund at period end. A complete unaudited listing of the fund's holdings as of its most recent quarter end is available upon request. In addition, each Fidelity Central Fund's financial statements are available on the SEC's website or upon request.
(d) Investment made with cash collateral received from securities on loan.
Affiliated Central Funds
Information regarding fiscal year to date income earned by the Fund from investments in Fidelity Central Funds is as follows:
| Fund | Income earned |
| Fidelity Cash Central Fund | $128,265 |
| Fidelity Securities Lending Cash Central Fund | 213,214 |
| Total | $341,479 |
Investment Valuation
The following is a summary of the inputs used, as of April 30, 2017, involving the Fund's assets and liabilities carried at fair value. The inputs or methodology used for valuing securities may not be an indication of the risk associated with investing in those securities. For more information on valuation inputs, and their aggregation into the levels used below, please refer to the Investment Valuation section in the accompanying Notes to Financial Statements.
| | Valuation Inputs at Reporting Date: |
| Description | Total | Level 1 | Level 2 | Level 3 |
| Investments in Securities: | | | | |
| Equities: | | | | |
| Consumer Discretionary | $204,294,193 | $174,839,724 | $29,454,469 | $-- |
| Consumer Staples | 359,546,602 | 101,680,815 | 257,865,787 | -- |
| Energy | 12,007,702 | 12,007,702 | -- | -- |
| Financials | 199,039,157 | 167,475,622 | 31,563,535 | -- |
| Health Care | 273,409,457 | 147,259,331 | 126,150,126 | -- |
| Industrials | 264,515,030 | 232,920,218 | 31,594,812 | -- |
| Information Technology | 344,554,338 | 267,718,797 | 76,835,541 | -- |
| Materials | 129,202,066 | 129,202,066 | -- | -- |
| Real Estate | 41,622,036 | 41,622,036 | -- | -- |
| Telecommunication Services | 8,323,741 | 8,323,741 | -- | -- |
| Money Market Funds | 108,127,872 | 108,127,872 | -- | -- |
| Total Investments in Securities: | $1,944,642,194 | $1,391,177,924 | $553,464,270 | $-- |
The following is a summary of transfers between Level 1 and Level 2 for the period ended April 30, 2017. Transfers are assumed to have occurred at the beginning of the period, and are primarily attributable to the valuation techniques used for foreign equity securities, as discussed in the accompanying Notes to Financial Statements:
| Transfers | Total |
| Level 1 to Level 2 | $83,144,029 |
| Level 2 to Level 1 | $68,746,581 |
See accompanying notes which are an integral part of the financial statements.
Financial Statements
Statement of Assets and Liabilities
| | | April 30, 2017 (Unaudited) |
| Assets | | |
Investment in securities, at value (including securities loaned of $54,483,263) — See accompanying schedule:
Unaffiliated issuers (cost $1,524,300,380) | $1,836,514,322 | |
| Fidelity Central Funds (cost $108,126,129) | 108,127,872 | |
| Total Investments (cost $1,632,426,509) | | $1,944,642,194 |
| Receivable for investments sold | | 180,933 |
| Receivable for fund shares sold | | 3,979,764 |
| Dividends receivable | | 10,653,819 |
| Distributions receivable from Fidelity Central Funds | | 60,171 |
| Prepaid expenses | | 1,119 |
| Other receivables | | 35,395 |
| Total assets | | 1,959,553,395 |
| Liabilities | | |
| Payable for investments purchased | $1,952,761 | |
| Payable for fund shares redeemed | 4,626,481 | |
| Accrued management fee | 1,153,657 | |
| Distribution and service plan fees payable | 89,645 | |
| Other affiliated payables | 367,476 | |
| Other payables and accrued expenses | 160,987 | |
| Collateral on securities loaned | 57,871,300 | |
| Total liabilities | | 66,222,307 |
| Net Assets | | $1,893,331,088 |
| Net Assets consist of: | | |
| Paid in capital | | $1,668,374,707 |
| Undistributed net investment income | | 9,046,431 |
| Accumulated undistributed net realized gain (loss) on investments and foreign currency transactions | | (96,206,991) |
| Net unrealized appreciation (depreciation) on investments and assets and liabilities in foreign currencies | | 312,116,941 |
| Net Assets | | $1,893,331,088 |
| Calculation of Maximum Offering Price | | |
| Class A: | | |
| Net Asset Value and redemption price per share ($145,127,708 ÷ 12,036,905 shares) | | $12.06 |
| Maximum offering price per share (100/94.25 of $12.06) | | $12.80 |
| Class M: | | |
| Net Asset Value and redemption price per share ($31,273,302 ÷ 2,598,446 shares) | | $12.04 |
| Maximum offering price per share (100/96.50 of $12.04) | | $12.48 |
| Class C: | | |
| Net Asset Value and offering price per share ($59,007,661 ÷ 4,967,586 shares)(a) | | $11.88 |
| International Growth: | | |
| Net Asset Value, offering price and redemption price per share ($792,767,299 ÷ 65,313,782 shares) | | $12.14 |
| Class I: | | |
| Net Asset Value, offering price and redemption price per share ($564,884,596 ÷ 46,619,452 shares) | | $12.12 |
| Class Z: | | |
| Net Asset Value, offering price and redemption price per share ($300,270,522 ÷ 24,754,795 shares) | | $12.13 |
(a) Redemption price per share is equal to net asset value less any applicable contingent deferred sales charge.
See accompanying notes which are an integral part of the financial statements.
Statement of Operations
| | | Six months ended April 30, 2017 (Unaudited) |
| Investment Income | | |
| Dividends | | $21,328,974 |
| Income from Fidelity Central Funds | | 341,479 |
| Income before foreign taxes withheld | | 21,670,453 |
| Less foreign taxes withheld | | (2,199,855) |
| Total income | | 19,470,598 |
| Expenses | | |
| Management fee | | |
| Basic fee | $5,969,494 | |
| Performance adjustment | 332,361 | |
| Transfer agent fees | 1,800,689 | |
| Distribution and service plan fees | 575,929 | |
| Accounting and security lending fees | 386,286 | |
| Custodian fees and expenses | 99,821 | |
| Independent trustees' fees and expenses | 3,463 | |
| Registration fees | 71,370 | |
| Audit | 40,092 | |
| Legal | 2,273 | |
| Interest | 942 | |
| Miscellaneous | 6,684 | |
| Total expenses before reductions | 9,289,404 | |
| Expense reductions | (58,726) | 9,230,678 |
| Net investment income (loss) | | 10,239,920 |
| Realized and Unrealized Gain (Loss) | | |
| Net realized gain (loss) on: | | |
| Investment securities: | | |
| Unaffiliated issuers | (16,972,827) | |
| Fidelity Central Funds | 4,505 | |
| Foreign currency transactions | (200,210) | |
| Total net realized gain (loss) | | (17,168,532) |
Change in net unrealized appreciation (depreciation) on:
Investment securities (net of decrease in deferred foreign taxes of $3,929) | 204,960,200 | |
| Assets and liabilities in foreign currencies | 142,461 | |
| Total change in net unrealized appreciation (depreciation) | | 205,102,661 |
| Net gain (loss) | | 187,934,129 |
| Net increase (decrease) in net assets resulting from operations | | $198,174,049 |
See accompanying notes which are an integral part of the financial statements.
Statement of Changes in Net Assets
| | Six months ended April 30, 2017 (Unaudited) | Year ended October 31, 2016 |
| Increase (Decrease) in Net Assets | | |
| Operations | | |
| Net investment income (loss) | $10,239,920 | $20,404,064 |
| Net realized gain (loss) | (17,168,532) | (41,385,367) |
| Change in net unrealized appreciation (depreciation) | 205,102,661 | (23,170,403) |
| Net increase (decrease) in net assets resulting from operations | 198,174,049 | (44,151,706) |
| Distributions to shareholders from net investment income | (18,629,181) | (9,313,588) |
| Distributions to shareholders from net realized gain | – | (1,062,130) |
| Total distributions | (18,629,181) | (10,375,718) |
| Share transactions - net increase (decrease) | (4,209,196) | 298,573,554 |
| Redemption fees | 6,819 | 63,422 |
| Total increase (decrease) in net assets | 175,342,491 | 244,109,552 |
| Net Assets | | |
| Beginning of period | 1,717,988,597 | 1,473,879,045 |
| End of period | $1,893,331,088 | $1,717,988,597 |
| Other Information | | |
| Undistributed net investment income end of period | $9,046,431 | $17,435,692 |
See accompanying notes which are an integral part of the financial statements.
Financial Highlights — Fidelity International Growth Fund Class A
| | Six months ended (Unaudited) April 30, | Years ended October 31, | | | | |
| | 2017 | 2016 | 2015 | 2014 | 2013 | 2012 |
| Selected Per–Share Data | | | | | | |
| Net asset value, beginning of period | $10.88 | $11.30 | $11.01 | $10.78 | $8.91 | $8.09 |
| Income from Investment Operations | | | | | | |
| Net investment income (loss)A | .05 | .12B | .07 | .09 | .08 | .08 |
| Net realized and unrealized gain (loss) | 1.23 | (.48) | .28 | .18 | 1.88 | .81 |
| Total from investment operations | 1.28 | (.36) | .35 | .27 | 1.96 | .89 |
| Distributions from net investment income | (.10) | (.05) | (.06) | (.03) | (.08) | (.06) |
| Distributions from net realized gain | – | (.01) | – | (.01) | (.01) | (.01) |
| Total distributions | (.10) | (.06) | (.06) | (.04) | (.09) | (.07) |
| Redemption fees added to paid in capitalA,C | – | – | – | – | – | – |
| Net asset value, end of period | $12.06 | $10.88 | $11.30 | $11.01 | $10.78 | $8.91 |
| Total ReturnD,E,F | 11.92% | (3.22)% | 3.20% | 2.54% | 22.18% | 11.10% |
| Ratios to Average Net AssetsG,H | | | | | | |
| Expenses before reductions | 1.28%I | 1.27% | 1.26% | 1.35% | 1.44% | 1.58% |
| Expenses net of fee waivers, if any | 1.28%I | 1.27% | 1.26% | 1.35% | 1.43% | 1.45% |
| Expenses net of all reductions | 1.28%I | 1.27% | 1.25% | 1.34% | 1.42% | 1.44% |
| Net investment income (loss) | .99%I | 1.05%B | .66% | .84% | .80% | .99% |
| Supplemental Data | | | | | | |
| Net assets, end of period (000 omitted) | $145,128 | $221,861 | $184,878 | $119,017 | $74,595 | $21,874 |
| Portfolio turnover rateJ | 35%I | 29% | 26% | 27% | 32% | 32% |
A Calculated based on average shares outstanding during the period.
B Net Investment income per share reflects a large, non-recurring dividend which amounted to $.04 per share. Excluding this non-recurring dividend, the ratio of net investment income (loss) to average net assets would have been .68%.
C Amount represents less than $.005 per share.
D Total returns for periods of less than one year are not annualized.
E Total returns would have been lower if certain expenses had not been reduced during the applicable periods shown.
F Total returns do not include the effect of the sales charges.
G Fees and expenses of any underlying Fidelity Central Funds are not included in the Fund's expense ratio. The Fund indirectly bears its proportionate share of the expenses of any underlying Fidelity Central Funds.
H Expense ratios reflect operating expenses of the class. Expenses before reductions do not reflect amounts reimbursed by the investment adviser or reductions from brokerage service arrangements or reductions from other expense offset arrangements and do not represent the amount paid by the class during periods when reimbursements or reductions occur. Expenses net of fee waivers reflect expenses after reimbursement by the investment adviser but prior to reductions from brokerage service arrangements or other expense offset arrangements. Expenses net of all reductions represent the net expenses paid by the class.
I Annualized
J Amount does not include the portfolio activity of any underlying Fidelity Central Funds.
See accompanying notes which are an integral part of the financial statements.
Financial Highlights — Fidelity International Growth Fund Class M
| | Six months ended (Unaudited) April 30, | Years ended October 31, | | | | |
| | 2017 | 2016 | 2015 | 2014 | 2013 | 2012 |
| Selected Per–Share Data | | | | | | |
| Net asset value, beginning of period | $10.84 | $11.26 | $10.96 | $10.75 | $8.89 | $8.08 |
| Income from Investment Operations | | | | | | |
| Net investment income (loss)A | .04 | .08B | .04 | .06 | .05 | .06 |
| Net realized and unrealized gain (loss) | 1.23 | (.48) | .27 | .18 | 1.88 | .81 |
| Total from investment operations | 1.27 | (.40) | .31 | .24 | 1.93 | .87 |
| Distributions from net investment income | (.07) | (.01) | (.01) | (.02) | (.07) | (.05) |
| Distributions from net realized gain | – | (.01) | – | (.01) | (.01) | (.01) |
| Total distributions | (.07) | (.02) | (.01) | (.03) | (.07)C | (.06) |
| Redemption fees added to paid in capitalA,D | – | – | – | – | – | – |
| Net asset value, end of period | $12.04 | $10.84 | $11.26 | $10.96 | $10.75 | $8.89 |
| Total ReturnE,F,G | 11.81% | (3.58)% | 2.85% | 2.21% | 21.91% | 10.82% |
| Ratios to Average Net AssetsH,I | | | | | | |
| Expenses before reductions | 1.61%J | 1.61% | 1.58% | 1.65% | 1.69% | 1.85% |
| Expenses net of fee waivers, if any | 1.61%J | 1.61% | 1.58% | 1.65% | 1.69% | 1.70% |
| Expenses net of all reductions | 1.60%J | 1.61% | 1.58% | 1.65% | 1.68% | 1.69% |
| Net investment income (loss) | .67%J | .71%B | .33% | .53% | .54% | .74% |
| Supplemental Data | | | | | | |
| Net assets, end of period (000 omitted) | $31,273 | $27,966 | $28,833 | $26,369 | $23,118 | $10,690 |
| Portfolio turnover rateK | 35%J | 29% | 26% | 27% | 32% | 32% |
A Calculated based on average shares outstanding during the period.
B Net Investment income per share reflects a large, non-recurring dividend which amounted to $.04 per share. Excluding this non-recurring dividend, the ratio of net investment income (loss) to average net assets would have been .34%.
C Total distributions of $0.07 per share is comprised of distributions from net investment income of $0.69 and distributions from net realized gain of $0.005 per share.
D Amount represents less than $.005 per share.
E Total returns for periods of less than one year are not annualized.
F Total returns would have been lower if certain expenses had not been reduced during the applicable periods shown.
G Total returns do not include the effect of the sales charges.
H Fees and expenses of any underlying Fidelity Central Funds are not included in the Fund's expense ratio. The Fund indirectly bears its proportionate share of the expenses of any underlying Fidelity Central Funds.
I Expense ratios reflect operating expenses of the class. Expenses before reductions do not reflect amounts reimbursed by the investment adviser or reductions from brokerage service arrangements or reductions from other expense offset arrangements and do not represent the amount paid by the class during periods when reimbursements or reductions occur. Expenses net of fee waivers reflect expenses after reimbursement by the investment adviser but prior to reductions from brokerage service arrangements or other expense offset arrangements. Expenses net of all reductions represent the net expenses paid by the class.
J Annualized
K Amount does not include the portfolio activity of any underlying Fidelity Central Funds.
See accompanying notes which are an integral part of the financial statements.
Financial Highlights — Fidelity International Growth Fund Class C
| | Six months ended (Unaudited) April 30, | Years ended October 31, | | | | |
| | 2017 | 2016 | 2015 | 2014 | 2013 | 2012 |
| Selected Per–Share Data | | | | | | |
| Net asset value, beginning of period | $10.67 | $11.12 | $10.87 | $10.69 | $8.84 | $8.03 |
| Income from Investment Operations | | | | | | |
| Net investment income (loss)A | .01 | .03B | (.02) | .01 | .01 | .02 |
| Net realized and unrealized gain (loss) | 1.22 | (.47) | .27 | .18 | 1.87 | .80 |
| Total from investment operations | 1.23 | (.44) | .25 | .19 | 1.88 | .82 |
| Distributions from net investment income | (.02) | – | – | – | (.02) | (.01) |
| Distributions from net realized gain | – | (.01) | – | (.01) | (.01) | (.01) |
| Total distributions | (.02) | (.01) | – | (.01) | (.03) | (.01)C |
| Redemption fees added to paid in capitalA,D | – | – | – | – | – | – |
| Net asset value, end of period | $11.88 | $10.67 | $11.12 | $10.87 | $10.69 | $8.84 |
| Total ReturnE,F,G | 11.51% | (3.98)% | 2.30% | 1.77% | 21.29% | 10.27% |
| Ratios to Average Net AssetsH,I | | | | | | |
| Expenses before reductions | 2.07%J | 2.07% | 2.06% | 2.12% | 2.19% | 2.33% |
| Expenses net of fee waivers, if any | 2.07%J | 2.07% | 2.06% | 2.12% | 2.18% | 2.20% |
| Expenses net of all reductions | 2.06%J | 2.06% | 2.05% | 2.12% | 2.17% | 2.19% |
| Net investment income (loss) | .21%J | .26%B | (.15)% | .06% | .05% | .24% |
| Supplemental Data | | | | | | |
| Net assets, end of period (000 omitted) | $59,008 | $52,738 | $52,378 | $32,737 | $17,196 | $5,648 |
| Portfolio turnover rateK | 35%J | 29% | 26% | 27% | 32% | 32% |
A Calculated based on average shares outstanding during the period.
B Net Investment income per share reflects a large, non-recurring dividend which amounted to $.04 per share. Excluding this non-recurring dividend, the ratio of net investment income (loss) to average net assets would have been (.12) %.
C Total distributions of $.01 per share is comprised of distributions from net investment income of $.007 and distributions from net realized gain of $.006 per share.
D Amount represents less than $.005 per share.
E Total returns for periods of less than one year are not annualized.
F Total returns would have been lower if certain expenses had not been reduced during the applicable periods shown.
G Total returns do not include the effect of the contingent deferred sales charge.
H Fees and expenses of any underlying Fidelity Central Funds are not included in the Fund's expense ratio. The Fund indirectly bears its proportionate share of the expenses of any underlying Fidelity Central Funds.
I Expense ratios reflect operating expenses of the class. Expenses before reductions do not reflect amounts reimbursed by the investment adviser or reductions from brokerage service arrangements or reductions from other expense offset arrangements and do not represent the amount paid by the class during periods when reimbursements or reductions occur. Expenses net of fee waivers reflect expenses after reimbursement by the investment adviser but prior to reductions from brokerage service arrangements or other expense offset arrangements. Expenses net of all reductions represent the net expenses paid by the class.
J Annualized
K Amount does not include the portfolio activity of any underlying Fidelity Central Funds.
See accompanying notes which are an integral part of the financial statements.
Financial Highlights — Fidelity International Growth Fund
| | Six months ended (Unaudited) April 30, | Years ended October 31, | | | | |
| | 2017 | 2016 | 2015 | 2014 | 2013 | 2012 |
| Selected Per–Share Data | | | | | | |
| Net asset value, beginning of period | $10.97 | $11.38 | $11.10 | $10.84 | $8.95 | $8.12 |
| Income from Investment Operations | | | | | | |
| Net investment income (loss)A | .07 | .15B | .11 | .13 | .11 | .11 |
| Net realized and unrealized gain (loss) | 1.23 | (.47) | .26 | .19 | 1.88 | .81 |
| Total from investment operations | 1.30 | (.32) | .37 | .32 | 1.99 | .92 |
| Distributions from net investment income | (.13) | (.08) | (.09) | (.05) | (.10) | (.08) |
| Distributions from net realized gain | – | (.01) | – | (.01) | (.01) | (.01) |
| Total distributions | (.13) | (.09) | (.09) | (.06) | (.10)C | (.09) |
| Redemption fees added to paid in capitalA,D | – | – | – | – | – | – |
| Net asset value, end of period | $12.14 | $10.97 | $11.38 | $11.10 | $10.84 | $8.95 |
| Total ReturnE,F | 12.04% | (2.87)% | 3.36% | 2.96% | 22.48% | 11.41% |
| Ratios to Average Net AssetsG,H | | | | | | |
| Expenses before reductions | 1.04%I | .99% | .97% | 1.04% | 1.13% | 1.28% |
| Expenses net of fee waivers, if any | 1.04%I | .99% | .97% | 1.04% | 1.13% | 1.20% |
| Expenses net of all reductions | 1.03%I | .98% | .96% | 1.04% | 1.11% | 1.19% |
| Net investment income (loss) | 1.24%I | 1.34%B | .94% | 1.14% | 1.11% | 1.24% |
| Supplemental Data | | | | | | |
| Net assets, end of period (000 omitted) | $792,767 | $1,038,771 | $938,348 | $635,607 | $430,914 | $149,526 |
| Portfolio turnover rateJ | 35%I | 29% | 26% | 27% | 32% | 32% |
A Calculated based on average shares outstanding during the period.
B Net Investment income per share reflects a large, non-recurring dividend which amounted to $.04 per share. Excluding this non-recurring dividend, the ratio of net investment income (loss) to average net assets would have been .96%.
C Total distributions of $.10 per share is comprised of distributions from net investment income of $.097 and distributions from net realized gain of $.005 per share.
D Amount represents less than $.005 per share.
E Total returns for periods of less than one year are not annualized.
F Total returns would have been lower if certain expenses had not been reduced during the applicable periods shown.
G Fees and expenses of any underlying Fidelity Central Funds are not included in the Fund's expense ratio. The Fund indirectly bears its proportionate share of the expenses of any underlying Fidelity Central Funds.
H Expense ratios reflect operating expenses of the class. Expenses before reductions do not reflect amounts reimbursed by the investment adviser or reductions from brokerage service arrangements or reductions from other expense offset arrangements and do not represent the amount paid by the class during periods when reimbursements or reductions occur. Expenses net of fee waivers reflect expenses after reimbursement by the investment adviser but prior to reductions from brokerage service arrangements or other expense offset arrangements. Expenses net of all reductions represent the net expenses paid by the class.
I Annualized
J Amount does not include the portfolio activity of any underlying Fidelity Central Funds.
See accompanying notes which are an integral part of the financial statements.
Financial Highlights — Fidelity International Growth Fund Class I
| | Six months ended (Unaudited) April 30, | Years ended October 31, | | | | |
| | 2017 | 2016 | 2015 | 2014 | 2013 | 2012 |
| Selected Per–Share Data | | | | | | |
| Net asset value, beginning of period | $10.95 | $11.36 | $11.08 | $10.84 | $8.94 | $8.12 |
| Income from Investment Operations | | | | | | |
| Net investment income (loss)A | .07 | .15B | .11 | .13 | .11 | .10 |
| Net realized and unrealized gain (loss) | 1.24 | (.47) | .27 | .18 | 1.90 | .81 |
| Total from investment operations | 1.31 | (.32) | .38 | .31 | 2.01 | .91 |
| Distributions from net investment income | (.14) | (.08) | (.10) | (.06) | (.10) | (.08) |
| Distributions from net realized gain | – | (.01) | – | (.01) | (.01) | (.01) |
| Total distributions | (.14) | (.09) | (.10) | (.07) | (.11) | (.09) |
| Redemption fees added to paid in capitalA,C | – | – | – | – | – | – |
| Net asset value, end of period | $12.12 | $10.95 | $11.36 | $11.08 | $10.84 | $8.94 |
| Total ReturnD,E | 12.11% | (2.87)% | 3.41% | 2.84% | 22.66% | 11.28% |
| Ratios to Average Net AssetsF,G | | | | | | |
| Expenses before reductions | .98%H | .98% | .98% | 1.04% | 1.11% | 1.27% |
| Expenses net of fee waivers, if any | .98%H | .98% | .98% | 1.04% | 1.11% | 1.20% |
| Expenses net of all reductions | .98%H | .98% | .97% | 1.04% | 1.09% | 1.19% |
| Net investment income (loss) | 1.29%H | 1.34%B | .94% | 1.14% | 1.13% | 1.24% |
| Supplemental Data | | | | | | |
| Net assets, end of period (000 omitted) | $564,885 | $359,676 | $267,745 | $121,554 | $38,771 | $3,992 |
| Portfolio turnover rateI | 35%H | 29% | 26% | 27% | 32% | 32% |
A Calculated based on average shares outstanding during the period.
B Net Investment income per share reflects a large, non-recurring dividend which amounted to $.04 per share. Excluding this non-recurring dividend, the ratio of net investment income (loss) to average net assets would have been .97%.
C Amount represents less than $.005 per share.
D Total returns for periods of less than one year are not annualized.
E Total returns would have been lower if certain expenses had not been reduced during the applicable periods shown.
F Fees and expenses of any underlying Fidelity Central Funds are not included in the Fund's expense ratio. The Fund indirectly bears its proportionate share of the expenses of any underlying Fidelity Central Funds.
G Expense ratios reflect operating expenses of the class. Expenses before reductions do not reflect amounts reimbursed by the investment adviser or reductions from brokerage service arrangements or reductions from other expense offset arrangements and do not represent the amount paid by the class during periods when reimbursements or reductions occur. Expenses net of fee waivers reflect expenses after reimbursement by the investment adviser but prior to reductions from brokerage service arrangements or other expense offset arrangements. Expenses net of all reductions represent the net expenses paid by the class.
H Annualized
I Amount does not include the portfolio activity of any underlying Fidelity Central Funds.
See accompanying notes which are an integral part of the financial statements.
Financial Highlights — Fidelity International Growth Fund Class Z
| | Six months ended (Unaudited) April 30, | Years ended October 31, | | | |
| | 2017 | 2016 | 2015 | 2014 | 2013 A |
| Selected Per–Share Data | | | | | |
| Net asset value, beginning of period | $10.97 | $11.38 | $11.10 | $10.84 | $10.26 |
| Income from Investment Operations | | | | | |
| Net investment income (loss)B | .08 | .16C | .12 | .14 | .02 |
| Net realized and unrealized gain (loss) | 1.23 | (.47) | .27 | .19 | .56 |
| Total from investment operations | 1.31 | (.31) | .39 | .33 | .58 |
| Distributions from net investment income | (.15) | (.09) | (.11) | (.06) | – |
| Distributions from net realized gain | – | (.01) | – | (.01) | – |
| Total distributions | (.15) | (.10) | (.11) | (.07) | – |
| Redemption fees added to paid in capitalB,D | – | – | – | – | – |
| Net asset value, end of period | $12.13 | $10.97 | $11.38 | $11.10 | $10.84 |
| Total ReturnE,F | 12.13% | (2.73)% | 3.52% | 3.07% | 5.65% |
| Ratios to Average Net AssetsG,H | | | | | |
| Expenses before reductions | .85%I | .85% | .84% | .88% | .94%I |
| Expenses net of fee waivers, if any | .85%I | .85% | .84% | .88% | .94%I |
| Expenses net of all reductions | .85%I | .84% | .83% | .88% | .93%I |
| Net investment income (loss) | 1.42%I | 1.48%C | 1.07% | 1.30% | .65%I |
| Supplemental Data | | | | | |
| Net assets, end of period (000 omitted) | $300,271 | $16,977 | $897 | $104 | $106 |
| Portfolio turnover rateJ | 35%I | 29% | 26% | 27% | 32% |
A For the period August 13, 2013 (commencement of sale of shares) to October 31, 2013.
B Calculated based on average shares outstanding during the period.
C Net Investment income per share reflects a large, non-recurring dividend which amounted to $.04 per share. Excluding this non-recurring dividend, the ratio of net investment income (loss) to average net assets would have been 1.10%.
D Amount represents less than $.005 per share.
E Total returns for periods of less than one year are not annualized.
F Total returns would have been lower if certain expenses had not been reduced during the applicable periods shown.
G Fees and expenses of any underlying Fidelity Central Funds are not included in the Fund's expense ratio. The Fund indirectly bears its proportionate share of the expenses of any underlying Fidelity Central Funds.
H Expense ratios reflect operating expenses of the class. Expenses before reductions do not reflect amounts reimbursed by the investment adviser or reductions from brokerage service arrangements or reductions from other expense offset arrangements and do not represent the amount paid by the class during periods when reimbursements or reductions occur. Expense ratios before reductions for start-up periods may not be representative of longer-term operating periods. Expenses net of fee waivers reflect expenses after reimbursement by the investment adviser but prior to reductions from brokerage service arrangements or other expense offset arrangements. Expenses net of all reductions represent the net expenses paid by the class.
I Annualized
J Amount does not include the portfolio activity of any underlying Fidelity Central Funds.
See accompanying notes which are an integral part of the financial statements.
Notes to Financial Statements (Unaudited)
For the period ended April 30, 2017
1. Organization.
Fidelity International Growth Fund (the Fund) is a fund of Fidelity Investment Trust (the Trust) and is authorized to issue an unlimited number of shares. The Trust is registered under the Investment Company Act of 1940, as amended (the 1940 Act), as an open-end management investment company organized as a Massachusetts business trust. The Fund offers Class A, Class M (formerly Class T), Class C, International Growth, Class I and Class Z shares, each of which has equal rights as to assets and voting privileges. Each class has exclusive voting rights with respect to matters that affect that class.
After the close of business on June 24, 2016, all outstanding Class B shares were converted to Class A shares. All prior fiscal period dollar and share amounts for Class B presented in the Notes to Financial Statements are for the period November 1, 2015 through June 24, 2016.
2. Investments in Fidelity Central Funds.
The Fund invests in Fidelity Central Funds, which are open-end investment companies generally available only to other investment companies and accounts managed by the investment adviser and its affiliates. The Fund's Schedule of Investments lists each of the Fidelity Central Funds held as of period end, if any, as an investment of the Fund, but does not include the underlying holdings of each Fidelity Central Fund. As an Investing Fund, the Fund indirectly bears its proportionate share of the expenses of the underlying Fidelity Central Funds.
The Money Market Central Funds seek preservation of capital and current income and are managed by Fidelity Investments Money Management, Inc. (FIMM), an affiliate of the investment adviser. Annualized expenses of the Money Market Central Funds as of their most recent shareholder report date are less than .005%.
A complete unaudited list of holdings for each Fidelity Central Fund is available upon request or at the Securities and Exchange Commission (the SEC) website at www.sec.gov. In addition, the financial statements of the Fidelity Central Funds are available on the SEC website or upon request.
3. Significant Accounting Policies.
The Fund is an investment company and applies the accounting and reporting guidance of the Financial Accounting Standards Board (FASB) Accounting Standards Codification Topic 946 Financial Services – Investments Companies. The financial statements have been prepared in conformity with accounting principles generally accepted in the United States of America (GAAP), which require management to make certain estimates and assumptions at the date of the financial statements. Actual results could differ from those estimates. Subsequent events, if any, through the date that the financial statements were issued have been evaluated in the preparation of the financial statements. The following summarizes the significant accounting policies of the Fund:
Investment Valuation. Investments are valued as of 4:00 p.m. Eastern time on the last calendar day of the period. The Board of Trustees (the Board) has delegated the day to day responsibility for the valuation of the Fund's investments to the Fair Value Committee (the Committee) established by the Fund's investment adviser. In accordance with valuation policies and procedures approved by the Board, the Fund attempts to obtain prices from one or more third party pricing vendors or brokers to value its investments. When current market prices, quotations or currency exchange rates are not readily available or reliable, investments will be fair valued in good faith by the Committee, in accordance with procedures adopted by the Board. Factors used in determining fair value vary by investment type and may include market or investment specific events. The frequency with which these procedures are used cannot be predicted and they may be utilized to a significant extent. The Committee oversees the Fund's valuation policies and procedures and reports to the Board on the Committee's activities and fair value determinations. The Board monitors the appropriateness of the procedures used in valuing the Fund's investments and ratifies the fair value determinations of the Committee.
The Fund categorizes the inputs to valuation techniques used to value its investments into a disclosure hierarchy consisting of three levels as shown below:
- Level 1 – quoted prices in active markets for identical investments
- Level 2 – other significant observable inputs (including quoted prices for similar investments, interest rates, prepayment speeds, etc.)
- Level 3 – unobservable inputs (including the Fund's own assumptions based on the best information available)
Valuation techniques used to value the Fund's investments by major category are as follows:
Equity securities, including restricted securities, for which market quotations are readily available, are valued at the last reported sale price or official closing price as reported by a third party pricing vendor on the primary market or exchange on which they are traded and are categorized as Level 1 in the hierarchy. In the event there were no sales during the day or closing prices are not available, securities are valued at the last quoted bid price or may be valued using the last available price and are generally categorized as Level 2 in the hierarchy. For foreign equity securities, when market or security specific events arise, comparisons to the valuation of American Depositary Receipts (ADRs), futures contracts, Exchange-Traded Funds (ETFs) and certain indexes as well as quoted prices for similar securities may be used and would be categorized as Level 2 in the hierarchy. Utilizing these techniques may result in transfers between Level 1 and Level 2. For equity securities, including restricted securities, where observable inputs are limited, assumptions about market activity and risk are used and these securities may be categorized as Level 3 in the hierarchy.
Changes in valuation techniques may result in transfers in or out of an assigned level within the disclosure hierarchy. The aggregate value of investments by input level as of April 30, 2017, including information on transfers between Levels 1 and 2 is included at the end of the Fund's Schedule of Investments.
Foreign Currency. The Fund may use foreign currency contracts to facilitate transactions in foreign-denominated securities. Gains and losses from these transactions may arise from changes in the value of the foreign currency or if the counterparties do not perform under the contracts' terms.
Foreign-denominated assets, including investment securities, and liabilities are translated into U.S. dollars at the exchange rates at period end. Purchases and sales of investment securities, income and dividends received and expenses denominated in foreign currencies are translated into U.S. dollars at the exchange rate in effect on the transaction date.
The effects of exchange rate fluctuations on investments are included with the net realized and unrealized gain (loss) on investment securities. Other foreign currency transactions resulting in realized and unrealized gain (loss) are disclosed separately.
Investment Transactions and Income. For financial reporting purposes, the Fund's investment holdings and NAV include trades executed through the end of the last business day of the period. The NAV per share for processing shareholder transactions is calculated as of the close of business of the New York Stock Exchange (NYSE), normally 4:00 p.m. Eastern time and includes trades executed through the end of the prior business day. Gains and losses on securities sold are determined on the basis of identified cost and may include proceeds received from litigation. Dividend income is recorded on the ex-dividend date, except for certain dividends from foreign securities where the ex-dividend date may have passed, which are recorded as soon as the Fund is informed of the ex-dividend date. Non-cash dividends included in dividend income, if any, are recorded at the fair market value of the securities received. Income and capital gain distributions from Fidelity Central Funds, if any, are recorded on the ex-dividend date. Certain distributions received by the Fund represent a return of capital or capital gain. The Fund determines the components of these distributions subsequent to the ex-dividend date, based upon receipt of tax filings or other correspondence relating to the underlying investment. These distributions are recorded as a reduction of cost of investments and/or as a realized gain. Investment income is recorded net of foreign taxes withheld where recovery of such taxes is uncertain.
Class Allocations and Expenses. Investment income, realized and unrealized capital gains and losses, common expenses of the Fund, and certain fund-level expense reductions, if any, are allocated daily on a pro-rata basis to each class based on the relative net assets of each class to the total net assets of the Fund. Each class differs with respect to transfer agent and distribution and service plan fees incurred. Certain expense reductions may also differ by class. For the reporting period, the allocated portion of income and expenses to each class as a percent of its average net assets may vary due to the timing of recording these transactions in relation to fluctuating net assets of the classes. Expenses directly attributable to a fund are charged to that fund. Expenses attributable to more than one fund are allocated among the respective funds on the basis of relative net assets or other appropriate methods. Expense estimates are accrued in the period to which they relate and adjustments are made when actual amounts are known.
Income Tax Information and Distributions to Shareholders. Each year, the Fund intends to qualify as a regulated investment company under Subchapter M of the Internal Revenue Code, including distributing substantially all of its taxable income and realized gains. As a result, no provision for U.S. Federal income taxes is required. The Fund files a U.S. federal tax return, in addition to state and local tax returns as required. The Fund's federal income tax returns are subject to examination by the Internal Revenue Service (IRS) for a period of three fiscal years after they are filed. State and local tax returns may be subject to examination for an additional fiscal year depending on the jurisdiction. Foreign taxes are provided for based on the Fund's understanding of the tax rules and rates that exist in the foreign markets in which it invests. The Fund is subject to a tax imposed on capital gains by certain countries in which it invests. An estimated deferred tax liability for net unrealized appreciation on the applicable securities is included in Other payables and accrued expenses on the Statement of Assets & Liabilities.
Distributions are declared and recorded on the ex-dividend date. Income dividends and capital gain distributions are declared separately for each class. Income and capital gain distributions are determined in accordance with income tax regulations, which may differ from GAAP.
Capital accounts within the financial statements are adjusted for permanent book-tax differences. These adjustments have no impact on net assets or the results of operations. Capital accounts are not adjusted for temporary book-tax differences which will reverse in a subsequent period.
Book-tax differences are primarily due to foreign currency transactions, passive foreign investment companies (PFIC), capital loss carryforwards and losses deferred due to wash sales.
The federal tax cost of investment securities and unrealized appreciation (depreciation) as of period end were as follows:
| Gross unrealized appreciation | $336,166,927 |
| Gross unrealized depreciation | (28,887,415) |
| Net unrealized appreciation (depreciation) on securities | $307,279,512 |
| Tax cost | $1,637,362,682 |
Capital loss carryforwards are only available to offset future capital gains of the Fund to the extent provided by regulations and may be limited. Under the Regulated Investment Company Modernization Act of 2010 (the Act), the Fund is permitted to carry forward capital losses incurred in taxable years beginning after December 22, 2010 for an unlimited period and such capital losses are required to be used prior to any losses that expire. The capital loss carryforward information presented below, including any applicable limitation, is estimated as of prior fiscal period end and is subject to adjustment.
| No expiration | |
| Short-term | $(52,216,684) |
| Long-term | (20,639,087) |
| Total no expiration | $(72,855,771) |
Short-Term Trading (Redemption) Fees. Shares held by investors in the Fund less than 30 days may have been subject to a redemption fee equal to 1.00% of the NAV of shares redeemed. All redemption fees, which reduce the proceeds of the shareholder redemption, are retained by the Fund and accounted for as an addition to paid in capital. In November 2016, the Board of Trustees approved the elimination of these redemption fees effective December 12, 2016.
4. Purchases and Sales of Investments.
Purchases and sales of securities, other than short-term securities, aggregated $300,726,925 and $291,854,565, respectively.
5. Fees and Other Transactions with Affiliates.
Management Fee. Fidelity Management & Research Company (the investment adviser) and its affiliates provide the Fund with investment management related services for which the Fund pays a monthly management fee. The management fee is the sum of an individual fund fee rate that is based on an annual rate of .45% of the Fund's average net assets and an annualized group fee rate that averaged .25% during the period. The group fee rate is based upon the average net assets of all the mutual funds advised by the investment adviser, including any mutual funds previously advised by the investment adviser that are currently advised by Fidelity SelectCo, LLC, an affiliate of the investment adviser. The group fee rate decreases as assets under management increase and increases as assets under management decrease. In addition, the management fee is subject to a performance adjustment(up to a maximum of +/- .20% of the Fund's average net assets over a 36 month performance period). The upward or downward adjustment to the management fee is based on the relative investment performance of International Growth as compared to its benchmark index, the MSCI EAFE Growth Index, over the same 36 month performance period. For the reporting period, the total annualized management fee rate, including the performance adjustment, was .73% of the Fund's average net assets. The performance adjustment included in the management fee rate may be higher or lower than the maximum performance adjustment rate due to the difference between the average net assets for the reporting and performance periods.
Distribution and Service Plan Fees. In accordance with Rule 12b-1 of the 1940 Act, the Fund has adopted separate Distribution and Service Plans for each class of shares. Certain classes pay Fidelity Distributors Corporation (FDC), an affiliate of the investment adviser, separate Distribution and Service Fees, each of which is based on an annual percentage of each class' average net assets. In addition, FDC may pay financial intermediaries for selling shares of the Fund and providing shareholder support services. For the period, the Distribution and Service Fee rates, total fees and amounts retained by FDC were as follows:
| | Distribution
Fee | Service
Fee | Total Fees | Retained
by FDC |
| Class A | -% | .25% | $236,193 | $333 |
| Class M | .25% | .25% | 72,288 | 650 |
| Class C | .75% | .25% | 267,448 | 45,863 |
| | | | $575,929 | $46,846 |
Sales Load. FDC may receive a front-end sales charge of up to 5.75% for selling Class A shares and 3.50% for selling Class M shares, some of which is paid to financial intermediaries for selling shares of the Fund. Depending on the holding period, FDC may receive contingent deferred sales charges levied on Class A, Class M and Class C redemptions. The deferred sales charges range from 1.00% for Class C shares, 1.00% for certain purchases of Class A shares and .25% for certain purchases of Class M shares.
For the period, sales charge amounts retained by FDC were as follows:
| | Retained
by FDC |
| Class A | $31,559 |
| Class M | 3,906 |
| Class C(a) | 3,165 |
| | $38,630 |
(a) When Class C shares are initially sold, FDC pays commissions from its own resources to financial intermediaries through which the sales are made.
Transfer Agent Fees. Fidelity Investments Institutional Operations Company, Inc., (FIIOC), an affiliate of the investment adviser, is the transfer, dividend disbursing and shareholder servicing agent for each class of the Fund. FIIOC receives account fees and asset-based fees that vary according to the account size and type of account of the shareholders of the respective classes of the Fund, except for Class Z. FIIOC receives an asset-based fee of Class Z's average net assets.FIIOC pays for typesetting, printing and mailing of shareholder reports, except proxy statements.
For the period, transfer agent fees for each class were as follows:
| | Amount | % of
Class-Level Average
Net Assets(a) |
| Class A | $214,309 | .23 |
| Class M | 43,682 | .30 |
| Class C | 70,030 | .26 |
| International Growth | 1,083,060 | .23 |
| Class I | 364,859 | .18 |
| Class Z | 24,749 | .05 |
| | $1,800,689 | |
(a) Annualized
Accounting and Security Lending Fees. Fidelity Service Company, Inc. (FSC), an affiliate of the investment adviser, maintains the Fund's accounting records. The accounting fee is based on the level of average net assets for each month. Under a separate contract, FSC administers the security lending program. The security lending fee is based on the number and duration of lending transactions.
Brokerage Commissions. The Fund placed a portion of its portfolio transactions with brokerage firms which are affiliates of the investment adviser. Brokerage commissions are included in net realized gain (loss) and change in net unrealized appreciation (depreciation) in the Statement of Operations. The commissions paid to these affiliated firms were $903 for the period.
Interfund Lending Program. Pursuant to an Exemptive Order issued by the SEC, the Fund, along with other registered investment companies having management contracts with FMR or other affiliated entities of FMR, may participate in an interfund lending program. This program provides an alternative credit facility allowing the funds to borrow from, or lend money to, other participating affiliated funds. At period end, there were no interfund loans outstanding. The Fund's activity in this program during the period for which loans were outstanding was as follows:
| Borrower or Lender | Average Loan Balance | Weighted Average Interest Rate | Interest Expense |
| Borrower | $10,417,333 | 1.09% | $942 |
Interfund Trades. The Fund may purchase from or sell securities to other Fidelity Funds under procedures adopted by the Board. The procedures have been designed to ensure these interfund trades are executed in accordance with Rule 17a-7 of the 1940 Act. Interfund trades are included within the respective purchases and sales amounts shown in the Purchases and Sales of Investments note.
6. Committed Line of Credit.
The Fund participates with other funds managed by the investment adviser or an affiliate in a $4.25 billion credit facility (the "line of credit") to be utilized for temporary or emergency purposes to fund shareholder redemptions or for other short-term liquidity purposes. The Fund has agreed to pay commitment fees on its pro-rata portion of the line of credit, which amounted to $2,880 and is reflected in Miscellaneous expenses on the Statement of Operations. During the period, the Fund did not borrow on this line of credit.
7. Security Lending.
The Fund lends portfolio securities through a lending agent from time to time in order to earn additional income. For equity securities, a lending agent is used and may loan securities to certain qualified borrowers, including Fidelity Capital Markets (FCM), a broker-dealer affiliated with the Fund. On the settlement date of the loan, the Fund receives collateral (in the form of U.S. Treasury obligations, letters of credit and/or cash) against the loaned securities and maintains collateral in an amount not less than 100% of the market value of the loaned securities during the period of the loan. The market value of the loaned securities is determined at the close of business of the Fund and any additional required collateral is delivered to the Fund on the next business day. The Fund or borrower may terminate the loan at any time, and if the borrower defaults on its obligation to return the securities loaned because of insolvency or other reasons, the Fund may apply collateral received from the borrower against the obligation. The Fund may experience delays and costs in recovering the securities loaned. Any cash collateral received is invested in the Fidelity Securities Lending Cash Central Fund. The value of loaned securities and cash collateral at period end are disclosed on the Fund's Statement of Assets and Liabilities. Security lending income represents the income earned on investing cash collateral, less rebates paid to borrowers and any lending agent fees associated with the loan, plus any premium payments received for lending certain types of securities. Security lending income is presented in the Statement of Operations as a component of income from Fidelity Central Funds. Total security lending income during the period amounted to $213,214. During the period, there were no securities loaned to FCM.
8. Expense Reductions.
Commissions paid to certain brokers with whom the investment adviser, or its affiliates, places trades on behalf of the Fund include an amount in addition to trade execution, which may be rebated back to the Fund to offset certain expenses. This amount totaled $51,424 for the period. Through arrangements with the Fund's custodian, credits realized as a result of certain uninvested cash balances were used to reduce the Fund's expenses. During the period, these credits reduced the Fund's expenses by $73.
In addition, during the period the investment adviser reimbursed and/or waived a portion of fund-level operating expenses in the amount of $7,229.
9. Distributions to Shareholders.
Distributions to shareholders of each class were as follows:
| | Six months ended
April 30, 2017 | Year ended October 31, 2016 |
| From net investment income | | |
| Class A | $1,997,030 | $857,372 |
| Class M | 186,824 | 25,900 |
| Class C | 77,926 | – |
| International Growth | 11,653,320 | 6,508,406 |
| Class I | 4,492,180 | 1,913,593 |
| Class Z | 221,901 | 8,317 |
| Total | $18,629,181 | $9,313,588 |
| From net realized gain | | |
| Class A | $– | $137,180 |
| Class M | – | 20,720 |
| Class B | – | 561 |
| Class C | – | 39,156 |
| International Growth | – | 667,539 |
| Class I | – | 196,266 |
| Class Z | – | 708 |
| Total | $– | $1,062,130 |
10. Share Transactions.
Share transactions for each class were as follows and may contain automatic conversions between classes or exchanges between affiliated funds:
| | Shares | Shares | Dollars | Dollars |
| | Six months ended
April 30, 2017 | Year ended October 31, 2016 | Six months ended
April 30, 2017 | Year ended October 31, 2016 |
| Class A | | | | |
| Shares sold | 2,569,091 | 9,759,153 | $28,204,412 | $106,168,466 |
| Reinvestment of distributions | 187,295 | 86,347 | 1,972,221 | 970,544 |
| Shares redeemed | (11,113,473) | (5,818,948) | (123,912,979) | (63,754,387) |
| Net increase (decrease) | (8,357,087) | 4,026,552 | $(93,736,346) | $43,384,623 |
| Class M | | | | |
| Shares sold | 377,474 | 648,968 | $4,110,523 | $7,086,728 |
| Reinvestment of distributions | 17,518 | 4,067 | 184,470 | 45,714 |
| Shares redeemed | (375,469) | (635,077) | (4,127,637) | (6,841,439) |
| Net increase (decrease) | 19,523 | 17,958 | $167,356 | $291,003 |
| Class B | | | | |
| Shares sold | – | 1,881 | $– | $19,626 |
| Reinvestment of distributions | – | 50 | – | 556 |
| Shares redeemed | – | (73,599) | – | (781,848) |
| Net increase (decrease) | – | (71,668) | $– | $(761,666) |
| Class C | | | | |
| Shares sold | 631,416 | 1,353,782 | $6,910,249 | $14,583,875 |
| Reinvestment of distributions | 7,327 | 3,485 | 76,279 | 38,678 |
| Shares redeemed | (612,420) | (1,125,675) | (6,612,250) | (12,076,750) |
| Net increase (decrease) | 26,323 | 231,592 | $374,278 | $2,545,803 |
| International Growth | | | | |
| Shares sold | 15,844,330 | 31,953,739 | $175,694,906 | $351,819,134 |
| Reinvestment of distributions | 929,056 | 515,203 | 9,838,706 | 5,821,794 |
| Shares redeemed | (46,165,183) | (20,188,262) | (515,037,609) | (220,612,157) |
| Net increase (decrease) | (29,391,797) | 12,280,680 | $(329,503,997) | $137,028,771 |
| Class I | | | | |
| Shares sold | 22,964,654 | 22,905,807 | $259,720,490 | $249,584,348 |
| Reinvestment of distributions | 415,087 | 177,277 | 4,387,467 | 1,999,688 |
| Shares redeemed | (9,605,092) | (13,798,950) | (106,156,960) | (151,305,009) |
| Net increase (decrease) | 13,774,649 | 9,284,134 | $157,950,997 | $100,279,027 |
| Class Z | | | | |
| Shares sold | 30,358,998 | 1,706,835 | $343,595,779 | $18,446,844 |
| Reinvestment of distributions | 20,974 | 799 | 221,901 | 9,025 |
| Shares redeemed | (7,172,969) | (238,655) | (83,279,164) | (2,649,876) |
| Net increase (decrease) | 23,207,003 | 1,468,979 | $260,538,516 | $15,805,993 |
11. Other.
The Fund's organizational documents provide former and current trustees and officers with a limited indemnification against liabilities arising in connection with the performance of their duties to the Fund. In the normal course of business, the Fund may also enter into contracts that provide general indemnifications. The Fund's maximum exposure under these arrangements is unknown as this would be dependent on future claims that may be made against the Fund. The risk of material loss from such claims is considered remote.
Shareholder Expense Example
As a shareholder of the Fund, you incur two types of costs: (1) transaction costs, including sales charges (loads) on purchase payments or redemption proceeds, redemption fees and (2) ongoing costs, including management fees, distribution and/or service (12b-1) fees and other Fund expenses. This Example is intended to help you understand your ongoing costs (in dollars) of investing in the Fund and to compare these costs with the ongoing costs of investing in other mutual funds.
The Example is based on an investment of $1,000 invested at the beginning of the period and held for the entire period (November 1, 2016 to April 30, 2017).
Actual Expenses
The first line of the accompanying table for each class of the Fund provides information about actual account values and actual expenses. You may use the information in this line, together with the amount you invested, to estimate the expenses that you paid over the period. Simply divide your account value by $1,000.00 (for example, an $8,600 account value divided by $1,000.00 = 8.6), then multiply the result by the number in the first line for a class of the Fund under the heading entitled "Expenses Paid During Period" to estimate the expenses you paid on your account during this period. A small balance maintenance fee of $12.00 that is charged once a year may apply for certain accounts with a value of less than $2,000. This fee is not included in the table below. If it was, the estimate of expenses you paid during the period would be higher, and your ending account value lower, by this amount. In addition, the Fund, as a shareholder in the underlying Fidelity Central Funds, will indirectly bear its pro-rata share of the fees and expenses incurred by the underlying Fidelity Central Funds. These fees and expenses are not included in the Fund's annualized expense ratio used to calculate the expense estimate in the table below.
Hypothetical Example for Comparison Purposes
The second line of the accompanying table for each class of the Fund provides information about hypothetical account values and hypothetical expenses based on a Class' actual expense ratio and an assumed rate of return of 5% per year before expenses, which is not the Class' actual return. The hypothetical account values and expenses may not be used to estimate the actual ending account balance or expenses you paid for the period. You may use this information to compare the ongoing costs of investing in the Fund and other funds. To do so, compare this 5% hypothetical example with the 5% hypothetical examples that appear in the shareholder reports of the other funds. A small balance maintenance fee of $12.00 that is charged once a year may apply for certain accounts with a value of less than $2,000. This fee is not included in the table below. If it was, the estimate of expenses you paid during the period would be higher, and your ending account value lower, by this amount. In addition, the Fund, as a shareholder in the underlying Fidelity Central Funds, will indirectly bear its pro-rata share of the fees and expenses incurred by the underlying Fidelity Central Funds. These fees and expenses are not included in the Fund's annualized expense ratio used to calculate the expense estimate in the table below.
Please note that the expenses shown in the table are meant to highlight your ongoing costs only and do not reflect any transaction costs. Therefore, the second line of the table is useful in comparing ongoing costs only, and will not help you determine the relative total costs of owning different funds. In addition, if these transactional costs were included, your costs would have been higher.
| | Annualized Expense Ratio-A | Beginning
Account Value
November 1, 2016 | Ending
Account Value
April 30, 2017 | Expenses Paid
During Period-B
November 1, 2016
to April 30, 2017 |
| Class A | 1.28% | | | |
| Actual | | $1,000.00 | $1,119.20 | $6.73 |
| Hypothetical-C | | $1,000.00 | $1,018.45 | $6.41 |
| Class M | 1.61% | | | |
| Actual | | $1,000.00 | $1,118.10 | $8.46 |
| Hypothetical-C | | $1,000.00 | $1,016.81 | $8.05 |
| Class C | 2.07% | | | |
| Actual | | $1,000.00 | $1,115.10 | $10.86 |
| Hypothetical-C | | $1,000.00 | $1,014.53 | $10.34 |
| International Growth | 1.04% | | | |
| Actual | | $1,000.00 | $1,120.40 | $5.47 |
| Hypothetical-C | | $1,000.00 | $1,019.64 | $5.21 |
| Class I | .98% | | | |
| Actual | | $1,000.00 | $1,121.10 | $5.15 |
| Hypothetical-C | | $1,000.00 | $1,019.93 | $4.91 |
| Class Z | .85% | | | |
| Actual | | $1,000.00 | $1,121.30 | $4.47 |
| Hypothetical-C | | $1,000.00 | $1,020.58 | $4.26 |
A Annualized expense ratio reflects expenses net of applicable fee waivers.
B Expenses are equal to each Class' annualized expense ratio, multiplied by the average account value over the period, multiplied by 181/365 (to reflect the one-half year period).
C 5% return per year before expenses
Corporate Headquarters
245 Summer St.
Boston, MA 02210
www.fidelity.com
IGF-SANN-0617
1.912353.107
Fidelity Advisor® International Value Fund -
Class A, Class M (formerly Class T), Class C and Class I
Semi-Annual Report April 30, 2017 Class A, Class M, Class C and Class I are classes of Fidelity® International Value Fund |
|
Contents
To view a fund's proxy voting guidelines and proxy voting record for the 12-month period ended June 30, visit http://www.fidelity.com/proxyvotingresults or visit the Securities and Exchange Commission's (SEC) web site at http://www.sec.gov.
You may also call 1-877-208-0098 to request a free copy of the proxy voting guidelines.
Standard & Poor's, S&P and S&P 500 are registered service marks of The McGraw-Hill Companies, Inc. and have been licensed for use by Fidelity Distributors Corporation.
Other third-party marks appearing herein are the property of their respective owners.
All other marks appearing herein are registered or unregistered trademarks or service marks of FMR LLC or an affiliated company. © 2017 FMR LLC. All rights reserved.
This report and the financial statements contained herein are submitted for the general information of the shareholders of the Fund. This report is not authorized for distribution to prospective investors in the Fund unless preceded or accompanied by an effective prospectus.
A fund files its complete schedule of portfolio holdings with the SEC for the first and third quarters of each fiscal year on Form N-Q. Forms N-Q are available on the SEC’s web site at http://www.sec.gov. A fund's Forms N-Q may be reviewed and copied at the SEC’s Public Reference Room in Washington, DC. Information regarding the operation of the SEC's Public Reference Room may be obtained by calling 1-800-SEC-0330.
For a complete list of a fund's portfolio holdings, view the most recent holdings listing, semiannual report, or annual report on Fidelity's web site at http://www.fidelity.com, http://www.institutional.fidelity.com, or http://www.401k.com, as applicable.
NOT FDIC INSURED •MAY LOSE VALUE •NO BANK GUARANTEE
Neither the Fund nor Fidelity Distributors Corporation is a bank.
Investment Summary (Unaudited)
Geographic Diversification (% of fund's net assets)
| As of April 30, 2017 |
| | Japan | 22.6% |
| | United Kingdom | 17.2% |
| | France | 15.3% |
| | Germany | 7.4% |
| | Switzerland | 7.0% |
| | Australia | 5.7% |
| | Spain | 4.2% |
| | United States of America* | 4.1% |
| | Netherlands | 3.8% |
| | Other | 12.7% |

| As of October 31, 2016 |
| | Japan | 21.8% |
| | United Kingdom | 21.0% |
| | France | 14.4% |
| | Switzerland | 7.5% |
| | Germany | 6.3% |
| | Australia | 4.5% |
| | United States of America* | 4.4% |
| | Netherlands | 3.8% |
| | Spain | 3.4% |
| | Other | 12.9% |

* Includes Short-Term investments and Net Other Assets (Liabilities).
Percentages are based on country or territory of incorporation and are adjusted for the effect of futures contracts, if applicable.
Asset Allocation as of April 30, 2017
| | % of fund's net assets | % of fund's net assets 6 months ago |
| Stocks | 98.9 | 99.0 |
| Short-Term Investments and Net Other Assets (Liabilities) | 1.1 | 1.0 |
Top Ten Stocks as of April 30, 2017
| | % of fund's net assets | % of fund's net assets 6 months ago |
| Total SA (France, Oil, Gas & Consumable Fuels) | 3.0 | 3.0 |
| Mitsubishi UFJ Financial Group, Inc. (Japan, Banks) | 2.5 | 2.4 |
| Toyota Motor Corp. (Japan, Automobiles) | 2.2 | 3.1 |
| Westpac Banking Corp. (Australia, Banks) | 2.2 | 2.2 |
| Sanofi SA (France, Pharmaceuticals) | 2.0 | 1.8 |
| BP PLC (United Kingdom, Oil, Gas & Consumable Fuels) | 1.9 | 1.9 |
| Australia & New Zealand Banking Group Ltd. (Australia, Banks) | 1.7 | 0.0 |
| Lloyds Banking Group PLC (United Kingdom, Banks) | 1.7 | 1.1 |
| BASF AG (Germany, Chemicals) | 1.7 | 2.1 |
| UBS Group AG (Switzerland, Capital Markets) | 1.6 | 1.2 |
| | 20.5 | |
Top Market Sectors as of April 30, 2017
| | % of fund's net assets | % of fund's net assets 6 months ago |
| Financials | 36.5 | 29.2 |
| Industrials | 13.4 | 11.5 |
| Health Care | 9.6 | 10.9 |
| Consumer Discretionary | 8.5 | 10.5 |
| Materials | 7.7 | 8.8 |
| Energy | 7.4 | 8.2 |
| Information Technology | 5.2 | 4.9 |
| Consumer Staples | 4.8 | 6.3 |
| Telecommunication Services | 3.4 | 4.5 |
| Utilities | 1.8 | 3.3 |
Percentages shown as 0.0% may reflect amounts less than 0.05%.
Investments April 30, 2017 (Unaudited)
Showing Percentage of Net Assets
| Common Stocks - 98.4% | | | |
| | | Shares | Value |
| Australia - 5.7% | | | |
| Australia & New Zealand Banking Group Ltd. | | 243,375 | $5,970,156 |
| Insurance Australia Group Ltd. | | 513,326 | 2,386,991 |
| Macquarie Group Ltd. | | 36,371 | 2,532,818 |
| Magellan Financial Group Ltd. | | 72,957 | 1,288,180 |
| Westpac Banking Corp. | | 289,915 | 7,600,056 |
|
| TOTAL AUSTRALIA | | | 19,778,201 |
|
| Bailiwick of Jersey - 0.7% | | | |
| Wolseley PLC | | 39,492 | 2,509,999 |
| Belgium - 1.4% | | | |
| KBC Groep NV | | 67,347 | 4,862,373 |
| Canada - 0.8% | | | |
| Imperial Oil Ltd. | | 45,300 | 1,317,800 |
| Potash Corp. of Saskatchewan, Inc. | | 85,600 | 1,443,546 |
|
| TOTAL CANADA | | | 2,761,346 |
|
| Finland - 1.1% | | | |
| Sampo Oyj (A Shares) (a) | | 77,234 | 3,700,923 |
| France - 15.3% | | | |
| Atos Origin SA | | 36,612 | 4,797,739 |
| AXA SA (a) | | 181,621 | 4,845,676 |
| Bouygues SA (a) | | 34,816 | 1,463,718 |
| Capgemini SA | | 27,393 | 2,742,642 |
| Compagnie de St. Gobain | | 59,400 | 3,206,104 |
| Havas SA | | 220,503 | 2,039,006 |
| Natixis SA | | 272,800 | 1,897,968 |
| Sanofi SA | | 72,108 | 6,813,762 |
| Societe Generale Series A | | 94,700 | 5,192,659 |
| SR Teleperformance SA | | 20,600 | 2,588,406 |
| Total SA | | 200,862 | 10,310,892 |
| VINCI SA (a) | | 56,500 | 4,815,980 |
| Vivendi SA | | 123,792 | 2,456,231 |
|
| TOTAL FRANCE | | | 53,170,783 |
|
| Germany - 7.4% | | | |
| Axel Springer Verlag AG | | 28,500 | 1,599,131 |
| BASF AG | | 59,654 | 5,813,209 |
| Brenntag AG | | 27,200 | 1,613,001 |
| Deutsche Telekom AG | | 282,200 | 4,950,014 |
| Fresenius SE & Co. KGaA | | 33,800 | 2,739,653 |
| HeidelbergCement Finance AG | | 26,600 | 2,462,907 |
| Linde AG | | 7,900 | 1,419,472 |
| SAP AG | | 29,570 | 2,961,910 |
| Vonovia SE | | 61,000 | 2,208,376 |
|
| TOTAL GERMANY | | | 25,767,673 |
|
| Hong Kong - 0.9% | | | |
| AIA Group Ltd. | | 184,000 | 1,273,843 |
| Power Assets Holdings Ltd. | | 192,000 | 1,727,873 |
|
| TOTAL HONG KONG | | | 3,001,716 |
|
| Indonesia - 0.4% | | | |
| PT Bank Rakyat Indonesia Tbk | | 1,406,500 | 1,361,231 |
| Ireland - 1.5% | | | |
| Allergan PLC | | 6,280 | 1,531,441 |
| CRH PLC | | 52,671 | 1,918,494 |
| Medtronic PLC | | 23,000 | 1,911,070 |
|
| TOTAL IRELAND | | | 5,361,005 |
|
| Israel - 0.4% | | | |
| Teva Pharmaceutical Industries Ltd. sponsored ADR | | 45,999 | 1,452,648 |
| Italy - 1.0% | | | |
| Intesa Sanpaolo SpA | | 1,173,100 | 3,424,399 |
| Japan - 22.6% | | | |
| AEON Financial Service Co. Ltd. | | 72,600 | 1,394,363 |
| Astellas Pharma, Inc. | | 105,500 | 1,391,240 |
| Dentsu, Inc. | | 19,600 | 1,104,176 |
| East Japan Railway Co. | | 17,800 | 1,589,425 |
| Hoya Corp. | | 64,900 | 3,099,597 |
| Itochu Corp. | | 246,800 | 3,489,184 |
| Japan Tobacco, Inc. | | 26,400 | 877,671 |
| Kao Corp. | | 34,700 | 1,913,753 |
| KDDI Corp. | | 150,400 | 3,987,717 |
| Komatsu Ltd. | | 111,300 | 2,974,108 |
| Makita Corp. | | 65,600 | 2,339,179 |
| Mitsubishi UFJ Financial Group, Inc. | | 1,356,700 | 8,596,860 |
| Nintendo Co. Ltd. | | 4,400 | 1,113,489 |
| Nippon Telegraph & Telephone Corp. | | 71,300 | 3,055,608 |
| Nomura Holdings, Inc. | | 440,000 | 2,644,237 |
| OBIC Co. Ltd. | | 42,600 | 2,300,534 |
| Olympus Corp. | | 66,000 | 2,539,942 |
| ORIX Corp. | | 229,100 | 3,495,843 |
| Panasonic Corp. | | 153,900 | 1,840,375 |
| Recruit Holdings Co. Ltd. | | 51,200 | 2,585,835 |
| Seven & i Holdings Co. Ltd. | | 57,800 | 2,442,144 |
| Shin-Etsu Chemical Co. Ltd. | | 34,100 | 2,962,318 |
| Shinsei Bank Ltd. | | 948,000 | 1,768,863 |
| Sony Corp. | | 89,900 | 3,084,860 |
| Sony Financial Holdings, Inc. | | 123,000 | 2,043,472 |
| Subaru Corp. | | 49,600 | 1,874,099 |
| Taiheiyo Cement Corp. | | 427,000 | 1,421,099 |
| Tokio Marine Holdings, Inc. | | 71,900 | 3,026,282 |
| Toyota Motor Corp. | | 144,000 | 7,793,394 |
|
| TOTAL JAPAN | | | 78,749,667 |
|
| Netherlands - 3.8% | | | |
| Akzo Nobel NV (a) | | 12,823 | 1,121,359 |
| ING Groep NV (Certificaten Van Aandelen) | | 344,290 | 5,611,769 |
| PostNL NV (a) | | 173,631 | 860,003 |
| RELX NV | | 177,227 | 3,427,663 |
| Wolters Kluwer NV | | 49,333 | 2,095,262 |
|
| TOTAL NETHERLANDS | | | 13,116,056 |
|
| Norway - 0.9% | | | |
| Statoil ASA (a) | | 193,419 | 3,185,397 |
| Spain - 3.7% | | | |
| Banco Santander SA (Spain) | | 743,100 | 4,846,230 |
| CaixaBank SA | | 757,997 | 3,441,642 |
| Iberdrola SA | | 653,088 | 4,696,721 |
|
| TOTAL SPAIN | | | 12,984,593 |
|
| Sweden - 3.6% | | | |
| Investor AB (B Shares) | | 67,551 | 3,088,006 |
| Nordea Bank AB | | 443,800 | 5,461,506 |
| Swedbank AB (A Shares) | | 117,842 | 2,792,616 |
| Telefonaktiebolaget LM Ericsson (B Shares) | | 155,300 | 1,008,958 |
|
| TOTAL SWEDEN | | | 12,351,086 |
|
| Switzerland - 7.0% | | | |
| ABB Ltd. (Reg.) | | 152,660 | 3,740,821 |
| Credit Suisse Group AG | | 101,487 | 1,547,775 |
| Lafargeholcim Ltd. (Reg.) | | 40,520 | 2,296,812 |
| Nestle SA (Reg. S) | | 28,149 | 2,168,050 |
| Novartis AG | | 56,169 | 4,324,175 |
| UBS Group AG | | 329,958 | 5,612,586 |
| Zurich Insurance Group AG | | 17,430 | 4,823,551 |
|
| TOTAL SWITZERLAND | | | 24,513,770 |
|
| United Kingdom - 17.2% | | | |
| AstraZeneca PLC (United Kingdom) | | 80,729 | 4,834,814 |
| Aviva PLC | | 716,341 | 4,871,416 |
| BAE Systems PLC | | 479,829 | 3,897,160 |
| BHP Billiton PLC | | 106,347 | 1,621,282 |
| BP PLC | | 1,132,482 | 6,483,024 |
| British American Tobacco PLC (United Kingdom) | | 36,400 | 2,459,307 |
| Bunzl PLC | | 103,266 | 3,220,703 |
| Compass Group PLC | | 170,939 | 3,451,397 |
| HSBC Holdings PLC sponsored ADR (a) | | 77,043 | 3,171,860 |
| Imperial Tobacco Group PLC | | 63,922 | 3,131,185 |
| Informa PLC | | 350,099 | 2,911,138 |
| ITV PLC | | 626,296 | 1,703,475 |
| Lloyds Banking Group PLC | | 6,617,300 | 5,945,821 |
| Micro Focus International PLC | | 89,200 | 2,989,964 |
| Rio Tinto PLC | | 107,160 | 4,227,487 |
| Royal Dutch Shell PLC Class B (United Kingdom) | | 55,823 | 1,485,281 |
| Standard Chartered PLC (United Kingdom) (b) | | 371,475 | 3,469,941 |
|
| TOTAL UNITED KINGDOM | | | 59,875,255 |
|
| United States of America - 3.0% | | | |
| Amgen, Inc. | | 7,700 | 1,257,564 |
| ConocoPhillips Co. | | 59,800 | 2,865,018 |
| Constellation Brands, Inc. Class A (sub. vtg.) | | 8,400 | 1,449,336 |
| Edgewell Personal Care Co. (b) | | 12,500 | 893,625 |
| Molson Coors Brewing Co. Class B | | 17,000 | 1,630,130 |
| S&P Global, Inc. | | 18,400 | 2,469,096 |
|
| TOTAL UNITED STATES OF AMERICA | | | 10,564,769 |
|
| TOTAL COMMON STOCKS | | | |
| (Cost $332,235,193) | | | 342,492,890 |
|
| Nonconvertible Preferred Stocks - 0.5% | | | |
| Spain - 0.5% | | | |
| Grifols SA Class B | | | |
| (Cost $1,455,226) | | 93,000 | 1,985,070 |
|
| Money Market Funds - 7.1% | | | |
| Fidelity Cash Central Fund, 0.85% (c) | | 1,416,079 | 1,416,362 |
| Fidelity Securities Lending Cash Central Fund 0.86% (c)(d) | | 23,197,646 | 23,199,966 |
| TOTAL MONEY MARKET FUNDS | | | |
| (Cost $24,616,581) | | | 24,616,328 |
| TOTAL INVESTMENT PORTFOLIO - 106.0% | | | |
| (Cost $358,307,000) | | | 369,094,288 |
| NET OTHER ASSETS (LIABILITIES) - (6.0)% | | | (20,966,081) |
| NET ASSETS - 100% | | | $348,128,207 |
Categorizations in the Schedule of Investments are based on country or territory of incorporation.
Legend
(a) Security or a portion of the security is on loan at period end.
(b) Non-income producing
(c) Affiliated fund that is generally available only to investment companies and other accounts managed by Fidelity Investments. The rate quoted is the annualized seven-day yield of the fund at period end. A complete unaudited listing of the fund's holdings as of its most recent quarter end is available upon request. In addition, each Fidelity Central Fund's financial statements are available on the SEC's website or upon request.
(d) Investment made with cash collateral received from securities on loan.
Affiliated Central Funds
Information regarding fiscal year to date income earned by the Fund from investments in Fidelity Central Funds is as follows:
| Fund | Income earned |
| Fidelity Cash Central Fund | $5,267 |
| Fidelity Securities Lending Cash Central Fund | 84,398 |
| Total | $89,665 |
Investment Valuation
The following is a summary of the inputs used, as of April 30, 2017, involving the Fund's assets and liabilities carried at fair value. The inputs or methodology used for valuing securities may not be an indication of the risk associated with investing in those securities. For more information on valuation inputs, and their aggregation into the levels used below, please refer to the Investment Valuation section in the accompanying Notes to Financial Statements.
| | Valuation Inputs at Reporting Date: |
| Description | Total | Level 1 | Level 2 | Level 3 |
| Investments in Securities: | | | | |
| Equities: | | | | |
| Consumer Discretionary | $29,857,282 | $13,687,256 | $16,170,026 | $-- |
| Consumer Staples | 16,965,201 | 12,337,844 | 4,627,357 | -- |
| Energy | 25,647,412 | 4,182,818 | 21,464,594 | -- |
| Financials | 126,461,008 | 67,915,147 | 58,545,861 | -- |
| Health Care | 33,880,976 | 16,516,985 | 17,363,991 | -- |
| Industrials | 46,416,551 | 28,478,483 | 17,938,068 | -- |
| Information Technology | 17,915,236 | 10,088,237 | 7,826,999 | -- |
| Materials | 26,707,985 | 18,940,722 | 7,767,263 | -- |
| Real Estate | 2,208,376 | 2,208,376 | -- | -- |
| Telecommunication Services | 11,993,339 | -- | 11,993,339 | -- |
| Utilities | 6,424,594 | 6,424,594 | -- | -- |
| Money Market Funds | 24,616,328 | 24,616,328 | -- | -- |
| Total Investments in Securities: | $369,094,288 | $205,396,790 | $163,697,498 | $-- |
The following is a summary of transfers between Level 1 and Level 2 for the period ended April 30, 2017. Transfers are assumed to have occurred at the beginning of the period, and are primarily attributable to the valuation techniques used for foreign equity securities, as discussed in the accompanying Notes to Financial Statements:
| Transfers | Total |
| Level 1 to Level 2 | $14,996,093 |
| Level 2 to Level 1 | $12,734,748 |
See accompanying notes which are an integral part of the financial statements.
Financial Statements
Statement of Assets and Liabilities
| | | April 30, 2017 (Unaudited) |
| Assets | | |
Investment in securities, at value (including securities loaned of $21,871,853) — See accompanying schedule:
Unaffiliated issuers (cost $333,690,419) | $344,477,960 | |
| Fidelity Central Funds (cost $24,616,581) | 24,616,328 | |
| Total Investments (cost $358,307,000) | | $369,094,288 |
| Cash | | 79,541 |
| Foreign currency held at value (cost $2) | | 43 |
| Receivable for investments sold | | 740,762 |
| Receivable for fund shares sold | | 96,454 |
| Dividends receivable | | 2,265,171 |
| Distributions receivable from Fidelity Central Funds | | 30,800 |
| Prepaid expenses | | 211 |
| Other receivables | | 15,758 |
| Total assets | | 372,323,028 |
| Liabilities | | |
| Payable for investments purchased | $559,911 | |
| Payable for fund shares redeemed | 126,078 | |
| Accrued management fee | 199,004 | |
| Distribution and service plan fees payable | 6,626 | |
| Other affiliated payables | 61,947 | |
| Other payables and accrued expenses | 40,080 | |
| Collateral on securities loaned | 23,201,175 | |
| Total liabilities | | 24,194,821 |
| Net Assets | | $348,128,207 |
| Net Assets consist of: | | |
| Paid in capital | | $442,314,742 |
| Undistributed net investment income | | 3,083,094 |
| Accumulated undistributed net realized gain (loss) on investments and foreign currency transactions | | (108,055,851) |
| Net unrealized appreciation (depreciation) on investments and assets and liabilities in foreign currencies | | 10,786,222 |
| Net Assets | | $348,128,207 |
| Calculation of Maximum Offering Price | | |
| Class A: | | |
| Net Asset Value and redemption price per share ($7,147,115 ÷ 853,097 shares) | | $8.38 |
| Maximum offering price per share (100/94.25 of $8.38) | | $8.89 |
| Class M: | | |
| Net Asset Value and redemption price per share ($3,768,065 ÷ 449,988 shares) | | $8.37 |
| Maximum offering price per share (100/96.50 of $8.37) | | $8.67 |
| Class C: | | |
| Net Asset Value and offering price per share ($4,508,681 ÷ 538,636 shares)(a) | | $8.37 |
| International Value: | | |
| Net Asset Value, offering price and redemption price per share ($328,731,963 ÷ 39,262,758 shares) | | $8.37 |
| Class I: | | |
| Net Asset Value, offering price and redemption price per share ($3,972,383 ÷ 473,703 shares) | | $8.39 |
(a) Redemption price per share is equal to net asset value less any applicable contingent deferred sales charge.
See accompanying notes which are an integral part of the financial statements.
Statement of Operations
| | | Six months ended April 30, 2017 (Unaudited) |
| Investment Income | | |
| Dividends | | $5,735,107 |
| Income from Fidelity Central Funds | | 89,665 |
| Income before foreign taxes withheld | | 5,824,772 |
| Less foreign taxes withheld | | (436,028) |
| Total income | | 5,388,744 |
| Expenses | | |
| Management fee | | |
| Basic fee | $1,149,903 | |
| Performance adjustment | (19,845) | |
| Transfer agent fees | 281,672 | |
| Distribution and service plan fees | 39,868 | |
| Accounting and security lending fees | 85,913 | |
| Custodian fees and expenses | 44,362 | |
| Independent trustees' fees and expenses | 668 | |
| Registration fees | 68,696 | |
| Audit | 33,941 | |
| Legal | 2,075 | |
| Miscellaneous | 1,280 | |
| Total expenses before reductions | 1,688,533 | |
| Expense reductions | (24,627) | 1,663,906 |
| Net investment income (loss) | | 3,724,838 |
| Realized and Unrealized Gain (Loss) | | |
| Net realized gain (loss) on: | | |
| Investment securities: | | |
| Unaffiliated issuers | (360,930) | |
| Fidelity Central Funds | (1,186) | |
| Foreign currency transactions | (96,383) | |
| Total net realized gain (loss) | | (458,499) |
Change in net unrealized appreciation (depreciation) on:
Investment securities | 29,464,934 | |
| Assets and liabilities in foreign currencies | 43,937 | |
| Total change in net unrealized appreciation (depreciation) | | 29,508,871 |
| Net gain (loss) | | 29,050,372 |
| Net increase (decrease) in net assets resulting from operations | | $32,775,210 |
See accompanying notes which are an integral part of the financial statements.
Statement of Changes in Net Assets
| | Six months ended April 30, 2017 (Unaudited) | Year ended October 31, 2016 |
| Increase (Decrease) in Net Assets | | |
| Operations | | |
| Net investment income (loss) | $3,724,838 | $7,988,662 |
| Net realized gain (loss) | (458,499) | (3,305,724) |
| Change in net unrealized appreciation (depreciation) | 29,508,871 | (18,037,363) |
| Net increase (decrease) in net assets resulting from operations | 32,775,210 | (13,354,425) |
| Distributions to shareholders from net investment income | (8,124,122) | (4,084,383) |
| Distributions to shareholders from net realized gain | (457,331) | – |
| Total distributions | (8,581,453) | (4,084,383) |
| Share transactions - net increase (decrease) | (2,808,549) | 56,799,318 |
| Redemption fees | 342 | 637 |
| Total increase (decrease) in net assets | 21,385,550 | 39,361,147 |
| Net Assets | | |
| Beginning of period | 326,742,657 | 287,381,510 |
| End of period | $348,128,207 | $326,742,657 |
| Other Information | | |
| Undistributed net investment income end of period | $3,083,094 | $7,482,378 |
See accompanying notes which are an integral part of the financial statements.
Financial Highlights — Fidelity International Value Fund Class A
| | Six months ended (Unaudited) April 30, | Years ended October 31, | | | | |
| | 2017 | 2016 | 2015 | 2014 | 2013 | 2012 |
| Selected Per–Share Data | | | | | | |
| Net asset value, beginning of period | $7.78 | $8.27 | $8.62 | $8.96 | $7.39 | $7.02 |
| Income from Investment Operations | | | | | | |
| Net investment income (loss)A | .08 | .17 | .13 | .31B | .17 | .20 |
| Net realized and unrealized gain (loss) | .70 | (.57) | (.20) | (.47) | 1.64 | .39 |
| Total from investment operations | .78 | (.40) | (.07) | (.16) | 1.81 | .59 |
| Distributions from net investment income | (.17) | (.09) | (.28) | (.17) | (.20) | (.22) |
| Distributions from net realized gain | (.01) | – | – | (.01) | (.04) | – |
| Total distributions | (.18) | (.09) | (.28) | (.18) | (.24) | (.22) |
| Redemption fees added to paid in capitalA,C | – | – | – | – | – | – |
| Net asset value, end of period | $8.38 | $7.78 | $8.27 | $8.62 | $8.96 | $7.39 |
| Total ReturnD,E,F | 10.16% | (4.91)% | (.81)% | (1.76)% | 25.24% | 8.82% |
| Ratios to Average Net AssetsG,H | | | | | | |
| Expenses before reductions | 1.36%I | 1.40% | 1.37% | 1.32% | 1.39% | 1.44% |
| Expenses net of fee waivers, if any | 1.35%I | 1.40% | 1.37% | 1.32% | 1.39% | 1.44% |
| Expenses net of all reductions | 1.34%I | 1.39% | 1.36% | 1.32% | 1.36% | 1.41% |
| Net investment income (loss) | 1.92%I | 2.19% | 1.58% | 3.44%B | 2.08% | 2.85% |
| Supplemental Data | | | | | | |
| Net assets, end of period (000 omitted) | $7,147 | $7,717 | $8,956 | $6,296 | $6,191 | $4,491 |
| Portfolio turnover rateJ | 52%I | 47% | 44% | 69% | 79% | 74% |
A Calculated based on average shares outstanding during the period.
B Net Investment income per share reflects a large, non-recurring dividend which amounted to $.14 per share. Excluding this non-recurring dividend, the ratio of net investment income (loss) to average net assets would have been 1.90%.
C Amount represents less than $.005 per share.
D Total returns for periods of less than one year are not annualized.
E Total returns would have been lower if certain expenses had not been reduced during the applicable periods shown.
F Total returns do not include the effect of the sales charges.
G Fees and expenses of any underlying Fidelity Central Funds are not included in the Fund's expense ratio. The Fund indirectly bears its proportionate share of the expenses of any underlying Fidelity Central Funds.
H Expense ratios reflect operating expenses of the class. Expenses before reductions do not reflect amounts reimbursed by the investment adviser or reductions from brokerage service arrangements or reductions from other expense offset arrangements and do not represent the amount paid by the class during periods when reimbursements or reductions occur. Expenses net of fee waivers reflect expenses after reimbursement by the investment adviser but prior to reductions from brokerage service arrangements or other expense offset arrangements. Expenses net of all reductions represent the net expenses paid by the class.
I Annualized
J Amount does not include the portfolio activity of any underlying Fidelity Central Funds.
See accompanying notes which are an integral part of the financial statements.
Financial Highlights — Fidelity International Value Fund Class M
| | Six months ended (Unaudited) April 30, | Years ended October 31, | | | | |
| | 2017 | 2016 | 2015 | 2014 | 2013 | 2012 |
| Selected Per–Share Data | | | | | | |
| Net asset value, beginning of period | $7.76 | $8.25 | $8.60 | $8.94 | $7.38 | $7.00 |
| Income from Investment Operations | | | | | | |
| Net investment income (loss)A | .06 | .15 | .11 | .28B | .15 | .18 |
| Net realized and unrealized gain (loss) | .70 | (.58) | (.20) | (.46) | 1.64 | .40 |
| Total from investment operations | .76 | (.43) | (.09) | (.18) | 1.79 | .58 |
| Distributions from net investment income | (.14) | (.06) | (.26) | (.15) | (.19) | (.20) |
| Distributions from net realized gain | (.01) | – | – | (.01) | (.04) | – |
| Total distributions | (.15) | (.06) | (.26) | (.16) | (.23) | (.20) |
| Redemption fees added to paid in capitalA,C | – | – | – | – | – | – |
| Net asset value, end of period | $8.37 | $7.76 | $8.25 | $8.60 | $8.94 | $7.38 |
| Total ReturnD,E,F | 9.98% | (5.24)% | (1.09)% | (1.99)% | 24.86% | 8.60% |
| Ratios to Average Net AssetsG,H | | | | | | |
| Expenses before reductions | 1.66%I | 1.70% | 1.66% | 1.59% | 1.66% | 1.71% |
| Expenses net of fee waivers, if any | 1.66%I | 1.70% | 1.66% | 1.59% | 1.65% | 1.70% |
| Expenses net of all reductions | 1.64%I | 1.69% | 1.65% | 1.59% | 1.63% | 1.67% |
| Net investment income (loss) | 1.62%I | 1.89% | 1.29% | 3.17%B | 1.81% | 2.58% |
| Supplemental Data | | | | | | |
| Net assets, end of period (000 omitted) | $3,768 | $3,703 | $4,086 | $3,604 | $3,758 | $2,693 |
| Portfolio turnover rateJ | 52%I | 47% | 44% | 69% | 79% | 74% |
A Calculated based on average shares outstanding during the period.
B Net Investment income per share reflects a large, non-recurring dividend which amounted to $.14 per share. Excluding this non-recurring dividend, the ratio of net investment income (loss) to average net assets would have been 1.64%.
C Amount represents less than $.005 per share.
D Total returns for periods of less than one year are not annualized.
E Total returns would have been lower if certain expenses had not been reduced during the applicable periods shown.
F Total returns do not include the effect of the sales charges.
G Fees and expenses of any underlying Fidelity Central Funds are not included in the Fund's expense ratio. The Fund indirectly bears its proportionate share of the expenses of any underlying Fidelity Central Funds.
H Expense ratios reflect operating expenses of the class. Expenses before reductions do not reflect amounts reimbursed by the investment adviser or reductions from brokerage service arrangements or reductions from other expense offset arrangements and do not represent the amount paid by the class during periods when reimbursements or reductions occur. Expenses net of fee waivers reflect expenses after reimbursement by the investment adviser but prior to reductions from brokerage service arrangements or other expense offset arrangements. Expenses net of all reductions represent the net expenses paid by the class.
I Annualized
J Amount does not include the portfolio activity of any underlying Fidelity Central Funds.
See accompanying notes which are an integral part of the financial statements.
Financial Highlights — Fidelity International Value Fund Class C
| | Six months ended (Unaudited) April 30, | Years ended October 31, | | | | |
| | 2017 | 2016 | 2015 | 2014 | 2013 | 2012 |
| Selected Per–Share Data | | | | | | |
| Net asset value, beginning of period | $7.75 | $8.23 | $8.59 | $8.93 | $7.38 | $7.00 |
| Income from Investment Operations | | | | | | |
| Net investment income (loss)A | .05 | .11 | .07 | .24B | .11 | .14 |
| Net realized and unrealized gain (loss) | .69 | (.57) | (.20) | (.45) | 1.63 | .41 |
| Total from investment operations | .74 | (.46) | (.13) | (.21) | 1.74 | .55 |
| Distributions from net investment income | (.11) | (.02) | (.23) | (.11) | (.15) | (.17) |
| Distributions from net realized gain | (.01) | – | – | (.01) | (.04) | – |
| Total distributions | (.12) | (.02) | (.23) | (.13)C | (.19) | (.17) |
| Redemption fees added to paid in capitalA,D | – | – | – | – | – | – |
| Net asset value, end of period | $8.37 | $7.75 | $8.23 | $8.59 | $8.93 | $7.38 |
| Total ReturnE,F,G | 9.63% | (5.61)% | (1.58)% | (2.43)% | 24.17% | 8.12% |
| Ratios to Average Net AssetsH,I | | | | | | |
| Expenses before reductions | 2.13%J | 2.17% | 2.15% | 2.07% | 2.14% | 2.19% |
| Expenses net of fee waivers, if any | 2.13%J | 2.17% | 2.14% | 2.07% | 2.14% | 2.19% |
| Expenses net of all reductions | 2.12%J | 2.17% | 2.14% | 2.07% | 2.11% | 2.16% |
| Net investment income (loss) | 1.15%J | 1.42% | .81% | 2.69%B | 1.33% | 2.09% |
| Supplemental Data | | | | | | |
| Net assets, end of period (000 omitted) | $4,509 | $4,168 | $4,502 | $3,647 | $3,231 | $2,249 |
| Portfolio turnover rateK | 52%J | 47% | 44% | 69% | 79% | 74% |
A Calculated based on average shares outstanding during the period.
B Net Investment income per share reflects a large, non-recurring dividend which amounted to $.14 per share. Excluding this non-recurring dividend, the ratio of net investment income (loss) to average net assets would have been 1.15%.
C Total distributions of $.13 per share is comprised of distributions from net investment income of $.111 and distributions from net realized gain of $.014 per share.
D Amount represents less than $.005 per share.
E Total returns for periods of less than one year are not annualized.
F Total returns would have been lower if certain expenses had not been reduced during the applicable periods shown.
G Total returns do not include the effect of the contingent deferred sales charge.
H Fees and expenses of any underlying Fidelity Central Funds are not included in the Fund's expense ratio. The Fund indirectly bears its proportionate share of the expenses of any underlying Fidelity Central Funds.
I Expense ratios reflect operating expenses of the class. Expenses before reductions do not reflect amounts reimbursed by the investment adviser or reductions from brokerage service arrangements or reductions from other expense offset arrangements and do not represent the amount paid by the class during periods when reimbursements or reductions occur. Expenses net of fee waivers reflect expenses after reimbursement by the investment adviser but prior to reductions from brokerage service arrangements or other expense offset arrangements. Expenses net of all reductions represent the net expenses paid by the class.
J Annualized
K Amount does not include the portfolio activity of any underlying Fidelity Central Funds.
See accompanying notes which are an integral part of the financial statements.
Financial Highlights — Fidelity International Value Fund
| | Six months ended (Unaudited) April 30, | Years ended October 31, | | | | |
| | 2017 | 2016 | 2015 | 2014 | 2013 | 2012 |
| Selected Per–Share Data | | | | | | |
| Net asset value, beginning of period | $7.79 | $8.29 | $8.64 | $8.97 | $7.40 | $7.03 |
| Income from Investment Operations | | | | | | |
| Net investment income (loss)A | .09 | .20 | .16 | .34B | .19 | .22 |
| Net realized and unrealized gain (loss) | .70 | (.58) | (.19) | (.46) | 1.65 | .40 |
| Total from investment operations | .79 | (.38) | (.03) | (.12) | 1.84 | .62 |
| Distributions from net investment income | (.20) | (.12) | (.32) | (.20) | (.22) | (.25) |
| Distributions from net realized gain | (.01) | – | – | (.01) | (.04) | – |
| Total distributions | (.21) | (.12) | (.32) | (.21) | (.27)C | (.25) |
| Redemption fees added to paid in capitalA,D | – | – | – | – | – | – |
| Net asset value, end of period | $8.37 | $7.79 | $8.29 | $8.64 | $8.97 | $7.40 |
| Total ReturnE,F | 10.34% | (4.69)% | (.41)% | (1.34)% | 25.57% | 9.19% |
| Ratios to Average Net AssetsG,H | | | | | | |
| Expenses before reductions | .99%I | 1.03% | 1.02% | .96% | 1.05% | 1.13% |
| Expenses net of fee waivers, if any | .99%I | 1.03% | 1.02% | .96% | 1.05% | 1.13% |
| Expenses net of all reductions | .98%I | 1.03% | 1.01% | .95% | 1.02% | 1.10% |
| Net investment income (loss) | 2.29%I | 2.56% | 1.93% | 3.80%B | 2.41% | 3.16% |
| Supplemental Data | | | | | | |
| Net assets, end of period (000 omitted) | $328,732 | $309,199 | $267,567 | $192,789 | $181,568 | $128,983 |
| Portfolio turnover rateJ | 52%I | 47% | 44% | 69% | 79% | 74% |
A Calculated based on average shares outstanding during the period.
B Net Investment income per share reflects a large, non-recurring dividend which amounted to $.14 per share. Excluding this non-recurring dividend, the ratio of net investment income (loss) to average net assets would have been 2.27%.
C Total distributions of $.27 per share is comprised of distributions from net investment income of $.223 and distributions from net realized gain of $.042 per share.
D Amount represents less than $.005 per share.
E��Total returns for periods of less than one year are not annualized.
F Total returns would have been lower if certain expenses had not been reduced during the applicable periods shown.
G Fees and expenses of any underlying Fidelity Central Funds are not included in the Fund's expense ratio. The Fund indirectly bears its proportionate share of the expenses of any underlying Fidelity Central Funds.
H Expense ratios reflect operating expenses of the class. Expenses before reductions do not reflect amounts reimbursed by the investment adviser or reductions from brokerage service arrangements or reductions from other expense offset arrangements and do not represent the amount paid by the class during periods when reimbursements or reductions occur. Expenses net of fee waivers reflect expenses after reimbursement by the investment adviser but prior to reductions from brokerage service arrangements or other expense offset arrangements. Expenses net of all reductions represent the net expenses paid by the class.
I Annualized
J Amount does not include the portfolio activity of any underlying Fidelity Central Funds.
See accompanying notes which are an integral part of the financial statements.
Financial Highlights — Fidelity International Value Fund Class I
| | Six months ended (Unaudited) April 30, | Years ended October 31, | | | | |
| | 2017 | 2016 | 2015 | 2014 | 2013 | 2012 |
| Selected Per–Share Data | | | | | | |
| Net asset value, beginning of period | $7.80 | $8.29 | $8.65 | $8.98 | $7.41 | $7.04 |
| Income from Investment Operations | | | | | | |
| Net investment income (loss)A | .09 | .19 | .15 | .33B | .19 | .22 |
| Net realized and unrealized gain (loss) | .70 | (.58) | (.19) | (.45) | 1.65 | .40 |
| Total from investment operations | .79 | (.39) | (.04) | (.12) | 1.84 | .62 |
| Distributions from net investment income | (.19) | (.10) | (.32) | (.19) | (.23) | (.25) |
| Distributions from net realized gain | (.01) | – | – | (.01) | (.04) | – |
| Total distributions | (.20) | (.10) | (.32) | (.21)C | (.27) | (.25) |
| Redemption fees added to paid in capitalA,D | – | – | – | – | – | – |
| Net asset value, end of period | $8.39 | $7.80 | $8.29 | $8.65 | $8.98 | $7.41 |
| Total ReturnE,F | 10.34% | (4.81)% | (.53)% | (1.41)% | 25.64% | 9.22% |
| Ratios to Average Net AssetsG,H | | | | | | |
| Expenses before reductions | 1.12%I | 1.17% | 1.14% | 1.05% | 1.07% | 1.10% |
| Expenses net of fee waivers, if any | 1.12%I | 1.17% | 1.14% | 1.05% | 1.07% | 1.10% |
| Expenses net of all reductions | 1.10%I | 1.16% | 1.13% | 1.04% | 1.04% | 1.07% |
| Net investment income (loss) | 2.16%I | 2.42% | 1.81% | 3.71%B | 2.39% | 3.18% |
| Supplemental Data | | | | | | |
| Net assets, end of period (000 omitted) | $3,972 | $1,955 | $1,969 | $1,310 | $239 | $372 |
| Portfolio turnover rateJ | 52%I | 47% | 44% | 69% | 79% | 74% |
A Calculated based on average shares outstanding during the period.
B Net Investment income per share reflects a large, non-recurring dividend which amounted to $.14 per share. Excluding this non-recurring dividend, the ratio of net investment income (loss) to average net assets would have been 2.18%.
C Total distributions of $.21 per share is comprised of distributions from net investment income of $.191 and distributions from net realized gain of .014 per share.
D Amount represents less than $.005 per share.
E Total returns for periods of less than one year are not annualized.
F Total returns would have been lower if certain expenses had not been reduced during the applicable periods shown.
G Fees and expenses of any underlying Fidelity Central Funds are not included in the Fund's expense ratio. The Fund indirectly bears its proportionate share of the expenses of any underlying Fidelity Central Funds.
H Expense ratios reflect operating expenses of the class. Expenses before reductions do not reflect amounts reimbursed by the investment adviser or reductions from brokerage service arrangements or reductions from other expense offset arrangements and do not represent the amount paid by the class during periods when reimbursements or reductions occur. Expenses net of fee waivers reflect expenses after reimbursement by the investment adviser but prior to reductions from brokerage service arrangements or other expense offset arrangements. Expenses net of all reductions represent the net expenses paid by the class.
I Annualized
J Amount does not include the portfolio activity of any underlying Fidelity Central Funds.
See accompanying notes which are an integral part of the financial statements.
Notes to Financial Statements (Unaudited)
For the period ended April 30, 2017
1. Organization.
Fidelity International Value Fund (the Fund) is a fund of Fidelity Investment Trust (the Trust) and is authorized to issue an unlimited number of shares. The Trust is registered under the Investment Company Act of 1940, as amended (the 1940 Act), as an open-end management investment company organized as a Massachusetts business trust. The Fund offers Class A, Class M (formerly Class T), Class C, International Value and Class I shares, each of which has equal rights as to assets and voting privileges. Each class has exclusive voting rights with respect to matters that affect that class.
After the close of business on June 24, 2016, all outstanding Class B shares were converted to Class A shares. All prior fiscal period dollar and share amounts for Class B presented in the Notes to Financial Statements are for the period November 1, 2015 through June 24, 2016.
2. Investments in Fidelity Central Funds.
The Fund invests in Fidelity Central Funds, which are open-end investment companies generally available only to other investment companies and accounts managed by the investment adviser and its affiliates. The Fund's Schedule of Investments lists each of the Fidelity Central Funds held as of period end, if any, as an investment of the Fund, but does not include the underlying holdings of each Fidelity Central Fund. As an Investing Fund, the Fund indirectly bears its proportionate share of the expenses of the underlying Fidelity Central Funds.
The Money Market Central Funds seek preservation of capital and current income and are managed by Fidelity Investments Money Management, Inc. (FIMM), an affiliate of the investment adviser. Annualized expenses of the Money Market Central Funds as of their most recent shareholder report date are less than .005%.
A complete unaudited list of holdings for each Fidelity Central Fund is available upon request or at the Securities and Exchange Commission (the SEC) website at www.sec.gov. In addition, the financial statements of the Fidelity Central Funds are available on the SEC website or upon request.
3. Significant Accounting Policies.
The Fund is an investment company and applies the accounting and reporting guidance of the Financial Accounting Standards Board (FASB) Accounting Standards Codification Topic 946 Financial Services – Investments Companies. The financial statements have been prepared in conformity with accounting principles generally accepted in the United States of America (GAAP), which require management to make certain estimates and assumptions at the date of the financial statements. Actual results could differ from those estimates. Subsequent events, if any, through the date that the financial statements were issued have been evaluated in the preparation of the financial statements. The following summarizes the significant accounting policies of the Fund:
Investment Valuation. Investments are valued as of 4:00 p.m. Eastern time on the last calendar day of the period. The Board of Trustees (the Board) has delegated the day to day responsibility for the valuation of the Fund's investments to the Fair Value Committee (the Committee) established by the Fund's investment adviser. In accordance with valuation policies and procedures approved by the Board, the Fund attempts to obtain prices from one or more third party pricing vendors or brokers to value its investments. When current market prices, quotations or currency exchange rates are not readily available or reliable, investments will be fair valued in good faith by the Committee, in accordance with procedures adopted by the Board. Factors used in determining fair value vary by investment type and may include market or investment specific events. The frequency with which these procedures are used cannot be predicted and they may be utilized to a significant extent. The Committee oversees the Fund's valuation policies and procedures and reports to the Board on the Committee's activities and fair value determinations. The Board monitors the appropriateness of the procedures used in valuing the Fund's investments and ratifies the fair value determinations of the Committee.
The Fund categorizes the inputs to valuation techniques used to value its investments into a disclosure hierarchy consisting of three levels as shown below:
- Level 1 – quoted prices in active markets for identical investments
- Level 2 – other significant observable inputs (including quoted prices for similar investments, interest rates, prepayment speeds, etc.)
- Level 3 – unobservable inputs (including the Fund's own assumptions based on the best information available)
Valuation techniques used to value the Fund's investments by major category are as follows:
Equity securities, including restricted securities, for which market quotations are readily available, are valued at the last reported sale price or official closing price as reported by a third party pricing vendor on the primary market or exchange on which they are traded and are categorized as Level 1 in the hierarchy. In the event there were no sales during the day or closing prices are not available, securities are valued at the last quoted bid price or may be valued using the last available price and are generally categorized as Level 2 in the hierarchy. For foreign equity securities, when market or security specific events arise, comparisons to the valuation of American Depositary Receipts (ADRs), futures contracts, Exchange-Traded Funds (ETFs) and certain indexes as well as quoted prices for similar securities may be used and would be categorized as Level 2 in the hierarchy. Utilizing these techniques may result in transfers between Level 1 and Level 2. For equity securities, including restricted securities, where observable inputs are limited, assumptions about market activity and risk are used and these securities may be categorized as Level 3 in the hierarchy.
Investments in open-end mutual funds, including the Fidelity Central Funds, are valued at their closing net asset value (NAV) each business day and are categorized as Level 1 in the hierarchy.
Changes in valuation techniques may result in transfers in or out of an assigned level within the disclosure hierarchy. The aggregate value of investments by input level as of April 30, 2017, including information on transfers between Levels 1 and 2, is included at the end of the Fund's Schedule of Investments.
Foreign Currency. The Fund may use foreign currency contracts to facilitate transactions in foreign-denominated securities. Gains and losses from these transactions may arise from changes in the value of the foreign currency or if the counterparties do not perform under the contracts' terms.
Foreign-denominated assets, including investment securities, and liabilities are translated into U.S. dollars at the exchange rates at period end. Purchases and sales of investment securities, income and dividends received and expenses denominated in foreign currencies are translated into U.S. dollars at the exchange rate in effect on the transaction date.
The effects of exchange rate fluctuations on investments are included with the net realized and unrealized gain (loss) on investment securities. Other foreign currency transactions resulting in realized and unrealized gain (loss) are disclosed separately.
Investment Transactions and Income. For financial reporting purposes, the Fund's investment holdings and NAV include trades executed through the end of the last business day of the period. The NAV per share for processing shareholder transactions is calculated as of the close of business of the New York Stock Exchange (NYSE), normally 4:00 p.m. Eastern time and includes trades executed through the end of the prior business day. Gains and losses on securities sold are determined on the basis of identified cost. Dividend income is recorded on the ex-dividend date, except for certain dividends from foreign securities where the ex-dividend date may have passed, which are recorded as soon as the Fund is informed of the ex-dividend date. Non-cash dividends included in dividend income, if any, are recorded at the fair market value of the securities received. Income and capital gain distributions from Fidelity Central Funds, if any, are recorded on the ex-dividend date. Certain distributions received by the Fund represent a return of capital or capital gain. The Fund determines the components of these distributions subsequent to the ex-dividend date, based upon receipt of tax filings or other correspondence relating to the underlying investment. These distributions are recorded as a reduction of cost of investments and/or as a realized gain. Investment income is recorded net of foreign taxes withheld where recovery of such taxes is uncertain.
Class Allocations and Expenses. Investment income, realized and unrealized capital gains and losses, common expenses of the Fund, and certain fund-level expense reductions, if any, are allocated daily on a pro-rata basis to each class based on the relative net assets of each class to the total net assets of the Fund. Each class differs with respect to transfer agent and distribution and service plan fees incurred. Certain expense reductions may also differ by class. For the reporting period, the allocated portion of income and expenses to each class as a percent of its average net assets may vary due to the timing of recording these transactions in relation to fluctuating net assets of the classes. Expenses directly attributable to a fund are charged to that fund. Expenses attributable to more than one fund are allocated among the respective funds on the basis of relative net assets or other appropriate methods. Expense estimates are accrued in the period to which they relate and adjustments are made when actual amounts are known.
Income Tax Information and Distributions to Shareholders. Each year, the Fund intends to qualify as a regulated investment company under Subchapter M of the Internal Revenue Code, including distributing substantially all of its taxable income and realized gains. As a result, no provision for U.S. Federal income taxes is required. The Fund files a U.S. federal tax return, in addition to state and local tax returns as required. The Fund's federal income tax returns are subject to examination by the Internal Revenue Service (IRS) for a period of three fiscal years after they are filed. State and local tax returns may be subject to examination for an additional fiscal year depending on the jurisdiction. Foreign taxes are provided for based on the Fund's understanding of the tax rules and rates that exist in the foreign markets in which it invests.
Distributions are declared and recorded on the ex-dividend date. Income dividends and capital gain distributions are declared separately for each class. Income and capital gain distributions are determined in accordance with income tax regulations, which may differ from GAAP.
Capital accounts within the financial statements are adjusted for permanent book-tax differences. These adjustments have no impact on net assets or the results of operations. Capital accounts are not adjusted for temporary book-tax differences which will reverse in a subsequent period.
Book-tax differences are primarily due to foreign currency transactions, partnerships, passive foreign investment companies (PFIC), capital loss carryforwards, and losses deferred due to wash sales.
The federal tax cost of investment securities and unrealized appreciation (depreciation) as of period end were as follows:
| Gross unrealized appreciation | $28,543,190 |
| Gross unrealized depreciation | (18,515,633) |
| Net unrealized appreciation (depreciation) on securities | $10,027,557 |
| Tax cost | $359,066,731 |
Capital loss carryforwards are only available to offset future capital gains of the Fund to the extent provided by regulations and may be limited. Under the Regulated Investment Company Modernization Act of 2010 (the Act), the Fund is permitted to carry forward capital losses incurred in taxable years beginning after December 22, 2010 for an unlimited period and such capital losses are required to be used prior to any losses that expire. The capital loss carryforward information presented below, including any applicable limitation, is estimated as of prior fiscal period end and is subject to adjustment.
| Fiscal year of expiration | |
| 2017 | $(65,376,972) |
| 2018 | (3,571,319) |
| 2019 | (31,368,797) |
| Total with expiration | $(100,317,088) |
| No expiration | |
| Short-term | $(6,030,826) |
| Total capital loss carryforward | $(106,347,914) |
Short-Term Trading (Redemption) Fees. Shares held by investors in the Fund less than 30 days may have been subject to a redemption fee equal to 1.00% of the NAV of shares redeemed. All redemption fees, which reduce the proceeds of the shareholder redemption, are retained by the Fund and accounted for as an addition to paid in capital.
4. Purchases and Sales of Investments.
Purchases and sales of securities, other than short-term securities, aggregated $85,165,131 and $93,403,567, respectively.
5. Fees and Other Transactions with Affiliates.
Management Fee. Fidelity Management & Research Company (the investment adviser) and its affiliates provide the Fund with investment management related services for which the Fund pays a monthly management fee. The management fee is the sum of an individual fund fee rate that is based on an annual rate of .45% of the Fund's average net assets and an annualized group fee rate that averaged .25% during the period. The group fee rate is based upon the average net assets of all the mutual funds advised by the investment adviser, including any mutual funds previously advised by the investment adviser that are currently advised by Fidelity SelectCo, LLC, an affiliate of the investment adviser. The group fee rate decreases as assets under management increase and increases as assets under management decrease. In addition, the management fee is subject to a performance adjustment (up to a maximum of +/- .20% of the Fund's average net assets over a 36 month performance period). The upward or downward adjustment to the management fee is based on the relative investment performance of the International Value as compared to its benchmark index, the MSCI EAFE Value Index, over the same 36 month performance period. For the reporting period, the total annualized management fee rate, including the performance adjustment, was .68% of the Fund's average net assets. The performance adjustment included in the management fee rate may be higher or lower than the maximum performance adjustment rate due to the difference between the average net assets for the reporting and performance periods.
Distribution and Service Plan Fees. In accordance with Rule 12b-1 of the 1940 Act, the Fund has adopted separate Distribution and Service Plans for each class of shares. Certain classes pay Fidelity Distributors Corporation (FDC), an affiliate of the investment adviser, separate Distribution and Service Fees, each of which is based on an annual percentage of each class' average net assets. In addition, FDC may pay financial intermediaries for selling shares of the Fund and providing shareholder support services. For the period, the Distribution and Service Fee rates, total fees and amounts retained by FDC were as follows:
| | Distribution
Fee | Service
Fee | Total Fees | Retained
by FDC |
| Class A | -% | .25% | $9,309 | $– |
| Class M | .25% | .25% | 9,128 | – |
| Class C | .75% | .25% | 21,431 | 2,539 |
| | | | $39,868 | $2,539 |
Sales Loads. FDC may receive a front-end sales charge of up to 5.75% for selling Class A shares and 3.50% for selling Class M shares, some of which is paid to financial intermediaries for selling shares of the Fund. Depending on the holding period, FDC may receive contingent deferred sales charges levied on Class A, Class M and Class C redemptions. The deferred sales charges are 1.00% for Class C shares, 1.00% for certain purchases of Class A shares and .25% for certain purchases of Class M shares.
For the period, sales charge amounts retained by FDC were as follows:
| | Retained
by FDC |
| Class A | $2,144 |
| Class M | 731 |
| Class C(a) | 501 |
| | $3,376 |
(a) When Class C shares are initially sold, FDC pays commissions from its own resources to financial intermediaries through which the sales are made.
Transfer Agent Fees. Fidelity Investments Institutional Operations Company, Inc., (FIIOC), an affiliate of the investment adviser, is the transfer, dividend disbursing and shareholder servicing agent for each class of the Fund. FIIOC receives account fees and asset-based fees that vary according to the account size and type of account of the shareholders of the respective classes of the Fund. FIIOC pays for typesetting, printing and mailing of shareholder reports, except proxy statements.
For the period, transfer agent fees for each class were as follows:
| | Amount | % of
Class-Level Average
Net Assets(a) |
| Class A | $10,312 | .28 |
| Class M | 5,999 | .33 |
| Class C | 6,540 | .31 |
| International Value | 254,989 | .16 |
| Class I | 3,832 | .29 |
| | $281,672 | |
(a) Annualized
Accounting and Security Lending Fees. Fidelity Service Company, Inc. (FSC), an affiliate of the investment adviser, maintains the Fund's accounting records. The accounting fee is based on the level of average net assets for each month. Under a separate contract, FSC administers the security lending program. The security lending fee is based on the number and duration of lending transactions.
Brokerage Commissions. The Fund placed a portion of its portfolio transactions with brokerage firms which are affiliates of the investment adviser. Brokerage commissions are included in net realized gain (loss) and change in net unrealized appreciation (depreciation) in the Statement of Operations. The commissions paid to these affiliated firms were $120 for the period.
Interfund Trades. The Fund may purchase from or sell securities to other Fidelity Funds under procedures adopted by the Board. The procedures have been designed to ensure these interfund trades are executed in accordance with Rule 17a-7 of the 1940 Act. Interfund trades are included within the respective purchases and sales amounts shown in the Purchases and Sales of Investments note.
6. Committed Line of Credit.
The Fund participates with other funds managed by the investment adviser or an affiliate in a $4.25 billion credit facility (the "line of credit") to be utilized for temporary or emergency purposes to fund shareholder redemptions or for other short-term liquidity purposes. The Fund has agreed to pay commitment fees on its pro-rata portion of the line of credit, which amounted to $558 and is reflected in Miscellaneous expenses on the Statement of Operations. During the period, the Fund did not borrow on this line of credit.
7. Security Lending.
The Fund lends portfolio securities through a lending agent from time to time in order to earn additional income. For equity securities, a lending agent is used and may loan securities to certain qualified borrowers, including Fidelity Capital Markets (FCM), a broker-dealer affiliated with the Fund. On the settlement date of the loan, the Fund receives collateral (in the form of U.S. Treasury obligations, letters of credit and/or cash) against the loaned securities and maintains collateral in an amount not less than 100% of the market value of the loaned securities during the period of the loan. The market value of the loaned securities is determined at the close of business of the Fund and any additional required collateral is delivered to the Fund on the next business day. The Fund or borrower may terminate the loan at any time, and if the borrower defaults on its obligation to return the securities loaned because of insolvency or other reasons, the Fund may apply collateral received from the borrower against the obligation. The Fund may experience delays and costs in recovering the securities loaned. Any cash collateral received is invested in the Fidelity Securities Lending Cash Central Fund. The value of loaned securities and cash collateral at period end are disclosed on the Fund's Statement of Assets and Liabilities. At period end, there were no security loans outstanding with FCM. Security lending income represents the income earned on investing cash collateral, less rebates paid to borrowers and any lending agent fees associated with the loan, plus any premium payments received for lending certain types of securities. Security lending income is presented in the Statement of Operations as a component of income from Fidelity Central Funds, Total security lending income during the period amounted to $84,398, including $36 from securities loaned to FCM.
8. Expense Reductions.
Commissions paid to certain brokers with whom the investment adviser, or its affiliates, places trades on behalf of the Fund include an amount in addition to trade execution, which may be rebated back to the Fund to offset certain expenses. This amount totaled $23,160 for the period.
In addition, during the period the investment adviser reimbursed and/or waived a portion of fund-level operating expenses in the amount of $1,467.
9. Distributions to Shareholders.
Distributions to shareholders of each class were as follows:
| | Six months ended April 30, 2017 | Year ended October 31, 2016 |
| From net investment income | | |
| Class A | $160,715 | $95,726 |
| Class M | 64,948 | 30,318 |
| Class B | – | 141 |
| Class C | 57,557 | 10,293 |
| International Value | 7,786,373 | 3,924,604 |
| Class I | 54,529 | 23,301 |
| Total | $8,124,122 | $4,084,383 |
| From net realized gain | | |
| Class A | $10,650 | $– |
| Class M | 5,031 | – |
| Class C | 5,917 | – |
| International Value | 432,576 | – |
| Class I | 3,157 | – |
| Total | $457,331 | $– |
10. Share Transactions.
Share transactions for each class were as follows and may contain automatic conversions between classes or exchanges between affiliated funds:
| | Shares | Shares | Dollars | Dollars |
| | Six months ended April 30, 2017 | Year ended October 31, 2016 | Six months ended April 30, 2017 | Year ended October 31, 2016 |
| Class A | | | | |
| Shares sold | 116,678 | 238,095 | $923,543 | $1,848,202 |
| Reinvestment of distributions | 21,396 | 11,425 | 166,672 | 93,224 |
| Shares redeemed | (276,809) | (340,144) | (2,196,972) | (2,620,114) |
| Net increase (decrease) | (138,735) | (90,624) | $(1,106,757) | $(678,688) |
| Class M | | | | |
| Shares sold | 57,884 | 88,717 | $457,214 | $694,653 |
| Reinvestment of distributions | 8,935 | 3,669 | 69,695 | 29,980 |
| Shares redeemed | (93,719) | (110,449) | (736,404) | (851,756) |
| Net increase (decrease) | (26,900) | (18,063) | $(209,495) | $(127,123) |
| Class B | | | | |
| Shares sold | – | 2 | $– | $14 |
| Reinvestment of distributions | – | 15 | – | 124 |
| Shares redeemed | – | (36,263) | – | (277,663) |
| Net increase (decrease) | – | (36,246) | $– | $(277,525) |
| Class C | | | | |
| Shares sold | 47,485 | 105,656 | $372,008 | $808,615 |
| Reinvestment of distributions | 7,631 | 1,181 | 59,598 | 9,659 |
| Shares redeemed | (54,626) | (115,602) | (428,429) | (896,778) |
| Net increase (decrease) | 490 | (8,765) | $3,177 | $(78,504) |
| International Value | | | | |
| Shares sold | 1,089,831 | 10,653,545 | $8,608,702 | $82,568,730 |
| Reinvestment of distributions | 1,033,790 | 470,177 | 8,032,545 | 3,831,944 |
| Shares redeemed | (2,538,371) | (3,741,188) | (19,917,454) | (28,527,423) |
| Net increase (decrease) | (414,750) | 7,382,534 | $(3,276,207) | $57,873,251 |
| Class I | | | | |
| Shares sold | 262,937 | 73,854 | $2,096,088 | $567,094 |
| Reinvestment of distributions | 6,933 | 2,528 | 54,005 | 20,650 |
| Shares redeemed | (46,806) | (63,368) | (369,360) | (499,837) |
| Net increase (decrease) | 223,064 | 13,014 | $1,780,733 | $87,907 |
11. Other.
The Fund's organizational documents provide former and current trustees and officers with a limited indemnification against liabilities arising in connection with the performance of their duties to the Fund. In the normal course of business, the Fund may also enter into contracts that provide general indemnifications. The Fund's maximum exposure under these arrangements is unknown as this would be dependent on future claims that may be made against the Fund. The risk of material loss from such claims is considered remote.
At the end of the period, Strategic Advisers International II Fund was the owner of record of approximately 69% of the total outstanding shares of the Fund.
Shareholder Expense Example
As a shareholder of the Fund, you incur two types of costs: (1) transaction costs, including sales charges (loads) on purchase payments or redemption proceeds, redemption fees and (2) ongoing costs, including management fees, distribution and/or service (12b-1) fees and other Fund expenses. This Example is intended to help you understand your ongoing costs (in dollars) of investing in the Fund and to compare these costs with the ongoing costs of investing in other mutual funds.
The Example is based on an investment of $1,000 invested at the beginning of the period and held for the entire period (November 1, 2016 to April 30, 2017).
Actual Expenses
The first line of the accompanying table for each class of the Fund provides information about actual account values and actual expenses. You may use the information in this line, together with the amount you invested, to estimate the expenses that you paid over the period. Simply divide your account value by $1,000.00 (for example, an $8,600 account value divided by $1,000.00 = 8.6), then multiply the result by the number in the first line for a class of the Fund under the heading entitled "Expenses Paid During Period" to estimate the expenses you paid on your account during this period. A small balance maintenance fee of $12.00 that is charged once a year may apply for certain accounts with a value of less than $2,000. This fee is not included in the table below. If it was, the estimate of expenses you paid during the period would be higher, and your ending account value lower, by this amount. In addition, the Fund, as a shareholder in the underlying Fidelity Central Funds, will indirectly bear its pro-rata share of the fees and expenses incurred by the underlying Fidelity Central Funds. These fees and expenses are not included in the Fund's annualized expense ratio used to calculate the expense estimate in the table below.
Hypothetical Example for Comparison Purposes
The second line of the accompanying table for each class of the Fund provides information about hypothetical account values and hypothetical expenses based on a Class' actual expense ratio and an assumed rate of return of 5% per year before expenses, which is not the Class' actual return. The hypothetical account values and expenses may not be used to estimate the actual ending account balance or expenses you paid for the period. You may use this information to compare the ongoing costs of investing in the Fund and other funds. To do so, compare this 5% hypothetical example with the 5% hypothetical examples that appear in the shareholder reports of the other funds. A small balance maintenance fee of $12.00 that is charged once a year may apply for certain accounts with a value of less than $2,000. This fee is not included in the table below. If it was, the estimate of expenses you paid during the period would be higher, and your ending account value lower, by this amount. In addition, the Fund, as a shareholder in the underlying Fidelity Central Funds, will indirectly bear its pro-rata share of the fees and expenses incurred by the underlying Fidelity Central Funds. These fees and expenses are not included in the Fund's annualized expense ratio used to calculate the expense estimate in the table below.
Please note that the expenses shown in the table are meant to highlight your ongoing costs only and do not reflect any transaction costs. Therefore, the second line of the table is useful in comparing ongoing costs only, and will not help you determine the relative total costs of owning different funds. In addition, if these transactional costs were included, your costs would have been higher.
| | Annualized Expense Ratio-A | Beginning
Account Value
November 1, 2016 | Ending
Account Value
April 30, 2017 | Expenses Paid
During Period-B
November 1, 2016
to April 30, 2017 |
| Class A | 1.35% | | | |
| Actual | | $1,000.00 | $1,101.60 | $7.03 |
| Hypothetical-C | | $1,000.00 | $1,018.10 | $6.76 |
| Class M | 1.66% | | | |
| Actual | | $1,000.00 | $1,099.80 | $8.64 |
| Hypothetical-C | | $1,000.00 | $1,016.56 | $8.30 |
| | | | | |
| | | | | |
| | | | | |
| Class C | 2.13% | | | |
| Actual | | $1,000.00 | $1,096.30 | $11.07 |
| Hypothetical-C | | $1,000.00 | $1,014.23 | $10.64 |
| International Value | .99% | | | |
| Actual | | $1,000.00 | $1,103.40 | $5.16 |
| Hypothetical-C | | $1,000.00 | $1,019.89 | $4.96 |
| Class I | 1.12% | | | |
| Actual | | $1,000.00 | $1,103.40 | $5.84 |
| Hypothetical-C | | $1,000.00 | $1,019.24 | $5.61 |
A Annualized expense ratio reflects expenses net of applicable fee waivers.
B Expenses are equal to each Class' annualized expense ratio, multiplied by the average account value over the period, multiplied by 181/365 (to reflect the one-half year period).
C 5% return per year before expenses
AFIV-SANN-0617
1.827501.110
Fidelity Flex℠ Funds Fidelity Flex℠ International Fund
Semi-Annual Report April 30, 2017 |
|
Contents
To view a fund's proxy voting guidelines and proxy voting record for the 12-month period ended June 30, visit http://www.fidelity.com/proxyvotingresults or visit the Securities and Exchange Commission's (SEC) web site at http://www.sec.gov.
You may also call 1-800-835-5092 to request a free copy of the proxy voting guidelines.
Standard & Poor's, S&P and S&P 500 are registered service marks of The McGraw-Hill Companies, Inc. and have been licensed for use by Fidelity Distributors Corporation.
Other third-party marks appearing herein are the property of their respective owners.
All other marks appearing herein are registered or unregistered trademarks or service marks of FMR LLC or an affiliated company. © 2017 FMR LLC. All rights reserved.
This report and the financial statements contained herein are submitted for the general information of the shareholders of the Fund. This report is not authorized for distribution to prospective investors in the Fund unless preceded or accompanied by an effective prospectus.
A fund files its complete schedule of portfolio holdings with the SEC for the first and third quarters of each fiscal year on Form N-Q. Forms N-Q are available on the SEC’s web site at http://www.sec.gov. A fund's Forms N-Q may be reviewed and copied at the SEC’s Public Reference Room in Washington, DC. Information regarding the operation of the SEC's Public Reference Room may be obtained by calling 1-800-SEC-0330.
For a complete list of a fund's portfolio holdings, view the most recent holdings listing, semiannual report, or annual report on Fidelity's web site at http://www.fidelity.com, http://www.institutional.fidelity.com, or http://www.401k.com, as applicable.
NOT FDIC INSURED •MAY LOSE VALUE •NO BANK GUARANTEE
Neither the Fund nor Fidelity Distributors Corporation is a bank.
Investment Summary (Unaudited)
Geographic Diversification (% of fund's net assets)
| As of April 30, 2017 |
| | United States of America* | 14.7% |
| | Japan | 13.2% |
| | United Kingdom | 11.0% |
| | Switzerland | 5.9% |
| | France | 5.7% |
| | Canada | 4.7% |
| | Germany | 4.5% |
| | Sweden | 3.5% |
| | Australia | 3.4% |
| | Other | 33.4% |
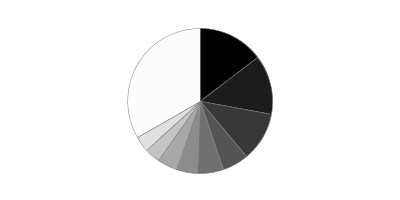
* Includes Short-Term investments and Net Other Assets (Liabilities).
Percentages are based on country or territory of incorporation and include the effect of futures contracts, if applicable.
Asset Allocation as of April 30, 2017
| % of fund's net assets |
| | Stocks | 96.9% |
| | Short-Term Investments and Net Other Assets (Liabilities) | 3.1% |

Top Ten Stocks as of April 30, 2017
| | % of fund's net assets |
| WisdomTree India Earnings ETF (United States of America, Investment Companies) | 2.8 |
| Nestle SA (Reg. S) (Switzerland, Food Products) | 2.1 |
| Samsung Electronics Co. Ltd. (Korea (South), Technology Hardware, Storage & Peripherals) | 1.4 |
| Anheuser-Busch InBev SA NV (Belgium, Beverages) | 1.2 |
| Naspers Ltd. Class N (South Africa, Media) | 1.2 |
| Tencent Holdings Ltd. (Cayman Islands, Internet Software & Services) | 1.2 |
| SAP AG (Germany, Software) | 1.1 |
| Alibaba Group Holding Ltd. sponsored ADR (Cayman Islands, Internet Software & Services) | 1.1 |
| British American Tobacco PLC (United Kingdom) (United Kingdom, Tobacco) | 1.1 |
| AIA Group Ltd. (Hong Kong, Insurance) | 1.0 |
| | 14.2 |
Top Market Sectors as of April 30, 2017
| | % of fund's net assets |
| Financials | 18.9 |
| Information Technology | 13.9 |
| Industrials | 13.1 |
| Consumer Staples | 11.9 |
| Health Care | 9.8 |
| Consumer Discretionary | 9.6 |
| Materials | 8.4 |
| Energy | 3.8 |
| Real Estate | 2.0 |
| Telecommunication Services | 1.7 |
Investments April 30, 2017 (Unaudited)
Showing Percentage of Net Assets
| Common Stocks - 92.9% | | | |
| | | Shares | Value |
| Australia - 3.4% | | | |
| Adelaide Brighton Ltd. | | 224 | $993 |
| Amcor Ltd. | | 587 | 6,905 |
| Australia & New Zealand Banking Group Ltd. | | 1,232 | 30,222 |
| Beacon Lighting Group Ltd. | | 777 | 1,047 |
| CSL Ltd. | | 515 | 51,116 |
| DuluxGroup Ltd. | | 551 | 2,793 |
| Imdex Ltd. (a) | | 2,316 | 1,075 |
| Insurance Australia Group Ltd. | | 2,527 | 11,751 |
| Macquarie Group Ltd. | | 179 | 12,465 |
| Magellan Financial Group Ltd. | | 356 | 6,286 |
| Quintis Ltd. | | 887 | 797 |
| RCG Corp. Ltd. | | 2,211 | 1,374 |
| Transurban Group unit | | 1,401 | 12,799 |
| Westpac Banking Corp. | | 1,468 | 38,483 |
|
| TOTAL AUSTRALIA | | | 178,106 |
|
| Austria - 0.7% | | | |
| Andritz AG | | 438 | 24,223 |
| Buwog-Gemeinnuetzige Wohnung | | 407 | 10,991 |
|
| TOTAL AUSTRIA | | | 35,214 |
|
| Bailiwick of Jersey - 0.2% | | | |
| Wolseley PLC | | 193 | 12,267 |
| Belgium - 1.9% | | | |
| Anheuser-Busch InBev SA NV | | 586 | 66,083 |
| KBC Ancora (a) | | 70 | 3,329 |
| KBC Groep NV | | 459 | 33,139 |
|
| TOTAL BELGIUM | | | 102,551 |
|
| Bermuda - 0.0% | | | |
| Vostok New Ventures Ltd. (depositary receipt) (a) | | 241 | 1,877 |
| Brazil - 1.8% | | | |
| BB Seguridade Participacoes SA | | 1,000 | 9,417 |
| Cielo SA | | 1,200 | 9,111 |
| Drogasil SA (a) | | 400 | 8,500 |
| Equatorial Energia SA | | 400 | 7,245 |
| Itau Unibanco Holding SA | | 700 | 7,512 |
| Kroton Educacional SA | | 2,000 | 9,420 |
| Qualicorp SA | | 1,100 | 7,832 |
| Smiles SA | | 300 | 6,525 |
| Ultrapar Participacoes SA | | 400 | 8,874 |
| Vale SA sponsored ADR | | 1,500 | 12,870 |
| Weg SA (a) | | 1,500 | 8,365 |
|
| TOTAL BRAZIL | | | 95,671 |
|
| Canada - 4.7% | | | |
| Alimentation Couche-Tard, Inc. Class B (sub. vtg.) | | 917 | 42,174 |
| Canadian National Railway Co. | | 460 | 33,250 |
| Canadian Pacific Railway Ltd. | | 89 | 13,637 |
| CCL Industries, Inc. Class B | | 121 | 28,011 |
| Constellation Software, Inc. | | 54 | 24,698 |
| Franco-Nevada Corp. | | 330 | 22,444 |
| Imperial Oil Ltd. | | 946 | 27,520 |
| New Look Vision Group, Inc. | | 60 | 1,253 |
| Pason Systems, Inc. | | 862 | 12,800 |
| Potash Corp. of Saskatchewan, Inc. | | 1,850 | 31,198 |
| PrairieSky Royalty Ltd. | | 593 | 12,924 |
| ShawCor Ltd. Class A | | 43 | 1,079 |
| Tesco Corp. (a) | | 85 | 557 |
|
| TOTAL CANADA | | | 251,545 |
|
| Cayman Islands - 3.2% | | | |
| 58.com, Inc. ADR (a) | | 100 | 3,958 |
| Alibaba Group Holding Ltd. sponsored ADR (a) | | 517 | 59,714 |
| Ctrip.com International Ltd. ADR (a) | | 254 | 12,830 |
| NetEase, Inc. ADR | | 47 | 12,473 |
| New Oriental Education & Technology Group, Inc. sponsored ADR (a) | | 175 | 11,295 |
| Shenzhou International Group Holdings Ltd. | | 1,000 | 6,582 |
| Tencent Holdings Ltd. | | 2,000 | 62,667 |
|
| TOTAL CAYMAN ISLANDS | | | 169,519 |
|
| Chile - 0.2% | | | |
| Sociedad Quimica y Minera de Chile SA (PN-B) sponsored ADR | | 228 | 8,105 |
| China - 1.3% | | | |
| Gree Electric Appliances, Inc. of Zhuhai Class A | | 1,600 | 7,659 |
| Hangzhou Hikvision Digital Technology Co. Ltd. Class A | | 1,550 | 8,223 |
| Inner Mongoli Yili Industries Co. Ltd. (A Shares) | | 2,200 | 5,828 |
| Jiangsu Hengrui Medicine Co. Ltd. (A Shares) | | 1,000 | 7,780 |
| Kweichow Moutai Co. Ltd. (A Shares) | | 100 | 5,998 |
| Midea Group Co. Ltd. Class A | | 1,500 | 7,324 |
| Shanghai International Airport Co. Ltd. (A Shares) | | 1,600 | 7,950 |
| Sinopharm Group Co. Ltd. (H Shares) | | 1,600 | 7,179 |
| Wuliangye Yibin Co. Ltd. Class A | | 1,100 | 7,260 |
| Yunnan Baiyao Group Co. Ltd. | | 500 | 6,201 |
|
| TOTAL CHINA | | | 71,402 |
|
| Denmark - 0.6% | | | |
| Jyske Bank A/S (Reg.) | | 239 | 12,772 |
| Novo Nordisk A/S Series B sponsored ADR | | 391 | 15,124 |
| Scandinavian Tobacco Group A/S | | 88 | 1,536 |
| Spar Nord Bank A/S | | 208 | 2,358 |
|
| TOTAL DENMARK | | | 31,790 |
|
| Finland - 0.5% | | | |
| Sampo Oyj (A Shares) | | 388 | 18,592 |
| Tikkurila Oyj | | 370 | 7,335 |
|
| TOTAL FINLAND | | | 25,927 |
|
| France - 5.7% | | | |
| Atos Origin SA | | 184 | 24,112 |
| AXA SA | | 896 | 23,905 |
| Bouygues SA | | 169 | 7,105 |
| Capgemini SA | | 138 | 13,817 |
| Compagnie de St. Gobain | | 299 | 16,138 |
| Dassault Systemes SA | | 80 | 7,140 |
| Elis SA | | 135 | 2,794 |
| Essilor International SA | | 107 | 13,864 |
| Havas SA | | 1,101 | 10,181 |
| Laurent-Perrier Group SA | | 17 | 1,309 |
| LVMH Moet Hennessy - Louis Vuitton SA | | 28 | 6,912 |
| Natixis SA | | 1,374 | 9,559 |
| Sanofi SA | | 357 | 33,734 |
| Societe Generale Series A | | 477 | 26,155 |
| SR Teleperformance SA | | 99 | 12,439 |
| Total SA | | 981 | 50,358 |
| Vetoquinol SA | | 33 | 1,812 |
| VINCI SA | | 288 | 24,549 |
| Virbac SA (a) | | 14 | 2,204 |
| Vivendi SA | | 609 | 12,084 |
|
| TOTAL FRANCE | | | 300,171 |
|
| Germany - 4.4% | | | |
| Axel Springer Verlag AG | | 144 | 8,080 |
| BASF AG | | 302 | 29,430 |
| Bayer AG | | 292 | 36,130 |
| Brenntag AG | | 125 | 7,413 |
| CompuGroup Medical AG | | 127 | 6,253 |
| CTS Eventim AG | | 115 | 4,430 |
| Deutsche Telekom AG | | 1,418 | 24,873 |
| Fielmann AG | | 23 | 1,758 |
| Fresenius SE & Co. KGaA | | 170 | 13,779 |
| HeidelbergCement Finance AG | | 130 | 12,037 |
| Linde AG | | 39 | 7,008 |
| Nexus AG | | 80 | 1,926 |
| SAP AG | | 606 | 60,701 |
| Symrise AG | | 110 | 7,701 |
| Vonovia SE | | 302 | 10,933 |
|
| TOTAL GERMANY | | | 232,452 |
|
| Greece - 0.1% | | | |
| Titan Cement Co. SA (Reg.) | | 300 | 7,840 |
| Hong Kong - 1.6% | | | |
| AIA Group Ltd. | | 7,800 | 54,000 |
| CSPC Pharmaceutical Group Ltd. | | 6,000 | 8,331 |
| Guangdong Investment Ltd. | | 6,000 | 9,287 |
| Power Assets Holdings Ltd. | | 1,000 | 8,999 |
| Techtronic Industries Co. Ltd. | | 1,500 | 6,441 |
|
| TOTAL HONG KONG | | | 87,058 |
|
| India - 0.2% | | | |
| HDFC Bank Ltd. sponsored ADR | | 99 | 7,881 |
| Indonesia - 0.8% | | | |
| PT Bank Central Asia Tbk | | 9,500 | 12,651 |
| PT Bank Rakyat Indonesia Tbk | | 18,120 | 17,537 |
| PT Telkomunikasi Indonesia Tbk Series B | | 35,800 | 11,810 |
|
| TOTAL INDONESIA | | | 41,998 |
|
| Ireland - 2.0% | | | |
| Accenture PLC Class A | | 113 | 13,707 |
| Allergan PLC | | 31 | 7,560 |
| CRH PLC | | 300 | 10,927 |
| CRH PLC sponsored ADR | | 933 | 33,887 |
| James Hardie Industries PLC CDI | | 1,775 | 30,131 |
| Medtronic PLC | | 113 | 9,389 |
|
| TOTAL IRELAND | | | 105,601 |
|
| Isle of Man - 0.2% | | | |
| Playtech Ltd. | | 958 | 11,899 |
| Israel - 0.9% | | | |
| Azrieli Group | | 132 | 7,030 |
| Check Point Software Technologies Ltd. (a) | | 100 | 10,401 |
| Elbit Systems Ltd. (Israel) | | 100 | 11,914 |
| Frutarom Industries Ltd. | | 100 | 5,878 |
| Ituran Location & Control Ltd. | | 98 | 3,067 |
| Strauss Group Ltd. | | 132 | 2,321 |
| Teva Pharmaceutical Industries Ltd. sponsored ADR | | 225 | 7,106 |
|
| TOTAL ISRAEL | | | 47,717 |
|
| Italy - 0.9% | | | |
| Azimut Holding SpA | | 349 | 6,813 |
| Beni Stabili SpA SIIQ | | 2,099 | 1,333 |
| Interpump Group SpA | | 801 | 21,246 |
| Intesa Sanpaolo SpA | | 5,826 | 17,007 |
|
| TOTAL ITALY | | | 46,399 |
|
| Japan - 13.2% | | | |
| AEON Financial Service Co. Ltd. | | 400 | 7,682 |
| Ai Holdings Corp. | | 100 | 2,460 |
| Artnature, Inc. | | 200 | 1,281 |
| Asahi Co. Ltd. | | 100 | 1,280 |
| Astellas Pharma, Inc. | | 1,400 | 18,462 |
| Azbil Corp. | | 200 | 6,728 |
| Broadleaf Co. Ltd. | | 100 | 649 |
| Daiichikosho Co. Ltd. | | 100 | 4,337 |
| Daikokutenbussan Co. Ltd. | | 100 | 4,781 |
| DENSO Corp. | | 380 | 16,359 |
| Dentsu, Inc. | | 91 | 5,127 |
| East Japan Railway Co. | | 300 | 26,788 |
| Funai Soken Holdings, Inc. | | 100 | 1,922 |
| GCA Savvian Group Corp. | | 200 | 1,617 |
| Goldcrest Co. Ltd. | | 200 | 3,552 |
| Hoya Corp. | | 700 | 33,432 |
| Itochu Corp. | | 1,200 | 16,965 |
| Japan Tobacco, Inc. | | 95 | 3,158 |
| Kao Corp. | | 200 | 11,030 |
| KDDI Corp. | | 800 | 21,211 |
| Keyence Corp. | | 100 | 40,188 |
| Kobayashi Pharmaceutical Co. Ltd. | | 100 | 5,239 |
| Komatsu Ltd. | | 1,100 | 29,394 |
| Lasertec Corp. | | 200 | 2,603 |
| Makita Corp. | | 300 | 10,697 |
| Miroku Jyoho Service Co., Ltd. | | 100 | 1,895 |
| Misumi Group, Inc. | | 900 | 17,043 |
| Mitsubishi UFJ Financial Group, Inc. | | 6,915 | 43,818 |
| Mitsui Fudosan Co. Ltd. | | 1,000 | 21,974 |
| Nagaileben Co. Ltd. | | 200 | 4,607 |
| ND Software Co. Ltd. | | 100 | 903 |
| Nihon Parkerizing Co. Ltd. | | 400 | 5,135 |
| Nippon Telegraph & Telephone Corp. | | 400 | 17,142 |
| Nomura Holdings, Inc. | | 2,200 | 13,221 |
| OBIC Co. Ltd. | | 300 | 16,201 |
| Olympus Corp. | | 700 | 26,939 |
| ORIX Corp. | | 1,200 | 18,311 |
| OSG Corp. | | 600 | 12,353 |
| Panasonic Corp. | | 762 | 9,112 |
| Paramount Bed Holdings Co. Ltd. | | 100 | 4,194 |
| ProNexus, Inc. | | 200 | 2,505 |
| Recruit Holdings Co. Ltd. | | 300 | 15,151 |
| San-Ai Oil Co. Ltd. | | 200 | 1,697 |
| Seven & i Holdings Co. Ltd. | | 300 | 12,675 |
| Shin-Etsu Chemical Co. Ltd. | | 204 | 17,722 |
| Shinsei Bank Ltd. | | 5,000 | 9,329 |
| SHO-BOND Holdings Co. Ltd. | | 360 | 16,470 |
| Shoei Co. Ltd. | | 100 | 2,776 |
| Sony Corp. | | 400 | 13,726 |
| Sony Financial Holdings, Inc. | | 600 | 9,968 |
| Subaru Corp. | | 195 | 7,368 |
| Taiheiyo Cement Corp. | | 2,098 | 6,982 |
| TKC Corp. | | 100 | 2,718 |
| Tokio Marine Holdings, Inc. | | 400 | 16,836 |
| Toyota Motor Corp. | | 800 | 43,297 |
| USS Co. Ltd. | | 1,600 | 28,275 |
| Welcia Holdings Co. Ltd. | | 100 | 3,220 |
| Workman Co. Ltd. | | 100 | 2,924 |
|
| TOTAL JAPAN | | | 703,429 |
|
| Kenya - 0.3% | | | |
| Safaricom Ltd. | | 78,900 | 14,717 |
| Korea (South) - 2.6% | | | |
| BGFretail Co. Ltd. | | 279 | 26,855 |
| Coway Co. Ltd. | | 99 | 8,746 |
| Leeno Industrial, Inc. | | 25 | 936 |
| LG Household & Health Care Ltd. | | 12 | 9,135 |
| NAVER Corp. | | 27 | 18,987 |
| Samsung Electronics Co. Ltd. | | 37 | 72,562 |
|
| TOTAL KOREA (SOUTH) | | | 137,221 |
|
| Luxembourg - 0.1% | | | |
| Eurofins Scientific SA | | 15 | 7,387 |
| Mexico - 1.8% | | | |
| CEMEX S.A.B. de CV sponsored ADR | | 1,180 | 10,880 |
| Consorcio ARA S.A.B. de CV | | 3,900 | 1,301 |
| Embotelladoras Arca S.A.B. de CV | | 1,200 | 8,852 |
| Fomento Economico Mexicano S.A.B. de CV: | | | |
| unit | | 1,300 | 11,699 |
| sponsored ADR | | 90 | 8,104 |
| Gruma S.A.B. de CV Series B | | 600 | 8,012 |
| Grupo Aeroportuario del Pacifico S.A.B. de CV Series B | | 800 | 8,227 |
| Grupo Aeroportuario del Sureste S.A.B. de CV Series B | | 460 | 8,729 |
| Grupo Aeroportuario Norte S.A.B. de CV | | 1,200 | 6,659 |
| Grupo Cementos de Chihuahua S.A.B. de CV | | 1,600 | 7,589 |
| Grupo Mexico SA de CV Series B | | 3,300 | 9,706 |
| Promotora y Operadora de Infraestructura S.A.B. de CV | | 765 | 8,162 |
|
| TOTAL MEXICO | | | 97,920 |
|
| Netherlands - 2.2% | | | |
| Akzo Nobel NV | | 64 | 5,597 |
| ASML Holding NV (Netherlands) | | 300 | 39,656 |
| ING Groep NV (Certificaten Van Aandelen) | | 1,744 | 28,426 |
| PostNL NV | | 826 | 4,091 |
| RELX NV | | 878 | 16,981 |
| Takeaway.com Holding BV (b) | | 31 | 1,044 |
| VastNed Retail NV | | 59 | 2,204 |
| Wolters Kluwer NV | | 243 | 10,321 |
| Yandex NV Series A (a) | | 263 | 7,169 |
|
| TOTAL NETHERLANDS | | | 115,489 |
|
| New Zealand - 0.1% | | | |
| Auckland International Airport Ltd. | | 1,163 | 5,510 |
| Norway - 0.3% | | | |
| Kongsberg Gruppen ASA | | 100 | 1,561 |
| Skandiabanken ASA | | 104 | 930 |
| Statoil ASA | | 898 | 14,789 |
|
| TOTAL NORWAY | | | 17,280 |
|
| Philippines - 0.8% | | | |
| Ayala Corp. | | 510 | 8,812 |
| Ayala Land, Inc. | | 11,700 | 8,235 |
| D&L Industries, Inc. | | 26,200 | 6,687 |
| Jollibee Food Corp. | | 390 | 1,633 |
| SM Investments Corp. | | 590 | 8,564 |
| SM Prime Holdings, Inc. | | 13,800 | 8,200 |
|
| TOTAL PHILIPPINES | | | 42,131 |
|
| Russia - 0.8% | | | |
| Alrosa Co. Ltd. (a) | | 4,700 | 8,100 |
| Magnit OJSC | | 61 | 9,404 |
| NOVATEK OAO GDR (Reg. S) | | 77 | 9,332 |
| Sberbank of Russia | | 5,620 | 16,324 |
|
| TOTAL RUSSIA | | | 43,160 |
|
| South Africa - 2.6% | | | |
| Aspen Pharmacare Holdings Ltd. | | 400 | 8,298 |
| Bidcorp Ltd. | | 400 | 8,475 |
| Capitec Bank Holdings Ltd. | | 100 | 5,706 |
| Clicks Group Ltd. | | 1,118 | 11,230 |
| Discovery Ltd. | | 800 | 8,010 |
| FirstRand Ltd. | | 3,000 | 11,191 |
| Mondi Ltd. | | 400 | 10,378 |
| Naspers Ltd. Class N | | 340 | 64,652 |
| Sanlam Ltd. | | 1,700 | 9,018 |
|
| TOTAL SOUTH AFRICA | | | 136,958 |
|
| Spain - 3.1% | | | |
| Amadeus IT Holding SA Class A | | 625 | 33,700 |
| Banco Santander SA (Spain) | | 3,736 | 24,365 |
| CaixaBank SA | | 3,730 | 16,936 |
| Hispania Activos Inmobiliarios SA | | 485 | 7,322 |
| Iberdrola SA | | 3,237 | 23,279 |
| Inditex SA | | 1,021 | 39,160 |
| Merlin Properties Socimi SA | | 567 | 6,711 |
| Prosegur Compania de Seguridad SA (Reg.) | | 1,765 | 11,516 |
|
| TOTAL SPAIN | | | 162,989 |
|
| Sweden - 3.5% | | | |
| Addlife AB (a) | | 60 | 1,141 |
| AddTech AB (B Shares) | | 128 | 2,305 |
| ASSA ABLOY AB (B Shares) | | 2,026 | 43,895 |
| Atlas Copco AB (A Shares) | | 620 | 23,184 |
| Fagerhult AB | | 480 | 19,807 |
| Investor AB (B Shares) | | 339 | 15,497 |
| Lagercrantz Group AB (B Shares) | | 190 | 2,075 |
| Loomis AB (B Shares) | | 67 | 2,432 |
| Nordea Bank AB | | 2,230 | 27,443 |
| Saab AB (B Shares) | | 71 | 3,521 |
| Svenska Cellulosa AB (SCA) (B Shares) | | 424 | 14,045 |
| Svenska Handelsbanken AB (A Shares) | | 973 | 13,809 |
| Swedbank AB (A Shares) | | 580 | 13,745 |
| Telefonaktiebolaget LM Ericsson (B Shares) | | 763 | 4,957 |
|
| TOTAL SWEDEN | | | 187,856 |
|
| Switzerland - 5.9% | | | |
| ABB Ltd. (Reg.) | | 768 | 18,819 |
| Credit Suisse Group AG | | 503 | 7,671 |
| Lafargeholcim Ltd. (Reg.) | | 201 | 11,393 |
| Nestle SA (Reg. S) | | 1,448 | 111,526 |
| Novartis AG | | 597 | 45,960 |
| Roche Holding AG (participation certificate) | | 169 | 44,221 |
| Schindler Holding AG: | | | |
| (participation certificate) | | 71 | 14,507 |
| (Reg.) | | 18 | 3,575 |
| Tecan Group AG | | 10 | 1,707 |
| UBS Group AG | | 1,663 | 28,288 |
| Zurich Insurance Group AG | | 88 | 24,353 |
|
| TOTAL SWITZERLAND | | | 312,020 |
|
| Thailand - 0.3% | | | |
| Airports of Thailand PCL (For. Reg.) | | 7,200 | 8,376 |
| Thai Beverage PCL | | 11,400 | 7,548 |
|
| TOTAL THAILAND | | | 15,924 |
|
| Turkey - 0.2% | | | |
| Tofas Turk Otomobil Fabrikasi A/S | | 863 | 7,187 |
| Tupras Turkiye Petrol Rafinelleri A/S | | 179 | 4,510 |
|
| TOTAL TURKEY | | | 11,697 |
|
| United Kingdom - 11.0% | | | |
| Alliance Pharma PLC | | 1,187 | 730 |
| AstraZeneca PLC (United Kingdom) | | 403 | 24,135 |
| Aviva PLC | | 3,588 | 24,400 |
| Avon Rubber PLC | | 78 | 1,060 |
| BAE Systems PLC | | 4,253 | 34,543 |
| Berendsen PLC | | 1,021 | 11,095 |
| BHP Billiton PLC | | 527 | 8,034 |
| BP PLC | | 5,586 | 31,978 |
| British American Tobacco PLC (United Kingdom) | | 860 | 58,105 |
| Bunzl PLC | | 519 | 16,187 |
| Compass Group PLC | | 858 | 17,324 |
| Dechra Pharmaceuticals PLC | | 195 | 4,268 |
| Domino's Pizza UK & IRL PLC | | 244 | 1,044 |
| DP Poland PLC (a) | | 2,416 | 1,588 |
| Elementis PLC | | 2,196 | 8,652 |
| Great Portland Estates PLC | | 314 | 2,814 |
| Howden Joinery Group PLC | | 1,308 | 7,844 |
| HSBC Holdings PLC sponsored ADR | | 379 | 15,603 |
| Imperial Tobacco Group PLC | | 315 | 15,430 |
| Informa PLC | | 4,203 | 34,949 |
| InterContinental Hotel Group PLC | | 133 | 7,056 |
| InterContinental Hotel Group PLC ADR | | 633 | 33,416 |
| ITV PLC | | 3,094 | 8,415 |
| Just Eat Holding Ltd. (a) | | 199 | 1,487 |
| Lloyds Banking Group PLC | | 33,489 | 30,091 |
| NMC Health PLC | | 299 | 7,695 |
| Prudential PLC | | 1,620 | 35,954 |
| Reckitt Benckiser Group PLC | | 500 | 46,069 |
| Rightmove PLC | | 142 | 7,699 |
| Rio Tinto PLC | | 547 | 21,579 |
| Royal Dutch Shell PLC Class B (United Kingdom) | | 277 | 7,370 |
| Shaftesbury PLC | | 654 | 7,895 |
| Spectris PLC | | 351 | 12,547 |
| Spirax-Sarco Engineering PLC | | 112 | 7,543 |
| Standard Chartered PLC (United Kingdom) (a) | | 1,841 | 17,197 |
| Ultra Electronics Holdings PLC | | 107 | 2,899 |
| Unilever PLC | | 133 | 6,843 |
| Unite Group PLC | | 244 | 2,045 |
|
| TOTAL UNITED KINGDOM | | | 583,583 |
|
| United States of America - 8.8% | | | |
| A.O. Smith Corp. | | 118 | 6,358 |
| Alphabet, Inc.: | | | |
| Class A (a) | | 32 | 29,585 |
| Class C (a) | | 7 | 6,342 |
| Amazon.com, Inc. (a) | | 8 | 7,400 |
| Amgen, Inc. | | 39 | 6,369 |
| Amphenol Corp. Class A | | 94 | 6,797 |
| Autoliv, Inc. | | 164 | 16,431 |
| Berkshire Hathaway, Inc. Class B (a) | | 123 | 20,321 |
| China Biologic Products, Inc. (a) | | 156 | 18,408 |
| ConocoPhillips Co. | | 276 | 13,223 |
| Constellation Brands, Inc. Class A (sub. vtg.) | | 41 | 7,074 |
| Domino's Pizza, Inc. | | 34 | 6,167 |
| Edgewell Personal Care Co. (a) | | 65 | 4,647 |
| Facebook, Inc. Class A (a) | | 51 | 7,663 |
| Martin Marietta Materials, Inc. | | 86 | 18,936 |
| MasterCard, Inc. Class A | | 360 | 41,875 |
| Mettler-Toledo International, Inc. (a) | | 14 | 7,188 |
| Mohawk Industries, Inc. (a) | | 79 | 18,548 |
| Molson Coors Brewing Co. Class B | | 173 | 16,589 |
| Moody's Corp. | | 150 | 17,748 |
| MSCI, Inc. | | 196 | 19,663 |
| Philip Morris International, Inc. | | 317 | 35,136 |
| PPG Industries, Inc. | | 72 | 7,908 |
| PriceSmart, Inc. | | 98 | 8,521 |
| ResMed, Inc. | | 184 | 12,510 |
| S&P Global, Inc. | | 252 | 33,816 |
| Sherwin-Williams Co. | | 69 | 23,093 |
| The Walt Disney Co. | | 14 | 1,618 |
| Visa, Inc. Class A | | 540 | 49,259 |
|
| TOTAL UNITED STATES OF AMERICA | | | 469,193 |
|
| TOTAL COMMON STOCKS | | | |
| (Cost $4,678,392) | | | 4,937,454 |
|
| Nonconvertible Preferred Stocks - 1.2% | | | |
| Brazil - 0.9% | | | |
| Ambev SA sponsored ADR | | 2,656 | 15,219 |
| Itau Unibanco Holding SA | | 1,600 | 19,790 |
| Itausa-Investimentos Itau SA (PN) | | 3,500 | 10,906 |
|
| TOTAL BRAZIL | | | 45,915 |
|
| Germany - 0.1% | | | |
| Sartorius AG (non-vtg.) | | 73 | 6,684 |
| Spain - 0.2% | | | |
| Grifols SA Class B | | 463 | 9,883 |
| TOTAL NONCONVERTIBLE PREFERRED STOCKS | | | |
| (Cost $59,033) | | | 62,482 |
|
| Investment Companies - 2.8% | | | |
| United States of America - 2.8% | | | |
| WisdomTree India Earnings ETF | | | |
| (Cost $135,934) | | 5,933 | 147,380 |
|
| Money Market Funds - 2.6% | | | |
| Fidelity Cash Central Fund, 0.85% (c) | | | |
| (Cost $136,351) | | 136,323 | 136,351 |
| TOTAL INVESTMENT PORTFOLIO - 99.5% | | | |
| (Cost $5,009,710) | | | 5,283,667 |
| NET OTHER ASSETS (LIABILITIES) - 0.5% | | | 28,517 |
| NET ASSETS - 100% | | | $5,312,184 |
Security Type Abbreviations
ETF – Exchange-Traded Fund
Categorizations in the Schedule of Investments are based on country or territory of incorporation.
Legend
(a) Non-income producing
(b) Security exempt from registration under Rule 144A of the Securities Act of 1933. These securities may be resold in transactions exempt from registration, normally to qualified institutional buyers. At the end of the period, the value of these securities amounted to $1,044 or 0.0% of net assets.
(c) Affiliated fund that is generally available only to investment companies and other accounts managed by Fidelity Investments. The rate quoted is the annualized seven-day yield of the fund at period end. A complete unaudited listing of the fund's holdings as of its most recent quarter end is available upon request. In addition, each Fidelity Central Fund's financial statements are available on the SEC's website or upon request.
Affiliated Central Funds
Information regarding fiscal year to date income earned by the Fund from investments in Fidelity Central Funds is as follows:
| Fund | Income earned |
| Fidelity Cash Central Fund | $535 |
| Total | $535 |
Investment Valuation
The following is a summary of the inputs used, as of April 30, 2017, involving the Fund's assets and liabilities carried at fair value. The inputs or methodology used for valuing securities may not be an indication of the risk associated with investing in those securities. For more information on valuation inputs, and their aggregation into the levels used below, please refer to the Investment Valuation section in the accompanying Notes to Financial Statements.
| | Valuation Inputs at Reporting Date: |
| Description | Total | Level 1 | Level 2 | Level 3 |
| Investments in Securities: | | | | |
| Equities: | | | | |
| Consumer Discretionary | $527,455 | $372,432 | $155,023 | $-- |
| Consumer Staples | 629,375 | 340,749 | 288,626 | -- |
| Energy | 197,011 | 92,516 | 104,495 | -- |
| Financials | 992,042 | 645,298 | 346,744 | -- |
| Health Care | 532,441 | 329,799 | 202,642 | -- |
| Industrials | 683,648 | 564,076 | 119,572 | -- |
| Information Technology | 742,426 | 600,284 | 142,142 | -- |
| Materials | 455,736 | 415,196 | 40,540 | -- |
| Real Estate | 101,239 | 101,239 | -- | -- |
| Telecommunication Services | 89,753 | 14,717 | 75,036 | -- |
| Utilities | 48,810 | 48,810 | -- | -- |
| Investment Companies | 147,380 | 147,380 | -- | -- |
| Money Market Funds | 136,351 | 136,351 | -- | -- |
| Total Investments in Securities: | $5,283,667 | $3,808,847 | $1,474,820 | $-- |
See accompanying notes which are an integral part of the financial statements.
Financial Statements
Statement of Assets and Liabilities
| | | April 30, 2017 (Unaudited) |
| Assets | | |
Investment in securities, at value — See accompanying schedule:
Unaffiliated issuers (cost $4,873,359) | $5,147,316 | |
| Fidelity Central Funds (cost $136,351) | 136,351 | |
| Total Investments (cost $5,009,710) | | $5,283,667 |
| Cash | | 23,347 |
| Foreign currency held at value (cost $88) | | 88 |
| Receivable for investments sold | | 10,628 |
| Dividends receivable | | 18,852 |
| Distributions receivable from Fidelity Central Funds | | 159 |
| Other receivables | | 236 |
| Total assets | | 5,336,977 |
| Liabilities | | |
| Payable for investments purchased | $24,789 | |
| Other payables and accrued expenses | 4 | |
| Total liabilities | | 24,793 |
| Net Assets | | $5,312,184 |
| Net Assets consist of: | | |
| Paid in capital | | $5,000,000 |
| Undistributed net investment income | | 33,673 |
| Accumulated undistributed net realized gain (loss) on investments and foreign currency transactions | | 4,383 |
| Net unrealized appreciation (depreciation) on investments and assets and liabilities in foreign currencies | | 274,128 |
| Net Assets, for 500,000 shares outstanding | | $5,312,184 |
| Net Asset Value, offering price and redemption price per share ($5,312,184 ÷ 500,000 shares) | | $10.62 |
See accompanying notes which are an integral part of the financial statements.
Statement of Operations
| | | For the period
March 7, 2017 (commencement of operations) to
April 30, 2017 (Unaudited) |
| Investment Income | | |
| Dividends | | $37,307 |
| Income from Fidelity Central Funds | | 535 |
| Income before foreign taxes withheld | | 37,842 |
| Less foreign taxes withheld | | (4,166) |
| Total income | | 33,676 |
| Expenses | | |
| Commitment fee | $1 | |
| Independent trustees' fees and expenses | 2 | |
| Total expenses | | 3 |
| Net investment income (loss) | | 33,673 |
| Realized and Unrealized Gain (Loss) | | |
| Net realized gain (loss) on: | | |
| Investment securities: | | |
| Unaffiliated issuers | 5,044 | |
| Foreign currency transactions | (661) | |
| Total net realized gain (loss) | | 4,383 |
Change in net unrealized appreciation (depreciation) on:
Investment securities | 273,957 | |
| Assets and liabilities in foreign currencies | 171 | |
| Total change in net unrealized appreciation (depreciation) | | 274,128 |
| Net gain (loss) | | 278,511 |
| Net increase (decrease) in net assets resulting from operations | | $312,184 |
See accompanying notes which are an integral part of the financial statements.
Statement of Changes in Net Assets
| | For the period
March 7, 2017 (commencement of operations) to
April 30, 2017 (Unaudited) |
| Increase (Decrease) in Net Assets | |
| Operations | |
| Net investment income (loss) | $33,673 |
| Net realized gain (loss) | 4,383 |
| Change in net unrealized appreciation (depreciation) | 274,128 |
| Net increase (decrease) in net assets resulting from operations | 312,184 |
| Share transactions | |
| Proceeds from sales of shares | 5,000,000 |
| Net increase (decrease) in net assets resulting from share transactions | 5,000,000 |
| Total increase (decrease) in net assets | 5,312,184 |
| Net Assets | |
| Beginning of period | – |
| End of period | $5,312,184 |
| Other Information | |
| Undistributed net investment income end of period | $33,673 |
| Shares | |
| Sold | 500,000 |
| Net increase (decrease) | 500,000 |
See accompanying notes which are an integral part of the financial statements.
Financial Highlights — Fidelity Flex International Fund
| | Six months ended (Unaudited) April 30, |
| | 2017 A |
| Selected Per–Share Data | |
| Net asset value, beginning of period | $10.00 |
| Income from Investment Operations | |
| Net investment income (loss)B | .07 |
| Net realized and unrealized gain (loss) | .55 |
| Total from investment operations | .62 |
| Net asset value, end of period | $10.62 |
| Total ReturnC | 6.20% |
| Ratios to Average Net AssetsD,E | |
| Expenses before reductionsF | - %G |
| Expenses net of fee waivers, if anyF | - %G |
| Expenses net of all reductionsF | - %G |
| Net investment income (loss) | 4.31%G |
| Supplemental Data | |
| Net assets, end of period (000 omitted) | $5,312 |
| Portfolio turnover rateH | 4%I |
A For the period March 7, 2017 (commencement of operations) to April 30, 2017.
B Calculated based on average shares outstanding during the period.
C Total returns for periods of less than one year are not annualized.
D Fees and expenses of any underlying Fidelity Central Funds are not included in the Fund's expense ratio. The Fund indirectly bears its proportionate share of the expenses of any underlying Fidelity Central Funds.
E Expense ratios reflect operating expenses of the Fund. Expenses before reductions do not reflect amounts reimbursed by the investment adviser or reductions from expense offset arrangements and do not represent the amount paid by the Fund during periods when reimbursements or reductions occur. Expense ratios before reductions for start-up periods may not be representative of longer term operating periods. Expenses net of fee waivers reflect expenses after reimbursement by the investment adviser but prior to reductions from expense offset arrangements. Expenses net of all reductions represent the net expenses paid by the Fund.
F Amount represents less than .005%.
G Annualized
H Amount does not include the portfolio activity of any underlying Fidelity Central Funds.
I Amount not annualized.
See accompanying notes which are an integral part of the financial statements.
Notes to Financial Statements (Unaudited)
For the period ended April 30, 2017
1. Organization.
Fidelity Flex International Fund (the Fund) is a fund of Fidelity Investment Trust (the Trust) and is authorized to issue an unlimited number of shares. Share transactions on the Statement of Changes in Net Assets may contain exchanges between affiliated funds. The Trust is registered under the Investment Company Act of 1940, as amended (the 1940 Act), as an open-end management investment company organized as a Massachusetts business trust. The Fund is available only to certain fee-based accounts offered by Fidelity. The Fund's investments in emerging markets can be subject to social, economic, regulatory, and political uncertainties and can be extremely volatile.
2. Investments in Fidelity Central Funds.
The Fund invests in Fidelity Central Funds, which are open-end investment companies generally available only to other investment companies and accounts managed by the investment adviser and its affiliates. The Fund's Schedule of Investments lists each of the Fidelity Central Funds held as of period end, if any, as an investment of the Fund, but does not include the underlying holdings of each Fidelity Central Fund. As an Investing Fund, the Fund indirectly bears its proportionate share of the expenses of the underlying Fidelity Central Funds.
The Money Market Central Funds seek preservation of capital and current income and are managed by Fidelity Investments Money Management, Inc. (FIMM), an affiliate of the investment adviser. Annualized expenses of the Money Market Central Funds as of their most recent shareholder report date are less than .005%.
A complete unaudited list of holdings for each Fidelity Central Fund is available upon request or at the Securities and Exchange Commission (the SEC) website at www.sec.gov. In addition, the financial statements of the Fidelity Central Funds are available on the SEC website or upon request.
3. Significant Accounting Policies.
The Fund is an investment company and applies the accounting and reporting guidance of the Financial Accounting Standards Board (FASB) Accounting Standards Codification Topic 946 Financial Services – Investments Companies. The financial statements have been prepared in conformity with accounting principles generally accepted in the United States of America (GAAP), which require management to make certain estimates and assumptions at the date of the financial statements. Actual results could differ from those estimates. Subsequent events, if any, through the date that the financial statements were issued have been evaluated in the preparation of the financial statements. The following summarizes the significant accounting policies of the Fund:
Investment Valuation. Investments are valued as of 4:00 p.m. Eastern time on the last calendar day of the period. The Board of Trustees (the Board) has delegated the day to day responsibility for the valuation of the Fund's investments to the Fair Value Committee (the Committee) established by the Fund's investment adviser. In accordance with valuation policies and procedures approved by the Board, the Fund attempts to obtain prices from one or more third party pricing vendors or brokers to value its investments. When current market prices, quotations or currency exchange rates are not readily available or reliable, investments will be fair valued in good faith by the Committee, in accordance with procedures adopted by the Board. Factors used in determining fair value vary by investment type and may include market or investment specific events. The frequency with which these procedures are used cannot be predicted and they may be utilized to a significant extent. The Committee oversees the Fund's valuation policies and procedures and reports to the Board on the Committee's activities and fair value determinations. The Board monitors the appropriateness of the procedures used in valuing the Fund's investments and ratifies the fair value determinations of the Committee.
The Fund categorizes the inputs to valuation techniques used to value its investments into a disclosure hierarchy consisting of three levels as shown below:
- Level 1 – quoted prices in active markets for identical investments
- Level 2 – other significant observable inputs (including quoted prices for similar investments, interest rates, prepayment speeds, etc.)
- Level 3 – unobservable inputs (including the Fund's own assumptions based on the best information available)
Valuation techniques used to value the Fund's investments by major category are as follows:
Equity securities, including restricted securities, for which market quotations are readily available, are valued at the last reported sale price or official closing price as reported by a third party pricing vendor on the primary market or exchange on which they are traded and are categorized as Level 1 in the hierarchy. In the event there were no sales during the day or closing prices are not available, securities are valued at the last quoted bid price or may be valued using the last available price and are generally categorized as Level 2 in the hierarchy. For foreign equity securities, when market or security specific events arise, comparisons to the valuation of American Depositary Receipts (ADRs), futures contracts, Exchange-Traded Funds (ETFs) and certain indexes as well as quoted prices for similar securities may be used and would be categorized as Level 2 in the hierarchy. Utilizing these techniques may result in transfers between Level 1 and Level 2. For equity securities, including restricted securities, where observable inputs are limited, assumptions about market activity and risk are used and these securities may be categorized as Level 3 in the hierarchy.
ETFs are valued at their last sale price or official closing price as reported by a third party pricing vendor on the primary market or exchange on which they are traded and are categorized as Level 1 in the hierarchy. In the event there were no sales during the day but the exchange reports a closing bid level, ETFs are valued at the closing bid and would be categorized as Level 1 in the hierarchy. In the event there was no closing bid, ETFs may be valued by another method that the Board believes reflects fair value in accordance with the Board's fair value pricing policies and may be categorized as Level 2 in the hierarchy.
Investments in open-end mutual funds, including the Fidelity Central Funds, are valued at their closing net asset value (NAV) each business day and are categorized as Level 1 in the hierarchy.
Changes in valuation techniques may result in transfers in or out of an assigned level within the disclosure hierarchy. The aggregate value of investments by input level as of April 30, 2017 is included at the end of the Fund's Schedule of Investments.
Foreign Currency. The Fund may use foreign currency contracts to facilitate transactions in foreign-denominated securities. Gains and losses from these transactions may arise from changes in the value of the foreign currency or if the counterparties do not perform under the contracts' terms.
Foreign-denominated assets, including investment securities, and liabilities are translated into U.S. dollars at the exchange rates at period end. Purchases and sales of investment securities, income and dividends received and expenses denominated in foreign currencies are translated into U.S. dollars at the exchange rate in effect on the transaction date.
The effects of exchange rate fluctuations on investments are included with the net realized and unrealized gain (loss) on investment securities. Other foreign currency transactions resulting in realized and unrealized gain (loss) are disclosed separately.
Investment Transactions and Income. For financial reporting purposes, the Fund's investment holdings and NAV include trades executed through the end of the last business day of the period. The NAV per share for processing shareholder transactions is calculated as of the close of business of the New York Stock Exchange (NYSE), normally 4:00 p.m. Eastern time and includes trades executed through the end of the prior business day. Gains and losses on securities sold are determined on the basis of identified cost. Dividend income is recorded on the ex-dividend date, except for certain dividends from foreign securities where the ex-dividend date may have passed, which are recorded as soon as the Fund is informed of the ex-dividend date. Non-cash dividends included in dividend income, if any, are recorded at the fair market value of the securities received. Income and capital gain distributions from Fidelity Central Funds, if any, are recorded on the ex-dividend date. Investment income is recorded net of foreign taxes withheld where recovery of such taxes is uncertain.
Expenses. Expenses directly attributable to a fund are charged to that fund. Expenses attributable to more than one fund are allocated among the respective funds on the basis of relative net assets or other appropriate methods. Expense estimates are accrued in the period to which they relate and adjustments are made when actual amounts are known.
Income Tax Information and Distributions to Shareholders. Each year, the Fund intends to qualify as a regulated investment company under Subchapter M of the Internal Revenue Code, including distributing substantially all of its taxable income and realized gains. As a result, no provision for U.S. Federal income taxes is required. The Fund files a U.S. federal tax return, in addition to state and local tax returns as required. The Fund's federal income tax returns are subject to examination by the Internal Revenue Service (IRS) for a period of three fiscal years after they are filed. State and local tax returns may be subject to examination for an additional fiscal year depending on the jurisdiction. Foreign taxes are provided for based on the Fund's understanding of the tax rules and rates that exist in the foreign markets in which it invests.
Distributions are declared and recorded on the ex-dividend date. Income and capital gain distributions are determined in accordance with income tax regulations, which may differ from GAAP.
Capital accounts within the financial statements are adjusted for permanent book-tax differences. These adjustments have no impact on net assets or the results of operations. Capital accounts are not adjusted for temporary book-tax differences which will reverse in a subsequent period.
The federal tax cost of investment securities and unrealized appreciation (depreciation) as of period end were as follows:
| Gross unrealized appreciation | $304,455 |
| Gross unrealized depreciation | (30,583) |
| Net unrealized appreciation (depreciation) on securities | $273,872 |
| Tax cost | $5,009,795 |
Restricted Securities. The Fund may invest in securities that are subject to legal or contractual restrictions on resale. These securities generally may be resold in transactions exempt from registration or to the public if the securities are registered. Disposal of these securities may involve time-consuming negotiations and expense, and prompt sale at an acceptable price may be difficult. Information regarding restricted securities is included at the end of the Fund's Schedule of Investments.
4. Purchases and Sales of Investments.
Purchases and sales of securities, other than short-term securities, aggregated $5,046,623 and $178,309, respectively.
5. Fees and Other Transactions with Affiliates.
Management Fee. Fidelity Management & Research Company (the investment adviser) and its affiliates provide the Fund with investment management related services and the Fund does not pay any fees for these services. Under the management contract, the investment adviser or an affiliate pays all other expenses of the Fund, excluding fees and expenses of the independent Trustees, and certain miscellaneous expenses such as proxy and shareholder meeting expenses.
Brokerage Commissions. The Fund placed a portion of its portfolio transactions with brokerage firms which are affiliates of the investment adviser. Brokerage commissions are included in net realized gain (loss) and change in net unrealized appreciation (depreciation) in the Statement of Operations. The commissions paid to these affiliated firms were $65 for the period.
Interfund Trades. The Fund may purchase from or sell securities to other Fidelity Funds under procedures adopted by the Board. The procedures have been designed to ensure these interfund trades are executed in accordance with Rule 17a-7 of the 1940 Act. Interfund trades are included within the respective purchases and sales amounts shown in the Purchases and Sales of Investments note.
6. Committed Line of Credit.
The Fund participates with other funds managed by the investment adviser or an affiliate in a $4.25 billion credit facility (the "line of credit") to be utilized for temporary or emergency purposes to fund shareholder redemptions or for other short-term liquidity purposes. The Fund has agreed to pay commitment fees on its pro-rata portion of the line of credit, which amounted to $1 and is reflected as Commitment fee on the Statement of Operations. During the period, the Fund did not borrow on this line of credit.
7. Other.
The Fund's organizational documents provide former and current trustees and officers with a limited indemnification against liabilities arising in connection with the performance of their duties to the Fund. In the normal course of business, the Fund may also enter into contracts that provide general indemnifications. The Fund's maximum exposure under these arrangements is unknown as this would be dependent on future claims that may be made against the Fund. The risk of material loss from such claims is considered remote.
At the end of the period, the investment adviser or its affiliates were the owners of record of 100% of the total outstanding shares of the Fund.
Shareholder Expense Example
As a shareholder of the Fund, you incur two types of costs: (1) transaction costs and (2) ongoing costs, including management fees and other Fund expenses. This Example is intended to help you understand your ongoing costs (in dollars) of investing in the Fund and to compare these costs with the ongoing costs of investing in other mutual funds.
The actual expense Example is based on an investment of $1,000 invested at the beginning of the period and held for the entire period (March 7, 2017 to April 30, 2017). The hypothetical expense Example is based on an investment of $1,000 invested for the one-half year period (November 1, 2016 to April 30, 2017).
Actual Expenses
The first line of the accompanying table provides information about actual account values and actual expenses. You may use the information in this line, together with the amount you invested, to estimate the expenses that you paid over the period. Simply divide your account value by $1,000.00 (for example, an $8,600 account value divided by $1,000.00 = 8.6), then multiply the result by the number in the first line under the heading entitled "Expenses Paid During Period" to estimate the expenses you paid on your account during this period. In addition, the Fund, as a shareholder in the underlying Fidelity Central Funds, will indirectly bear its pro-rata share of the fees and expenses incurred by the underlying Fidelity Central Funds. These fees and expenses are not included in the Fund's annualized expense ratio used to calculate the expense estimate in the table below.
Hypothetical Example for Comparison Purposes
The second line of the accompanying table provides information about hypothetical account values and hypothetical expenses based on the Fund's actual expense ratio and an assumed rate of return of 5% per year before expenses, which is not the Fund's actual return. The hypothetical account values and expenses may not be used to estimate the actual ending account balance or expenses you paid for the period. You may use this information to compare the ongoing costs of investing in the Fund and other funds. To do so, compare this 5% hypothetical example with the 5% hypothetical examples that appear in the shareholder reports of the other funds. In addition, the Fund, as a shareholder in the underlying Fidelity Central Funds, will indirectly bear its pro-rata share of the fees and expenses incurred by the underlying Fidelity Central Funds. These fees and expenses are not included in the Fund's annualized expense ratio used to calculate the expense estimate in the table below.
Please note that the expenses shown in the table are meant to highlight your ongoing costs only and do not reflect any transaction costs. Therefore, the second line of the table is useful in comparing ongoing costs only, and will not help you determine the relative total costs of owning different funds.
| | Annualized Expense Ratio-A | Beginning
Account Value | Ending
Account Value
April 30, 2017 | Expenses Paid
During Period |
| Actual | - %B | $1,000.00 | $1,062.00 | $-C |
| Hypothetical-D | | $1,000.00 | $1,024.79 | $-E |
A Annualized expense ratio reflects expenses net of applicable fee waivers.
B Amount represents less than .005%.
C Actual expenses are equal to the Fund's annualized expense ratio, multiplied by the average account value over the period, multiplied by 55/365 (to reflect the period March 7, 2017 to April 30, 2017.
D 5% return per year before expenses
E Hypothetical expenses are equal to each Fund's annualized expense ratio, multiplied by the average account value over the period, multiplied by 181/365 (to reflect the one-half year period).
Board Approval of Investment Advisory Contracts and Management Fees
Fidelity Flex International Fund
On January 18, 2017, the Board of Trustees, including the Independent Trustees (together, the Board), voted to approve the management contract with Fidelity Management & Research Company (FMR) and the sub-advisory agreements with affiliates of FMR (together, the Advisory Contracts) for the fund. The Board, assisted by the advice of fund counsel and Independent Trustees' counsel, considered a broad range of information.
Nature, Extent, and Quality of Services Provided. The Board considered Fidelity's staffing as it relates to the fund, including the backgrounds of investment personnel of Fidelity, and also considered the fund's investment objective, strategies, and related investment philosophy. The Board considered the structure of the investment personnel compensation program and whether this structure provides appropriate incentives to act in the best interests of the fund.
Resources Dedicated to Investment Management and Support Services. The Board and the Fund Oversight and Research Committees reviewed the general qualifications and capabilities of Fidelity's investment staff, including its size, education, experience, and resources, as well as Fidelity's approach to recruiting,training, managing, and compensating investment personnel. The Board noted that Fidelity has continued to increase the resources devoted to non-U.S. offices, including expansion of Fidelity's global investment organization. The Board also noted that Fidelity's analysts have extensive resources, tools and capabilities that allow them to conduct sophisticated quantitative and fundamental analysis, as well as credit analysis of issuers, counterparties and guarantors. Further, the Board considered that Fidelity's investment professionals have sufficient access to global information and data so as to provide competitive investment results over time, and that those professionals also have access to sophisticated tools that permit them to assess portfolio construction and risk and performance attribution characteristics continuously, as well as to transmit new information and research conclusions rapidly around the world. Additionally, in its deliberations, the Board considered Fidelity's trading, risk management, compliance, and technology and operations capabilities and resources, which are integral parts of the investment management process.
Shareholder and Administrative Services. The Board considered the nature, extent, quality, and cost of advisory, administrative, and shareholder services to be performed by FMR, the sub-advisers (together with FMR, the Investment Advisers), and their affiliates under the Advisory Contracts and under separate agreements covering transfer agency, pricing and bookkeeping, and securities lending services for the fund. The Board also considered the nature and extent of the supervision of third party service providers, principally custodians, subcustodians, and pricing vendors.
The Board noted that the growth of fund assets over time across the complex allows Fidelity to reinvest in the development of services designed to enhance the value or convenience of the Fidelity funds as investment vehicles. These services include 24-hour access to account information and market information through telephone representatives and over the Internet, investor education materials and asset allocation tools, and the expanded availability of Fidelity Investor Centers.
Investment Performance. The fund is a new fund and therefore had no historical performance for the Board to review at the time it approved the fund's Advisory Contracts. The Board considered the Investment Advisers' strength in fundamental, research-driven security selection, which the Board is familiar with through its supervision of other Fidelity funds.
Based on its review, the Board concluded that the nature, extent, and quality of services to be provided to the fund under the Advisory Contracts should benefit the shareholders of the fund.
Competitiveness of Management Fee and Total Expense Ratio. The Board noted that the fund is available exclusively to retirement plans offered through certain Fidelity fee-based programs. The Board considered that while the fund does not pay a management fee, FMR is indirectly compensated for its services out of the program fee. The Board noted that FMR pays all operating expenses, with certain limited exceptions, on behalf of the fund. Based on its review, the Board concluded that the fund's management fee and projected total expense ratio were reasonable in light of the services that the fund and its shareholders will receive and the other factors considered.
Costs of the Services and Profitability. The fund is a new fund and therefore no revenue, cost, or profitability data was available for the Board to review in respect of the fund at the time it approved the Advisory Contracts. In connection with its future renewal of the fund's Advisory Contracts, the Board will consider the revenues earned and the expenses incurred by Fidelity in conducting the business of developing, marketing, distributing, managing, administering and servicing the fund and servicing the fund's shareholders.
Economies of Scale. The Board will consider economies of scale when there is operating experience to permit assessment thereof. It noted, however, that because the fund pays no advisory fees and FMR bears most expenses of the fund, economies of scale cannot be realized by the fund.
Based on its evaluation of all of the conclusions noted above, and after considering all factors it believed relevant, the Board concluded that the advisory fee structures are fair and reasonable, and that the fund's Advisory Contracts should be approved.
Corporate Headquarters
245 Summer St.
Boston, MA 02210
www.fidelity.com
ZNL-SANN-0617
1.9881586.100
Fidelity Advisor® Emerging Markets Discovery Fund -
Class A, Class M (formerly Class T), Class C and Class I
Semi-Annual Report April 30, 2017 Class A, Class M, Class C and Class I are classes of Fidelity® Emerging Markets Discovery Fund |
|
Contents
To view a fund's proxy voting guidelines and proxy voting record for the 12-month period ended June 30, visit http://www.fidelity.com/proxyvotingresults or visit the Securities and Exchange Commission's (SEC) web site at http://www.sec.gov.
You may also call 1-877-208-0098 to request a free copy of the proxy voting guidelines.
Standard & Poor's, S&P and S&P 500 are registered service marks of The McGraw-Hill Companies, Inc. and have been licensed for use by Fidelity Distributors Corporation.
Other third-party marks appearing herein are the property of their respective owners.
All other marks appearing herein are registered or unregistered trademarks or service marks of FMR LLC or an affiliated company. © 2017 FMR LLC. All rights reserved.
This report and the financial statements contained herein are submitted for the general information of the shareholders of the Fund. This report is not authorized for distribution to prospective investors in the Fund unless preceded or accompanied by an effective prospectus.
A fund files its complete schedule of portfolio holdings with the SEC for the first and third quarters of each fiscal year on Form N-Q. Forms N-Q are available on the SEC’s web site at http://www.sec.gov. A fund's Forms N-Q may be reviewed and copied at the SEC’s Public Reference Room in Washington, DC. Information regarding the operation of the SEC's Public Reference Room may be obtained by calling 1-800-SEC-0330.
For a complete list of a fund's portfolio holdings, view the most recent holdings listing, semiannual report, or annual report on Fidelity's web site at http://www.fidelity.com, http://www.institutional.fidelity.com, or http://www.401k.com, as applicable.
NOT FDIC INSURED •MAY LOSE VALUE •NO BANK GUARANTEE
Neither the Fund nor Fidelity Distributors Corporation is a bank.
Investment Summary (Unaudited)
Top Five Stocks as of April 30, 2017
| | % of fund's net assets | % of fund's net assets 6 months ago |
| Hyundai Motor Co. Series 2 (Korea (South), Automobiles) | 2.0 | 0.0 |
| Yandex NV Series A (Netherlands, Internet Software & Services) | 1.9 | 0.9 |
| Qingdao Haier Co. Ltd. (China, Household Durables) | 1.6 | 1.2 |
| Arvind Mills Ltd. (India, Textiles, Apparel & Luxury Goods) | 1.4 | 0.7 |
| Shangri-La Asia Ltd. (Bermuda, Hotels, Restaurants & Leisure) | 1.3 | 1.1 |
| | 8.2 | |
Top Five Market Sectors as of April 30, 2017
| | % of fund's net assets | % of fund's net assets 6 months ago |
| Consumer Discretionary | 16.2 | 16.3 |
| Information Technology | 14.8 | 16.3 |
| Industrials | 11.3 | 11.5 |
| Financials | 9.9 | 12.5 |
| Materials | 9.4 | 9.1 |
Top Five Countries as of April 30, 2017
| (excluding cash equivalents) | % of fund's net assets | % of fund's net assets 6 months ago |
| Korea (South) | 12.3 | 9.1 |
| United States of America | 10.6 | 5.9 |
| India | 9.2 | 12.4 |
| Cayman Islands | 9.0 | 10.5 |
| Brazil | 8.9 | 7.5 |
Percentages are adjusted for the effect of futures contracts, if applicable.
Asset Allocation (% of fund's net assets)
| As of April 30, 2017 |
| | Stocks and Equity Futures | 95.1% |
| | Short-Term Investments and Net Other Assets (Liabilities) | 4.9% |

| As of October 31, 2016 |
| | Stocks and Equity Futures | 95.9% |
| | Short-Term Investments and Net Other Assets (Liabilities) | 4.1% |

Percentages shown as 0.0% may reflect amounts less than 0.05%.
Investments April 30, 2017 (Unaudited)
Showing Percentage of Net Assets
| Common Stocks - 81.4% | | | |
| | | Shares | Value |
| Argentina - 0.6% | | | |
| Grupo Superveille SA sponsored ADR | | 18,300 | $310,917 |
| Inversiones y Representaciones SA ADR (a)(b) | | 34,410 | 867,820 |
|
| TOTAL ARGENTINA | | | 1,178,737 |
|
| Bailiwick of Guernsey - 0.3% | | | |
| Etalon Group Ltd. GDR (Reg. S) | | 158,700 | 610,995 |
| Bailiwick of Jersey - 0.5% | | | |
| Atrium European Real Estate Ltd. | | 259,040 | 1,092,007 |
| Bangladesh - 0.2% | | | |
| BRAC Bank Ltd. | | 539,359 | 472,121 |
| Bermuda - 2.1% | | | |
| Credicorp Ltd. (United States) | | 2,600 | 399,516 |
| PAX Global Technology Ltd. | | 1,248,000 | 773,347 |
| Shangri-La Asia Ltd. | | 1,868,000 | 2,675,313 |
| Tai Cheung Holdings Ltd. | | 456,000 | 429,130 |
|
| TOTAL BERMUDA | | | 4,277,306 |
|
| Brazil - 8.0% | | | |
| Arezzo Industria e Comercio SA | | 138,200 | 1,467,318 |
| B2W Companhia Global do Varejo (a) | | 70,340 | 296,514 |
| B2W Companhia Global do Varejo rights (a) | | 23,943 | 99,044 |
| BM&F BOVESPA SA | | 51,300 | 307,246 |
| BR Malls Participacoes SA | | 163,800 | 725,064 |
| BR Properties SA (a) | | 163,600 | 486,566 |
| BTG Pactual Participations Ltd. unit | | 71,700 | 419,938 |
| Cia. Hering SA | | 139,400 | 967,089 |
| Companhia de Saneamento de Minas Gerais | | 57,200 | 648,761 |
| Cosan SA Industria e Comercio | | 92,900 | 1,086,158 |
| Direcional Engenharia SA | | 260,300 | 500,254 |
| Fibria Celulose SA | | 114,700 | 1,062,422 |
| FPC Par Corretora de Seguros | | 57,500 | 342,386 |
| Hypermarcas SA | | 196,438 | 1,860,376 |
| Localiza Rent A Car SA | | 85,900 | 1,280,090 |
| Minerva SA | | 166,300 | 529,176 |
| QGEP Participacoes SA | | 687,000 | 1,376,576 |
| Smiles SA | | 105,200 | 2,288,246 |
| Tegma Gestao Logistica SA | | 208,900 | 858,227 |
|
| TOTAL BRAZIL | | | 16,601,451 |
|
| British Virgin Islands - 0.2% | | | |
| Dolphin Capital Investors Ltd. (a) | | 2,452,257 | 247,741 |
| Mail.Ru Group Ltd. GDR (Reg. S) (a) | | 10,264 | 270,456 |
|
| TOTAL BRITISH VIRGIN ISLANDS | | | 518,197 |
|
| Canada - 1.0% | | | |
| Pan American Silver Corp. | | 60,900 | 1,021,293 |
| Torex Gold Resources, Inc. (a) | | 64,570 | 1,093,629 |
|
| TOTAL CANADA | | | 2,114,922 |
|
| Cayman Islands - 9.0% | | | |
| 51job, Inc. sponsored ADR (a) | | 25,600 | 1,049,344 |
| 58.com, Inc. ADR (a) | | 22,900 | 906,382 |
| Airtac International Group | | 79,000 | 901,797 |
| ASM Pacific Technology Ltd. | | 70,500 | 1,049,567 |
| Boyaa Interactive International Ltd. (a) | | 563,000 | 287,350 |
| Changyou.com Ltd. (A Shares) ADR (a)(b) | | 25,700 | 839,105 |
| Cheetah Mobile, Inc. ADR (a)(b) | | 24,900 | 262,446 |
| China State Construction International Holdings Ltd. | | 814,000 | 1,477,650 |
| Geely Automobile Holdings Ltd. | | 550,000 | 742,445 |
| Goodbaby International Holdings Ltd. | | 1,153,000 | 523,259 |
| Haitian International Holdings Ltd. | | 657,000 | 1,609,907 |
| IGG, Inc. | | 146,000 | 222,237 |
| JA Solar Holdings Co. Ltd. ADR (a)(b) | | 27,200 | 190,672 |
| JinkoSolar Holdings Co. Ltd. ADR (a)(b) | | 25,400 | 440,436 |
| Lee's Pharmaceutical Holdings Ltd. | | 518,500 | 514,610 |
| Pico Far East Holdings Ltd. | | 2,750,000 | 1,113,668 |
| Silicon Motion Technology Corp. sponsored ADR | | 5,100 | 247,605 |
| SINA Corp. | | 3,100 | 238,111 |
| Sinosoft Tech Group Ltd. | | 803,000 | 253,959 |
| SITC International Holdings Co. Ltd. | | 1,915,000 | 1,371,313 |
| Sunny Optical Technology Group Co. Ltd. | | 186,000 | 1,530,402 |
| TPK Holding Co. Ltd. (a) | | 59,000 | 210,833 |
| Uni-President China Holdings Ltd. | | 1,544,000 | 1,083,808 |
| Vinda International Holdings Ltd. | | 516,000 | 1,048,140 |
| Yirendai Ltd. sponsored ADR (a)(b) | | 7,300 | 182,208 |
| YY, Inc. ADR (a) | | 7,700 | 377,069 |
|
| TOTAL CAYMAN ISLANDS | | | 18,674,323 |
|
| Chile - 1.9% | | | |
| Compania Cervecerias Unidas SA sponsored ADR | | 40,500 | 1,043,685 |
| CorpBanca SA (a) | | 27,171,980 | 247,656 |
| Empresas CMPC SA | | 264,175 | 613,646 |
| Enersis SA | | 3,288,313 | 652,977 |
| Inversiones La Construccion SA | | 19,581 | 264,051 |
| Sociedad Quimica y Minera de Chile SA (PN-B) sponsored ADR | | 26,500 | 942,075 |
| Vina Concha y Toro SA | | 168,816 | 272,168 |
|
| TOTAL CHILE | | | 4,036,258 |
|
| China - 4.8% | | | |
| BBMG Corp. (H Shares) | | 1,772,000 | 949,975 |
| China Longyuan Power Grid Corp. Ltd. (H Shares) | | 833,200 | 641,636 |
| Huangshan Tourism Development Co. Ltd. | | 567,200 | 842,859 |
| Qingdao Haier Co. Ltd. | | 1,882,254 | 3,328,451 |
| Tong Ren Tang Technologies Co. Ltd. (H Shares) | | 1,022,000 | 1,721,213 |
| TravelSky Technology Ltd. (H Shares) | | 330,000 | 869,722 |
| Tsingtao Brewery Co. Ltd. (H Shares) | | 174,000 | 782,942 |
| Zhengzhou Yutong Bus Co. Ltd. | | 304,634 | 890,017 |
|
| TOTAL CHINA | | | 10,026,815 |
|
| Colombia - 0.3% | | | |
| Bancolombia SA sponsored ADR | | 7,300 | 288,277 |
| Organizacion Terpel SA | | 105,202 | 432,680 |
|
| TOTAL COLOMBIA | | | 720,957 |
|
| Cyprus - 0.4% | | | |
| Globaltrans Investment PLC GDR (Reg. S) | | 117,300 | 887,961 |
| Egypt - 0.4% | | | |
| Credit Agricole Egypt | | 208,180 | 407,133 |
| Egyptian Kuwaiti Holding | | 667,700 | 420,651 |
|
| TOTAL EGYPT | | | 827,784 |
|
| Greece - 1.2% | | | |
| National Bank of Greece SA (a) | | 1,823,300 | 567,714 |
| Titan Cement Co. SA (Reg.) | | 73,900 | 1,931,177 |
|
| TOTAL GREECE | | | 2,498,891 |
|
| Hong Kong - 1.0% | | | |
| China Resources Beer Holdings Co. Ltd. | | 522,000 | 1,256,287 |
| Far East Horizon Ltd. | | 852,584 | 784,807 |
|
| TOTAL HONG KONG | | | 2,041,094 |
|
| India - 9.2% | | | |
| ACC Ltd. | | 3,939 | 99,658 |
| Adani Ports & Special Economic Zone Ltd. (a) | | 280,199 | 1,428,235 |
| Alembic Pharmaceuticals Ltd. (a) | | 175,899 | 1,675,404 |
| Arvind Mills Ltd. | | 466,018 | 2,894,400 |
| Deccan Cements Ltd. | | 44,951 | 887,169 |
| Edelweiss Financial Services Ltd. | | 61,710 | 160,922 |
| EIH Ltd. (a) | | 542,948 | 1,114,779 |
| Federal Bank Ltd. (a) | | 509,137 | 852,125 |
| Gujarat Gas Ltd. (a) | | 1,008 | 13,243 |
| IDFC Ltd. (a) | | 383,973 | 368,504 |
| Iifl Holdings Ltd. | | 53,750 | 401,098 |
| JK Cement Ltd. | | 62,381 | 945,806 |
| LIC Housing Finance Ltd. | | 57,619 | 599,492 |
| Manappuram General Finance & Leasing Ltd. | | 573,259 | 833,272 |
| Phoenix Mills Ltd. | | 133,337 | 857,389 |
| Power Grid Corp. of India Ltd. | | 157,386 | 509,197 |
| Solar Industries India Ltd. | | 105,537 | 1,315,888 |
| Steel Authority of India Ltd. (a) | | 846,743 | 794,851 |
| The Ramco Cements Ltd. (a) | | 85,612 | 915,245 |
| Torrent Pharmaceuticals Ltd. (a) | | 90,300 | 1,992,738 |
| VST Industries Ltd. (a) | | 10,013 | 474,757 |
|
| TOTAL INDIA | | | 19,134,172 |
|
| Indonesia - 1.3% | | | |
| PT Bank Danamon Indonesia Tbk Series A | | 1,323,300 | 482,500 |
| PT Cikarang Listrindo Tbk | | 4,781,400 | 462,751 |
| PT Indo Tambangraya Megah Tbk | | 231,700 | 332,453 |
| PT Media Nusantara Citra Tbk | | 2,235,500 | 306,084 |
| PT Pakuwon Jati Tbk | | 11,890,000 | 557,525 |
| PT Panin Life Tbk (a) | | 28,314,200 | 497,076 |
|
| TOTAL INDONESIA | | | 2,638,389 |
|
| Israel - 0.1% | | | |
| Bezeq The Israel Telecommunication Corp. Ltd. | | 131,460 | 221,229 |
| Japan - 0.1% | | | |
| Rakuten, Inc. | | 25,000 | 255,887 |
| Kazakhstan - 0.1% | | | |
| JSC Halyk Bank of Kazakhstan GDR unit (a) | | 41,000 | 307,500 |
| Kenya - 0.2% | | | |
| KCB Group Ltd. | | 1,433,000 | 437,398 |
| Korea (South) - 9.6% | | | |
| AMOREPACIFIC Group, Inc. | | 6,236 | 720,846 |
| BS Financial Group, Inc. | | 160,389 | 1,347,854 |
| Com2uS Corp. | | 6,263 | 660,654 |
| Daou Technology, Inc. | | 32,066 | 584,889 |
| Dong A Eltek Co. Ltd. | | 8,503 | 175,277 |
| DOUBLEUGAMES Co. Ltd. | | 13,477 | 649,209 |
| Fila Korea Ltd. | | 28,827 | 1,758,609 |
| Hanon Systems | | 102,638 | 763,289 |
| Hyundai Fire & Marine Insurance Co. Ltd. | | 14,919 | 481,300 |
| Hyundai Glovis Co. Ltd. | | 6,053 | 771,523 |
| Hyundai HCN | | 141,419 | 486,066 |
| Hyundai Industrial Development & Construction Co. | | 19,100 | 750,501 |
| Hyundai Mipo Dockyard Co. Ltd. (a) | | 10,019 | 815,541 |
| Hyundai Wia Corp. | | 13,737 | 783,695 |
| KB Financial Group, Inc. | | 9,680 | 425,620 |
| KEPCO Plant Service & Engineering Co. Ltd. | | 15,343 | 774,163 |
| Korea Electric Power Corp. | | 14,957 | 596,347 |
| Korea Express Co. Ltd. (a) | | 6,673 | 976,665 |
| Korean Reinsurance Co. | | 42,656 | 423,710 |
| Medy-Tox, Inc. | | 4,480 | 1,969,845 |
| Minwise Co. Ltd. | | 26,163 | 443,869 |
| MK Electron Co. Ltd. | | 38,844 | 296,725 |
| NCSOFT Corp. | | 4,492 | 1,421,519 |
| Nice Information & Telecom, Inc. | | 9,861 | 235,776 |
| Samjin Pharmaceutical Co. Ltd. | | 39,142 | 1,164,695 |
| Silicon Works Co. Ltd. | | 14,647 | 377,248 |
| SundayToz Corp. | | 6,751 | 132,931 |
|
| TOTAL KOREA (SOUTH) | | | 19,988,366 |
|
| Malaysia - 1.0% | | | |
| Matrix Concepts Holdings Bhd | | 1,016,000 | 606,183 |
| Top Glove Corp. Bhd | | 1,377,600 | 1,450,272 |
|
| TOTAL MALAYSIA | | | 2,056,455 |
|
| Mexico - 3.7% | | | |
| Gruma S.A.B. de CV Series B | | 97,330 | 1,299,681 |
| Grupo Aeroportuario del Pacifico S.A.B. de CV Series B | | 130,400 | 1,341,041 |
| Grupo Comercial Chedraui S.A.B. de CV | | 456,600 | 946,659 |
| Industrias Penoles SA de CV | | 60,430 | 1,470,685 |
| Macquarie Mexican (REIT) | | 399,272 | 437,550 |
| Qualitas Controladora S.A.B. de CV | | 256,500 | 419,796 |
| Tenedora Nemak SA de CV | | 1,374,400 | 1,452,866 |
| Terrafina | | 217,900 | 367,618 |
|
| TOTAL MEXICO | | | 7,735,896 |
|
| Netherlands - 2.2% | | | |
| X5 Retail Group NV GDR (Reg. S) (a) | | 17,900 | 630,975 |
| Yandex NV Series A (a) | | 143,900 | 3,922,714 |
|
| TOTAL NETHERLANDS | | | 4,553,689 |
|
| Pakistan - 0.2% | | | |
| Habib Bank Ltd. | | 133,700 | 351,739 |
| Panama - 0.4% | | | |
| Copa Holdings SA Class A | | 6,900 | 803,298 |
| Philippines - 0.5% | | | |
| Metro Pacific Investments Corp. | | 4,497,200 | 590,044 |
| Robinsons Land Corp. | | 792,300 | 405,222 |
|
| TOTAL PHILIPPINES | | | 995,266 |
|
| Poland - 0.1% | | | |
| Asseco Poland SA | | 12,600 | 177,346 |
| Romania - 0.2% | | | |
| Banca Transilvania SA | | 497,264 | 329,334 |
| Russia - 1.8% | | | |
| Inter Rao Ues JSC (a) | | 12,651,004 | 900,012 |
| Moscow Exchange MICEX-RTS OAO (a) | | 414,500 | 837,683 |
| RusHydro PJSC (a) | | 103,912,000 | 1,633,643 |
| Sistema JSFC | | 599,200 | 224,718 |
| Sistema JSFC sponsored GDR | | 28,460 | 239,349 |
|
| TOTAL RUSSIA | | | 3,835,405 |
|
| Singapore - 0.6% | | | |
| First Resources Ltd. | | 856,800 | 1,149,841 |
| South Africa - 1.8% | | | |
| Bidvest Group Ltd. | | 111,500 | 1,330,866 |
| EOH Holdings Ltd. | | 49,400 | 522,879 |
| Imperial Holdings Ltd. | | 49,500 | 625,947 |
| Pick 'n Pay Stores Ltd. | | 100,500 | 477,542 |
| Reunert Ltd. | | 153,900 | 816,501 |
|
| TOTAL SOUTH AFRICA | | | 3,773,735 |
|
| Sri Lanka - 0.5% | | | |
| Dialog Axiata PLC | | 3,023,372 | 237,905 |
| Hatton National Bank PLC | | 465,838 | 702,575 |
|
| TOTAL SRI LANKA | | | 940,480 |
|
| Taiwan - 7.2% | | | |
| Addcn Technology Co. Ltd. | | 26,000 | 193,991 |
| Advantech Co. Ltd. | | 102,000 | 823,479 |
| Alpha Networks, Inc. | | 550,000 | 446,762 |
| Chipbond Technology Corp. | | 185,000 | 275,452 |
| Cleanaway Co. Ltd. | | 160,000 | 910,565 |
| CTCI Corp. | | 608,000 | 1,062,184 |
| Cub Elecparts, Inc. | | 97,568 | 1,020,133 |
| Elite Advanced Laser Corp. | | 92,000 | 404,857 |
| eMemory Technology, Inc. | | 44,000 | 604,904 |
| Everlight Electronics Co. Ltd. | | 319,000 | 501,357 |
| FLEXium Interconnect, Inc. | | 137,356 | 509,012 |
| Inventec Corp. | | 860,000 | 638,818 |
| Largan Precision Co. Ltd. | | 2,000 | 331,866 |
| Lite-On Technology Corp. | | 666,220 | 1,159,487 |
| Powertech Technology, Inc. | | 172,000 | 538,941 |
| Radiant Opto-Electronics Corp. | | 461,000 | 960,957 |
| Soft-World International Corp. | | 143,000 | 326,473 |
| St.Shine Optical Co. Ltd. | | 32,000 | 618,337 |
| Sunrex Technology Corp. | | 461,000 | 289,050 |
| Synnex Technology International Corp. | | 580,100 | 627,644 |
| Tong Hsing Electronics Industries Ltd. | | 92,000 | 389,637 |
| Tripod Technology Corp. | | 194,000 | 547,537 |
| Universal Cement Corp. | | 451,568 | 389,965 |
| Vanguard International Semiconductor Corp. | | 394,000 | 750,898 |
| Yuanta Financial Holding Co. Ltd. | | 1,446,000 | 617,192 |
|
| TOTAL TAIWAN | | | 14,939,498 |
|
| Thailand - 2.2% | | | |
| Delta Electronics PCL (For. Reg.) | | 338,800 | 900,855 |
| LPN Development PCL (For. Reg.) | | 940,000 | 317,861 |
| PTT Global Chemical PCL (For. Reg.) | | 767,400 | 1,663,439 |
| Sansiri PCL (For. Reg.) | | 5,400,000 | 327,746 |
| Star Petroleum Refining PCL | | 3,766,500 | 1,436,931 |
|
| TOTAL THAILAND | | | 4,646,832 |
|
| Turkey - 3.3% | | | |
| Aksa Akrilik Kimya Sanayii | | 882,000 | 2,634,615 |
| Aselsan A/S | | 283,000 | 1,556,044 |
| Bim Birlesik Magazalar A/S JSC | | 71,000 | 1,160,363 |
| Tupras Turkiye Petrol Rafinelleri A/S | | 57,828 | 1,457,117 |
|
| TOTAL TURKEY | | | 6,808,139 |
|
| United Arab Emirates - 0.9% | | | |
| Emaar Properties PJSC | | 934,134 | 1,826,050 |
| National Bank of Ras Al-Khaimah PSC | | 115,100 | 143,209 |
|
| TOTAL UNITED ARAB EMIRATES | | | 1,969,259 |
|
| United Kingdom - 1.7% | | | |
| BGEO Group PLC | | 10,940 | 510,102 |
| Mondi PLC | | 72,700 | 1,884,162 |
| Shanghai International Airport Co. Ltd. (UBS Warrant Programme) warrants 5/11/18 (a)(c) | | 181,300 | 900,780 |
| TBC Bank Group PLC (a) | | 14,953 | 314,716 |
|
| TOTAL UNITED KINGDOM | | | 3,609,760 |
|
| United States of America - 0.4% | | | |
| Net 1 UEPS Technologies, Inc. (a) | | 32,800 | 355,224 |
| The AES Corp. | | 47,800 | 540,618 |
|
| TOTAL UNITED STATES OF AMERICA | | | 895,842 |
|
| Vietnam - 0.2% | | | |
| FTP Corp. | | 163,990 | 334,924 |
| TOTAL COMMON STOCKS | | | |
| (Cost $153,174,412) | | | 169,469,498 |
|
| Nonconvertible Preferred Stocks - 4.0% | | | |
| Brazil - 0.9% | | | |
| Banco ABC Brasil SA | | 117,950 | 662,204 |
| Banco do Estado Rio Grande do Sul SA | | 91,100 | 407,848 |
| Companhia Paranaense de Energia-Copel (PN-B) sponsored ADR (b) | | 43,600 | 399,812 |
| Metalurgica Gerdau SA (PN) (a) | | 240,700 | 348,835 |
|
| TOTAL BRAZIL | | | 1,818,699 |
|
| Korea (South) - 2.7% | | | |
| Hyundai Motor Co. Series 2 | | 48,580 | 4,240,499 |
| LG Chemical Ltd. | | 5,800 | 927,918 |
| Samsung Fire & Marine Insurance Co. Ltd. | | 2,791 | 440,387 |
|
| TOTAL KOREA (SOUTH) | | | 5,608,804 |
|
| Russia - 0.4% | | | |
| Sberbank of Russia (a) | | 404,100 | 893,114 |
| TOTAL NONCONVERTIBLE PREFERRED STOCKS | | | |
| (Cost $7,753,380) | | | 8,320,617 |
| | | Principal Amount | Value |
|
| Government Obligations - 0.5% | | | |
| United States of America - 0.5% | | | |
| U.S. Treasury Bills, yield at date of purchase 0.5% to 0.76% 5/11/17 to 6/22/17(d) | | | |
| (Cost $979,028) | | 980,000 | 979,088 |
| | | Shares | Value |
|
| Money Market Funds - 14.8% | | | |
| Fidelity Cash Central Fund, 0.85% (e) | | 29,397,836 | 29,403,716 |
| Fidelity Securities Lending Cash Central Fund 0.86% (e)(f) | | 1,551,815 | 1,551,970 |
| TOTAL MONEY MARKET FUNDS | | | |
| (Cost $30,954,612) | | | 30,955,686 |
| TOTAL INVESTMENT PORTFOLIO - 100.7% | | | |
| (Cost $192,861,432) | | | 209,724,889 |
| NET OTHER ASSETS (LIABILITIES) - (0.7)% | | | (1,460,844) |
| NET ASSETS - 100% | | | $208,264,045 |
| Futures Contracts | | | |
| | Expiration Date | Underlying Face Amount at Value | Unrealized Appreciation/(Depreciation) |
| Purchased | | | |
| Equity Index Contracts | | | |
| 412 ICE E-mini MSCI Emerging Markets Index Contracts (United States) | June 2017 | 20,167,400 | $443,176 |
The face value of futures purchased as a percentage of Net Assets is 9.7%
Categorizations in the Schedule of Investments are based on country or territory of incorporation.
Legend
(a) Non-income producing
(b) Security or a portion of the security is on loan at period end.
(c) Security exempt from registration under Rule 144A of the Securities Act of 1933. These securities may be resold in transactions exempt from registration, normally to qualified institutional buyers. At the end of the period, the value of these securities amounted to $900,780 or 0.4% of net assets.
(d) Security or a portion of the security was pledged to cover margin requirements for futures contracts. At period end, the value of securities pledged amounted to $873,196.
(e) Affiliated fund that is generally available only to investment companies and other accounts managed by Fidelity Investments. The rate quoted is the annualized seven-day yield of the fund at period end. A complete unaudited listing of the fund's holdings as of its most recent quarter end is available upon request. In addition, each Fidelity Central Fund's financial statements are available on the SEC's website or upon request.
(f) Investment made with cash collateral received from securities on loan.
Affiliated Central Funds
Information regarding fiscal year to date income earned by the Fund from investments in Fidelity Central Funds is as follows:
| Fund | Income earned |
| Fidelity Cash Central Fund | $48,976 |
| Fidelity Securities Lending Cash Central Fund | 20,992 |
| Total | $69,968 |
Investment Valuation
The following is a summary of the inputs used, as of April 30, 2017, involving the Fund's assets and liabilities carried at fair value. The inputs or methodology used for valuing securities may not be an indication of the risk associated with investing in those securities. For more information on valuation inputs, and their aggregation into the levels used below, please refer to the Investment Valuation section in the accompanying Notes to Financial Statements.
| | Valuation Inputs at Reporting Date: |
| Description | Total | Level 1 | Level 2 | Level 3 |
| Investments in Securities: | | | | |
| Equities: | | | | |
| Consumer Discretionary | $33,614,009 | $33,614,009 | $-- | $-- |
| Consumer Staples | 12,876,870 | 12,876,870 | -- | -- |
| Energy | 5,689,235 | 5,689,235 | -- | -- |
| Financials | 20,971,507 | 19,077,393 | 1,894,114 | -- |
| Health Care | 12,967,490 | 12,967,490 | -- | -- |
| Industrials | 23,663,433 | 23,663,433 | -- | -- |
| Information Technology | 30,665,068 | 30,665,068 | -- | -- |
| Materials | 19,257,838 | 19,257,838 | -- | -- |
| Real Estate | 10,162,467 | 10,162,467 | -- | -- |
| Telecommunication Services | 923,201 | 923,201 | -- | -- |
| Utilities | 6,998,997 | 6,402,650 | 596,347 | -- |
| Government Obligations | 979,088 | -- | 979,088 | -- |
| Money Market Funds | 30,955,686 | 30,955,686 | -- | -- |
| Total Investments in Securities: | $209,724,889 | $206,255,340 | $3,469,549 | $-- |
| Derivative Instruments: | | | | |
| Assets | | | | |
| Futures Contracts | $443,176 | $443,176 | $-- | $-- |
| Total Assets | $443,176 | $443,176 | $-- | $-- |
| Total Derivative Instruments: | $443,176 | $443,176 | $-- | $-- |
Value of Derivative Instruments
The following table is a summary of the Fund's value of derivative instruments by primary risk exposure as of April 30, 2017. For additional information on derivative instruments, please refer to the Derivative Instruments section in the accompanying Notes to Financial Statements.
| Primary Risk Exposure / Derivative Type | Value |
| | Asset | Liability |
| Equity Risk | | |
| Futures Contracts(a) | $443,176 | $0 |
| Total Equity Risk | 443,176 | 0 |
| Total Value of Derivatives | $443,176 | $0 |
(a) Reflects gross cumulative appreciation (depreciation) on futures contracts as presented in the Schedule of Investments. In the Statement of Assets and Liabilities, the period end daily variation margin is included in receivable or payable for daily variation margin for derivative instruments, and the net cumulative appreciation (depreciation) is included in net unrealized appreciation (depreciation).
See accompanying notes which are an integral part of the financial statements.
Financial Statements
Statement of Assets and Liabilities
| | | April 30, 2017 (Unaudited) |
| Assets | | |
Investment in securities, at value (including securities loaned of $1,516,131) — See accompanying schedule:
Unaffiliated issuers (cost $161,906,820) | $178,769,203 | |
| Fidelity Central Funds (cost $30,954,612) | 30,955,686 | |
| Total Investments (cost $192,861,432) | | $209,724,889 |
| Cash | | 174,898 |
| Foreign currency held at value (cost $134,176) | | 134,160 |
| Receivable for investments sold | | 633,326 |
| Receivable for fund shares sold | | 2,083,452 |
| Dividends receivable | | 351,679 |
| Distributions receivable from Fidelity Central Funds | | 20,940 |
| Receivable for daily variation margin for derivative instruments | | 67,980 |
| Prepaid expenses | | 45 |
| Other receivables | | 39,978 |
| Total assets | | 213,231,347 |
| Liabilities | | |
| Payable for investments purchased | $2,623,073 | |
| Payable for fund shares redeemed | 398,643 | |
| Accrued management fee | 130,320 | |
| Distribution and service plan fees payable | 8,702 | |
| Other affiliated payables | 33,120 | |
| Other payables and accrued expenses | 221,569 | |
| Collateral on securities loaned | 1,551,875 | |
| Total liabilities | | 4,967,302 |
| Net Assets | | $208,264,045 |
| Net Assets consist of: | | |
| Paid in capital | | $196,166,233 |
| Undistributed net investment income | | 483,103 |
| Accumulated undistributed net realized gain (loss) on investments and foreign currency transactions | | (5,533,048) |
| Net unrealized appreciation (depreciation) on investments and assets and liabilities in foreign currencies | | 17,147,757 |
| Net Assets | | $208,264,045 |
| Calculation of Maximum Offering Price | | |
| Class A: | | |
| Net Asset Value and redemption price per share ($9,008,987 ÷ 673,521 shares) | | $13.38 |
| Maximum offering price per share (100/94.25 of $13.38) | | $14.20 |
| Class M: | | |
| Net Asset Value and redemption price per share ($6,524,390 ÷ 490,018 shares) | | $13.31 |
| Maximum offering price per share (100/96.50 of $13.31) | | $13.79 |
| Class C: | | |
| Net Asset Value and offering price per share ($6,104,468 ÷ 466,608 shares)(a) | | $13.08 |
| Emerging Markets Discovery: | | |
| Net Asset Value, offering price and redemption price per share ($145,323,553 ÷ 10,814,938 shares) | | $13.44 |
| Class I: | | |
| Net Asset Value, offering price and redemption price per share ($41,302,647 ÷ 3,067,270 shares) | | $13.47 |
(a) Redemption price per share is equal to net asset value less any applicable contingent deferred sales charge.
See accompanying notes which are an integral part of the financial statements.
Statement of Operations
| | | Six months ended April 30, 2017 (Unaudited) |
| Investment Income | | |
| Dividends | | $1,439,687 |
| Interest | | 1,475 |
| Income from Fidelity Central Funds | | 69,968 |
| Income before foreign taxes withheld | | 1,511,130 |
| Less foreign taxes withheld | | (102,529) |
| Total income | | 1,408,601 |
| Expenses | | |
| Management fee | $491,614 | |
| Transfer agent fees | 124,250 | |
| Distribution and service plan fees | 34,016 | |
| Accounting and security lending fees | 30,258 | |
| Custodian fees and expenses | 98,366 | |
| Independent trustees' fees and expenses | 203 | |
| Registration fees | 55,315 | |
| Audit | 41,578 | |
| Legal | 88 | |
| Miscellaneous | 320 | |
| Total expenses before reductions | 876,008 | |
| Expense reductions | (17,157) | 858,851 |
| Net investment income (loss) | | 549,750 |
| Realized and Unrealized Gain (Loss) | | |
| Net realized gain (loss) on: | | |
| Investment securities: | | |
| Unaffiliated issuers (net of foreign taxes of $1,306) | (422,857) | |
| Fidelity Central Funds | (58) | |
| Foreign currency transactions | (27,472) | |
| Futures contracts | 491,569 | |
| Total net realized gain (loss) | | 41,182 |
Change in net unrealized appreciation (depreciation) on:
Investment securities (net of decrease in deferred foreign taxes of $82,216) | 12,864,578 | |
| Assets and liabilities in foreign currencies | (987) | |
| Futures contracts | 476,310 | |
| Total change in net unrealized appreciation (depreciation) | | 13,339,901 |
| Net gain (loss) | | 13,381,083 |
| Net increase (decrease) in net assets resulting from operations | | $13,930,833 |
See accompanying notes which are an integral part of the financial statements.
Statement of Changes in Net Assets
| | Six months ended April 30, 2017 (Unaudited) | Year ended October 31, 2016 |
| Increase (Decrease) in Net Assets | | |
| Operations | | |
| Net investment income (loss) | $549,750 | $715,896 |
| Net realized gain (loss) | 41,182 | (2,841,874) |
| Change in net unrealized appreciation (depreciation) | 13,339,901 | 10,693,560 |
| Net increase (decrease) in net assets resulting from operations | 13,930,833 | 8,567,582 |
| Distributions to shareholders from net investment income | (659,806) | (490,717) |
| Distributions to shareholders from net realized gain | (485,420) | – |
| Total distributions | (1,145,226) | (490,717) |
| Share transactions - net increase (decrease) | 109,579,250 | 6,360,074 |
| Redemption fees | 60,701 | 41,424 |
| Total increase (decrease) in net assets | 122,425,558 | 14,478,363 |
| Net Assets | | |
| Beginning of period | 85,838,487 | 71,360,124 |
| End of period | $208,264,045 | $85,838,487 |
| Other Information | | |
| Undistributed net investment income end of period | $483,103 | $593,159 |
See accompanying notes which are an integral part of the financial statements.
Financial Highlights — Fidelity Emerging Markets Discovery Fund Class A
| | Six months ended (Unaudited) April 30, | Years ended October 31, | | | | |
| | 2017 | 2016 | 2015 | 2014 | 2013 | 2012 A |
| Selected Per–Share Data | | | | | | |
| Net asset value, beginning of period | $12.27 | $10.92 | $12.17 | $12.49 | $11.89 | $10.00 |
| Income from Investment Operations | | | | | | |
| Net investment income (loss)B | .05 | .09 | .09C | .04 | .08 | .12 |
| Net realized and unrealized gain (loss) | 1.18 | 1.30 | (1.34) | (.01) | .75 | 1.76 |
| Total from investment operations | 1.23 | 1.39 | (1.25) | .03 | .83 | 1.88 |
| Distributions from net investment income | (.07) | (.05) | – | (.06) | (.04) | (.01) |
| Distributions from net realized gain | (.06) | – | – | (.30) | (.20) | – |
| Total distributions | (.13) | (.05) | – | (.36) | (.25)D | (.01) |
| Redemption fees added to paid in capitalB | .01 | .01 | –E | .01 | .02 | .02 |
| Net asset value, end of period | $13.38 | $12.27 | $10.92 | $12.17 | $12.49 | $11.89 |
| Total ReturnF,G,H | 10.29% | 12.93% | (10.27)% | .31% | 7.20% | 19.00% |
| Ratios to Average Net AssetsI,J | | | | | | |
| Expenses before reductions | 1.79%K | 1.89% | 1.88% | 1.82% | 1.87% | 3.49% |
| Expenses net of fee waivers, if any | 1.70%K | 1.70% | 1.70% | 1.70% | 1.70% | 1.70% |
| Expenses net of all reductions | 1.69%K | 1.70% | 1.69% | 1.70% | 1.64% | 1.64% |
| Net investment income (loss) | .76%K | .85% | .76%C | .29% | .62% | 1.16% |
| Supplemental Data | | | | | | |
| Net assets, end of period (000 omitted) | $9,009 | $5,252 | $4,660 | $4,362 | $5,065 | $1,671 |
| Portfolio turnover rateL | 42%K | 60% | 103% | 148% | 179% | 83% |
A For the period November 1, 2011 (commencement of operations) to October 31, 2012.
B Calculated based on average shares outstanding during the period.
C Net Investment income per share reflects a large, non-recurring dividend which amounted to $.06 per share. Excluding this non-recurring dividend, the ratio of net investment income (loss) to average net assets would have been .22%.
D Total distributions of $.25 per share is comprised of distributions from net investment income of $.044 and distributions from net realized gain of $.203 per share.
E Amount represents less than $.005 per share.
F Total returns for periods of less than one year are not annualized.
G Total returns would have been lower if certain expenses had not been reduced during the applicable periods shown.
H Total returns do not include the effect of the sales charges.
I Fees and expenses of any underlying Fidelity Central Funds are not included in the Fund's expense ratio. The Fund indirectly bears its proportionate share of the expenses of any underlying Fidelity Central Funds.
J Expense ratios reflect operating expenses of the class. Expenses before reductions do not reflect amounts reimbursed by the investment adviser or reductions from brokerage service arrangements or reductions from other expense offset arrangements and do not represent the amount paid by the class during periods when reimbursements or reductions occur. Expense ratios before reductions for start-up periods may not be representative of longer-term operating periods. Expenses net of fee waivers reflect expenses after reimbursement by the investment adviser but prior to reductions from brokerage service arrangements or other expense offset arrangements. Expenses net of all reductions represent the net expenses paid by the class.
K Annualized
L Amount does not include the portfolio activity of any underlying Fidelity Central Funds.
See accompanying notes which are an integral part of the financial statements.
Financial Highlights — Fidelity Emerging Markets Discovery Fund Class M
| | Six months ended (Unaudited) April 30, | Years ended October 31, | | | | |
| | 2017 | 2016 | 2015 | 2014 | 2013 | 2012 A |
| Selected Per–Share Data | | | | | | |
| Net asset value, beginning of period | $12.20 | $10.86 | $12.13 | $12.44 | $11.87 | $10.00 |
| Income from Investment Operations | | | | | | |
| Net investment income (loss)B | .03 | .07 | .06C | –D | .05 | .10 |
| Net realized and unrealized gain (loss) | 1.18 | 1.28 | (1.33) | –D | .74 | 1.75 |
| Total from investment operations | 1.21 | 1.35 | (1.27) | –D | .79 | 1.85 |
| Distributions from net investment income | (.04) | (.02) | – | (.02) | (.03) | –D |
| Distributions from net realized gain | (.06) | �� | – | (.30) | (.20) | – |
| Total distributions | (.11)E | (.02) | – | (.32) | (.24)F | –D |
| Redemption fees added to paid in capitalB | .01 | .01 | –D | .01 | .02 | .02 |
| Net asset value, end of period | $13.31 | $12.20 | $10.86 | $12.13 | $12.44 | $11.87 |
| Total ReturnG,H,I | 10.14% | 12.58% | (10.47)% | .05% | 6.87% | 18.75% |
| Ratios to Average Net AssetsJ,K | | | | | | |
| Expenses before reductions | 2.05%L | 2.17% | 2.16% | 2.10% | 2.19% | 3.77% |
| Expenses net of fee waivers, if any | 1.95%L | 1.95% | 1.95% | 1.95% | 1.95% | 1.95% |
| Expenses net of all reductions | 1.94%L | 1.94% | 1.94% | 1.95% | 1.89% | 1.89% |
| Net investment income (loss) | .51%L | .60% | .51%C | .04% | .37% | .91% |
| Supplemental Data | | | | | | |
| Net assets, end of period (000 omitted) | $6,524 | $2,868 | $2,015 | $2,031 | $1,914 | $1,700 |
| Portfolio turnover rateM | 42%L | 60% | 103% | 148% | 179% | 83% |
A For the period November 1, 2011 (commencement of operations) to October 31, 2012.
B Calculated based on average shares outstanding during the period.
C Net Investment income per share reflects a large, non-recurring dividend which amounted to $.06 per share. Excluding this non-recurring dividend, the ratio of net investment income (loss) to average net assets would have been (.03) %.
D Amount represents less than $.005 per share.
E Total distributions of $.11 per share is comprised of distributions from net investment income of $.044 and distributions from net realized gain of $.064 per share.
F Total distributions of $.24 per share is comprised of distributions from net investment income of $.034 and distributions from net realized gain of $.203 per share
G Total returns for periods of less than one year are not annualized.
H Total returns would have been lower if certain expenses had not been reduced during the applicable periods shown.
I Total returns do not include the effect of the sales charges.
J Fees and expenses of any underlying Fidelity Central Funds are not included in the Fund's expense ratio. The Fund indirectly bears its proportionate share of the expenses of any underlying Fidelity Central Funds.
K Expense ratios reflect operating expenses of the class. Expenses before reductions do not reflect amounts reimbursed by the investment adviser or reductions from brokerage service arrangements or reductions from other expense offset arrangements and do not represent the amount paid by the class during periods when reimbursements or reductions occur. Expense ratios before reductions for start-up periods may not be representative of longer-term operating periods. Expenses net of fee waivers reflect expenses after reimbursement by the investment adviser but prior to reductions from brokerage service arrangements or other expense offset arrangements. Expenses net of all reductions represent the net expenses paid by the class.
L Annualized
M Amount does not include the portfolio activity of any underlying Fidelity Central Funds.
See accompanying notes which are an integral part of the financial statements.
Financial Highlights — Fidelity Emerging Markets Discovery Fund Class C
| | Six months ended (Unaudited) April 30, | Years ended October 31, | | | | |
| | 2017 | 2016 | 2015 | 2014 | 2013 | 2012 A |
| Selected Per–Share Data | | | | | | |
| Net asset value, beginning of period | $11.97 | $10.69 | $12.00 | $12.35 | $11.82 | $10.00 |
| Income from Investment Operations | | | | | | |
| Net investment income (loss)B | – | .01 | –C,D | (.06) | (.02) | .04 |
| Net realized and unrealized gain (loss) | 1.17 | 1.26 | (1.31) | –D | .74 | 1.76 |
| Total from investment operations | 1.17 | 1.27 | (1.31) | (.06) | .72 | 1.80 |
| Distributions from net investment income | (.01) | – | – | – | (.01) | – |
| Distributions from net realized gain | (.06) | – | – | (.30) | (.20) | – |
| Total distributions | (.07) | – | – | (.30) | (.21) | – |
| Redemption fees added to paid in capitalB | .01 | .01 | –E | .01 | .02 | .02 |
| Net asset value, end of period | $13.08 | $11.97 | $10.69 | $12.00 | $12.35 | $11.82 |
| Total ReturnF,G,H | 9.91% | 11.97% | (10.92)% | (.42)% | 6.32% | 18.20% |
| Ratios to Average Net AssetsI,J | | | | | | |
| Expenses before reductions | 2.54%D | 2.63% | 2.64% | 2.58% | 2.70% | 4.32% |
| Expenses net of fee waivers, if any | 2.45%D | 2.45% | 2.45% | 2.45% | 2.45% | 2.45% |
| Expenses net of all reductions | 2.44%D | 2.44% | 2.44% | 2.45% | 2.39% | 2.39% |
| Net investment income (loss) | .01%D | .10% | .01%C | (.46)% | (.13)% | .41% |
| Supplemental Data | | | | | | |
| Net assets, end of period (000 omitted) | $6,104 | $2,203 | $1,675 | $1,750 | $2,082 | $1,474 |
| Portfolio turnover rateK | 42%D | 60% | 103% | 148% | 179% | 83% |
A For the period November 1, 2011 (commencement of operations) to October 31, 2012.
B Calculated based on average shares outstanding during the period.
C Net Investment income per share reflects a large, non-recurring dividend which amounted to $.06 per share. Excluding this non-recurring dividend, the ratio of net investment income (loss) to average net assets would have been (.52) %.
D Annualized
E Amount represents less than $.005 per share.
F Total returns for periods of less than one year are not annualized.
G Total returns would have been lower if certain expenses had not been reduced during the applicable periods shown.
H Total returns do not include the effect of the contingent deferred sales charge.
I Fees and expenses of any underlying Fidelity Central Funds are not included in the Fund's expense ratio. The Fund indirectly bears its proportionate share of the expenses of any underlying Fidelity Central Funds.
J Expense ratios reflect operating expenses of the class. Expenses before reductions do not reflect amounts reimbursed by the investment adviser or reductions from brokerage service arrangements or reductions from other expense offset arrangements and do not represent the amount paid by the class during periods when reimbursements or reductions occur. Expense ratios before reductions for start-up periods may not be representative of longer-term operating periods. Expenses net of fee waivers reflect expenses after reimbursement by the investment adviser but prior to reductions from brokerage service arrangements or other expense offset arrangements. Expenses net of all reductions represent the net expenses paid by the class.
K Amount does not include the portfolio activity of any underlying Fidelity Central Funds.
See accompanying notes which are an integral part of the financial statements.
Financial Highlights — Fidelity Emerging Markets Discovery Fund
| | Six months ended (Unaudited) April 30, | Years ended October 31, | | | | |
| | 2017 | 2016 | 2015 | 2014 | 2013 | 2012 A |
| Selected Per–Share Data | | | | | | |
| Net asset value, beginning of period | $12.33 | $10.98 | $12.21 | $12.52 | $11.92 | $10.00 |
| Income from Investment Operations | | | | | | |
| Net investment income (loss)B | .06 | .12 | .12C | .07 | .11 | .15 |
| Net realized and unrealized gain (loss) | 1.20 | 1.31 | (1.35) | –D | .74 | 1.76 |
| Total from investment operations | 1.26 | 1.43 | (1.23) | .07 | .85 | 1.91 |
| Distributions from net investment income | (.09) | (.09) | – | (.09) | (.07) | (.01) |
| Distributions from net realized gain | (.06) | – | – | (.30) | (.20) | – |
| Total distributions | (.16)E | (.09) | – | (.39) | (.27) | (.01) |
| Redemption fees added to paid in capitalB | .01 | .01 | –D | .01 | .02 | .02 |
| Net asset value, end of period | $13.44 | $12.33 | $10.98 | $12.21 | $12.52 | $11.92 |
| Total ReturnF,G | 10.49% | 13.19% | (10.07)% | .61% | 7.37% | 19.35% |
| Ratios to Average Net AssetsH,I | | | | | | |
| Expenses before reductions | 1.46%J | 1.55% | 1.56% | 1.48% | 1.57% | 3.02% |
| Expenses net of fee waivers, if any | 1.45%J | 1.45% | 1.45% | 1.45% | 1.45% | 1.45% |
| Expenses net of all reductions | 1.44%J | 1.44% | 1.44% | 1.45% | 1.39% | 1.39% |
| Net investment income (loss) | 1.01%J | 1.10% | 1.01%C | .54% | .87% | 1.41% |
| Supplemental Data | | | | | | |
| Net assets, end of period (000 omitted) | $145,324 | $67,178 | $61,601 | $78,377 | $96,731 | $39,135 |
| Portfolio turnover rateK | 42%J | 60% | 103% | 148% | 179% | 83% |
A For the period November 1, 2011 (commencement of operations) to October 31, 2012.
B Calculated based on average shares outstanding during the period.
C Net Investment income per share reflects a large, non-recurring dividend which amounted to $.06 per share. Excluding this non-recurring dividend, the ratio of net investment income (loss) to average net assets would have been .48%.
D Amount represents less than $.005 per share.
E Total distributions of $.16 per share is comprised of distributions from net investment income of $.091 and distributions from net realized gain of $.064 per share.
F Total returns for periods of less than one year are not annualized.
G Total returns would have been lower if certain expenses had not been reduced during the applicable periods shown.
H Fees and expenses of any underlying Fidelity Central Funds are not included in the Fund's expense ratio. The Fund indirectly bears its proportionate share of the expenses of any underlying Fidelity Central Funds.
I Expense ratios reflect operating expenses of the class. Expenses before reductions do not reflect amounts reimbursed by the investment adviser or reductions from brokerage service arrangements or reductions from other expense offset arrangements and do not represent the amount paid by the class during periods when reimbursements or reductions occur. Expense ratios before reductions for start-up periods may not be representative of longer-term operating periods. Expenses net of fee waivers reflect expenses after reimbursement by the investment adviser but prior to reductions from brokerage service arrangements or other expense offset arrangements. Expenses net of all reductions represent the net expenses paid by the class.
J Annualized
K Amount does not include the portfolio activity of any underlying Fidelity Central Funds.
See accompanying notes which are an integral part of the financial statements.
Financial Highlights — Fidelity Emerging Markets Discovery Fund Class I
| | Six months ended (Unaudited) April 30, | Years ended October 31, | | | | |
| | 2017 | 2016 | 2015 | 2014 | 2013 | 2012 A |
| Selected Per–Share Data | | | | | | |
| Net asset value, beginning of period | $12.37 | $11.02 | $12.25 | $12.53 | $11.92 | $10.00 |
| Income from Investment Operations | | | | | | |
| Net investment income (loss)B | .06 | .13 | .12C | .07 | .11 | .15 |
| Net realized and unrealized gain (loss) | 1.20 | 1.30 | (1.35) | –D | .75 | 1.76 |
| Total from investment operations | 1.26 | 1.43 | (1.23) | .07 | .86 | 1.91 |
| Distributions from net investment income | (.10) | (.09) | – | (.06) | (.07) | (.01) |
| Distributions from net realized gain | (.06) | – | – | (.30) | (.20) | – |
| Total distributions | (.17)E | (.09) | – | (.36) | (.27) | (.01) |
| Redemption fees added to paid in capitalB | .01 | .01 | –D | .01 | .02 | .02 |
| Net asset value, end of period | $13.47 | $12.37 | $11.02 | $12.25 | $12.53 | $11.92 |
| Total ReturnF,G | 10.47% | 13.16% | (10.04)% | .61% | 7.45% | 19.35% |
| Ratios to Average Net AssetsH,I | | | | | | |
| Expenses before reductions | 1.42%J | 1.59% | 1.54% | 1.56% | 1.60% | 3.21% |
| Expenses net of fee waivers, if any | 1.42%J | 1.45% | 1.45% | 1.45% | 1.45% | 1.45% |
| Expenses net of all reductions | 1.41%J | 1.44% | 1.43% | 1.45% | 1.39% | 1.39% |
| Net investment income (loss) | 1.04%J | 1.10% | 1.01%C | .54% | .87% | 1.41% |
| Supplemental Data | | | | | | |
| Net assets, end of period (000 omitted) | $41,303 | $8,337 | $1,410 | $481 | $1,076 | $1,825 |
| Portfolio turnover rateK | 42%J | 60% | 103% | 148% | 179% | 83% |
A For the period November 1, 2011 (commencement of operations) to October 31, 2012.
B Calculated based on average shares outstanding during the period.
C Net Investment income per share reflects a large, non-recurring dividend which amounted to $.06 per share. Excluding this non-recurring dividend, the ratio of net investment income (loss) to average net assets would have been .48%.
D Amount represents less than $.005 per share.
E Total distributions of $.17 per share is comprised of distributions from net investment income of $.101 and distributions from net realized gain of $.064 per share.
F Total returns for periods of less than one year are not annualized.
G Total returns would have been lower if certain expenses had not been reduced during the applicable periods shown.
H Fees and expenses of any underlying Fidelity Central Funds are not included in the Fund's expense ratio. The Fund indirectly bears its proportionate share of the expenses of any underlying Fidelity Central Funds.
I Expense ratios reflect operating expenses of the class. Expenses before reductions do not reflect amounts reimbursed by the investment adviser or reductions from brokerage service arrangements or reductions from other expense offset arrangements and do not represent the amount paid by the class during periods when reimbursements or reductions occur. Expense ratios before reductions for start-up periods may not be representative of longer-term operating periods. Expenses net of fee waivers reflect expenses after reimbursement by the investment adviser but prior to reductions from brokerage service arrangements or other expense offset arrangements. Expenses net of all reductions represent the net expenses paid by the class.
J Annualized
K Amount does not include the portfolio activity of any underlying Fidelity Central Funds.
See accompanying notes which are an integral part of the financial statements.
Notes to Financial Statements (Unaudited)
For the period ended April 30, 2017
1. Organization.
Fidelity Emerging Markets Discovery Fund (the Fund) is a fund of Fidelity Investment Trust (the Trust) and is authorized to issue an unlimited number of shares. The Trust is registered under the Investment Company Act of 1940, as amended (the 1940 Act), as an open-end management investment company organized as a Massachusetts business trust. The Fund offers Class A, Class M (formerly Class T), Class C, Emerging Markets Discovery and Class I shares, each of which has equal rights as to assets and voting privileges. Each class has exclusive voting rights with respect to matters that affect that class. The Fund's investments in emerging markets can be subject to social, economic, regulatory, and political uncertainties and can be extremely volatile.
2. Investments in Fidelity Central Funds.
The Fund invests in Fidelity Central Funds, which are open-end investment companies generally available only to other investment companies and accounts managed by the investment adviser and its affiliates. The Fund's Schedule of Investments lists each of the Fidelity Central Funds held as of period end, if any, as an investment of the Fund, but does not include the underlying holdings of each Fidelity Central Fund. As an Investing Fund, the Fund indirectly bears its proportionate share of the expenses of the underlying Fidelity Central Funds.
The Money Market Central Funds seek preservation of capital and current income and are managed by Fidelity Investments Money Management, Inc. (FIMM), an affiliate of the investment adviser. Annualized expenses of the Money Market Central Funds as of their most recent shareholder report date are less than .005%.
A complete unaudited list of holdings for each Fidelity Central Fund is available upon request or at the Securities and Exchange Commission (the SEC) website at www.sec.gov. In addition, the financial statements of the Fidelity Central Funds are available on the SEC website or upon request.
3. Significant Accounting Policies.
The Fund is an investment company and applies the accounting and reporting guidance of the Financial Accounting Standards Board (FASB) Accounting Standards Codification Topic 946 Financial Services – Investments Companies. The financial statements have been prepared in conformity with accounting principles generally accepted in the United States of America (GAAP), which require management to make certain estimates and assumptions at the date of the financial statements. Actual results could differ from those estimates. Subsequent events, if any, through the date that the financial statements were issued have been evaluated in the preparation of the financial statements. The following summarizes the significant accounting policies of the Fund:
Investment Valuation. Investments are valued as of 4:00 p.m. Eastern time on the last calendar day of the period. The Board of Trustees (the Board) has delegated the day to day responsibility for the valuation of the Fund's investments to the Fair Value Committee (the Committee) established by the Fund's investment adviser. In accordance with valuation policies and procedures approved by the Board, the Fund attempts to obtain prices from one or more third party pricing vendors or brokers to value its investments. When current market prices, quotations or currency exchange rates are not readily available or reliable, investments will be fair valued in good faith by the Committee, in accordance with procedures adopted by the Board. Factors used in determining fair value vary by investment type and may include market or investment specific events, changes in interest rates and credit quality. The frequency with which these procedures are used cannot be predicted and they may be utilized to a significant extent. The Committee oversees the Fund's valuation policies and procedures and reports to the Board on the Committee's activities and fair value determinations. The Board monitors the appropriateness of the procedures used in valuing the Fund's investments and ratifies the fair value determinations of the Committee.
The Fund categorizes the inputs to valuation techniques used to value its investments into a disclosure hierarchy consisting of three levels as shown below:
- Level 1 – quoted prices in active markets for identical investments
- Level 2 – other significant observable inputs (including quoted prices for similar investments, interest rates, prepayment speeds, etc.)
- Level 3 – unobservable inputs (including the Fund's own assumptions based on the best information available)
Valuation techniques used to value the Fund's investments by major category are as follows:
Equity securities, including restricted securities, for which market quotations are readily available, are valued at the last reported sale price or official closing price as reported by a third party pricing vendor on the primary market or exchange on which they are traded and are categorized as Level 1 in the hierarchy. In the event there were no sales during the day or closing prices are not available, securities are valued at the last quoted bid price or may be valued using the last available price and are generally categorized as Level 2 in the hierarchy. For foreign equity securities, when market or security specific events arise, comparisons to the valuation of American Depositary Receipts (ADRs), futures contracts, Exchange-Traded Funds (ETFs) and certain indexes as well as quoted prices for similar securities may be used and would be categorized as Level 2 in the hierarchy. Utilizing these techniques may result in transfers between Level 1 and Level 2. For equity securities, including restricted securities, where observable inputs are limited, assumptions about market activity and risk are used and these securities may be categorized as Level 3 in the hierarchy.
Debt securities, including restricted securities, are valued based on evaluated prices received from third party pricing vendors or from brokers who make markets in such securities. U.S. government and government agency obligations are valued by pricing vendors who utilize matrix pricing which considers yield or price of bonds of comparable quality, coupon, maturity and type or by broker-supplied prices. When independent prices are unavailable or unreliable, debt securities may be valued utilizing pricing methodologies which consider similar factors that would be used by third party pricing vendors. Debt securities are generally categorized as Level 2 in the hierarchy but may be Level 3 depending on the circumstances.
Futures contracts are valued at the settlement price established each day by the board of trade or exchange on which they are traded and are categorized as Level 1 in the hierarchy. Investments in open-end mutual funds, including the Fidelity Central Funds, are valued at their closing net asset value (NAV) each business day and are categorized as Level 1 in the hierarchy.
Changes in valuation techniques may result in transfers in or out of an assigned level within the disclosure hierarchy. The aggregate value of investments by input level as of April 30, 2017 is included at the end of the Fund's Schedule of Investments.
Foreign Currency. The Fund may use foreign currency contracts to facilitate transactions in foreign-denominated securities. Gains and losses from these transactions may arise from changes in the value of the foreign currency or if the counterparties do not perform under the contracts' terms.
Foreign-denominated assets, including investment securities, and liabilities are translated into U.S. dollars at the exchange rates at period end. Purchases and sales of investment securities, income and dividends received and expenses denominated in foreign currencies are translated into U.S. dollars at the exchange rate in effect on the transaction date.
The effects of exchange rate fluctuations on investments are included with the net realized and unrealized gain (loss) on investment securities. Other foreign currency transactions resulting in realized and unrealized gain (loss) are disclosed separately.
Investment Transactions and Income. For financial reporting purposes, the Fund's investment holdings and NAV include trades executed through the end of the last business day of the period. The NAV per share for processing shareholder transactions is calculated as of the close of business of the New York Stock Exchange (NYSE), normally 4:00 p.m. Eastern time and includes trades executed through the end of the prior business day. Gains and losses on securities sold are determined on the basis of identified cost. Dividend income is recorded on the ex-dividend date, except for certain dividends from foreign securities where the ex-dividend date may have passed, which are recorded as soon as the Fund is informed of the ex-dividend date. Non-cash dividends included in dividend income, if any, are recorded at the fair market value of the securities received. Income and capital gain distributions from Fidelity Central Funds, if any, are recorded on the ex-dividend date. Interest income is accrued as earned and includes coupon interest and amortization of premium and accretion of discount on debt securities as applicable. Investment income is recorded net of foreign taxes withheld where recovery of such taxes is uncertain.
Class Allocations and Expenses. Investment income, realized and unrealized capital gains and losses, common expenses of the Fund, and certain fund-level expense reductions, if any, are allocated daily on a pro-rata basis to each class based on the relative net assets of each class to the total net assets of the Fund. Each class differs with respect to transfer agent and distribution and service plan fees incurred. Certain expense reductions may also differ by class. For the reporting period, the allocated portion of income and expenses to each class as a percent of its average net assets may vary due to the timing of recording these transactions in relation to fluctuating net assets of the classes. Expenses directly attributable to a fund are charged to that fund. Expenses attributable to more than one fund are allocated among the respective funds on the basis of relative net assets or other appropriate methods. Expense estimates are accrued in the period to which they relate and adjustments are made when actual amounts are known.
Income Tax Information and Distributions to Shareholders. Each year, the Fund intends to qualify as a regulated investment company under Subchapter M of the Internal Revenue Code, including distributing substantially all of its taxable income and realized gains. As a result, no provision for U.S. Federal income taxes is required. The Fund files a U.S. federal tax return, in addition to state and local tax returns as required. The Fund's federal income tax returns are subject to examination by the Internal Revenue Service (IRS) for a period of three fiscal years after they are filed. State and local tax returns may be subject to examination for an additional fiscal year depending on the jurisdiction. Foreign taxes are provided for based on the Fund's understanding of the tax rules and rates that exist in the foreign markets in which it invests. The Fund is subject to a tax imposed on capital gains by certain countries in which it invests. An estimated deferred tax liability for net unrealized appreciation on the applicable securities is included in Other payables and accrued expenses on the Statement of Assets & Liabilities.
Distributions are declared and recorded on the ex-dividend date. Income dividends and capital gain distributions are declared separately for each class. Income and capital gain distributions are determined in accordance with income tax regulations, which may differ from GAAP.
Capital accounts within the financial statements are adjusted for permanent book-tax differences. These adjustments have no impact on net assets or the results of operations. Capital accounts are not adjusted for temporary book-tax differences which will reverse in a subsequent period.
Book-tax differences are primarily due to foreign currency transactions, futures transactions, certain foreign taxes, passive foreign investment companies (PFIC), market discount, capital loss carryforwards and losses deferred due to wash sales.
The federal tax cost of investment securities and unrealized appreciation (depreciation) as of period end were as follows:
| Gross unrealized appreciation | $22,220,414 |
| Gross unrealized depreciation | (5,873,253) |
| Net unrealized appreciation (depreciation) on securities | $16,347,161 |
| Tax cost | $193,377,728 |
Capital loss carryforwards are only available to offset future capital gains of the Fund to the extent provided by regulations and may be limited. Under the Regulated Investment Company Modernization Act of 2010 (the Act), the Fund is permitted to carry forward capital losses incurred in taxable years beginning after December 22, 2010 for an unlimited period and such capital losses are required to be used prior to any losses that expire. The capital loss carryforward information presented below, including any applicable limitation, is estimated as of prior fiscal period end and is subject to adjustment.
| No expiration | |
| Short-term | $(3,072,849) |
| Long-term | (1,665,778) |
| Total capital loss carryforward | $(4,738,627) |
Short-Term Trading (Redemption) Fees. Shares held by investors in the Fund less than 90 days may have been subject to a redemption fee equal to 2.00% of the NAV of shares redeemed. All redemption fees, which reduce the proceeds of the shareholder redemption, are retained by the Fund and accounted for as an addition to paid in capital.
Restricted Securities. The Fund may invest in securities that are subject to legal or contractual restrictions on resale. These securities generally may be resold in transactions exempt from registration or to the public if the securities are registered. Disposal of these securities may involve time-consuming negotiations and expense, and prompt sale at an acceptable price may be difficult. Information regarding restricted securities is included at the end of the Fund's Schedule of Investments.
4. Derivative Instruments.
Risk Exposures and the Use of Derivative Instruments. The Fund's investment objective allows the Fund to enter into various types of derivative contracts, including futures contracts. Derivatives are investments whose value is primarily derived from underlying assets, indices or reference rates and may be transacted on an exchange or over-the-counter (OTC). Derivatives may involve a future commitment to buy or sell a specified asset based on specified terms, to exchange future cash flows at periodic intervals based on a notional principal amount, or for one party to make one or more payments upon the occurrence of specified events in exchange for periodic payments from the other party.
The Fund used derivatives to increase returns and to manage exposure to certain risks as defined below. The success of any strategy involving derivatives depends on analysis of numerous economic factors, and if the strategies for investment do not work as intended, the Fund may not achieve its objectives.
The Fund's use of derivatives increased or decreased its exposure to the following risk:
| Equity Risk | Equity risk relates to the fluctuations in the value of financial instruments as a result of changes in market prices (other than those arising from interest rate risk or foreign exchange risk), whether caused by factors specific to an individual investment, its issuer, or all factors affecting all instruments traded in a market or market segment.
|
The Fund is also exposed to additional risks from investing in derivatives, such as liquidity risk and counterparty credit risk. Liquidity risk is the risk that the Fund will be unable to close out the derivative in the open market in a timely manner. Counterparty credit risk is the risk that the counterparty will not be able to fulfill its obligation to the Fund. Counterparty credit risk related to exchange-traded futures contracts may be mitigated by the protection provided by the exchange on which they trade.
Investing in derivatives may involve greater risks than investing in the underlying assets directly and, to varying degrees, may involve risk of loss in excess of any initial investment and collateral received and amounts recognized in the Statement of Assets and Liabilities. In addition, there may be the risk that the change in value of the derivative contract does not correspond to the change in value of the underlying instrument.
Futures Contracts. A futures contract is an agreement between two parties to buy or sell a specified underlying instrument for a fixed price at a specified future date. The Fund used futures contracts to manage its exposure to the stock market.
Upon entering into a futures contract, a fund is required to deposit either cash or securities (initial margin) with a clearing broker in an amount equal to a certain percentage of the face value of the contract. Futures contracts are marked-to-market daily and subsequent daily payments (variation margin) are made or received by a fund depending on the daily fluctuations in the value of the futures contracts and are recorded as unrealized appreciation or (depreciation). This receivable and/or payable, if any, is included in daily variation margin for derivative instruments in the Statement of Assets and Liabilities. Realized gain or (loss) is recorded upon the expiration or closing of a futures contract. The net realized gain (loss) and change in net unrealized appreciation (depreciation) on futures contracts during the period is included in the Statement of Operations.
Any open futures contracts at period end are presented in the Schedule of Investments under the caption "Futures Contracts". The underlying face amount at value reflects each contract's exposure to the underlying instrument or index at period end and is representative of volume of activity during the period. Securities deposited to meet initial margin requirements are identified in the Schedule of Investments.
During the period the Fund recognized net realized gain (loss) of $491,569 and a change in net unrealized appreciation (depreciation) of $476,310 related to its investment in futures contracts. These amounts are included in the Statement of Operations.
5. Purchases and Sales of Investments.
Purchases and sales of securities, other than short-term securities, aggregated $110,597,649 and $22,612,206, respectively.
6. Fees and Other Transactions with Affiliates.
Management Fee. Fidelity Management & Research Company (the investment adviser) and its affiliates provide the Fund with investment management related services for which the Fund pays a monthly management fee. The management fee is the sum of an individual fund fee rate that is based on an annual rate of .60% of the Fund's average net assets and an annualized group fee rate that averaged .25% during the period. The group fee rate is based upon the average net assets of all the mutual funds advised by the investment adviser, including any mutual funds previously advised by the investment adviser that are currently advised by Fidelity SelectCo, LLC, an affiliate of the investment adviser. The group fee rate decreases as assets under management increase and increases as assets under management decrease. For the reporting period, the total annualized management fee rate was .85% of the Fund's average net assets.
Distribution and Service Plan Fees. In accordance with Rule 12b-1 of the 1940 Act, the Fund has adopted separate Distribution and Service Plans for each class of shares. Certain classes pay Fidelity Distributors Corporation (FDC), an affiliate of the investment adviser, separate Distribution and Service Fees, each of which is based on an annual percentage of each class' average net assets. In addition, FDC may pay financial intermediaries for selling shares of the Fund and providing shareholder support services. For the period, the Distribution and Service Fee rates, total fees and amounts retained by FDC were as follows:
| | Distribution
Fee | Service
Fee | Total Fees | Retained
by FDC |
| Class A | -% | .25% | $7,842 | $255 |
| Class M | .25% | .25% | 9,842 | 75 |
| Class C | .75% | .25% | 16,332 | 5,802 |
| | | | $34,016 | $6,132 |
Sales Load. FDC may receive a front-end sales charge of up to 5.75% for selling Class A shares and 3.50% for selling Class M shares, some of which is paid to financial intermediaries for selling shares of the Fund. Depending on the holding period, FDC may receive contingent deferred sales charges levied on Class A, Class M, and Class C redemptions. The deferred sales charges are 1.00% for Class C shares, 1.00% for certain purchases of Class A shares and .25% for certain purchases of Class M shares.
For the period, sales charge amounts retained by FDC were as follows:
| | Retained
by FDC |
| Class A | $6,914 |
| Class M | 1,430 |
| Class C(a) | 81 |
| | $8,425 |
(a) When Class C shares are initially sold, FDC pays commissions from its own resources to financial intermediaries through which the sales are made.
Transfer Agent Fees. Fidelity Investments Institutional Operations Company, Inc., (FIIOC), an affiliate of the investment adviser, is the transfer, dividend disbursing and shareholder servicing agent for each class of the Fund. FIIOC receives account fees and asset-based fees that vary according to the account size and type of account of the shareholders of the respective classes of the Fund. FIIOC pays for typesetting, printing and mailing of shareholder reports, except proxy statements.
For the period, transfer agent fees for each class were as follows:
| | Amount | % of
Class-Level Average
Net Assets(a) |
| Class A | $8,816 | .28 |
| Class M | 6,194 | .31 |
| Class C | 4,697 | .29 |
| Emerging Markets Discovery | 92,567 | .21 |
| Class I | 11,976 | .16 |
| | $124,250 | |
(a) Annualized
Accounting and Security Lending Fees. Fidelity Service Company, Inc. (FSC), an affiliate of the investment adviser, maintains the Fund's accounting records. The accounting fee is based on the level of average net assets for each month. Under a separate contract, FSC administers the security lending program. The security lending fee is based on the number and duration of lending transactions.
Brokerage Commissions. The Fund placed a portion of its portfolio transactions with brokerage firms which are affiliates of the investment adviser. Brokerage commissions are included in net realized gain (loss) and change in net unrealized appreciation (depreciation) in the Statement of Operations. The commissions paid to these affiliated firms were $466 for the period.
Interfund Trades. The Fund may purchase from or sell securities to other Fidelity Funds under procedures adopted by the Board. The procedures have been designed to ensure these interfund trades are executed in accordance with Rule 17a-7 of the 1940 Act. Interfund trades are included within the respective purchases and sales amounts shown in the Purchases and Sales of Investments note.
7. Committed Line of Credit.
The Fund participates with other funds managed by the investment adviser or an affiliate in a $4.25 billion credit facility (the "line of credit") to be utilized for temporary or emergency purposes to fund shareholder redemptions or for other short-term liquidity purposes. The Fund has agreed to pay commitment fees on its pro-rata portion of the line of credit, which amounted to $163 and is reflected in Miscellaneous expenses on the Statement of Operations. During the period, the Fund did not borrow on this line of credit.
8. Security Lending.
The Fund lends portfolio securities through a lending agent from time to time in order to earn additional income. For equity securities, a lending agent is used and may loan securities to certain qualified borrowers, including Fidelity Capital Markets (FCM), a broker-dealer affiliated with the Fund. On the settlement date of the loan, the Fund receives collateral (in the form of U.S. Treasury obligations, letters of credit and/or cash) against the loaned securities and maintains collateral in an amount not less than 100% of the market value of the loaned securities during the period of the loan. The market value of the loaned securities is determined at the close of business of the Fund and any additional required collateral is delivered to the Fund on the next business day. The Fund or borrower may terminate the loan at any time, and if the borrower defaults on its obligation to return the securities loaned because of insolvency or other reasons, the Fund may apply collateral received from the borrower against the obligation. The Fund may experience delays and costs in recovering the securities loaned. Any cash collateral received is invested in the Fidelity Securities Lending Cash Central Fund. The value of loaned securities and cash collateral at period end are disclosed on the Fund's Statement of Assets and Liabilities. At period end, there were no security loans outstanding with FCM. Security lending income represents the income earned on investing cash collateral, less rebates paid to borrowers and any lending agent fees associated with the loan, plus any premium payments received for lending certain types of securities. Security lending income is presented in the Statement of Operations as a component of income from Fidelity Central Funds. Total security lending income during the period amounted to $20,992, including $3 from securities loaned to FCM.
9. Expense Reductions.
The investment adviser contractually agreed to reimburse each class to the extent annual operating expenses exceeded certain levels of average net assets as noted in the table below. This reimbursement will remain in place through December 31, 2017. Some expenses, for example interest expense, including commitment fees, are excluded from this reimbursement.
The following classes were in reimbursement during the period:
| | Expense
Limitations | Reimbursement |
| Class A | 1.70% | $2,791 |
| Class M | 1.95% | 1,965 |
| Class C | 2.45% | 1,527 |
| Emerging Markets Discovery | 1.45% | 3,202 |
| | | $9,485 |
Commissions paid to certain brokers with whom the investment adviser, or its affiliates, places trades on behalf of the Fund include an amount in addition to trade execution, which may be rebated back to the Fund to offset certain expenses. This amount totaled $7,161 for the period. In addition, through arrangements with the Fund's custodian, credits realized as a result of certain uninvested cash balances were used to reduce the Fund's expenses. During the period, these credits reduced the Fund's custody expenses by $114.
In addition, during the period the investment adviser reimbursed and/or waived a portion of fund-level operating expenses in the amount of $397.
10. Distributions to Shareholders.
Distributions to shareholders of each class were as follows:
| | Six months ended
April 30, 2017 | Year ended October 31, 2016 |
| From net investment income | | |
| Class A | $29,900 | $22,428 |
| Class M | 10,789 | 4,316 |
| Class C | 1,070 | – |
| Emerging Markets Discovery | 534,294 | 453,104 |
| Class I | 83,753 | 10,869 |
| Total | $659,806 | $490,717 |
| From net realized gain | | |
| Class A | $29,370 | $– |
| Class M | 15,653 | – |
| Class C | 12,406 | – |
| Emerging Markets Discovery | 375,874 | – |
| Class I | 52,117 | – |
| Total | $485,420 | $– |
11. Share Transactions.
Share transactions for each class were as follows and may contain automatic conversions between classes or exchanges between affiliated funds:
| | Shares | Shares | Dollars | Dollars |
| | Six months ended April 30, 2017 | Year ended October 31, 2016 | Six months ended April 30, 2017 | Year ended October 31, 2016 |
| Class A | | | | |
| Shares sold | 404,988 | 131,085 | $5,116,680 | $1,473,088 |
| Reinvestment of distributions | 4,936 | 1,944 | 55,853 | 20,757 |
| Shares redeemed | (164,598) | (131,586) | (2,061,812) | (1,425,583) |
| Net increase (decrease) | 245,326 | 1,443 | $3,110,721 | $68,262 |
| Class M | | | | |
| Shares sold | 281,702 | 74,898 | $3,530,517 | $869,903 |
| Reinvestment of distributions | 2,312 | 389 | 26,067 | 4,146 |
| Shares redeemed | (29,087) | (25,757) | (357,128) | (281,676) |
| Net increase (decrease) | 254,927 | 49,530 | $3,199,456 | $592,373 |
| Class C | | | | |
| Shares sold | 303,778 | 58,882 | $3,764,443 | $655,298 |
| Reinvestment of distributions | 1,203 | – | 13,340 | – |
| Shares redeemed | (22,310) | (31,638) | (274,573) | (342,535) |
| Net increase (decrease) | 282,671 | 27,244 | $3,503,210 | $312,763 |
| Emerging Markets Discovery | | | | |
| Shares sold | 6,508,632 | 2,003,183 | $82,481,962 | $22,538,095 |
| Reinvestment of distributions | 74,929 | 39,922 | 850,905 | 427,569 |
| Shares redeemed | (1,215,820) | (2,204,224) | (14,587,583) | (24,359,570) |
| Net increase (decrease) | 5,367,741 | (161,119) | $68,745,284 | $(1,393,906) |
| Class I | | | | |
| Shares sold | 3,016,643 | 642,732 | $38,574,879 | $7,808,576 |
| Reinvestment of distributions | 11,894 | 981 | 135,413 | 10,531 |
| Shares redeemed | (635,470) | (97,475) | (7,689,713) | (1,038,525) |
| Net increase (decrease) | 2,393,067 | 546,238 | $31,020,579 | $6,780,582 |
12. Other.
The Fund's organizational documents provide former and current trustees and officers with a limited indemnification against liabilities arising in connection with the performance of their duties to the Fund. In the normal course of business, the Fund may also enter into contracts that provide general indemnifications. The Fund's maximum exposure under these arrangements is unknown as this would be dependent on future claims that may be made against the Fund. The risk of material loss from such claims is considered remote.
Shareholder Expense Example
As a shareholder of the Fund, you incur two types of costs: (1) transaction costs, including sales charges (loads) on purchase payments or redemption proceeds, redemption fees and (2) ongoing costs, including management fees, distribution and/or service (12b-1) fees and other Fund expenses. This Example is intended to help you understand your ongoing costs (in dollars) of investing in the Fund and to compare these costs with the ongoing costs of investing in other mutual funds.
The Example is based on an investment of $1,000 invested at the beginning of the period and held for the entire period (November 1, 2016 to April 30, 2017).
Actual Expenses
The first line of the accompanying table for each class of the Fund provides information about actual account values and actual expenses. You may use the information in this line, together with the amount you invested, to estimate the expenses that you paid over the period. Simply divide your account value by $1,000.00 (for example, an $8,600 account value divided by $1,000.00 = 8.6), then multiply the result by the number in the first line for a class of the Fund under the heading entitled "Expenses Paid During Period" to estimate the expenses you paid on your account during this period. A small balance maintenance fee of $12.00 that is charged once a year may apply for certain accounts with a value of less than $2,000. This fee is not included in the table below. If it was, the estimate of expenses you paid during the period would be higher, and your ending account value lower, by this amount. In addition, the Fund, as a shareholder in the underlying Fidelity Central Funds, will indirectly bear its pro-rata share of the fees and expenses incurred by the underlying Fidelity Central Funds. These fees and expenses are not included in the Fund's annualized expense ratio used to calculate the expense estimate in the table below.
Hypothetical Example for Comparison Purposes
The second line of the accompanying table for each class of the Fund provides information about hypothetical account values and hypothetical expenses based on a Class' actual expense ratio and an assumed rate of return of 5% per year before expenses, which is not the Class' actual return. The hypothetical account values and expenses may not be used to estimate the actual ending account balance or expenses you paid for the period. You may use this information to compare the ongoing costs of investing in the Fund and other funds. To do so, compare this 5% hypothetical example with the 5% hypothetical examples that appear in the shareholder reports of the other funds. A small balance maintenance fee of $12.00 that is charged once a year may apply for certain accounts with a value of less than $2,000. This fee is not included in the table below. If it was, the estimate of expenses you paid during the period would be higher, and your ending account value lower, by this amount. In addition, the Fund, as a shareholder in the underlying Fidelity Central Funds, will indirectly bear its pro-rata share of the fees and expenses incurred by the underlying Fidelity Central Funds. These fees and expenses are not included in the Fund's annualized expense ratio used to calculate the expense estimate in the table below.
Please note that the expenses shown in the table are meant to highlight your ongoing costs only and do not reflect any transaction costs. Therefore, the second line of the table is useful in comparing ongoing costs only, and will not help you determine the relative total costs of owning different funds. In addition, if these transactional costs were included, your costs would have been higher.
| | Annualized Expense Ratio-A | Beginning
Account Value
November 1, 2016 | Ending
Account Value
April 30, 2017 | Expenses Paid
During Period-B
November 1, 2016
to April 30, 2017 |
| Class A | 1.70% | | | |
| Actual | | $1,000.00 | $1,102.90 | $8.86 |
| Hypothetical-C | | $1,000.00 | $1,016.36 | $8.50 |
| Class M | 1.95% | | | |
| Actual | | $1,000.00 | $1,101.40 | $10.16 |
| Hypothetical-C | | $1,000.00 | $1,015.12 | $9.74 |
| Class C | 2.45% | | | |
| Actual | | $1,000.00 | $1,099.10 | $12.75 |
| Hypothetical-C | | $1,000.00 | $1,012.65 | $12.23 |
| Emerging Markets Discovery | 1.45% | | | |
| Actual | | $1,000.00 | $1,104.90 | $7.57 |
| Hypothetical-C | | $1,000.00 | $1,017.60 | $7.25 |
| Class I | 1.42% | | | |
| Actual | | $1,000.00 | $1,104.70 | $7.41 |
| Hypothetical-C | | $1,000.00 | $1,017.75 | $7.10 |
A Annualized expense ratio reflects expenses net of applicable fee waivers.
B Expenses are equal to each Class' annualized expense ratio, multiplied by the average account value over the period, multiplied by 181/365 (to reflect the one-half year period).
C 5% return per year before expenses
AEMD-SANN-0617
1.931253.105
Fidelity Advisor® Emerging Europe, Middle East, Africa (EMEA) Fund -
Class A, Class M (formerly Class T), Class C and Class I
Semi-Annual Report April 30, 2017 Class A, Class M, Class C and Class I are classes of Fidelity® Emerging Europe, Middle East, Africa (EMEA) Fund |
|
Contents
To view a fund's proxy voting guidelines and proxy voting record for the 12-month period ended June 30, visit http://www.fidelity.com/proxyvotingresults or visit the Securities and Exchange Commission's (SEC) web site at http://www.sec.gov.
You may also call 1-877-208-0098 to request a free copy of the proxy voting guidelines.
Standard & Poor's, S&P and S&P 500 are registered service marks of The McGraw-Hill Companies, Inc. and have been licensed for use by Fidelity Distributors Corporation.
Other third-party marks appearing herein are the property of their respective owners.
All other marks appearing herein are registered or unregistered trademarks or service marks of FMR LLC or an affiliated company. © 2017 FMR LLC. All rights reserved.
This report and the financial statements contained herein are submitted for the general information of the shareholders of the Fund. This report is not authorized for distribution to prospective investors in the Fund unless preceded or accompanied by an effective prospectus.
A fund files its complete schedule of portfolio holdings with the SEC for the first and third quarters of each fiscal year on Form N-Q. Forms N-Q are available on the SEC’s web site at http://www.sec.gov. A fund's Forms N-Q may be reviewed and copied at the SEC’s Public Reference Room in Washington, DC. Information regarding the operation of the SEC's Public Reference Room may be obtained by calling 1-800-SEC-0330.
For a complete list of a fund's portfolio holdings, view the most recent holdings listing, semiannual report, or annual report on Fidelity's web site at http://www.fidelity.com, http://www.institutional.fidelity.com, or http://www.401k.com, as applicable.
NOT FDIC INSURED •MAY LOSE VALUE •NO BANK GUARANTEE
Neither the Fund nor Fidelity Distributors Corporation is a bank.
Investment Summary (Unaudited)
Geographic Diversification (% of fund's net assets)
| As of April 30, 2017 |
| | South Africa | 41.3% |
| | Russia | 21.6% |
| | United Arab Emirates | 5.8% |
| | Poland | 5.6% |
| | United Kingdom | 4.1% |
| | Romania | 2.4% |
| | Greece | 1.9% |
| | Nigeria | 1.9% |
| | Hungary | 1.8% |
| | Other* | 13.6% |
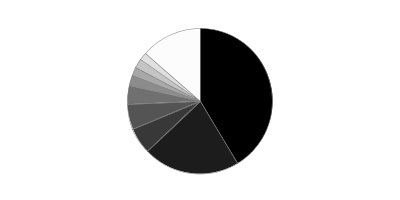
* Includes Short-Term investments and Net Other Assets (Liabilities).
Percentages are based on country or territory of incorporation and are adjusted for the effect of futures contracts, if applicable.
| As of October 31, 2016 |
| | South Africa | 43.5% |
| | Russia | 22.0% |
| | United Arab Emirates | 5.2% |
| | United Kingdom | 3.7% |
| | Romania | 3.1% |
| | Hungary | 2.1% |
| | Poland | 2.0% |
| | Netherlands | 1.9% |
| | Qatar | 1.8% |
| | Other* | 14.7% |

* Includes Short-Term investments and Net Other Assets (Liabilities).
Percentages are based on country or territory of incorporation and are adjusted for the effect of futures contracts, if applicable.
Asset Allocation as of April 30, 2017
| | % of fund's net assets | % of fund's net assets 6 months ago |
| Stocks | 99.5 | 99.3 |
| Short-Term Investments and Net Other Assets (Liabilities) | 0.5 | 0.7 |
Top Ten Stocks as of April 30, 2017
| | % of fund's net assets | % of fund's net assets 6 months ago |
| Naspers Ltd. Class N (South Africa, Media) | 8.3 | 8.3 |
| Sberbank of Russia (Russia, Banks) | 5.5 | 5.0 |
| Gazprom OAO (Russia, Oil, Gas & Consumable Fuels) | 4.0 | 4.0 |
| Lukoil PJSC (Russia, Oil, Gas & Consumable Fuels) | 3.9 | 4.7 |
| FirstRand Ltd. (South Africa, Diversified Financial Services) | 3.1 | 3.0 |
| Standard Bank Group Ltd. (South Africa, Banks) | 2.7 | 2.3 |
| NOVATEK OAO (Russia, Oil, Gas & Consumable Fuels) | 2.1 | 2.2 |
| Shoprite Holdings Ltd. (South Africa, Food & Staples Retailing) | 2.0 | 2.3 |
| Remgro Ltd. (South Africa, Diversified Financial Services) | 1.9 | 2.0 |
| Surgutneftegas OJSC (Russia, Oil, Gas & Consumable Fuels) | 1.8 | 1.5 |
| | 35.3 | |
Top Market Sectors as of April 30, 2017
| | % of fund's net assets | % of fund's net assets 6 months ago |
| Financials | 31.1 | 31.0 |
| Consumer Discretionary | 18.9 | 18.3 |
| Energy | 16.3 | 15.6 |
| Materials | 11.3 | 11.7 |
| Consumer Staples | 10.3 | 10.4 |
| Industrials | 4.6 | 5.9 |
| Real Estate | 2.7 | 2.6 |
| Telecommunication Services | 2.1 | 2.3 |
| Health Care | 1.7 | 1.5 |
| Utilities | 0.3 | 0.0 |
Market Sectors may include more than one industry category.
The Fund may invest up to 35% of its total assets in any industry that represents more than 20% of the emerging Europe, Middle East and Africa markets. As of April 30, 2017, the Fund did not have more than 25% of its total assets invested in any one industry.
Percentages shown as 0.0% may reflect amounts less than 0.05%.
Investments April 30, 2017 (Unaudited)
Showing Percentage of Net Assets
| Common Stocks - 96.1% | | | |
| | | Shares | Value |
| Austria - 0.5% | | | |
| Buwog-Gemeinnuetzige Wohnung | | 20,100 | $542,775 |
| Bailiwick of Jersey - 0.8% | | | |
| Glencore Xstrata PLC | | 137,200 | 543,513 |
| Wizz Air Holdings PLC (a) | | 13,888 | 317,484 |
|
| TOTAL BAILIWICK OF JERSEY | | | 860,997 |
|
| Belgium - 0.6% | | | |
| KBC Groep NV | | 8,912 | 643,436 |
| Bermuda - 0.7% | | | |
| Central European Media Enterprises Ltd. Class A (a)(b) | | 181,600 | 744,560 |
| Botswana - 0.3% | | | |
| First National Bank of Botswana Ltd. (a) | | 1,042,331 | 277,453 |
| British Virgin Islands - 0.5% | | | |
| Lenta Ltd. GDR (a) | | 80,900 | 515,333 |
| Canada - 0.6% | | | |
| Detour Gold Corp. (a) | | 52,300 | 660,910 |
| Cyprus - 0.5% | | | |
| Globaltrans Investment PLC GDR (Reg. S) | | 68,500 | 518,545 |
| Estonia - 0.4% | | | |
| Tallinna Kaubamaja AS | | 42,700 | 420,013 |
| Greece - 1.9% | | | |
| Fourlis Holdings SA (a) | | 100,000 | 522,864 |
| Jumbo SA | | 26,536 | 418,843 |
| Motor Oil (HELLAS) Corinth Refineries SA | | 37,800 | 641,103 |
| Sarantis SA | | 37,800 | 475,989 |
|
| TOTAL GREECE | | | 2,058,799 |
|
| Hungary - 1.8% | | | |
| OTP Bank PLC | | 67,500 | 1,898,588 |
| Israel - 1.1% | | | |
| Bank Hapoalim BM (Reg.) | | 80,000 | 499,420 |
| Elbit Systems Ltd. (Israel) | | 4,900 | 583,784 |
| First International Bank of Israel | | 6,500 | 107,143 |
|
| TOTAL ISRAEL | | | 1,190,347 |
|
| Kenya - 1.4% | | | |
| British American Tobacco Kenya Ltd. | | 63,400 | 518,504 |
| KCB Group Ltd. | | 1,685,600 | 514,500 |
| Safaricom Ltd. | | 2,640,544 | 492,543 |
|
| TOTAL KENYA | | | 1,525,547 |
|
| Lithuania - 0.3% | | | |
| Apranga AB (a) | | 110,466 | 330,909 |
| Luxembourg - 0.5% | | | |
| Tenaris SA | | 32,000 | 499,901 |
| Morocco - 0.1% | | | |
| Douja Promotion Groupe Addoha SA | | 25,000 | 119,129 |
| Netherlands - 0.9% | | | |
| X5 Retail Group NV GDR (Reg. S) (a) | | 20,100 | 708,525 |
| Yandex NV Series A (a) | | 10,000 | 272,600 |
|
| TOTAL NETHERLANDS | | | 981,125 |
|
| Nigeria - 1.9% | | | |
| Dangote Cement PLC | | 738,994 | 384,553 |
| Guaranty Trust Bank PLC | | 3,000,000 | 261,463 |
| Nigerian Breweries PLC | | 1,768,869 | 712,121 |
| Zenith Bank PLC | | 13,652,978 | 665,781 |
|
| TOTAL NIGERIA | | | 2,023,918 |
|
| Oman - 0.6% | | | |
| BankMuscat SAOG (a) | | 575,400 | 600,807 |
| Pakistan - 1.3% | | | |
| Engro Corp. Ltd. | | 150,500 | 506,532 |
| K-Electric Ltd. (a) | | 4,200,000 | 322,753 |
| United Bank Ltd. | | 214,400 | 507,863 |
|
| TOTAL PAKISTAN | | | 1,337,148 |
|
| Poland - 5.6% | | | |
| Ambra SA | | 100,400 | 261,922 |
| Fabryki Mebli Forte SA | | 22,000 | 449,448 |
| Globe Trade Centre SA | | 260,000 | 616,622 |
| Inter Cars SA | | 7,200 | 575,284 |
| Kruk SA | | 7,600 | 560,322 |
| LPP SA | | 560 | 1,001,856 |
| NG2 SA | | 13,800 | 798,288 |
| Orbis SA | | 25,500 | 571,896 |
| Pfleiderer Grajewo SA | | 57,000 | 652,843 |
| Quercus TFI SA (a) | | 269,800 | 452,078 |
|
| TOTAL POLAND | | | 5,940,559 |
|
| Qatar - 1.1% | | | |
| Qatar National Bank SAQ | | 30,037 | 1,186,203 |
| Romania - 2.4% | | | |
| Banca Transilvania SA | | 900,508 | 596,399 |
| BRD-Groupe Societe Generale | | 505,088 | 1,459,263 |
| Fondul Propietatea SA GDR | | 43,000 | 475,150 |
|
| TOTAL ROMANIA | | | 2,530,812 |
|
| Russia - 18.2% | | | |
| Alrosa Co. Ltd. (a) | | 727,200 | 1,253,244 |
| Gazprom OAO (a) | | 1,749,673 | 4,203,118 |
| Lukoil PJSC | | 16,600 | 822,544 |
| Lukoil PJSC sponsored ADR | | 67,195 | 3,337,240 |
| NOVATEK OAO | | 178,900 | 2,185,312 |
| Novolipetsk Steel OJSC GDR (Reg. S) | | 28,800 | 547,200 |
| Sberbank of Russia | | 2,004,320 | 5,821,664 |
| Tatneft PAO (a) | | 165,800 | 1,097,979 |
|
| TOTAL RUSSIA | | | 19,268,301 |
|
| Slovenia - 0.6% | | | |
| Petrol d.d., Ljubljana | | 1,550 | 592,634 |
| South Africa - 41.3% | | | |
| African Rainbow Minerals Ltd. | | 80,900 | 511,537 |
| AngloGold Ashanti Ltd. | | 112,100 | 1,283,761 |
| ArcelorMittal South Africa Ltd. (a) | | 780,000 | 437,751 |
| Aveng Ltd. (a) | | 1,189,200 | 506,336 |
| AVI Ltd. | | 80,000 | 585,105 |
| Barloworld Ltd. | | 74,200 | 668,612 |
| Cashbuild Ltd. (a) | | 21,000 | 570,424 |
| City Lodge Hotels Ltd. | | 55,300 | 615,412 |
| Clicks Group Ltd. | | 139,954 | 1,405,745 |
| Dis-Chem Pharmacies Pty Ltd. | | 312,000 | 575,497 |
| DRDGOLD Ltd. | | 2,367,814 | 923,496 |
| Exxaro Resources Ltd. | | 95,500 | 813,809 |
| FirstRand Ltd. | | 877,100 | 3,271,794 |
| Grindrod Ltd. (a) | | 633,200 | 569,531 |
| Holdsport Ltd. | | 124,700 | 590,572 |
| Hulamin Ltd. | | 1,096,900 | 568,816 |
| Imperial Holdings Ltd. | | 79,000 | 998,987 |
| KAP Industrial Holdings Ltd. | | 887,200 | 622,061 |
| Kumba Iron Ore Ltd. (a) | | 24,000 | 312,595 |
| Mr Price Group Ltd. | | 97,500 | 1,146,179 |
| MTN Group Ltd. | | 102,350 | 968,835 |
| Murray & Roberts Holdings Ltd. | | 499,000 | 522,757 |
| Nampak Ltd. (a) | | 1,072,900 | 1,437,090 |
| Naspers Ltd. Class N | | 46,400 | 8,823,034 |
| Northam Platinum Ltd. (a) | | 125,400 | 466,365 |
| Pioneer Foods Ltd. | | 61,400 | 757,452 |
| Pretoria Portland Cement Co. Ltd. (a) | | 1,118,549 | 523,126 |
| PSG Group Ltd. | | 86,600 | 1,639,819 |
| Remgro Ltd. | | 123,700 | 2,053,436 |
| RMB Holdings Ltd. | | 253,300 | 1,162,654 |
| Sasol Ltd. | | 30,100 | 922,410 |
| Shoprite Holdings Ltd. | | 135,600 | 2,128,810 |
| Spar Group Ltd. | | 78,800 | 1,062,440 |
| Spur Corp. Ltd. | | 241,500 | 562,920 |
| Standard Bank Group Ltd. | | 252,914 | 2,807,769 |
| Telkom SA Ltd. | | 153,000 | 856,147 |
|
| TOTAL SOUTH AFRICA | | | 43,673,084 |
|
| Turkey - 0.3% | | | |
| Migros Turk Ticaret A/S (a) | | 40,000 | 273,878 |
| United Arab Emirates - 5.8% | | | |
| Agthia Group PJSC | | 274,787 | 467,579 |
| Aldar Properties PJSC | | 1,425,871 | 830,755 |
| DP World Ltd. | | 30,000 | 613,200 |
| Dubai Financial Market PJSC (a) | | 2,760,358 | 864,256 |
| Dubai Islamic Bank Pakistan Ltd. (a) | | 522,528 | 835,077 |
| Dubai Parks and Resorts PJSC (a) | | 2,538,210 | 666,859 |
| Emaar Malls Group PJSC (a) | | 1,034,766 | 724,026 |
| National Bank of Abu Dhabi PJSC (a) | | 398,375 | 1,193,064 |
|
| TOTAL UNITED ARAB EMIRATES | | | 6,194,816 |
|
| United Kingdom - 4.1% | | | |
| ALDREES Petroleum and Transport Services Co. ELS (HSBC Warrant Program) warrants 1/30/20 (c) | | 90,625 | 638,441 |
| Banque Saudi Fransi (HSBC Bank Warrant Program) warrants 3/24/20 (a)(c) | | 15,000 | 104,793 |
| Bupa Arabia ELS (HSBC Warrant Program) warrants 10/19/18 (c) | | 13,300 | 413,336 |
| Fawaz Alhokair Group ELS (HSBC Bank Warrant Program) warrants 2/28/20 (a)(c) | | 16,500 | 149,766 |
| Georgia Healthcare Group PLC (a) | | 107,500 | 494,281 |
| Mediclinic International PLC | | 57,300 | 604,654 |
| NMC Health PLC | | 23,749 | 611,195 |
| The Savola Group ELS (HSBC Warrant Program) warrants 1/24/20 (c) | | 76,800 | 870,547 |
| United International Transportation Co. ELS (HSBC Warrant Program) warrants 7/31/17 (a)(c) | | 78,004 | 474,233 |
|
| TOTAL UNITED KINGDOM | | | 4,361,246 |
|
| TOTAL COMMON STOCKS | | | |
| (Cost $80,211,686) | | | 101,771,773 |
|
| Nonconvertible Preferred Stocks - 3.4% | | | |
| Russia - 3.4% | | | |
| Surgutneftegas OJSC (a) | | 3,572,400 | 1,914,570 |
| Tatneft PAO (a) | | 410,800 | 1,718,139 |
|
| TOTAL RUSSIA | | | 3,632,709 |
|
| TOTAL NONCONVERTIBLE PREFERRED STOCKS | | | |
| (Cost $3,156,715) | | | 3,632,709 |
|
| Money Market Funds - 0.5% | | | |
| Fidelity Securities Lending Cash Central Fund 0.86% (d)(e) | | | |
| (Cost $492,502) | | 492,462 | 492,511 |
| TOTAL INVESTMENT PORTFOLIO - 100.0% | | | |
| (Cost $83,860,903) | | | 105,896,993 |
| NET OTHER ASSETS (LIABILITIES) - 0.0% | | | (43,173) |
| NET ASSETS - 100% | | | $105,853,820 |
Security Type Abbreviations
ELS – Equity-Linked Security
Categorizations in the Schedule of Investments are based on country or territory of incorporation.
Legend
(a) Non-income producing
(b) Security or a portion of the security is on loan at period end.
(c) Security exempt from registration under Rule 144A of the Securities Act of 1933. These securities may be resold in transactions exempt from registration, normally to qualified institutional buyers. At the end of the period, the value of these securities amounted to $2,651,116 or 2.5% of net assets.
(d) Affiliated fund that is generally available only to investment companies and other accounts managed by Fidelity Investments. The rate quoted is the annualized seven-day yield of the fund at period end. A complete unaudited listing of the fund's holdings as of its most recent quarter end is available upon request. In addition, each Fidelity Central Fund's financial statements are available on the SEC's website or upon request.
(e) Investment made with cash collateral received from securities on loan.
Affiliated Central Funds
Information regarding fiscal year to date income earned by the Fund from investments in Fidelity Central Funds is as follows:
| Fund | Income earned |
| Fidelity Cash Central Fund | $2,056 |
| Fidelity Securities Lending Cash Central Fund | 3,855 |
| Total | $5,911 |
Investment Valuation
The following is a summary of the inputs used, as of April 30, 2017, involving the Fund's assets and liabilities carried at fair value. The inputs or methodology used for valuing securities may not be an indication of the risk associated with investing in those securities. For more information on valuation inputs, and their aggregation into the levels used below, please refer to the Investment Valuation section in the accompanying Notes to Financial Statements.
| | Valuation Inputs at Reporting Date: |
| Description | Total | Level 1 | Level 2 | Level 3 |
| Investments in Securities: | | | | |
| Equities: | | | | |
| Consumer Discretionary | $19,980,969 | $11,157,935 | $8,823,034 | $-- |
| Consumer Staples | 10,868,913 | 10,868,913 | -- | -- |
| Energy | 17,233,715 | 9,793,582 | 7,440,133 | -- |
| Financials | 33,006,518 | 24,533,738 | 8,472,780 | -- |
| Health Care | 1,710,130 | 1,710,130 | -- | -- |
| Industrials | 4,922,310 | 4,922,310 | -- | -- |
| Information Technology | 272,600 | 272,600 | -- | -- |
| Materials | 11,935,742 | 8,806,075 | 3,129,667 | -- |
| Real Estate | 2,833,307 | 2,833,307 | -- | -- |
| Telecommunication Services | 2,317,525 | 2,317,525 | -- | -- |
| Utilities | 322,753 | 322,753 | -- | -- |
| Money Market Funds | 492,511 | 492,511 | -- | -- |
| Total Investments in Securities: | $105,896,993 | $78,031,379 | $27,865,614 | $-- |
The following is a summary of transfers between Level 1 and Level 2 for the period ended April 30, 2017. Transfers are assumed to have occurred at the beginning of the period, and are primarily attributable to the valuation techniques used for foreign equity securities, as discussed in the accompanying Notes to Financial Statements:
| Transfers | Total |
| Level 1 to Level 2 | $8,212,485 |
| Level 2 to Level 1 | $773,474 |
See accompanying notes which are an integral part of the financial statements.
Financial Statements
Statement of Assets and Liabilities
| | | April 30, 2017 (Unaudited) |
| Assets | | |
Investment in securities, at value (including securities loaned of $476,558) — See accompanying schedule:
Unaffiliated issuers (cost $83,368,401) | $105,404,482 | |
| Fidelity Central Funds (cost $492,502) | 492,511 | |
| Total Investments (cost $83,860,903) | | $105,896,993 |
| Foreign currency held at value (cost $239,377) | | 240,294 |
| Receivable for investments sold | | 1,519,020 |
| Receivable for fund shares sold | | 89,807 |
| Dividends receivable | | 220,007 |
| Distributions receivable from Fidelity Central Funds | | 888 |
| Prepaid expenses | | 61 |
| Receivable from investment adviser for expense reductions | | 34,793 |
| Other receivables | | 7,459 |
| Total assets | | 108,009,322 |
| Liabilities | | |
| Payable to custodian bank | $472,076 | |
| Payable for investments purchased | 750,126 | |
| Payable for fund shares redeemed | 271,597 | |
| Accrued management fee | 70,171 | |
| Distribution and service plan fees payable | 7,353 | |
| Other affiliated payables | 27,476 | |
| Other payables and accrued expenses | 64,203 | |
| Collateral on securities loaned | 492,500 | |
| Total liabilities | | 2,155,502 |
| Net Assets | | $105,853,820 |
| Net Assets consist of: | | |
| Paid in capital | | $105,456,981 |
| Undistributed net investment income | | 529,208 |
| Accumulated undistributed net realized gain (loss) on investments and foreign currency transactions | | (22,158,055) |
| Net unrealized appreciation (depreciation) on investments and assets and liabilities in foreign currencies | | 22,025,686 |
| Net Assets | | $105,853,820 |
| Calculation of Maximum Offering Price | | |
| Class A: | | |
| Net Asset Value and redemption price per share ($5,915,775 ÷ 675,029 shares) | | $8.76 |
| Maximum offering price per share (100/94.25 of $8.76) | | $9.29 |
| Class M: | | |
| Net Asset Value and redemption price per share ($2,472,840 ÷ 282,883 shares) | | $8.74 |
| Maximum offering price per share (100/96.50 of $8.74) | | $9.06 |
| Class C: | | |
| Net Asset Value and offering price per share ($6,087,502 ÷ 698,550 shares)(a) | | $8.71 |
| Emerging Europe, Middle East, Africa (EMEA): | | |
| Net Asset Value, offering price and redemption price per share ($82,668,067 ÷ 9,424,036 shares) | | $8.77 |
| Class I: | | |
| Net Asset Value, offering price and redemption price per share ($8,709,636 ÷ 994,407 shares) | | $8.76 |
(a) Redemption price per share is equal to net asset value less any applicable contingent deferred sales charge.
See accompanying notes which are an integral part of the financial statements.
Statement of Operations
| | | Six months ended April 30, 2017 (Unaudited) |
| Investment Income | | |
| Dividends | | $1,482,736 |
| Income from Fidelity Central Funds | | 5,911 |
| Income before foreign taxes withheld | | 1,488,647 |
| Less foreign taxes withheld | | (129,608) |
| Total income | | 1,359,039 |
| Expenses | | |
| Management fee | $423,018 | |
| Transfer agent fees | 137,897 | |
| Distribution and service plan fees | 48,292 | |
| Accounting and security lending fees | 27,553 | |
| Custodian fees and expenses | 80,401 | |
| Independent trustees' fees and expenses | 214 | |
| Registration fees | 74,313 | |
| Audit | 34,768 | |
| Legal | 113 | |
| Miscellaneous | 386 | |
| Total expenses before reductions | 826,955 | |
| Expense reductions | (49,082) | 777,873 |
| Net investment income (loss) | | 581,166 |
| Realized and Unrealized Gain (Loss) | | |
| Net realized gain (loss) on: | | |
| Investment securities: | | |
| Unaffiliated issuers (net of foreign taxes of $47,553) | 1,610,418 | |
| Fidelity Central Funds | (73) | |
| Foreign currency transactions | (19,210) | |
| Total net realized gain (loss) | | 1,591,135 |
Change in net unrealized appreciation (depreciation) on:
Investment securities (net of decrease in deferred foreign taxes of $9,392) | 6,719,356 | |
| Assets and liabilities in foreign currencies | 550 | |
| Total change in net unrealized appreciation (depreciation) | | 6,719,906 |
| Net gain (loss) | | 8,311,041 |
| Net increase (decrease) in net assets resulting from operations | | $8,892,207 |
See accompanying notes which are an integral part of the financial statements.
Statement of Changes in Net Assets
| | Six months ended April 30, 2017 (Unaudited) | Year ended October 31, 2016 |
| Increase (Decrease) in Net Assets | | |
| Operations | | |
| Net investment income (loss) | $581,166 | $1,751,403 |
| Net realized gain (loss) | 1,591,135 | (6,335,400) |
| Change in net unrealized appreciation (depreciation) | 6,719,906 | 12,445,434 |
| Net increase (decrease) in net assets resulting from operations | 8,892,207 | 7,861,437 |
| Distributions to shareholders from net investment income | (1,167,439) | (1,323,710) |
| Share transactions - net increase (decrease) | (636,409) | 9,065,893 |
| Redemption fees | 49,861 | 36,545 |
| Total increase (decrease) in net assets | 7,138,220 | 15,640,165 |
| Net Assets | | |
| Beginning of period | 98,715,600 | 83,075,435 |
| End of period | $105,853,820 | $98,715,600 |
| Other Information | | |
| Undistributed net investment income end of period | $529,208 | $1,115,481 |
See accompanying notes which are an integral part of the financial statements.
Financial Highlights — Fidelity Emerging Europe, Middle East, Africa (EMEA) Fund Class A
| | Six months ended (Unaudited) April 30, | Years ended October 31, | | | | |
| | 2017 | 2016 | 2015 | 2014 | 2013 | 2012 |
| Selected Per–Share Data | | | | | | |
| Net asset value, beginning of period | $8.13 | $7.49 | $9.04 | $9.49 | $8.71 | $8.34 |
| Income from Investment Operations | | | | | | |
| Net investment income (loss)A | .04 | .14 | .12 | .13 | .16 | .18 |
| Net realized and unrealized gain (loss) | .68 | .61 | (1.50) | (.46) | .85 | .34 |
| Total from investment operations | .72 | .75 | (1.38) | (.33) | 1.01 | .52 |
| Distributions from net investment income | (.09) | (.11) | (.14) | (.12) | (.15) | (.15) |
| Distributions from net realized gain | – | – | (.04) | – | (.07) | – |
| Total distributions | (.09) | (.11) | (.17)B | (.12) | (.23)C | (.15) |
| Redemption fees added to paid in capitalA,D | – | – | – | – | – | – |
| Net asset value, end of period | $8.76 | $8.13 | $7.49 | $9.04 | $9.49 | $8.71 |
| Total ReturnE,F,G | 8.86% | 10.22% | (15.42)% | (3.48)% | 11.75% | 6.38% |
| Ratios to Average Net AssetsH,I | | | | | | |
| Expenses before reductions | 1.70%J | 1.69% | 1.61% | 1.60% | 1.64% | 1.62% |
| Expenses net of fee waivers, if any | 1.65%J | 1.65% | 1.61% | 1.60% | 1.63% | 1.62% |
| Expenses net of all reductions | 1.63%J | 1.64% | 1.60% | 1.60% | 1.62% | 1.60% |
| Net investment income (loss) | .93%J | 1.90% | 1.51% | 1.45% | 1.82% | 2.09% |
| Supplemental Data | | | | | | |
| Net assets, end of period (000 omitted) | $5,916 | $7,867 | $5,788 | $7,889 | $10,883 | $8,934 |
| Portfolio turnover rateK | 59%J | 54% | 50% | 38% | 64% | 30% |
A Calculated based on average shares outstanding during the period.
B Total distributions of $.17 per share is comprised of distributions from net investment income of $.135 and distributions from net realized gain of $.039 per share.
C Total distributions of $.23 per share is comprised of distributions from net investment income of $.151 and distributions from net realized gain of $.074 per share.
D Amount represents less than $.005 per share.
E Total returns for periods of less than one year are not annualized.
F Total returns would have been lower if certain expenses had not been reduced during the applicable periods shown.
G Total returns do not include the effect of the sales charges.
H Fees and expenses of any underlying Fidelity Central Funds are not included in the Fund's expense ratio. The Fund indirectly bears its proportionate share of the expenses of any underlying Fidelity Central Funds.
I Expense ratios reflect operating expenses of the class. Expenses before reductions do not reflect amounts reimbursed by the investment adviser or reductions from brokerage service arrangements or reductions from other expense offset arrangements and do not represent the amount paid by the class during periods when reimbursements or reductions occur. Expenses net of fee waivers reflect expenses after reimbursement by the investment adviser but prior to reductions from brokerage service arrangements or other expense offset arrangements. Expenses net of all reductions represent the net expenses paid by the class.
J Annualized
K Amount does not include the portfolio activity of any underlying Fidelity Central Funds.
See accompanying notes which are an integral part of the financial statements.
Financial Highlights — Fidelity Emerging Europe, Middle East, Africa (EMEA) Fund Class M
| | Six months ended (Unaudited) April 30, | Years ended October 31, | | | | |
| | 2017 | 2016 | 2015 | 2014 | 2013 | 2012 |
| Selected Per–Share Data | | | | | | |
| Net asset value, beginning of period | $8.10 | $7.44 | $9.01 | $9.46 | $8.68 | $8.31 |
| Income from Investment Operations | | | | | | |
| Net investment income (loss)A | .03 | .12 | .10 | .11 | .14 | .15 |
| Net realized and unrealized gain (loss) | .68 | .61 | (1.51) | (.46) | .84 | .35 |
| Total from investment operations | .71 | .73 | (1.41) | (.35) | .98 | .50 |
| Distributions from net investment income | (.07) | (.07) | (.13) | (.10) | (.12) | (.13) |
| Distributions from net realized gain | – | – | (.04) | – | (.07) | – |
| Total distributions | (.07) | (.07) | (.16)B | (.10) | (.20)C | (.13) |
| Redemption fees added to paid in capitalA,D | – | – | – | – | – | – |
| Net asset value, end of period | $8.74 | $8.10 | $7.44 | $9.01 | $9.46 | $8.68 |
| Total ReturnE,F,G | 8.81% | 9.98% | (15.80)% | (3.67)% | 11.42% | 6.14% |
| Ratios to Average Net AssetsH,I | | | | | | |
| Expenses before reductions | 2.04%J | 2.00% | 1.92% | 1.92% | 1.93% | 1.89% |
| Expenses net of fee waivers, if any | 1.90%J | 1.90% | 1.90% | 1.90% | 1.90% | 1.89% |
| Expenses net of all reductions | 1.88%J | 1.89% | 1.89% | 1.90% | 1.88% | 1.86% |
| Net investment income (loss) | .68%J | 1.65% | 1.22% | 1.15% | 1.55% | 1.82% |
| Supplemental Data | | | | | | |
| Net assets, end of period (000 omitted) | $2,473 | $2,580 | $2,003 | $2,465 | $3,465 | $3,336 |
| Portfolio turnover rateK | 59%J | 54% | 50% | 38% | 64% | 30% |
A Calculated based on average shares outstanding during the period.
B Total distributions of $.16 per share is comprised of distributions from net investment income of $.125 and distributions from net realized gain of $.039 per share.
C Total distributions of $.20 per share is comprised of distributions from net investment income of $.122 and distributions from net realized gain of $.074 per share.
D Amount represents less than $.005 per share.
E Total returns for periods of less than one year are not annualized.
F Total returns would have been lower if certain expenses had not been reduced during the applicable periods shown.
G Total returns do not include the effect of the sales charges.
H Fees and expenses of any underlying Fidelity Central Funds are not included in the Fund's expense ratio. The Fund indirectly bears its proportionate share of the expenses of any underlying Fidelity Central Funds.
I Expense ratios reflect operating expenses of the class. Expenses before reductions do not reflect amounts reimbursed by the investment adviser or reductions from brokerage service arrangements or reductions from other expense offset arrangements and do not represent the amount paid by the class during periods when reimbursements or reductions occur. Expenses net of fee waivers reflect expenses after reimbursement by the investment adviser but prior to reductions from brokerage service arrangements or other expense offset arrangements. Expenses net of all reductions represent the net expenses paid by the class.
J Annualized
K Amount does not include the portfolio activity of any underlying Fidelity Central Funds.
See accompanying notes which are an integral part of the financial statements.
Financial Highlights — Fidelity Emerging Europe, Middle East, Africa (EMEA) Fund Class C
| | Six months ended (Unaudited) April 30, | Years ended October 31, | | | | |
| | 2017 | 2016 | 2015 | 2014 | 2013 | 2012 |
| Selected Per–Share Data | | | | | | |
| Net asset value, beginning of period | $8.06 | $7.39 | $8.93 | $9.39 | $8.62 | $8.24 |
| Income from Investment Operations | | | | | | |
| Net investment income (loss)A | .01 | .09 | .06 | .06 | .09 | .11 |
| Net realized and unrealized gain (loss) | .67 | .60 | (1.48) | (.46) | .83 | .35 |
| Total from investment operations | .68 | .69 | (1.42) | (.40) | .92 | .46 |
| Distributions from net investment income | (.03) | (.02) | (.08) | (.06) | (.08) | (.08) |
| Distributions from net realized gain | – | – | (.04) | – | (.07) | – |
| Total distributions | (.03) | (.02) | (.12) | (.06) | (.15) | (.08) |
| Redemption fees added to paid in capitalA,B | – | – | – | – | – | – |
| Net asset value, end of period | $8.71 | $8.06 | $7.39 | $8.93 | $9.39 | $8.62 |
| Total ReturnC,D,E | 8.50% | 9.33% | (16.08)% | (4.24)% | 10.83% | 5.68% |
| Ratios to Average Net AssetsF,G | | | | | | |
| Expenses before reductions | 2.49%H | 2.47% | 2.41% | 2.40% | 2.42% | 2.37% |
| Expenses net of fee waivers, if any | 2.40%H | 2.40% | 2.40% | 2.40% | 2.40% | 2.37% |
| Expenses net of all reductions | 2.38%H | 2.39% | 2.39% | 2.40% | 2.38% | 2.35% |
| Net investment income (loss) | .18%H | 1.15% | .72% | .65% | 1.05% | 1.34% |
| Supplemental Data | | | | | | |
| Net assets, end of period (000 omitted) | $6,088 | $6,269 | $4,104 | $6,662 | $6,782 | $7,770 |
| Portfolio turnover rateI | 59%H | 54% | 50% | 38% | 64% | 30% |
A Calculated based on average shares outstanding during the period.
B Amount represents less than $.005 per share.
C Total returns for periods of less than one year are not annualized.
D Total returns would have been lower if certain expenses had not been reduced during the applicable periods shown.
E Total returns do not include the effect of the contingent deferred sales charge.
F Fees and expenses of any underlying Fidelity Central Funds are not included in the Fund's expense ratio. The Fund indirectly bears its proportionate share of the expenses of any underlying Fidelity Central Funds.
G Expense ratios reflect operating expenses of the class. Expenses before reductions do not reflect amounts reimbursed by the investment adviser or reductions from brokerage service arrangements or reductions from other expense offset arrangements and do not represent the amount paid by the class during periods when reimbursements or reductions occur. Expenses net of fee waivers reflect expenses after reimbursement by the investment adviser but prior to reductions from brokerage service arrangements or other expense offset arrangements. Expenses net of all reductions represent the net expenses paid by the class.
H Annualized
I Amount does not include the portfolio activity of any underlying Fidelity Central Funds.
See accompanying notes which are an integral part of the financial statements.
Financial Highlights — Fidelity Emerging Europe, Middle East, Africa (EMEA) Fund
| | Six months ended (Unaudited) April 30, | Years ended October 31, | | | | |
| | 2017 | 2016 | 2015 | 2014 | 2013 | 2012 |
| Selected Per–Share Data | | | | | | |
| Net asset value, beginning of period | $8.14 | $7.50 | $9.08 | $9.52 | $8.75 | $8.37 |
| Income from Investment Operations | | | | | | |
| Net investment income (loss)A | .05 | .16 | .14 | .16 | .18 | .20 |
| Net realized and unrealized gain (loss) | .68 | .61 | (1.51) | (.47) | .84 | .35 |
| Total from investment operations | .73 | .77 | (1.37) | (.31) | 1.02 | .55 |
| Distributions from net investment income | (.10) | (.13) | (.17) | (.13) | (.18) | (.17) |
| Distributions from net realized gain | – | – | (.04) | – | (.07) | – |
| Total distributions | (.10) | (.13) | (.21) | (.13) | (.25) | (.17) |
| Redemption fees added to paid in capitalA,B | – | – | – | – | – | – |
| Net asset value, end of period | $8.77 | $8.14 | $7.50 | $9.08 | $9.52 | $8.75 |
| Total ReturnC,D | 9.08% | 10.54% | (15.33)% | (3.21)% | 11.90% | 6.81% |
| Ratios to Average Net AssetsE,F | | | | | | |
| Expenses before reductions | 1.47%G | 1.46% | 1.39% | 1.37% | 1.40% | 1.37% |
| Expenses net of fee waivers, if any | 1.40%G | 1.40% | 1.38% | 1.37% | 1.40% | 1.37% |
| Expenses net of all reductions | 1.38%G | 1.39% | 1.38% | 1.37% | 1.38% | 1.34% |
| Net investment income (loss) | 1.18%G | 2.15% | 1.74% | 1.68% | 2.05% | 2.34% |
| Supplemental Data | | | | | | |
| Net assets, end of period (000 omitted) | $82,668 | $76,193 | $67,521 | $96,784 | $110,265 | $111,441 |
| Portfolio turnover rateH | 59%G | 54% | 50% | 38% | 64% | 30% |
A Calculated based on average shares outstanding during the period.
B Amount represents less than $.005 per share.
C Total returns for periods of less than one year are not annualized.
D Total returns would have been lower if certain expenses had not been reduced during the applicable periods shown.
E Fees and expenses of any underlying Fidelity Central Funds are not included in the Fund's expense ratio. The Fund indirectly bears its proportionate share of the expenses of any underlying Fidelity Central Funds.
F Expense ratios reflect operating expenses of the class. Expenses before reductions do not reflect amounts reimbursed by the investment adviser or reductions from brokerage service arrangements or reductions from other expense offset arrangements and do not represent the amount paid by the class during periods when reimbursements or reductions occur. Expenses net of fee waivers reflect expenses after reimbursement by the investment adviser but prior to reductions from brokerage service arrangements or other expense offset arrangements. Expenses net of all reductions represent the net expenses paid by the class.
G Annualized
H Amount does not include the portfolio activity of any underlying Fidelity Central Funds.
See accompanying notes which are an integral part of the financial statements.
Financial Highlights — Fidelity Emerging Europe, Middle East, Africa (EMEA) Fund Class I
| | Six months ended (Unaudited) April 30, | Years ended October 31, | | | | |
| | 2017 | 2016 | 2015 | 2014 | 2013 | 2012 |
| Selected Per–Share Data | | | | | | |
| Net asset value, beginning of period | $8.14 | $7.50 | $9.08 | $9.52 | $8.75 | $8.37 |
| Income from Investment Operations | | | | | | |
| Net investment income (loss)A | .05 | .17 | .15 | .16 | .19 | .21 |
| Net realized and unrealized gain (loss) | .68 | .61 | (1.51) | (.46) | .84 | .35 |
| Total from investment operations | .73 | .78 | (1.36) | (.30) | 1.03 | .56 |
| Distributions from net investment income | (.11) | (.14) | (.18) | (.14) | (.19) | (.18) |
| Distributions from net realized gain | – | – | (.04) | – | (.07) | – |
| Total distributions | (.11) | (.14) | (.22) | (.14) | (.26) | (.18) |
| Redemption fees added to paid in capitalA,B | – | – | – | – | – | – |
| Net asset value, end of period | $8.76 | $8.14 | $7.50 | $9.08 | $9.52 | $8.75 |
| Total ReturnC,D | 9.05% | 10.69% | (15.23)% | (3.09)% | 12.05% | 6.93% |
| Ratios to Average Net AssetsE,F | | | | | | |
| Expenses before reductions | 1.38%G | 1.31% | 1.25% | 1.26% | 1.30% | 1.28% |
| Expenses net of fee waivers, if any | 1.38%G | 1.31% | 1.25% | 1.26% | 1.30% | 1.28% |
| Expenses net of all reductions | 1.36%G | 1.30% | 1.24% | 1.26% | 1.28% | 1.25% |
| Net investment income (loss) | 1.21%G | 2.24% | 1.88% | 1.79% | 2.15% | 2.43% |
| Supplemental Data | | | | | | |
| Net assets, end of period (000 omitted) | $8,710 | $5,807 | $3,478 | $5,596 | $10,231 | $8,586 |
| Portfolio turnover rateH | 59%G | 54% | 50% | 38% | 64% | 30% |
A Calculated based on average shares outstanding during the period.
B Amount represents less than $.005 per share.
C Total returns for periods of less than one year are not annualized.
D Total returns would have been lower if certain expenses had not been reduced during the applicable periods shown.
E Fees and expenses of any underlying Fidelity Central Funds are not included in the Fund's expense ratio. The Fund indirectly bears its proportionate share of the expenses of any underlying Fidelity Central Funds.
F Expense ratios reflect operating expenses of the class. Expenses before reductions do not reflect amounts reimbursed by the investment adviser or reductions from brokerage service arrangements or reductions from other expense offset arrangements and do not represent the amount paid by the class during periods when reimbursements or reductions occur. Expenses net of fee waivers reflect expenses after reimbursement by the investment adviser but prior to reductions from brokerage service arrangements or other expense offset arrangements. Expenses net of all reductions represent the net expenses paid by the class.
G Annualized
H Amount does not include the portfolio activity of any underlying Fidelity Central Funds.
See accompanying notes which are an integral part of the financial statements.
Notes to Financial Statements (Unaudited)
For the period ended April 30, 2017
1. Organization.
Fidelity Emerging Europe, Middle East, Africa (EMEA) Fund (the Fund) is a non-diversified fund of Fidelity Investment Trust (the Trust) and is authorized to issue an unlimited number of shares. The Trust is registered under the Investment Company Act of 1940, as amended (the 1940 Act), as an open-end management investment company organized as a Massachusetts business trust. The Fund offers Class A, Class M (formerly Class T), Class C, Emerging Europe, Middle East, Africa (EMEA), and Class I shares, each of which has equal rights as to assets and voting privileges. Each class has exclusive voting rights with respect to matters that affect that class. The Fund's investments in emerging markets can be subject to social, economic, regulatory, and political uncertainties and can be extremely volatile.
After the close of business on June 24, 2016, all outstanding Class B shares were converted to Class A shares. All prior fiscal period dollar and share amounts for Class B presented in the Notes to Financial Statements are for the period November 1, 2015 through June 24, 2016.
2. Investments in Fidelity Central Funds.
The Fund invests in Fidelity Central Funds, which are open-end investment companies generally available only to other investment companies and accounts managed by the investment adviser and its affiliates. The Fund's Schedule of Investments lists each of the Fidelity Central Funds held as of period end, if any, as an investment of the Fund, but does not include the underlying holdings of each Fidelity Central Fund. As an Investing Fund, the Fund indirectly bears its proportionate share of the expenses of the underlying Fidelity Central Funds.
The Money Market Central Funds seek preservation of capital and current income and are managed by Fidelity Investments Money Management, Inc. (FIMM), an affiliate of the investment adviser. Annualized expenses of the Money Market Central Funds as of their most recent shareholder report date are less than .005%.
A complete unaudited list of holdings for each Fidelity Central Fund is available upon request or at the Securities and Exchange Commission (the SEC) website at www.sec.gov. In addition, the financial statements of the Fidelity Central Funds are available on the SEC website or upon request.
3. Significant Accounting Policies.
The Fund is an investment company and applies the accounting and reporting guidance of the Financial Accounting Standards Board (FASB) Accounting Standards Codification Topic 946 Financial Services – Investments Companies. The financial statements have been prepared in conformity with accounting principles generally accepted in the United States of America (GAAP), which require management to make certain estimates and assumptions at the date of the financial statements. Actual results could differ from those estimates. Subsequent events, if any, through the date that the financial statements were issued have been evaluated in the preparation of the financial statements. The following summarizes the significant accounting policies of the Fund:
Investment Valuation. Investments are valued as of 4:00 p.m. Eastern time on the last calendar day of the period. The Board of Trustees (the Board) has delegated the day to day responsibility for the valuation of the Fund's investments to the Fair Value Committee (the Committee) established by the Fund's investment adviser. In accordance with valuation policies and procedures approved by the Board, the Fund attempts to obtain prices from one or more third party pricing vendors or brokers to value its investments. When current market prices, quotations or currency exchange rates are not readily available or reliable, investments will be fair valued in good faith by the Committee, in accordance with procedures adopted by the Board. Factors used in determining fair value vary by investment type and may include market or investment specific events. The frequency with which these procedures are used cannot be predicted and they may be utilized to a significant extent. The Committee oversees the Fund's valuation policies and procedures and reports to the Board on the Committee's activities and fair value determinations. The Board monitors the appropriateness of the procedures used in valuing the Fund's investments and ratifies the fair value determinations of the Committee.
The Fund categorizes the inputs to valuation techniques used to value its investments into a disclosure hierarchy consisting of three levels as shown below:
- Level 1 – quoted prices in active markets for identical investments
- Level 2 – other significant observable inputs (including quoted prices for similar investments, interest rates, prepayment speeds, etc.)
- Level 3 – unobservable inputs (including the Fund's own assumptions based on the best information available)
Valuation techniques used to value the Fund's investments by major category are as follows:
Equity securities, including restricted securities, for which market quotations are readily available, are valued at the last reported sale price or official closing price as reported by a third party pricing vendor on the primary market or exchange on which they are traded and are categorized as Level 1 in the hierarchy. In the event there were no sales during the day or closing prices are not available, securities are valued at the last quoted bid price or may be valued using the last available price and are generally categorized as Level 2 in the hierarchy. For foreign equity securities, when market or security specific events arise, comparisons to the valuation of American Depositary Receipts (ADRs), futures contracts, Exchange-Traded Funds (ETFs) and certain indexes as well as quoted prices for similar securities may be used and would be categorized as Level 2 in the hierarchy. Utilizing these techniques may result in transfers between Level 1 and Level 2. For equity securities, including restricted securities, where observable inputs are limited, assumptions about market activity and risk are used and these securities may be categorized as Level 3 in the hierarchy.
Investments in open-end mutual funds, including the Fidelity Central Funds, are valued at their closing net asset value (NAV) each business day and are categorized as Level 1 in the hierarchy.
Changes in valuation techniques may result in transfers in or out of an assigned level within the disclosure hierarchy. The aggregate value of investments by input level as of April 30, 2017, including information on transfers between Levels 1 and 2, is included at the end of the Fund's Schedule of Investments.
Foreign Currency. The Fund may use foreign currency contracts to facilitate transactions in foreign-denominated securities. Gains and losses from these transactions may arise from changes in the value of the foreign currency or if the counterparties do not perform under the contracts' terms.
Foreign-denominated assets, including investment securities, and liabilities are translated into U.S. dollars at the exchange rates at period end. Purchases and sales of investment securities, income and dividends received and expenses denominated in foreign currencies are translated into U.S. dollars at the exchange rate in effect on the transaction date.
The effects of exchange rate fluctuations on investments are included with the net realized and unrealized gain (loss) on investment securities. Other foreign currency transactions resulting in realized and unrealized gain (loss) are disclosed separately.
Investment Transactions and Income. For financial reporting purposes, the Fund's investment holdings and NAV include trades executed through the end of the last business day of the period. The NAV per share for processing shareholder transactions is calculated as of the close of business of the New York Stock Exchange (NYSE), normally 4:00 p.m. Eastern time and includes trades executed through the end of the prior business day. Gains and losses on securities sold are determined on the basis of identified cost. Dividend income is recorded on the ex-dividend date, except for certain dividends from foreign securities where the ex-dividend date may have passed, which are recorded as soon as the Fund is informed of the ex-dividend date. Non-cash dividends included in dividend income, if any, are recorded at the fair market value of the securities received. Income and capital gain distributions from Fidelity Central Funds, if any, are recorded on the ex-dividend date. Investment income is recorded net of foreign taxes withheld where recovery of such taxes is uncertain.
Class Allocations and Expenses. Investment income, realized and unrealized capital gains and losses, common expenses of the Fund, and certain fund-level expense reductions, if any, are allocated daily on a pro-rata basis to each class based on the relative net assets of each class to the total net assets of the Fund. Each class differs with respect to transfer agent and distribution and service plan fees incurred. Certain expense reductions may also differ by class. For the reporting period, the allocated portion of income and expenses to each class as a percent of its average net assets may vary due to the timing of recording these transactions in relation to fluctuating net assets of the classes. Expenses directly attributable to a fund are charged to that fund. Expenses attributable to more than one fund are allocated among the respective funds on the basis of relative net assets or other appropriate methods. Expense estimates are accrued in the period to which they relate and adjustments are made when actual amounts are known.
Income Tax Information and Distributions to Shareholders. Each year, the Fund intends to qualify as a regulated investment company under Subchapter M of the Internal Revenue Code, including distributing substantially all of its taxable income and realized gains. As a result, no provision for U.S. Federal income taxes is required. The Fund files a U.S. federal tax return, in addition to state and local tax returns as required. The Fund's federal income tax returns are subject to examination by the Internal Revenue Service (IRS) for a period of three fiscal years after they are filed. State and local tax returns may be subject to examination for an additional fiscal year depending on the jurisdiction. Foreign taxes are provided for based on the Fund's understanding of the tax rules and rates that exist in the foreign markets in which it invests. The Fund is subject to a tax imposed on capital gains by certain countries in which it invests. An estimated deferred tax liability for net unrealized appreciation on the applicable securities is included in Other payables and accrued expenses on the Statement of Assets & Liabilities.
Distributions are declared and recorded on the ex-dividend date. Income dividends and capital gain distributions are declared separately for each class. Income and capital gain distributions are determined in accordance with income tax regulations, which may differ from GAAP.
Capital accounts within the financial statements are adjusted for permanent book-tax differences. These adjustments have no impact on net assets or the results of operations. Capital accounts are not adjusted for temporary book-tax differences which will reverse in a subsequent period.
Book-tax differences are primarily due to foreign currency transactions, certain foreign taxes, passive foreign investment companies (PFIC), capital loss carryforwards, and losses deferred due to wash sales.
The federal tax cost of investment securities and unrealized appreciation (depreciation) as of period end were as follows:
| Gross unrealized appreciation | $26,314,719 |
| Gross unrealized depreciation | (4,599,739) |
| Net unrealized appreciation (depreciation) on securities | $21,714,980 |
| Tax cost | $84,182,013 |
Capital loss carryforwards are only available to offset future capital gains of the Fund to the extent provided by regulations and may be limited. Under the Regulated Investment Company Modernization Act of 2010 (the Act), the Fund is permitted to carry forward capital losses incurred in taxable years beginning after December 22, 2010 for an unlimited period and such capital losses are required to be used prior to any losses that expire. The capital loss carryforward information presented below, including any applicable limitation, is estimated as of prior fiscal period end and is subject to adjustment.
| Fiscal year of expiration | |
| 2018 | $(1,624,705) |
| No expiration | |
| Short-term | (4,750,173) |
| Long-term | (17,009,690) |
| Total no expiration | (21,759,863) |
| Total capital loss carryforward | $(23,384,568) |
Short-Term Trading (Redemption) Fees. Shares held by investors in the Fund less than 90 days may have been subject to a redemption fee equal to 1.50% of the NAV of shares redeemed. All redemption fees, which reduce the proceeds of the shareholder redemption, are retained by the Fund and accounted for as an addition to paid in capital.
Restricted Securities. The Fund may invest in securities that are subject to legal or contractual restrictions on resale. These securities generally may be resold in transactions exempt from registration or to the public if the securities are registered. Disposal of these securities may involve time-consuming negotiations and expense, and prompt sale at an acceptable price may be difficult. Information regarding restricted securities is included at the end of the Fund's Schedule of Investments.
4. Purchases and Sales of Investments.
Purchases and sales of securities, other than short-term securities, aggregated $30,479,227 and $30,847,538, respectively.
5. Fees and Other Transactions with Affiliates.
Management Fee. Fidelity Management & Research Company (the investment adviser) and its affiliates provide the Fund with investment management related services for which the Fund pays a monthly management fee. The management fee is the sum of an individual fund fee rate that is based on an annual rate of .55% of the Fund's average net assets and an annualized group fee rate that averaged .25% during the period. The group fee rate is based upon the average net assets of all the mutual funds advised by the investment adviser, including any mutual funds previously advised by the investment adviser that are currently advised by Fidelity SelectCo, LLC, an affiliate of the investment adviser. The group fee rate decreases as assets under management increase and increases as assets under management decrease. For the reporting period, the total annualized management fee rate was .80% of the Fund's average net assets.
Distribution and Service Plan Fees. In accordance with Rule 12b-1 of the 1940 Act, the Fund has adopted separate Distribution and Service Plans for each class of shares except Class I. Certain classes pay Fidelity Distributors Corporation (FDC), an affiliate of the investment adviser, separate Distribution and Service Fees, each of which is based on an annual percentage of each class' average net assets. In addition, FDC may pay financial intermediaries for selling shares of the Fund and providing shareholder support services. For the period, the Distribution and Service Fee rates, total fees and amounts retained by FDC were as follows:
| | Distribution
Fee | Service
Fee | Total Fees | Retained
by FDC |
| Class A | -% | .25% | $9,770 | $– |
| Class M | .25% | .25% | 6,506 | 86 |
| Class C | .75% | .25% | 32,016 | 4,029 |
| | | | $48,292 | $4,115 |
Sales Load. FDC may receive a front-end sales charge of up to 5.75% for selling Class A shares and 3.50% for selling Class M shares, some of which is paid to financial intermediaries for selling shares of the Fund. Depending on the holding period, FDC may receive contingent deferred sales charges levied on Class A, Class M, and Class C redemptions. The deferred sales charges are 1.00% for Class C shares, 1.00% for certain purchases of Class A shares and .25% for certain purchases of Class M shares.
For the period, sales charge amounts retained by FDC were as follows:
| | Retained
by FDC |
| Class A | $1,522 |
| Class M | 504 |
| Class C(a) | 163 |
| | $2,189 |
(a) When Class C shares are initially sold, FDC pays commissions from its own resources to financial intermediaries through which the sales are made.
Transfer Agent Fees. Fidelity Investments Institutional Operations Company, Inc., (FIIOC), an affiliate of the investment adviser, is the transfer, dividend disbursing and shareholder servicing agent for each class of the Fund. FIIOC receives account fees and asset-based fees that vary according to the account size and type of account of the shareholders of the respective classes of the Fund. FIIOC pays for typesetting, printing and mailing of shareholder reports, except proxy statements.
For the period, transfer agent fees for each applicable class were as follows:
| | Amount | % of
Class-Level Average
Net Assets(a) |
| Class A | $9,693 | .25 |
| Class M | 4,312 | .33 |
| Class C | 9,301 | .29 |
| Emerging Europe, Middle East, Africa (EMEA) | 108,852 | .26 |
| Class I | 5,739 | .16 |
| | $137,897 | |
(a) Annualized
Accounting and Security Lending Fees. Fidelity Service Company, Inc. (FSC), an affiliate of the investment adviser, maintains the Fund's accounting records. The accounting fee is based on the level of average net assets for each month. Under a separate contract, FSC administers the security lending program. The security lending fee is based on the number and duration of lending transactions.
Brokerage Commissions. The Fund placed a portion of its portfolio transactions with brokerage firms which are affiliates of the investment adviser. Brokerage commissions are included in net realized gain (loss) and change in net unrealized appreciation (depreciation) in the Statement of Operations. The commissions paid to these affiliated firms were $2 for the period.
Interfund Trades. The Fund may purchase from or sell securities to other Fidelity Funds under procedures adopted by the Board. The procedures have been designed to ensure these interfund trades are executed in accordance with Rule 17a-7 of the 1940 Act. Interfund trades are included within the respective purchases and sales amounts shown in the Purchases and Sales of Investments note.
6. Committed Line of Credit.
The Fund participates with other funds managed by the investment adviser or an affiliate in a $4.25 billion credit facility (the "line of credit") to be utilized for temporary or emergency purposes to fund shareholder redemptions or for other short-term liquidity purposes. The Fund has agreed to pay commitment fees on its pro-rata portion of the line of credit, which amounted to $179 and is reflected in Miscellaneous expenses on the Statement of Operations. During the period, the Fund did not borrow on this line of credit.
7. Security Lending.
The Fund lends portfolio securities through a lending agent from time to time in order to earn additional income. For equity securities, a lending agent is used and may loan securities to certain qualified borrowers, including Fidelity Capital Markets (FCM), a broker-dealer affiliated with the Fund. On the settlement date of the loan, the Fund receives collateral (in the form of U.S. Treasury obligations, letters of credit and/or cash) against the loaned securities and maintains collateral in an amount not less than 100% of the market value of the loaned securities during the period of the loan. The market value of the loaned securities is determined at the close of business of the Fund and any additional required collateral is delivered to the Fund on the next business day. The Fund or borrower may terminate the loan at any time, and if the borrower defaults on its obligation to return the securities loaned because of insolvency or other reasons, the Fund may apply collateral received from the borrower against the obligation. The Fund may experience delays and costs in recovering the securities loaned. Any cash collateral received is invested in the Fidelity Securities Lending Cash Central Fund. The value of loaned securities and cash collateral at period end are disclosed on the Fund's Statement of Assets and Liabilities. Security lending income represents the income earned on investing cash collateral, less rebates paid to borrowers, plus any premium payments received for lending certain types of securities. Security lending income is presented in the Statement of Operations as a component of income from Fidelity Central Funds. Total security lending income during the period amounted to $3,855. During the period, there were no securities loaned to FCM.
8. Expense Reductions.
The investment adviser voluntarily agreed to reimburse each class to the extent annual operating expenses exceeded certain levels of average net assets as noted in the table below. Some expenses, for example interest expense, including commitment fees, are excluded from this reimbursement.
The following classes were in reimbursement during the period:
| | Expense
Limitations | Reimbursement |
| Class A | 1.65% | $1,619 |
| Class M | 1.90% | 1,769 |
| Class C | 2.40% | 2,962 |
| Emerging Europe, Middle East, Africa (EMEA) | 1.40% | 29,696 |
| | | $36,046 |
Commissions paid to certain brokers with whom the investment adviser, or its affiliates, places trades on behalf of the Fund include an amount in addition to trade execution, which may be rebated back to the Fund to offset certain expenses. This amount totaled $12,579 for the period.
In addition, during the period the investment adviser reimbursed and/or waived a portion of fund-level operating expenses in the amount of $457.
9. Distributions to Shareholders.
Distributions to shareholders of each class were as follows:
| | Six months ended
April 30, 2017 | Year ended October 31, 2016 |
| From net investment income | | |
| Class A | $82,211 | $80,414 |
| Class M | 22,957 | 18,230 |
| Class B | – | 201 |
| Class C | 25,148 | 9,270 |
| Emerging Europe, Middle East, Africa (EMEA) | 957,314 | 1,152,813 |
| Class I | 79,809 | 62,782 |
| Total | $1,167,439 | $1,323,710 |
10. Share Transactions.
Share transactions for each class were as follows and may contain automatic conversions between classes or exchanges between affiliated funds:
| | Shares | Shares | Dollars | Dollars |
| | Six months ended
April 30, 2017 | Year ended October 31, 2016 | Six months ended
April 30, 2017 | Year ended October 31, 2016 |
| Class A | | | | |
| Shares sold | 255,779 | 455,903 | $2,156,091 | $3,437,125 |
| Reinvestment of distributions | 9,506 | 10,903 | 78,136 | 75,669 |
| Shares redeemed | (557,881) | (272,430) | (4,775,375) | (1,968,300) |
| Net increase (decrease) | (292,596) | 194,376 | $(2,541,148) | $1,544,494 |
| Class M | | | | |
| Shares sold | 45,458 | 127,263 | $372,968 | $957,632 |
| Reinvestment of distributions | 2,795 | 2,627 | 22,945 | 18,230 |
| Shares redeemed | (83,668) | (80,720) | (712,255) | (600,724) |
| Net increase (decrease) | (35,415) | 49,170 | $(316,342) | $375,138 |
| Class B | | | | |
| Shares sold | – | 6,222 | $– | $48,688 |
| Reinvestment of distributions | – | 29 | – | 201 |
| Shares redeemed | – | (30,363) | – | (224,475) |
| Net increase (decrease) | – | (24,112) | $– | $(175,586) |
| Class C | | | | |
| Shares sold | 111,449 | 511,536 | $940,063 | $3,858,488 |
| Reinvestment of distributions | 2,631 | 776 | 21,571 | 5,381 |
| Shares redeemed | (192,937) | (290,654) | (1,622,543) | (2,107,856) |
| Net increase (decrease) | (78,857) | 221,658 | $(660,909) | $1,756,013 |
| Emerging Europe, Middle East, Africa (EMEA) | | | | |
| Shares sold | 2,531,494 | 3,096,394 | $21,355,931 | $23,505,412 |
| Reinvestment of distributions | 108,986 | 155,366 | 895,866 | 1,078,225 |
| Shares redeemed | (2,571,477) | (2,896,341) | (21,803,358) | (21,342,473) |
| Net increase (decrease) | 69,003 | 355,419 | $448,439 | $3,241,164 |
| Class I | | | | |
| Shares sold | 668,928 | 627,690 | $5,750,136 | $5,110,628 |
| Reinvestment of distributions | 9,024 | 7,594 | 74,090 | 52,629 |
| Shares redeemed | (397,206) | (385,176) | (3,390,675) | (2,838,587) |
| Net increase (decrease) | 280,746 | 250,108 | $2,433,551 | $2,324,670 |
11. Other.
The Fund's organizational documents provide former and current trustees and officers with a limited indemnification against liabilities arising in connection with the performance of their duties to the Fund. In the normal course of business, the Fund may also enter into contracts that provide general indemnifications. The Fund's maximum exposure under these arrangements is unknown as this would be dependent on future claims that may be made against the Fund. The risk of material loss from such claims is considered remote.
At the end of the period, the investment adviser or its affiliates were the owners of record of 10% of the total outstanding shares of the Fund.
Shareholder Expense Example
As a shareholder of the Fund, you incur two types of costs: (1) transaction costs, including sales charges (loads) on purchase payments or redemption proceeds, redemption fees and (2) ongoing costs, including management fees, distribution and/or service (12b-1) fees and other Fund expenses. This Example is intended to help you understand your ongoing costs (in dollars) of investing in the Fund and to compare these costs with the ongoing costs of investing in other mutual funds.
The Example is based on an investment of $1,000 invested at the beginning of the period and held for the entire period (November 1, 2016 to April 30, 2017).
Actual Expenses
The first line of the accompanying table for each class of the Fund provides information about actual account values and actual expenses. You may use the information in this line, together with the amount you invested, to estimate the expenses that you paid over the period. Simply divide your account value by $1,000.00 (for example, an $8,600 account value divided by $1,000.00 = 8.6), then multiply the result by the number in the first line for a class of the Fund under the heading entitled "Expenses Paid During Period" to estimate the expenses you paid on your account during this period. A small balance maintenance fee of $12.00 that is charged once a year may apply for certain accounts with a value of less than $2,000. This fee is not included in the table below. If it was, the estimate of expenses you paid during the period would be higher, and your ending account value lower, by this amount. In addition, the Fund, as a shareholder in the underlying Fidelity Central Funds, will indirectly bear its pro-rata share of the fees and expenses incurred by the underlying Fidelity Central Funds. These fees and expenses are not included in the Fund's annualized expense ratio used to calculate the expense estimate in the table below.
Hypothetical Example for Comparison Purposes
The second line of the accompanying table for each class of the Fund provides information about hypothetical account values and hypothetical expenses based on a Class' actual expense ratio and an assumed rate of return of 5% per year before expenses, which is not the Class' actual return. The hypothetical account values and expenses may not be used to estimate the actual ending account balance or expenses you paid for the period. You may use this information to compare the ongoing costs of investing in the Fund and other funds. To do so, compare this 5% hypothetical example with the 5% hypothetical examples that appear in the shareholder reports of the other funds. A small balance maintenance fee of $12.00 that is charged once a year may apply for certain accounts with a value of less than $2,000. This fee is not included in the table below. If it was, the estimate of expenses you paid during the period would be higher, and your ending account value lower, by this amount. In addition, the Fund, as a shareholder in the underlying Fidelity Central Funds, will indirectly bear its pro-rata share of the fees and expenses incurred by the underlying Fidelity Central Funds. These fees and expenses are not included in the Fund's annualized expense ratio used to calculate the expense estimate in the table below.
Please note that the expenses shown in the table are meant to highlight your ongoing costs only and do not reflect any transaction costs. Therefore, the second line of the table is useful in comparing ongoing costs only, and will not help you determine the relative total costs of owning different funds. In addition, if these transactional costs were included, your costs would have been higher.
| | Annualized Expense Ratio-A | Beginning
Account Value
November 1, 2016 | Ending
Account Value
April 30, 2017 | Expenses Paid
During Period-B
November 1, 2016
to April 30, 2017 |
| Class A | 1.65% | | | |
| Actual | | $1,000.00 | $1,088.60 | $8.54 |
| Hypothetical-C | | $1,000.00 | $1,016.61 | $8.25 |
| Class M | 1.90% | | | |
| Actual | | $1,000.00 | $1,088.10 | $9.84 |
| Hypothetical-C | | $1,000.00 | $1,015.37 | $9.49 |
| Class C | 2.40% | | | |
| Actual | | $1,000.00 | $1,085.00 | $12.41 |
| Hypothetical-C | | $1,000.00 | $1,012.89 | $11.98 |
| Emerging Europe, Middle East, Africa (EMEA) | 1.40% | | | |
| Actual | | $1,000.00 | $1,090.80 | $7.26 |
| Hypothetical-C | | $1,000.00 | $1,017.85 | $7.00 |
| Class I | 1.38% | | | |
| Actual | | $1,000.00 | $1,090.50 | $7.15 |
| Hypothetical-C | | $1,000.00 | $1,017.95 | $6.90 |
A Annualized expense ratio reflects expenses net of applicable fee waivers.
B Expenses are equal to each Class' annualized expense ratio, multiplied by the average account value over the period, multiplied by 181/365 (to reflect the one-half year period).
C 5% return per year before expenses
AEME-SANN-0617
1.861993.108
Fidelity Advisor® Worldwide Fund -
Class A, Class M (formerly Class T), Class C and Class I
Semi-Annual Report April 30, 2017 Class A, Class M, Class C and Class I are classes of Fidelity® Worldwide Fund |
|
Contents
To view a fund's proxy voting guidelines and proxy voting record for the 12-month period ended June 30, visit http://www.fidelity.com/proxyvotingresults or visit the Securities and Exchange Commission's (SEC) web site at http://www.sec.gov.
You may also call 1-877-208-0098 to request a free copy of the proxy voting guidelines.
Standard & Poor's, S&P and S&P 500 are registered service marks of The McGraw-Hill Companies, Inc. and have been licensed for use by Fidelity Distributors Corporation.
Other third-party marks appearing herein are the property of their respective owners.
All other marks appearing herein are registered or unregistered trademarks or service marks of FMR LLC or an affiliated company. © 2017 FMR LLC. All rights reserved.
This report and the financial statements contained herein are submitted for the general information of the shareholders of the Fund. This report is not authorized for distribution to prospective investors in the Fund unless preceded or accompanied by an effective prospectus.
A fund files its complete schedule of portfolio holdings with the SEC for the first and third quarters of each fiscal year on Form N-Q. Forms N-Q are available on the SEC’s web site at http://www.sec.gov. A fund's Forms N-Q may be reviewed and copied at the SEC’s Public Reference Room in Washington, DC. Information regarding the operation of the SEC's Public Reference Room may be obtained by calling 1-800-SEC-0330.
For a complete list of a fund's portfolio holdings, view the most recent holdings listing, semiannual report, or annual report on Fidelity's web site at http://www.fidelity.com, http://www.institutional.fidelity.com, or http://www.401k.com, as applicable.
NOT FDIC INSURED •MAY LOSE VALUE •NO BANK GUARANTEE
Neither the Fund nor Fidelity Distributors Corporation is a bank.
Investment Summary (Unaudited)
Geographic Diversification (% of fund's net assets)
| As of April 30, 2017 |
| | United States of America* | 51.3% |
| | United Kingdom | 7.5% |
| | Japan | 6.8% |
| | Germany | 4.9% |
| | France | 3.5% |
| | Netherlands | 3.0% |
| | Switzerland | 2.4% |
| | Canada | 2.2% |
| | Ireland | 1.9% |
| | Other | 16.5% |

* Includes Short-Term investments and Net Other Assets (Liabilities).
Percentages are based on country or territory of incorporation and are adjusted for the effect of futures contracts, if applicable.
| As of October 31, 2016 |
| | United States of America* | 52.4% |
| | Japan | 7.1% |
| | United Kingdom | 5.5% |
| | Germany | 4.8% |
| | Ireland | 3.7% |
| | France | 3.6% |
| | Canada | 2.0% |
| | Netherlands | 2.0% |
| | Switzerland | 1.7% |
| | Other | 17.2% |

* Includes Short-Term investments and Net Other Assets (Liabilities).
Percentages are based on country or territory of incorporation and are adjusted for the effect of futures contracts, if applicable.
Asset Allocation as of April 30, 2017
| | % of fund's net assets | % of fund's net assets 6 months ago |
| Stocks | 98.9 | 97.9 |
| Short-Term Investments and Net Other Assets (Liabilities) | 1.1 | 2.1 |
Top Ten Stocks as of April 30, 2017
| | % of fund's net assets | % of fund's net assets 6 months ago |
| Apple, Inc. (United States of America, Technology Hardware, Storage & Peripherals) | 2.8 | 2.3 |
| adidas AG (Germany, Textiles, Apparel & Luxury Goods) | 2.7 | 1.8 |
| Adobe Systems, Inc. (United States of America, Software) | 2.6 | 3.3 |
| Bank of America Corp. (United States of America, Banks) | 2.6 | 0.0 |
| Alphabet, Inc. Class A (United States of America, Internet Software & Services) | 2.5 | 3.4 |
| Microsoft Corp. (United States of America, Software) | 1.9 | 1.6 |
| British American Tobacco PLC (United Kingdom, Tobacco) | 1.7 | 0.3 |
| S&P Global, Inc. (United States of America, Capital Markets) | 1.5 | 3.3 |
| IHS Markit Ltd. (Bermuda, Professional Services) | 1.5 | 1.2 |
| Activision Blizzard, Inc. (United States of America, Software) | 1.4 | 0.8 |
| | 21.2 | |
Top Market Sectors as of April 30, 2017
| | % of fund's net assets | % of fund's net assets 6 months ago |
| Information Technology | 23.5 | 25.5 |
| Financials | 19.4 | 16.9 |
| Industrials | 14.3 | 11.8 |
| Consumer Discretionary | 13.5 | 12.9 |
| Health Care | 10.3 | 8.3 |
| Consumer Staples | 7.3 | 8.4 |
| Materials | 4.5 | 2.8 |
| Energy | 3.1 | 6.7 |
| Telecommunication Services | 1.6 | 1.4 |
| Real Estate | 1.1 | 2.7 |
Percentages shown as 0.0% may reflect amounts less than 0.05%.
Investments April 30, 2017 (Unaudited)
Showing Percentage of Net Assets
| Common Stocks - 98.8% | | | |
| | | Shares | Value |
| Australia - 0.9% | | | |
| Altium Ltd. | | 99,765 | $612,573 |
| Australia & New Zealand Banking Group Ltd. | | 155,719 | 3,819,894 |
| Bapcor Ltd. | | 597,660 | 2,340,570 |
| Magellan Financial Group Ltd. | | 81,493 | 1,438,898 |
| Ramsay Health Care Ltd. | | 65,163 | 3,498,534 |
| Spark Infrastructure Group unit | | 1,160,368 | 2,163,520 |
|
| TOTAL AUSTRALIA | | | 13,873,989 |
|
| Austria - 0.6% | | | |
| ams AG | | 42,000 | 2,701,508 |
| Erste Group Bank AG | | 85,200 | 3,045,970 |
| Wienerberger AG | | 142,700 | 3,342,027 |
|
| TOTAL AUSTRIA | | | 9,089,505 |
|
| Bailiwick of Jersey - 0.8% | | | |
| Glencore Xstrata PLC | | 1,079,712 | 4,246,372 |
| IWG PLC | | 416,421 | 1,752,343 |
| Randgold Resources Ltd. sponsored ADR | | 13,010 | 1,144,750 |
| Shire PLC | | 38,100 | 2,246,330 |
| Wizz Air Holdings PLC (a) | | 34,000 | 777,250 |
| Wolseley PLC | | 34,278 | 2,178,612 |
|
| TOTAL BAILIWICK OF JERSEY | | | 12,345,657 |
|
| Belgium - 0.5% | | | |
| Anheuser-Busch InBev SA NV | | 13,411 | 1,512,363 |
| KBC Groep NV | | 83,303 | 6,014,377 |
|
| TOTAL BELGIUM | | | 7,526,740 |
|
| Bermuda - 1.5% | | | |
| Axovant Sciences Ltd. (a) | | 5,000 | 121,200 |
| IHS Markit Ltd. (a) | | 527,900 | 22,910,860 |
|
| TOTAL BERMUDA | | | 23,032,060 |
|
| Canada - 2.2% | | | |
| Alimentation Couche-Tard, Inc. Class B (sub. vtg.) | | 51,100 | 2,350,140 |
| Cenovus Energy, Inc. | | 228,100 | 2,274,232 |
| Constellation Software, Inc. | | 5,800 | 2,652,734 |
| First Quantum Minerals Ltd. | | 1,287,000 | 12,266,122 |
| Franco-Nevada Corp. | | 15,400 | 1,049,048 |
| PrairieSky Royalty Ltd. (b) | | 532,999 | 11,616,219 |
| Suncor Energy, Inc. | | 39,400 | 1,234,777 |
|
| TOTAL CANADA | | | 33,443,272 |
|
| Cayman Islands - 1.2% | | | |
| Alibaba Group Holding Ltd. sponsored ADR (a) | | 30,000 | 3,465,000 |
| Ctrip.com International Ltd. ADR (a) | | 17,500 | 883,925 |
| Goodbaby International Holdings Ltd. | | 5,171,000 | 2,346,723 |
| JD.com, Inc. sponsored ADR (a) | | 141,700 | 4,969,419 |
| Melco Crown Entertainment Ltd. sponsored ADR | | 86,300 | 1,894,285 |
| New Oriental Education & Technology Group, Inc. sponsored ADR (a) | | 68,800 | 4,440,352 |
|
| TOTAL CAYMAN ISLANDS | | | 17,999,704 |
|
| Chile - 0.2% | | | |
| Vina San Pedro SA | | 306,277,514 | 2,982,902 |
| China - 0.4% | | | |
| Kweichow Moutai Co. Ltd. (A Shares) | | 41,800 | 2,507,212 |
| Shanghai International Airport Co. Ltd. (A Shares) | | 377,300 | 1,874,596 |
| Wuliangye Yibin Co. Ltd. Class A | | 332,300 | 2,193,320 |
|
| TOTAL CHINA | | | 6,575,128 |
|
| Denmark - 0.6% | | | |
| Nets A/S (c) | | 103,400 | 1,880,757 |
| NNIT A/S (a) | | 110,402 | 3,112,420 |
| Novo Nordisk A/S Series B | | 49,780 | 1,938,277 |
| Novozymes A/S Series B | | 38,200 | 1,650,350 |
|
| TOTAL DENMARK | | | 8,581,804 |
|
| Finland - 0.2% | | | |
| Sampo Oyj (A Shares) (b) | | 53,500 | 2,563,629 |
| France - 3.5% | | | |
| ALTEN | | 23,200 | 1,966,143 |
| Altran Technologies SA | | 112,500 | 1,888,438 |
| Amundi SA | | 70,020 | 4,606,876 |
| Atos Origin SA | | 11,483 | 1,504,764 |
| AXA SA | | 82,400 | 2,198,445 |
| BNP Paribas SA | | 51,300 | 3,619,977 |
| Capgemini SA | | 22,900 | 2,292,794 |
| Cegedim SA (a) | | 35,010 | 974,003 |
| Havas SA | | 315,012 | 2,912,937 |
| Kaufman & Broad SA | | 19,500 | 764,689 |
| Kering SA | | 9,000 | 2,789,643 |
| Maisons du Monde SA | | 84,200 | 2,922,169 |
| Rexel SA | | 98,400 | 1,757,869 |
| Rubis | | 23,800 | 2,418,316 |
| Societe Generale Series A | | 48,800 | 2,675,837 |
| Sodexo SA | | 24,700 | 3,139,896 |
| Total SA | | 202,457 | 10,392,773 |
| VINCI SA | | 51,500 | 4,389,787 |
|
| TOTAL FRANCE | | | 53,215,356 |
|
| Germany - 4.9% | | | |
| adidas AG | | 205,300 | 41,126,162 |
| Aumann AG | | 5,500 | 361,746 |
| Axel Springer Verlag AG | | 43,237 | 2,426,021 |
| Deutsche Borse AG | | 9,362 | 916,293 |
| Deutsche Post AG | | 111,581 | 4,010,647 |
| Deutsche Telekom AG | | 112,300 | 1,969,832 |
| Fresenius SE & Co. KGaA | | 29,600 | 2,399,222 |
| Henkel AG & Co. KGaA | | 23,400 | 2,731,213 |
| Nexus AG | | 47,000 | 1,131,456 |
| Rational AG | | 6,400 | 3,215,962 |
| SAP AG | | 117,326 | 11,752,081 |
| Wirecard AG (b) | | 38,000 | 2,243,936 |
|
| TOTAL GERMANY | | | 74,284,571 |
|
| Greece - 0.1% | | | |
| Ff Group (a) | | 59,300 | 1,262,196 |
| Hong Kong - 0.2% | | | |
| AIA Group Ltd. | | 315,800 | 2,186,303 |
| Techtronic Industries Co. Ltd. | | 231,000 | 991,907 |
|
| TOTAL HONG KONG | | | 3,178,210 |
|
| India - 1.3% | | | |
| Avenue Supermarts Ltd. | | 1,642 | 18,811 |
| Bharti Infratel Ltd. | | 567,859 | 3,132,985 |
| HDFC Bank Ltd. | | 65,958 | 1,610,158 |
| HDFC Bank Ltd. sponsored ADR | | 79,493 | 6,328,438 |
| Housing Development Finance Corp. Ltd. | | 238,717 | 5,707,635 |
| Lupin Ltd. | | 1,335 | 27,791 |
| Reliance Industries Ltd. | | 145,596 | 3,159,676 |
|
| TOTAL INDIA | | | 19,985,494 |
|
| Indonesia - 0.2% | | | |
| PT Bank Central Asia Tbk | | 1,068,000 | 1,422,237 |
| PT Bank Rakyat Indonesia Tbk | | 2,121,200 | 2,052,928 |
| PT Kino Indonesia Tbk | | 234,500 | 42,224 |
|
| TOTAL INDONESIA | | | 3,517,389 |
|
| Ireland - 1.9% | | | |
| Accenture PLC Class A | | 17,800 | 2,159,140 |
| Alkermes PLC (a) | | 173,036 | 10,079,347 |
| Cairn Homes PLC (a) | | 1,347,939 | 2,297,905 |
| CRH PLC | | 134,700 | 4,906,327 |
| DCC PLC (United Kingdom) | | 16,900 | 1,560,677 |
| Green REIT PLC | | 621,300 | 923,808 |
| Greencore Group PLC | | 364,056 | 1,075,078 |
| James Hardie Industries PLC CDI | | 119,520 | 2,028,887 |
| Kerry Group PLC Class A | | 29,800 | 2,435,235 |
| Ryanair Holdings PLC sponsored ADR (a) | | 21,470 | 1,973,737 |
|
| TOTAL IRELAND | | | 29,440,141 |
|
| Isle of Man - 0.3% | | | |
| Paysafe Group PLC (a) | | 734,888 | 4,320,342 |
| Israel - 0.2% | | | |
| Frutarom Industries Ltd. | | 55,500 | 3,262,452 |
| Italy - 0.2% | | | |
| De Longhi SpA | | 50,400 | 1,537,220 |
| Intesa Sanpaolo SpA | | 716,700 | 2,092,121 |
|
| TOTAL ITALY | | | 3,629,341 |
|
| Japan - 6.8% | | | |
| A/S One Corp. | | 61,700 | 2,731,460 |
| ACOM Co. Ltd. (a) | | 119,900 | 532,411 |
| Ain Holdings, Inc. | | 37,900 | 2,624,696 |
| Aozora Bank Ltd. | | 577,000 | 2,101,476 |
| Daiichikosho Co. Ltd. | | 46,200 | 2,003,830 |
| Daito Trust Construction Co. Ltd. | | 15,400 | 2,265,620 |
| Dentsu, Inc. | | 66,900 | 3,768,845 |
| Hoya Corp. | | 86,000 | 4,107,325 |
| KDDI Corp. | | 207,700 | 5,506,973 |
| Keyence Corp. | | 9,820 | 3,946,499 |
| Komatsu Ltd. | | 103,400 | 2,763,008 |
| Misumi Group, Inc. | | 169,500 | 3,209,818 |
| Mitsubishi UFJ Financial Group, Inc. | | 672,600 | 4,261,995 |
| Monex Group, Inc. | | 831,000 | 2,079,830 |
| Morinaga & Co. Ltd. | | 37,000 | 1,749,181 |
| Nidec Corp. | | 19,300 | 1,769,419 |
| Nintendo Co. Ltd. | | 8,800 | 2,226,977 |
| Nitori Holdings Co. Ltd. | | 24,500 | 3,189,011 |
| Olympus Corp. | | 119,100 | 4,583,440 |
| OMRON Corp. | | 58,900 | 2,464,844 |
| ORIX Corp. | | 290,700 | 4,435,799 |
| Panasonic Corp. | | 260,900 | 3,119,907 |
| Recruit Holdings Co. Ltd. | | 91,800 | 4,636,322 |
| Relo Holdings Corp. | | 114,000 | 1,871,451 |
| Shionogi & Co. Ltd. | | 43,400 | 2,232,000 |
| SMC Corp. | | 8,900 | 2,506,131 |
| SMS Co., Ltd. | | 73,400 | 1,953,602 |
| SoftBank Corp. | | 53,500 | 4,058,121 |
| Sony Corp. | | 176,400 | 6,053,050 |
| Start Today Co. Ltd. | | 163,200 | 3,484,333 |
| Sundrug Co. Ltd. | | 72,200 | 2,532,424 |
| Tsuruha Holdings, Inc. | | 36,300 | 3,679,659 |
| VT Holdings Co. Ltd. | | 280,200 | 1,425,193 |
| Welcia Holdings Co. Ltd. | | 122,800 | 3,954,716 |
|
| TOTAL JAPAN | | | 103,829,366 |
|
| Kenya - 0.1% | | | |
| Safaricom Ltd. | | 6,251,600 | 1,166,117 |
| Luxembourg - 0.3% | | | |
| Eurofins Scientific SA | | 9,500 | 4,678,489 |
| Marshall Islands - 0.1% | | | |
| Hoegh LNG Partners LP | | 49,800 | 1,008,450 |
| Netherlands - 3.0% | | | |
| ASML Holding NV | | 8,000 | 1,054,800 |
| ASML Holding NV (Netherlands) | | 40,600 | 5,366,774 |
| Basic-Fit NV | | 37,100 | 648,629 |
| IMCD Group BV | | 106,500 | 5,736,717 |
| ING Groep NV (Certificaten Van Aandelen) | | 316,800 | 5,163,695 |
| Intertrust NV | | 98,600 | 1,976,252 |
| Koninklijke Philips Electronics NV | | 211,000 | 7,286,355 |
| Takeaway.com Holding BV (c) | | 31,700 | 1,067,693 |
| Unilever NV: | | | |
| (Certificaten Van Aandelen) (Bearer) | | 145,500 | 7,622,089 |
| (NY Reg.) (a) | | 194,000 | 10,134,560 |
| Van Lanschot NV (Bearer) | | 17,200 | 467,462 |
|
| TOTAL NETHERLANDS | | | 46,525,026 |
|
| New Zealand - 0.3% | | | |
| EBOS Group Ltd. | | 210,137 | 2,641,768 |
| Ryman Healthcare Group Ltd. | | 436,814 | 2,588,279 |
|
| TOTAL NEW ZEALAND | | | 5,230,047 |
|
| Norway - 0.6% | | | |
| Schibsted ASA (A Shares) | | 86,600 | 2,153,401 |
| Statoil ASA (b) | | 465,085 | 7,659,436 |
|
| TOTAL NORWAY | | | 9,812,837 |
|
| Philippines - 0.3% | | | |
| D&L Industries, Inc. | | 8,349,900 | 2,131,117 |
| SM Investments Corp. | | 137,205 | 1,991,670 |
|
| TOTAL PHILIPPINES | | | 4,122,787 |
|
| Singapore - 1.0% | | | |
| Broadcom Ltd. | | 71,000 | 15,677,510 |
| South Africa - 0.7% | | | |
| Aspen Pharmacare Holdings Ltd. | | 51,600 | 1,070,438 |
| Distell Group Ltd. | | 126,410 | 1,269,988 |
| EOH Holdings Ltd. | | 209,322 | 2,215,590 |
| Naspers Ltd. Class N | | 30,800 | 5,856,667 |
|
| TOTAL SOUTH AFRICA | | | 10,412,683 |
|
| Spain - 1.6% | | | |
| Amadeus IT Holding SA Class A | | 37,400 | 2,016,621 |
| Atresmedia Corporacion de Medios de Comunicacion SA | | 108,300 | 1,360,208 |
| CaixaBank SA | | 1,165,084 | 5,289,998 |
| Grifols SA ADR | | 170,873 | 3,709,653 |
| Hispania Activos Inmobiliarios SA | | 99,880 | 1,507,958 |
| Inditex SA | | 104,302 | 4,000,425 |
| Mediaset Espana Comunicacion SA | | 183,300 | 2,526,807 |
| Neinor Homes SLU | | 91,300 | 1,800,598 |
| Prosegur Cash SA | | 804,500 | 2,050,640 |
|
| TOTAL SPAIN | | | 24,262,908 |
|
| Sweden - 1.6% | | | |
| ASSA ABLOY AB (B Shares) | | 176,600 | 3,826,171 |
| Com Hem Holding AB | | 54,500 | 678,689 |
| HEXPOL AB (B Shares) | | 118,900 | 1,321,588 |
| Indutrade AB | | 87,000 | 2,055,830 |
| Nordea Bank AB | | 253,200 | 3,115,938 |
| Saab AB (B Shares) | | 66,000 | 3,272,690 |
| Sandvik AB | | 173,800 | 2,790,281 |
| Svenska Cellulosa AB (SCA) (B Shares) | | 165,600 | 5,485,536 |
| Svenska Handelsbanken AB (A Shares) | | 154,000 | 2,185,519 |
|
| TOTAL SWEDEN | | | 24,732,242 |
|
| Switzerland - 2.4% | | | |
| ABB Ltd. (Reg.) | | 236,230 | 5,788,643 |
| Credit Suisse Group AG | | 191,807 | 2,925,242 |
| EDAG Engineering Group AG | | 77,800 | 1,436,047 |
| Forbo Holding AG (Reg.) | | 1,170 | 1,917,859 |
| Julius Baer Group Ltd. | | 59,790 | 3,117,851 |
| Kaba Holding AG (B Shares) (Reg.) | | 2,620 | 2,244,774 |
| Nestle SA (Reg. S) | | 54,639 | 4,208,324 |
| Panalpina Welttransport Holding AG | | 18,370 | 2,431,486 |
| Partners Group Holding AG | | 6,758 | 4,085,364 |
| Schindler Holding AG (participation certificate) | | 10,829 | 2,212,599 |
| Syngenta AG (a) | | 7,621 | 3,533,233 |
| UBS Group AG | | 210,740 | 3,600,583 |
|
| TOTAL SWITZERLAND | | | 37,502,005 |
|
| Taiwan - 0.4% | | | |
| Largan Precision Co. Ltd. | | 18,000 | 2,986,798 |
| Taiwan Semiconductor Manufacturing Co. Ltd. | | 477,000 | 3,067,497 |
|
| TOTAL TAIWAN | | | 6,054,295 |
|
| United Kingdom - 7.5% | | | |
| Aggreko PLC | | 180,300 | 2,072,530 |
| Ascential PLC | | 207,619 | 948,708 |
| BAE Systems PLC | | 275,100 | 2,234,356 |
| Barclays PLC | | 898,378 | 2,460,125 |
| BCA Marketplace PLC | | 511,600 | 1,302,057 |
| BHP Billiton PLC | | 274,852 | 4,190,176 |
| Booker Group PLC | | 1,155,900 | 2,904,416 |
| British American Tobacco PLC: | | | |
| (United Kingdom) | | 77,600 | 5,242,917 |
| sponsored ADR (b) | | 300,000 | 20,412,000 |
| Bunzl PLC | | 101,900 | 3,178,100 |
| Cineworld Group PLC | | 138,500 | 1,262,872 |
| CMC Markets PLC | | 899,700 | 1,462,441 |
| Compass Group PLC | | 131,200 | 2,649,034 |
| Countryside Properties PLC | | 256,100 | 894,929 |
| Dialog Semiconductor PLC (a) | | 37,200 | 1,740,418 |
| Diploma PLC | | 147,500 | 2,118,656 |
| GlaxoSmithKline PLC | | 210,100 | 4,228,865 |
| Hilton Food Group PLC | | 350,100 | 3,489,294 |
| Imperial Tobacco Group PLC | | 42,203 | 2,067,291 |
| Jiangsu Yanghe Brewery JSC Ltd. ELS (HSBC Warrant Program) warrants 9/19/19 (a)(c) | | 157,700 | 1,830,130 |
| John Wood Group PLC | | 178,300 | 1,753,945 |
| LivaNova PLC (a) | | 39,000 | 2,055,300 |
| London Stock Exchange Group PLC | | 69,481 | 3,044,422 |
| Melrose Industries PLC | | 1,888,986 | 5,786,244 |
| Micro Focus International PLC | | 252,200 | 8,453,688 |
| Moneysupermarket.com Group PLC | | 393,500 | 1,762,918 |
| NCC Group Ltd. (b) | | 584,200 | 1,078,235 |
| Reckitt Benckiser Group PLC | | 42,200 | 3,888,204 |
| Rex Bionics PLC (a) | | 100,000 | 8,419 |
| Rio Tinto PLC | | 116,200 | 4,584,117 |
| Senior Engineering Group PLC | | 457,700 | 1,270,991 |
| Softcat PLC | | 333,193 | 1,777,992 |
| Spirax-Sarco Engineering PLC | | 33,846 | 2,279,542 |
| St. James's Place Capital PLC | | 123,700 | 1,839,282 |
| Standard Chartered PLC (United Kingdom) (a) | | 591,667 | 5,526,751 |
| Zpg PLC | | 603,000 | 2,889,721 |
|
| TOTAL UNITED KINGDOM | | | 114,689,086 |
|
| United States of America - 50.2% | | | |
| Activision Blizzard, Inc. | | 405,000 | 21,161,250 |
| Adobe Systems, Inc. (a) | | 301,124 | 40,272,324 |
| Alaska Air Group, Inc. | | 89,000 | 7,573,010 |
| Albemarle Corp. U.S. | | 3,000 | 326,730 |
| Alexion Pharmaceuticals, Inc. (a) | | 52,900 | 6,759,562 |
| Allison Transmission Holdings, Inc. | | 377,200 | 14,590,096 |
| Alphabet, Inc. Class A (a) | | 40,500 | 37,443,060 |
| Amazon.com, Inc. (a) | | 20,500 | 18,962,295 |
| American Tower Corp. | | 75,000 | 9,445,500 |
| AMETEK, Inc. | | 36,000 | 2,059,200 |
| Amgen, Inc. | | 129,300 | 21,117,276 |
| Amphenol Corp. Class A | | 135,000 | 9,761,850 |
| Analog Devices, Inc. | | 16,000 | 1,219,200 |
| Apple, Inc. | | 293,000 | 42,089,451 |
| athenahealth, Inc. (a) | | 1,200 | 117,612 |
| Autodesk, Inc. (a) | | 19,000 | 1,711,330 |
| Bank of America Corp. | | 1,678,000 | 39,164,520 |
| Berkshire Hathaway, Inc. Class B (a) | | 38,000 | 6,277,980 |
| Bio-Rad Laboratories, Inc. Class A (a) | | 3,000 | 654,780 |
| Boston Scientific Corp. (a) | | 779,000 | 20,550,020 |
| Burlington Stores, Inc. (a) | | 3,000 | 296,760 |
| CalAtlantic Group, Inc. | | 63,000 | 2,281,860 |
| Caterpillar, Inc. | | 185,000 | 18,918,100 |
| Cavium, Inc. (a) | | 1,700 | 117,045 |
| CBOE Holdings, Inc. | | 242,000 | 19,943,220 |
| Celanese Corp. Class A | | 10,000 | 870,400 |
| Charles Schwab Corp. | | 122,000 | 4,739,700 |
| Charter Communications, Inc. Class A (a) | | 52,000 | 17,948,320 |
| Cintas Corp. | | 5,000 | 612,350 |
| CME Group, Inc. | | 25,000 | 2,904,750 |
| Comcast Corp. Class A | | 12,000 | 470,280 |
| CSX Corp. | | 248,000 | 12,608,320 |
| Cummins, Inc. | | 69,000 | 10,414,860 |
| Cypress Semiconductor Corp. | | 170,000 | 2,381,700 |
| Edwards Lifesciences Corp. (a) | | 5,000 | 548,350 |
| Electronic Arts, Inc. (a) | | 53,900 | 5,110,798 |
| Entegris, Inc. (a) | | 59,000 | 1,463,200 |
| EOG Resources, Inc. | | 33,000 | 3,052,500 |
| Facebook, Inc. Class A (a) | | 121,500 | 18,255,375 |
| First Republic Bank | | 36,000 | 3,328,560 |
| FMC Corp. | | 183,000 | 13,401,090 |
| Global Payments, Inc. | | 29,700 | 2,428,272 |
| Goldman Sachs Group, Inc. | | 27,000 | 6,042,600 |
| Great Western Bancorp, Inc. | | 15,000 | 618,000 |
| HealthSouth Corp. | | 2 | 94 |
| Humana, Inc. | | 62,000 | 13,762,760 |
| Intercept Pharmaceuticals, Inc. (a) | | 48,060 | 5,399,541 |
| Intuit, Inc. | | 40,000 | 5,008,400 |
| Intuitive Surgical, Inc. (a) | | 2,500 | 2,089,675 |
| J.B. Hunt Transport Services, Inc. | | 25,000 | 2,241,500 |
| JPMorgan Chase & Co. | | 207,000 | 18,009,000 |
| KLA-Tencor Corp. | | 85,000 | 8,348,700 |
| Kulicke & Soffa Industries, Inc. (a) | | 67,000 | 1,495,440 |
| Lamb Weston Holdings, Inc. | | 27,000 | 1,127,250 |
| Lennar Corp. Class A | | 79,000 | 3,989,500 |
| Marriott International, Inc. Class A | | 92,000 | 8,686,640 |
| Microsemi Corp. (a) | | 3,000 | 140,820 |
| Microsoft Corp. | | 421,000 | 28,821,660 |
| Molson Coors Brewing Co. Class B | | 17,300 | 1,658,897 |
| Monsanto Co. | | 19,700 | 2,297,217 |
| Morgan Stanley | | 236,000 | 10,235,320 |
| MSC Industrial Direct Co., Inc. Class A | | 127,000 | 11,370,310 |
| MSCI, Inc. | | 122,400 | 12,279,168 |
| Netflix, Inc. (a) | | 21,000 | 3,196,200 |
| Northern Trust Corp. | | 87,000 | 7,830,000 |
| PACCAR, Inc. | | 34,000 | 2,268,820 |
| PayPal Holdings, Inc. (a) | | 417,000 | 19,899,240 |
| Performance Food Group Co. (a) | | 135,000 | 3,361,500 |
| Pioneer Natural Resources Co. | | 24,000 | 4,151,760 |
| Post Holdings, Inc. (a) | | 51,000 | 4,293,690 |
| Prestige Brands Holdings, Inc. (a) | | 138,900 | 7,974,249 |
| Qualcomm, Inc. | | 40,000 | 2,149,600 |
| Quest Diagnostics, Inc. | | 4,000 | 422,040 |
| Roper Technologies, Inc. | | 3,000 | 656,100 |
| S&P Global, Inc. | | 176,092 | 23,629,785 |
| Sirius XM Holdings, Inc. | | 160,000 | 792,000 |
| SLM Corp. (a) | | 65,000 | 815,100 |
| SunTrust Banks, Inc. | | 237,000 | 13,463,970 |
| SVB Financial Group (a) | | 71,000 | 12,491,740 |
| Symantec Corp. | | 5,000 | 158,150 |
| T-Mobile U.S., Inc. (a) | | 102,000 | 6,861,540 |
| Terex Corp. | | 39,000 | 1,364,220 |
| Texas Instruments, Inc. | | 61,000 | 4,829,980 |
| The Walt Disney Co. | | 55,000 | 6,358,000 |
| Twenty-First Century Fox, Inc. Class B | | 65,000 | 1,940,900 |
| U.S. Bancorp | | 57,000 | 2,922,960 |
| U.S. Foods Holding Corp. | | 102,000 | 2,876,400 |
| Union Pacific Corp. | | 82,000 | 9,180,720 |
| United Rentals, Inc. (a) | | 17,000 | 1,864,220 |
| UnitedHealth Group, Inc. | | 106,000 | 18,537,280 |
| Univar, Inc. (a) | | 170,700 | 5,095,395 |
| Vertex Pharmaceuticals, Inc. (a) | | 26,000 | 3,075,800 |
| Visa, Inc. Class A | | 89,500 | 8,164,190 |
| Western Digital Corp. | | 13,000 | 1,157,910 |
|
| TOTAL UNITED STATES OF AMERICA | | | 768,758,807 |
|
| TOTAL COMMON STOCKS | | | |
| (Cost $1,238,005,173) | | | 1,512,572,537 |
|
| Convertible Preferred Stocks - 0.1% | | | |
| Cayman Islands - 0.1% | | | |
| China Internet Plus Holdings Ltd. Series A-11 (a)(d) | | | |
| (Cost $1,166,878) | | 369,166 | 1,768,305 |
|
| Money Market Funds - 3.6% | | | |
| Fidelity Cash Central Fund, 0.85% (e) | | 13,905,475 | 13,908,257 |
| Fidelity Securities Lending Cash Central Fund 0.86% (e)(f) | | 40,926,552 | 40,930,644 |
| TOTAL MONEY MARKET FUNDS | | | |
| (Cost $54,838,486) | | | 54,838,901 |
| TOTAL INVESTMENT PORTFOLIO - 102.5% | | | |
| (Cost $1,294,010,537) | | | 1,569,179,743 |
| NET OTHER ASSETS (LIABILITIES) - (2.5)% | | | (38,958,629) |
| NET ASSETS - 100% | | | $1,530,221,114 |
Categorizations in the Schedule of Investments are based on country or territory of incorporation.
Legend
(a) Non-income producing
(b) Security or a portion of the security is on loan at period end.
(c) Security exempt from registration under Rule 144A of the Securities Act of 1933. These securities may be resold in transactions exempt from registration, normally to qualified institutional buyers. At the end of the period, the value of these securities amounted to $4,778,580 or 0.3% of net assets.
(d) Restricted securities - Investment in securities not registered under the Securities Act of 1933 (excluding 144A issues). At the end of the period, the value of restricted securities (excluding 144A issues) amounted to $1,768,305 or 0.1% of net assets.
(e) Affiliated fund that is generally available only to investment companies and other accounts managed by Fidelity Investments. The rate quoted is the annualized seven-day yield of the fund at period end. A complete unaudited listing of the fund's holdings as of its most recent quarter end is available upon request. In addition, each Fidelity Central Fund's financial statements are available on the SEC's website or upon request.
(f) Investment made with cash collateral received from securities on loan.
Additional information on each restricted holding is as follows:
| Security | Acquisition Date | Acquisition Cost |
| China Internet Plus Holdings Ltd. Series A-11 | 1/26/15 | $1,166,878 |
Affiliated Central Funds
Information regarding fiscal year to date income earned by the Fund from investments in Fidelity Central Funds is as follows:
| Fund | Income earned |
| Fidelity Cash Central Fund | $53,602 |
| Fidelity Securities Lending Cash Central Fund | 183,932 |
| Total | $237,534 |
Investment Valuation
The following is a summary of the inputs used, as of April 30, 2017, involving the Fund's assets and liabilities carried at fair value. The inputs or methodology used for valuing securities may not be an indication of the risk associated with investing in those securities. For more information on valuation inputs, and their aggregation into the levels used below, please refer to the Investment Valuation section in the accompanying Notes to Financial Statements.
| | Valuation Inputs at Reporting Date: |
| Description | Total | Level 1 | Level 2 | Level 3 |
| Investments in Securities: | | | | |
| Equities: | | | | |
| Consumer Discretionary | $201,502,393 | $182,055,430 | $17,678,658 | $1,768,305 |
| Consumer Staples | 109,536,319 | 87,062,422 | 22,473,897 | -- |
| Energy | 46,303,768 | 28,251,559 | 18,052,209 | -- |
| Financials | 298,573,343 | 264,947,746 | 33,625,597 | -- |
| Health Care | 161,173,055 | 152,751,164 | 8,421,891 | -- |
| Industrials | 223,019,892 | 194,368,484 | 28,651,408 | -- |
| Information Technology | 363,709,639 | 344,370,290 | 19,339,349 | -- |
| Materials | 66,552,003 | 52,871,383 | 13,680,620 | -- |
| Real Estate | 16,014,337 | 16,014,337 | -- | -- |
| Telecommunication Services | 23,374,257 | 11,839,331 | 11,534,926 | -- |
| Utilities | 4,581,836 | 4,581,836 | -- | -- |
| Money Market Funds | 54,838,901 | 54,838,901 | -- | -- |
| Total Investments in Securities: | $1,569,179,743 | $1,393,952,883 | $173,458,555 | $1,768,305 |
The following is a summary of transfers between Level 1 and Level 2 for the period ended April 30, 2017. Transfers are assumed to have occurred at the beginning of the period, and are primarily attributable to the valuation techniques used for foreign equity securities, as discussed in the accompanying Notes to Financial Statements:
| Transfers | Total |
| Level 1 to Level 2 | $36,987,288 |
| Level 2 to Level 1 | $34,193,712 |
See accompanying notes which are an integral part of the financial statements.
Financial Statements
Statement of Assets and Liabilities
| | | April 30, 2017 (Unaudited) |
| Assets | | |
Investment in securities, at value (including securities loaned of $39,618,264) — See accompanying schedule:
Unaffiliated issuers (cost $1,239,172,051) | $1,514,340,842 | |
| Fidelity Central Funds (cost $54,838,486) | 54,838,901 | |
| Total Investments (cost $1,294,010,537) | | $1,569,179,743 |
| Cash | | 27,492 |
| Receivable for investments sold | | 22,200,997 |
| Receivable for fund shares sold | | 973,802 |
| Dividends receivable | | 3,297,189 |
| Distributions receivable from Fidelity Central Funds | | 78,109 |
| Prepaid expenses | | 1,005 |
| Other receivables | | 115,539 |
| Total assets | | 1,595,873,876 |
| Liabilities | | |
| Payable for investments purchased | $22,676,976 | |
| Payable for fund shares redeemed | 882,402 | |
| Accrued management fee | 739,165 | |
| Distribution and service plan fees payable | 17,628 | |
| Other affiliated payables | 268,627 | |
| Other payables and accrued expenses | 134,825 | |
| Collateral on securities loaned | 40,933,139 | |
| Total liabilities | | 65,652,762 |
| Net Assets | | $1,530,221,114 |
| Net Assets consist of: | | |
| Paid in capital | | $1,220,227,761 |
| Undistributed net investment income | | 3,945,371 |
| Accumulated undistributed net realized gain (loss) on investments and foreign currency transactions | | 30,968,335 |
| Net unrealized appreciation (depreciation) on investments and assets and liabilities in foreign currencies | | 275,079,647 |
| Net Assets | | $1,530,221,114 |
| Calculation of Maximum Offering Price | | |
| Class A: | | |
| Net Asset Value and redemption price per share ($29,321,924 ÷ 1,227,146 shares) | | $23.89 |
| Maximum offering price per share (100/94.25 of $23.89) | | $25.35 |
| Class M: | | |
| Net Asset Value and redemption price per share ($9,515,091 ÷ 400,071 shares) | | $23.78 |
| Maximum offering price per share (100/96.50 of $23.78) | | $24.64 |
| Class C: | | |
| Net Asset Value and offering price per share ($9,565,130 ÷ 407,901 shares)(a) | | $23.45 |
| Worldwide: | | |
| Net Asset Value, offering price and redemption price per share ($1,465,808,041 ÷ 60,705,679 shares) | | $24.15 |
| Class I: | | |
| Net Asset Value, offering price and redemption price per share ($16,010,928 ÷ 665,982 shares) | | $24.04 |
(a) Redemption price per share is equal to net asset value less any applicable contingent deferred sales charge.
See accompanying notes which are an integral part of the financial statements.
Statement of Operations
| | | Six months ended April 30, 2017 (Unaudited) |
| Investment Income | | |
| Dividends | | $11,699,924 |
| Income from Fidelity Central Funds | | 237,534 |
| Income before foreign taxes withheld | | 11,937,458 |
| Less foreign taxes withheld | | (621,561) |
| Total income | | 11,315,897 |
| Expenses | | |
| Management fee | | |
| Basic fee | $4,932,982 | |
| Performance adjustment | (1,309,912) | |
| Transfer agent fees | 1,374,434 | |
| Distribution and service plan fees | 107,179 | |
| Accounting and security lending fees | 231,827 | |
| Custodian fees and expenses | 92,227 | |
| Independent trustees' fees and expenses | 3,019 | |
| Registration fees | 75,421 | |
| Audit | 37,014 | |
| Legal | 7,518 | |
| Miscellaneous | 5,979 | |
| Total expenses before reductions | 5,557,688 | |
| Expense reductions | (98,456) | 5,459,232 |
| Net investment income (loss) | | 5,856,665 |
| Realized and Unrealized Gain (Loss) | | |
| Net realized gain (loss) on: | | |
| Investment securities: | | |
| Unaffiliated issuers | 75,700,542 | |
| Fidelity Central Funds | (4,658) | |
| Foreign currency transactions | (112,550) | |
| Total net realized gain (loss) | | 75,583,334 |
Change in net unrealized appreciation (depreciation) on:
Investment securities | 67,419,095 | |
| Assets and liabilities in foreign currencies | 55,876 | |
| Total change in net unrealized appreciation (depreciation) | | 67,474,971 |
| Net gain (loss) | | 143,058,305 |
| Net increase (decrease) in net assets resulting from operations | | $148,914,970 |
See accompanying notes which are an integral part of the financial statements.
Statement of Changes in Net Assets
| | Six months ended April 30, 2017 (Unaudited) | Year ended October 31, 2016 |
| Increase (Decrease) in Net Assets | | |
| Operations | | |
| Net investment income (loss) | $5,856,665 | $13,077,907 |
| Net realized gain (loss) | 75,583,334 | (34,179,863) |
| Change in net unrealized appreciation (depreciation) | 67,474,971 | 7,184,648 |
| Net increase (decrease) in net assets resulting from operations | 148,914,970 | (13,917,308) |
| Distributions to shareholders from net investment income | (12,665,603) | (9,278,911) |
| Distributions to shareholders from net realized gain | (4,590,851) | (52,672,015) |
| Total distributions | (17,256,454) | (61,950,926) |
| Share transactions - net increase (decrease) | (84,364,952) | (65,607,542) |
| Redemption fees | 2,108 | 16,394 |
| Total increase (decrease) in net assets | 47,295,672 | (141,459,382) |
| Net Assets | | |
| Beginning of period | 1,482,925,442 | 1,624,384,824 |
| End of period | $1,530,221,114 | $1,482,925,442 |
| Other Information | | |
| Undistributed net investment income end of period | $3,945,371 | $10,754,309 |
See accompanying notes which are an integral part of the financial statements.
Financial Highlights — Fidelity Worldwide Fund Class A
| | Six months ended (Unaudited) April 30, | Years ended October 31, | | | | |
| | 2017 | 2016 | 2015 | 2014 | 2013 | 2012 |
| Selected Per–Share Data | | | | | | |
| Net asset value, beginning of period | $21.83 | $22.88 | $24.64 | $25.18 | $19.69 | $17.89 |
| Income from Investment Operations | | | | | | |
| Net investment income (loss)A | .06 | .12 | .06 | .02 | .02 | .10 |
| Net realized and unrealized gain (loss) | 2.19 | (.35) | .58 | 1.46 | 5.66 | 1.72 |
| Total from investment operations | 2.25 | (.23) | .64 | 1.48 | 5.68 | 1.82 |
| Distributions from net investment income | (.12) | (.07) | – | (.04) | (.11) | (.02) |
| Distributions from net realized gain | (.07) | (.75) | (2.40) | (1.98) | (.08) | – |
| Total distributions | (.19) | (.82) | (2.40) | (2.02) | (.19) | (.02) |
| Redemption fees added to paid in capitalA,B | – | – | – | – | – | – |
| Net asset value, end of period | $23.89 | $21.83 | $22.88 | $24.64 | $25.18 | $19.69 |
| Total ReturnC,D,E | 10.39% | (1.09)% | 2.73% | 6.29% | 29.10% | 10.20% |
| Ratios to Average Net AssetsF,G | | | | | | |
| Expenses before reductions | 1.06%H | 1.22% | 1.27% | 1.31% | 1.45% | 1.43% |
| Expenses net of fee waivers, if any | 1.06%H | 1.22% | 1.26% | 1.31% | 1.45% | 1.43% |
| Expenses net of all reductions | 1.04%H | 1.22% | 1.26% | 1.31% | 1.42% | 1.41% |
| Net investment income (loss) | .49%H | .55% | .27% | .10% | .09% | .52% |
| Supplemental Data | | | | | | |
| Net assets, end of period (000 omitted) | $29,322 | $29,052 | $31,043 | $33,788 | $28,661 | $18,723 |
| Portfolio turnover rateI | 133%H | 117% | 151% | 163% | 161% | 186% |
A Calculated based on average shares outstanding during the period.
B Amount represents less than $.005 per share.
C Total returns for periods of less than one year are not annualized.
D Total returns would have been lower if certain expenses had not been reduced during the applicable periods shown.
E Total returns do not include the effect of the sales charges.
F Fees and expenses of any underlying Fidelity Central Funds are not included in the Fund's expense ratio. The Fund indirectly bears its proportionate share of the expenses of any underlying Fidelity Central Funds.
G Expense ratios reflect operating expenses of the class. Expenses before reductions do not reflect amounts reimbursed by the investment adviser or reductions from brokerage service arrangements or reductions from other expense offset arrangements and do not represent the amount paid by the class during periods when reimbursements or reductions occur. Expenses net of fee waivers reflect expenses after reimbursement by the investment adviser but prior to reductions from brokerage service arrangements or other expense offset arrangements. Expenses net of all reductions represent the net expenses paid by the class.
H Annualized
I Amount does not include the portfolio activity of any underlying Fidelity Central Funds.
See accompanying notes which are an integral part of the financial statements.
Financial Highlights — Fidelity Worldwide Fund Class M
| | Six months ended (Unaudited) April 30, | Years ended October 31, | | | | |
| | 2017 | 2016 | 2015 | 2014 | 2013 | 2012 |
| Selected Per–Share Data | | | | | | |
| Net asset value, beginning of period | $21.67 | $22.72 | $24.49 | $25.05 | $19.61 | $17.83 |
| Income from Investment Operations | | | | | | |
| Net investment income (loss)A | .02 | .05 | (.01) | (.04) | (.04) | .05 |
| Net realized and unrealized gain (loss) | 2.19 | (.35) | .57 | 1.46 | 5.63 | 1.73 |
| Total from investment operations | 2.21 | (.30) | .56 | 1.42 | 5.59 | 1.78 |
| Distributions from net investment income | (.03) | –B | – | – | (.07) | – |
| Distributions from net realized gain | (.07) | (.75) | (2.33) | (1.98) | (.08) | – |
| Total distributions | (.10) | (.75) | (2.33) | (1.98) | (.15) | – |
| Redemption fees added to paid in capitalA,B | – | – | – | – | – | – |
| Net asset value, end of period | $23.78 | $21.67 | $22.72 | $24.49 | $25.05 | $19.61 |
| Total ReturnC,D,E | 10.25% | (1.38)% | 2.36% | 6.05% | 28.73% | 9.98% |
| Ratios to Average Net AssetsF,G | | | | | | |
| Expenses before reductions | 1.36%H | 1.53% | 1.57% | 1.58% | 1.71% | 1.68% |
| Expenses net of fee waivers, if any | 1.36%H | 1.52% | 1.56% | 1.58% | 1.70% | 1.68% |
| Expenses net of all reductions | 1.35%H | 1.52% | 1.56% | 1.58% | 1.68% | 1.66% |
| Net investment income (loss) | .19%H | .25% | (.04)% | (.17)% | (.16)% | .26% |
| Supplemental Data | | | | | | |
| Net assets, end of period (000 omitted) | $9,515 | $9,270 | $13,055 | $12,160 | $9,822 | $5,550 |
| Portfolio turnover rateI | 133%H | 117% | 151% | 163% | 161% | 186% |
A Calculated based on average shares outstanding during the period.
B Amount represents less than $.005 per share.
C Total returns for periods of less than one year are not annualized.
D Total returns would have been lower if certain expenses had not been reduced during the applicable periods shown.
E Total returns do not include the effect of the sales charges.
F Fees and expenses of any underlying Fidelity Central Funds are not included in the Fund's expense ratio. The Fund indirectly bears its proportionate share of the expenses of any underlying Fidelity Central Funds.
G Expense ratios reflect operating expenses of the class. Expenses before reductions do not reflect amounts reimbursed by the investment adviser or reductions from brokerage service arrangements or reductions from other expense offset arrangements and do not represent the amount paid by the class during periods when reimbursements or reductions occur. Expenses net of fee waivers reflect expenses after reimbursement by the investment adviser but prior to reductions from brokerage service arrangements or other expense offset arrangements. Expenses net of all reductions represent the net expenses paid by the class.
H Annualized
I Amount does not include the portfolio activity of any underlying Fidelity Central Funds.
See accompanying notes which are an integral part of the financial statements.
Financial Highlights — Fidelity Worldwide Fund Class C
| | Six months ended (Unaudited) April 30, | Years ended October 31, | | | | |
| | 2017 | 2016 | 2015 | 2014 | 2013 | 2012 |
| Selected Per–Share Data | | | | | | |
| Net asset value, beginning of period | $21.33 | $22.48 | $24.12 | $24.78 | $19.41 | $17.74 |
| Income from Investment Operations | | | | | | |
| Net investment income (loss)A | (.03) | (.05) | (.12) | (.15) | (.14) | (.04) |
| Net realized and unrealized gain (loss) | 2.16 | (.35) | .57 | 1.44 | 5.58 | 1.71 |
| Total from investment operations | 2.13 | (.40) | .45 | 1.29 | 5.44 | 1.67 |
| Distributions from net investment income | – | – | – | – | – | – |
| Distributions from net realized gain | (.01) | (.75) | (2.09) | (1.95) | (.07) | – |
| Total distributions | (.01) | (.75) | (2.09) | (1.95) | (.07) | – |
| Redemption fees added to paid in capitalA,B | – | – | – | – | – | – |
| Net asset value, end of period | $23.45 | $21.33 | $22.48 | $24.12 | $24.78 | $19.41 |
| Total ReturnC,D,E | 10.00% | (1.88)% | 1.90% | 5.55% | 28.12% | 9.41% |
| Ratios to Average Net AssetsF,G | | | | | | |
| Expenses before reductions | 1.82%H | 2.01% | 2.07% | 2.04% | 2.15% | 2.18% |
| Expenses net of fee waivers, if any | 1.82%H | 2.01% | 2.07% | 2.04% | 2.14% | 2.18% |
| Expenses net of all reductions | 1.81%H | 2.00% | 2.06% | 2.03% | 2.12% | 2.16% |
| Net investment income (loss) | (.27)%H | (.24)% | (.54)% | (.63)% | (.60)% | (.23)% |
| Supplemental Data | | | | | | |
| Net assets, end of period (000 omitted) | $9,565 | $10,315 | $11,231 | $9,229 | $10,778 | $1,726 |
| Portfolio turnover rateI | 133%H | 117% | 151% | 163% | 161% | 186% |
A Calculated based on average shares outstanding during the period.
B Amount represents less than $.005 per share.
C Total returns for periods of less than one year are not annualized.
D Total returns would have been lower if certain expenses had not been reduced during the applicable periods shown.
E Total returns do not include the effect of the contingent deferred sales charge.
F Fees and expenses of any underlying Fidelity Central Funds are not included in the Fund's expense ratio. The Fund indirectly bears its proportionate share of the expenses of any underlying Fidelity Central Funds.
G Expense ratios reflect operating expenses of the class. Expenses before reductions do not reflect amounts reimbursed by the investment adviser or reductions from brokerage service arrangements or reductions from other expense offset arrangements and do not represent the amount paid by the class during periods when reimbursements or reductions occur. Expenses net of fee waivers reflect expenses after reimbursement by the investment adviser but prior to reductions from brokerage service arrangements or other expense offset arrangements. Expenses net of all reductions represent the net expenses paid by the class.
H Annualized
I Amount does not include the portfolio activity of any underlying Fidelity Central Funds.
See accompanying notes which are an integral part of the financial statements.
Financial Highlights — Fidelity Worldwide Fund
| | Six months ended (Unaudited) April 30, | Years ended October 31, | | | | |
| | 2017 | 2016 | 2015 | 2014 | 2013 | 2012 |
| Selected Per–Share Data | | | | | | |
| Net asset value, beginning of period | $22.09 | $23.14 | $24.92 | $25.41 | $19.85 | $18.02 |
| Income from Investment Operations | | | | | | |
| Net investment income (loss)A | .09 | .19 | .13 | .11 | .10 | .16 |
| Net realized and unrealized gain (loss) | 2.24 | (.35) | .58 | 1.47 | 5.70 | 1.74 |
| Total from investment operations | 2.33 | (.16) | .71 | 1.58 | 5.80 | 1.90 |
| Distributions from net investment income | (.20) | (.14) | (.08) | (.09) | (.16) | (.07) |
| Distributions from net realized gain | (.07) | (.75) | (2.41) | (1.98) | (.08) | – |
| Total distributions | (.27) | (.89) | (2.49) | (2.07) | (.24) | (.07) |
| Redemption fees added to paid in capitalA,B | – | – | – | – | – | – |
| Net asset value, end of period | $24.15 | $22.09 | $23.14 | $24.92 | $25.41 | $19.85 |
| Total ReturnC,D | 10.64% | (.78)% | 3.01% | 6.64% | 29.54% | 10.56% |
| Ratios to Average Net AssetsE,F | | | | | | |
| Expenses before reductions | .74%G | .91% | .96% | .98% | 1.11% | 1.11% |
| Expenses net of fee waivers, if any | .74%G | .91% | .96% | .97% | 1.11% | 1.11% |
| Expenses net of all reductions | .72%G | .90% | .95% | .97% | 1.08% | 1.09% |
| Net investment income (loss) | .81%G | .87% | .57% | .44% | .43% | .84% |
| Supplemental Data | | | | | | |
| Net assets, end of period (000 omitted) | $1,465,808 | $1,421,364 | $1,543,516 | $1,535,658 | $1,464,415 | $1,081,240 |
| Portfolio turnover rateH | 133%G | 117% | 151% | 163% | 161% | 186% |
A Calculated based on average shares outstanding during the period.
B Amount represents less than $.005 per share.
C Total returns for periods of less than one year are not annualized.
D Total returns would have been lower if certain expenses had not been reduced during the applicable periods shown.
E Fees and expenses of any underlying Fidelity Central Funds are not included in the Fund's expense ratio. The Fund indirectly bears its proportionate share of the expenses of any underlying Fidelity Central Funds.
F Expense ratios reflect operating expenses of the class. Expenses before reductions do not reflect amounts reimbursed by the investment adviser or reductions from brokerage service arrangements or reductions from other expense offset arrangements and do not represent the amount paid by the class during periods when reimbursements or reductions occur. Expenses net of fee waivers reflect expenses after reimbursement by the investment adviser but prior to reductions from brokerage service arrangements or other expense offset arrangements. Expenses net of all reductions represent the net expenses paid by the class.
G Annualized
H Amount does not include the portfolio activity of any underlying Fidelity Central Funds.
See accompanying notes which are an integral part of the financial statements.
Financial Highlights — Fidelity Worldwide Fund Class I
| | Six months ended (Unaudited) April 30, | Years ended October 31, | | | | |
| | 2017 | 2016 | 2015 | 2014 | 2013 | 2012 |
| Selected Per–Share Data | | | | | | |
| Net asset value, beginning of period | $21.99 | $23.03 | $24.81 | $25.31 | $19.78 | $17.98 |
| Income from Investment Operations | | | | | | |
| Net investment income (loss)A | .09 | .17 | .13 | .10 | .08 | .14 |
| Net realized and unrealized gain (loss) | 2.21 | (.35) | .58 | 1.47 | 5.68 | 1.74 |
| Total from investment operations | 2.30 | (.18) | .71 | 1.57 | 5.76 | 1.88 |
| Distributions from net investment income | (.18) | (.11) | (.07) | (.09) | (.15) | (.08) |
| Distributions from net realized gain | (.07) | (.75) | (2.41) | (1.98) | (.08) | – |
| Total distributions | (.25) | (.86) | (2.49)B | (2.07) | (.23) | (.08) |
| Redemption fees added to paid in capitalA,C | – | – | – | – | – | – |
| Net asset value, end of period | $24.04 | $21.99 | $23.03 | $24.81 | $25.31 | $19.78 |
| Total ReturnD,E | 10.58% | (.86)% | 3.00% | 6.63% | 29.44% | 10.49% |
| Ratios to Average Net AssetsF,G | | | | | | |
| Expenses before reductions | .76%H | .99% | .98% | 1.01% | 1.17% | 1.18% |
| Expenses net of fee waivers, if any | .76%H | .99% | .98% | 1.01% | 1.17% | 1.18% |
| Expenses net of all reductions | .75%H | .98% | .97% | 1.00% | 1.14% | 1.16% |
| Net investment income (loss) | .79%H | .78% | .55% | .40% | .37% | .77% |
| Supplemental Data | | | | | | |
| Net assets, end of period (000 omitted) | $16,011 | $12,924 | $25,173 | $19,107 | $10,639 | $4,291 |
| Portfolio turnover rateI | 133%H | 117% | 151% | 163% | 161% | 186% |
A Calculated based on average shares outstanding during the period.
B Total distributions of $2.49 per share is comprised of distributions from net investment income of $.074 and distributions from net realized gain of $2.413 per share.
C Amount represents less than $.005 per share.
D Total returns for periods of less than one year are not annualized.
E Total returns would have been lower if certain expenses had not been reduced during the applicable periods shown.
F Fees and expenses of any underlying Fidelity Central Funds are not included in the Fund's expense ratio. The Fund indirectly bears its proportionate share of the expenses of any underlying Fidelity Central Funds.
G Expense ratios reflect operating expenses of the class. Expenses before reductions do not reflect amounts reimbursed by the investment adviser or reductions from brokerage service arrangements or reductions from other expense offset arrangements and do not represent the amount paid by the class during periods when reimbursements or reductions occur. Expenses net of fee waivers reflect expenses after reimbursement by the investment adviser but prior to reductions from brokerage service arrangements or other expense offset arrangements. Expenses net of all reductions represent the net expenses paid by the class.
H Annualized
I Amount does not include the portfolio activity of any underlying Fidelity Central Funds.
See accompanying notes which are an integral part of the financial statements.
Notes to Financial Statements (Unaudited)
For the period ended April 30, 2017
1.��Organization.
Fidelity Worldwide Fund (the Fund) is a fund of Fidelity Investment Trust (the Trust) and is authorized to issue an unlimited number of shares. The Trust is registered under the Investment Company Act of 1940, as amended (the 1940 Act), as an open-end management investment company organized as a Massachusetts business trust. The Fund offers Class A, Class M (formerly Class T), Class C, Worldwide and Class I shares, each of which has equal rights as to assets and voting privileges. Each class has exclusive voting rights with respect to matters that affect that class.
After the close of business on June 24, 2016, all outstanding Class B shares were converted to Class A shares. All prior fiscal period dollar and share amounts for Class B presented in the Notes to Financial Statements are for the period November 1, 2015 through June 24, 2016.
2. Investments in Fidelity Central Funds.
The Fund invests in Fidelity Central Funds, which are open-end investment companies generally available only to other investment companies and accounts managed by the investment adviser and its affiliates. The Fund's Schedule of Investments lists each of the Fidelity Central Funds held as of period end, if any, as an investment of the Fund, but does not include the underlying holdings of each Fidelity Central Fund. As an Investing Fund, the Fund indirectly bears its proportionate share of the expenses of the underlying Fidelity Central Funds.
The Money Market Central Funds seek preservation of capital and current income and are managed by Fidelity Investments Money Management, Inc. (FIMM), an affiliate of the investment adviser. Annualized expenses of the Money Market Central Funds as of their most recent shareholder report date are less than .005%.
A complete unaudited list of holdings for each Fidelity Central Fund is available upon request or at the Securities and Exchange Commission (the SEC) website at www.sec.gov. In addition, the financial statements of the Fidelity Central Funds are available on the SEC website or upon request.
3. Significant Accounting Policies.
The Fund is an investment company and applies the accounting and reporting guidance of the Financial Accounting Standards Board (FASB) Accounting Standards Codification Topic 946 Financial Services – Investments Companies. The financial statements have been prepared in conformity with accounting principles generally accepted in the United States of America (GAAP), which require management to make certain estimates and assumptions at the date of the financial statements. Actual results could differ from those estimates. Subsequent events, if any, through the date that the financial statements were issued have been evaluated in the preparation of the financial statements. The following summarizes the significant accounting policies of the Fund:
Investment Valuation. Investments are valued as of 4:00 p.m. Eastern time on the last calendar day of the period. The Board of Trustees (the Board) has delegated the day to day responsibility for the valuation of the Fund's investments to the Fair Value Committee (the Committee) established by the Fund's investment adviser. In accordance with valuation policies and procedures approved by the Board, the Fund attempts to obtain prices from one or more third party pricing vendors or brokers to value its investments. When current market prices, quotations or currency exchange rates are not readily available or reliable, investments will be fair valued in good faith by the Committee, in accordance with procedures adopted by the Board. Factors used in determining fair value vary by investment type and may include market or investment specific events. The frequency with which these procedures are used cannot be predicted and they may be utilized to a significant extent. The Committee oversees the Fund's valuation policies and procedures and reports to the Board on the Committee's activities and fair value determinations. The Board monitors the appropriateness of the procedures used in valuing the Fund's investments and ratifies the fair value determinations of the Committee.
The Fund categorizes the inputs to valuation techniques used to value its investments into a disclosure hierarchy consisting of three levels as shown below:
- Level 1 – quoted prices in active markets for identical investments
- Level 2 – other significant observable inputs (including quoted prices for similar investments, interest rates, prepayment speeds, etc.)
- Level 3 – unobservable inputs (including the Fund's own assumptions based on the best information available)
Valuation techniques used to value the Fund's investments by major category are as follows:
Equity securities, including restricted securities, for which market quotations are readily available, are valued at the last reported sale price or official closing price as reported by a third party pricing vendor on the primary market or exchange on which they are traded and are categorized as Level 1 in the hierarchy. In the event there were no sales during the day or closing prices are not available, securities are valued at the last quoted bid price or may be valued using the last available price and are generally categorized as Level 2 in the hierarchy. For foreign equity securities, when market or security specific events arise, comparisons to the valuation of American Depositary Receipts (ADRs), futures contracts, Exchange-Traded Funds (ETFs) and certain indexes as well as quoted prices for similar securities may be used and would be categorized as Level 2 in the hierarchy. Utilizing these techniques may result in transfers between Level 1 and Level 2. For equity securities, including restricted securities, where observable inputs are limited, assumptions about market activity and risk are used and these securities may be categorized as Level 3 in the hierarchy.
Investments in open-end mutual funds, including the Fidelity Central Funds, are valued at their closing net asset value (NAV) each business day and are categorized as Level 1 in the hierarchy.
Changes in valuation techniques may result in transfers in or out of an assigned level within the disclosure hierarchy. The aggregate value of investments by input level as of April 30, 2017, including information on transfers between Levels 1 and 2, is included at the end of the Fund's Schedule of Investments.
Foreign Currency. The Fund may use foreign currency contracts to facilitate transactions in foreign-denominated securities. Gains and losses from these transactions may arise from changes in the value of the foreign currency or if the counterparties do not perform under the contracts' terms.
Foreign-denominated assets, including investment securities, and liabilities are translated into U.S. dollars at the exchange rates at period end. Purchases and sales of investment securities, income and dividends received and expenses denominated in foreign currencies are translated into U.S. dollars at the exchange rate in effect on the transaction date.
The effects of exchange rate fluctuations on investments are included with the net realized and unrealized gain (loss) on investment securities. Other foreign currency transactions resulting in realized and unrealized gain (loss) are disclosed separately.
Investment Transactions and Income. For financial reporting purposes, the Fund's investment holdings and NAV include trades executed through the end of the last business day of the period. The NAV per share for processing shareholder transactions is calculated as of the close of business of the New York Stock Exchange (NYSE), normally 4:00 p.m. Eastern time and includes trades executed through the end of the prior business day. Gains and losses on securities sold are determined on the basis of identified cost and may include proceeds received from litigation. Dividend income is recorded on the ex-dividend date, except for certain dividends from foreign securities where the ex-dividend date may have passed, which are recorded as soon as the Fund is informed of the ex-dividend date. Non-cash dividends included in dividend income, if any, are recorded at the fair market value of the securities received. Income and capital gain distributions from Fidelity Central Funds, if any, are recorded on the ex-dividend date. Certain distributions received by the Fund represent a return of capital or capital gain. The Fund determines the components of these distributions subsequent to the ex-dividend date, based upon receipt of tax filings or other correspondence relating to the underlying investment. These distributions are recorded as a reduction of cost of investments and/or as a realized gain. Investment income is recorded net of foreign taxes withheld where recovery of such taxes is uncertain.
Class Allocations and Expenses. Investment income, realized and unrealized capital gains and losses, common expenses of the Fund, and certain fund-level expense reductions, if any, are allocated daily on a pro-rata basis to each class based on the relative net assets of each class to the total net assets of the Fund. Each class differs with respect to transfer agent and distribution and service plan fees incurred. Certain expense reductions may also differ by class. For the reporting period, the allocated portion of income and expenses to each class as a percent of its average net assets may vary due to the timing of recording these transactions in relation to fluctuating net assets of the classes. Expenses directly attributable to a fund are charged to that fund. Expenses attributable to more than one fund are allocated among the respective funds on the basis of relative net assets or other appropriate methods. Expense estimates are accrued in the period to which they relate and adjustments are made when actual amounts are known.
Income Tax Information and Distributions to Shareholders. Each year, the Fund intends to qualify as a regulated investment company under Subchapter M of the Internal Revenue Code, including distributing substantially all of its taxable income and realized gains. As a result, no provision for U.S. Federal income taxes is required. The Fund files a U.S. federal tax return, in addition to state and local tax returns as required. The Fund's federal income tax returns are subject to examination by the Internal Revenue Service (IRS) for a period of three fiscal years after they are filed. State and local tax returns may be subject to examination for an additional fiscal year depending on the jurisdiction. Foreign taxes are provided for based on the Fund's understanding of the tax rules and rates that exist in the foreign markets in which it invests. The Fund is subject to a tax imposed on capital gains by certain countries in which it invests.
Distributions are declared and recorded on the ex-dividend date. Income dividends and capital gain distributions are declared separately for each class. Income and capital gain distributions are determined in accordance with income tax regulations, which may differ from GAAP.
Capital accounts within the financial statements are adjusted for permanent book-tax differences. These adjustments have no impact on net assets or the results of operations. Capital accounts are not adjusted for temporary book-tax differences which will reverse in a subsequent period.
Book-tax differences are primarily due to foreign currency transactions, certain foreign taxes, passive foreign income companies (PFIC), deferred trustees compensation and losses deferred due to wash sales.
The federal tax cost of investment securities and unrealized appreciation (depreciation) as of period end were as follows:
| Gross unrealized appreciation | $293,533,179 |
| Gross unrealized depreciation | (25,064,459) |
| Net unrealized appreciation (depreciation) on securities | $268,468,720 |
| Tax cost | $1,300,711,023 |
Capital loss carryforwards are only available to offset future capital gains of the Fund to the extent provided by regulations and may be limited. Under the Regulated Investment Company Modernization Act of 2010 (the Act), the Fund is permitted to carry forward capital losses incurred in taxable years beginning after December 22, 2010 for an unlimited period and such capital losses are required to be used prior to any losses that expire. The capital loss carryforward information presented below, including any applicable limitation, is estimated as of prior fiscal period end and is subject to adjustment.
| No expiration | |
| Short-term | $(35,963,442) |
Short-Term Trading (Redemption) Fees. Shares held by investors in the Fund less than 30 days may have been subject to a redemption fee equal to 1.00% of the NAV of shares redeemed. All redemption fees, which reduce the proceeds of the shareholder redemption, are retained by the Fund and accounted for as an addition to paid in capital. In November 2016, the Board of Trustees approved the elimination of these redemption fees effective December 12, 2016.
Restricted Securities. The Fund may invest in securities that are subject to legal or contractual restrictions on resale. These securities generally may be resold in transactions exempt from registration or to the public if the securities are registered. Disposal of these securities may involve time-consuming negotiations and expense, and prompt sale at an acceptable price may be difficult. Information regarding restricted securities is included at the end of the Fund's Schedule of Investments.
4. Purchases and Sales of Investments.
Purchases and sales of securities, other than short-term securities, aggregated $967,813,890 and $1,048,807,326, respectively.
5. Fees and Other Transactions with Affiliates.
Management Fee. Fidelity Management & Research Company (the investment adviser) and its affiliates provide the Fund with investment management related services for which the Fund pays a monthly management fee. The management fee is the sum of an individual fund fee rate that is based on an annual rate of .424% of the Fund's average net assets and an annualized group fee rate that averaged .25% during the period. The group fee rate is based upon the average net assets of all the mutual funds advised by the investment adviser, including any mutual funds previously advised by the investment adviser that are currently advised by Fidelity SelectCo, LLC, an affiliate of the investment adviser. The group fee rate decreases as assets under management increase and increases as assets under management decrease. In addition, the management fee is subject to a performance adjustment (up to a maximum of +/- .20% of the Fund's average net assets over a 36 month performance period). The upward or downward adjustment to the management fee is based on the relative investment performance of Overseas as compared to its benchmark index, the MSCI World Index, over the same 36 month performance period. For the reporting period, the total annualized management fee rate, including the performance adjustment, was .49% of the Fund's average net assets. The performance adjustment included in the management fee rate may be higher or lower than the maximum performance adjustment rate due to the difference between the average net assets for the reporting and performance periods.
Distribution and Service Plan Fees. In accordance with Rule 12b-1 of the 1940 Act, the Fund has adopted separate Distribution and Service Plans for each class of shares. Certain classes pay Fidelity Distributors Corporation (FDC), an affiliate of the investment adviser, separate Distribution and Service Fees, each of which is based on an annual percentage of each class' average net assets. In addition, FDC may pay financial intermediaries for selling shares of the Fund and providing shareholder support services. For the period, the Distribution and Service Fee rates, total fees and amounts retained by FDC were as follows:
| | Distribution
Fee | Service
Fee | Total Fees | Retained
by FDC |
| Class A | -% | .25% | $35,246 | $614 |
| Class M | .25% | .25% | 22,872 | 276 |
| Class C | .75% | .25% | 49,061 | 5,522 |
| | | | $107,179 | $6,412 |
Sales Load. FDC may receive a front-end sales charge of up to 5.75% for selling Class A shares and 3.50% for selling Class M shares, some of which is paid to financial intermediaries for selling shares of the Fund. Depending on the holding period, FDC may receive contingent deferred sales charges levied on Class A, Class M and Class C redemptions. The deferred sales charges are 1.00% for Class C shares, 1.00% for certain purchases of Class A shares and .25% for certain purchases of Class M shares.
For the period, sales charge amounts retained by FDC were as follows:
| | Retained
by FDC |
| Class A | $4,985 |
| Class M | 952 |
| Class C(a) | 738 |
| | $6,675 |
(a) When Class C shares are initially sold, FDC pays commissions from its own resources to financial intermediaries through which the sales are made.
Transfer Agent Fees. Fidelity Investments Institutional Operations Company, Inc., (FIIOC), an affiliate of the investment adviser, is the transfer, dividend disbursing and shareholder servicing agent for each class of the Fund. FIIOC receives account fees and asset-based fees that vary according to the account size and type of account of the shareholders of the respective classes of the Fund. FIIOC pays for typesetting, printing and mailing of shareholder reports, except proxy statements.
For the period, transfer agent fees for each class were as follows:
| | Amount | % of
Class-Level Average
Net Assets(a) |
| Class A | $35,803 | .25 |
| Class M | 14,181 | .31 |
| Class C | 13,281 | .27 |
| Worldwide | 1,296,523 | .18 |
| Class I | 14,646 | .21 |
| | $1,374,434 | |
(a) Annualized
Accounting and Security Lending Fees. Fidelity Service Company, Inc. (FSC), an affiliate of the investment adviser, maintains the Fund's accounting records. The accounting fee is based on the level of average net assets for each month. Under a separate contract, FSC administers the security lending program. The security lending fee is based on the number and duration of lending transactions.
Brokerage Commissions. The Fund placed a portion of its portfolio transactions with brokerage firms which are affiliates of the investment adviser. Brokerage commissions are included in net realized gain (loss) and change in net unrealized appreciation (depreciation) in the Statement of Operations. The commissions paid to these affiliated firms were $14,614 for the period.
Interfund Trades. The Fund may purchase from or sell securities to other Fidelity Funds under procedures adopted by the Board. The procedures have been designed to ensure these interfund trades are executed in accordance with Rule 17a-7 of the 1940 Act. Interfund trades are included within the respective purchases and sales amounts shown in the Purchases and Sales of Investments note.
6. Committed Line of Credit.
The Fund participates with other funds managed by the investment adviser or an affiliate in a $4.25 billion credit facility (the "line of credit") to be utilized for temporary or emergency purposes to fund shareholder redemptions or for other short-term liquidity purposes. The Fund has agreed to pay commitment fees on its pro-rata portion of the line of credit, which amounted to $2,509 and is reflected in Miscellaneous expenses on the Statement of Operations. During the period, the Fund did not borrow on this line of credit.
7. Security Lending.
The Fund lends portfolio securities through a lending agent from time to time in order to earn additional income. For equity securities, a lending agent is used and may loan securities to certain qualified borrowers, including Fidelity Capital Markets (FCM), a broker-dealer affiliated with the Fund. On the settlement date of the loan, the Fund receives collateral (in the form of U.S. Treasury obligations, letters of credit and/or cash) against the loaned securities and maintains collateral in an amount not less than 100% of the market value of the loaned securities during the period of the loan. The market value of the loaned securities is determined at the close of business of the Fund and any additional required collateral is delivered to the Fund on the next business day. The Fund or borrower may terminate the loan at any time, and if the borrower defaults on its obligation to return the securities loaned because of insolvency or other reasons, the Fund may apply collateral received from the borrower against the obligation. The Fund may experience delays and costs in recovering the securities loaned. Any cash collateral received is invested in the Fidelity Securities Lending Cash Central Fund. The value of loaned securities and cash collateral at period end are disclosed on the Fund's Statement of Assets and Liabilities. Security lending income represents the income earned on investing cash collateral, less rebates paid to borrowers and any lending agent fees associated with the loan, plus any premium payments received for lending certain types of securities. Security lending income is presented in the Statement of Operations as a component of Income from Fidelity Central Funds. Total security lending income during the period amounted to $183,932, including $10,852 from securities loaned to FCM. During the period, there were no securities loaned to FCM.
8. Expense Reductions.
Commissions paid to certain brokers with whom the investment adviser, or its affiliates, places trades on behalf of the Fund include an amount in addition to trade execution, which may be rebated back to the Fund to offset certain expenses. This amount totaled $91,914 for the period.
In addition, during the period the investment adviser reimbursed and/or waived a portion of fund-level operating expenses in the amount of $6,542.
9. Distributions to Shareholders.
Distributions to shareholders of each class were as follows:
| | Six months ended
April 30, 2017 | Year ended October 31, 2016 |
| From net investment income | | |
| Class A | $156,477 | $95,208 |
| Class M | 13,192 | 2,313 |
| Worldwide | 12,387,164 | 9,064,407 |
| Class I | 108,770 | 116,983 |
| Total | $12,665,603 | $9,278,911 |
| From net realized gain | | |
| Class A | $90,524 | $1,050,091 |
| Class M | 29,788 | 433,754 |
| Class B | – | 11,494 |
| Class C | 5,172 | 384,211 |
| Worldwide | 4,423,987 | 49,987,535 |
| Class I | 41,380 | 804,930 |
| Total | $4,590,851 | $52,672,015 |
10. Share Transactions.
Share transactions for each class were as follows and may contain automatic conversions between classes or exchanges between affiliated funds:
| | Shares | Shares | Dollars | Dollars |
| | Six months ended
April 30, 2017 | Year ended October 31, 2016 | Six months ended
April 30, 2017 | Year ended October 31, 2016 |
| Class A | | | | |
| Shares sold | 120,515 | 331,876 | $2,719,789 | $7,164,455 |
| Reinvestment of distributions | 11,046 | 49,536 | 241,804 | 1,105,146 |
| Shares redeemed | (235,474) | (407,262) | (5,254,213) | (8,799,726) |
| Net increase (decrease) | (103,913) | (25,850) | $(2,292,620) | $(530,125) |
| Class M | | | | |
| Shares sold | 27,960 | 92,065 | $629,375 | $1,986,009 |
| Reinvestment of distributions | 1,947 | 19,370 | 42,456 | 430,197 |
| Shares redeemed | (57,604) | (258,217) | (1,275,858) | (5,563,782) |
| Net increase (decrease) | (27,697) | (146,782) | $(604,027) | $(3,147,576) |
| Class B | | | | |
| Shares sold | – | 457 | $– | $8,678 |
| Reinvestment of distributions | – | 487 | – | 10,726 |
| Shares redeemed | – | (17,206) | – | (357,745) |
| Net increase (decrease) | – | (16,262) | $– | $(338,341) |
| Class C | | | | |
| Shares sold | 26,872 | 109,109 | $590,395 | $2,300,381 |
| Reinvestment of distributions | 220 | 15,568 | 4,750 | 341,870 |
| Shares redeemed | (102,865) | (140,660) | (2,264,024) | (2,969,570) |
| Net increase (decrease) | (75,773) | (15,983) | $(1,668,879) | $(327,319) |
| Worldwide | | | | |
| Shares sold | 2,811,611 | 8,058,052 | $63,844,968 | $175,292,628 |
| Reinvestment of distributions | 735,217 | 2,542,668 | 16,240,943 | 57,260,887 |
| Shares redeemed | (7,175,802) | (12,958,622) | (161,678,433) | (282,800,632) |
| Net increase (decrease) | (3,628,974) | (2,357,902) | $(81,592,522) | $(50,247,117) |
| Class I | | | | |
| Shares sold | 183,773 | 401,119 | $4,162,492 | $8,728,970 |
| Reinvestment of distributions | 6,375 | 28,687 | 140,244 | 643,439 |
| Shares redeemed | (111,928) | (935,107) | (2,509,640) | (20,389,473) |
| Net increase (decrease) | 78,220 | (505,301) | $1,793,096 | $(11,017,064) |
11. Other.
The Fund's organizational documents provide former and current trustees and officers with a limited indemnification against liabilities arising in connection with the performance of their duties to the Fund. In the normal course of business, the Fund may also enter into contracts that provide general indemnifications. The Fund's maximum exposure under these arrangements is unknown as this would be dependent on future claims that may be made against the Fund. The risk of material loss from such claims is considered remote.
Shareholder Expense Example
As a shareholder of the Fund, you incur two types of costs: (1) transaction costs, including sales charges (loads) on purchase payments or redemption proceeds, redemption fees and (2) ongoing costs, including management fees, distribution and/or service (12b-1) fees and other Fund expenses. This Example is intended to help you understand your ongoing costs (in dollars) of investing in the Fund and to compare these costs with the ongoing costs of investing in other mutual funds.
The Example is based on an investment of $1,000 invested at the beginning of the period and held for the entire period (November 1, 2016 to April 30, 2017).
Actual Expenses
The first line of the accompanying table for each class of the Fund provides information about actual account values and actual expenses. You may use the information in this line, together with the amount you invested, to estimate the expenses that you paid over the period. Simply divide your account value by $1,000.00 (for example, an $8,600 account value divided by $1,000.00 = 8.6), then multiply the result by the number in the first line for a class of the Fund under the heading entitled "Expenses Paid During Period" to estimate the expenses you paid on your account during this period. A small balance maintenance fee of $12.00 that is charged once a year may apply for certain accounts with a value of less than $2,000. This fee is not included in the table below. If it was, the estimate of expenses you paid during the period would be higher, and your ending account value lower, by this amount. In addition, the Fund, as a shareholder in the underlying Fidelity Central Funds, will indirectly bear its pro-rata share of the fees and expenses incurred by the underlying Fidelity Central Funds. These fees and expenses are not included in the Fund's annualized expense ratio used to calculate the expense estimate in the table below.
Hypothetical Example for Comparison Purposes
The second line of the accompanying table for each class of the Fund provides information about hypothetical account values and hypothetical expenses based on a Class' actual expense ratio and an assumed rate of return of 5% per year before expenses, which is not the Class' actual return. The hypothetical account values and expenses may not be used to estimate the actual ending account balance or expenses you paid for the period. You may use this information to compare the ongoing costs of investing in the Fund and other funds. To do so, compare this 5% hypothetical example with the 5% hypothetical examples that appear in the shareholder reports of the other funds. A small balance maintenance fee of $12.00 that is charged once a year may apply for certain accounts with a value of less than $2,000. This fee is not included in the table below. If it was, the estimate of expenses you paid during the period would be higher, and your ending account value lower, by this amount. In addition, the Fund, as a shareholder in the underlying Fidelity Central Funds, will indirectly bear its pro-rata share of the fees and expenses incurred by the underlying Fidelity Central Funds. These fees and expenses are not included in the Fund's annualized expense ratio used to calculate the expense estimate in the table below.
Please note that the expenses shown in the table are meant to highlight your ongoing costs only and do not reflect any transaction costs. Therefore, the second line of the table is useful in comparing ongoing costs only, and will not help you determine the relative total costs of owning different funds. In addition, if these transactional costs were included, your costs would have been higher.
| | Annualized Expense Ratio-A | Beginning
Account Value
November 1, 2016 | Ending
Account Value
April 30, 2017 | Expenses Paid
During Period-B
November 1, 2016
to April 30, 2017 |
| Class A | 1.06% | | | |
| Actual | | $1,000.00 | $1,103.90 | $5.53 |
| Hypothetical-C | | $1,000.00 | $1,019.54 | $5.31 |
| Class M | 1.36% | | | |
| Actual | | $1,000.00 | $1,102.50 | $7.09 |
| Hypothetical-C | | $1,000.00 | $1,018.05 | $6.81 |
| Class C | 1.82% | | | |
| Actual | | $1,000.00 | $1,100.00 | $9.48 |
| Hypothetical-C | | $1,000.00 | $1,015.77 | $9.10 |
| Worldwide | .74% | | | |
| Actual | | $1,000.00 | $1,106.40 | $3.86 |
| Hypothetical-C | | $1,000.00 | $1,021.12 | $3.71 |
| Class I | .76% | | | |
| Actual | | $1,000.00 | $1,105.80 | $3.97 |
| Hypothetical-C | | $1,000.00 | $1,021.03 | $3.81 |
A Annualized expense ratio reflects expenses net of applicable fee waivers.
B Expenses are equal to each Class' annualized expense ratio, multiplied by the average account value over the period, multiplied by 181/365 (to reflect the one-half year period).
C 5% return per year before expenses
AWLD-SANN-0617
1.883450.108
Fidelity® Emerging Europe, Middle East, Africa (EMEA) Fund
Semi-Annual Report April 30, 2017 |
|
Contents
To view a fund's proxy voting guidelines and proxy voting record for the 12-month period ended June 30, visit http://www.fidelity.com/proxyvotingresults or visit the Securities and Exchange Commission's (SEC) web site at http://www.sec.gov.
You may also call 1-800-544-8544 to request a free copy of the proxy voting guidelines.
Standard & Poor's, S&P and S&P 500 are registered service marks of The McGraw-Hill Companies, Inc. and have been licensed for use by Fidelity Distributors Corporation.
Other third-party marks appearing herein are the property of their respective owners.
All other marks appearing herein are registered or unregistered trademarks or service marks of FMR LLC or an affiliated company. © 2017 FMR LLC. All rights reserved.
This report and the financial statements contained herein are submitted for the general information of the shareholders of the Fund. This report is not authorized for distribution to prospective investors in the Fund unless preceded or accompanied by an effective prospectus.
A fund files its complete schedule of portfolio holdings with the SEC for the first and third quarters of each fiscal year on Form N-Q. Forms N-Q are available on the SEC’s web site at http://www.sec.gov. A fund's Forms N-Q may be reviewed and copied at the SEC’s Public Reference Room in Washington, DC. Information regarding the operation of the SEC's Public Reference Room may be obtained by calling 1-800-SEC-0330.
For a complete list of a fund's portfolio holdings, view the most recent holdings listing, semiannual report, or annual report on Fidelity's web site at http://www.fidelity.com, http://www.institutional.fidelity.com, or http://www.401k.com, as applicable.
NOT FDIC INSURED •MAY LOSE VALUE •NO BANK GUARANTEE
Neither the Fund nor Fidelity Distributors Corporation is a bank.
Investment Summary (Unaudited)
Geographic Diversification (% of fund's net assets)
| As of April 30, 2017 |
| | South Africa | 41.3% |
| | Russia | 21.6% |
| | United Arab Emirates | 5.8% |
| | Poland | 5.6% |
| | United Kingdom | 4.1% |
| | Romania | 2.4% |
| | Greece | 1.9% |
| | Nigeria | 1.9% |
| | Hungary | 1.8% |
| | Other* | 13.6% |

* Includes Short-Term investments and Net Other Assets (Liabilities).
Percentages are based on country or territory of incorporation and are adjusted for the effect of futures contracts, if applicable.
| As of October 31, 2016 |
| | South Africa | 43.5% |
| | Russia | 22.0% |
| | United Arab Emirates | 5.2% |
| | United Kingdom | 3.7% |
| | Romania | 3.1% |
| | Hungary | 2.1% |
| | Poland | 2.0% |
| | Netherlands | 1.9% |
| | Qatar | 1.8% |
| | Other* | 14.7% |

* Includes Short-Term investments and Net Other Assets (Liabilities).
Percentages are based on country or territory of incorporation and are adjusted for the effect of futures contracts, if applicable.
Asset Allocation as of April 30, 2017
| | % of fund's net assets | % of fund's net assets 6 months ago |
| Stocks | 99.5 | 99.3 |
| Short-Term Investments and Net Other Assets (Liabilities) | 0.5 | 0.7 |
Top Ten Stocks as of April 30, 2017
| | % of fund's net assets | % of fund's net assets 6 months ago |
| Naspers Ltd. Class N (South Africa, Media) | 8.3 | 8.3 |
| Sberbank of Russia (Russia, Banks) | 5.5 | 5.0 |
| Gazprom OAO (Russia, Oil, Gas & Consumable Fuels) | 4.0 | 4.0 |
| Lukoil PJSC (Russia, Oil, Gas & Consumable Fuels) | 3.9 | 4.7 |
| FirstRand Ltd. (South Africa, Diversified Financial Services) | 3.1 | 3.0 |
| Standard Bank Group Ltd. (South Africa, Banks) | 2.7 | 2.3 |
| NOVATEK OAO (Russia, Oil, Gas & Consumable Fuels) | 2.1 | 2.2 |
| Shoprite Holdings Ltd. (South Africa, Food & Staples Retailing) | 2.0 | 2.3 |
| Remgro Ltd. (South Africa, Diversified Financial Services) | 1.9 | 2.0 |
| Surgutneftegas OJSC (Russia, Oil, Gas & Consumable Fuels) | 1.8 | 1.5 |
| | 35.3 | |
Top Market Sectors as of April 30, 2017
| | % of fund's net assets | % of fund's net assets 6 months ago |
| Financials | 31.1 | 31.0 |
| Consumer Discretionary | 18.9 | 18.3 |
| Energy | 16.3 | 15.6 |
| Materials | 11.3 | 11.7 |
| Consumer Staples | 10.3 | 10.4 |
| Industrials | 4.6 | 5.9 |
| Real Estate | 2.7 | 2.6 |
| Telecommunication Services | 2.1 | 2.3 |
| Health Care | 1.7 | 1.5 |
| Utilities | 0.3 | 0.0 |
Market Sectors may include more than one industry category.
The Fund may invest up to 35% of its total assets in any industry that represents more than 20% of the emerging Europe, Middle East and Africa markets. As of April 30, 2017, the Fund did not have more than 25% of its total assets invested in any one industry.
Percentages shown as 0.0% may reflect amounts less than 0.05%.
Investments April 30, 2017 (Unaudited)
Showing Percentage of Net Assets
| Common Stocks - 96.1% | | | |
| | | Shares | Value |
| Austria - 0.5% | | | |
| Buwog-Gemeinnuetzige Wohnung | | 20,100 | $542,775 |
| Bailiwick of Jersey - 0.8% | | | |
| Glencore Xstrata PLC | | 137,200 | 543,513 |
| Wizz Air Holdings PLC (a) | | 13,888 | 317,484 |
|
| TOTAL BAILIWICK OF JERSEY | | | 860,997 |
|
| Belgium - 0.6% | | | |
| KBC Groep NV | | 8,912 | 643,436 |
| Bermuda - 0.7% | | | |
| Central European Media Enterprises Ltd. Class A (a)(b) | | 181,600 | 744,560 |
| Botswana - 0.3% | | | |
| First National Bank of Botswana Ltd. (a) | | 1,042,331 | 277,453 |
| British Virgin Islands - 0.5% | | | |
| Lenta Ltd. GDR (a) | | 80,900 | 515,333 |
| Canada - 0.6% | | | |
| Detour Gold Corp. (a) | | 52,300 | 660,910 |
| Cyprus - 0.5% | | | |
| Globaltrans Investment PLC GDR (Reg. S) | | 68,500 | 518,545 |
| Estonia - 0.4% | | | |
| Tallinna Kaubamaja AS | | 42,700 | 420,013 |
| Greece - 1.9% | | | |
| Fourlis Holdings SA (a) | | 100,000 | 522,864 |
| Jumbo SA | | 26,536 | 418,843 |
| Motor Oil (HELLAS) Corinth Refineries SA | | 37,800 | 641,103 |
| Sarantis SA | | 37,800 | 475,989 |
|
| TOTAL GREECE | | | 2,058,799 |
|
| Hungary - 1.8% | | | |
| OTP Bank PLC | | 67,500 | 1,898,588 |
| Israel - 1.1% | | | |
| Bank Hapoalim BM (Reg.) | | 80,000 | 499,420 |
| Elbit Systems Ltd. (Israel) | | 4,900 | 583,784 |
| First International Bank of Israel | | 6,500 | 107,143 |
|
| TOTAL ISRAEL | | | 1,190,347 |
|
| Kenya - 1.4% | | | |
| British American Tobacco Kenya Ltd. | | 63,400 | 518,504 |
| KCB Group Ltd. | | 1,685,600 | 514,500 |
| Safaricom Ltd. | | 2,640,544 | 492,543 |
|
| TOTAL KENYA | | | 1,525,547 |
|
| Lithuania - 0.3% | | | |
| Apranga AB (a) | | 110,466 | 330,909 |
| Luxembourg - 0.5% | | | |
| Tenaris SA | | 32,000 | 499,901 |
| Morocco - 0.1% | | | |
| Douja Promotion Groupe Addoha SA | | 25,000 | 119,129 |
| Netherlands - 0.9% | | | |
| X5 Retail Group NV GDR (Reg. S) (a) | | 20,100 | 708,525 |
| Yandex NV Series A (a) | | 10,000 | 272,600 |
|
| TOTAL NETHERLANDS | | | 981,125 |
|
| Nigeria - 1.9% | | | |
| Dangote Cement PLC | | 738,994 | 384,553 |
| Guaranty Trust Bank PLC | | 3,000,000 | 261,463 |
| Nigerian Breweries PLC | | 1,768,869 | 712,121 |
| Zenith Bank PLC | | 13,652,978 | 665,781 |
|
| TOTAL NIGERIA | | | 2,023,918 |
|
| Oman - 0.6% | | | |
| BankMuscat SAOG (a) | | 575,400 | 600,807 |
| Pakistan - 1.3% | | | |
| Engro Corp. Ltd. | | 150,500 | 506,532 |
| K-Electric Ltd. (a) | | 4,200,000 | 322,753 |
| United Bank Ltd. | | 214,400 | 507,863 |
|
| TOTAL PAKISTAN | | | 1,337,148 |
|
| Poland - 5.6% | | | |
| Ambra SA | | 100,400 | 261,922 |
| Fabryki Mebli Forte SA | | 22,000 | 449,448 |
| Globe Trade Centre SA | | 260,000 | 616,622 |
| Inter Cars SA | | 7,200 | 575,284 |
| Kruk SA | | 7,600 | 560,322 |
| LPP SA | | 560 | 1,001,856 |
| NG2 SA | | 13,800 | 798,288 |
| Orbis SA | | 25,500 | 571,896 |
| Pfleiderer Grajewo SA | | 57,000 | 652,843 |
| Quercus TFI SA (a) | | 269,800 | 452,078 |
|
| TOTAL POLAND | | | 5,940,559 |
|
| Qatar - 1.1% | | | |
| Qatar National Bank SAQ | | 30,037 | 1,186,203 |
| Romania - 2.4% | | | |
| Banca Transilvania SA | | 900,508 | 596,399 |
| BRD-Groupe Societe Generale | | 505,088 | 1,459,263 |
| Fondul Propietatea SA GDR | | 43,000 | 475,150 |
|
| TOTAL ROMANIA | | | 2,530,812 |
|
| Russia - 18.2% | | | |
| Alrosa Co. Ltd. (a) | | 727,200 | 1,253,244 |
| Gazprom OAO (a) | | 1,749,673 | 4,203,118 |
| Lukoil PJSC | | 16,600 | 822,544 |
| Lukoil PJSC sponsored ADR | | 67,195 | 3,337,240 |
| NOVATEK OAO | | 178,900 | 2,185,312 |
| Novolipetsk Steel OJSC GDR (Reg. S) | | 28,800 | 547,200 |
| Sberbank of Russia | | 2,004,320 | 5,821,664 |
| Tatneft PAO (a) | | 165,800 | 1,097,979 |
|
| TOTAL RUSSIA | | | 19,268,301 |
|
| Slovenia - 0.6% | | | |
| Petrol d.d., Ljubljana | | 1,550 | 592,634 |
| South Africa - 41.3% | | | |
| African Rainbow Minerals Ltd. | | 80,900 | 511,537 |
| AngloGold Ashanti Ltd. | | 112,100 | 1,283,761 |
| ArcelorMittal South Africa Ltd. (a) | | 780,000 | 437,751 |
| Aveng Ltd. (a) | | 1,189,200 | 506,336 |
| AVI Ltd. | | 80,000 | 585,105 |
| Barloworld Ltd. | | 74,200 | 668,612 |
| Cashbuild Ltd. (a) | | 21,000 | 570,424 |
| City Lodge Hotels Ltd. | | 55,300 | 615,412 |
| Clicks Group Ltd. | | 139,954 | 1,405,745 |
| Dis-Chem Pharmacies Pty Ltd. | | 312,000 | 575,497 |
| DRDGOLD Ltd. | | 2,367,814 | 923,496 |
| Exxaro Resources Ltd. | | 95,500 | 813,809 |
| FirstRand Ltd. | | 877,100 | 3,271,794 |
| Grindrod Ltd. (a) | | 633,200 | 569,531 |
| Holdsport Ltd. | | 124,700 | 590,572 |
| Hulamin Ltd. | | 1,096,900 | 568,816 |
| Imperial Holdings Ltd. | | 79,000 | 998,987 |
| KAP Industrial Holdings Ltd. | | 887,200 | 622,061 |
| Kumba Iron Ore Ltd. (a) | | 24,000 | 312,595 |
| Mr Price Group Ltd. | | 97,500 | 1,146,179 |
| MTN Group Ltd. | | 102,350 | 968,835 |
| Murray & Roberts Holdings Ltd. | | 499,000 | 522,757 |
| Nampak Ltd. (a) | | 1,072,900 | 1,437,090 |
| Naspers Ltd. Class N | | 46,400 | 8,823,034 |
| Northam Platinum Ltd. (a) | | 125,400 | 466,365 |
| Pioneer Foods Ltd. | | 61,400 | 757,452 |
| Pretoria Portland Cement Co. Ltd. (a) | | 1,118,549 | 523,126 |
| PSG Group Ltd. | | 86,600 | 1,639,819 |
| Remgro Ltd. | | 123,700 | 2,053,436 |
| RMB Holdings Ltd. | | 253,300 | 1,162,654 |
| Sasol Ltd. | | 30,100 | 922,410 |
| Shoprite Holdings Ltd. | | 135,600 | 2,128,810 |
| Spar Group Ltd. | | 78,800 | 1,062,440 |
| Spur Corp. Ltd. | | 241,500 | 562,920 |
| Standard Bank Group Ltd. | | 252,914 | 2,807,769 |
| Telkom SA Ltd. | | 153,000 | 856,147 |
|
| TOTAL SOUTH AFRICA | | | 43,673,084 |
|
| Turkey - 0.3% | | | |
| Migros Turk Ticaret A/S (a) | | 40,000 | 273,878 |
| United Arab Emirates - 5.8% | | | |
| Agthia Group PJSC | | 274,787 | 467,579 |
| Aldar Properties PJSC | | 1,425,871 | 830,755 |
| DP World Ltd. | | 30,000 | 613,200 |
| Dubai Financial Market PJSC (a) | | 2,760,358 | 864,256 |
| Dubai Islamic Bank Pakistan Ltd. (a) | | 522,528 | 835,077 |
| Dubai Parks and Resorts PJSC (a) | | 2,538,210 | 666,859 |
| Emaar Malls Group PJSC (a) | | 1,034,766 | 724,026 |
| National Bank of Abu Dhabi PJSC (a) | | 398,375 | 1,193,064 |
|
| TOTAL UNITED ARAB EMIRATES | | | 6,194,816 |
|
| United Kingdom - 4.1% | | | |
| ALDREES Petroleum and Transport Services Co. ELS (HSBC Warrant Program) warrants 1/30/20 (c) | | 90,625 | 638,441 |
| Banque Saudi Fransi (HSBC Bank Warrant Program) warrants 3/24/20 (a)(c) | | 15,000 | 104,793 |
| Bupa Arabia ELS (HSBC Warrant Program) warrants 10/19/18 (c) | | 13,300 | 413,336 |
| Fawaz Alhokair Group ELS (HSBC Bank Warrant Program) warrants 2/28/20 (a)(c) | | 16,500 | 149,766 |
| Georgia Healthcare Group PLC (a) | | 107,500 | 494,281 |
| Mediclinic International PLC | | 57,300 | 604,654 |
| NMC Health PLC | | 23,749 | 611,195 |
| The Savola Group ELS (HSBC Warrant Program) warrants 1/24/20 (c) | | 76,800 | 870,547 |
| United International Transportation Co. ELS (HSBC Warrant Program) warrants 7/31/17 (a)(c) | | 78,004 | 474,233 |
|
| TOTAL UNITED KINGDOM | | | 4,361,246 |
|
| TOTAL COMMON STOCKS | | | |
| (Cost $80,211,686) | | | 101,771,773 |
|
| Nonconvertible Preferred Stocks - 3.4% | | | |
| Russia - 3.4% | | | |
| Surgutneftegas OJSC(a) | | 3,572,400 | 1,914,570 |
| Tatneft PAO (a) | | 410,800 | 1,718,139 |
|
| TOTAL RUSSIA | | | 3,632,709 |
|
| TOTAL NONCONVERTIBLE PREFERRED STOCKS | | | |
| (Cost $3,156,715) | | | 3,632,709 |
|
| Money Market Funds - 0.5% | | | |
| Fidelity Securities Lending Cash Central Fund 0.86% (d)(e) | | | |
| (Cost $492,502) | | 492,462 | 492,511 |
| TOTAL INVESTMENT PORTFOLIO - 100.0% | | | |
| (Cost $83,860,903) | | | 105,896,993 |
| NET OTHER ASSETS (LIABILITIES) - 0.0% | | | (43,173) |
| NET ASSETS - 100% | | | $105,853,820 |
Security Type Abbreviations
ELS – Equity-Linked Security
Categorizations in the Schedule of Investments are based on country or territory of incorporation.
Legend
(a) Non-income producing
(b) Security or a portion of the security is on loan at period end.
(c) Security exempt from registration under Rule 144A of the Securities Act of 1933. These securities may be resold in transactions exempt from registration, normally to qualified institutional buyers. At the end of the period, the value of these securities amounted to $2,651,116 or 2.5% of net assets.
(d) Affiliated fund that is generally available only to investment companies and other accounts managed by Fidelity Investments. The rate quoted is the annualized seven-day yield of the fund at period end. A complete unaudited listing of the fund's holdings as of its most recent quarter end is available upon request. In addition, each Fidelity Central Fund's financial statements are available on the SEC's website or upon request.
(e) Investment made with cash collateral received from securities on loan.
Affiliated Central Funds
Information regarding fiscal year to date income earned by the Fund from investments in Fidelity Central Funds is as follows:
| Fund | Income earned |
| Fidelity Cash Central Fund | $2,056 |
| Fidelity Securities Lending Cash Central Fund | 3,855 |
| Total | $5,911 |
Investment Valuation
The following is a summary of the inputs used, as of April 30, 2017, involving the Fund's assets and liabilities carried at fair value. The inputs or methodology used for valuing securities may not be an indication of the risk associated with investing in those securities. For more information on valuation inputs, and their aggregation into the levels used below, please refer to the Investment Valuation section in the accompanying Notes to Financial Statements.
| | Valuation Inputs at Reporting Date: |
| Description | Total | Level 1 | Level 2 | Level 3 |
| Investments in Securities: | | | | |
| Equities: | | | | |
| Consumer Discretionary | $19,980,969 | $11,157,935 | $8,823,034 | $-- |
| Consumer Staples | 10,868,913 | 10,868,913 | -- | -- |
| Energy | 17,233,715 | 9,793,582 | 7,440,133 | -- |
| Financials | 33,006,518 | 24,533,738 | 8,472,780 | -- |
| Health Care | 1,710,130 | 1,710,130 | -- | -- |
| Industrials | 4,922,310 | 4,922,310 | -- | -- |
| Information Technology | 272,600 | 272,600 | -- | -- |
| Materials | 11,935,742 | 8,806,075 | 3,129,667 | -- |
| Real Estate | 2,833,307 | 2,833,307 | -- | -- |
| Telecommunication Services | 2,317,525 | 2,317,525 | -- | -- |
| Utilities | 322,753 | 322,753 | -- | -- |
| Money Market Funds | 492,511 | 492,511 | -- | -- |
| Total Investments in Securities: | $105,896,993 | $78,031,379 | $27,865,614 | $-- |
The following is a summary of transfers between Level 1 and Level 2 for the period ended April 30, 2017. Transfers are assumed to have occurred at the beginning of the period, and are primarily attributable to the valuation techniques used for foreign equity securities, as discussed in the accompanying Notes to Financial Statements:
| Transfers | Total |
| Level 1 to Level 2 | $8,212,485 |
| Level 2 to Level 1 | $773,474 |
See accompanying notes which are an integral part of the financial statements.
Financial Statements
Statement of Assets and Liabilities
| | | April 30, 2017 (Unaudited) |
| Assets | | |
Investment in securities, at value (including securities loaned of $476,558) — See accompanying schedule:
Unaffiliated issuers (cost $83,368,401) | $105,404,482 | |
| Fidelity Central Funds (cost $492,502) | 492,511 | |
| Total Investments (cost $83,860,903) | | $105,896,993 |
| Foreign currency held at value (cost $239,377) | | 240,294 |
| Receivable for investments sold | | 1,519,020 |
| Receivable for fund shares sold | | 89,807 |
| Dividends receivable | | 220,007 |
| Distributions receivable from Fidelity Central Funds | | 888 |
| Prepaid expenses | | 61 |
| Receivable from investment adviser for expense reductions | | 34,793 |
| Other receivables | | 7,459 |
| Total assets | | 108,009,322 |
| Liabilities | | |
| Payable to custodian bank | $472,076 | |
| Payable for investments purchased | 750,126 | |
| Payable for fund shares redeemed | 271,597 | |
| Accrued management fee | 70,171 | |
| Distribution and service plan fees payable | 7,353 | |
| Other affiliated payables | 27,476 | |
| Other payables and accrued expenses | 64,203 | |
| Collateral on securities loaned | 492,500 | |
| Total liabilities | | 2,155,502 |
| Net Assets | | $105,853,820 |
| Net Assets consist of: | | |
| Paid in capital | | $105,456,981 |
| Undistributed net investment income | | 529,208 |
| Accumulated undistributed net realized gain (loss) on investments and foreign currency transactions | | (22,158,055) |
| Net unrealized appreciation (depreciation) on investments and assets and liabilities in foreign currencies | | 22,025,686 |
| Net Assets | | $105,853,820 |
| Calculation of Maximum Offering Price | | |
| Class A: | | |
| Net Asset Value and redemption price per share ($5,915,775 ÷ 675,029 shares) | | $8.76 |
| Maximum offering price per share (100/94.25 of $8.76) | | $9.29 |
| Class M: | | |
| Net Asset Value and redemption price per share ($2,472,840 ÷ 282,883 shares) | | $8.74 |
| Maximum offering price per share (100/96.50 of $8.74) | | $9.06 |
| Class C: | | |
| Net Asset Value and offering price per share ($6,087,502 ÷ 698,550 shares)(a) | | $8.71 |
| Emerging Europe, Middle East, Africa (EMEA): | | |
| Net Asset Value, offering price and redemption price per share ($82,668,067 ÷ 9,424,036 shares) | | $8.77 |
| Class I: | | |
| Net Asset Value, offering price and redemption price per share ($8,709,636 ÷ 994,407 shares) | | $8.76 |
(a) Redemption price per share is equal to net asset value less any applicable contingent deferred sales charge.
See accompanying notes which are an integral part of the financial statements.
Statement of Operations
| | | Six months ended April 30, 2017 (Unaudited) |
| Investment Income | | |
| Dividends | | $1,482,736 |
| Income from Fidelity Central Funds | | 5,911 |
| Income before foreign taxes withheld | | 1,488,647 |
| Less foreign taxes withheld | | (129,608) |
| Total income | | 1,359,039 |
| Expenses | | |
| Management fee | $423,018 | |
| Transfer agent fees | 137,897 | |
| Distribution and service plan fees | 48,292 | |
| Accounting and security lending fees | 27,553 | |
| Custodian fees and expenses | 80,401 | |
| Independent trustees' fees and expenses | 214 | |
| Registration fees | 74,313 | |
| Audit | 34,768 | |
| Legal | 113 | |
| Miscellaneous | 386 | |
| Total expenses before reductions | 826,955 | |
| Expense reductions | (49,082) | 777,873 |
| Net investment income (loss) | | 581,166 |
| Realized and Unrealized Gain (Loss) | | |
| Net realized gain (loss) on: | | |
| Investment securities: | | |
| Unaffiliated issuers (net of foreign taxes of $47,553) | 1,610,418 | |
| Fidelity Central Funds | (73) | |
| Foreign currency transactions | (19,210) | |
| Total net realized gain (loss) | | 1,591,135 |
Change in net unrealized appreciation (depreciation) on:
Investment securities (net of decrease in deferred foreign taxes of $9,392) | 6,719,356 | |
| Assets and liabilities in foreign currencies | 550 | |
| Total change in net unrealized appreciation (depreciation) | | 6,719,906 |
| Net gain (loss) | | 8,311,041 |
| Net increase (decrease) in net assets resulting from operations | | $8,892,207 |
See accompanying notes which are an integral part of the financial statements.
Statement of Changes in Net Assets
| | Six months ended April 30, 2017 (Unaudited) | Year ended October 31, 2016 |
| Increase (Decrease) in Net Assets | | |
| Operations | | |
| Net investment income (loss) | $581,166 | $1,751,403 |
| Net realized gain (loss) | 1,591,135 | (6,335,400) |
| Change in net unrealized appreciation (depreciation) | 6,719,906 | 12,445,434 |
| Net increase (decrease) in net assets resulting from operations | 8,892,207 | 7,861,437 |
| Distributions to shareholders from net investment income | (1,167,439) | (1,323,710) |
| Share transactions - net increase (decrease) | (636,409) | 9,065,893 |
| Redemption fees | 49,861 | 36,545 |
| Total increase (decrease) in net assets | 7,138,220 | 15,640,165 |
| Net Assets | | |
| Beginning of period | 98,715,600 | 83,075,435 |
| End of period | $105,853,820 | $98,715,600 |
| Other Information | | |
| Undistributed net investment income end of period | $529,208 | $1,115,481 |
See accompanying notes which are an integral part of the financial statements.
Financial Highlights — Fidelity Emerging Europe, Middle East, Africa (EMEA) Fund Class A
| | Six months ended (Unaudited) April 30, | Years ended October 31, | | | | |
| | 2017 | 2016 | 2015 | 2014 | 2013 | 2012 |
| Selected Per–Share Data | | | | | | |
| Net asset value, beginning of period | $8.13 | $7.49 | $9.04 | $9.49 | $8.71 | $8.34 |
| Income from Investment Operations | | | | | | |
| Net investment income (loss)A | .04 | .14 | .12 | .13 | .16 | .18 |
| Net realized and unrealized gain (loss) | .68 | .61 | (1.50) | (.46) | .85 | .34 |
| Total from investment operations | .72 | .75 | (1.38) | (.33) | 1.01 | .52 |
| Distributions from net investment income | (.09) | (.11) | (.14) | (.12) | (.15) | (.15) |
| Distributions from net realized gain | – | – | (.04) | – | (.07) | – |
| Total distributions | (.09) | (.11) | (.17)B | (.12) | (.23)C | (.15) |
| Redemption fees added to paid in capitalA,D | – | – | – | – | – | – |
| Net asset value, end of period | $8.76 | $8.13 | $7.49 | $9.04 | $9.49 | $8.71 |
| Total ReturnE,F,G | 8.86% | 10.22% | (15.42)% | (3.48)% | 11.75% | 6.38% |
| Ratios to Average Net AssetsH,I | | | | | | |
| Expenses before reductions | 1.70%J | 1.69% | 1.61% | 1.60% | 1.64% | 1.62% |
| Expenses net of fee waivers, if any | 1.65%J | 1.65% | 1.61% | 1.60% | 1.63% | 1.62% |
| Expenses net of all reductions | 1.63%J | 1.64% | 1.60% | 1.60% | 1.62% | 1.60% |
| Net investment income (loss) | .93%J | 1.90% | 1.51% | 1.45% | 1.82% | 2.09% |
| Supplemental Data | | | | | | |
| Net assets, end of period (000 omitted) | $5,916 | $7,867 | $5,788 | $7,889 | $10,883 | $8,934 |
| Portfolio turnover rateK | 59%J | 54% | 50% | 38% | 64% | 30% |
A Calculated based on average shares outstanding during the period.
B Total distributions of $.17 per share is comprised of distributions from net investment income of $.135 and distributions from net realized gain of $.039 per share.
C Total distributions of $.23 per share is comprised of distributions from net investment income of $.151 and distributions from net realized gain of $.074 per share.
D Amount represents less than $.005 per share.
E Total returns for periods of less than one year are not annualized.
F Total returns would have been lower if certain expenses had not been reduced during the applicable periods shown.
G Total returns do not include the effect of the sales charges.
H Fees and expenses of any underlying Fidelity Central Funds are not included in the Fund's expense ratio. The Fund indirectly bears its proportionate share of the expenses of any underlying Fidelity Central Funds.
I Expense ratios reflect operating expenses of the class. Expenses before reductions do not reflect amounts reimbursed by the investment adviser or reductions from brokerage service arrangements or reductions from other expense offset arrangements and do not represent the amount paid by the class during periods when reimbursements or reductions occur. Expenses net of fee waivers reflect expenses after reimbursement by the investment adviser but prior to reductions from brokerage service arrangements or other expense offset arrangements. Expenses net of all reductions represent the net expenses paid by the class.
J Annualized
K Amount does not include the portfolio activity of any underlying Fidelity Central Funds.
See accompanying notes which are an integral part of the financial statements.
Financial Highlights — Fidelity Emerging Europe, Middle East, Africa (EMEA) Fund Class M
| | Six months ended (Unaudited) April 30, | Years ended October 31, | | | | |
| | 2017 | 2016 | 2015 | 2014 | 2013 | 2012 |
| Selected Per–Share Data | | | | | | |
| Net asset value, beginning of period | $8.10 | $7.44 | $9.01 | $9.46 | $8.68 | $8.31 |
| Income from Investment Operations | | | | | | |
| Net investment income (loss)A | .03 | .12 | .10 | .11 | .14 | .15 |
| Net realized and unrealized gain (loss) | .68 | .61 | (1.51) | (.46) | .84 | .35 |
| Total from investment operations | .71 | .73 | (1.41) | (.35) | .98 | .50 |
| Distributions from net investment income | (.07) | (.07) | (.13) | (.10) | (.12) | (.13) |
| Distributions from net realized gain | – | – | (.04) | – | (.07) | – |
| Total distributions | (.07) | (.07) | (.16)B | (.10) | (.20)C | (.13) |
| Redemption fees added to paid in capitalA,D | – | – | – | – | – | – |
| Net asset value, end of period | $8.74 | $8.10 | $7.44 | $9.01 | $9.46 | $8.68 |
| Total ReturnE,F,G | 8.81% | 9.98% | (15.80)% | (3.67)% | 11.42% | 6.14% |
| Ratios to Average Net AssetsH,I | | | | | | |
| Expenses before reductions | 2.04%J | 2.00% | 1.92% | 1.92% | 1.93% | 1.89% |
| Expenses net of fee waivers, if any | 1.90%J | 1.90% | 1.90% | 1.90% | 1.90% | 1.89% |
| Expenses net of all reductions | 1.88%J | 1.89% | 1.89% | 1.90% | 1.88% | 1.86% |
| Net investment income (loss) | .68%J | 1.65% | 1.22% | 1.15% | 1.55% | 1.82% |
| Supplemental Data | | | | | | |
| Net assets, end of period (000 omitted) | $2,473 | $2,580 | $2,003 | $2,465 | $3,465 | $3,336 |
| Portfolio turnover rateK | 59%J | 54% | 50% | 38% | 64% | 30% |
A Calculated based on average shares outstanding during the period.
B Total distributions of $.16 per share is comprised of distributions from net investment income of $.125 and distributions from net realized gain of $.039 per share.
C Total distributions of $.20 per share is comprised of distributions from net investment income of $.122 and distributions from net realized gain of $.074 per share.
D Amount represents less than $.005 per share.
E Total returns for periods of less than one year are not annualized.
F Total returns would have been lower if certain expenses had not been reduced during the applicable periods shown.
G Total returns do not include the effect of the sales charges.
H Fees and expenses of any underlying Fidelity Central Funds are not included in the Fund's expense ratio. The Fund indirectly bears its proportionate share of the expenses of any underlying Fidelity Central Funds.
I Expense ratios reflect operating expenses of the class. Expenses before reductions do not reflect amounts reimbursed by the investment adviser or reductions from brokerage service arrangements or reductions from other expense offset arrangements and do not represent the amount paid by the class during periods when reimbursements or reductions occur. Expenses net of fee waivers reflect expenses after reimbursement by the investment adviser but prior to reductions from brokerage service arrangements or other expense offset arrangements. Expenses net of all reductions represent the net expenses paid by the class.
J Annualized
K Amount does not include the portfolio activity of any underlying Fidelity Central Funds.
See accompanying notes which are an integral part of the financial statements.
Financial Highlights — Fidelity Emerging Europe, Middle East, Africa (EMEA) Fund Class C
| | Six months ended (Unaudited) April 30, | Years ended October 31, | | | | |
| | 2017 | 2016 | 2015 | 2014 | 2013 | 2012 |
| Selected Per–Share Data | | | | | | |
| Net asset value, beginning of period | $8.06 | $7.39 | $8.93 | $9.39 | $8.62 | $8.24 |
| Income from Investment Operations | | | | | | |
| Net investment income (loss)A | .01 | .09 | .06 | .06 | .09 | .11 |
| Net realized and unrealized gain (loss) | .67 | .60 | (1.48) | (.46) | .83 | .35 |
| Total from investment operations | .68 | .69 | (1.42) | (.40) | .92 | .46 |
| Distributions from net investment income | (.03) | (.02) | (.08) | (.06) | (.08) | (.08) |
| Distributions from net realized gain | – | – | (.04) | – | (.07) | – |
| Total distributions | (.03) | (.02) | (.12) | (.06) | (.15) | (.08) |
| Redemption fees added to paid in capitalA,B | – | – | – | – | – | – |
| Net asset value, end of period | $8.71 | $8.06 | $7.39 | $8.93 | $9.39 | $8.62 |
| Total ReturnC,D,E | 8.50% | 9.33% | (16.08)% | (4.24)% | 10.83% | 5.68% |
| Ratios to Average Net AssetsF,G | | | | | | |
| Expenses before reductions | 2.49%H | 2.47% | 2.41% | 2.40% | 2.42% | 2.37% |
| Expenses net of fee waivers, if any | 2.40%H | 2.40% | 2.40% | 2.40% | 2.40% | 2.37% |
| Expenses net of all reductions | 2.38%H | 2.39% | 2.39% | 2.40% | 2.38% | 2.35% |
| Net investment income (loss) | .18%H | 1.15% | .72% | .65% | 1.05% | 1.34% |
| Supplemental Data | | | | | | |
| Net assets, end of period (000 omitted) | $6,088 | $6,269 | $4,104 | $6,662 | $6,782 | $7,770 |
| Portfolio turnover rateI | 59%H | 54% | 50% | 38% | 64% | 30% |
A Calculated based on average shares outstanding during the period.
B Amount represents less than $.005 per share.
C Total returns for periods of less than one year are not annualized.
D Total returns would have been lower if certain expenses had not been reduced during the applicable periods shown.
E Total returns do not include the effect of the contingent deferred sales charge.
F Fees and expenses of any underlying Fidelity Central Funds are not included in the Fund's expense ratio. The Fund indirectly bears its proportionate share of the expenses of any underlying Fidelity Central Funds.
G Expense ratios reflect operating expenses of the class. Expenses before reductions do not reflect amounts reimbursed by the investment adviser or reductions from brokerage service arrangements or reductions from other expense offset arrangements and do not represent the amount paid by the class during periods when reimbursements or reductions occur. Expenses net of fee waivers reflect expenses after reimbursement by the investment adviser but prior to reductions from brokerage service arrangements or other expense offset arrangements. Expenses net of all reductions represent the net expenses paid by the class.
H Annualized
I Amount does not include the portfolio activity of any underlying Fidelity Central Funds.
See accompanying notes which are an integral part of the financial statements.
Financial Highlights — Fidelity Emerging Europe, Middle East, Africa (EMEA) Fund
| | Six months ended (Unaudited) April 30, | Years ended October 31, | | | | |
| | 2017 | 2016 | 2015 | 2014 | 2013 | 2012 |
| Selected Per–Share Data | | | | | | |
| Net asset value, beginning of period | $8.14 | $7.50 | $9.08 | $9.52 | $8.75 | $8.37 |
| Income from Investment Operations | | | | | | |
| Net investment income (loss)A | .05 | .16 | .14 | .16 | .18 | .20 |
| Net realized and unrealized gain (loss) | .68 | .61 | (1.51) | (.47) | .84 | .35 |
| Total from investment operations | .73 | .77 | (1.37) | (.31) | 1.02 | .55 |
| Distributions from net investment income | (.10) | (.13) | (.17) | (.13) | (.18) | (.17) |
| Distributions from net realized gain | – | – | (.04) | – | (.07) | – |
| Total distributions | (.10) | (.13) | (.21) | (.13) | (.25) | (.17) |
| Redemption fees added to paid in capitalA,B | – | – | – | – | – | – |
| Net asset value, end of period | $8.77 | $8.14 | $7.50 | $9.08 | $9.52 | $8.75 |
| Total ReturnC,D | 9.08% | 10.54% | (15.33)% | (3.21)% | 11.90% | 6.81% |
| Ratios to Average Net AssetsE,F | | | | | | |
| Expenses before reductions | 1.47%G | 1.46% | 1.39% | 1.37% | 1.40% | 1.37% |
| Expenses net of fee waivers, if any | 1.40%G | 1.40% | 1.38% | 1.37% | 1.40% | 1.37% |
| Expenses net of all reductions | 1.38%G | 1.39% | 1.38% | 1.37% | 1.38% | 1.34% |
| Net investment income (loss) | 1.18%G | 2.15% | 1.74% | 1.68% | 2.05% | 2.34% |
| Supplemental Data | | | | | | |
| Net assets, end of period (000 omitted) | $82,668 | $76,193 | $67,521 | $96,784 | $110,265 | $111,441 |
| Portfolio turnover rateH | 59%G | 54% | 50% | 38% | 64% | 30% |
A Calculated based on average shares outstanding during the period.
B Amount represents less than $.005 per share.
C Total returns for periods of less than one year are not annualized.
D Total returns would have been lower if certain expenses had not been reduced during the applicable periods shown.
E Fees and expenses of any underlying Fidelity Central Funds are not included in the Fund's expense ratio. The Fund indirectly bears its proportionate share of the expenses of any underlying Fidelity Central Funds.
F Expense ratios reflect operating expenses of the class. Expenses before reductions do not reflect amounts reimbursed by the investment adviser or reductions from brokerage service arrangements or reductions from other expense offset arrangements and do not represent the amount paid by the class during periods when reimbursements or reductions occur. Expenses net of fee waivers reflect expenses after reimbursement by the investment adviser but prior to reductions from brokerage service arrangements or other expense offset arrangements. Expenses net of all reductions represent the net expenses paid by the class.
G Annualized
H Amount does not include the portfolio activity of any underlying Fidelity Central Funds.
See accompanying notes which are an integral part of the financial statements.
Financial Highlights — Fidelity Emerging Europe, Middle East, Africa (EMEA) Fund Class I
| | Six months ended (Unaudited) April 30, | Years ended October 31, | | | | |
| | 2017 | 2016 | 2015 | 2014 | 2013 | 2012 |
| Selected Per–Share Data | | | | | | |
| Net asset value, beginning of period | $8.14 | $7.50 | $9.08 | $9.52 | $8.75 | $8.37 |
| Income from Investment Operations | | | | | | |
| Net investment income (loss)A | .05 | .17 | .15 | .16 | .19 | .21 |
| Net realized and unrealized gain (loss) | .68 | .61 | (1.51) | (.46) | .84 | .35 |
| Total from investment operations | .73 | .78 | (1.36) | (.30) | 1.03 | .56 |
| Distributions from net investment income | (.11) | (.14) | (.18) | (.14) | (.19) | (.18) |
| Distributions from net realized gain | – | – | (.04) | – | (.07) | – |
| Total distributions | (.11) | (.14) | (.22) | (.14) | (.26) | (.18) |
| Redemption fees added to paid in capitalA,B | – | – | – | – | – | – |
| Net asset value, end of period | $8.76 | $8.14 | $7.50 | $9.08 | $9.52 | $8.75 |
| Total ReturnC,D | 9.05% | 10.69% | (15.23)% | (3.09)% | 12.05% | 6.93% |
| Ratios to Average Net AssetsE,F | | | | | | |
| Expenses before reductions | 1.38%G | 1.31% | 1.25% | 1.26% | 1.30% | 1.28% |
| Expenses net of fee waivers, if any | 1.38%G | 1.31% | 1.25% | 1.26% | 1.30% | 1.28% |
| Expenses net of all reductions | 1.36%G | 1.30% | 1.24% | 1.26% | 1.28% | 1.25% |
| Net investment income (loss) | 1.21%G | 2.24% | 1.88% | 1.79% | 2.15% | 2.43% |
| Supplemental Data | | | | | | |
| Net assets, end of period (000 omitted) | $8,710 | $5,807 | $3,478 | $5,596 | $10,231 | $8,586 |
| Portfolio turnover rateH | 59%G | 54% | 50% | 38% | 64% | 30% |
A Calculated based on average shares outstanding during the period.
B Amount represents less than $.005 per share.
C Total returns for periods of less than one year are not annualized.
D Total returns would have been lower if certain expenses had not been reduced during the applicable periods shown.
E Fees and expenses of any underlying Fidelity Central Funds are not included in the Fund's expense ratio. The Fund indirectly bears its proportionate share of the expenses of any underlying Fidelity Central Funds.
F Expense ratios reflect operating expenses of the class. Expenses before reductions do not reflect amounts reimbursed by the investment adviser or reductions from brokerage service arrangements or reductions from other expense offset arrangements and do not represent the amount paid by the class during periods when reimbursements or reductions occur. Expenses net of fee waivers reflect expenses after reimbursement by the investment adviser but prior to reductions from brokerage service arrangements or other expense offset arrangements. Expenses net of all reductions represent the net expenses paid by the class.
G Annualized
H Amount does not include the portfolio activity of any underlying Fidelity Central Funds.
See accompanying notes which are an integral part of the financial statements.
Notes to Financial Statements (Unaudited)
For the period ended April 30, 2017
1. Organization.
Fidelity Emerging Europe, Middle East, Africa (EMEA) Fund (the Fund) is a non-diversified fund of Fidelity Investment Trust (the Trust) and is authorized to issue an unlimited number of shares. The Trust is registered under the Investment Company Act of 1940, as amended (the 1940 Act), as an open-end management investment company organized as a Massachusetts business trust. The Fund offers Class A, Class M (formerly Class T), Class C, Emerging Europe, Middle East, Africa (EMEA), and Class I shares, each of which has equal rights as to assets and voting privileges. Each class has exclusive voting rights with respect to matters that affect that class. The Fund's investments in emerging markets can be subject to social, economic, regulatory, and political uncertainties and can be extremely volatile.
After the close of business on June 24, 2016, all outstanding Class B shares were converted to Class A shares. All prior fiscal period dollar and share amounts for Class B presented in the Notes to Financial Statements are for the period November 1, 2015 through June 24, 2016.
2. Investments in Fidelity Central Funds.
The Fund invests in Fidelity Central Funds, which are open-end investment companies generally available only to other investment companies and accounts managed by the investment adviser and its affiliates. The Fund's Schedule of Investments lists each of the Fidelity Central Funds held as of period end, if any, as an investment of the Fund, but does not include the underlying holdings of each Fidelity Central Fund. As an Investing Fund, the Fund indirectly bears its proportionate share of the expenses of the underlying Fidelity Central Funds.
The Money Market Central Funds seek preservation of capital and current income and are managed by Fidelity Investments Money Management, Inc. (FIMM), an affiliate of the investment adviser. Annualized expenses of the Money Market Central Funds as of their most recent shareholder report date are less than .005%.
A complete unaudited list of holdings for each Fidelity Central Fund is available upon request or at the Securities and Exchange Commission (the SEC) website at www.sec.gov. In addition, the financial statements of the Fidelity Central Funds are available on the SEC website or upon request.
3. Significant Accounting Policies.
The Fund is an investment company and applies the accounting and reporting guidance of the Financial Accounting Standards Board (FASB) Accounting Standards Codification Topic 946 Financial Services – Investments Companies. The financial statements have been prepared in conformity with accounting principles generally accepted in the United States of America (GAAP), which require management to make certain estimates and assumptions at the date of the financial statements. Actual results could differ from those estimates. Subsequent events, if any, through the date that the financial statements were issued have been evaluated in the preparation of the financial statements. The following summarizes the significant accounting policies of the Fund:
Investment Valuation. Investments are valued as of 4:00 p.m. Eastern time on the last calendar day of the period. The Board of Trustees (the Board) has delegated the day to day responsibility for the valuation of the Fund's investments to the Fair Value Committee (the Committee) established by the Fund's investment adviser. In accordance with valuation policies and procedures approved by the Board, the Fund attempts to obtain prices from one or more third party pricing vendors or brokers to value its investments. When current market prices, quotations or currency exchange rates are not readily available or reliable, investments will be fair valued in good faith by the Committee, in accordance with procedures adopted by the Board. Factors used in determining fair value vary by investment type and may include market or investment specific events. The frequency with which these procedures are used cannot be predicted and they may be utilized to a significant extent. The Committee oversees the Fund's valuation policies and procedures and reports to the Board on the Committee's activities and fair value determinations. The Board monitors the appropriateness of the procedures used in valuing the Fund's investments and ratifies the fair value determinations of the Committee.
The Fund categorizes the inputs to valuation techniques used to value its investments into a disclosure hierarchy consisting of three levels as shown below:
- Level 1 – quoted prices in active markets for identical investments
- Level 2 – other significant observable inputs (including quoted prices for similar investments, interest rates, prepayment speeds, etc.)
- Level 3 – unobservable inputs (including the Fund's own assumptions based on the best information available)
Valuation techniques used to value the Fund's investments by major category are as follows:
Equity securities, including restricted securities, for which market quotations are readily available, are valued at the last reported sale price or official closing price as reported by a third party pricing vendor on the primary market or exchange on which they are traded and are categorized as Level 1 in the hierarchy. In the event there were no sales during the day or closing prices are not available, securities are valued at the last quoted bid price or may be valued using the last available price and are generally categorized as Level 2 in the hierarchy. For foreign equity securities, when market or security specific events arise, comparisons to the valuation of American Depositary Receipts (ADRs), futures contracts, Exchange-Traded Funds (ETFs) and certain indexes as well as quoted prices for similar securities may be used and would be categorized as Level 2 in the hierarchy. Utilizing these techniques may result in transfers between Level 1 and Level 2. For equity securities, including restricted securities, where observable inputs are limited, assumptions about market activity and risk are used and these securities may be categorized as Level 3 in the hierarchy.
Investments in open-end mutual funds, including the Fidelity Central Funds, are valued at their closing net asset value (NAV) each business day and are categorized as Level 1 in the hierarchy.
Changes in valuation techniques may result in transfers in or out of an assigned level within the disclosure hierarchy. The aggregate value of investments by input level as of April 30, 2017, including information on transfers between Levels 1 and 2, is included at the end of the Fund's Schedule of Investments.
Foreign Currency. The Fund may use foreign currency contracts to facilitate transactions in foreign-denominated securities. Gains and losses from these transactions may arise from changes in the value of the foreign currency or if the counterparties do not perform under the contracts' terms.
Foreign-denominated assets, including investment securities, and liabilities are translated into U.S. dollars at the exchange rates at period end. Purchases and sales of investment securities, income and dividends received and expenses denominated in foreign currencies are translated into U.S. dollars at the exchange rate in effect on the transaction date.
The effects of exchange rate fluctuations on investments are included with the net realized and unrealized gain (loss) on investment securities. Other foreign currency transactions resulting in realized and unrealized gain (loss) are disclosed separately.
Investment Transactions and Income. For financial reporting purposes, the Fund's investment holdings and NAV include trades executed through the end of the last business day of the period. The NAV per share for processing shareholder transactions is calculated as of the close of business of the New York Stock Exchange (NYSE), normally 4:00 p.m. Eastern time and includes trades executed through the end of the prior business day. Gains and losses on securities sold are determined on the basis of identified cost. Dividend income is recorded on the ex-dividend date, except for certain dividends from foreign securities where the ex-dividend date may have passed, which are recorded as soon as the Fund is informed of the ex-dividend date. Non-cash dividends included in dividend income, if any, are recorded at the fair market value of the securities received. Income and capital gain distributions from Fidelity Central Funds, if any, are recorded on the ex-dividend date. Investment income is recorded net of foreign taxes withheld where recovery of such taxes is uncertain.
Class Allocations and Expenses. Investment income, realized and unrealized capital gains and losses, common expenses of the Fund, and certain fund-level expense reductions, if any, are allocated daily on a pro-rata basis to each class based on the relative net assets of each class to the total net assets of the Fund. Each class differs with respect to transfer agent and distribution and service plan fees incurred. Certain expense reductions may also differ by class. For the reporting period, the allocated portion of income and expenses to each class as a percent of its average net assets may vary due to the timing of recording these transactions in relation to fluctuating net assets of the classes. Expenses directly attributable to a fund are charged to that fund. Expenses attributable to more than one fund are allocated among the respective funds on the basis of relative net assets or other appropriate methods. Expense estimates are accrued in the period to which they relate and adjustments are made when actual amounts are known.
Income Tax Information and Distributions to Shareholders. Each year, the Fund intends to qualify as a regulated investment company under Subchapter M of the Internal Revenue Code, including distributing substantially all of its taxable income and realized gains. As a result, no provision for U.S. Federal income taxes is required. The Fund files a U.S. federal tax return, in addition to state and local tax returns as required. The Fund's federal income tax returns are subject to examination by the Internal Revenue Service (IRS) for a period of three fiscal years after they are filed. State and local tax returns may be subject to examination for an additional fiscal year depending on the jurisdiction. Foreign taxes are provided for based on the Fund's understanding of the tax rules and rates that exist in the foreign markets in which it invests. The Fund is subject to a tax imposed on capital gains by certain countries in which it invests. An estimated deferred tax liability for net unrealized appreciation on the applicable securities is included in Other payables and accrued expenses on the Statement of Assets & Liabilities.
Distributions are declared and recorded on the ex-dividend date. Income dividends and capital gain distributions are declared separately for each class. Income and capital gain distributions are determined in accordance with income tax regulations, which may differ from GAAP.
Capital accounts within the financial statements are adjusted for permanent book-tax differences. These adjustments have no impact on net assets or the results of operations. Capital accounts are not adjusted for temporary book-tax differences which will reverse in a subsequent period.
Book-tax differences are primarily due to foreign currency transactions, certain foreign taxes, passive foreign investment companies (PFIC), capital loss carryforwards, and losses deferred due to wash sales.
The federal tax cost of investment securities and unrealized appreciation (depreciation) as of period end were as follows:
| Gross unrealized appreciation | $26,314,719 |
| Gross unrealized depreciation | (4,599,739) |
| Net unrealized appreciation (depreciation) on securities | $21,714,980 |
| Tax cost | $84,182,013 |
Capital loss carryforwards are only available to offset future capital gains of the Fund to the extent provided by regulations and may be limited. Under the Regulated Investment Company Modernization Act of 2010 (the Act), the Fund is permitted to carry forward capital losses incurred in taxable years beginning after December 22, 2010 for an unlimited period and such capital losses are required to be used prior to any losses that expire. The capital loss carryforward information presented below, including any applicable limitation, is estimated as of prior fiscal period end and is subject to adjustment.
| Fiscal year of expiration | |
| 2018 | $(1,624,705) |
| No expiration | |
| Short-term | (4,750,173) |
| Long-term | (17,009,690) |
| Total no expiration | (21,759,863) |
| Total capital loss carryforward | $(23,384,568) |
Short-Term Trading (Redemption) Fees. Shares held by investors in the Fund less than 90 days may have been subject to a redemption fee equal to 1.50% of the NAV of shares redeemed. All redemption fees, which reduce the proceeds of the shareholder redemption, are retained by the Fund and accounted for as an addition to paid in capital.
Restricted Securities. The Fund may invest in securities that are subject to legal or contractual restrictions on resale. These securities generally may be resold in transactions exempt from registration or to the public if the securities are registered. Disposal of these securities may involve time-consuming negotiations and expense, and prompt sale at an acceptable price may be difficult. Information regarding restricted securities is included at the end of the Fund's Schedule of Investments.
4. Purchases and Sales of Investments.
Purchases and sales of securities, other than short-term securities, aggregated $30,479,227 and $30,847,538, respectively.
5. Fees and Other Transactions with Affiliates.
Management Fee. Fidelity Management & Research Company (the investment adviser) and its affiliates provide the Fund with investment management related services for which the Fund pays a monthly management fee. The management fee is the sum of an individual fund fee rate that is based on an annual rate of .55% of the Fund's average net assets and an annualized group fee rate that averaged .25% during the period. The group fee rate is based upon the average net assets of all the mutual funds advised by the investment adviser, including any mutual funds previously advised by the investment adviser that are currently advised by Fidelity SelectCo, LLC, an affiliate of the investment adviser. The group fee rate decreases as assets under management increase and increases as assets under management decrease. For the reporting period, the total annualized management fee rate was .80% of the Fund's average net assets.
Distribution and Service Plan Fees. In accordance with Rule 12b-1 of the 1940 Act, the Fund has adopted separate Distribution and Service Plans for each class of shares except Class I. Certain classes pay Fidelity Distributors Corporation (FDC), an affiliate of the investment adviser, separate Distribution and Service Fees, each of which is based on an annual percentage of each class' average net assets. In addition, FDC may pay financial intermediaries for selling shares of the Fund and providing shareholder support services. For the period, the Distribution and Service Fee rates, total fees and amounts retained by FDC were as follows:
| | Distribution
Fee | Service
Fee | Total Fees | Retained
by FDC |
| Class A | -% | .25% | $9,770 | $– |
| Class M | .25% | .25% | 6,506 | 86 |
| Class C | .75% | .25% | 32,016 | 4,029 |
| | | | $48,292 | $4,115 |
Sales Load. FDC may receive a front-end sales charge of up to 5.75% for selling Class A shares and 3.50% for selling Class M shares, some of which is paid to financial intermediaries for selling shares of the Fund. Depending on the holding period, FDC may receive contingent deferred sales charges levied on Class A, Class M, and Class C redemptions. The deferred sales charges are 1.00% for Class C shares, 1.00% for certain purchases of Class A shares and .25% for certain purchases of Class M shares.
For the period, sales charge amounts retained by FDC were as follows:
| | Retained
by FDC |
| Class A | $1,522 |
| Class M | 504 |
| Class C(a) | 163 |
| | $2,189 |
(a) When Class C shares are initially sold, FDC pays commissions from its own resources to financial intermediaries through which the sales are made.
Transfer Agent Fees. Fidelity Investments Institutional Operations Company, Inc., (FIIOC), an affiliate of the investment adviser, is the transfer, dividend disbursing and shareholder servicing agent for each class of the Fund. FIIOC receives account fees and asset-based fees that vary according to the account size and type of account of the shareholders of the respective classes of the Fund. FIIOC pays for typesetting, printing and mailing of shareholder reports, except proxy statements.
For the period, transfer agent fees for each applicable class were as follows:
| | Amount | % of
Class-Level Average
Net Assets(a) |
| Class A | $9,693 | .25 |
| Class M | 4,312 | .33 |
| Class C | 9,301 | .29 |
| Emerging Europe, Middle East, Africa (EMEA) | 108,852 | .26 |
| Class I | 5,739 | .16 |
| | $137,897 | |
(a) Annualized
Accounting and Security Lending Fees. Fidelity Service Company, Inc. (FSC), an affiliate of the investment adviser, maintains the Fund's accounting records. The accounting fee is based on the level of average net assets for each month. Under a separate contract, FSC administers the security lending program. The security lending fee is based on the number and duration of lending transactions.
Brokerage Commissions. The Fund placed a portion of its portfolio transactions with brokerage firms which are affiliates of the investment adviser. Brokerage commissions are included in net realized gain (loss) and change in net unrealized appreciation (depreciation) in the Statement of Operations. The commissions paid to these affiliated firms were $2 for the period.
Interfund Trades. The Fund may purchase from or sell securities to other Fidelity Funds under procedures adopted by the Board. The procedures have been designed to ensure these interfund trades are executed in accordance with Rule 17a-7 of the 1940 Act. Interfund trades are included within the respective purchases and sales amounts shown in the Purchases and Sales of Investments note.
6. Committed Line of Credit.
The Fund participates with other funds managed by the investment adviser or an affiliate in a $4.25 billion credit facility (the "line of credit") to be utilized for temporary or emergency purposes to fund shareholder redemptions or for other short-term liquidity purposes. The Fund has agreed to pay commitment fees on its pro-rata portion of the line of credit, which amounted to $179 and is reflected in Miscellaneous expenses on the Statement of Operations. During the period, the Fund did not borrow on this line of credit.
7. Security Lending.
The Fund lends portfolio securities through a lending agent from time to time in order to earn additional income. For equity securities, a lending agent is used and may loan securities to certain qualified borrowers, including Fidelity Capital Markets (FCM), a broker-dealer affiliated with the Fund. On the settlement date of the loan, the Fund receives collateral (in the form of U.S. Treasury obligations, letters of credit and/or cash) against the loaned securities and maintains collateral in an amount not less than 100% of the market value of the loaned securities during the period of the loan. The market value of the loaned securities is determined at the close of business of the Fund and any additional required collateral is delivered to the Fund on the next business day. The Fund or borrower may terminate the loan at any time, and if the borrower defaults on its obligation to return the securities loaned because of insolvency or other reasons, the Fund may apply collateral received from the borrower against the obligation. The Fund may experience delays and costs in recovering the securities loaned. Any cash collateral received is invested in the Fidelity Securities Lending Cash Central Fund. The value of loaned securities and cash collateral at period end are disclosed on the Fund's Statement of Assets and Liabilities. Security lending income represents the income earned on investing cash collateral, less rebates paid to borrowers, plus any premium payments received for lending certain types of securities. Security lending income is presented in the Statement of Operations as a component of income from Fidelity Central Funds. Total security lending income during the period amounted to $3,855. During the period, there were no securities loaned to FCM.
8. Expense Reductions.
The investment adviser voluntarily agreed to reimburse each class to the extent annual operating expenses exceeded certain levels of average net assets as noted in the table below. Some expenses, for example interest expense, including commitment fees, are excluded from this reimbursement.
The following classes were in reimbursement during the period:
| | Expense
Limitations | Reimbursement |
| Class A | 1.65% | $1,619 |
| Class M | 1.90% | 1,769 |
| Class C | 2.40% | 2,962 |
| Emerging Europe, Middle East, Africa (EMEA) | 1.40% | 29,696 |
| | | $36,046 |
Commissions paid to certain brokers with whom the investment adviser, or its affiliates, places trades on behalf of the Fund include an amount in addition to trade execution, which may be rebated back to the Fund to offset certain expenses. This amount totaled $12,579 for the period.
In addition, during the period the investment adviser reimbursed and/or waived a portion of fund-level operating expenses in the amount of $457.
9. Distributions to Shareholders.
Distributions to shareholders of each class were as follows:
| | Six months ended
April 30, 2017 | Year ended October 31, 2016 |
| From net investment income | | |
| Class A | $82,211 | $80,414 |
| Class M | 22,957 | 18,230 |
| Class B | – | 201 |
| Class C | 25,148 | 9,270 |
| Emerging Europe, Middle East, Africa (EMEA) | 957,314 | 1,152,813 |
| Class I | 79,809 | 62,782 |
| Total | $1,167,439 | $1,323,710 |
10. Share Transactions.
Share transactions for each class were as follows and may contain automatic conversions between classes or exchanges between affiliated funds:
| | Shares | Shares | Dollars | Dollars |
| | Six months ended
April 30, 2017 | Year ended October 31, 2016 | Six months ended
April 30, 2017 | Year ended October 31, 2016 |
| Class A | | | | |
| Shares sold | 255,779 | 455,903 | $2,156,091 | $3,437,125 |
| Reinvestment of distributions | 9,506 | 10,903 | 78,136 | 75,669 |
| Shares redeemed | (557,881) | (272,430) | (4,775,375) | (1,968,300) |
| Net increase (decrease) | (292,596) | 194,376 | $(2,541,148) | $1,544,494 |
| Class M | | | | |
| Shares sold | 45,458 | 127,263 | $372,968 | $957,632 |
| Reinvestment of distributions | 2,795 | 2,627 | 22,945 | 18,230 |
| Shares redeemed | (83,668) | (80,720) | (712,255) | (600,724) |
| Net increase (decrease) | (35,415) | 49,170 | $(316,342) | $375,138 |
| Class B | | | | |
| Shares sold | – | 6,222 | $– | $48,688 |
| Reinvestment of distributions | – | 29 | – | 201 |
| Shares redeemed | – | (30,363) | – | (224,475) |
| Net increase (decrease) | – | (24,112) | $– | $(175,586) |
| Class C | | | | |
| Shares sold | 111,449 | 511,536 | $940,063 | $3,858,488 |
| Reinvestment of distributions | 2,631 | 776 | 21,571 | 5,381 |
| Shares redeemed | (192,937) | (290,654) | (1,622,543) | (2,107,856) |
| Net increase (decrease) | (78,857) | 221,658 | $(660,909) | $1,756,013 |
| Emerging Europe, Middle East, Africa (EMEA) | | | | |
| Shares sold | 2,531,494 | 3,096,394 | $21,355,931 | $23,505,412 |
| Reinvestment of distributions | 108,986 | 155,366 | 895,866 | 1,078,225 |
| Shares redeemed | (2,571,477) | (2,896,341) | (21,803,358) | (21,342,473) |
| Net increase (decrease) | 69,003 | 355,419 | $448,439 | $3,241,164 |
| Class I | | | | |
| Shares sold | 668,928 | 627,690 | $5,750,136 | $5,110,628 |
| Reinvestment of distributions | 9,024 | 7,594 | 74,090 | 52,629 |
| Shares redeemed | (397,206) | (385,176) | (3,390,675) | (2,838,587) |
| Net increase (decrease) | 280,746 | 250,108 | $2,433,551 | $2,324,670 |
11. Other.
The Fund's organizational documents provide former and current trustees and officers with a limited indemnification against liabilities arising in connection with the performance of their duties to the Fund. In the normal course of business, the Fund may also enter into contracts that provide general indemnifications. The Fund's maximum exposure under these arrangements is unknown as this would be dependent on future claims that may be made against the Fund. The risk of material loss from such claims is considered remote.
At the end of the period, the investment adviser or its affiliates were the owners of record of 10% of the total outstanding shares of the Fund.
Shareholder Expense Example
As a shareholder of the Fund, you incur two types of costs: (1) transaction costs, including sales charges (loads) on purchase payments or redemption proceeds, redemption fees and (2) ongoing costs, including management fees, distribution and/or service (12b-1) fees and other Fund expenses. This Example is intended to help you understand your ongoing costs (in dollars) of investing in the Fund and to compare these costs with the ongoing costs of investing in other mutual funds.
The Example is based on an investment of $1,000 invested at the beginning of the period and held for the entire period (November 1, 2016 to April 30, 2017).
Actual Expenses
The first line of the accompanying table for each class of the Fund provides information about actual account values and actual expenses. You may use the information in this line, together with the amount you invested, to estimate the expenses that you paid over the period. Simply divide your account value by $1,000.00 (for example, an $8,600 account value divided by $1,000.00 = 8.6), then multiply the result by the number in the first line for a class of the Fund under the heading entitled "Expenses Paid During Period" to estimate the expenses you paid on your account during this period. A small balance maintenance fee of $12.00 that is charged once a year may apply for certain accounts with a value of less than $2,000. This fee is not included in the table below. If it was, the estimate of expenses you paid during the period would be higher, and your ending account value lower, by this amount. In addition, the Fund, as a shareholder in the underlying Fidelity Central Funds, will indirectly bear its pro-rata share of the fees and expenses incurred by the underlying Fidelity Central Funds. These fees and expenses are not included in the Fund's annualized expense ratio used to calculate the expense estimate in the table below.
Hypothetical Example for Comparison Purposes
The second line of the accompanying table for each class of the Fund provides information about hypothetical account values and hypothetical expenses based on a Class' actual expense ratio and an assumed rate of return of 5% per year before expenses, which is not the Class' actual return. The hypothetical account values and expenses may not be used to estimate the actual ending account balance or expenses you paid for the period. You may use this information to compare the ongoing costs of investing in the Fund and other funds. To do so, compare this 5% hypothetical example with the 5% hypothetical examples that appear in the shareholder reports of the other funds. A small balance maintenance fee of $12.00 that is charged once a year may apply for certain accounts with a value of less than $2,000. This fee is not included in the table below. If it was, the estimate of expenses you paid during the period would be higher, and your ending account value lower, by this amount. In addition, the Fund, as a shareholder in the underlying Fidelity Central Funds, will indirectly bear its pro-rata share of the fees and expenses incurred by the underlying Fidelity Central Funds. These fees and expenses are not included in the Fund's annualized expense ratio used to calculate the expense estimate in the table below.
Please note that the expenses shown in the table are meant to highlight your ongoing costs only and do not reflect any transaction costs. Therefore, the second line of the table is useful in comparing ongoing costs only, and will not help you determine the relative total costs of owning different funds. In addition, if these transactional costs were included, your costs would have been higher.
| | Annualized Expense Ratio-A | Beginning
Account Value
November 1, 2016 | Ending
Account Value
April 30, 2017 | Expenses Paid
During Period-B
November 1, 2016
to April 30, 2017 |
| Class A | 1.65% | | | |
| Actual | | $1,000.00 | $1,088.60 | $8.54 |
| Hypothetical-C | | $1,000.00 | $1,016.61 | $8.25 |
| Class M | 1.90% | | | |
| Actual | | $1,000.00 | $1,088.10 | $9.84 |
| Hypothetical-C | | $1,000.00 | $1,015.37 | $9.49 |
| Class C | 2.40% | | | |
| Actual | | $1,000.00 | $1,085.00 | $12.41 |
| Hypothetical-C | | $1,000.00 | $1,012.89 | $11.98 |
| Emerging Europe, Middle East, Africa (EMEA) | 1.40% | | | |
| Actual | | $1,000.00 | $1,090.80 | $7.26 |
| Hypothetical-C | | $1,000.00 | $1,017.85 | $7.00 |
| Class I | 1.38% | | | |
| Actual | | $1,000.00 | $1,090.50 | $7.15 |
| Hypothetical-C | | $1,000.00 | $1,017.95 | $6.90 |
A Annualized expense ratio reflects expenses net of applicable fee waivers.
B Expenses are equal to each Class' annualized expense ratio, multiplied by the average account value over the period, multiplied by 181/365 (to reflect the one-half year period).
C 5% return per year before expenses
Corporate Headquarters
245 Summer St.
Boston, MA 02210
www.fidelity.com
EME-SANN-0617
1.861975.108
Fidelity® Overseas Fund
Class K
Semi-Annual Report April 30, 2017 |
|
Contents
To view a fund's proxy voting guidelines and proxy voting record for the 12-month period ended June 30, visit http://www.fidelity.com/proxyvotingresults or visit the Securities and Exchange Commission's (SEC) web site at http://www.sec.gov.
You may also call 1-800-835-5092 to request a free copy of the proxy voting guidelines.
Standard & Poor's, S&P and S&P 500 are registered service marks of The McGraw-Hill Companies, Inc. and have been licensed for use by Fidelity Distributors Corporation.
Other third-party marks appearing herein are the property of their respective owners.
All other marks appearing herein are registered or unregistered trademarks or service marks of FMR LLC or an affiliated company. © 2017 FMR LLC. All rights reserved.
This report and the financial statements contained herein are submitted for the general information of the shareholders of the Fund. This report is not authorized for distribution to prospective investors in the Fund unless preceded or accompanied by an effective prospectus.
A fund files its complete schedule of portfolio holdings with the SEC for the first and third quarters of each fiscal year on Form N-Q. Forms N-Q are available on the SEC’s web site at http://www.sec.gov. A fund's Forms N-Q may be reviewed and copied at the SEC’s Public Reference Room in Washington, DC. Information regarding the operation of the SEC's Public Reference Room may be obtained by calling 1-800-SEC-0330.
For a complete list of a fund's portfolio holdings, view the most recent holdings listing, semiannual report, or annual report on Fidelity's web site at http://www.fidelity.com, http://www.institutional.fidelity.com, or http://www.401k.com, as applicable.
NOT FDIC INSURED •MAY LOSE VALUE •NO BANK GUARANTEE
Neither the Fund nor Fidelity Distributors Corporation is a bank.
Investment Summary (Unaudited)
Geographic Diversification (% of fund's net assets)
| As of April 30, 2017 |
| | United Kingdom | 21.9% |
| | Japan | 18.1% |
| | Germany | 8.9% |
| | France | 8.5% |
| | United States of America* | 6.6% |
| | Switzerland | 5.4% |
| | Netherlands | 4.5% |
| | Sweden | 4.2% |
| | Spain | 3.1% |
| | Other | 18.8% |
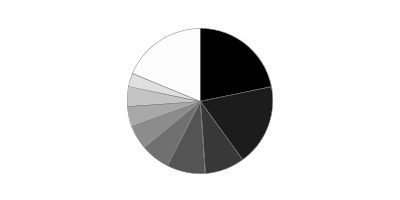
* Includes Short-Term investments and Net Other Assets (Liabilities).
Percentages are based on country or territory of incorporation and are adjusted for the effect of futures contracts, if applicable.
| As of October 31, 2016 |
| | Japan | 20.6% |
| | United Kingdom | 19.0% |
| | Germany | 9.7% |
| | France | 8.6% |
| | United States of America* | 6.4% |
| | Switzerland | 5.9% |
| | Sweden | 4.6% |
| | Netherlands | 3.3% |
| | Ireland | 2.8% |
| | Other | 19.1% |

* Includes Short-Term investments and Net Other Assets (Liabilities).
Percentages are based on country or territory of incorporation and are adjusted for the effect of futures contracts, if applicable.
Asset Allocation as of April 30, 2017
| | % of fund's net assets | % of fund's net assets 6 months ago |
| Stocks | 96.6 | 98.0 |
| Short-Term Investments and Net Other Assets (Liabilities) | 3.4 | 2.0 |
Top Ten Stocks as of April 30, 2017
| | % of fund's net assets | % of fund's net assets 6 months ago |
| Nestle SA (Reg. S) (Switzerland, Food Products) | 2.1 | 2.3 |
| Unilever NV (NY Reg.) (Netherlands, Personal Products) | 1.5 | 0.0 |
| Bayer AG (Germany, Pharmaceuticals) | 1.5 | 1.2 |
| British American Tobacco PLC (United Kingdom) (United Kingdom, Tobacco) | 1.4 | 1.3 |
| Total SA (France, Oil, Gas & Consumable Fuels) | 1.3 | 1.5 |
| Sanofi SA (France, Pharmaceuticals) | 1.2 | 1.4 |
| SAP AG (Germany, Software) | 1.1 | 1.4 |
| Prudential PLC (United Kingdom, Insurance) | 1.1 | 0.9 |
| UBS Group AG (Switzerland, Capital Markets) | 1.1 | 1.0 |
| AIA Group Ltd. (Hong Kong, Insurance) | 1.1 | 1.1 |
| | 13.4 | |
Top Market Sectors as of April 30, 2017
| | % of fund's net assets | % of fund's net assets 6 months ago |
| Financials | 21.6 | 20.2 |
| Industrials | 15.6 | 12.1 |
| Consumer Staples | 13.2 | 13.1 |
| Health Care | 12.5 | 15.6 |
| Consumer Discretionary | 11.6 | 13.2 |
| Information Technology | 11.1 | 11.8 |
| Materials | 6.4 | 6.8 |
| Energy | 2.6 | 2.3 |
| Telecommunication Services | 1.5 | 1.8 |
| Real Estate | 0.5 | 1.1 |
Percentages shown as 0.0% may reflect amounts less than 0.05%.
Investments April 30, 2017 (Unaudited)
Showing Percentage of Net Assets
| Common Stocks - 95.6% | | | |
| | | Shares | Value |
| Australia - 1.8% | | | |
| Adelaide Brighton Ltd. | | 4,044,528 | $17,928,972 |
| Amcor Ltd. | | 4,271,593 | 50,249,516 |
| Aub Group Ltd. | | 2,971,406 | 26,833,365 |
| Life Healthcare Group Ltd. | | 1,672,012 | 2,679,286 |
| Pact Group Holdings Ltd. | | 3,431,805 | 18,116,636 |
|
| TOTAL AUSTRALIA | | | 115,807,775 |
|
| Austria - 0.3% | | | |
| Andritz AG | | 382,600 | 21,159,219 |
| Bailiwick of Guernsey - 0.3% | | | |
| Burford Capital Ltd. | | 2,037,000 | 20,578,915 |
| Bailiwick of Jersey - 2.3% | | | |
| IWG PLC | | 6,169,081 | 25,960,139 |
| Sanne Group PLC | | 2,737,937 | 23,103,337 |
| Wolseley PLC | | 705,130 | 44,816,049 |
| WPP PLC | | 2,250,133 | 48,183,279 |
|
| TOTAL BAILIWICK OF JERSEY | | | 142,062,804 |
|
| Belgium - 2.0% | | | |
| Anheuser-Busch InBev SA NV | | 567,512 | 63,998,537 |
| KBC Groep NV | | 824,651 | 59,538,816 |
|
| TOTAL BELGIUM | | | 123,537,353 |
|
| Bermuda - 1.2% | | | |
| Credicorp Ltd. (United States) | | 116,300 | 17,870,658 |
| IHS Markit Ltd. (a) | | 1,334,800 | 57,930,320 |
|
| TOTAL BERMUDA | | | 75,800,978 |
|
| Canada - 0.5% | | | |
| Constellation Software, Inc. | | 70,400 | 32,198,697 |
| Denmark - 0.2% | | | |
| NNIT A/S (a)(b) | | 496,970 | 14,010,431 |
| France - 8.5% | | | |
| ALTEN | | 363,400 | 30,797,256 |
| Amundi SA | | 700,500 | 46,088,501 |
| AXA SA (b) | | 1,527,000 | 40,740,593 |
| Capgemini SA | | 459,500 | 46,006,057 |
| Christian Dior SA | | 182,497 | 50,086,144 |
| Compagnie de St. Gobain | | 863,100 | 46,585,663 |
| Maisons du Monde SA | | 994,900 | 34,528,102 |
| Publicis Groupe SA | | 642,700 | 46,395,170 |
| Sanofi SA | | 818,742 | 77,366,073 |
| Sodexo SA | | 276,400 | 35,136,330 |
| Total SA | | 1,634,300 | 83,893,908 |
|
| TOTAL FRANCE | | | 537,623,797 |
|
| Germany - 7.9% | | | |
| adidas AG | | 238,734 | 47,823,737 |
| Axel Springer Verlag AG | | 689,700 | 38,698,959 |
| Bayer AG | | 739,897 | 91,549,792 |
| CompuGroup Medical AG | | 470,900 | 23,185,402 |
| Deutsche Post AG | | 1,841,540 | 66,191,981 |
| Fresenius Medical Care AG & Co. KGaA | | 385,800 | 34,247,193 |
| Fresenius SE & Co. KGaA | | 785,500 | 63,668,555 |
| mutares AG | | 305,427 | 4,657,823 |
| ProSiebenSat.1 Media AG | | 777,800 | 33,017,350 |
| SAP AG | | 715,998 | 71,718,688 |
| Wirecard AG (b) | | 393,400 | 23,230,645 |
|
| TOTAL GERMANY | | | 497,990,125 |
|
| Hong Kong - 1.1% | | | |
| AIA Group Ltd. | | 9,714,800 | 67,256,164 |
| India - 0.3% | | | |
| Axis Bank Ltd. | | 2,691,848 | 21,339,249 |
| Indonesia - 0.5% | | | |
| PT Bank Rakyat Indonesia Tbk | | 32,462,500 | 31,417,680 |
| Ireland - 2.7% | | | |
| DCC PLC (United Kingdom) | | 307,600 | 28,406,171 |
| Kerry Group PLC Class A | | 463,264 | 37,857,603 |
| Kingspan Group PLC (Ireland) | | 828,515 | 28,821,382 |
| Medtronic PLC | | 483,200 | 40,149,088 |
| United Drug PLC (United Kingdom) | | 3,294,996 | 31,879,561 |
|
| TOTAL IRELAND | | | 167,113,805 |
|
| Israel - 0.6% | | | |
| Frutarom Industries Ltd. | | 620,172 | 36,455,525 |
| Italy - 1.7% | | | |
| Banca Generali SpA | | 1,190,200 | 34,214,235 |
| Intesa Sanpaolo SpA | | 17,308,900 | 50,526,454 |
| Reply SpA | | 143,400 | 25,133,484 |
|
| TOTAL ITALY | | | 109,874,173 |
|
| Japan - 18.1% | | | |
| AEON Financial Service Co. Ltd. | | 1,331,800 | 25,578,684 |
| Ai Holdings Corp. | | 1,385,700 | 34,084,677 |
| Arc Land Sakamoto Co. Ltd. | | 1,059,400 | 13,105,294 |
| Astellas Pharma, Inc. | | 3,590,300 | 47,345,689 |
| Bridgestone Corp. | | 1,120,200 | 46,707,240 |
| Broadleaf Co. Ltd. | | 1,028,600 | 6,671,252 |
| Daiichikosho Co. Ltd. | | 600,500 | 26,045,459 |
| Daito Trust Construction Co. Ltd. | | 221,600 | 32,601,390 |
| Dentsu, Inc. | | 732,200 | 41,248,854 |
| GMO Internet, Inc. | | 1,523,900 | 18,085,846 |
| Hoya Corp. | | 1,236,800 | 59,069,058 |
| Iriso Electronics Co. Ltd. | | 185,800 | 11,750,527 |
| Japan Tobacco, Inc. | | 1,084,400 | 36,051,011 |
| Kaken Pharmaceutical Co. Ltd. | | 359,900 | 21,340,561 |
| KDDI Corp. | | 1,704,300 | 45,187,936 |
| Keyence Corp. | | 118,080 | 47,454,443 |
| KOMEDA Holdings Co. Ltd. | | 1,044,100 | 18,011,252 |
| Miroku Jyoho Service Co., Ltd. | | 798,300 | 15,131,715 |
| Misumi Group, Inc. | | 1,359,900 | 25,752,401 |
| Morinaga & Co. Ltd. | | 468,000 | 22,124,781 |
| Nabtesco Corp. | | 1,238,700 | 35,113,631 |
| Nakanishi, Inc. | | 779,100 | 30,611,868 |
| Nippon Paint Holdings Co. Ltd. | | 897,100 | 34,403,252 |
| Nitori Holdings Co. Ltd. | | 325,400 | 42,355,272 |
| NOF Corp. | | 1,477,000 | 16,641,507 |
| OBIC Co. Ltd. | | 436,200 | 23,556,170 |
| Olympus Corp. | | 1,695,500 | 65,249,563 |
| ORIX Corp. | | 3,389,000 | 51,712,841 |
| Otsuka Corp. | | 360,200 | 19,290,370 |
| Outsourcing, Inc. (b) | | 509,400 | 19,535,187 |
| Recruit Holdings Co. Ltd. | | 877,900 | 44,337,986 |
| S Foods, Inc. | | 6,800 | 211,976 |
| Ship Healthcare Holdings, Inc. | | 6,400 | 172,064 |
| SMC Corp. | | 119,000 | 33,508,948 |
| Software Service, Inc. | | 108,400 | 4,920,422 |
| Sundrug Co. Ltd. | | 642,600 | 22,539,278 |
| The Suruga Bank Ltd. | | 1,223,900 | 25,570,425 |
| Tsuruha Holdings, Inc. | | 339,900 | 34,454,990 |
| VT Holdings Co. Ltd. | | 3,332,400 | 16,949,727 |
| Welcia Holdings Co. Ltd. | | 914,300 | 29,444,602 |
|
| TOTAL JAPAN | | | 1,143,928,149 |
|
| Kenya - 0.2% | | | |
| Safaricom Ltd. | | 64,839,100 | 12,094,503 |
| Luxembourg - 0.4% | | | |
| Eurofins Scientific SA | | 56,784 | 27,964,560 |
| Netherlands - 4.5% | | | |
| IMCD Group BV | | 1,012,578 | 54,543,410 |
| ING Groep NV (Certificaten Van Aandelen) | | 3,573,800 | 58,251,304 |
| Intertrust NV | | 968,900 | 19,419,779 |
| Koninklijke Philips Electronics NV | | 1,659,400 | 57,303,211 |
| Unilever NV (NY Reg.) (a)(b) | | 1,801,974 | 94,135,122 |
|
| TOTAL NETHERLANDS | | | 283,652,826 |
|
| New Zealand - 0.8% | | | |
| EBOS Group Ltd. | | 2,276,701 | 28,621,879 |
| Trade Maine Group Ltd. | | 6,128,845 | 22,302,744 |
|
| TOTAL NEW ZEALAND | | | 50,924,623 |
|
| Norway - 0.5% | | | |
| Statoil ASA (b) | | 1,702,500 | 28,038,294 |
| Panama - 0.4% | | | |
| Copa Holdings SA Class A | | 219,100 | 25,507,622 |
| Portugal - 0.5% | | | |
| NOS SGPS SA | | 5,170,400 | 29,613,670 |
| Spain - 3.1% | | | |
| Amadeus IT Holding SA Class A | | 1,171,100 | 63,146,122 |
| CaixaBank SA | | 10,197,500 | 46,301,171 |
| Grifols SA ADR | | 2,294,100 | 49,804,911 |
| Prosegur Cash SA | | 13,289,500 | 33,874,430 |
|
| TOTAL SPAIN | | | 193,126,634 |
|
| Sweden - 4.2% | | | |
| Addlife AB (a) | | 838,800 | 15,957,210 |
| Alfa Laval AB (b) | | 1,737,734 | 35,648,140 |
| HEXPOL AB (B Shares) (b) | | 3,223,600 | 35,830,718 |
| Indutrade AB | | 1,143,500 | 27,021,163 |
| Nordea Bank AB | | 5,142,000 | 63,278,652 |
| Svenska Cellulosa AB (SCA) (B Shares) | | 1,418,000 | 46,971,560 |
| Swedbank AB (A Shares) | | 1,598,200 | 37,874,090 |
|
| TOTAL SWEDEN | | | 262,581,533 |
|
| Switzerland - 5.4% | | | |
| Credit Suisse Group AG | | 3,160,830 | 48,205,704 |
| Julius Baer Group Ltd. | | 860,410 | 44,867,544 |
| Nestle SA (Reg. S) | | 1,697,834 | 130,768,030 |
| Sika AG | | 7,900 | 50,417,085 |
| UBS Group AG | | 3,937,566 | 67,274,997 |
|
| TOTAL SWITZERLAND | | | 341,533,360 |
|
| Taiwan - 0.5% | | | |
| Taiwan Semiconductor Manufacturing Co. Ltd. | | 4,353,000 | 27,993,321 |
| United Kingdom - 21.9% | | | |
| Aon PLC | | 228,400 | 27,371,456 |
| Ascential PLC | | 6,751,503 | 30,850,761 |
| Booker Group PLC | | 14,350,000 | 36,057,073 |
| British American Tobacco PLC (United Kingdom) | | 1,292,100 | 87,298,630 |
| BT Group PLC | | 9,269,900 | 36,569,298 |
| Cineworld Group PLC | | 4,271,800 | 38,951,161 |
| Close Brothers Group PLC | | 1,459,321 | 31,980,705 |
| Coca-Cola European Partners PLC | | 672,100 | 25,956,502 |
| Compass Group PLC | | 2,401,300 | 48,484,190 |
| ConvaTec Group PLC | | 9,001,400 | 35,803,601 |
| Cranswick PLC | | 488,600 | 16,972,627 |
| Dechra Pharmaceuticals PLC | | 477,895 | 10,460,586 |
| Diploma PLC | | 2,172,603 | 31,206,766 |
| Equiniti Group PLC | | 5,585,385 | 15,969,476 |
| Essentra PLC | | 3,528,543 | 24,747,465 |
| Exova Group Ltd. PLC | | 8,574,435 | 26,486,876 |
| Halma PLC | | 2,438,900 | 33,262,830 |
| Hastings Group Holdings PLC | | 5,148,350 | 20,157,796 |
| Hikma Pharmaceuticals PLC | | 541,022 | 13,573,173 |
| Hilton Food Group PLC | | 1,138,579 | 11,347,721 |
| Howden Joinery Group PLC | | 4,687,400 | 28,109,288 |
| IMI PLC | | 1,829,199 | 30,301,794 |
| Intertek Group PLC | | 693,400 | 36,516,408 |
| James Fisher and Sons PLC | | 998,358 | 20,766,757 |
| Jardine Lloyd Thompson Group PLC | | 1,698,399 | 24,131,437 |
| John Wood Group PLC | | 3,350,596 | 32,959,960 |
| London Stock Exchange Group PLC | | 754,745 | 33,070,372 |
| Melrose Industries PLC | | 15,054,914 | 46,115,430 |
| Micro Focus International PLC | | 1,261,900 | 42,298,605 |
| Next PLC | | 236,500 | 13,186,852 |
| Prudential PLC | | 3,099,080 | 68,780,556 |
| Reckitt Benckiser Group PLC | | 578,800 | 53,329,212 |
| Rio Tinto PLC | | 1,361,000 | 53,691,765 |
| Rolls-Royce Holdings PLC | | 2,776,266 | 29,198,056 |
| Rotork PLC | | 5,155,247 | 16,418,930 |
| Schroders PLC | | 843,300 | 34,809,758 |
| Shawbrook Group PLC | | 2,815,186 | 12,470,103 |
| Sinclair Pharma PLC (a) | | 10,471,424 | 4,543,467 |
| Spectris PLC | | 1,002,800 | 35,847,613 |
| St. James's Place Capital PLC | | 3,289,805 | 48,915,769 |
| Standard Life PLC | | 7,294,781 | 34,382,001 |
| Tesco PLC (a) | | 5,071,200 | 12,035,049 |
| Ultra Electronics Holdings PLC | | 813,200 | 22,034,129 |
| Victrex PLC | | 909,100 | 22,560,255 |
| Volution Group PLC | | 9,211,967 | 23,385,426 |
|
| TOTAL UNITED KINGDOM | | | 1,383,367,685 |
|
| United States of America - 3.2% | | | |
| Alphabet, Inc. Class C (a) | | 57,493 | 52,086,358 |
| Moody's Corp. | | 234,600 | 27,757,872 |
| PPG Industries, Inc. | | 351,500 | 38,608,760 |
| S&P Global, Inc. | | 411,100 | 55,165,509 |
| Total System Services, Inc. | | 475,800 | 27,268,098 |
|
| TOTAL UNITED STATES OF AMERICA | | | 200,886,597 |
|
| TOTAL COMMON STOCKS | | | |
| (Cost $5,025,999,091) | | | 6,025,440,067 |
|
| Nonconvertible Preferred Stocks - 1.0% | | | |
| Germany - 1.0% | | | |
| Henkel AG & Co. KGaA | | 473,600 | 64,486,560 |
| United Kingdom - 0.0% | | | |
| Rolls-Royce Holdings PLC (C Shares) | | 197,114,886 | 255,303 |
| TOTAL NONCONVERTIBLE PREFERRED STOCKS | | | |
| (Cost $45,884,993) | | | 64,741,863 |
|
| Money Market Funds - 6.1% | | | |
| Fidelity Cash Central Fund, 0.85% (c) | | 190,242,709 | 190,280,758 |
| Fidelity Securities Lending Cash Central Fund 0.86% (c)(d) | | 194,847,305 | 194,866,790 |
| TOTAL MONEY MARKET FUNDS | | | |
| (Cost $385,153,758) | | | 385,147,548 |
| TOTAL INVESTMENT PORTFOLIO - 102.7% | | | |
| (Cost $5,457,037,842) | | | 6,475,329,478 |
| NET OTHER ASSETS (LIABILITIES) - (2.7)% | | | (170,052,233) |
| NET ASSETS - 100% | | | $6,305,277,245 |
Categorizations in the Schedule of Investments are based on country or territory of incorporation.
Legend
(a) Non-income producing
(b) Security or a portion of the security is on loan at period end.
(c) Affiliated fund that is generally available only to investment companies and other accounts managed by Fidelity Investments. The rate quoted is the annualized seven-day yield of the fund at period end. A complete unaudited listing of the fund's holdings as of its most recent quarter end is available upon request. In addition, each Fidelity Central Fund's financial statements are available on the SEC's website or upon request.
(d) Investment made with cash collateral received from securities on loan.
Affiliated Central Funds
Information regarding fiscal year to date income earned by the Fund from investments in Fidelity Central Funds is as follows:
| Fund | Income earned |
| Fidelity Cash Central Fund | $264,427 |
| Fidelity Securities Lending Cash Central Fund | 1,174,652 |
| Total | $1,439,079 |
Investment Valuation
The following is a summary of the inputs used, as of April 30, 2017, involving the Fund's assets and liabilities carried at fair value. The inputs or methodology used for valuing securities may not be an indication of the risk associated with investing in those securities. For more information on valuation inputs, and their aggregation into the levels used below, please refer to the Investment Valuation section in the accompanying Notes to Financial Statements.
| | Valuation Inputs at Reporting Date: |
| Description | Total | Level 1 | Level 2 | Level 3 |
| Investments in Securities: | | | | |
| Equities: | | | | |
| Consumer Discretionary | $721,681,547 | $591,996,728 | $129,684,819 | $-- |
| Consumer Staples | 826,040,864 | 478,611,406 | 347,429,458 | -- |
| Energy | 165,658,919 | 53,726,717 | 111,932,202 | -- |
| Financials | 1,365,948,966 | 1,008,275,640 | 357,673,326 | -- |
| Health Care | 794,173,993 | 543,665,246 | 250,508,747 | -- |
| Industrials | 987,590,808 | 819,279,567 | 168,311,241 | -- |
| Information Technology | 702,982,250 | 557,264,184 | 145,718,066 | -- |
| Materials | 399,651,456 | 345,959,691 | 53,691,765 | -- |
| Real Estate | 32,601,390 | 32,601,390 | -- | -- |
| Telecommunication Services | 93,851,737 | 12,094,503 | 81,757,234 | -- |
| Money Market Funds | 385,147,548 | 385,147,548 | -- | -- |
| Total Investments in Securities: | $6,475,329,478 | $4,828,622,620 | $1,646,706,858 | $-- |
The following is a summary of transfers between Level 1 and Level 2 for the period ended April 30, 2017. Transfers are assumed to have occurred at the beginning of the period, and are primarily attributable to the valuation techniques used for foreign equity securities, as discussed in the accompanying Notes to Financial Statements:
| Transfers | Total |
| Level 1 to Level 2 | $190,226,278 |
| Level 2 to Level 1 | $57,632,360 |
See accompanying notes which are an integral part of the financial statements.
Financial Statements
Statement of Assets and Liabilities
| | | April 30, 2017 (Unaudited) |
| Assets | | |
Investment in securities, at value (including securities loaned of $189,260,696) — See accompanying schedule:
Unaffiliated issuers (cost $5,071,884,084) | $6,090,181,930 | |
| Fidelity Central Funds (cost $385,153,758) | 385,147,548 | |
| Total Investments (cost $5,457,037,842) | | $6,475,329,478 |
| Foreign currency held at value (cost $3,628) | | 3,653 |
| Receivable for investments sold | | 15,522,388 |
| Receivable for fund shares sold | | 6,842,795 |
| Dividends receivable | | 27,770,825 |
| Distributions receivable from Fidelity Central Funds | | 372,907 |
| Prepaid expenses | | 3,393 |
| Other receivables | | 392,135 |
| Total assets | | 6,526,237,574 |
| Liabilities | | |
| Payable to custodian bank | $942 | |
| Payable for investments purchased | 18,324,320 | |
| Payable for fund shares redeemed | 2,156,983 | |
| Accrued management fee | 4,094,822 | |
| Other affiliated payables | 862,180 | |
| Other payables and accrued expenses | 649,901 | |
| Collateral on securities loaned | 194,871,181 | |
| Total liabilities | | 220,960,329 |
| Net Assets | | $6,305,277,245 |
| Net Assets consist of: | | |
| Paid in capital | | $6,244,769,799 |
| Undistributed net investment income | | 26,516,672 |
| Accumulated undistributed net realized gain (loss) on investments and foreign currency transactions | | (984,458,215) |
| Net unrealized appreciation (depreciation) on investments and assets and liabilities in foreign currencies | | 1,018,448,989 |
| Net Assets | | $6,305,277,245 |
| Overseas: | | |
| Net Asset Value, offering price and redemption price per share ($5,390,078,788 ÷ 119,449,931 shares) | | $45.12 |
| Class K: | | |
| Net Asset Value, offering price and redemption price per share ($915,198,457 ÷ 20,324,252 shares) | | $45.03 |
See accompanying notes which are an integral part of the financial statements.
Statement of Operations
| | | Six months ended April 30, 2017 (Unaudited) |
| Investment Income | | |
| Dividends | | $60,433,859 |
| Interest | | 1,772 |
| Income from Fidelity Central Funds | | 1,439,079 |
| Income before foreign taxes withheld | | 61,874,710 |
| Less foreign taxes withheld | | (5,070,888) |
| Total income | | 56,803,822 |
| Expenses | | |
| Management fee | | |
| Basic fee | $18,449,554 | |
| Performance adjustment | 3,626,320 | |
| Transfer agent fees | 4,205,900 | |
| Accounting and security lending fees | 798,289 | |
| Custodian fees and expenses | 270,659 | |
| Independent trustees' fees and expenses | 10,941 | |
| Appreciation in deferred trustee compensation account | 95 | |
| Registration fees | 100,298 | |
| Audit | 47,469 | |
| Legal | 27,115 | |
| Miscellaneous | 20,768 | |
| Total expenses before reductions | 27,557,408 | |
| Expense reductions | (158,475) | 27,398,933 |
| Net investment income (loss) | | 29,404,889 |
| Realized and Unrealized Gain (Loss) | | |
| Net realized gain (loss) on: | | |
| Investment securities: | | |
| Unaffiliated issuers | 33,997,926 | |
| Fidelity Central Funds | (4,982) | |
| Foreign currency transactions | (547,296) | |
| Total net realized gain (loss) | | 33,445,648 |
Change in net unrealized appreciation (depreciation) on:
Investment securities | 641,442,202 | |
| Assets and liabilities in foreign currencies | 744,451 | |
| Total change in net unrealized appreciation (depreciation) | | 642,186,653 |
| Net gain (loss) | | 675,632,301 |
| Net increase (decrease) in net assets resulting from operations | | $705,037,190 |
See accompanying notes which are an integral part of the financial statements.
Statement of Changes in Net Assets
| | Six months ended April 30, 2017 (Unaudited) | Year ended October 31, 2016 |
| Increase (Decrease) in Net Assets | | |
| Operations | | |
| Net investment income (loss) | $29,404,889 | $95,870,128 |
| Net realized gain (loss) | 33,445,648 | (60,892,494) |
| Change in net unrealized appreciation (depreciation) | 642,186,653 | (60,859,999) |
| Net increase (decrease) in net assets resulting from operations | 705,037,190 | (25,882,365) |
| Distributions to shareholders from net investment income | (95,770,395) | (49,659,846) |
| Distributions to shareholders from net realized gain | (6,822,055) | (685,981) |
| Total distributions | (102,592,450) | (50,345,827) |
| Share transactions - net increase (decrease) | 389,058,312 | 854,054,931 |
| Redemption fees | 11,066 | 61,587 |
| Total increase (decrease) in net assets | 991,514,118 | 777,888,326 |
| Net Assets | | |
| Beginning of period | 5,313,763,127 | 4,535,874,801 |
| End of period | $6,305,277,245 | $5,313,763,127 |
| Other Information | | |
| Undistributed net investment income end of period | $26,516,672 | $92,882,178 |
See accompanying notes which are an integral part of the financial statements.
Financial Highlights — Fidelity Overseas Fund
| | Six months ended (Unaudited) April 30, | Years ended October 31, | | | | |
| | 2017 | 2016 | 2015 | 2014 | 2013 | 2012 |
| Selected Per–Share Data | | | | | | |
| Net asset value, beginning of period | $40.73 | $41.56 | $39.02 | $39.22 | $31.35 | $29.28 |
| Income from Investment Operations | | | | | | |
| Net investment income (loss)A | .22 | .75B | .52 | .77C | .54 | .73 |
| Net realized and unrealized gain (loss) | 4.95 | (1.15) | 2.69 | (.28) | 8.10 | 2.19 |
| Total from investment operations | 5.17 | (.40) | 3.21 | .49 | 8.64 | 2.92 |
| Distributions from net investment income | (.72) | (.43) | (.67) | (.51) | (.77) | (.83) |
| Distributions from net realized gain | (.05) | (.01) | – | (.18) | – | (.02) |
| Total distributions | (.78)D | (.43)E | (.67) | (.69) | (.77) | (.85) |
| Redemption fees added to paid in capitalA,F | – | – | – | – | – | – |
| Net asset value, end of period | $45.12 | $40.73 | $41.56 | $39.02 | $39.22 | $31.35 |
| Total ReturnG,H | 12.97% | (.97)% | 8.34% | 1.27% | 28.17% | 10.37% |
| Ratios to Average Net AssetsI,J | | | | | | |
| Expenses before reductions | 1.02%K | 1.03% | 1.04% | 1.04% | 1.09% | .69% |
| Expenses net of fee waivers, if any | 1.02%K | 1.03% | 1.04% | 1.04% | 1.09% | .69% |
| Expenses net of all reductions | 1.01%K | 1.03% | 1.03% | 1.04% | 1.06% | .67% |
| Net investment income (loss) | 1.05%K | 1.88%B | 1.28% | 1.93%C | 1.54% | 2.52% |
| Supplemental Data | | | | | | |
| Net assets, end of period (000 omitted) | $5,390,079 | $4,569,084 | $3,844,290 | $2,738,667 | $1,874,922 | $1,639,725 |
| Portfolio turnover rateL | 29%K | 33% | 28% | 41% | 42% | 90% |
A Calculated based on average shares outstanding during the period.
B Net Investment income per share reflects a large, non-recurring dividend which amounted to $.18 per share. Excluding this non-recurring dividend, the ratio of net investment income (loss) to average net assets would have been 1.42%.
C Net Investment income per share reflects a large, non-recurring dividend which amounted to $.24 per share. Excluding this non-recurring dividend, the ratio of net investment income (loss) to average net assets would have been 1.34%.
D Total distributions of $.78 per share is comprised of distributions from net investment income of $.723 and distributions from net realized gain of $.052 per share.
E Total distributions of $.43 per share is comprised of distributions from net investment income of $.428 and distributions from net realized gain of $.006 per share.
F Amount represents less than $.005 per share.
G Total returns for periods of less than one year are not annualized.
H Total returns would have been lower if certain expenses had not been reduced during the applicable periods shown.
I Fees and expenses of any underlying Fidelity Central Funds are not included in the Fund's expense ratio. The Fund indirectly bears its proportionate share of the expenses of any underlying Fidelity Central Funds.
J Expense ratios reflect operating expenses of the class. Expenses before reductions do not reflect amounts reimbursed by the investment adviser or reductions from brokerage service arrangements or reductions from other expense offset arrangements and do not represent the amount paid by the class during periods when reimbursements or reductions occur. Expenses net of fee waivers reflect expenses after reimbursement by the investment adviser but prior to reductions from brokerage service arrangements or other expense offset arrangements. Expenses net of all reductions represent the net expenses paid by the class.
K Annualized
L Amount does not include the portfolio activity of any underlying Fidelity Central Funds.
See accompanying notes which are an integral part of the financial statements.
Financial Highlights — Fidelity Overseas Fund Class K
| | Six months ended (Unaudited) April 30, | Years ended October 31, | | | | |
| | 2017 | 2016 | 2015 | 2014 | 2013 | 2012 |
| Selected Per–Share Data | | | | | | |
| Net asset value, beginning of period | $40.67 | $41.49 | $38.96 | $39.17 | $31.32 | $29.29 |
| Income from Investment Operations | | | | | | |
| Net investment income (loss)A | .24 | .80B | .57 | .82C | .60 | .79 |
| Net realized and unrealized gain (loss) | 4.94 | (1.14) | 2.68 | (.28) | 8.08 | 2.18 |
| Total from investment operations | 5.18 | (.34) | 3.25 | .54 | 8.68 | 2.97 |
| Distributions from net investment income | (.77) | (.47) | (.72) | (.58) | (.83) | (.92) |
| Distributions from net realized gain | (.05) | (.01) | – | (.18) | – | (.02) |
| Total distributions | (.82) | (.48) | (.72) | (.75)D | (.83) | (.94) |
| Redemption fees added to paid in capitalA,E | – | – | – | – | – | – |
| Net asset value, end of period | $45.03 | $40.67 | $41.49 | $38.96 | $39.17 | $31.32 |
| Total ReturnF,G | 13.05% | (.85)% | 8.47% | 1.41% | 28.37% | 10.59% |
| Ratios to Average Net AssetsH,I | | | | | | |
| Expenses before reductions | .90%J | .91% | .91% | .90% | .93% | .51% |
| Expenses net of fee waivers, if any | .90%J | .91% | .91% | .90% | .92% | .51% |
| Expenses net of all reductions | .89%J | .90% | .90% | .90% | .90% | .48% |
| Net investment income (loss) | 1.17%J | 2.00%B | 1.40% | 2.06%C | 1.71% | 2.70% |
| Supplemental Data | | | | | | |
| Net assets, end of period (000 omitted) | $915,198 | $744,679 | $691,585 | $626,817 | $562,490 | $265,484 |
| Portfolio turnover rateK | 29%J | 33% | 28% | 41% | 42% | 90% |
A Calculated based on average shares outstanding during the period.
B Net Investment income per share reflects a large, non-recurring dividend which amounted to $.18 per share. Excluding this non-recurring dividend, the ratio of net investment income (loss) to average net assets would have been 1.55%.
C Net Investment income per share reflects a large, non-recurring dividend which amounted to $.24 per share. Excluding this non-recurring dividend, the ratio of net investment income (loss) to average net assets would have been 1.47%.
D Total distributions of $.75 per share is comprised of distributions from net investment income of $.575 and distributions from net realized gain of $.177 per share.
E Amount represents less than $.005 per share.
F Total returns for periods of less than one year are not annualized.
G Total returns would have been lower if certain expenses had not been reduced during the applicable periods shown.
H Fees and expenses of any underlying Fidelity Central Funds are not included in the Fund's expense ratio. The Fund indirectly bears its proportionate share of the expenses of any underlying Fidelity Central Funds.
I Expense ratios reflect operating expenses of the class. Expenses before reductions do not reflect amounts reimbursed by the investment adviser or reductions from brokerage service arrangements or reductions from other expense offset arrangements and do not represent the amount paid by the class during periods when reimbursements or reductions occur. Expenses net of fee waivers reflect expenses after reimbursement by the investment adviser but prior to reductions from brokerage service arrangements or other expense offset arrangements. Expenses net of all reductions represent the net expenses paid by the class.
J Annualized
K Amount does not include the portfolio activity of any underlying Fidelity Central Funds.
See accompanying notes which are an integral part of the financial statements.
See accompanying notes which are an integral part of the financial statements.
Notes to Financial Statements (Unaudited)
For the period ended April 30, 2017
1. Organization.
Fidelity Overseas Fund (the Fund) is a fund of Fidelity Investment Trust (the Trust) and is authorized to issue an unlimited number of shares. The Trust is registered under the Investment Company Act of 1940, as amended (the 1940 Act), as an open-end management investment company organized as a Massachusetts business trust. The Fund offers Overseas and Class K shares, each of which has equal rights as to assets and voting privileges. Each class has exclusive voting rights with respect to matters that affect that class.
2. Investments in Fidelity Central Funds.
The Fund invests in Fidelity Central Funds, which are open-end investment companies generally available only to other investment companies and accounts managed by the investment adviser and its affiliates. The Fund's Schedule of Investments lists each of the Fidelity Central Funds held as of period end, if any, as an investment of the Fund, but does not include the underlying holdings of each Fidelity Central Fund. As an Investing Fund, the Fund indirectly bears its proportionate share of the expenses of the underlying Fidelity Central Funds.
The Money Market Central Funds seek preservation of capital and current income and are managed by Fidelity Investments Money Management, Inc. (FIMM), an affiliate of the investment adviser. Annualized expenses of the Money Market Central Funds as of their most recent shareholder report date are less than .005%.
A complete unaudited list of holdings for each Fidelity Central Fund is available upon request or at the Securities and Exchange Commission (the SEC) website at www.sec.gov. In addition, the financial statements of the Fidelity Central Funds are available on the SEC website or upon request.
3. Significant Accounting Policies.
The Fund is an investment company and applies the accounting and reporting guidance of the Financial Accounting Standards Board (FASB) Accounting Standards Codification Topic 946 Financial Services – Investments Companies. The financial statements have been prepared in conformity with accounting principles generally accepted in the United States of America (GAAP), which require management to make certain estimates and assumptions at the date of the financial statements. Actual results could differ from those estimates. Subsequent events, if any, through the date that the financial statements were issued have been evaluated in the preparation of the financial statements. The following summarizes the significant accounting policies of the Fund:
Investment Valuation. Investments are valued as of 4:00 p.m. Eastern time on the last calendar day of the period. The Board of Trustees (the Board) has delegated the day to day responsibility for the valuation of the Fund's investments to the Fair Value Committee (the Committee) established by the Fund's investment adviser. In accordance with valuation policies and procedures approved by the Board, the Fund attempts to obtain prices from one or more third party pricing vendors or brokers to value its investments. When current market prices, quotations or currency exchange rates are not readily available or reliable, investments will be fair valued in good faith by the Committee, in accordance with procedures adopted by the Board. Factors used in determining fair value vary by investment type and may include market or investment specific events. The frequency with which these procedures are used cannot be predicted and they may be utilized to a significant extent. The Committee oversees the Fund's valuation policies and procedures and reports to the Board on the Committee's activities and fair value determinations. The Board monitors the appropriateness of the procedures used in valuing the Fund's investments and ratifies the fair value determinations of the Committee.
The Fund categorizes the inputs to valuation techniques used to value its investments into a disclosure hierarchy consisting of three levels as shown below:
- Level 1 – quoted prices in active markets for identical investments
- Level 2 – other significant observable inputs (including quoted prices for similar investments, interest rates, prepayment speeds, etc.)
- Level 3 – unobservable inputs (including the Fund's own assumptions based on the best information available)
Valuation techniques used to value the Fund's investments by major category are as follows:
Equity securities, including restricted securities, for which market quotations are readily available, are valued at the last reported sale price or official closing price as reported by a third party pricing vendor on the primary market or exchange on which they are traded and are categorized as Level 1 in the hierarchy. In the event there were no sales during the day or closing prices are not available, securities are valued at the last quoted bid price or may be valued using the last available price and are generally categorized as Level 2 in the hierarchy. For foreign equity securities, when market or security specific events arise, comparisons to the valuation of American Depositary Receipts (ADRs), futures contracts, Exchange-Traded Funds (ETFs) and certain indexes as well as quoted prices for similar securities may be used and would be categorized as Level 2 in the hierarchy. Utilizing these techniques may result in transfers between Level 1 and Level 2. For equity securities, including restricted securities, where observable inputs are limited, assumptions about market activity and risk are used and these securities may be categorized as Level 3 in the hierarchy.
Investments in open-end mutual funds, including the Fidelity Central Funds, are valued at their closing net asset value (NAV) each business day and are categorized as Level 1 in the hierarchy.
Changes in valuation techniques may result in transfers in or out of an assigned level within the disclosure hierarchy. The aggregate value of investments by input level as of April 30, 2017, including information on transfers between Levels 1 and 2, is included at the end of the Fund's Schedule of Investments.
Foreign Currency. The Fund may use foreign currency contracts to facilitate transactions in foreign-denominated securities. Gains and losses from these transactions may arise from changes in the value of the foreign currency or if the counterparties do not perform under the contracts' terms.
Foreign-denominated assets, including investment securities, and liabilities are translated into U.S. dollars at the exchange rates at period end. Purchases and sales of investment securities, income and dividends received and expenses denominated in foreign currencies are translated into U.S. dollars at the exchange rate in effect on the transaction date.
The effects of exchange rate fluctuations on investments are included with the net realized and unrealized gain (loss) on investment securities. Other foreign currency transactions resulting in realized and unrealized gain (loss) are disclosed separately.
Investment Transactions and Income. For financial reporting purposes, the Fund's investment holdings and NAV include trades executed through the end of the last business day of the period. The NAV per share for processing shareholder transactions is calculated as of the close of business of the New York Stock Exchange (NYSE), normally 4:00 p.m. Eastern time and includes trades executed through the end of the prior business day. Gains and losses on securities sold are determined on the basis of identified cost. Dividend income is recorded on the ex-dividend date, except for certain dividends from foreign securities where the ex-dividend date may have passed, which are recorded as soon as the Fund is informed of the ex-dividend date. Non-cash dividends included in dividend income, if any, are recorded at the fair market value of the securities received. Income and capital gain distributions from Fidelity Central Funds, if any, are recorded on the ex-dividend date. Certain distributions received by the Fund represent a return of capital or capital gain. The Fund determines the components of these distributions subsequent to the ex-dividend date, based upon receipt of tax filings or other correspondence relating to the underlying investment. These distributions are recorded as a reduction of cost of investments and/or as a realized gain. Interest income is accrued as earned and includes coupon interest and amortization of premium and accretion of discount on debt securities as applicable. Investment income is recorded net of foreign taxes withheld where recovery of such taxes is uncertain.
Class Allocations and Expenses. Investment income, realized and unrealized capital gains and losses, common expenses of the Fund, and certain fund-level expense reductions, if any, are allocated daily on a pro-rata basis to each class based on the relative net assets of each class to the total net assets of the Fund. Each class differs with respect to transfer agent fees incurred. Certain expense reductions may also differ by class. For the reporting period, the allocated portion of income and expenses to each class as a percent of its average net assets may vary due to the timing of recording these transactions in relation to fluctuating net assets of the classes. Expenses directly attributable to a fund are charged to that fund. Expenses attributable to more than one fund are allocated among the respective funds on the basis of relative net assets or other appropriate methods. Expense estimates are accrued in the period to which they relate and adjustments are made when actual amounts are known.
Deferred Trustee Compensation. Under a Deferred Compensation Plan (the Plan), independent Trustees may elect to defer receipt of a portion of their annual compensation. Deferred amounts are invested in a cross-section of Fidelity funds, are marked-to-market and remain in the Fund until distributed in accordance with the Plan. The investment of deferred amounts and the offsetting payable to the Trustees are included in the accompanying Statement of Assets and Liabilities.
Income Tax Information and Distributions to Shareholders. Each year, the Fund intends to qualify as a regulated investment company under Subchapter M of the Internal Revenue Code, including distributing substantially all of its taxable income and realized gains. As a result, no provision for U.S. Federal income taxes is required. The Fund files a U.S. federal tax return, in addition to state and local tax returns as required. The Fund's federal income tax returns are subject to examination by the Internal Revenue Service (IRS) for a period of three fiscal years after they are filed. State and local tax returns may be subject to examination for an additional fiscal year depending on the jurisdiction. Foreign taxes are provided for based on the Fund's understanding of the tax rules and rates that exist in the foreign markets in which it invests.
Distributions are declared and recorded on the ex-dividend date. Income dividends and capital gain distributions are declared separately for each class. Income and capital gain distributions are determined in accordance with income tax regulations, which may differ from GAAP.
Capital accounts within the financial statements are adjusted for permanent book-tax differences. These adjustments have no impact on net assets or the results of operations. Capital accounts are not adjusted for temporary book-tax differences which will reverse in a subsequent period.
Book-tax differences are primarily due to foreign currency transactions, passive foreign investment companies (PFIC), deferred trustees compensation, capital loss carryforwards and losses deferred due to wash sales.
The federal tax cost of investment securities and unrealized appreciation (depreciation) as of period end were as follows:
| Gross unrealized appreciation | $1,153,790,595 |
| Gross unrealized depreciation | (137,112,120) |
| Net unrealized appreciation (depreciation) on securities | $1,016,678,475 |
| Tax cost | $5,458,651,003 |
Capital loss carryforwards are only available to offset future capital gains of the Fund to the extent provided by regulations and may be limited. Under the Regulated Investment Company Modernization Act of 2010 (the Act), the Fund is permitted to carry forward capital losses incurred in taxable years beginning after December 22, 2010 for an unlimited period and such capital losses are required to be used prior to any losses that expire. The capital loss carryforward information presented below, including any applicable limitation, is estimated as of prior fiscal period end and is subject to adjustment.
| Fiscal year of expiration | |
| 2017 | $(939,719,765) |
| No expiration | |
| Short-term | (64,208,536) |
| Total capital loss carryforward | $(1,003,928,301) |
Short-Term Trading (Redemption) Fees. Shares held by investors in the Fund less than 30 days may have been subject to a redemption fee equal to 1.00% of the NAV of shares redeemed. All redemption fees, which reduce the proceeds of the shareholder redemption, are retained by the Fund and accounted for as an addition to paid in capital. In November 2016, the Board of Trustees approved the elimination of these redemption fees effective December 12, 2016.
4. Purchases and Sales of Investments.
Purchases and sales of securities, other than short-term securities, aggregated $1,003,425,239 and $794,234,015, respectively.
5. Fees and Other Transactions with Affiliates.
Management Fee. Fidelity Management & Research Company (the investment adviser) and its affiliates provide the Fund with investment management related services for which the Fund pays a monthly management fee. The management fee is the sum of an individual fund fee rate that is based on an annual rate of .424% of the Fund's average net assets and an annualized group fee rate that averaged .25% during the period. The group fee rate is based upon the average net assets of all the mutual funds advised by the investment adviser, including any mutual funds previously advised by the investment adviser that are currently advised by Fidelity SelectCo, LLC, an affiliate of the investment adviser. The group fee rate decreases as assets under management increase and increases as assets under management decrease. In addition, the management fee is subject to a performance adjustment (up to a maximum of +/- .20% of the Fund's average net assets over a 36 month performance period). The upward or downward adjustment to the management fee is based on the relative investment performance of Overseas as compared to its benchmark index, the MSCI EAFE Index, over the same 36 month performance period. For the reporting period, the total annualized management fee rate, including the performance adjustment, was .80% of the Fund's average net assets. The performance adjustment included in the management fee rate may be higher or lower than the maximum performance adjustment rate due to the difference between the average net assets for the reporting and performance periods.
Transfer Agent Fees. Fidelity Investments Institutional Operations Company, Inc., (FIIOC), an affiliate of the investment adviser, is the transfer, dividend disbursing and shareholder servicing agent for each class of the Fund. FIIOC receives account fees and asset-based fees that vary according to the account size and type of account of the shareholders of Overseas. FIIOC receives an asset-based fee of Class K's average net assets. FIIOC pays for typesetting, printing and mailing of shareholder reports, except proxy statements.
For the period, transfer agent fees for each class were as follows:
| | Amount | % of
Class-Level Average
Net Assets(a) |
| Overseas | $4,016,424 | .17 |
| Class K | 189,476 | .05 |
| | $4,205,900 | |
(a) Annualized
Accounting and Security Lending Fees. Fidelity Service Company, Inc. (FSC), an affiliate of the investment adviser, maintains the Fund's accounting records. The accounting fee is based on the level of average net assets for each month. Under a separate contract, FSC administers the security lending program. The security lending fee is based on the number and duration of lending transactions.
Brokerage Commissions. The Fund placed a portion of its portfolio transactions with brokerage firms which are affiliates of the investment adviser. Brokerage commissions are included in net realized gain (loss) and change in net unrealized appreciation (depreciation) in the Statement of Operations. The commissions paid to these affiliated firms were $3,495 for the period.
Interfund Trades. The Fund may purchase from or sell securities to other Fidelity Funds under procedures adopted by the Board. The procedures have been designed to ensure these interfund trades are executed in accordance with Rule 17a-7 of the 1940 Act. Interfund trades are included within the respective purchases and sales amounts shown in the Purchases and Sales of Investments note.
6. Committed Line of Credit.
The Fund participates with other funds managed by the investment adviser or an affiliate in a $4.25 billion credit facility (the "line of credit") to be utilized for temporary or emergency purposes to fund shareholder redemptions or for other short-term liquidity purposes. The Fund has agreed to pay commitment fees on its pro-rata portion of the line of credit, which amounted to $9,146 and is reflected in Miscellaneous expenses on the Statement of Operations.
7. Security Lending.
The Fund lends portfolio securities through a lending agent from time to time in order to earn additional income. For equity securities, a lending agent is used and may loan securities to certain qualified borrowers, including Fidelity Capital Markets (FCM), a broker-dealer affiliated with the Fund. On the settlement date of the loan, the Fund receives collateral (in the form of U.S. Treasury obligations, letters of credit and/or cash) against the loaned securities and maintains collateral in an amount not less than 100% of the market value of the loaned securities during the period of the loan. The market value of the loaned securities is determined at the close of business of the Fund and any additional required collateral is delivered to the Fund on the next business day. The Fund or borrower may terminate the loan at any time, and if the borrower defaults on its obligation to return the securities loaned because of insolvency or other reasons, the Fund may apply collateral received from the borrower against the obligation. The Fund may experience delays and costs in recovering the securities loaned. Any cash collateral received is invested in the Fidelity Securities Lending Cash Central Fund. The value of loaned securities and cash collateral at period end are disclosed on the Fund's Statement of Assets and Liabilities. Security lending income represents the income earned on investing cash collateral, less rebates paid to borrowers and any lending agent fees associated with the loan, plus any premium payments received for lending certain types of securities. Security lending income is presented in the Statement of Operations as a component of Income from Fidelity Central Funds. Total security lending income during the period amounted to $1,174,652. During the period, there were no securities loaned to FCM.
8. Expense Reductions.
Commissions paid to certain brokers with whom the investment adviser, or its affiliates, places trades on behalf of the Fund include an amount in addition to trade execution, which may be rebated back to the Fund to offset certain expenses. This amount totaled $134,924 for the period.
In addition, during the period the investment adviser reimbursed and/or waived a portion of fund-level operating expenses in the amount of $23,551.
9. Distributions to Shareholders.
Distributions to shareholders of each class were as follows:
| | Six months ended
April 30, 2017 | Year ended October 31, 2016 |
| From net investment income | | |
| Overseas | $81,032,152 | $41,702,378 |
| Class K | 14,738,243 | 7,957,468 |
| Total | $95,770,395 | $49,659,846 |
| From net realized gain | | |
| Overseas | $5,828,037 | $584,612 |
| Class K | 994,018 | 101,369 |
| Total | $6,822,055 | $685,981 |
10. Share Transactions.
Share transactions for each class were as follows and may contain automatic conversions between classes or exchanges between affiliated funds:
| | Shares | Shares | Dollars | Dollars |
| | Six months ended
April 30, 2017 | Year ended October 31, 2016 | Six months ended
April 30, 2017 | Year ended October 31, 2016 |
| Overseas | | | | |
| Shares sold | 18,094,751 | 37,524,563 | $751,636,440 | $1,504,705,495 |
| Reinvestment of distributions | 2,111,922 | 981,115 | 82,914,053 | 40,667,201 |
| Shares redeemed | (12,931,845) | (18,839,855) | (526,088,544) | (756,461,832) |
| Net increase (decrease) | 7,274,828 | 19,665,823 | $308,461,949 | $788,910,864 |
| Class K | | | | |
| Shares sold | 4,446,364 | 5,594,348 | $181,807,765 | $223,588,949 |
| Reinvestment of distributions | 401,743 | 194,940 | 15,732,261 | 8,058,837 |
| Shares redeemed | (2,833,149) | (4,150,582) | (116,943,663) | (166,503,719) |
| Net increase (decrease) | 2,014,958 | 1,638,706 | $80,596,363 | $65,144,067 |
11. Other.
The Fund's organizational documents provide former and current trustees and officers with a limited indemnification against liabilities arising in connection with the performance of their duties to the Fund. In the normal course of business, the Fund may also enter into contracts that provide general indemnifications. The Fund's maximum exposure under these arrangements is unknown as this would be dependent on future claims that may be made against the Fund. The risk of material loss from such claims is considered remote.
At the end of the period, mutual funds managed by the investment adviser or its affiliates were the owners of record, in the aggregate, of approximately 33% of the total outstanding shares of the Fund.
Shareholder Expense Example
As a shareholder of the Fund, you incur two types of costs: (1) transaction costs, including redemption fees and (2) ongoing costs, including management fees and other Fund expenses. This Example is intended to help you understand your ongoing costs (in dollars) of investing in the Fund and to compare these costs with the ongoing costs of investing in other mutual funds.
The Example is based on an investment of $1,000 invested at the beginning of the period and held for the entire period (November 1, 2016 to April 30, 2017).
Actual Expenses
The first line of the accompanying table for each class of the Fund provides information about actual account values and actual expenses. You may use the information in this line, together with the amount you invested, to estimate the expenses that you paid over the period. Simply divide your account value by $1,000.00 (for example, an $8,600 account value divided by $1,000.00 = 8.6), then multiply the result by the number in the first line for a class of the Fund under the heading entitled "Expenses Paid During Period" to estimate the expenses you paid on your account during this period. A small balance maintenance fee of $12.00 that is charged once a year may apply for certain accounts with a value of less than $2,000. This fee is not included in the table below. If it was, the estimate of expenses you paid during the period would be higher, and your ending account value lower, by this amount. In addition, the Fund, as a shareholder in the underlying Fidelity Central Funds, will indirectly bear its pro-rata share of the fees and expenses incurred by the underlying Fidelity Central Funds. These fees and expenses are not included in the Fund's annualized expense ratio used to calculate the expense estimate in the table below.
Hypothetical Example for Comparison Purposes
The second line of the accompanying table for each class of the Fund provides information about hypothetical account values and hypothetical expenses based on a Class' actual expense ratio and an assumed rate of return of 5% per year before expenses, which is not the Class' actual return. The hypothetical account values and expenses may not be used to estimate the actual ending account balance or expenses you paid for the period. You may use this information to compare the ongoing costs of investing in the Fund and other funds. To do so, compare this 5% hypothetical example with the 5% hypothetical examples that appear in the shareholder reports of the other funds. A small balance maintenance fee of $12.00 that is charged once a year may apply for certain accounts with a value of less than $2,000. This fee is not included in the table below. If it was, the estimate of expenses you paid during the period would be higher, and your ending account value lower, by this amount. In addition, the Fund, as a shareholder in the underlying Fidelity Central Funds, will indirectly bear its pro-rata share of the fees and expenses incurred by the underlying Fidelity Central Funds. These fees and expenses are not included in the Fund's annualized expense ratio used to calculate the expense estimate in the table below.
Please note that the expenses shown in the table are meant to highlight your ongoing costs only and do not reflect any transaction costs. Therefore, the second line of the table is useful in comparing ongoing costs only, and will not help you determine the relative total costs of owning different funds. In addition, if these transactional costs were included, your costs would have been higher.
| | Annualized Expense Ratio-A | Beginning
Account Value
November 1, 2016 | Ending
Account Value
April 30, 2017 | Expenses Paid
During Period-B
November 1, 2016
to April 30, 2017 |
| Overseas | 1.02% | | | |
| Actual | | $1,000.00 | $1,129.70 | $5.39 |
| Hypothetical-C | | $1,000.00 | $1,019.74 | $5.11 |
| Class K | .90% | | | |
| Actual | | $1,000.00 | $1,130.50 | $4.75 |
| Hypothetical-C | | $1,000.00 | $1,020.33 | $4.51 |
A Annualized expense ratio reflects expenses net of applicable fee waivers.
B Expenses are equal to each Class' annualized expense ratio, multiplied by the average account value over the period, multiplied by 181/365 (to reflect the one-half year period).
C 5% return per year before expenses
Corporate Headquarters
245 Summer St.
Boston, MA 02210
www.fidelity.com
OVE-K-SANN-0617
1.863322.108
Fidelity Advisor® China Region Fund -
Class A, Class M (formerly Class T), Class C and Class I
Semi-Annual Report April 30, 2017 Class A, Class M, Class C and Class I are classes of Fidelity® China Region Fund |
|
Contents
To view a fund's proxy voting guidelines and proxy voting record for the 12-month period ended June 30, visit http://www.fidelity.com/proxyvotingresults or visit the Securities and Exchange Commission's (SEC) web site at http://www.sec.gov.
You may also call 1-877-208-0098 to request a free copy of the proxy voting guidelines.
Standard & Poor's, S&P and S&P 500 are registered service marks of The McGraw-Hill Companies, Inc. and have been licensed for use by Fidelity Distributors Corporation.
Other third-party marks appearing herein are the property of their respective owners.
All other marks appearing herein are registered or unregistered trademarks or service marks of FMR LLC or an affiliated company. © 2017 FMR LLC. All rights reserved.
This report and the financial statements contained herein are submitted for the general information of the shareholders of the Fund. This report is not authorized for distribution to prospective investors in the Fund unless preceded or accompanied by an effective prospectus.
A fund files its complete schedule of portfolio holdings with the SEC for the first and third quarters of each fiscal year on Form N-Q. Forms N-Q are available on the SEC’s web site at http://www.sec.gov. A fund's Forms N-Q may be reviewed and copied at the SEC’s Public Reference Room in Washington, DC. Information regarding the operation of the SEC's Public Reference Room may be obtained by calling 1-800-SEC-0330.
For a complete list of a fund's portfolio holdings, view the most recent holdings listing, semiannual report, or annual report on Fidelity's web site at http://www.fidelity.com, http://www.institutional.fidelity.com, or http://www.401k.com, as applicable.
NOT FDIC INSURED •MAY LOSE VALUE •NO BANK GUARANTEE
Neither the Fund nor Fidelity Distributors Corporation is a bank.
Investment Summary (Unaudited)
Geographic Diversification (% of fund's net assets)
| As of April 30, 2017 |
| | China | 39.7% |
| | Cayman Islands | 34.3% |
| | Taiwan | 15.2% |
| | Hong Kong | 4.7% |
| | United States of America* | 2.6% |
| | Bailiwick of Jersey | 1.2% |
| | British Virgin Islands | 1.0% |
| | Bermuda | 0.8% |
| | United Kingdom | 0.5% |

* Includes Short-Term investments and Net Other Assets (Liabilities).
Percentages are based on country or territory of incorporation and are adjusted for the effect of futures contracts, if applicable.
| As of October 31, 2016 |
| | Cayman Islands | 30.6% |
| | China | 29.0% |
| | Taiwan | 20.3% |
| | United States of America* | 6.1% |
| | United Kingdom | 4.8% |
| | Bermuda | 3.0% |
| | Hong Kong | 2.7% |
| | Netherlands | 2.1% |
| | British Virgin Islands | 1.1% |
| | Other | 0.3% |

* Includes Short-Term investments and Net Other Assets (Liabilities).
Percentages are based on country or territory of incorporation and are adjusted for the effect of futures contracts, if applicable.
Asset Allocation as of April 30, 2017
| | % of fund's net assets | % of fund's net assets 6 months ago |
| Stocks | 97.6 | 93.9 |
| Short-Term Investments and Net Other Assets (Liabilities) | 2.4 | 6.1 |
Top Ten Stocks as of April 30, 2017
| | % of fund's net assets | % of fund's net assets 6 months ago |
| Tencent Holdings Ltd. (Internet Software & Services) | 9.2 | 9.2 |
| Taiwan Semiconductor Manufacturing Co. Ltd. (Semiconductors & Semiconductor Equipment) | 6.8 | 8.8 |
| Alibaba Group Holding Ltd. sponsored ADR (Internet Software & Services) | 5.7 | 5.8 |
| JD.com, Inc. sponsored ADR (Internet & Direct Marketing Retail) | 3.2 | 0.9 |
| China Construction Bank Corp. (H Shares) (Banks) | 2.8 | 2.8 |
| Hon Hai Precision Industry Co. Ltd. (Foxconn) (Electronic Equipment & Components) | 2.7 | 2.1 |
| NetEase, Inc. ADR (Internet Software & Services) | 2.3 | 1.6 |
| Industrial & Commercial Bank of China Ltd. (H Shares) (Banks) | 2.1 | 1.9 |
| China Oilfield Services Ltd. (H Shares) (Energy Equipment & Services) | 1.9 | 0.8 |
| Kweichow Moutai Co. Ltd. (A Shares) (Beverages) | 1.8 | 2.0 |
| | 38.5 | |
Top Market Sectors as of April 30, 2017
| | % of fund's net assets | % of fund's net assets 6 months ago |
| Information Technology | 37.5 | 36.2 |
| Consumer Discretionary | 14.0 | 12.6 |
| Financials | 10.7 | 17.0 |
| Materials | 7.9 | 4.0 |
| Industrials | 7.1 | 5.1 |
| Consumer Staples | 5.9 | 3.5 |
| Energy | 5.1 | 3.9 |
| Health Care | 5.1 | 3.2 |
| Utilities | 2.4 | 3.3 |
| Real Estate | 1.3 | 3.6 |
Market Sectors may include more than one industry category.
The Fund may invest up to 35% of its total assets in any industry that represents more than 20% of the Hong Kong, Taiwanese and Chinese markets. As of April 30, 2017, the Fund did not have more than 25% of its total assets invested in any one industry.
Investments April 30, 2017 (Unaudited)
Showing Percentage of Net Assets
| Common Stocks - 96.7% | | | |
| | | Shares | Value |
| CONSUMER DISCRETIONARY - 13.1% | | | |
| Automobiles - 1.8% | | | |
| Guangzhou Automobile Group Co. Ltd. (H Shares) | | 2,966,000 | $4,613,909 |
| SAIC Motor Corp. Ltd. | | 3,622,515 | 14,319,799 |
| | | | 18,933,708 |
| Diversified Consumer Services - 1.4% | | | |
| New Oriental Education & Technology Group, Inc. sponsored ADR (a) | | 229,800 | 14,831,292 |
| Hotels, Restaurants & Leisure - 1.2% | | | |
| China Travel International Investment HK Ltd. | | 17,560,000 | 5,079,483 |
| Huangshan Tourism Development Co. Ltd. | | 14 | 21 |
| Melco Crown Entertainment Ltd. sponsored ADR | | 354,300 | 7,776,885 |
| | | | 12,856,389 |
| Household Durables - 3.0% | | | |
| Hangzhou Robam Appliances Co. Ltd. Class A | | 762,963 | 6,031,984 |
| Midea Group Co. Ltd. Class A | | 2,288,400 | 11,173,938 |
| Nien Made Enterprise Co. Ltd. | | 432,000 | 4,366,741 |
| Sundart Holdings Ltd. | | 20,000,000 | 11,030,617 |
| | | | 32,603,280 |
| Internet & Direct Marketing Retail - 4.7% | | | |
| Ctrip.com International Ltd. ADR (a) | | 99,400 | 5,020,694 |
| JD.com, Inc. sponsored ADR (a) | | 994,300 | 34,870,101 |
| Vipshop Holdings Ltd. ADR (a) | | 758,900 | 10,525,943 |
| | | | 50,416,738 |
| Specialty Retail - 0.5% | | | |
| Chow Tai Fook Jewellery Group Ltd. | | 5,333,800 | 5,856,082 |
| Textiles, Apparel & Luxury Goods - 0.5% | | | |
| JNBY Design Ltd. | | 6,510,000 | 5,197,388 |
|
| TOTAL CONSUMER DISCRETIONARY | | | 140,694,877 |
|
| CONSUMER STAPLES - 5.9% | | | |
| Beverages - 5.0% | | | |
| Jiangsu Yanghe Brewery Joint-Stock Co. Ltd. Class A | | 1,374,789 | 15,954,612 |
| Kweichow Moutai Co. Ltd. (A Shares) | | 314,832 | 18,883,983 |
| Wuliangye Yibin Co. Ltd. Class A | | 2,801,656 | 18,492,108 |
| | | | 53,330,703 |
| Food & Staples Retailing - 0.9% | | | |
| COFCO Meat Holdings Ltd. | | 30,491,000 | 6,624,771 |
| Zhou Hei Ya International Holdings Co. Ltd. | | 3,442,000 | 3,646,285 |
| | | | 10,271,056 |
|
| TOTAL CONSUMER STAPLES | | | 63,601,759 |
|
| ENERGY - 5.1% | | | |
| Energy Equipment & Services - 1.9% | | | |
| China Oilfield Services Ltd. (H Shares) | | 22,508,000 | 20,776,571 |
| Oil, Gas & Consumable Fuels - 3.2% | | | |
| CNOOC Ltd. | | 15,768,000 | 18,394,917 |
| PetroChina Co. Ltd. (H Shares) | | 22,126,000 | 15,545,317 |
| | | | 33,940,234 |
|
| TOTAL ENERGY | | | 54,716,805 |
|
| FINANCIALS - 10.7% | | | |
| Banks - 4.9% | | | |
| China Construction Bank Corp. (H Shares) | | 37,614,000 | 30,561,813 |
| Industrial & Commercial Bank of China Ltd. (H Shares) | | 33,821,000 | 22,088,320 |
| | | | 52,650,133 |
| Capital Markets - 0.7% | | | |
| CITIC Securities Co. Ltd. (H Shares) | | 1,156,000 | 2,425,440 |
| Shanghai International Airport Co. Ltd. (UBS Warrant Programme) warrants 5/11/18 (a)(b) | | 1,119,000 | 5,559,694 |
| | | | 7,985,134 |
| Diversified Financial Services - 0.2% | | | |
| GDS Holdings Ltd. ADR | | 237,800 | 1,921,424 |
| Insurance - 4.9% | | | |
| China Life Insurance Co. Ltd. (H Shares) | | 5,682,000 | 17,286,148 |
| China Pacific Insurance (Group) Co. Ltd. (H Shares) | | 5,009,600 | 18,516,266 |
| Ping An Insurance (Group) Co. of China Ltd. (H Shares) | | 3,041,500 | 17,126,730 |
| | | | 52,929,144 |
|
| TOTAL FINANCIALS | | | 115,485,835 |
|
| HEALTH CARE - 5.1% | | | |
| Health Care Providers & Services - 0.9% | | | |
| China Resources Phoenix Health (c) | | 7,070,000 | 9,080,242 |
| Life Sciences Tools & Services - 0.7% | | | |
| JHL Biotech, Inc. (a) | | 3,976,696 | 7,960,497 |
| Pharmaceuticals - 3.5% | | | |
| China Resources Pharmaceutical Group Ltd. | | 4,485,000 | 5,281,660 |
| CSPC Pharmaceutical Group Ltd. | | 10,938,000 | 15,187,077 |
| Jiangsu Hengrui Medicine Co. Ltd. (A Shares) | | 799,944 | 6,223,398 |
| Tonghua Dongbao Pharmaceutical Co. Ltd. Class A | | 1,163,336 | 3,646,869 |
| Yunnan Baiyao Group Co. Ltd. | | 559,400 | 6,938,232 |
| | | | 37,277,236 |
|
| TOTAL HEALTH CARE | | | 54,317,975 |
|
| INDUSTRIALS - 7.1% | | | |
| Commercial Services & Supplies - 0.2% | | | |
| Focused Photonics Hangzhou, Inc. | | 561,697 | 2,411,871 |
| Construction & Engineering - 4.8% | | | |
| Beijing Urban Consolidated & Development Group Ltd. (H Shares) | | 20,963,000 | 12,774,511 |
| China Communications Construction Co. Ltd. (H Shares) | | 12,960,000 | 17,827,946 |
| China Energy Engineering Corp. Ltd. | | 27,132,000 | 5,057,808 |
| China State Construction International Holdings Ltd. | | 8,562,000 | 15,542,556 |
| | | | 51,202,821 |
| Machinery - 0.7% | | | |
| Sany Heavy Industry Co. Ltd. Class A | | 7,886,277 | 8,042,435 |
| Road & Rail - 0.6% | | | |
| Daqin Railway Co. Ltd. (A Shares) | | 6,192,097 | 7,006,362 |
| Trading Companies & Distributors - 0.8% | | | |
| Summit Ascent Holdings Ltd. (a)(c) | | 31,652,000 | 8,179,179 |
|
| TOTAL INDUSTRIALS | | | 76,842,668 |
|
| INFORMATION TECHNOLOGY - 37.5% | | | |
| Electronic Equipment & Components - 9.0% | | | |
| AVIC Jonhon OptronicTechnology Co. Ltd. | | 1,890,360 | 10,382,103 |
| Chroma ATE, Inc. | | 3,145,000 | 9,823,247 |
| Hangzhou Hikvision Digital Technology Co. Ltd. Class A | | 2,839,100 | 15,061,418 |
| Hon Hai Precision Industry Co. Ltd. (Foxconn) | | 8,856,400 | 28,951,868 |
| Largan Precision Co. Ltd. | | 93,000 | 15,431,790 |
| Lens Technology Co. Ltd. Class A | | 839,047 | 4,473,051 |
| Sunny Optical Technology Group Co. Ltd. | | 606,000 | 4,986,147 |
| Tongda Group Holdings Ltd. | | 20,390,000 | 8,021,418 |
| | | | 97,131,042 |
| Internet Software & Services - 17.6% | | | |
| 58.com, Inc. ADR (a) | | 107,000 | 4,235,060 |
| Alibaba Group Holding Ltd. sponsored ADR (a) | | 534,600 | 61,746,300 |
| NetEase, Inc. ADR | | 92,300 | 24,495,497 |
| Tencent Holdings Ltd. | | 3,151,300 | 98,740,754 |
| Weibo Corp. sponsored ADR (a)(c) | | 9,970 | 556,924 |
| | | | 189,774,535 |
| Semiconductors & Semiconductor Equipment - 8.6% | | | |
| Advanced Semiconductor Engineering, Inc. | | 9,595,000 | 12,004,612 |
| ASM Pacific Technology Ltd. | | 114,400 | 1,703,127 |
| GlobalWafers Co. Ltd. unit (a) | | 738,500 | 5,278,060 |
| Taiwan Semiconductor Manufacturing Co. Ltd. | | 11,388,000 | 73,234,077 |
| | | | 92,219,876 |
| Software - 0.9% | | | |
| China City Railway Transportation Technology Holdings Co. Ltd. (a) | | 48,540,000 | 9,547,809 |
| Technology Hardware, Storage & Peripherals - 1.4% | | | |
| ADLINK Technology, Inc. | | 3,682,844 | 8,079,031 |
| Advantech Co. Ltd. | | 346,000 | 2,793,369 |
| Axiomtek Co. Ltd. | | 2,000,000 | 3,897,694 |
| | | | 14,770,094 |
|
| TOTAL INFORMATION TECHNOLOGY | | | 403,443,356 |
|
| MATERIALS - 7.9% | | | |
| Construction Materials - 3.8% | | | |
| BBMG Corp. (H Shares) | | 33,657,000 | 18,043,633 |
| China Shanshui Cement Group Ltd. (a)(c) | | 6,687,000 | 3,782,653 |
| TCC International Holdings Ltd. | | 13,948,000 | 6,383,729 |
| West China Cement Ltd. (a) | | 85,964,000 | 12,930,490 |
| | | | 41,140,505 |
| Metals & Mining - 4.1% | | | |
| Angang Steel Co. Ltd.: | | | |
| (A Shares) (a) | | 5,819,352 | 4,499,477 |
| (H Shares) (a) | | 10,712,000 | 7,202,525 |
| Baoshan Iron & Steel Co. Ltd. | | 4,184,268 | 3,787,602 |
| Jiangxi Copper Co. Ltd. (H Shares) | | 4,214,000 | 6,576,968 |
| Zhaojin Mining Industry Co. Ltd. (H Shares) (c) | | 12,973,000 | 11,274,561 |
| Zijin Mng Group Co. Ltd. (H Shares) | | 29,330,000 | 10,369,487 |
| | | | 43,710,620 |
|
| TOTAL MATERIALS | | | 84,851,125 |
|
| REAL ESTATE - 1.3% | | | |
| Real Estate Management & Development - 1.3% | | | |
| Beijing Capital Land Ltd. (H Shares) | | 29,448,000 | 14,310,675 |
| TELECOMMUNICATION SERVICES - 0.6% | | | |
| Diversified Telecommunication Services - 0.6% | | | |
| China Unicom Ltd. | | 4,694,000 | 6,074,148 |
| UTILITIES - 2.4% | | | |
| Independent Power and Renewable Electricity Producers - 2.4% | | | |
| Beijing Jingneng Clean Energy Co. Ltd. (H Shares) | | 16,792,000 | 5,094,798 |
| Canvest Environmental Protection Group Co. Ltd. (c) | | 16,700,000 | 9,532,613 |
| Huaneng Renewables Corp. Ltd. (H Shares) | | 31,944,000 | 11,170,451 |
| | | | 25,797,862 |
| TOTAL COMMON STOCKS | | | |
| (Cost $866,816,845) | | | 1,040,137,085 |
|
| Convertible Preferred Stocks - 0.9% | | | |
| CONSUMER DISCRETIONARY - 0.9% | | | |
| Internet & Direct Marketing Retail - 0.9% | | | |
| China Internet Plus Holdings Ltd. Series A-11 (a)(d) | | | |
| (Cost $6,268,244) | | 1,983,088 | 9,498,992 |
|
| Money Market Funds - 2.6% | | | |
| Fidelity Cash Central Fund, 0.85% (e) | | 16,347,759 | 16,351,028 |
| Fidelity Securities Lending Cash Central Fund 0.86% (e)(f) | | 12,013,876 | 12,015,077 |
| TOTAL MONEY MARKET FUNDS | | | |
| (Cost $28,365,111) | | | 28,366,105 |
| TOTAL INVESTMENT PORTFOLIO - 100.2% | | | |
| (Cost $901,450,200) | | | 1,078,002,182 |
| NET OTHER ASSETS (LIABILITIES) - (0.2)% | | | (2,484,062) |
| NET ASSETS - 100% | | | $1,075,518,120 |
Legend
(a) Non-income producing
(b) Security exempt from registration under Rule 144A of the Securities Act of 1933. These securities may be resold in transactions exempt from registration, normally to qualified institutional buyers. At the end of the period, the value of these securities amounted to $5,559,694 or 0.5% of net assets.
(c) Security or a portion of the security is on loan at period end.
(d) Restricted securities - Investment in securities not registered under the Securities Act of 1933 (excluding 144A issues). At the end of the period, the value of restricted securities (excluding 144A issues) amounted to $9,498,992 or 0.9% of net assets.
(e) Affiliated fund that is generally available only to investment companies and other accounts managed by Fidelity Investments. The rate quoted is the annualized seven-day yield of the fund at period end. A complete unaudited listing of the fund's holdings as of its most recent quarter end is available upon request. In addition, each Fidelity Central Fund's financial statements are available on the SEC's website or upon request.
(f) Investment made with cash collateral received from securities on loan.
Additional information on each restricted holding is as follows:
| Security | Acquisition Date | Acquisition Cost |
| China Internet Plus Holdings Ltd. Series A-11 | 1/26/15 | $6,268,244 |
Affiliated Central Funds
Information regarding fiscal year to date income earned by the Fund from investments in Fidelity Central Funds is as follows:
| Fund | Income earned |
| Fidelity Cash Central Fund | $45,639 |
| Fidelity Securities Lending Cash Central Fund | 356,846 |
| Total | $402,485 |
Investment Valuation
The following is a summary of the inputs used, as of April 30, 2017, involving the Fund's assets and liabilities carried at fair value. The inputs or methodology used for valuing securities may not be an indication of the risk associated with investing in those securities. For more information on valuation inputs, and their aggregation into the levels used below, please refer to the Investment Valuation section in the accompanying Notes to Financial Statements.
| | Valuation Inputs at Reporting Date: |
| Description | Total | Level 1 | Level 2 | Level 3 |
| Investments in Securities: | | | | |
| Equities: | | | | |
| Consumer Discretionary | $150,193,869 | $140,694,877 | $-- | $9,498,992 |
| Consumer Staples | 63,601,759 | 63,601,759 | -- | -- |
| Energy | 54,716,805 | 20,776,571 | 33,940,234 | -- |
| Financials | 115,485,835 | 92,639,993 | 22,845,842 | -- |
| Health Care | 54,317,975 | 54,317,975 | -- | -- |
| Industrials | 76,842,668 | 76,842,668 | -- | -- |
| Information Technology | 403,443,356 | 219,463,913 | 183,979,443 | -- |
| Materials | 84,851,125 | 81,068,472 | -- | 3,782,653 |
| Real Estate | 14,310,675 | 14,310,675 | -- | -- |
| Telecommunication Services | 6,074,148 | -- | 6,074,148 | -- |
| Utilities | 25,797,862 | 25,797,862 | -- | -- |
| Money Market Funds | 28,366,105 | 28,366,105 | -- | -- |
| Total Investments in Securities: | $1,078,002,182 | $817,880,870 | $246,839,667 | $13,281,645 |
The following is a summary of transfers between Level 1 and Level 2 for the period ended April 30, 2017. Transfers are assumed to have occurred at the beginning of the period, and are primarily attributable to the valuation techniques used for foreign equity securities, as discussed in the accompanying Notes to Financial Statements:
| Transfers | Total |
| Level 1 to Level 2 | $0 |
| Level 2 to Level 1 | $20,300,707 |
The following is a reconciliation of Investments in Securities for which Level 3 inputs were used in determining value:
| Investments in Securities: | |
| Beginning Balance | $16,032,916 |
| Net Realized Gain (Loss) on Investment Securities | 1,787,345 |
| Net Unrealized Gain (Loss) on Investment Securities | 9,243,798 |
| Cost of Purchases | -- |
| Proceeds of Sales | (13,782,414) |
| Amortization/Accretion | -- |
| Transfers into Level 3 | -- |
| Transfers out of Level 3 | -- |
| Ending Balance | $13,281,645 |
| The change in unrealized gain (loss) for the period attributable to Level 3 securities held at April 30, 2017 | $8,573,262 |
The information used in the above reconciliation represents fiscal year to date activity for any Investments in Securities identified as using Level 3 inputs at either the beginning or the end of the current fiscal period. Transfers in or out of Level 3 represent the beginning value of any Security or Instrument where a change in the pricing level occurred from the beginning to the end of the period. The cost of purchases and the proceeds of sales may include securities received or delivered through corporate actions or exchanges.
See accompanying notes which are an integral part of the financial statements.
Financial Statements
Statement of Assets and Liabilities
| | | April 30, 2017 (Unaudited) |
| Assets | | |
Investment in securities, at value (including securities loaned of $11,259,645) — See accompanying schedule:
Unaffiliated issuers (cost $873,085,089) | $1,049,636,077 | |
| Fidelity Central Funds (cost $28,365,111) | 28,366,105 | |
| Total Investments (cost $901,450,200) | | $1,078,002,182 |
| Receivable for investments sold | | 10,516,603 |
| Receivable for fund shares sold | | 940,931 |
| Distributions receivable from Fidelity Central Funds | | 67,682 |
| Prepaid expenses | | 688 |
| Other receivables | | 172,030 |
| Total assets | | 1,089,700,116 |
| Liabilities | | |
| Payable for investments purchased | $39,390 | |
| Payable for fund shares redeemed | 1,191,973 | |
| Accrued management fee | 613,208 | |
| Distribution and service plan fees payable | 14,781 | |
| Other affiliated payables | 216,843 | |
| Other payables and accrued expenses | 90,881 | |
| Collateral on securities loaned | 12,014,920 | |
| Total liabilities | | 14,181,996 |
| Net Assets | | $1,075,518,120 |
| Net Assets consist of: | | |
| Paid in capital | | $1,095,231,215 |
| Accumulated net investment loss | | (3,761,519) |
| Accumulated undistributed net realized gain (loss) on investments and foreign currency transactions | | (192,502,575) |
| Net unrealized appreciation (depreciation) on investments and assets and liabilities in foreign currencies | | 176,550,999 |
| Net Assets | | $1,075,518,120 |
| Calculation of Maximum Offering Price | | |
| Class A: | | |
| Net Asset Value and redemption price per share ($22,428,998 ÷ 799,149 shares) | | $28.07 |
| Maximum offering price per share (100/94.25 of $28.07) | | $29.78 |
| Class M: | | |
| Net Asset Value and redemption price per share ($6,097,886 ÷ 217,978 shares) | | $27.97 |
| Maximum offering price per share (100/96.50 of $27.97) | | $28.98 |
| Class C: | | |
| Net Asset Value and offering price per share ($9,489,886 ÷ 345,040 shares)(a) | | $27.50 |
| China Region: | | |
| Net Asset Value, offering price and redemption price per share ($1,017,915,078 ÷ 35,883,667 shares) | | $28.37 |
| Class I: | | |
| Net Asset Value, offering price and redemption price per share ($19,586,272 ÷ 694,979 shares) | | $28.18 |
(a) Redemption price per share is equal to net asset value less any applicable contingent deferred sales charge.
See accompanying notes which are an integral part of the financial statements.
Statement of Operations
| | | Six months ended April 30, 2017 (Unaudited) |
| Investment Income | | |
| Dividends | | $313,459 |
| Special dividends | | 468,101 |
| Income from Fidelity Central Funds (including $356,846 from security lending) | | 402,485 |
| Income before foreign taxes withheld | | 1,184,045 |
| Less foreign taxes withheld | | (27,989) |
| Total income | | 1,156,056 |
| Expenses | | |
| Management fee | $3,503,912 | |
| Transfer agent fees | 1,058,887 | |
| Distribution and service plan fees | 88,600 | |
| Accounting and security lending fees | 236,042 | |
| Custodian fees and expenses | 175,869 | |
| Independent trustees' fees and expenses | 2,061 | |
| Registration fees | 62,470 | |
| Audit | 43,344 | |
| Legal | 1,593 | |
| Interest | 5,462 | |
| Miscellaneous | 4,108 | |
| Total expenses before reductions | 5,182,348 | |
| Expense reductions | (265,829) | 4,916,519 |
| Net investment income (loss) | | (3,760,463) |
| Realized and Unrealized Gain (Loss) | | |
| Net realized gain (loss) on: | | |
| Investment securities: | | |
| Unaffiliated issuers | 26,955,277 | |
| Fidelity Central Funds | (3,531) | |
| Foreign currency transactions | (42,611) | |
| Total net realized gain (loss) | | 26,909,135 |
Change in net unrealized appreciation (depreciation) on:
Investment securities | 83,798,219 | |
| Assets and liabilities in foreign currencies | (6,044) | |
| Total change in net unrealized appreciation (depreciation) | | 83,792,175 |
| Net gain (loss) | | 110,701,310 |
| Net increase (decrease) in net assets resulting from operations | | $106,940,847 |
See accompanying notes which are an integral part of the financial statements.
Statement of Changes in Net Assets
| | Six months ended April 30, 2017 (Unaudited) | Year ended October 31, 2016 |
| Increase (Decrease) in Net Assets | | |
| Operations | | |
| Net investment income (loss) | $(3,760,463) | $11,358,761 |
| Net realized gain (loss) | 26,909,135 | (213,446,905) |
| Change in net unrealized appreciation (depreciation) | 83,792,175 | 180,733,105 |
| Net increase (decrease) in net assets resulting from operations | 106,940,847 | (21,355,039) |
| Distributions to shareholders from net investment income | (10,635,218) | (15,103,497) |
| Distributions to shareholders from net realized gain | (1,988,847) | (159,831,115) |
| Total distributions | (12,624,065) | (174,934,612) |
| Share transactions - net increase (decrease) | (82,973,681) | (83,319,865) |
| Redemption fees | 56,550 | 164,633 |
| Total increase (decrease) in net assets | 11,399,651 | (279,444,883) |
| Net Assets | | |
| Beginning of period | 1,064,118,469 | 1,343,563,352 |
| End of period | $1,075,518,120 | $1,064,118,469 |
| Other Information | | |
| Undistributed net investment income end of period | $– | $10,634,162 |
| Accumulated net investment loss end of period | $(3,761,519) | $– |
See accompanying notes which are an integral part of the financial statements.
Financial Highlights — Fidelity China Region Fund Class A
| | Six months ended (Unaudited) April 30, | Years ended October 31, | | | | |
| | 2017 | 2016 | 2015 | 2014 | 2013 | 2012 |
| Selected Per–Share Data | | | | | | |
| Net asset value, beginning of period | $25.46 | $29.34 | $34.18 | $35.56 | $28.53 | $27.28 |
| Income from Investment Operations | | | | | | |
| Net investment income (loss)A | (.13)B | .18 | .40C | .21 | .30 | .36 |
| Net realized and unrealized gain (loss) | 2.97 | (.20) | (.83) | 2.01D | 7.06 | 1.42 |
| Total from investment operations | 2.84 | (.02) | (.43) | 2.22 | 7.36 | 1.78 |
| Distributions from net investment income | (.18) | (.27) | (.22) | (.30) | (.34) | (.19) |
| Distributions from net realized gain | (.05) | (3.59) | (4.24) | (3.31) | – | (.34) |
| Total distributions | (.23) | (3.86) | (4.46) | (3.61) | (.34) | (.53) |
| Redemption fees added to paid in capitalA | –E | –E | .05 | .01 | .01 | –E |
| Net asset value, end of period | $28.07 | $25.46 | $29.34 | $34.18 | $35.56 | $28.53 |
| Total ReturnF,G,H | 11.29% | (.13)% | (1.45)% | 6.45%D | 26.07% | 6.70% |
| Ratios to Average Net AssetsI,J | | | | | | |
| Expenses before reductions | 1.32%K | 1.33% | 1.28% | 1.35% | 1.35% | 1.36% |
| Expenses net of fee waivers, if any | 1.32%K | 1.33% | 1.28% | 1.35% | 1.35% | 1.36% |
| Expenses net of all reductions | 1.27%K | 1.32% | 1.26% | 1.35% | 1.31% | 1.29% |
| Net investment income (loss) | (1.04)%B,K | .75% | 1.26%C | .64% | .94% | 1.35% |
| Supplemental Data | | | | | | |
| Net assets, end of period (000 omitted) | $22,429 | $22,937 | $32,761 | $21,728 | $20,623 | $13,539 |
| Portfolio turnover rateL | 82%K | 70% | 151% | 87% | 92% | 107% |
A Calculated based on average shares outstanding during the period.
B Net Investment income per share reflects a large, non-recurring dividend which amounted to $.01 per share. Excluding this non-recurring dividend, the ratio of net investment income (loss) to average net assets would have been (1.13) %.
C Net Investment income per share reflects a large, non-recurring dividend which amounted to $.13 per share. Excluding this non-recurring dividend, the ratio of net investment income (loss) to average net assets would have been .85%.
D Amount includes a reimbursement from the adviser for an operations error which amounted to $.01 per share. Excluding this reimbursement, the total return would have been 6.42%.
E Amount represents less than $.005 per share.
F Total returns for periods of less than one year are not annualized.
G Total returns would have been lower if certain expenses had not been reduced during the applicable periods shown.
H Total returns do not include the effect of the sales charges.
I Fees and expenses of any underlying Fidelity Central Funds are not included in the Fund's expense ratio. The Fund indirectly bears its proportionate share of the expenses of any underlying Fidelity Central Funds.
J Expense ratios reflect operating expenses of the class. Expenses before reductions do not reflect amounts reimbursed by the investment adviser or reductions from brokerage service arrangements or reductions from other expense offset arrangements and do not represent the amount paid by the class during periods when reimbursements or reductions occur. Expenses net of fee waivers reflect expenses after reimbursement by the investment adviser but prior to reductions from brokerage service arrangements or other expense offset arrangements. Expenses net of all reductions represent the net expenses paid by the class.
K Annualized
L Amount does not include the portfolio activity of any underlying Fidelity Central Funds.
See accompanying notes which are an integral part of the financial statements.
Financial Highlights — Fidelity China Region Fund Class M
| | Six months ended (Unaudited) April 30, | Years ended October 31, | | | | |
| | 2017 | 2016 | 2015 | 2014 | 2013 | 2012 |
| Selected Per–Share Data | | | | | | |
| Net asset value, beginning of period | $25.34 | $29.18 | $34.02 | $35.40 | $28.40 | $27.13 |
| Income from Investment Operations | | | | | | |
| Net investment income (loss)A | (.18)B | .10 | .30C | .12 | .21 | .29 |
| Net realized and unrealized gain (loss) | 2.97 | (.22) | (.83) | 1.99D | 7.04 | 1.40 |
| Total from investment operations | 2.79 | (.12) | (.53) | 2.11 | 7.25 | 1.69 |
| Distributions from net investment income | (.11) | (.13) | (.12) | (.19) | (.26) | (.08) |
| Distributions from net realized gain | (.05) | (3.59) | (4.24) | (3.31) | – | (.34) |
| Total distributions | (.16) | (3.72) | (4.36) | (3.50) | (.26) | (.42) |
| Redemption fees added to paid in capitalA | –E | –E | .05 | .01 | .01 | –E |
| Net asset value, end of period | $27.97 | $25.34 | $29.18 | $34.02 | $35.40 | $28.40 |
| Total ReturnF,G,H | 11.10% | (.50)% | (1.79)% | 6.15%D | 25.74% | 6.38% |
| Ratios to Average Net AssetsI,J | | | | | | |
| Expenses before reductions | 1.66%K | 1.67% | 1.62% | 1.65% | 1.64% | 1.64% |
| Expenses net of fee waivers, if any | 1.66%K | 1.67% | 1.62% | 1.65% | 1.64% | 1.64% |
| Expenses net of all reductions | 1.61%K | 1.67% | 1.60% | 1.65% | 1.60% | 1.57% |
| Net investment income (loss) | (1.38)%B,K | .40% | .92%C | .35% | .65% | 1.06% |
| Supplemental Data | | | | | | |
| Net assets, end of period (000 omitted) | $6,098 | $5,644 | $6,409 | $6,305 | $5,965 | $4,349 |
| Portfolio turnover rateL | 82%K | 70% | 151% | 87% | 92% | 107% |
A Calculated based on average shares outstanding during the period.
B Net Investment income per share reflects a large, non-recurring dividend which amounted to $.01 per share. Excluding this non-recurring dividend, the ratio of net investment income (loss) to average net assets would have been (1.47) %.
C Net Investment income per share reflects a large, non-recurring dividend which amounted to $.13 per share. Excluding this non-recurring dividend, the ratio of net investment income (loss) to average net assets would have been .51%.
D Amount includes a reimbursement from the adviser for an operations error which amounted to $.01 per share. Excluding this reimbursement, the total return would have been 6.12%.
E Amount represents less than $.005 per share.
F Total returns for periods of less than one year are not annualized.
G Total returns would have been lower if certain expenses had not been reduced during the applicable periods shown.
H Total returns do not include the effect of the sales charges.
I Fees and expenses of any underlying Fidelity Central Funds are not included in the Fund's expense ratio. The Fund indirectly bears its proportionate share of the expenses of any underlying Fidelity Central Funds.
J Expense ratios reflect operating expenses of the class. Expenses before reductions do not reflect amounts reimbursed by the investment adviser or reductions from brokerage service arrangements or reductions from other expense offset arrangements and do not represent the amount paid by the class during periods when reimbursements or reductions occur. Expenses net of fee waivers reflect expenses after reimbursement by the investment adviser but prior to reductions from brokerage service arrangements or other expense offset arrangements. Expenses net of all reductions represent the net expenses paid by the class.
K Annualized
L Amount does not include the portfolio activity of any underlying Fidelity Central Funds.
See accompanying notes which are an integral part of the financial statements.
Financial Highlights — Fidelity China Region Fund Class C
| | Six months ended (Unaudited) April 30, | Years ended October 31, | | | | |
| | 2017 | 2016 | 2015 | 2014 | 2013 | 2012 |
| Selected Per–Share Data | | | | | | |
| Net asset value, beginning of period | $24.82 | $28.68 | $33.56 | $34.99 | $28.07 | $26.86 |
| Income from Investment Operations | | | | | | |
| Net investment income (loss)A | (.22)B | –C | .15D | (.02) | .06 | .16 |
| Net realized and unrealized gain (loss) | 2.92 | (.21) | (.80) | 1.97E | 6.97 | 1.39 |
| Total from investment operations | 2.70 | (.21) | (.65) | 1.95 | 7.03 | 1.55 |
| Distributions from net investment income | – | (.06) | (.04) | (.08) | (.12) | – |
| Distributions from net realized gain | (.02) | (3.59) | (4.24) | (3.31) | – | (.34) |
| Total distributions | (.02) | (3.65) | (4.28) | (3.39) | (.12) | (.34) |
| Redemption fees added to paid in capitalA | –C | –C | .05 | .01 | .01 | –C |
| Net asset value, end of period | $27.50 | $24.82 | $28.68 | $33.56 | $34.99 | $28.07 |
| Total ReturnF,G,H | 10.88% | (.88)% | (2.21)% | 5.71%E | 25.14% | 5.88% |
| Ratios to Average Net AssetsI,J | | | | | | |
| Expenses before reductions | 2.05%K | 2.07% | 2.05% | 2.07% | 2.10% | 2.11% |
| Expenses net of fee waivers, if any | 2.05%K | 2.07% | 2.05% | 2.07% | 2.10% | 2.11% |
| Expenses net of all reductions | 2.00%K | 2.06% | 2.02% | 2.07% | 2.07% | 2.04% |
| Net investment income (loss) | (1.77)%B,K | .01% | .49%D | (.07)% | .19% | .59% |
| Supplemental Data | | | | | | |
| Net assets, end of period (000 omitted) | $9,490 | $11,218 | $14,355 | $10,445 | $6,957 | $4,515 |
| Portfolio turnover rateL | 82%K | 70% | 151% | 87% | 92% | 107% |
A Calculated based on average shares outstanding during the period.
B Net Investment income per share reflects a large, non-recurring dividend which amounted to $.01 per share. Excluding this non-recurring dividend, the ratio of net investment income (loss) to average net assets would have been (1.86) %.
C Amount represents less than $.005 per share.
D Net Investment income per share reflects a large, non-recurring dividend which amounted to $.13 per share. Excluding this non-recurring dividend, the ratio of net investment income (loss) to average net assets would have been .09%.
E Amount includes a reimbursement from the adviser for an operations error which amounted to $.01 per share. Excluding this reimbursement, the total return would have been 5.68%.
F Total returns for periods of less than one year are not annualized.
G Total returns would have been lower if certain expenses had not been reduced during the applicable periods shown.
H Total returns do not include the effect of the contingent deferred sales charge.
I Fees and expenses of any underlying Fidelity Central Funds are not included in the Fund's expense ratio. The Fund indirectly bears its proportionate share of the expenses of any underlying Fidelity Central Funds.
J Expense ratios reflect operating expenses of the class. Expenses before reductions do not reflect amounts reimbursed by the investment adviser or reductions from brokerage service arrangements or reductions from other expense offset arrangements and do not represent the amount paid by the class during periods when reimbursements or reductions occur. Expenses net of fee waivers reflect expenses after reimbursement by the investment adviser but prior to reductions from brokerage service arrangements or other expense offset arrangements. Expenses net of all reductions represent the net expenses paid by the class.
K Annualized
L Amount does not include the portfolio activity of any underlying Fidelity Central Funds.
See accompanying notes which are an integral part of the financial statements.
Financial Highlights — Fidelity China Region Fund
| | Six months ended (Unaudited) April 30, | Years ended October 31, | | | | |
| | 2017 | 2016 | 2015 | 2014 | 2013 | 2012 |
| Selected Per–Share Data | | | | | | |
| Net asset value, beginning of period | $25.78 | $29.66 | $34.51 | $35.83 | $28.73 | $27.49 |
| Income from Investment Operations | | | | | | |
| Net investment income (loss)A | (.09)B | .26 | .51C | .33 | .41 | .45 |
| Net realized and unrealized gain (loss) | 3.00 | (.21) | (.84) | 2.03D | 7.11 | 1.42 |
| Total from investment operations | 2.91 | .05 | (.33) | 2.36 | 7.52 | 1.87 |
| Distributions from net investment income | (.27) | (.35) | (.33) | (.38) | (.43) | (.29) |
| Distributions from net realized gain | (.05) | (3.59) | (4.24) | (3.31) | – | (.34) |
| Total distributions | (.32) | (3.93)E | (4.57) | (3.69) | (.43) | (.63) |
| Redemption fees added to paid in capitalA | –F | –F | .05 | .01 | .01 | –F |
| Net asset value, end of period | $28.37 | $25.78 | $29.66 | $34.51 | $35.83 | $28.73 |
| Total ReturnG,H | 11.47% | .15% | (1.14)% | 6.83%D | 26.51% | 7.01% |
| Ratios to Average Net AssetsI,J | | | | | | |
| Expenses before reductions | 1.01%K | 1.02% | .99% | 1.01% | 1.02% | 1.04% |
| Expenses net of fee waivers, if any | 1.01%K | 1.02% | .98% | 1.01% | 1.02% | 1.04% |
| Expenses net of all reductions | .96%K | 1.01% | .96% | 1.01% | .98% | .98% |
| Net investment income (loss) | (.73)%B,K | 1.06% | 1.55%C | .99% | 1.27% | 1.66% |
| Supplemental Data | | | | | | |
| Net assets, end of period (000 omitted) | $1,017,915 | $1,004,985 | $1,262,274 | $1,352,761 | $1,425,828 | $1,265,488 |
| Portfolio turnover rateL | 82%K | 70% | 151% | 87% | 92% | 107% |
A Calculated based on average shares outstanding during the period.
B Net Investment income per share reflects a large, non-recurring dividend which amounted to $.01 per share. Excluding this non-recurring dividend, the ratio of net investment income (loss) to average net assets would have been (.82) %.
C Net Investment income per share reflects a large, non-recurring dividend which amounted to $.13 per share. Excluding this non-recurring dividend, the ratio of net investment income (loss) to average net assets would have been 1.15%.
D Amount includes a reimbursement from the adviser for an operations error which amounted to $.01 per share. Excluding this reimbursement, the total return would have been 6.80%.
E Total distributions of $3.93 per share is comprised of distributions from net investment income of $.345 and distributions from net realized gain of $3.588 per share.
F Amount represents less than $.005 per share.
G Total returns for periods of less than one year are not annualized.
H Total returns would have been lower if certain expenses had not been reduced during the applicable periods shown.
I Fees and expenses of any underlying Fidelity Central Funds are not included in the Fund's expense ratio. The Fund indirectly bears its proportionate share of the expenses of any underlying Fidelity Central Funds.
J Expense ratios reflect operating expenses of the class. Expenses before reductions do not reflect amounts reimbursed by the investment adviser or reductions from brokerage service arrangements or reductions from other expense offset arrangements and do not represent the amount paid by the class during periods when reimbursements or reductions occur. Expenses net of fee waivers reflect expenses after reimbursement by the investment adviser but prior to reductions from brokerage service arrangements or other expense offset arrangements. Expenses net of all reductions represent the net expenses paid by the class.
K Annualized
L Amount does not include the portfolio activity of any underlying Fidelity Central Funds.
See accompanying notes which are an integral part of the financial statements.
Financial Highlights — Fidelity China Region Fund Class I
| | Six months ended (Unaudited) April 30, | Years ended October 31, | | | | |
| | 2017 | 2016 | 2015 | 2014 | 2013 | 2012 |
| Selected Per–Share Data | | | | | | |
| Net asset value, beginning of period | $25.62 | $29.51 | $34.39 | $35.75 | $28.68 | $27.46 |
| Income from Investment Operations | | | | | | |
| Net investment income (loss)A | (.09)B | .26 | .51C | .34 | .42 | .45 |
| Net realized and unrealized gain (loss) | 2.98 | (.20) | (.84) | 2.02D | 7.10 | 1.42 |
| Total from investment operations | 2.89 | .06 | (.33) | 2.36 | 7.52 | 1.87 |
| Distributions from net investment income | (.28) | (.36) | (.36) | (.43) | (.46) | (.31) |
| Distributions from net realized gain | (.05) | (3.59) | (4.24) | (3.31) | – | (.34) |
| Total distributions | (.33) | (3.95) | (4.60) | (3.73)E | (.46) | (.65) |
| Redemption fees added to paid in capitalA | –F | –F | .05 | .01 | .01 | –F |
| Net asset value, end of period | $28.18 | $25.62 | $29.51 | $34.39 | $35.75 | $28.68 |
| Total ReturnG,H | 11.47% | .16% | (1.14)% | 6.87%D | 26.58% | 7.02% |
| Ratios to Average Net AssetsI,J | | | | | | |
| Expenses before reductions | 1.01%K | 1.00% | .97% | .98% | .97% | 1.04% |
| Expenses net of fee waivers, if any | 1.01%K | 1.00% | .97% | .98% | .97% | 1.04% |
| Expenses net of all reductions | .95%K | .99% | .95% | .98% | .93% | .98% |
| Net investment income (loss) | (.72)%B,K | 1.07% | 1.57%C | 1.01% | 1.32% | 1.66% |
| Supplemental Data | | | | | | |
| Net assets, end of period (000 omitted) | $19,586 | $19,334 | $26,961 | $19,404 | $10,206 | $1,958 |
| Portfolio turnover rateL | 82%K | 70% | 151% | 87% | 92% | 107% |
A Calculated based on average shares outstanding during the period.
B Net Investment income per share reflects a large, non-recurring dividend which amounted to $.01 per share. Excluding this non-recurring dividend, the ratio of net investment income (loss) to average net assets would have been (.82) %.
C Net Investment income per share reflects a large, non-recurring dividend which amounted to $.13 per share. Excluding this non-recurring dividend, the ratio of net investment income (loss) to average net assets would have been 1.16%.
D Amount includes a reimbursement from the adviser for an operations error which amounted to $.01 per share. Excluding this reimbursement, the total return would have been 6.84%.
E Total distributions of $3.73 per share is comprised of distributions from net investment income of $.425 and distributions from net realized gain of $3.306 per share.
F Amount represents less than $.005 per share.
G Total returns for periods of less than one year are not annualized.
H Total returns would have been lower if certain expenses had not been reduced during the applicable periods shown.
I Fees and expenses of any underlying Fidelity Central Funds are not included in the Fund's expense ratio. The Fund indirectly bears its proportionate share of the expenses of any underlying Fidelity Central Funds.
J Expense ratios reflect operating expenses of the class. Expenses before reductions do not reflect amounts reimbursed by the investment adviser or reductions from brokerage service arrangements or reductions from other expense offset arrangements and do not represent the amount paid by the class during periods when reimbursements or reductions occur. Expenses net of fee waivers reflect expenses after reimbursement by the investment adviser but prior to reductions from brokerage service arrangements or other expense offset arrangements. Expenses net of all reductions represent the net expenses paid by the class.
K Annualized
L Amount does not include the portfolio activity of any underlying Fidelity Central Funds.
See accompanying notes which are an integral part of the financial statements.
Notes to Financial Statements (Unaudited)
For the period ended April 30, 2017
1. Organization.
Fidelity China Region Fund (the Fund) is a fund of Fidelity Investment Trust (the Trust) and is authorized to issue an unlimited number of shares. The Trust is registered under the Investment Company Act of 1940, as amended (the 1940 Act), as an open-end management investment company organized as a Massachusetts business trust. The Fund offers Class A, Class M (formerly Class T), Class C, China Region and Class I shares, each of which has equal rights as to assets and voting privileges. Each class has exclusive voting rights with respect to matters that affect that class. The Fund's investments in emerging markets can be subject to social, economic, regulatory, and political uncertainties and can be extremely volatile.
After the close of business on June 24, 2016, all outstanding Class B shares were converted to Class A shares. All prior fiscal period dollar and share amounts for Class B presented in the Notes to Financial Statements are for the period November 1, 2015 through June 24, 2016.
2. Investments in Fidelity Central Funds.
The Fund invests in Fidelity Central Funds, which are open-end investment companies generally available only to other investment companies and accounts managed by the investment adviser and its affiliates. The Fund's Schedule of Investments lists each of the Fidelity Central Funds held as of period end, if any, as an investment of the Fund, but does not include the underlying holdings of each Fidelity Central Fund. As an Investing Fund, the Fund indirectly bears its proportionate share of the expenses of the underlying Fidelity Central Funds.
The Money Market Central Funds seek preservation of capital and current income and are managed by Fidelity Investments Money Management, Inc. (FIMM), an affiliate of the investment adviser. Annualized expenses of the Money Market Central Funds as of their most recent shareholder report date are less than .005%.
A complete unaudited list of holdings for each Fidelity Central Fund is available upon request or at the Securities and Exchange Commission (the SEC) website at www.sec.gov. In addition, the financial statements of the Fidelity Central Funds are available on the SEC website or upon request.
3. Significant Accounting Policies.
The Fund is an investment company and applies the accounting and reporting guidance of the Financial Accounting Standards Board (FASB) Accounting Standards Codification Topic 946 Financial Services – Investments Companies. The financial statements have been prepared in conformity with accounting principles generally accepted in the United States of America (GAAP), which require management to make certain estimates and assumptions at the date of the financial statements. Actual results could differ from those estimates. Subsequent events, if any, through the date that the financial statements were issued have been evaluated in the preparation of the financial statements. The following summarizes the significant accounting policies of the Fund:
Investment Valuation. Investments are valued as of 4:00 p.m. Eastern time on the last calendar day of the period. The Board of Trustees (the Board) has delegated the day to day responsibility for the valuation of the Fund's investments to the Fair Value Committee (the Committee) established by the Fund's investment adviser. In accordance with valuation policies and procedures approved by the Board, the Fund attempts to obtain prices from one or more third party pricing vendors or brokers to value its investments. When current market prices, quotations or currency exchange rates are not readily available or reliable, investments will be fair valued in good faith by the Committee, in accordance with procedures adopted by the Board. Factors used in determining fair value vary by investment type and may include market or investment specific events. The frequency with which these procedures are used cannot be predicted and they may be utilized to a significant extent. The Committee oversees the Fund's valuation policies and procedures and reports to the Board on the Committee's activities and fair value determinations. The Board monitors the appropriateness of the procedures used in valuing the Fund's investments and ratifies the fair value determinations of the Committee.
The Fund categorizes the inputs to valuation techniques used to value its investments into a disclosure hierarchy consisting of three levels as shown below:
- Level 1 – quoted prices in active markets for identical investments
- Level 2 – other significant observable inputs (including quoted prices for similar investments, interest rates, prepayment speeds, etc.)
- Level 3 – unobservable inputs (including the Fund's own assumptions based on the best information available)
Valuation techniques used to value the Fund's investments by major category are as follows:
Equity securities, including restricted securities, for which market quotations are readily available, are valued at the last reported sale price or official closing price as reported by a third party pricing vendor on the primary market or exchange on which they are traded and are categorized as Level 1 in the hierarchy. In the event there were no sales during the day or closing prices are not available, securities are valued at the last quoted bid price or may be valued using the last available price and are generally categorized as Level 2 in the hierarchy. For foreign equity securities, when market or security specific events arise, comparisons to the valuation of American Depositary Receipts (ADRs), futures contracts, Exchange-Traded Funds (ETFs) and certain indexes as well as quoted prices for similar securities may be used and would be categorized as Level 2 in the hierarchy. Utilizing these techniques may result in transfers between Level 1 and Level 2. For equity securities, including restricted securities, where observable inputs are limited, assumptions about market activity and risk are used and these securities may be categorized as Level 3 in the hierarchy. Equity securities, including restricted securities, for which observable inputs are not available are valued using alternate valuation approaches, including the market approach and the income approach and are categorized as Level 3 in the hierarchy. The market approach generally consists of using comparable market transactions while the income approach generally consists of using the net present value of estimated future cash flows, adjusted as appropriate for liquidity, credit, market and/or other risk factors.
Investments in open-end mutual funds , including the Fidelity Central Funds, are valued at their closing net asset value (NAV) each business day and are categorized as Level 1 in the hierarchy.
The following provides information on Level 3 securities held by the Fund that were valued at period end based on unobservable inputs. These amounts exclude valuations provided by a broker.
| Asset Type | Fair Value | Valuation Technique(s) | Unobservable Input | Amount or Range/Weighted Average | Impact to Valuation from an Increase in Input(a) |
| Equities | $13,281,645 | Market comparable | Enterprise value/Gross profit multiple (EV/GP) | 12.5 | Increase |
| | | | Discount rate | 2.3% | Decrease |
| | | | Discount for lack of marketability | 15.0% | Decrease |
| | | Market approach | Transaction price | $0.57 | Increase |
(a) Represents the expected directional change in the fair value of the Level 3 investments that would result from an increase in the corresponding input. A decrease to the unobservable input would have the opposite effect. Significant changes in these inputs could result in significantly higher or lower fair value measurements.
Changes in valuation techniques may result in transfers in or out of an assigned level within the disclosure hierarchy. The aggregate value of investments by input level as of April 30, 2017, including information on transfers between Levels 1 and 2, as well as a roll forward of Level 3 investments, is included at the end of the Fund's Schedule of Investments.
Foreign Currency. The Fund may use foreign currency contracts to facilitate transactions in foreign-denominated securities. Gains and losses from these transactions may arise from changes in the value of the foreign currency or if the counterparties do not perform under the contracts' terms.
Foreign-denominated assets, including investment securities, and liabilities are translated into U.S. dollars at the exchange rates at period end. Purchases and sales of investment securities, income and dividends received and expenses denominated in foreign currencies are translated into U.S. dollars at the exchange rate in effect on the transaction date.
The effects of exchange rate fluctuations on investments are included with the net realized and unrealized gain (loss) on investment securities. Other foreign currency transactions resulting in realized and unrealized gain (loss) are disclosed separately.
Investment Transactions and Income. For financial reporting purposes, the Fund's investment holdings and NAV include trades executed through the end of the last business day of the period. The NAV per share for processing shareholder transactions is calculated as of the close of business of the New York Stock Exchange (NYSE), normally 4:00 p.m. Eastern time and includes trades executed through the end of the prior business day. Gains and losses on securities sold are determined on the basis of identified cost. Dividend income is recorded on the ex-dividend date, except for certain dividends from foreign securities where the ex-dividend date may have passed, which are recorded as soon as the Fund is informed of the ex-dividend date. Non-cash dividends included in dividend income, if any, are recorded at the fair market value of the securities received. Income and capital gain distributions from Fidelity Central Funds, if any, are recorded on the ex-dividend date. Investment income is recorded net of foreign taxes withheld where recovery of such taxes is uncertain.
Class Allocations and Expenses. Investment income, realized and unrealized capital gains and losses, common expenses of the Fund, and certain fund-level expense reductions, if any, are allocated daily on a pro-rata basis to each class based on the relative net assets of each class to the total net assets of the Fund. Each class differs with respect to transfer agent and distribution and service plan fees incurred. Certain expense reductions may also differ by class. For the reporting period, the allocated portion of income and expenses to each class as a percent of its average net assets may vary due to the timing of recording these transactions in relation to fluctuating net assets of the classes. Expenses directly attributable to a fund are charged to that fund. Expenses attributable to more than one fund are allocated among the respective funds on the basis of relative net assets or other appropriate methods. Expense estimates are accrued in the period to which they relate and adjustments are made when actual amounts are known.
Income Tax Information and Distributions to Shareholders. Each year, the Fund intends to qualify as a regulated investment company under Subchapter M of the Internal Revenue Code, including distributing substantially all of its taxable income and realized gains. As a result, no provision for U.S. Federal income taxes is required. The Fund files a U.S. federal tax return, in addition to state and local tax returns as required. The Fund's federal income tax returns are subject to examination by the Internal Revenue Service (IRS) for a period of three fiscal years after they are filed. State and local tax returns may be subject to examination for an additional fiscal year depending on the jurisdiction. Foreign taxes are provided for based on the Fund's understanding of the tax rules and rates that exist in the foreign markets in which it invests.
Distributions are declared and recorded on the ex-dividend date. Income dividends and capital gain distributions are declared separately for each class. Income and capital gain distributions are determined in accordance with income tax regulations, which may differ from GAAP.
Capital accounts within the financial statements are adjusted for permanent book-tax differences. These adjustments have no impact on net assets or the results of operations. Capital accounts are not adjusted for temporary book-tax differences which will reverse in a subsequent period.
Book-tax differences are primarily due to foreign currency transactions, certain foreign taxes, passive foreign investment companies (PFIC), deferred trustees compensation, capital loss carryfowards and losses deferred due to wash sales.
The federal tax cost of investment securities and unrealized appreciation (depreciation) as of period end were as follows:
| Gross unrealized appreciation | $209,666,123 |
| Gross unrealized depreciation | (34,744,290) |
| Net unrealized appreciation (depreciation) on securities | $174,921,833 |
| Tax cost | $903,080,349 |
Capital loss carryforwards are only available to offset future capital gains of the Fund to the extent provided by regulations and may be limited. Under the Regulated Investment Company Modernization Act of 2010 (the Act), the Fund is permitted to carry forward capital losses incurred in taxable years beginning after December 22, 2010 for an unlimited period and such capital losses are required to be used prior to any losses that expire. The capital loss carryforward information presented below, including any applicable limitation, is estimated as of prior fiscal period end and is subject to adjustment.
| No expiration | |
| Short-term | $(180,168,755) |
| Long-term | (33,286,830) |
| Total capital loss carryforward | $(213,455,585) |
Short-Term Trading (Redemption) Fees. Shares held by investors in the Fund less than 90 days may have been subject to a redemption fee equal to 1.50% of the NAV of shares redeemed. All redemption fees, which reduce the proceeds of the shareholder redemption, are retained by the Fund and accounted for as an addition to paid in capital.
Restricted Securities. The Fund may invest in securities that are subject to legal or contractual restrictions on resale. These securities generally may be resold in transactions exempt from registration or to the public if the securities are registered. Disposal of these securities may involve time-consuming negotiations and expense, and prompt sale at an acceptable price may be difficult. Information regarding restricted securities is included at the end of the Fund's Schedule of Investments.
4. Purchases and Sales of Investments.
Purchases and sales of securities, other than short-term securities, aggregated $407,613,724 and $459,637,020, respectively.
5. Fees and Other Transactions with Affiliates.
Management Fee. Fidelity Management & Research Company (the investment adviser) and its affiliates provide the Fund with investment management related services for which the Fund pays a monthly management fee. The management fee is the sum of an individual fund fee rate that is based on an annual rate of .45% of the Fund's average net assets and an annualized group fee rate that averaged .25% during the period. The group fee rate is based upon the average net assets of all the mutual funds advised by the investment adviser, including any mutual funds previously advised by the investment adviser that are currently advised by Fidelity SelectCo, LLC, an affiliate of the investment adviser. The group fee rate decreases as assets under management increase and increases as assets under management decrease. For the reporting period, the total annualized management fee rate was .70% of the Fund's average net assets.
Distribution and Service Plan Fees. In accordance with Rule 12b-1 of the 1940 Act, the Fund has adopted separate Distribution and Service Plans for each class of shares. Certain classes pay Fidelity Distributors Corporation (FDC), an affiliate of the investment adviser, separate Distribution and Service Fees, each of which is based on an annual percentage of each class' average net assets. In addition, FDC may pay financial intermediaries for selling shares of the Fund and providing shareholder support services. For the period, the Distribution and Service Fee rates, total fees and amounts retained by FDC were as follows:
| | Distribution
Fee | Service
Fee | Total Fees | Retained
by FDC |
| Class A | -% | .25% | $26,646 | $36 |
| Class M | .25% | .25% | 14,058 | 283 |
| Class C | .75% | .25% | 47,896 | 4,066 |
| | | | $88,600 | $4,385 |
Sales Load. FDC may receive a front-end sales charge of up to 5.75% for selling Class A shares and 3.50% for selling Class M shares, some of which is paid to financial intermediaries for selling shares of the Fund. Depending on the holding period, FDC may receive contingent deferred sales charges levied on Class A, Class M, and Class C redemptions. The deferred sales charges are 1.00% for Class C shares, 1.00% for certain purchases of Class A shares and .25% for certain purchases of Class M shares.
For the period, sales charge amounts retained by FDC were as follows:
| | Retained
by FDC |
| Class A | $3,736 |
| Class M | 1,270 |
| Class C(a) | 1,354 |
| | $6,360 |
(a) When Class C shares are initially sold, FDC pays commissions from its own resources to financial intermediaries through which the sales are made.
Transfer Agent Fees. Fidelity Investments Institutional Operations Company, Inc., (FIIOC), an affiliate of the investment adviser, is the transfer, dividend disbursing and shareholder servicing agent for each class of the Fund. FIIOC receives account fees and asset-based fees that vary according to the account size and type of account of the shareholders of the respective classes of the Fund. FIIOC pays for typesetting, printing and mailing of shareholder reports, except proxy statements.
For the period, transfer agent fees for each class were as follows:
| | Amount | % of
Class-Level Average
Net Assets(a) |
| Class A | $28,877 | .27 |
| Class M | 10,187 | .36 |
| Class C | 11,957 | .25 |
| China Region | 988,218 | .21 |
| Class I | 19,648 | .20 |
| | $1,058,887 | |
(a) Annualized
Accounting and Security Lending Fees. Fidelity Service Company, Inc. (FSC), an affiliate of the investment adviser, maintains the Fund's accounting records. The accounting fee is based on the level of average net assets for each month. Under a separate contract, FSC administers the security lending program. The security lending fee is based on the number and duration of lending transactions.
Brokerage Commissions. The Fund placed a portion of its portfolio transactions with brokerage firms which are affiliates of the investment adviser. Brokerage commissions are included in net realized gain (loss) and change in net unrealized appreciation (depreciation) in the Statement of Operations. The commissions paid to these affiliated firms were $1,011 for the period.
Interfund Lending Program. Pursuant to an Exemptive Order issued by the SEC, the Fund, along with other registered investment companies having management contracts with FMR or other affiliated entities of FMR, may participate in an interfund lending program. This program provides an alternative credit facility allowing the funds to borrow from, or lend money to, other participating affiliated funds. At period end, there were no interfund loans outstanding. The Fund's activity in this program during the period for which loans were outstanding was as follows:
| Borrower or Lender | Average Loan Balance | Weighted Average Interest Rate | Interest Expense |
| Borrower | $12,213,000 | .71% | $5,088 |
Interfund Trades. The Fund may purchase from or sell securities to other Fidelity Funds under procedures adopted by the Board. The procedures have been designed to ensure these interfund trades are executed in accordance with Rule 17a-7 of the 1940 Act. Interfund trades are included within the respective purchases and sales amounts shown in the Purchases and Sales of Investments note.
6. Committed Line of Credit.
The Fund participates with other funds managed by the investment adviser or an affiliate in a $4.25 billion credit facility (the "line of credit") to be utilized for temporary or emergency purposes to fund shareholder redemptions or for other short-term liquidity purposes. The Fund has agreed to pay commitment fees on its pro-rata portion of the line of credit, which amounted to $1,712 and is reflected in Miscellaneous expenses on the Statement of Operations. During the period, the Fund did not borrow on this line of credit.
7. Security Lending.
The Fund lends portfolio securities through a lending agent from time to time in order to earn additional income. For equity securities, a lending agent is used and may loan securities to certain qualified borrowers, including Fidelity Capital Markets (FCM), a broker-dealer affiliated with the Fund. On the settlement date of the loan, the Fund receives collateral (in the form of U.S. Treasury obligations, letters of credit and/or cash) against the loaned securities and maintains collateral in an amount not less than 100% of the market value of the loaned securities during the period of the loan. The market value of the loaned securities is determined at the close of business of the Fund and any additional required collateral is delivered to the Fund on the next business day. The Fund or borrower may terminate the loan at any time, and if the borrower defaults on its obligation to return the securities loaned because of insolvency or other reasons, the Fund may apply collateral received from the borrower against the obligation. The Fund may experience delays and costs in recovering the securities loaned. Any cash collateral received is invested in the Fidelity Securities Lending Cash Central Fund. The value of loaned securities and cash collateral at period end are disclosed on the Fund's Statement of Assets and Liabilities. Security lending income represents the income earned on investing cash collateral, less rebates paid to borrowers and any lending agent fees associated with the loan, plus any premium payments received for lending certain types of securities. Security lending income is presented in the Statement of Operations as a component of income from Fidelity Central Funds. During the period, there were no securities loaned to FCM.
8. Bank Borrowings.
The Fund is permitted to have bank borrowings for temporary or emergency purposes to fund shareholder redemptions or for other short-term liquidity requirements. The Fund has established borrowing arrangements with certain banks. The interest rate on the borrowings is the bank's base rate, as revised from time to time. The average loan balance during the period for which loans were outstanding amounted to $4,033,333. The weighted average interest rate was 1.11%. The interest expense amounted to $374 under the bank borrowing program. At period end, there were no bank borrowings outstanding.
9. Expense Reductions.
Commissions paid to certain brokers with whom the investment adviser, or its affiliates, places trades on behalf of the Fund include an amount in addition to trade execution, which may be rebated back to the Fund to offset certain expenses. This amount totaled $261,477 for the period.
In addition, during the period the investment adviser reimbursed and/or waived a portion of fund-level operating expenses in the amount of $4,352.
10. Distributions to Shareholders.
Distributions to shareholders of each class were as follows:
| | Six months ended
April 30, 2017 | Year ended October 31, 2016 |
| From net investment income | | |
| Class A | $157,254 | $297,014 |
| Class M | 24,256 | 28,522 |
| Class C | – | 29,301 |
| China Region | 10,241,399 | 14,431,516 |
| Class I | $212,309 | $317,144 |
| Total | $10,635,218 | $15,103,497 |
| From net realized gain | | |
| Class A | $43,202 | $3,946,989 |
| Class M | 10,926 | 763,704 |
| Class B | – | 93,006 |
| Class C | 7,384 | 1,752,229 |
| China Region | 1,889,558 | 150,087,760 |
| Class I | 37,777 | 3,187,427 |
| Total | $1,988,847 | $159,831,115 |
11. Share Transactions.
Share transactions for each class were as follows and may contain automatic conversions between classes or exchanges between affiliated funds:
| | Shares | Shares | Dollars | Dollars |
| | Six months ended April 30, 2017 | Year ended October 31, 2016 | Six months ended April 30, 2017 | Year ended October 31, 2016 |
| Class A | | | | |
| Shares sold | 110,593 | 240,368 | $2,907,714 | $5,824,186 |
| Reinvestment of distributions | 7,951 | 162,605 | 195,750 | 4,157,811 |
| Shares redeemed | (220,425) | (618,365) | (5,603,531) | (14,282,494) |
| Net increase (decrease) | (101,881) | (215,392) | $(2,500,067) | $(4,300,497) |
| Class M | | | | |
| Shares sold | 23,659 | 43,307 | $599,639 | $1,037,492 |
| Reinvestment of distributions | 1,419 | 30,599 | 34,859 | 781,504 |
| Shares redeemed | (29,803) | (70,825) | (753,758) | (1,686,295) |
| Net increase (decrease) | (4,725) | 3,081 | $(119,260) | $132,701 |
| Class B | | | | |
| Shares sold | – | 30 | $– | $648 |
| Reinvestment of distributions | – | 3,443 | – | 87,630 |
| Shares redeemed | – | (31,204) | – | (704,876) |
| Net increase (decrease) | – | (27,731) | $– | $(616,598) |
| Class C | | | | |
| Shares sold | 35,440 | 98,283 | $901,963 | $2,387,271 |
| Reinvestment of distributions | 254 | 55,713 | 6,148 | 1,398,404 |
| Shares redeemed | (142,611) | (202,505) | (3,523,893) | (4,847,372) |
| Net increase (decrease) | (106,917) | (48,509) | $(2,615,782) | $(1,061,697) |
| China Region | | | | |
| Shares sold | 2,408,244 | 3,781,033 | $63,571,325 | $92,584,217 |
| Reinvestment of distributions | 469,803 | 6,142,435 | 11,674,597 | 158,659,097 |
| Shares redeemed | (5,980,331) | (13,494,506) | (151,379,293) | (325,219,240) |
| Net increase (decrease) | (3,102,284) | (3,571,038) | $(76,133,371) | $(73,975,926) |
| Class I | | | | |
| Shares sold | 209,292 | 405,852 | $5,379,622 | $10,200,502 |
| Reinvestment of distributions | 8,728 | 99,936 | 215,492 | 2,565,348 |
| Shares redeemed | (277,604) | (664,751) | (7,200,315) | (16,263,698) |
| Net increase (decrease) | (59,584) | (158,963) | $(1,605,201) | $(3,497,848) |
12. Other.
The Fund's organizational documents provide former and current trustees and officers with a limited indemnification against liabilities arising in connection with the performance of their duties to the Fund. In the normal course of business, the Fund may also enter into contracts that provide general indemnifications. The Fund's maximum exposure under these arrangements is unknown as this would be dependent on future claims that may be made against the Fund. The risk of material loss from such claims is considered remote.
Shareholder Expense Example
As a shareholder of the Fund, you incur two types of costs: (1) transaction costs, including sales charges (loads) on purchase payments or redemption proceeds, redemption fees and (2) ongoing costs, including management fees, distribution and/or service (12b-1) fees and other Fund expenses. This Example is intended to help you understand your ongoing costs (in dollars) of investing in the Fund and to compare these costs with the ongoing costs of investing in other mutual funds.
The Example is based on an investment of $1,000 invested at the beginning of the period and held for the entire period (November 1, 2016 to April 30, 2017).
Actual Expenses
The first line of the accompanying table for each class of the Fund provides information about actual account values and actual expenses. You may use the information in this line, together with the amount you invested, to estimate the expenses that you paid over the period. Simply divide your account value by $1,000.00 (for example, an $8,600 account value divided by $1,000.00 = 8.6), then multiply the result by the number in the first line for a class of the Fund under the heading entitled "Expenses Paid During Period" to estimate the expenses you paid on your account during this period. A small balance maintenance fee of $12.00 that is charged once a year may apply for certain accounts with a value of less than $2,000. This fee is not included in the table below. If it was, the estimate of expenses you paid during the period would be higher, and your ending account value lower, by this amount. In addition, the Fund, as a shareholder in the underlying Fidelity Central Funds, will indirectly bear its pro-rata share of the fees and expenses incurred by the underlying Fidelity Central Funds. These fees and expenses are not included in the Fund's annualized expense ratio used to calculate the expense estimate in the table below.
Hypothetical Example for Comparison Purposes
The second line of the accompanying table for each class of the Fund provides information about hypothetical account values and hypothetical expenses based on a Class' actual expense ratio and an assumed rate of return of 5% per year before expenses, which is not the Class' actual return. The hypothetical account values and expenses may not be used to estimate the actual ending account balance or expenses you paid for the period. You may use this information to compare the ongoing costs of investing in the Fund and other funds. To do so, compare this 5% hypothetical example with the 5% hypothetical examples that appear in the shareholder reports of the other funds. A small balance maintenance fee of $12.00 that is charged once a year may apply for certain accounts with a value of less than $2,000. This fee is not included in the table below. If it was, the estimate of expenses you paid during the period would be higher, and your ending account value lower, by this amount. In addition, the Fund, as a shareholder in the underlying Fidelity Central Funds, will indirectly bear its pro-rata share of the fees and expenses incurred by the underlying Fidelity Central Funds. These fees and expenses are not included in the Fund's annualized expense ratio used to calculate the expense estimate in the table below.
Please note that the expenses shown in the table are meant to highlight your ongoing costs only and do not reflect any transaction costs. Therefore, the second line of the table is useful in comparing ongoing costs only, and will not help you determine the relative total costs of owning different funds. In addition, if these transactional costs were included, your costs would have been higher.
| | Annualized Expense Ratio-A | Beginning
Account Value
November 1, 2016 | Ending
Account Value
April 30, 2017 | Expenses Paid
During Period-B
November 1, 2016
to April 30, 2017 |
| Class A | 1.32% | | | |
| Actual | | $1,000.00 | $1,112.90 | $6.92 |
| Hypothetical-C | | $1,000.00 | $1,018.25 | $6.61 |
| Class M | 1.66% | | | |
| Actual | | $1,000.00 | $1,111.00 | $8.69 |
| Hypothetical-C | | $1,000.00 | $1,016.56 | $8.30 |
| Class C | 2.05% | | | |
| Actual | | $1,000.00 | $1,108.80 | $10.72 |
| Hypothetical-C | | $1,000.00 | $1,014.63 | $10.24 |
| China Region | 1.01% | | | |
| Actual | | $1,000.00 | $1,114.70 | $5.30 |
| Hypothetical-C | | $1,000.00 | $1,019.79 | $5.06 |
| Class I | 1.01% | | | |
| Actual | | $1,000.00 | $1,114.70 | $5.30 |
| Hypothetical-C | | $1,000.00 | $1,019.79 | $5.06 |
A Annualized expense ratio reflects expenses net of applicable fee waivers.
B Expenses are equal to each Class' annualized expense ratio, multiplied by the average account value over the period, multiplied by 181/365 (to reflect the one-half year period).
C 5% return per year before expenses
AHKC-SANN-0617
1.861464.108
Fidelity® International Value Fund
Semi-Annual Report April 30, 2017 |
|
Contents
To view a fund's proxy voting guidelines and proxy voting record for the 12-month period ended June 30, visit http://www.fidelity.com/proxyvotingresults or visit the Securities and Exchange Commission's (SEC) web site at http://www.sec.gov.
You may also call 1-800-544-8544 to request a free copy of the proxy voting guidelines.
Standard & Poor's, S&P and S&P 500 are registered service marks of The McGraw-Hill Companies, Inc. and have been licensed for use by Fidelity Distributors Corporation.
Other third-party marks appearing herein are the property of their respective owners.
All other marks appearing herein are registered or unregistered trademarks or service marks of FMR LLC or an affiliated company. © 2017 FMR LLC. All rights reserved.
This report and the financial statements contained herein are submitted for the general information of the shareholders of the Fund. This report is not authorized for distribution to prospective investors in the Fund unless preceded or accompanied by an effective prospectus.
A fund files its complete schedule of portfolio holdings with the SEC for the first and third quarters of each fiscal year on Form N-Q. Forms N-Q are available on the SEC’s web site at http://www.sec.gov. A fund's Forms N-Q may be reviewed and copied at the SEC’s Public Reference Room in Washington, DC. Information regarding the operation of the SEC's Public Reference Room may be obtained by calling 1-800-SEC-0330.
For a complete list of a fund's portfolio holdings, view the most recent holdings listing, semiannual report, or annual report on Fidelity's web site at http://www.fidelity.com, http://www.institutional.fidelity.com, or http://www.401k.com, as applicable.
NOT FDIC INSURED •MAY LOSE VALUE •NO BANK GUARANTEE
Neither the Fund nor Fidelity Distributors Corporation is a bank.
Investment Summary (Unaudited)
Geographic Diversification (% of fund's net assets)
| As of April 30, 2017 |
| | Japan | 22.6% |
| | United Kingdom | 17.2% |
| | France | 15.3% |
| | Germany | 7.4% |
| | Switzerland | 7.0% |
| | Australia | 5.7% |
| | Spain | 4.2% |
| | United States of America * | 4.1% |
| | Netherlands | 3.8% |
| | Other | 12.7% |

| As of October 31, 2016 |
| | Japan | 21.8% |
| | United Kingdom | 21.0% |
| | France | 14.4% |
| | Switzerland | 7.5% |
| | Germany | 6.3% |
| | Australia | 4.5% |
| | United States of America* | 4.4% |
| | Netherlands | 3.8% |
| | Spain | 3.4% |
| | Other | 12.9% |

* Includes Short-Term investments and Net Other Assets (Liabilities).
Percentages are based on country or territory of incorporation and are adjusted for the effect of futures contracts, if applicable.
Asset Allocation as of April 30, 2017
| | % of fund's net assets | % of fund's net assets 6 months ago |
| Stocks | 98.9 | 99.0 |
| Short-Term Investments and Net Other Assets (Liabilities) | 1.1 | 1.0 |
Top Ten Stocks as of April 30, 2017
| | % of fund's net assets | % of fund's net assets 6 months ago |
| Total SA (France, Oil, Gas & Consumable Fuels) | 3.0 | 3.0 |
| Mitsubishi UFJ Financial Group, Inc. (Japan, Banks) | 2.5 | 2.4 |
| Toyota Motor Corp. (Japan, Automobiles) | 2.2 | 3.1 |
| Westpac Banking Corp. (Australia, Banks) | 2.2 | 2.2 |
| Sanofi SA (France, Pharmaceuticals) | 2.0 | 1.8 |
| BP PLC (United Kingdom, Oil, Gas & Consumable Fuels) | 1.9 | 1.9 |
| Australia & New Zealand Banking Group Ltd. (Australia, Banks) | 1.7 | 0.0 |
| Lloyds Banking Group PLC (United Kingdom, Banks) | 1.7 | 1.1 |
| BASF AG (Germany, Chemicals) | 1.7 | 2.1 |
| UBS Group AG (Switzerland, Capital Markets) | 1.6 | 1.2 |
| | 20.5 | |
Top Market Sectors as of April 30, 2017
| | % of fund's net assets | % of fund's net assets 6 months ago |
| Financials | 36.5 | 29.2 |
| Industrials | 13.4 | 11.5 |
| Health Care | 9.6 | 10.9 |
| Consumer Discretionary | 8.5 | 10.5 |
| Materials | 7.7 | 8.8 |
| Energy | 7.4 | 8.2 |
| Information Technology | 5.2 | 4.9 |
| Consumer Staples | 4.8 | 6.3 |
| Telecommunication Services | 3.4 | 4.5 |
| Utilities | 1.8 | 3.3 |
Percentages shown as 0.0% may reflect amounts less than 0.05%.
Investments April 30, 2017 (Unaudited)
Showing Percentage of Net Assets
| Common Stocks - 98.4% | | | |
| | | Shares | Value |
| Australia - 5.7% | | | |
| Australia & New Zealand Banking Group Ltd. | | 243,375 | $5,970,156 |
| Insurance Australia Group Ltd. | | 513,326 | 2,386,991 |
| Macquarie Group Ltd. | | 36,371 | 2,532,818 |
| Magellan Financial Group Ltd. | | 72,957 | 1,288,180 |
| Westpac Banking Corp. | | 289,915 | 7,600,056 |
|
| TOTAL AUSTRALIA | | | 19,778,201 |
|
| Bailiwick of Jersey - 0.7% | | | |
| Wolseley PLC | | 39,492 | 2,509,999 |
| Belgium - 1.4% | | | |
| KBC Groep NV | | 67,347 | 4,862,373 |
| Canada - 0.8% | | | |
| Imperial Oil Ltd. | | 45,300 | 1,317,800 |
| Potash Corp. of Saskatchewan, Inc. | | 85,600 | 1,443,546 |
|
| TOTAL CANADA | | | 2,761,346 |
|
| Finland - 1.1% | | | |
| Sampo Oyj (A Shares) (a) | | 77,234 | 3,700,923 |
| France - 15.3% | | | |
| Atos Origin SA | | 36,612 | 4,797,739 |
| AXA SA (a) | | 181,621 | 4,845,676 |
| Bouygues SA (a) | | 34,816 | 1,463,718 |
| Capgemini SA | | 27,393 | 2,742,642 |
| Compagnie de St. Gobain | | 59,400 | 3,206,104 |
| Havas SA | | 220,503 | 2,039,006 |
| Natixis SA | | 272,800 | 1,897,968 |
| Sanofi SA | | 72,108 | 6,813,762 |
| Societe Generale Series A | | 94,700 | 5,192,659 |
| SR Teleperformance SA | | 20,600 | 2,588,406 |
| Total SA | | 200,862 | 10,310,892 |
| VINCI SA (a) | | 56,500 | 4,815,980 |
| Vivendi SA | | 123,792 | 2,456,231 |
|
| TOTAL FRANCE | | | 53,170,783 |
|
| Germany - 7.4% | | | |
| Axel Springer Verlag AG | | 28,500 | 1,599,131 |
| BASF AG | | 59,654 | 5,813,209 |
| Brenntag AG | | 27,200 | 1,613,001 |
| Deutsche Telekom AG | | 282,200 | 4,950,014 |
| Fresenius SE & Co. KGaA | | 33,800 | 2,739,653 |
| HeidelbergCement Finance AG | | 26,600 | 2,462,907 |
| Linde AG | | 7,900 | 1,419,472 |
| SAP AG | | 29,570 | 2,961,910 |
| Vonovia SE | | 61,000 | 2,208,376 |
|
| TOTAL GERMANY | | | 25,767,673 |
|
| Hong Kong - 0.9% | | | |
| AIA Group Ltd. | | 184,000 | 1,273,843 |
| Power Assets Holdings Ltd. | | 192,000 | 1,727,873 |
|
| TOTAL HONG KONG | | | 3,001,716 |
|
| Indonesia - 0.4% | | | |
| PT Bank Rakyat Indonesia Tbk | | 1,406,500 | 1,361,231 |
| Ireland - 1.5% | | | |
| Allergan PLC | | 6,280 | 1,531,441 |
| CRH PLC | | 52,671 | 1,918,494 |
| Medtronic PLC | | 23,000 | 1,911,070 |
|
| TOTAL IRELAND | | | 5,361,005 |
|
| Israel - 0.4% | | | |
| Teva Pharmaceutical Industries Ltd. sponsored ADR | | 45,999 | 1,452,648 |
| Italy - 1.0% | | | |
| Intesa Sanpaolo SpA | | 1,173,100 | 3,424,399 |
| Japan - 22.6% | | | |
| AEON Financial Service Co. Ltd. | | 72,600 | 1,394,363 |
| Astellas Pharma, Inc. | | 105,500 | 1,391,240 |
| Dentsu, Inc. | | 19,600 | 1,104,176 |
| East Japan Railway Co. | | 17,800 | 1,589,425 |
| Hoya Corp. | | 64,900 | 3,099,597 |
| Itochu Corp. | | 246,800 | 3,489,184 |
| Japan Tobacco, Inc. | | 26,400 | 877,671 |
| Kao Corp. | | 34,700 | 1,913,753 |
| KDDI Corp. | | 150,400 | 3,987,717 |
| Komatsu Ltd. | | 111,300 | 2,974,108 |
| Makita Corp. | | 65,600 | 2,339,179 |
| Mitsubishi UFJ Financial Group, Inc. | | 1,356,700 | 8,596,860 |
| Nintendo Co. Ltd. | | 4,400 | 1,113,489 |
| Nippon Telegraph & Telephone Corp. | | 71,300 | 3,055,608 |
| Nomura Holdings, Inc. | | 440,000 | 2,644,237 |
| OBIC Co. Ltd. | | 42,600 | 2,300,534 |
| Olympus Corp. | | 66,000 | 2,539,942 |
| ORIX Corp. | | 229,100 | 3,495,843 |
| Panasonic Corp. | | 153,900 | 1,840,375 |
| Recruit Holdings Co. Ltd. | | 51,200 | 2,585,835 |
| Seven & i Holdings Co. Ltd. | | 57,800 | 2,442,144 |
| Shin-Etsu Chemical Co. Ltd. | | 34,100 | 2,962,318 |
| Shinsei Bank Ltd. | | 948,000 | 1,768,863 |
| Sony Corp. | | 89,900 | 3,084,860 |
| Sony Financial Holdings, Inc. | | 123,000 | 2,043,472 |
| Subaru Corp. | | 49,600 | 1,874,099 |
| Taiheiyo Cement Corp. | | 427,000 | 1,421,099 |
| Tokio Marine Holdings, Inc. | | 71,900 | 3,026,282 |
| Toyota Motor Corp. | | 144,000 | 7,793,394 |
|
| TOTAL JAPAN | | | 78,749,667 |
|
| Netherlands - 3.8% | | | |
| Akzo Nobel NV (a) | | 12,823 | 1,121,359 |
| ING Groep NV (Certificaten Van Aandelen) | | 344,290 | 5,611,769 |
| PostNL NV (a) | | 173,631 | 860,003 |
| RELX NV | | 177,227 | 3,427,663 |
| Wolters Kluwer NV | | 49,333 | 2,095,262 |
|
| TOTAL NETHERLANDS | | | 13,116,056 |
|
| Norway - 0.9% | | | |
| Statoil ASA (a) | | 193,419 | 3,185,397 |
| Spain - 3.7% | | | |
| Banco Santander SA (Spain) | | 743,100 | 4,846,230 |
| CaixaBank SA | | 757,997 | 3,441,642 |
| Iberdrola SA | | 653,088 | 4,696,721 |
|
| TOTAL SPAIN | | | 12,984,593 |
|
| Sweden - 3.6% | | | |
| Investor AB (B Shares) | | 67,551 | 3,088,006 |
| Nordea Bank AB | | 443,800 | 5,461,506 |
| Swedbank AB (A Shares) | | 117,842 | 2,792,616 |
| Telefonaktiebolaget LM Ericsson (B Shares) | | 155,300 | 1,008,958 |
|
| TOTAL SWEDEN | | | 12,351,086 |
|
| Switzerland - 7.0% | | | |
| ABB Ltd. (Reg.) | | 152,660 | 3,740,821 |
| Credit Suisse Group AG | | 101,487 | 1,547,775 |
| Lafargeholcim Ltd. (Reg.) | | 40,520 | 2,296,812 |
| Nestle SA (Reg. S) | | 28,149 | 2,168,050 |
| Novartis AG | | 56,169 | 4,324,175 |
| UBS Group AG | | 329,958 | 5,612,586 |
| Zurich Insurance Group AG | | 17,430 | 4,823,551 |
|
| TOTAL SWITZERLAND | | | 24,513,770 |
|
| United Kingdom - 17.2% | | | |
| AstraZeneca PLC (United Kingdom) | | 80,729 | 4,834,814 |
| Aviva PLC | | 716,341 | 4,871,416 |
| BAE Systems PLC | | 479,829 | 3,897,160 |
| BHP Billiton PLC | | 106,347 | 1,621,282 |
| BP PLC | | 1,132,482 | 6,483,024 |
| British American Tobacco PLC (United Kingdom) | | 36,400 | 2,459,307 |
| Bunzl PLC | | 103,266 | 3,220,703 |
| Compass Group PLC | | 170,939 | 3,451,397 |
| HSBC Holdings PLC sponsored ADR (a) | | 77,043 | 3,171,860 |
| Imperial Tobacco Group PLC | | 63,922 | 3,131,185 |
| Informa PLC | | 350,099 | 2,911,138 |
| ITV PLC | | 626,296 | 1,703,475 |
| Lloyds Banking Group PLC | | 6,617,300 | 5,945,821 |
| Micro Focus International PLC | | 89,200 | 2,989,964 |
| Rio Tinto PLC | | 107,160 | 4,227,487 |
| Royal Dutch Shell PLC Class B (United Kingdom) | | 55,823 | 1,485,281 |
| Standard Chartered PLC (United Kingdom) (b) | | 371,475 | 3,469,941 |
|
| TOTAL UNITED KINGDOM | | | 59,875,255 |
|
| United States of America - 3.0% | | | |
| Amgen, Inc. | | 7,700 | 1,257,564 |
| ConocoPhillips Co. | | 59,800 | 2,865,018 |
| Constellation Brands, Inc. Class A (sub. vtg.) | | 8,400 | 1,449,336 |
| Edgewell Personal Care Co. (b) | | 12,500 | 893,625 |
| Molson Coors Brewing Co. Class B | | 17,000 | 1,630,130 |
| S&P Global, Inc. | | 18,400 | 2,469,096 |
|
| TOTAL UNITED STATES OF AMERICA | | | 10,564,769 |
|
| TOTAL COMMON STOCKS | | | |
| (Cost $332,235,193) | | | 342,492,890 |
|
| Nonconvertible Preferred Stocks - 0.5% | | | |
| Spain - 0.5% | | | |
| Grifols SA Class B | | | |
| (Cost $1,455,226) | | 93,000 | 1,985,070 |
|
| Money Market Funds - 7.1% | | | |
| Fidelity Cash Central Fund, 0.85% (c) | | 1,416,079 | 1,416,362 |
| Fidelity Securities Lending Cash Central Fund 0.86% (c)(d) | | 23,197,646 | 23,199,966 |
| TOTAL MONEY MARKET FUNDS | | | |
| (Cost $24,616,581) | | | 24,616,328 |
| TOTAL INVESTMENT PORTFOLIO - 106.0% | | | |
| (Cost $358,307,000) | | | 369,094,288 |
| NET OTHER ASSETS (LIABILITIES) - (6.0)% | | | (20,966,081) |
| NET ASSETS - 100% | | | $348,128,207 |
Categorizations in the Schedule of Investments are based on country or territory of incorporation.
Legend
(a) Security or a portion of the security is on loan at period end.
(b) Non-income producing
(c) Affiliated fund that is generally available only to investment companies and other accounts managed by Fidelity Investments. The rate quoted is the annualized seven-day yield of the fund at period end. A complete unaudited listing of the fund's holdings as of its most recent quarter end is available upon request. In addition, each Fidelity Central Fund's financial statements are available on the SEC's website or upon request.
(d) Investment made with cash collateral received from securities on loan.
Affiliated Central Funds
Information regarding fiscal year to date income earned by the Fund from investments in Fidelity Central Funds is as follows:
| Fund | Income earned |
| Fidelity Cash Central Fund | $5,267 |
| Fidelity Securities Lending Cash Central Fund | 84,398 |
| Total | $89,665 |
Investment Valuation
The following is a summary of the inputs used, as of April 30, 2017, involving the Fund's assets and liabilities carried at fair value. The inputs or methodology used for valuing securities may not be an indication of the risk associated with investing in those securities. For more information on valuation inputs, and their aggregation into the levels used below, please refer to the Investment Valuation section in the accompanying Notes to Financial Statements.
| | Valuation Inputs at Reporting Date: |
| Description | Total | Level 1 | Level 2 | Level 3 |
| Investments in Securities: | | | | |
| Equities: | | | | |
| Consumer Discretionary | $29,857,282 | $13,687,256 | $16,170,026 | $-- |
| Consumer Staples | 16,965,201 | 12,337,844 | 4,627,357 | -- |
| Energy | 25,647,412 | 4,182,818 | 21,464,594 | -- |
| Financials | 126,461,008 | 67,915,147 | 58,545,861 | -- |
| Health Care | 33,880,976 | 16,516,985 | 17,363,991 | -- |
| Industrials | 46,416,551 | 28,478,483 | 17,938,068 | -- |
| Information Technology | 17,915,236 | 10,088,237 | 7,826,999 | -- |
| Materials | 26,707,985 | 18,940,722 | 7,767,263 | -- |
| Real Estate | 2,208,376 | 2,208,376 | -- | -- |
| Telecommunication Services | 11,993,339 | -- | 11,993,339 | -- |
| Utilities | 6,424,594 | 6,424,594 | -- | -- |
| Money Market Funds | 24,616,328 | 24,616,328 | -- | -- |
| Total Investments in Securities: | $369,094,288 | $205,396,790 | $163,697,498 | $-- |
The following is a summary of transfers between Level 1 and Level 2 for the period ended April 30, 2017. Transfers are assumed to have occurred at the beginning of the period, and are primarily attributable to the valuation techniques used for foreign equity securities, as discussed in the accompanying Notes to Financial Statements:
| Transfers | Total |
| Level 1 to Level 2 | $14,996,093 |
| Level 2 to Level 1 | $12,734,748 |
See accompanying notes which are an integral part of the financial statements.
Financial Statements
Statement of Assets and Liabilities
| | | April 30, 2017 (Unaudited) |
| Assets | | |
Investment in securities, at value (including securities loaned of $21,871,853) — See accompanying schedule:
Unaffiliated issuers (cost $333,690,419) | $344,477,960 | |
| Fidelity Central Funds (cost $24,616,581) | 24,616,328 | |
| Total Investments (cost $358,307,000) | | $369,094,288 |
| Cash | | 79,541 |
| Foreign currency held at value (cost $2) | | 43 |
| Receivable for investments sold | | 740,762 |
| Receivable for fund shares sold | | 96,454 |
| Dividends receivable | | 2,265,171 |
| Distributions receivable from Fidelity Central Funds | | 30,800 |
| Prepaid expenses | | 211 |
| Other receivables | | 15,758 |
| Total assets | | 372,323,028 |
| Liabilities | | |
| Payable for investments purchased | $559,911 | |
| Payable for fund shares redeemed | 126,078 | |
| Accrued management fee | 199,004 | |
| Distribution and service plan fees payable | 6,626 | |
| Other affiliated payables | 61,947 | |
| Other payables and accrued expenses | 40,080 | |
| Collateral on securities loaned | 23,201,175 | |
| Total liabilities | | 24,194,821 |
| Net Assets | | $348,128,207 |
| Net Assets consist of: | | |
| Paid in capital | | $442,314,742 |
| Undistributed net investment income | | 3,083,094 |
| Accumulated undistributed net realized gain (loss) on investments and foreign currency transactions | | (108,055,851) |
| Net unrealized appreciation (depreciation) on investments and assets and liabilities in foreign currencies | | 10,786,222 |
| Net Assets | | $348,128,207 |
| Calculation of Maximum Offering Price | | |
| Class A: | | |
| Net Asset Value and redemption price per share ($7,147,115 ÷ 853,097 shares) | | $8.38 |
| Maximum offering price per share (100/94.25 of $8.38) | | $8.89 |
| Class M: | | |
| Net Asset Value and redemption price per share ($3,768,065 ÷ 449,988 shares) | | $8.37 |
| Maximum offering price per share (100/96.50 of $8.37) | | $8.67 |
| Class C: | | |
| Net Asset Value and offering price per share ($4,508,681 ÷ 538,636 shares)(a) | | $8.37 |
| International Value: | | |
| Net Asset Value, offering price and redemption price per share ($328,731,963 ÷ 39,262,758 shares) | | $8.37 |
| Class I: | | |
| Net Asset Value, offering price and redemption price per share ($3,972,383 ÷ 473,703 shares) | | $8.39 |
(a) Redemption price per share is equal to net asset value less any applicable contingent deferred sales charge.
See accompanying notes which are an integral part of the financial statements.
Statement of Operations
| | | Six months ended April 30, 2017 (Unaudited) |
| Investment Income | | |
| Dividends | | $5,735,107 |
| Income from Fidelity Central Funds | | 89,665 |
| Income before foreign taxes withheld | | 5,824,772 |
| Less foreign taxes withheld | | (436,028) |
| Total income | | 5,388,744 |
| Expenses | | |
| Management fee | | |
| Basic fee | $1,149,903 | |
| Performance adjustment | (19,845) | |
| Transfer agent fees | 281,672 | |
| Distribution and service plan fees | 39,868 | |
| Accounting and security lending fees | 85,913 | |
| Custodian fees and expenses | 44,362 | |
| Independent trustees' fees and expenses | 668 | |
| Registration fees | 68,696 | |
| Audit | 33,941 | |
| Legal | 2,075 | |
| Miscellaneous | 1,280 | |
| Total expenses before reductions | 1,688,533 | |
| Expense reductions | (24,627) | 1,663,906 |
| Net investment income (loss) | | 3,724,838 |
| Realized and Unrealized Gain (Loss) | | |
| Net realized gain (loss) on: | | |
| Investment securities: | | |
| Unaffiliated issuers | (360,930) | |
| Fidelity Central Funds | (1,186) | |
| Foreign currency transactions | (96,383) | |
| Total net realized gain (loss) | | (458,499) |
Change in net unrealized appreciation (depreciation) on:
Investment securities | 29,464,934 | |
| Assets and liabilities in foreign currencies | 43,937 | |
| Total change in net unrealized appreciation (depreciation) | | 29,508,871 |
| Net gain (loss) | | 29,050,372 |
| Net increase (decrease) in net assets resulting from operations | | $32,775,210 |
See accompanying notes which are an integral part of the financial statements.
Statement of Changes in Net Assets
| | Six months ended April 30, 2017 (Unaudited) | Year ended October 31, 2016 |
| Increase (Decrease) in Net Assets | | |
| Operations | | |
| Net investment income (loss) | $3,724,838 | $7,988,662 |
| Net realized gain (loss) | (458,499) | (3,305,724) |
| Change in net unrealized appreciation (depreciation) | 29,508,871 | (18,037,363) |
| Net increase (decrease) in net assets resulting from operations | 32,775,210 | (13,354,425) |
| Distributions to shareholders from net investment income | (8,124,122) | (4,084,383) |
| Distributions to shareholders from net realized gain | (457,331) | – |
| Total distributions | (8,581,453) | (4,084,383) |
| Share transactions - net increase (decrease) | (2,808,549) | 56,799,318 |
| Redemption fees | 342 | 637 |
| Total increase (decrease) in net assets | 21,385,550 | 39,361,147 |
| Net Assets | | |
| Beginning of period | 326,742,657 | 287,381,510 |
| End of period | $348,128,207 | $326,742,657 |
| Other Information | | |
| Undistributed net investment income end of period | $3,083,094 | $7,482,378 |
See accompanying notes which are an integral part of the financial statements.
Financial Highlights — Fidelity International Value Fund Class A
| | Six months ended (Unaudited) April 30, | Years ended October 31, | | | | |
| | 2017 | 2016 | 2015 | 2014 | 2013 | 2012 |
| Selected Per–Share Data | | | | | | |
| Net asset value, beginning of period | $7.78 | $8.27 | $8.62 | $8.96 | $7.39 | $7.02 |
| Income from Investment Operations | | | | | | |
| Net investment income (loss)A | .08 | .17 | .13 | .31B | .17 | .20 |
| Net realized and unrealized gain (loss) | .70 | (.57) | (.20) | (.47) | 1.64 | .39 |
| Total from investment operations | .78 | (.40) | (.07) | (.16) | 1.81 | .59 |
| Distributions from net investment income | (.17) | (.09) | (.28) | (.17) | (.20) | (.22) |
| Distributions from net realized gain | (.01) | – | – | (.01) | (.04) | – |
| Total distributions | (.18) | (.09) | (.28) | (.18) | (.24) | (.22) |
| Redemption fees added to paid in capitalA,C | – | – | – | – | – | – |
| Net asset value, end of period | $8.38 | $7.78 | $8.27 | $8.62 | $8.96 | $7.39 |
| Total ReturnD,E,F | 10.16% | (4.91)% | (.81)% | (1.76)% | 25.24% | 8.82% |
| Ratios to Average Net AssetsG,H | | | | | | |
| Expenses before reductions | 1.36%I | 1.40% | 1.37% | 1.32% | 1.39% | 1.44% |
| Expenses net of fee waivers, if any | 1.35%I | 1.40% | 1.37% | 1.32% | 1.39% | 1.44% |
| Expenses net of all reductions | 1.34%I | 1.39% | 1.36% | 1.32% | 1.36% | 1.41% |
| Net investment income (loss) | 1.92%I | 2.19% | 1.58% | 3.44%B | 2.08% | 2.85% |
| Supplemental Data | | | | | | |
| Net assets, end of period (000 omitted) | $7,147 | $7,717 | $8,956 | $6,296 | $6,191 | $4,491 |
| Portfolio turnover rateJ | 52%I | 47% | 44% | 69% | 79% | 74% |
A Calculated based on average shares outstanding during the period.
B Net Investment income per share reflects a large, non-recurring dividend which amounted to $.14 per share. Excluding this non-recurring dividend, the ratio of net investment income (loss) to average net assets would have been 1.90%.
C Amount represents less than $.005 per share.
D Total returns for periods of less than one year are not annualized.
E Total returns would have been lower if certain expenses had not been reduced during the applicable periods shown.
F Total returns do not include the effect of the sales charges.
G Fees and expenses of any underlying Fidelity Central Funds are not included in the Fund's expense ratio. The Fund indirectly bears its proportionate share of the expenses of any underlying Fidelity Central Funds.
H Expense ratios reflect operating expenses of the class. Expenses before reductions do not reflect amounts reimbursed by the investment adviser or reductions from brokerage service arrangements or reductions from other expense offset arrangements and do not represent the amount paid by the class during periods when reimbursements or reductions occur. Expenses net of fee waivers reflect expenses after reimbursement by the investment adviser but prior to reductions from brokerage service arrangements or other expense offset arrangements. Expenses net of all reductions represent the net expenses paid by the class.
I Annualized
J Amount does not include the portfolio activity of any underlying Fidelity Central Funds.
See accompanying notes which are an integral part of the financial statements.
Financial Highlights — Fidelity International Value Fund Class M
| | Six months ended (Unaudited) April 30, | Years ended October 31, | | | | |
| | 2017 | 2016 | 2015 | 2014 | 2013 | 2012 |
| Selected Per–Share Data | | | | | | |
| Net asset value, beginning of period | $7.76 | $8.25 | $8.60 | $8.94 | $7.38 | $7.00 |
| Income from Investment Operations | | | | | | |
| Net investment income (loss)A | .06 | .15 | .11 | .28B | .15 | .18 |
| Net realized and unrealized gain (loss) | .70 | (.58) | (.20) | (.46) | 1.64 | .40 |
| Total from investment operations | .76 | (.43) | (.09) | (.18) | 1.79 | .58 |
| Distributions from net investment income | (.14) | (.06) | (.26) | (.15) | (.19) | (.20) |
| Distributions from net realized gain | (.01) | – | – | (.01) | (.04) | – |
| Total distributions | (.15) | (.06) | (.26) | (.16) | (.23) | (.20) |
| Redemption fees added to paid in capitalA,C | – | – | – | – | – | – |
| Net asset value, end of period | $8.37 | $7.76 | $8.25 | $8.60 | $8.94 | $7.38 |
| Total ReturnD,E,F | 9.98% | (5.24)% | (1.09)% | (1.99)% | 24.86% | 8.60% |
| Ratios to Average Net AssetsG,H | | | | | | |
| Expenses before reductions | 1.66%I | 1.70% | 1.66% | 1.59% | 1.66% | 1.71% |
| Expenses net of fee waivers, if any | 1.66%I | 1.70% | 1.66% | 1.59% | 1.65% | 1.70% |
| Expenses net of all reductions | 1.64%I | 1.69% | 1.65% | 1.59% | 1.63% | 1.67% |
| Net investment income (loss) | 1.62%I | 1.89% | 1.29% | 3.17%B | 1.81% | 2.58% |
| Supplemental Data | | | | | | |
| Net assets, end of period (000 omitted) | $3,768 | $3,703 | $4,086 | $3,604 | $3,758 | $2,693 |
| Portfolio turnover rateJ | 52%I | 47% | 44% | 69% | 79% | 74% |
A Calculated based on average shares outstanding during the period.
B Net Investment income per share reflects a large, non-recurring dividend which amounted to $.14 per share. Excluding this non-recurring dividend, the ratio of net investment income (loss) to average net assets would have been 1.64%.
C Amount represents less than $.005 per share.
D Total returns for periods of less than one year are not annualized.
E Total returns would have been lower if certain expenses had not been reduced during the applicable periods shown.
F Total returns do not include the effect of the sales charges.
G Fees and expenses of any underlying Fidelity Central Funds are not included in the Fund's expense ratio. The Fund indirectly bears its proportionate share of the expenses of any underlying Fidelity Central Funds.
H Expense ratios reflect operating expenses of the class. Expenses before reductions do not reflect amounts reimbursed by the investment adviser or reductions from brokerage service arrangements or reductions from other expense offset arrangements and do not represent the amount paid by the class during periods when reimbursements or reductions occur. Expenses net of fee waivers reflect expenses after reimbursement by the investment adviser but prior to reductions from brokerage service arrangements or other expense offset arrangements. Expenses net of all reductions represent the net expenses paid by the class.
I Annualized
J Amount does not include the portfolio activity of any underlying Fidelity Central Funds.
See accompanying notes which are an integral part of the financial statements.
Financial Highlights — Fidelity International Value Fund Class C
| | Six months ended (Unaudited) April 30, | Years ended October 31, | | | | |
| | 2017 | 2016 | 2015 | 2014 | 2013 | 2012 |
| Selected Per–Share Data | | | | | | |
| Net asset value, beginning of period | $7.75 | $8.23 | $8.59 | $8.93 | $7.38 | $7.00 |
| Income from Investment Operations | | | | | | |
| Net investment income (loss)A | .05 | .11 | .07 | .24B | .11 | .14 |
| Net realized and unrealized gain (loss) | .69 | (.57) | (.20) | (.45) | 1.63 | .41 |
| Total from investment operations | .74 | (.46) | (.13) | (.21) | 1.74 | .55 |
| Distributions from net investment income | (.11) | (.02) | (.23) | (.11) | (.15) | (.17) |
| Distributions from net realized gain | (.01) | – | – | (.01) | (.04) | – |
| Total distributions | (.12) | (.02) | (.23) | (.13)C | (.19) | (.17) |
| Redemption fees added to paid in capitalA,D | – | – | – | – | – | – |
| Net asset value, end of period | $8.37 | $7.75 | $8.23 | $8.59 | $8.93 | $7.38 |
| Total ReturnE,F,G | 9.63% | (5.61)% | (1.58)% | (2.43)% | 24.17% | 8.12% |
| Ratios to Average Net AssetsH,I | | | | | | |
| Expenses before reductions | 2.13%J | 2.17% | 2.15% | 2.07% | 2.14% | 2.19% |
| Expenses net of fee waivers, if any | 2.13%J | 2.17% | 2.14% | 2.07% | 2.14% | 2.19% |
| Expenses net of all reductions | 2.12%J | 2.17% | 2.14% | 2.07% | 2.11% | 2.16% |
| Net investment income (loss) | 1.15%J | 1.42% | .81% | 2.69%B | 1.33% | 2.09% |
| Supplemental Data | | | | | | |
| Net assets, end of period (000 omitted) | $4,509 | $4,168 | $4,502 | $3,647 | $3,231 | $2,249 |
| Portfolio turnover rateK | 52%J | 47% | 44% | 69% | 79% | 74% |
A Calculated based on average shares outstanding during the period.
B Net Investment income per share reflects a large, non-recurring dividend which amounted to $.14 per share. Excluding this non-recurring dividend, the ratio of net investment income (loss) to average net assets would have been 1.15%.
C Total distributions of $.13 per share is comprised of distributions from net investment income of $.111 and distributions from net realized gain of $.014 per share.
D Amount represents less than $.005 per share.
E Total returns for periods of less than one year are not annualized.
F Total returns would have been lower if certain expenses had not been reduced during the applicable periods shown.
G Total returns do not include the effect of the contingent deferred sales charge.
H Fees and expenses of any underlying Fidelity Central Funds are not included in the Fund's expense ratio. The Fund indirectly bears its proportionate share of the expenses of any underlying Fidelity Central Funds.
I Expense ratios reflect operating expenses of the class. Expenses before reductions do not reflect amounts reimbursed by the investment adviser or reductions from brokerage service arrangements or reductions from other expense offset arrangements and do not represent the amount paid by the class during periods when reimbursements or reductions occur. Expenses net of fee waivers reflect expenses after reimbursement by the investment adviser but prior to reductions from brokerage service arrangements or other expense offset arrangements. Expenses net of all reductions represent the net expenses paid by the class.
J Annualized
K Amount does not include the portfolio activity of any underlying Fidelity Central Funds.
See accompanying notes which are an integral part of the financial statements.
Financial Highlights — Fidelity International Value Fund
| | Six months ended (Unaudited) April 30, | Years ended October 31, | | | | |
| | 2017 | 2016 | 2015 | 2014 | 2013 | 2012 |
| Selected Per–Share Data | | | | | | |
| Net asset value, beginning of period | $7.79 | $8.29 | $8.64 | $8.97 | $7.40 | $7.03 |
| Income from Investment Operations | | | | | | |
| Net investment income (loss)A | .09 | .20 | .16 | .34B | .19 | .22 |
| Net realized and unrealized gain (loss) | .70 | (.58) | (.19) | (.46) | 1.65 | .40 |
| Total from investment operations | .79 | (.38) | (.03) | (.12) | 1.84 | .62 |
| Distributions from net investment income | (.20) | (.12) | (.32) | (.20) | (.22) | (.25) |
| Distributions from net realized gain | (.01) | – | – | (.01) | (.04) | – |
| Total distributions | (.21) | (.12) | (.32) | (.21) | (.27)C | (.25) |
| Redemption fees added to paid in capitalA,D | – | – | – | – | – | – |
| Net asset value, end of period | $8.37 | $7.79 | $8.29 | $8.64 | $8.97 | $7.40 |
| Total ReturnE,F | 10.34% | (4.69)% | (.41)% | (1.34)% | 25.57% | 9.19% |
| Ratios to Average Net AssetsG,H | | | | | | |
| Expenses before reductions | .99%I | 1.03% | 1.02% | .96% | 1.05% | 1.13% |
| Expenses net of fee waivers, if any | .99%I | 1.03% | 1.02% | .96% | 1.05% | 1.13% |
| Expenses net of all reductions | .98%I | 1.03% | 1.01% | .95% | 1.02% | 1.10% |
| Net investment income (loss) | 2.29%I | 2.56% | 1.93% | 3.80%B | 2.41% | 3.16% |
| Supplemental Data | | | | | | |
| Net assets, end of period (000 omitted) | $328,732 | $309,199 | $267,567 | $192,789 | $181,568 | $128,983 |
| Portfolio turnover rateJ | 52%I | 47% | 44% | 69% | 79% | 74% |
A Calculated based on average shares outstanding during the period.
B Net Investment income per share reflects a large, non-recurring dividend which amounted to $.14 per share. Excluding this non-recurring dividend, the ratio of net investment income (loss) to average net assets would have been 2.27%.
C Total distributions of $.27 per share is comprised of distributions from net investment income of $.223 and distributions from net realized gain of $.042 per share.
D Amount represents less than $.005 per share.
E Total returns for periods of less than one year are not annualized.
F Total returns would have been lower if certain expenses had not been reduced during the applicable periods shown.
G Fees and expenses of any underlying Fidelity Central Funds are not included in the Fund's expense ratio. The Fund indirectly bears its proportionate share of the expenses of any underlying Fidelity Central Funds.
H Expense ratios reflect operating expenses of the class. Expenses before reductions do not reflect amounts reimbursed by the investment adviser or reductions from brokerage service arrangements or reductions from other expense offset arrangements and do not represent the amount paid by the class during periods when reimbursements or reductions occur. Expenses net of fee waivers reflect expenses after reimbursement by the investment adviser but prior to reductions from brokerage service arrangements or other expense offset arrangements. Expenses net of all reductions represent the net expenses paid by the class.
I Annualized
J Amount does not include the portfolio activity of any underlying Fidelity Central Funds.
See accompanying notes which are an integral part of the financial statements.
Financial Highlights — Fidelity International Value Fund Class I
| | Six months ended (Unaudited) April 30, | Years ended October 31, | | | | |
| | 2017 | 2016 | 2015 | 2014 | 2013 | 2012 |
| Selected Per–Share Data | | | | | | |
| Net asset value, beginning of period | $7.80 | $8.29 | $8.65 | $8.98 | $7.41 | $7.04 |
| Income from Investment Operations | | | | | | |
| Net investment income (loss)A | .09 | .19 | .15 | .33B | .19 | .22 |
| Net realized and unrealized gain (loss) | .70 | (.58) | (.19) | (.45) | 1.65 | .40 |
| Total from investment operations | .79 | (.39) | (.04) | (.12) | 1.84 | .62 |
| Distributions from net investment income | (.19) | (.10) | (.32) | (.19) | (.23) | (.25) |
| Distributions from net realized gain | (.01) | – | – | (.01) | (.04) | – |
| Total distributions | (.20) | (.10) | (.32) | (.21)C | (.27) | (.25) |
| Redemption fees added to paid in capitalA,D | – | – | – | – | – | – |
| Net asset value, end of period | $8.39 | $7.80 | $8.29 | $8.65 | $8.98 | $7.41 |
| Total ReturnE,F | 10.34% | (4.81)% | (.53)% | (1.41)% | 25.64% | 9.22% |
| Ratios to Average Net AssetsG,H | | | | | | |
| Expenses before reductions | 1.12%I | 1.17% | 1.14% | 1.05% | 1.07% | 1.10% |
| Expenses net of fee waivers, if any | 1.12%I | 1.17% | 1.14% | 1.05% | 1.07% | 1.10% |
| Expenses net of all reductions | 1.10%I | 1.16% | 1.13% | 1.04% | 1.04% | 1.07% |
| Net investment income (loss) | 2.16%I | 2.42% | 1.81% | 3.71%B | 2.39% | 3.18% |
| Supplemental Data | | | | | | |
| Net assets, end of period (000 omitted) | $3,972 | $1,955 | $1,969 | $1,310 | $239 | $372 |
| Portfolio turnover rateJ | 52%I | 47% | 44% | 69% | 79% | 74% |
A Calculated based on average shares outstanding during the period.
B Net Investment income per share reflects a large, non-recurring dividend which amounted to $.14 per share. Excluding this non-recurring dividend, the ratio of net investment income (loss) to average net assets would have been 2.18%.
C Total distributions of $.21 per share is comprised of distributions from net investment income of $.191 and distributions from net realized gain of .014 per share.
D Amount represents less than $.005 per share.
E Total returns for periods of less than one year are not annualized.
F Total returns would have been lower if certain expenses had not been reduced during the applicable periods shown.
G Fees and expenses of any underlying Fidelity Central Funds are not included in the Fund's expense ratio. The Fund indirectly bears its proportionate share of the expenses of any underlying Fidelity Central Funds.
H Expense ratios reflect operating expenses of the class. Expenses before reductions do not reflect amounts reimbursed by the investment adviser or reductions from brokerage service arrangements or reductions from other expense offset arrangements and do not represent the amount paid by the class during periods when reimbursements or reductions occur. Expenses net of fee waivers reflect expenses after reimbursement by the investment adviser but prior to reductions from brokerage service arrangements or other expense offset arrangements. Expenses net of all reductions represent the net expenses paid by the class.
I Annualized
J Amount does not include the portfolio activity of any underlying Fidelity Central Funds.
See accompanying notes which are an integral part of the financial statements.
Notes to Financial Statements (Unaudited)
For the period ended April 30, 2017
1. Organization.
Fidelity International Value Fund (the Fund) is a fund of Fidelity Investment Trust (the Trust) and is authorized to issue an unlimited number of shares. The Trust is registered under the Investment Company Act of 1940, as amended (the 1940 Act), as an open-end management investment company organized as a Massachusetts business trust. The Fund offers Class A, Class M (formerly Class T), Class C, International Value and Class I shares, each of which has equal rights as to assets and voting privileges. Each class has exclusive voting rights with respect to matters that affect that class.
After the close of business on June 24, 2016, all outstanding Class B shares were converted to Class A shares. All prior fiscal period dollar and share amounts for Class B presented in the Notes to Financial Statements are for the period November 1, 2015 through June 24, 2016.
2. Investments in Fidelity Central Funds.
The Fund invests in Fidelity Central Funds, which are open-end investment companies generally available only to other investment companies and accounts managed by the investment adviser and its affiliates. The Fund's Schedule of Investments lists each of the Fidelity Central Funds held as of period end, if any, as an investment of the Fund, but does not include the underlying holdings of each Fidelity Central Fund. As an Investing Fund, the Fund indirectly bears its proportionate share of the expenses of the underlying Fidelity Central Funds.
The Money Market Central Funds seek preservation of capital and current income and are managed by Fidelity Investments Money Management, Inc. (FIMM), an affiliate of the investment adviser. Annualized expenses of the Money Market Central Funds as of their most recent shareholder report date are less than .005%.
A complete unaudited list of holdings for each Fidelity Central Fund is available upon request or at the Securities and Exchange Commission (the SEC) website at www.sec.gov. In addition, the financial statements of the Fidelity Central Funds are available on the SEC website or upon request.
3. Significant Accounting Policies.
The Fund is an investment company and applies the accounting and reporting guidance of the Financial Accounting Standards Board (FASB) Accounting Standards Codification Topic 946 Financial Services – Investments Companies. The financial statements have been prepared in conformity with accounting principles generally accepted in the United States of America (GAAP), which require management to make certain estimates and assumptions at the date of the financial statements. Actual results could differ from those estimates. Subsequent events, if any, through the date that the financial statements were issued have been evaluated in the preparation of the financial statements. The following summarizes the significant accounting policies of the Fund:
Investment Valuation. Investments are valued as of 4:00 p.m. Eastern time on the last calendar day of the period. The Board of Trustees (the Board) has delegated the day to day responsibility for the valuation of the Fund's investments to the Fair Value Committee (the Committee) established by the Fund's investment adviser. In accordance with valuation policies and procedures approved by the Board, the Fund attempts to obtain prices from one or more third party pricing vendors or brokers to value its investments. When current market prices, quotations or currency exchange rates are not readily available or reliable, investments will be fair valued in good faith by the Committee, in accordance with procedures adopted by the Board. Factors used in determining fair value vary by investment type and may include market or investment specific events. The frequency with which these procedures are used cannot be predicted and they may be utilized to a significant extent. The Committee oversees the Fund's valuation policies and procedures and reports to the Board on the Committee's activities and fair value determinations. The Board monitors the appropriateness of the procedures used in valuing the Fund's investments and ratifies the fair value determinations of the Committee.
The Fund categorizes the inputs to valuation techniques used to value its investments into a disclosure hierarchy consisting of three levels as shown below:
- Level 1 – quoted prices in active markets for identical investments
- Level 2 – other significant observable inputs (including quoted prices for similar investments, interest rates, prepayment speeds, etc.)
- Level 3 – unobservable inputs (including the Fund's own assumptions based on the best information available)
Valuation techniques used to value the Fund's investments by major category are as follows:
Equity securities, including restricted securities, for which market quotations are readily available, are valued at the last reported sale price or official closing price as reported by a third party pricing vendor on the primary market or exchange on which they are traded and are categorized as Level 1 in the hierarchy. In the event there were no sales during the day or closing prices are not available, securities are valued at the last quoted bid price or may be valued using the last available price and are generally categorized as Level 2 in the hierarchy. For foreign equity securities, when market or security specific events arise, comparisons to the valuation of American Depositary Receipts (ADRs), futures contracts, Exchange-Traded Funds (ETFs) and certain indexes as well as quoted prices for similar securities may be used and would be categorized as Level 2 in the hierarchy. Utilizing these techniques may result in transfers between Level 1 and Level 2. For equity securities, including restricted securities, where observable inputs are limited, assumptions about market activity and risk are used and these securities may be categorized as Level 3 in the hierarchy.
Investments in open-end mutual funds, including the Fidelity Central Funds, are valued at their closing net asset value (NAV) each business day and are categorized as Level 1 in the hierarchy.
Changes in valuation techniques may result in transfers in or out of an assigned level within the disclosure hierarchy. The aggregate value of investments by input level as of April 30, 2017, including information on transfers between Levels 1 and 2, is included at the end of the Fund's Schedule of Investments.
Foreign Currency. The Fund may use foreign currency contracts to facilitate transactions in foreign-denominated securities. Gains and losses from these transactions may arise from changes in the value of the foreign currency or if the counterparties do not perform under the contracts' terms.
Foreign-denominated assets, including investment securities, and liabilities are translated into U.S. dollars at the exchange rates at period end. Purchases and sales of investment securities, income and dividends received and expenses denominated in foreign currencies are translated into U.S. dollars at the exchange rate in effect on the transaction date.
The effects of exchange rate fluctuations on investments are included with the net realized and unrealized gain (loss) on investment securities. Other foreign currency transactions resulting in realized and unrealized gain (loss) are disclosed separately.
Investment Transactions and Income. For financial reporting purposes, the Fund's investment holdings and NAV include trades executed through the end of the last business day of the period. The NAV per share for processing shareholder transactions is calculated as of the close of business of the New York Stock Exchange (NYSE), normally 4:00 p.m. Eastern time and includes trades executed through the end of the prior business day. Gains and losses on securities sold are determined on the basis of identified cost. Dividend income is recorded on the ex-dividend date, except for certain dividends from foreign securities where the ex-dividend date may have passed, which are recorded as soon as the Fund is informed of the ex-dividend date. Non-cash dividends included in dividend income, if any, are recorded at the fair market value of the securities received. Income and capital gain distributions from Fidelity Central Funds, if any, are recorded on the ex-dividend date. Certain distributions received by the Fund represent a return of capital or capital gain. The Fund determines the components of these distributions subsequent to the ex-dividend date, based upon receipt of tax filings or other correspondence relating to the underlying investment. These distributions are recorded as a reduction of cost of investments and/or as a realized gain. Investment income is recorded net of foreign taxes withheld where recovery of such taxes is uncertain.
Class Allocations and Expenses. Investment income, realized and unrealized capital gains and losses, common expenses of the Fund, and certain fund-level expense reductions, if any, are allocated daily on a pro-rata basis to each class based on the relative net assets of each class to the total net assets of the Fund. Each class differs with respect to transfer agent and distribution and service plan fees incurred. Certain expense reductions may also differ by class. For the reporting period, the allocated portion of income and expenses to each class as a percent of its average net assets may vary due to the timing of recording these transactions in relation to fluctuating net assets of the classes. Expenses directly attributable to a fund are charged to that fund. Expenses attributable to more than one fund are allocated among the respective funds on the basis of relative net assets or other appropriate methods. Expense estimates are accrued in the period to which they relate and adjustments are made when actual amounts are known.
Income Tax Information and Distributions to Shareholders. Each year, the Fund intends to qualify as a regulated investment company under Subchapter M of the Internal Revenue Code, including distributing substantially all of its taxable income and realized gains. As a result, no provision for U.S. Federal income taxes is required. The Fund files a U.S. federal tax return, in addition to state and local tax returns as required. The Fund's federal income tax returns are subject to examination by the Internal Revenue Service (IRS) for a period of three fiscal years after they are filed. State and local tax returns may be subject to examination for an additional fiscal year depending on the jurisdiction. Foreign taxes are provided for based on the Fund's understanding of the tax rules and rates that exist in the foreign markets in which it invests.
Distributions are declared and recorded on the ex-dividend date. Income dividends and capital gain distributions are declared separately for each class. Income and capital gain distributions are determined in accordance with income tax regulations, which may differ from GAAP.
Capital accounts within the financial statements are adjusted for permanent book-tax differences. These adjustments have no impact on net assets or the results of operations. Capital accounts are not adjusted for temporary book-tax differences which will reverse in a subsequent period.
Book-tax differences are primarily due to foreign currency transactions, partnerships, passive foreign investment companies (PFIC), capital loss carryforwards, and losses deferred due to wash sales.
The federal tax cost of investment securities and unrealized appreciation (depreciation) as of period end were as follows:
| Gross unrealized appreciation | $28,543,190 |
| Gross unrealized depreciation | (18,515,633) |
| Net unrealized appreciation (depreciation) on securities | $10,027,557 |
| Tax cost | $359,066,731 |
Capital loss carryforwards are only available to offset future capital gains of the Fund to the extent provided by regulations and may be limited. Under the Regulated Investment Company Modernization Act of 2010 (the Act), the Fund is permitted to carry forward capital losses incurred in taxable years beginning after December 22, 2010 for an unlimited period and such capital losses are required to be used prior to any losses that expire. The capital loss carryforward information presented below, including any applicable limitation, is estimated as of prior fiscal period end and is subject to adjustment.
| Fiscal year of expiration | |
| 2017 | $(65,376,972) |
| 2018 | (3,571,319) |
| 2019 | (31,368,797) |
| Total with expiration | $(100,317,088) |
| No expiration | |
| Short-term | $(6,030,826) |
| Total capital loss carryforward | $(106,347,914) |
Short-Term Trading (Redemption) Fees. Shares held by investors in the Fund less than 30 days may have been subject to a redemption fee equal to 1.00% of the NAV of shares redeemed. All redemption fees, which reduce the proceeds of the shareholder redemption, are retained by the Fund and accounted for as an addition to paid in capital.
4. Purchases and Sales of Investments.
Purchases and sales of securities, other than short-term securities, aggregated $85,165,131 and $93,403,567, respectively.
5. Fees and Other Transactions with Affiliates.
Management Fee. Fidelity Management & Research Company (the investment adviser) and its affiliates provide the Fund with investment management related services for which the Fund pays a monthly management fee. The management fee is the sum of an individual fund fee rate that is based on an annual rate of .45% of the Fund's average net assets and an annualized group fee rate that averaged .25% during the period. The group fee rate is based upon the average net assets of all the mutual funds advised by the investment adviser, including any mutual funds previously advised by the investment adviser that are currently advised by Fidelity SelectCo, LLC, an affiliate of the investment adviser. The group fee rate decreases as assets under management increase and increases as assets under management decrease. In addition, the management fee is subject to a performance adjustment (up to a maximum of +/- .20% of the Fund's average net assets over a 36 month performance period). The upward or downward adjustment to the management fee is based on the relative investment performance of the International Value as compared to its benchmark index, the MSCI EAFE Value Index, over the same 36 month performance period. For the reporting period, the total annualized management fee rate, including the performance adjustment, was .68% of the Fund's average net assets. The performance adjustment included in the management fee rate may be higher or lower than the maximum performance adjustment rate due to the difference between the average net assets for the reporting and performance periods.
Distribution and Service Plan Fees. In accordance with Rule 12b-1 of the 1940 Act, the Fund has adopted separate Distribution and Service Plans for each class of shares. Certain classes pay Fidelity Distributors Corporation (FDC), an affiliate of the investment adviser, separate Distribution and Service Fees, each of which is based on an annual percentage of each class' average net assets. In addition, FDC may pay financial intermediaries for selling shares of the Fund and providing shareholder support services. For the period, the Distribution and Service Fee rates, total fees and amounts retained by FDC were as follows:
| | Distribution
Fee | Service
Fee | Total Fees | Retained
by FDC |
| Class A | -% | .25% | $9,309 | $– |
| Class M | .25% | .25% | 9,128 | – |
| Class C | .75% | .25% | 21,431 | 2,539 |
| | | | $39,868 | $2,539 |
Sales Loads. FDC may receive a front-end sales charge of up to 5.75% for selling Class A shares and 3.50% for selling Class M shares, some of which is paid to financial intermediaries for selling shares of the Fund. Depending on the holding period, FDC may receive contingent deferred sales charges levied on Class A, Class M and Class C redemptions. The deferred sales charges are 1.00% for Class C shares, 1.00% for certain purchases of Class A shares and .25% for certain purchases of Class M shares.
For the period, sales charge amounts retained by FDC were as follows:
| | Retained
by FDC |
| Class A | $2,144 |
| Class M | 731 |
| Class C(a) | 501 |
| | $3,376 |
(a) When Class C shares are initially sold, FDC pays commissions from its own resources to financial intermediaries through which the sales are made.
Transfer Agent Fees. Fidelity Investments Institutional Operations Company, Inc., (FIIOC), an affiliate of the investment adviser, is the transfer, dividend disbursing and shareholder servicing agent for each class of the Fund. FIIOC receives account fees and asset-based fees that vary according to the account size and type of account of the shareholders of the respective classes of the Fund. FIIOC pays for typesetting, printing and mailing of shareholder reports, except proxy statements.
For the period, transfer agent fees for each class were as follows:
| | Amount | % of
Class-Level Average
Net Assets(a) |
| Class A | $10,312 | .28 |
| Class M | 5,999 | .33 |
| Class C | 6,540 | .31 |
| International Value | 254,989 | .16 |
| Class I | 3,832 | .29 |
| | $281,672 | |
(a) Annualized
Accounting and Security Lending Fees. Fidelity Service Company, Inc. (FSC), an affiliate of the investment adviser, maintains the Fund's accounting records. The accounting fee is based on the level of average net assets for each month. Under a separate contract, FSC administers the security lending program. The security lending fee is based on the number and duration of lending transactions.
Brokerage Commissions. The Fund placed a portion of its portfolio transactions with brokerage firms which are affiliates of the investment adviser. Brokerage commissions are included in net realized gain (loss) and change in net unrealized appreciation (depreciation) in the Statement of Operations. The commissions paid to these affiliated firms were $120 for the period.
Interfund Trades. The Fund may purchase from or sell securities to other Fidelity Funds under procedures adopted by the Board. The procedures have been designed to ensure these interfund trades are executed in accordance with Rule 17a-7 of the 1940 Act. Interfund trades are included within the respective purchases and sales amounts shown in the Purchases and Sales of Investments note.
6. Committed Line of Credit.
The Fund participates with other funds managed by the investment adviser or an affiliate in a $4.25 billion credit facility (the "line of credit") to be utilized for temporary or emergency purposes to fund shareholder redemptions or for other short-term liquidity purposes. The Fund has agreed to pay commitment fees on its pro-rata portion of the line of credit, which amounted to $558 and is reflected in Miscellaneous expenses on the Statement of Operations. During the period, the Fund did not borrow on this line of credit.
7. Security Lending.
The Fund lends portfolio securities through a lending agent from time to time in order to earn additional income. For equity securities, a lending agent is used and may loan securities to certain qualified borrowers, including Fidelity Capital Markets (FCM), a broker-dealer affiliated with the Fund. On the settlement date of the loan, the Fund receives collateral (in the form of U.S. Treasury obligations, letters of credit and/or cash) against the loaned securities and maintains collateral in an amount not less than 100% of the market value of the loaned securities during the period of the loan. The market value of the loaned securities is determined at the close of business of the Fund and any additional required collateral is delivered to the Fund on the next business day. The Fund or borrower may terminate the loan at any time, and if the borrower defaults on its obligation to return the securities loaned because of insolvency or other reasons, the Fund may apply collateral received from the borrower against the obligation. The Fund may experience delays and costs in recovering the securities loaned. Any cash collateral received is invested in the Fidelity Securities Lending Cash Central Fund. The value of loaned securities and cash collateral at period end are disclosed on the Fund's Statement of Assets and Liabilities. At period end, there were no security loans outstanding with FCM. Security lending income represents the income earned on investing cash collateral, less rebates paid to borrowers and any lending agent fees associated with the loan, plus any premium payments received for lending certain types of securities. Security lending income is presented in the Statement of Operations as a component of income from Fidelity Central Funds, Total security lending income during the period amounted to $84,398, including $36 from securities loaned to FCM.
8. Expense Reductions.
Commissions paid to certain brokers with whom the investment adviser, or its affiliates, places trades on behalf of the Fund include an amount in addition to trade execution, which may be rebated back to the Fund to offset certain expenses. This amount totaled $23,160 for the period.
In addition, during the period the investment adviser reimbursed and/or waived a portion of fund-level operating expenses in the amount of $1,467.
9. Distributions to Shareholders.
Distributions to shareholders of each class were as follows:
| | Six months ended April 30, 2017 | Year ended October 31, 2016 |
| From net investment income | | |
| Class A | $160,715 | $95,726 |
| Class M | 64,948 | 30,318 |
| Class B | – | 141 |
| Class C | 57,557 | 10,293 |
| International Value | 7,786,373 | 3,924,604 |
| Class I | 54,529 | 23,301 |
| Total | $8,124,122 | $4,084,383 |
| From net realized gain | | |
| Class A | $10,650 | $– |
| Class M | 5,031 | – |
| Class C | 5,917 | – |
| International Value | 432,576 | – |
| Class I | 3,157 | – |
| Total | $457,331 | $– |
10. Share Transactions.
Share transactions for each class were as follows and may contain automatic conversions between classes or exchanges between affiliated funds:
| | Shares | Shares | Dollars | Dollars |
| | Six months ended April 30, 2017 | Year ended October 31, 2016 | Six months ended April 30, 2017 | Year ended October 31, 2016 |
| Class A | | | | |
| Shares sold | 116,678 | 238,095 | $923,543 | $1,848,202 |
| Reinvestment of distributions | 21,396 | 11,425 | 166,672 | 93,224 |
| Shares redeemed | (276,809) | (340,144) | (2,196,972) | (2,620,114) |
| Net increase (decrease) | (138,735) | (90,624) | $(1,106,757) | $(678,688) |
| Class M | | | | |
| Shares sold | 57,884 | 88,717 | $457,214 | $694,653 |
| Reinvestment of distributions | 8,935 | 3,669 | 69,695 | 29,980 |
| Shares redeemed | (93,719) | (110,449) | (736,404) | (851,756) |
| Net increase (decrease) | (26,900) | (18,063) | $(209,495) | $(127,123) |
| Class B | | | | |
| Shares sold | – | 2 | $– | $14 |
| Reinvestment of distributions | – | 15 | – | 124 |
| Shares redeemed | – | (36,263) | – | (277,663) |
| Net increase (decrease) | – | (36,246) | $– | $(277,525) |
| Class C | | | | |
| Shares sold | 47,485 | 105,656 | $372,008 | $808,615 |
| Reinvestment of distributions | 7,631 | 1,181 | 59,598 | 9,659 |
| Shares redeemed | (54,626) | (115,602) | (428,429) | (896,778) |
| Net increase (decrease) | 490 | (8,765) | $3,177 | $(78,504) |
| International Value | | | | |
| Shares sold | 1,089,831 | 10,653,545 | $8,608,702 | $82,568,730 |
| Reinvestment of distributions | 1,033,790 | 470,177 | 8,032,545 | 3,831,944 |
| Shares redeemed | (2,538,371) | (3,741,188) | (19,917,454) | (28,527,423) |
| Net increase (decrease) | (414,750) | 7,382,534 | $(3,276,207) | $57,873,251 |
| Class I | | | | |
| Shares sold | 262,937 | 73,854 | $2,096,088 | $567,094 |
| Reinvestment of distributions | 6,933 | 2,528 | 54,005 | 20,650 |
| Shares redeemed | (46,806) | (63,368) | (369,360) | (499,837) |
| Net increase (decrease) | 223,064 | 13,014 | $1,780,733 | $87,907 |
11. Other.
The Fund's organizational documents provide former and current trustees and officers with a limited indemnification against liabilities arising in connection with the performance of their duties to the Fund. In the normal course of business, the Fund may also enter into contracts that provide general indemnifications. The Fund's maximum exposure under these arrangements is unknown as this would be dependent on future claims that may be made against the Fund. The risk of material loss from such claims is considered remote.
At the end of the period, Strategic Advisers International II Fund was the owner of record of approximately 69% of the total outstanding shares of the Fund.
Shareholder Expense Example
As a shareholder of the Fund, you incur two types of costs: (1) transaction costs, including sales charges (loads) on purchase payments or redemption proceeds, redemption fees and (2) ongoing costs, including management fees, distribution and/or service (12b-1) fees and other Fund expenses. This Example is intended to help you understand your ongoing costs (in dollars) of investing in the Fund and to compare these costs with the ongoing costs of investing in other mutual funds.
The Example is based on an investment of $1,000 invested at the beginning of the period and held for the entire period (November 1, 2016 to April 30, 2017).
Actual Expenses
The first line of the accompanying table for each class of the Fund provides information about actual account values and actual expenses. You may use the information in this line, together with the amount you invested, to estimate the expenses that you paid over the period. Simply divide your account value by $1,000.00 (for example, an $8,600 account value divided by $1,000.00 = 8.6), then multiply the result by the number in the first line for a class of the Fund under the heading entitled "Expenses Paid During Period" to estimate the expenses you paid on your account during this period. A small balance maintenance fee of $12.00 that is charged once a year may apply for certain accounts with a value of less than $2,000. This fee is not included in the table below. If it was, the estimate of expenses you paid during the period would be higher, and your ending account value lower, by this amount. In addition, the Fund, as a shareholder in the underlying Fidelity Central Funds, will indirectly bear its pro-rata share of the fees and expenses incurred by the underlying Fidelity Central Funds. These fees and expenses are not included in the Fund's annualized expense ratio used to calculate the expense estimate in the table below.
Hypothetical Example for Comparison Purposes
The second line of the accompanying table for each class of the Fund provides information about hypothetical account values and hypothetical expenses based on a Class' actual expense ratio and an assumed rate of return of 5% per year before expenses, which is not the Class' actual return. The hypothetical account values and expenses may not be used to estimate the actual ending account balance or expenses you paid for the period. You may use this information to compare the ongoing costs of investing in the Fund and other funds. To do so, compare this 5% hypothetical example with the 5% hypothetical examples that appear in the shareholder reports of the other funds. A small balance maintenance fee of $12.00 that is charged once a year may apply for certain accounts with a value of less than $2,000. This fee is not included in the table below. If it was, the estimate of expenses you paid during the period would be higher, and your ending account value lower, by this amount. In addition, the Fund, as a shareholder in the underlying Fidelity Central Funds, will indirectly bear its pro-rata share of the fees and expenses incurred by the underlying Fidelity Central Funds. These fees and expenses are not included in the Fund's annualized expense ratio used to calculate the expense estimate in the table below.
Please note that the expenses shown in the table are meant to highlight your ongoing costs only and do not reflect any transaction costs. Therefore, the second line of the table is useful in comparing ongoing costs only, and will not help you determine the relative total costs of owning different funds. In addition, if these transactional costs were included, your costs would have been higher.
| | Annualized Expense Ratio-A | Beginning
Account Value
November 1, 2016 | Ending
Account Value
April 30, 2017 | Expenses Paid
During Period-B
November 1, 2016
to April 30, 2017 |
| Class A | 1.35% | | | |
| Actual | | $1,000.00 | $1,101.60 | $7.03 |
| Hypothetical-C | | $1,000.00 | $1,018.10 | $6.76 |
| Class M | 1.66% | | | |
| Actual | | $1,000.00 | $1,099.80 | $8.64 |
| Hypothetical-C | | $1,000.00 | $1,016.56 | $8.30 |
| | | | | |
| | | | | |
| | | | | |
| Class C | 2.13% | | | |
| Actual | | $1,000.00 | $1,096.30 | $11.07 |
| Hypothetical-C | | $1,000.00 | $1,014.23 | $10.64 |
| International Value | .99% | | | |
| Actual | | $1,000.00 | $1,103.40 | $5.16 |
| Hypothetical-C | | $1,000.00 | $1,019.89 | $4.96 |
| Class I | 1.12% | | | |
| Actual | | $1,000.00 | $1,103.40 | $5.84 |
| Hypothetical-C | | $1,000.00 | $1,019.24 | $5.61 |
A Annualized expense ratio reflects expenses net of applicable fee waivers.
B Expenses are equal to each Class' annualized expense ratio, multiplied by the average account value over the period, multiplied by 181/365 (to reflect the one-half year period).
C 5% return per year before expenses
Corporate Headquarters
245 Summer St.
Boston, MA 02210
www.fidelity.com
FIV-SANN-0617
1.827485.110
Fidelity Advisor® Total International Equity Fund -
Class A, Class M (formerly Class T), Class C, Class I and Class Z
Semi-Annual Report April 30, 2017 Class A, Class M, Class C, Class I and Class Z are classes of Fidelity® Total International Equity Fund |
|
Contents
To view a fund's proxy voting guidelines and proxy voting record for the 12-month period ended June 30, visit http://www.fidelity.com/proxyvotingresults or visit the Securities and Exchange Commission's (SEC) web site at http://www.sec.gov.
You may also call 1-877-208-0098 to request a free copy of the proxy voting guidelines.
Standard & Poor's, S&P and S&P 500 are registered service marks of The McGraw-Hill Companies, Inc. and have been licensed for use by Fidelity Distributors Corporation.
Other third-party marks appearing herein are the property of their respective owners.
All other marks appearing herein are registered or unregistered trademarks or service marks of FMR LLC or an affiliated company. © 2017 FMR LLC. All rights reserved.
This report and the financial statements contained herein are submitted for the general information of the shareholders of the Fund. This report is not authorized for distribution to prospective investors in the Fund unless preceded or accompanied by an effective prospectus.
A fund files its complete schedule of portfolio holdings with the SEC for the first and third quarters of each fiscal year on Form N-Q. Forms N-Q are available on the SEC’s web site at http://www.sec.gov. A fund's Forms N-Q may be reviewed and copied at the SEC’s Public Reference Room in Washington, DC. Information regarding the operation of the SEC's Public Reference Room may be obtained by calling 1-800-SEC-0330.
For a complete list of a fund's portfolio holdings, view the most recent holdings listing, semiannual report, or annual report on Fidelity's web site at http://www.fidelity.com, http://www.institutional.fidelity.com, or http://www.401k.com, as applicable.
NOT FDIC INSURED •MAY LOSE VALUE •NO BANK GUARANTEE
Neither the Fund nor Fidelity Distributors Corporation is a bank.
Investment Summary (Unaudited)
Geographic Diversification (% of fund's net assets)
| As of April 30, 2017 |
| | Japan | 12.7% |
| | United States of America* | 11.3% |
| | United Kingdom | 11.0% |
| | Switzerland | 5.9% |
| | France | 5.5% |
| | Canada | 4.8% |
| | Germany | 4.4% |
| | Sweden | 3.5% |
| | India | 3.3% |
| | Other | 37.6% |
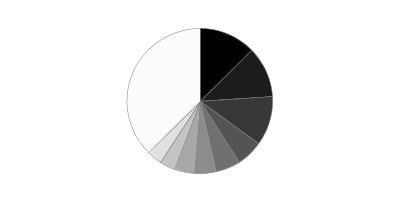
* Includes Short-Term investments and Net Other Assets (Liabilities).
Percentages are based on country or territory of incorporation and are adjusted for the effect of futures contracts, if applicable.
| As of October 31, 2016 |
| | Japan | 13.7% |
| | United States of America* | 11.7% |
| | United Kingdom | 11.5% |
| | Switzerland | 6.9% |
| | France | 5.4% |
| | Canada | 5.1% |
| | Germany | 3.9% |
| | Cayman Islands | 3.5% |
| | Australia | 3.2% |
| | Other | 35.1% |
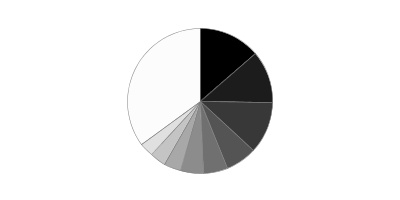
* Includes Short-Term investments and Net Other Assets (Liabilities).
Percentages are based on country or territory of incorporation and are adjusted for the effect of futures contracts, if applicable.
Asset Allocation as of April 30, 2017
| | % of fund's net assets | % of fund's net assets 6 months ago |
| Stocks | 97.5 | 98.3 |
| Investment Companies | 0.4 | 0.0 |
| Short-Term Investments and Net Other Assets (Liabilities) | 2.1 | 1.7 |
Top Ten Stocks as of April 30, 2017
| | % of fund's net assets | % of fund's net assets 6 months ago |
| Nestle SA (Reg. S) (Switzerland, Food Products) | 2.1 | 2.2 |
| Samsung Electronics Co. Ltd. (Korea (South), Technology Hardware, Storage & Peripherals) | 1.3 | 0.8 |
| Taiwan Semiconductor Manufacturing Co. Ltd. (Taiwan, Semiconductors & Semiconductor Equipment) | 1.3 | 1.3 |
| Anheuser-Busch InBev SA NV (Belgium, Beverages) | 1.3 | 1.3 |
| SAP AG (Germany, Software) | 1.2 | 1.0 |
| Alibaba Group Holding Ltd. sponsored ADR (Cayman Islands, Internet Software & Services) | 1.1 | 1.0 |
| Tencent Holdings Ltd. (Cayman Islands, Internet Software & Services) | 1.1 | 1.0 |
| Naspers Ltd. Class N (South Africa, Media) | 1.1 | 1.0 |
| British American Tobacco PLC (United Kingdom) (United Kingdom, Tobacco) | 1.1 | 0.2 |
| AIA Group Ltd. (Hong Kong, Insurance) | 1.0 | 1.1 |
| | 12.6 | |
Top Market Sectors as of April 30, 2017
| | % of fund's net assets | % of fund's net assets 6 months ago |
| Financials | 19.3 | 17.1 |
| Information Technology | 15.5 | 14.4 |
| Industrials | 12.9 | 11.5 |
| Consumer Staples | 12.2 | 14.1 |
| Consumer Discretionary | 10.0 | 12.1 |
| Health Care | 9.9 | 11.8 |
| Materials | 8.9 | 7.7 |
| Energy | 4.2 | 4.0 |
| Real Estate | 1.8 | 2.1 |
| Telecommunication Services | 1.8 | 1.7 |
Percentages shown as 0.0% may reflect amounts less than 0.05%.
Investments April 30, 2017 (Unaudited)
Showing Percentage of Net Assets
| Common Stocks - 96.2% | | | |
| | | Shares | Value |
| Australia - 3.3% | | | |
| Adelaide Brighton Ltd. | | 14,945 | $66,250 |
| Amcor Ltd. | | 37,925 | 446,136 |
| Australia & New Zealand Banking Group Ltd. | | 78,388 | 1,922,912 |
| Beacon Lighting Group Ltd. | | 45,008 | 60,664 |
| CSL Ltd. | | 33,974 | 3,372,036 |
| DuluxGroup Ltd. | | 31,910 | 161,764 |
| Imdex Ltd. (a) | | 150,407 | 69,827 |
| Insurance Australia Group Ltd. | | 168,220 | 782,231 |
| Macquarie Group Ltd. | | 11,919 | 830,020 |
| Magellan Financial Group Ltd. | | 23,701 | 418,482 |
| Quintis Ltd. | | 54,330 | 48,819 |
| RCG Corp. Ltd. | | 128,117 | 79,625 |
| Transurban Group unit | | 93,952 | 858,285 |
| Westpac Banking Corp. | | 93,378 | 2,447,883 |
|
| TOTAL AUSTRALIA | | | 11,564,934 |
|
| Austria - 0.7% | | | |
| Andritz AG | | 28,872 | 1,596,730 |
| Buwog-Gemeinnuetzige Wohnung | | 26,449 | 714,222 |
|
| TOTAL AUSTRIA | | | 2,310,952 |
|
| Bailiwick of Jersey - 0.2% | | | |
| Integrated Diagnostics Holdings PLC | | 8,000 | 24,080 |
| Wolseley PLC | | 12,877 | 818,425 |
|
| TOTAL BAILIWICK OF JERSEY | | | 842,505 |
|
| Belgium - 1.9% | | | |
| Anheuser-Busch InBev SA NV | | 38,371 | 4,327,112 |
| KBC Ancora (a) | | 1,311 | 62,350 |
| KBC Groep NV | | 29,595 | 2,136,724 |
|
| TOTAL BELGIUM | | | 6,526,186 |
|
| Bermuda - 0.2% | | | |
| Credicorp Ltd. (United States) | | 3,800 | 583,908 |
| Vostok New Ventures Ltd. (depositary receipt) (a) | | 12,960 | 100,961 |
|
| TOTAL BERMUDA | | | 684,869 |
|
| Brazil - 1.7% | | | |
| BB Seguridade Participacoes SA | | 61,600 | 580,087 |
| Cielo SA | | 78,403 | 595,300 |
| Drogasil SA (a) | | 27,000 | 573,762 |
| Equatorial Energia SA | | 27,300 | 494,471 |
| Itau Unibanco Holding SA | | 13,400 | 143,792 |
| Kroton Educacional SA | | 123,500 | 581,694 |
| Qualicorp SA | | 73,600 | 524,050 |
| Smiles SA | | 22,200 | 482,881 |
| Ultrapar Participacoes SA | | 25,700 | 570,184 |
| Vale SA sponsored ADR | | 102,700 | 881,166 |
| Weg SA (a) | | 94,600 | 527,534 |
|
| TOTAL BRAZIL | | | 5,954,921 |
|
| Canada - 4.8% | | | |
| Alimentation Couche-Tard, Inc. Class B (sub. vtg.) | | 61,903 | 2,846,980 |
| Canadian National Railway Co. | | 31,059 | 2,245,040 |
| Canadian Pacific Railway Ltd. | | 6,000 | 919,351 |
| CCL Industries, Inc. Class B | | 8,166 | 1,890,375 |
| Constellation Software, Inc. | | 3,662 | 1,674,881 |
| Franco-Nevada Corp. | | 22,200 | 1,509,870 |
| Imperial Oil Ltd. | | 63,726 | 1,853,822 |
| McCoy Global, Inc. (a) | | 12,300 | 17,571 |
| New Look Vision Group, Inc. | | 3,500 | 73,074 |
| Pason Systems, Inc. | | 57,978 | 860,931 |
| Potash Corp. of Saskatchewan, Inc. | | 124,626 | 2,101,674 |
| PrairieSky Royalty Ltd. | | 40,400 | 880,481 |
| ShawCor Ltd. Class A | | 2,500 | 62,727 |
| Tesco Corp. (a) | | 4,900 | 32,095 |
|
| TOTAL CANADA | | | 16,968,872 |
|
| Cayman Islands - 3.1% | | | |
| 58.com, Inc. ADR (a) | | 4,600 | 182,068 |
| Alibaba Group Holding Ltd. sponsored ADR (a) | | 34,800 | 4,019,400 |
| Ctrip.com International Ltd. ADR (a) | | 15,800 | 798,058 |
| NetEase, Inc. ADR | | 3,100 | 822,709 |
| New Oriental Education & Technology Group, Inc. sponsored ADR (a) | | 9,900 | 638,946 |
| Shenzhou International Group Holdings Ltd. | | 77,000 | 506,843 |
| Tencent Holdings Ltd. | | 128,100 | 4,013,801 |
|
| TOTAL CAYMAN ISLANDS | | | 10,981,825 |
|
| Chile - 0.2% | | | |
| Sociedad Quimica y Minera de Chile SA (PN-B) sponsored ADR | | 14,600 | 519,030 |
| China - 1.3% | | | |
| Gree Electric Appliances, Inc. of Zhuhai Class A | | 101,600 | 486,371 |
| Hangzhou Hikvision Digital Technology Co. Ltd. Class A | | 99,700 | 528,908 |
| Inner Mongoli Yili Industries Co. Ltd. (A Shares) | | 145,000 | 384,086 |
| Jiangsu Hengrui Medicine Co. Ltd. (A Shares) | | 60,416 | 470,024 |
| Kweichow Moutai Co. Ltd. (A Shares) | | 8,294 | 497,484 |
| Midea Group Co. Ltd. Class A | | 92,400 | 451,176 |
| Shanghai International Airport Co. Ltd. (A Shares) | | 102,000 | 506,782 |
| Sinopharm Group Co. Ltd. (H Shares) | | 112,400 | 504,318 |
| Wuliangye Yibin Co. Ltd. Class A | | 68,900 | 454,769 |
| Yunnan Baiyao Group Co. Ltd. | | 35,200 | 436,585 |
|
| TOTAL CHINA | | | 4,720,503 |
|
| Denmark - 0.6% | | | |
| Jyske Bank A/S (Reg.) | | 15,454 | 825,858 |
| Novo Nordisk A/S Series B sponsored ADR | | 26,200 | 1,013,416 |
| Scandinavian Tobacco Group A/S | | 5,098 | 88,995 |
| Spar Nord Bank A/S | | 12,031 | 136,375 |
|
| TOTAL DENMARK | | | 2,064,644 |
|
| Finland - 0.5% | | | |
| Sampo Oyj (A Shares) (b) | | 24,753 | 1,186,122 |
| Tikkurila Oyj | | 26,780 | 530,920 |
|
| TOTAL FINLAND | | | 1,717,042 |
|
| France - 5.5% | | | |
| Atos Origin SA | | 11,748 | 1,539,491 |
| AXA SA | | 58,506 | 1,560,949 |
| Bouygues SA | | 11,367 | 477,886 |
| Capgemini SA | | 8,802 | 881,274 |
| Compagnie de St. Gobain | | 19,100 | 1,030,919 |
| Dassault Systemes SA | | 5,100 | 455,156 |
| Elis SA | | 7,978 | 165,118 |
| Essilor International SA | | 7,184 | 930,847 |
| Havas SA | | 70,804 | 654,729 |
| Laurent-Perrier Group SA | | 959 | 73,835 |
| LVMH Moet Hennessy - Louis Vuitton SA | | 1,849 | 456,461 |
| Natixis SA | | 87,400 | 608,073 |
| Sanofi SA | | 23,398 | 2,210,967 |
| Societe Generale Series A | | 30,300 | 1,661,432 |
| SR Teleperformance SA | | 6,600 | 829,295 |
| Total SA | | 65,220 | 3,347,954 |
| Vetoquinol SA | | 1,900 | 104,353 |
| VINCI SA | | 18,400 | 1,568,390 |
| Virbac SA (a) | | 730 | 114,945 |
| Vivendi SA | | 40,552 | 804,617 |
|
| TOTAL FRANCE | | | 19,476,691 |
|
| Germany - 4.3% | | | |
| Axel Springer Verlag AG | | 9,100 | 510,600 |
| BASF AG | | 19,214 | 1,872,381 |
| Bayer AG | | 18,600 | 2,301,437 |
| Brenntag AG | | 9,100 | 539,644 |
| CompuGroup Medical AG | | 8,046 | 396,156 |
| CTS Eventim AG | | 6,855 | 264,076 |
| Deutsche Telekom AG | | 90,600 | 1,589,197 |
| Fielmann AG | | 1,258 | 96,170 |
| Fresenius SE & Co. KGaA | | 10,800 | 875,392 |
| HeidelbergCement Finance AG | | 8,700 | 805,537 |
| Linde AG | | 2,600 | 467,168 |
| Nexus AG | | 1,120 | 26,962 |
| SAP AG | | 40,555 | 4,062,234 |
| Symrise AG | | 6,700 | 469,062 |
| Vonovia SE | | 19,800 | 716,817 |
|
| TOTAL GERMANY | | | 14,992,833 |
|
| Greece - 0.1% | | | |
| Titan Cement Co. SA (Reg.) | | 18,200 | 475,608 |
| Hong Kong - 1.6% | | | |
| AIA Group Ltd. | | 507,400 | 3,512,762 |
| CSPC Pharmaceutical Group Ltd. | | 402,000 | 558,165 |
| Guangdong Investment Ltd. | | 362,000 | 560,335 |
| Power Assets Holdings Ltd. | | 63,000 | 566,958 |
| Techtronic Industries Co. Ltd. | | 106,500 | 457,308 |
|
| TOTAL HONG KONG | | | 5,655,528 |
|
| India - 3.1% | | | |
| Adani Ports & Special Economic Zone Ltd. (a) | | 102,012 | 519,977 |
| Amara Raja Batteries Ltd. (a) | | 33,484 | 463,589 |
| Asian Paints Ltd. | | 31,871 | 555,450 |
| Eicher Motors Ltd. | | 1,318 | 534,416 |
| Godrej Consumer Products Ltd. | | 20,772 | 563,096 |
| HDFC Bank Ltd. | | 22,840 | 557,567 |
| Hero Motocorp Ltd. | | 9,107 | 470,096 |
| Hindustan Zinc Ltd. | | 101,004 | 420,968 |
| Housing Development Finance Corp. Ltd. | | 97,641 | 2,334,560 |
| IndusInd Bank Ltd. (a) | | 23,629 | 531,074 |
| ITC Ltd. | | 170,410 | 736,879 |
| Jyothy Laboratories Ltd. | | 20,604 | 128,194 |
| LIC Housing Finance Ltd. | | 56,230 | 585,040 |
| Maruti Suzuki India Ltd. | | 6,535 | 663,243 |
| Power Grid Corp. of India Ltd. | | 145,676 | 471,311 |
| Reliance Industries Ltd. | | 45,576 | 989,075 |
| Zee Entertainment Enterprises Ltd. | | 67,048 | 549,452 |
|
| TOTAL INDIA | | | 11,073,987 |
|
| Indonesia - 0.8% | | | |
| PT Bank Central Asia Tbk | | 586,000 | 780,366 |
| PT Bank Rakyat Indonesia Tbk | | 1,154,000 | 1,116,858 |
| PT Surya Citra Media Tbk | | 205,900 | 44,180 |
| PT Telkomunikasi Indonesia Tbk Series B | | 2,393,600 | 789,616 |
|
| TOTAL INDONESIA | | | 2,731,020 |
|
| Ireland - 1.8% | | | |
| Accenture PLC Class A | | 3,800 | 460,940 |
| Allergan PLC | | 2,000 | 487,720 |
| CRH PLC | | 17,248 | 628,243 |
| CRH PLC sponsored ADR | | 62,529 | 2,271,053 |
| FBD Holdings PLC (a) | | 5,372 | 47,692 |
| James Hardie Industries PLC CDI | | 115,299 | 1,957,235 |
| Medtronic PLC | | 7,500 | 623,175 |
|
| TOTAL IRELAND | | | 6,476,058 |
|
| Isle of Man - 0.2% | | | |
| Playtech Ltd. | | 61,992 | 770,001 |
| Israel - 0.7% | | | |
| Azrieli Group | | 7,196 | 383,265 |
| Check Point Software Technologies Ltd. (a) | | 4,200 | 436,842 |
| Elbit Systems Ltd. (Israel) | | 3,496 | 416,512 |
| Frutarom Industries Ltd. | | 8,700 | 511,411 |
| Ituran Location & Control Ltd. | | 5,661 | 177,189 |
| Strauss Group Ltd. | | 8,059 | 141,719 |
| Teva Pharmaceutical Industries Ltd. sponsored ADR | | 15,009 | 473,984 |
|
| TOTAL ISRAEL | | | 2,540,922 |
|
| Italy - 0.9% | | | |
| Azimut Holding SpA | | 21,514 | 419,959 |
| Beni Stabili SpA SIIQ | | 121,626 | 77,240 |
| Interpump Group SpA | | 52,991 | 1,405,557 |
| Intesa Sanpaolo SpA | | 377,900 | 1,103,129 |
|
| TOTAL ITALY | | | 3,005,885 |
|
| Japan - 12.7% | | | |
| AEON Financial Service Co. Ltd. | | 23,400 | 449,423 |
| Ai Holdings Corp. | | 4,100 | 100,850 |
| Aoki Super Co. Ltd. | | 6,000 | 74,277 |
| Artnature, Inc. | | 11,000 | 70,455 |
| Asahi Co. Ltd. | | 6,300 | 80,647 |
| Astellas Pharma, Inc. | | 91,800 | 1,210,577 |
| Azbil Corp. | | 10,700 | 359,946 |
| Broadleaf Co. Ltd. | | 3,900 | 25,294 |
| Central Automotive Products Ltd. | | 5,100 | 52,841 |
| Coca-Cola West Co. Ltd. | | 1,800 | 53,528 |
| Daiichikosho Co. Ltd. | | 4,100 | 177,829 |
| Daikokutenbussan Co. Ltd. | | 4,000 | 191,254 |
| DENSO Corp. | | 25,000 | 1,076,250 |
| Dentsu, Inc. | | 6,600 | 371,814 |
| East Japan Railway Co. | | 18,200 | 1,625,143 |
| Funai Soken Holdings, Inc. | | 4,200 | 80,703 |
| GCA Savvian Group Corp. | | 10,100 | 81,634 |
| Goldcrest Co. Ltd. | | 10,060 | 178,684 |
| Hoya Corp. | | 45,900 | 2,192,165 |
| Hub Co. Ltd. | | 500 | 9,554 |
| Itochu Corp. | | 79,200 | 1,119,706 |
| Japan Tobacco, Inc. | | 8,620 | 286,573 |
| Kao Corp. | | 11,200 | 617,695 |
| KDDI Corp. | | 48,300 | 1,280,630 |
| Keyence Corp. | | 6,142 | 2,468,370 |
| Kobayashi Pharmaceutical Co. Ltd. | | 4,300 | 225,270 |
| Komatsu Ltd. | | 71,600 | 1,913,263 |
| Koshidaka Holdings Co. Ltd. | | 4,000 | 98,784 |
| Kusuri No Aoki Holdings Co. Ltd. | | 1,700 | 73,429 |
| Lasertec Corp. | | 12,600 | 164,006 |
| Makita Corp. | | 21,000 | 748,823 |
| Medikit Co. Ltd. | | 1,900 | 79,085 |
| Miroku Jyoho Service Co., Ltd. | | 3,200 | 60,656 |
| Misumi Group, Inc. | | 56,100 | 1,062,365 |
| Mitsubishi UFJ Financial Group, Inc. | | 437,000 | 2,769,093 |
| Mitsui Fudosan Co. Ltd. | | 34,000 | 747,100 |
| Nabtesco Corp. | | 3,700 | 104,885 |
| Nagaileben Co. Ltd. | | 9,500 | 218,847 |
| Nakano Refrigerators Co. Ltd. | | 700 | 19,215 |
| ND Software Co. Ltd. | | 5,500 | 49,684 |
| Nihon Parkerizing Co. Ltd. | | 23,700 | 304,236 |
| Nintendo Co. Ltd. | | 3,400 | 860,423 |
| Nippon Telegraph & Telephone Corp. | | 22,900 | 981,394 |
| Nomura Holdings, Inc. | | 142,700 | 857,574 |
| NS Tool Co. Ltd. | | 7,600 | 109,424 |
| OBIC Co. Ltd. | | 19,900 | 1,074,662 |
| Olympus Corp. | | 50,800 | 1,954,985 |
| ORIX Corp. | | 73,500 | 1,121,538 |
| OSG Corp. | | 42,500 | 874,972 |
| Panasonic Corp. | | 50,000 | 597,913 |
| Paramount Bed Holdings Co. Ltd. | | 4,600 | 192,913 |
| ProNexus, Inc. | | 7,900 | 98,932 |
| Recruit Holdings Co. Ltd. | | 16,600 | 838,376 |
| San-Ai Oil Co. Ltd. | | 11,400 | 96,743 |
| Seven & i Holdings Co. Ltd. | | 18,800 | 794,331 |
| Shin-Etsu Chemical Co. Ltd. | | 11,300 | 981,648 |
| Shinsei Bank Ltd. | | 310,000 | 578,426 |
| SHO-BOND Holdings Co. Ltd. | | 21,740 | 994,609 |
| Shoei Co. Ltd. | | 5,800 | 161,032 |
| SK Kaken Co. Ltd. | | 100 | 9,509 |
| Software Service, Inc. | | 1,600 | 72,626 |
| Sony Corp. | | 28,800 | 988,253 |
| Sony Financial Holdings, Inc. | | 40,400 | 671,189 |
| Subaru Corp. | | 16,100 | 608,327 |
| Taiheiyo Cement Corp. | | 139,000 | 462,606 |
| Techno Medica Co. Ltd. | | 1,800 | 32,004 |
| The Monogatari Corp. | | 1,700 | 76,403 |
| TKC Corp. | | 3,700 | 100,570 |
| Tocalo Co. Ltd. | | 2,800 | 75,479 |
| Tokio Marine Holdings, Inc. | | 23,200 | 976,492 |
| Toyota Motor Corp. | | 46,300 | 2,505,793 |
| USS Co. Ltd. | | 106,700 | 1,885,616 |
| Welcia Holdings Co. Ltd. | | 3,500 | 112,716 |
| Workman Co. Ltd. | | 4,300 | 125,750 |
| Yamada Consulting Group Co. Ltd. | | 2,200 | 100,848 |
| Yamato Kogyo Co. Ltd. | | 1,900 | 47,519 |
|
| TOTAL JAPAN | | | 44,896,178 |
|
| Kenya - 0.3% | | | |
| Safaricom Ltd. | | 5,162,200 | 962,910 |
| Korea (South) - 2.5% | | | |
| BGFretail Co. Ltd. | | 17,335 | 1,668,585 |
| Coway Co. Ltd. | | 6,334 | 559,570 |
| Leeno Industrial, Inc. | | 1,197 | 44,824 |
| LG Household & Health Care Ltd. | | 814 | 619,659 |
| NAVER Corp. | | 1,767 | 1,242,616 |
| Samsung Electronics Co. Ltd. | | 2,438 | 4,781,275 |
|
| TOTAL KOREA (SOUTH) | | | 8,916,529 |
|
| Luxembourg - 0.1% | | | |
| Eurofins Scientific SA | | 1,000 | 492,473 |
| Mexico - 1.8% | | | |
| CEMEX S.A.B. de CV sponsored ADR | | 76,700 | 707,174 |
| Consorcio ARA S.A.B. de CV | | 224,355 | 74,844 |
| Embotelladoras Arca S.A.B. de CV | | 76,800 | 566,538 |
| Fomento Economico Mexicano S.A.B. de CV: | | | |
| unit | | 84,600 | 761,322 |
| sponsored ADR | | 6,033 | 543,211 |
| Gruma S.A.B. de CV Series B | | 37,535 | 501,218 |
| Grupo Aeroportuario del Pacifico S.A.B. de CV Series B | | 53,300 | 548,140 |
| Grupo Aeroportuario del Sureste S.A.B. de CV Series B | | 29,905 | 567,465 |
| Grupo Aeroportuario Norte S.A.B. de CV | | 82,100 | 455,611 |
| Grupo Cementos de Chihuahua S.A.B. de CV | | 96,200 | 456,286 |
| Grupo Mexico SA de CV Series B | | 219,000 | 644,136 |
| Promotora y Operadora de Infraestructura S.A.B. de CV | | 49,315 | 526,177 |
|
| TOTAL MEXICO | | | 6,352,122 |
|
| Netherlands - 2.2% | | | |
| Aalberts Industries NV | | 6,100 | 242,001 |
| Akzo Nobel NV | | 4,160 | 363,788 |
| ASML Holding NV (Netherlands) | | 20,100 | 2,656,950 |
| ING Groep NV (Certificaten Van Aandelen) | | 110,976 | 1,808,858 |
| PostNL NV | | 55,000 | 272,418 |
| RELX NV | | 57,476 | 1,111,616 |
| Takeaway.com Holding BV (c) | | 1,800 | 60,626 |
| VastNed Retail NV | | 3,427 | 128,024 |
| Wolters Kluwer NV | | 16,174 | 686,939 |
| Yandex NV Series A (a) | | 19,700 | 537,022 |
|
| TOTAL NETHERLANDS | | | 7,868,242 |
|
| New Zealand - 0.1% | | | |
| Auckland International Airport Ltd. | | 77,950 | 369,291 |
| Norway - 0.3% | | | |
| Kongsberg Gruppen ASA | | 5,900 | 92,080 |
| Skandiabanken ASA | | 6,200 | 55,422 |
| Statoil ASA | | 62,687 | 1,032,386 |
|
| TOTAL NORWAY | | | 1,179,888 |
|
| Philippines - 0.8% | | | |
| Ayala Corp. | | 31,730 | 548,220 |
| Ayala Land, Inc. | | 769,500 | 541,626 |
| D&L Industries, Inc. | | 1,690,400 | 431,435 |
| Jollibee Food Corp. | | 22,780 | 95,387 |
| SM Investments Corp. | | 37,050 | 537,818 |
| SM Prime Holdings, Inc. | | 894,900 | 531,749 |
|
| TOTAL PHILIPPINES | | | 2,686,235 |
|
| Russia - 0.8% | | | |
| Alrosa Co. Ltd. (a) | | 314,900 | 542,693 |
| Magnit OJSC | | 4,020 | 619,714 |
| NOVATEK OAO GDR (Reg. S) | | 5,300 | 642,360 |
| Sberbank of Russia | | 371,720 | 1,079,682 |
|
| TOTAL RUSSIA | | | 2,884,449 |
|
| South Africa - 2.5% | | | |
| Aspen Pharmacare Holdings Ltd. | | 28,200 | 585,007 |
| Bidcorp Ltd. | | 27,732 | 587,563 |
| Capitec Bank Holdings Ltd. | | 9,400 | 536,367 |
| Clicks Group Ltd. | | 72,521 | 728,425 |
| Discovery Ltd. | | 50,667 | 507,286 |
| FirstRand Ltd. | | 200,200 | 746,794 |
| Mondi Ltd. | | 21,800 | 565,613 |
| Naspers Ltd. Class N | | 20,500 | 3,898,106 |
| Sanlam Ltd. | | 106,400 | 564,415 |
|
| TOTAL SOUTH AFRICA | | | 8,719,576 |
|
| Spain - 3.0% | | | |
| Amadeus IT Holding SA Class A | | 39,900 | 2,151,422 |
| Banco Santander SA (Spain) | | 238,400 | 1,554,759 |
| CaixaBank SA | | 242,906 | 1,102,901 |
| Hispania Activos Inmobiliarios SA | | 31,295 | 472,482 |
| Iberdrola SA | | 211,733 | 1,522,690 |
| Inditex SA | | 66,996 | 2,569,582 |
| Merlin Properties Socimi SA | | 36,400 | 430,803 |
| Prosegur Compania de Seguridad SA (Reg.) | | 116,876 | 762,605 |
|
| TOTAL SPAIN | | | 10,567,244 |
|
| Sweden - 3.5% | | | |
| Addlife AB (a) | | 1,000 | 19,024 |
| AddTech AB (B Shares) | | 7,400 | 133,257 |
| ASSA ABLOY AB (B Shares) | | 134,700 | 2,918,376 |
| Atlas Copco AB (A Shares) | | 42,200 | 1,577,980 |
| Fagerhult AB | | 30,875 | 1,274,069 |
| Investor AB (B Shares) | | 21,687 | 991,393 |
| Lagercrantz Group AB (B Shares) | | 12,400 | 135,448 |
| Loomis AB (B Shares) | | 3,900 | 141,561 |
| Nordea Bank AB | | 142,467 | 1,753,232 |
| Saab AB (B Shares) | | 4,100 | 203,303 |
| Svenska Cellulosa AB (SCA) (B Shares) | | 27,800 | 920,881 |
| Svenska Handelsbanken AB (A Shares) | | 65,645 | 931,613 |
| Swedbank AB (A Shares) | | 38,600 | 914,742 |
| Telefonaktiebolaget LM Ericsson (B Shares) | | 50,800 | 330,039 |
|
| TOTAL SWEDEN | | | 12,244,918 |
|
| Switzerland - 5.9% | | | |
| ABB Ltd. (Reg.) | | 48,990 | 1,200,464 |
| Credit Suisse Group AG | | 32,912 | 501,940 |
| Lafargeholcim Ltd. (Reg.) | | 13,320 | 755,023 |
| Nestle SA (Reg. S) | | 94,906 | 7,309,701 |
| Novartis AG | | 39,432 | 3,035,675 |
| Roche Holding AG (participation certificate) | | 11,345 | 2,968,584 |
| Schindler Holding AG: | | | |
| (participation certificate) | | 4,737 | 967,871 |
| (Reg.) | | 1,212 | 240,695 |
| Sika AG | | 70 | 446,734 |
| Tecan Group AG | | 170 | 29,011 |
| UBS Group AG | | 105,989 | 1,802,873 |
| Zurich Insurance Group AG | | 5,596 | 1,548,628 |
|
| TOTAL SWITZERLAND | | | 20,807,199 |
|
| Taiwan - 1.7% | | | |
| Addcn Technology Co. Ltd. | | 10,772 | 80,372 |
| Advantech Co. Ltd. | | 60,000 | 484,399 |
| Largan Precision Co. Ltd. | | 3,870 | 642,162 |
| Taiwan Semiconductor Manufacturing Co. Ltd. | | 723,035 | 4,649,702 |
|
| TOTAL TAIWAN | | | 5,856,635 |
|
| Thailand - 0.3% | | | |
| Airports of Thailand PCL (For. Reg.) | | 451,100 | 524,762 |
| Thai Beverage PCL | | 722,600 | 478,406 |
|
| TOTAL THAILAND | | | 1,003,168 |
|
| Turkey - 0.2% | | | |
| Tofas Turk Otomobil Fabrikasi A/S | | 55,707 | 463,918 |
| Tupras Turkiye Petrol Rafinelleri A/S | | 12,000 | 302,369 |
|
| TOTAL TURKEY | | | 766,287 |
|
| United Arab Emirates - 0.2% | | | |
| National Bank of Abu Dhabi PJSC (a) | | 174,704 | 523,208 |
| United Kingdom - 11.0% | | | |
| Alliance Pharma PLC | | 68,814 | 42,336 |
| AstraZeneca PLC (United Kingdom) | | 25,904 | 1,551,376 |
| Aviva PLC | | 229,915 | 1,563,517 |
| Avon Rubber PLC | | 1,300 | 17,663 |
| BAE Systems PLC | | 277,221 | 2,251,582 |
| Berendsen PLC | | 68,755 | 747,142 |
| BHP Billiton PLC | | 34,490 | 525,807 |
| BP PLC | | 367,555 | 2,104,111 |
| British American Tobacco PLC (United Kingdom) | | 56,400 | 3,810,574 |
| Bunzl PLC | | 33,129 | 1,033,241 |
| Compass Group PLC | | 54,907 | 1,108,617 |
| Dechra Pharmaceuticals PLC | | 3,300 | 72,233 |
| Domino's Pizza UK & IRL PLC | | 15,700 | 67,206 |
| DP Poland PLC (a) | | 40,800 | 26,818 |
| Elementis PLC | | 139,608 | 550,055 |
| Great Portland Estates PLC | | 18,172 | 162,872 |
| Hilton Food Group PLC | | 3,495 | 34,833 |
| Howden Joinery Group PLC | | 82,700 | 495,933 |
| HSBC Holdings PLC sponsored ADR | | 24,607 | 1,013,070 |
| Imperial Tobacco Group PLC | | 20,948 | 1,026,127 |
| Informa PLC | | 275,792 | 2,293,261 |
| InterContinental Hotel Group PLC | | 8,600 | 456,242 |
| InterContinental Hotel Group PLC ADR | | 40,112 | 2,117,512 |
| ITE Group PLC | | 49,000 | 112,333 |
| ITV PLC | | 207,919 | 565,523 |
| Just Eat Holding Ltd. (a) | | 11,540 | 86,242 |
| Lloyds Banking Group PLC | | 2,131,800 | 1,915,479 |
| Micro Focus International PLC | | 36,100 | 1,210,064 |
| NMC Health PLC | | 19,400 | 499,271 |
| Prudential PLC | | 108,664 | 2,411,674 |
| Reckitt Benckiser Group PLC | | 33,251 | 3,063,666 |
| Rightmove PLC | | 9,000 | 487,954 |
| Rio Tinto PLC | | 34,802 | 1,372,947 |
| Royal Dutch Shell PLC Class B (United Kingdom) | | 18,114 | 481,959 |
| Shaftesbury PLC | | 41,937 | 506,233 |
| Spectris PLC | | 21,770 | 778,224 |
| Spirax-Sarco Engineering PLC | | 6,499 | 437,710 |
| Standard Chartered PLC (United Kingdom) (a) | | 120,535 | 1,125,915 |
| Topps Tiles PLC | | 25,400 | 34,132 |
| Ultra Electronics Holdings PLC | | 6,201 | 168,020 |
| Unilever PLC | | 8,600 | 442,456 |
| Unite Group PLC | | 12,351 | 103,501 |
|
| TOTAL UNITED KINGDOM | | | 38,875,431 |
|
| United States of America - 8.8% | | | |
| A.O. Smith Corp. | | 8,300 | 447,204 |
| Alphabet, Inc.: | | | |
| Class A (a) | | 2,030 | 1,876,776 |
| Class C (a) | | 483 | 437,579 |
| Amazon.com, Inc. (a) | | 520 | 480,995 |
| Amgen, Inc. | | 2,600 | 424,632 |
| Amphenol Corp. Class A | | 6,100 | 441,091 |
| Autoliv, Inc. | | 11,254 | 1,127,538 |
| Berkshire Hathaway, Inc. Class B (a) | | 8,216 | 1,357,365 |
| China Biologic Products, Inc. (a) | | 10,800 | 1,274,400 |
| ConocoPhillips Co. | | 19,400 | 929,454 |
| Constellation Brands, Inc. Class A (sub. vtg.) | | 2,700 | 465,858 |
| Domino's Pizza, Inc. | | 2,390 | 433,522 |
| Edgewell Personal Care Co. (a) | | 4,300 | 307,407 |
| Facebook, Inc. Class A (a) | | 3,400 | 510,850 |
| Martin Marietta Materials, Inc. | | 5,660 | 1,246,275 |
| MasterCard, Inc. Class A | | 24,130 | 2,806,802 |
| Mettler-Toledo International, Inc. (a) | | 900 | 462,078 |
| Mohawk Industries, Inc. (a) | | 5,095 | 1,196,255 |
| Molson Coors Brewing Co. Class B | | 11,600 | 1,112,324 |
| Moody's Corp. | | 9,700 | 1,147,704 |
| MSCI, Inc. | | 12,500 | 1,254,000 |
| Philip Morris International, Inc. | | 19,600 | 2,172,464 |
| PPG Industries, Inc. | | 4,900 | 538,216 |
| PriceSmart, Inc. | | 6,285 | 546,481 |
| ResMed, Inc. | | 12,460 | 847,155 |
| S&P Global, Inc. | | 16,200 | 2,173,878 |
| Sherwin-Williams Co. | | 4,600 | 1,539,528 |
| The Walt Disney Co. | | 3,800 | 439,280 |
| Visa, Inc. Class A | | 32,677 | 2,980,796 |
|
| TOTAL UNITED STATES OF AMERICA | | | 30,977,907 |
|
| TOTAL COMMON STOCKS | | | |
| (Cost $278,507,607) | | | 339,004,706 |
|
| Preferred Stocks - 1.3% | | | |
| Convertible Preferred Stocks - 0.2% | | | |
| India - 0.2% | | | |
| PC Jeweller Ltd. 13.00% (d) | | 3,557,622 | 549,993 |
| Nonconvertible Preferred Stocks - 1.1% | | | |
| Brazil - 0.8% | | | |
| Ambev SA sponsored ADR | | 167,000 | 956,910 |
| Itau Unibanco Holding SA | | 99,170 | 1,226,639 |
| Itausa-Investimentos Itau SA (PN) | | 217,400 | 677,395 |
| | | | 2,860,944 |
| Germany - 0.1% | | | |
| Sartorius AG (non-vtg.) | | 4,300 | 393,736 |
| Spain - 0.2% | | | |
| Grifols SA Class B | | 30,200 | 644,614 |
|
| TOTAL NONCONVERTIBLE PREFERRED STOCKS | | | 3,899,294 |
|
| TOTAL PREFERRED STOCKS | | | |
| (Cost $3,616,876) | | | 4,449,287 |
|
| Investment Companies - 0.4% | | | |
| United States of America - 0.4% | | | |
| iShares MSCI EAFE Small-Cap ETF | | | |
| (Cost $1,570,116) | | 27,800 | 1,568,476 |
|
| Money Market Funds - 2.0% | | | |
| Fidelity Cash Central Fund, 0.85% (e) | | 5,708,343 | 5,709,485 |
| Fidelity Securities Lending Cash Central Fund 0.86% (e)(f) | | 1,271,875 | 1,272,002 |
| TOTAL MONEY MARKET FUNDS | | | |
| (Cost $6,981,487) | | | 6,981,487 |
| TOTAL INVESTMENT PORTFOLIO - 99.9% | | | |
| (Cost $290,676,086) | | | 352,003,956 |
| NET OTHER ASSETS (LIABILITIES) - 0.1% | | | 311,081 |
| NET ASSETS - 100% | | | $352,315,037 |
Security Type Abbreviations
ETF – Exchange-Traded Fund
Categorizations in the Schedule of Investments are based on country or territory of incorporation.
Legend
(a) Non-income producing
(b) Security or a portion of the security is on loan at period end.
(c) Security exempt from registration under Rule 144A of the Securities Act of 1933. These securities may be resold in transactions exempt from registration, normally to qualified institutional buyers. At the end of the period, the value of these securities amounted to $60,626 or 0.0% of net assets.
(d) Restricted securities - Investment in securities not registered under the Securities Act of 1933 (excluding 144A issues). At the end of the period, the value of restricted securities (excluding 144A issues) amounted to $549,993 or 0.2% of net assets.
(e) Affiliated fund that is generally available only to investment companies and other accounts managed by Fidelity Investments. The rate quoted is the annualized seven-day yield of the fund at period end. A complete unaudited listing of the fund's holdings as of its most recent quarter end is available upon request. In addition, each Fidelity Central Fund's financial statements are available on the SEC's website or upon request.
(f) Investment made with cash collateral received from securities on loan.
Additional information on each restricted holding is as follows:
| Security | Acquisition Date | Acquisition Cost |
| PC Jeweller Ltd. 13.00% | 7/28/16 | $530,934 |
Affiliated Central Funds
Information regarding fiscal year to date income earned by the Fund from investments in Fidelity Central Funds is as follows:
| Fund | Income earned |
| Fidelity Cash Central Fund | $21,461 |
| Fidelity Securities Lending Cash Central Fund | 21,692 |
| Total | $43,153 |
Investment Valuation
The following is a summary of the inputs used, as of April 30, 2017, involving the Fund's assets and liabilities carried at fair value. The inputs or methodology used for valuing securities may not be an indication of the risk associated with investing in those securities. For more information on valuation inputs, and their aggregation into the levels used below, please refer to the Investment Valuation section in the accompanying Notes to Financial Statements.
| | Valuation Inputs at Reporting Date: |
| Description | Total | Level 1 | Level 2 | Level 3 |
| Investments in Securities: | | | | |
| Equities: | | | | |
| Consumer Discretionary | $36,678,330 | $26,573,194 | $10,105,136 | $-- |
| Consumer Staples | 42,471,767 | 23,518,258 | 18,953,509 | -- |
| Energy | 14,204,222 | 7,237,812 | 6,966,410 | -- |
| Financials | 67,910,499 | 45,020,193 | 22,890,306 | -- |
| Health Care | 34,793,103 | 21,514,487 | 13,278,616 | -- |
| Industrials | 46,143,187 | 38,391,063 | 7,752,124 | -- |
| Information Technology | 55,187,580 | 40,390,107 | 14,797,473 | -- |
| Materials | 31,151,175 | 28,624,178 | 2,526,997 | -- |
| Real Estate | 5,694,618 | 5,694,618 | -- | -- |
| Telecommunication Services | 5,603,747 | 962,910 | 4,640,837 | -- |
| Utilities | 3,615,765 | 3,615,765 | -- | -- |
| Investment Companies | 1,568,476 | 1,568,476 | -- | -- |
| Money Market Funds | 6,981,487 | 6,981,487 | -- | -- |
| Total Investments in Securities: | $352,003,956 | $250,092,548 | $101,911,408 | $-- |
The following is a summary of transfers between Level 1 and Level 2 for the period ended April 30, 2017. Transfers are assumed to have occurred at the beginning of the period, and are primarily attributable to the valuation techniques used for foreign equity securities, as discussed in the accompanying Notes to Financial Statements:
| Transfers | Total |
| Level 1 to Level 2 | $11,768,859 |
| Level 2 to Level 1 | $8,584,383 |
See accompanying notes which are an integral part of the financial statements.
Financial Statements
Statement of Assets and Liabilities
| | | April 30, 2017 (Unaudited) |
| Assets | | |
Investment in securities, at value (including securities loaned of $1,149,670) — See accompanying schedule:
Unaffiliated issuers (cost $283,694,599) | $345,022,469 | |
| Fidelity Central Funds (cost $6,981,487) | 6,981,487 | |
| Total Investments (cost $290,676,086) | | $352,003,956 |
| Cash | | 260,283 |
| Foreign currency held at value (cost $204,133) | | 204,121 |
| Receivable for investments sold | | 2,196,362 |
| Receivable for fund shares sold | | 114,112 |
| Dividends receivable | | 1,785,054 |
| Distributions receivable from Fidelity Central Funds | | 10,866 |
| Prepaid expenses | | 202 |
| Receivable from investment adviser for expense reductions | | 82 |
| Other receivables | | 36,246 |
| Total assets | | 356,611,284 |
| Liabilities | | |
| Payable for investments purchased | $2,459,052 | |
| Payable for fund shares redeemed | 184,648 | |
| Accrued management fee | 224,529 | |
| Distribution and service plan fees payable | 10,130 | |
| Other affiliated payables | 49,420 | |
| Other payables and accrued expenses | 96,468 | |
| Collateral on securities loaned | 1,272,000 | |
| Total liabilities | | 4,296,247 |
| Net Assets | | $352,315,037 |
| Net Assets consist of: | | |
| Paid in capital | | $307,349,169 |
| Undistributed net investment income | | 1,726,589 |
| Accumulated undistributed net realized gain (loss) on investments and foreign currency transactions | | (18,043,442) |
| Net unrealized appreciation (depreciation) on investments and assets and liabilities in foreign currencies | | 61,282,721 |
| Net Assets | | $352,315,037 |
| Calculation of Maximum Offering Price | | |
| Class A: | | |
| Net Asset Value and redemption price per share ($8,521,385 ÷ 1,017,298 shares) | | $8.38 |
| Maximum offering price per share (100/94.25 of $8.38) | | $8.89 |
| Class M: | | |
| Net Asset Value and redemption price per share ($14,784,961 ÷ 1,757,259 shares) | | $8.41 |
| Maximum offering price per share (100/96.50 of $8.41) | | $8.72 |
| Class C: | | |
| Net Asset Value and offering price per share ($2,937,777 ÷ 350,019 shares)(a) | | $8.39 |
| Total International Equity: | | |
| Net Asset Value, offering price and redemption price per share ($322,011,677 ÷ 38,383,771 shares) | | $8.39 |
| Class I: | | |
| Net Asset Value, offering price and redemption price per share ($3,951,015 ÷ 472,731 shares) | | $8.36 |
| Class Z: | | |
| Net Asset Value, offering price and redemption price per share ($108,222 ÷ 12,937 shares) | | $8.37 |
(a) Redemption price per share is equal to net asset value less any applicable contingent deferred sales charge.
See accompanying notes which are an integral part of the financial statements.
Statement of Operations
| | | Six months ended April 30, 2017 (Unaudited) |
| Investment Income | | |
| Dividends | | $4,184,091 |
| Income from Fidelity Central Funds | | 43,153 |
| Income before foreign taxes withheld | | 4,227,244 |
| Less foreign taxes withheld | | (374,193) |
| Total income | | 3,853,051 |
| Expenses | | |
| Management fee | | |
| Basic fee | $1,129,780 | |
| Performance adjustment | 71,150 | |
| Transfer agent fees | 204,650 | |
| Distribution and service plan fees | 59,505 | |
| Accounting and security lending fees | 84,093 | |
| Custodian fees and expenses | 98,051 | |
| Independent trustees' fees and expenses | 649 | |
| Registration fees | 28,464 | |
| Audit | 55,153 | |
| Legal | 1,145 | |
| Miscellaneous | 1,944 | |
| Total expenses before reductions | 1,734,584 | |
| Expense reductions | (24,463) | 1,710,121 |
| Net investment income (loss) | | 2,142,930 |
| Realized and Unrealized Gain (Loss) | | |
| Net realized gain (loss) on: | | |
| Investment securities: | | |
| Unaffiliated issuers | 8,759,675 | |
| Fidelity Central Funds | (952) | |
| Foreign currency transactions | (88,370) | |
| Total net realized gain (loss) | | 8,670,353 |
Change in net unrealized appreciation (depreciation) on:
Investment securities (net of increase in deferred foreign taxes of $34,910) | 23,429,654 | |
| Assets and liabilities in foreign currencies | 23,913 | |
| Total change in net unrealized appreciation (depreciation) | | 23,453,567 |
| Net gain (loss) | | 32,123,920 |
| Net increase (decrease) in net assets resulting from operations | | $34,266,850 |
See accompanying notes which are an integral part of the financial statements.
Statement of Changes in Net Assets
| | Six months ended April 30, 2017 (Unaudited) | Year ended October 31, 2016 |
| Increase (Decrease) in Net Assets | | |
| Operations | | |
| Net investment income (loss) | $2,142,930 | $4,368,676 |
| Net realized gain (loss) | 8,670,353 | 3,239,278 |
| Change in net unrealized appreciation (depreciation) | 23,453,567 | (10,501,802) |
| Net increase (decrease) in net assets resulting from operations | 34,266,850 | (2,893,848) |
| Distributions to shareholders from net investment income | (4,227,310) | (3,869,339) |
| Share transactions - net increase (decrease) | 14,264,395 | (21,421,371) |
| Redemption fees | 1,125 | 1,162 |
| Total increase (decrease) in net assets | 44,305,060 | (28,183,396) |
| Net Assets | | |
| Beginning of period | 308,009,977 | 336,193,373 |
| End of period | $352,315,037 | $308,009,977 |
| Other Information | | |
| Undistributed net investment income end of period | $1,726,589 | $3,810,969 |
See accompanying notes which are an integral part of the financial statements.
Financial Highlights — Fidelity Total International Equity Fund Class A
| | Six months ended (Unaudited) April 30, | Years ended October 31, | | | | |
| | 2017 | 2016 | 2015 | 2014 | 2013 | 2012 |
| Selected Per–Share Data | | | | | | |
| Net asset value, beginning of period | $7.67 | $7.79 | $8.00 | $8.27 | $7.31 | $6.67 |
| Income from Investment Operations | | | | | | |
| Net investment income (loss)A | .04 | .08 | .07 | .13 | .09 | .13 |
| Net realized and unrealized gain (loss) | .75 | (.14) | (.14) | (.12) | 1.24 | .59 |
| Total from investment operations | .79 | (.06) | (.07) | .01 | 1.33 | .72 |
| Distributions from net investment income | (.08) | (.06) | (.10) | (.10) | (.13) | (.08) |
| Distributions from net realized gain | – | – | (.04) | (.18) | (.25) | – |
| Total distributions | (.08) | (.06) | (.14) | (.28) | (.37)B | (.08) |
| Redemption fees added to paid in capitalA,C | – | – | – | – | – | – |
| Net asset value, end of period | $8.38 | $7.67 | $7.79 | $8.00 | $8.27 | $7.31 |
| Total ReturnD,E,F | 10.47% | (.76)% | (.89)% | .19% | 19.00% | 10.88% |
| Ratios to Average Net AssetsG,H | | | | | | |
| Expenses before reductions | 1.42%I | 1.52% | 1.48% | 1.44% | 1.50% | 1.57% |
| Expenses net of fee waivers, if any | 1.42%I | 1.45% | 1.45% | 1.44% | 1.45% | 1.45% |
| Expenses net of all reductions | 1.41%I | 1.45% | 1.44% | 1.44% | 1.43% | 1.42% |
| Net investment income (loss) | .97%I | 1.10% | .86% | 1.63% | 1.21% | 1.88% |
| Supplemental Data | | | | | | |
| Net assets, end of period (000 omitted) | $8,521 | $8,576 | $9,163 | $9,164 | $9,034 | $5,767 |
| Portfolio turnover rateJ | 53%I | 51% | 53% | 85% | 89% | 110% |
A Calculated based on average shares outstanding during the period.
B Total distributions of $.37 per share is comprised of distributions from net investment income of $.126 and distributions from net realized gain of $.245 per share.
C Amount represents less than $.005 per share.
D Total returns for periods of less than one year are not annualized.
E Total returns would have been lower if certain expenses had not been reduced during the applicable periods shown.
F Total returns do not include the effect of the sales charges.
G Fees and expenses of any underlying Fidelity Central Funds are not included in the Fund's expense ratio. The Fund indirectly bears its proportionate share of the expenses of any underlying Fidelity Central Funds.
H Expense ratios reflect operating expenses of the class. Expenses before reductions do not reflect amounts reimbursed by the investment adviser or reductions from brokerage service arrangements or reductions from other expense offset arrangements and do not represent the amount paid by the class during periods when reimbursements or reductions occur. Expenses net of fee waivers reflect expenses after reimbursement by the investment adviser but prior to reductions from brokerage service arrangements or other expense offset arrangements. Expenses net of all reductions represent the net expenses paid by the class.
I Annualized
J Amount does not include the portfolio activity of any underlying Fidelity Central Funds.
See accompanying notes which are an integral part of the financial statements.
Financial Highlights — Fidelity Total International Equity Fund Class M
| | Six months ended (Unaudited) April 30, | Years ended October 31, | | | | |
| | 2017 | 2016 | 2015 | 2014 | 2013 | 2012 |
| Selected Per–Share Data | | | | | | |
| Net asset value, beginning of period | $7.70 | $7.81 | $8.04 | $8.32 | $7.37 | $6.73 |
| Income from Investment Operations | | | | | | |
| Net investment income (loss)A | .03 | .06 | .05 | .11 | .07 | .11 |
| Net realized and unrealized gain (loss) | .75 | (.13) | (.15) | (.12) | 1.25 | .59 |
| Total from investment operations | .78 | (.07) | (.10) | (.01) | 1.32 | .70 |
| Distributions from net investment income | (.07) | (.04) | (.09) | (.09) | (.13) | (.06) |
| Distributions from net realized gain | – | – | (.04) | (.18) | (.25) | – |
| Total distributions | (.07) | (.04) | (.13) | (.27) | (.37)B | (.06) |
| Redemption fees added to paid in capitalA,C | – | – | – | – | – | – |
| Net asset value, end of period | $8.41 | $7.70 | $7.81 | $8.04 | $8.32 | $7.37 |
| Total ReturnD,E,F | 10.18% | (.86)% | (1.26)% | (.06)% | 18.73% | 10.52% |
| Ratios to Average Net AssetsG,H | | | | | | |
| Expenses before reductions | 1.64%I | 1.73% | 1.70% | 1.68% | 1.75% | 1.84% |
| Expenses net of fee waivers, if any | 1.64%I | 1.70% | 1.70% | 1.68% | 1.70% | 1.70% |
| Expenses net of all reductions | 1.63%I | 1.69% | 1.69% | 1.68% | 1.67% | 1.67% |
| Net investment income (loss) | .75%I | .85% | .61% | 1.38% | .96% | 1.63% |
| Supplemental Data | | | | | | |
| Net assets, end of period (000 omitted) | $14,785 | $13,893 | $13,962 | $10,282 | $7,909 | $2,348 |
| Portfolio turnover rateJ | 53%I | 51% | 53% | 85% | 89% | 110% |
A Calculated based on average shares outstanding during the period.
B Total distributions of $.37 per share is comprised of distributions from net investment income of $.128 and distributions from net realized gain of $.245 per share.
C Amount represents less than $.005 per share.
D Total returns for periods of less than one year are not annualized.
E Total returns would have been lower if certain expenses had not been reduced during the applicable periods shown.
F Total returns do not include the effect of the sales charges.
G Fees and expenses of any underlying Fidelity Central Funds are not included in the Fund's expense ratio. The Fund indirectly bears its proportionate share of the expenses of any underlying Fidelity Central Funds.
H Expense ratios reflect operating expenses of the class. Expenses before reductions do not reflect amounts reimbursed by the investment adviser or reductions from brokerage service arrangements or reductions from other expense offset arrangements and do not represent the amount paid by the class during periods when reimbursements or reductions occur. Expenses net of fee waivers reflect expenses after reimbursement by the investment adviser but prior to reductions from brokerage service arrangements or other expense offset arrangements. Expenses net of all reductions represent the net expenses paid by the class.
I Annualized
J Amount does not include the portfolio activity of any underlying Fidelity Central Funds.
See accompanying notes which are an integral part of the financial statements.
Financial Highlights — Fidelity Total International Equity Fund Class C
| | Six months ended (Unaudited) April 30, | Years ended October 31, | | | | |
| | 2017 | 2016 | 2015 | 2014 | 2013 | 2012 |
| Selected Per–Share Data | | | | | | |
| Net asset value, beginning of period | $7.66 | $7.77 | $8.00 | $8.28 | $7.31 | $6.67 |
| Income from Investment Operations | | | | | | |
| Net investment income (loss)A | .01 | .03 | .01 | .07 | .04 | .08 |
| Net realized and unrealized gain (loss) | .74 | (.14) | (.15) | (.12) | 1.25 | .58 |
| Total from investment operations | .75 | (.11) | (.14) | (.05) | 1.29 | .66 |
| Distributions from net investment income | (.02) | – | (.05) | (.05) | (.08) | (.02) |
| Distributions from net realized gain | – | – | (.04) | (.18) | (.25) | – |
| Total distributions | (.02) | – | (.09) | (.23) | (.32)B | (.02) |
| Redemption fees added to paid in capitalA,C | – | – | – | – | – | – |
| Net asset value, end of period | $8.39 | $7.66 | $7.77 | $8.00 | $8.28 | $7.31 |
| Total ReturnD,E,F | 9.87% | (1.42)% | (1.73)% | (.57)% | 18.30% | 9.98% |
| Ratios to Average Net AssetsG,H | | | | | | |
| Expenses before reductions | 2.22%I | 2.30% | 2.26% | 2.22% | 2.26% | 2.31% |
| Expenses net of fee waivers, if any | 2.20%I | 2.20% | 2.20% | 2.20% | 2.20% | 2.20% |
| Expenses net of all reductions | 2.18%I | 2.20% | 2.19% | 2.20% | 2.18% | 2.17% |
| Net investment income (loss) | .19%I | .35% | .11% | .87% | .46% | 1.13% |
| Supplemental Data | | | | | | |
| Net assets, end of period (000 omitted) | $2,938 | $2,713 | $3,311 | $4,028 | $3,584 | $2,737 |
| Portfolio turnover rateJ | 53%I | 51% | 53% | 85% | 89% | 110% |
A Calculated based on average shares outstanding during the period.
B Total distributions of $.32 per share is comprised of distributions from net investment income of $.075 and distributions from net realized gain of $.245 per share.
C Amount represents less than $.005 per share.
D Total returns for periods of less than one year are not annualized.
E Total returns would have been lower if certain expenses had not been reduced during the applicable periods shown.
F Total returns do not include the effect of the contingent deferred sales charge.
G Fees and expenses of any underlying Fidelity Central Funds are not included in the Fund's expense ratio. The Fund indirectly bears its proportionate share of the expenses of any underlying Fidelity Central Funds.
H Expense ratios reflect operating expenses of the class. Expenses before reductions do not reflect amounts reimbursed by the investment adviser or reductions from brokerage service arrangements or reductions from other expense offset arrangements and do not represent the amount paid by the class during periods when reimbursements or reductions occur. Expenses net of fee waivers reflect expenses after reimbursement by the investment adviser but prior to reductions from brokerage service arrangements or other expense offset arrangements. Expenses net of all reductions represent the net expenses paid by the class.
I Annualized
J Amount does not include the portfolio activity of any underlying Fidelity Central Funds.
See accompanying notes which are an integral part of the financial statements.
Financial Highlights — Fidelity Total International Equity Fund
| | Six months ended (Unaudited) April 30, | Years ended October 31, | | | | |
| | 2017 | 2016 | 2015 | 2014 | 2013 | 2012 |
| Selected Per–Share Data | | | | | | |
| Net asset value, beginning of period | $7.70 | $7.82 | $8.03 | $8.29 | $7.32 | $6.69 |
| Income from Investment Operations | | | | | | |
| Net investment income (loss)A | .05 | .11 | .10 | .16 | .12 | .15 |
| Net realized and unrealized gain (loss) | .75 | (.13) | (.14) | (.12) | 1.24 | .58 |
| Total from investment operations | .80 | (.02) | (.04) | .04 | 1.36 | .73 |
| Distributions from net investment income | (.11) | (.10) | (.13) | (.12) | (.15) | (.10) |
| Distributions from net realized gain | – | – | (.04) | (.18) | (.25) | – |
| Total distributions | (.11) | (.10) | (.17) | (.30) | (.39)B | (.10) |
| Redemption fees added to paid in capitalA,C | – | – | – | – | – | – |
| Net asset value, end of period | $8.39 | $7.70 | $7.82 | $8.03 | $8.29 | $7.32 |
| Total ReturnD,E | 10.55% | (.32)% | (.51)% | .55% | 19.48% | 11.03% |
| Ratios to Average Net AssetsF,G | | | | | | |
| Expenses before reductions | 1.02%H | 1.11% | 1.07% | 1.04% | 1.09% | 1.16% |
| Expenses net of fee waivers, if any | 1.02%H | 1.11% | 1.07% | 1.04% | 1.09% | 1.16% |
| Expenses net of all reductions | 1.01%H | 1.10% | 1.06% | 1.04% | 1.07% | 1.13% |
| Net investment income (loss) | 1.37%H | 1.44% | 1.24% | 2.03% | 1.57% | 2.16% |
| Supplemental Data | | | | | | |
| Net assets, end of period (000 omitted) | $322,012 | $280,672 | $307,035 | $324,438 | $324,395 | $281,979 |
| Portfolio turnover rateI | 53%H | 51% | 53% | 85% | 89% | 110% |
A Calculated based on average shares outstanding during the period.
B Total distributions of $.39 per share is comprised of distributions from net investment income of $.148 and distributions from net realized gain of $.245 per share.
C Amount represents less than $.005 per share.
D Total returns for periods of less than one year are not annualized.
E Total returns would have been lower if certain expenses had not been reduced during the applicable periods shown.
F Fees and expenses of any underlying Fidelity Central Funds are not included in the Fund's expense ratio. The Fund indirectly bears its proportionate share of the expenses of any underlying Fidelity Central Funds.
G Expense ratios reflect operating expenses of the class. Expenses before reductions do not reflect amounts reimbursed by the investment adviser or reductions from brokerage service arrangements or reductions from other expense offset arrangements and do not represent the amount paid by the class during periods when reimbursements or reductions occur. Expenses net of fee waivers reflect expenses after reimbursement by the investment adviser but prior to reductions from brokerage service arrangements or other expense offset arrangements. Expenses net of all reductions represent the net expenses paid by the class.
H Annualized
I Amount does not include the portfolio activity of any underlying Fidelity Central Funds.
See accompanying notes which are an integral part of the financial statements.
Financial Highlights — Fidelity Total International Equity Fund Class I
| | Six months ended (Unaudited) April 30, | Years ended October 31, | | | | |
| | 2017 | 2016 | 2015 | 2014 | 2013 | 2012 |
| Selected Per–Share Data | | | | | | |
| Net asset value, beginning of period | $7.66 | $7.78 | $7.99 | $8.26 | $7.30 | $6.67 |
| Income from Investment Operations | | | | | | |
| Net investment income (loss)A | .05 | .10 | .09 | .15 | .11 | .14 |
| Net realized and unrealized gain (loss) | .75 | (.13) | (.14) | (.12) | 1.24 | .59 |
| Total from investment operations | .80 | (.03) | (.05) | .03 | 1.35 | .73 |
| Distributions from net investment income | (.10) | (.09) | (.12) | (.12) | (.15) | (.10) |
| Distributions from net realized gain | – | – | (.04) | (.18) | (.25) | – |
| Total distributions | (.10) | (.09) | (.16) | (.30) | (.39)B | (.10) |
| Redemption fees added to paid in capitalA,C | – | – | – | – | – | – |
| Net asset value, end of period | $8.36 | $7.66 | $7.78 | $7.99 | $8.26 | $7.30 |
| Total ReturnD,E | 10.59% | (.43)% | (.64)% | .37% | 19.40% | 11.06% |
| Ratios to Average Net AssetsF,G | | | | | | |
| Expenses before reductions | 1.10%H | 1.22% | 1.17% | 1.15% | 1.21% | 1.27% |
| Expenses net of fee waivers, if any | 1.10%H | 1.20% | 1.17% | 1.15% | 1.20% | 1.20% |
| Expenses net of all reductions | 1.09%H | 1.20% | 1.16% | 1.15% | 1.18% | 1.17% |
| Net investment income (loss) | 1.29%H | 1.35% | 1.14% | 1.91% | 1.46% | 2.13% |
| Supplemental Data | | | | | | |
| Net assets, end of period (000 omitted) | $3,951 | $2,156 | $2,602 | $2,240 | $2,372 | $1,514 |
| Portfolio turnover rateI | 53%H | 51% | 53% | 85% | 89% | 110% |
A Calculated based on average shares outstanding during the period.
B Total distributions of $.39 per share is comprised of distributions from net investment income of $.148 and distributions from net realized gain of $.245 per share.
C Amount represents less than $.005 per share.
D Total returns for periods of less than one year are not annualized.
E Total returns would have been lower if certain expenses had not been reduced during the applicable periods shown.
F Fees and expenses of any underlying Fidelity Central Funds are not included in the Fund's expense ratio. The Fund indirectly bears its proportionate share of the expenses of any underlying Fidelity Central Funds.
G Expense ratios reflect operating expenses of the class. Expenses before reductions do not reflect amounts reimbursed by the investment adviser or reductions from brokerage service arrangements or reductions from other expense offset arrangements and do not represent the amount paid by the class during periods when reimbursements or reductions occur. Expenses net of fee waivers reflect expenses after reimbursement by the investment adviser but prior to reductions from brokerage service arrangements or other expense offset arrangements. Expenses net of all reductions represent the net expenses paid by the class.
H Annualized
I Amount does not include the portfolio activity of any underlying Fidelity Central Funds.
See accompanying notes which are an integral part of the financial statements.
Financial Highlights — Fidelity Total International Equity Fund Class Z
| | Six months ended (Unaudited) April 30, |
| | 2017 A |
| Selected Per–Share Data | |
| Net asset value, beginning of period | $7.73 |
| Income from Investment Operations | |
| Net investment income (loss)B | .05 |
| Net realized and unrealized gain (loss) | .59 |
| Total from investment operations | .64 |
| Distributions from net investment income | – |
| Distributions from net realized gain | – |
| Total distributions | – |
| Redemption fees added to paid in capitalB,C | – |
| Net asset value, end of period | $8.37 |
| Total ReturnD,E | 8.28% |
| Ratios to Average Net AssetsF,G | |
| Expenses before reductions | .95%H |
| Expenses net of fee waivers, if any | .95%H |
| Expenses net of all reductions | .93%H |
| Net investment income (loss) | 2.46%H |
| Supplemental Data | |
| Net assets, end of period (000 omitted) | $108 |
| Portfolio turnover rateI | 53%H |
A For the period February 1, 2017 (commencement of sale of shares) to April 30, 2017.
B Calculated based on average shares outstanding during the period.
C Amount represents less than $.005 per share.
D Total returns for periods of less than one year are not annualized.
E Total returns would have been lower if certain expenses had not been reduced during the applicable periods shown.
F Fees and expenses of any underlying Fidelity Central Funds are not included in the Fund's expense ratio. The Fund indirectly bears its proportionate share of the expenses of any underlying Fidelity Central Funds.
G Expense ratios reflect operating expenses of the class. Expenses before reductions do not reflect amounts reimbursed by the investment adviser or reductions from brokerage service arrangements or reductions from other expense offset arrangements and do not represent the amount paid by the class during periods when reimbursements or reductions occur. Expense ratios before reductions for start-up periods may not be representative of longer-term operating periods. Expenses net of fee waivers reflect expenses after reimbursement by the investment adviser but prior to reductions from brokerage service arrangements or other expense offset arrangements. Expenses net of all reductions represent the net expenses paid by the class.
H Annualized
I Amount does not include the portfolio activity of any underlying Fidelity Central Funds.
See accompanying notes which are an integral part of the financial statements.
Notes to Financial Statements (Unaudited)
For the period ended April 30, 2017
1. Organization.
Fidelity Total International Equity Fund (the Fund) is a fund of Fidelity Investment Trust (the Trust) and is authorized to issue an unlimited number of shares. The Trust is registered under the Investment Company Act of 1940, as amended (the 1940 Act), as an open-end management investment company organized as a Massachusetts business trust. The Fund commenced sale of Class Z shares on February 01, 2017. The Fund offers Class A, Class M (formerly Class T), Class C, Total International Equity, Class I and Class Z shares, each of which has equal rights as to assets and voting privileges. Each class has exclusive voting rights with respect to matters that affect that class. The Fund's investments in emerging markets can be subject to social, economic, regulatory, and political uncertainties and can be extremely volatile.
After the close of business on June 24, 2016, all outstanding Class B shares were converted to Class A shares. All prior fiscal period dollar and share amounts for Class B presented in the Notes to Financial Statements are for the period November 1, 2015 through June 24, 2016.
2. Investments in Fidelity Central Funds.
The Fund invests in Fidelity Central Funds, which are open-end investment companies generally available only to other investment companies and accounts managed by the investment adviser and its affiliates. The Fund's Schedule of Investments lists each of the Fidelity Central Funds held as of period end, if any, as an investment of the Fund, but does not include the underlying holdings of each Fidelity Central Fund. As an Investing Fund, the Fund indirectly bears its proportionate share of the expenses of the underlying Fidelity Central Funds.
The Money Market Central Funds seek preservation of capital and current income and are managed by Fidelity Investments Money Management, Inc. (FIMM), an affiliate of the investment adviser. Annualized expenses of the Money Market Central Funds as of their most recent shareholder report date are less than .005%.
A complete unaudited list of holdings for each Fidelity Central Fund is available upon request or at the Securities and Exchange Commission (the SEC) website at www.sec.gov. In addition, the financial statements of the Fidelity Central Funds are available on the SEC website or upon request.
3. Significant Accounting Policies.
The Fund is an investment company and applies the accounting and reporting guidance of the Financial Accounting Standards Board (FASB) Accounting Standards Codification Topic 946 Financial Services – Investments Companies. The financial statements have been prepared in conformity with accounting principles generally accepted in the United States of America (GAAP), which require management to make certain estimates and assumptions at the date of the financial statements. Actual results could differ from those estimates. Subsequent events, if any, through the date that the financial statements were issued have been evaluated in the preparation of the financial statements. The following summarizes the significant accounting policies of the Fund:
Investment Valuation. Investments are valued as of 4:00 p.m. Eastern time on the last calendar day of the period. The Board of Trustees (the Board) has delegated the day to day responsibility for the valuation of the Fund's investments to the Fair Value Committee (the Committee) established by the Fund's investment adviser. In accordance with valuation policies and procedures approved by the Board, the Fund attempts to obtain prices from one or more third party pricing vendors or brokers to value its investments. When current market prices, quotations or currency exchange rates are not readily available or reliable, investments will be fair valued in good faith by the Committee, in accordance with procedures adopted by the Board. Factors used in determining fair value vary by investment type and may include market or investment specific events. The frequency with which these procedures are used cannot be predicted and they may be utilized to a significant extent. The Committee oversees the Fund's valuation policies and procedures and reports to the Board on the Committee's activities and fair value determinations. The Board monitors the appropriateness of the procedures used in valuing the Fund's investments and ratifies the fair value determinations of the Committee.
The Fund categorizes the inputs to valuation techniques used to value its investments into a disclosure hierarchy consisting of three levels as shown below:
- Level 1 – quoted prices in active markets for identical investments
- Level 2 – other significant observable inputs (including quoted prices for similar investments, interest rates, prepayment speeds, etc.)
- Level 3 – unobservable inputs (including the Fund's own assumptions based on the best information available)
Valuation techniques used to value the Fund's investments by major category are as follows:
Equity securities, including restricted securities, for which market quotations are readily available, are valued at the last reported sale price or official closing price as reported by a third party pricing vendor on the primary market or exchange on which they are traded and are categorized as Level 1 in the hierarchy. In the event there were no sales during the day or closing prices are not available, securities are valued at the last quoted bid price or may be valued using the last available price and are generally categorized as Level 2 in the hierarchy. For foreign equity securities, when market or security specific events arise, comparisons to the valuation of American Depositary Receipts (ADRs), futures contracts, Exchange-Traded Funds (ETFs) and certain indexes as well as quoted prices for similar securities may be used and would be categorized as Level 2 in the hierarchy. Utilizing these techniques may result in transfers between Level 1 and Level 2. For equity securities, including restricted securities, where observable inputs are limited, assumptions about market activity and risk are used and these securities may be categorized as Level 3 in the hierarchy.
ETFs are valued at their last sale price or official closing price as reported by a third party pricing vendor on the primary market or exchange on which they are traded and are categorized as Level 1 in the hierarchy. In the event there were no sales during the day but the exchange reports a closing bid level, ETFs are valued at the closing bid and would be categorized as Level 1 in the hierarchy. In the event there was no closing bid, ETFs may be valued by another method that the Board believes reflects fair value in accordance with the Board's fair value pricing policies and may be categorized as Level 2 in the hierarchy.
Investments in open-end mutual funds, including the Fidelity Central Funds, are valued at their closing net asset value (NAV) each business day and are categorized as Level 1 in the hierarchy.
Changes in valuation techniques may result in transfers in or out of an assigned level within the disclosure hierarchy. The aggregate value of investments by input level as of April 30, 2017, including information on transfers between Levels 1 and 2 is included at the end of the Fund's Schedule of Investments.
Foreign Currency. The Fund may use foreign currency contracts to facilitate transactions in foreign-denominated securities. Gains and losses from these transactions may arise from changes in the value of the foreign currency or if the counterparties do not perform under the contracts' terms.
Foreign-denominated assets, including investment securities, and liabilities are translated into U.S. dollars at the exchange rates at period end. Purchases and sales of investment securities, income and dividends received and expenses denominated in foreign currencies are translated into U.S. dollars at the exchange rate in effect on the transaction date.
The effects of exchange rate fluctuations on investments are included with the net realized and unrealized gain (loss) on investment securities. Other foreign currency transactions resulting in realized and unrealized gain (loss) are disclosed separately.
Investment Transactions and Income. For financial reporting purposes, the Fund's investment holdings and NAV include trades executed through the end of the last business day of the period. The NAV per share for processing shareholder transactions is calculated as of the close of business of the New York Stock Exchange (NYSE), normally 4:00 p.m. Eastern time and includes trades executed through the end of the prior business day. Gains and losses on securities sold are determined on the basis of identified cost and may include proceeds received from litigation. Dividend income is recorded on the ex-dividend date, except for certain dividends from foreign securities where the ex-dividend date may have passed, which are recorded as soon as the Fund is informed of the ex-dividend date. Non-cash dividends included in dividend income, if any, are recorded at the fair market value of the securities received. Income and capital gain distributions from Fidelity Central Funds, if any, are recorded on the ex-dividend date. Certain distributions received by the Fund represent a return of capital or capital gain. The Fund determines the components of these distributions subsequent to the ex-dividend date, based upon receipt of tax filings or other correspondence relating to the underlying investment. These distributions are recorded as a reduction of cost of investments and/or as a realized gain. Investment income is recorded net of foreign taxes withheld where recovery of such taxes is uncertain.
Class Allocations and Expenses. Investment income, realized and unrealized capital gains and losses, common expenses of the Fund, and certain fund-level expense reductions, if any, are allocated daily on a pro-rata basis to each class based on the relative net assets of each class to the total net assets of the Fund. Each class differs with respect to transfer agent and distribution and service plan fees incurred. Certain expense reductions may also differ by class. For the reporting period, the allocated portion of income and expenses to each class as a percent of its average net assets may vary due to the timing of recording these transactions in relation to fluctuating net assets of the classes. Expenses directly attributable to a fund are charged to that fund. Expenses attributable to more than one fund are allocated among the respective funds on the basis of relative net assets or other appropriate methods. Expense estimates are accrued in the period to which they relate and adjustments are made when actual amounts are known.
Income Tax Information and Distributions to Shareholders. Each year, the Fund intends to qualify as a regulated investment company under Subchapter M of the Internal Revenue Code, including distributing substantially all of its taxable income and realized gains. As a result, no provision for U.S. Federal income taxes is required. The Fund files a U.S. federal tax return, in addition to state and local tax returns as required. The Fund's federal income tax returns are subject to examination by the Internal Revenue Service (IRS) for a period of three fiscal years after they are filed. State and local tax returns may be subject to examination for an additional fiscal year depending on the jurisdiction. Foreign taxes are provided for based on the Fund's understanding of the tax rules and rates that exist in the foreign markets in which it invests. The Fund is subject to a tax imposed on capital gains by certain countries in which it invests. An estimated deferred tax liability for net unrealized appreciation on the applicable securities is included in Other payables and accrued expenses on the Statement of Assets & Liabilities.
Distributions are declared and recorded on the ex-dividend date. Income dividends and capital gain distributions are declared separately for each class. Income and capital gain distributions are determined in accordance with income tax regulations, which may differ from GAAP.
Capital accounts within the financial statements are adjusted for permanent book-tax differences. These adjustments have no impact on net assets or the results of operations. Capital accounts are not adjusted for temporary book-tax differences which will reverse in a subsequent period.
Book-tax differences are primarily due to foreign currency transactions, partnerships, certain foreign taxes, passive foreign investment companies (PFIC), expiring capital loss carryforwards and losses deferred due to wash sales.
The federal tax cost of investment securities and unrealized appreciation (depreciation) as of period end were as follows:
| Gross unrealized appreciation | $67,556,148 |
| Gross unrealized depreciation | (7,722,433) |
| Net unrealized appreciation (depreciation) on securities | $59,833,715 |
| Tax cost | $292,170,241 |
Capital loss carryforwards are only available to offset future capital gains of the Fund to the extent provided by regulations and may be limited. Under the Regulated Investment Company Modernization Act of 2010 (the Act), the Fund is permitted to carry forward capital losses incurred in taxable years beginning after December 22, 2010 for an unlimited period and such capital losses are required to be used prior to any losses that expire. The capital loss carryforward information presented below, including any applicable limitation, is estimated as of prior fiscal period end and is subject to adjustment.
| Fiscal year of expiration | |
| 2017 | $(13,607,298) |
| 2019 | (8,855,997) |
| Total with expiration | (22,463,295) |
| No expiration | |
| Short-term | (1,840,457) |
| Total capital loss carryforward | $(24,303,752) |
Due to large subscriptions in a prior period, $22,463,295 of capital losses that will be available to offset future capital gains of the Fund will be limited to approximately $4,535,766 per year
Short-Term Trading (Redemption) Fees. Shares held by investors in the Fund less than 30 days may have been subject to a redemption fee equal to 1.00% of the NAV of shares redeemed. All redemption fees, which reduce the proceeds of the shareholder redemption, are retained by the Fund and accounted for as an addition to paid in capital.
Restricted Securities. The Fund may invest in securities that are subject to legal or contractual restrictions on resale. These securities generally may be resold in transactions exempt from registration or to the public if the securities are registered. Disposal of these securities may involve time-consuming negotiations and expense, and prompt sale at an acceptable price may be difficult. Information regarding restricted securities is included at the end of the Fund's Schedule of Investments.
4. Purchases and Sales of Investments.
Purchases and sales of securities, other than short-term securities, aggregated $94,691,070 and $84,569,294, respectively.
5. Fees and Other Transactions with Affiliates.
Management Fee. Fidelity Management & Research Company (the investment adviser) and its affiliates provide the Fund with investment management related services for which the Fund pays a monthly management fee. The management fee is the sum of an individual fund fee rate that is based on an annual rate of .45% of the Fund's average net assets and an annualized group fee rate that averaged .25% during the period. The group fee rate is based upon the average net assets of all the mutual funds advised by the investment adviser, including any mutual funds previously advised by the investment adviser that are currently advised by Fidelity SelectCo, LLC, an affiliate of the investment adviser. The group fee rate decreases as assets under management increase and increases as assets under management decrease. In addition, the management fee is subject to a performance adjustment (up to a maximum of +/- .20% of the Fund's average net assets over a 36 month performance period). The upward or downward adjustment to the management fee is based on the relative investment performance of the Total International Equity as compared to its benchmark index, the MSCI All Country World ex USA Index, over the same 36 month performance period. For the reporting period, the total annualized management fee rate, including the performance adjustment, was .74% of the Fund's average net assets. The performance adjustment included in the management fee rate may be higher or lower than the maximum performance adjustment rate due to the difference between the average net assets for the reporting and performance periods.
Distribution and Service Plan Fees. In accordance with Rule 12b-1 of the 1940 Act, the Fund has adopted separate Distribution and Service Plans for each class of shares. Certain classes pay Fidelity Distributors Corporation (FDC), an affiliate of the investment adviser, separate Distribution and Service Fees, each of which is based on an annual percentage of each class' average net assets. In addition, FDC may pay financial intermediaries for selling shares of the Fund and providing shareholder support services. For the period, the Distribution and Service Fee rates, total fees and amounts retained by FDC were as follows:
| | Distribution
Fee | Service
Fee | Total Fees | Retained
by FDC |
| Class A | -% | .25% | $10,450 | $1,021 |
| Class M | .25% | .25% | 35,276 | – |
| Class C | .75% | .25% | 13,779 | 2,508 |
| | | | $59,505 | $3,529 |
Sales Load. FDC may receive a front-end sales charge of up to 5.75% for selling Class A shares and 3.50% for selling Class M shares, some of which is paid to financial intermediaries for selling shares of the Fund. Depending on the holding period, FDC may receive contingent deferred sales charges levied on Class A, Class M, and Class C redemptions. The deferred sales charges are 1.00% for Class C shares, 1.00% for certain purchases of Class A shares and .25% for certain purchases of Class M shares.
For the period, sales charge amounts retained by FDC were as follows:
| | Retained
by FDC |
| Class A | $874 |
| Class M | 858 |
| Class C(a) | 315 |
| | $2,047 |
(a) When Class C shares are initially sold, FDC pays commissions from its own resources to financial intermediaries through which the sales are made.
Transfer Agent Fees. Fidelity Investments Institutional Operations Company, Inc., (FIIOC), an affiliate of the investment adviser, is the transfer, dividend disbursing and shareholder servicing agent for each class of the Fund. FIIOC receives account fees and asset-based fees that vary according to the account size and type of account of the shareholders of the respective classes of the Fund except for Class Z. FIIOC receives an asset-based fee of Class Z's average net assets. FIIOC pays for typesetting, printing and mailing of shareholder reports, except proxy statements.
For the period, transfer agent fees for each class were as follows:
| | Amount | % of
Class-Level Average
Net Assets(a) |
| Class A | $11,185 | .27 |
| Class M | 16,738 | .24 |
| Class C | 4,286 | .31 |
| Total International Equity | 170,021 | .11 |
| Class I | 2,408 | .20 |
| Class Z | 12 | .05 |
| | $204,650 | |
(a) Annualized
Accounting and Security Lending Fees. Fidelity Service Company, Inc. (FSC), an affiliate of the investment adviser, maintains the Fund's accounting records. The accounting fee is based on the level of average net assets for each month. Under a separate contract, FSC administers the security lending program. The security lending fee is based on the number and duration of lending transactions.
Brokerage Commissions. The Fund placed a portion of its portfolio transactions with brokerage firms which are affiliates of the investment adviser. Brokerage commissions are included in net realized gain (loss) and change in net unrealized appreciation (depreciation) in the Consolidated Statement of Operations. The commissions paid to these affiliated firms were $394 for the period.
Interfund Trades. The Fund may purchase from or sell securities to other Fidelity Funds under procedures adopted by the Board. The procedures have been designed to ensure these interfund trades are executed in accordance with Rule 17a-7 of the 1940 Act. Interfund trades are included within the respective purchases and sales amounts shown in the Purchases and Sales of Investments note.
6. Committed Line of Credit.
The Fund participates with other funds managed by the investment adviser or an affiliate in a $4.25 billion credit facility (the "line of credit") to be utilized for temporary or emergency purposes to fund shareholder redemptions or for other short-term liquidity purposes. The Fund has agreed to pay commitment fees on its pro-rata portion of the line of credit, which amounted to $544 and is reflected in Miscellaneous expenses on the Statement of Operations. During the period, the Fund did not borrow on this line of credit.
7. Security Lending.
The Fund lends portfolio securities through a lending agent from time to time in order to earn additional income. For equity securities, a lending agent is used and may loan securities to certain qualified borrowers, including Fidelity Capital Markets (FCM), a broker-dealer affiliated with the Fund. On the settlement date of the loan, the Fund receives collateral (in the form of U.S. Treasury obligations, letters of credit and/or cash) against the loaned securities and maintains collateral in an amount not less than 100% of the market value of the loaned securities during the period of the loan. The market value of the loaned securities is determined at the close of business of the Fund and any additional required collateral is delivered to the Fund on the next business day. The Fund or borrower may terminate the loan at any time, and if the borrower defaults on its obligation to return the securities loaned because of insolvency or other reasons, the Fund may apply collateral received from the borrower against the obligation. The Fund may experience delays and costs in recovering the securities loaned. Any cash collateral received is invested in the Fidelity Securities Lending Cash Central Fund. The value of loaned securities and cash collateral at period end are disclosed on the Fund's Statement of Assets and Liabilities. Security lending income represents the income earned on investing cash collateral, less rebates paid to borrowers and any lending agent fees associated with the loan, plus any premium payments received for lending certain types of securities. Security lending income is presented in the Statement of Operations as a component of income from Fidelity Central Funds. Total security lending income during the period amounted to $21,692. During the period, there were no securities loaned to FCM.
8. Expense Reductions.
The investment adviser contractually agreed to reimburse each class to the extent annual operating expenses exceeded certain levels of average net assets as noted in the table below. This reimbursement will remain in place through December 31, 2018. Some expenses, for example interest expense, including commitment fees, are excluded from this reimbursement.
The following classes were in reimbursement during the period:
| | Expense
Limitations | Reimbursement |
| Class C | 2.20% | $268 |
Commissions paid to certain brokers with whom the investment adviser, or its affiliates, places trades on behalf of the Fund include an amount in addition to trade execution, which may be rebated back to the Fund to offset certain expenses. This amount totaled $22,831 for the period.
In addition, during the period the investment adviser reimbursed and/or waived a portion of fund-level operating expenses in the amount of $1,364.
9. Distributions to Shareholders.
Distributions to shareholders of each class were as follows:
| | Six months ended
April 30, 2017 | Year ended October 31, 2016 |
| From net investment income | | |
| Class A | $92,173 | $72,361 |
| Class M | 119,902 | 77,358 |
| Class C | 8,223 | – |
| Total International Equity | 3,979,536 | 3,691,251 |
| Class I | 27,476 | 28,369 |
| Total | $4,227,310 | $3,869,339 |
10. Share Transactions.
Share transactions for each class were as follows and may contain automatic conversions between classes or exchanges between affiliated funds:
| | Shares | Shares | Dollars | Dollars |
| | Six months ended April 30, 2017(a) | Year ended October 31, 2016 | Six months ended April 30, 2017(a) | Year ended October 31, 2016 |
| Class A | | | | |
| Shares sold | 71,231 | 221,277 | $558,901 | $1,661,593 |
| Reinvestment of distributions | 12,257 | 9,322 | 91,682 | 71,782 |
| Shares redeemed | (183,857) | (289,523) | (1,436,713) | (2,176,317) |
| Net increase (decrease) | (100,369) | (58,924) | $(786,130) | $(442,942) |
| Class M | | | | |
| Shares sold | 183,236 | 459,219 | $1,397,603 | $3,481,274 |
| Reinvestment of distributions | 15,944 | 9,988 | 119,902 | 77,308 |
| Shares redeemed | (246,794) | (451,150) | (1,918,439) | (3,381,486) |
| Net increase (decrease) | (47,614) | 18,057 | $(400,934) | $177,096 |
| Class B | | | | |
| Shares sold | – | 1,078 | $– | $7,665 |
| Shares redeemed | – | (16,441) | – | (122,211) |
| Net increase (decrease) | – | (15,363) | $– | $(114,546) |
| Class C | | | | |
| Shares sold | 47,309 | 91,061 | $367,562 | $684,626 |
| Reinvestment of distributions | 1,070 | – | 8,046 | – |
| Shares redeemed | (52,737) | (162,991) | (412,214) | (1,228,823) |
| Net increase (decrease) | (4,358) | (71,930) | $(36,606) | $(544,197) |
| Total International Equity | | | | |
| Shares sold | 5,074,241 | 4,801,342 | $38,688,159 | $36,478,674 |
| Reinvestment of distributions | 523,250 | 471,692 | 3,913,907 | 3,632,026 |
| Shares redeemed | (3,687,104) | (8,073,720) | (28,747,034) | (60,183,392) |
| Net increase (decrease) | 1,910,387 | (2,800,686) | $13,855,032 | $(20,072,692) |
| Class I | | | | |
| Shares sold | 271,947 | 155,879 | $2,158,212 | $1,165,295 |
| Reinvestment of distributions | 3,621 | 3,671 | 27,016 | 28,160 |
| Shares redeemed | (84,375) | (212,465) | (652,197) | (1,617,545) |
| Net increase (decrease) | 191,193 | (52,915) | $1,533,031 | $(424,090) |
| Class Z | | | | |
| Shares sold | 12,937 | – | $100,000 | $– |
| Net increase (decrease) | 12,937 | – | $100,000 | $– |
(a) Share transactions for class Z are for the period February 1, 2017 (commencement of sale of shares) to April 30, 2017.
11. Other.
The Fund's organizational documents provide former and current trustees and officers with a limited indemnification against liabilities arising in connection with the performance of their duties to the Fund. In the normal course of business, the Fund may also enter into contracts that provide general indemnifications. The Fund's maximum exposure under these arrangements is unknown as this would be dependent on future claims that may be made against the Fund. The risk of material loss from such claims is considered remote.
At the end of the period, a shareholder of record owned approximately 71% of the total outstanding shares of the Fund.
Effective after the close of business on April 30, 2017, 30,358,599 shares of the Fund held by an affiliated entity were redeemed in-kind for investments and cash with a value of $259,566,026. The Fund recognized a net realized gain of $51,686,663 for book purposes and no gain or loss for federal income tax purposes.
Shareholder Expense Example
As a shareholder of the Fund, you incur two types of costs: (1) transaction costs, including sales charges (loads) on purchase payments or redemption proceeds, redemption fees and (2) ongoing costs, including management fees, distribution and/or service (12b-1) fees and other Fund expenses. This Example is intended to help you understand your ongoing costs (in dollars) of investing in the Fund and to compare these costs with the ongoing costs of investing in other mutual funds.
The actual expense Example is based on an investment of $1,000 invested at the beginning of the period and held for the entire period (November 1, 2016 to April 30, 2017) for Class A, Class M, Class C, Total International Equity and Class I and for the period (February 1, 2017 to April 30, 2017) for Class Z. The hypothetical expense is based on an investment of $1,000 invested for the one-half year period (November 1, 2016 to April 30, 2017).
Actual Expenses
The first line of the accompanying table for each class of the Fund provides information about actual account values and actual expenses. You may use the information in this line, together with the amount you invested, to estimate the expenses that you paid over the period. Simply divide your account value by $1,000.00 (for example, an $8,600 account value divided by $1,000.00 = 8.6), then multiply the result by the number in the first line for a class of the Fund under the heading entitled "Expenses Paid During Period" to estimate the expenses you paid on your account during this period. A small balance maintenance fee of $12.00 that is charged once a year may apply for certain accounts with a value of less than $2,000. This fee is not included in the table below. If it was, the estimate of expenses you paid during the period would be higher, and your ending account value lower, by this amount. In addition, the Fund, as a shareholder in the underlying Fidelity Central Funds, will indirectly bear its pro-rata share of the fees and expenses incurred by the underlying Fidelity Central Funds. These fees and expenses are not included in the Fund's annualized expense ratio used to calculate the expense estimate in the table below.
Hypothetical Example for Comparison Purposes
The second line of the accompanying table for each class of the Fund provides information about hypothetical account values and hypothetical expenses based on a Class' actual expense ratio and an assumed rate of return of 5% per year before expenses, which is not the Class' actual return. The hypothetical account values and expenses may not be used to estimate the actual ending account balance or expenses you paid for the period. You may use this information to compare the ongoing costs of investing in the Fund and other funds. To do so, compare this 5% hypothetical example with the 5% hypothetical examples that appear in the shareholder reports of the other funds. A small balance maintenance fee of $12.00 that is charged once a year may apply for certain accounts with a value of less than $2,000. This fee is not included in the table below. If it was, the estimate of expenses you paid during the period would be higher, and your ending account value lower, by this amount. In addition, the Fund, as a shareholder in the underlying Fidelity Central Funds, will indirectly bear its pro-rata share of the fees and expenses incurred by the underlying Fidelity Central Funds. These fees and expenses are not included in the Fund's annualized expense ratio used to calculate the expense estimate in the table below.
Please note that the expenses shown in the table are meant to highlight your ongoing costs only and do not reflect any transaction costs. Therefore, the second line of the table is useful in comparing ongoing costs only, and will not help you determine the relative total costs of owning different funds. In addition, if these transactional costs were included, your costs would have been higher.
| | Annualized Expense Ratio-A | Beginning
Account Value
| Ending
Account Value
April 30, 2017 | Expenses Paid
During Period
|
| Class A | 1.42% | | | |
| Actual | | $1,000.00 | $1,104.70 | $7.41-B |
| Hypothetical-C | | $1,000.00 | $1,017.75 | $7.10-D |
| Class M | 1.64% | | | |
| Actual | | $1,000.00 | $1,101.80 | $8.55-B |
| Hypothetical-C | | $1,000.00 | $1,016.66 | $8.20-D |
| Class C | 2.20% | | | |
| Actual | | $1,000.00 | $1,098.70 | $11.45-B |
| Hypothetical-C | | $1,000.00 | $1,013.88 | $10.99-D |
| Total International Equity | 1.02% | | | |
| Actual | | $1,000.00 | $1,105.50 | $5.32-B |
| Hypothetical-C | | $1,000.00 | $1,019.74 | $5.11-D |
| Class I | 1.10% | | | |
| Actual | | $1,000.00 | $1,105.90 | $5.74-B |
| Hypothetical-C | | $1,000.00 | $1,019.34 | $5.51-D |
| Class Z | .95% | | | |
| Actual | | $1,000.00 | $1,082.80 | $2.36-B |
| Hypothetical-C | | $1,000.00 | $1,020.08 | $4.76-D |
A Annualized expense ratio reflects expenses net of applicable fee waivers.
B Actual Expenses are equal to each Class' annualized expense ratio; multiplied by the average account value over the period, multiplied by 181/365 (to reflect the one-half year period) for Class A, Class M, Class C, Total International Equity and Class I and multiplied by 89/365 (to reflect the period February 01, 2017 to April 30, 2017) for class Z.
C 5% return per year before expenses
D Hypothetical expenses are equal to each Class' annualized expense ratio, multiplied by the average account value over the period, multiplied by 181/365 (to reflect the one-half year period).
ATIE-SANN-0617
1.853367.109
Fidelity® Series Emerging Markets Fund
Fidelity® Series Emerging Markets Fund
Class F Fidelity® Series International Growth Fund
Fidelity® Series International Growth Fund
Class F Fidelity® Series International Small Cap Fund
Fidelity® Series International Small Cap Fund
Class F Fidelity® Series International Value Fund
Fidelity® Series International Value Fund
Class F
Semi-Annual Report April 30, 2017 |
|
Contents
To view a fund's proxy voting guidelines and proxy voting record for the 12-month period ended June 30, visit http://www.fidelity.com/proxyvotingresults or visit the Securities and Exchange Commission's (SEC) web site at http://www.sec.gov.
You may also call 1-800-544-8544, or for Class F, call 1-800-835-5092, to request a free copy of the proxy voting guidelines.
Standard & Poor's, S&P and S&P 500 are registered service marks of The McGraw-Hill Companies, Inc. and have been licensed for use by Fidelity Distributors Corporation.
Other third-party marks appearing herein are the property of their respective owners.
All other marks appearing herein are registered or unregistered trademarks or service marks of FMR LLC or an affiliated company. © 2017 FMR LLC. All rights reserved.
This report and the financial statements contained herein are submitted for the general information of the shareholders of the Funds. This report is not authorized for distribution to prospective investors in the Funds unless preceded or accompanied by an effective prospectus.
A fund files its complete schedule of portfolio holdings with the SEC for the first and third quarters of each fiscal year on Form N-Q. Forms N-Q are available on the SEC’s web site at http://www.sec.gov. A fund's Forms N-Q may be reviewed and copied at the SEC’s Public Reference Room in Washington, DC. Information regarding the operation of the SEC's Public Reference Room may be obtained by calling 1-800-SEC-0330.
For a complete list of a fund's portfolio holdings, view the most recent holdings listing, semiannual report, or annual report on Fidelity's web site at http://www.fidelity.com, http://www.institutional.fidelity.com, or http://www.401k.com, as applicable.
NOT FDIC INSURED •MAY LOSE VALUE •NO BANK GUARANTEE
Neither the Funds nor Fidelity Distributors Corporation is a bank.
Fidelity® Series Emerging Markets Fund
Investment Summary (Unaudited)
Geographic Diversification (% of fund's net assets)
| As of April 30, 2017 |
| | Cayman Islands | 15.4% |
| | Korea (South) | 11.7% |
| | Brazil | 9.4% |
| | Taiwan | 8.4% |
| | India | 7.9% |
| | China | 6.7% |
| | South Africa | 6.1% |
| | Russia | 5.5% |
| | Hong Kong | 4.4% |
| | Other* | 24.5% |

* Includes Short-Term investments and Net Other Assets (Liabilities).
Percentages are based on country or territory of incorporation and are adjusted for the effect of futures contracts, if applicable.
| As of October 31, 2016 |
| | Korea (South) | 12.5% |
| | Cayman Islands | 10.9% |
| | India | 9.1% |
| | Brazil | 9.1% |
| | Taiwan | 8.0% |
| | South Africa | 7.1% |
| | China | 6.7% |
| | Hong Kong | 5.5% |
| | Russia | 5.4% |
| | Other* | 25.7% |
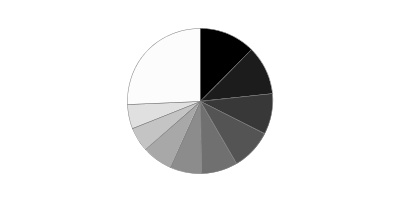
* Includes Short-Term investments and Net Other Assets (Liabilities).
Percentages are based on country or territory of incorporation and are adjusted for the effect of futures contracts, if applicable.
Asset Allocation as of April 30, 2017
| | % of fund's net assets | % of fund's net assets 6 months ago |
| Stocks and Equity Futures | 99.0 | 98.7 |
| Short-Term Investments and Net Other Assets (Liabilities) | 1.0 | 1.3 |
Top Ten Stocks as of April 30, 2017
| | % of fund's net assets | % of fund's net assets 6 months ago |
| Tencent Holdings Ltd. (Cayman Islands, Internet Software & Services) | 4.0 | 3.5 |
| Naspers Ltd. Class N (South Africa, Media) | 3.6 | 3.5 |
| Taiwan Semiconductor Manufacturing Co. Ltd. (Taiwan, Semiconductors & Semiconductor Equipment) | 3.2 | 4.2 |
| JD.com, Inc. sponsored ADR (Cayman Islands, Internet & Direct Marketing Retail) | 2.9 | 0.9 |
| Alibaba Group Holding Ltd. sponsored ADR (Cayman Islands, Internet Software & Services) | 2.2 | 2.4 |
| Sberbank of Russia (Russia, Banks) | 2.1 | 1.3 |
| Largan Precision Co. Ltd. (Taiwan, Electronic Equipment & Components) | 1.8 | 0.6 |
| Itau Unibanco Holding SA sponsored ADR (Brazil, Banks) | 1.8 | 1.6 |
| Samsung Electronics Co. Ltd. (Korea (South), Technology Hardware, Storage & Peripherals) | 1.7 | 3.3 |
| Industrial & Commercial Bank of China Ltd. (H Shares) (China, Banks) | 1.4 | 1.4 |
| | 24.7 | |
Top Market Sectors as of April 30, 2017
| | % of fund's net assets | % of fund's net assets 6 months ago |
| Financials | 23.1 | 22.9 |
| Information Technology | 22.4 | 22.1 |
| Consumer Discretionary | 14.6 | 12.5 |
| Materials | 6.9 | 6.5 |
| Consumer Staples | 6.9 | 7.8 |
| Energy | 6.8 | 8.0 |
| Industrials | 5.6 | 5.6 |
| Telecommunication Services | 4.5 | 5.1 |
| Utilities | 2.8 | 3.0 |
| Real Estate | 2.4 | 2.5 |
Fidelity® Series Emerging Markets Fund
Investments April 30, 2017 (Unaudited)
Showing Percentage of Net Assets
| Common Stocks - 90.8% | | | |
| | | Shares | Value |
| Argentina - 0.5% | | | |
| Grupo Superveille SA sponsored ADR | | 633,652 | $10,765,747 |
| Telecom Argentina SA Class B sponsored ADR | | 1,066,834 | 24,174,458 |
| YPF SA Class D sponsored ADR | | 1,595,800 | 41,219,514 |
|
| TOTAL ARGENTINA | | | 76,159,719 |
|
| Australia - 0.0% | | | |
| Frontier Digital Ventures Ltd. (a) | | 15,575,924 | 5,831,626 |
| Austria - 0.5% | | | |
| Erste Group Bank AG | | 2,277,440 | 81,420,361 |
| Bermuda - 1.5% | | | |
| AGTech Holdings Ltd. (b) | | 71,288,000 | 13,747,389 |
| Credicorp Ltd. (United States) | | 430,440 | 66,141,410 |
| GP Investments Ltd. Class A (depositary receipt) (a)(b) | | 7,634,637 | 16,163,816 |
| PAX Global Technology Ltd. | | 35,382,000 | 21,925,118 |
| Shangri-La Asia Ltd. | | 74,118,000 | 106,150,343 |
| VimpelCom Ltd. sponsored ADR | | 5,091,620 | 21,028,391 |
|
| TOTAL BERMUDA | | | 245,156,467 |
|
| Brazil - 3.8% | | | |
| B2W Companhia Global do Varejo (b) | | 17,043,794 | 71,846,998 |
| B2W Companhia Global do Varejo rights (b) | | 5,044,380 | 20,866,940 |
| BB Seguridade Participacoes SA | | 5,357,900 | 50,455,296 |
| BR Malls Participacoes SA | | 10,579,600 | 46,830,825 |
| Cielo SA | | 3,875,388 | 29,425,135 |
| Companhia de Saneamento de Minas Gerais | | 3,384,070 | 38,382,042 |
| Cosan SA Industria e Comercio | | 2,791,000 | 32,631,499 |
| Direcional Engenharia SA (a) | | 14,002,100 | 26,909,724 |
| FPC Par Corretora de Seguros (a) | | 10,009,600 | 59,602,539 |
| Localiza Rent A Car SA | | 3,211,800 | 47,862,554 |
| Minerva SA (a) | | 11,614,700 | 36,958,608 |
| Smiles SA (a) | | 7,144,900 | 155,411,508 |
|
| TOTAL BRAZIL | | | 617,183,668 |
|
| British Virgin Islands - 0.6% | | | |
| Mail.Ru Group Ltd. GDR (Reg. S) (b) | | 3,745,101 | 98,683,411 |
| Canada - 0.4% | | | |
| Pan American Silver Corp. | | 3,200,800 | 53,677,416 |
| Torex Gold Resources, Inc. (b) | | 1,079,590 | 18,285,133 |
|
| TOTAL CANADA | | | 71,962,549 |
|
| Cayman Islands - 15.2% | | | |
| 51job, Inc. sponsored ADR(b) | | 878,000 | 35,989,220 |
| 58.com, Inc. ADR (b)(c) | | 4,364,618 | 172,751,580 |
| Airtac International Group | | 2,033,000 | 23,206,995 |
| Alibaba Group Holding Ltd. sponsored ADR (b) | | 3,078,906 | 355,613,643 |
| ASM Pacific Technology Ltd. | | 1,651,700 | 24,589,644 |
| Bitauto Holdings Ltd. ADR (b)(c) | | 1,734,333 | 50,850,644 |
| BizLink Holding, Inc. | | 2,627,277 | 15,690,815 |
| China State Construction International Holdings Ltd. | | 24,284,000 | 44,082,624 |
| CK Hutchison Holdings Ltd. | | 1,627,270 | 20,324,269 |
| Ctrip.com International Ltd. ADR (b) | | 2,451,200 | 123,810,112 |
| Haitian International Holdings Ltd. | | 15,806,000 | 38,730,883 |
| JD.com, Inc. sponsored ADR (b) | | 13,696,100 | 480,322,227 |
| Kingsoft Corp. Ltd. | | 10,692,000 | 30,515,778 |
| Momo, Inc. ADR (b)(c) | | 1,065,800 | 40,479,084 |
| NetEase, Inc. ADR | | 430,500 | 114,250,395 |
| Sino Biopharmaceutical Ltd. | | 47,252,000 | 38,878,785 |
| Sunny Optical Technology Group Co. Ltd. | | 4,976,000 | 40,942,359 |
| Tencent Holdings Ltd. | | 20,810,499 | 652,062,413 |
| Uni-President China Holdings Ltd. | | 99,792,000 | 70,048,830 |
| Vipshop Holdings Ltd. ADR (b) | | 7,399,100 | 102,625,517 |
|
| TOTAL CAYMAN ISLANDS | | | 2,475,765,817 |
|
| Chile - 1.8% | | | |
| Compania Cervecerias Unidas SA sponsored ADR | | 2,461,200 | 63,425,124 |
| CorpBanca SA (b) | | 4,234,256,609 | 38,592,733 |
| Enersis SA | | 226,955,727 | 45,067,751 |
| Inversiones La Construccion SA | | 2,259,606 | 30,470,934 |
| Sociedad Quimica y Minera de Chile SA (PN-B) sponsored ADR | | 1,492,200 | 53,047,710 |
| Vina Concha y Toro SA | | 34,096,719 | 54,971,224 |
|
| TOTAL CHILE | | | 285,575,476 |
|
| China - 6.7% | | | |
| Anhui Conch Cement Co. Ltd. (H Shares) | | 15,521,500 | 54,376,683 |
| BBMG Corp. (H Shares) | | 91,408,500 | 49,004,409 |
| China Life Insurance Co. Ltd. (H Shares) | | 40,255,900 | 122,469,104 |
| China Longyuan Power Grid Corp. Ltd. (H Shares) | | 40,331,810 | 31,058,970 |
| China Oilfield Services Ltd. (H Shares) | | 37,296,000 | 34,427,003 |
| China Pacific Insurance (Group) Co. Ltd. (H Shares) | | 29,571,694 | 109,301,613 |
| China Petroleum & Chemical Corp. (H Shares) | | 56,674,000 | 46,022,332 |
| China Telecom Corp. Ltd. (H Shares) | | 96,114,882 | 46,955,531 |
| Industrial & Commercial Bank of China Ltd. (H Shares) | | 343,851,400 | 224,567,564 |
| Inner Mongoli Yili Industries Co. Ltd. (A Shares) | | 8,526,179 | 22,584,758 |
| Kweichow Moutai Co. Ltd. (A Shares) | | 853,529 | 51,195,644 |
| Maanshan Iron & Steel Ltd. (H Shares) (b) | | 72,204,000 | 24,413,471 |
| PICC Property & Casualty Co. Ltd. (H Shares) | | 32,514,500 | 52,335,205 |
| Qingdao Haier Co. Ltd. | | 53,236,837 | 94,140,428 |
| Shanghai International Airport Co. Ltd. (A Shares) | | 8,056,498 | 40,028,296 |
| Tsingtao Brewery Co. Ltd. (H Shares) | | 14,058,000 | 63,256,346 |
| Zhengzhou Yutong Bus Co. Ltd. | | 11,592,654 | 33,869,015 |
|
| TOTAL CHINA | | | 1,100,006,372 |
|
| Colombia - 0.3% | | | |
| Bancolombia SA sponsored ADR | | 1,316,086 | 51,972,236 |
| Czech Republic - 0.3% | | | |
| MONETA Money Bank A/S | | 13,813,475 | 44,609,492 |
| Greece - 0.4% | | | |
| Titan Cement Co. SA (Reg.) | | 2,474,800 | 64,672,233 |
| Hong Kong - 4.4% | | | |
| AIA Group Ltd. | | 5,661,920 | 39,197,824 |
| China Mobile Ltd. | | 3,355,295 | 35,722,560 |
| China Mobile Ltd. sponsored ADR | | 2,870,970 | 153,080,120 |
| China Resources Beer Holdings Co. Ltd. | | 45,776,666 | 110,169,790 |
| China Resources Power Holdings Co. Ltd. | | 19,450,397 | 35,058,151 |
| China Unicom Ltd. | | 6,059,000 | 7,840,491 |
| China Unicom Ltd. sponsored ADR (c) | | 3,382,900 | 43,910,042 |
| CNOOC Ltd. | | 114,760,000 | 133,878,787 |
| CSPC Pharmaceutical Group Ltd. | | 13,110,000 | 18,202,832 |
| Far East Horizon Ltd. | | 118,945,750 | 109,490,004 |
| Sinotruk Hong Kong Ltd. | | 42,614,000 | 29,638,900 |
|
| TOTAL HONG KONG | | | 716,189,501 |
|
| India - 7.9% | | | |
| ACC Ltd. | | 581,950 | 14,723,453 |
| Adani Ports & Special Economic Zone Ltd. (b) | | 10,533,034 | 53,689,147 |
| Axis Bank Ltd. | | 7,227,405 | 57,294,244 |
| Bharti Infratel Ltd. | | 6,240,562 | 34,430,352 |
| Coal India Ltd. (b) | | 12,289,893 | 52,885,346 |
| Edelweiss Financial Services Ltd. | | 10,457,926 | 27,271,291 |
| Eicher Motors Ltd. | | 120,637 | 48,915,311 |
| Gujarat Gas Ltd. (b) | | 297,434 | 3,907,725 |
| ICICI Bank Ltd. | | 8,446,719 | 36,445,469 |
| ICICI Bank Ltd. sponsored ADR | | 4,257,000 | 36,482,490 |
| Indraprastha Gas Ltd. | | 1,833,274 | 30,161,050 |
| ITC Ltd. | | 15,757,498 | 68,137,882 |
| JK Cement Ltd. | | 3,180,810 | 48,226,700 |
| Larsen & Toubro Ltd. | | 2,598,516 | 70,724,581 |
| LIC Housing Finance Ltd. | | 5,198,152 | 54,083,744 |
| Lupin Ltd. | | 4,265,699 | 88,800,720 |
| Petronet LNG Ltd. | | 5,987,168 | 39,462,785 |
| Phoenix Mills Ltd. | | 6,700,878 | 43,088,240 |
| Power Grid Corp. of India Ltd. | | 21,129,547 | 68,361,266 |
| Reliance Industries Ltd. | | 8,149,046 | 176,847,861 |
| SREI Infrastructure Finance Ltd. (a) | | 41,882,982 | 59,023,148 |
| State Bank of India | | 18,734,374 | 84,434,358 |
| Sun Pharmaceutical Industries Ltd. | | 9,377,238 | 93,633,815 |
|
| TOTAL INDIA | | | 1,291,030,978 |
|
| Indonesia - 1.7% | | | |
| PT Astra International Tbk | | 144,270,900 | 96,873,325 |
| PT Bank Mandiri (Persero) Tbk | | 71,786,800 | 63,013,396 |
| PT Bank Rakyat Indonesia Tbk | | 83,789,600 | 81,092,793 |
| PT Kalbe Farma Tbk | | 168,217,000 | 20,003,297 |
| PT Link Net Tbk | | 52,097,141 | 21,106,202 |
|
| TOTAL INDONESIA | | | 282,089,013 |
|
| Israel - 0.4% | | | |
| Bezeq The Israel Telecommunication Corp. Ltd. | | 42,186,637 | 70,994,410 |
| Japan - 1.1% | | | |
| Alps Electric Co. Ltd. | | 1,137,200 | 33,409,554 |
| Nissha Printing Co. Ltd. (c) | | 194,300 | 4,831,573 |
| Sumco Corp. | | 6,203,200 | 108,455,141 |
| Suzuki Motor Corp. | | 807,800 | 33,710,568 |
|
| TOTAL JAPAN | | | 180,406,836 |
|
| Korea (South) - 10.2% | | | |
| AMOREPACIFIC Group, Inc. | | 329,136 | 38,046,224 |
| BS Financial Group, Inc. | | 3,906,637 | 32,830,037 |
| Daou Technology, Inc. (a) | | 3,046,123 | 55,561,755 |
| Duk San Neolux Co. Ltd. (b) | | 413,663 | 13,617,862 |
| EO Technics Co. Ltd. | | 123,781 | 9,226,994 |
| Fila Korea Ltd. (a) | | 653,093 | 39,842,347 |
| Hanon Systems | | 3,402,923 | 25,306,548 |
| Hyundai Fire & Marine Insurance Co. Ltd. | | 1,839,665 | 59,349,249 |
| Hyundai Glovis Co. Ltd. | | 260,068 | 33,148,611 |
| Hyundai Industrial Development & Construction Co. | | 277,121 | 10,888,984 |
| Hyundai Mipo Dockyard Co. Ltd. (b) | | 368,022 | 29,956,784 |
| Hyundai Mobis | | 630,844 | 123,107,743 |
| InterPark INT Corp. (a) | | 3,076,471 | 29,071,786 |
| KB Financial Group, Inc. | | 4,158,832 | 182,859,809 |
| KEPCO Plant Service & Engineering Co. Ltd. | | 521,580 | 26,317,416 |
| Korea Electric Power Corp. | | 1,659,438 | 66,163,085 |
| Korea Express Co. Ltd. (b) | | 345,791 | 50,610,233 |
| Korean Reinsurance Co. (a) | | 6,169,623 | 61,284,054 |
| KT Corp. | | 564,099 | 15,964,691 |
| KT Corp. sponsored ADR (c) | | 480,400 | 7,969,836 |
| LG Chemical Ltd. | | 200,055 | 48,184,837 |
| LG Telecom Ltd. | | 1,716,746 | 21,806,417 |
| Netmarble Games Corp. | | 255,533 | 35,266,070 |
| Samsung Electronics Co. Ltd. | | 138,997 | 272,593,448 |
| Samsung Fire & Marine Insurance Co. Ltd. | | 70,371 | 16,578,259 |
| Samsung Life Insurance Co. Ltd. (b) | | 585,415 | 56,349,281 |
| Samsung SDI Co. Ltd. | | 620,616 | 75,012,922 |
| Shinhan Financial Group Co. Ltd. | | 4,136,541 | 172,752,005 |
| Shinhan Financial Group Co. Ltd. sponsored ADR (c) | | 38,921 | 1,625,341 |
| SK Telecom Co. Ltd. sponsored ADR (c) | | 1,539,700 | 36,321,523 |
| Viatron Technologies, Inc. | | 565,612 | 10,242,271 |
|
| TOTAL KOREA (SOUTH) | | | 1,657,856,422 |
|
| Mauritius - 0.3% | | | |
| MakeMyTrip Ltd. (b) | | 1,095,996 | 42,086,246 |
| Mexico - 4.1% | | | |
| America Movil S.A.B. de CV Series L sponsored ADR | | 1,195,220 | 18,394,436 |
| CEMEX S.A.B. de CV sponsored ADR | | 10,003,112 | 92,228,693 |
| Fibra Uno Administracion SA de CV | | 20,656,500 | 36,078,444 |
| Gruma S.A.B. de CV Series B | | 5,949,120 | 79,440,633 |
| Grupo Aeroportuario del Pacifico S.A.B. de CV Series B | | 5,182,000 | 53,291,999 |
| Grupo Comercial Chedraui S.A.B. de CV | | 11,188,288 | 23,196,445 |
| Grupo Financiero Banorte S.A.B. de CV Series O | | 14,841,118 | 85,892,076 |
| Infraestructura Energetica Nova S.A.B. de CV | | 9,214,200 | 43,043,080 |
| Macquarie Mexican (REIT) (a) | | 71,290,613 | 78,125,143 |
| Promotora y Operadora de Infraestructura S.A.B. de CV | | 3,033,640 | 32,368,066 |
| Tenedora Nemak SA de CV | | 32,631,379 | 34,494,333 |
| Wal-Mart de Mexico SA de CV Series V (b) | | 40,386,500 | 91,176,810 |
|
| TOTAL MEXICO | | | 667,730,158 |
|
| Netherlands - 1.3% | | | |
| Hangzhou Hikvision Digital Technology Co. Ltd. ELS (BNP Paribas Warrant Program) warrants 9/29/17 (b)(d) | | 8,516,700 | 45,181,072 |
| X5 Retail Group NV GDR (Reg. S) (b) | | 1,326,800 | 46,769,700 |
| Yandex NV Series A (b) | | 4,282,132 | 116,730,918 |
|
| TOTAL NETHERLANDS | | | 208,681,690 |
|
| Nigeria - 0.3% | | | |
| Guaranty Trust Bank PLC | | 101,802,322 | 8,872,511 |
| Guaranty Trust Bank PLC GDR (Reg. S) | | 4,047,204 | 17,807,698 |
| Transnational Corp. of Nigeria PLC | | 1,235,285,783 | 3,557,688 |
| Zenith Bank PLC | | 494,649,406 | 24,121,342 |
|
| TOTAL NIGERIA | | | 54,359,239 |
|
| Pakistan - 0.5% | | | |
| Habib Bank Ltd. | | 28,629,800 | 75,319,427 |
| Panama - 0.3% | | | |
| Copa Holdings SA Class A | | 355,000 | 41,329,100 |
| Philippines - 0.5% | | | |
| Metropolitan Bank & Trust Co. | | 22,719,977 | 38,280,770 |
| Robinsons Land Corp. | | 85,337,770 | 43,646,029 |
|
| TOTAL PHILIPPINES | | | 81,926,799 |
|
| Romania - 0.2% | | | |
| Banca Transilvania SA | | 37,985,362 | 25,157,378 |
| Russia - 5.5% | | | |
| Gazprom OAO sponsored ADR (Reg. S) | | 2,440,974 | 11,594,627 |
| Lukoil PJSC sponsored ADR | | 2,952,200 | 146,621,013 |
| Magnit OJSC GDR (Reg. S) | | 1,182,800 | 41,338,860 |
| MegaFon PJSC (b) | | 1,458,940 | 15,345,731 |
| MegaFon PJSC GDR | | 801,791 | 8,571,146 |
| MMC Norilsk Nickel PJSC sponsored ADR | | 5,671,700 | 87,259,105 |
| Mobile TeleSystems OJSC | | 8,744,750 | 42,076,581 |
| Mobile TeleSystems OJSC sponsored ADR | | 300,700 | 3,103,224 |
| NOVATEK OAO GDR (Reg. S) | | 795,600 | 96,426,720 |
| RusHydro PJSC (b) | | 2,153,273,900 | 33,852,494 |
| Sberbank of Russia | | 48,557,720 | 141,038,717 |
| Sberbank of Russia sponsored ADR | | 16,177,531 | 192,350,844 |
| Sistema JSFC | | 86,955,800 | 32,611,050 |
| Sistema JSFC sponsored GDR | | 723,300 | 6,082,953 |
| Unipro PJSC | | 702,967,196 | 31,117,447 |
|
| TOTAL RUSSIA | | | 889,390,512 |
|
| Singapore - 0.4% | | | |
| Ascendas Real Estate Investment Trust | | 16,211,000 | 29,703,439 |
| First Resources Ltd. | | 27,714,800 | 37,193,752 |
|
| TOTAL SINGAPORE | | | 66,897,191 |
|
| South Africa - 6.1% | | | |
| Alexander Forbes Group Holdings Ltd. | | 8,730,029 | 4,207,007 |
| Aspen Pharmacare Holdings Ltd. | | 2,407,182 | 49,936,812 |
| Barclays Africa Group Ltd. | | 2,678,317 | 29,461,236 |
| Bidcorp Ltd. | | 1,437,645 | 30,459,624 |
| Bidvest Group Ltd. | | 3,694,245 | 44,094,586 |
| FirstRand Ltd. | | 18,626,400 | 69,480,950 |
| Imperial Holdings Ltd. | | 3,464,100 | 43,804,939 |
| JSE Ltd. | | 1,889,192 | 20,130,648 |
| Life Healthcare Group Holdings Ltd. | | 16,198,600 | 34,824,490 |
| MTN Group Ltd. | | 1,957,100 | 18,525,724 |
| Naspers Ltd. Class N | | 3,108,160 | 591,021,329 |
| Nedbank Group Ltd. | | 2,069,000 | 34,904,578 |
| Telkom SA Ltd. | | 5,254,057 | 29,400,309 |
|
| TOTAL SOUTH AFRICA | | | 1,000,252,232 |
|
| Taiwan - 8.4% | | | |
| Advantech Co. Ltd. | | 2,978,000 | 24,042,352 |
| Boardtek Electronics Corp. | | 5,386,000 | 4,945,290 |
| Chroma ATE, Inc. | | 6,497,000 | 20,293,048 |
| E.SUN Financial Holdings Co. Ltd. | | 66,739,420 | 40,300,249 |
| E.SUN Financial Holdings Co. Ltd. rights 5/2/17 (b) | | 4,329,445 | 465,563 |
| eMemory Technology, Inc. | | 909,000 | 12,496,757 |
| Genius Electronic Optical Co. Ltd. (b) | | 3,029,000 | 35,428,366 |
| GlobalWafers Co. Ltd. | | 7,066,000 | 50,499,818 |
| GlobalWafers Co. Ltd. unit (b) | | 5,534,300 | 39,553,642 |
| Hon Hai Precision Industry Co. Ltd. (Foxconn) | | 5,810,000 | 18,993,085 |
| King's Town Bank | | 28,288,000 | 27,143,301 |
| LandMark Optoelectronics Corp. | | 2,889,446 | 25,335,115 |
| Largan Precision Co. Ltd. | | 1,802,900 | 299,161,020 |
| PChome Online, Inc. | | 3,061,000 | 26,130,364 |
| Taiwan Cement Corp. | | 66,350,000 | 77,056,712 |
| Taiwan Fertilizer Co. Ltd. | | 15,211,000 | 20,534,322 |
| Taiwan Semiconductor Manufacturing Co. Ltd. | | 77,695,284 | 499,643,695 |
| Taiwan Semiconductor Manufacturing Co. Ltd. sponsored ADR | | 448,101 | 14,818,700 |
| Universal Cement Corp. | | 25,285,914 | 21,836,428 |
| Vanguard International Semiconductor Corp. | | 10,622,000 | 20,243,761 |
| Wistron NeWeb Corp. | | 5,559,800 | 15,930,870 |
| Yuanta Financial Holding Co. Ltd. | | 167,374,206 | 71,439,872 |
|
| TOTAL TAIWAN | | | 1,366,292,330 |
|
| Thailand - 1.8% | | | |
| Delta Electronics PCL (For. Reg.) | | 9,338,900 | 24,831,757 |
| Kasikornbank PCL (For. Reg.) | | 17,030,604 | 91,059,588 |
| PTT Global Chemical PCL (For. Reg.) | | 39,244,000 | 85,066,474 |
| PTT PCL (For. Reg.) | | 6,261,600 | 70,397,757 |
| Star Petroleum Refining PCL | | 70,301,000 | 26,820,035 |
|
| TOTAL THAILAND | | | 298,175,611 |
|
| Turkey - 1.3% | | | |
| Aselsan A/S | | 6,996,000 | 38,466,724 |
| Bim Birlesik Magazalar A/S JSC | | 3,782,000 | 61,809,738 |
| Enka Insaat ve Sanayi A/S | | 15,290,126 | 23,503,734 |
| Tupras Turkiye Petrol Rafinelleri A/S | | 3,103,796 | 78,207,672 |
| Turkiye Garanti Bankasi A/S | | 3,168,000 | 8,553,364 |
|
| TOTAL TURKEY | | | 210,541,232 |
|
| United Arab Emirates - 1.5% | | | |
| DP World Ltd. | | 2,351,205 | 48,058,630 |
| Emaar Properties PJSC | | 54,734,374 | 106,995,046 |
| National Bank of Abu Dhabi PJSC (b) | | 32,328,073 | 96,816,990 |
|
| TOTAL UNITED ARAB EMIRATES | | | 251,870,666 |
|
| United Kingdom - 0.6% | | | |
| Fresnillo PLC | | 1,999,500 | 37,603,205 |
| Mondi PLC | | 2,184,100 | 56,605,215 |
| Shanghai International Airport Co. Ltd. (UBS Warrant Programme) warrants 5/11/18 (b)(d) | | 498,900 | 2,478,759 |
|
| TOTAL UNITED KINGDOM | | | 96,687,179 |
|
| United States of America - 0.0% | | | |
| China Biologic Products, Inc. (b) | | 69,705 | 8,225,190 |
| TOTAL COMMON STOCKS | | | |
| (Cost $11,843,022,952) | | | 14,802,488,767 |
|
| Preferred Stocks - 7.3% | | | |
| Convertible Preferred Stocks - 0.2% | | | |
| Cayman Islands - 0.2% | | | |
| China Internet Plus Holdings Ltd. Series A-11 (b)(e) | | 7,577,282 | 36,295,181 |
| Nonconvertible Preferred Stocks - 7.1% | | | |
| Brazil - 5.6% | | | |
| Ambev SA sponsored ADR | | 22,630,400 | 129,672,192 |
| Banco do Estado Rio Grande do Sul SA | | 8,788,436 | 39,345,214 |
| Companhia Paranaense de Energia-Copel: | | | |
| (PN-B) | | 128,600 | 1,181,853 |
| (PN-B) sponsored ADR (c) | | 4,245,809 | 38,934,069 |
| Fibria Celulose SA sponsored ADR (c) | | 6,129,900 | 56,272,482 |
| Itau Unibanco Holding SA sponsored ADR | | 23,449,394 | 288,427,546 |
| Metalurgica Gerdau SA (PN) (a)(b) | | 37,824,122 | 54,816,705 |
| Petroleo Brasileiro SA - Petrobras (PN) sponsored (non-vtg.) (b) | | 12,561,800 | 109,664,514 |
| Telefonica Brasil SA | | 4,662,000 | 69,458,887 |
| Vale SA (PN-A) sponsored ADR | | 13,845,000 | 113,667,450 |
| | | | 901,440,912 |
| Korea (South) - 1.5% | | | |
| Hyundai Motor Co. Series 2 | | 1,053,899 | 91,993,821 |
| Samsung Electronics Co. Ltd. | | 78,895 | 121,574,310 |
| Samsung Fire & Marine Insurance Co. Ltd. | | 211,865 | 33,429,824 |
| | | | 246,997,955 |
|
| TOTAL NONCONVERTIBLE PREFERRED STOCKS | | | 1,148,438,867 |
|
| TOTAL PREFERRED STOCKS | | | |
| (Cost $882,808,410) | | | 1,184,734,048 |
| | | Principal Amount | Value |
|
| Government Obligations - 0.1% | | | |
| United States of America - 0.1% | | | |
| U.S. Treasury Bills, yield at date of purchase 0.5% to 0.76% 5/25/17 to 6/29/17(f) | | | |
| (Cost $16,999,453) | | 17,010,000 | 16,998,322 |
| | | Shares | Value |
|
| Money Market Funds - 2.7% | | | |
| Fidelity Cash Central Fund, 0.85% (g) | | 300,884,669 | 300,944,846 |
| Fidelity Securities Lending Cash Central Fund 0.86% (g)(h) | | 134,392,137 | 134,405,576 |
| TOTAL MONEY MARKET FUNDS | | | |
| (Cost $435,320,971) | | | 435,350,422 |
| TOTAL INVESTMENT PORTFOLIO - 100.9% | | | |
| (Cost $13,178,151,786) | | | 16,439,571,559 |
| NET OTHER ASSETS (LIABILITIES) - (0.9)% | | | (147,872,053) |
| NET ASSETS - 100% | | | $16,291,699,506 |
| Futures Contracts | | | |
| | Expiration Date | Underlying Face Amount at Value | Unrealized Appreciation/(Depreciation) |
| Purchased | | | |
| Equity Index Contracts | | | |
| 3,142 ICE E-mini MSCI Emerging Markets Index Contracts (United States) | June 2017 | 153,800,900 | $2,951,625 |
The face value of futures purchased as a percentage of Net Assets is 0.9%
Security Type Abbreviations
ELS – Equity-Linked Security
Categorizations in the Schedule of Investments are based on country or territory of incorporation.
Legend
(a) Affiliated company
(b) Non-income producing
(c) Security or a portion of the security is on loan at period end.
(d) Security exempt from registration under Rule 144A of the Securities Act of 1933. These securities may be resold in transactions exempt from registration, normally to qualified institutional buyers. At the end of the period, the value of these securities amounted to $47,659,831 or 0.3% of net assets.
(e) Restricted securities - Investment in securities not registered under the Securities Act of 1933 (excluding 144A issues). At the end of the period, the value of restricted securities (excluding 144A issues) amounted to $36,295,181 or 0.2% of net assets.
(f) Security or a portion of the security was pledged to cover margin requirements for futures contracts. At period end, the value of securities pledged amounted to $6,625,082.
(g) Affiliated fund that is generally available only to investment companies and other accounts managed by Fidelity Investments. The rate quoted is the annualized seven-day yield of the fund at period end. A complete unaudited listing of the fund's holdings as of its most recent quarter end is available upon request. In addition, each Fidelity Central Fund's financial statements are available on the SEC's website or upon request.
(h) Investment made with cash collateral received from securities on loan.
Additional information on each restricted holding is as follows:
| Security | Acquisition Date | Acquisition Cost |
| China Internet Plus Holdings Ltd. Series A-11 | 1/26/15 | $23,950,652 |
Affiliated Central Funds
Information regarding fiscal year to date income earned by the Fund from investments in Fidelity Central Funds is as follows:
| Fund | Income earned |
| Fidelity Cash Central Fund | $965,524 |
| Fidelity Securities Lending Cash Central Fund | 675,139 |
| Total | $1,640,663 |
Other Affiliated Issuers
An affiliated company is a company in which the Fund has ownership of at least 5% of the voting securities. Fiscal year to date transactions with companies which are or were affiliates are as follows:
| Affiliate | Value, beginning of period | Purchases | Sales Proceeds | Dividend Income | Value, end of period |
| Daou Technology, Inc. | $44,852,464 | $8,601,682 | $-- | $481,811 | $55,561,755 |
| Direcional Engenharia SA | 23,505,135 | 550,989 | -- | -- | 26,909,724 |
| Fila Korea Ltd. | 51,126,461 | -- | 1,060,525 | 115,434 | 39,842,347 |
| FPC Par Corretora de Seguros | 51,039,845 | 6,095,228 | 12,853,097 | 1,430,767 | 59,602,539 |
| Frontier Digital Ventures Ltd. | 6,042,789 | -- | -- | -- | 5,831,626 |
| GP Investments Ltd. Class A (depositary receipt) | 17,347,037 | -- | 697,647 | -- | 16,163,816 |
| InterPark INT Corp. | 30,049,593 | 76,664 | -- | 190,078 | 29,071,786 |
| Korean Reinsurance Co. | 75,492,743 | -- | 11,379,020 | 1,390,984 | 61,284,054 |
| Macquarie Mexican (REIT) | 90,614,570 | 224,011 | 907,383 | 3,313,693 | 78,125,143 |
| Metalurgica Gerdau SA (PN) | 56,285,896 | -- | -- | -- | 54,816,705 |
| Minerva SA | 40,691,800 | -- | 4,320,600 | 1,007,272 | 36,958,608 |
| Smiles SA | 137,502,361 | -- | 6,016,092 | 9,969,197 | 155,411,508 |
| SREI Infrastructure Finance Ltd. | 45,678,231 | -- | -- | -- | 59,023,148 |
| Total | $670,228,925 | $15,548,574 | $37,234,364 | $17,899,236 | $678,602,759 |
Investment Valuation
The following is a summary of the inputs used, as of April 30, 2017, involving the Fund's assets and liabilities carried at fair value. The inputs or methodology used for valuing securities may not be an indication of the risk associated with investing in those securities. For more information on valuation inputs, and their aggregation into the levels used below, please refer to the Investment Valuation section in the accompanying Notes to Financial Statements.
| | Valuation Inputs at Reporting Date: |
| Description | Total | Level 1 | Level 2 | Level 3 |
| Investments in Securities: | | | | |
| Equities: | | | | |
| Consumer Discretionary | $2,375,523,589 | $1,748,207,079 | $591,021,329 | $36,295,181 |
| Consumer Staples | 1,119,852,184 | 1,119,852,184 | -- | -- |
| Energy | 1,097,107,465 | 917,206,346 | 179,901,119 | -- |
| Financials | 3,701,991,370 | 2,998,300,872 | 703,690,498 | -- |
| Health Care | 352,505,941 | 352,505,941 | -- | -- |
| Industrials | 939,619,050 | 939,619,050 | -- | -- |
| Information Technology | 3,616,257,616 | 2,429,285,438 | 1,186,972,178 | -- |
| Materials | 1,145,176,698 | 1,145,176,698 | -- | -- |
| Real Estate | 384,467,166 | 384,467,166 | -- | -- |
| Telecommunication Services | 784,875,065 | 683,270,742 | 101,604,323 | -- |
| Utilities | 469,846,671 | 403,683,586 | 66,163,085 | -- |
| Government Obligations | 16,998,322 | -- | 16,998,322 | -- |
| Money Market Funds | 435,350,422 | 435,350,422 | -- | -- |
| Total Investments in Securities: | $16,439,571,559 | $13,556,925,524 | $2,846,350,854 | $36,295,181 |
| Derivative Instruments: | | | | |
| Assets | | | | |
| Futures Contracts | $2,951,625 | $2,951,625 | $-- | $-- |
| Total Assets | $2,951,625 | $2,951,625 | $-- | $-- |
| Total Derivative Instruments: | $2,951,625 | $2,951,625 | $-- | $-- |
The following is a summary of transfers between Level 1 and Level 2 for the period ended April 30, 2017. Transfers are assumed to have occurred at the beginning of the period, and are primarily attributable to the valuation techniques used for foreign equity securities, as discussed in the accompanying Notes to Financial Statements:
| Transfers | Total |
| Level 1 to Level 2 | $684,740,660 |
| Level 2 to Level 1 | $252,117,868 |
Value of Derivative Instruments
The following table is a summary of the Fund's value of derivative instruments by primary risk exposure as of April 30, 2017. For additional information on derivative instruments, please refer to the Derivative Instruments section in the accompanying Notes to Financial Statements.
| Primary Risk Exposure / Derivative Type | Value |
| | Asset | Liability |
| Equity Risk | | |
| Futures Contracts(a) | $2,951,625 | $0 |
| Total Equity Risk | 2,951,625 | 0 |
| Total Value of Derivatives | $2,951,625 | $0 |
(a) Reflects gross cumulative appreciation (depreciation) on futures contracts as presented in the Schedule of Investments. In the Statement of Assets and Liabilities, the period end daily variation margin is included in receivable or payable for daily variation margin for derivative instruments, and the net cumulative appreciation (depreciation) is included in net unrealized appreciation (depreciation).
See accompanying notes which are an integral part of the financial statements.
Fidelity® Series Emerging Markets Fund
Financial Statements
Statement of Assets and Liabilities
| | | April 30, 2017 (Unaudited) |
| Assets | | |
Investment in securities, at value (including securities loaned of $130,265,683) — See accompanying schedule:
Unaffiliated issuers (cost $12,139,296,333) | $15,325,618,378 | |
| Fidelity Central Funds (cost $435,320,971) | 435,350,422 | |
| Other affiliated issuers (cost $603,534,482) | 678,602,759 | |
| Total Investments (cost $13,178,151,786) | | $16,439,571,559 |
| Cash | | 2,135,696 |
| Foreign currency held at value (cost $25,119,286) | | 25,122,127 |
| Receivable for investments sold | | 149,048,320 |
| Receivable for fund shares sold | | 10,186,425 |
| Dividends receivable | | 29,928,409 |
| Interest receivable | | 1,405 |
| Distributions receivable from Fidelity Central Funds | | 292,451 |
| Receivable for daily variation margin for derivative instruments | | 518,430 |
| Prepaid expenses | | 9,513 |
| Other receivables | | 3,132,115 |
| Total assets | | 16,659,946,450 |
| Liabilities | | |
| Payable for investments purchased | $195,043,194 | |
| Payable for fund shares redeemed | 7,029,596 | |
| Accrued management fee | 10,629,732 | |
| Other affiliated payables | 1,107,121 | |
| Other payables and accrued expenses | 20,041,144 | |
| Collateral on securities loaned | 134,396,157 | |
| Total liabilities | | 368,246,944 |
| Net Assets | | $16,291,699,506 |
| Net Assets consist of: | | |
| Paid in capital | | $14,235,011,563 |
| Undistributed net investment income | | 42,186,047 |
| Accumulated undistributed net realized gain (loss) on investments and foreign currency transactions | | (1,232,020,173) |
| Net unrealized appreciation (depreciation) on investments and assets and liabilities in foreign currencies | | 3,246,522,069 |
| Net Assets | | $16,291,699,506 |
| Series Emerging Markets: | | |
| Net Asset Value, offering price and redemption price per share ($7,408,181,964 ÷ 405,165,839 shares) | | $18.28 |
| Class F: | | |
| Net Asset Value, offering price and redemption price per share ($8,883,517,542 ÷ 484,446,295 shares) | | $18.34 |
See accompanying notes which are an integral part of the financial statements.
Statement of Operations
| | | Six months ended April 30, 2017 (Unaudited) |
| Investment Income | | |
| Dividends (including $17,899,236 earned from other affiliated issuers) | | $171,867,771 |
| Interest | | 33,598 |
| Income from Fidelity Central Funds | | 1,640,663 |
| Income before foreign taxes withheld | | 173,542,032 |
| Less foreign taxes withheld | | (17,832,482) |
| Total income | | 155,709,550 |
| Expenses | | |
| Management fee | $61,842,262 | |
| Transfer agent fees | 5,532,785 | |
| Accounting and security lending fees | 1,014,613 | |
| Custodian fees and expenses | 4,638,422 | |
| Independent trustees' fees and expenses | 31,313 | |
| Registration fees | 6,307 | |
| Audit | 42,228 | |
| Legal | 18,418 | |
| Miscellaneous | 58,642 | |
| Total expenses before reductions | 73,184,990 | |
| Expense reductions | (1,344,266) | 71,840,724 |
| Net investment income (loss) | | 83,868,826 |
| Realized and Unrealized Gain (Loss) | | |
| Net realized gain (loss) on: | | |
| Investment securities: | | |
| Unaffiliated issuers (net of foreign taxes of $1,315,565) | 208,801,873 | |
| Fidelity Central Funds | 6,894 | |
| Other affiliated issuers | (685,070) | |
| Foreign currency transactions | 601,048 | |
| Futures contracts | (6,885,374) | |
| Total net realized gain (loss) | | 201,839,371 |
Change in net unrealized appreciation (depreciation) on:
Investment securities (net of increase in deferred foreign taxes of $6,093,296) | 1,316,771,489 | |
| Assets and liabilities in foreign currencies | 292,848 | |
| Futures contracts | 2,910,535 | |
| Total change in net unrealized appreciation (depreciation) | | $1,319,974,872 |
| Net gain (loss) | | 1,521,814,243 |
| Net increase (decrease) in net assets resulting from operations | | $1,605,683,069 |
See accompanying notes which are an integral part of the financial statements.
Statement of Changes in Net Assets
| | Six months ended April 30, 2017 (Unaudited) | Year ended October 31, 2016 |
| Increase (Decrease) in Net Assets | | |
| Operations | | |
| Net investment income (loss) | $83,868,826 | $180,634,834 |
| Net realized gain (loss) | 201,839,371 | (402,075,307) |
| Change in net unrealized appreciation (depreciation) | 1,319,974,872 | 1,930,762,003 |
| Net increase (decrease) in net assets resulting from operations | 1,605,683,069 | 1,709,321,530 |
| Distributions to shareholders from net investment income | (193,538,453) | (158,339,864) |
| Distributions to shareholders from net realized gain | (33,641,199) | – |
| Total distributions | (227,179,652) | (158,339,864) |
| Share transactions - net increase (decrease) | (547,474,041) | 1,997,447,805 |
| Total increase (decrease) in net assets | 831,029,376 | 3,548,429,471 |
| Net Assets | | |
| Beginning of period | 15,460,670,130 | 11,912,240,659 |
| End of period | $16,291,699,506 | $15,460,670,130 |
| Other Information | | |
| Undistributed net investment income end of period | $42,186,047 | $151,855,674 |
See accompanying notes which are an integral part of the financial statements.
Financial Highlights — Fidelity Series Emerging Markets Fund
| | Six months ended (Unaudited) April 30, | Years ended October 31, | | | | |
| | 2017 | 2016 | 2015 | 2014 | 2013 | 2012 |
| Selected Per–Share Data | | | | | | |
| Net asset value, beginning of period | $16.79 | $15.31 | $17.77 | $17.56 | $16.25 | $16.06 |
| Income from Investment Operations | | | | | | |
| Net investment income (loss)A | .08 | .19 | .21B | .21 | .20 | .21 |
| Net realized and unrealized gain (loss) | 1.64 | 1.47 | (2.53) | .17 | 1.34 | .59 |
| Total from investment operations | 1.72 | 1.66 | (2.32) | .38 | 1.54 | .80 |
| Distributions from net investment income | (.19) | (.18) | (.14) | (.17) | (.22) | (.09) |
| Distributions from net realized gain | (.04) | – | – | (.01) | (.01) | (.52) |
| Total distributions | (.23) | (.18) | (.14) | (.17)C | (.23) | (.61) |
| Net asset value, end of period | $18.28 | $16.79 | $15.31 | $17.77 | $17.56 | $16.25 |
| Total ReturnD,E | 10.48% | 11.02% | (13.14)% | 2.20% | 9.59% | 5.40% |
| Ratios to Average Net AssetsF,G | | | | | | |
| Expenses before reductions | 1.03%H | 1.03% | 1.04% | 1.06% | 1.09% | 1.10% |
| Expenses net of fee waivers, if any | 1.03%H | 1.03% | 1.04% | 1.06% | 1.09% | 1.10% |
| Expenses net of all reductions | 1.01%H | 1.03% | 1.03% | 1.06% | 1.06% | 1.07% |
| Net investment income (loss) | 1.00%H | 1.24% | 1.29%B | 1.18% | 1.22% | 1.37% |
| Supplemental Data | | | | | | |
| Net assets, end of period (000 omitted) | $7,408,182 | $6,998,219 | $5,571,493 | $4,837,497 | $3,623,928 | $3,182,644 |
| Portfolio turnover rateI | 46%H | 45% | 64% | 93% | 79% | 80% |
A Calculated based on average shares outstanding during the period.
B Net Investment income per share reflects a large, non-recurring dividend which amounted to $.05 per share. Excluding this non-recurring dividend, the ratio of net investment income (loss) to average net assets would have been 1.00%.
C Total distributions of $.17 per share is comprised of distributions from net investment income of $.166 and distributions from net realized gain of $.006 per share.
D Total returns for periods of less than one year are not annualized.
E Total returns would have been lower if certain expenses had not been reduced during the applicable periods shown.
F Fees and expenses of any underlying Fidelity Central Funds are not included in the Fund's expense ratio. The Fund indirectly bears its proportionate share of the expenses of any underlying Fidelity Central Funds.
G Expense ratios reflect operating expenses of the class. Expenses before reductions do not reflect amounts reimbursed by the investment adviser or reductions from brokerage service arrangements or reductions from other expense offset arrangements and do not represent the amount paid by the class during periods when reimbursements or reductions occur. Expenses net of fee waivers reflect expenses after reimbursement by the investment adviser but prior to reductions from brokerage service arrangements or other expense offset arrangements. Expenses net of all reductions represent the net expenses paid by the class.
H Annualized
I Amount does not include the portfolio activity of any underlying Fidelity Central Funds.
See accompanying notes which are an integral part of the financial statements.
Financial Highlights — Fidelity Series Emerging Markets Fund Class F
| | Six months ended (Unaudited) April 30, | Years ended October 31, | | | | |
| | 2017 | 2016 | 2015 | 2014 | 2013 | 2012 |
| Selected Per–Share Data | | | | | | |
| Net asset value, beginning of period | $16.85 | $15.36 | $17.83 | $17.62 | $16.30 | $16.11 |
| Income from Investment Operations | | | | | | |
| Net investment income (loss)A | .10 | .21 | .24B | .24 | .23 | .25 |
| Net realized and unrealized gain (loss) | 1.64 | 1.49 | (2.54) | .17 | 1.35 | .58 |
| Total from investment operations | 1.74 | 1.70 | (2.30) | .41 | 1.58 | .83 |
| Distributions from net investment income | (.22) | (.21) | (.17) | (.19) | (.26) | (.12) |
| Distributions from net realized gain | (.04) | – | – | (.01) | (.01) | (.52) |
| Total distributions | (.25)C | (.21) | (.17) | (.20) | (.26)D | (.64) |
| Net asset value, end of period | $18.34 | $16.85 | $15.36 | $17.83 | $17.62 | $16.30 |
| Total ReturnE,F | 10.61% | 11.23% | (13.02)% | 2.35% | 9.84% | 5.60% |
| Ratios to Average Net AssetsG,H | | | | | | |
| Expenses before reductions | .87%I | .87% | .88% | .89% | .90% | .90% |
| Expenses net of fee waivers, if any | .87%I | .87% | .88% | .89% | .90% | .90% |
| Expenses net of all reductions | .85%I | .86% | .87% | .89% | .88% | .87% |
| Net investment income (loss) | 1.15%I | 1.41% | 1.45%B | 1.35% | 1.40% | 1.57% |
| Supplemental Data | | | | | | |
| Net assets, end of period (000 omitted) | $8,883,518 | $8,462,452 | $6,340,748 | $5,208,429 | $3,490,320 | $2,570,780 |
| Portfolio turnover rateJ | 46%I | 45% | 64% | 93% | 79% | 80% |
A Calculated based on average shares outstanding during the period.
B Net Investment income per share reflects a large, non-recurring dividend which amounted to $.05 per share. Excluding this non-recurring dividend, the ratio of net investment income (loss) to average net assets would have been 1.17%.
C Total distributions of $.25 per share is comprised of distributions from net investment income of $.218 and distributions from net realized gain of $.036 per share.
D Total distributions of $.26 per share is comprised of distributions from net investment income of $.255 and distributions from net realized gain of $.009 per share.
E Total returns for periods of less than one year are not annualized.
F Total returns would have been lower if certain expenses had not been reduced during the applicable periods shown.
G Fees and expenses of any underlying Fidelity Central Funds are not included in the Fund's expense ratio. The Fund indirectly bears its proportionate share of the expenses of any underlying Fidelity Central Funds.
H Expense ratios reflect operating expenses of the class. Expenses before reductions do not reflect amounts reimbursed by the investment adviser or reductions from brokerage service arrangements or reductions from other expense offset arrangements and do not represent the amount paid by the class during periods when reimbursements or reductions occur. Expenses net of fee waivers reflect expenses after reimbursement by the investment adviser but prior to reductions from brokerage service arrangements or other expense offset arrangements. Expenses net of all reductions represent the net expenses paid by the class.
I Annualized
J Amount does not include the portfolio activity of any underlying Fidelity Central Funds.
See accompanying notes which are an integral part of the financial statements.
Fidelity® Series International Growth Fund
Investment Summary (Unaudited)
Geographic Diversification (% of fund's net assets)
| As of April 30, 2017 |
| | United States of America* | 20.2% |
| | Japan | 11.7% |
| | United Kingdom | 11.5% |
| | Switzerland | 10.8% |
| | Sweden | 5.6% |
| | Germany | 4.8% |
| | Spain | 4.7% |
| | Belgium | 3.9% |
| | Australia | 3.7% |
| | Other | 23.1% |
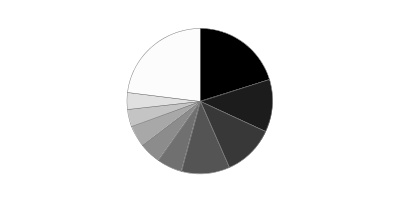
* Includes Short-Term investments and Net Other Assets (Liabilities).
Percentages are based on country or territory of incorporation and are adjusted for the effect of futures contracts, if applicable.
| As of October 31, 2016 |
| | United States of America* | 23.9% |
| | Japan | 13.8% |
| | Switzerland | 12.5% |
| | United Kingdom | 8.8% |
| | Spain | 5.1% |
| | Belgium | 4.0% |
| | Sweden | 4.0% |
| | Australia | 4.0% |
| | Germany | 3.9% |
| | Other | 20.0% |

* Includes Short-Term investments and Net Other Assets (Liabilities).
Percentages are based on country or territory of incorporation and are adjusted for the effect of futures contracts, if applicable.
Asset Allocation as of April 30, 2017
| | % of fund's net assets | % of fund's net assets 6 months ago |
| Stocks | 97.1 | 94.8 |
| Short-Term Investments and Net Other Assets (Liabilities) | 2.9 | 5.2 |
Top Ten Stocks as of April 30, 2017
| | % of fund's net assets | % of fund's net assets 6 months ago |
| Nestle SA (Reg. S) (Switzerland, Food Products) | 5.8 | 5.5 |
| Anheuser-Busch InBev SA NV (Belgium, Beverages) | 3.4 | 3.5 |
| CSL Ltd. (Australia, Biotechnology) | 3.0 | 3.0 |
| SAP AG (Germany, Software) | 2.7 | 2.2 |
| Roche Holding AG (participation certificate) (Switzerland, Pharmaceuticals) | 2.6 | 3.1 |
| Visa, Inc. Class A (United States of America, IT Services) | 2.4 | 2.3 |
| British American Tobacco PLC (United Kingdom) (United Kingdom, Tobacco) | 2.3 | 0.0 |
| Inditex SA (Spain, Specialty Retail) | 2.2 | 2.7 |
| Reckitt Benckiser Group PLC (United Kingdom, Household Products) | 2.2 | 2.4 |
| ASSA ABLOY AB (B Shares) (Sweden, Building Products) | 2.2 | 2.2 |
| | 28.8 | |
Top Market Sectors as of April 30, 2017
| | % of fund's net assets | % of fund's net assets 6 months ago |
| Consumer Staples | 19.2 | 19.8 |
| Information Technology | 18.3 | 15.7 |
| Health Care | 14.7 | 17.9 |
| Industrials | 13.4 | 10.9 |
| Consumer Discretionary | 10.7 | 12.9 |
| Financials | 10.7 | 9.1 |
| Materials | 6.8 | 5.3 |
| Real Estate | 2.3 | 2.5 |
| Energy | 0.6 | 0.3 |
| Telecommunication Services | 0.4 | 0.4 |
Percentages shown as 0.0% may reflect amounts less than 0.05%.
Fidelity® Series International Growth Fund
Investments April 30, 2017 (Unaudited)
Showing Percentage of Net Assets
| Common Stocks - 96.7% | | | |
| | | Shares | Value |
| Australia - 3.7% | | | |
| CSL Ltd. | | 4,300,501 | $426,839,517 |
| Transurban Group unit | | 11,421,639 | 104,340,784 |
|
| TOTAL AUSTRALIA | | | 531,180,301 |
|
| Austria - 1.7% | | | |
| Andritz AG | | 3,111,498 | 172,077,541 |
| Buwog-Gemeinnuetzige Wohnung | | 2,693,763 | 72,741,694 |
|
| TOTAL AUSTRIA | | | 244,819,235 |
|
| Belgium - 3.9% | | | |
| Anheuser-Busch InBev SA NV | | 4,369,581 | 492,759,258 |
| KBC Groep NV | | 1,006,959 | 72,701,235 |
|
| TOTAL BELGIUM | | | 565,460,493 |
|
| Brazil - 0.1% | | | |
| Itau Unibanco Holding SA | | 972,900 | 10,439,966 |
| Canada - 1.4% | | | |
| Alimentation Couche-Tard, Inc. Class B (sub. vtg.) | | 1,362,400 | 62,658,124 |
| Franco-Nevada Corp. | | 1,002,400 | 68,175,390 |
| Pason Systems, Inc. | | 2,199,769 | 32,664,970 |
| PrairieSky Royalty Ltd. | | 1,538,800 | 33,536,720 |
|
| TOTAL CANADA | | | 197,035,204 |
|
| Cayman Islands - 1.1% | | | |
| 58.com, Inc. ADR (a)(b) | | 1,127,100 | 44,610,618 |
| Alibaba Group Holding Ltd. sponsored ADR (a) | | 1,042,200 | 120,374,100 |
|
| TOTAL CAYMAN ISLANDS | | | 164,984,718 |
|
| Denmark - 1.3% | | | |
| Jyske Bank A/S (Reg.) | | 1,346,300 | 71,945,941 |
| Novo Nordisk A/S Series B sponsored ADR | | 3,135,081 | 121,264,933 |
|
| TOTAL DENMARK | | | 193,210,874 |
|
| Finland - 0.3% | | | |
| Tikkurila Oyj | | 1,985,479 | 39,362,637 |
| France - 0.9% | | | |
| Essilor International SA | | 968,544 | 125,496,410 |
| Germany - 4.8% | | | |
| Bayer AG | | 2,443,700 | 302,366,716 |
| SAP AG | | 3,909,649 | 391,614,076 |
|
| TOTAL GERMANY | | | 693,980,792 |
|
| Hong Kong - 2.2% | | | |
| AIA Group Ltd. | | 45,615,000 | 315,795,477 |
| India - 1.0% | | | |
| Housing Development Finance Corp. Ltd. | | 5,825,258 | 139,279,753 |
| Ireland - 3.4% | | | |
| CRH PLC sponsored ADR | | 7,833,805 | 284,523,798 |
| James Hardie Industries PLC CDI | | 12,709,123 | 215,741,124 |
|
| TOTAL IRELAND | | | 500,264,922 |
|
| Isle of Man - 0.5% | | | |
| Playtech Ltd. | | 5,940,274 | 73,783,953 |
| Israel - 0.3% | | | |
| Azrieli Group | | 839,086 | 44,690,400 |
| Italy - 1.0% | | | |
| Azimut Holding SpA | | 1,882,606 | 36,748,951 |
| Interpump Group SpA | | 4,116,049 | 109,175,956 |
|
| TOTAL ITALY | | | 145,924,907 |
|
| Japan - 11.7% | | | |
| Astellas Pharma, Inc. | | 7,259,800 | 95,735,797 |
| DENSO Corp. | | 3,117,300 | 134,199,800 |
| East Japan Railway Co. | | 1,524,900 | 136,163,755 |
| Hoya Corp. | | 3,148,100 | 150,351,957 |
| Keyence Corp. | | 777,600 | 312,504,867 |
| Komatsu Ltd. | | 4,388,300 | 117,262,154 |
| Misumi Group, Inc. | | 6,035,300 | 114,290,364 |
| Mitsui Fudosan Co. Ltd. | | 4,272,000 | 93,870,949 |
| Nintendo Co. Ltd. | | 240,200 | 60,786,358 |
| Olympus Corp. | | 3,742,100 | 144,010,845 |
| OSG Corp. | | 3,588,000 | 73,868,222 |
| SHO-BOND Holdings Co. Ltd. (c) | | 1,551,100 | 70,963,086 |
| USS Co. Ltd. | | 10,817,800 | 191,173,501 |
|
| TOTAL JAPAN | | | 1,695,181,655 |
|
| Kenya - 0.4% | | | |
| Safaricom Ltd. | | 350,021,100 | 65,289,789 |
| Korea (South) - 1.2% | | | |
| BGFretail Co. Ltd. | | 1,214,203 | 116,873,443 |
| NAVER Corp. | | 82,254 | 57,843,882 |
|
| TOTAL KOREA (SOUTH) | | | 174,717,325 |
|
| Mexico - 0.5% | | | |
| Fomento Economico Mexicano S.A.B. de CV sponsored ADR | | 782,412 | 70,448,376 |
| Netherlands - 2.0% | | | |
| ASML Holding NV (Netherlands) | | 2,201,400 | 290,995,481 |
| New Zealand - 0.3% | | | |
| Auckland International Airport Ltd. | | 9,564,644 | 45,312,884 |
| South Africa - 2.0% | | | |
| Clicks Group Ltd. | | 7,052,484 | 70,837,521 |
| Naspers Ltd. Class N | | 1,195,210 | 227,270,991 |
|
| TOTAL SOUTH AFRICA | | | 298,108,512 |
|
| Spain - 4.7% | | | |
| Amadeus IT Holding SA Class A | | 3,970,800 | 214,106,925 |
| Hispania Activos Inmobiliarios SA | | 2,597,710 | 39,219,441 |
| Inditex SA | | 8,564,127 | 328,470,693 |
| Merlin Properties Socimi SA | | 3,236,200 | 38,301,218 |
| Prosegur Compania de Seguridad SA (Reg.) | | 10,374,189 | 67,690,618 |
|
| TOTAL SPAIN | | | 687,788,895 |
|
| Sweden - 5.6% | | | |
| ASSA ABLOY AB (B Shares) (b) | | 15,029,217 | 325,619,178 |
| Atlas Copco AB (A Shares) (b) | | 5,437,000 | 203,305,116 |
| Fagerhult AB | | 1,264,264 | 52,170,356 |
| Svenska Cellulosa AB (SCA) (B Shares) | | 3,520,800 | 116,627,270 |
| Svenska Handelsbanken AB (A Shares) | | 8,145,613 | 115,599,963 |
|
| TOTAL SWEDEN | | | 813,321,883 |
|
| Switzerland - 10.8% | | | |
| Nestle SA (Reg. S) | | 10,998,888 | 847,139,945 |
| Novartis AG | | 2,686,178 | 206,795,610 |
| Roche Holding AG (participation certificate) | | 1,428,511 | 373,790,610 |
| Schindler Holding AG: | | | |
| (participation certificate) | | 579,078 | 118,318,148 |
| (Reg.) | | 154,309 | 30,644,682 |
|
| TOTAL SWITZERLAND | | | 1,576,688,995 |
|
| Taiwan - 0.9% | | | |
| Taiwan Semiconductor Manufacturing Co. Ltd. | | 20,014,000 | 128,706,253 |
| Turkey - 0.2% | | | |
| Tupras Turkiye Petrol Rafinelleri A/S | | 1,160,924 | 29,252,297 |
| United Kingdom - 11.5% | | | |
| BAE Systems PLC | | 15,343,500 | 124,619,538 |
| Berendsen PLC | | 5,892,200 | 64,028,935 |
| British American Tobacco PLC (United Kingdom) | | 4,882,900 | 329,905,178 |
| Elementis PLC | | 8,531,847 | 33,615,464 |
| Howden Joinery Group PLC | | 6,596,900 | 39,560,132 |
| Informa PLC | | 15,456,952 | 128,527,400 |
| InterContinental Hotel Group PLC ADR (b) | | 4,885,952 | 257,929,406 |
| Prudential PLC | | 10,927,318 | 242,519,396 |
| Reckitt Benckiser Group PLC | | 3,537,987 | 325,981,439 |
| Rightmove PLC | | 692,770 | 37,559,961 |
| Shaftesbury PLC | | 3,385,400 | 40,866,057 |
| Spectris PLC | | 1,175,000 | 42,003,336 |
|
| TOTAL UNITED KINGDOM | | | 1,667,116,242 |
|
| United States of America - 17.3% | | | |
| Alphabet, Inc. Class A (a) | | 257,194 | 237,780,997 |
| Autoliv, Inc. (b) | | 1,318,027 | 132,053,125 |
| Berkshire Hathaway, Inc. Class B (a) | | 1,017,450 | 168,092,915 |
| China Biologic Products, Inc. (a) | | 612,950 | 72,328,100 |
| Domino's Pizza, Inc. | | 277,840 | 50,397,398 |
| Martin Marietta Materials, Inc. | | 663,000 | 145,985,970 |
| MasterCard, Inc. Class A | | 2,540,010 | 295,453,963 |
| Mohawk Industries, Inc. (a) | | 588,915 | 138,271,353 |
| Molson Coors Brewing Co. Class B | | 798,700 | 76,587,343 |
| Moody's Corp. | | 662,400 | 78,375,168 |
| MSCI, Inc. | | 996,300 | 99,948,816 |
| Philip Morris International, Inc. | | 1,951,292 | 216,281,205 |
| PPG Industries, Inc. | | 617,100 | 67,782,264 |
| PriceSmart, Inc. | | 634,275 | 55,150,211 |
| ResMed, Inc. | | 1,399,200 | 95,131,608 |
| S&P Global, Inc. | | 846,471 | 113,587,943 |
| Sherwin-Williams Co. | | 396,900 | 132,834,492 |
| Visa, Inc. Class A | | 3,782,096 | 345,002,797 |
|
| TOTAL UNITED STATES OF AMERICA | | | 2,521,045,668 |
|
| TOTAL COMMON STOCKS | | | |
| (Cost $10,418,570,709) | | | 14,049,684,297 |
|
| Nonconvertible Preferred Stocks - 0.4% | | | |
| Brazil - 0.4% | | | |
| Itau Unibanco Holding SA | | | |
| (Cost $58,353,975) | | 4,375,000 | 54,114,617 |
|
| Money Market Funds - 5.8% | | | |
| Fidelity Cash Central Fund, 0.85% (d) | | 363,962,951 | 364,035,744 |
| Fidelity Securities Lending Cash Central Fund 0.86% (d)(e) | | 481,139,951 | 481,188,065 |
| TOTAL MONEY MARKET FUNDS | | | |
| (Cost $845,163,713) | | | 845,223,809 |
| TOTAL INVESTMENT PORTFOLIO - 102.9% | | | |
| (Cost $11,322,088,397) | | | 14,949,022,723 |
| NET OTHER ASSETS (LIABILITIES) - (2.9)% | | | (418,105,765) |
| NET ASSETS - 100% | | | $14,530,916,958 |
Categorizations in the Schedule of Investments are based on country or territory of incorporation.
Legend
(a) Non-income producing
(b) Security or a portion of the security is on loan at period end.
(c) Affiliated company
(d) Affiliated fund that is generally available only to investment companies and other accounts managed by Fidelity Investments. The rate quoted is the annualized seven-day yield of the fund at period end. A complete unaudited listing of the fund's holdings as of its most recent quarter end is available upon request. In addition, each Fidelity Central Fund's financial statements are available on the SEC's website or upon request.
(e) Investment made with cash collateral received from securities on loan.
Affiliated Central Funds
Information regarding fiscal year to date income earned by the Fund from investments in Fidelity Central Funds is as follows:
| Fund | Income earned |
| Fidelity Cash Central Fund | $1,727,044 |
| Fidelity Securities Lending Cash Central Fund | 885,455 |
| Total | $2,612,499 |
Other Affiliated Issuers
An affiliated company is a company in which the Fund has ownership of at least 5% of the voting securities. Fiscal year to date transactions with companies which are or were affiliates are as follows:
| Affiliate | Value, beginning of period | Purchases | Sales Proceeds | Dividend Income | Value, end of period |
| SHO-BOND Holdings Co. Ltd. | $72,329,808 | $2,413,584 | $-- | $476,467 | $70,963,086 |
| Total | $72,329,808 | $2,413,584 | $-- | $476,467 | $70,963,086 |
Investment Valuation
The following is a summary of the inputs used, as of April 30, 2017, involving the Fund's assets and liabilities carried at fair value. The inputs or methodology used for valuing securities may not be an indication of the risk associated with investing in those securities. For more information on valuation inputs, and their aggregation into the levels used below, please refer to the Investment Valuation section in the accompanying Notes to Financial Statements.
| | Valuation Inputs at Reporting Date: |
| Description | Total | Level 1 | Level 2 | Level 3 |
| Investments in Securities: | | | | |
| Equities: | | | | |
| Consumer Discretionary | $1,588,293,667 | $1,361,022,676 | $227,270,991 | $-- |
| Consumer Staples | 2,781,249,313 | 785,463,493 | 1,995,785,820 | -- |
| Energy | 95,453,987 | 95,453,987 | -- | -- |
| Financials | 1,519,150,141 | 1,276,630,745 | 242,519,396 | -- |
| Health Care | 2,114,112,103 | 1,135,423,370 | 978,688,733 | -- |
| Industrials | 1,969,411,449 | 1,727,529,757 | 241,881,692 | -- |
| Information Technology | 2,653,127,567 | 2,072,020,880 | 581,106,687 | -- |
| Materials | 988,021,139 | 988,021,139 | -- | -- |
| Real Estate | 329,689,759 | 329,689,759 | -- | -- |
| Telecommunication Services | 65,289,789 | 65,289,789 | -- | -- |
| Money Market Funds | 845,223,809 | 845,223,809 | -- | -- |
| Total Investments in Securities: | $14,949,022,723 | $10,681,769,404 | $4,267,253,319 | $-- |
The following is a summary of transfers between Level 1 and Level 2 for the period ended April 30, 2017. Transfers are assumed to have occurred at the beginning of the period, and are primarily attributable to the valuation techniques used for foreign equity securities, as discussed in the accompanying Notes to Financial Statements:
| Transfers | Total |
| Level 1 to Level 2 | $608,218,019 |
| Level 2 to Level 1 | $507,195,396 |
See accompanying notes which are an integral part of the financial statements.
Fidelity® Series International Growth Fund
Financial Statements
Statement of Assets and Liabilities
| | | April 30, 2017 (Unaudited) |
| Assets | | |
Investment in securities, at value (including securities loaned of $453,611,474) — See accompanying schedule:
Unaffiliated issuers (cost $10,430,324,661) | $14,032,835,828 | |
| Fidelity Central Funds (cost $845,163,713) | 845,223,809 | |
| Other affiliated issuers (cost $46,600,023) | 70,963,086 | |
| Total Investments (cost $11,322,088,397) | | $14,949,022,723 |
| Cash | | 4 |
| Receivable for investments sold | | 85,835 |
| Receivable for fund shares sold | | 9,479,587 |
| Dividends receivable | | 89,010,787 |
| Distributions receivable from Fidelity Central Funds | | 771,385 |
| Prepaid expenses | | 8,171 |
| Other receivables | | 341,860 |
| Total assets | | 15,048,720,352 |
| Liabilities | | |
| Payable for investments purchased | $20,263,810 | |
| Payable for fund shares redeemed | 6,038,352 | |
| Accrued management fee | 9,088,254 | |
| Other affiliated payables | 974,875 | |
| Other payables and accrued expenses | 261,183 | |
| Collateral on securities loaned | 481,176,920 | |
| Total liabilities | | 517,803,394 |
| Net Assets | | $14,530,916,958 |
| Net Assets consist of: | | |
| Paid in capital | | $10,776,607,755 |
| Undistributed net investment income | | 81,196,193 |
| Accumulated undistributed net realized gain (loss) on investments and foreign currency transactions | | 46,715,047 |
| Net unrealized appreciation (depreciation) on investments and assets and liabilities in foreign currencies | | 3,626,397,963 |
| Net Assets | | $14,530,916,958 |
| Series International Growth: | | |
| Net Asset Value, offering price and redemption price per share ($6,543,529,306 ÷ 449,640,238 shares) | | $14.55 |
| Class F: | | |
| Net Asset Value, offering price and redemption price per share ($7,987,387,652 ÷ 547,481,358 shares) | | $14.59 |
See accompanying notes which are an integral part of the financial statements.
Statement of Operations
| | | Six months ended April 30, 2017 (Unaudited) |
| Investment Income | | |
| Dividends (including $476,467 earned from other affiliated issuers) | | $163,657,384 |
| Income from Fidelity Central Funds | | 2,612,499 |
| Income before foreign taxes withheld | | 166,269,883 |
| Less foreign taxes withheld | | (16,935,466) |
| Total income | | 149,334,417 |
| Expenses | | |
| Management fee | | |
| Basic fee | $46,659,027 | |
| Performance adjustment | 3,005,199 | |
| Transfer agent fees | 4,735,216 | |
| Accounting and security lending fees | 967,802 | |
| Custodian fees and expenses | 684,634 | |
| Independent trustees' fees and expenses | 26,684 | |
| Registration fees | 5,896 | |
| Audit | 34,312 | |
| Legal | 15,153 | |
| Miscellaneous | 50,466 | |
| Total expenses before reductions | 56,184,389 | |
| Expense reductions | (588,278) | 55,596,111 |
| Net investment income (loss) | | 93,738,306 |
| Realized and Unrealized Gain (Loss) | | |
| Net realized gain (loss) on: | | |
| Investment securities: | | |
| Unaffiliated issuers | 78,608,026 | |
| Fidelity Central Funds | (1,805) | |
| Other affiliated issuers | (80,591) | |
| Foreign currency transactions | (2,124,177) | |
| Total net realized gain (loss) | | 76,401,453 |
Change in net unrealized appreciation (depreciation) on:
Investment securities | 1,376,358,464 | |
| Assets and liabilities in foreign currencies | 953,466 | |
| Total change in net unrealized appreciation (depreciation) | | 1,377,311,930 |
| Net gain (loss) | | 1,453,713,383 |
| Net increase (decrease) in net assets resulting from operations | | $1,547,451,689 |
See accompanying notes which are an integral part of the financial statements.
Statement of Changes in Net Assets
| | Six months ended April 30, 2017 (Unaudited) | Year ended October 31, 2016 |
| Increase (Decrease) in Net Assets | | |
| Operations | | |
| Net investment income (loss) | $93,738,306 | $165,399,336 |
| Net realized gain (loss) | 76,401,453 | 166,506,812 |
| Change in net unrealized appreciation (depreciation) | 1,377,311,930 | (656,844,150) |
| Net increase (decrease) in net assets resulting from operations | 1,547,451,689 | (324,938,002) |
| Distributions to shareholders from net investment income | (170,410,130) | (141,417,551) |
| Distributions to shareholders from net realized gain | (166,389,831) | (272,101,876) |
| Total distributions | (336,799,961) | (413,519,427) |
| Share transactions - net increase (decrease) | 802,376,723 | 1,248,358,990 |
| Total increase (decrease) in net assets | 2,013,028,451 | 509,901,561 |
| Net Assets | | |
| Beginning of period | 12,517,888,507 | 12,007,986,946 |
| End of period | $14,530,916,958 | $12,517,888,507 |
| Other Information | | |
| Undistributed net investment income end of period | $81,196,193 | $157,868,017 |
See accompanying notes which are an integral part of the financial statements.
Financial Highlights — Fidelity Series International Growth Fund
| | Six months ended (Unaudited) April 30, | Years ended October 31, | | | | |
| | 2017 | 2016 | 2015 | 2014 | 2013 | 2012 |
| Selected Per–Share Data | | | | | | |
| Net asset value, beginning of period | $13.37 | $14.28 | $14.17 | $13.95 | $11.55 | $10.53 |
| Income from Investment Operations | | | | | | |
| Net investment income (loss)A | .09 | .17B | .15 | .17 | .16 | .15 |
| Net realized and unrealized gain (loss) | 1.42 | (.60) | .36 | .20 | 2.43 | .99 |
| Total from investment operations | 1.51 | (.43) | .51 | .37 | 2.59 | 1.14 |
| Distributions from net investment income | (.16) | (.16) | (.19) | (.10) | (.19) | (.12) |
| Distributions from net realized gain | (.17) | (.33) | (.21) | (.05) | – | (.01) |
| Total distributions | (.33) | (.48)C | (.40) | (.15) | (.19) | (.12)D |
| Net asset value, end of period | $14.55 | $13.37 | $14.28 | $14.17 | $13.95 | $11.55 |
| Total ReturnE,F | 11.61% | (3.10)% | 3.65% | 2.66% | 22.72% | 11.00% |
| Ratios to Average Net AssetsG,H | | | | | | |
| Expenses before reductions | .93%I | .94% | .92% | .97% | 1.04% | 1.05% |
| Expenses net of fee waivers, if any | .92%I | .94% | .91% | .97% | 1.04% | 1.05% |
| Expenses net of all reductions | .92%I | .94% | .91% | .97% | 1.02% | 1.04% |
| Net investment income (loss) | 1.31%I | 1.27%B | 1.06% | 1.23% | 1.26% | 1.38% |
| Supplemental Data | | | | | | |
| Net assets, end of period (000 omitted) | $6,543,529 | $5,618,983 | $5,563,674 | $6,049,347 | $5,642,298 | $5,045,151 |
| Portfolio turnover rateJ | 28%I | 26% | 24% | 33% | 41% | 27% |
A Calculated based on average shares outstanding during the period.
B Net Investment income per share reflects a large, non-recurring dividend which amounted to $.05 per share. Excluding this non-recurring dividend, the ratio of net investment income (loss) to average net assets would have been .93%.
C Total distributions of $.48 per share is comprised of distributions from net investment income of $.156 and distributions from net realized gain of $.326 per share.
D Total distributions of $.12 per share is comprised of distributions from net investment income of $.115 and distributions from net realized gain of $.007 per share.
E Total returns for periods of less than one year are not annualized.
F Total returns would have been lower if certain expenses had not been reduced during the applicable periods shown.
G Fees and expenses of any underlying Fidelity Central Funds are not included in the Fund's expense ratio. The Fund indirectly bears its proportionate share of the expenses of any underlying Fidelity Central Funds.
H Expense ratios reflect operating expenses of the class. Expenses before reductions do not reflect amounts reimbursed by the investment adviser or reductions from brokerage service arrangements or reductions from other expense offset arrangements and do not represent the amount paid by the class during periods when reimbursements or reductions occur. Expenses net of fee waivers reflect expenses after reimbursement by the investment adviser but prior to reductions from brokerage service arrangements or other expense offset arrangements. Expenses net of all reductions represent the net expenses paid by the class.
I Annualized
J Amount does not include the portfolio activity of any underlying Fidelity Central Funds.
See accompanying notes which are an integral part of the financial statements.
Financial Highlights — Fidelity Series International Growth Fund Class F
| | Six months ended (Unaudited) April 30, | Years ended October 31, | | | | |
| | 2017 | 2016 | 2015 | 2014 | 2013 | 2012 |
| Selected Per–Share Data | | | | | | |
| Net asset value, beginning of period | $13.42 | $14.32 | $14.21 | $13.99 | $11.59 | $10.57 |
| Income from Investment Operations | | | | | | |
| Net investment income (loss)A | .10 | .19B | .18 | .20 | .18 | .17 |
| Net realized and unrealized gain (loss) | 1.42 | (.58) | .35 | .19 | 2.43 | 1.00 |
| Total from investment operations | 1.52 | (.39) | .53 | .39 | 2.61 | 1.17 |
| Distributions from net investment income | (.18) | (.18) | (.21) | (.12) | (.21) | (.14) |
| Distributions from net realized gain | (.17) | (.33) | (.21) | (.05) | – | (.01) |
| Total distributions | (.35) | (.51) | (.42) | (.17) | (.21) | (.15) |
| Net asset value, end of period | $14.59 | $13.42 | $14.32 | $14.21 | $13.99 | $11.59 |
| Total ReturnC,D | 11.67% | (2.85)% | 3.83% | 2.80% | 22.88% | 11.23% |
| Ratios to Average Net AssetsE,F | | | | | | |
| Expenses before reductions | .77%G | .78% | .75% | .80% | .85% | .85% |
| Expenses net of fee waivers, if any | .77%G | .77% | .75% | .80% | .85% | .85% |
| Expenses net of all reductions | .76%G | .77% | .75% | .80% | .84% | .84% |
| Net investment income (loss) | 1.47%G | 1.44%B | 1.23% | 1.40% | 1.44% | 1.58% |
| Supplemental Data | | | | | | |
| Net assets, end of period (000 omitted) | $7,987,388 | $6,898,905 | $6,444,313 | $6,578,200 | $5,536,085 | $4,064,357 |
| Portfolio turnover rateH | 28%G | 26% | 24% | 33% | 41% | 27% |
A Calculated based on average shares outstanding during the period.
B Net Investment income per share reflects a large, non-recurring dividend which amounted to $.05 per share. Excluding this non-recurring dividend, the ratio of net investment income (loss) to average net assets would have been 1.09%.
C Total returns for periods of less than one year are not annualized.
D Total returns would have been lower if certain expenses had not been reduced during the applicable periods shown.
E Fees and expenses of any underlying Fidelity Central Funds are not included in the Fund's expense ratio. The Fund indirectly bears its proportionate share of the expenses of any underlying Fidelity Central Funds.
F Expense ratios reflect operating expenses of the class. Expenses before reductions do not reflect amounts reimbursed by the investment adviser or reductions from brokerage service arrangements or reductions from other expense offset arrangements and do not represent the amount paid by the class during periods when reimbursements or reductions occur. Expenses net of fee waivers reflect expenses after reimbursement by the investment adviser but prior to reductions from brokerage service arrangements or other expense offset arrangements. Expenses net of all reductions represent the net expenses paid by the class.
G Annualized
H Amount does not include the portfolio activity of any underlying Fidelity Central Funds.
See accompanying notes which are an integral part of the financial statements.
Fidelity® Series International Small Cap Fund
Investment Summary (Unaudited)
Geographic Diversification (% of fund's net assets)
| As of April 30, 2017 |
| | Japan | 27.7% |
| | United Kingdom | 17.9% |
| | United States of America* | 10.0% |
| | Germany | 6.3% |
| | Sweden | 5.1% |
| | Italy | 3.3% |
| | Australia | 2.6% |
| | France | 2.4% |
| | Netherlands | 2.3% |
| | Other | 22.4% |
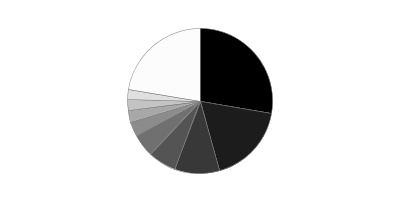
* Includes Short-Term investments and Net Other Assets (Liabilities).
Percentages are based on country or territory of incorporation and are adjusted for the effect of futures contracts, if applicable.
| As of October 31, 2016 |
| | Japan | 28.3% |
| | United Kingdom | 17.4% |
| | United States of America* | 11.3% |
| | Germany | 6.7% |
| | Sweden | 4.0% |
| | Italy | 2.8% |
| | Netherlands | 2.7% |
| | Australia | 2.6% |
| | Spain | 2.3% |
| | Other | 21.9% |

* Includes Short-Term investments and Net Other Assets (Liabilities).
Percentages are based on country or territory of incorporation and are adjusted for the effect of futures contracts, if applicable.
Asset Allocation as of April 30, 2017
| | % of fund's net assets | % of fund's net assets 6 months ago |
| Stocks | 93.4 | 95.2 |
| Short-Term Investments and Net Other Assets (Liabilities) | 6.6 | 4.8 |
Top Ten Stocks as of April 30, 2017
| | % of fund's net assets | % of fund's net assets 6 months ago |
| Interpump Group SpA (Italy, Machinery) | 2.0 | 1.3 |
| Spirax-Sarco Engineering PLC (United Kingdom, Machinery) | 2.0 | 1.8 |
| CompuGroup Medical AG (Germany, Health Care Technology) | 2.0 | 1.8 |
| Spectris PLC (United Kingdom, Electronic Equipment & Components) | 1.9 | 1.4 |
| USS Co. Ltd. (Japan, Specialty Retail) | 1.9 | 2.2 |
| Sartorius AG (non-vtg.) (Germany, Health Care Equipment & Supplies) | 1.9 | 1.7 |
| Fagerhult AB (Sweden, Electrical Equipment) | 1.8 | 1.4 |
| Azbil Corp. (Japan, Electronic Equipment & Components) | 1.7 | 1.4 |
| BGFretail Co. Ltd. (Korea (South), Food & Staples Retailing) | 1.6 | 1.3 |
| OBIC Co. Ltd. (Japan, IT Services) | 1.5 | 1.5 |
| | 18.3 | |
Top Market Sectors as of April 30, 2017
| | % of fund's net assets | % of fund's net assets 6 months ago |
| Industrials | 22.0 | 20.2 |
| Consumer Discretionary | 14.3 | 17.6 |
| Information Technology | 12.2 | 11.3 |
| Health Care | 11.9 | 11.3 |
| Consumer Staples | 9.1 | 9.9 |
| Materials | 7.8 | 7.8 |
| Financials | 7.2 | 7.4 |
| Real Estate | 6.8 | 7.9 |
| Energy | 2.1 | 1.8 |
| Utilities | 0.0 | 0.0 |
Percentages shown as 0.0% may reflect amounts less than 0.05%.
Fidelity® Series International Small Cap Fund
Investments April 30, 2017 (Unaudited)
Showing Percentage of Net Assets
| Common Stocks - 91.4% | | | |
| | | Shares | Value |
| Australia - 2.6% | | | |
| Adelaide Brighton Ltd. | | 2,482,768 | $11,005,852 |
| Austal Ltd. | | 1,811,336 | 2,326,103 |
| Beacon Lighting Group Ltd. | | 6,523,255 | 8,792,304 |
| Credit Corp. Group Ltd. | | 79,931 | 1,089,312 |
| DuluxGroup Ltd. | | 4,919,853 | 24,940,585 |
| Imdex Ltd. (a) | | 14,934,283 | 6,933,330 |
| John Fairfax Holdings Ltd. | | 3,096,308 | 2,457,626 |
| Nanosonics Ltd. (a) | | 403,377 | 954,474 |
| Pact Group Holdings Ltd. | | 250,000 | 1,319,760 |
| Quintis Ltd. (b) | | 12,531,976 | 11,260,732 |
| RCG Corp. Ltd. (b) | | 19,253,658 | 11,966,225 |
| Reckon Ltd. | | 3,446,160 | 4,025,556 |
| SomnoMed Ltd. (a) | | 184,705 | 409,389 |
|
| TOTAL AUSTRALIA | | | 87,481,248 |
|
| Austria - 1.7% | | | |
| Andritz AG | | 493,024 | 27,266,081 |
| Buwog-Gemeinnuetzige Wohnung | | 817,695 | 22,080,829 |
| IMMOFINANZ Immobilien Anlagen AG (b) | | 1,950,851 | 4,058,868 |
| RHI AG | | 53,500 | 1,558,924 |
| Wienerberger AG | | 116,600 | 2,730,766 |
|
| TOTAL AUSTRIA | | | 57,695,468 |
|
| Bailiwick of Jersey - 0.5% | | | |
| Integrated Diagnostics Holdings PLC | | 4,317,632 | 12,996,072 |
| IWG PLC | | 780,100 | 3,282,743 |
|
| TOTAL BAILIWICK OF JERSEY | | | 16,278,815 |
|
| Belgium - 1.3% | | | |
| Econocom Group SA | | 58,186 | 935,835 |
| Gimv NV | | 61,909 | 3,776,499 |
| KBC Ancora (a) | | 779,573 | 37,075,586 |
|
| TOTAL BELGIUM | | | 41,787,920 |
|
| Bermuda - 0.6% | | | |
| APT Satellite Holdings Ltd. | | 595,000 | 322,806 |
| BW Offshore Ltd. (a) | | 240,000 | 617,750 |
| Vostok New Ventures Ltd. (depositary receipt) (a) | | 2,635,242 | 20,529,021 |
|
| TOTAL BERMUDA | | | 21,469,577 |
|
| Brazil - 0.0% | | | |
| Magnesita Refratarios SA (a) | | 116,200 | 993,945 |
| Canada - 1.7% | | | |
| McCoy Global, Inc. (a) | | 1,111,500 | 1,587,799 |
| New Look Vision Group, Inc. | | 547,600 | 11,432,988 |
| Pason Systems, Inc. | | 860,900 | 12,783,739 |
| PrairieSky Royalty Ltd. | | 319,000 | 6,952,309 |
| ShawCor Ltd. Class A | | 443,200 | 11,120,179 |
| Tesco Corp. (a) | | 976,693 | 6,397,339 |
| Total Energy Services, Inc. | | 224,000 | 2,231,713 |
| Whitecap Resources, Inc. (b) | | 220,000 | 1,556,866 |
| ZCL Composites, Inc. | | 210,000 | 2,269,148 |
|
| TOTAL CANADA | | | 56,332,080 |
|
| Cayman Islands - 0.5% | | | |
| 58.com, Inc. ADR (a) | | 241,400 | 9,554,612 |
| SITC International Holdings Co. Ltd. | | 4,312,000 | 3,087,781 |
| Value Partners Group Ltd. | | 4,570,000 | 4,230,203 |
|
| TOTAL CAYMAN ISLANDS | | | 16,872,596 |
|
| Denmark - 2.1% | | | |
| Jyske Bank A/S (Reg.) | | 541,719 | 28,949,330 |
| Royal Unibrew A/S | | 31,900 | 1,387,048 |
| Scandinavian Tobacco Group A/S | | 959,969 | 16,758,072 |
| Spar Nord Bank A/S | | 2,155,354 | 24,431,501 |
|
| TOTAL DENMARK | | | 71,525,951 |
|
| Finland - 0.7% | | | |
| Olvi PLC (A Shares) | | 111,500 | 3,449,377 |
| Oriola-KD Oyj | | 195,100 | 822,462 |
| Tikkurila Oyj | | 977,930 | 19,387,716 |
|
| TOTAL FINLAND | | | 23,659,555 |
|
| France - 2.4% | | | |
| Cegedim SA (a) | | 10,300 | 286,553 |
| Elis SA | | 1,461,062 | 30,239,162 |
| Ipsen SA | | 13,100 | 1,524,731 |
| Laurent-Perrier Group SA | | 135,868 | 10,460,712 |
| Parrot SA (a)(b) | | 67,443 | 650,171 |
| Rubis | | 11,900 | 1,209,158 |
| Somfy SA | | 2,400 | 1,160,758 |
| Vetoquinol SA | | 301,927 | 16,582,587 |
| Virbac SA (a) | | 116,800 | 18,391,131 |
|
| TOTAL FRANCE | | | 80,504,963 |
|
| Germany - 4.4% | | | |
| CompuGroup Medical AG | | 1,347,483 | 66,345,158 |
| CTS Eventim AG | | 1,172,295 | 45,160,431 |
| Fielmann AG | | 201,790 | 15,426,255 |
| MLP AG | | 702,245 | 4,426,797 |
| Nexus AG | | 519,508 | 12,506,391 |
| SMA Solar Technology AG (b) | | 84,233 | 2,179,640 |
|
| TOTAL GERMANY | | | 146,044,672 |
|
| Greece - 0.2% | | | |
| Fourlis Holdings SA (a) | | 557,400 | 2,914,444 |
| Motor Oil (HELLAS) Corinth Refineries SA | | 150,000 | 2,544,060 |
| Mytilineos Holdings SA (a) | | 310,800 | 2,339,411 |
|
| TOTAL GREECE | | | 7,797,915 |
|
| India - 0.7% | | | |
| Jyothy Laboratories Ltd. | | 3,611,337 | 22,469,043 |
| Torrent Pharmaceuticals Ltd. (a) | | 34,396 | 759,050 |
|
| TOTAL INDIA | | | 23,228,093 |
|
| Ireland - 1.7% | | | |
| FBD Holdings PLC (a) | | 1,298,400 | 11,526,929 |
| James Hardie Industries PLC CDI | | 2,524,307 | 42,850,858 |
| United Drug PLC (United Kingdom) | | 191,500 | 1,852,790 |
|
| TOTAL IRELAND | | | 56,230,577 |
|
| Isle of Man - 0.8% | | | |
| Playtech Ltd. | | 2,187,347 | 27,168,967 |
| Israel - 2.1% | | | |
| Azrieli Group | | 334,879 | 17,835,927 |
| Ituran Location & Control Ltd. | | 928,362 | 29,057,731 |
| Strauss Group Ltd. | | 1,265,055 | 22,246,218 |
|
| TOTAL ISRAEL | | | 69,139,876 |
|
| Italy - 3.3% | | | |
| Astm SpA | | 67,100 | 1,034,252 |
| Azimut Holding SpA | | 1,359,364 | 26,535,133 |
| Beni Stabili SpA SIIQ | | 19,947,820 | 12,668,100 |
| Cerved Information Solutions SpA | | 235,105 | 2,509,779 |
| Interpump Group SpA | | 2,552,966 | 67,716,041 |
|
| TOTAL ITALY | | | 110,463,305 |
|
| Japan - 27.7% | | | |
| Aeon Delight Co. Ltd. | | 43,000 | 1,311,505 |
| Ai Holdings Corp. | | 625,600 | 15,388,161 |
| Ain Holdings, Inc. | | 20,300 | 1,405,840 |
| Aoki Super Co. Ltd. | | 135,000 | 1,671,227 |
| Arcland Service Holdings Co. Ltd. (a) | | 46,900 | 1,293,721 |
| Artnature, Inc. (c) | | 1,778,400 | 11,390,694 |
| Asahi Co. Ltd. | | 1,015,500 | 12,999,493 |
| Asante, Inc. | | 188,300 | 2,863,140 |
| Azbil Corp. | | 1,664,500 | 55,993,496 |
| Broadleaf Co. Ltd. | | 771,500 | 5,003,763 |
| Central Automotive Products Ltd. | | 119,000 | 1,232,967 |
| Chugoku Marine Paints Ltd. | | 215,000 | 1,589,235 |
| Coca-Cola West Co. Ltd. | | 457,650 | 13,609,417 |
| Daiichikosho Co. Ltd. | | 643,100 | 27,893,146 |
| Daikokutenbussan Co. Ltd. | | 569,400 | 27,224,956 |
| Funai Soken Holdings, Inc. | | 624,000 | 11,990,204 |
| GCA Savvian Group Corp. | | 1,935,687 | 15,645,248 |
| GMO Internet, Inc. | | 253,300 | 3,006,198 |
| Goldcrest Co. Ltd. | | 1,584,110 | 28,136,693 |
| Iwatsuka Confectionary Co. Ltd. | | 137,200 | 5,230,769 |
| Kaken Pharmaceutical Co. Ltd. | | 20,000 | 1,185,916 |
| Kamigumi Co. Ltd. | | 225,700 | 2,048,965 |
| Kobayashi Pharmaceutical Co. Ltd. | | 667,100 | 34,948,320 |
| Konoike Transport Co. Ltd. | | 171,600 | 2,333,668 |
| Koshidaka Holdings Co. Ltd. | | 384,200 | 9,488,249 |
| Kusuri No Aoki Holdings Co. Ltd. | | 293,900 | 12,694,582 |
| Lasertec Corp. | | 1,884,400 | 24,528,050 |
| Leopalace21 Corp. | | 664,200 | 3,527,306 |
| Mandom Corp. | | 27,000 | 1,281,274 |
| Medikit Co. Ltd. | | 271,400 | 11,296,667 |
| Miraial Co. Ltd. | | 48,900 | 404,009 |
| Mirait Holdings Corp. | | 151,300 | 1,571,701 |
| Miroku Jyoho Service Co., Ltd. | | 334,400 | 6,338,526 |
| Misumi Group, Inc. | | 1,411,500 | 26,729,549 |
| Mitsuboshi Belting Ltd. | | 145,000 | 1,390,491 |
| Monex Group, Inc. | | 1,334,932 | 3,341,072 |
| Morinaga & Co. Ltd. | | 56,300 | 2,661,592 |
| Nabtesco Corp. | | 560,000 | 15,874,411 |
| Nagaileben Co. Ltd. | | 1,488,300 | 34,285,305 |
| Nakanishi, Inc. | | 30,200 | 1,186,598 |
| Nakano Refrigerators Co. Ltd. | | 283,700 | 7,787,594 |
| ND Software Co. Ltd. | | 224,536 | 2,028,327 |
| Nihon Parkerizing Co. Ltd. | | 3,715,200 | 47,691,870 |
| Nitto Kohki Co. Ltd. | | 61,600 | 1,436,182 |
| NOF Corp. | | 275,000 | 3,098,453 |
| NS Tool Co. Ltd. | | 4,000 | 57,591 |
| OBIC Co. Ltd. | | 943,400 | 50,946,562 |
| Okamoto Industries, Inc. | | 200,000 | 2,167,302 |
| OSG Corp. (b) | | 2,225,800 | 45,823,826 |
| PALTAC Corp. | | 102,300 | 3,019,215 |
| Paramount Bed Holdings Co. Ltd. | | 691,060 | 28,981,435 |
| ProNexus, Inc. | | 1,241,000 | 15,541,027 |
| S Foods, Inc. (b) | | 86,500 | 2,696,457 |
| Sakai Moving Service Co. Ltd. | | 13,100 | 381,337 |
| San-A Co. Ltd. | | 34,600 | 1,573,644 |
| San-Ai Oil Co. Ltd. | | 1,952,400 | 16,568,472 |
| Sekisui Jushi Corp. | | 134,000 | 2,360,852 |
| Shinko Plantech Co. Ltd. | | 138,200 | 1,032,703 |
| Shinsei Bank Ltd. | | 2,124,000 | 3,963,149 |
| Ship Healthcare Holdings, Inc. | | 27,100 | 728,582 |
| SHO-BOND Holdings Co. Ltd. | | 778,800 | 35,630,231 |
| Shoei Co. Ltd. (c) | | 800,800 | 22,233,469 |
| SK Kaken Co. Ltd. | | 217,000 | 20,634,223 |
| Software Service, Inc. | | 168,400 | 7,643,902 |
| Techno Medica Co. Ltd. | | 283,000 | 5,031,675 |
| The Monogatari Corp. | | 219,000 | 9,842,476 |
| TKC Corp. | | 684,400 | 18,602,664 |
| Tocalo Co. Ltd. | | 458,400 | 12,356,959 |
| Toshiba Plant Systems & Services Corp. | | 104,300 | 1,696,308 |
| Tsuruha Holdings, Inc. | | 29,170 | 2,956,905 |
| USS Co. Ltd. | | 3,561,200 | 62,933,967 |
| Welcia Holdings Co. Ltd. | | 578,600 | 18,633,541 |
| Workman Co. Ltd. | | 650,700 | 19,029,217 |
| Yamato Kogyo Co. Ltd. | | 310,100 | 7,755,630 |
| Yuasa Trading Co. Ltd. | | 73,900 | 2,137,946 |
| Yusen Logistics Co. Ltd. | | 187,000 | 1,779,834 |
|
| TOTAL JAPAN | | | 928,779,651 |
|
| Korea (South) - 1.8% | | | |
| BGFretail Co. Ltd. | | 556,522 | 53,568,178 |
| iMarketKorea, Inc. | | 86,705 | 1,013,692 |
| Leeno Industrial, Inc. | | 186,094 | 6,968,710 |
|
| TOTAL KOREA (SOUTH) | | | 61,550,580 |
|
| Luxembourg - 0.1% | | | |
| B&M European Value Retail S.A. | | 653,731 | 2,853,421 |
| Marshall Islands - 0.0% | | | |
| StealthGas, Inc. (a) | | 65,000 | 222,300 |
| Mexico - 0.4% | | | |
| Consorcio ARA S.A.B. de CV | | 38,033,895 | 12,687,898 |
| Netherlands - 2.3% | | | |
| Aalberts Industries NV | | 984,900 | 39,073,254 |
| Arcadis NV | | 64,918 | 1,124,725 |
| BinckBank NV | | 560,793 | 2,787,408 |
| Intertrust NV | | 71,000 | 1,423,062 |
| Takeaway.com Holding BV (d) | | 222,278 | 7,486,580 |
| Van Lanschot NV (Bearer) | | 202,384 | 5,500,399 |
| VastNed Retail NV | | 556,055 | 20,772,849 |
|
| TOTAL NETHERLANDS | | | 78,168,277 |
|
| New Zealand - 0.1% | | | |
| EBOS Group Ltd. | | 105,894 | 1,331,262 |
| Trade Maine Group Ltd. | | 264,436 | 962,277 |
|
| TOTAL NEW ZEALAND | | | 2,293,539 |
|
| Norway - 1.1% | | | |
| ABG Sundal Collier ASA | | 5,193,025 | 3,399,115 |
| Borregaard ASA | | 200,000 | 2,247,845 |
| Kongsberg Gruppen ASA (b) | | 992,748 | 15,493,621 |
| Schibsted ASA (A Shares) | | 82,366 | 2,048,118 |
| Skandiabanken ASA | | 1,174,894 | 10,502,343 |
| Spectrum ASA (a) | | 350,000 | 1,610,179 |
|
| TOTAL NORWAY | | | 35,301,221 |
|
| Philippines - 0.5% | | | |
| Jollibee Food Corp. | | 3,696,500 | 15,478,400 |
| Singapore - 0.1% | | | |
| Boustead Singapore Ltd. | | 3,836,400 | 2,443,829 |
| Hour Glass Ltd. | | 1,558,300 | 769,586 |
|
| TOTAL SINGAPORE | | | 3,213,415 |
|
| South Africa - 0.7% | | | |
| Clicks Group Ltd. | | 2,335,481 | 23,458,357 |
| Spain - 2.3% | | | |
| Baron de Ley SA (a) | | 9,415 | 1,159,926 |
| Hispania Activos Inmobiliarios SA | | 1,100,650 | 16,617,281 |
| Merlin Properties Socimi SA | | 1,590,500 | 18,823,956 |
| Prosegur Cash SA | | 604,700 | 1,541,357 |
| Prosegur Compania de Seguridad SA (Reg.) | | 5,776,586 | 37,691,686 |
|
| TOTAL SPAIN | | | 75,834,206 |
|
| Sweden - 5.1% | | | |
| Addlife AB (a) | | 526,400 | 10,014,158 |
| AddTech AB (B Shares) | | 1,181,610 | 21,278,132 |
| Fagerhult AB (b) | | 1,503,735 | 62,052,222 |
| Granges AB | | 260,000 | 2,700,597 |
| Lagercrantz Group AB (B Shares) | | 1,848,316 | 20,189,513 |
| Loomis AB (B Shares) | | 607,000 | 22,032,730 |
| Mekonomen AB (b) | | 58,400 | 1,157,147 |
| Saab AB (B Shares) | | 662,300 | 32,840,952 |
|
| TOTAL SWEDEN | | | 172,265,451 |
|
| Switzerland - 0.2% | | | |
| Daetwyler Holdings AG | | 8,240 | 1,394,589 |
| EDAG Engineering Group AG | | 49,000 | 904,451 |
| Tecan Group AG | | 17,063 | 2,911,857 |
| Vontobel Holdings AG | | 51,663 | 3,042,665 |
|
| TOTAL SWITZERLAND | | | 8,253,562 |
|
| Taiwan - 0.4% | | | |
| Addcn Technology Co. Ltd. | | 1,618,570 | 12,076,483 |
| United Kingdom - 17.9% | | | |
| AA PLC | | 649,987 | 2,199,788 |
| Alliance Pharma PLC | | 13,751,663 | 8,460,298 |
| Ascential PLC | | 479,626 | 2,191,635 |
| Berendsen PLC | | 3,261,209 | 35,438,671 |
| Carphone Warehouse Group PLC | | 61,700 | 268,111 |
| Cineworld Group PLC | | 249,100 | 2,271,346 |
| Countrywide PLC | | 1,848,869 | 4,064,927 |
| Dechra Pharmaceuticals PLC | | 1,830,063 | 40,058,029 |
| Dignity PLC | | 55,107 | 1,779,368 |
| Domino's Pizza UK & IRL PLC | | 2,386,400 | 10,215,310 |
| DP Poland PLC (a) | | 6,618,000 | 4,350,104 |
| Elementis PLC | | 8,949,982 | 35,262,915 |
| Equiniti Group PLC | | 1,243,355 | 3,554,943 |
| Great Portland Estates PLC | | 2,804,000 | 25,131,646 |
| H&T Group PLC | | 1,076,088 | 4,111,560 |
| Hill & Smith Holdings PLC | | 61,530 | 1,058,332 |
| Hilton Food Group PLC | | 911,038 | 9,079,919 |
| Howden Joinery Group PLC | | 5,312,300 | 31,856,673 |
| Informa PLC | | 5,317,433 | 44,215,434 |
| InterContinental Hotel Group PLC ADR | | 326,021 | 17,210,649 |
| ITE Group PLC | | 8,434,572 | 19,336,290 |
| Just Eat Holding Ltd. (a) | | 1,794,725 | 13,412,526 |
| LivaNova PLC (a) | | 26,500 | 1,396,550 |
| Luxfer Holdings PLC sponsored ADR | | 250,000 | 2,922,500 |
| Mears Group PLC | | 504,312 | 3,403,093 |
| Mitie Group PLC | | 528,691 | 1,435,258 |
| PayPoint PLC | | 99,400 | 1,309,315 |
| Polypipe Group PLC | | 368,000 | 1,898,432 |
| Rightmove PLC | | 524,000 | 28,409,746 |
| Shaftesbury PLC | | 3,047,755 | 36,790,255 |
| Sinclair Pharma PLC (a) | | 2,489,716 | 1,080,268 |
| Spectris PLC | | 1,791,116 | 64,027,955 |
| Spirax-Sarco Engineering PLC | | 992,628 | 66,853,893 |
| Ted Baker PLC | | 226,067 | 8,183,815 |
| Topps Tiles PLC (c) | | 10,685,355 | 14,358,660 |
| Tullett Prebon PLC | | 812,116 | 4,818,537 |
| Ultra Electronics Holdings PLC | | 1,039,010 | 28,152,583 |
| Unite Group PLC | | 2,020,063 | 16,928,015 |
| Zpg PLC | | 405,923 | 1,945,280 |
|
| TOTAL UNITED KINGDOM | | | 599,442,629 |
|
| United States of America - 3.4% | | | |
| Autoliv, Inc. | | 123,800 | 12,403,522 |
| China Biologic Products, Inc. (a)(b) | | 225,808 | 26,645,344 |
| Compass Minerals International, Inc. | | 29,000 | 1,914,000 |
| Domino's Pizza, Inc. | | 33,900 | 6,149,121 |
| Martin Marietta Materials, Inc. | | 72,080 | 15,871,295 |
| Mohawk Industries, Inc. (a) | | 53,962 | 12,669,738 |
| PriceSmart, Inc. | | 257,926 | 22,426,666 |
| ResMed, Inc. | | 209,700 | 14,257,503 |
| Resources Connection, Inc. | | 53,500 | 743,650 |
| Utah Medical Products, Inc. | | 11,950 | 748,070 |
|
| TOTAL UNITED STATES OF AMERICA | | | 113,828,909 |
|
| TOTAL COMMON STOCKS | | | |
| (Cost $2,279,350,514) | | | 3,060,383,822 |
|
| Nonconvertible Preferred Stocks - 2.0% | | | |
| Brazil - 0.1% | | | |
| Banco ABC Brasil SA | | 676,849 | 3,800,019 |
| Germany - 1.9% | | | |
| Sartorius AG (non-vtg.) | | 683,172 | 62,555,708 |
| TOTAL NONCONVERTIBLE PREFERRED STOCKS | | | |
| (Cost $24,290,181) | | | 66,355,727 |
|
| Money Market Funds - 7.2% | | | |
| Fidelity Cash Central Fund, 0.85% (e) | | 206,660,852 | 206,702,185 |
| Fidelity Securities Lending Cash Central Fund 0.86% (e)(f) | | 34,583,633 | 34,587,092 |
| TOTAL MONEY MARKET FUNDS | | | |
| (Cost $241,264,107) | | | 241,289,277 |
| TOTAL INVESTMENT PORTFOLIO - 100.6% | | | |
| (Cost $2,544,904,802) | | | 3,368,028,826 |
| NET OTHER ASSETS (LIABILITIES) - (0.6)% | | | (19,417,631) |
| NET ASSETS - 100% | | | $3,348,611,195 |
Categorizations in the Schedule of Investments are based on country or territory of incorporation.
Legend
(a) Non-income producing
(b) Security or a portion of the security is on loan at period end.
(c) Affiliated company
(d) Security exempt from registration under Rule 144A of the Securities Act of 1933. These securities may be resold in transactions exempt from registration, normally to qualified institutional buyers. At the end of the period, the value of these securities amounted to $7,486,580 or 0.2% of net assets.
(e) Affiliated fund that is generally available only to investment companies and other accounts managed by Fidelity Investments. The rate quoted is the annualized seven-day yield of the fund at period end. A complete unaudited listing of the fund's holdings as of its most recent quarter end is available upon request. In addition, each Fidelity Central Fund's financial statements are available on the SEC's website or upon request.
(f) Investment made with cash collateral received from securities on loan.
Affiliated Central Funds
Information regarding fiscal year to date income earned by the Fund from investments in Fidelity Central Funds is as follows:
| Fund | Income earned |
| Fidelity Cash Central Fund | $632,402 |
| Fidelity Securities Lending Cash Central Fund | 564,060 |
| Total | $1,196,462 |
Other Affiliated Issuers
An affiliated company is a company in which the Fund has ownership of at least 5% of the voting securities. Fiscal year to date transactions with companies which are or were affiliates are as follows:
| Affiliate | Value, beginning of period | Purchases | Sales Proceeds | Dividend Income | Value, end of period |
| Artnature, Inc. | $12,038,036 | $-- | $1,157,148 | $230,753 | $11,390,694 |
| Shoei Co. Ltd. | 13,379,931 | 1,822,879 | -- | 42,608 | 22,233,469 |
| Topps Tiles PLC | 9,638,880 | 2,219,084 | -- | 282,593 | 14,358,660 |
| Total | $35,056,847 | $4,041,963 | $1,157,148 | $555,954 | $47,982,823 |
Investment Valuation
All investments are categorized as Level 1 under the Fair Value Hierarchy. The inputs or methodology used for valuing securities may not be an indication of the risk associated with investing in those securities. For more information on valuation inputs please refer to the Investment Valuation section in the accompanying Notes to Financial Statements.
See accompanying notes which are an integral part of the financial statements.
Fidelity® Series International Small Cap Fund
Financial Statements
Statement of Assets and Liabilities
| | | April 30, 2017 (Unaudited) |
| Assets | | |
Investment in securities, at value (including securities loaned of $33,033,836) — See accompanying schedule:
Unaffiliated issuers (cost $2,255,936,035) | $3,078,756,726 | |
| Fidelity Central Funds (cost $241,264,107) | 241,289,277 | |
| Other affiliated issuers (cost $47,704,660) | 47,982,823 | |
| Total Investments (cost $2,544,904,802) | | $3,368,028,826 |
| Foreign currency held at value (cost $3,026) | | 3,026 |
| Receivable for investments sold | | 5,176,080 |
| Receivable for fund shares sold | | 2,170,589 |
| Dividends receivable | | 15,883,742 |
| Distributions receivable from Fidelity Central Funds | | 247,455 |
| Prepaid expenses | | 1,863 |
| Other receivables | | 78,007 |
| Total assets | | 3,391,589,588 |
| Liabilities | | |
| Payable to custodian bank | $265,092 | |
| Payable for investments purchased | 4,171,597 | |
| Payable for fund shares redeemed | 1,381,232 | |
| Accrued management fee | 2,188,848 | |
| Other affiliated payables | 301,110 | |
| Other payables and accrued expenses | 88,618 | |
| Collateral on securities loaned | 34,581,896 | |
| Total liabilities | | 42,978,393 |
| Net Assets | | $3,348,611,195 |
| Net Assets consist of: | | |
| Paid in capital | | $2,463,318,100 |
| Undistributed net investment income | | 12,398,720 |
| Accumulated undistributed net realized gain (loss) on investments and foreign currency transactions | | 49,740,843 |
| Net unrealized appreciation (depreciation) on investments and assets and liabilities in foreign currencies | | 823,153,532 |
| Net Assets | | $3,348,611,195 |
| Series International Small Cap: | | |
| Net Asset Value, offering price and redemption price per share ($1,507,373,871 ÷ 93,373,248 shares) | | $16.14 |
| Class F: | | |
| Net Asset Value, offering price and redemption price per share ($1,841,237,324 ÷ 113,796,406 shares) | | $16.18 |
See accompanying notes which are an integral part of the financial statements.
Statement of Operations
| | | Six months ended April 30, 2017 (Unaudited) |
| Investment Income | | |
| Dividends (including $555,954 earned from other affiliated issuers) | | $32,416,095 |
| Income from Fidelity Central Funds | | 1,196,462 |
| Income before foreign taxes withheld | | 33,612,557 |
| Less foreign taxes withheld | | (3,186,360) |
| Total income | | 30,426,197 |
| Expenses | | |
| Management fee | | |
| Basic fee | $13,027,426 | |
| Performance adjustment | (631,340) | |
| Transfer agent fees | 1,087,998 | |
| Accounting and security lending fees | 668,535 | |
| Custodian fees and expenses | 193,392 | |
| Independent trustees' fees and expenses | 6,139 | |
| Registration fees | 930 | |
| Audit | 34,041 | |
| Legal | 3,661 | |
| Miscellaneous | 16,547 | |
| Total expenses before reductions | 14,407,329 | |
| Expense reductions | (129,449) | 14,277,880 |
| Net investment income (loss) | | 16,148,317 |
| Realized and Unrealized Gain (Loss) | | |
| Net realized gain (loss) on: | | |
| Investment securities: | | |
| Unaffiliated issuers | 82,660,353 | |
| Fidelity Central Funds | 3,001 | |
| Other affiliated issuers | (1,000,856) | |
| Foreign currency transactions | (441,016) | |
| Total net realized gain (loss) | | 81,221,482 |
Change in net unrealized appreciation (depreciation) on:
Investment securities | 265,318,584 | |
| Assets and liabilities in foreign currencies | 311,625 | |
| Total change in net unrealized appreciation (depreciation) | | 265,630,209 |
| Net gain (loss) | | 346,851,691 |
| Net increase (decrease) in net assets resulting from operations | | $363,000,008 |
See accompanying notes which are an integral part of the financial statements.
Statement of Changes in Net Assets
| | Six months ended April 30, 2017 (Unaudited) | Year ended October 31, 2016 |
| Increase (Decrease) in Net Assets | | |
| Operations | | |
| Net investment income (loss) | $16,148,317 | $30,865,970 |
| Net realized gain (loss) | 81,221,482 | 86,017,298 |
| Change in net unrealized appreciation (depreciation) | 265,630,209 | (100,087,153) |
| Net increase (decrease) in net assets resulting from operations | 363,000,008 | 16,796,115 |
| Distributions to shareholders from net investment income | (34,157,192) | (27,359,738) |
| Distributions to shareholders from net realized gain | (85,456,930) | (162,604,163) |
| Total distributions | (119,614,122) | (189,963,901) |
| Share transactions - net increase (decrease) | 200,874,767 | 324,362,862 |
| Total increase (decrease) in net assets | 444,260,653 | 151,195,076 |
| Net Assets | | |
| Beginning of period | 2,904,350,542 | 2,753,155,466 |
| End of period | $3,348,611,195 | $2,904,350,542 |
| Other Information | | |
| Undistributed net investment income end of period | $12,398,720 | $30,407,595 |
See accompanying notes which are an integral part of the financial statements.
Financial Highlights — Fidelity Series International Small Cap Fund
| | Six months ended (Unaudited) April 30, | Years ended October 31, | | | | |
| | 2017 | 2016 | 2015 | 2014 | 2013 | 2012 |
| Selected Per–Share Data | | | | | | |
| Net asset value, beginning of period | $15.02 | $16.11 | $15.21 | $15.75 | $12.44 | $11.22 |
| Income from Investment Operations | | | | | | |
| Net investment income (loss)A | .07 | .15 | .14 | .14 | .15 | .15 |
| Net realized and unrealized gain (loss) | 1.62 | (.13) | 1.10 | (.11) | 3.29 | 1.19 |
| Total from investment operations | 1.69 | .02 | 1.24 | .03 | 3.44 | 1.34 |
| Distributions from net investment income | (.15) | (.15) | (.14) | (.13) | (.12) | (.11) |
| Distributions from net realized gain | (.42) | (.96) | (.20) | (.44) | (.01) | (.01) |
| Total distributions | (.57) | (1.11) | (.34) | (.57) | (.13) | (.12) |
| Net asset value, end of period | $16.14 | $15.02 | $16.11 | $15.21 | $15.75 | $12.44 |
| Total ReturnB,C | 11.81% | .02% | 8.36% | .21% | 27.95% | 12.07% |
| Ratios to Average Net AssetsD,E | | | | | | |
| Expenses before reductions | 1.02%F | 1.06% | 1.10% | 1.18% | 1.23% | 1.22% |
| Expenses net of fee waivers, if any | 1.02%F | 1.06% | 1.10% | 1.18% | 1.23% | 1.22% |
| Expenses net of all reductions | 1.01%F | 1.05% | 1.10% | 1.18% | 1.22% | 1.22% |
| Net investment income (loss) | .96%F | 1.01% | .89% | .86% | 1.05% | 1.27% |
| Supplemental Data | | | | | | |
| Net assets, end of period (000 omitted) | $1,507,374 | $1,303,650 | $1,276,570 | $1,330,809 | $1,163,381 | $1,040,585 |
| Portfolio turnover rateG | 29%F | 21% | 16% | 18% | 29% | 25% |
A Calculated based on average shares outstanding during the period.
B Total returns for periods of less than one year are not annualized.
C Total returns would have been lower if certain expenses had not been reduced during the applicable periods shown.
D Fees and expenses of any underlying Fidelity Central Funds are not included in the Fund's expense ratio. The Fund indirectly bears its proportionate share of the expenses of any underlying Fidelity Central Funds.
E Expense ratios reflect operating expenses of the class. Expenses before reductions do not reflect amounts reimbursed by the investment adviser or reductions from brokerage service arrangements or reductions from other expense offset arrangements and do not represent the amount paid by the class during periods when reimbursements or reductions occur. Expenses net of fee waivers reflect expenses after reimbursement by the investment adviser but prior to reductions from brokerage service arrangements or other expense offset arrangements. Expenses net of all reductions represent the net expenses paid by the class.
F Annualized
G Amount does not include the portfolio activity of any underlying Fidelity Central Funds.
See accompanying notes which are an integral part of the financial statements.
Financial Highlights — Fidelity Series International Small Cap Fund Class F
| | Six months ended (Unaudited) April 30, | Years ended October 31, | | | | |
| | 2017 | 2016 | 2015 | 2014 | 2013 | 2012 |
| Selected Per–Share Data | | | | | | |
| Net asset value, beginning of period | $15.06 | $16.16 | $15.27 | $15.79 | $12.48 | $11.26 |
| Income from Investment Operations | | | | | | |
| Net investment income (loss)A | .08 | .18 | .17 | .16 | .17 | .17 |
| Net realized and unrealized gain (loss) | 1.63 | (.14) | 1.10 | (.09) | 3.30 | 1.19 |
| Total from investment operations | 1.71 | .04 | 1.27 | .07 | 3.47 | 1.36 |
| Distributions from net investment income | (.18) | (.18) | (.17) | (.15) | (.15) | (.13) |
| Distributions from net realized gain | (.42) | (.96) | (.20) | (.44) | (.01) | (.01) |
| Total distributions | (.59)B | (1.14) | (.38)C | (.59) | (.16) | (.14) |
| Net asset value, end of period | $16.18 | $15.06 | $16.16 | $15.27 | $15.79 | $12.48 |
| Total ReturnD,E | 11.96% | .13% | 8.49% | .47% | 28.14% | 12.25% |
| Ratios to Average Net AssetsF,G | | | | | | |
| Expenses before reductions | .87%H | .89% | .94% | 1.01% | 1.04% | 1.02% |
| Expenses net of fee waivers, if any | .86%H | .89% | .93% | 1.01% | 1.04% | 1.02% |
| Expenses net of all reductions | .86%H | .89% | .93% | 1.01% | 1.03% | 1.01% |
| Net investment income (loss) | 1.12%H | 1.18% | 1.06% | 1.04% | 1.24% | 1.47% |
| Supplemental Data | | | | | | |
| Net assets, end of period (000 omitted) | $1,841,237 | $1,600,701 | $1,476,586 | $1,448,727 | $1,141,808 | $836,468 |
| Portfolio turnover rateI | 29%H | 21% | 16% | 18% | 29% | 25% |
A Calculated based on average shares outstanding during the period.
B Total distributions of $.59 per share is comprised of distributions from net investment income of $.177 and distributions from net realized gain of $.417 per share.
C Total distributions of $.38 per share is comprised of distributions from net investment income of $.172 and distributions from net realized gain of $.203 per share.
D Total returns for periods of less than one year are not annualized.
E Total returns would have been lower if certain expenses had not been reduced during the applicable periods shown.
F Fees and expenses of any underlying Fidelity Central Funds are not included in the Fund's expense ratio. The Fund indirectly bears its proportionate share of the expenses of any underlying Fidelity Central Funds.
G Expense ratios reflect operating expenses of the class. Expenses before reductions do not reflect amounts reimbursed by the investment adviser or reductions from brokerage service arrangements or reductions from other expense offset arrangements and do not represent the amount paid by the class during periods when reimbursements or reductions occur. Expenses net of fee waivers reflect expenses after reimbursement by the investment adviser but prior to reductions from brokerage service arrangements or other expense offset arrangements. Expenses net of all reductions represent the net expenses paid by the class.
H Annualized
I Amount does not include the portfolio activity of any underlying Fidelity Central Funds.
See accompanying notes which are an integral part of the financial statements.
Fidelity® Series International Value Fund
Investment Summary (Unaudited)
Geographic Diversification (% of fund's net assets)
| As of April 30, 2017 |
| | Japan | 22.6% |
| | United Kingdom | 17.2% |
| | France | 15.2% |
| | Germany | 7.4% |
| | Switzerland | 7.0% |
| | Australia | 5.7% |
| | Spain | 4.3% |
| | United States of America* | 4.2% |
| | Netherlands | 3.8% |
| | Other | 12.6% |

* Includes Short-Term investments and Net Other Assets (Liabilities).
Percentages are based on country or territory of incorporation and are adjusted for the effect of futures contracts, if applicable.
| As of October 31, 2016 |
| | Japan | 21.7% |
| | United Kingdom | 21.0% |
| | France | 14.4% |
| | Switzerland | 7.5% |
| | Germany | 6.3% |
| | United States of America* | 4.6% |
| | Australia | 4.5% |
| | Netherlands | 3.8% |
| | Spain | 3.4% |
| | Other | 12.8% |
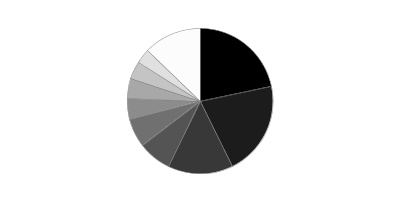
* Includes Short-Term investments and Net Other Assets (Liabilities).
Percentages are based on country or territory of incorporation and are adjusted for the effect of futures contracts, if applicable.
Asset Allocation as of April 30, 2017
| | % of fund's net assets | % of fund's net assets 6 months ago |
| Stocks | 98.9 | 98.8 |
| Short-Term Investments and Net Other Assets (Liabilities) | 1.1 | 1.2 |
Top Ten Stocks as of April 30, 2017
| | % of fund's net assets | % of fund's net assets 6 months ago |
| Total SA (France, Oil, Gas & Consumable Fuels) | 3.0 | 3.0 |
| Mitsubishi UFJ Financial Group, Inc. (Japan, Banks) | 2.5 | 2.4 |
| Toyota Motor Corp. (Japan, Automobiles) | 2.2 | 3.1 |
| Westpac Banking Corp. (Australia, Banks) | 2.2 | 2.3 |
| Sanofi SA (France, Pharmaceuticals) | 1.9 | 1.8 |
| BP PLC (United Kingdom, Oil, Gas & Consumable Fuels) | 1.9 | 1.9 |
| Australia & New Zealand Banking Group Ltd. (Australia, Banks) | 1.7 | 0.0 |
| Lloyds Banking Group PLC (United Kingdom, Banks) | 1.7 | 1.1 |
| BASF AG (Germany, Chemicals) | 1.7 | 2.0 |
| ING Groep NV (Certificaten Van Aandelen) (Netherlands, Banks) | 1.6 | 1.8 |
| | 20.4 | |
Top Market Sectors as of April 30, 2017
| | % of fund's net assets | % of fund's net assets 6 months ago |
| Financials | 36.4 | 29.1 |
| Industrials | 13.5 | 11.4 |
| Health Care | 9.6 | 10.9 |
| Consumer Discretionary | 8.5 | 10.6 |
| Materials | 7.7 | 8.8 |
| Energy | 7.4 | 8.2 |
| Information Technology | 5.1 | 4.8 |
| Consumer Staples | 4.9 | 6.3 |
| Telecommunication Services | 3.4 | 4.5 |
| Utilities | 1.8 | 3.3 |
Percentages shown as 0.0% may reflect amounts less than 0.05%.
Fidelity® Series International Value Fund
Investments April 30, 2017 (Unaudited)
Showing Percentage of Net Assets
| Common Stocks - 98.3% | | | |
| | | Shares | Value |
| Australia - 5.7% | | | |
| Australia & New Zealand Banking Group Ltd. | | 10,063,496 | $246,864,480 |
| Insurance Australia Group Ltd. | | 21,559,956 | 100,254,830 |
| Macquarie Group Ltd. | | 1,529,068 | 106,481,849 |
| Magellan Financial Group Ltd. | | 3,034,346 | 53,576,549 |
| Westpac Banking Corp. | | 11,987,930 | 314,260,882 |
|
| TOTAL AUSTRALIA | | | 821,438,590 |
|
| Bailiwick of Jersey - 0.7% | | | |
| Wolseley PLC | | 1,631,335 | 103,682,994 |
| Belgium - 1.4% | | | |
| KBC Groep NV | | 2,771,570 | 200,104,039 |
| Canada - 0.8% | | | |
| Imperial Oil Ltd. | | 1,875,300 | 54,553,432 |
| Potash Corp. of Saskatchewan, Inc. | | 3,536,700 | 59,642,382 |
|
| TOTAL CANADA | | | 114,195,814 |
|
| Finland - 1.1% | | | |
| Sampo Oyj (A Shares) (a) | | 3,161,313 | 151,484,766 |
| France - 15.2% | | | |
| Atos Origin SA | | 1,492,946 | 195,639,809 |
| AXA SA (a) | | 7,421,373 | 198,003,364 |
| Bouygues SA (a) | | 1,437,642 | 60,440,674 |
| Capgemini SA | | 1,132,705 | 113,408,686 |
| Compagnie de St. Gobain | | 2,455,000 | 132,508,170 |
| Havas SA | | 9,169,131 | 84,787,575 |
| Natixis SA | | 11,224,100 | 78,090,094 |
| Sanofi SA | | 2,958,987 | 279,606,034 |
| Societe Generale Series A | | 3,923,300 | 215,125,227 |
| SR Teleperformance SA | | 855,800 | 107,531,916 |
| Total SA | | 8,363,382 | 429,319,463 |
| VINCI SA (a) | | 2,337,900 | 199,279,283 |
| Vivendi SA (a) | | 5,062,381 | 100,445,736 |
|
| TOTAL FRANCE | | | 2,194,186,031 |
|
| Germany - 7.4% | | | |
| Axel Springer Verlag AG | | 1,171,900 | 65,755,125 |
| BASF AG | | 2,466,689 | 240,375,828 |
| Brenntag AG | | 1,130,700 | 67,052,197 |
| Deutsche Telekom AG | | 11,507,400 | 201,849,031 |
| Fresenius SE & Co. KGaA | | 1,378,300 | 111,717,848 |
| HeidelbergCement Finance AG | | 1,106,400 | 102,442,129 |
| Linde AG | | 328,000 | 58,935,051 |
| SAP AG | | 1,227,416 | 122,945,406 |
| Vonovia SE | | 2,522,300 | 91,314,538 |
|
| TOTAL GERMANY | | | 1,062,387,153 |
|
| Hong Kong - 0.9% | | | |
| AIA Group Ltd. | | 7,640,000 | 52,892,194 |
| Power Assets Holdings Ltd. | | 7,888,550 | 70,991,727 |
|
| TOTAL HONG KONG | | | 123,883,921 |
|
| Indonesia - 0.4% | | | |
| PT Bank Rakyat Indonesia Tbk | | 58,322,500 | 56,445,363 |
| Ireland - 1.5% | | | |
| Allergan PLC | | 260,400 | 63,501,144 |
| CRH PLC | | 2,191,781 | 79,833,660 |
| Medtronic PLC | | 952,900 | 79,176,461 |
|
| TOTAL IRELAND | | | 222,511,265 |
|
| Israel - 0.4% | | | |
| Teva Pharmaceutical Industries Ltd. sponsored ADR | | 1,903,592 | 60,115,435 |
| Italy - 1.0% | | | |
| Intesa Sanpaolo SpA | | 48,654,100 | 142,026,307 |
| Japan - 22.6% | | | |
| AEON Financial Service Co. Ltd. | | 2,996,900 | 57,558,761 |
| Astellas Pharma, Inc. | | 4,357,200 | 57,458,885 |
| Dentsu, Inc. | | 815,600 | 45,947,235 |
| East Japan Railway Co. | | 740,200 | 66,095,096 |
| Hoya Corp. | | 2,690,400 | 128,492,394 |
| Itochu Corp. | | 10,060,900 | 142,237,976 |
| Japan Tobacco, Inc. | | 1,098,700 | 36,526,416 |
| Kao Corp. | | 1,441,900 | 79,522,774 |
| KDDI Corp. | | 6,132,900 | 162,608,162 |
| Komatsu Ltd. | | 4,633,500 | 123,814,277 |
| Makita Corp. | | 2,728,400 | 97,289,886 |
| Mitsubishi UFJ Financial Group, Inc. | | 56,098,800 | 355,475,445 |
| Nintendo Co. Ltd. | | 187,400 | 47,424,494 |
| Nippon Telegraph & Telephone Corp. | | 2,907,400 | 124,598,511 |
| Nomura Holdings, Inc. | | 18,271,300 | 109,803,739 |
| OBIC Co. Ltd. | | 1,769,900 | 95,580,157 |
| Olympus Corp. | | 2,735,700 | 105,280,583 |
| ORIX Corp. | | 9,518,400 | 145,241,520 |
| Panasonic Corp. | | 6,365,509 | 76,120,348 |
| Recruit Holdings Co. Ltd. | | 2,127,400 | 107,443,481 |
| Seven & i Holdings Co. Ltd. | | 2,403,730 | 101,561,501 |
| Shin-Etsu Chemical Co. Ltd. | | 1,411,900 | 122,653,865 |
| Shinsei Bank Ltd. | | 39,195,000 | 73,133,528 |
| Sony Corp. | | 3,725,800 | 127,848,382 |
| Sony Financial Holdings, Inc. | | 5,181,800 | 86,088,303 |
| Subaru Corp. | | 2,046,000 | 77,306,589 |
| Taiheiyo Cement Corp. | | 17,646,000 | 58,727,661 |
| Tokio Marine Holdings, Inc. | | 2,985,700 | 125,668,575 |
| Toyota Motor Corp. | | 5,952,300 | 322,143,189 |
|
| TOTAL JAPAN | | | 3,259,651,733 |
|
| Netherlands - 3.8% | | | |
| Akzo Nobel NV (a) | | 530,163 | 46,362,226 |
| ING Groep NV (Certificaten Van Aandelen) | | 14,235,034 | 232,024,539 |
| PostNL NV (a) | | 6,894,649 | 34,149,521 |
| RELX NV | | 7,358,583 | 142,318,832 |
| Wolters Kluwer NV | | 2,050,476 | 87,087,421 |
|
| TOTAL NETHERLANDS | | | 541,942,539 |
|
| Norway - 0.9% | | | |
| Statoil ASA (a) | | 8,040,777 | 132,422,714 |
| Spain - 3.7% | | | |
| Banco Santander SA (Spain) | | 30,416,400 | 198,364,783 |
| CaixaBank SA | | 30,995,908 | 140,735,165 |
| Iberdrola SA | | 27,110,962 | 194,970,071 |
|
| TOTAL SPAIN | | | 534,070,019 |
|
| Sweden - 3.5% | | | |
| Investor AB (B Shares) | | 2,790,521 | 127,565,054 |
| Nordea Bank AB | | 18,165,533 | 223,549,287 |
| Swedbank AB (A Shares) | | 4,823,500 | 114,307,142 |
| Telefonaktiebolaget LM Ericsson (B Shares) | | 6,454,100 | 41,931,201 |
|
| TOTAL SWEDEN | | | 507,352,684 |
|
| Switzerland - 7.0% | | | |
| ABB Ltd. (Reg.) | | 6,336,500 | 155,271,276 |
| Credit Suisse Group AG | | 4,210,504 | 64,214,245 |
| Lafargeholcim Ltd. (Reg.) | | 1,652,900 | 93,692,020 |
| Nestle SA (Reg. S) | | 1,168,769 | 90,019,183 |
| Novartis AG | | 2,331,527 | 179,492,777 |
| UBS Group AG | | 13,512,971 | 229,855,637 |
| Zurich Insurance Group AG | | 713,879 | 197,557,764 |
|
| TOTAL SWITZERLAND | | | 1,010,102,902 |
|
| United Kingdom - 17.2% | | | |
| AstraZeneca PLC (United Kingdom) | | 3,344,615 | 200,307,094 |
| Aviva PLC | | 29,717,687 | 202,092,601 |
| BAE Systems PLC | | 19,900,550 | 161,631,789 |
| BHP Billiton PLC | | 4,415,630 | 67,317,199 |
| BP PLC | | 47,143,399 | 269,877,845 |
| British American Tobacco PLC (United Kingdom) | | 1,512,100 | 102,162,571 |
| Bunzl PLC | | 4,292,878 | 133,888,065 |
| Compass Group PLC | | 6,972,817 | 140,786,816 |
| HSBC Holdings PLC sponsored ADR (a) | | 3,200,230 | 131,753,469 |
| Imperial Tobacco Group PLC | | 2,658,574 | 130,228,823 |
| Informa PLC | | 14,276,162 | 118,708,914 |
| ITV PLC | | 25,976,685 | 70,654,505 |
| Lloyds Banking Group PLC | | 273,628,700 | 245,862,721 |
| Micro Focus International PLC | | 3,498,500 | 117,268,937 |
| Rio Tinto PLC | | 4,450,584 | 175,576,568 |
| Royal Dutch Shell PLC Class B (United Kingdom) | | 2,326,139 | 61,891,529 |
| Standard Chartered PLC (United Kingdom) (b) | | 15,439,528 | 144,220,360 |
|
| TOTAL UNITED KINGDOM | | | 2,474,229,806 |
|
| United States of America - 3.1% | | | |
| Amgen, Inc. | | 321,900 | 52,572,708 |
| ConocoPhillips Co. | | 2,488,400 | 119,219,244 |
| Constellation Brands, Inc. Class A (sub. vtg.) | | 349,100 | 60,233,714 |
| Edgewell Personal Care Co. (b) | | 527,600 | 37,718,124 |
| Molson Coors Brewing Co. Class B | | 707,100 | 67,803,819 |
| S&P Global, Inc. | | 753,500 | 101,112,165 |
|
| TOTAL UNITED STATES OF AMERICA | | | 438,659,774 |
|
| TOTAL COMMON STOCKS | | | |
| (Cost $12,363,526,671) | | | 14,150,893,849 |
|
| Nonconvertible Preferred Stocks - 0.6% | | | |
| Spain - 0.6% | | | |
| Grifols SA Class B | | | |
| (Cost $60,866,623) | | 3,866,400 | 82,527,664 |
|
| Money Market Funds - 3.6% | | | |
| Fidelity Cash Central Fund, 0.85% (c) | | 66,660,668 | 66,674,000 |
| Fidelity Securities Lending Cash Central Fund 0.86% (c)(d) | | 457,546,247 | 457,592,002 |
| TOTAL MONEY MARKET FUNDS | | | |
| (Cost $524,265,971) | | | 524,266,002 |
| TOTAL INVESTMENT PORTFOLIO - 102.5% | | | |
| (Cost $12,948,659,265) | | | 14,757,687,515 |
| NET OTHER ASSETS (LIABILITIES) - (2.5)% | | | (364,726,584) |
| NET ASSETS - 100% | | | $14,392,960,931 |
Categorizations in the Schedule of Investments are based on country or territory of incorporation.
Legend
(a) Security or a portion of the security is on loan at period end.
(b) Non-income producing
(c) Affiliated fund that is generally available only to investment companies and other accounts managed by Fidelity Investments. The rate quoted is the annualized seven-day yield of the fund at period end. A complete unaudited listing of the fund's holdings as of its most recent quarter end is available upon request. In addition, each Fidelity Central Fund's financial statements are available on the SEC's website or upon request.
(d) Investment made with cash collateral received from securities on loan.
Affiliated Central Funds
Information regarding fiscal year to date income earned by the Fund from investments in Fidelity Central Funds is as follows:
| Fund | Income earned |
| Fidelity Cash Central Fund | $368,363 |
| Fidelity Securities Lending Cash Central Fund | 3,472,312 |
| Total | $3,840,675 |
Investment Valuation
The following is a summary of the inputs used, as of April 30, 2017, involving the Fund's assets and liabilities carried at fair value. The inputs or methodology used for valuing securities may not be an indication of the risk associated with investing in those securities. For more information on valuation inputs, and their aggregation into the levels used below, please refer to the Investment Valuation section in the accompanying Notes to Financial Statements.
| | Valuation Inputs at Reporting Date: |
| Description | Total | Level 1 | Level 2 | Level 3 |
| Investments in Securities: | | | | |
| Equities: | | | | |
| Consumer Discretionary | $1,230,504,414 | $563,605,679 | $666,898,735 | $-- |
| Consumer Staples | 705,776,925 | 513,595,171 | 192,181,754 | -- |
| Energy | 1,067,284,227 | 173,772,676 | 893,511,551 | -- |
| Financials | 5,221,794,747 | 2,804,612,748 | 2,417,181,999 | -- |
| Health Care | 1,400,249,027 | 683,384,237 | 716,864,790 | -- |
| Industrials | 1,921,722,854 | 1,178,043,235 | 743,679,619 | -- |
| Information Technology | 734,198,690 | 408,488,903 | 325,709,787 | -- |
| Materials | 1,105,558,589 | 782,831,162 | 322,727,427 | -- |
| Real Estate | 91,314,538 | 91,314,538 | -- | -- |
| Telecommunication Services | 489,055,704 | -- | 489,055,704 | -- |
| Utilities | 265,961,798 | 265,961,798 | -- | -- |
| Money Market Funds | 524,266,002 | 524,266,002 | -- | -- |
| Total Investments in Securities: | $14,757,687,515 | $7,989,876,149 | $6,767,811,366 | $-- |
The following is a summary of transfers between Level 1 and Level 2 for the period ended April 30, 2017. Transfers are assumed to have occurred at the beginning of the period, and are primarily attributable to the valuation techniques used for foreign equity securities, as discussed in the accompanying Notes to Financial Statements:
| Transfers | Total |
| Level 1 to Level 2 | $588,999,688 |
| Level 2 to Level 1 | $500,582,218 |
See accompanying notes which are an integral part of the financial statements.
Fidelity® Series International Value Fund
Financial Statements
Statement of Assets and Liabilities
| | | April 30, 2017 (Unaudited) |
| Assets | | |
Investment in securities, at value (including securities loaned of $429,582,624) — See accompanying schedule:
Unaffiliated issuers (cost $12,424,393,294) | $14,233,421,513 | |
| Fidelity Central Funds (cost $524,265,971) | 524,266,002 | |
| Total Investments (cost $12,948,659,265) | | $14,757,687,515 |
| Foreign currency held at value (cost $2,635,782) | | 2,640,030 |
| Receivable for investments sold | | 31,364,513 |
| Receivable for fund shares sold | | 9,479,587 |
| Dividends receivable | | 95,012,741 |
| Distributions receivable from Fidelity Central Funds | | 1,076,811 |
| Prepaid expenses | | 8,063 |
| Other receivables | | 596,138 |
| Total assets | | 14,897,865,398 |
| Liabilities | | |
| Payable for investments purchased | $31,780,797 | |
| Payable for fund shares redeemed | 6,038,352 | |
| Accrued management fee | 8,266,380 | |
| Other affiliated payables | 976,177 | |
| Other payables and accrued expenses | 211,646 | |
| Collateral on securities loaned | 457,631,115 | |
| Total liabilities | | 504,904,467 |
| Net Assets | | $14,392,960,931 |
| Net Assets consist of: | | |
| Paid in capital | | $13,523,462,494 |
| Undistributed net investment income | | 139,972,743 |
| Accumulated undistributed net realized gain (loss) on investments and foreign currency transactions | | (1,079,317,092) |
| Net unrealized appreciation (depreciation) on investments and assets and liabilities in foreign currencies | | 1,808,842,786 |
| Net Assets | | $14,392,960,931 |
| Series International Value: | | |
| Net Asset Value, offering price and redemption price per share ($6,484,719,276 ÷ 650,628,107 shares) | | $9.97 |
| Class F: | | |
| Net Asset Value, offering price and redemption price per share ($7,908,241,655 ÷ 791,493,111 shares) | | $9.99 |
See accompanying notes which are an integral part of the financial statements.
Statement of Operations
| | | Six months ended April 30, 2017 (Unaudited) |
| Investment Income | | |
| Dividends | | $234,854,015 |
| Income from Fidelity Central Funds | | 3,840,675 |
| Income before foreign taxes withheld | | 238,694,690 |
| Less foreign taxes withheld | | (18,195,610) |
| Total income | | 220,499,080 |
| Expenses | | |
| Management fee | | |
| Basic fee | $47,141,893 | |
| Performance adjustment | (912,981) | |
| Transfer agent fees | 4,795,784 | |
| Accounting and security lending fees | 966,249 | |
| Custodian fees and expenses | 551,295 | |
| Independent trustees' fees and expenses | 27,054 | |
| Registration fees | 7,112 | |
| Audit | 38,824 | |
| Legal | 15,250 | |
| Interest | 659 | |
| Miscellaneous | 50,424 | |
| Total expenses before reductions | 52,681,563 | |
| Expense reductions | (914,071) | 51,767,492 |
| Net investment income (loss) | | 168,731,588 |
| Realized and Unrealized Gain (Loss) | | |
| Net realized gain (loss) on: | | |
| Investment securities: | | |
| Unaffiliated issuers | (194,024,113) | |
| Fidelity Central Funds | (51,157) | |
| Foreign currency transactions | (4,371,126) | |
| Total net realized gain (loss) | | (198,446,396) |
Change in net unrealized appreciation (depreciation) on:
Investment securities | 1,392,483,612 | |
| Assets and liabilities in foreign currencies | 1,639,896 | |
| Total change in net unrealized appreciation (depreciation) | | 1,394,123,508 |
| Net gain (loss) | | 1,195,677,112 |
| Net increase (decrease) in net assets resulting from operations | | $1,364,408,700 |
See accompanying notes which are an integral part of the financial statements.
Statement of Changes in Net Assets
| | Six months ended April 30, 2017 (Unaudited) | Year ended October 31, 2016 |
| Increase (Decrease) in Net Assets | | |
| Operations | | |
| Net investment income (loss) | $168,731,588 | $323,480,918 |
| Net realized gain (loss) | (198,446,396) | (488,635,728) |
| Change in net unrealized appreciation (depreciation) | 1,394,123,508 | (314,124,333) |
| Net increase (decrease) in net assets resulting from operations | 1,364,408,700 | (479,279,143) |
| Distributions to shareholders from net investment income | (329,576,938) | (256,925,581) |
| Distributions to shareholders from net realized gain | (24,285,362) | – |
| Total distributions | (353,862,300) | (256,925,581) |
| Share transactions - net increase (decrease) | 520,299,907 | 1,605,266,994 |
| Total increase (decrease) in net assets | 1,530,846,307 | 869,062,270 |
| Net Assets | | |
| Beginning of period | 12,862,114,624 | 11,993,052,354 |
| End of period | $14,392,960,931 | $12,862,114,624 |
| Other Information | | |
| Undistributed net investment income end of period | $139,972,743 | $300,818,093 |
See accompanying notes which are an integral part of the financial statements.
Financial Highlights — Fidelity Series International Value Fund
| | Six months ended (Unaudited) April 30, | Years ended October 31, | | | | |
| | 2017 | 2016 | 2015 | 2014 | 2013 | 2012 |
| Selected Per–Share Data | | | | | | |
| Net asset value, beginning of period | $9.27 | $9.91 | $10.73 | $11.14 | $9.16 | $8.59 |
| Income from Investment Operations | | | | | | |
| Net investment income (loss)A | .11 | .24 | .22 | .45B | .26 | .29 |
| Net realized and unrealized gain (loss) | .83 | (.68) | (.28) | (.59) | 2.03 | .50 |
| Total from investment operations | .94 | (.44) | (.06) | (.14) | 2.29 | .79 |
| Distributions from net investment income | (.22) | (.20) | (.44) | (.24) | (.26) | (.22) |
| Distributions from net realized gain | (.02) | – | (.32) | (.04) | (.06) | – |
| Total distributions | (.24) | (.20) | (.76) | (.27)C | (.31)D | (.22) |
| Net asset value, end of period | $9.97 | $9.27 | $9.91 | $10.73 | $11.14 | $9.16 |
| Total ReturnE,F | 10.37% | (4.49)% | (.65)% | (1.25)% | 25.78% | 9.56% |
| Ratios to Average Net AssetsG,H | | | | | | |
| Expenses before reductions | .87%I | .96% | .89% | .82% | .88% | .90% |
| Expenses net of fee waivers, if any | .86%I | .96% | .89% | .82% | .88% | .90% |
| Expenses net of all reductions | .85%I | .95% | .88% | .81% | .85% | .87% |
| Net investment income (loss) | 2.41%I | 2.58% | 2.12% | 4.05%B | 2.58% | 3.35% |
| Supplemental Data | | | | | | |
| Net assets, end of period (000 omitted) | $6,484,719 | $5,774,976 | $5,556,957 | $5,971,189 | $5,710,397 | $5,107,633 |
| Portfolio turnover rateJ | 48%I | 45% | 44% | 70% | 80% | 63% |
A Calculated based on average shares outstanding during the period.
B Net Investment income per share reflects a large, non-recurring dividend which amounted to $.18 per share. Excluding this non-recurring dividend, the ratio of net investment income (loss) to average net assets would have been 2.46%.
C Total distributions of $.27 per share is comprised of distributions from net investment income of $.237 and distributions from net realized gain of $.036 per share.
D Total distributions of $.31 per share is comprised of distributions from net investment income of $.256 and distributions from net realized gain of $.057 per share.
E Total returns for periods of less than one year are not annualized.
F Total returns would have been lower if certain expenses had not been reduced during the applicable periods shown.
G Fees and expenses of any underlying Fidelity Central Funds are not included in the Fund's expense ratio. The Fund indirectly bears its proportionate share of the expenses of any underlying Fidelity Central Funds.
H Expense ratios reflect operating expenses of the class. Expenses before reductions do not reflect amounts reimbursed by the investment adviser or reductions from brokerage service arrangements or reductions from other expense offset arrangements and do not represent the amount paid by the class during periods when reimbursements or reductions occur. Expenses net of fee waivers reflect expenses after reimbursement by the investment adviser but prior to reductions from brokerage service arrangements or other expense offset arrangements. Expenses net of all reductions represent the net expenses paid by the class.
I Annualized
J Amount does not include the portfolio activity of any underlying Fidelity Central Funds.
See accompanying notes which are an integral part of the financial statements.
Financial Highlights — Fidelity Series International Value Fund Class F
| | Six months ended (Unaudited) April 30, | Years ended October 31, | | | | |
| | 2017 | 2016 | 2015 | 2014 | 2013 | 2012 |
| Selected Per–Share Data | | | | | | |
| Net asset value, beginning of period | $9.30 | $9.94 | $10.76 | $11.18 | $9.19 | $8.62 |
| Income from Investment Operations | | | | | | |
| Net investment income (loss)A | .12 | .25 | .23 | .47B | .28 | .30 |
| Net realized and unrealized gain (loss) | .82 | (.67) | (.27) | (.60) | 2.04 | .51 |
| Total from investment operations | .94 | (.42) | (.04) | (.13) | 2.32 | .81 |
| Distributions from net investment income | (.24) | (.22) | (.46) | (.25) | (.27) | (.24) |
| Distributions from net realized gain | (.02) | – | (.32) | (.04) | (.06) | – |
| Total distributions | (.25)C | (.22) | (.78) | (.29) | (.33) | (.24) |
| Net asset value, end of period | $9.99 | $9.30 | $9.94 | $10.76 | $11.18 | $9.19 |
| Total ReturnD,E | 10.39% | (4.30)% | (.46)% | (1.18)% | 26.05% | 9.77% |
| Ratios to Average Net AssetsF,G | | | | | | |
| Expenses before reductions | .71%H | .79% | .73% | .65% | .69% | .70% |
| Expenses net of fee waivers, if any | .71%H | .79% | .73% | .65% | .69% | .70% |
| Expenses net of all reductions | .69%H | .79% | .72% | .64% | .67% | .67% |
| Net investment income (loss) | 2.56%H | 2.75% | 2.28% | 4.22%B | 2.76% | 3.55% |
| Supplemental Data | | | | | | |
| Net assets, end of period (000 omitted) | $7,908,242 | $7,087,139 | $6,436,096 | $6,467,583 | $5,601,176 | $4,114,635 |
| Portfolio turnover rateI | 48%H | 45% | 44% | 70% | 80% | 63% |
A Calculated based on average shares outstanding during the period.
B Net Investment income per share reflects a large, non-recurring dividend which amounted to $.18 per share. Excluding this non-recurring dividend, the ratio of net investment income (loss) to average net assets would have been 2.64%.
C Total distributions of $.25 per share is comprised of distributions from net investment income of $.237 and distributions from net realized gain of $.017 per share.
D Total returns for periods of less than one year are not annualized.
E Total returns would have been lower if certain expenses had not been reduced during the applicable periods shown.
F Fees and expenses of any underlying Fidelity Central Funds are not included in the Fund's expense ratio. The Fund indirectly bears its proportionate share of the expenses of any underlying Fidelity Central Funds.
G Expense ratios reflect operating expenses of the class. Expenses before reductions do not reflect amounts reimbursed by the investment adviser or reductions from brokerage service arrangements or reductions from other expense offset arrangements and do not represent the amount paid by the class during periods when reimbursements or reductions occur. Expenses net of fee waivers reflect expenses after reimbursement by the investment adviser but prior to reductions from brokerage service arrangements or other expense offset arrangements. Expenses net of all reductions represent the net expenses paid by the class.
H Annualized
I Amount does not include the portfolio activity of any underlying Fidelity Central Funds.
See accompanying notes which are an integral part of the financial statements.
Notes to Financial Statements (Unaudited)
For the period ended April 30, 2017
1. Organization.
Fidelity Series Emerging Markets Fund, Fidelity Series International Growth Fund, Fidelity Series International Small Cap Fund and Fidelity Series International Value Fund (the Funds) are funds of Fidelity Investment Trust (the Trust). The Trust is registered under the Investment Company Act of 1940, as amended (the 1940 Act), as an open-end management investment company organized as a Massachusetts business trust. Each Fund is authorized to issue an unlimited number of shares. Shares of the Funds are only available for purchase by mutual funds for which Fidelity Management & Research Company (FMR) or an affiliate serves as an investment manager. Fidelity Series Emerging Markets Fund offers Series Emerging Markets shares and Class F shares. Fidelity Series International Growth Fund offers Series International Growth shares and Class F shares. Fidelity Series International Small Cap Fund offers Series International Small Cap shares and Class F shares. Fidelity Series International Value Fund offers Series International Value shares and Class F shares. All classes have equal rights as to assets and voting privileges. Each class has exclusive voting rights with respect to matters that affect that class. The Funds' investments in emerging markets can be subject to social, economic, regulatory, and political uncertainties and can be extremely volatile.
2. Investments in Fidelity Central Funds.
The Funds invest in Fidelity Central Funds, which are open-end investment companies generally available only to other investment companies and accounts managed by the investment adviser and its affiliates. The Funds' Schedules of Investments list each of the Fidelity Central Funds held as of period end, if any, as an investment of each Fund, but do not include the underlying holdings of each Fidelity Central Fund. As an Investing Fund, each Fund indirectly bears its proportionate share of the expenses of the underlying Fidelity Central Funds.
The Money Market Central Funds seek preservation of capital and current income and are managed by Fidelity Investments Money Management, Inc. (FIMM), an affiliate of the investment adviser. Annualized expenses of the Money Market Central Funds as of their most recent shareholder report date are less than .005%.
A complete unaudited list of holdings for each Fidelity Central Fund is available upon request or at the Securities and Exchange Commission (the SEC) website at www.sec.gov. In addition, the financial statements of the Fidelity Central Funds are available on the SEC website or upon request.
3. Significant Accounting Policies.
Each Fund is an investment company and applies the accounting and reporting guidance of the Financial Accounting Standards Board (FASB) Accounting Standards Codification Topic 946 Financial Services – Investments Companies. The financial statements have been prepared in conformity with accounting principles generally accepted in the United States of America (GAAP), which require management to make certain estimates and assumptions at the date of the financial statements. Actual results could differ from those estimates. Subsequent events, if any, through the date that the financial statements were issued have been evaluated in the preparation of the financial statements. The following summarizes the significant accounting policies of the Funds:
Investment Valuation. Investments are valued as of 4:00 p.m. Eastern time on the last calendar day of the period. The Board of Trustees (the Board) has delegated the day to day responsibility for the valuation of each Fund's investments to the Fair Value Committee (the Committee) established by each Fund's investment adviser. In accordance with valuation policies and procedures approved by the Board, each Fund attempts to obtain prices from one or more third party pricing vendors or brokers to value its investments. When current market prices, quotations or currency exchange rates are not readily available or reliable, investments will be fair valued in good faith by the Committee, in accordance with procedures adopted by the Board. Factors used in determining fair value vary by investment type and may include market or investment specific events, changes in interest rates and credit quality. The frequency with which these procedures are used cannot be predicted and they may be utilized to a significant extent. The Committee oversees each Fund's valuation policies and procedures and reports to the Board on the Committee's activities and fair value determinations. The Board monitors the appropriateness of the procedures used in valuing each Fund's investments and ratifies the fair value determinations of the Committee.
Each Fund categorizes the inputs to valuation techniques used to value its investments into a disclosure hierarchy consisting of three levels as shown below:
- Level 1 – quoted prices in active markets for identical investments
- Level 2 – other significant observable inputs (including quoted prices for similar investments, interest rates, prepayment speeds, etc.)
- Level 3 – unobservable inputs (including the Fund's own assumptions based on the best information available)
Valuation techniques used to value each Fund's investments by major category are as follows:
Equity securities, including restricted securities, for which market quotations are readily available, are valued at the last reported sale price or official closing price as reported by a third party pricing vendor on the primary market or exchange on which they are traded and are categorized as Level 1 in the hierarchy. In the event there were no sales during the day or closing prices are not available, securities are valued at the last quoted bid price or may be valued using the last available price and are generally categorized as Level 2 in the hierarchy. For foreign equity securities, when market or security specific events arise, comparisons to the valuation of American Depositary Receipts (ADRs), futures contracts, Exchange-Traded Funds (ETFs) and certain indexes as well as quoted prices for similar securities may be used and would be categorized as Level 2 in the hierarchy. Utilizing these techniques may result in transfers between Level 1 and Level 2. For equity securities, including restricted securities, where observable inputs are limited, assumptions about market activity and risk are used and these securities may be categorized as Level 3 in the hierarchy.
Debt securities, including restricted securities, are valued based on evaluated prices received from third party pricing vendors or from brokers who make markets in such securities. U.S. government and government agency obligations are valued by pricing vendors who utilize matrix pricing which considers yield or price of bonds of comparable quality, coupon, maturity and type or by broker-supplied prices. When independent prices are unavailable or unreliable, debt securities may be valued utilizing pricing methodologies which consider similar factors that would be used by third party pricing vendors. Debt securities are generally categorized as Level 2 in the hierarchy but may be Level 3 depending on the circumstances.
Futures contracts are valued at the settlement price established each day by the board of trade or exchange on which they are traded and are categorized as Level 1 in the hierarchy. Investments in open-end mutual funds, including the Fidelity Central Funds, are valued at their closing net asset value (NAV) each business day and are categorized as Level 1 in the hierarchy.
Changes in valuation techniques may result in transfers in or out of an assigned level within the disclosure hierarchy. The aggregate value of investments by input level as of April 30, 2017, including information on transfers between Levels 1 and 2, is included at the end of each applicable Fund's Schedule of Investments.
Foreign Currency. The Funds may use foreign currency contracts to facilitate transactions in foreign-denominated securities. Gains and losses from these transactions may arise from changes in the value of the foreign currency or if the counterparties do not perform under the contracts' terms.
Foreign-denominated assets, including investment securities, and liabilities are translated into U.S. dollars at the exchange rates at period end. Purchases and sales of investment securities, income and dividends received and expenses denominated in foreign currencies are translated into U.S. dollars at the exchange rate in effect on the transaction date.
The effects of exchange rate fluctuations on investments are included with the net realized and unrealized gain (loss) on investment securities. Other foreign currency transactions resulting in realized and unrealized gain (loss) are disclosed separately.
Investment Transactions and Income. For financial reporting purposes, the Funds' investment holdings and NAV include trades executed through the end of the last business day of the period. The NAV per share for processing shareholder transactions is calculated as of the close of business of the New York Stock Exchange (NYSE), normally 4:00 p.m. Eastern time and includes trades executed through the end of the prior business day. Gains and losses on securities sold are determined on the basis of identified cost. Dividend income is recorded on the ex-dividend date, except for certain dividends from foreign securities where the ex-dividend date may have passed, which are recorded as soon as the Funds are informed of the ex-dividend date. Non-cash dividends included in dividend income, if any, are recorded at the fair market value of the securities received. Income and capital gain distributions from Fidelity Central Funds, if any, are recorded on the ex-dividend date. Certain distributions received by the Funds represent a return of capital or capital gain. The Funds determine the components of these distributions subsequent to the ex-dividend date, based upon receipt of tax filings or other correspondence relating to the underlying investment. These distributions are recorded as a reduction of cost of investments and/or as a realized gain. Interest income is accrued as earned and includes coupon interest and amortization of premium and accretion of discount on debt securities as applicable. Investment income is recorded net of foreign taxes withheld where recovery of such taxes is uncertain.
Class Allocations and Expenses. Investment income, realized and unrealized capital gains and losses, common expenses of each Fund, and certain fund-level expense reductions, if any, are allocated daily on a pro-rata basis to each class based on the relative net assets of each class to the total net assets of each Fund. Each class differs with respect to transfer agent fees incurred. Certain expense reductions may also differ by class. For the reporting period, the allocated portion of income and expenses to each class as a percent of its average net assets may vary due to the timing of recording these transactions in relation to fluctuating net assets of the classes. Expenses directly attributable to a fund are charged to that fund. Expenses attributable to more than one fund are allocated among the respective funds on the basis of relative net assets or other appropriate methods. Expense estimates are accrued in the period to which they relate and adjustments are made when actual amounts are known.
Income Tax Information and Distributions to Shareholders. Each year, each Fund intends to qualify as a regulated investment company under Subchapter M of the Internal Revenue Code, including distributing substantially all of its taxable income and realized gains. As a result, no provision for U.S. Federal income taxes is required. Each Fund files a U.S. federal tax return, in addition to state and local tax returns as required. Each Fund's federal income tax returns are subject to examination by the Internal Revenue Service (IRS) for a period of three fiscal years after they are filed. State and local tax returns may be subject to examination for an additional fiscal year depending on the jurisdiction. Foreign taxes are provided for based on each Fund's understanding of the tax rules and rates that exist in the foreign markets in which it invests. Fidelity Series Emerging Markets Fund is subject to a tax imposed on capital gains by certain countries in which it invests. An estimated deferred tax liability for net unrealized appreciation on the applicable securities is included in Other payables and accrued expenses on Fidelity Series Emerging Markets Fund's Statement of Assets & Liabilities.
Distributions are declared and recorded on the ex-dividend date. Income dividends and capital gain distributions are declared separately for each class. Income and capital gain distributions are determined in accordance with income tax regulations, which may differ from GAAP.
Capital accounts within the financial statements are adjusted for permanent book-tax differences. These adjustments have no impact on net assets or the results of operations. Capital accounts are not adjusted for temporary book-tax differences which will reverse in a subsequent period.
Book-tax differences are primarily due to futures contracts, foreign currency transactions, certain foreign taxes, passive foreign investment companies (PFIC), partnerships, capital loss carryforwards and losses deferred due to wash sales.
The federal tax cost of investment securities and unrealized appreciation (depreciation) as of period end were as follows for each Fund:
| | Tax cost | Gross unrealized appreciation | Gross unrealized depreciation | Net unrealized appreciation (depreciation) on securities |
| Fidelity Series Emerging Markets Fund | $13,220,028,336 | $3,748,738,351 | $(529,195,128) | $3,219,543,223 |
| Fidelity Series International Growth Fund | 11,337,095,776 | 3,772,442,458 | (160,515,511) | 3,611,926,947 |
| Fidelity Series International Small Cap Fund | 2,572,611,327 | 917,917,404 | (122,499,905) | 795,417,499 |
| Fidelity Series International Value Fund | 13,007,353,690 | 2,097,968,524 | (347,634,699) | 1,750,333,825 |
Capital loss carryforwards are only available to offset future capital gains of the Funds to the extent provided by regulations and may be limited. Under the Regulated Investment Company Modernization Act of 2010 (the Act), the Funds are permitted to carry forward capital losses incurred in taxable years beginning after December 22, 2010 for an unlimited period and such capital losses are required to be used prior to any losses that expire. The capital loss carryforward information presented below, including any applicable limitation, is estimated as of prior fiscal period end and is subject to adjustment.
| | No expiration | | | |
| | Short-term | Long-term | Total no expiration | Total capital loss carryforward |
| Fidelity Series Emerging Markets Fund | $(1,027,032,217) | $(300,620,692) | $(1,327,652,909) | $(1,327,652,909) |
| Fidelity Series International Value Fund | (478,490,553) | (272,135,510) | (750,626,063) | (750,626,063) |
Restricted Securities. The Funds may invest in securities that are subject to legal or contractual restrictions on resale. These securities generally may be resold in transactions exempt from registration or to the public if the securities are registered. Disposal of these securities may involve time-consuming negotiations and expense, and prompt sale at an acceptable price may be difficult. Information regarding restricted securities is included at the end of each applicable Fund's Schedule of Investments.
4. Derivative Instruments.
Risk Exposures and the Use of Derivative Instruments. The Funds' investment objective allows the Funds to enter into various types of derivative contracts, including futures contracts. Derivatives are investments whose value is primarily derived from underlying assets, indices or reference rates and may be transacted on an exchange or over-the-counter (OTC). Derivatives may involve a future commitment to buy or sell a specified asset based on specified terms, to exchange future cash flows at periodic intervals based on a notional principal amount, or for one party to make one or more payments upon the occurrence of specified events in exchange for periodic payments from the other party.
The Funds used derivatives to increase returns and to manage exposure to certain risks as defined below. The success of any strategy involving derivatives depends on analysis of numerous economic factors, and if the strategies for investment do not work as intended, the Funds may not achieve their objectives.
The Funds' use of derivatives increased or decreased their exposure to the following risk:
| Equity Risk | Equity risk relates to the fluctuations in the value of financial instruments as a result of changes in market prices (other than those arising from interest rate risk or foreign exchange risk), whether caused by factors specific to an individual investment, its issuer, or all factors affecting all instruments traded in a market or market segment.
|
The Funds are also exposed to additional risks from investing in derivatives, such as liquidity risk and counterparty credit risk. Liquidity risk is the risk that the Funds will be unable to close out the derivative in the open market in a timely manner. Counterparty credit risk is the risk that the counterparty will not be able to fulfill its obligation to the Funds. Counterparty credit risk related to exchange-traded futures contracts may be mitigated by the protection provided by the exchange on which they trade.
Investing in derivatives may involve greater risks than investing in the underlying assets directly and, to varying degrees, may involve risk of loss in excess of any initial investment and collateral received and amounts recognized in the Statement of Assets and Liabilities. In addition, there may be the risk that the change in value of the derivative contract does not correspond to the change in value of the underlying instrument.
Futures Contracts. A futures contract is an agreement between two parties to buy or sell a specified underlying instrument for a fixed price at a specified future date. The Funds used futures contracts to manage their exposure to the stock market.
Upon entering into a futures contract, a fund is required to deposit either cash or securities (initial margin) with a clearing broker in an amount equal to a certain percentage of the face value of the contract. Futures contracts are marked-to-market daily and subsequent daily payments (variation margin) are made or received by a fund depending on the daily fluctuations in the value of the futures contracts and are recorded as unrealized appreciation or (depreciation). This receivable and/or payable, if any, is included in daily variation margin for derivative instruments in the Statement of Assets and Liabilities. Realized gain or (loss) is recorded upon the expiration or closing of a futures contract.
Any open futures contracts at period end are presented in the Schedule of Investments under the caption "Futures Contracts". The underlying face amount at value reflects each contract's exposure to the underlying instrument or index at period end and is representative of volume of activity during the period. Securities deposited to meet initial margin requirements are identified in the Schedule of Investments.
During the period the Fidelity Series Emerging Markets Fund recognized net realized gain (loss) of $(6,885,374) and a change in net unrealized appreciation (depreciation) of $2,910,535 related to its investment in futures contracts. These amounts are included in the Statement of Operations.
5. Purchases and Sales of Investments.
Purchases and sales of securities, other than short-term securities, are noted in the table below.
| | Purchases ($) | Sales ($) |
| Fidelity Series Emerging Markets Fund | 3,451,171,091 | 4,183,326,160 |
| Fidelity Series International Growth Fund | 2,581,853,067 | 1,803,846,818 |
| Fidelity Series International Small Cap Fund | 435,680,537 | 419,719,334 |
| Fidelity Series International Value Fund | 3,545,389,463 | 3,220,445,706 |
6. Fees and Other Transactions with Affiliates.
Management Fee. Fidelity Management & Research Company (the investment adviser) and its affiliates provide the Funds with investment management related services for which the Funds pay a monthly management fee. The management fee is the sum of an individual fund fee rate and an annualized group fee rate. The individual fund fee rate is applied to each Fund's average net assets. The group fee rate is based upon the average net assets of all the mutual funds advised by the investment adviser, including any mutual funds previously advised by the investment adviser that are currently advised by Fidelity SelectCo, LLC, an affiliate of the investment adviser. The group fee rate decreases as assets under management increase and increases as assets under management decrease. In addition, the management fee for Fidelity Series International Growth Fund, Fidelity Series International Small Cap Fund and Fidelity Series International Value Fund is subject to a performance adjustment (up to a maximum of +/- .20% of each applicable Fund's average net assets over a 36 month performance period.) The upward or downward adjustment to the management fee is based on relative investment performance of Series International Growth, Series International Small Cap and Series International Value as compared to its benchmark index over the same 36 month performance period. For the reporting period, each Fund's annualized management fee rate expressed as a percentage of each Fund's average net assets, including the performance adjustment, if applicable was as follows: The performance adjustment included in the management fee rate may be higher or lower than the maximum performance adjustment rate due to the difference between the average net asset for the reporting and performance periods.
| | Individual Rate | Group Rate | Total |
| Fidelity Series Emerging Markets Fund | .55% | .25% | .80% |
| Fidelity Series International Growth Fund | .45% | .25% | .74% |
| Fidelity Series International Small Cap Fund | .60% | .25% | .81% |
| Fidelity Series International Value Fund | .45% | .25% | .68% |
| | Performance Benchmark |
| Fidelity Series International Growth Fund | MSCI EAFE Growth Index |
| Fidelity Series International Small Cap Fund | MSCI EAFE Small Cap Index |
| Fidelity Series International Value Fund | MSCI EAFE Value Index |
The Board and shareholders approved a new management contract, effective June 1, 2017. Under the management contract, each Fund will not pay a management fee. In addition, the investment adviser will pay all ordinary operating expenses of each Fund, except custody fees, fees and expenses of the independent Trustees, and certain miscellaneous expenses such as proxy and shareholder meeting expenses.
Transfer Agent Fees. Fidelity Investments Institutional Operations Company, Inc., (FIIOC), an affiliate of the investment adviser, is the transfer, dividend disbursing and shareholder servicing agent for each class of the Funds. FIIOC receives account fees and asset-based fees that vary according to the account size and type of account of the shareholders of the respective classes of each Fund, except for Class F. FIIOC receives no fees for providing transfer agency services to Class F. FIIOC pays for typesetting, printing and mailing of shareholder reports, except proxy statements. For the period, transfer agent fees for each applicable class were as follows:
| | Amount | % of
Class-Level Average
Net Assets(a) |
| Fidelity Series Emerging Markets Fund | | |
| Series Emerging Markets | $5,532,785 | .16 |
| Fidelity Series International Growth Fund | | |
| Series International Growth | 4,735,216 | .16 |
| Fidelity Series International Small Cap Fund | | |
| Series International Small Cap | 1,087,998 | .16 |
| Fidelity Series International Value Fund | | |
| Series International Value | 4,795,784 | .16 |
(a) Annualized
Accounting and Security Lending Fees. Fidelity Service Company, Inc. (FSC), an affiliate of the investment adviser, maintains each Fund's accounting records. The accounting fee is based on the level of average net assets for each month. Under a separate contract, FSC administers the security lending program. The security lending fee is based on the number and duration of lending transactions.
Brokerage Commissions. Certain Funds placed a portion of their portfolio transactions with brokerage firms which are affiliates of the investment adviser. Brokerage commissions are included in net realized gain (loss) and change in net unrealized appreciation (depreciation) in the Statement of Operations. The commissions paid to these affiliated firms were as follows:
| | Amount |
| Fidelity Series Emerging Markets Fund | $43,879 |
| Fidelity Series International Growth Fund | 7,415 |
| Fidelity Series International Small Cap Fund | 1,710 |
| Fidelity Series International Value Fund | 2,974 |
Interfund Lending Program. Pursuant to an Exemptive Order issued by the SEC, the Funds, along with other registered investment companies having management contracts with FMR or other affiliated entities of FMR, may participate in an interfund lending program. This program provides an alternative credit facility allowing the funds to borrow from, or lend money to, other participating affiliated funds. At period end, there were no interfund loans outstanding. Each applicable fund's activity in this program during the period for which loans were outstanding was as follows:
| | Borrower or Lender | Average Loan Balance | Weighted Average Interest Rate | Interest Expense |
| Fidelity Series International Value Fund | Borrower | $9,476,000 | .83% | $659 |
Interfund Trades. The Funds may purchase from or sell securities to other Fidelity Funds under procedures adopted by the Board. The procedures have been designed to ensure these interfund trades are executed in accordance with Rule 17a-7 of the 1940 Act. Interfund trades are included within the respective purchases and sales amounts shown in the Purchases and Sales of Investments note.
7. Committed Line of Credit.
Certain Funds participate with other funds managed by the investment adviser or an affiliate in a $4.25 billion credit facility (the "line of credit") to be utilized for temporary or emergency purposes to fund shareholder redemptions or for other short-term liquidity purposes. The participating funds have agreed to pay commitment fees on their pro-rata portion of the line of credit, which are reflected in Miscellaneous expenses on the Statement of Operations, and are as follows:
| Fidelity Series Emerging Markets Fund | $26,230 |
| Fidelity Series International Growth Fund | 22,375 |
| Fidelity Series International Small Cap Fund | 5,153 |
| Fidelity Series International Value Fund | 22,689 |
During the period, the Funds did not borrow on this line of credit.
8. Security Lending.
Certain Funds lend portfolio securities through a lending agent from time to time in order to earn additional income. For equity securities, a lending agent is used and may loan securities to certain qualified borrowers, including Fidelity Capital Markets (FCM), a broker-dealer affiliated with the Funds. On the settlement date of the loan, each applicable Fund receives collateral (in the form of U.S. Treasury obligations, letters of credit and/or cash) against the loaned securities and maintains collateral in an amount not less than 100% of the market value of the loaned securities during the period of the loan. The market value of the loaned securities is determined at the close of business of the Funds and any additional required collateral is delivered to the Funds on the next business day. The Funds or borrower may terminate the loan at any time, and if the borrower defaults on its obligation to return the securities loaned because of insolvency or other reasons, the Funds may apply collateral received from the borrower against the obligation. The Funds may experience delays and costs in recovering the securities loaned. Any cash collateral received is invested in the Fidelity Securities Lending Cash Central Fund. The value of loaned securities and cash collateral at period end are disclosed on each applicable Fund's Statement of Assets and Liabilities. At period end, there were no security loans outstanding with FCM. Security lending income represents the income earned on investing cash collateral, less rebates paid to borrowers and any lending agent fees associated with the loan, plus any premium payments received for lending certain types of securities. Security lending income is presented on each applicable Fund's Statement of Operations as a component of income from Fidelity Central Funds. FCM security lending activity was as follows:
| | Total Security Lending Income | Security Lending Income From Securities Loaned to FCM |
| Fidelity Series Emerging Markets Fund | $675,139 | $8,608 |
| Fidelity Series International Growth Fund | 885,455 | 22 |
| Fidelity Series International Small Cap Fund | 564,060 | 129 |
| Fidelity Series International Value Fund | 3,472,312 | – |
9. Expense Reductions.
Commissions paid to certain brokers with whom the investment adviser, or its affiliates, places trades on behalf of Certain Funds include an amount in addition to trade execution, which may be rebated back to the Funds to offset certain expenses. In addition, through arrangements with each applicable Fund's custodian, credits realized as a result of certain uninvested cash balances were used to reduce the Fund's expenses. All of the applicable expense reductions are noted in the table below.
| | Brokerage Service reduction | Custody
expense
reduction |
| Fidelity Series Emerging Markets Fund | $1,277,205 | $– |
| Fidelity Series International Growth Fund | 529,075 | 272 |
| Fidelity Series International Small Cap Fund | 115,891 | – |
| Fidelity Series International Value Fund | 853,368 | 256 |
In addition, during the period the investment adviser reimbursed and/or waived a portion of fund-level operating expenses as follows:
| | Fund-Level Amount |
| Fidelity Series Emerging Markets Fund | $67,061 |
| Fidelity Series International Growth Fund | 58,931 |
| Fidelity Series International Small Cap Fund | 13,558 |
| Fidelity Series International Value Fund | 60,447 |
Effective June 1, 2017, the investment adviser will contractually reimburse expenses of each class of each Fund to the extent annual operating expenses exceed .014% of class-level average net assets. Fees and expenses of the independent Trustees and certain miscellaneous expenses such as proxy and shareholder meeting expenses will be excluded from this reimbursement.
10. Distributions to Shareholders.
Distributions to shareholders of each class were as follows:
| | Six months ended
April 30, 2017 | Year ended
October 31, 2016 |
| Fidelity Series Emerging Markets Fund | | |
| From net investment income | | |
| Series Emerging Markets | $82,269,688 | $69,080,205 |
| Class F | 111,268,765 | 89,259,659 |
| Total | $193,538,453 | $158,339,864 |
| From net realized gain | | |
| Series Emerging Markets | $15,266,540 | $– |
| Class F | 18,374,659 | – |
| Total | $33,641,199 | $– |
| Fidelity Series International Growth Fund | | |
| From net investment income | | |
| Series International Growth | $71,631,335 | $60,262,280 |
| Class F | 98,778,795 | 81,155,271 |
| Total | $170,410,130 | $141,417,551 |
| From net realized gain | | |
| Series International Growth | $74,784,915 | $125,932,714 |
| Class F | $91,604,916 | $146,169,162 |
| Total | $166,389,831 | $272,101,876 |
| Fidelity Series International Small Cap Fund | | |
| From net investment income | | |
| Series International Small Cap | $14,167,288 | $11,493,851 |
| Class F | 19,989,904 | 15,865,887 |
| Total | $34,157,192 | $27,359,738 |
| From net realized gain | | |
| Series International Small Cap | $38,362,071 | $75,296,455 |
| Class F | 47,094,859 | 87,307,708 |
| Total | $85,456,930 | $162,604,163 |
| Fidelity Series International Value Fund | | |
| From net investment income | | |
| Series International Value | $143,191,242 | $113,519,073 |
| Class F | 186,385,696 | 143,406,508 |
| Total | $329,576,938 | $256,925,581 |
| From net realized gain | | |
| Series International Value | $10,915,924 | $– |
| Class F | 13,369,438 | – |
| Total | $24,285,362 | $– |
11. Share Transactions.
Transactions for each class of shares were as follows:
| | Shares | Shares | Dollars | Dollars |
| | Six months ended April 30, 2017 | Year ended October 31, 2016 | Six months ended April 30, 2017 | Year ended October 31, 2016 |
| Fidelity Series Emerging Markets Fund | | | | |
| Series Emerging Markets | | | | |
| Shares sold | 23,019,174 | 86,255,737 | $376,630,569 | $1,225,904,043 |
| Reinvestment of distributions | 6,260,348 | 4,686,581 | 97,536,228 | 69,080,205 |
| Shares redeemed | (40,996,728) | (38,072,375) | (697,841,022) | (572,922,905) |
| Net increase (decrease) | (11,717,206) | 52,869,943 | $(223,674,225) | $722,061,343 |
| Class F | | | | |
| Shares sold | 35,629,205 | 121,860,800 | $595,747,931 | $1,759,396,538 |
| Reinvestment of distributions | 8,299,835 | 6,043,308 | 129,643,424 | 89,259,659 |
| Shares redeemed | (61,781,843) | (38,417,155) | $(1,049,191,171) | $(573,269,735) |
| Net increase (decrease) | (17,852,803) | 89,486,953 | $(323,799,816) | $1,275,386,462 |
| Fidelity Series International Growth Fund | | | | |
| Series International Growth | | | | |
| Shares sold | 48,105,135 | 71,557,147 | $631,808,276 | $950,043,740 |
| Reinvestment of distributions | 11,528,839 | 13,492,391 | 146,416,250 | 186,194,994 |
| Shares redeemed | (30,125,959) | (54,629,273) | (403,216,408) | (742,386,563) |
| Net increase (decrease) | 29,508,015 | 30,420,265 | $375,008,118 | $393,852,171 |
| Class F | | | | |
| Shares sold | 68,288,654 | 111,047,353 | $905,206,415 | $1,484,673,797 |
| Reinvestment of distributions | 14,967,273 | 16,448,946 | 190,383,711 | 227,324,433 |
| Shares redeemed | (49,955,358) | (63,260,483) | (668,221,521) | (857,491,411) |
| Net increase (decrease) | 33,300,569 | 64,235,816 | $427,368,605 | $854,506,819 |
| Fidelity Series International Small Cap Fund | | | | |
| Series International Small Cap | | | | |
| Shares sold | 8,907,477 | 13,970,665 | $130,670,811 | $203,844,367 |
| Reinvestment of distributions | 3,725,486 | 5,687,438 | 52,529,359 | 86,790,306 |
| Shares redeemed | (6,064,940) | (12,099,806) | (90,119,953) | (183,237,403) |
| Net increase (decrease) | 6,568,023 | 7,558,297 | $93,080,217 | $107,397,270 |
| Class F | | | | |
| Shares sold | 12,973,088 | 21,616,390 | $191,738,336 | $317,805,284 |
| Reinvestment of distributions | 4,751,046 | 6,752,199 | 67,084,763 | 103,173,595 |
| Shares redeemed | (10,195,872) | (13,495,964) | (151,028,549) | (204,013,287) |
| Net increase (decrease) | 7,528,262 | 14,872,625 | $107,794,550 | $216,965,592 |
| Fidelity Series International Value Fund | | | | |
| Series International Value | | | | |
| Shares sold | 47,056,413 | 127,074,626 | $438,058,980 | $1,158,126,260 |
| Reinvestment of distributions | 16,805,580 | 11,715,075 | 154,107,166 | 113,519,073 |
| Shares redeemed | (36,187,879) | (76,426,474) | (339,583,787) | (713,679,690) |
| Net increase (decrease) | 27,674,114 | 62,363,227 | $252,582,359 | $557,965,643 |
Class F | | | | |
| Shares sold | 71,044,637 | 189,019,529 | $665,528,102 | $1,732,715,824 |
| Reinvestment of distributions | 21,759,819 | 14,784,176 | 199,755,134 | 143,406,508 |
| Shares redeemed | (63,426,062) | (88,864,488) | (597,565,688) | (828,820,981) |
| Net increase (decrease) | 29,378,394 | 114,939,217 | $267,717,548 | $1,047,301,351 |
12. Other.
The Funds' organizational documents provide former and current trustees and officers with a limited indemnification against liabilities arising in connection with the performance of their duties to the Funds. In the normal course of business, the Funds may also enter into contracts that provide general indemnifications. The Funds' maximum exposure under these arrangements is unknown as this would be dependent on future claims that may be made against the Funds. The risk of material loss from such claims is considered remote.
At the end of the period, mutual funds managed by the investment adviser or its affiliates were the owners of record of all of the outstanding shares of the Funds.
Shareholder Expense Example
As a shareholder of a Fund, you incur two types of costs: (1) transaction costs and (2) ongoing costs, including management fees and other Fund expenses. This Example is intended to help you understand your ongoing costs (in dollars) of investing in the Funds and to compare these costs with the ongoing costs of investing in other mutual funds.
The Example is based on an investment of $1,000 invested at the beginning of the period and held for the entire period (November 1, 2016 to April 30, 2017).
Actual Expenses
The first line of the accompanying table for each Class of each fund provides information about actual account values and actual expenses. You may use the information in this line, together with the amount you invested, to estimate the expenses that you paid over the period. Simply divide your account value by $1,000.00 (for example, an $8,600 account value divided by $1,000.00 = 8.6), then multiply the result by the number in the first line for a Class of the fund under the heading entitled "Expenses Paid During Period" to estimate the expenses you paid on your account during this period. In addition, each Fund, as a shareholder in the underlying Fidelity Central Funds, will indirectly bear its pro-rata share of the fees and expenses incurred by the underlying Fidelity Central Funds. These fees and expenses are not included in the Fund's annualized expense ratio used to calculate the expense estimate in the table below.
Hypothetical Example for Comparison Purposes
The second line of the accompanying table for each Class of each fund provides information about hypothetical account values and hypothetical expenses based on a Class' actual expense ratio and an assumed rate of return of 5% per year before expenses, which is not the Class' actual return. The hypothetical account values and expenses may not be used to estimate the actual ending account balance or expenses you paid for the period. You may use this information to compare the ongoing costs of investing in the Fund and other funds. To do so, compare this 5% hypothetical example with the 5% hypothetical examples that appear in the shareholder reports of the other funds. In addition, each Fund, as a shareholder in the underlying Fidelity Central Funds, will indirectly bear its pro-rata share of the fees and expenses incurred by the underlying Fidelity Central Funds. These fees and expenses are not included in the Fund's annualized expense ratio used to calculate the expense estimate in the table below.
Please note that the expenses shown in the table are meant to highlight your ongoing costs only and do not reflect any transaction costs. Therefore, the second line of the table is useful in comparing ongoing costs only, and will not help you determine the relative total costs of owning different funds.
| | Annualized Expense Ratio-A | Beginning
Account Value
November 1, 2016 | Ending
Account Value
April 30, 2017 | Expenses Paid
During Period-B
November 1, 2016
to April 30, 2017 |
| Fidelity Series Emerging Markets Fund | | | | |
| Series Emerging Markets | 1.03% | | | |
| Actual | | $1,000.00 | $1,104.80 | $5.38** |
| Hypothetical-C | | $1,000.00 | $1,019.69 | $5.16** |
| Class F | .87% | | | |
| Actual | | $1,000.00 | $1,106.10 | $4.54** |
| Hypothetical-C | | $1,000.00 | $1,020.48 | $4.36** |
| Fidelity Series International Growth Fund | | | | |
| Series International Growth | .92% | | | |
| Actual | | $1,000.00 | $1,116.10 | $4.83** |
| Hypothetical-C | | $1,000.00 | $1,020.23 | $4.61** |
| Class F | .77% | | | |
| Actual | | $1,000.00 | $1,116.70 | $4.04** |
| Hypothetical-C | | $1,000.00 | $1,020.98 | $3.86** |
| Fidelity Series International Small Cap Fund | | | | |
| Series International Small Cap | 1.02% | | | |
| Actual | | $1,000.00 | $1,118.10 | $5.36** |
| Hypothetical-C | | $1,000.00 | $1,019.74 | $5.11** |
| Class F | .86% | | | |
| Actual | | $1,000.00 | $1,119.60 | $4.52** |
| Hypothetical-C | | $1,000.00 | $1,020.53 | $4.31** |
| Fidelity Series International Value Fund | | | | |
| Series International Value | .86% | | | |
| Actual | | $1,000.00 | $1,103.70 | $4.49** |
| Hypothetical-C | | $1,000.00 | $1,020.53 | $4.31** |
| Class F | .71% | | | |
| Actual | | $1,000.00 | $1,103.90 | $3.70** |
| Hypothetical-C | | $1,000.00 | $1,021.27 | $3.56** |
A Annualized expense ratio reflects expenses net of applicable fee waivers.
B Expenses are equal to each Class' annualized expense ratio, multiplied by the average account value over the period, multiplied by 181/ 365 (to reflect the one-half year period).
C 5% return per year before expenses
** If fees and changes to the class level expense contract and/ or expense cap, effective June 1, 2017, had been in effect during the current period, the annualized expense ratio and the expenses paid in the actual and hypothetical examples above would have been as shown in table below:
| | Annualized Expense Ratio-(a) | Expenses Paid
|
| Fidelity Series Emerging Markets Fund | | |
| Series Emerging Markets | .01% | |
| Actual | | $.05 |
| Hypothetical-(b) | | $.05 |
| Class F | .01% | |
| Actual | | $.05 |
| Hypothetical-(b) | | $.05 |
| Fidelity Series International Growth Fund | | |
| Series International Growth | .01% | |
| Actual | | $.05 |
| Hypothetical-(b) | | $.05 |
| Class F | .01% | |
| Actual | | $.05 |
| Hypothetical-(b) | | $.05 |
| Fidelity Series International Small Cap Fund | | |
| Series International Small Cap | .01% | |
| Actual | | $.05 |
| Hypothetical-(b) | | $.05 |
| Class F | .01% | |
| Actual | | $.05 |
| Hypothetical-(b) | | $.05 |
| Fidelity Series International Value Fund | | |
| Series International Value | .01% | |
| Actual | | $.05 |
| Hypothetical-(b) | | $.05 |
| Class F | .01% | |
| Actual | | $.05 |
| Hypothetical-(b) | | $.05 |
(a) Annualized expense ratio reflects expenses net of applicable fee waivers.
(b) 5% return per year before expenses
GSV-S-SANN-0617
1.907946.107
Fidelity® International Discovery Fund
Class K
Semi-Annual Report April 30, 2017 |
|
Contents
To view a fund's proxy voting guidelines and proxy voting record for the 12-month period ended June 30, visit http://www.fidelity.com/proxyvotingresults or visit the Securities and Exchange Commission's (SEC) web site at http://www.sec.gov.
You may also call 1-800-835-5092 to request a free copy of the proxy voting guidelines.
Standard & Poor's, S&P and S&P 500 are registered service marks of The McGraw-Hill Companies, Inc. and have been licensed for use by Fidelity Distributors Corporation.
Other third-party marks appearing herein are the property of their respective owners.
All other marks appearing herein are registered or unregistered trademarks or service marks of FMR LLC or an affiliated company. © 2017 FMR LLC. All rights reserved.
This report and the financial statements contained herein are submitted for the general information of the shareholders of the Fund. This report is not authorized for distribution to prospective investors in the Fund unless preceded or accompanied by an effective prospectus.
A fund files its complete schedule of portfolio holdings with the SEC for the first and third quarters of each fiscal year on Form N-Q. Forms N-Q are available on the SEC’s web site at http://www.sec.gov. A fund's Forms N-Q may be reviewed and copied at the SEC’s Public Reference Room in Washington, DC. Information regarding the operation of the SEC's Public Reference Room may be obtained by calling 1-800-SEC-0330.
For a complete list of a fund's portfolio holdings, view the most recent holdings listing, semiannual report, or annual report on Fidelity's web site at http://www.fidelity.com, http://www.institutional.fidelity.com, or http://www.401k.com, as applicable.
NOT FDIC INSURED •MAY LOSE VALUE •NO BANK GUARANTEE
Neither the Fund nor Fidelity Distributors Corporation is a bank.
Investment Summary (Unaudited)
Geographic Diversification (% of fund's net assets)
| As of April 30, 2017 |
| | Japan | 17.6% |
| | United Kingdom | 15.4% |
| | France | 8.6% |
| | Switzerland | 5.8% |
| | Netherlands | 5.7% |
| | Germany | 5.7% |
| | Sweden | 4.2% |
| | Spain | 4.1% |
| | United States of America* | 3.4% |
| | Other | 29.5% |

| As of October 31, 2016 |
| | Japan | 18.7% |
| | United Kingdom | 13.2% |
| | France | 9.3% |
| | Germany | 8.2% |
| | Netherlands | 4.8% |
| | United States of America* | 4.5% |
| | Switzerland | 4.2% |
| | Hong Kong | 3.6% |
| | Sweden | 3.5% |
| | Other | 30.0% |

* Includes Short-Term investments and Net Other Assets (Liabilities).
Percentages are based on country or territory of incorporation and are adjusted for the effect of futures contracts, if applicable.
Asset Allocation as of April 30, 2017
| | % of fund's net assets | % of fund's net assets 6 months ago |
| Stocks and Equity Futures | 98.3 | 98.8 |
| Short-Term Investments and Net Other Assets (Liabilities) | 1.7 | 1.2 |
Top Ten Stocks as of April 30, 2017
| | % of fund's net assets | % of fund's net assets 6 months ago |
| Total SA (France, Oil, Gas & Consumable Fuels) | 2.1 | 2.1 |
| SAP AG (Germany, Software) | 1.7 | 1.7 |
| Micro Focus International PLC (United Kingdom, Software) | 1.4 | 1.1 |
| Statoil ASA (Norway, Oil, Gas & Consumable Fuels) | 1.3 | 1.5 |
| Unilever NV (Certificaten Van Aandelen) (Bearer) (Netherlands, Personal Products) | 1.2 | 1.6 |
| Koninklijke Philips Electronics NV (Netherlands, Industrial Conglomerates) | 1.2 | 0.6 |
| Naspers Ltd. Class N (South Africa, Media) | 1.2 | 1.2 |
| Housing Development Finance Corp. Ltd. (India, Thrifts & Mortgage Finance) | 1.2 | 1.2 |
| British American Tobacco PLC (United Kingdom, Tobacco) | 1.2 | 0.8 |
| ORIX Corp. (Japan, Diversified Financial Services) | 1.1 | 1.3 |
| | 13.6 | |
Top Market Sectors as of April 30, 2017
| | % of fund's net assets | % of fund's net assets 6 months ago |
| Financials | 20.8 | 20.8 |
| Industrials | 16.4 | 14.6 |
| Consumer Discretionary | 13.9 | 13.8 |
| Information Technology | 13.3 | 11.7 |
| Consumer Staples | 10.0 | 12.9 |
| Health Care | 7.7 | 8.2 |
| Materials | 6.2 | 5.4 |
| Energy | 4.8 | 4.7 |
| Telecommunication Services | 2.8 | 2.7 |
| Real Estate | 1.1 | 1.9 |
Investments April 30, 2017 (Unaudited)
Showing Percentage of Net Assets
| Common Stocks - 97.5% | | | |
| | | Shares | Value (000s) |
| Australia - 2.3% | | | |
| Altium Ltd. | | 1,569,213 | $9,635 |
| Australia & New Zealand Banking Group Ltd. | | 2,511,358 | 61,605 |
| Bapcor Ltd. | | 8,624,274 | 33,775 |
| Magellan Financial Group Ltd. | | 1,204,177 | 21,262 |
| Ramsay Health Care Ltd. | | 1,008,165 | 54,127 |
| Spark Infrastructure Group unit | | 19,012,123 | 35,448 |
|
| TOTAL AUSTRALIA | | | 215,852 |
|
| Austria - 1.0% | | | |
| Erste Group Bank AG | | 1,271,400 | 45,454 |
| Wienerberger AG | | 2,092,000 | 48,995 |
|
| TOTAL AUSTRIA | | | 94,449 |
|
| Bailiwick of Jersey - 1.8% | | | |
| Glencore Xstrata PLC | | 16,946,469 | 66,648 |
| IWG PLC | | 6,386,188 | 26,874 |
| Randgold Resources Ltd. sponsored ADR | | 189,614 | 16,684 |
| Shire PLC | | 552,000 | 32,545 |
| Wolseley PLC | | 503,038 | 31,972 |
|
| TOTAL BAILIWICK OF JERSEY | | | 174,723 |
|
| Belgium - 1.5% | | | |
| Anheuser-Busch InBev SA NV | | 425,227 | 47,953 |
| KBC Groep NV | | 1,303,959 | 94,144 |
|
| TOTAL BELGIUM | | | 142,097 |
|
| Canada - 2.0% | | | |
| Alimentation Couche-Tard, Inc. Class B (sub. vtg.) | | 725,100 | 33,348 |
| Cenovus Energy, Inc. | | 3,404,200 | 33,941 |
| Constellation Software, Inc. | | 95,200 | 43,541 |
| Franco-Nevada Corp. | | 227,700 | 15,511 |
| PrairieSky Royalty Ltd. (a) | | 1,810,573 | 39,460 |
| Suncor Energy, Inc. | | 676,200 | 21,192 |
|
| TOTAL CANADA | | | 186,993 |
|
| Cayman Islands - 2.2% | | | |
| Alibaba Group Holding Ltd. sponsored ADR (b) | | 417,200 | 48,187 |
| Ctrip.com International Ltd. ADR (b) | | 254,000 | 12,830 |
| JD.com, Inc. sponsored ADR (b) | | 1,261,000 | 44,223 |
| Melco Crown Entertainment Ltd. sponsored ADR | | 1,338,700 | 29,384 |
| New Oriental Education & Technology Group, Inc. sponsored ADR (b) | | 1,085,900 | 70,084 |
|
| TOTAL CAYMAN ISLANDS | | | 204,708 |
|
| China - 1.1% | | | |
| Kweichow Moutai Co. Ltd. (A Shares) | | 623,582 | 37,403 |
| Shanghai International Airport Co. Ltd. (A Shares) | | 5,861,900 | 29,125 |
| Wuliangye Yibin Co. Ltd. Class A | | 5,202,900 | 34,341 |
|
| TOTAL CHINA | | | 100,869 |
|
| Denmark - 1.0% | | | |
| Nets A/S (c) | | 1,621,800 | 29,499 |
| Novo Nordisk A/S Series B | | 991,645 | 38,612 |
| Novozymes A/S Series B | | 595,300 | 25,719 |
|
| TOTAL DENMARK | | | 93,830 |
|
| Finland - 0.5% | | | |
| Sampo Oyj (A Shares) (a) | | 934,600 | 44,784 |
| France - 8.6% | | | |
| ALTEN | | 336,259 | 28,497 |
| Altran Technologies SA | | 1,492,300 | 25,050 |
| Amundi SA | | 967,958 | 63,686 |
| Atos Origin SA | | 181,865 | 23,832 |
| AXA SA | | 1,278,800 | 34,119 |
| BNP Paribas SA | | 778,100 | 54,907 |
| Capgemini SA | | 395,600 | 39,608 |
| Cegedim SA (b) | | 536,390 | 14,923 |
| Havas SA | | 4,515,981 | 41,760 |
| Kaufman & Broad SA | | 235,300 | 9,227 |
| Maisons du Monde SA | | 1,122,200 | 38,946 |
| Rexel SA | | 1,540,100 | 27,513 |
| Rubis | | 373,700 | 37,972 |
| Societe Generale Series A | | 814,400 | 44,656 |
| Sodexo SA | | 388,500 | 49,387 |
| Total SA (a) | | 3,804,504 | 195,290 |
| VINCI SA (a) | | 961,800 | 81,982 |
|
| TOTAL FRANCE | | | 811,355 |
|
| Germany - 5.7% | | | |
| adidas AG | | 252,900 | 50,662 |
| Aumann AG | | 68,000 | 4,472 |
| Axel Springer Verlag AG | | 604,902 | 33,941 |
| Deutsche Borse AG | | 164,581 | 16,108 |
| Deutsche Post AG | | 1,743,413 | 62,665 |
| Deutsche Telekom AG | | 1,845,500 | 32,372 |
| Fresenius SE & Co. KGaA | | 440,400 | 35,697 |
| Henkel AG & Co. KGaA | | 342,700 | 39,999 |
| Nexus AG | | 614,500 | 14,793 |
| Rational AG | | 92,205 | 46,332 |
| SAP AG | | 1,627,467 | 163,017 |
| Wirecard AG (a) | | 594,600 | 35,112 |
|
| TOTAL GERMANY | | | 535,170 |
|
| Hong Kong - 1.1% | | | |
| AIA Group Ltd. | | 9,308,600 | 64,444 |
| Techtronic Industries Co. Ltd. | | 10,282,000 | 44,151 |
|
| TOTAL HONG KONG | | | 108,595 |
|
| India - 2.9% | | | |
| Avenue Supermarts Ltd. | | 595,148 | 6,818 |
| Bharti Infratel Ltd. | | 10,548,301 | 58,197 |
| HDFC Bank Ltd. | | 1,034,409 | 25,252 |
| HDFC Bank Ltd. sponsored ADR | | 965,784 | 76,886 |
| Housing Development Finance Corp. Ltd. | | 4,692,201 | 112,189 |
|
| TOTAL INDIA | | | 279,342 |
|
| Indonesia - 0.6% | | | |
| PT Bank Central Asia Tbk | | 16,688,600 | 22,224 |
| PT Bank Rakyat Indonesia Tbk | | 32,624,300 | 31,574 |
|
| TOTAL INDONESIA | | | 53,798 |
|
| Ireland - 2.7% | | | |
| Cairn Homes PLC (b) | | 17,549,270 | 29,917 |
| CRH PLC | | 2,144,300 | 78,104 |
| DCC PLC (United Kingdom) | | 244,251 | 22,556 |
| Green REIT PLC | | 9,492,200 | 14,114 |
| James Hardie Industries PLC CDI | | 1,790,532 | 30,395 |
| Kerry Group PLC Class A | | 574,300 | 46,931 |
| Ryanair Holdings PLC sponsored ADR (b) | | 319,377 | 29,360 |
|
| TOTAL IRELAND | | | 251,377 |
|
| Isle of Man - 0.7% | | | |
| Paysafe Group PLC (b) | | 10,565,025 | 62,111 |
| Israel - 0.6% | | | |
| Frutarom Industries Ltd. | | 893,500 | 52,523 |
| Italy - 0.6% | | | |
| De Longhi SpA | | 734,500 | 22,403 |
| Intesa Sanpaolo SpA | | 12,757,000 | 37,239 |
|
| TOTAL ITALY | | | 59,642 |
|
| Japan - 17.1% | | | |
| ACOM Co. Ltd. (b) | | 2,209,000 | 9,809 |
| Aozora Bank Ltd. | | 8,893,000 | 32,389 |
| Daito Trust Construction Co. Ltd. | | 246,600 | 36,279 |
| Dentsu, Inc. | | 1,086,800 | 61,225 |
| Hoya Corp. | | 1,473,700 | 70,383 |
| KDDI Corp. | | 3,926,700 | 104,113 |
| Keyence Corp. | | 197,720 | 79,460 |
| Komatsu Ltd. | | 1,614,100 | 43,131 |
| Misumi Group, Inc. | | 2,754,800 | 52,168 |
| Mitsubishi UFJ Financial Group, Inc. | | 13,391,800 | 84,858 |
| Monex Group, Inc. | | 12,015,949 | 30,074 |
| Morinaga & Co. Ltd. | | 578,200 | 27,335 |
| Nidec Corp. | | 324,300 | 29,732 |
| Nintendo Co. Ltd. | | 122,200 | 30,925 |
| Nitori Holdings Co. Ltd. | | 382,300 | 49,762 |
| Olympus Corp. | | 2,085,300 | 80,251 |
| OMRON Corp. | | 920,100 | 38,504 |
| ORIX Corp. | | 7,007,900 | 106,934 |
| Panasonic Corp. | | 4,045,000 | 48,371 |
| Recruit Holdings Co. Ltd. | | 1,435,300 | 72,489 |
| Relo Holdings Corp. | | 1,784,000 | 29,287 |
| Shionogi & Co. Ltd. | | 617,700 | 31,767 |
| SMC Corp. | | 139,300 | 39,225 |
| SMS Co., Ltd. | | 1,148,500 | 30,568 |
| SoftBank Corp. | | 820,400 | 62,230 |
| Sony Corp. | | 2,984,900 | 102,425 |
| Start Today Co. Ltd. | | 2,494,700 | 53,262 |
| Sundrug Co. Ltd. | | 1,146,800 | 40,224 |
| Tsuruha Holdings, Inc. | | 557,800 | 56,543 |
| VT Holdings Co. Ltd. | | 3,872,500 | 19,697 |
| Welcia Holdings Co. Ltd. | | 1,934,800 | 62,309 |
|
| TOTAL JAPAN | | | 1,615,729 |
|
| Luxembourg - 0.7% | | | |
| Eurofins Scientific SA | | 144,039 | 70,935 |
| Marshall Islands - 0.2% | | | |
| Hoegh LNG Partners LP | | 715,655 | 14,492 |
| Netherlands - 5.7% | | | |
| ASML Holding NV (Netherlands) | | 632,000 | 83,542 |
| Basic-Fit NV | | 579,100 | 10,125 |
| IMCD Group BV | | 1,603,400 | 86,369 |
| ING Groep NV (Certificaten Van Aandelen) | | 4,886,500 | 79,648 |
| Intertrust NV | | 1,544,800 | 30,963 |
| Koninklijke Philips Electronics NV | | 3,314,100 | 114,444 |
| Takeaway.com Holding BV (c) | | 378,700 | 12,755 |
| Unilever NV (Certificaten Van Aandelen) (Bearer) | | 2,238,000 | 117,239 |
| Van Lanschot NV (Bearer) | | 223,700 | 6,080 |
|
| TOTAL NETHERLANDS | | | 541,165 |
|
| New Zealand - 0.8% | | | |
| EBOS Group Ltd. | | 3,154,998 | 39,664 |
| Ryman Healthcare Group Ltd. | | 6,562,126 | 38,883 |
|
| TOTAL NEW ZEALAND | | | 78,547 |
|
| Norway - 1.7% | | | |
| Schibsted ASA (A Shares) | | 1,355,900 | 33,716 |
| Statoil ASA (a) | | 7,690,694 | 126,657 |
|
| TOTAL NORWAY | | | 160,373 |
|
| Philippines - 0.3% | | | |
| SM Investments Corp. | | 2,042,375 | 29,647 |
| Romania - 0.3% | | | |
| Banca Transilvania SA | | 37,524,532 | 24,852 |
| South Africa - 1.7% | | | |
| Aspen Pharmacare Holdings Ltd. | | 656,700 | 13,623 |
| EOH Holdings Ltd. | | 3,062,767 | 32,418 |
| Naspers Ltd. Class N | | 598,300 | 113,768 |
|
| TOTAL SOUTH AFRICA | | | 159,809 |
|
| Spain - 4.1% | | | |
| Amadeus IT Holding SA Class A | | 811,000 | 43,729 |
| Atresmedia Corporacion de Medios de Comunicacion SA | | 1,719,200 | 21,593 |
| CaixaBank SA | | 18,486,033 | 83,935 |
| Grifols SA ADR | | 2,404,158 | 52,194 |
| Hispania Activos Inmobiliarios SA | | 1,424,325 | 21,504 |
| Inditex SA | | 1,924,054 | 73,796 |
| Mediaset Espana Comunicacion SA | | 2,836,600 | 39,103 |
| Neinor Homes SLU | | 1,128,700 | 22,260 |
| Prosegur Cash SA | | 12,570,400 | 32,041 |
|
| TOTAL SPAIN | | | 390,155 |
|
| Sweden - 4.2% | | | |
| ASSA ABLOY AB (B Shares) (a) | | 3,095,800 | 67,073 |
| Com Hem Holding AB | | 847,200 | 10,550 |
| HEXPOL AB (B Shares) | | 1,872,700 | 20,815 |
| Indutrade AB | | 1,342,200 | 31,716 |
| Nordea Bank AB | | 4,510,400 | 55,506 |
| Saab AB (B Shares) | | 979,400 | 48,565 |
| Sandvik AB (a) | | 2,729,900 | 43,827 |
| Svenska Cellulosa AB (SCA) (B Shares) | | 2,683,200 | 88,882 |
| Svenska Handelsbanken AB (A Shares) | | 2,492,700 | 35,376 |
|
| TOTAL SWEDEN | | | 402,310 |
|
| Switzerland - 5.8% | | | |
| ABB Ltd. (Reg.) | | 3,714,650 | 91,025 |
| Credit Suisse Group AG | | 2,880,071 | 43,924 |
| Forbo Holding AG (Reg.) | | 13,976 | 22,909 |
| Julius Baer Group Ltd. | | 873,100 | 45,529 |
| Kaba Holding AG (B Shares) (Reg.) | | 41,400 | 35,471 |
| Nestle SA (Reg. S) | | 825,949 | 63,615 |
| Panalpina Welttransport Holding AG (a) | | 286,330 | 37,899 |
| Partners Group Holding AG | | 108,566 | 65,631 |
| Schindler Holding AG (participation certificate) | | 170,348 | 34,806 |
| Syngenta AG (b) | | 120,996 | 56,096 |
| UBS Group AG | | 3,195,750 | 54,601 |
|
| TOTAL SWITZERLAND | | | 551,506 |
|
| Taiwan - 0.9% | | | |
| Largan Precision Co. Ltd. | | 303,000 | 50,278 |
| Taiwan Semiconductor Manufacturing Co. Ltd. | | 5,895,000 | 37,910 |
|
| TOTAL TAIWAN | | | 88,188 |
|
| United Kingdom - 15.4% | | | |
| Aggreko PLC | | 2,825,800 | 32,482 |
| Ascential PLC | | 2,492,536 | 11,390 |
| BAE Systems PLC | | 4,026,900 | 32,706 |
| Barclays PLC | | 13,597,151 | 37,235 |
| BCA Marketplace PLC | | 7,762,300 | 19,756 |
| BHP Billiton PLC | | 4,323,364 | 65,911 |
| Booker Group PLC | | 18,014,400 | 45,265 |
| British American Tobacco PLC: | | | |
| (United Kingdom) | | 1,184,800 | 80,049 |
| sponsored ADR (a) | | 423,000 | 28,781 |
| Bunzl PLC | | 1,636,000 | 51,024 |
| Cineworld Group PLC | | 2,055,200 | 18,740 |
| CMC Markets PLC | | 12,077,600 | 19,632 |
| Compass Group PLC | | 1,891,700 | 38,195 |
| Countryside Properties PLC | | 3,312,793 | 11,576 |
| Dialog Semiconductor PLC (b) | | 585,500 | 27,393 |
| Diploma PLC | | 2,312,600 | 33,218 |
| GlaxoSmithKline PLC | | 3,518,200 | 70,814 |
| Imperial Tobacco Group PLC | | 852,167 | 41,743 |
| Jiangsu Yanghe Brewery JSC Ltd. ELS (HSBC Warrant Program) warrants 9/19/19 (b)(c) | | 2,466,200 | 28,621 |
| John Wood Group PLC | | 2,221,100 | 21,849 |
| LivaNova PLC (b) | | 607,800 | 32,031 |
| London Stock Exchange Group PLC | | 1,262,636 | 55,324 |
| Melrose Industries PLC | | 31,513,724 | 96,531 |
| Micro Focus International PLC | | 3,845,400 | 128,897 |
| Moneysupermarket.com Group PLC | | 5,210,600 | 23,344 |
| NCC Group Ltd. (a) | | 9,151,300 | 16,890 |
| Reckitt Benckiser Group PLC | | 757,300 | 69,776 |
| Rex Bionics PLC (b)(d) | | 1,297,286 | 109 |
| Rio Tinto PLC | | 1,828,100 | 72,119 |
| Senior Engineering Group PLC | | 7,132,100 | 19,805 |
| Softcat PLC | | 4,924,700 | 26,279 |
| Spirax-Sarco Engineering PLC | | 522,100 | 35,164 |
| St. James's Place Capital PLC | | 2,354,900 | 35,015 |
| Standard Chartered PLC (United Kingdom) (b) | | 9,090,621 | 84,915 |
| Zpg PLC | | 8,904,609 | 42,673 |
|
| TOTAL UNITED KINGDOM | | | 1,455,252 |
|
| United States of America - 1.7% | | | |
| Alexion Pharmaceuticals, Inc. (b) | | 280,000 | 35,778 |
| Global Payments, Inc. | | 434,200 | 35,500 |
| Monsanto Co. | | 287,400 | 33,514 |
| MSCI, Inc. | | 503,900 | 50,551 |
| Visa, Inc. Class A | | 102,100 | 9,314 |
|
| TOTAL UNITED STATES OF AMERICA | | | 164,657 |
|
| TOTAL COMMON STOCKS | | | |
| (Cost $7,564,119) | | | 9,219,835 |
|
| Convertible Preferred Stocks - 0.3% | | | |
| Cayman Islands - 0.3% | | | |
| China Internet Plus Holdings Ltd. Series A-11 (b)(e) | | | |
| (Cost $18,833) | | 5,958,244 | 28,540 |
| | | Principal Amount (000s) | Value (000s) |
|
| Government Obligations - 0.0% | | | |
| United States of America - 0.0% | | | |
| U.S. Treasury Bills, yield at date of purchase 0.67% to 0.76% 6/1/17 to 6/22/17(f) | | | |
| (Cost $1,809) | | 1,810 | 1,809 |
| | | Shares | Value (000s) |
|
| Money Market Funds - 3.4% | | | |
| Fidelity Cash Central Fund, 0.85% (g) | | 116,041,297 | 116,065 |
| Fidelity Securities Lending Cash Central Fund 0.86% (g)(h) | | 210,503,210 | 210,524 |
| TOTAL MONEY MARKET FUNDS | | | |
| (Cost $326,594) | | | 326,589 |
| TOTAL INVESTMENT PORTFOLIO - 101.2% | | | |
| (Cost $7,911,355) | | | 9,576,773 |
| NET OTHER ASSETS (LIABILITIES) - (1.2)% | | | (116,324) |
| NET ASSETS - 100% | | | $9,460,449 |
| Futures Contracts | | | |
| | Expiration Date | Underlying Face Amount at Value (000s) | Unrealized Appreciation/(Depreciation) (000s) |
| Purchased | | | |
| Equity Index Contracts | | | |
| 335 TSE TOPIX Index Contracts (Japan) | June 2017 | 45,979 | $(332) |
The face value of futures purchased as a percentage of Net Assets is .5%
Security Type Abbreviations
ELS - Equity-Linked Security –
Categorizations in the Schedule of Investments are based on country or territory of incorporation.
Legend
(a) Security or a portion of the security is on loan at period end.
(b) Non-income producing
(c) Security exempt from registration under Rule 144A of the Securities Act of 1933. These securities may be resold in transactions exempt from registration, normally to qualified institutional buyers. At the end of the period, the value of these securities amounted to $70,875,000 or 0.7% of net assets.
(d) Affiliated company
(e) Restricted securities - Investment in securities not registered under the Securities Act of 1933 (excluding 144A issues). At the end of the period, the value of restricted securities (excluding 144A issues) amounted to $28,540,000 or 0.3% of net assets.
(f) Security or a portion of the security was pledged to cover margin requirements for futures contracts. At period end, the value of securities pledged amounted to $1,809,000.
(g) Affiliated fund that is generally available only to investment companies and other accounts managed by Fidelity Investments. The rate quoted is the annualized seven-day yield of the fund at period end. A complete unaudited listing of the fund's holdings as of its most recent quarter end is available upon request. In addition, each Fidelity Central Fund's financial statements are available on the SEC's website or upon request.
(h) Investment made with cash collateral received from securities on loan.
Additional information on each restricted holding is as follows:
| Security | Acquisition Date | Acquisition Cost (000s) |
| China Internet Plus Holdings Ltd. Series A-11 | 1/26/15 | $18,833 |
Affiliated Central Funds
Information regarding fiscal year to date income earned by the Fund from investments in Fidelity Central Funds is as follows:
| Fund | Income earned |
| | (Amounts in thousands) |
| Fidelity Cash Central Fund | $474 |
| Fidelity Securities Lending Cash Central Fund | 2,019 |
| Total | $2,493 |
Other Affiliated Issuers
An affiliated company is a company in which the Fund has ownership of at least 5% of the voting securities. Fiscal year to date transactions with companies which are or were affiliates are as follows:
| Affiliate (Amounts in thousands) | Value, beginning of period | Purchases | Sales Proceeds | Dividend Income | Value, end of period |
| Hoegh LNG Partners LP | $12,739 | $-- | $-- | $590 | $-- |
| Rex Bionics PLC | 357 | -- | -- | -- | 109 |
| Total | $13,096 | $-- | $-- | $590 | $109 |
Investment Valuation
The following is a summary of the inputs used, as of April 30, 2017, involving the Fund's assets and liabilities carried at fair value. The inputs or methodology used for valuing securities may not be an indication of the risk associated with investing in those securities. For more information on valuation inputs, and their aggregation into the levels used below, please refer to the Investment Valuation section in the accompanying Notes to Financial Statements.
| | Valuation Inputs at Reporting Date: |
| Description | Total | Level 1 | Level 2 | Level 3 |
| (Amounts in thousands) | | | | |
| Investments in Securities: | | | | |
| Equities: | | | | |
| Consumer Discretionary | $1,330,472 | $999,173 | $302,759 | $28,540 |
| Consumer Staples | 961,736 | 583,104 | 378,632 | -- |
| Energy | 452,881 | 130,934 | 321,947 | -- |
| Financials | 1,953,013 | 1,407,997 | 545,016 | -- |
| Health Care | 727,129 | 585,049 | 142,080 | -- |
| Industrials | 1,552,331 | 1,094,406 | 457,925 | -- |
| Information Technology | 1,245,713 | 974,253 | 271,460 | -- |
| Materials | 583,034 | 366,900 | 216,134 | -- |
| Real Estate | 101,184 | 101,184 | -- | -- |
| Telecommunication Services | 267,462 | 68,747 | 198,715 | -- |
| Utilities | 73,420 | 73,420 | -- | -- |
| Government Obligations | 1,809 | -- | 1,809 | -- |
| Money Market Funds | 326,589 | 326,589 | -- | -- |
| Total Investments in Securities: | $9,576,773 | $6,711,756 | $2,836,477 | $28,540 |
| Derivative Instruments: | | | | |
| Liabilities | | | | |
| Futures Contracts | $(332) | $(332) | $-- | $-- |
| Total Liabilities | $(332) | $(332) | $-- | $-- |
| Total Derivative Instruments: | $(332) | $(332) | $-- | $-- |
The following is a summary of transfers between Level 1 and Level 2 for the period ended April 30, 2017. Transfers are assumed to have occurred at the beginning of the period, and are primarily attributable to the valuation techniques used for foreign equity securities, as discussed in the accompanying Notes to Financial Statements:
| Transfers | Total (000s) |
| (Amounts in thousands) | |
| Level 1 to Level 2 | $613,313 |
| Level 2 to Level 1 | $186,375 |
Value of Derivative Instruments
The following table is a summary of the Fund's value of derivative instruments by primary risk exposure as of April 30, 2017. For additional information on derivative instruments, please refer to the Derivative Instruments section in the accompanying Notes to Financial Statements.
| Primary Risk Exposure / Derivative Type | Value |
| | Asset | Liability |
| (Amounts in thousands) | | |
| Equity Risk | | |
| Futures Contracts(a) | $0 | $(332) |
| Total Equity Risk | 0 | (332) |
| Total Value of Derivatives | $0 | $(332) |
(a) Reflects gross cumulative appreciation (depreciation) on futures contracts as presented in the Schedule of Investments. In the Statement of Assets and Liabilities, the period end daily variation margin is included in receivable or payable for daily variation margin for derivative instruments, and the net cumulative appreciation (depreciation) is included in net unrealized appreciation (depreciation).
See accompanying notes which are an integral part of the financial statements.
Financial Statements
Statement of Assets and Liabilities
| Amounts in thousands (except per-share amounts) | | April 30, 2017 (Unaudited) |
| Assets | | |
Investment in securities, at value (including securities loaned of $198,644) — See accompanying schedule:
Unaffiliated issuers (cost $7,580,820) | $9,250,075 | |
| Fidelity Central Funds (cost $326,594) | 326,589 | |
| Other affiliated issuers (cost $3,941) | 109 | |
| Total Investments (cost $7,911,355) | | $9,576,773 |
| Cash | | 1,328 |
| Foreign currency held at value (cost $139) | | 138 |
| Receivable for investments sold | | 68,391 |
| Receivable for fund shares sold | | 4,781 |
| Dividends receivable | | 39,247 |
| Distributions receivable from Fidelity Central Funds | | 566 |
| Prepaid expenses | | 6 |
| Other receivables | | 4,862 |
| Total assets | | 9,696,092 |
| Liabilities | | |
| Payable for investments purchased | $10,134 | |
| Payable for fund shares redeemed | 6,723 | |
| Accrued management fee | 5,911 | |
| Distribution and service plan fees payable | 81 | |
| Payable for daily variation margin for derivative instruments | 301 | |
| Other affiliated payables | 1,304 | |
| Other payables and accrued expenses | 636 | |
| Collateral on securities loaned | 210,553 | |
| Total liabilities | | 235,643 |
| Net Assets | | $9,460,449 |
| Net Assets consist of: | | |
| Paid in capital | | $7,982,465 |
| Undistributed net investment income | | 39,560 |
| Accumulated undistributed net realized gain (loss) on investments and foreign currency transactions | | (224,753) |
| Net unrealized appreciation (depreciation) on investments and assets and liabilities in foreign currencies | | 1,663,177 |
| Net Assets | | $9,460,449 |
| Calculation of Maximum Offering Price | | |
| Class A: | | |
| Net Asset Value and redemption price per share ($231,623 ÷ 5,643.7 shares) | | $41.04 |
| Maximum offering price per share (100/94.25 of $41.04) | | $43.54 |
| Class M: | | |
| Net Asset Value and redemption price per share ($32,697 ÷ 801.0 shares) | | $40.82 |
| Maximum offering price per share (100/96.50 of $40.82) | | $42.30 |
| Class C: | | |
| Net Asset Value and offering price per share ($25,453 ÷ 627.5 shares)(a) | | $40.56 |
| International Discovery: | | |
| Net Asset Value, offering price and redemption price per share ($6,578,139 ÷ 159,270.9 shares) | | $41.30 |
| Class K: | | |
| Net Asset Value, offering price and redemption price per share ($1,916,593 ÷ 46,511.3 shares) | | $41.21 |
| Class I: | | |
| Net Asset Value, offering price and redemption price per share ($593,899 ÷ 14,413.6 shares) | | $41.20 |
| Class Z: | | |
| Net Asset Value, offering price and redemption price per share ($82,045 ÷ 1,992.4 shares) | | $41.18 |
(a) Redemption price per share is equal to net asset value less any applicable contingent deferred sales charge.
See accompanying notes which are an integral part of the financial statements.
Statement of Operations
| Amounts in thousands | | Six months ended April 30, 2017 (Unaudited) |
| Investment Income | | |
| Dividends (including $590 earned from other affiliated issuers) | | $92,257 |
| Interest | | 7 |
| Income from Fidelity Central Funds | | 2,493 |
| Income before foreign taxes withheld | | 94,757 |
| Less foreign taxes withheld | | (8,456) |
| Total income | | 86,301 |
| Expenses | | |
| Management fee | | |
| Basic fee | $30,315 | |
| Performance adjustment | 94 | |
| Transfer agent fees | 6,986 | |
| Distribution and service plan fees | 488 | |
| Accounting and security lending fees | 877 | |
| Custodian fees and expenses | 645 | |
| Independent trustees' fees and expenses | 19 | |
| Registration fees | 131 | |
| Audit | 66 | |
| Legal | 36 | |
| Miscellaneous | 36 | |
| Total expenses before reductions | 39,693 | |
| Expense reductions | (1,074) | 38,619 |
| Net investment income (loss) | | 47,682 |
| Realized and Unrealized Gain (Loss) | | |
| Net realized gain (loss) on: | | |
| Investment securities: | | |
| Unaffiliated issuers | 405,105 | |
| Fidelity Central Funds | (17) | |
| Foreign currency transactions | (3,861) | |
| Futures contracts | 13,067 | |
| Total net realized gain (loss) | | 414,294 |
Change in net unrealized appreciation (depreciation) on:
Investment securities | 480,137 | |
| Assets and liabilities in foreign currencies | 746 | |
| Futures contracts | (4,118) | |
| Total change in net unrealized appreciation (depreciation) | | 476,765 |
| Net gain (loss) | | 891,059 |
| Net increase (decrease) in net assets resulting from operations | | $938,741 |
See accompanying notes which are an integral part of the financial statements.
Statement of Changes in Net Assets
| Amounts in thousands | Six months ended April 30, 2017 (Unaudited) | Year ended October 31, 2016 |
| Increase (Decrease) in Net Assets | | |
| Operations | | |
| Net investment income (loss) | $47,682 | $162,246 |
| Net realized gain (loss) | 414,294 | (541,847) |
| Change in net unrealized appreciation (depreciation) | 476,765 | (131,024) |
| Net increase (decrease) in net assets resulting from operations | 938,741 | (510,625) |
| Distributions to shareholders from net investment income | (150,174) | (113,434) |
| Distributions to shareholders from net realized gain | (11,939) | (1,362) |
| Total distributions | (162,113) | (114,796) |
| Share transactions - net increase (decrease) | (697,736) | (960,274) |
| Redemption fees | 9 | 70 |
| Total increase (decrease) in net assets | 78,901 | (1,585,625) |
| Net Assets | | |
| Beginning of period | 9,381,548 | 10,967,173 |
| End of period | $9,460,449 | $9,381,548 |
| Other Information | | |
| Undistributed net investment income end of period | $39,560 | $142,052 |
See accompanying notes which are an integral part of the financial statements.
Financial Highlights — Fidelity International Discovery Fund Class A
| | Six months ended (Unaudited) April 30, | Years ended October 31, | | | | |
| | 2017 | 2016 | 2015 | 2014 | 2013 | 2012 |
| Selected Per–Share Data | | | | | | |
| Net asset value, beginning of period | $37.60 | $39.78 | $38.70 | $39.49 | $31.66 | $29.43 |
| Income from Investment Operations | | | | | | |
| Net investment income (loss)A | .13 | .47B | .40C | .53D | .34 | .41 |
| Net realized and unrealized gain (loss) | 3.83 | (2.38) | .79 | (.67) | 7.97 | 2.11 |
| Total from investment operations | 3.96 | (1.91) | 1.19 | (.14) | 8.31 | 2.52 |
| Distributions from net investment income | (.47) | (.27) | (.11) | (.33) | (.45) | (.29) |
| Distributions from net realized gain | (.05) | (.01) | – | (.31) | (.03) | – |
| Total distributions | (.52) | (.27)E | (.11) | (.65)F | (.48) | (.29) |
| Redemption fees added to paid in capitalA,G | – | – | – | – | – | – |
| Net asset value, end of period | $41.04 | $37.60 | $39.78 | $38.70 | $39.49 | $31.66 |
| Total ReturnH,I,J | 10.71% | (4.83)% | 3.09% | (.36)% | 26.59% | 8.70% |
| Ratios to Average Net AssetsK,L | | | | | | |
| Expenses before reductions | 1.24%M | 1.35% | 1.33% | 1.28% | 1.35% | 1.34% |
| Expenses net of fee waivers, if any | 1.24%M | 1.35% | 1.33% | 1.28% | 1.35% | 1.34% |
| Expenses net of all reductions | 1.22%M | 1.34% | 1.32% | 1.28% | 1.33% | 1.31% |
| Net investment income (loss) | .69%M | 1.26%B | 1.00%C | 1.35%D | .97% | 1.41% |
| Supplemental Data | | | | | | |
| Net assets, end of period (in millions) | $232 | $236 | $283 | $297 | $347 | $299 |
| Portfolio turnover rateN | 43%M | 50%O | 60%O | 57% | 65% | 68% |
A Calculated based on average shares outstanding during the period.
B Net Investment income per share reflects a large, non-recurring dividend which amounted to $.14 per share. Excluding this non-recurring dividend, the ratio of net investment income (loss) to average net assets would have been .88%.
C Net Investment income per share reflects a large, non-recurring dividend which amounted to $.12 per share. Excluding this non-recurring dividend, the ratio of net investment income (loss) to average net assets would have been .69%.
D Net Investment income per share reflects a large, non-recurring dividend which amounted to $.22 per share. Excluding this non-recurring dividend, the ratio of net investment income (loss) to average net assets would have been .80%.
E Total distributions of $.27 per share is comprised of distributions from net investment income of $.269 and distributions from net realized gain of $.005 per share.
F Total distributions of $.65 per share is comprised of distributions from net investment income of $.334 and distributions from net realized gain of $.311 per share.
G Amount represents less than $.005 per share.
H Total returns for periods of less than one year are not annualized.
I Total returns would have been lower if certain expenses had not been reduced during the applicable periods shown.
J Total returns do not include the effect of the sales charges.
K Fees and expenses of any underlying Fidelity Central Funds are not included in the Fund's expense ratio. The Fund indirectly bears its proportionate share of the expenses of any underlying Fidelity Central Funds.
L Expense ratios reflect operating expenses of the class. Expenses before reductions do not reflect amounts reimbursed by the investment adviser or reductions from brokerage service arrangements or reductions from other expense offset arrangements and do not represent the amount paid by the class during periods when reimbursements or reductions occur. Expenses net of fee waivers reflect expenses after reimbursement by the investment adviser but prior to reductions from brokerage service arrangements or other expense offset arrangements. Expenses net of all reductions represent the net expenses paid by the class.
M Annualized
N Amount does not include the portfolio activity of any underlying Fidelity Central Funds.
O Portfolio turnover rate excludes securities received or delivered in-kind.
See accompanying notes which are an integral part of the financial statements.
Financial Highlights — Fidelity International Discovery Fund Class M
| | Six months ended (Unaudited) April 30, | Years ended October 31, | | | | |
| | 2017 | 2016 | 2015 | 2014 | 2013 | 2012 |
| Selected Per–Share Data | | | | | | |
| Net asset value, beginning of period | $37.34 | $39.51 | $38.43 | $39.23 | $31.42 | $29.18 |
| Income from Investment Operations | | | | | | |
| Net investment income (loss)A | .09 | .38B | .30C | .44D | .26 | .34 |
| Net realized and unrealized gain (loss) | 3.81 | (2.37) | .80 | (.68) | 7.92 | 2.09 |
| Total from investment operations | 3.90 | (1.99) | 1.10 | (.24) | 8.18 | 2.43 |
| Distributions from net investment income | (.37) | (.17) | (.02) | (.25) | (.34) | (.19) |
| Distributions from net realized gain | (.05) | (.01) | – | (.31) | (.03) | – |
| Total distributions | (.42) | (.18) | (.02) | (.56) | (.37) | (.19) |
| Redemption fees added to paid in capitalA,E | – | – | – | – | – | – |
| Net asset value, end of period | $40.82 | $37.34 | $39.51 | $38.43 | $39.23 | $31.42 |
| Total ReturnF,G,H | 10.58% | (5.07)% | 2.86% | (.60)% | 26.31% | 8.41% |
| Ratios to Average Net AssetsI,J | | | | | | |
| Expenses before reductions | 1.48%K | 1.58% | 1.57% | 1.51% | 1.59% | 1.59% |
| Expenses net of fee waivers, if any | 1.48%K | 1.58% | 1.57% | 1.51% | 1.59% | 1.59% |
| Expenses net of all reductions | 1.46%K | 1.57% | 1.56% | 1.51% | 1.57% | 1.56% |
| Net investment income (loss) | .45%K | 1.02%B | .76%C | 1.11%D | .73% | 1.16% |
| Supplemental Data | | | | | | |
| Net assets, end of period (in millions) | $33 | $35 | $43 | $49 | $53 | $46 |
| Portfolio turnover rateL | 43%K | 50%M | 60%M | 57% | 65% | 68% |
A Calculated based on average shares outstanding during the period.
B Net Investment income per share reflects a large, non-recurring dividend which amounted to $.14 per share. Excluding this non-recurring dividend, the ratio of net investment income (loss) to average net assets would have been .64%.
C Net Investment income per share reflects a large, non-recurring dividend which amounted to $.12 per share. Excluding this non-recurring dividend, the ratio of net investment income (loss) to average net assets would have been .45%.
D Net Investment income per share reflects a large, non-recurring dividend which amounted to $.21 per share. Excluding this non-recurring dividend, the ratio of net investment income (loss) to average net assets would have been .56%.
E Amount represents less than $.005 per share.
F Total returns for periods of less than one year are not annualized.
G Total returns would have been lower if certain expenses had not been reduced during the applicable periods shown.
H Total returns do not include the effect of the sales charges.
I Fees and expenses of any underlying Fidelity Central Funds are not included in the Fund's expense ratio. The Fund indirectly bears its proportionate share of the expenses of any underlying Fidelity Central Funds.
J Expense ratios reflect operating expenses of the class. Expenses before reductions do not reflect amounts reimbursed by the investment adviser or reductions from brokerage service arrangements or reductions from other expense offset arrangements and do not represent the amount paid by the class during periods when reimbursements or reductions occur. Expenses net of fee waivers reflect expenses after reimbursement by the investment adviser but prior to reductions from brokerage service arrangements or other expense offset arrangements. Expenses net of all reductions represent the net expenses paid by the class.
K Annualized
L Amount does not include the portfolio activity of any underlying Fidelity Central Funds.
M Portfolio turnover rate excludes securities received or delivered in-kind.
See accompanying notes which are an integral part of the financial statements.
Financial Highlights — Fidelity International Discovery Fund Class C
| | Six months ended (Unaudited) April 30, | Years ended October 31, | | | | |
| | 2017 | 2016 | 2015 | 2014 | 2013 | 2012 |
| Selected Per–Share Data | | | | | | |
| Net asset value, beginning of period | $36.96 | $39.14 | $38.25 | $39.07 | $31.32 | $29.08 |
| Income from Investment Operations | | | | | | |
| Net investment income (loss)A | (.01) | .19B | .10C | .23D | .08 | .19 |
| Net realized and unrealized gain (loss) | 3.79 | (2.37) | .79 | (.66) | 7.90 | 2.09 |
| Total from investment operations | 3.78 | (2.18) | .89 | (.43) | 7.98 | 2.28 |
| Distributions from net investment income | (.13) | – | – | (.08) | (.20) | (.04) |
| Distributions from net realized gain | (.05) | – | – | (.31) | (.03) | – |
| Total distributions | (.18) | – | – | (.39) | (.23) | (.04) |
| Redemption fees added to paid in capitalA,E | – | – | – | – | – | – |
| Net asset value, end of period | $40.56 | $36.96 | $39.14 | $38.25 | $39.07 | $31.32 |
| Total ReturnF,G,H | 10.30% | (5.57)% | 2.33% | (1.10)% | 25.65% | 7.86% |
| Ratios to Average Net AssetsI,J | | | | | | |
| Expenses before reductions | 2.00%K | 2.10% | 2.09% | 2.03% | 2.10% | 2.09% |
| Expenses net of fee waivers, if any | 2.00%K | 2.10% | 2.09% | 2.03% | 2.09% | 2.09% |
| Expenses net of all reductions | 1.98%K | 2.09% | 2.08% | 2.02% | 2.07% | 2.06% |
| Net investment income (loss) | (.07)%K | .50%B | .24%C | .60%D | .23% | .66% |
| Supplemental Data | | | | | | |
| Net assets, end of period (in millions) | $25 | $26 | $32 | $35 | $36 | $30 |
| Portfolio turnover rateL | 43%K | 50%M | 60%M | 57% | 65% | 68% |
A Calculated based on average shares outstanding during the period.
B Net Investment income per share reflects a large, non-recurring dividend which amounted to $.14 per share. Excluding this non-recurring dividend, the ratio of net investment income (loss) to average net assets would have been .13%.
C Net Investment income per share reflects a large, non-recurring dividend which amounted to $.12 per share. Excluding this non-recurring dividend, the ratio of net investment income (loss) to average net assets would have been (.06) %.
D Net Investment income per share reflects a large, non-recurring dividend which amounted to $.21 per share. Excluding this non-recurring dividend, the ratio of net investment income (loss) to average net assets would have been .05%.
E Amount represents less than $.005 per share.
F Total returns for periods of less than one year are not annualized.
G Total returns would have been lower if certain expenses had not been reduced during the applicable periods shown.
H Total returns do not include the effect of the contingent deferred sales charge.
I Fees and expenses of any underlying Fidelity Central Funds are not included in the Fund's expense ratio. The Fund indirectly bears its proportionate share of the expenses of any underlying Fidelity Central Funds.
J Expense ratios reflect operating expenses of the class. Expenses before reductions do not reflect amounts reimbursed by the investment adviser or reductions from brokerage service arrangements or reductions from other expense offset arrangements and do not represent the amount paid by the class during periods when reimbursements or reductions occur. Expenses net of fee waivers reflect expenses after reimbursement by the investment adviser but prior to reductions from brokerage service arrangements or other expense offset arrangements. Expenses net of all reductions represent the net expenses paid by the class.
K Annualized
L Amount does not include the portfolio activity of any underlying Fidelity Central Funds.
M Portfolio turnover rate excludes securities received or delivered in-kind.
See accompanying notes which are an integral part of the financial statements.
Financial Highlights — Fidelity International Discovery Fund
| | Six months ended (Unaudited) April 30, | Years ended October 31, | | | | |
| | 2017 | 2016 | 2015 | 2014 | 2013 | 2012 |
| Selected Per–Share Data | | | | | | |
| Net asset value, beginning of period | $37.91 | $40.12 | $39.03 | $39.82 | $31.91 | $29.69 |
| Income from Investment Operations | | | | | | |
| Net investment income (loss)A | .20 | .61B | .54C | .67D | .47 | .51 |
| Net realized and unrealized gain (loss) | 3.85 | (2.41) | .81 | (.68) | 8.02 | 2.12 |
| Total from investment operations | 4.05 | (1.80) | 1.35 | (.01) | 8.49 | 2.63 |
| Distributions from net investment income | (.61) | (.41) | (.26) | (.47) | (.55) | (.41) |
| Distributions from net realized gain | (.05) | (.01) | – | (.31) | (.03) | – |
| Total distributions | (.66) | (.41)E | (.26) | (.78) | (.58) | (.41) |
| Redemption fees added to paid in capitalA,F | – | – | – | – | – | – |
| Net asset value, end of period | $41.30 | $37.91 | $40.12 | $39.03 | $39.82 | $31.91 |
| Total ReturnG,H | 10.92% | (4.53)% | 3.47% | (.01)% | 27.03% | 9.03% |
| Ratios to Average Net AssetsI,J | | | | | | |
| Expenses before reductions | .89%K | 1.00% | .99% | .93% | 1.00% | 1.01% |
| Expenses net of fee waivers, if any | .89%K | 1.00% | .99% | .93% | 1.00% | 1.01% |
| Expenses net of all reductions | .87%K | .99% | .98% | .93% | .98% | .98% |
| Net investment income (loss) | 1.04%K | 1.61%B | 1.34%C | 1.69%D | 1.32% | 1.73% |
| Supplemental Data | | | | | | |
| Net assets, end of period (in millions) | $6,578 | $6,421 | $7,209 | $7,464 | $7,800 | $5,965 |
| Portfolio turnover rateL | 43%K | 50%M | 60%M | 57% | 65% | 68% |
A Calculated based on average shares outstanding during the period.
B Net Investment income per share reflects a large, non-recurring dividend which amounted to $.14 per share. Excluding this non-recurring dividend, the ratio of net investment income (loss) to average net assets would have been 1.23%.
C Net Investment income per share reflects a large, non-recurring dividend which amounted to $.12 per share. Excluding this non-recurring dividend, the ratio of net investment income (loss) to average net assets would have been 1.03%.
D Net Investment income per share reflects a large, non-recurring dividend which amounted to $.22 per share. Excluding this non-recurring dividend, the ratio of net investment income (loss) to average net assets would have been 1.15%.
E Total distributions of $.41 per share is comprised of distributions from net investment income of $.409 and distributions from net realized gain of $.005 per share.
F Amount represents less than $.005 per share.
G Total returns for periods of less than one year are not annualized.
H Total returns would have been lower if certain expenses had not been reduced during the applicable periods shown.
I Fees and expenses of any underlying Fidelity Central Funds are not included in the Fund's expense ratio. The Fund indirectly bears its proportionate share of the expenses of any underlying Fidelity Central Funds.
J Expense ratios reflect operating expenses of the class. Expenses before reductions do not reflect amounts reimbursed by the investment adviser or reductions from brokerage service arrangements or reductions from other expense offset arrangements and do not represent the amount paid by the class during periods when reimbursements or reductions occur. Expenses net of fee waivers reflect expenses after reimbursement by the investment adviser but prior to reductions from brokerage service arrangements or other expense offset arrangements. Expenses net of all reductions represent the net expenses paid by the class.
K Annualized
L Amount does not include the portfolio activity of any underlying Fidelity Central Funds.
M Portfolio turnover rate excludes securities received or delivered in-kind.
See accompanying notes which are an integral part of the financial statements.
Financial Highlights — Fidelity International Discovery Fund Class K
| | Six months ended (Unaudited) April 30, | Years ended October 31, | | | | |
| | 2017 | 2016 | 2015 | 2014 | 2013 | 2012 |
| Selected Per–Share Data | | | | | | |
| Net asset value, beginning of period | $37.86 | $40.06 | $38.97 | $39.76 | $31.87 | $29.66 |
| Income from Investment Operations | | | | | | |
| Net investment income (loss)A | .22 | .66B | .59C | .72D | .52 | .57 |
| Net realized and unrealized gain (loss) | 3.84 | (2.39) | .81 | (.67) | 8.01 | 2.11 |
| Total from investment operations | 4.06 | (1.73) | 1.40 | .05 | 8.53 | 2.68 |
| Distributions from net investment income | (.66) | (.46) | (.31) | (.53) | (.61) | (.47) |
| Distributions from net realized gain | (.05) | (.01) | – | (.31) | (.03) | – |
| Total distributions | (.71) | (.47) | (.31) | (.84) | (.64) | (.47) |
| Redemption fees added to paid in capitalA,E | – | – | – | – | – | – |
| Net asset value, end of period | $41.21 | $37.86 | $40.06 | $38.97 | $39.76 | $31.87 |
| Total ReturnF,G | 10.98% | (4.38)% | 3.61% | .13% | 27.23% | 9.24% |
| Ratios to Average Net AssetsH,I | | | | | | |
| Expenses before reductions | .76%J | .86% | .86% | .80% | .85% | .83% |
| Expenses net of fee waivers, if any | .76%J | .86% | .86% | .80% | .85% | .83% |
| Expenses net of all reductions | .74%J | .85% | .85% | .79% | .83% | .80% |
| Net investment income (loss) | 1.17%J | 1.74%B | 1.47%C | 1.83%D | 1.47% | 1.91% |
| Supplemental Data | | | | | | |
| Net assets, end of period (in millions) | $1,917 | $1,880 | $2,308 | $2,464 | $2,576 | $1,776 |
| Portfolio turnover rateK | 43%J | 50%L | 60%L | 57% | 65% | 68% |
A Calculated based on average shares outstanding during the period.
B Net Investment income per share reflects a large, non-recurring dividend which amounted to $.14 per share. Excluding this non-recurring dividend, the ratio of net investment income (loss) to average net assets would have been 1.36%.
C Net Investment income per share reflects a large, non-recurring dividend which amounted to $.12 per share. Excluding this non-recurring dividend, the ratio of net investment income (loss) to average net assets would have been 1.16%.
D Net Investment income per share reflects a large, non-recurring dividend which amounted to $.22 per share. Excluding this non-recurring dividend, the ratio of net investment income (loss) to average net assets would have been 1.28%.
E Amount represents less than $.005 per share.
F Total returns for periods of less than one year are not annualized.
G Total returns would have been lower if certain expenses had not been reduced during the applicable periods shown.
H Fees and expenses of any underlying Fidelity Central Funds are not included in the Fund's expense ratio. The Fund indirectly bears its proportionate share of the expenses of any underlying Fidelity Central Funds.
I Expense ratios reflect operating expenses of the class. Expenses before reductions do not reflect amounts reimbursed by the investment adviser or reductions from brokerage service arrangements or reductions from other expense offset arrangements and do not represent the amount paid by the class during periods when reimbursements or reductions occur. Expenses net of fee waivers reflect expenses after reimbursement by the investment adviser but prior to reductions from brokerage service arrangements or other expense offset arrangements. Expenses net of all reductions represent the net expenses paid by the class.
J Annualized
K Amount does not include the portfolio activity of any underlying Fidelity Central Funds.
L Portfolio turnover rate excludes securities received or delivered in-kind.
See accompanying notes which are an integral part of the financial statements.
Financial Highlights — Fidelity International Discovery Fund Class I
| | Six months ended (Unaudited) April 30, | Years ended October 31, | | | | |
| | 2017 | 2016 | 2015 | 2014 | 2013 | 2012 |
| Selected Per–Share Data | | | | | | |
| Net asset value, beginning of period | $37.82 | $40.03 | $38.96 | $39.76 | $31.87 | $29.65 |
| Income from Investment Operations | | | | | | |
| Net investment income (loss)A | .20 | .61B | .53C | .67D | .47 | .52 |
| Net realized and unrealized gain (loss) | 3.84 | (2.40) | .80 | (.68) | 8.01 | 2.11 |
| Total from investment operations | 4.04 | (1.79) | 1.33 | (.01) | 8.48 | 2.63 |
| Distributions from net investment income | (.61) | (.42) | (.26) | (.48) | (.56) | (.41) |
| Distributions from net realized gain | (.05) | (.01) | – | (.31) | (.03) | – |
| Total distributions | (.66) | (.42)E | (.26) | (.79) | (.59) | (.41) |
| Redemption fees added to paid in capitalA,F | – | – | – | – | – | – |
| Net asset value, end of period | $41.20 | $37.82 | $40.03 | $38.96 | $39.76 | $31.87 |
| Total ReturnG,H | 10.90% | (4.52)% | 3.44% | (.01)% | 27.03% | 9.07% |
| Ratios to Average Net AssetsI,J | | | | | | |
| Expenses before reductions | .90%K | 1.00% | 1.00% | .93% | 1.00% | 1.00% |
| Expenses net of fee waivers, if any | .90%K | 1.00% | .99% | .93% | 1.00% | 1.00% |
| Expenses net of all reductions | .87%K | .99% | .98% | .93% | .97% | .97% |
| Net investment income (loss) | 1.03%K | 1.60%B | 1.33%C | 1.69%D | 1.33% | 1.75% |
| Supplemental Data | | | | | | |
| Net assets, end of period (in millions) | $594 | $745 | $1,061 | $650 | $476 | $294 |
| Portfolio turnover rateL | 43%K | 50%M | 60%M | 57% | 65% | 68% |
A Calculated based on average shares outstanding during the period.
B Net Investment income per share reflects a large, non-recurring dividend which amounted to $.14 per share. Excluding this non-recurring dividend, the ratio of net investment income (loss) to average net assets would have been 1.22%.
C Net Investment income per share reflects a large, non-recurring dividend which amounted to $.12 per share. Excluding this non-recurring dividend, the ratio of net investment income (loss) to average net assets would have been 1.03%.
D Net Investment income per share reflects a large, non-recurring dividend which amounted to $.22 per share. Excluding this non-recurring dividend, the ratio of net investment income (loss) to average net assets would have been 1.14%.
E Total distributions of $.42 per share is comprised of distributions from net investment income of $.418 and distributions from net realized gain of $.005 per share.
F Amount represents less than $.005 per share.
G Total returns for periods of less than one year are not annualized.
H Total returns would have been lower if certain expenses had not been reduced during the applicable periods shown.
I Fees and expenses of any underlying Fidelity Central Funds are not included in the Fund's expense ratio. The Fund indirectly bears its proportionate share of the expenses of any underlying Fidelity Central Funds.
J Expense ratios reflect operating expenses of the class. Expenses before reductions do not reflect amounts reimbursed by the investment adviser or reductions from brokerage service arrangements or reductions from other expense offset arrangements and do not represent the amount paid by the class during periods when reimbursements or reductions occur. Expenses net of fee waivers reflect expenses after reimbursement by the investment adviser but prior to reductions from brokerage service arrangements or other expense offset arrangements. Expenses net of all reductions represent the net expenses paid by the class.
K Annualized
L Amount does not include the portfolio activity of any underlying Fidelity Central Funds.
M Portfolio turnover rate excludes securities received or delivered in-kind.
See accompanying notes which are an integral part of the financial statements.
Financial Highlights — Fidelity International Discovery Fund Class Z
| | Six months ended (Unaudited) April 30, | Years ended October 31, | | | |
| | 2017 | 2016 | 2015 | 2014 | 2013 A |
| Selected Per–Share Data | | | | | |
| Net asset value, beginning of period | $37.84 | $40.03 | $38.96 | $39.77 | $37.22 |
| Income from Investment Operations | | | | | |
| Net investment income (loss)B | .22 | .66C | .59D | .72E | .07 |
| Net realized and unrealized gain (loss) | 3.84 | (2.38) | .80 | (.68) | 2.48 |
| Total from investment operations | 4.06 | (1.72) | 1.39 | .04 | 2.55 |
| Distributions from net investment income | (.67) | (.46) | (.32) | (.54) | – |
| Distributions from net realized gain | (.05) | (.01) | – | (.31) | – |
| Total distributions | (.72) | (.47) | (.32) | (.85) | – |
| Redemption fees added to paid in capitalB,F | – | – | – | – | – |
| Net asset value, end of period | $41.18 | $37.84 | $40.03 | $38.96 | $39.77 |
| Total ReturnG,H | 10.97% | (4.36)% | 3.58% | .12% | 6.85% |
| Ratios to Average Net AssetsI,J | | | | | |
| Expenses before reductions | .76%K | .86% | .86% | .80% | .85%K |
| Expenses net of fee waivers, if any | .76%K | .86% | .86% | .80% | .85%K |
| Expenses net of all reductions | .74%K | .85% | .85% | .79% | .83%K |
| Net investment income (loss) | 1.17%K | 1.74%C | 1.47%D | 1.83%E | .76%K |
| Supplemental Data | | | | | |
| Net assets, end of period (in millions) | $82 | $38 | $30 | $35 | $– |
| Portfolio turnover rateL | 43%K | 50%M | 60%M | 57% | 65% |
A For the period August 13, 2013 (commencement of sale of shares) to October 31, 2013.
B Calculated based on average shares outstanding during the period.
C Net Investment income per share reflects a large, non-recurring dividend which amounted to $.14 per share. Excluding this non-recurring dividend, the ratio of net investment income (loss) to average net assets would have been 1.36%.
D Net Investment income per share reflects a large, non-recurring dividend which amounted to $.12 per share. Excluding this non-recurring dividend, the ratio of net investment income (loss) to average net assets would have been 1.16%.
E Net Investment income per share reflects a large, non-recurring dividend which amounted to $.21 per share. Excluding this non-recurring dividend, the ratio of net investment income (loss) to average net assets would have been 1.28%.
F Amount represents less than $.005 per share.
G Total returns for periods of less than one year are not annualized.
H Total returns would have been lower if certain expenses had not been reduced during the applicable periods shown.
I Fees and expenses of any underlying Fidelity Central Funds are not included in the Fund's expense ratio. The Fund indirectly bears its proportionate share of the expenses of any underlying Fidelity Central Funds.
J Expense ratios reflect operating expenses of the class. Expenses before reductions do not reflect amounts reimbursed by the investment adviser or reductions from brokerage service arrangements or reductions from other expense offset arrangements and do not represent the amount paid by the class during periods when reimbursements or reductions occur. Expense ratios before reductions for start-up periods may not be representative of longer-term operating periods. Expenses net of fee waivers reflect expenses after reimbursement by the investment adviser but prior to reductions from brokerage service arrangements or other expense offset arrangements. Expenses net of all reductions represent the net expenses paid by the class.
K Annualized
L Amount does not include the portfolio activity of any underlying Fidelity Central Funds.
M Portfolio turnover rate excludes securities received or delivered in-kind.
See accompanying notes which are an integral part of the financial statements.
Notes to Financial Statements (Unaudited)
For the period ended April 30, 2017
(Amounts in thousands except percentages)
1. Organization.
Fidelity International Discovery Fund (the Fund) is a fund of Fidelity Investment Trust (the Trust) and is authorized to issue an unlimited number of shares. The Trust is registered under the Investment Company Act of 1940, as amended (the 1940 Act), as an open-end management investment company organized as a Massachusetts business trust. The Fund offers Class A, Class M (formerly Class T), Class C, International Discovery, Class K, Class I and Class Z shares, each of which has equal rights as to assets and voting privileges. Each class has exclusive voting rights with respect to matters that affect that class.
After the close of business on June 24, 2016, all outstanding Class B shares were converted to Class A shares. All prior fiscal period dollar and share amounts for Class B presented in the Notes to Financial Statements are for the period November 1, 2015 through June 24, 2016.
2. Investments in Fidelity Central Funds.
The Fund invests in Fidelity Central Funds, which are open-end investment companies generally available only to other investment companies and accounts managed by the investment adviser and its affiliates. The Fund's Schedule of Investments lists each of the Fidelity Central Funds held as of period end, if any, as an investment of the Fund, but does not include the underlying holdings of each Fidelity Central Fund. As an Investing Fund, the Fund indirectly bears its proportionate share of the expenses of the underlying Fidelity Central Funds.
The Money Market Central Funds seek preservation of capital and current income and are managed by Fidelity Investments Money Management, Inc. (FIMM), an affiliate of the investment adviser. Annualized expenses of the Money Market Central Funds as of their most recent shareholder report date are less than .005%.
A complete unaudited list of holdings for each Fidelity Central Fund is available upon request or at the Securities and Exchange Commission (the SEC) website at www.sec.gov. In addition, the financial statements of the Fidelity Central Funds are available on the SEC website or upon request.
3. Significant Accounting Policies.
The Fund is an investment company and applies the accounting and reporting guidance of the Financial Accounting Standards Board (FASB) Accounting Standards Codification Topic 946 Financial Services – Investments Companies. The financial statements have been prepared in conformity with accounting principles generally accepted in the United States of America (GAAP), which require management to make certain estimates and assumptions at the date of the financial statements. Actual results could differ from those estimates. Subsequent events, if any, through the date that the financial statements were issued have been evaluated in the preparation of the financial statements. The following summarizes the significant accounting policies of the Fund:
Investment Valuation. Investments are valued as of 4:00 p.m. Eastern time on the last calendar day of the period. The Board of Trustees (the Board) has delegated the day to day responsibility for the valuation of the Fund's investments to the Fair Value Committee (the Committee) established by the Fund's investment adviser. In accordance with valuation policies and procedures approved by the Board, the Fund attempts to obtain prices from one or more third party pricing vendors or brokers to value its investments. When current market prices, quotations or currency exchange rates are not readily available or reliable, investments will be fair valued in good faith by the Committee, in accordance with procedures adopted by the Board. Factors used in determining fair value vary by investment type and may include market or investment specific events, changes in interest rates and credit quality. The frequency with which these procedures are used cannot be predicted and they may be utilized to a significant extent. The Committee oversees the Fund's valuation policies and procedures and reports to the Board on the Committee's activities and fair value determinations. The Board monitors the appropriateness of the procedures used in valuing the Fund's investments and ratifies the fair value determinations of the Committee.
The Fund categorizes the inputs to valuation techniques used to value its investments into a disclosure hierarchy consisting of three levels as shown below:
- Level 1 – quoted prices in active markets for identical investments
- Level 2 – other significant observable inputs (including quoted prices for similar investments, interest rates, prepayment speeds, etc.)
- Level 3 – unobservable inputs (including the Fund's own assumptions based on the best information available)
Valuation techniques used to value the Fund's investments by major category are as follows:
Equity securities, including restricted securities, for which market quotations are readily available, are valued at the last reported sale price or official closing price as reported by a third party pricing vendor on the primary market or exchange on which they are traded and are categorized as Level 1 in the hierarchy. In the event there were no sales during the day or closing prices are not available, securities are valued at the last quoted bid price or may be valued using the last available price and are generally categorized as Level 2 in the hierarchy. For foreign equity securities, when market or security specific events arise, comparisons to the valuation of American Depositary Receipts (ADRs), futures contracts, Exchange-Traded Funds (ETFs) and certain indexes as well as quoted prices for similar securities may be used and would be categorized as Level 2 in the hierarchy. Utilizing these techniques may result in transfers between Level 1 and Level 2. For equity securities, including restricted securities, where observable inputs are limited, assumptions about market activity and risk are used and these securities may be categorized as Level 3 in the hierarchy.
Debt securities, including restricted securities, are valued based on evaluated prices received from third party pricing vendors or from brokers who make markets in such securities. U.S. government and government agency obligations are valued by pricing vendors who utilize matrix pricing which considers yield or price of bonds of comparable quality, coupon, maturity and type or by broker-supplied prices. When independent prices are unavailable or unreliable, debt securities may be valued utilizing pricing methodologies which consider similar factors that would be used by third party pricing vendors. Debt securities are generally categorized as Level 2 in the hierarchy but may be Level 3 depending on the circumstances.
Futures contracts are valued at the settlement price established each day by the board of trade or exchange on which they are traded and are categorized as Level 1 in the hierarchy. Investments in open-end mutual funds, including the Fidelity Central Funds, are valued at their closing net asset value (NAV) each business day and are categorized as Level 1 in the hierarchy.
Changes in valuation techniques may result in transfers in or out of an assigned level within the disclosure hierarchy. The aggregate value of investments by input level as of April 30, 2017, including information on transfers between Levels 1 and 2, is included at the end of the Fund's Schedule of Investments.
Foreign Currency. The Fund may use foreign currency contracts to facilitate transactions in foreign-denominated securities. Gains and losses from these transactions may arise from changes in the value of the foreign currency or if the counterparties do not perform under the contracts' terms.
Foreign-denominated assets, including investment securities, and liabilities are translated into U.S. dollars at the exchange rates at period end. Purchases and sales of investment securities, income and dividends received and expenses denominated in foreign currencies are translated into U.S. dollars at the exchange rate in effect on the transaction date.
The effects of exchange rate fluctuations on investments are included with the net realized and unrealized gain (loss) on investment securities. Other foreign currency transactions resulting in realized and unrealized gain (loss) are disclosed separately.
Investment Transactions and Income. For financial reporting purposes, the Fund's investment holdings and NAV include trades executed through the end of the last business day of the period. The NAV per share for processing shareholder transactions is calculated as of the close of business of the New York Stock Exchange (NYSE), normally 4:00 p.m. Eastern time and includes trades executed through the end of the prior business day. Gains and losses on securities sold are determined on the basis of identified cost. Dividend income is recorded on the ex-dividend date, except for certain dividends from foreign securities where the ex-dividend date may have passed, which are recorded as soon as the Fund is informed of the ex-dividend date. Non-cash dividends included in dividend income, if any, are recorded at the fair market value of the securities received. Income and capital gain distributions from Fidelity Central Funds, if any, are recorded on the ex-dividend date. Certain distributions received by the Fund represent a return of capital or capital gain. The Fund determines the components of these distributions subsequent to the ex-dividend date, based upon receipt of tax filings or other correspondence relating to the underlying investment. These distributions are recorded as a reduction of cost of investments and/or as a realized gain. Interest income is accrued as earned and includes coupon interest and amortization of premium and accretion of discount on debt securities as applicable. Investment income is recorded net of foreign taxes withheld where recovery of such taxes is uncertain.
Class Allocations and Expenses. Investment income, realized and unrealized capital gains and losses, common expenses of the Fund, and certain fund-level expense reductions, if any, are allocated daily on a pro-rata basis to each class based on the relative net assets of each class to the total net assets of the Fund. Each class differs with respect to transfer agent and distribution and service plan fees incurred. Certain expense reductions may also differ by class. For the reporting period, the allocated portion of income and expenses to each class as a percent of its average net assets may vary due to the timing of recording these transactions in relation to fluctuating net assets of the classes. Expenses directly attributable to a fund are charged to that fund. Expenses attributable to more than one fund are allocated among the respective funds on the basis of relative net assets or other appropriate methods. Expense estimates are accrued in the period to which they relate and adjustments are made when actual amounts are known.
Deferred Trustee Compensation. Under a Deferred Compensation Plan (the Plan), independent Trustees may elect to defer receipt of a portion of their annual compensation. Deferred amounts are invested in a cross-section of Fidelity funds, are marked-to-market and remain in the Fund until distributed in accordance with the Plan. The investment of deferred amounts and the offsetting payable to the Trustees are included in the accompanying Statement of Assets and Liabilities.
Income Tax Information and Distributions to Shareholders. Each year, the Fund intends to qualify as a regulated investment company under Subchapter M of the Internal Revenue Code, including distributing substantially all of its taxable income and realized gains. As a result, no provision for U.S. Federal income taxes is required. The Fund files a U.S. federal tax return, in addition to state and local tax returns as required. The Fund's federal income tax returns are subject to examination by the Internal Revenue Service (IRS) for a period of three fiscal years after they are filed. State and local tax returns may be subject to examination for an additional fiscal year depending on the jurisdiction. Foreign taxes are provided for based on the Fund's understanding of the tax rules and rates that exist in the foreign markets in which it invests.
Distributions are declared and recorded on the ex-dividend date. Income dividends and capital gain distributions are declared separately for each class. Income and capital gain distributions are determined in accordance with income tax regulations, which may differ from GAAP.
Capital accounts within the financial statements are adjusted for permanent book-tax differences. These adjustments have no impact on net assets or the results of operations. Capital accounts are not adjusted for temporary book-tax differences which will reverse in a subsequent period.
Book-tax differences are primarily due to futures contracts, foreign currency transactions, passive foreign investment companies (PFIC), market discount, certain foreign taxes, redemptions in-kind, deferred trustees compensation, capital loss carryforwards and losses deferred due to wash sales.
The federal tax cost of investment securities and unrealized appreciation (depreciation) as of period end were as follows:
| Gross unrealized appreciation | $1,829,440 |
| Gross unrealized depreciation | (167,661) |
| Net unrealized appreciation (depreciation) on securities | $1,661,779 |
| Tax cost | $7,914,994 |
Capital loss carryforwards are only available to offset future capital gains of the Fund to the extent provided by regulations and may be limited. Under the Regulated Investment Company Modernization Act of 2010 (the Act), the Fund is permitted to carry forward capital losses incurred in taxable years beginning after December 22, 2010 for an unlimited period and such capital losses are required to be used prior to any losses that expire. The capital loss carryforward information presented below, including any applicable limitation, is estimated as of prior fiscal period end and is subject to adjustment.
| Fiscal year of expiration | |
| 2017 | $(49,104) |
| No expiration | |
| Short-term | (473,137) |
| Long-term | (90,465) |
| Total no expiration | (563,602) |
| Total capital loss carryforward | $(612,706) |
Short-Term Trading (Redemption) Fees. Shares held by investors in the Fund less than 30 days may have been subject to a redemption fee equal to 1.00% of the NAV of shares redeemed. All redemption fees, which reduce the proceeds of the shareholder redemption, are retained by the Fund and accounted for as an addition to paid in capital. In November 2016, the Board of Trustees approved the removal of the redemption fees effective December 12, 2016.
Restricted Securities. The Fund may invest in securities that are subject to legal or contractual restrictions on resale. These securities generally may be resold in transactions exempt from registration or to the public if the securities are registered. Disposal of these securities may involve time-consuming negotiations and expense, and prompt sale at an acceptable price may be difficult. Information regarding restricted securities is included at the end of the Fund's Schedule of Investments.
4. Derivative Instruments.
Risk Exposures and the Use of Derivative Instruments. The Fund's investment objective allows the Fund to enter into various types of derivative contracts, including futures contracts. Derivatives are investments whose value is primarily derived from underlying assets, indices or reference rates and may be transacted on an exchange or over-the-counter (OTC). Derivatives may involve a future commitment to buy or sell a specified asset based on specified terms, to exchange future cash flows at periodic intervals based on a notional principal amount, or for one party to make one or more payments upon the occurrence of specified events in exchange for periodic payments from the other party.
The Fund used derivatives to increase returns and to manage exposure to certain risks as defined below. The success of any strategy involving derivatives depends on analysis of numerous economic factors, and if the strategies for investment do not work as intended, the Fund may not achieve its objectives.
The Fund's use of derivatives increased or decreased its exposure to the following risk:
| Equity Risk | Equity risk relates to the fluctuations in the value of financial instruments as a result of changes in market prices (other than those arising from interest rate risk or foreign exchange risk), whether caused by factors specific to an individual investment, its issuer, or all factors affecting all instruments traded in a market or market segment.
|
The Fund is also exposed to additional risks from investing in derivatives, such as liquidity risk and counterparty credit risk. Liquidity risk is the risk that the Fund will be unable to close out the derivative in the open market in a timely manner. Counterparty credit risk is the risk that the counterparty will not be able to fulfill its obligation to the Fund. Counterparty credit risk related to exchange-traded futures contracts may be mitigated by the protection provided by the exchange on which they trade.
Investing in derivatives may involve greater risks than investing in the underlying assets directly and, to varying degrees, may involve risk of loss in excess of any initial investment and collateral received and amounts recognized in the Statement of Assets and Liabilities. In addition, there may be the risk that the change in value of the derivative contract does not correspond to the change in value of the underlying instrument.
Futures Contracts. A futures contract is an agreement between two parties to buy or sell a specified underlying instrument for a fixed price at a specified future date. The Fund used futures contracts to manage its exposure to the stock market.
Upon entering into a futures contract, a fund is required to deposit either cash or securities (initial margin) with a clearing broker in an amount equal to a certain percentage of the face value of the contract. Futures contracts are marked-to-market daily and subsequent daily payments (variation margin) are made or received by a fund depending on the daily fluctuations in the value of the futures contracts and are recorded as unrealized appreciation or (depreciation). This receivable and/or payable, if any, is included in daily variation margin for derivative instruments in the Statement of Assets and Liabilities. Realized gain or (loss) is recorded upon the expiration or closing of a futures contract.
Any open futures contracts at period end are presented in the Schedule of Investments under the caption "Futures Contracts". The underlying face amount at value reflects each contract's exposure to the underlying instrument or index at period end and is representative of volume of activity during the period. Securities deposited to meet initial margin requirements are identified in the Schedule of Investments.
During the period the Fund recognized net realized gain (loss) of $13,067 a change in net unrealized appreciation (depreciation) of $(4,118) related to its investment in futures contracts. These amounts are included in the Statement of Operations.
5. Purchases and Sales of Investments.
Purchases and sales of securities, other than short-term securities, aggregated $1,918,011 and $2,727,630, respectively.
Prior Fiscal Year Redemptions In-Kind. During the prior period, 1,487 shares of the Fund held by an unaffiliated entity were redeemed for investments and cash with a value of $55,670. The Fund had a net gain of $10,064 on investments delivered through the in-kind redemptions. The amount of the redemptions is included in share transactions activity shown in the accompanying Statement of Changes in Net Assets as well as the Notes to Financial Statements. The Fund recognized no gain or loss for federal income tax purposes.
6. Fees and Other Transactions with Affiliates.
Management Fee. Fidelity Management & Research Company (the investment adviser) and its affiliates provide the Fund with investment management related services for which the Fund pays a monthly management fee. The management fee is the sum of an individual fund fee rate that is based on an annual rate of .424% of the Fund's average net assets and an annualized group fee rate that averaged .25% during the period. The group fee rate is based upon the average net assets of all the mutual funds advised by the investment adviser, including any mutual funds previously advised by the investment adviser that are currently advised by Fidelity SelectCo, LLC, an affiliate of the investment adviser. The group fee rate decreases as assets under management increase and increases as assets under management decrease. In addition, the management fee is subject to a performance adjustment (up to a maximum of +/- .20% of the Fund's average net assets over a 36 month performance period). The upward or downward adjustment to the management fee is based on the relative investment performance of International Discovery as compared to its benchmark index, the MSCI EAFE Index, over the same 36 month performance period. For the reporting period, the total annualized management fee rate, including the performance adjustment, was .67% of the Fund's average net assets. The performance adjustment included in the management fee rate may be higher or lower than the maximum performance adjustment rate due to the difference between the average net assets for the reporting and performance periods.
Distribution and Service Plan Fees. In accordance with Rule 12b-1 of the 1940 Act, the Fund has adopted separate Distribution and Service Plans for each class of shares. Certain classes pay Fidelity Distributors Corporation (FDC), an affiliate of the investment adviser, separate Distribution and Service Fees, each of which is based on an annual percentage of each class' average net assets. In addition, FDC may pay financial intermediaries for selling shares of the Fund and providing shareholder support services. For the period, the Distribution and Service Fee rates, total fees and amounts retained by FDC were as follows:
| | Distribution
Fee | Service
Fee | Total Fees | Retained
by FDC |
| Class A | -% | .25% | $283 | $3 |
| Class M | .25% | .25% | 82 | –(a) |
| Class C | .75% | .25% | 123 | 9 |
| | | | $488 | $12 |
| (a) In the amount of less than five hundred dollars. | | | | |
Sales Load. FDC may receive a front-end sales charge of up to 5.75% for selling Class A shares and 3.50% for selling Class M shares, some of which is paid to financial intermediaries for selling shares of the Fund. Depending on the holding period, FDC may receive contingent deferred sales charges levied on Class A, Class M and Class C redemptions. The deferred sales charges are 1.00% for Class C shares, 1.00% for certain purchases of Class A shares and .25% for certain purchases of Class M shares.
For the period, sales charge amounts retained by FDC were as follows:
| | Retained
by FDC |
| Class A | $20 |
| Class M | 2 |
| Class C(a) | 2 |
| | $24 |
(a) When Class C shares are initially sold, FDC pays commissions from its own resources to financial intermediaries through which the sales are made.
Transfer Agent Fees. Fidelity Investments Institutional Operations Company, Inc., (FIIOC), an affiliate of the investment adviser, is the transfer, dividend disbursing and shareholder servicing agent for each class of the Fund. FIIOC receives account fees and asset-based fees that vary according to the account size and type of account of the shareholders of the respective classes of the Fund, except for Class K and Class Z. FIIOC receives an asset-based fee of Class K's and Class Z's average net assets. FIIOC pays for typesetting, printing and mailing of shareholder reports, except proxy statements.
For the period, transfer agent fees for each class were as follows:
| | Amount | % of
Class-Level Average
Net Assets(a) |
| Class A | $316 | .28 |
| Class M | 44 | .27 |
| Class C | 36 | .29 |
| International Discovery | 5,560 | .18 |
| Class K | 425 | .05 |
| Class I | 592 | .19 |
| Class Z | 13 | .05 |
| | $6,986 | |
(a) Annualized
Accounting and Security Lending Fees. Fidelity Service Company, Inc. (FSC), an affiliate of the investment adviser, maintains the Fund's accounting records. The accounting fee is based on the level of average net assets for each month. Under a separate contract, FSC administers the security lending program. The security lending fee is based on the number and duration of lending transactions.
Brokerage Commissions. The Fund placed a portion of its portfolio transactions with brokerage firms which are affiliates of the investment adviser. Brokerage commissions are included in net realized gain (loss) and change in net unrealized appreciation (depreciation) in the Statement of Operations. The commissions paid to these affiliated firms were $6 for the period.
Interfund Trades. The Fund may purchase from or sell securities to other Fidelity Funds under procedures adopted by the Board. The procedures have been designed to ensure these interfund trades are executed in accordance with Rule 17a-7 of the 1940 Act. Interfund trades are included within the respective purchases and sales amounts shown in the Purchases and Sales of Investments note.
7. Committed Line of Credit.
The Fund participates with other funds managed by the investment adviser or an affiliate in a $4.25 billion credit facility (the "line of credit") to be utilized for temporary or emergency purposes to fund shareholder redemptions or for other short-term liquidity purposes. The Fund has agreed to pay commitment fees on its pro-rata portion of the line of credit, which amounted to $15 and is reflected in Miscellaneous expenses on the Statement of Operations. During the period, the Fund did not borrow on this line of credit.
8. Security Lending.
The Fund lends portfolio securities through a lending agent from time to time in order to earn additional income. For equity securities, a lending agent is used and may loan securities to certain qualified borrowers, including Fidelity Capital Markets (FCM), a broker-dealer affiliated with the Fund. On the settlement date of the loan, the Fund receives collateral (in the form of U.S. Treasury obligations, letters of credit and/or cash) against the loaned securities and maintains collateral in an amount not less than 100% of the market value of the loaned securities during the period of the loan. The market value of the loaned securities is determined at the close of business of the Fund and any additional required collateral is delivered to the Fund on the next business day. The Fund or borrower may terminate the loan at any time, and if the borrower defaults on its obligation to return the securities loaned because of insolvency or other reasons, the Fund may apply collateral received from the borrower against the obligation. The Fund may experience delays and costs in recovering the securities loaned. Any cash collateral received is invested in the Fidelity Securities Lending Cash Central Fund. The value of loaned securities and cash collateral at period end are disclosed on the Fund's Statement of Assets and Liabilities. Security lending income represents the income earned on investing cash collateral, less rebates paid to borrowers and any lending agent fees associated with the loan, plus any premium payments received for lending certain types of securities. Security lending income is presented in the Statement of Operations as a component of income from Fidelity Central Funds. Total security lending income during the period amounted to $2,019. During the period, there were no securities loaned to FCM.
9. Expense Reductions.
Commissions paid to certain brokers with whom the investment adviser, or its affiliates, places trades on behalf of the Fund include an amount in addition to trade execution, which may be rebated back to the Fund to offset certain expenses. This amount totaled $1,034 for the period.
In addition, during the period the investment adviser reimbursed and/or waived a portion of fund-level operating expenses in the amount of $40.
10. Distributions to Shareholders.
Distributions to shareholders of each class were as follows:
| | Six months ended
April 30, 2017 | Year ended October 31, 2016 |
| From net investment income | | |
| Class A | $2,894 | $1,912 |
| Class M | 333 | 184 |
| Class C | 92 | – |
| International Discovery | 102,284 | 73,519 |
| Class K | 32,411 | 26,239 |
| Class I | 11,493 | 11,205 |
| Class Z | 667 | 375 |
| Total | $150,174 | $113,434 |
| From net realized gain | | |
| Class A | $302 | $36 |
| Class M | 44 | 5 |
| Class C | 34 | – |
| International Discovery | 8,189 | 899 |
| Class K | 2,392 | 284 |
| Class I | 929 | 134 |
| Class Z | 49 | 4 |
| Total | $11,939 | $1,362 |
11. Share Transactions.
Share transactions for each class were as follows and may contain automatic conversions between classes or exchanges between affiliated funds:
| | Shares | Shares | Dollars | Dollars |
| | Six months ended
April 30, 2017 | Year ended October 31, 2016 | Six months ended
April 30, 2017 | Year ended October 31, 2016 |
| Class A | | | | |
| Shares sold | 364 | 885 | $13,763 | $33,250 |
| Reinvestment of distributions | 87 | 48 | 3,152 | 1,922 |
| Shares redeemed | (1,088) | (1,758) | (41,081) | (66,337) |
| Net increase (decrease) | (637) | (825) | $(24,166) | $(31,165) |
| Class M | | | | |
| Shares sold | 35 | 126 | $1,305 | $4,736 |
| Reinvestment of distributions | 10 | 5 | 365 | 183 |
| Shares redeemed | (180) | (282) | (6,755) | (10,546) |
| Net increase (decrease) | (135) | (151) | $(5,085) | $(5,627) |
| Class B | | | | |
| Shares sold | – | 1 | $– | $16 |
| Shares redeemed | – | (58) | – | (2,118) |
| Net increase (decrease) | – | (57) | $– | $(2,102) |
| Class C | | | | |
| Shares sold | 30 | 193 | $1,121 | $7,216 |
| Reinvestment of distributions | 3 | – | 116 | – |
| Shares redeemed | (111) | (298) | (4,139) | (11,125) |
| Net increase (decrease) | (78) | (105) | $(2,902) | $(3,909) |
| International Discovery | | | | |
| Shares sold | 8,884 | 18,319 | $332,954 | $696,598 |
| Reinvestment of distributions | 2,884 | 1,781 | 105,222 | 70,961 |
| Shares redeemed | (21,871) | (30,424) | (824,296) | (1,154,409) |
| Net increase (decrease) | (10,103) | (10,324) | $(386,120) | $(386,850) |
| Class K | | | | |
| Shares sold | 5,259 | 12,391 | $199,707 | $466,861 |
| Reinvestment of distributions | 957 | 667 | 34,803 | 26,523 |
| Shares redeemed | (9,366) | (21,012)(a) | (352,321) | (800,081)(a) |
| Net increase (decrease) | (3,150) | (7,954) | $(117,811) | $(306,697) |
| Class I | | | | |
| Shares sold | 1,666 | 8,874 | $62,988 | $334,588 |
| Reinvestment of distributions | 82 | 52 | 2,985 | 2,069 |
| Shares redeemed | (7,042) | (15,719) | (265,168) | (569,974) |
| Net increase (decrease) | (5,294) | (6,793) | $(199,195) | $(233,317) |
| Class Z | | | | |
| Shares sold | 1,163 | 497 | $44,254 | $18,760 |
| Reinvestment of distributions | 20 | 10 | 716 | 379 |
| Shares redeemed | (194) | (256) | (7,427) | (9,746) |
| Net increase (decrease) | 989 | 251 | $37,543 | $9,393 |
(a) Amount includes in-kind redemptions (see the prior Redemptions In-Kind note for additional details).
12. Other.
The Fund's organizational documents provide former and current trustees and officers with a limited indemnification against liabilities arising in connection with the performance of their duties to the Fund. In the normal course of business, the Fund may also enter into contracts that provide general indemnifications. The Fund's maximum exposure under these arrangements is unknown as this would be dependent on future claims that may be made against the Fund. The risk of material loss from such claims is considered remote.
At the end of the period, Strategic Advisers International Fund was the owner of record of approximately 12% of the total outstanding shares of the Fund.
Shareholder Expense Example
As a shareholder of the Fund, you incur two types of costs: (1) transaction costs, including sales charges (loads) on purchase payments or redemption proceeds, redemption fees and (2) ongoing costs, including management fees, distribution and/or service (12b-1) fees and other Fund expenses. This Example is intended to help you understand your ongoing costs (in dollars) of investing in the Fund and to compare these costs with the ongoing costs of investing in other mutual funds.
The Example is based on an investment of $1,000 invested at the beginning of the period and held for the entire period (November 1, 2016 to April 30, 2017).
Actual Expenses
The first line of the accompanying table for each class of the Fund provides information about actual account values and actual expenses. You may use the information in this line, together with the amount you invested, to estimate the expenses that you paid over the period. Simply divide your account value by $1,000.00 (for example, an $8,600 account value divided by $1,000.00 = 8.6), then multiply the result by the number in the first line for a class of the Fund under the heading entitled "Expenses Paid During Period" to estimate the expenses you paid on your account during this period. A small balance maintenance fee of $12.00 that is charged once a year may apply for certain accounts with a value of less than $2,000. This fee is not included in the table below. If it was, the estimate of expenses you paid during the period would be higher, and your ending account value lower, by this amount. In addition, the Fund, as a shareholder in the underlying Fidelity Central Funds, will indirectly bear its pro-rata share of the fees and expenses incurred by the underlying Fidelity Central Funds. These fees and expenses are not included in the Fund's annualized expense ratio used to calculate the expense estimate in the table below.
Hypothetical Example for Comparison Purposes
The second line of the accompanying table for each class of the Fund provides information about hypothetical account values and hypothetical expenses based on a Class' actual expense ratio and an assumed rate of return of 5% per year before expenses, which is not the Class' actual return. The hypothetical account values and expenses may not be used to estimate the actual ending account balance or expenses you paid for the period. You may use this information to compare the ongoing costs of investing in the Fund and other funds. To do so, compare this 5% hypothetical example with the 5% hypothetical examples that appear in the shareholder reports of the other funds. A small balance maintenance fee of $12.00 that is charged once a year may apply for certain accounts with a value of less than $2,000. This fee is not included in the table below. If it was, the estimate of expenses you paid during the period would be higher, and your ending account value lower, by this amount. In addition, the Fund, as a shareholder in the underlying Fidelity Central Funds, will indirectly bear its pro-rata share of the fees and expenses incurred by the underlying Fidelity Central Funds. These fees and expenses are not included in the Fund's annualized expense ratio used to calculate the expense estimate in the table below.
Please note that the expenses shown in the table are meant to highlight your ongoing costs only and do not reflect any transaction costs. Therefore, the second line of the table is useful in comparing ongoing costs only, and will not help you determine the relative total costs of owning different funds. In addition, if these transactional costs were included, your costs would have been higher.
| | Annualized Expense Ratio-A | Beginning
Account Value
November 1, 2016 | Ending
Account Value
April 30, 2017 | Expenses Paid
During Period-B
November 1, 2016
to April 30, 2017 |
| Class A | 1.24% | | | |
| Actual | | $1,000.00 | $1,107.10 | $6.48 |
| Hypothetical-C | | $1,000.00 | $1,018.65 | $6.21 |
| Class M | 1.48% | | | |
| Actual | | $1,000.00 | $1,105.80 | $7.73 |
| Hypothetical-C | | $1,000.00 | $1,017.46 | $7.40 |
| Class C | 2.00% | | | |
| Actual | | $1,000.00 | $1,103.00 | $10.43 |
| Hypothetical-C | | $1,000.00 | $1,014.88 | $9.99 |
| International Discovery | .89% | | | |
| Actual | | $1,000.00 | $1,109.20 | $4.65 |
| Hypothetical-C | | $1,000.00 | $1,020.38 | $4.46 |
| Class K | .76% | | | |
| Actual | | $1,000.00 | $1,109.80 | $3.98 |
| Hypothetical-C | | $1,000.00 | $1,021.03 | $3.81 |
| Class I | .90% | | | |
| Actual | | $1,000.00 | $1,109.00 | $4.71 |
| Hypothetical-C | | $1,000.00 | $1,020.33 | $4.51 |
| Class Z | .76% | | | |
| Actual | | $1,000.00 | $1,109.70 | $3.98 |
| Hypothetical-C | | $1,000.00 | $1,021.03 | $3.81 |
A Annualized expense ratio reflects expenses net of applicable fee waivers.
B Expenses are equal to each Class' annualized expense ratio, multiplied by the average account value over the period, multiplied by 181/365 (to reflect the one-half year period).
C 5% return per year before expenses
Corporate Headquarters
245 Summer St.
Boston, MA 02210
www.fidelity.com
IGI-K-SANN-0617
1.863311.108
Fidelity Advisor® Canada Fund -
Class A, Class M (formerly Class T), Class C and Class I
Semi-Annual Report April 30, 2017 Class A, Class M, Class C and Class I are classes of Fidelity® Canada Fund |
|
Contents
To view a fund's proxy voting guidelines and proxy voting record for the 12-month period ended June 30, visit http://www.fidelity.com/proxyvotingresults or visit the Securities and Exchange Commission's (SEC) web site at http://www.sec.gov.
You may also call 1-877-208-0098 to request a free copy of the proxy voting guidelines.
Standard & Poor's, S&P and S&P 500 are registered service marks of The McGraw-Hill Companies, Inc. and have been licensed for use by Fidelity Distributors Corporation.
Other third-party marks appearing herein are the property of their respective owners.
All other marks appearing herein are registered or unregistered trademarks or service marks of FMR LLC or an affiliated company. © 2017 FMR LLC. All rights reserved.
This report and the financial statements contained herein are submitted for the general information of the shareholders of the Fund. This report is not authorized for distribution to prospective investors in the Fund unless preceded or accompanied by an effective prospectus.
A fund files its complete schedule of portfolio holdings with the SEC for the first and third quarters of each fiscal year on Form N-Q. Forms N-Q are available on the SEC’s web site at http://www.sec.gov. A fund's Forms N-Q may be reviewed and copied at the SEC’s Public Reference Room in Washington, DC. Information regarding the operation of the SEC's Public Reference Room may be obtained by calling 1-800-SEC-0330.
For a complete list of a fund's portfolio holdings, view the most recent holdings listing, semiannual report, or annual report on Fidelity's web site at http://www.fidelity.com, http://www.institutional.fidelity.com, or http://www.401k.com, as applicable.
NOT FDIC INSURED •MAY LOSE VALUE •NO BANK GUARANTEE
Neither the Fund nor Fidelity Distributors Corporation is a bank.
Investment Summary (Unaudited)
Geographic Diversification (% of fund's net assets)
| As of April 30, 2017 |
| | Canada | 93.4% |
| | United States of America* | 3.3% |
| | Bailiwick of Jersey | 0.8% |
| | United Kingdom | 0.7% |
| | Germany | 0.6% |
| | France | 0.6% |
| | Ireland | 0.6% |

* Includes Short-Term investments and Net Other Assets (Liabilities).
Percentages are based on country or territory of incorporation and are adjusted for the effect of futures contracts, if applicable.
| As of October 31, 2016 |
| | Canada | 93.2% |
| | United States of America* | 3.8% |
| | Bailiwick of Jersey | 0.9% |
| | United Kingdom | 0.8% |
| | France | 0.5% |
| | Ireland | 0.4% |
| | Israel | 0.4% |

* Includes Short-Term investments and Net Other Assets (Liabilities).
Percentages are based on country or territory of incorporation and are adjusted for the effect of futures contracts, if applicable.
Asset Allocation as of April 30, 2017
| | % of fund's net assets | % of fund's net assets 6 months ago |
| Stocks | 97.1 | 97.0 |
| Short-Term Investments and Net Other Assets (Liabilities) | 2.9 | 3.0 |
Top Ten Stocks as of April 30, 2017
| | % of fund's net assets | % of fund's net assets 6 months ago |
| Royal Bank of Canada (Banks) | 9.9 | 9.3 |
| The Toronto-Dominion Bank (Banks) | 8.9 | 8.7 |
| Suncor Energy, Inc. (Oil, Gas & Consumable Fuels) | 5.9 | 5.4 |
| Enbridge, Inc. (Oil, Gas & Consumable Fuels) | 4.3 | 4.1 |
| Rogers Communications, Inc. Class B (non-vtg.) (Wireless Telecommunication Services) | 3.7 | 3.7 |
| Manulife Financial Corp. (Insurance) | 3.6 | 0.0 |
| Canadian National Railway Co. (Road & Rail) | 3.1 | 5.4 |
| Canadian Pacific Railway Ltd. (Road & Rail) | 3.1 | 0.0 |
| TELUS Corp. (Diversified Telecommunication Services) | 2.8 | 2.9 |
| Alimentation Couche-Tard, Inc. Class B (sub. vtg.) (Food & Staples Retailing) | 2.5 | 2.4 |
| | 47.8 | |
Top Market Sectors as of April 30, 2017
| | % of fund's net assets | % of fund's net assets 6 months ago |
| Financials | 31.0 | 31.1 |
| Energy | 19.6 | 21.8 |
| Materials | 13.0 | 13.7 |
| Industrials | 8.5 | 7.4 |
| Consumer Staples | 8.1 | 7.4 |
| Telecommunication Services | 6.5 | 6.6 |
| Information Technology | 4.6 | 4.6 |
| Consumer Discretionary | 3.6 | 2.5 |
| Real Estate | 0.9 | 0.8 |
| Utilities | 0.7 | 0.7 |
Market Sectors may include more than one industry category.
The Fund may invest up to 35% of its total assets in any industry that represents more than 20% of the Canadian market. As of April 30, 2017, 20.8% of the Fund’s total assets were invested in the Diversified Banks industry, which accounts for more than 20% of the Canadian market.
Percentages shown as 0.0% may reflect amounts less than 0.05%.
Investments April 30, 2017 (Unaudited)
Showing Percentage of Net Assets
| Common Stocks - 97.1% | | | |
| | | Shares | Value |
| CONSUMER DISCRETIONARY - 3.6% | | | |
| Auto Components - 0.4% | | | |
| Magna International, Inc. Class A (sub. vtg.) | | 136,400 | $5,697,614 |
| Hotels, Restaurants & Leisure - 0.2% | | | |
| Freshii, Inc. | | 258,500 | 2,348,192 |
| Media - 2.2% | | | |
| Cogeco Communications, Inc. | | 176,900 | 10,122,456 |
| Corus Entertainment, Inc. Class B (non-vtg.) | | 588,000 | 5,772,096 |
| Quebecor, Inc. Class B (sub. vtg.) | | 404,600 | 12,350,963 |
| | | | 28,245,515 |
| Specialty Retail - 0.8% | | | |
| AutoCanada, Inc. (a) | | 282,300 | 4,855,796 |
| Sleep Country Canada Holdings, Inc. | | 224,400 | 5,804,596 |
| | | | 10,660,392 |
|
| TOTAL CONSUMER DISCRETIONARY | | | 46,951,713 |
|
| CONSUMER STAPLES - 8.1% | | | |
| Food & Staples Retailing - 7.6% | | | |
| Alimentation Couche-Tard, Inc. Class B (sub. vtg.) | | 719,200 | 33,076,720 |
| Empire Co. Ltd. Class A (non-vtg.) | | 416,300 | 6,413,530 |
| George Weston Ltd. | | 330,800 | 29,707,902 |
| Jean Coutu Group, Inc. Class A (sub. vtg.) | | 395,700 | 6,475,908 |
| Metro, Inc. Class A (sub. vtg.) | | 375,295 | 12,861,287 |
| North West Co., Inc. | | 429,400 | 10,129,065 |
| | | | 98,664,412 |
| Tobacco - 0.5% | | | |
| Imperial Tobacco Group PLC | | 137,773 | 6,748,737 |
|
| TOTAL CONSUMER STAPLES | | | 105,413,149 |
|
| ENERGY - 19.6% | | | |
| Energy Equipment & Services - 1.5% | | | |
| Canadian Energy Services & Technology Corp. | | 1,654,100 | 7,815,791 |
| Pason Systems, Inc. | | 348,200 | 5,170,517 |
| ShawCor Ltd. Class A | | 293,400 | 7,361,598 |
| | | | 20,347,906 |
| Oil, Gas & Consumable Fuels - 18.1% | | | |
| ARC Resources Ltd. | | 772,800 | 10,145,105 |
| Canadian Natural Resources Ltd. | | 874,498 | 27,854,784 |
| Cenovus Energy, Inc. | | 1,197,300 | 11,937,477 |
| Enbridge, Inc. | | 1,354,200 | 56,130,278 |
| Imperial Oil Ltd. | | 381,300 | 11,092,211 |
| NuVista Energy Ltd. (b) | | 1,064,900 | 4,797,725 |
| Parkland Fuel Corp. (b)(c)(d) | | 81,300 | 1,591,992 |
| Peyto Exploration & Development Corp. | | 380,600 | 6,925,830 |
| PrairieSky Royalty Ltd. | | 1,032,018 | 22,491,876 |
| Raging River Exploration, Inc. (b) | | 1,057,900 | 6,176,670 |
| Suncor Energy, Inc. | | 2,425,100 | 76,001,449 |
| | | | 235,145,397 |
|
| TOTAL ENERGY | | | 255,493,303 |
|
| FINANCIALS - 31.0% | | | |
| Banks - 20.8% | | | |
| Bank of Nova Scotia | | 470,800 | 26,170,693 |
| Royal Bank of Canada | | 1,875,400 | 128,415,541 |
| The Toronto-Dominion Bank | | 2,472,000 | 116,315,564 |
| | | | 270,901,798 |
| Capital Markets - 3.1% | | | |
| Amundi SA | | 120,480 | 7,926,827 |
| Brookfield Asset Management, Inc. Class A | | 193,900 | 7,167,645 |
| CI Financial Corp. | | 575,700 | 11,260,533 |
| Fairfax India Holdings Corp. (b) | | 102,000 | 1,416,780 |
| TMX Group Ltd. | | 208,000 | 11,751,189 |
| | | | 39,522,974 |
| Insurance - 7.1% | | | |
| Intact Financial Corp. | | 220,525 | 15,106,621 |
| Manulife Financial Corp. | | 2,713,300 | 47,585,365 |
| Power Corp. of Canada (sub. vtg.) | | 1,286,700 | 29,814,528 |
| | | | 92,506,514 |
|
| TOTAL FINANCIALS | | | 402,931,286 |
|
| HEALTH CARE - 0.6% | | | |
| Pharmaceuticals - 0.6% | | | |
| Bayer AG | | 64,300 | 7,956,042 |
| INDUSTRIALS - 8.5% | | | |
| Airlines - 0.5% | | | |
| WestJet Airlines Ltd. | | 341,100 | 5,642,312 |
| Professional Services - 0.7% | | | |
| Stantec, Inc. | | 343,000 | 8,802,088 |
| Road & Rail - 6.7% | | | |
| Canadian National Railway Co. | | 570,600 | 41,244,718 |
| Canadian Pacific Railway Ltd. | | 261,300 | 40,037,733 |
| TransForce, Inc. | | 286,000 | 6,226,820 |
| | | | 87,509,271 |
| Trading Companies & Distributors - 0.6% | | | |
| Toromont Industries Ltd. | | 229,600 | 8,167,742 |
|
| TOTAL INDUSTRIALS | | | 110,121,413 |
|
| INFORMATION TECHNOLOGY - 4.6% | | | |
| IT Services - 1.8% | | | |
| CGI Group, Inc. Class A (sub. vtg.) (b) | | 479,900 | 23,160,919 |
| Semiconductors & Semiconductor Equipment - 0.2% | | | |
| Dialog Semiconductor PLC(b) | | 65,800 | 3,078,482 |
| Software - 2.6% | | | |
| Constellation Software, Inc. | | 33,300 | 15,230,350 |
| Open Text Corp. | | 543,628 | 18,849,063 |
| | | | 34,079,413 |
|
| TOTAL INFORMATION TECHNOLOGY | | | 60,318,814 |
|
| MATERIALS - 13.0% | | | |
| Chemicals - 2.9% | | | |
| Agrium, Inc. | | 340,400 | 31,949,048 |
| Monsanto Co. | | 49,300 | 5,748,873 |
| | | | 37,697,921 |
| Construction Materials - 0.6% | | | |
| CRH PLC | | 199,200 | 7,255,682 |
| Containers & Packaging - 1.0% | | | |
| CCL Industries, Inc. Class B | | 55,800 | 12,917,329 |
| Metals & Mining - 7.8% | | | |
| Agnico Eagle Mines Ltd. (Canada) | | 323,600 | 15,468,225 |
| Barrick Gold Corp. | | 589,500 | 9,854,870 |
| Detour Gold Corp. (b) | | 444,400 | 5,615,838 |
| Franco-Nevada Corp. | | 299,000 | 20,335,636 |
| Goldcorp, Inc. | | 320,100 | 4,460,131 |
| Lundin Mining Corp. | | 2,485,000 | 13,252,848 |
| Premier Gold Mines Ltd. (b) | | 1,839,800 | 3,719,899 |
| Randgold Resources Ltd. | | 118,964 | 10,464,834 |
| Silver Wheaton Corp. | | 672,200 | 13,413,961 |
| Torex Gold Resources, Inc. (b) | | 295,070 | 4,997,633 |
| | | | 101,583,875 |
| Paper & Forest Products - 0.7% | | | |
| Western Forest Products, Inc. | | 6,174,300 | 9,724,732 |
|
| TOTAL MATERIALS | | | 169,179,539 |
|
| REAL ESTATE - 0.9% | | | |
| Equity Real Estate Investment Trusts (REITs) - 0.9% | | | |
| Allied Properties (REIT) | | 413,000 | 11,082,517 |
| TELECOMMUNICATION SERVICES - 6.5% | | | |
| Diversified Telecommunication Services - 2.8% | | | |
| TELUS Corp. | | 1,109,100 | 36,903,646 |
| Wireless Telecommunication Services - 3.7% | | | |
| Rogers Communications, Inc. Class B (non-vtg.) | | 1,038,300 | 47,607,924 |
|
| TOTAL TELECOMMUNICATION SERVICES | | | 84,511,570 |
|
| UTILITIES - 0.7% | | | |
| Electric Utilities - 0.7% | | | |
| Hydro One Ltd. | | 526,100 | 9,265,187 |
| TOTAL COMMON STOCKS | | | |
| (Cost $1,004,899,915) | | | 1,263,224,533 |
|
| Money Market Funds - 2.7% | | | |
| Fidelity Cash Central Fund, 0.85% (e) | | 30,990,102 | 30,996,300 |
| Fidelity Securities Lending Cash Central Fund 0.86% (e)(f) | | 4,266,184 | 4,266,611 |
| TOTAL MONEY MARKET FUNDS | | | |
| (Cost $35,257,776) | | | 35,262,911 |
| TOTAL INVESTMENT PORTFOLIO - 99.8% | | | |
| (Cost $1,040,157,691) | | | 1,298,487,444 |
| NET OTHER ASSETS (LIABILITIES) - 0.2% | | | 2,149,052 |
| NET ASSETS - 100% | | | $1,300,636,496 |
Legend
(a) Security or a portion of the security is on loan at period end.
(b) Non-income producing
(c) Security exempt from registration under Rule 144A of the Securities Act of 1933. These securities may be resold in transactions exempt from registration, normally to qualified institutional buyers. At the end of the period, the value of these securities amounted to $1,591,992 or 0.1% of net assets.
(d) Security or a portion of the security purchased on a delayed delivery or when-issued basis.
(e) Affiliated fund that is generally available only to investment companies and other accounts managed by Fidelity Investments. The rate quoted is the annualized seven-day yield of the fund at period end. A complete unaudited listing of the fund's holdings as of its most recent quarter end is available upon request. In addition, each Fidelity Central Fund's financial statements are available on the SEC's website or upon request.
(f) Investment made with cash collateral received from securities on loan.
Affiliated Central Funds
Information regarding fiscal year to date income earned by the Fund from investments in Fidelity Central Funds is as follows:
| Fund | Income earned |
| Fidelity Cash Central Fund | $96,720 |
| Fidelity Securities Lending Cash Central Fund | 451,748 |
| Total | $548,468 |
Investment Valuation
The following is a summary of the inputs used, as of April 30, 2017, involving the Fund's assets and liabilities carried at fair value. The inputs or methodology used for valuing securities may not be an indication of the risk associated with investing in those securities. For more information on valuation inputs, and their aggregation into the levels used below, please refer to the Investment Valuation section in the accompanying Notes to Financial Statements.
| | Valuation Inputs at Reporting Date: |
| Description | Total | Level 1 | Level 2 | Level 3 |
| Investments in Securities: | | | | |
| Equities: | | | | |
| Consumer Discretionary | $46,951,713 | $46,951,713 | $-- | $-- |
| Consumer Staples | 105,413,149 | 105,413,149 | -- | -- |
| Energy | 255,493,303 | 253,901,311 | 1,591,992 | -- |
| Financials | 402,931,286 | 402,931,286 | -- | -- |
| Health Care | 7,956,042 | -- | 7,956,042 | -- |
| Industrials | 110,121,413 | 110,121,413 | -- | -- |
| Information Technology | 60,318,814 | 60,318,814 | -- | -- |
| Materials | 169,179,539 | 151,459,023 | 17,720,516 | -- |
| Real Estate | 11,082,517 | 11,082,517 | -- | -- |
| Telecommunication Services | 84,511,570 | 84,511,570 | -- | -- |
| Utilities | 9,265,187 | 9,265,187 | -- | -- |
| Money Market Funds | 35,262,911 | 35,262,911 | -- | -- |
| Total Investments in Securities: | $1,298,487,444 | $1,271,218,894 | $27,268,550 | $-- |
See accompanying notes which are an integral part of the financial statements.
Financial Statements
Statement of Assets and Liabilities
| | | April 30, 2017 (Unaudited) |
| Assets | | |
Investment in securities, at value (including securities loaned of $4,060,598) — See accompanying schedule:
Unaffiliated issuers (cost $1,004,899,915) | $1,263,224,533 | |
| Fidelity Central Funds (cost $35,257,776) | 35,262,911 | |
| Total Investments (cost $1,040,157,691) | | $1,298,487,444 |
| Foreign currency held at value (cost $36,466) | | 36,466 |
| Receivable for investments sold | | 11,901,380 |
| Receivable for fund shares sold | | 430,734 |
| Dividends receivable | | 2,407,802 |
| Distributions receivable from Fidelity Central Funds | | 37,489 |
| Prepaid expenses | | 905 |
| Other receivables | | 11,464 |
| Total assets | | 1,313,313,684 |
| Liabilities | | |
| Payable to custodian bank | $669 | |
| Payable for investments purchased | | |
| Regular delivery | 3,340,994 | |
| Delayed delivery | 1,649,764 | |
| Payable for fund shares redeemed | 2,208,027 | |
| Accrued management fee | 855,917 | |
| Distribution and service plan fees payable | 27,227 | |
| Other affiliated payables | 288,393 | |
| Other payables and accrued expenses | 39,257 | |
| Collateral on securities loaned | 4,266,940 | |
| Total liabilities | | 12,677,188 |
| Net Assets | | $1,300,636,496 |
| Net Assets consist of: | | |
| Paid in capital | | $1,061,454,950 |
| Undistributed net investment income | | 5,294,279 |
| Accumulated undistributed net realized gain (loss) on investments and foreign currency transactions | | (24,457,222) |
| Net unrealized appreciation (depreciation) on investments and assets and liabilities in foreign currencies | | 258,344,489 |
| Net Assets | | $1,300,636,496 |
| Calculation of Maximum Offering Price | | |
| Class A: | | |
| Net Asset Value and redemption price per share ($38,054,780 ÷ 776,913 shares) | | $48.98 |
| Maximum offering price per share (100/94.25 of $48.98) | | $51.97 |
| Class M: | | |
| Net Asset Value and redemption price per share ($11,353,837 ÷ 232,924 shares) | | $48.74 |
| Maximum offering price per share (100/96.50 of $48.74) | | $50.51 |
| Class C: | | |
| Net Asset Value and offering price per share ($16,661,912 ÷ 347,882 shares)(a) | | $47.90 |
| Canada: | | |
| Net Asset Value, offering price and redemption price per share ($1,189,095,294 ÷ 24,180,640 shares) | | $49.18 |
| Class I: | | |
| Net Asset Value, offering price and redemption price per share ($45,470,673 ÷ 926,823 shares) | | $49.06 |
(a) Redemption price per share is equal to net asset value less any applicable contingent deferred sales charge.
See accompanying notes which are an integral part of the financial statements.
Statement of Operations
| | | Six months ended April 30, 2017 (Unaudited) |
| Investment Income | | |
| Dividends | | $17,404,149 |
| Income from Fidelity Central Funds | | 548,468 |
| Income before foreign taxes withheld | | 17,952,617 |
| Less foreign taxes withheld | | (2,539,493) |
| Total income | | 15,413,124 |
| Expenses | | |
| Management fee | | |
| Basic fee | $4,725,386 | |
| Performance adjustment | 323,022 | |
| Transfer agent fees | 1,457,347 | |
| Distribution and service plan fees | 173,256 | |
| Accounting and security lending fees | 312,692 | |
| Custodian fees and expenses | 11,056 | |
| Independent trustees' fees and expenses | 2,774 | |
| Registration fees | 66,720 | |
| Audit | 40,975 | |
| Legal | 2,142 | |
| Miscellaneous | 5,428 | |
| Total expenses before reductions | 7,120,798 | |
| Expense reductions | (14,891) | 7,105,907 |
| Net investment income (loss) | | 8,307,217 |
| Realized and Unrealized Gain (Loss) | | |
| Net realized gain (loss) on: | | |
| Investment securities: | | |
| Unaffiliated issuers | 26,096,203 | |
| Fidelity Central Funds | (1,175) | |
| Foreign currency transactions | 7,313 | |
| Total net realized gain (loss) | | 26,102,341 |
Change in net unrealized appreciation (depreciation) on:
Investment securities | 10,434,273 | |
| Assets and liabilities in foreign currencies | 18,466 | |
| Total change in net unrealized appreciation (depreciation) | | 10,452,739 |
| Net gain (loss) | | 36,555,080 |
| Net increase (decrease) in net assets resulting from operations | | $44,862,297 |
See accompanying notes which are an integral part of the financial statements.
Statement of Changes in Net Assets
| | Six months ended April 30, 2017 (Unaudited) | Year ended October 31, 2016 |
| Increase (Decrease) in Net Assets | | |
| Operations | | |
| Net investment income (loss) | $8,307,217 | $17,076,194 |
| Net realized gain (loss) | 26,102,341 | (32,588,329) |
| Change in net unrealized appreciation (depreciation) | 10,452,739 | 98,530,458 |
| Net increase (decrease) in net assets resulting from operations | 44,862,297 | 83,018,323 |
| Distributions to shareholders from net investment income | (16,443,381) | (17,462,078) |
| Distributions to shareholders from net realized gain | (5,168,976) | (1,771,774) |
| Total distributions | (21,612,357) | (19,233,852) |
| Share transactions - net increase (decrease) | (70,682,526) | (105,554,211) |
| Redemption fees | 29,954 | 81,286 |
| Total increase (decrease) in net assets | (47,402,632) | (41,688,454) |
| Net Assets | | |
| Beginning of period | 1,348,039,128 | 1,389,727,582 |
| End of period | $1,300,636,496 | $1,348,039,128 |
| Other Information | | |
| Undistributed net investment income end of period | $5,294,279 | $13,430,443 |
See accompanying notes which are an integral part of the financial statements.
Financial Highlights — Fidelity Canada Fund Class A
| | Six months ended (Unaudited) April 30, | Years ended October 31, | | | | |
| | 2017 | 2016 | 2015 | 2014 | 2013 | 2012 |
| Selected Per–Share Data | | | | | | |
| Net asset value, beginning of period | $48.09 | $45.25 | $60.56 | $57.31 | $53.65 | $52.20 |
| Income from Investment Operations | | | | | | |
| Net investment income (loss)A | .23 | .48 | .45 | .47 | .60 | .57 |
| Net realized and unrealized gain (loss) | 1.30 | 2.84 | (8.04) | 3.13 | 3.63 | 1.50 |
| Total from investment operations | 1.53 | 3.32 | (7.59) | 3.60 | 4.23 | 2.07 |
| Distributions from net investment income | (.45) | (.42) | (.50) | (.03) | (.57) | (.33) |
| Distributions from net realized gain | (.19) | (.06) | (7.22) | (.32) | – | (.29) |
| Total distributions | (.64) | (.48) | (7.72) | (.35) | (.57) | (.62) |
| Redemption fees added to paid in capitalA,B | – | – | – | – | – | – |
| Net asset value, end of period | $48.98 | $48.09 | $45.25 | $60.56 | $57.31 | $53.65 |
| Total ReturnC,D,E | 3.17% | 7.45% | (14.32)% | 6.32% | 7.98% | 4.04% |
| Ratios to Average Net AssetsF,G | | | | | | |
| Expenses before reductions | 1.34%H | 1.48% | 1.43% | 1.29% | 1.19% | 1.08% |
| Expenses net of fee waivers, if any | 1.34%H | 1.48% | 1.43% | 1.29% | 1.19% | 1.08% |
| Expenses net of all reductions | 1.34%H | 1.48% | 1.43% | 1.29% | 1.18% | 1.08% |
| Net investment income (loss) | .94%H | 1.06% | .90% | .79% | 1.11% | 1.11% |
| Supplemental Data | | | | | | |
| Net assets, end of period (000 omitted) | $38,055 | $44,144 | $58,286 | $95,004 | $116,661 | $159,597 |
| Portfolio turnover rateI | 40%H | 44% | 24% | 85% | 64% | 86% |
A Calculated based on average shares outstanding during the period.
B Amount represents less than $.005 per share.
C Total returns for periods of less than one year are not annualized.
D Total returns would have been lower if certain expenses had not been reduced during the applicable periods shown.
E Total returns do not include the effect of the sales charges.
F Fees and expenses of any underlying Fidelity Central Funds are not included in the Fund's expense ratio. The Fund indirectly bears its proportionate share of the expenses of any underlying Fidelity Central Funds.
G Expense ratios reflect operating expenses of the class. Expenses before reductions do not reflect amounts reimbursed by the investment adviser or reductions from brokerage service arrangements or reductions from other expense offset arrangements and do not represent the amount paid by the class during periods when reimbursements or reductions occur. Expenses net of fee waivers reflect expenses after reimbursement by the investment adviser but prior to reductions from brokerage service arrangements or other expense offset arrangements. Expenses net of all reductions represent the net expenses paid by the class.
H Annualized
I Amount does not include the portfolio activity of any underlying Fidelity Central Funds.
See accompanying notes which are an integral part of the financial statements.
Financial Highlights — Fidelity Canada Fund Class M
| | Six months ended (Unaudited) April 30, | Years ended October 31, | | | | |
| | 2017 | 2016 | 2015 | 2014 | 2013 | 2012 |
| Selected Per–Share Data | | | | | | |
| Net asset value, beginning of period | $47.82 | $44.99 | $60.22 | $57.14 | $53.48 | $52.01 |
| Income from Investment Operations | | | | | | |
| Net investment income (loss)A | .16 | .35 | .29 | .29 | .45 | .43 |
| Net realized and unrealized gain (loss) | 1.29 | 2.83 | (8.00) | 3.11 | 3.63 | 1.49 |
| Total from investment operations | 1.45 | 3.18 | (7.71) | 3.40 | 4.08 | 1.92 |
| Distributions from net investment income | (.34) | (.29) | (.30) | – | (.42) | (.16) |
| Distributions from net realized gain | (.19) | (.06) | (7.22) | (.32) | – | (.29) |
| Total distributions | (.53) | (.35) | (7.52) | (.32) | (.42) | (.45) |
| Redemption fees added to paid in capitalA,B | – | – | – | – | – | – |
| Net asset value, end of period | $48.74 | $47.82 | $44.99 | $60.22 | $57.14 | $53.48 |
| Total ReturnC,D,E | 3.01% | 7.14% | (14.58)% | 5.99% | 7.69% | 3.74% |
| Ratios to Average Net AssetsF,G | | | | | | |
| Expenses before reductions | 1.63%H | 1.77% | 1.75% | 1.59% | 1.47% | 1.36% |
| Expenses net of fee waivers, if any | 1.63%H | 1.77% | 1.75% | 1.59% | 1.47% | 1.36% |
| Expenses net of all reductions | 1.63%H | 1.77% | 1.75% | 1.59% | 1.46% | 1.36% |
| Net investment income (loss) | .65%H | .78% | .58% | .48% | .83% | .83% |
| Supplemental Data | | | | | | |
| Net assets, end of period (000 omitted) | $11,354 | $11,140 | $12,820 | $21,989 | $23,751 | $29,626 |
| Portfolio turnover rateI | 40%H | 44% | 24% | 85% | 64% | 86% |
A Calculated based on average shares outstanding during the period.
B Amount represents less than $.005 per share.
C Total returns for periods of less than one year are not annualized.
D Total returns would have been lower if certain expenses had not been reduced during the applicable periods shown.
E Total returns do not include the effect of the sales charges.
F Fees and expenses of any underlying Fidelity Central Funds are not included in the Fund's expense ratio. The Fund indirectly bears its proportionate share of the expenses of any underlying Fidelity Central Funds.
G Expense ratios reflect operating expenses of the class. Expenses before reductions do not reflect amounts reimbursed by the investment adviser or reductions from brokerage service arrangements or reductions from other expense offset arrangements and do not represent the amount paid by the class during periods when reimbursements or reductions occur. Expenses net of fee waivers reflect expenses after reimbursement by the investment adviser but prior to reductions from brokerage service arrangements or other expense offset arrangements. Expenses net of all reductions represent the net expenses paid by the class.
H Annualized
I Amount does not include the portfolio activity of any underlying Fidelity Central Funds.
See accompanying notes which are an integral part of the financial statements.
Financial Highlights — Fidelity Canada Fund Class C
| | Six months ended (Unaudited) April 30, | Years ended October 31, | | | | |
| | 2017 | 2016 | 2015 | 2014 | 2013 | 2012 |
| Selected Per–Share Data | | | | | | |
| Net asset value, beginning of period | $46.87 | $44.02 | $59.04 | $56.27 | $52.61 | $51.19 |
| Income from Investment Operations | | | | | | |
| Net investment income (loss)A | .05 | .15 | .07 | .02 | .20 | .19 |
| Net realized and unrealized gain (loss) | 1.27 | 2.78 | (7.85) | 3.07 | 3.58 | 1.46 |
| Total from investment operations | 1.32 | 2.93 | (7.78) | 3.09 | 3.78 | 1.65 |
| Distributions from net investment income | (.11) | (.02) | (.02) | – | (.12) | – |
| Distributions from net realized gain | (.19) | (.06) | (7.22) | (.32) | – | (.23) |
| Total distributions | (.29)B | (.08) | (7.24) | (.32) | (.12) | (.23) |
| Redemption fees added to paid in capitalA,C | – | – | – | – | – | – |
| Net asset value, end of period | $47.90 | $46.87 | $44.02 | $59.04 | $56.27 | $52.61 |
| Total ReturnD,E,F | 2.82% | 6.67% | (14.96)% | 5.53% | 7.21% | 3.26% |
| Ratios to Average Net AssetsG,H | | | | | | |
| Expenses before reductions | 2.06%I | 2.21% | 2.19% | 2.03% | 1.93% | 1.82% |
| Expenses net of fee waivers, if any | 2.06%I | 2.21% | 2.19% | 2.03% | 1.92% | 1.82% |
| Expenses net of all reductions | 2.06%I | 2.21% | 2.18% | 2.03% | 1.92% | 1.82% |
| Net investment income (loss) | .21%I | .33% | .14% | .04% | .37% | .37% |
| Supplemental Data | | | | | | |
| Net assets, end of period (000 omitted) | $16,662 | $18,489 | $21,610 | $38,749 | $46,040 | $66,500 |
| Portfolio turnover rateJ | 40%I | 44% | 24% | 85% | 64% | 86% |
A Calculated based on average shares outstanding during the period.
B Total distributions of $.29 per share is comprised of distributions from net investment income of $.105 and distributions from net realized gain of $.188 per share.
C Amount represents less than $.005 per share.
D Total returns for periods of less than one year are not annualized.
E Total returns would have been lower if certain expenses had not been reduced during the applicable periods shown.
F Total returns do not include the effect of the contingent deferred sales charge.
G Fees and expenses of any underlying Fidelity Central Funds are not included in the Fund's expense ratio. The Fund indirectly bears its proportionate share of the expenses of any underlying Fidelity Central Funds.
H Expense ratios reflect operating expenses of the class. Expenses before reductions do not reflect amounts reimbursed by the investment adviser or reductions from brokerage service arrangements or reductions from other expense offset arrangements and do not represent the amount paid by the class during periods when reimbursements or reductions occur. Expenses net of fee waivers reflect expenses after reimbursement by the investment adviser but prior to reductions from brokerage service arrangements or other expense offset arrangements. Expenses net of all reductions represent the net expenses paid by the class.
I Annualized
J Amount does not include the portfolio activity of any underlying Fidelity Central Funds.
See accompanying notes which are an integral part of the financial statements.
Financial Highlights — Fidelity Canada Fund
| | Six months ended (Unaudited) April 30, | Years ended October 31, | | | | |
| | 2017 | 2016 | 2015 | 2014 | 2013 | 2012 |
| Selected Per–Share Data | | | | | | |
| Net asset value, beginning of period | $48.35 | $45.55 | $60.95 | $57.72 | $54.05 | $52.59 |
| Income from Investment Operations | | | | | | |
| Net investment income (loss)A | .31 | .62 | .60 | .66 | .77 | .73 |
| Net realized and unrealized gain (loss) | 1.32 | 2.85 | (8.09) | 3.13 | 3.66 | 1.51 |
| Total from investment operations | 1.63 | 3.47 | (7.49) | 3.79 | 4.43 | 2.24 |
| Distributions from net investment income | (.61) | (.61) | (.69) | (.24) | (.76) | (.49) |
| Distributions from net realized gain | (.19) | (.06) | (7.22) | (.32) | – | (.29) |
| Total distributions | (.80) | (.67) | (7.91) | (.56) | (.76) | (.78) |
| Redemption fees added to paid in capitalA,B | – | – | – | – | – | – |
| Net asset value, end of period | $49.18 | $48.35 | $45.55 | $60.95 | $57.72 | $54.05 |
| Total ReturnC,D | 3.36% | 7.79% | (14.08)% | 6.64% | 8.32% | 4.36% |
| Ratios to Average Net AssetsE,F | | | | | | |
| Expenses before reductions | 1.02%G | 1.17% | 1.15% | .98% | .87% | .77% |
| Expenses net of fee waivers, if any | 1.02%G | 1.17% | 1.15% | .98% | .87% | .77% |
| Expenses net of all reductions | 1.02%G | 1.17% | 1.14% | .98% | .86% | .77% |
| Net investment income (loss) | 1.25%G | 1.37% | 1.18% | 1.09% | 1.42% | 1.42% |
| Supplemental Data | | | | | | |
| Net assets, end of period (000 omitted) | $1,189,095 | $1,233,050 | $1,279,488 | $2,057,843 | $2,262,380 | $2,992,597 |
| Portfolio turnover rateH | 40%G | 44% | 24% | 85% | 64% | 86% |
A Calculated based on average shares outstanding during the period.
B Amount represents less than $.005 per share.
C Total returns for periods of less than one year are not annualized.
D Total returns would have been lower if certain expenses had not been reduced during the applicable periods shown.
E Fees and expenses of any underlying Fidelity Central Funds are not included in the Fund's expense ratio. The Fund indirectly bears its proportionate share of the expenses of any underlying Fidelity Central Funds.
F Expense ratios reflect operating expenses of the class. Expenses before reductions do not reflect amounts reimbursed by the investment adviser or reductions from brokerage service arrangements or reductions from other expense offset arrangements and do not represent the amount paid by the class during periods when reimbursements or reductions occur. Expenses net of fee waivers reflect expenses after reimbursement by the investment adviser but prior to reductions from brokerage service arrangements or other expense offset arrangements. Expenses net of all reductions represent the net expenses paid by the class.
G Annualized
H Amount does not include the portfolio activity of any underlying Fidelity Central Funds.
See accompanying notes which are an integral part of the financial statements.
Financial Highlights — Fidelity Canada Fund Class I
| | Six months ended (Unaudited) April 30, | Years ended October 31, | | | | |
| | 2017 | 2016 | 2015 | 2014 | 2013 | 2012 |
| Selected Per–Share Data | | | | | | |
| Net asset value, beginning of period | $48.28 | $45.44 | $60.80 | $57.57 | $53.91 | $52.44 |
| Income from Investment Operations | | | | | | |
| Net investment income (loss)A | .32 | .66 | .61 | .65 | .78 | .74 |
| Net realized and unrealized gain (loss) | 1.31 | 2.83 | (8.07) | 3.12 | 3.64 | 1.50 |
| Total from investment operations | 1.63 | 3.49 | (7.46) | 3.77 | 4.42 | 2.24 |
| Distributions from net investment income | (.66) | (.59) | (.68) | (.22) | (.76) | (.48) |
| Distributions from net realized gain | (.19) | (.06) | (7.22) | (.32) | – | (.29) |
| Total distributions | (.85) | (.65) | (7.90) | (.54) | (.76) | (.77) |
| Redemption fees added to paid in capitalA,B | – | – | – | – | – | – |
| Net asset value, end of period | $49.06 | $48.28 | $45.44 | $60.80 | $57.57 | $53.91 |
| Total ReturnC,D | 3.36% | 7.83% | (14.05)% | 6.62% | 8.34% | 4.38% |
| Ratios to Average Net AssetsE,F | | | | | | |
| Expenses before reductions | .99%G | 1.14% | 1.13% | 1.00% | .86% | .76% |
| Expenses net of fee waivers, if any | .99%G | 1.13% | 1.12% | 1.00% | .86% | .76% |
| Expenses net of all reductions | .99%G | 1.13% | 1.12% | 1.00% | .85% | .76% |
| Net investment income (loss) | 1.28%G | 1.41% | 1.21% | 1.08% | 1.43% | 1.42% |
| Supplemental Data | | | | | | |
| Net assets, end of period (000 omitted) | $45,471 | $41,217 | $14,846 | $30,165 | $30,831 | $59,245 |
| Portfolio turnover rateH | 40%G | 44% | 24% | 85% | 64% | 86% |
A Calculated based on average shares outstanding during the period.
B Amount represents less than $.005 per share.
C Total returns for periods of less than one year are not annualized.
D Total returns would have been lower if certain expenses had not been reduced during the applicable periods shown.
E Fees and expenses of any underlying Fidelity Central Funds are not included in the Fund's expense ratio. The Fund indirectly bears its proportionate share of the expenses of any underlying Fidelity Central Funds.
F Expense ratios reflect operating expenses of the class. Expenses before reductions do not reflect amounts reimbursed by the investment adviser or reductions from brokerage service arrangements or reductions from other expense offset arrangements and do not represent the amount paid by the class during periods when reimbursements or reductions occur. Expenses net of fee waivers reflect expenses after reimbursement by the investment adviser but prior to reductions from brokerage service arrangements or other expense offset arrangements. Expenses net of all reductions represent the net expenses paid by the class.
G Annualized
H Amount does not include the portfolio activity of any underlying Fidelity Central Funds.
See accompanying notes which are an integral part of the financial statements.
Notes to Financial Statements (Unaudited)
For the period ended April 30, 2017
1. Organization.
Fidelity Canada Fund (the Fund) is a fund of Fidelity Investment Trust (the Trust) and is authorized to issue an unlimited number of shares. The Trust is registered under the Investment Company Act of 1940, as amended (the 1940 Act), as an open-end management investment company organized as a Massachusetts business trust. The Fund offers Class A, Class M (formerly Class T), Class C, Canada and Class I shares, each of which has equal rights as to assets and voting privileges. Each class has exclusive voting rights with respect to matters that affect that class.
After the close of business on June 24, 2016, all outstanding Class B shares were converted to Class A shares. All prior fiscal period dollar and share amounts for Class B presented in the Notes to Financial Statements are for the period November 1, 2015 through June 24, 2016.
2. Investments in Fidelity Central Funds.
The Fund invests in Fidelity Central Funds, which are open-end investment companies generally available only to other investment companies and accounts managed by the investment adviser and its affiliates. The Fund's Schedule of Investments lists each of the Fidelity Central Funds held as of period end, if any, as an investment of the Fund, but does not include the underlying holdings of each Fidelity Central Fund. As an Investing Fund, the Fund indirectly bears its proportionate share of the expenses of the underlying Fidelity Central Funds.
The Money Market Central Funds seek preservation of capital and current income and are managed by Fidelity Investments Money Management, Inc. (FIMM), an affiliate of the investment adviser. Annualized expenses of the Money Market Central Funds as of their most recent shareholder report date are less than .005%.
A complete unaudited list of holdings for each Fidelity Central Fund is available upon request or at the Securities and Exchange Commission (the SEC) website at www.sec.gov. In addition, the financial statements of the Fidelity Central Funds are available on the SEC website or upon request.
3. Significant Accounting Policies.
The Fund is an investment company and applies the accounting and reporting guidance of the Financial Accounting Standards Board (FASB) Accounting Standards Codification Topic 946 Financial Services – Investments Companies. The financial statements have been prepared in conformity with accounting principles generally accepted in the United States of America (GAAP), which require management to make certain estimates and assumptions at the date of the financial statements. Actual results could differ from those estimates. Subsequent events, if any, through the date that the financial statements were issued have been evaluated in the preparation of the financial statements. The following summarizes the significant accounting policies of the Fund:
Investment Valuation. Investments are valued as of 4:00 p.m. Eastern time on the last calendar day of the period. The Board of Trustees (the Board) has delegated the day to day responsibility for the valuation of the Fund's investments to the Fair Value Committee (the Committee) established by the Fund's investment adviser. In accordance with valuation policies and procedures approved by the Board, the Fund attempts to obtain prices from one or more third party pricing vendors or brokers to value its investments. When current market prices, quotations or currency exchange rates are not readily available or reliable, investments will be fair valued in good faith by the Committee, in accordance with procedures adopted by the Board. Factors used in determining fair value vary by investment type and may include market or investment specific events. The frequency with which these procedures are used cannot be predicted and they may be utilized to a significant extent. The Committee oversees the Fund's valuation policies and procedures and reports to the Board on the Committee's activities and fair value determinations. The Board monitors the appropriateness of the procedures used in valuing the Fund's investments and ratifies the fair value determinations of the Committee.
The Fund categorizes the inputs to valuation techniques used to value its investments into a disclosure hierarchy consisting of three levels as shown below:
- Level 1 – quoted prices in active markets for identical investments
- Level 2 – other significant observable inputs (including quoted prices for similar investments, interest rates, prepayment speeds, etc.)
- Level 3 – unobservable inputs (including the Fund's own assumptions based on the best information available)
Valuation techniques used to value the Fund's investments by major category are as follows:
Equity securities, including restricted securities, for which market quotations are readily available, are valued at the last reported sale price or official closing price as reported by a third party pricing vendor on the primary market or exchange on which they are traded and are categorized as Level 1 in the hierarchy. In the event there were no sales during the day or closing prices are not available, securities are valued at the last quoted bid price or may be valued using the last available price and are generally categorized as Level 2 in the hierarchy. For foreign equity securities, when market or security specific events arise, comparisons to the valuation of American Depositary Receipts (ADRs), futures contracts, Exchange-Traded Funds (ETFs) and certain indexes as well as quoted prices for similar securities may be used and would be categorized as Level 2 in the hierarchy. Utilizing these techniques may result in transfers between Level 1 and Level 2. For equity securities, including restricted securities, where observable inputs are limited, assumptions about market activity and risk are used and these securities may be categorized as Level 3 in the hierarchy.
Investments in open-end mutual funds, including the Fidelity Central Funds, are valued at their closing net asset value (NAV) each business day and are categorized as Level 1 in the hierarchy.
Changes in valuation techniques may result in transfers in or out of an assigned level within the disclosure hierarchy. The aggregate value of investments by input level as of April 30, 2017 is included at the end of the Fund's Schedule of Investments.
Foreign Currency. The Fund may use foreign currency contracts to facilitate transactions in foreign-denominated securities. Gains and losses from these transactions may arise from changes in the value of the foreign currency or if the counterparties do not perform under the contracts' terms.
Foreign-denominated assets, including investment securities, and liabilities are translated into U.S. dollars at the exchange rates at period end. Purchases and sales of investment securities, income and dividends received and expenses denominated in foreign currencies are translated into U.S. dollars at the exchange rate in effect on the transaction date.
The effects of exchange rate fluctuations on investments are included with the net realized and unrealized gain (loss) on investment securities. Other foreign currency transactions resulting in realized and unrealized gain (loss) are disclosed separately.
Investment Transactions and Income. For financial reporting purposes, the Fund's investment holdings and NAV include trades executed through the end of the last business day of the period. The NAV per share for processing shareholder transactions is calculated as of the close of business of the New York Stock Exchange (NYSE), normally 4:00 p.m. Eastern time and includes trades executed through the end of the prior business day. Gains and losses on securities sold are determined on the basis of identified cost and may include proceeds received from litigation. Dividend income is recorded on the ex-dividend date, except for certain dividends from foreign securities where the ex-dividend date may have passed, which are recorded as soon as the Fund is informed of the ex-dividend date. Non-cash dividends included in dividend income, if any, are recorded at the fair market value of the securities received. Income and capital gain distributions from Fidelity Central Funds, if any, are recorded on the ex-dividend date. Certain distributions received by the Fund represent a return of capital or capital gain. The Fund determines the components of these distributions subsequent to the ex-dividend date, based upon receipt of tax filings or other correspondence relating to the underlying investment. These distributions are recorded as a reduction of cost of investments and/or as a realized gain. Investment income is recorded net of foreign taxes withheld where recovery of such taxes is uncertain.
Class Allocations and Expenses. Investment income, realized and unrealized capital gains and losses, common expenses of the Fund, and certain fund-level expense reductions, if any, are allocated daily on a pro-rata basis to each class based on the relative net assets of each class to the total net assets of the Fund. Each class differs with respect to transfer agent and distribution and service plan fees incurred. Certain expense reductions may also differ by class. For the reporting period, the allocated portion of income and expenses to each class as a percent of its average net assets may vary due to the timing of recording these transactions in relation to fluctuating net assets of the classes. Expenses directly attributable to a fund are charged to that fund. Expenses attributable to more than one fund are allocated among the respective funds on the basis of relative net assets or other appropriate methods. Expense estimates are accrued in the period to which they relate and adjustments are made when actual amounts are known.
Income Tax Information and Distributions to Shareholders. Each year, the Fund intends to qualify as a regulated investment company under Subchapter M of the Internal Revenue Code, including distributing substantially all of its taxable income and realized gains. As a result, no provision for U.S. Federal income taxes is required. The Fund files a U.S. federal tax return, in addition to state and local tax returns as required. The Fund's federal income tax returns are subject to examination by the Internal Revenue Service (IRS) for a period of three fiscal years after they are filed. State and local tax returns may be subject to examination for an additional fiscal year depending on the jurisdiction. Foreign taxes are provided for based on the Fund's understanding of the tax rules and rates that exist in the foreign markets in which it invests.
Distributions are declared and recorded on the ex-dividend date. Income dividends and capital gain distributions are declared separately for each class. Income and capital gain distributions are determined in accordance with income tax regulations, which may differ from GAAP.
Capital accounts within the financial statements are adjusted for permanent book-tax differences. These adjustments have no impact on net assets or the results of operations. Capital accounts are not adjusted for temporary book-tax differences which will reverse in a subsequent period.
Book-tax differences are primarily due to foreign currency transactions, passive foreign investment companies (PFIC), partnerships, capital loss carryforwards, deferred trustees compensation and losses deferred due to wash sales.
The federal tax cost of investment securities and unrealized appreciation (depreciation) as of period end were as follows:
| Gross unrealized appreciation | $306,056,975 |
| Gross unrealized depreciation | (52,684,122) |
| Net unrealized appreciation (depreciation) on securities | $253,372,853 |
| Tax cost | $1,045,114,591 |
Capital loss carryforwards are only available to offset future capital gains of the Fund to the extent provided by regulations and may be limited. Under the Regulated Investment Company Modernization Act of 2010 (the Act), the Fund is permitted to carry forward capital losses incurred in taxable years beginning after December 22, 2010 for an unlimited period and such capital losses are required to be used prior to any losses that expire. The capital loss carryforward information presented below, including any applicable limitation, is estimated as of prior fiscal period end and is subject to adjustment.
| No expiration | |
| Short-term | $(3,213,379) |
| Long-term | (34,724,041) |
| Total capital loss carryforward | $(37,937,420) |
Short-Term Trading (Redemption) Fees. Shares held by investors in the Fund less than 90 days may have been subject to a redemption fee equal to 1.50% of the NAV of shares redeemed. All redemption fees, which reduce the proceeds of the shareholder redemption, are retained by the Fund and accounted for as an addition to paid in capital.
Delayed Delivery Transactions and When-Issued Securities. During the period, the Fund transacted in securities on a delayed delivery or when-issued basis. Payment and delivery may take place after the customary settlement period for that security. The price of the underlying securities and the date when the securities will be delivered and paid for are fixed at the time the transaction is negotiated. The securities purchased on a delayed delivery or when-issued basis are identified as such in the Fund's Schedule of Investments. With respect to purchase commitments, the Fund identifies securities as segregated in its records with a value at least equal to the amount of the commitment. Losses may arise due to changes in the value of the underlying securities or if the counterparty does not perform under the contract's terms, or if the issuer does not issue the securities due to political, economic, or other factors.
Restricted Securities. The Fund may invest in securities that are subject to legal or contractual restrictions on resale. These securities generally may be resold in transactions exempt from registration or to the public if the securities are registered. Disposal of these securities may involve time-consuming negotiations and expense, and prompt sale at an acceptable price may be difficult. Information regarding restricted securities is included at the end of the Fund's Schedule of Investments.
4. Purchases and Sales of Investments.
Purchases and sales of securities, other than short-term securities, aggregated $261,518,704 and $343,965,365, respectively.
5. Fees and Other Transactions with Affiliates.
Management Fee. Fidelity Management & Research Company (the investment adviser) and its affiliates provide the Fund with investment management related services for which the Fund pays a monthly management fee. The management fee is the sum of an individual fund fee rate that is based on an annual rate of .45% of the Fund's average net assets and an annualized group fee rate that averaged .25% during the period. The group fee rate is based upon the average net assets of all the mutual funds advised by the investment adviser, including any mutual funds previously advised by the investment adviser that are currently advised by Fidelity SelectCo, LLC, an affiliate of the investment adviser. The group fee rate decreases as assets under management increase and increases as assets under management decrease. In addition, the management fee is subject to a performance adjustment (up to a maximum of +/- .20% of the Fund's average net assets over a 36 month performance period). The upward or downward adjustment to the management fee is based on the relative investment performance of Canada as compared to its benchmark index, the S&P/TSX Composite Index, over the same 36 month performance period. For the reporting period, the total annualized management fee rate, including the performance adjustment, was .74% of the Fund's average net assets. The performance adjustment included in the management fee rate may be higher or lower than the maximum performance adjustment rate due to the difference between the average net assets for the reporting and performance periods.
Distribution and Service Plan Fees. In accordance with Rule 12b-1 of the 1940 Act, the Fund has adopted separate Distribution and Service Plans for each class of shares. Certain classes pay Fidelity Distributors Corporation (FDC), an affiliate of the investment adviser, separate Distribution and Service Fees, each of which is based on an annual percentage of each class' average net assets. In addition, FDC may pay financial intermediaries for selling shares of the Fund and providing shareholder support services. For the period, the Distribution and Service Fee rates, total fees and amounts retained by FDC were as follows:
| | Distribution
Fee | Service
Fee | Total Fees | Retained
by FDC |
| Class A | -% | .25% | $53,571 | $189 |
| Class M | .25% | .25% | 29,016 | 137 |
| Class C | .75% | .25% | 90,669 | 3,886 |
| | | | $173,256 | $4,212 |
Sales Load. FDC may receive a front-end sales charge of up to 5.75% for selling Class A shares and 3.50% for selling Class M shares, some of which is paid to financial intermediaries for selling shares of the Fund. Depending on the holding period, FDC may receive contingent deferred sales charges levied on Class A, Class M, and Class C redemptions. The deferred sales charges are 1.00% for Class C shares, 1.00% for certain purchases of Class A shares and .25% for certain purchases of Class M shares.
For the period, sales charge amounts retained by FDC were as follows:
| | Retained
by FDC |
| Class A | $3,544 |
| Class M | 1,299 |
| Class C(a) | 104 |
| | $4,947 |
(a) When Class C shares are initially sold, FDC pays commissions from its own resources to financial intermediaries through which the sales are made.
Transfer Agent Fees. Fidelity Investments Institutional Operations Company, Inc., (FIIOC), an affiliate of the investment adviser, is the transfer, dividend disbursing and shareholder servicing agent for each class of the Fund. FIIOC receives account fees and asset-based fees that vary according to the account size and type of account of the shareholders of the respective classes of the Fund. FIIOC pays for typesetting, printing and mailing of shareholder reports, except proxy statements.
For the period, transfer agent fees for each class were as follows:
| | Amount | % of
Class-Level Average
Net Assets(a) |
| Class A | $60,050 | .28 |
| Class M | 18,556 | .32 |
| Class C | 23,029 | .25 |
| Canada | 1,315,494 | .21 |
| Class I | 40,218 | .18 |
| | $1,457,347 | |
(a) Annualized
Accounting and Security Lending Fees. Fidelity Service Company, Inc. (FSC), an affiliate of the investment adviser, maintains the Fund's accounting records. The accounting fee is based on the level of average net assets for each month. Under a separate contract, FSC administers the security lending program. The security lending fee is based on the number and duration of lending transactions.
Brokerage Commissions. The Fund placed a portion of its portfolio transactions with brokerage firms which are affiliates of the investment adviser. Brokerage commissions are included in net realized gain (loss) and change in net unrealized appreciation (depreciation) in the Statement of Operations. The commissions paid to these affiliated firms were $43 for the period.
Interfund Trades. The Fund may purchase from or sell securities to other Fidelity Funds under procedures adopted by the Board. The procedures have been designed to ensure these interfund trades are executed in accordance with Rule 17a-7 of the 1940 Act. Interfund trades are included within the respective purchases and sales amounts shown in the Purchases and Sales of Investments note.
6. Committed Line of Credit.
The Fund participates with other funds managed by the investment adviser or an affiliate in a $4.25 billion credit facility (the "line of credit") to be utilized for temporary or emergency purposes to fund shareholder redemptions or for other short-term liquidity purposes. The Fund has agreed to pay commitment fees on its pro-rata portion of the line of credit, which amounted to $2,333 and is reflected in Miscellaneous expenses on the Statement of Operations. During the period, the Fund did not borrow on this line of credit.
7. Security Lending.
The Fund lends portfolio securities through a lending agent from time to time in order to earn additional income. For equity securities, a lending agent is used and may loan securities to certain qualified borrowers, including Fidelity Capital Markets (FCM), a broker-dealer affiliated with the Fund. On the settlement date of the loan, the Fund receives collateral (in the form of U.S. Treasury obligations, letters of credit and/or cash) against the loaned securities and maintains collateral in an amount not less than 100% of the market value of the loaned securities during the period of the loan. The market value of the loaned securities is determined at the close of business of the Fund and any additional required collateral is delivered to the Fund on the next business day. The Fund or borrower may terminate the loan at any time, and if the borrower defaults on its obligation to return the securities loaned because of insolvency or other reasons, the Fund may apply collateral received from the borrower against the obligation. The Fund may experience delays and costs in recovering the securities loaned. Any cash collateral received is invested in the Fidelity Securities Lending Cash Central Fund. The value of loaned securities and cash collateral at period end are disclosed on the Fund's Statement of Assets and Liabilities. The value of securities loaned to FCM at period end was $429,313. Security lending income represents the income earned on investing cash collateral, less rebates paid to borrowers and any lending agent fees associated with the loan, plus any premium payments received for lending certain types of securities. Security lending income is presented in the Statement of Operations as a component of income from Fidelity Central Funds. Total security lending income during the period amounted to $451,748, including $3,696 from securities loaned to FCM.
8. Expense Reductions.
Commissions paid to certain brokers with whom the investment adviser, or its affiliates, places trades on behalf of the Fund include an amount in addition to trade execution, which may be rebated back to the Fund to offset certain expenses. This amount totaled $8,751 for the period. In addition, through arrangements with the Fund's custodian, credits realized as a result of certain uninvested cash balances were used to reduce the Fund's expenses. During the period, these credits reduced the Fund's custody expenses by $2.
In addition, during the period the investment adviser reimbursed and/or waived a portion of fund level operating expenses in the amount of $6,138.
9. Distributions to Shareholders.
Distributions to shareholders of each class were as follows:
| | Six months ended April 30, 2017 | Year ended October 31, 2016 |
| From net investment income | | |
| Class A | $406,836 | $482,934 |
| Class M | 78,661 | 79,315 |
| Class C | 39,905 | 8,502 |
| Canada | 15,352,959 | 16,735,044 |
| Class I | 565,020 | 156,283 |
| Total | $16,443,381 | $17,462,078 |
| From net realized gain | | |
| Class A | $168,842 | $69,321 |
| Class M | 43,752 | 16,639 |
| Class B | – | 3,460 |
| Class C | 71,450 | 28,339 |
| Canada | 4,723,987 | 1,638,014 |
| Class I | 160,945 | 16,001 |
| Total | $5,168,976 | $1,771,774 |
10. Share Transactions.
Share transactions for each class were as follows and may contain automatic conversions between classes or exchanges between affiliated funds:
| | Shares | Shares | Dollars | Dollars |
| | Six months ended April 30, 2017 | Year ended October 31, 2016 | Six months ended April 30, 2017 | Year ended October 31, 2016 |
| Class A | | | | |
| Shares sold | 42,681 | 134,113 | $2,103,413 | $6,147,050 |
| Reinvestment of distributions | 10,631 | 11,425 | 525,595 | 496,287 |
| Shares redeemed | (194,308) | (515,795) | (9,610,765) | (23,017,589) |
| Net increase (decrease) | (140,996) | (370,257) | $(6,981,757) | $(16,374,252) |
| Class M | | | | |
| Shares sold | 16,981 | 23,059 | $835,568 | $1,036,279 |
| Reinvestment of distributions | 2,464 | 2,169 | 121,397 | 93,951 |
| Shares redeemed | (19,476) | (77,250) | (959,360) | (3,322,138) |
| Net increase (decrease) | (31) | (52,022) | $(2,395) | $(2,191,908) |
| Class B | | | | |
| Shares sold | – | 499 | $– | $21,798 |
| Reinvestment of distributions | – | 68 | – | 2,895 |
| Shares redeemed | – | (61,115) | – | (2,725,253) |
| Net increase (decrease) | – | (60,548) | $– | $(2,700,560) |
| Class C | | | | |
| Shares sold | 19,473 | 41,578 | $941,259 | $1,834,681 |
| Reinvestment of distributions | 1,995 | 731 | 96,717 | 31,141 |
| Shares redeemed | (68,036) | (138,754) | (3,280,065) | (5,980,751) |
| Net increase (decrease) | (46,568) | (96,445) | $(2,242,089) | $(4,114,929) |
| Canada | | | | |
| Shares sold | 1,318,095 | 3,590,664 | $65,362,039 | $166,771,731 |
| Reinvestment of distributions | 381,896 | 388,588 | 18,930,598 | 16,926,879 |
| Shares redeemed | (3,019,477) | (6,566,019) | (149,388,409) | (289,731,847) |
| Net increase (decrease) | (1,319,486) | (2,586,767) | $(65,095,772) | $(106,033,237) |
| Class I | | | | |
| Shares sold | 140,001 | 807,708 | $6,942,151 | $37,813,282 |
| Reinvestment of distributions | 14,338 | 2,849 | 709,005 | 123,890 |
| Shares redeemed | (81,143) | (283,652) | (4,011,669) | (12,076,497) |
| Net increase (decrease) | 73,196 | 526,905 | $3,639,487 | $25,860,675 |
11. Other.
The Fund's organizational documents provide former and current trustees and officers with a limited indemnification against liabilities arising in connection with the performance of their duties to the Fund. In the normal course of business, the Fund may also enter into contracts that provide general indemnifications. The Fund's maximum exposure under these arrangements is unknown as this would be dependent on future claims that may be made against the Fund. The risk of material loss from such claims is considered remote.
Shareholder Expense Example
As a shareholder of the Fund, you incur two types of costs: (1) transaction costs, including sales charges (loads) on purchase payments or redemption proceeds, redemption fees and (2) ongoing costs, including management fees, distribution and/or service (12b-1) fees and other Fund expenses. This Example is intended to help you understand your ongoing costs (in dollars) of investing in the Fund and to compare these costs with the ongoing costs of investing in other mutual funds.
The Example is based on an investment of $1,000 invested at the beginning of the period and held for the entire period (November 1, 2016 to April 30, 2017).
Actual Expenses
The first line of the accompanying table for each class of the Fund provides information about actual account values and actual expenses. You may use the information in this line, together with the amount you invested, to estimate the expenses that you paid over the period. Simply divide your account value by $1,000.00 (for example, an $8,600 account value divided by $1,000.00 = 8.6), then multiply the result by the number in the first line for a class of the Fund under the heading entitled "Expenses Paid During Period" to estimate the expenses you paid on your account during this period. A small balance maintenance fee of $12.00 that is charged once a year may apply for certain accounts with a value of less than $2,000. This fee is not included in the table below. If it was, the estimate of expenses you paid during the period would be higher, and your ending account value lower, by this amount. In addition, the Fund, as a shareholder in the underlying Fidelity Central Funds, will indirectly bear its pro-rata share of the fees and expenses incurred by the underlying Fidelity Central Funds. These fees and expenses are not included in the Fund's annualized expense ratio used to calculate the expense estimate in the table below.
Hypothetical Example for Comparison Purposes
The second line of the accompanying table for each class of the Fund provides information about hypothetical account values and hypothetical expenses based on a Class' actual expense ratio and an assumed rate of return of 5% per year before expenses, which is not the Class' actual return. The hypothetical account values and expenses may not be used to estimate the actual ending account balance or expenses you paid for the period. You may use this information to compare the ongoing costs of investing in the Fund and other funds. To do so, compare this 5% hypothetical example with the 5% hypothetical examples that appear in the shareholder reports of the other funds. A small balance maintenance fee of $12.00 that is charged once a year may apply for certain accounts with a value of less than $2,000. This fee is not included in the table below. If it was, the estimate of expenses you paid during the period would be higher, and your ending account value lower, by this amount. In addition, the Fund, as a shareholder in the underlying Fidelity Central Funds, will indirectly bear its pro-rata share of the fees and expenses incurred by the underlying Fidelity Central Funds. These fees and expenses are not included in the Fund's annualized expense ratio used to calculate the expense estimate in the table below.
Please note that the expenses shown in the table are meant to highlight your ongoing costs only and do not reflect any transaction costs. Therefore, the second line of the table is useful in comparing ongoing costs only, and will not help you determine the relative total costs of owning different funds. In addition, if these transactional costs were included, your costs would have been higher.
| | Annualized Expense Ratio-A | Beginning
Account Value
November 1, 2016 | Ending
Account Value
April 30, 2017 | Expenses Paid
During Period-B
November 1, 2016
to April 30, 2017 |
| Class A | 1.34% | | | |
| Actual | | $1,000.00 | $1,031.70 | $6.75 |
| Hypothetical-C | | $1,000.00 | $1,018.15 | $6.71 |
| Class M | 1.63% | | | |
| Actual | | $1,000.00 | 1,030.10 | 8.20 |
| Hypothetical-C | | $1,000.00 | $1,016.71 | $8.15 |
| Class C | 2.06% | | | |
| Actual | | $1,000.00 | $1,028.20 | $10.36 |
| Hypothetical-C | | $1,000.00 | $1,014.58 | $10.29 |
| Canada | 1.02% | | | |
| Actual | | $1,000.00 | $1,033.60 | $5.14 |
| Hypothetical-C | | $1,000.00 | $1,019.74 | $5.11 |
| Class I | .99% | | | |
| Actual | | $1,000.00 | $1,033.60 | $4.99 |
| Hypothetical-C | | $1,000.00 | $1,019.89 | $4.96 |
A Annualized expense ratio reflects expenses net of applicable fee waivers.
B Expenses are equal to each Class' annualized expense ratio, multiplied by the average account value over the period, multiplied by 181/365 (to reflect the one-half year period).
C 5% return per year before expenses
ACAN-SANN-0617
1.843168.109
Fidelity® Emerging Markets Fund
Class K
Semi-Annual Report April 30, 2017 |
|
Contents
To view a fund's proxy voting guidelines and proxy voting record for the 12-month period ended June 30, visit http://www.fidelity.com/proxyvotingresults or visit the Securities and Exchange Commission's (SEC) web site at http://www.sec.gov.
You may also call 1-800-835-5092 to request a free copy of the proxy voting guidelines.
Standard & Poor's, S&P and S&P 500 are registered service marks of The McGraw-Hill Companies, Inc. and have been licensed for use by Fidelity Distributors Corporation.
Other third-party marks appearing herein are the property of their respective owners.
All other marks appearing herein are registered or unregistered trademarks or service marks of FMR LLC or an affiliated company. © 2017 FMR LLC. All rights reserved.
This report and the financial statements contained herein are submitted for the general information of the shareholders of the Fund. This report is not authorized for distribution to prospective investors in the Fund unless preceded or accompanied by an effective prospectus.
A fund files its complete schedule of portfolio holdings with the SEC for the first and third quarters of each fiscal year on Form N-Q. Forms N-Q are available on the SEC’s web site at http://www.sec.gov. A fund's Forms N-Q may be reviewed and copied at the SEC’s Public Reference Room in Washington, DC. Information regarding the operation of the SEC's Public Reference Room may be obtained by calling 1-800-SEC-0330.
For a complete list of a fund's portfolio holdings, view the most recent holdings listing, semiannual report, or annual report on Fidelity's web site at http://www.fidelity.com, http://www.institutional.fidelity.com, or http://www.401k.com, as applicable.
NOT FDIC INSURED •MAY LOSE VALUE •NO BANK GUARANTEE
Neither the Fund nor Fidelity Distributors Corporation is a bank.
Investment Summary (Unaudited)
Geographic Diversification (% of fund's net assets)
| As of April 30, 2017 |
| | India | 11.6% |
| | Cayman Islands | 10.9% |
| | United States of America* | 9.7% |
| | Brazil | 9.7% |
| | Korea (South) | 8.1% |
| | South Africa | 6.9% |
| | Mexico | 6.4% |
| | Taiwan | 5.4% |
| | China | 5.3% |
| | Other | 26.0% |
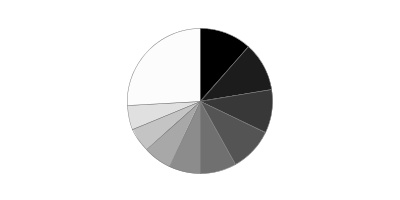
* Includes Short-Term investments and Net Other Assets (Liabilities).
Percentages are based on country or territory of incorporation and are adjusted for the effect of futures contracts, if applicable.
| As of October 31, 2016 |
| | Cayman Islands | 13.4% |
| | India | 11.5% |
| | United States of America* | 10.6% |
| | Brazil | 8.9% |
| | Korea (South) | 7.8% |
| | South Africa | 7.5% |
| | Mexico | 7.3% |
| | Taiwan | 6.0% |
| | Indonesia | 3.6% |
| | Other | 23.4% |
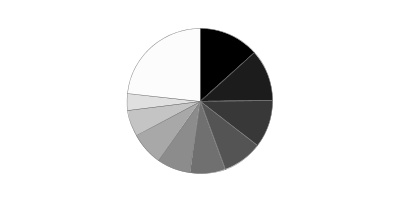
* Includes Short-Term investments and Net Other Assets (Liabilities).
Percentages are based on country or territory of incorporation and are adjusted for the effect of futures contracts, if applicable.
Asset Allocation as of April 30, 2017
| | % of fund's net assets | % of fund's net assets 6 months ago |
| Stocks | 98.0 | 99.2 |
| Short-Term Investments and Net Other Assets (Liabilities) | 2.0 | 0.8 |
Top Ten Stocks as of April 30, 2017
| | % of fund's net assets | % of fund's net assets 6 months ago |
| Samsung Electronics Co. Ltd. (Korea (South), Technology Hardware, Storage & Peripherals) | 5.4 | 3.4 |
| Tencent Holdings Ltd. (Cayman Islands, Internet Software & Services) | 4.5 | 4.2 |
| Taiwan Semiconductor Manufacturing Co. Ltd. (Taiwan, Semiconductors & Semiconductor Equipment) | 4.0 | 4.2 |
| Alibaba Group Holding Ltd. sponsored ADR (Cayman Islands, Internet Software & Services) | 3.4 | 3.2 |
| Naspers Ltd. Class N (South Africa, Media) | 2.3 | 2.4 |
| Itau Unibanco Holding SA (Brazil, Banks) | 1.4 | 1.5 |
| Housing Development Finance Corp. Ltd. (India, Thrifts & Mortgage Finance) | 1.4 | 1.3 |
| Sberbank of Russia (Russia, Banks) | 1.2 | 1.0 |
| Reliance Industries Ltd. (India, Oil, Gas & Consumable Fuels) | 1.1 | 0.0 |
| Ambev SA sponsored ADR (Brazil, Beverages) | 1.0 | 1.2 |
| | 25.7 | |
Top Market Sectors as of April 30, 2017
| | % of fund's net assets | % of fund's net assets 6 months ago |
| Information Technology | 27.5 | 26.2 |
| Financials | 16.3 | 16.8 |
| Consumer Discretionary | 12.8 | 13.5 |
| Consumer Staples | 12.1 | 16.0 |
| Materials | 9.6 | 4.6 |
| Industrials | 7.5 | 8.2 |
| Health Care | 5.8 | 7.6 |
| Energy | 2.4 | 1.4 |
| Utilities | 1.6 | 2.7 |
| Telecommunication Services | 1.2 | 0.5 |
Percentages shown as 0.0% may reflect amounts less than 0.05%.
Investments April 30, 2017 (Unaudited)
Showing Percentage of Net Assets
| Common Stocks - 94.2% | | | |
| | | Shares | Value |
| Australia - 0.5% | | | |
| Amcor Ltd. | | 1,683,018 | $19,798,431 |
| Belgium - 0.5% | | | |
| Anheuser-Busch InBev SA NV | | 180,800 | 20,388,883 |
| Bermuda - 0.7% | | | |
| Credicorp Ltd. (United States) | | 188,532 | 28,969,827 |
| Brazil - 6.5% | | | |
| BB Seguridade Participacoes SA | | 2,758,820 | 25,979,783 |
| Cielo SA | | 3,476,744 | 26,398,302 |
| Drogasil SA (a) | | 1,198,400 | 25,466,543 |
| Equatorial Energia SA | | 1,209,300 | 21,903,454 |
| Kroton Educacional SA | | 5,528,160 | 26,038,025 |
| Qualicorp SA | | 3,265,400 | 23,250,434 |
| Smiles SA | | 984,800 | 21,420,769 |
| Ultrapar Participacoes SA | | 1,152,100 | 25,560,682 |
| Vale SA sponsored ADR | | 4,590,900 | 39,389,922 |
| Weg SA (a) | | 4,196,290 | 23,400,492 |
|
| TOTAL BRAZIL | | | 258,808,406 |
|
| Cayman Islands - 10.9% | | | |
| Alibaba Group Holding Ltd. sponsored ADR (a) | | 1,167,400 | 134,834,700 |
| Ctrip.com International Ltd. ADR (a) | | 699,100 | 35,311,541 |
| NetEase, Inc. ADR | | 141,600 | 37,579,224 |
| New Oriental Education & Technology Group, Inc. sponsored ADR (a) | | 427,400 | 27,584,396 |
| Shenzhou International Group Holdings Ltd. | | 3,407,000 | 22,426,144 |
| Tencent Holdings Ltd. | | 5,716,800 | 179,126,432 |
|
| TOTAL CAYMAN ISLANDS | | | 436,862,437 |
|
| Chile - 0.6% | | | |
| Sociedad Quimica y Minera de Chile SA (PN-B) sponsored ADR | | 645,500 | 22,947,525 |
| China - 5.3% | | | |
| Gree Electric Appliances, Inc. of Zhuhai Class A | | 4,815,167 | 23,050,774 |
| Hangzhou Hikvision Digital Technology Co. Ltd. Class A | | 4,459,800 | 23,659,228 |
| Inner Mongoli Yili Industries Co. Ltd. (A Shares) | | 6,940,808 | 18,385,313 |
| Jiangsu Hengrui Medicine Co. Ltd. (A Shares) | | 2,678,268 | 20,836,369 |
| Kweichow Moutai Co. Ltd. (A Shares) | | 353,998 | 21,233,204 |
| Midea Group Co. Ltd. Class A | | 4,120,700 | 20,120,804 |
| Shanghai International Airport Co. Ltd. (A Shares) | | 4,524,900 | 22,481,733 |
| Sinopharm Group Co. Ltd. (H Shares) | | 5,007,600 | 22,468,164 |
| Wuliangye Yibin Co. Ltd. Class A | | 3,265,100 | 21,551,034 |
| Yunnan Baiyao Group Co. Ltd. | | 1,572,897 | 19,508,623 |
|
| TOTAL CHINA | | | 213,295,246 |
|
| France - 1.0% | | | |
| Dassault Systemes SA | | 226,762 | 20,237,681 |
| LVMH Moet Hennessy - Louis Vuitton SA | | 82,339 | 20,326,939 |
|
| TOTAL FRANCE | | | 40,564,620 |
|
| Germany - 0.5% | | | |
| Symrise AG | | 296,000 | 20,722,756 |
| Greece - 0.5% | | | |
| Titan Cement Co. SA (Reg.) | | 814,400 | 21,282,151 |
| Hong Kong - 2.3% | | | |
| AIA Group Ltd. | | 3,148,200 | 21,795,184 |
| CSPC Pharmaceutical Group Ltd. | | 17,990,000 | 24,978,562 |
| Guangdong Investment Ltd. | | 16,109,000 | 24,934,898 |
| Techtronic Industries Co. Ltd. | | 4,695,000 | 20,160,188 |
|
| TOTAL HONG KONG | | | 91,868,832 |
|
| India - 11.0% | | | |
| Adani Ports & Special Economic Zone Ltd. (a) | | 4,577,285 | 23,331,409 |
| Amara Raja Batteries Ltd. (a) | | 1,493,643 | 20,679,602 |
| Asian Paints Ltd. | | 1,414,085 | 24,644,759 |
| Eicher Motors Ltd. | | 58,476 | 23,710,567 |
| Godrej Consumer Products Ltd. | | 922,442 | 25,005,941 |
| HDFC Bank Ltd. | | 1,067,970 | 26,071,151 |
| Hero Motocorp Ltd. | | 406,199 | 20,967,678 |
| Hindustan Zinc Ltd. | | 4,532,075 | 18,888,933 |
| Housing Development Finance Corp. Ltd. | | 2,258,779 | 54,006,566 |
| IndusInd Bank Ltd. (a) | | 1,048,802 | 23,572,351 |
| ITC Ltd. | | 7,640,825 | 33,040,121 |
| LIC Housing Finance Ltd. | | 2,595,838 | 27,008,182 |
| Maruti Suzuki India Ltd. | | 292,978 | 29,734,601 |
| Power Grid Corp. of India Ltd. | | 6,452,598 | 20,876,348 |
| Reliance Industries Ltd. | | 2,043,154 | 44,339,842 |
| Zee Entertainment Enterprises Ltd. | | 2,972,445 | 24,358,884 |
|
| TOTAL INDIA | | | 440,236,935 |
|
| Indonesia - 2.5% | | | |
| PT Bank Central Asia Tbk | | 26,084,900 | 34,736,813 |
| PT Bank Rakyat Indonesia Tbk | | 30,827,200 | 29,835,012 |
| PT Surya Citra Media Tbk | | 16,365,600 | 3,511,562 |
| PT Telkomunikasi Indonesia Tbk Series B | | 90,143,200 | 29,737,029 |
|
| TOTAL INDONESIA | | | 97,820,416 |
|
| Ireland - 0.5% | | | |
| Accenture PLC Class A | | 166,400 | 20,184,320 |
| Israel - 1.2% | | | |
| Check Point Software Technologies Ltd. (a) | | 186,200 | 19,366,662 |
| Elbit Systems Ltd. (Israel) | | 37,177 | 4,762,846 |
| Frutarom Industries Ltd. | | 374,100 | 21,990,692 |
|
| TOTAL ISRAEL | | | 46,120,200 |
|
| Kenya - 0.5% | | | |
| Safaricom Ltd. | | 107,079,700 | 19,973,684 |
| Korea (South) - 8.1% | | | |
| BGFretail Co. Ltd. | | 207,950 | 20,016,284 |
| Coway Co. Ltd. | | 283,638 | 25,057,682 |
| LG Household & Health Care Ltd. | | 36,948 | 28,126,730 |
| NAVER Corp. | | 51,873 | 36,478,903 |
| Samsung Electronics Co. Ltd. | | 108,834 | 213,439,391 |
|
| TOTAL KOREA (SOUTH) | | | 323,118,990 |
|
| Luxembourg - 0.6% | | | |
| Eurofins Scientific SA | | 43,560 | 21,452,103 |
| Mexico - 6.4% | | | |
| CEMEX S.A.B. de CV sponsored ADR | | 3,425,500 | 31,583,110 |
| Embotelladoras Arca S.A.B. de CV | | 3,439,700 | 25,373,960 |
| Fomento Economico Mexicano S.A.B. de CV unit | | 3,791,767 | 34,122,429 |
| Gruma S.A.B. de CV Series B | | 1,677,810 | 22,404,371 |
| Grupo Aeroportuario del Pacifico S.A.B. de CV Series B | | 2,360,857 | 24,279,195 |
| Grupo Aeroportuario del Sureste S.A.B. de CV Series B | | 1,333,505 | 25,304,028 |
| Grupo Aeroportuario Norte S.A.B. de CV | | 3,617,200 | 20,073,512 |
| Grupo Cementos de Chihuahua S.A.B. de CV | | 4,216,400 | 19,998,797 |
| Grupo Mexico SA de CV Series B | | 9,943,800 | 29,247,325 |
| Promotora y Operadora de Infraestructura S.A.B. de CV | | 2,203,045 | 23,505,856 |
|
| TOTAL MEXICO | | | 255,892,583 |
|
| Netherlands - 1.1% | | | |
| ASML Holding NV (Netherlands) | | 144,500 | 19,100,957 |
| Yandex NV Series A (a) | | 872,500 | 23,784,350 |
|
| TOTAL NETHERLANDS | | | 42,885,307 |
|
| Philippines - 2.9% | | | |
| Ayala Corp. | | 1,419,650 | 24,528,214 |
| Ayala Land, Inc. | | 34,435,800 | 24,238,233 |
| D&L Industries, Inc. | | 74,318,700 | 18,968,114 |
| SM Investments Corp. | | 1,656,903 | 24,051,631 |
| SM Prime Holdings, Inc. | | 40,026,600 | 23,783,789 |
|
| TOTAL PHILIPPINES | | | 115,569,981 |
|
| Russia - 3.2% | | | |
| Alrosa Co. Ltd. (a) | | 13,213,000 | 22,771,050 |
| Magnit OJSC | | 182,544 | 28,140,547 |
| NOVATEK OAO GDR (Reg. S) | | 238,100 | 28,857,720 |
| Sberbank of Russia | | 16,836,460 | 48,902,476 |
|
| TOTAL RUSSIA | | | 128,671,793 |
|
| South Africa - 6.9% | | | |
| Aspen Pharmacare Holdings Ltd. | | 1,266,090 | 26,264,943 |
| Bidcorp Ltd. | | 1,239,098 | 26,252,976 |
| Capitec Bank Holdings Ltd. | | 413,200 | 23,577,329 |
| Discovery Ltd. | | 2,264,085 | 22,668,381 |
| FirstRand Ltd. | | 8,964,700 | 33,440,486 |
| Mondi Ltd. | | 971,866 | 25,215,609 |
| Naspers Ltd. Class N | | 495,612 | 94,241,372 |
| Sanlam Ltd. | | 4,740,100 | 25,144,566 |
|
| TOTAL SOUTH AFRICA | | | 276,805,662 |
|
| Spain - 0.5% | | | |
| Amadeus IT Holding SA Class A | | 378,500 | 20,408,852 |
| Sweden - 0.5% | | | |
| ASSA ABLOY AB (B Shares) | | 940,200 | 20,370,133 |
| Switzerland - 0.6% | | | |
| Sika AG | | 3,570 | 22,783,417 |
| Taiwan - 5.4% | | | |
| Advantech Co. Ltd. | | 2,710,000 | 21,878,702 |
| Largan Precision Co. Ltd. | | 215,000 | 35,675,644 |
| Taiwan Semiconductor Manufacturing Co. Ltd. | | 24,812,000 | 159,561,285 |
|
| TOTAL TAIWAN | | | 217,115,631 |
|
| Thailand - 1.1% | | | |
| Airports of Thailand PCL (For. Reg.) | | 20,182,400 | 23,478,081 |
| Thai Beverage PCL | | 32,033,000 | 21,207,834 |
|
| TOTAL THAILAND | | | 44,685,915 |
|
| Turkey - 0.5% | | | |
| Tofas Turk Otomobil Fabrikasi A/S | | 2,469,930 | 20,569,132 |
| United Arab Emirates - 0.6% | | | |
| National Bank of Abu Dhabi PJSC (a) | | 7,810,734 | 23,391,798 |
| United Kingdom - 3.1% | | | |
| British American Tobacco PLC (United Kingdom) | | 311,400 | 21,039,233 |
| InterContinental Hotel Group PLC | | 378,700 | 20,090,562 |
| NMC Health PLC | | 859,200 | 22,112,048 |
| Prudential PLC | | 970,914 | 21,548,332 |
| Reckitt Benckiser Group PLC | | 219,000 | 20,178,123 |
| Unilever PLC | | 381,300 | 19,617,249 |
|
| TOTAL UNITED KINGDOM | | | 124,585,547 |
|
| United States of America - 7.7% | | | |
| A.O. Smith Corp. | | 365,500 | 19,693,140 |
| Alphabet, Inc. Class C (a) | | 23,245 | 21,059,040 |
| Amazon.com, Inc. (a) | | 21,980 | 20,331,280 |
| Amphenol Corp. Class A | | 269,400 | 19,480,314 |
| China Biologic Products, Inc. (a) | | 189,078 | 22,311,204 |
| Facebook, Inc. Class A (a) | | 146,000 | 21,936,500 |
| MasterCard, Inc. Class A | | 173,400 | 20,169,888 |
| Mettler-Toledo International, Inc. (a) | | 40,080 | 20,577,874 |
| Moody's Corp. | | 183,700 | 21,735,384 |
| MSCI, Inc. | | 201,200 | 20,184,384 |
| Philip Morris International, Inc. | | 176,400 | 19,552,176 |
| S&P Global, Inc. | | 157,000 | 21,067,830 |
| Sherwin-Williams Co. | | 65,000 | 21,754,200 |
| The Walt Disney Co. | | 166,300 | 19,224,280 |
| Visa, Inc. Class A | | 220,200 | 20,086,644 |
|
| TOTAL UNITED STATES OF AMERICA | | | 309,164,138 |
|
| TOTAL COMMON STOCKS | | | |
| (Cost $2,814,368,845) | | | 3,767,315,651 |
|
| Preferred Stocks - 3.8% | | | |
| Convertible Preferred Stocks - 0.6% | | | |
| India - 0.6% | | | |
| PC Jeweller Ltd. 13.00% (b) | | 169,426,966 | 26,192,687 |
| Nonconvertible Preferred Stocks - 3.2% | | | |
| Brazil - 3.2% | | | |
| Ambev SA sponsored ADR | | 7,382,580 | 42,302,183 |
| Itau Unibanco Holding SA | | 4,400,510 | 54,430,152 |
| Itausa-Investimentos Itau SA (PN) | | 9,748,900 | 30,376,529 |
| | | | 127,108,864 |
| TOTAL PREFERRED STOCKS | | | |
| (Cost $133,133,926) | | | 153,301,551 |
|
| Money Market Funds - 2.3% | | | |
| Fidelity Cash Central Fund, 0.85% (c) | | 91,891,825 | 91,910,204 |
| Fidelity Securities Lending Cash Central Fund 0.86% (c)(d) | | 4,093 | 4,094 |
| TOTAL MONEY MARKET FUNDS | | | |
| (Cost $91,914,297) | | | 91,914,298 |
| TOTAL INVESTMENT PORTFOLIO - 100.3% | | | |
| (Cost $3,039,417,068) | | | 4,012,531,500 |
| NET OTHER ASSETS (LIABILITIES) - (0.3)% | | | (12,469,496) |
| NET ASSETS - 100% | | | $4,000,062,004 |
Categorizations in the Schedule of Investments are based on country or territory of incorporation.
Legend
(a) Non-income producing
(b) Restricted securities - Investment in securities not registered under the Securities Act of 1933 (excluding 144A issues). At the end of the period, the value of restricted securities (excluding 144A issues) amounted to $26,192,687 or 0.7% of net assets.
(c) Affiliated fund that is generally available only to investment companies and other accounts managed by Fidelity Investments. The rate quoted is the annualized seven-day yield of the fund at period end. A complete unaudited listing of the fund's holdings as of its most recent quarter end is available upon request. In addition, each Fidelity Central Fund's financial statements are available on the SEC's website or upon request.
(d) Investment made with cash collateral received from securities on loan.
Additional information on each restricted holding is as follows:
| Security | Acquisition Date | Acquisition Cost |
| PC Jeweller Ltd. 13.00% | 7/28/16 | $25,285,041 |
Affiliated Central Funds
Information regarding fiscal year to date income earned by the Fund from investments in Fidelity Central Funds is as follows:
| Fund | Income earned |
| Fidelity Cash Central Fund | $101,332 |
| Fidelity Securities Lending Cash Central Fund | 128,250 |
| Total | $229,582 |
Investment Valuation
The following is a summary of the inputs used, as of April 30, 2017, involving the Fund's assets and liabilities carried at fair value. The inputs or methodology used for valuing securities may not be an indication of the risk associated with investing in those securities. For more information on valuation inputs, and their aggregation into the levels used below, please refer to the Investment Valuation section in the accompanying Notes to Financial Statements.
| | Valuation Inputs at Reporting Date: |
| Description | Total | Level 1 | Level 2 | Level 3 |
| Investments in Securities: | | | | |
| Equities: | | | | |
| Consumer Discretionary | $520,719,300 | $379,958,302 | $140,760,998 | $-- |
| Consumer Staples | 493,405,134 | 412,181,646 | 81,223,488 | -- |
| Energy | 98,758,244 | 98,758,244 | -- | -- |
| Financials | 642,970,730 | 546,448,771 | 96,521,959 | -- |
| Health Care | 223,760,324 | 223,760,324 | -- | -- |
| Industrials | 299,122,225 | 299,122,225 | -- | -- |
| Information Technology | 1,094,447,019 | 755,759,302 | 338,687,717 | -- |
| Materials | 381,986,791 | 381,986,791 | -- | -- |
| Real Estate | 48,022,022 | 48,022,022 | -- | -- |
| Telecommunication Services | 49,710,713 | 19,973,684 | 29,737,029 | -- |
| Utilities | 67,714,700 | 67,714,700 | -- | -- |
| Money Market Funds | 91,914,298 | 91,914,298 | -- | -- |
| Total Investments in Securities: | $4,012,531,500 | $3,325,600,309 | $686,931,191 | $-- |
The following is a summary of transfers between Level 1 and Level 2 for the period ended April 30, 2017. Transfers are assumed to have occurred at the beginning of the period, and are primarily attributable to the valuation techniques used for foreign equity securities, as discussed in the accompanying Notes to Financial Statements:
| Transfers | Total |
| Level 1 to Level 2 | $103,316,862 |
| Level 2 to Level 1 | $18,242,515 |
See accompanying notes which are an integral part of the financial statements.
Financial Statements
Statement of Assets and Liabilities
| | | April 30, 2017 (Unaudited) |
| Assets | | |
Investment in securities, at value — See accompanying schedule:
Unaffiliated issuers (cost $2,947,502,771) | $3,920,617,203 | |
| Fidelity Central Funds (cost $91,914,297) | 91,914,297 | |
| Total Investments (cost $3,039,417,068) | | $4,012,531,500 |
| Foreign currency held at value (cost $1,379,123) | | 1,379,123 |
| Receivable for investments sold | | 12,821,590 |
| Receivable for fund shares sold | | 5,752,296 |
| Dividends receivable | | 5,774,355 |
| Distributions receivable from Fidelity Central Funds | | 30,358 |
| Prepaid expenses | | 2,343 |
| Other receivables | | 4,725,762 |
| Total assets | | 4,043,017,327 |
| Liabilities | | |
| Payable to custodian bank | $2,229,090 | |
| Payable for investments purchased | 32,097,417 | |
| Payable for fund shares redeemed | 2,102,049 | |
| Accrued management fee | 2,259,909 | |
| Other affiliated payables | 672,473 | |
| Other payables and accrued expenses | 3,594,385 | |
| Total liabilities | | 42,955,323 |
| Net Assets | | $4,000,062,004 |
| Net Assets consist of: | | |
| Paid in capital | | $3,488,719,822 |
| Undistributed net investment income | | 8,638,278 |
| Accumulated undistributed net realized gain (loss) on investments and foreign currency transactions | | (469,853,254) |
| Net unrealized appreciation (depreciation) on investments and assets and liabilities in foreign currencies | | 972,557,158 |
| Net Assets | | $4,000,062,004 |
| Emerging Markets: | | |
| Net Asset Value, offering price and redemption price per share ($3,260,510,330 ÷ 123,448,382 shares) | | $26.41 |
| Class K: | | |
| Net Asset Value, offering price and redemption price per share ($739,551,674 ÷ 27,986,768 shares) | | $26.43 |
See accompanying notes which are an integral part of the financial statements.
Statement of Operations
| | | Six months ended April 30, 2017 (Unaudited) |
| Investment Income | | |
| Dividends | | $34,173,788 |
| Income from Fidelity Central Funds | | 229,582 |
| Income before foreign taxes withheld | | 34,403,370 |
| Less foreign taxes withheld | | (2,900,981) |
| Total income | | 31,502,389 |
| Expenses | | |
| Management fee | $12,696,117 | |
| Transfer agent fees | 3,151,546 | |
| Accounting and security lending fees | 754,994 | |
| Custodian fees and expenses | 736,596 | |
| Independent trustees' fees and expenses | 7,353 | |
| Registration fees | 63,993 | |
| Audit | 57,754 | |
| Legal | 4,510 | |
| Interest | 6,301 | |
| Miscellaneous | 14,132 | |
| Total expenses before reductions | 17,493,296 | |
| Expense reductions | (668,426) | 16,824,870 |
| Net investment income (loss) | | 14,677,519 |
| Realized and Unrealized Gain (Loss) | | |
| Net realized gain (loss) on: | | |
| Investment securities: | | |
| Unaffiliated issuers | 19,774,673 | |
| Fidelity Central Funds | 2,709 | |
| Foreign currency transactions | (822,580) | |
| Total net realized gain (loss) | | 18,954,802 |
Change in net unrealized appreciation (depreciation) on:
Investment securities | 322,263,434 | |
| Assets and liabilities in foreign currencies | 123,006 | |
| Total change in net unrealized appreciation (depreciation) | | 322,386,440 |
| Net gain (loss) | | 341,341,242 |
| Net increase (decrease) in net assets resulting from operations | | $356,018,761 |
See accompanying notes which are an integral part of the financial statements.
Statement of Changes in Net Assets
| | Six months ended April 30, 2017 (Unaudited) | Year ended October 31, 2016 |
| Increase (Decrease) in Net Assets | | |
| Operations | | |
| Net investment income (loss) | $14,677,519 | $21,682,785 |
| Net realized gain (loss) | 18,954,802 | (227,815,936) |
| Change in net unrealized appreciation (depreciation) | 322,386,440 | 470,369,169 |
| Net increase (decrease) in net assets resulting from operations | 356,018,761 | 264,236,018 |
| Distributions to shareholders from net investment income | (23,974,554) | (17,361,594) |
| Share transactions - net increase (decrease) | (5,386,378) | 131,573,266 |
| Redemption fees | 171,864 | 1,810,193 |
| Total increase (decrease) in net assets | 326,829,693 | 380,257,883 |
| Net Assets | | |
| Beginning of period | 3,673,232,311 | 3,292,974,428 |
| End of period | $4,000,062,004 | $3,673,232,311 |
| Other Information | | |
| Undistributed net investment income end of period | $8,638,278 | $17,935,313 |
See accompanying notes which are an integral part of the financial statements.
Financial Highlights — Fidelity Emerging Markets Fund
| | Six months ended (Unaudited) April 30, | Years ended October 31, | | | | |
| | 2017 | 2016 | 2015 | 2014 | 2013 | 2012 |
| Selected Per–Share Data | | | | | | |
| Net asset value, beginning of period | $24.25 | $22.55 | $25.44 | $24.43 | $22.15 | $22.23 |
| Income from Investment Operations | | | | | | |
| Net investment income (loss)A | .09 | .14 | .19 | .17 | .20 | .33 |
| Net realized and unrealized gain (loss) | 2.22 | 1.66 | (2.91) | .86 | 2.38 | (.11) |
| Total from investment operations | 2.31 | 1.80 | (2.72) | 1.03 | 2.58 | .22 |
| Distributions from net investment income | (.15) | (.11) | (.14) | (.02) | (.30) | (.30) |
| Distributions from net realized gain | – | – | (.03) | – | – | – |
| Total distributions | (.15) | (.11) | (.17) | (.02) | (.30) | (.30) |
| Redemption fees added to paid in capitalA | –B | .01 | –B | –B | –B | –B |
| Net asset value, end of period | $26.41 | $24.25 | $22.55 | $25.44 | $24.43 | $22.15 |
| Total ReturnC,D | 9.63% | 8.07% | (10.76)% | 4.22% | 11.78% | 1.03% |
| Ratios to Average Net AssetsE,F | | | | | | |
| Expenses before reductions | .99%G | 1.01% | 1.05% | 1.07% | 1.08% | 1.09% |
| Expenses net of fee waivers, if any | .99%G | 1.01% | 1.05% | 1.07% | 1.08% | 1.09% |
| Expenses net of all reductions | .95%G | 1.00% | 1.03% | 1.07% | 1.03% | 1.03% |
| Net investment income (loss) | .78%G | .61% | .78% | .71% | .85% | 1.50% |
| Supplemental Data | | | | | | |
| Net assets, end of period (000 omitted) | $3,260,510 | $3,014,957 | $2,738,934 | $2,370,927 | $2,241,338 | $2,203,756 |
| Portfolio turnover rateH | 74%G | 79% | 107% | 94% | 119% | 176% |
A Calculated based on average shares outstanding during the period.
B Amount represents less than $.005 per share.
C Total returns for periods of less than one year are not annualized.
D Total returns would have been lower if certain expenses had not been reduced during the applicable periods shown.
E Fees and expenses of any underlying Fidelity Central Funds are not included in the Fund's expense ratio. The Fund indirectly bears its proportionate share of the expenses of any underlying Fidelity Central Funds.
F Expense ratios reflect operating expenses of the class. Expenses before reductions do not reflect amounts reimbursed by the investment adviser or reductions from brokerage service arrangements or reductions from other expense offset arrangements and do not represent the amount paid by the class during periods when reimbursements or reductions occur. Expenses net of fee waivers reflect expenses after reimbursement by the investment adviser but prior to reductions from brokerage service arrangements or other expense offset arrangements. Expenses net of all reductions represent the net expenses paid by the class.
G Annualized
H Amount does not include the portfolio activity of any underlying Fidelity Central Funds.
See accompanying notes which are an integral part of the financial statements.
Financial Highlights — Fidelity Emerging Markets Fund Class K
| | Six months ended (Unaudited) April 30, | Years ended October 31, | | | | |
| | 2017 | 2016 | 2015 | 2014 | 2013 | 2012 |
| Selected Per–Share Data | | | | | | |
| Net asset value, beginning of period | $24.28 | $22.58 | $25.48 | $24.42 | $22.15 | $22.23 |
| Income from Investment Operations | | | | | | |
| Net investment income (loss)A | .11 | .18 | .24 | .23 | .25 | .37 |
| Net realized and unrealized gain (loss) | 2.23 | 1.66 | (2.92) | .86 | 2.38 | (.10) |
| Total from investment operations | 2.34 | 1.84 | (2.68) | 1.09 | 2.63 | .27 |
| Distributions from net investment income | (.19) | (.15) | (.20) | (.03) | (.36) | (.35) |
| Distributions from net realized gain | – | – | (.03) | – | – | – |
| Total distributions | (.19) | (.15) | (.22)B | (.03) | (.36) | (.35) |
| Redemption fees added to paid in capitalA | –C | .01 | –C | –C | –C | –C |
| Net asset value, end of period | $26.43 | $24.28 | $22.58 | $25.48 | $24.42 | $22.15 |
| Total ReturnD,E | 9.76% | 8.27% | (10.60)% | 4.47% | 12.01% | 1.25% |
| Ratios to Average Net AssetsF,G | | | | | | |
| Expenses before reductions | .83%H | .84% | .85% | .86% | .87% | .87% |
| Expenses net of fee waivers, if any | .83%H | .84% | .85% | .85% | .87% | .87% |
| Expenses net of all reductions | .80%H | .83% | .83% | .85% | .82% | .81% |
| Net investment income (loss) | .93%H | .78% | .98% | .92% | 1.07% | 1.72% |
| Supplemental Data | | | | | | |
| Net assets, end of period (000 omitted) | $739,552 | $658,276 | $554,041 | $623,430 | $547,369 | $607,919 |
| Portfolio turnover rateI | 74%H | 79% | 107% | 94% | 119% | 176% |
A Calculated based on average shares outstanding during the period.
B Total distributions of $.22 per share is comprised of distributions from net investment income of $.195 and distributions from net realized gain of $.025 per share.
C Amount represents less than $.005 per share.
D Total returns for periods of less than one year are not annualized.
E Total returns would have been lower if certain expenses had not been reduced during the applicable periods shown.
F Fees and expenses of any underlying Fidelity Central Funds are not included in the Fund's expense ratio. The Fund indirectly bears its proportionate share of the expenses of any underlying Fidelity Central Funds.
G Expense ratios reflect operating expenses of the class. Expenses before reductions do not reflect amounts reimbursed by the investment adviser or reductions from brokerage service arrangements or reductions from other expense offset arrangements and do not represent the amount paid by the class during periods when reimbursements or reductions occur. Expenses net of fee waivers reflect expenses after reimbursement by the investment adviser but prior to reductions from brokerage service arrangements or other expense offset arrangements. Expenses net of all reductions represent the net expenses paid by the class.
H Annualized
I Amount does not include the portfolio activity of any underlying Fidelity Central Funds.
See accompanying notes which are an integral part of the financial statements.
Notes to Financial Statements (Unaudited)
For the period ended April 30, 2017
1. Organization.
Fidelity Emerging Markets Fund (the Fund) is a fund of Fidelity Investment Trust (the Trust) and is authorized to issue an unlimited number of shares. The Trust is registered under the Investment Company Act of 1940, as amended (the 1940 Act), as an open-end management investment company organized as a Massachusetts business trust. The Fund offers Emerging Markets and Class K shares, each of which has equal rights as to assets and voting privileges. Each class has exclusive voting rights with respect to matters that affect that class. The Fund's investments in emerging markets can be subject to social, economic, regulatory, and political uncertainties and can be extremely volatile.
2. Investments in Fidelity Central Funds.
The Fund invests in Fidelity Central Funds, which are open-end investment companies generally available only to other investment companies and accounts managed by the investment adviser and its affiliates. The Fund's Schedule of Investments lists each of the Fidelity Central Funds held as of period end, if any, as an investment of the Fund, but does not include the underlying holdings of each Fidelity Central Fund. As an Investing Fund, the Fund indirectly bears its proportionate share of the expenses of the underlying Fidelity Central Funds.
The Money Market Central Funds seek preservation of capital and current income and are managed by Fidelity Investments Money Management, Inc. (FIMM), an affiliate of the investment adviser. Annualized expenses of the Money Market Central Funds as of their most recent shareholder report date are less than .005%.
A complete unaudited list of holdings for each Fidelity Central Fund is available upon request or at the Securities and Exchange Commission (the SEC) website at www.sec.gov. In addition, the financial statements of the Fidelity Central Funds are available on the SEC website or upon request.
3. Significant Accounting Policies.
The Fund is an investment company and applies the accounting and reporting guidance of the Financial Accounting Standards Board (FASB) Accounting Standards Codification Topic 946 Financial Services – Investments Companies. The financial statements have been prepared in conformity with accounting principles generally accepted in the United States of America (GAAP), which require management to make certain estimates and assumptions at the date of the financial statements. Actual results could differ from those estimates. Subsequent events, if any, through the date that the financial statements were issued have been evaluated in the preparation of the financial statements. The following summarizes the significant accounting policies of the Fund:
Investment Valuation. Investments are valued as of 4:00 p.m. Eastern time on the last calendar day of the period. The Board of Trustees (the Board) has delegated the day to day responsibility for the valuation of the Fund's investments to the Fair Value Committee (the Committee) established by the Fund's investment adviser. In accordance with valuation policies and procedures approved by the Board, the Fund attempts to obtain prices from one or more third party pricing vendors or brokers to value its investments. When current market prices, quotations or currency exchange rates are not readily available or reliable, investments will be fair valued in good faith by the Committee, in accordance with procedures adopted by the Board. Factors used in determining fair value vary by investment type and may include market or investment specific events. The frequency with which these procedures are used cannot be predicted and they may be utilized to a significant extent. The Committee oversees the Fund's valuation policies and procedures and reports to the Board on the Committee's activities and fair value determinations. The Board monitors the appropriateness of the procedures used in valuing the Fund's investments and ratifies the fair value determinations of the Committee.
The Fund categorizes the inputs to valuation techniques used to value its investments into a disclosure hierarchy consisting of three levels as shown below:
- Level 1 – quoted prices in active markets for identical investments
- Level 2 – other significant observable inputs (including quoted prices for similar investments, interest rates, prepayment speeds, etc.)
- Level 3 – unobservable inputs (including the Fund's own assumptions based on the best information available)
Valuation techniques used to value the Fund's investments by major category are as follows:
Equity securities, including restricted securities, for which market quotations are readily available, are valued at the last reported sale price or official closing price as reported by a third party pricing vendor on the primary market or exchange on which they are traded and are categorized as Level 1 in the hierarchy. In the event there were no sales during the day or closing prices are not available, securities are valued at the last quoted bid price or may be valued using the last available price and are generally categorized as Level 2 in the hierarchy. For foreign equity securities, when market or security specific events arise, comparisons to the valuation of American Depositary Receipts (ADRs), futures contracts, Exchange-Traded Funds (ETFs) and certain indexes as well as quoted prices for similar securities may be used and would be categorized as Level 2 in the hierarchy. Utilizing these techniques may result in transfers between Level 1 and Level 2. For equity securities, including restricted securities, where observable inputs are limited, assumptions about market activity and risk are used and these securities may be categorized as Level 3 in the hierarchy.
Investments in open-end mutual funds, including the Fidelity Central Funds, are valued at their closing net asset value (NAV) each business day and are categorized as Level 1 in the hierarchy.
Changes in valuation techniques may result in transfers in or out of an assigned level within the disclosure hierarchy. The aggregate value of investments by input level as of April 30, 2017, including information on transfers between Levels 1 and 2, is included at the end of the Fund's Schedule of Investments.
Foreign Currency. The Fund may use foreign currency contracts to facilitate transactions in foreign-denominated securities. Gains and losses from these transactions may arise from changes in the value of the foreign currency or if the counterparties do not perform under the contracts' terms.
Foreign-denominated assets, including investment securities, and liabilities are translated into U.S. dollars at the exchange rates at period end. Purchases and sales of investment securities, income and dividends received and expenses denominated in foreign currencies are translated into U.S. dollars at the exchange rate in effect on the transaction date.
The effects of exchange rate fluctuations on investments are included with the net realized and unrealized gain (loss) on investment securities. Other foreign currency transactions resulting in realized and unrealized gain (loss) are disclosed separately.
Investment Transactions and Income. For financial reporting purposes, the Fund's investment holdings and NAV include trades executed through the end of the last business day of the period. The NAV per share for processing shareholder transactions is calculated as of the close of business of the New York Stock Exchange (NYSE), normally 4:00 p.m. Eastern time and includes trades executed through the end of the prior business day. Gains and losses on securities sold are determined on the basis of identified cost. Dividend income is recorded on the ex-dividend date, except for certain dividends from foreign securities where the ex-dividend date may have passed, which are recorded as soon as the Fund is informed of the ex-dividend date. Non-cash dividends included in dividend income, if any, are recorded at the fair market value of the securities received. Income and capital gain distributions from Fidelity Central Funds, if any, are recorded on the ex-dividend date. Certain distributions received by the Fund represent a return of capital or capital gain. The Fund determines the components of these distributions subsequent to the ex-dividend date, based upon receipt of tax filings or other correspondence relating to the underlying investment. These distributions are recorded as a reduction of cost of investments and/or as a realized gain. Investment income is recorded net of foreign taxes withheld where recovery of such taxes is uncertain.
Class Allocations and Expenses. Investment income, realized and unrealized capital gains and losses, common expenses of the Fund, and certain fund-level expense reductions, if any, are allocated daily on a pro-rata basis to each class based on the relative net assets of each class to the total net assets of the Fund. Each class differs with respect to transfer agent fees incurred. Certain expense reductions may also differ by class. For the reporting period, the allocated portion of income and expenses to each class as a percent of its average net assets may vary due to the timing of recording these transactions in relation to fluctuating net assets of the classes. Expenses directly attributable to a fund are charged to that fund. Expenses attributable to more than one fund are allocated among the respective funds on the basis of relative net assets or other appropriate methods. Expense estimates are accrued in the period to which they relate and adjustments are made when actual amounts are known.
Income Tax Information and Distributions to Shareholders. Each year, the Fund intends to qualify as a regulated investment company under Subchapter M of the Internal Revenue Code, including distributing substantially all of its taxable income and realized gains. As a result, no provision for U.S. Federal income taxes is required. The Fund files a U.S. federal tax return, in addition to state and local tax returns as required. The Fund's federal income tax returns are subject to examination by the Internal Revenue Service (IRS) for a period of three fiscal years after they are filed. State and local tax returns may be subject to examination for an additional fiscal year depending on the jurisdiction. Foreign taxes are provided for based on the Fund's understanding of the tax rules and rates that exist in the foreign markets in which it invests. The Fund is subject to a tax imposed on capital gains by certain countries in which it invests.
Distributions are declared and recorded on the ex-dividend date. Income dividends and capital gain distributions are declared separately for each class. Income and capital gain distributions are determined in accordance with income tax regulations, which may differ from GAAP.
Capital accounts within the financial statements are adjusted for permanent book-tax differences. These adjustments have no impact on net assets or the results of operations. Capital accounts are not adjusted for temporary book-tax differences which will reverse in a subsequent period.
Book-tax differences are primarily due to foreign currency transactions, certain foreign taxes, passive foreign investment companies (PFIC), deferred trustees compensation, capital loss carryforwards and losses deferred due to wash sales.
The federal tax cost of investment securities and unrealized appreciation (depreciation) as of period end were as follows:
| Gross unrealized appreciation | $995,288,231 |
| Gross unrealized depreciation | (32,853,324) |
| Net unrealized appreciation (depreciation) on securities | $962,434,907 |
| Tax cost | $3,050,096,593 |
Capital loss carryforwards are only available to offset future capital gains of the Fund to the extent provided by regulations and may be limited. Under the Regulated Investment Company Modernization Act of 2010 (the Act), the Fund is permitted to carry forward capital losses incurred in taxable years beginning after December 22, 2010 for an unlimited period and such capital losses are required to be used prior to any losses that expire. The capital loss carryforward information presented below, including any applicable limitation, is estimated as of prior fiscal period end and is subject to adjustment.
| Fiscal year of expiration | |
| 2017 | $(24,838,920) |
| No expiration | |
| Short-term | (360,338,760) |
| Long-term | (85,169,192) |
| Total no expiration | (445,507,952) |
| Total capital loss carryforward | $(470,346,872) |
Short-Term Trading (Redemption) Fees. Shares held by investors in the Fund less than 90 days may have been subject to a redemption fee equal to 1.50% of the NAV of shares redeemed. All redemption fees, which reduce the proceeds of the shareholder redemption, are retained by the Fund and accounted for as an addition to paid in capital.
Restricted Securities. The Fund may invest in securities that are subject to legal or contractual restrictions on resale. These securities generally may be resold in transactions exempt from registration or to the public if the securities are registered. Disposal of these securities may involve time-consuming negotiations and expense, and prompt sale at an acceptable price may be difficult. Information regarding restricted securities is included at the end of the Fund's Schedule of Investments.
4. Purchases and Sales of Investments.
Purchases and sales of securities, other than short-term securities, aggregated $1,343,043,234 and $1,407,100,085, respectively.
5. Fees and Other Transactions with Affiliates.
Management Fee. Fidelity Management & Research Company (the investment adviser) and its affiliates provide the Fund with investment management related services for which the Fund pays a monthly management fee. The management fee is the sum of an individual fund fee rate that is based on an annual rate of .45% of the Fund's average net assets and an annualized group fee rate that averaged .25% during the period. The group fee rate is based upon the average net assets of all the mutual funds advised by the investment adviser, including any mutual funds previously advised by the investment adviser that are currently advised by Fidelity SelectCo, LLC, an affiliate of the investment adviser. The group fee rate decreases as assets under management increase and increases as assets under management decrease. For the reporting period, the total annualized management fee rate was .70% of the Fund's average net assets.
Transfer Agent Fees. Fidelity Investments Institutional Operations Company, Inc., (FIIOC), an affiliate of the investment adviser, is the transfer, dividend disbursing and shareholder servicing agent for each class of the Fund. FIIOC receives account fees and asset-based fees that vary according to the account size and type of account of the shareholders of Emerging Markets, except for Class K. FIIOC receives an asset-based fee of Class K's average net assets.FIIOC pays for typesetting, printing and mailing of shareholder reports, except proxy statements.
For the period, transfer agent fees for each class were as follows:
| | Amount | % of
Class-Level Average
Net Assets(a) |
| Emerging Markets | $2,995,502 | .20 |
| Class K | 156,044 | .05 |
| | $3,151,546 | |
(a) Annualized
Accounting and Security Lending Fees. Fidelity Service Company, Inc. (FSC), an affiliate of the investment adviser, maintains the Fund's accounting records. The accounting fee is based on the level of average net assets for each month. Under a separate contract, FSC administers the security lending program. The security lending fee is based on the number and duration of lending transactions.
Brokerage Commissions. The Fund placed a portion of its portfolio transactions with brokerage firms which are affiliates of the investment adviser. Brokerage commissions are included in net realized gain (loss) and change in net unrealized appreciation (depreciation) in the Statement of Operations. The commissions paid to these affiliated firms were $6,672 for the period.
Interfund Lending Program. Pursuant to an Exemptive Order issued by the SEC, the Fund, along with other registered investment companies having management contracts with FMR or other affiliated entities of FMR, may participate in an interfund lending program. This program provides an alternative credit facility allowing the funds to borrow from, or lend money to, other participating affiliated funds. At period end, there were no interfund loans outstanding. The Fund's activity in this program during the period for which loans were outstanding was as follows:
| Borrower or Lender | Average Loan Balance | Weighted Average Interest Rate | Interest Expense |
| Borrower | $12,129,818 | .85% | $6,301 |
Interfund Trades. The Fund may purchase from or sell securities to other Fidelity Funds under procedures adopted by the Board. The procedures have been designed to ensure these interfund trades are executed in accordance with Rule 17a-7 of the 1940 Act. Interfund trades are included within the respective purchases and sales amounts shown in the Purchases and Sales of Investments note.
6. Committed Line of Credit.
The Fund participates with other funds managed by the investment adviser or an affiliate in a $4.25 billion credit facility (the "line of credit") to be utilized for temporary or emergency purposes to fund shareholder redemptions or for other short-term liquidity purposes. The Fund has agreed to pay commitment fees on its pro-rata portion of the line of credit, which amounted to $6,119 and is reflected in Miscellaneous expenses on the Statement of Operations. During the period, the Fund did not borrow on this line of credit.
7. Security Lending.
The Fund lends portfolio securities through a lending agent from time to time in order to earn additional income. For equity securities, a lending agent is used and may loan securities to certain qualified borrowers, including Fidelity Capital Markets (FCM), a broker-dealer affiliated with the Fund. On the settlement date of the loan, the Fund receives collateral (in the form of U.S. Treasury obligations, letters of credit and/or cash) against the loaned securities and maintains collateral in an amount not less than 100% of the market value of the loaned securities during the period of the loan. The market value of the loaned securities is determined at the close of business of the Fund and any additional required collateral is delivered to the Fund on the next business day. The Fund or borrower may terminate the loan at any time, and if the borrower defaults on its obligation to return the securities loaned because of insolvency or other reasons, the Fund may apply collateral received from the borrower against the obligation. The Fund may experience delays and costs in recovering the securities loaned. Any cash collateral received is invested in the Fidelity Securities Lending Cash Central Fund. At period end, there were no security loans outstanding. Security lending income represents the income earned on investing cash collateral, less rebates paid to borrowers and any lending agent fees associated with the loan, plus any premium payments received for lending certain types of securities. Security lending income is presented in the Statement of Operations as a component of income from Fidelity Central Funds. Total security lending income during the period amounted to $128,250, including $1,060 from securities loaned to FCM.
8. Expense Reductions.
Commissions paid to certain brokers with whom the investment adviser, or its affiliates, places trades on behalf of the Fund include an amount in addition to trade execution, which may be rebated back to the Fund to offset certain expenses. This amount totaled $652,995 for the period.
In addition, during the period the investment adviser reimbursed and/or waived a portion of fund-level operating expenses in the amount of $15,431.
9. Distributions to Shareholders.
Distributions to shareholders of each class were as follows:
| | Six months ended
April 30, 2017 | Year ended October 31, 2016 |
| From net investment income | | |
| Emerging Markets | $18,744,412 | $13,660,209 |
| Class K | 5,230,142 | 3,701,385 |
| Total | $23,974,554 | $17,361,594 |
10. Share Transactions.
Share transactions for each class were as follows and may contain automatic conversions between classes or exchanges between affiliated funds:
| | Shares | Shares | Dollars | Dollars |
| | Six months ended April 30, 2017 | Year ended October 31, 2016 | Six months ended April 30, 2017 | Year ended October 31, 2016 |
| Emerging Markets | | | | |
| Shares sold | 16,265,862 | 40,381,882 | $382,796,383 | $879,217,354 |
| Reinvestment of distributions | 790,787 | 572,542 | 17,864,538 | 12,670,348 |
| Shares redeemed | (17,959,036) | (38,074,038) | (425,830,637) | (819,023,837) |
| Net increase (decrease) | (902,387) | 2,880,386 | $(25,169,716) | $72,863,865 |
| Class K | | | | |
| Shares sold | 4,961,080 | 8,389,679 | $117,341,002 | $189,089,919 |
| Reinvestment of distributions | 231,437 | 167,256 | 5,230,142 | 3,701,385 |
| Shares redeemed | (4,318,358) | (5,977,816) | (102,787,806) | (134,081,903) |
| Net increase (decrease) | 874,159 | 2,579,119 | $19,783,338 | $58,709,401 |
11. Other.
The Fund's organizational documents provide former and current trustees and officers with a limited indemnification against liabilities arising in connection with the performance of their duties to the Fund. In the normal course of business, the Fund may also enter into contracts that provide general indemnifications. The Fund's maximum exposure under these arrangements is unknown as this would be dependent on future claims that may be made against the Fund. The risk of material loss from such claims is considered remote.
Shareholder Expense Example
As a shareholder of the Fund, you incur two types of costs: (1) transaction costs, including redemption fees and (2) ongoing costs, including management fees and other Fund expenses. This Example is intended to help you understand your ongoing costs (in dollars) of investing in the Fund and to compare these costs with the ongoing costs of investing in other mutual funds.
The Example is based on an investment of $1,000 invested at the beginning of the period and held for the entire period (November 1, 2016 to April 30, 2017).
Actual Expenses
The first line of the accompanying table for each class of the Fund provides information about actual account values and actual expenses. You may use the information in this line, together with the amount you invested, to estimate the expenses that you paid over the period. Simply divide your account value by $1,000.00 (for example, an $8,600 account value divided by $1,000.00 = 8.6), then multiply the result by the number in the first line for a class of the Fund under the heading entitled "Expenses Paid During Period" to estimate the expenses you paid on your account during this period. A small balance maintenance fee of $12.00 that is charged once a year may apply for certain accounts with a value of less than $2,000. This fee is not included in the table below. If it was, the estimate of expenses you paid during the period would be higher, and your ending account value lower, by this amount. In addition, the Fund, as a shareholder in the underlying Fidelity Central Funds, will indirectly bear its pro-rata share of the fees and expenses incurred by the underlying Fidelity Central Funds. These fees and expenses are not included in the Fund's annualized expense ratio used to calculate the expense estimate in the table below.
Hypothetical Example for Comparison Purposes
The second line of the accompanying table for each class of the Fund provides information about hypothetical account values and hypothetical expenses based on a Class' actual expense ratio and an assumed rate of return of 5% per year before expenses, which is not the Class' actual return. The hypothetical account values and expenses may not be used to estimate the actual ending account balance or expenses you paid for the period. You may use this information to compare the ongoing costs of investing in the Fund and other funds. To do so, compare this 5% hypothetical example with the 5% hypothetical examples that appear in the shareholder reports of the other funds. A small balance maintenance fee of $12.00 that is charged once a year may apply for certain accounts with a value of less than $2,000. This fee is not included in the table below. If it was, the estimate of expenses you paid during the period would be higher, and your ending account value lower, by this amount. In addition, the Fund, as a shareholder in the underlying Fidelity Central Funds, will indirectly bear its pro-rata share of the fees and expenses incurred by the underlying Fidelity Central Funds. These fees and expenses are not included in the Fund's annualized expense ratio used to calculate the expense estimate in the table below.
Please note that the expenses shown in the table are meant to highlight your ongoing costs only and do not reflect any transaction costs. Therefore, the second line of the table is useful in comparing ongoing costs only, and will not help you determine the relative total costs of owning different funds. In addition, if these transactional costs were included, your costs would have been higher.
| | Annualized Expense Ratio-A | Beginning
Account Value
November 1, 2016 | Ending
Account Value
April 30, 2017 | Expenses Paid
During Period-B
November 1, 2016
to April 30, 2017 |
| Emerging Markets | .99% | | | |
| Actual | | $1,000.00 | $1,096.30 | $5.15 |
| Hypothetical-C | | $1,000.00 | $1,019.89 | $4.96 |
| Class K | .83% | | | |
| Actual | | $1,000.00 | $1,097.60 | $4.32 |
| Hypothetical-C | | $1,000.00 | $1,020.68 | $4.16 |
A Annualized expense ratio reflects expenses net of applicable fee waivers.
B Expenses are equal to each Class' annualized expense ratio, multiplied by the average account value over the period, multiplied by 181/365 (to reflect the one-half year period).
C 5% return per year before expenses
Corporate Headquarters
245 Summer St.
Boston, MA 02210
www.fidelity.com
EMF-K-SANN-0617
1.863019.108
Fidelity® Total International Equity Fund
Semi-Annual Report April 30, 2017 |
|
Contents
To view a fund's proxy voting guidelines and proxy voting record for the 12-month period ended June 30, visit http://www.fidelity.com/proxyvotingresults or visit the Securities and Exchange Commission's (SEC) web site at http://www.sec.gov.
You may also call 1-800-544-8544 to request a free copy of the proxy voting guidelines.
Standard & Poor's, S&P and S&P 500 are registered service marks of The McGraw-Hill Companies, Inc. and have been licensed for use by Fidelity Distributors Corporation.
Other third-party marks appearing herein are the property of their respective owners.
All other marks appearing herein are registered or unregistered trademarks or service marks of FMR LLC or an affiliated company. © 2017 FMR LLC. All rights reserved.
This report and the financial statements contained herein are submitted for the general information of the shareholders of the Fund. This report is not authorized for distribution to prospective investors in the Fund unless preceded or accompanied by an effective prospectus.
A fund files its complete schedule of portfolio holdings with the SEC for the first and third quarters of each fiscal year on Form N-Q. Forms N-Q are available on the SEC’s web site at http://www.sec.gov. A fund's Forms N-Q may be reviewed and copied at the SEC’s Public Reference Room in Washington, DC. Information regarding the operation of the SEC's Public Reference Room may be obtained by calling 1-800-SEC-0330.
For a complete list of a fund's portfolio holdings, view the most recent holdings listing, semiannual report, or annual report on Fidelity's web site at http://www.fidelity.com, http://www.institutional.fidelity.com, or http://www.401k.com, as applicable.
NOT FDIC INSURED •MAY LOSE VALUE •NO BANK GUARANTEE
Neither the Fund nor Fidelity Distributors Corporation is a bank.
Investment Summary (Unaudited)
Geographic Diversification (% of fund's net assets)
| As of April 30, 2017 |
| | Japan | 12.7% |
| | United States of America* | 11.3% |
| | United Kingdom | 11.0% |
| | Switzerland | 5.9% |
| | France | 5.5% |
| | Canada | 4.8% |
| | Germany | 4.4% |
| | Sweden | 3.5% |
| | India | 3.3% |
| | Other | 37.6% |

* Includes Short-Term investments and Net Other Assets (Liabilities).
Percentages are based on country or territory of incorporation and are adjusted for the effect of futures contracts, if applicable.
| As of October 31, 2016 |
| | Japan | 13.7% |
| | United States of America* | 11.7% |
| | United Kingdom | 11.5% |
| | Switzerland | 6.9% |
| | France | 5.4% |
| | Canada | 5.1% |
| | Germany | 3.9% |
| | Cayman Islands | 3.5% |
| | Australia | 3.2% |
| | Other | 35.1% |

* Includes Short-Term investments and Net Other Assets (Liabilities).
Percentages are based on country or territory of incorporation and are adjusted for the effect of futures contracts, if applicable.
Asset Allocation as of April 30, 2017
| | % of fund's net assets | % of fund's net assets 6 months ago |
| Stocks | 97.5 | 98.3 |
| Investment Companies | 0.4 | 0.0 |
| Short-Term Investments and Net Other Assets (Liabilities) | 2.1 | 1.7 |
Top Ten Stocks as of April 30, 2017
| | % of fund's net assets | % of fund's net assets 6 months ago |
| Nestle SA (Reg. S) (Switzerland, Food Products) | 2.1 | 2.2 |
| Samsung Electronics Co. Ltd. (Korea (South), Technology Hardware, Storage & Peripherals) | 1.3 | 0.8 |
| Taiwan Semiconductor Manufacturing Co. Ltd. (Taiwan, Semiconductors & Semiconductor Equipment) | 1.3 | 1.3 |
| Anheuser-Busch InBev SA NV (Belgium, Beverages) | 1.3 | 1.3 |
| SAP AG (Germany, Software) | 1.2 | 1.0 |
| Alibaba Group Holding Ltd. sponsored ADR (Cayman Islands, Internet Software & Services) | 1.1 | 1.0 |
| Tencent Holdings Ltd. (Cayman Islands, Internet Software & Services) | 1.1 | 1.0 |
| Naspers Ltd. Class N (South Africa, Media) | 1.1 | 1.0 |
| British American Tobacco PLC (United Kingdom) (United Kingdom, Tobacco) | 1.1 | 0.2 |
| AIA Group Ltd. (Hong Kong, Insurance) | 1.0 | 1.1 |
| | 12.6 | |
Top Market Sectors as of April 30, 2017
| | % of fund's net assets | % of fund's net assets 6 months ago |
| Financials | 19.3 | 17.1 |
| Information Technology | 15.5 | 14.4 |
| Industrials | 12.9 | 11.5 |
| Consumer Staples | 12.2 | 14.1 |
| Consumer Discretionary | 10.0 | 12.1 |
| Health Care | 9.9 | 11.8 |
| Materials | 8.9 | 7.7 |
| Energy | 4.2 | 4.0 |
| Real Estate | 1.8 | 2.1 |
| Telecommunication Services | 1.8 | 1.7 |
Percentages shown as 0.0% may reflect amounts less than 0.05%.
Investments April 30, 2017 (Unaudited)
Showing Percentage of Net Assets
| Common Stocks - 96.2% | | | |
| | | Shares | Value |
| Australia - 3.3% | | | |
| Adelaide Brighton Ltd. | | 14,945 | $66,250 |
| Amcor Ltd. | | 37,925 | 446,136 |
| Australia & New Zealand Banking Group Ltd. | | 78,388 | 1,922,912 |
| Beacon Lighting Group Ltd. | | 45,008 | 60,664 |
| CSL Ltd. | | 33,974 | 3,372,036 |
| DuluxGroup Ltd. | | 31,910 | 161,764 |
| Imdex Ltd. (a) | | 150,407 | 69,827 |
| Insurance Australia Group Ltd. | | 168,220 | 782,231 |
| Macquarie Group Ltd. | | 11,919 | 830,020 |
| Magellan Financial Group Ltd. | | 23,701 | 418,482 |
| Quintis Ltd. | | 54,330 | 48,819 |
| RCG Corp. Ltd. | | 128,117 | 79,625 |
| Transurban Group unit | | 93,952 | 858,285 |
| Westpac Banking Corp. | | 93,378 | 2,447,883 |
|
| TOTAL AUSTRALIA | | | 11,564,934 |
|
| Austria - 0.7% | | | |
| Andritz AG | | 28,872 | 1,596,730 |
| Buwog-Gemeinnuetzige Wohnung | | 26,449 | 714,222 |
|
| TOTAL AUSTRIA | | | 2,310,952 |
|
| Bailiwick of Jersey - 0.2% | | | |
| Integrated Diagnostics Holdings PLC | | 8,000 | 24,080 |
| Wolseley PLC | | 12,877 | 818,425 |
|
| TOTAL BAILIWICK OF JERSEY | | | 842,505 |
|
| Belgium - 1.9% | | | |
| Anheuser-Busch InBev SA NV | | 38,371 | 4,327,112 |
| KBC Ancora (a) | | 1,311 | 62,350 |
| KBC Groep NV | | 29,595 | 2,136,724 |
|
| TOTAL BELGIUM | | | 6,526,186 |
|
| Bermuda - 0.2% | | | |
| Credicorp Ltd. (United States) | | 3,800 | 583,908 |
| Vostok New Ventures Ltd. (depositary receipt) (a) | | 12,960 | 100,961 |
|
| TOTAL BERMUDA | | | 684,869 |
|
| Brazil - 1.7% | | | |
| BB Seguridade Participacoes SA | | 61,600 | 580,087 |
| Cielo SA | | 78,403 | 595,300 |
| Drogasil SA (a) | | 27,000 | 573,762 |
| Equatorial Energia SA | | 27,300 | 494,471 |
| Itau Unibanco Holding SA | | 13,400 | 143,792 |
| Kroton Educacional SA | | 123,500 | 581,694 |
| Qualicorp SA | | 73,600 | 524,050 |
| Smiles SA | | 22,200 | 482,881 |
| Ultrapar Participacoes SA | | 25,700 | 570,184 |
| Vale SA sponsored ADR | | 102,700 | 881,166 |
| Weg SA (a) | | 94,600 | 527,534 |
|
| TOTAL BRAZIL | | | 5,954,921 |
|
| Canada - 4.8% | | | |
| Alimentation Couche-Tard, Inc. Class B (sub. vtg.) | | 61,903 | 2,846,980 |
| Canadian National Railway Co. | | 31,059 | 2,245,040 |
| Canadian Pacific Railway Ltd. | | 6,000 | 919,351 |
| CCL Industries, Inc. Class B | | 8,166 | 1,890,375 |
| Constellation Software, Inc. | | 3,662 | 1,674,881 |
| Franco-Nevada Corp. | | 22,200 | 1,509,870 |
| Imperial Oil Ltd. | | 63,726 | 1,853,822 |
| McCoy Global, Inc. (a) | | 12,300 | 17,571 |
| New Look Vision Group, Inc. | | 3,500 | 73,074 |
| Pason Systems, Inc. | | 57,978 | 860,931 |
| Potash Corp. of Saskatchewan, Inc. | | 124,626 | 2,101,674 |
| PrairieSky Royalty Ltd. | | 40,400 | 880,481 |
| ShawCor Ltd. Class A | | 2,500 | 62,727 |
| Tesco Corp. (a) | | 4,900 | 32,095 |
|
| TOTAL CANADA | | | 16,968,872 |
|
| Cayman Islands - 3.1% | | | |
| 58.com, Inc. ADR (a) | | 4,600 | 182,068 |
| Alibaba Group Holding Ltd. sponsored ADR (a) | | 34,800 | 4,019,400 |
| Ctrip.com International Ltd. ADR (a) | | 15,800 | 798,058 |
| NetEase, Inc. ADR | | 3,100 | 822,709 |
| New Oriental Education & Technology Group, Inc. sponsored ADR (a) | | 9,900 | 638,946 |
| Shenzhou International Group Holdings Ltd. | | 77,000 | 506,843 |
| Tencent Holdings Ltd. | | 128,100 | 4,013,801 |
|
| TOTAL CAYMAN ISLANDS | | | 10,981,825 |
|
| Chile - 0.2% | | | |
| Sociedad Quimica y Minera de Chile SA (PN-B) sponsored ADR | | 14,600 | 519,030 |
| China - 1.3% | | | |
| Gree Electric Appliances, Inc. of Zhuhai Class A | | 101,600 | 486,371 |
| Hangzhou Hikvision Digital Technology Co. Ltd. Class A | | 99,700 | 528,908 |
| Inner Mongoli Yili Industries Co. Ltd. (A Shares) | | 145,000 | 384,086 |
| Jiangsu Hengrui Medicine Co. Ltd. (A Shares) | | 60,416 | 470,024 |
| Kweichow Moutai Co. Ltd. (A Shares) | | 8,294 | 497,484 |
| Midea Group Co. Ltd. Class A | | 92,400 | 451,176 |
| Shanghai International Airport Co. Ltd. (A Shares) | | 102,000 | 506,782 |
| Sinopharm Group Co. Ltd. (H Shares) | | 112,400 | 504,318 |
| Wuliangye Yibin Co. Ltd. Class A | | 68,900 | 454,769 |
| Yunnan Baiyao Group Co. Ltd. | | 35,200 | 436,585 |
|
| TOTAL CHINA | | | 4,720,503 |
|
| Denmark - 0.6% | | | |
| Jyske Bank A/S (Reg.) | | 15,454 | 825,858 |
| Novo Nordisk A/S Series B sponsored ADR | | 26,200 | 1,013,416 |
| Scandinavian Tobacco Group A/S | | 5,098 | 88,995 |
| Spar Nord Bank A/S | | 12,031 | 136,375 |
|
| TOTAL DENMARK | | | 2,064,644 |
|
| Finland - 0.5% | | | |
| Sampo Oyj (A Shares) (b) | | 24,753 | 1,186,122 |
| Tikkurila Oyj | | 26,780 | 530,920 |
|
| TOTAL FINLAND | | | 1,717,042 |
|
| France - 5.5% | | | |
| Atos Origin SA | | 11,748 | 1,539,491 |
| AXA SA | | 58,506 | 1,560,949 |
| Bouygues SA | | 11,367 | 477,886 |
| Capgemini SA | | 8,802 | 881,274 |
| Compagnie de St. Gobain | | 19,100 | 1,030,919 |
| Dassault Systemes SA | | 5,100 | 455,156 |
| Elis SA | | 7,978 | 165,118 |
| Essilor International SA | | 7,184 | 930,847 |
| Havas SA | | 70,804 | 654,729 |
| Laurent-Perrier Group SA | | 959 | 73,835 |
| LVMH Moet Hennessy - Louis Vuitton SA | | 1,849 | 456,461 |
| Natixis SA | | 87,400 | 608,073 |
| Sanofi SA | | 23,398 | 2,210,967 |
| Societe Generale Series A | | 30,300 | 1,661,432 |
| SR Teleperformance SA | | 6,600 | 829,295 |
| Total SA | | 65,220 | 3,347,954 |
| Vetoquinol SA | | 1,900 | 104,353 |
| VINCI SA | | 18,400 | 1,568,390 |
| Virbac SA (a) | | 730 | 114,945 |
| Vivendi SA | | 40,552 | 804,617 |
|
| TOTAL FRANCE | | | 19,476,691 |
|
| Germany - 4.3% | | | |
| Axel Springer Verlag AG | | 9,100 | 510,600 |
| BASF AG | | 19,214 | 1,872,381 |
| Bayer AG | | 18,600 | 2,301,437 |
| Brenntag AG | | 9,100 | 539,644 |
| CompuGroup Medical AG | | 8,046 | 396,156 |
| CTS Eventim AG | | 6,855 | 264,076 |
| Deutsche Telekom AG | | 90,600 | 1,589,197 |
| Fielmann AG | | 1,258 | 96,170 |
| Fresenius SE & Co. KGaA | | 10,800 | 875,392 |
| HeidelbergCement Finance AG | | 8,700 | 805,537 |
| Linde AG | | 2,600 | 467,168 |
| Nexus AG | | 1,120 | 26,962 |
| SAP AG | | 40,555 | 4,062,234 |
| Symrise AG | | 6,700 | 469,062 |
| Vonovia SE | | 19,800 | 716,817 |
|
| TOTAL GERMANY | | | 14,992,833 |
|
| Greece - 0.1% | | | |
| Titan Cement Co. SA (Reg.) | | 18,200 | 475,608 |
| Hong Kong - 1.6% | | | |
| AIA Group Ltd. | | 507,400 | 3,512,762 |
| CSPC Pharmaceutical Group Ltd. | | 402,000 | 558,165 |
| Guangdong Investment Ltd. | | 362,000 | 560,335 |
| Power Assets Holdings Ltd. | | 63,000 | 566,958 |
| Techtronic Industries Co. Ltd. | | 106,500 | 457,308 |
|
| TOTAL HONG KONG | | | 5,655,528 |
|
| India - 3.1% | | | |
| Adani Ports & Special Economic Zone Ltd. (a) | | 102,012 | 519,977 |
| Amara Raja Batteries Ltd. (a) | | 33,484 | 463,589 |
| Asian Paints Ltd. | | 31,871 | 555,450 |
| Eicher Motors Ltd. | | 1,318 | 534,416 |
| Godrej Consumer Products Ltd. | | 20,772 | 563,096 |
| HDFC Bank Ltd. | | 22,840 | 557,567 |
| Hero Motocorp Ltd. | | 9,107 | 470,096 |
| Hindustan Zinc Ltd. | | 101,004 | 420,968 |
| Housing Development Finance Corp. Ltd. | | 97,641 | 2,334,560 |
| IndusInd Bank Ltd. (a) | | 23,629 | 531,074 |
| ITC Ltd. | | 170,410 | 736,879 |
| Jyothy Laboratories Ltd. | | 20,604 | 128,194 |
| LIC Housing Finance Ltd. | | 56,230 | 585,040 |
| Maruti Suzuki India Ltd. | | 6,535 | 663,243 |
| Power Grid Corp. of India Ltd. | | 145,676 | 471,311 |
| Reliance Industries Ltd. | | 45,576 | 989,075 |
| Zee Entertainment Enterprises Ltd. | | 67,048 | 549,452 |
|
| TOTAL INDIA | | | 11,073,987 |
|
| Indonesia - 0.8% | | | |
| PT Bank Central Asia Tbk | | 586,000 | 780,366 |
| PT Bank Rakyat Indonesia Tbk | | 1,154,000 | 1,116,858 |
| PT Surya Citra Media Tbk | | 205,900 | 44,180 |
| PT Telkomunikasi Indonesia Tbk Series B | | 2,393,600 | 789,616 |
|
| TOTAL INDONESIA | | | 2,731,020 |
|
| Ireland - 1.8% | | | |
| Accenture PLC Class A | | 3,800 | 460,940 |
| Allergan PLC | | 2,000 | 487,720 |
| CRH PLC | | 17,248 | 628,243 |
| CRH PLC sponsored ADR | | 62,529 | 2,271,053 |
| FBD Holdings PLC (a) | | 5,372 | 47,692 |
| James Hardie Industries PLC CDI | | 115,299 | 1,957,235 |
| Medtronic PLC | | 7,500 | 623,175 |
|
| TOTAL IRELAND | | | 6,476,058 |
|
| Isle of Man - 0.2% | | | |
| Playtech Ltd. | | 61,992 | 770,001 |
| Israel - 0.7% | | | |
| Azrieli Group | | 7,196 | 383,265 |
| Check Point Software Technologies Ltd. (a) | | 4,200 | 436,842 |
| Elbit Systems Ltd. (Israel) | | 3,496 | 416,512 |
| Frutarom Industries Ltd. | | 8,700 | 511,411 |
| Ituran Location & Control Ltd. | | 5,661 | 177,189 |
| Strauss Group Ltd. | | 8,059 | 141,719 |
| Teva Pharmaceutical Industries Ltd. sponsored ADR | | 15,009 | 473,984 |
|
| TOTAL ISRAEL | | | 2,540,922 |
|
| Italy - 0.9% | | | |
| Azimut Holding SpA | | 21,514 | 419,959 |
| Beni Stabili SpA SIIQ | | 121,626 | 77,240 |
| Interpump Group SpA | | 52,991 | 1,405,557 |
| Intesa Sanpaolo SpA | | 377,900 | 1,103,129 |
|
| TOTAL ITALY | | | 3,005,885 |
|
| Japan - 12.7% | | | |
| AEON Financial Service Co. Ltd. | | 23,400 | 449,423 |
| Ai Holdings Corp. | | 4,100 | 100,850 |
| Aoki Super Co. Ltd. | | 6,000 | 74,277 |
| Artnature, Inc. | | 11,000 | 70,455 |
| Asahi Co. Ltd. | | 6,300 | 80,647 |
| Astellas Pharma, Inc. | | 91,800 | 1,210,577 |
| Azbil Corp. | | 10,700 | 359,946 |
| Broadleaf Co. Ltd. | | 3,900 | 25,294 |
| Central Automotive Products Ltd. | | 5,100 | 52,841 |
| Coca-Cola West Co. Ltd. | | 1,800 | 53,528 |
| Daiichikosho Co. Ltd. | | 4,100 | 177,829 |
| Daikokutenbussan Co. Ltd. | | 4,000 | 191,254 |
| DENSO Corp. | | 25,000 | 1,076,250 |
| Dentsu, Inc. | | 6,600 | 371,814 |
| East Japan Railway Co. | | 18,200 | 1,625,143 |
| Funai Soken Holdings, Inc. | | 4,200 | 80,703 |
| GCA Savvian Group Corp. | | 10,100 | 81,634 |
| Goldcrest Co. Ltd. | | 10,060 | 178,684 |
| Hoya Corp. | | 45,900 | 2,192,165 |
| Hub Co. Ltd. | | 500 | 9,554 |
| Itochu Corp. | | 79,200 | 1,119,706 |
| Japan Tobacco, Inc. | | 8,620 | 286,573 |
| Kao Corp. | | 11,200 | 617,695 |
| KDDI Corp. | | 48,300 | 1,280,630 |
| Keyence Corp. | | 6,142 | 2,468,370 |
| Kobayashi Pharmaceutical Co. Ltd. | | 4,300 | 225,270 |
| Komatsu Ltd. | | 71,600 | 1,913,263 |
| Koshidaka Holdings Co. Ltd. | | 4,000 | 98,784 |
| Kusuri No Aoki Holdings Co. Ltd. | | 1,700 | 73,429 |
| Lasertec Corp. | | 12,600 | 164,006 |
| Makita Corp. | | 21,000 | 748,823 |
| Medikit Co. Ltd. | | 1,900 | 79,085 |
| Miroku Jyoho Service Co., Ltd. | | 3,200 | 60,656 |
| Misumi Group, Inc. | | 56,100 | 1,062,365 |
| Mitsubishi UFJ Financial Group, Inc. | | 437,000 | 2,769,093 |
| Mitsui Fudosan Co. Ltd. | | 34,000 | 747,100 |
| Nabtesco Corp. | | 3,700 | 104,885 |
| Nagaileben Co. Ltd. | | 9,500 | 218,847 |
| Nakano Refrigerators Co. Ltd. | | 700 | 19,215 |
| ND Software Co. Ltd. | | 5,500 | 49,684 |
| Nihon Parkerizing Co. Ltd. | | 23,700 | 304,236 |
| Nintendo Co. Ltd. | | 3,400 | 860,423 |
| Nippon Telegraph & Telephone Corp. | | 22,900 | 981,394 |
| Nomura Holdings, Inc. | | 142,700 | 857,574 |
| NS Tool Co. Ltd. | | 7,600 | 109,424 |
| OBIC Co. Ltd. | | 19,900 | 1,074,662 |
| Olympus Corp. | | 50,800 | 1,954,985 |
| ORIX Corp. | | 73,500 | 1,121,538 |
| OSG Corp. | | 42,500 | 874,972 |
| Panasonic Corp. | | 50,000 | 597,913 |
| Paramount Bed Holdings Co. Ltd. | | 4,600 | 192,913 |
| ProNexus, Inc. | | 7,900 | 98,932 |
| Recruit Holdings Co. Ltd. | | 16,600 | 838,376 |
| San-Ai Oil Co. Ltd. | | 11,400 | 96,743 |
| Seven & i Holdings Co. Ltd. | | 18,800 | 794,331 |
| Shin-Etsu Chemical Co. Ltd. | | 11,300 | 981,648 |
| Shinsei Bank Ltd. | | 310,000 | 578,426 |
| SHO-BOND Holdings Co. Ltd. | | 21,740 | 994,609 |
| Shoei Co. Ltd. | | 5,800 | 161,032 |
| SK Kaken Co. Ltd. | | 100 | 9,509 |
| Software Service, Inc. | | 1,600 | 72,626 |
| Sony Corp. | | 28,800 | 988,253 |
| Sony Financial Holdings, Inc. | | 40,400 | 671,189 |
| Subaru Corp. | | 16,100 | 608,327 |
| Taiheiyo Cement Corp. | | 139,000 | 462,606 |
| Techno Medica Co. Ltd. | | 1,800 | 32,004 |
| The Monogatari Corp. | | 1,700 | 76,403 |
| TKC Corp. | | 3,700 | 100,570 |
| Tocalo Co. Ltd. | | 2,800 | 75,479 |
| Tokio Marine Holdings, Inc. | | 23,200 | 976,492 |
| Toyota Motor Corp. | | 46,300 | 2,505,793 |
| USS Co. Ltd. | | 106,700 | 1,885,616 |
| Welcia Holdings Co. Ltd. | | 3,500 | 112,716 |
| Workman Co. Ltd. | | 4,300 | 125,750 |
| Yamada Consulting Group Co. Ltd. | | 2,200 | 100,848 |
| Yamato Kogyo Co. Ltd. | | 1,900 | 47,519 |
|
| TOTAL JAPAN | | | 44,896,178 |
|
| Kenya - 0.3% | | | |
| Safaricom Ltd. | | 5,162,200 | 962,910 |
| Korea (South) - 2.5% | | | |
| BGFretail Co. Ltd. | | 17,335 | 1,668,585 |
| Coway Co. Ltd. | | 6,334 | 559,570 |
| Leeno Industrial, Inc. | | 1,197 | 44,824 |
| LG Household & Health Care Ltd. | | 814 | 619,659 |
| NAVER Corp. | | 1,767 | 1,242,616 |
| Samsung Electronics Co. Ltd. | | 2,438 | 4,781,275 |
|
| TOTAL KOREA (SOUTH) | | | 8,916,529 |
|
| Luxembourg - 0.1% | | | |
| Eurofins Scientific SA | | 1,000 | 492,473 |
| Mexico - 1.8% | | | |
| CEMEX S.A.B. de CV sponsored ADR | | 76,700 | 707,174 |
| Consorcio ARA S.A.B. de CV | | 224,355 | 74,844 |
| Embotelladoras Arca S.A.B. de CV | | 76,800 | 566,538 |
| Fomento Economico Mexicano S.A.B. de CV: | | | |
| unit | | 84,600 | 761,322 |
| sponsored ADR | | 6,033 | 543,211 |
| Gruma S.A.B. de CV Series B | | 37,535 | 501,218 |
| Grupo Aeroportuario del Pacifico S.A.B. de CV Series B | | 53,300 | 548,140 |
| Grupo Aeroportuario del Sureste S.A.B. de CV Series B | | 29,905 | 567,465 |
| Grupo Aeroportuario Norte S.A.B. de CV | | 82,100 | 455,611 |
| Grupo Cementos de Chihuahua S.A.B. de CV | | 96,200 | 456,286 |
| Grupo Mexico SA de CV Series B | | 219,000 | 644,136 |
| Promotora y Operadora de Infraestructura S.A.B. de CV | | 49,315 | 526,177 |
|
| TOTAL MEXICO | | | 6,352,122 |
|
| Netherlands - 2.2% | | | |
| Aalberts Industries NV | | 6,100 | 242,001 |
| Akzo Nobel NV | | 4,160 | 363,788 |
| ASML Holding NV (Netherlands) | | 20,100 | 2,656,950 |
| ING Groep NV (Certificaten Van Aandelen) | | 110,976 | 1,808,858 |
| PostNL NV | | 55,000 | 272,418 |
| RELX NV | | 57,476 | 1,111,616 |
| Takeaway.com Holding BV (c) | | 1,800 | 60,626 |
| VastNed Retail NV | | 3,427 | 128,024 |
| Wolters Kluwer NV | | 16,174 | 686,939 |
| Yandex NV Series A (a) | | 19,700 | 537,022 |
|
| TOTAL NETHERLANDS | | | 7,868,242 |
|
| New Zealand - 0.1% | | | |
| Auckland International Airport Ltd. | | 77,950 | 369,291 |
| Norway - 0.3% | | | |
| Kongsberg Gruppen ASA | | 5,900 | 92,080 |
| Skandiabanken ASA | | 6,200 | 55,422 |
| Statoil ASA | | 62,687 | 1,032,386 |
|
| TOTAL NORWAY | | | 1,179,888 |
|
| Philippines - 0.8% | | | |
| Ayala Corp. | | 31,730 | 548,220 |
| Ayala Land, Inc. | | 769,500 | 541,626 |
| D&L Industries, Inc. | | 1,690,400 | 431,435 |
| Jollibee Food Corp. | | 22,780 | 95,387 |
| SM Investments Corp. | | 37,050 | 537,818 |
| SM Prime Holdings, Inc. | | 894,900 | 531,749 |
|
| TOTAL PHILIPPINES | | | 2,686,235 |
|
| Russia - 0.8% | | | |
| Alrosa Co. Ltd. (a) | | 314,900 | 542,693 |
| Magnit OJSC | | 4,020 | 619,714 |
| NOVATEK OAO GDR (Reg. S) | | 5,300 | 642,360 |
| Sberbank of Russia | | 371,720 | 1,079,682 |
|
| TOTAL RUSSIA | | | 2,884,449 |
|
| South Africa - 2.5% | | | |
| Aspen Pharmacare Holdings Ltd. | | 28,200 | 585,007 |
| Bidcorp Ltd. | | 27,732 | 587,563 |
| Capitec Bank Holdings Ltd. | | 9,400 | 536,367 |
| Clicks Group Ltd. | | 72,521 | 728,425 |
| Discovery Ltd. | | 50,667 | 507,286 |
| FirstRand Ltd. | | 200,200 | 746,794 |
| Mondi Ltd. | | 21,800 | 565,613 |
| Naspers Ltd. Class N | | 20,500 | 3,898,106 |
| Sanlam Ltd. | | 106,400 | 564,415 |
|
| TOTAL SOUTH AFRICA | | | 8,719,576 |
|
| Spain - 3.0% | | | |
| Amadeus IT Holding SA Class A | | 39,900 | 2,151,422 |
| Banco Santander SA (Spain) | | 238,400 | 1,554,759 |
| CaixaBank SA | | 242,906 | 1,102,901 |
| Hispania Activos Inmobiliarios SA | | 31,295 | 472,482 |
| Iberdrola SA | | 211,733 | 1,522,690 |
| Inditex SA | | 66,996 | 2,569,582 |
| Merlin Properties Socimi SA | | 36,400 | 430,803 |
| Prosegur Compania de Seguridad SA (Reg.) | | 116,876 | 762,605 |
|
| TOTAL SPAIN | | | 10,567,244 |
|
| Sweden - 3.5% | | | |
| Addlife AB (a) | | 1,000 | 19,024 |
| AddTech AB (B Shares) | | 7,400 | 133,257 |
| ASSA ABLOY AB (B Shares) | | 134,700 | 2,918,376 |
| Atlas Copco AB (A Shares) | | 42,200 | 1,577,980 |
| Fagerhult AB | | 30,875 | 1,274,069 |
| Investor AB (B Shares) | | 21,687 | 991,393 |
| Lagercrantz Group AB (B Shares) | | 12,400 | 135,448 |
| Loomis AB (B Shares) | | 3,900 | 141,561 |
| Nordea Bank AB | | 142,467 | 1,753,232 |
| Saab AB (B Shares) | | 4,100 | 203,303 |
| Svenska Cellulosa AB (SCA) (B Shares) | | 27,800 | 920,881 |
| Svenska Handelsbanken AB (A Shares) | | 65,645 | 931,613 |
| Swedbank AB (A Shares) | | 38,600 | 914,742 |
| Telefonaktiebolaget LM Ericsson (B Shares) | | 50,800 | 330,039 |
|
| TOTAL SWEDEN | | | 12,244,918 |
|
| Switzerland - 5.9% | | | |
| ABB Ltd. (Reg.) | | 48,990 | 1,200,464 |
| Credit Suisse Group AG | | 32,912 | 501,940 |
| Lafargeholcim Ltd. (Reg.) | | 13,320 | 755,023 |
| Nestle SA (Reg. S) | | 94,906 | 7,309,701 |
| Novartis AG | | 39,432 | 3,035,675 |
| Roche Holding AG (participation certificate) | | 11,345 | 2,968,584 |
| Schindler Holding AG: | | | |
| (participation certificate) | | 4,737 | 967,871 |
| (Reg.) | | 1,212 | 240,695 |
| Sika AG | | 70 | 446,734 |
| Tecan Group AG | | 170 | 29,011 |
| UBS Group AG | | 105,989 | 1,802,873 |
| Zurich Insurance Group AG | | 5,596 | 1,548,628 |
|
| TOTAL SWITZERLAND | | | 20,807,199 |
|
| Taiwan - 1.7% | | | |
| Addcn Technology Co. Ltd. | | 10,772 | 80,372 |
| Advantech Co. Ltd. | | 60,000 | 484,399 |
| Largan Precision Co. Ltd. | | 3,870 | 642,162 |
| Taiwan Semiconductor Manufacturing Co. Ltd. | | 723,035 | 4,649,702 |
|
| TOTAL TAIWAN | | | 5,856,635 |
|
| Thailand - 0.3% | | | |
| Airports of Thailand PCL (For. Reg.) | | 451,100 | 524,762 |
| Thai Beverage PCL | | 722,600 | 478,406 |
|
| TOTAL THAILAND | | | 1,003,168 |
|
| Turkey - 0.2% | | | |
| Tofas Turk Otomobil Fabrikasi A/S | | 55,707 | 463,918 |
| Tupras Turkiye Petrol Rafinelleri A/S | | 12,000 | 302,369 |
|
| TOTAL TURKEY | | | 766,287 |
|
| United Arab Emirates - 0.2% | | | |
| National Bank of Abu Dhabi PJSC (a) | | 174,704 | 523,208 |
| United Kingdom - 11.0% | | | |
| Alliance Pharma PLC | | 68,814 | 42,336 |
| AstraZeneca PLC (United Kingdom) | | 25,904 | 1,551,376 |
| Aviva PLC | | 229,915 | 1,563,517 |
| Avon Rubber PLC | | 1,300 | 17,663 |
| BAE Systems PLC | | 277,221 | 2,251,582 |
| Berendsen PLC | | 68,755 | 747,142 |
| BHP Billiton PLC | | 34,490 | 525,807 |
| BP PLC | | 367,555 | 2,104,111 |
| British American Tobacco PLC (United Kingdom) | | 56,400 | 3,810,574 |
| Bunzl PLC | | 33,129 | 1,033,241 |
| Compass Group PLC | | 54,907 | 1,108,617 |
| Dechra Pharmaceuticals PLC | | 3,300 | 72,233 |
| Domino's Pizza UK & IRL PLC | | 15,700 | 67,206 |
| DP Poland PLC (a) | | 40,800 | 26,818 |
| Elementis PLC | | 139,608 | 550,055 |
| Great Portland Estates PLC | | 18,172 | 162,872 |
| Hilton Food Group PLC | | 3,495 | 34,833 |
| Howden Joinery Group PLC | | 82,700 | 495,933 |
| HSBC Holdings PLC sponsored ADR | | 24,607 | 1,013,070 |
| Imperial Tobacco Group PLC | | 20,948 | 1,026,127 |
| Informa PLC | | 275,792 | 2,293,261 |
| InterContinental Hotel Group PLC | | 8,600 | 456,242 |
| InterContinental Hotel Group PLC ADR | | 40,112 | 2,117,512 |
| ITE Group PLC | | 49,000 | 112,333 |
| ITV PLC | | 207,919 | 565,523 |
| Just Eat Holding Ltd. (a) | | 11,540 | 86,242 |
| Lloyds Banking Group PLC | | 2,131,800 | 1,915,479 |
| Micro Focus International PLC | | 36,100 | 1,210,064 |
| NMC Health PLC | | 19,400 | 499,271 |
| Prudential PLC | | 108,664 | 2,411,674 |
| Reckitt Benckiser Group PLC | | 33,251 | 3,063,666 |
| Rightmove PLC | | 9,000 | 487,954 |
| Rio Tinto PLC | | 34,802 | 1,372,947 |
| Royal Dutch Shell PLC Class B (United Kingdom) | | 18,114 | 481,959 |
| Shaftesbury PLC | | 41,937 | 506,233 |
| Spectris PLC | | 21,770 | 778,224 |
| Spirax-Sarco Engineering PLC | | 6,499 | 437,710 |
| Standard Chartered PLC (United Kingdom) (a) | | 120,535 | 1,125,915 |
| Topps Tiles PLC | | 25,400 | 34,132 |
| Ultra Electronics Holdings PLC | | 6,201 | 168,020 |
| Unilever PLC | | 8,600 | 442,456 |
| Unite Group PLC | | 12,351 | 103,501 |
|
| TOTAL UNITED KINGDOM | | | 38,875,431 |
|
| United States of America - 8.8% | | | |
| A.O. Smith Corp. | | 8,300 | 447,204 |
| Alphabet, Inc.: | | | |
| Class A (a) | | 2,030 | 1,876,776 |
| Class C (a) | | 483 | 437,579 |
| Amazon.com, Inc. (a) | | 520 | 480,995 |
| Amgen, Inc. | | 2,600 | 424,632 |
| Amphenol Corp. Class A | | 6,100 | 441,091 |
| Autoliv, Inc. | | 11,254 | 1,127,538 |
| Berkshire Hathaway, Inc. Class B (a) | | 8,216 | 1,357,365 |
| China Biologic Products, Inc. (a) | | 10,800 | 1,274,400 |
| ConocoPhillips Co. | | 19,400 | 929,454 |
| Constellation Brands, Inc. Class A (sub. vtg.) | | 2,700 | 465,858 |
| Domino's Pizza, Inc. | | 2,390 | 433,522 |
| Edgewell Personal Care Co. (a) | | 4,300 | 307,407 |
| Facebook, Inc. Class A (a) | | 3,400 | 510,850 |
| Martin Marietta Materials, Inc. | | 5,660 | 1,246,275 |
| MasterCard, Inc. Class A | | 24,130 | 2,806,802 |
| Mettler-Toledo International, Inc. (a) | | 900 | 462,078 |
| Mohawk Industries, Inc. (a) | | 5,095 | 1,196,255 |
| Molson Coors Brewing Co. Class B | | 11,600 | 1,112,324 |
| Moody's Corp. | | 9,700 | 1,147,704 |
| MSCI, Inc. | | 12,500 | 1,254,000 |
| Philip Morris International, Inc. | | 19,600 | 2,172,464 |
| PPG Industries, Inc. | | 4,900 | 538,216 |
| PriceSmart, Inc. | | 6,285 | 546,481 |
| ResMed, Inc. | | 12,460 | 847,155 |
| S&P Global, Inc. | | 16,200 | 2,173,878 |
| Sherwin-Williams Co. | | 4,600 | 1,539,528 |
| The Walt Disney Co. | | 3,800 | 439,280 |
| Visa, Inc. Class A | | 32,677 | 2,980,796 |
|
| TOTAL UNITED STATES OF AMERICA | | | 30,977,907 |
|
| TOTAL COMMON STOCKS | | | |
| (Cost $278,507,607) | | | 339,004,706 |
|
| Preferred Stocks - 1.3% | | | |
| Convertible Preferred Stocks - 0.2% | | | |
| India - 0.2% | | | |
| PC Jeweller Ltd. 13.00% (d) | | 3,557,622 | 549,993 |
| Nonconvertible Preferred Stocks - 1.1% | | | |
| Brazil - 0.8% | | | |
| Ambev SA sponsored ADR | | 167,000 | 956,910 |
| Itau Unibanco Holding SA | | 99,170 | 1,226,639 |
| Itausa-Investimentos Itau SA (PN) | | 217,400 | 677,395 |
| | | | 2,860,944 |
| Germany - 0.1% | | | |
| Sartorius AG (non-vtg.) | | 4,300 | 393,736 |
| Spain - 0.2% | | | |
| Grifols SA Class B | | 30,200 | 644,614 |
|
| TOTAL NONCONVERTIBLE PREFERRED STOCKS | | | 3,899,294 |
|
| TOTAL PREFERRED STOCKS | | | |
| (Cost $3,616,876) | | | 4,449,287 |
|
| Investment Companies - 0.4% | | | |
| United States of America - 0.4% | | | |
| iShares MSCI EAFE Small-Cap ETF | | | |
| (Cost $1,570,116) | | 27,800 | 1,568,476 |
|
| Money Market Funds - 2.0% | | | |
| Fidelity Cash Central Fund, 0.85% (e) | | 5,708,343 | 5,709,485 |
| Fidelity Securities Lending Cash Central Fund 0.86% (e)(f) | | 1,271,875 | 1,272,002 |
| TOTAL MONEY MARKET FUNDS | | | |
| (Cost $6,981,487) | | | 6,981,487 |
| TOTAL INVESTMENT PORTFOLIO - 99.9% | | | |
| (Cost $290,676,086) | | | 352,003,956 |
| NET OTHER ASSETS (LIABILITIES) - 0.1% | | | 311,081 |
| NET ASSETS - 100% | | | $352,315,037 |
Security Type Abbreviations
ETF – Exchange-Traded Fund
Categorizations in the Schedule of Investments are based on country or territory of incorporation.
Legend
(a) Non-income producing
(b) Security or a portion of the security is on loan at period end.
(c) Security exempt from registration under Rule 144A of the Securities Act of 1933. These securities may be resold in transactions exempt from registration, normally to qualified institutional buyers. At the end of the period, the value of these securities amounted to $60,626 or 0.0% of net assets.
(d) Restricted securities - Investment in securities not registered under the Securities Act of 1933 (excluding 144A issues). At the end of the period, the value of restricted securities (excluding 144A issues) amounted to $549,993 or 0.2% of net assets.
(e) Affiliated fund that is generally available only to investment companies and other accounts managed by Fidelity Investments. The rate quoted is the annualized seven-day yield of the fund at period end. A complete unaudited listing of the fund's holdings as of its most recent quarter end is available upon request. In addition, each Fidelity Central Fund's financial statements are available on the SEC's website or upon request.
(f) Investment made with cash collateral received from securities on loan.
Additional information on each restricted holding is as follows:
| Security | Acquisition Date | Acquisition Cost |
| PC Jeweller Ltd. 13.00% | 7/28/16 | $530,934 |
Affiliated Central Funds
Information regarding fiscal year to date income earned by the Fund from investments in Fidelity Central Funds is as follows:
| Fund | Income earned |
| Fidelity Cash Central Fund | $21,461 |
| Fidelity Securities Lending Cash Central Fund | 21,692 |
| Total | $43,153 |
Investment Valuation
The following is a summary of the inputs used, as of April 30, 2017, involving the Fund's assets and liabilities carried at fair value. The inputs or methodology used for valuing securities may not be an indication of the risk associated with investing in those securities. For more information on valuation inputs, and their aggregation into the levels used below, please refer to the Investment Valuation section in the accompanying Notes to Financial Statements.
| | Valuation Inputs at Reporting Date: |
| Description | Total | Level 1 | Level 2 | Level 3 |
| Investments in Securities: | | | | |
| Equities: | | | | |
| Consumer Discretionary | $36,678,330 | $26,573,194 | $10,105,136 | $-- |
| Consumer Staples | 42,471,767 | 23,518,258 | 18,953,509 | -- |
| Energy | 14,204,222 | 7,237,812 | 6,966,410 | -- |
| Financials | 67,910,499 | 45,020,193 | 22,890,306 | -- |
| Health Care | 34,793,103 | 21,514,487 | 13,278,616 | -- |
| Industrials | 46,143,187 | 38,391,063 | 7,752,124 | -- |
| Information Technology | 55,187,580 | 40,390,107 | 14,797,473 | -- |
| Materials | 31,151,175 | 28,624,178 | 2,526,997 | -- |
| Real Estate | 5,694,618 | 5,694,618 | -- | -- |
| Telecommunication Services | 5,603,747 | 962,910 | 4,640,837 | -- |
| Utilities | 3,615,765 | 3,615,765 | -- | -- |
| Investment Companies | 1,568,476 | 1,568,476 | -- | -- |
| Money Market Funds | 6,981,487 | 6,981,487 | -- | -- |
| Total Investments in Securities: | $352,003,956 | $250,092,548 | $101,911,408 | $-- |
The following is a summary of transfers between Level 1 and Level 2 for the period ended April 30, 2017. Transfers are assumed to have occurred at the beginning of the period, and are primarily attributable to the valuation techniques used for foreign equity securities, as discussed in the accompanying Notes to Financial Statements:
| Transfers | Total |
| Level 1 to Level 2 | $11,768,859 |
| Level 2 to Level 1 | $8,584,383 |
See accompanying notes which are an integral part of the financial statements.
Financial Statements
Statement of Assets and Liabilities
| | | April 30, 2017 (Unaudited) |
| Assets | | |
Investment in securities, at value (including securities loaned of $1,149,670) — See accompanying schedule:
Unaffiliated issuers (cost $283,694,599) | $345,022,469 | |
| Fidelity Central Funds (cost $6,981,487) | 6,981,487 | |
| Total Investments (cost $290,676,086) | | $352,003,956 |
| Cash | | 260,283 |
| Foreign currency held at value (cost $204,133) | | 204,121 |
| Receivable for investments sold | | 2,196,362 |
| Receivable for fund shares sold | | 114,112 |
| Dividends receivable | | 1,785,054 |
| Distributions receivable from Fidelity Central Funds | | 10,866 |
| Prepaid expenses | | 202 |
| Receivable from investment adviser for expense reductions | | 82 |
| Other receivables | | 36,246 |
| Total assets | | 356,611,284 |
| Liabilities | | |
| Payable for investments purchased | $2,459,052 | |
| Payable for fund shares redeemed | 184,648 | |
| Accrued management fee | 224,529 | |
| Distribution and service plan fees payable | 10,130 | |
| Other affiliated payables | 49,420 | |
| Other payables and accrued expenses | 96,468 | |
| Collateral on securities loaned | 1,272,000 | |
| Total liabilities | | 4,296,247 |
| Net Assets | | $352,315,037 |
| Net Assets consist of: | | |
| Paid in capital | | $307,349,169 |
| Undistributed net investment income | | 1,726,589 |
| Accumulated undistributed net realized gain (loss) on investments and foreign currency transactions | | (18,043,442) |
| Net unrealized appreciation (depreciation) on investments and assets and liabilities in foreign currencies | | 61,282,721 |
| Net Assets | | $352,315,037 |
| Calculation of Maximum Offering Price | | |
| Class A: | | |
| Net Asset Value and redemption price per share ($8,521,385 ÷ 1,017,298 shares) | | $8.38 |
| Maximum offering price per share (100/94.25 of $8.38) | | $8.89 |
| Class M: | | |
| Net Asset Value and redemption price per share ($14,784,961 ÷ 1,757,259 shares) | | $8.41 |
| Maximum offering price per share (100/96.50 of $8.41) | | $8.72 |
| Class C: | | |
| Net Asset Value and offering price per share ($2,937,777 ÷ 350,019 shares)(a) | | $8.39 |
| Total International Equity: | | |
| Net Asset Value, offering price and redemption price per share ($322,011,677 ÷ 38,383,771 shares) | | $8.39 |
| Class I: | | |
| Net Asset Value, offering price and redemption price per share ($3,951,015 ÷ 472,731 shares) | | $8.36 |
| Class Z: | | |
| Net Asset Value, offering price and redemption price per share ($108,222 ÷ 12,937 shares) | | $8.37 |
(a) Redemption price per share is equal to net asset value less any applicable contingent deferred sales charge.
See accompanying notes which are an integral part of the financial statements.
Statement of Operations
| | | Six months ended April 30, 2017 (Unaudited) |
| Investment Income | | |
| Dividends | | $4,184,091 |
| Income from Fidelity Central Funds | | 43,153 |
| Income before foreign taxes withheld | | 4,227,244 |
| Less foreign taxes withheld | | (374,193) |
| Total income | | 3,853,051 |
| Expenses | | |
| Management fee | | |
| Basic fee | $1,129,780 | |
| Performance adjustment | 71,150 | |
| Transfer agent fees | 204,650 | |
| Distribution and service plan fees | 59,505 | |
| Accounting and security lending fees | 84,093 | |
| Custodian fees and expenses | 98,051 | |
| Independent trustees' fees and expenses | 649 | |
| Registration fees | 28,464 | |
| Audit | 55,153 | |
| Legal | 1,145 | |
| Miscellaneous | 1,944 | |
| Total expenses before reductions | 1,734,584 | |
| Expense reductions | (24,463) | 1,710,121 |
| Net investment income (loss) | | 2,142,930 |
| Realized and Unrealized Gain (Loss) | | |
| Net realized gain (loss) on: | | |
| Investment securities: | | |
| Unaffiliated issuers | 8,759,675 | |
| Fidelity Central Funds | (952) | |
| Foreign currency transactions | (88,370) | |
| Total net realized gain (loss) | | 8,670,353 |
Change in net unrealized appreciation (depreciation) on:
Investment securities (net of increase in deferred foreign taxes of $34,910) | 23,429,654 | |
| Assets and liabilities in foreign currencies | 23,913 | |
| Total change in net unrealized appreciation (depreciation) | | 23,453,567 |
| Net gain (loss) | | 32,123,920 |
| Net increase (decrease) in net assets resulting from operations | | $34,266,850 |
See accompanying notes which are an integral part of the financial statements.
Statement of Changes in Net Assets
| | Six months ended April 30, 2017 (Unaudited) | Year ended October 31, 2016 |
| Increase (Decrease) in Net Assets | | |
| Operations | | |
| Net investment income (loss) | $2,142,930 | $4,368,676 |
| Net realized gain (loss) | 8,670,353 | 3,239,278 |
| Change in net unrealized appreciation (depreciation) | 23,453,567 | (10,501,802) |
| Net increase (decrease) in net assets resulting from operations | 34,266,850 | (2,893,848) |
| Distributions to shareholders from net investment income | (4,227,310) | (3,869,339) |
| Share transactions - net increase (decrease) | 14,264,395 | (21,421,371) |
| Redemption fees | 1,125 | 1,162 |
| Total increase (decrease) in net assets | 44,305,060 | (28,183,396) |
| Net Assets | | |
| Beginning of period | 308,009,977 | 336,193,373 |
| End of period | $352,315,037 | $308,009,977 |
| Other Information | | |
| Undistributed net investment income end of period | $1,726,589 | $3,810,969 |
See accompanying notes which are an integral part of the financial statements.
Financial Highlights — Fidelity Total International Equity Fund Class A
| | Six months ended (Unaudited) April 30, | Years ended October 31, | | | | |
| | 2017 | 2016 | 2015 | 2014 | 2013 | 2012 |
| Selected Per–Share Data | | | | | | |
| Net asset value, beginning of period | $7.67 | $7.79 | $8.00 | $8.27 | $7.31 | $6.67 |
| Income from Investment Operations | | | | | | |
| Net investment income (loss)A | .04 | .08 | .07 | .13 | .09 | .13 |
| Net realized and unrealized gain (loss) | .75 | (.14) | (.14) | (.12) | 1.24 | .59 |
| Total from investment operations | .79 | (.06) | (.07) | .01 | 1.33 | .72 |
| Distributions from net investment income | (.08) | (.06) | (.10) | (.10) | (.13) | (.08) |
| Distributions from net realized gain | – | – | (.04) | (.18) | (.25) | – |
| Total distributions | (.08) | (.06) | (.14) | (.28) | (.37)B | (.08) |
| Redemption fees added to paid in capitalA,C | – | – | – | – | – | – |
| Net asset value, end of period | $8.38 | $7.67 | $7.79 | $8.00 | $8.27 | $7.31 |
| Total ReturnD,E,F | 10.47% | (.76)% | (.89)% | .19% | 19.00% | 10.88% |
| Ratios to Average Net AssetsG,H | | | | | | |
| Expenses before reductions | 1.42%I | 1.52% | 1.48% | 1.44% | 1.50% | 1.57% |
| Expenses net of fee waivers, if any | 1.42%I | 1.45% | 1.45% | 1.44% | 1.45% | 1.45% |
| Expenses net of all reductions | 1.41%I | 1.45% | 1.44% | 1.44% | 1.43% | 1.42% |
| Net investment income (loss) | .97%I | 1.10% | .86% | 1.63% | 1.21% | 1.88% |
| Supplemental Data | | | | | | |
| Net assets, end of period (000 omitted) | $8,521 | $8,576 | $9,163 | $9,164 | $9,034 | $5,767 |
| Portfolio turnover rateJ | 53%I | 51% | 53% | 85% | 89% | 110% |
A Calculated based on average shares outstanding during the period.
B Total distributions of $.37 per share is comprised of distributions from net investment income of $.126 and distributions from net realized gain of $.245 per share.
C Amount represents less than $.005 per share.
D Total returns for periods of less than one year are not annualized.
E Total returns would have been lower if certain expenses had not been reduced during the applicable periods shown.
F Total returns do not include the effect of the sales charges.
G Fees and expenses of any underlying Fidelity Central Funds are not included in the Fund's expense ratio. The Fund indirectly bears its proportionate share of the expenses of any underlying Fidelity Central Funds.
H Expense ratios reflect operating expenses of the class. Expenses before reductions do not reflect amounts reimbursed by the investment adviser or reductions from brokerage service arrangements or reductions from other expense offset arrangements and do not represent the amount paid by the class during periods when reimbursements or reductions occur. Expenses net of fee waivers reflect expenses after reimbursement by the investment adviser but prior to reductions from brokerage service arrangements or other expense offset arrangements. Expenses net of all reductions represent the net expenses paid by the class.
I Annualized
J Amount does not include the portfolio activity of any underlying Fidelity Central Funds.
See accompanying notes which are an integral part of the financial statements.
Financial Highlights — Fidelity Total International Equity Fund Class M
| | Six months ended (Unaudited) April 30, | Years ended October 31, | | | | |
| | 2017 | 2016 | 2015 | 2014 | 2013 | 2012 |
| Selected Per–Share Data | | | | | | |
| Net asset value, beginning of period | $7.70 | $7.81 | $8.04 | $8.32 | $7.37 | $6.73 |
| Income from Investment Operations | | | | | | |
| Net investment income (loss)A | .03 | .06 | .05 | .11 | .07 | .11 |
| Net realized and unrealized gain (loss) | .75 | (.13) | (.15) | (.12) | 1.25 | .59 |
| Total from investment operations | .78 | (.07) | (.10) | (.01) | 1.32 | .70 |
| Distributions from net investment income | (.07) | (.04) | (.09) | (.09) | (.13) | (.06) |
| Distributions from net realized gain | – | – | (.04) | (.18) | (.25) | – |
| Total distributions | (.07) | (.04) | (.13) | (.27) | (.37)B | (.06) |
| Redemption fees added to paid in capitalA,C | – | – | – | – | – | – |
| Net asset value, end of period | $8.41 | $7.70 | $7.81 | $8.04 | $8.32 | $7.37 |
| Total ReturnD,E,F | 10.18% | (.86)% | (1.26)% | (.06)% | 18.73% | 10.52% |
| Ratios to Average Net AssetsG,H | | | | | | |
| Expenses before reductions | 1.64%I | 1.73% | 1.70% | 1.68% | 1.75% | 1.84% |
| Expenses net of fee waivers, if any | 1.64%I | 1.70% | 1.70% | 1.68% | 1.70% | 1.70% |
| Expenses net of all reductions | 1.63%I | 1.69% | 1.69% | 1.68% | 1.67% | 1.67% |
| Net investment income (loss) | .75%I | .85% | .61% | 1.38% | .96% | 1.63% |
| Supplemental Data | | | | | | |
| Net assets, end of period (000 omitted) | $14,785 | $13,893 | $13,962 | $10,282 | $7,909 | $2,348 |
| Portfolio turnover rateJ | 53%I | 51% | 53% | 85% | 89% | 110% |
A Calculated based on average shares outstanding during the period.
B Total distributions of $.37 per share is comprised of distributions from net investment income of $.128 and distributions from net realized gain of $.245 per share.
C Amount represents less than $.005 per share.
D Total returns for periods of less than one year are not annualized.
E Total returns would have been lower if certain expenses had not been reduced during the applicable periods shown.
F Total returns do not include the effect of the sales charges.
G Fees and expenses of any underlying Fidelity Central Funds are not included in the Fund's expense ratio. The Fund indirectly bears its proportionate share of the expenses of any underlying Fidelity Central Funds.
H Expense ratios reflect operating expenses of the class. Expenses before reductions do not reflect amounts reimbursed by the investment adviser or reductions from brokerage service arrangements or reductions from other expense offset arrangements and do not represent the amount paid by the class during periods when reimbursements or reductions occur. Expenses net of fee waivers reflect expenses after reimbursement by the investment adviser but prior to reductions from brokerage service arrangements or other expense offset arrangements. Expenses net of all reductions represent the net expenses paid by the class.
I Annualized
J Amount does not include the portfolio activity of any underlying Fidelity Central Funds.
See accompanying notes which are an integral part of the financial statements.
Financial Highlights — Fidelity Total International Equity Fund Class C
| | Six months ended (Unaudited) April 30, | Years ended October 31, | | | | |
| | 2017 | 2016 | 2015 | 2014 | 2013 | 2012 |
| Selected Per–Share Data | | | | | | |
| Net asset value, beginning of period | $7.66 | $7.77 | $8.00 | $8.28 | $7.31 | $6.67 |
| Income from Investment Operations | | | | | | |
| Net investment income (loss)A | .01 | .03 | .01 | .07 | .04 | .08 |
| Net realized and unrealized gain (loss) | .74 | (.14) | (.15) | (.12) | 1.25 | .58 |
| Total from investment operations | .75 | (.11) | (.14) | (.05) | 1.29 | .66 |
| Distributions from net investment income | (.02) | – | (.05) | (.05) | (.08) | (.02) |
| Distributions from net realized gain | – | – | (.04) | (.18) | (.25) | – |
| Total distributions | (.02) | – | (.09) | (.23) | (.32)B | (.02) |
| Redemption fees added to paid in capitalA,C | – | – | – | – | – | – |
| Net asset value, end of period | $8.39 | $7.66 | $7.77 | $8.00 | $8.28 | $7.31 |
| Total ReturnD,E,F | 9.87% | (1.42)% | (1.73)% | (.57)% | 18.30% | 9.98% |
| Ratios to Average Net AssetsG,H | | | | | | |
| Expenses before reductions | 2.22%I | 2.30% | 2.26% | 2.22% | 2.26% | 2.31% |
| Expenses net of fee waivers, if any | 2.20%I | 2.20% | 2.20% | 2.20% | 2.20% | 2.20% |
| Expenses net of all reductions | 2.18%I | 2.20% | 2.19% | 2.20% | 2.18% | 2.17% |
| Net investment income (loss) | .19%I | .35% | .11% | .87% | .46% | 1.13% |
| Supplemental Data | | | | | | |
| Net assets, end of period (000 omitted) | $2,938 | $2,713 | $3,311 | $4,028 | $3,584 | $2,737 |
| Portfolio turnover rateJ | 53%I | 51% | 53% | 85% | 89% | 110% |
A Calculated based on average shares outstanding during the period.
B Total distributions of $.32 per share is comprised of distributions from net investment income of $.075 and distributions from net realized gain of $.245 per share.
C Amount represents less than $.005 per share.
D Total returns for periods of less than one year are not annualized.
E Total returns would have been lower if certain expenses had not been reduced during the applicable periods shown.
F Total returns do not include the effect of the contingent deferred sales charge.
G Fees and expenses of any underlying Fidelity Central Funds are not included in the Fund's expense ratio. The Fund indirectly bears its proportionate share of the expenses of any underlying Fidelity Central Funds.
H Expense ratios reflect operating expenses of the class. Expenses before reductions do not reflect amounts reimbursed by the investment adviser or reductions from brokerage service arrangements or reductions from other expense offset arrangements and do not represent the amount paid by the class during periods when reimbursements or reductions occur. Expenses net of fee waivers reflect expenses after reimbursement by the investment adviser but prior to reductions from brokerage service arrangements or other expense offset arrangements. Expenses net of all reductions represent the net expenses paid by the class.
I Annualized
J Amount does not include the portfolio activity of any underlying Fidelity Central Funds.
See accompanying notes which are an integral part of the financial statements.
Financial Highlights — Fidelity Total International Equity Fund
| | Six months ended (Unaudited) April 30, | Years ended October 31, | | | | |
| | 2017 | 2016 | 2015 | 2014 | 2013 | 2012 |
| Selected Per–Share Data | | | | | | |
| Net asset value, beginning of period | $7.70 | $7.82 | $8.03 | $8.29 | $7.32 | $6.69 |
| Income from Investment Operations | | | | | | |
| Net investment income (loss)A | .05 | .11 | .10 | .16 | .12 | .15 |
| Net realized and unrealized gain (loss) | .75 | (.13) | (.14) | (.12) | 1.24 | .58 |
| Total from investment operations | .80 | (.02) | (.04) | .04 | 1.36 | .73 |
| Distributions from net investment income | (.11) | (.10) | (.13) | (.12) | (.15) | (.10) |
| Distributions from net realized gain | – | – | (.04) | (.18) | (.25) | – |
| Total distributions | (.11) | (.10) | (.17) | (.30) | (.39)B | (.10) |
| Redemption fees added to paid in capitalA,C | – | – | – | – | – | – |
| Net asset value, end of period | $8.39 | $7.70 | $7.82 | $8.03 | $8.29 | $7.32 |
| Total ReturnD,E | 10.55% | (.32)% | (.51)% | .55% | 19.48% | 11.03% |
| Ratios to Average Net AssetsF,G | | | | | | |
| Expenses before reductions | 1.02%H | 1.11% | 1.07% | 1.04% | 1.09% | 1.16% |
| Expenses net of fee waivers, if any | 1.02%H | 1.11% | 1.07% | 1.04% | 1.09% | 1.16% |
| Expenses net of all reductions | 1.01%H | 1.10% | 1.06% | 1.04% | 1.07% | 1.13% |
| Net investment income (loss) | 1.37%H | 1.44% | 1.24% | 2.03% | 1.57% | 2.16% |
| Supplemental Data | | | | | | |
| Net assets, end of period (000 omitted) | $322,012 | $280,672 | $307,035 | $324,438 | $324,395 | $281,979 |
| Portfolio turnover rateI | 53%H | 51% | 53% | 85% | 89% | 110% |
A Calculated based on average shares outstanding during the period.
B Total distributions of $.39 per share is comprised of distributions from net investment income of $.148 and distributions from net realized gain of $.245 per share.
C Amount represents less than $.005 per share.
D Total returns for periods of less than one year are not annualized.
E Total returns would have been lower if certain expenses had not been reduced during the applicable periods shown.
F Fees and expenses of any underlying Fidelity Central Funds are not included in the Fund's expense ratio. The Fund indirectly bears its proportionate share of the expenses of any underlying Fidelity Central Funds.
G Expense ratios reflect operating expenses of the class. Expenses before reductions do not reflect amounts reimbursed by the investment adviser or reductions from brokerage service arrangements or reductions from other expense offset arrangements and do not represent the amount paid by the class during periods when reimbursements or reductions occur. Expenses net of fee waivers reflect expenses after reimbursement by the investment adviser but prior to reductions from brokerage service arrangements or other expense offset arrangements. Expenses net of all reductions represent the net expenses paid by the class.
H Annualized
I Amount does not include the portfolio activity of any underlying Fidelity Central Funds.
See accompanying notes which are an integral part of the financial statements.
Financial Highlights — Fidelity Total International Equity Fund Class I
| | Six months ended (Unaudited) April 30, | Years ended October 31, | | | | |
| | 2017 | 2016 | 2015 | 2014 | 2013 | 2012 |
| Selected Per–Share Data | | | | | | |
| Net asset value, beginning of period | $7.66 | $7.78 | $7.99 | $8.26 | $7.30 | $6.67 |
| Income from Investment Operations | | | | | | |
| Net investment income (loss)A | .05 | .10 | .09 | .15 | .11 | .14 |
| Net realized and unrealized gain (loss) | .75 | (.13) | (.14) | (.12) | 1.24 | .59 |
| Total from investment operations | .80 | (.03) | (.05) | .03 | 1.35 | .73 |
| Distributions from net investment income | (.10) | (.09) | (.12) | (.12) | (.15) | (.10) |
| Distributions from net realized gain | – | – | (.04) | (.18) | (.25) | – |
| Total distributions | (.10) | (.09) | (.16) | (.30) | (.39)B | (.10) |
| Redemption fees added to paid in capitalA,C | – | – | – | – | – | – |
| Net asset value, end of period | $8.36 | $7.66 | $7.78 | $7.99 | $8.26 | $7.30 |
| Total ReturnD,E | 10.59% | (.43)% | (.64)% | .37% | 19.40% | 11.06% |
| Ratios to Average Net AssetsF,G | | | | | | |
| Expenses before reductions | 1.10%H | 1.22% | 1.17% | 1.15% | 1.21% | 1.27% |
| Expenses net of fee waivers, if any | 1.10%H | 1.20% | 1.17% | 1.15% | 1.20% | 1.20% |
| Expenses net of all reductions | 1.09%H | 1.20% | 1.16% | 1.15% | 1.18% | 1.17% |
| Net investment income (loss) | 1.29%H | 1.35% | 1.14% | 1.91% | 1.46% | 2.13% |
| Supplemental Data | | | | | | |
| Net assets, end of period (000 omitted) | $3,951 | $2,156 | $2,602 | $2,240 | $2,372 | $1,514 |
| Portfolio turnover rateI | 53%H | 51% | 53% | 85% | 89% | 110% |
A Calculated based on average shares outstanding during the period.
B Total distributions of $.39 per share is comprised of distributions from net investment income of $.148 and distributions from net realized gain of $.245 per share.
C Amount represents less than $.005 per share.
D Total returns for periods of less than one year are not annualized.
E Total returns would have been lower if certain expenses had not been reduced during the applicable periods shown.
F Fees and expenses of any underlying Fidelity Central Funds are not included in the Fund's expense ratio. The Fund indirectly bears its proportionate share of the expenses of any underlying Fidelity Central Funds.
G Expense ratios reflect operating expenses of the class. Expenses before reductions do not reflect amounts reimbursed by the investment adviser or reductions from brokerage service arrangements or reductions from other expense offset arrangements and do not represent the amount paid by the class during periods when reimbursements or reductions occur. Expenses net of fee waivers reflect expenses after reimbursement by the investment adviser but prior to reductions from brokerage service arrangements or other expense offset arrangements. Expenses net of all reductions represent the net expenses paid by the class.
H Annualized
I Amount does not include the portfolio activity of any underlying Fidelity Central Funds.
See accompanying notes which are an integral part of the financial statements.
Financial Highlights — Fidelity Total International Equity Fund Class Z
| | Six months ended (Unaudited) April 30, |
| | 2017 A |
| Selected Per–Share Data | |
| Net asset value, beginning of period | $7.73 |
| Income from Investment Operations | |
| Net investment income (loss)B | .05 |
| Net realized and unrealized gain (loss) | .59 |
| Total from investment operations | .64 |
| Distributions from net investment income | – |
| Distributions from net realized gain | – |
| Total distributions | – |
| Redemption fees added to paid in capitalB,C | – |
| Net asset value, end of period | $8.37 |
| Total ReturnD,E | 8.28% |
| Ratios to Average Net AssetsF,G | |
| Expenses before reductions | .95%H |
| Expenses net of fee waivers, if any | .95%H |
| Expenses net of all reductions | .93%H |
| Net investment income (loss) | 2.46%H |
| Supplemental Data | |
| Net assets, end of period (000 omitted) | $108 |
| Portfolio turnover rateI | 53%H |
A For the period February 1, 2017 (commencement of sale of shares) to April 30, 2017.
B Calculated based on average shares outstanding during the period.
C Amount represents less than $.005 per share.
D Total returns for periods of less than one year are not annualized.
E Total returns would have been lower if certain expenses had not been reduced during the applicable periods shown.
F Fees and expenses of any underlying Fidelity Central Funds are not included in the Fund's expense ratio. The Fund indirectly bears its proportionate share of the expenses of any underlying Fidelity Central Funds.
G Expense ratios reflect operating expenses of the class. Expenses before reductions do not reflect amounts reimbursed by the investment adviser or reductions from brokerage service arrangements or reductions from other expense offset arrangements and do not represent the amount paid by the class during periods when reimbursements or reductions occur. Expense ratios before reductions for start-up periods may not be representative of longer-term operating periods. Expenses net of fee waivers reflect expenses after reimbursement by the investment adviser but prior to reductions from brokerage service arrangements or other expense offset arrangements. Expenses net of all reductions represent the net expenses paid by the class.
H Annualized
I Amount does not include the portfolio activity of any underlying Fidelity Central Funds.
See accompanying notes which are an integral part of the financial statements.
Notes to Financial Statements (Unaudited)
For the period ended April 30, 2017
1. Organization.
Fidelity Total International Equity Fund (the Fund) is a fund of Fidelity Investment Trust (the Trust) and is authorized to issue an unlimited number of shares. The Trust is registered under the Investment Company Act of 1940, as amended (the 1940 Act), as an open-end management investment company organized as a Massachusetts business trust. The Fund commenced sale of Class Z shares on February 01, 2017. The Fund offers Class A, Class M (formerly Class T), Class C, Total International Equity, Class I and Class Z shares, each of which has equal rights as to assets and voting privileges. Each class has exclusive voting rights with respect to matters that affect that class. The Fund's investments in emerging markets can be subject to social, economic, regulatory, and political uncertainties and can be extremely volatile.
After the close of business on June 24, 2016, all outstanding Class B shares were converted to Class A shares. All prior fiscal period dollar and share amounts for Class B presented in the Notes to Financial Statements are for the period November 1, 2015 through June 24, 2016.
2. Investments in Fidelity Central Funds.
The Fund invests in Fidelity Central Funds, which are open-end investment companies generally available only to other investment companies and accounts managed by the investment adviser and its affiliates. The Fund's Schedule of Investments lists each of the Fidelity Central Funds held as of period end, if any, as an investment of the Fund, but does not include the underlying holdings of each Fidelity Central Fund. As an Investing Fund, the Fund indirectly bears its proportionate share of the expenses of the underlying Fidelity Central Funds.
The Money Market Central Funds seek preservation of capital and current income and are managed by Fidelity Investments Money Management, Inc. (FIMM), an affiliate of the investment adviser. Annualized expenses of the Money Market Central Funds as of their most recent shareholder report date are less than .005%.
A complete unaudited list of holdings for each Fidelity Central Fund is available upon request or at the Securities and Exchange Commission (the SEC) website at www.sec.gov. In addition, the financial statements of the Fidelity Central Funds are available on the SEC website or upon request.
3. Significant Accounting Policies.
The Fund is an investment company and applies the accounting and reporting guidance of the Financial Accounting Standards Board (FASB) Accounting Standards Codification Topic 946 Financial Services – Investments Companies. The financial statements have been prepared in conformity with accounting principles generally accepted in the United States of America (GAAP), which require management to make certain estimates and assumptions at the date of the financial statements. Actual results could differ from those estimates. Subsequent events, if any, through the date that the financial statements were issued have been evaluated in the preparation of the financial statements. The following summarizes the significant accounting policies of the Fund:
Investment Valuation. Investments are valued as of 4:00 p.m. Eastern time on the last calendar day of the period. The Board of Trustees (the Board) has delegated the day to day responsibility for the valuation of the Fund's investments to the Fair Value Committee (the Committee) established by the Fund's investment adviser. In accordance with valuation policies and procedures approved by the Board, the Fund attempts to obtain prices from one or more third party pricing vendors or brokers to value its investments. When current market prices, quotations or currency exchange rates are not readily available or reliable, investments will be fair valued in good faith by the Committee, in accordance with procedures adopted by the Board. Factors used in determining fair value vary by investment type and may include market or investment specific events. The frequency with which these procedures are used cannot be predicted and they may be utilized to a significant extent. The Committee oversees the Fund's valuation policies and procedures and reports to the Board on the Committee's activities and fair value determinations. The Board monitors the appropriateness of the procedures used in valuing the Fund's investments and ratifies the fair value determinations of the Committee.
The Fund categorizes the inputs to valuation techniques used to value its investments into a disclosure hierarchy consisting of three levels as shown below:
- Level 1 – quoted prices in active markets for identical investments
- Level 2 – other significant observable inputs (including quoted prices for similar investments, interest rates, prepayment speeds, etc.)
- Level 3 – unobservable inputs (including the Fund's own assumptions based on the best information available)
Valuation techniques used to value the Fund's investments by major category are as follows:
Equity securities, including restricted securities, for which market quotations are readily available, are valued at the last reported sale price or official closing price as reported by a third party pricing vendor on the primary market or exchange on which they are traded and are categorized as Level 1 in the hierarchy. In the event there were no sales during the day or closing prices are not available, securities are valued at the last quoted bid price or may be valued using the last available price and are generally categorized as Level 2 in the hierarchy. For foreign equity securities, when market or security specific events arise, comparisons to the valuation of American Depositary Receipts (ADRs), futures contracts, Exchange-Traded Funds (ETFs) and certain indexes as well as quoted prices for similar securities may be used and would be categorized as Level 2 in the hierarchy. Utilizing these techniques may result in transfers between Level 1 and Level 2. For equity securities, including restricted securities, where observable inputs are limited, assumptions about market activity and risk are used and these securities may be categorized as Level 3 in the hierarchy.
ETFs are valued at their last sale price or official closing price as reported by a third party pricing vendor on the primary market or exchange on which they are traded and are categorized as Level 1 in the hierarchy. In the event there were no sales during the day but the exchange reports a closing bid level, ETFs are valued at the closing bid and would be categorized as Level 1 in the hierarchy. In the event there was no closing bid, ETFs may be valued by another method that the Board believes reflects fair value in accordance with the Board's fair value pricing policies and may be categorized as Level 2 in the hierarchy.
Investments in open-end mutual funds, including the Fidelity Central Funds, are valued at their closing net asset value (NAV) each business day and are categorized as Level 1 in the hierarchy.
Changes in valuation techniques may result in transfers in or out of an assigned level within the disclosure hierarchy. The aggregate value of investments by input level as of April 30, 2017, including information on transfers between Levels 1 and 2 is included at the end of the Fund's Schedule of Investments.
Foreign Currency. The Fund may use foreign currency contracts to facilitate transactions in foreign-denominated securities. Gains and losses from these transactions may arise from changes in the value of the foreign currency or if the counterparties do not perform under the contracts' terms.
Foreign-denominated assets, including investment securities, and liabilities are translated into U.S. dollars at the exchange rates at period end. Purchases and sales of investment securities, income and dividends received and expenses denominated in foreign currencies are translated into U.S. dollars at the exchange rate in effect on the transaction date.
The effects of exchange rate fluctuations on investments are included with the net realized and unrealized gain (loss) on investment securities. Other foreign currency transactions resulting in realized and unrealized gain (loss) are disclosed separately.
Investment Transactions and Income. For financial reporting purposes, the Fund's investment holdings and NAV include trades executed through the end of the last business day of the period. The NAV per share for processing shareholder transactions is calculated as of the close of business of the New York Stock Exchange (NYSE), normally 4:00 p.m. Eastern time and includes trades executed through the end of the prior business day. Gains and losses on securities sold are determined on the basis of identified cost and may include proceeds received from litigation. Dividend income is recorded on the ex-dividend date, except for certain dividends from foreign securities where the ex-dividend date may have passed, which are recorded as soon as the Fund is informed of the ex-dividend date. Non-cash dividends included in dividend income, if any, are recorded at the fair market value of the securities received. Income and capital gain distributions from Fidelity Central Funds, if any, are recorded on the ex-dividend date. Certain distributions received by the Fund represent a return of capital or capital gain. The Fund determines the components of these distributions subsequent to the ex-dividend date, based upon receipt of tax filings or other correspondence relating to the underlying investment. These distributions are recorded as a reduction of cost of investments and/or as a realized gain. Investment income is recorded net of foreign taxes withheld where recovery of such taxes is uncertain.
Class Allocations and Expenses. Investment income, realized and unrealized capital gains and losses, common expenses of the Fund, and certain fund-level expense reductions, if any, are allocated daily on a pro-rata basis to each class based on the relative net assets of each class to the total net assets of the Fund. Each class differs with respect to transfer agent and distribution and service plan fees incurred. Certain expense reductions may also differ by class. For the reporting period, the allocated portion of income and expenses to each class as a percent of its average net assets may vary due to the timing of recording these transactions in relation to fluctuating net assets of the classes. Expenses directly attributable to a fund are charged to that fund. Expenses attributable to more than one fund are allocated among the respective funds on the basis of relative net assets or other appropriate methods. Expense estimates are accrued in the period to which they relate and adjustments are made when actual amounts are known.
Income Tax Information and Distributions to Shareholders. Each year, the Fund intends to qualify as a regulated investment company under Subchapter M of the Internal Revenue Code, including distributing substantially all of its taxable income and realized gains. As a result, no provision for U.S. Federal income taxes is required. The Fund files a U.S. federal tax return, in addition to state and local tax returns as required. The Fund's federal income tax returns are subject to examination by the Internal Revenue Service (IRS) for a period of three fiscal years after they are filed. State and local tax returns may be subject to examination for an additional fiscal year depending on the jurisdiction. Foreign taxes are provided for based on the Fund's understanding of the tax rules and rates that exist in the foreign markets in which it invests. The Fund is subject to a tax imposed on capital gains by certain countries in which it invests. An estimated deferred tax liability for net unrealized appreciation on the applicable securities is included in Other payables and accrued expenses on the Statement of Assets & Liabilities.
Distributions are declared and recorded on the ex-dividend date. Income dividends and capital gain distributions are declared separately for each class. Income and capital gain distributions are determined in accordance with income tax regulations, which may differ from GAAP.
Capital accounts within the financial statements are adjusted for permanent book-tax differences. These adjustments have no impact on net assets or the results of operations. Capital accounts are not adjusted for temporary book-tax differences which will reverse in a subsequent period.
Book-tax differences are primarily due to foreign currency transactions, partnerships, certain foreign taxes, passive foreign investment companies (PFIC), expiring capital loss carryforwards and losses deferred due to wash sales.
The federal tax cost of investment securities and unrealized appreciation (depreciation) as of period end were as follows:
| Gross unrealized appreciation | $67,556,148 |
| Gross unrealized depreciation | (7,722,433) |
| Net unrealized appreciation (depreciation) on securities | $59,833,715 |
| Tax cost | $292,170,241 |
Capital loss carryforwards are only available to offset future capital gains of the Fund to the extent provided by regulations and may be limited. Under the Regulated Investment Company Modernization Act of 2010 (the Act), the Fund is permitted to carry forward capital losses incurred in taxable years beginning after December 22, 2010 for an unlimited period and such capital losses are required to be used prior to any losses that expire. The capital loss carryforward information presented below, including any applicable limitation, is estimated as of prior fiscal period end and is subject to adjustment.
| Fiscal year of expiration | |
| 2017 | $(13,607,298) |
| 2019 | (8,855,997) |
| Total with expiration | (22,463,295) |
| No expiration | |
| Short-term | (1,840,457) |
| Total capital loss carryforward | $(24,303,752) |
Due to large subscriptions in a prior period, $22,463,295 of capital losses that will be available to offset future capital gains of the Fund will be limited to approximately $4,535,766 per year
Short-Term Trading (Redemption) Fees. Shares held by investors in the Fund less than 30 days may have been subject to a redemption fee equal to 1.00% of the NAV of shares redeemed. All redemption fees, which reduce the proceeds of the shareholder redemption, are retained by the Fund and accounted for as an addition to paid in capital.
Restricted Securities. The Fund may invest in securities that are subject to legal or contractual restrictions on resale. These securities generally may be resold in transactions exempt from registration or to the public if the securities are registered. Disposal of these securities may involve time-consuming negotiations and expense, and prompt sale at an acceptable price may be difficult. Information regarding restricted securities is included at the end of the Fund's Schedule of Investments.
4. Purchases and Sales of Investments.
Purchases and sales of securities, other than short-term securities, aggregated $94,691,070 and $84,569,294, respectively.
5. Fees and Other Transactions with Affiliates.
Management Fee. Fidelity Management & Research Company (the investment adviser) and its affiliates provide the Fund with investment management related services for which the Fund pays a monthly management fee. The management fee is the sum of an individual fund fee rate that is based on an annual rate of .45% of the Fund's average net assets and an annualized group fee rate that averaged .25% during the period. The group fee rate is based upon the average net assets of all the mutual funds advised by the investment adviser, including any mutual funds previously advised by the investment adviser that are currently advised by Fidelity SelectCo, LLC, an affiliate of the investment adviser. The group fee rate decreases as assets under management increase and increases as assets under management decrease. In addition, the management fee is subject to a performance adjustment (up to a maximum of +/- .20% of the Fund's average net assets over a 36 month performance period). The upward or downward adjustment to the management fee is based on the relative investment performance of the Total International Equity as compared to its benchmark index, the MSCI All Country World ex USA Index, over the same 36 month performance period. For the reporting period, the total annualized management fee rate, including the performance adjustment, was .74% of the Fund's average net assets. The performance adjustment included in the management fee rate may be higher or lower than the maximum performance adjustment rate due to the difference between the average net assets for the reporting and performance periods.
Distribution and Service Plan Fees. In accordance with Rule 12b-1 of the 1940 Act, the Fund has adopted separate Distribution and Service Plans for each class of shares. Certain classes pay Fidelity Distributors Corporation (FDC), an affiliate of the investment adviser, separate Distribution and Service Fees, each of which is based on an annual percentage of each class' average net assets. In addition, FDC may pay financial intermediaries for selling shares of the Fund and providing shareholder support services. For the period, the Distribution and Service Fee rates, total fees and amounts retained by FDC were as follows:
| | Distribution
Fee | Service
Fee | Total Fees | Retained
by FDC |
| Class A | -% | .25% | $10,450 | $1,021 |
| Class M | .25% | .25% | 35,276 | – |
| Class C | .75% | .25% | 13,779 | 2,508 |
| | | | $59,505 | $3,529 |
Sales Load. FDC may receive a front-end sales charge of up to 5.75% for selling Class A shares and 3.50% for selling Class M shares, some of which is paid to financial intermediaries for selling shares of the Fund. Depending on the holding period, FDC may receive contingent deferred sales charges levied on Class A, Class M, and Class C redemptions. The deferred sales charges are 1.00% for Class C shares, 1.00% for certain purchases of Class A shares and .25% for certain purchases of Class M shares.
For the period, sales charge amounts retained by FDC were as follows:
| | Retained
by FDC |
| Class A | $874 |
| Class M | 858 |
| Class C(a) | 315 |
| | $2,047 |
(a) When Class C shares are initially sold, FDC pays commissions from its own resources to financial intermediaries through which the sales are made.
Transfer Agent Fees. Fidelity Investments Institutional Operations Company, Inc., (FIIOC), an affiliate of the investment adviser, is the transfer, dividend disbursing and shareholder servicing agent for each class of the Fund. FIIOC receives account fees and asset-based fees that vary according to the account size and type of account of the shareholders of the respective classes of the Fund except for Class Z. FIIOC receives an asset-based fee of Class Z's average net assets. FIIOC pays for typesetting, printing and mailing of shareholder reports, except proxy statements.
For the period, transfer agent fees for each class were as follows:
| | Amount | % of
Class-Level Average
Net Assets(a) |
| Class A | $11,185 | .27 |
| Class M | 16,738 | .24 |
| Class C | 4,286 | .31 |
| Total International Equity | 170,021 | .11 |
| Class I | 2,408 | .20 |
| Class Z | 12 | .05 |
| | $204,650 | |
(a) Annualized
Accounting and Security Lending Fees. Fidelity Service Company, Inc. (FSC), an affiliate of the investment adviser, maintains the Fund's accounting records. The accounting fee is based on the level of average net assets for each month. Under a separate contract, FSC administers the security lending program. The security lending fee is based on the number and duration of lending transactions.
Brokerage Commissions. The Fund placed a portion of its portfolio transactions with brokerage firms which are affiliates of the investment adviser. Brokerage commissions are included in net realized gain (loss) and change in net unrealized appreciation (depreciation) in the Consolidated Statement of Operations. The commissions paid to these affiliated firms were $394 for the period.
Interfund Trades. The Fund may purchase from or sell securities to other Fidelity Funds under procedures adopted by the Board. The procedures have been designed to ensure these interfund trades are executed in accordance with Rule 17a-7 of the 1940 Act. Interfund trades are included within the respective purchases and sales amounts shown in the Purchases and Sales of Investments note.
6. Committed Line of Credit.
The Fund participates with other funds managed by the investment adviser or an affiliate in a $4.25 billion credit facility (the "line of credit") to be utilized for temporary or emergency purposes to fund shareholder redemptions or for other short-term liquidity purposes. The Fund has agreed to pay commitment fees on its pro-rata portion of the line of credit, which amounted to $544 and is reflected in Miscellaneous expenses on the Statement of Operations. During the period, the Fund did not borrow on this line of credit.
7. Security Lending.
The Fund lends portfolio securities through a lending agent from time to time in order to earn additional income. For equity securities, a lending agent is used and may loan securities to certain qualified borrowers, including Fidelity Capital Markets (FCM), a broker-dealer affiliated with the Fund. On the settlement date of the loan, the Fund receives collateral (in the form of U.S. Treasury obligations, letters of credit and/or cash) against the loaned securities and maintains collateral in an amount not less than 100% of the market value of the loaned securities during the period of the loan. The market value of the loaned securities is determined at the close of business of the Fund and any additional required collateral is delivered to the Fund on the next business day. The Fund or borrower may terminate the loan at any time, and if the borrower defaults on its obligation to return the securities loaned because of insolvency or other reasons, the Fund may apply collateral received from the borrower against the obligation. The Fund may experience delays and costs in recovering the securities loaned. Any cash collateral received is invested in the Fidelity Securities Lending Cash Central Fund. The value of loaned securities and cash collateral at period end are disclosed on the Fund's Statement of Assets and Liabilities. Security lending income represents the income earned on investing cash collateral, less rebates paid to borrowers and any lending agent fees associated with the loan, plus any premium payments received for lending certain types of securities. Security lending income is presented in the Statement of Operations as a component of income from Fidelity Central Funds. Total security lending income during the period amounted to $21,692. During the period, there were no securities loaned to FCM.
8. Expense Reductions.
The investment adviser contractually agreed to reimburse each class to the extent annual operating expenses exceeded certain levels of average net assets as noted in the table below. This reimbursement will remain in place through December 31, 2018. Some expenses, for example interest expense, including commitment fees, are excluded from this reimbursement.
The following classes were in reimbursement during the period:
| | Expense
Limitations | Reimbursement |
| Class C | 2.20% | $268 |
Commissions paid to certain brokers with whom the investment adviser, or its affiliates, places trades on behalf of the Fund include an amount in addition to trade execution, which may be rebated back to the Fund to offset certain expenses. This amount totaled $22,831 for the period.
In addition, during the period the investment adviser reimbursed and/or waived a portion of fund-level operating expenses in the amount of $1,364.
9. Distributions to Shareholders.
Distributions to shareholders of each class were as follows:
| | Six months ended
April 30, 2017 | Year ended October 31, 2016 |
| From net investment income | | |
| Class A | $92,173 | $72,361 |
| Class M | 119,902 | 77,358 |
| Class C | 8,223 | – |
| Total International Equity | 3,979,536 | 3,691,251 |
| Class I | 27,476 | 28,369 |
| Total | $4,227,310 | $3,869,339 |
10. Share Transactions.
Share transactions for each class were as follows and may contain automatic conversions between classes or exchanges between affiliated funds:
| | Shares | Shares | Dollars | Dollars |
| | Six months ended April 30, 2017(a) | Year ended October 31, 2016 | Six months ended April 30, 2017(a) | Year ended October 31, 2016 |
| Class A | | | | |
| Shares sold | 71,231 | 221,277 | $558,901 | $1,661,593 |
| Reinvestment of distributions | 12,257 | 9,322 | 91,682 | 71,782 |
| Shares redeemed | (183,857) | (289,523) | (1,436,713) | (2,176,317) |
| Net increase (decrease) | (100,369) | (58,924) | $(786,130) | $(442,942) |
| Class M | | | | |
| Shares sold | 183,236 | 459,219 | $1,397,603 | $3,481,274 |
| Reinvestment of distributions | 15,944 | 9,988 | 119,902 | 77,308 |
| Shares redeemed | (246,794) | (451,150) | (1,918,439) | (3,381,486) |
| Net increase (decrease) | (47,614) | 18,057 | $(400,934) | $177,096 |
| Class B | | | | |
| Shares sold | – | 1,078 | $– | $7,665 |
| Shares redeemed | – | (16,441) | – | (122,211) |
| Net increase (decrease) | – | (15,363) | $– | $(114,546) |
| Class C | | | | |
| Shares sold | 47,309 | 91,061 | $367,562 | $684,626 |
| Reinvestment of distributions | 1,070 | – | 8,046 | – |
| Shares redeemed | (52,737) | (162,991) | (412,214) | (1,228,823) |
| Net increase (decrease) | (4,358) | (71,930) | $(36,606) | $(544,197) |
| Total International Equity | | | | |
| Shares sold | 5,074,241 | 4,801,342 | $38,688,159 | $36,478,674 |
| Reinvestment of distributions | 523,250 | 471,692 | 3,913,907 | 3,632,026 |
| Shares redeemed | (3,687,104) | (8,073,720) | (28,747,034) | (60,183,392) |
| Net increase (decrease) | 1,910,387 | (2,800,686) | $13,855,032 | $(20,072,692) |
| Class I | | | | |
| Shares sold | 271,947 | 155,879 | $2,158,212 | $1,165,295 |
| Reinvestment of distributions | 3,621 | 3,671 | 27,016 | 28,160 |
| Shares redeemed | (84,375) | (212,465) | (652,197) | (1,617,545) |
| Net increase (decrease) | 191,193 | (52,915) | $1,533,031 | $(424,090) |
| Class Z | | | | |
| Shares sold | 12,937 | – | $100,000 | $– |
| Net increase (decrease) | 12,937 | – | $100,000 | $– |
(a) Share transactions for class Z are for the period February 1, 2017 (commencement of sale of shares) to April 30, 2017.
11. Other.
The Fund's organizational documents provide former and current trustees and officers with a limited indemnification against liabilities arising in connection with the performance of their duties to the Fund. In the normal course of business, the Fund may also enter into contracts that provide general indemnifications. The Fund's maximum exposure under these arrangements is unknown as this would be dependent on future claims that may be made against the Fund. The risk of material loss from such claims is considered remote.
At the end of the period, a shareholder of record owned approximately 71% of the total outstanding shares of the Fund.
Effective after the close of business on April 30, 2017, 30,358,599 shares of the Fund held by an affiliated entity were redeemed in-kind for investments and cash with a value of $259,566,026. The Fund recognized a net realized gain of $51,686,663 for book purposes and no gain or loss for federal income tax purposes.
Shareholder Expense Example
As a shareholder of the Fund, you incur two types of costs: (1) transaction costs, including sales charges (loads) on purchase payments or redemption proceeds, redemption fees and (2) ongoing costs, including management fees, distribution and/or service (12b-1) fees and other Fund expenses. This Example is intended to help you understand your ongoing costs (in dollars) of investing in the Fund and to compare these costs with the ongoing costs of investing in other mutual funds.
The actual expense Example is based on an investment of $1,000 invested at the beginning of the period and held for the entire period (November 1, 2016 to April 30, 2017) for Class A, Class M, Class C, Total International Equity and Class I and for the period (February 1, 2017 to April 30, 2017) for Class Z. The hypothetical expense is based on an investment of $1,000 invested for the one-half year period (November 1, 2016 to April 30, 2017).
Actual Expenses
The first line of the accompanying table for each class of the Fund provides information about actual account values and actual expenses. You may use the information in this line, together with the amount you invested, to estimate the expenses that you paid over the period. Simply divide your account value by $1,000.00 (for example, an $8,600 account value divided by $1,000.00 = 8.6), then multiply the result by the number in the first line for a class of the Fund under the heading entitled "Expenses Paid During Period" to estimate the expenses you paid on your account during this period. A small balance maintenance fee of $12.00 that is charged once a year may apply for certain accounts with a value of less than $2,000. This fee is not included in the table below. If it was, the estimate of expenses you paid during the period would be higher, and your ending account value lower, by this amount. In addition, the Fund, as a shareholder in the underlying Fidelity Central Funds, will indirectly bear its pro-rata share of the fees and expenses incurred by the underlying Fidelity Central Funds. These fees and expenses are not included in the Fund's annualized expense ratio used to calculate the expense estimate in the table below.
Hypothetical Example for Comparison Purposes
The second line of the accompanying table for each class of the Fund provides information about hypothetical account values and hypothetical expenses based on a Class' actual expense ratio and an assumed rate of return of 5% per year before expenses, which is not the Class' actual return. The hypothetical account values and expenses may not be used to estimate the actual ending account balance or expenses you paid for the period. You may use this information to compare the ongoing costs of investing in the Fund and other funds. To do so, compare this 5% hypothetical example with the 5% hypothetical examples that appear in the shareholder reports of the other funds. A small balance maintenance fee of $12.00 that is charged once a year may apply for certain accounts with a value of less than $2,000. This fee is not included in the table below. If it was, the estimate of expenses you paid during the period would be higher, and your ending account value lower, by this amount. In addition, the Fund, as a shareholder in the underlying Fidelity Central Funds, will indirectly bear its pro-rata share of the fees and expenses incurred by the underlying Fidelity Central Funds. These fees and expenses are not included in the Fund's annualized expense ratio used to calculate the expense estimate in the table below.
Please note that the expenses shown in the table are meant to highlight your ongoing costs only and do not reflect any transaction costs. Therefore, the second line of the table is useful in comparing ongoing costs only, and will not help you determine the relative total costs of owning different funds. In addition, if these transactional costs were included, your costs would have been higher.
| | Annualized Expense Ratio-A | Beginning
Account Value
| Ending
Account Value
April 30, 2017 | Expenses Paid
During Period
|
| Class A | 1.42% | | | |
| Actual | | $1,000.00 | $1,104.70 | $7.41-B |
| Hypothetical-C | | $1,000.00 | $1,017.75 | $7.10-D |
| Class M | 1.64% | | | |
| Actual | | $1,000.00 | $1,101.80 | $8.55-B |
| Hypothetical-C | | $1,000.00 | $1,016.66 | $8.20-D |
| Class C | 2.20% | | | |
| Actual | | $1,000.00 | $1,098.70 | $11.45-B |
| Hypothetical-C | | $1,000.00 | $1,013.88 | $10.99-D |
| Total International Equity | 1.02% | | | |
| Actual | | $1,000.00 | $1,105.50 | $5.32-B |
| Hypothetical-C | | $1,000.00 | $1,019.74 | $5.11-D |
| Class I | 1.10% | | | |
| Actual | | $1,000.00 | $1,105.90 | $5.74-B |
| Hypothetical-C | | $1,000.00 | $1,019.34 | $5.51-D |
| Class Z | .95% | | | |
| Actual | | $1,000.00 | $1,082.80 | $2.36-B |
| Hypothetical-C | | $1,000.00 | $1,020.08 | $4.76-D |
A Annualized expense ratio reflects expenses net of applicable fee waivers.
B Actual Expenses are equal to each Class' annualized expense ratio; multiplied by the average account value over the period, multiplied by 181/365 (to reflect the one-half year period) for Class A, Class M, Class C, Total International Equity and Class I and multiplied by 89/365 (to reflect the period February 01, 2017 to April 30, 2017) for class Z.
C 5% return per year before expenses
D Hypothetical expenses are equal to each Class' annualized expense ratio, multiplied by the average account value over the period, multiplied by 181/365 (to reflect the one-half year period).
Corporate Headquarters
245 Summer St.
Boston, MA 02210
www.fidelity.com
TIE-SANN-0617
1.912361.107
Fidelity Advisor® Global Commodity Stock Fund -
Class A, Class M (formerly Class T), Class C and Class I
Semi-Annual Report April 30, 2017 Class A, Class M, Class C and Class I are classes of Fidelity® Global Commodity Stock Fund |
|
Contents
To view a fund's proxy voting guidelines and proxy voting record for the 12-month period ended June 30, visit http://www.fidelity.com/proxyvotingresults or visit the Securities and Exchange Commission's (SEC) web site at http://www.sec.gov.
You may also call 1-877-208-0098 to request a free copy of the proxy voting guidelines.
Standard & Poor's, S&P and S&P 500 are registered service marks of The McGraw-Hill Companies, Inc. and have been licensed for use by Fidelity Distributors Corporation.
Other third-party marks appearing herein are the property of their respective owners.
All other marks appearing herein are registered or unregistered trademarks or service marks of FMR LLC or an affiliated company. © 2017 FMR LLC. All rights reserved.
This report and the financial statements contained herein are submitted for the general information of the shareholders of the Fund. This report is not authorized for distribution to prospective investors in the Fund unless preceded or accompanied by an effective prospectus.
A fund files its complete schedule of portfolio holdings with the SEC for the first and third quarters of each fiscal year on Form N-Q. Forms N-Q are available on the SEC’s web site at http://www.sec.gov. A fund's Forms N-Q may be reviewed and copied at the SEC’s Public Reference Room in Washington, DC. Information regarding the operation of the SEC's Public Reference Room may be obtained by calling 1-800-SEC-0330.
For a complete list of a fund's portfolio holdings, view the most recent holdings listing, semiannual report, or annual report on Fidelity's web site at http://www.fidelity.com, http://www.institutional.fidelity.com, or http://www.401k.com, as applicable.
NOT FDIC INSURED •MAY LOSE VALUE •NO BANK GUARANTEE
Neither the Fund nor Fidelity Distributors Corporation is a bank.
Investment Summary (Unaudited)
Top Ten Stocks as of April 30, 2017
| | % of fund's net assets | % of fund's net assets 6 months ago |
| Monsanto Co. | 6.4 | 5.7 |
| BHP Billiton PLC | 4.4 | 4.2 |
| Chevron Corp. | 4.2 | 4.0 |
| Rio Tinto PLC | 4.1 | 3.5 |
| Archer Daniels Midland Co. | 3.5 | 3.4 |
| Glencore Xstrata PLC | 3.4 | 2.4 |
| Potash Corp. of Saskatchewan, Inc. | 2.6 | 2.3 |
| Suncor Energy, Inc. | 2.2 | 2.4 |
| Anadarko Petroleum Corp. | 2.2 | 2.3 |
| Total SA | 2.2 | 2.2 |
| | 35.2 | |
Top Sectors (% of fund's net assets)
| As of April 30, 2017 |
| | Energy | 34.5% |
| | Metals | 31.3% |
| | Agriculture | 28.7% |
| | Other | 3.9% |
| | Short-Term Investments and Net Other Assets | 1.6% |
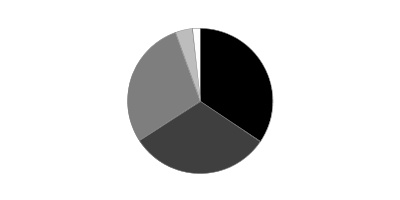
| As of October 31, 2016 |
| | Agriculture | 32.2% |
| | Energy | 30.3% |
| | Metals | 30.2% |
| | Other | 6.3% |
| | Short-Term Investments and Net Other Assets | 1.0% |
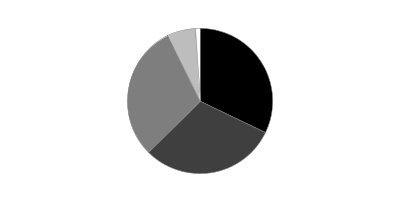
Investments April 30, 2017 (Unaudited)
Showing Percentage of Net Assets
| Common Stocks - 96.9% | | | |
| | | Shares | Value |
| Chemicals - 20.9% | | | |
| Commodity Chemicals - 0.6% | | | |
| LyondellBasell Industries NV Class A | | 27,100 | $2,296,996 |
| Westlake Chemical Corp. | | 3,300 | 205,425 |
| | | | 2,502,421 |
| Diversified Chemicals - 0.4% | | | |
| E.I. du Pont de Nemours & Co. | | 10,500 | 837,375 |
| The Chemours Co. LLC | | 21,300 | 858,177 |
| The Dow Chemical Co. | | 700 | 43,960 |
| | | | 1,739,512 |
| Fertilizers & Agricultural Chemicals - 19.6% | | | |
| Agrium, Inc. | | 97,000 | 9,104,165 |
| CF Industries Holdings, Inc. | | 257,160 | 6,876,458 |
| FMC Corp. | | 71,000 | 5,199,330 |
| Intrepid Potash, Inc. (a) | | 149,300 | 270,233 |
| K&S AG (b) | | 120,300 | 2,870,492 |
| Monsanto Co. | | 230,200 | 26,843,625 |
| Potash Corp. of Saskatchewan, Inc. | | 646,200 | 10,897,421 |
| Sociedad Quimica y Minera de Chile SA (PN-B) sponsored ADR | | 51,000 | 1,813,050 |
| Syngenta AG (a) | | 16,496 | 7,647,844 |
| The Mosaic Co. | | 205,561 | 5,535,758 |
| UPL Ltd. (a) | | 75,800 | 950,477 |
| Yara International ASA | | 98,000 | 3,643,326 |
| | | | 81,652,179 |
| Specialty Chemicals - 0.3% | | | |
| Novozymes A/S Series B | | 1,000 | 43,203 |
| Platform Specialty Products Corp. (a) | | 29,500 | 418,015 |
| W.R. Grace & Co. | | 12,400 | 864,528 |
| | | | 1,325,746 |
|
| TOTAL CHEMICALS | | | 87,219,858 |
|
| Construction & Engineering - 0.3% | | | |
| Construction & Engineering - 0.3% | | | |
| KBR, Inc. | | 85,200 | 1,197,060 |
| Construction Materials - 0.2% | | | |
| Construction Materials - 0.2% | | | |
| Eagle Materials, Inc. | | 9,100 | 873,327 |
| Containers & Packaging - 0.0% | | | |
| Paper Packaging - 0.0% | | | |
| WestRock Co. | | 359 | 19,228 |
| Energy Equipment & Services - 0.3% | | | |
| Oil & Gas Equipment & Services - 0.3% | | | |
| Baker Hughes, Inc. | | 18,200 | 1,080,534 |
| Food Products - 7.1% | | | |
| Agricultural Products - 6.9% | | | |
| Archer Daniels Midland Co. | | 316,400 | 14,475,300 |
| Bunge Ltd. | | 83,500 | 6,599,005 |
| Darling International, Inc. (a) | | 180,800 | 2,735,504 |
| First Resources Ltd. | | 1,505,600 | 2,020,542 |
| Ingredion, Inc. | | 6,900 | 854,358 |
| SLC Agricola SA | | 350,000 | 2,161,277 |
| | | | 28,845,986 |
| Packaged Foods & Meats - 0.2% | | | |
| Adecoagro SA (a) | | 72,600 | 805,134 |
|
| TOTAL FOOD PRODUCTS | | | 29,651,120 |
|
| Independent Power and Renewable Electricity Producers - 0.6% | | | |
| Independent Power Producers & Energy Traders - 0.6% | | | |
| Calpine Corp. (a) | | 111,600 | 1,138,320 |
| China Resources Power Holdings Co. Ltd. | | 478,000 | 861,566 |
| The AES Corp. | | 37,100 | 419,601 |
| | | | 2,419,487 |
| Machinery - 1.0% | | | |
| Agricultural & Farm Machinery - 0.6% | | | |
| AGCO Corp. | | 13,500 | 863,865 |
| Deere & Co. | | 1,900 | 212,059 |
| Jain Irrigation Systems Ltd. | | 824,359 | 1,436,121 |
| | | | 2,512,045 |
| Construction Machinery & Heavy Trucks - 0.4% | | | |
| Allison Transmission Holdings, Inc. | | 43,100 | 1,667,108 |
| Caterpillar, Inc. | | 600 | 61,356 |
| | | | 1,728,464 |
|
| TOTAL MACHINERY | | | 4,240,509 |
|
| Metals & Mining - 30.3% | | | |
| Copper - 2.2% | | | |
| Antofagasta PLC | | 4,100 | 44,500 |
| First Quantum Minerals Ltd. | | 483,324 | 4,606,458 |
| Freeport-McMoRan, Inc. (a) | | 343,800 | 4,383,450 |
| | | | 9,034,408 |
| Diversified Metals & Mining - 15.8% | | | |
| Anglo American PLC (United Kingdom) (a) | | 329,951 | 4,728,656 |
| Arizona Mining, Inc. (a) | | 620,900 | 859,676 |
| BHP Billiton PLC | | 1,188,404 | 18,117,466 |
| Boliden AB (b) | | 27,900 | 797,566 |
| Glencore Xstrata PLC | | 3,563,919 | 14,016,447 |
| Grupo Mexico SA de CV Series B | | 272,611 | 801,820 |
| Ivanhoe Mines Ltd. (a) | | 395,500 | 1,387,821 |
| Korea Zinc Co. Ltd. | | 2,792 | 1,044,300 |
| MMC Norilsk Nickel PJSC sponsored ADR | | 51,300 | 789,251 |
| Rio Tinto PLC | | 437,387 | 17,255,018 |
| South32 Ltd. | | 655,278 | 1,357,930 |
| Sumitomo Metal Mining Co. Ltd. | | 103,000 | 1,396,587 |
| Teck Resources Ltd. Class B (sub. vtg.) | | 122,200 | 2,535,221 |
| Turquoise Hill Resources Ltd. (a) | | 271,300 | 739,340 |
| | | | 65,827,099 |
| Gold - 6.7% | | | |
| Acacia Mining PLC | | 40,000 | 204,952 |
| Agnico Eagle Mines Ltd. (Canada) | | 45,800 | 2,189,260 |
| AngloGold Ashanti Ltd. sponsored ADR | | 88,000 | 1,005,840 |
| B2Gold Corp. (a) | | 691,280 | 1,736,999 |
| Barrick Gold Corp. | | 250,400 | 4,186,021 |
| Compania de Minas Buenaventura SA sponsored ADR | | 54,200 | 650,942 |
| Continental Gold, Inc. (a) | | 375,900 | 848,154 |
| Eldorado Gold Corp. | | 178,200 | 651,418 |
| Franco-Nevada Corp. | | 20,100 | 1,367,044 |
| Goldcorp, Inc. | | 42,510 | 592,315 |
| Newcrest Mining Ltd. | | 120,542 | 1,909,941 |
| Newmont Mining Corp. | | 147,100 | 4,973,451 |
| Premier Gold Mines Ltd. (a) | | 1,433,200 | 2,897,793 |
| Randgold Resources Ltd. sponsored ADR | | 22,900 | 2,014,971 |
| SEMAFO, Inc. (a) | | 362,500 | 833,852 |
| Tahoe Resources, Inc. | | 121,000 | 980,374 |
| Torex Gold Resources, Inc. (a) | | 50,070 | 848,041 |
| | | | 27,891,368 |
| Precious Metals & Minerals - 0.4% | | | |
| Fresnillo PLC | | 42,800 | 804,910 |
| Gold Standard Ventures Corp. (a) | | 477,700 | 808,386 |
| Impala Platinum Holdings Ltd. (a) | | 67,400 | 216,273 |
| | | | 1,829,569 |
| Silver - 0.5% | | | |
| Silver Wheaton Corp. | | 110,200 | 2,199,075 |
| Steel - 4.7% | | | |
| ArcelorMittal SA Class A unit (a)(b) | | 504,610 | 3,935,958 |
| Fortescue Metals Group Ltd. | | 220,700 | 877,531 |
| Hyundai Steel Co. | | 24,552 | 1,184,867 |
| JFE Holdings, Inc. | | 117,500 | 2,003,218 |
| Nippon Steel & Sumitomo Metal Corp. | | 68,400 | 1,540,419 |
| Nucor Corp. | | 75,192 | 4,611,525 |
| POSCO | | 17,262 | 4,076,341 |
| Thyssenkrupp AG | | 67,100 | 1,597,426 |
| | | | 19,827,285 |
|
| TOTAL METALS & MINING | | | 126,608,804 |
|
| Oil, Gas & Consumable Fuels - 33.9% | | | |
| Coal & Consumable Fuels - 0.2% | | | |
| Arch Coal, Inc. (a)(b) | | 12,200 | 856,928 |
| Integrated Oil & Gas - 15.4% | | | |
| BP PLC | | 793,100 | 4,540,193 |
| Cenovus Energy, Inc. | | 300,300 | 2,994,090 |
| Chevron Corp. | | 162,400 | 17,328,080 |
| China Petroleum & Chemical Corp. (H Shares) | | 1,932,000 | 1,568,888 |
| Exxon Mobil Corp. | | 77,700 | 6,344,205 |
| Imperial Oil Ltd. | | 37,100 | 1,079,258 |
| Lukoil PJSC sponsored ADR | | 44,700 | 2,220,026 |
| Occidental Petroleum Corp. | | 41,400 | 2,547,756 |
| Royal Dutch Shell PLC: | | | |
| Class A (United Kingdom) | | 136,500 | 3,544,694 |
| Class B (United Kingdom) | | 44,393 | 1,181,164 |
| Statoil ASA (b) | | 135,400 | 2,229,888 |
| Suncor Energy, Inc. | | 297,832 | 9,333,909 |
| Total SA | | 180,400 | 9,260,516 |
| | | | 64,172,667 |
| Oil & Gas Exploration & Production - 16.7% | | | |
| Anadarko Petroleum Corp. | | 163,500 | 9,322,770 |
| Apache Corp. | | 59,200 | 2,879,488 |
| Cabot Oil & Gas Corp. | | 86,200 | 2,003,288 |
| Callon Petroleum Co. (a) | | 70,900 | 839,456 |
| Canadian Natural Resources Ltd. | | 95,000 | 3,025,970 |
| Cimarex Energy Co. | | 7,100 | 828,428 |
| CNOOC Ltd. sponsored ADR | | 18,400 | 2,137,160 |
| Concho Resources, Inc. (a) | | 6,700 | 848,622 |
| ConocoPhillips Co. | | 171,100 | 8,197,401 |
| Continental Resources, Inc. (a) | | 41,400 | 1,755,774 |
| Crescent Point Energy Corp. | | 20,400 | 201,900 |
| Devon Energy Corp. | | 56,800 | 2,243,032 |
| Diamondback Energy, Inc. (a) | | 19,200 | 1,916,928 |
| EOG Resources, Inc. | | 57,300 | 5,300,250 |
| EQT Corp. | | 53,801 | 3,127,990 |
| Hess Corp. | | 34,900 | 1,704,167 |
| INPEX Corp. | | 84,600 | 810,900 |
| Marathon Oil Corp. | | 163,000 | 2,423,810 |
| Murphy Oil Corp. | | 31,400 | 822,052 |
| Newfield Exploration Co. (a) | | 27,400 | 948,588 |
| Noble Energy, Inc. | | 123,300 | 3,986,289 |
| NOVATEK OAO GDR (Reg. S) | | 13,400 | 1,624,080 |
| Parsley Energy, Inc. Class A (a) | | 28,900 | 860,931 |
| PDC Energy, Inc. (a) | | 13,900 | 767,697 |
| Pioneer Natural Resources Co. | | 16,610 | 2,873,364 |
| PrairieSky Royalty Ltd. | | 83,798 | 1,826,300 |
| Range Resources Corp. | | 77,800 | 2,060,922 |
| Rice Energy, Inc. (a) | | 37,800 | 804,762 |
| RSP Permian, Inc. (a) | | 22,200 | 844,710 |
| Seven Generations Energy Ltd. (a) | | 25,800 | 456,823 |
| Southwestern Energy Co. (a) | | 151,500 | 1,137,765 |
| Woodside Petroleum Ltd. | | 59,111 | 1,424,361 |
| | | | 70,005,978 |
| Oil & Gas Refining & Marketing - 0.1% | | | |
| Reliance Industries Ltd. | | 20,400 | 442,714 |
| Oil & Gas Storage & Transport - 1.5% | | | |
| Boardwalk Pipeline Partners, LP | | 58,000 | 1,052,120 |
| Cheniere Energy Partners LP | | 6,600 | 209,550 |
| Cheniere Energy, Inc. (a) | | 4,600 | 208,610 |
| Golar LNG Ltd. | | 33,600 | 857,136 |
| Kinder Morgan, Inc. | | 41,600 | 858,208 |
| Plains All American Pipeline LP | | 28,500 | 833,625 |
| Scorpio Tankers, Inc. | | 282,700 | 1,243,880 |
| The Williams Companies, Inc. | | 36,100 | 1,105,743 |
| | | | 6,368,872 |
|
| TOTAL OIL, GAS & CONSUMABLE FUELS | | | 141,847,159 |
|
| Paper & Forest Products - 2.0% | | | |
| Forest Products - 0.4% | | | |
| Quintis Ltd. | | 1,732,347 | 1,556,618 |
| Paper Products - 1.6% | | | |
| Mondi PLC | | 79,700 | 2,065,581 |
| Sappi Ltd. | | 115,361 | 857,196 |
| Stora Enso Oyj (R Shares) (b) | | 65,500 | 779,133 |
| UPM-Kymmene Corp. | | 122,400 | 3,230,594 |
| | | | 6,932,504 |
|
| TOTAL PAPER & FOREST PRODUCTS | | | 8,489,122 |
|
| Semiconductors & Semiconductor Equipment - 0.3% | | | |
| Semiconductor Equipment - 0.3% | | | |
| SolarEdge Technologies, Inc. (a) | | 69,100 | 1,115,965 |
| TOTAL COMMON STOCKS | | | |
| (Cost $463,831,753) | | | 404,762,173 |
|
| Nonconvertible Preferred Stocks - 1.5% | | | |
| Metals & Mining - 1.0% | | | |
| Steel - 1.0% | | | |
| Gerdau SA: | | | |
| (PN) | | 52,000 | 160,552 |
| sponsored ADR | | 496,600 | 1,514,630 |
| Vale SA (PN-A) sponsored ADR | | 329,800 | 2,707,658 |
| | | | 4,382,840 |
| Oil, Gas & Consumable Fuels - 0.3% | | | |
| Integrated Oil & Gas - 0.3% | | | |
| Petroleo Brasileiro SA - Petrobras (PN) sponsored (non-vtg.) (a) | | 145,600 | 1,271,088 |
| Paper & Forest Products - 0.2% | | | |
| Paper Products - 0.2% | | | |
| Suzano Papel e Celulose SA | | 210,600 | 889,761 |
| TOTAL NONCONVERTIBLE PREFERRED STOCKS | | | |
| (Cost $8,573,677) | | | 6,543,689 |
|
| Money Market Funds - 4.1% | | | |
| Fidelity Cash Central Fund, 0.85% (c) | | 6,963,625 | 6,965,017 |
| Fidelity Securities Lending Cash Central Fund 0.86% (c)(d) | | 10,022,235 | 10,023,238 |
| TOTAL MONEY MARKET FUNDS | | | |
| (Cost $16,988,603) | | | 16,988,255 |
| TOTAL INVESTMENT PORTFOLIO - 102.5% | | | |
| (Cost $489,394,033) | | | 428,294,117 |
| NET OTHER ASSETS (LIABILITIES) - (2.5)% | | | (10,584,983) |
| NET ASSETS - 100% | | | $417,709,134 |
Legend
(a) Non-income producing
(b) Security or a portion of the security is on loan at period end.
(c) Affiliated fund that is generally available only to investment companies and other accounts managed by Fidelity Investments. The rate quoted is the annualized seven-day yield of the fund at period end. A complete unaudited listing of the fund's holdings as of its most recent quarter end is available upon request. In addition, each Fidelity Central Fund's financial statements are available on the SEC's website or upon request.
(d) Investment made with cash collateral received from securities on loan.
Affiliated Central Funds
Information regarding fiscal year to date income earned by the Fund from investments in Fidelity Central Funds is as follows:
| Fund | Income earned |
| Fidelity Cash Central Fund | $20,214 |
| Fidelity Securities Lending Cash Central Fund | 68,368 |
| Total | $88,582 |
Investment Valuation
The following is a summary of the inputs used, as of April 30, 2017, involving the Fund's assets and liabilities carried at fair value. The inputs or methodology used for valuing securities may not be an indication of the risk associated with investing in those securities. For more information on valuation inputs, and their aggregation into the levels used below, please refer to the Investment Valuation section in the accompanying Notes to Financial Statements.
| | Valuation Inputs at Reporting Date: |
| Description | Total | Level 1 | Level 2 | Level 3 |
| Investments in Securities: | | | | |
| Common Stocks | $404,762,173 | $341,413,802 | $63,348,371 | $-- |
| Nonconvertible Preferred Stocks | 6,543,689 | 6,543,689 | -- | -- |
| Money Market Funds | 16,988,255 | 16,988,255 | -- | -- |
| Total Investments in Securities: | $428,294,117 | $364,945,746 | $63,348,371 | $-- |
Other Information
Distribution of investments by country or territory of incorporation, as a percentage of Total Net Assets, is as follows (Unaudited):
| United States of America | 44.6% |
| Canada | 16.3% |
| United Kingdom | 12.7% |
| Bailiwick of Jersey | 3.9% |
| France | 2.2% |
| Brazil | 2.0% |
| Switzerland | 1.8% |
| Bermuda | 1.8% |
| Australia | 1.7% |
| Korea (South) | 1.6% |
| Norway | 1.4% |
| Japan | 1.3% |
| Luxembourg | 1.1% |
| Russia | 1.1% |
| Germany | 1.1% |
| Others (Individually Less Than 1%) | 5.4% |
| | 100.0% |
See accompanying notes which are an integral part of the financial statements.
Financial Statements
Statement of Assets and Liabilities
| | | April 30, 2017 (Unaudited) |
| Assets | | |
Investment in securities, at value (including securities loaned of $9,638,469) — See accompanying schedule:
Unaffiliated issuers (cost $472,405,430) | $411,305,862 | |
| Fidelity Central Funds (cost $16,988,603) | 16,988,255 | |
| Total Investments (cost $489,394,033) | | $428,294,117 |
| Foreign currency held at value (cost $264,429) | | 264,429 |
| Receivable for investments sold | | 3,523,654 |
| Receivable for fund shares sold | | 172,884 |
| Dividends receivable | | 706,809 |
| Distributions receivable from Fidelity Central Funds | | 16,144 |
| Prepaid expenses | | 222 |
| Other receivables | | 23,105 |
| Total assets | | 433,001,364 |
| Liabilities | | |
| Payable for investments purchased | $4,076,467 | |
| Payable for fund shares redeemed | 777,124 | |
| Accrued management fee | 247,093 | |
| Distribution and service plan fees payable | 21,581 | |
| Other affiliated payables | 112,107 | |
| Other payables and accrued expenses | 34,593 | |
| Collateral on securities loaned | 10,023,265 | |
| Total liabilities | | 15,292,230 |
| Net Assets | | $417,709,134 |
| Net Assets consist of: | | |
| Paid in capital | | $558,036,940 |
| Undistributed net investment income | | 1,552,637 |
| Accumulated undistributed net realized gain (loss) on investments and foreign currency transactions | | (80,762,992) |
| Net unrealized appreciation (depreciation) on investments and assets and liabilities in foreign currencies | | (61,117,451) |
| Net Assets | | $417,709,134 |
| Calculation of Maximum Offering Price | | |
| Class A: | | |
| Net Asset Value and redemption price per share ($30,816,014 ÷ 2,696,693 shares) | | $11.43 |
| Maximum offering price per share (100/94.25 of $11.43) | | $12.13 |
| Class M: | | |
| Net Asset Value and redemption price per share ($6,793,860 ÷ 594,854 shares) | | $11.42 |
| Maximum offering price per share (100/96.50 of $11.42) | | $11.83 |
| Class C: | | |
| Net Asset Value and offering price per share ($14,316,822 ÷ 1,264,687 shares)(a) | | $11.32 |
| Global Commodity Stock: | | |
| Net Asset Value, offering price and redemption price per share ($264,991,026 ÷ 23,148,159 shares) | | $11.45 |
| Class I: | | |
| Net Asset Value, offering price and redemption price per share ($100,791,412 ÷ 8,809,496 shares) | | $11.44 |
(a) Redemption price per share is equal to net asset value less any applicable contingent deferred sales charge.
See accompanying notes which are an integral part of the financial statements.
Statement of Operations
| | | Six months ended April 30, 2017 (Unaudited) |
| Investment Income | | |
| Dividends | | $4,564,919 |
| Income from Fidelity Central Funds | | 88,582 |
| Income before foreign taxes withheld | | 4,653,501 |
| Less foreign taxes withheld | | (235,395) |
| Total income | | 4,418,106 |
| Expenses | | |
| Management fee | $1,443,839 | |
| Transfer agent fees | 553,313 | |
| Distribution and service plan fees | 133,247 | |
| Accounting and security lending fees | 108,081 | |
| Custodian fees and expenses | 33,284 | |
| Independent trustees' fees and expenses | 816 | |
| Registration fees | 81,203 | |
| Audit | 28,347 | |
| Legal | 620 | |
| Miscellaneous | 1,433 | |
| Total expenses before reductions | 2,384,183 | |
| Expense reductions | (19,894) | 2,364,289 |
| Net investment income (loss) | | 2,053,817 |
| Realized and Unrealized Gain (Loss) | | |
| Net realized gain (loss) on: | | |
| Investment securities: | | |
| Unaffiliated issuers | 13,679,313 | |
| Fidelity Central Funds | (908) | |
| Foreign currency transactions | (60,004) | |
| Total net realized gain (loss) | | 13,618,401 |
Change in net unrealized appreciation (depreciation) on:
Investment securities | 12,340,635 | |
| Assets and liabilities in foreign currencies | 12,956 | |
| Total change in net unrealized appreciation (depreciation) | | 12,353,591 |
| Net gain (loss) | | 25,971,992 |
| Net increase (decrease) in net assets resulting from operations | | $28,025,809 |
See accompanying notes which are an integral part of the financial statements.
Statement of Changes in Net Assets
| | Six months ended April 30, 2017 (Unaudited) | Year ended October 31, 2016 |
| Increase (Decrease) in Net Assets | | |
| Operations | | |
| Net investment income (loss) | $2,053,817 | $3,732,641 |
| Net realized gain (loss) | 13,618,401 | (22,456,882) |
| Change in net unrealized appreciation (depreciation) | 12,353,591 | 48,478,395 |
| Net increase (decrease) in net assets resulting from operations | 28,025,809 | 29,754,154 |
| Distributions to shareholders from net investment income | (3,511,036) | (5,140,876) |
| Distributions to shareholders from net realized gain | (2,362,260) | (224,075) |
| Total distributions | (5,873,296) | (5,364,951) |
| Share transactions - net increase (decrease) | 43,020,634 | 97,100,151 |
| Redemption fees | 6,938 | 14,543 |
| Total increase (decrease) in net assets | 65,180,085 | 121,503,897 |
| Net Assets | | |
| Beginning of period | 352,529,049 | 231,025,152 |
| End of period | $417,709,134 | $352,529,049 |
| Other Information | | |
| Undistributed net investment income end of period | $1,552,637 | $3,009,856 |
See accompanying notes which are an integral part of the financial statements.
Financial Highlights — Fidelity Global Commodity Stock Fund Class A
| | Six months ended (Unaudited) April 30, | Years ended October 31, | | | | |
| | 2017 | 2016 | 2015 | 2014 | 2013 | 2012 |
| Selected Per–Share Data | | | | | | |
| Net asset value, beginning of period | $10.73 | $10.05 | $13.25 | $14.17 | $14.59 | $15.14 |
| Income from Investment Operations | | | | | | |
| Net investment income (loss)A | .05 | .11 | .22 | .15 | .16 | .11 |
| Net realized and unrealized gain (loss) | .80 | .79 | (3.25) | (.91) | (.45) | (.59) |
| Total from investment operations | .85 | .90 | (3.03) | (.76) | (.29) | (.48) |
| Distributions from net investment income | (.08) | (.21) | (.14) | (.15) | (.13) | (.05) |
| Distributions from net realized gain | (.07) | (.01) | (.03) | (.01) | – | (.01) |
| Total distributions | (.15) | (.22) | (.17) | (.16) | (.13) | (.07)B |
| Redemption fees added to paid in capitalA,C | – | – | – | – | – | – |
| Net asset value, end of period | $11.43 | $10.73 | $10.05 | $13.25 | $14.17 | $14.59 |
| Total ReturnD,E,F | 7.87% | 9.29% | (23.16)% | (5.41)% | (2.00)% | (3.19)% |
| Ratios to Average Net AssetsG,H | | | | | | |
| Expenses before reductions | 1.35%I | 1.38% | 1.34% | 1.35% | 1.36% | 1.34% |
| Expenses net of fee waivers, if any | 1.35%I | 1.38% | 1.34% | 1.35% | 1.35% | 1.34% |
| Expenses net of all reductions | 1.34%I | 1.37% | 1.34% | 1.35% | 1.34% | 1.33% |
| Net investment income (loss) | .79%I | 1.18% | 1.85% | 1.05% | 1.12% | .80% |
| Supplemental Data | | | | | | |
| Net assets, end of period (000 omitted) | $30,816 | $34,791 | $31,391 | $51,586 | $71,293 | $99,694 |
| Portfolio turnover rateJ | 85%I | 85% | 77% | 75% | 65% | 91% |
A Calculated based on average shares outstanding during the period.
B Total distributions of $.07 per share is comprised of distributions from net investment income of $.052 and distributions from net realized gain of $.014 per share.
C Amount represents less than $.005 per share.
D Total returns for periods of less than one year are not annualized.
E Total returns would have been lower if certain expenses had not been reduced during the applicable periods shown.
F Total returns do not include the effect of the sales charges.
G Fees and expenses of any underlying Fidelity Central Funds are not included in the Fund's expense ratio. The Fund indirectly bears its proportionate share of the expenses of any underlying Fidelity Central Funds.
H Expense ratios reflect operating expenses of the class. Expenses before reductions do not reflect amounts reimbursed by the investment adviser or reductions from brokerage service arrangements or reductions from other expense offset arrangements and do not represent the amount paid by the class during periods when reimbursements or reductions occur. Expenses net of fee waivers reflect expenses after reimbursement by the investment adviser but prior to reductions from brokerage service arrangements or other expense offset arrangements. Expenses net of all reductions represent the net expenses paid by the class.
I Annualized
J Amount does not include the portfolio activity of any underlying Fidelity Central Funds.
See accompanying notes which are an integral part of the financial statements.
Financial Highlights — Fidelity Global Commodity Stock Fund Class M
| | Six months ended (Unaudited) April 30, | Years ended October 31, | | | | |
| | 2017 | 2016 | 2015 | 2014 | 2013 | 2012 |
| Selected Per–Share Data | | | | | | |
| Net asset value, beginning of period | $10.72 | $10.02 | $13.21 | $14.13 | $14.54 | $15.08 |
| Income from Investment Operations | | | | | | |
| Net investment income (loss)A | .03 | .09 | .19 | .11 | .12 | .08 |
| Net realized and unrealized gain (loss) | .79 | .79 | (3.25) | (.90) | (.45) | (.60) |
| Total from investment operations | .82 | .88 | (3.06) | (.79) | (.33) | (.52) |
| Distributions from net investment income | (.05) | (.17) | (.10) | (.11) | (.08) | (.01) |
| Distributions from net realized gain | (.07) | (.01) | (.03) | (.01) | – | (.01) |
| Total distributions | (.12) | (.18) | (.13) | (.13)B | (.08) | (.02) |
| Redemption fees added to paid in capitalA,C | – | – | – | – | – | – |
| Net asset value, end of period | $11.42 | $10.72 | $10.02 | $13.21 | $14.13 | $14.54 |
| Total ReturnD,E,F | 7.63% | 9.08% | (23.40)% | (5.65)% | (2.26)% | (3.43)% |
| Ratios to Average Net AssetsG,H | | | | | | |
| Expenses before reductions | 1.64%I | 1.65% | 1.63% | 1.62% | 1.62% | 1.61% |
| Expenses net of fee waivers, if any | 1.64%I | 1.65% | 1.63% | 1.62% | 1.61% | 1.61% |
| Expenses net of all reductions | 1.63%I | 1.64% | 1.62% | 1.62% | 1.60% | 1.60% |
| Net investment income (loss) | .50%I | .90% | 1.57% | .78% | .86% | .53% |
| Supplemental Data | | | | | | |
| Net assets, end of period (000 omitted) | $6,794 | $6,068 | $6,335 | $9,867 | $12,551 | $16,692 |
| Portfolio turnover rateJ | 85%I | 85% | 77% | 75% | 65% | 91% |
A Calculated based on average shares outstanding during the period.
B Total distributions of $.13 per share is comprised of distributions from net investment income of $.113 and distributions from net realized gain of $.013 per share.
C Amount represents less than $.005 per share.
D Total returns for periods of less than one year are not annualized.
E Total returns would have been lower if certain expenses had not been reduced during the applicable periods shown.
F Total returns do not include the effect of the sales charges.
G Fees and expenses of any underlying Fidelity Central Funds are not included in the Fund's expense ratio. The Fund indirectly bears its proportionate share of the expenses of any underlying Fidelity Central Funds.
H Expense ratios reflect operating expenses of the class. Expenses before reductions do not reflect amounts reimbursed by the investment adviser or reductions from brokerage service arrangements or reductions from other expense offset arrangements and do not represent the amount paid by the class during periods when reimbursements or reductions occur. Expenses net of fee waivers reflect expenses after reimbursement by the investment adviser but prior to reductions from brokerage service arrangements or other expense offset arrangements. Expenses net of all reductions represent the net expenses paid by the class.
I Annualized
J Amount does not include the portfolio activity of any underlying Fidelity Central Funds.
See accompanying notes which are an integral part of the financial statements.
Financial Highlights — Fidelity Global Commodity Stock Fund Class C
| | Six months ended (Unaudited) April 30, | Years ended October 31, | | | | |
| | 2017 | 2016 | 2015 | 2014 | 2013 | 2012 |
| Selected Per–Share Data | | | | | | |
| Net asset value, beginning of period | $10.61 | $9.92 | $13.06 | $13.96 | $14.37 | $14.95 |
| Income from Investment Operations | | | | | | |
| Net investment income (loss)A | –B | .04 | .13 | .04 | .05 | .01 |
| Net realized and unrealized gain (loss) | .79 | .78 | (3.22) | (.89) | (.44) | (.59) |
| Total from investment operations | .79 | .82 | (3.09) | (.85) | (.39) | (.58) |
| Distributions from net investment income | (.01) | (.12) | (.03) | (.03) | (.02) | – |
| Distributions from net realized gain | (.07) | (.01) | (.03) | (.01) | – | – |
| Total distributions | (.08) | (.13) | (.05)C | (.05)D | (.02) | – |
| Redemption fees added to paid in capitalA,B | – | – | – | – | – | – |
| Net asset value, end of period | $11.32 | $10.61 | $9.92 | $13.06 | $13.96 | $14.37 |
| Total ReturnE,F,G | 7.44% | 8.46% | (23.74)% | (6.13)% | (2.75)% | (3.88)% |
| Ratios to Average Net AssetsH,I | | | | | | |
| Expenses before reductions | 2.10%J | 2.13% | 2.12% | 2.11% | 2.11% | 2.10% |
| Expenses net of fee waivers, if any | 2.10%J | 2.13% | 2.12% | 2.11% | 2.11% | 2.10% |
| Expenses net of all reductions | 2.09%J | 2.12% | 2.11% | 2.11% | 2.10% | 2.09% |
| Net investment income (loss) | .05%J | .43% | 1.08% | .29% | .36% | .03% |
| Supplemental Data | | | | | | |
| Net assets, end of period (000 omitted) | $14,317 | $12,620 | $11,274 | $17,659 | $23,830 | $31,865 |
| Portfolio turnover rateK | 85%J | 85% | 77% | 75% | 65% | 91% |
A Calculated based on average shares outstanding during the period.
B Amount represents less than $.005 per share.
C Total distributions of $.05 per share is comprised of distributions from net investment income of $.025 and distributions from net realized gain of $.026 per share.
D Total distributions of $.05 per share is comprised of distributions from net investment income of $.033 and distributions from net realized gain of $.013 per share.
E Total returns for periods of less than one year are not annualized.
F Total returns would have been lower if certain expenses had not been reduced during the applicable periods shown.
G Total returns do not include the effect of the contingent deferred sales charge.
H Fees and expenses of any underlying Fidelity Central Funds are not included in the Fund's expense ratio. The Fund indirectly bears its proportionate share of the expenses of any underlying Fidelity Central Funds.
I Expense ratios reflect operating expenses of the class. Expenses before reductions do not reflect amounts reimbursed by the investment adviser or reductions from brokerage service arrangements or reductions from other expense offset arrangements and do not represent the amount paid by the class during periods when reimbursements or reductions occur. Expenses net of fee waivers reflect expenses after reimbursement by the investment adviser but prior to reductions from brokerage service arrangements or other expense offset arrangements. Expenses net of all reductions represent the net expenses paid by the class.
J Annualized
K Amount does not include the portfolio activity of any underlying Fidelity Central Funds.
See accompanying notes which are an integral part of the financial statements.
Financial Highlights — Fidelity Global Commodity Stock Fund
| | Six months ended (Unaudited) April 30, | Years ended October 31, | | | | |
| | 2017 | 2016 | 2015 | 2014 | 2013 | 2012 |
| Selected Per–Share Data | | | | | | |
| Net asset value, beginning of period | $10.77 | $10.09 | $13.31 | $14.24 | $14.66 | $15.21 |
| Income from Investment Operations | | | | | | |
| Net investment income (loss)A | .06 | .14 | .25 | .19 | .19 | .15 |
| Net realized and unrealized gain (loss) | .79 | .79 | (3.27) | (.92) | (.45) | (.60) |
| Total from investment operations | .85 | .93 | (3.02) | (.73) | (.26) | (.45) |
| Distributions from net investment income | (.11) | (.24) | (.18) | (.19) | (.16) | (.08) |
| Distributions from net realized gain | (.07) | (.01) | (.03) | (.01) | – | (.01) |
| Total distributions | (.17)B | (.25) | (.20)C | (.20) | (.16) | (.10)D |
| Redemption fees added to paid in capitalA,E | – | – | – | – | – | – |
| Net asset value, end of period | $11.45 | $10.77 | $10.09 | $13.31 | $14.24 | $14.66 |
| Total ReturnF,G | 7.90% | 9.62% | (22.97)% | (5.16)% | (1.75)% | (2.96)% |
| Ratios to Average Net AssetsH,I | | | | | | |
| Expenses before reductions | 1.12%J | 1.13% | 1.12% | 1.11% | 1.11% | 1.10% |
| Expenses net of fee waivers, if any | 1.12%J | 1.13% | 1.12% | 1.11% | 1.11% | 1.10% |
| Expenses net of all reductions | 1.11%J | 1.12% | 1.11% | 1.11% | 1.09% | 1.09% |
| Net investment income (loss) | 1.02%J | 1.43% | 2.08% | 1.29% | 1.37% | 1.04% |
| Supplemental Data | | | | | | |
| Net assets, end of period (000 omitted) | $264,991 | $228,982 | $156,320 | $223,084 | $273,476 | $387,242 |
| Portfolio turnover rateK | 85%J | 85% | 77% | 75% | 65% | 91% |
A Calculated based on average shares outstanding during the period.
B Total distributions of $.17 per share is comprised of distributions from net investment income of $.105 and distributions from net realized gain of $.068 per share.
C Total distributions of $.20 per share is comprised of distributions from net investment income of $.178 and distributions from net realized gain of $.026 per share.
D Total distributions of $.10 per share is comprised of distributions from net investment income of $.084 and distributions from net realized gain of $.014 per share.
E Amount represents less than $.005 per share.
F Total returns for periods of less than one year are not annualized.
G Total returns would have been lower if certain expenses had not been reduced during the applicable periods shown.
H Fees and expenses of any underlying Fidelity Central Funds are not included in the Fund's expense ratio. The Fund indirectly bears its proportionate share of the expenses of any underlying Fidelity Central Funds.
I Expense ratios reflect operating expenses of the class. Expenses before reductions do not reflect amounts reimbursed by the investment adviser or reductions from brokerage service arrangements or reductions from other expense offset arrangements and do not represent the amount paid by the class during periods when reimbursements or reductions occur. Expenses net of fee waivers reflect expenses after reimbursement by the investment adviser but prior to reductions from brokerage service arrangements or other expense offset arrangements. Expenses net of all reductions represent the net expenses paid by the class.
J Annualized
K Amount does not include the portfolio activity of any underlying Fidelity Central Funds.
See accompanying notes which are an integral part of the financial statements.
Financial Highlights — Fidelity Global Commodity Stock Fund Class I
| | Six months ended (Unaudited) April 30, | Years ended October 31, | | | | |
| | 2017 | 2016 | 2015 | 2014 | 2013 | 2012 |
| Selected Per–Share Data | | | | | | |
| Net asset value, beginning of period | $10.76 | $10.09 | $13.31 | $14.24 | $14.67 | $15.22 |
| Income from Investment Operations | | | | | | |
| Net investment income (loss)A | .07 | .16 | .25 | .19 | .20 | .16 |
| Net realized and unrealized gain (loss) | .80 | .77 | (3.26) | (.92) | (.45) | (.60) |
| Total from investment operations | .87 | .93 | (3.01) | (.73) | (.25) | (.44) |
| Distributions from net investment income | (.12) | (.25) | (.19) | (.19) | (.18) | (.09) |
| Distributions from net realized gain | (.07) | (.01) | (.03) | (.01) | – | (.01) |
| Total distributions | (.19) | (.26) | (.21)B | (.20) | (.18) | (.11)C |
| Redemption fees added to paid in capitalA,D | – | – | – | – | – | – |
| Net asset value, end of period | $11.44 | $10.76 | $10.09 | $13.31 | $14.24 | $14.67 |
| Total ReturnE,F | 8.03% | 9.63% | (22.93)% | (5.16)% | (1.71)% | (2.90)% |
| Ratios to Average Net AssetsG,H | | | | | | |
| Expenses before reductions | .98%I | 1.01% | 1.09% | 1.06% | 1.04% | 1.04% |
| Expenses net of fee waivers, if any | .98%I | 1.01% | 1.08% | 1.06% | 1.04% | 1.04% |
| Expenses net of all reductions | .97%I | 1.00% | 1.08% | 1.06% | 1.03% | 1.03% |
| Net investment income (loss) | 1.16%I | 1.55% | 2.11% | 1.34% | 1.43% | 1.10% |
| Supplemental Data | | | | | | |
| Net assets, end of period (000 omitted) | $100,791 | $70,068 | $24,841 | $23,840 | $31,613 | $50,540 |
| Portfolio turnover rateJ | 85%I | 85% | 77% | 75% | 65% | 91% |
A Calculated based on average shares outstanding during the period.
B Total distributions of $.21 per share is comprised of distributions from net investment income of $.186 and distributions from net realized gain of $.026 per share.
C Total distributions of $.11 per share is comprised of distributions from net investment income of $.093 and distributions from net realized gain of $.014 per share.
D Amount represents less than $.005 per share.
E Total returns for periods of less than one year are not annualized.
F Total returns would have been lower if certain expenses had not been reduced during the applicable periods shown.
G Fees and expenses of any underlying Fidelity Central Funds are not included in the Fund's expense ratio. The Fund indirectly bears its proportionate share of the expenses of any underlying Fidelity Central Funds.
H Expense ratios reflect operating expenses of the class. Expenses before reductions do not reflect amounts reimbursed by the investment adviser or reductions from brokerage service arrangements or reductions from other expense offset arrangements and do not represent the amount paid by the class during periods when reimbursements or reductions occur. Expenses net of fee waivers reflect expenses after reimbursement by the investment adviser but prior to reductions from brokerage service arrangements or other expense offset arrangements. Expenses net of all reductions represent the net expenses paid by the class.
I Annualized
J Amount does not include the portfolio activity of any underlying Fidelity Central Funds.
See accompanying notes which are an integral part of the financial statements.
Notes to Financial Statements (Unaudited)
For the period ended April 30, 2017
1. Organization.
Fidelity Global Commodity Stock Fund (the Fund) is a non-diversified fund of Fidelity Investment Trust (the Trust) and is authorized to issue an unlimited number of shares. The Trust is registered under the Investment Company Act of 1940, as amended (the 1940 Act), as an open-end management investment company organized as a Massachusetts business trust. The Fund offers Class A, Class M (formerly Class T), Class C, Global Commodity Stock and Class I shares, each of which has equal rights as to assets and voting privileges. Each class has exclusive voting rights with respect to matters that affect that class.
After the close of business on June 24, 2016, all outstanding Class B shares were converted to Class A shares. All prior fiscal period dollar and share amounts for Class B presented in the Notes to Financial Statements are for the period November 1, 2015 through June 24, 2016.
2. Investments in Fidelity Central Funds.
The Fund invests in Fidelity Central Funds, which are open-end investment companies generally available only to other investment companies and accounts managed by the investment adviser and its affiliates. The Fund's Schedule of Investments lists each of the Fidelity Central Funds held as of period end, if any, as an investment of the Fund, but does not include the underlying holdings of each Fidelity Central Fund. As an Investing Fund, the Fund indirectly bears its proportionate share of the expenses of the underlying Fidelity Central Funds.
The Money Market Central Funds seek preservation of capital and current income and are managed by Fidelity Investments Money Management, Inc. (FIMM), an affiliate of the investment adviser. Annualized expenses of the Money Market Central Funds as of their most recent shareholder report date are less than .005%.
A complete unaudited list of holdings for each Fidelity Central Fund is available upon request or at the Securities and Exchange Commission (the SEC) website at www.sec.gov. In addition, the financial statements of the Fidelity Central Funds are available on the SEC website or upon request.
3. Significant Accounting Policies.
The Fund is an investment company and applies the accounting and reporting guidance of the Financial Accounting Standards Board (FASB) Accounting Standards Codification Topic 946 Financial Services – Investments Companies. The financial statements have been prepared in conformity with accounting principles generally accepted in the United States of America (GAAP), which require management to make certain estimates and assumptions at the date of the financial statements. Actual results could differ from those estimates. Subsequent events, if any, through the date that the financial statements were issued have been evaluated in the preparation of the financial statements. The following summarizes the significant accounting policies of the Fund:
Investment Valuation. Investments are valued as of 4:00 p.m. Eastern time on the last calendar day of the period. The Board of Trustees (the Board) has delegated the day to day responsibility for the valuation of the Fund's investments to the Fair Value Committee (the Committee) established by the Fund's investment adviser. In accordance with valuation policies and procedures approved by the Board, the Fund attempts to obtain prices from one or more third party pricing vendors or brokers to value its investments. When current market prices, quotations or currency exchange rates are not readily available or reliable, investments will be fair valued in good faith by the Committee, in accordance with procedures adopted by the Board. Factors used in determining fair value vary by investment type and may include market or investment specific events. The frequency with which these procedures are used cannot be predicted and they may be utilized to a significant extent. The Committee oversees the Fund's valuation policies and procedures and reports to the Board on the Committee's activities and fair value determinations. The Board monitors the appropriateness of the procedures used in valuing the Fund's investments and ratifies the fair value determinations of the Committee.
The Fund categorizes the inputs to valuation techniques used to value its investments into a disclosure hierarchy consisting of three levels as shown below:
- Level 1 – quoted prices in active markets for identical investments
- Level 2 – other significant observable inputs (including quoted prices for similar investments, interest rates, prepayment speeds, etc.)
- Level 3 – unobservable inputs (including the Fund's own assumptions based on the best information available)
Valuation techniques used to value the Fund's investments by major category are as follows:
Equity securities, including restricted securities, for which market quotations are readily available, are valued at the last reported sale price or official closing price as reported by a third party pricing vendor on the primary market or exchange on which they are traded and are categorized as Level 1 in the hierarchy. In the event there were no sales during the day or closing prices are not available, securities are valued at the last quoted bid price or may be valued using the last available price and are generally categorized as Level 2 in the hierarchy. For foreign equity securities, when market or security specific events arise, comparisons to the valuation of American Depositary Receipts (ADRs), futures contracts, Exchange-Traded Funds (ETFs) and certain indexes as well as quoted prices for similar securities may be used and would be categorized as Level 2 in the hierarchy. Utilizing these techniques may result in transfers between Level 1 and Level 2. For equity securities, including restricted securities, where observable inputs are limited, assumptions about market activity and risk are used and these securities may be categorized as Level 3 in the hierarchy.
Investments in open-end mutual funds, including the Fidelity Central Funds, are valued at their closing net asset value (NAV) each business day and are categorized as Level 1 in the hierarchy.
Changes in valuation techniques may result in transfers in or out of an assigned level within the disclosure hierarchy. The aggregate value of investments by input level as of April 30, 2017 is included at the end of the Fund's Schedule of Investments.
Foreign Currency. The Fund may use foreign currency contracts to facilitate transactions in foreign-denominated securities. Gains and losses from these transactions may arise from changes in the value of the foreign currency or if the counterparties do not perform under the contracts' terms.
Foreign-denominated assets, including investment securities, and liabilities are translated into U.S. dollars at the exchange rates at period end. Purchases and sales of investment securities, income and dividends received and expenses denominated in foreign currencies are translated into U.S. dollars at the exchange rate in effect on the transaction date.
The effects of exchange rate fluctuations on investments are included with the net realized and unrealized gain (loss) on investment securities. Other foreign currency transactions resulting in realized and unrealized gain (loss) are disclosed separately.
Investment Transactions and Income. For financial reporting purposes, the Fund's investment holdings and NAV include trades executed through the end of the last business day of the period. The NAV per share for processing shareholder transactions is calculated as of the close of business of the New York Stock Exchange (NYSE), normally 4:00 p.m. Eastern time and includes trades executed through the end of the prior business day. Gains and losses on securities sold are determined on the basis of identified cost and may include proceeds received from litigation. Dividend income is recorded on the ex-dividend date, except for certain dividends from foreign securities where the ex-dividend date may have passed, which are recorded as soon as the Fund is informed of the ex-dividend date. Non-cash dividends included in dividend income, if any, are recorded at the fair market value of the securities received. Income and capital gain distributions from Fidelity Central Funds, if any, are recorded on the ex-dividend date. Certain distributions received by the Fund represent a return of capital or capital gain. The Fund determines the components of these distributions subsequent to the ex-dividend date, based upon receipt of tax filings or other correspondence relating to the underlying investment. These distributions are recorded as a reduction of cost of investments and/or as a realized gain. Investment income is recorded net of foreign taxes withheld where recovery of such taxes is uncertain.
Class Allocations and Expenses. Investment income, realized and unrealized capital gains and losses, common expenses of the Fund, and certain fund-level expense reductions, if any, are allocated daily on a pro-rata basis to each class based on the relative net assets of each class to the total net assets of the Fund. Each class differs with respect to transfer agent and distribution and service plan fees incurred. Certain expense reductions may also differ by class. For the reporting period, the allocated portion of income and expenses to each class as a percent of its average net assets may vary due to the timing of recording these transactions in relation to fluctuating net assets of the classes. Expenses directly attributable to a fund are charged to that fund. Expenses attributable to more than one fund are allocated among the respective funds on the basis of relative net assets or other appropriate methods. Expense estimates are accrued in the period to which they relate and adjustments are made when actual amounts are known.
Income Tax Information and Distributions to Shareholders. Each year, the Fund intends to qualify as a regulated investment company under Subchapter M of the Internal Revenue Code, including distributing substantially all of its taxable income and realized gains. As a result, no provision for U.S. Federal income taxes is required. The Fund files a U.S. federal tax return, in addition to state and local tax returns as required. The Fund's federal income tax returns are subject to examination by the Internal Revenue Service (IRS) for a period of three fiscal years after they are filed. State and local tax returns may be subject to examination for an additional fiscal year depending on the jurisdiction. Foreign taxes are provided for based on the Fund's understanding of the tax rules and rates that exist in the foreign markets in which it invests.
Distributions are declared and recorded on the ex-dividend date. Income dividends and capital gain distributions are declared separately for each class. Income and capital gain distributions are determined in accordance with income tax regulations, which may differ from GAAP.
Capital accounts within the financial statements are adjusted for permanent book-tax differences. These adjustments have no impact on net assets or the results of operations. Capital accounts are not adjusted for temporary book-tax differences which will reverse in a subsequent period.
Book-tax differences are primarily due to foreign currency transactions, passive foreign investment companies (PFIC),partnerships, capital loss carryforwards and losses deferred due to wash sales.
The federal tax cost of investment securities and unrealized appreciation (depreciation) as of period end were as follows:
| Gross unrealized appreciation | $21,052,475 |
| Gross unrealized depreciation | (88,323,728) |
| Net unrealized appreciation (depreciation) on securities | $(67,271,253) |
| Tax cost | $495,565,370 |
Capital loss carryforwards are only available to offset future capital gains of the Fund to the extent provided by regulations and may be limited. Under the Regulated Investment Company Modernization Act of 2010 (the Act), the Fund is permitted to carry forward capital losses incurred in taxable years beginning after December 22, 2010 for an unlimited period and such capital losses are required to be used prior to any losses that expire. The capital loss carryforward information presented below, including any applicable limitation, is estimated as of prior fiscal period end and is subject to adjustment.
| Fiscal year of expiration | |
| 2019 | $(6,952,413) |
| No expiration | |
| Short-term | (8,754,263) |
| Long-term | (72,167,588) |
| Total no expiration | (80,921,851) |
| Total capital loss carryforward | $(87,874,264) |
Short-Term Trading (Redemption) Fees. Shares held by investors in the Fund less than 30 days may have been subject to a redemption fee equal to 1.00% of the NAV of shares redeemed. All redemption fees, which reduce the proceeds of the shareholder redemption, are retained by the Fund and accounted for as an addition to paid in capital.
4. Purchases and Sales of Investments.
Purchases and sales of securities, other than short-term securities, aggregated $206,841,374 and $170,436,102, respectively.
5. Fees and Other Transactions with Affiliates.
Management Fee. Fidelity Management & Research Company (the investment adviser) and its affiliates provide the Fund with investment management related services for which the Fund pays a monthly management fee. The management fee is the sum of an individual fund fee rate that is based on an annual rate of .45% of the Fund's average net assets and an annualized group fee rate that averaged .25% during the period. The group fee rate is based upon the average net assets of all the mutual funds advised by the investment adviser, including any mutual funds previously advised by the investment adviser that are currently advised by Fidelity SelectCo, LLC, an affiliate of the investment adviser. The group fee rate decreases as assets under management increase and increases as assets under management decrease. For the reporting period, the total annualized management fee rate was .70% of the Fund's average net assets.
Distribution and Service Plan Fees. In accordance with Rule 12b-1 of the 1940 Act, the Fund has adopted separate Distribution and Service Plans for each class of shares. Certain classes pay Fidelity Distributors Corporation (FDC), an affiliate of the investment adviser, separate Distribution and Service Fees, each of which is based on an annual percentage of each class' average net assets. In addition, FDC may pay financial intermediaries for selling shares of the Fund and providing shareholder support services. For the period, the Distribution and Service Fee rates, total fees and amounts retained by FDC were as follows:
| | Distribution
Fee | Service
Fee | Total Fees | Retained
by FDC |
| Class A | -% | .25% | $44,819 | $952 |
| Class M | .25% | .25% | 16,736 | 104 |
| Class C | .75% | .25% | 71,692 | 14,981 |
| | | | $133,247 | $16,037 |
Sales Load. FDC may receive a front-end sales charge of up to 5.75% for selling Class A shares and 3.50% for selling Class M shares, some of which is paid to financial intermediaries for selling shares of the Fund. Depending on the holding period, FDC may receive contingent deferred sales charges levied on Class A, Class M, and Class C redemptions. The deferred sales charges are 1.00% for Class C shares, 1.00% for certain purchases of Class A shares and .25% for certain purchases of Class M shares.
For the period, sales charge amounts retained by FDC were as follows:
| | Retained
by FDC |
| Class A | $16,952 |
| Class M | 1,860 |
| Class C(a) | 1,522 |
| | $20,334 |
(a) When Class C shares are initially sold, FDC pays commissions from its own resources to financial intermediaries through which the sales are made.
Transfer Agent Fees. Fidelity Investments Institutional Operations Company, Inc., (FIIOC), an affiliate of the investment adviser, is the transfer, dividend disbursing and shareholder servicing agent for each class of the Fund. FIIOC receives account fees and asset-based fees that vary according to the account size and type of account of the shareholders of the respective classes of the Fund. FIIOC pays for typesetting, printing and mailing of shareholder reports, except proxy statements.
For the period, transfer agent fees for each class were as follows:
| | Amount | % of
Class-Level Average
Net Assets(a) |
| Class A | $50,232 | .28 |
| Class M | 10,638 | .32 |
| Class C | 19,809 | .28 |
| Global Commodity Stock | 398,054 | .30 |
| Class I | 74,580 | .16 |
| | $553,313 | |
(a) Annualized
Accounting and Security Lending Fees. Fidelity Service Company, Inc. (FSC), an affiliate of the investment adviser, maintains the Fund's accounting records. The accounting fee is based on the level of average net assets for each month. Under a separate contract, FSC administers the security lending program. The security lending fee is based on the number and duration of lending transactions.
Brokerage Commissions. The Fund placed a portion of its portfolio transactions with brokerage firms which are affiliates of the investment adviser. Brokerage commissions are included in net realized gain (loss) and change in net unrealized appreciation (depreciation) in the Statement of Operations. The commissions paid to these affiliated firms were $4,759 for the period.
Interfund Trades. The Fund may purchase from or sell securities to other Fidelity Funds under procedures adopted by the Board. The procedures have been designed to ensure these interfund trades are executed in accordance with Rule 17a-7 of the 1940 Act. Interfund trades are included within the respective purchases and sales amounts shown in the Purchases and Sales of Investments note.
6. Committed Line of Credit.
The Fund participates with other funds managed by the investment adviser or an affiliate in a $4.25 billion credit facility (the "line of credit") to be utilized for temporary or emergency purposes to fund shareholder redemptions or for other short-term liquidity purposes. The Fund has agreed to pay commitment fees on its pro-rata portion of the line of credit, which amounted to $690 and is reflected in Miscellaneous expenses on the Statement of Operations. During the period, the Fund did not borrow on this line of credit.
7. Security Lending.
The Fund lends portfolio securities through a lending agent from time to time in order to earn additional income. For equity securities, a lending agent is used and may loan securities to certain qualified borrowers, including Fidelity Capital Markets (FCM), a broker-dealer affiliated with the Fund. On the settlement date of the loan, the Fund receives collateral (in the form of U.S. Treasury obligations, letters of credit and/or cash) against the loaned securities and maintains collateral in an amount not less than 100% of the market value of the loaned securities during the period of the loan. The market value of the loaned securities is determined at the close of business of the Fund and any additional required collateral is delivered to the Fund on the next business day. The Fund or borrower may terminate the loan at any time, and if the borrower defaults on its obligation to return the securities loaned because of insolvency or other reasons, the Fund may apply collateral received from the borrower against the obligation. The Fund may experience delays and costs in recovering the securities loaned. Any cash collateral received is invested in the Fidelity Securities Lending Cash Central Fund. The value of loaned securities and cash collateral at period end are disclosed on the Fund's Statement of Assets and Liabilities. At period end, there were no security loans outstanding with FCM. Security lending income represents the income earned on investing cash collateral, less rebates paid to borrowers and any lending agent fees associated with the loan, plus any premium payments received for lending certain types of securities. Security lending income is presented in the Statement of Operations as a component of income from Fidelity Central Funds. Total security lending income during the period amounted to $68,368, including $341 from securities loaned to FCM.
8. Expense Reductions.
Commissions paid to certain brokers with whom the investment adviser, or its affiliates, places trades on behalf of the Fund include an amount in addition to trade execution, which may be rebated back to the Fund to offset certain expenses. This amount totaled $18,080 for the period. In addition, through arrangements with the Fund's custodian, credits realized as a result of certain uninvested cash balances were used to reduce the Fund's expenses. During the period, these credits reduced the Fund's custody expenses by $16.
In addition, during the period the investment adviser reimbursed and/or waived a portion of fund-level operating expenses in the amount of $1,798.
9. Distributions to Shareholders.
Distributions to shareholders of each class were as follows:
| | Six months ended
April 30, 2017 | Year ended October 31, 2016 |
| From net investment income | | |
| Class A | $252,767 | $638,599 |
| Class M | 29,683 | 103,956 |
| Class B | – | 8,861 |
| Class C | 14,849 | 133,173 |
| Global Commodity Stock | 2,329,358 | 3,642,366 |
| Class I | 884,379 | 613,921 |
| Total | $3,511,036 | $5,140,876 |
| From net realized gain | | |
| Class A | $220,361 | $30,410 |
| Class M | 39,578 | 6,044 |
| Class B | – | 836 |
| Class C | 84,142 | 11,098 |
| Global Commodity Stock | 1,508,537 | 151,130 |
| Class I | 509,642 | 24,557 |
| Total | $2,362,260 | $224,075 |
10. Share Transactions.
Share transactions for each class were as follows and may contain automatic conversions between classes or exchanges between affiliated funds:
| | Shares | Shares | Dollars | Dollars |
| | Six months ended April 30, 2017 | Year ended October 31, 2016 | Six months ended April 30, 2017 | Year ended October 31, 2016 |
| Class A | | | | |
| Shares sold | 527,554 | 995,820 | $6,122,558 | $9,707,856 |
| Reinvestment of distributions | 39,394 | 70,559 | 455,002 | 655,495 |
| Shares redeemed | (1,111,518) | (948,589) | (12,952,144) | (9,072,163) |
| Net increase (decrease) | (544,570) | 117,790 | $(6,374,584) | $1,291,188 |
| Class M | | | | |
| Shares sold | 104,498 | 109,904 | $1,201,597 | $1,057,407 |
| Reinvestment of distributions | 5,865 | 11,521 | 67,801 | 107,030 |
| Shares redeemed | (81,654) | (187,357) | (935,110) | (1,802,838) |
| Net increase (decrease) | 28,709 | (65,932) | $334,288 | $(638,401) |
| Class B | | | | |
| Shares sold | – | 2,904 | $– | $29,587 |
| Reinvestment of distributions | – | 982 | – | 9,133 |
| Shares redeemed | – | (90,607) | – | (897,527) |
| Net increase (decrease) | – | (86,721) | $– | $(858,807) |
| Class C | | | | |
| Shares sold | 247,260 | 318,100 | $2,830,752 | $3,098,053 |
| Reinvestment of distributions | 8,150 | 14,787 | 93,566 | 136,635 |
| Shares redeemed | (179,775) | (280,508) | (2,055,431) | (2,667,860) |
| Net increase (decrease) | 75,635 | 52,379 | $868,887 | $566,828 |
| Global Commodity Stock | | | | |
| Shares sold | 5,384,437 | 11,244,608 | $62,248,308 | $110,744,052 |
| Reinvestment of distributions | 315,142 | 376,092 | 3,643,039 | 3,493,876 |
| Shares redeemed | (3,821,995) | (5,847,902) | (44,051,864) | (57,190,452) |
| Net increase (decrease) | 1,877,584 | 5,772,798 | $21,839,483 | $57,047,476 |
| Class I | | | | |
| Shares sold | 3,288,953 | 6,770,473 | $37,841,011 | $66,305,135 |
| Reinvestment of distributions | 58,242 | 60,388 | 672,698 | 560,405 |
| Shares redeemed | (1,047,537) | (2,783,838) | (12,161,149) | (27,173,673) |
| Net increase (decrease) | 2,299,658 | 4,047,023 | $26,352,560 | $39,691,867 |
11. Other.
The Fund's organizational documents provide former and current trustees and officers with a limited indemnification against liabilities arising in connection with the performance of their duties to the Fund. In the normal course of business, the Fund may also enter into contracts that provide general indemnifications. The Fund's maximum exposure under these arrangements is unknown as this would be dependent on future claims that may be made against the Fund. The risk of material loss from such claims is considered remote.
At the end of the period, the investment adviser or its affiliates were the owners of record of 20% of the total outstanding shares of the Fund.
Shareholder Expense Example
As a shareholder of the Fund, you incur two types of costs: (1) transaction costs, including sales charges (loads) on purchase payments or redemption proceeds, redemption fees and (2) ongoing costs, including management fees, distribution and/or service (12b-1) fees and other Fund expenses. This Example is intended to help you understand your ongoing costs (in dollars) of investing in the Fund and to compare these costs with the ongoing costs of investing in other mutual funds.
The Example is based on an investment of $1,000 invested at the beginning of the period and held for the entire period (November 1, 2016 to April 30, 2017).
Actual Expenses
The first line of the accompanying table for each class of the Fund provides information about actual account values and actual expenses. You may use the information in this line, together with the amount you invested, to estimate the expenses that you paid over the period. Simply divide your account value by $1,000.00 (for example, an $8,600 account value divided by $1,000.00 = 8.6), then multiply the result by the number in the first line for a class of the Fund under the heading entitled "Expenses Paid During Period" to estimate the expenses you paid on your account during this period. A small balance maintenance fee of $12.00 that is charged once a year may apply for certain accounts with a value of less than $2,000. This fee is not included in the table below. If it was, the estimate of expenses you paid during the period would be higher, and your ending account value lower, by this amount. In addition, the Fund, as a shareholder in the underlying Fidelity Central Funds, will indirectly bear its pro-rata share of the fees and expenses incurred by the underlying Fidelity Central Funds. These fees and expenses are not included in the Fund's annualized expense ratio used to calculate the expense estimate in the table below.
Hypothetical Example for Comparison Purposes
The second line of the accompanying table for each class of the Fund provides information about hypothetical account values and hypothetical expenses based on a Class' actual expense ratio and an assumed rate of return of 5% per year before expenses, which is not the Class' actual return. The hypothetical account values and expenses may not be used to estimate the actual ending account balance or expenses you paid for the period. You may use this information to compare the ongoing costs of investing in the Fund and other funds. To do so, compare this 5% hypothetical example with the 5% hypothetical examples that appear in the shareholder reports of the other funds. A small balance maintenance fee of $12.00 that is charged once a year may apply for certain accounts with a value of less than $2,000. This fee is not included in the table below. If it was, the estimate of expenses you paid during the period would be higher, and your ending account value lower, by this amount. In addition, the Fund, as a shareholder in the underlying Fidelity Central Funds, will indirectly bear its pro-rata share of the fees and expenses incurred by the underlying Fidelity Central Funds. These fees and expenses are not included in the Fund's annualized expense ratio used to calculate the expense estimate in the table below.
Please note that the expenses shown in the table are meant to highlight your ongoing costs only and do not reflect any transaction costs. Therefore, the second line of the table is useful in comparing ongoing costs only, and will not help you determine the relative total costs of owning different funds. In addition, if these transactional costs were included, your costs would have been higher.
| | Annualized Expense Ratio-A | Beginning
Account Value
November 1, 2016 | Ending
Account Value
April 30, 2017 | Expenses Paid
During Period-B
November 1, 2016
to April 30, 2017 |
| Class A | 1.35% | | | |
| Actual | | $1,000.00 | $1,078.70 | $6.96 |
| Hypothetical-C | | $1,000.00 | $1,018.10 | $6.76 |
| Class M | 1.64% | | | |
| Actual | | $1,000.00 | $1,076.30 | $8.44 |
| Hypothetical-C | | $1,000.00 | $1,016.66 | $8.20 |
| Class C | 2.10% | | | |
| Actual | | $1,000.00 | $1,074.40 | $10.80 |
| Hypothetical-C | | $1,000.00 | $1,014.38 | $10.49 |
| Global Commodity Stock | 1.12% | | | |
| Actual | | $1,000.00 | $1,079.00 | $5.77 |
| Hypothetical-C | | $1,000.00 | $1,019.24 | $5.61 |
| Class I | .98% | | | |
| Actual | | $1,000.00 | $1,080.30 | $5.05 |
| Hypothetical-C | | $1,000.00 | $1,019.93 | $4.91 |
A Annualized expense ratio reflects expenses net of applicable fee waivers.
B Expenses are equal to each Class' annualized expense ratio, multiplied by the average account value over the period, multiplied by 181/365 (to reflect the one-half year period).
C 5% return per year before expenses
AGCS-SANN-0617
1.879399.108
Fidelity Advisor® Japan Fund -
Class A, Class M (formerly Class T), Class C and Class I
Semi-Annual Report April 30, 2017 Class A, Class M, Class C and Class I are classes of Fidelity® Japan Fund |
|
Contents
To view a fund's proxy voting guidelines and proxy voting record for the 12-month period ended June 30, visit http://www.fidelity.com/proxyvotingresults or visit the Securities and Exchange Commission's (SEC) web site at http://www.sec.gov.
You may also call 1-877-208-0098 to request a free copy of the proxy voting guidelines.
Standard & Poor's, S&P and S&P 500 are registered service marks of The McGraw-Hill Companies, Inc. and have been licensed for use by Fidelity Distributors Corporation.
Other third-party marks appearing herein are the property of their respective owners.
All other marks appearing herein are registered or unregistered trademarks or service marks of FMR LLC or an affiliated company. © 2017 FMR LLC. All rights reserved.
This report and the financial statements contained herein are submitted for the general information of the shareholders of the Fund. This report is not authorized for distribution to prospective investors in the Fund unless preceded or accompanied by an effective prospectus.
A fund files its complete schedule of portfolio holdings with the SEC for the first and third quarters of each fiscal year on Form N-Q. Forms N-Q are available on the SEC’s web site at http://www.sec.gov. A fund's Forms N-Q may be reviewed and copied at the SEC’s Public Reference Room in Washington, DC. Information regarding the operation of the SEC's Public Reference Room may be obtained by calling 1-800-SEC-0330.
For a complete list of a fund's portfolio holdings, view the most recent holdings listing, semiannual report, or annual report on Fidelity's web site at http://www.fidelity.com, http://www.institutional.fidelity.com, or http://www.401k.com, as applicable.
NOT FDIC INSURED •MAY LOSE VALUE •NO BANK GUARANTEE
Neither the Fund nor Fidelity Distributors Corporation is a bank.
Investment Summary (Unaudited)
Geographic Diversification (% of fund's net assets)
| As of April 30, 2017 |
| | Japan | 97.8% |
| | Hong Kong | 1.0% |
| | Cayman Islands | 0.7% |
| | United States of America* | 0.5% |

* Includes Short-Term investments and Net Other Assets (Liabilities).
Percentages are based on country or territory of incorporation and are adjusted for the effect of futures contracts, if applicable.
| As of October 31, 2016 |
| | Japan | 98.3% |
| | United States of America* | 1.1% |
| | Cayman Islands | 0.6% |

* Includes Short-Term investments and Net Other Assets (Liabilities).
Percentages are based on country or territory of incorporation and are adjusted for the effect of futures contracts, if applicable.
Asset Allocation as of April 30, 2017
| | % of fund's net assets | % of fund's net assets 6 months ago |
| Stocks | 99.5 | 98.9 |
| Short-Term Investments and Net Other Assets (Liabilities) | 0.5 | 1.1 |
Top Ten Stocks as of April 30, 2017
| | % of fund's net assets | % of fund's net assets 6 months ago |
| SoftBank Corp. (Wireless Telecommunication Services) | 4.4 | 3.7 |
| Mitsubishi UFJ Financial Group, Inc. (Banks) | 3.9 | 3.3 |
| KDDI Corp. (Wireless Telecommunication Services) | 3.7 | 4.4 |
| Sony Corp. (Household Durables) | 3.7 | 3.6 |
| Hoya Corp. (Health Care Equipment & Supplies) | 3.6 | 3.2 |
| ORIX Corp. (Diversified Financial Services) | 3.4 | 3.6 |
| East Japan Railway Co. (Road & Rail) | 2.7 | 3.0 |
| Shimadzu Corp. (Electronic Equipment & Components) | 2.5 | 2.2 |
| Olympus Corp. (Health Care Equipment & Supplies) | 2.4 | 2.3 |
| Honda Motor Co. Ltd. (Automobiles) | 2.4 | 2.6 |
| | 32.7 | |
Top Market Sectors as of April 30, 2017
| | % of fund's net assets | % of fund's net assets 6 months ago |
| Consumer Discretionary | 19.9 | 21.2 |
| Industrials | 17.0 | 14.1 |
| Information Technology | 14.6 | 13.2 |
| Financials | 12.7 | 11.6 |
| Consumer Staples | 10.0 | 11.1 |
| Health Care | 9.6 | 12.3 |
| Telecommunication Services | 8.1 | 9.9 |
| Materials | 7.6 | 5.2 |
| Real Estate | 0.0 | 0.3 |
Percentages shown as 0.0% may reflect amounts less than 0.05%.
Investments April 30, 2017 (Unaudited)
Showing Percentage of Net Assets
| Common Stocks - 99.5% | | | |
| | | Shares | Value |
| CONSUMER DISCRETIONARY - 19.9% | | | |
| Auto Components - 3.4% | | | |
| Bridgestone Corp. | | 143,900 | $5,999,975 |
| DaikyoNishikawa Corp. | | 109,000 | 1,383,584 |
| Hi-Lex Corp. | | 17,200 | 424,928 |
| NGK Spark Plug Co. Ltd. | | 97,600 | 2,110,909 |
| Sumitomo Electric Industries Ltd. | | 249,000 | 4,057,488 |
| | | | 13,976,884 |
| Automobiles - 5.6% | | | |
| Honda Motor Co. Ltd. | | 339,100 | 9,869,731 |
| Subaru Corp. | | 104,500 | 3,948,455 |
| Suzuki Motor Corp. | | 223,300 | 9,318,606 |
| | | | 23,136,792 |
| Household Durables - 7.6% | | | |
| Panasonic Corp. | | 399,400 | 4,776,125 |
| Rinnai Corp. | | 38,600 | 3,206,423 |
| Sekisui Chemical Co. Ltd. | | 123,500 | 2,071,720 |
| Sekisui House Ltd. | | 121,100 | 2,009,190 |
| Sony Corp. | | 445,200 | 15,276,746 |
| Techtronic Industries Co. Ltd. | | 1,010,000 | 4,336,910 |
| | | | 31,677,114 |
| Media - 1.6% | | | |
| Dentsu, Inc. | | 70,000 | 3,943,485 |
| LIFULL Co. Ltd. (a) | | 388,900 | 2,728,144 |
| | | | 6,671,629 |
| Multiline Retail - 0.4% | | | |
| Don Quijote Holdings Co. Ltd. | | 50,700 | 1,848,805 |
| Specialty Retail - 1.3% | | | |
| Nitori Holdings Co. Ltd. | | 15,600 | 2,030,554 |
| USS Co. Ltd. | | 179,400 | 3,170,379 |
| | | | 5,200,933 |
|
| TOTAL CONSUMER DISCRETIONARY | | | 82,512,157 |
|
| CONSUMER STAPLES - 10.0% | | | |
| Food & Staples Retailing - 5.7% | | | |
| Ain Holdings, Inc. | | 39,300 | 2,721,651 |
| San-A Co. Ltd. | | 49,600 | 2,255,860 |
| Seven & i Holdings Co. Ltd. | | 182,500 | 7,710,922 |
| Sundrug Co. Ltd. | | 101,600 | 3,563,633 |
| Tsuruha Holdings, Inc. | | 22,800 | 2,311,191 |
| Welcia Holdings Co. Ltd. | | 149,400 | 4,811,357 |
| | | | 23,374,614 |
| Food Products - 0.8% | | | |
| Japan Meat Co. Ltd. | | 34,100 | 567,441 |
| Morinaga & Co. Ltd. | | 59,700 | 2,822,328 |
| | | | 3,389,769 |
| Personal Products - 1.8% | | | |
| Kao Corp. | | 85,500 | 4,715,443 |
| Kose Corp. | | 29,700 | 2,816,138 |
| | | | 7,531,581 |
| Tobacco - 1.7% | | | |
| Japan Tobacco, Inc. | | 205,800 | 6,841,846 |
|
| TOTAL CONSUMER STAPLES | | | 41,137,810 |
|
| FINANCIALS - 12.7% | | | |
| Banks - 5.1% | | | |
| Mitsubishi UFJ Financial Group, Inc. | | 2,551,400 | 16,167,192 |
| Shinsei Bank Ltd. | | 2,594,000 | 4,840,117 |
| | | | 21,007,309 |
| Capital Markets - 0.5% | | | |
| Monex Group, Inc. | | 824,100 | 2,062,560 |
| Consumer Finance - 0.7% | | | |
| AEON Financial Service Co. Ltd. | | 149,300 | 2,867,471 |
| Diversified Financial Services - 3.4% | | | |
| ORIX Corp. | | 912,300 | 13,920,810 |
| Insurance - 3.0% | | | |
| Sony Financial Holdings, Inc. | | 201,600 | 3,349,300 |
| Tokio Marine Holdings, Inc. | | 217,800 | 9,167,236 |
| | | | 12,516,536 |
|
| TOTAL FINANCIALS | | | 52,374,686 |
|
| HEALTH CARE - 9.6% | | | |
| Biotechnology - 0.6% | | | |
| PeptiDream, Inc. (a)(b) | | 44,300 | 2,650,648 |
| Health Care Equipment & Supplies - 7.2% | | | |
| Hoya Corp. | | 310,500 | 14,829,352 |
| Nakanishi, Inc. | | 26,500 | 1,041,220 |
| Olympus Corp. | | 259,300 | 9,978,892 |
| Paramount Bed Holdings Co. Ltd. | | 88,800 | 3,724,064 |
| | | | 29,573,528 |
| Health Care Providers & Services - 0.9% | | | |
| Ship Healthcare Holdings, Inc. | | 140,300 | 3,771,959 |
| Pharmaceuticals - 0.9% | | | |
| Shionogi & Co. Ltd. | | 75,600 | 3,888,000 |
|
| TOTAL HEALTH CARE | | | 39,884,135 |
|
| INDUSTRIALS - 17.0% | | | |
| Building Products - 2.0% | | | |
| Daikin Industries Ltd. | | 64,500 | 6,263,400 |
| Toto Ltd. | | 49,200 | 1,877,964 |
| | | | 8,141,364 |
| Commercial Services & Supplies - 0.9% | | | |
| Sohgo Security Services Co., Ltd. | | 81,300 | 3,548,100 |
| Construction & Engineering - 1.0% | | | |
| Toshiba Plant Systems & Services Corp. | | 265,900 | 4,324,527 |
| Electrical Equipment - 3.5% | | | |
| Mitsubishi Electric Corp. | | 447,000 | 6,231,334 |
| Nidec Corp. | | 88,900 | 8,150,330 |
| | | | 14,381,664 |
| Machinery - 2.9% | | | |
| Komatsu Ltd. | | 78,800 | 2,105,658 |
| Kubota Corp. | | 219,600 | 3,453,320 |
| SMC Corp. | | 22,400 | 6,307,567 |
| | | | 11,866,545 |
| Professional Services - 2.2% | | | |
| Benefit One, Inc. | | 89,500 | 2,733,774 |
| Outsourcing, Inc. (a) | | 77,300 | 2,964,409 |
| Recruit Holdings Co. Ltd. | | 71,700 | 3,621,180 |
| | | | 9,319,363 |
| Road & Rail - 2.7% | | | |
| East Japan Railway Co. | | 127,300 | 11,367,071 |
| Trading Companies & Distributors - 1.8% | | | |
| Misumi Group, Inc. | | 310,600 | 5,881,826 |
| Trusco Nakayama Corp. | | 74,300 | 1,696,286 |
| | | | 7,578,112 |
|
| TOTAL INDUSTRIALS | | | 70,526,746 |
|
| INFORMATION TECHNOLOGY - 14.6% | | | |
| Electronic Equipment & Components - 7.5% | | | |
| Azbil Corp. | | 162,900 | 5,479,928 |
| Iriso Electronics Co. Ltd. | | 18,100 | 1,144,696 |
| Murata Manufacturing Co. Ltd. | | 26,500 | 3,552,747 |
| OMRON Corp. | | 60,600 | 2,535,986 |
| Shimadzu Corp. | | 613,000 | 10,393,093 |
| TDK Corp. | | 55,400 | 3,429,110 |
| Topcon Corp. | | 259,500 | 4,578,933 |
| | | | 31,114,493 |
| Internet Software & Services - 4.1% | | | |
| Alibaba Group Holding Ltd. sponsored ADR (b) | | 23,400 | 2,702,700 |
| DeNA Co. Ltd. | | 143,800 | 3,079,171 |
| Kakaku.com, Inc. | | 411,900 | 5,937,863 |
| SMS Co., Ltd. | | 83,700 | 2,227,745 |
| Yahoo! Japan Corp. | | 742,400 | 3,176,719 |
| | | | 17,124,198 |
| IT Services - 0.3% | | | |
| Otsuka Corp. | | 25,900 | 1,387,064 |
| Semiconductors & Semiconductor Equipment - 1.6% | | | |
| Sumco Corp. | | 367,100 | 6,418,281 |
| Software - 1.1% | | | |
| Nintendo Co. Ltd. | | 17,600 | 4,453,955 |
|
| TOTAL INFORMATION TECHNOLOGY | | | 60,497,991 |
|
| MATERIALS - 7.6% | | | |
| Chemicals - 7.6% | | | |
| Daicel Chemical Industries Ltd. | | 208,300 | 2,389,914 |
| Hitachi Chemical Co. Ltd. | | 134,900 | 3,860,336 |
| JSR Corp. | | 245,000 | 4,474,725 |
| Kansai Paint Co. Ltd. | | 172,100 | 3,810,207 |
| Okamoto Industries, Inc. | | 111,000 | 1,202,853 |
| Shin-Etsu Chemical Co. Ltd. | | 87,600 | 7,609,943 |
| Sumitomo Chemical Co. Ltd. | | 602,000 | 3,396,797 |
| Toray Industries, Inc. | | 524,000 | 4,635,267 |
| | | | 31,380,042 |
| TELECOMMUNICATION SERVICES - 8.1% | | | |
| Wireless Telecommunication Services - 8.1% | | | |
| KDDI Corp. | | 580,800 | 15,399,374 |
| SoftBank Corp. | | 240,400 | 18,234,991 |
| | | | 33,634,365 |
| TOTAL COMMON STOCKS | | | |
| (Cost $351,359,401) | | | 411,947,932 |
|
| Money Market Funds - 2.8% | | | |
| Fidelity Cash Central Fund, 0.85% (c) | | 4,818,153 | 4,819,117 |
| Fidelity Securities Lending Cash Central Fund 0.86% (c)(d) | | 6,854,921 | 6,855,606 |
| TOTAL MONEY MARKET FUNDS | | | |
| (Cost $11,675,203) | | | 11,674,723 |
| TOTAL INVESTMENT PORTFOLIO - 102.3% | | | |
| (Cost $363,034,604) | | | 423,622,655 |
| NET OTHER ASSETS (LIABILITIES) - (2.3)% | | | (9,435,140) |
| NET ASSETS - 100% | | | $414,187,515 |
Legend
(a) Security or a portion of the security is on loan at period end.
(b) Non-income producing
(c) Affiliated fund that is generally available only to investment companies and other accounts managed by Fidelity Investments. The rate quoted is the annualized seven-day yield of the fund at period end. A complete unaudited listing of the fund's holdings as of its most recent quarter end is available upon request. In addition, each Fidelity Central Fund's financial statements are available on the SEC's website or upon request.
(d) Investment made with cash collateral received from securities on loan.
Affiliated Central Funds
Information regarding fiscal year to date income earned by the Fund from investments in Fidelity Central Funds is as follows:
| Fund | Income earned |
| Fidelity Cash Central Fund | $6,905 |
| Fidelity Securities Lending Cash Central Fund | 60,511 |
| Total | $67,416 |
Investment Valuation
The following is a summary of the inputs used, as of April 30, 2017, involving the Fund's assets and liabilities carried at fair value. The inputs or methodology used for valuing securities may not be an indication of the risk associated with investing in those securities. For more information on valuation inputs, and their aggregation into the levels used below, please refer to the Investment Valuation section in the accompanying Notes to Financial Statements.
| | Valuation Inputs at Reporting Date: |
| Description | Total | Level 1 | Level 2 | Level 3 |
| Investments in Securities: | | | | |
| Equities: | | | | |
| Consumer Discretionary | $82,512,157 | $52,589,555 | $29,922,602 | $-- |
| Consumer Staples | 41,137,810 | 41,137,810 | -- | -- |
| Financials | 52,374,686 | 36,207,494 | 16,167,192 | -- |
| Health Care | 39,884,135 | 39,884,135 | -- | -- |
| Industrials | 70,526,746 | 68,421,088 | 2,105,658 | -- |
| Information Technology | 60,497,991 | 56,044,036 | 4,453,955 | -- |
| Materials | 31,380,042 | 31,380,042 | -- | -- |
| Telecommunication Services | 33,634,365 | -- | 33,634,365 | -- |
| Money Market Funds | 11,674,723 | 11,674,723 | -- | -- |
| Total Investments in Securities: | $423,622,655 | $337,338,883 | $86,283,772 | $-- |
See accompanying notes which are an integral part of the financial statements.
Financial Statements
Statement of Assets and Liabilities
| | | April 30, 2017 (Unaudited) |
| Assets | | |
Investment in securities, at value (including securities loaned of $6,524,398) — See accompanying schedule:
Unaffiliated issuers (cost $351,359,401) | $411,947,932 | |
| Fidelity Central Funds (cost $11,675,203) | 11,674,723 | |
| Total Investments (cost $363,034,604) | | $423,622,655 |
| Receivable for investments sold | | 4,121,947 |
| Receivable for fund shares sold | | 215,650 |
| Dividends receivable | | 2,873,866 |
| Distributions receivable from Fidelity Central Funds | | 11,226 |
| Prepaid expenses | | 263 |
| Other receivables | | 7,929 |
| Total assets | | 430,853,536 |
| Liabilities | | |
| Payable for fund shares redeemed | $9,448,211 | |
| Accrued management fee | 184,625 | |
| Distribution and service plan fees payable | 17,452 | |
| Other affiliated payables | 100,450 | |
| Other payables and accrued expenses | 60,781 | |
| Collateral on securities loaned | 6,854,502 | |
| Total liabilities | | 16,666,021 |
| Net Assets | | $414,187,515 |
| Net Assets consist of: | | |
| Paid in capital | | $549,345,476 |
| Undistributed net investment income | | 1,770,842 |
| Accumulated undistributed net realized gain (loss) on investments and foreign currency transactions | | (197,503,056) |
| Net unrealized appreciation (depreciation) on investments and assets and liabilities in foreign currencies | | 60,574,253 |
| Net Assets | | $414,187,515 |
| Calculation of Maximum Offering Price | | |
| Class A: | | |
| Net Asset Value and redemption price per share ($21,048,203 ÷ 1,609,128 shares) | | $13.08 |
| Maximum offering price per share (100/94.25 of $13.08) | | $13.88 |
| Class M: | | |
| Net Asset Value and redemption price per share ($4,183,050 ÷ 319,608 shares) | | $13.09 |
| Maximum offering price per share (100/96.50 of $13.09) | | $13.56 |
| Class C: | | |
| Net Asset Value and offering price per share ($13,816,328 ÷ 1,064,113 shares)(a) | | $12.98 |
| Japan: | | |
| Net Asset Value, offering price and redemption price per share ($221,494,711 ÷ 16,907,602 shares) | | $13.10 |
| Class I: | | |
| Net Asset Value, offering price and redemption price per share ($153,645,223 ÷ 11,739,262 shares) | | $13.09 |
(a) Redemption price per share is equal to net asset value less any applicable contingent deferred sales charge.
See accompanying notes which are an integral part of the financial statements.
Statement of Operations
| | | Six months ended April 30, 2017 (Unaudited) |
| Investment Income | | |
| Dividends | | $3,801,833 |
| Income from Fidelity Central Funds | | 67,416 |
| Income before foreign taxes withheld | | 3,869,249 |
| Less foreign taxes withheld | | (380,183) |
| Total income | | 3,489,066 |
| Expenses | | |
| Management fee | | |
| Basic fee | $1,416,755 | |
| Performance adjustment | (442,082) | |
| Transfer agent fees | 412,242 | |
| Distribution and service plan fees | 106,841 | |
| Accounting and security lending fees | 106,115 | |
| Custodian fees and expenses | 21,460 | |
| Independent trustees' fees and expenses | 825 | |
| Registration fees | 60,350 | |
| Audit | 42,124 | |
| Legal | 475 | |
| Miscellaneous | 1,612 | |
| Total expenses before reductions | 1,726,717 | |
| Expense reductions | (13,341) | 1,713,376 |
| Net investment income (loss) | | 1,775,690 |
| Realized and Unrealized Gain (Loss) | | |
| Net realized gain (loss) on: | | |
| Investment securities: | | |
| Unaffiliated issuers | 2,426,120 | |
| Fidelity Central Funds | 975 | |
| Foreign currency transactions | (305,538) | |
| Total net realized gain (loss) | | 2,121,557 |
Change in net unrealized appreciation (depreciation) on:
Investment securities | 15,865,728 | |
| Assets and liabilities in foreign currencies | 80,225 | |
| Total change in net unrealized appreciation (depreciation) | | 15,945,953 |
| Net gain (loss) | | 18,067,510 |
| Net increase (decrease) in net assets resulting from operations | | $19,843,200 |
See accompanying notes which are an integral part of the financial statements.
Statement of Changes in Net Assets
| | Six months ended April 30, 2017 (Unaudited) | Year ended October 31, 2016 |
| Increase (Decrease) in Net Assets | | |
| Operations | | |
| Net investment income (loss) | $1,775,690 | $3,375,493 |
| Net realized gain (loss) | 2,121,557 | (19,947,501) |
| Change in net unrealized appreciation (depreciation) | 15,945,953 | 35,358,570 |
| Net increase (decrease) in net assets resulting from operations | 19,843,200 | 18,786,562 |
| Distributions to shareholders from net investment income | (3,369,067) | (3,027,093) |
| Distributions to shareholders from net realized gain | (1,060,540) | (270,338) |
| Total distributions | (4,429,607) | (3,297,431) |
| Share transactions - net increase (decrease) | (4,398,135) | (159,708,771) |
| Redemption fees | 23,848 | 43,507 |
| Total increase (decrease) in net assets | 11,039,306 | (144,176,133) |
| Net Assets | | |
| Beginning of period | 403,148,209 | 547,324,342 |
| End of period | $414,187,515 | $403,148,209 |
| Other Information | | |
| Undistributed net investment income end of period | $1,770,842 | $3,364,219 |
See accompanying notes which are an integral part of the financial statements.
Financial Highlights — Fidelity Japan Fund Class A
| | Six months ended (Unaudited) April 30, | Years ended October 31, | | | | |
| | 2017 | 2016 | 2015 | 2014 | 2013 | 2012 |
| Selected Per–Share Data | | | | | | |
| Net asset value, beginning of period | $12.59 | $11.87 | $11.65 | $12.00 | $9.30 | $9.54 |
| Income from Investment Operations | | | | | | |
| Net investment income (loss)A | .04 | .06 | .04 | .05 | .08 | .09 |
| Net realized and unrealized gain (loss) | .54 | .72 | .23 | (.31) | 2.80 | (.15) |
| Total from investment operations | .58 | .78 | .27 | (.26) | 2.88 | (.06) |
| Distributions from net investment income | (.06) | (.05) | (.05) | (.08) | (.11) | (.13) |
| Distributions from net realized gain | (.03) | (.01) | – | (.01) | (.08) | (.05) |
| Total distributions | (.09) | (.06) | (.05) | (.09) | (.19) | (.18) |
| Redemption fees added to paid in capitalA | –B | –B | –B | –B | .01 | –B |
| Net asset value, end of period | $13.08 | $12.59 | $11.87 | $11.65 | $12.00 | $9.30 |
| Total ReturnC,D,E | 4.69% | 6.56% | 2.31% | (2.18)% | 31.58% | (.64)% |
| Ratios to Average Net AssetsF,G | | | | | | |
| Expenses before reductions | 1.08%H | 1.08% | 1.10% | 1.23% | 1.26% | 1.42% |
| Expenses net of fee waivers, if any | 1.08%H | 1.08% | 1.10% | 1.23% | 1.26% | 1.38% |
| Expenses net of all reductions | 1.07%H | 1.08% | 1.09% | 1.23% | 1.25% | 1.36% |
| Net investment income (loss) | .64%H | .51% | .37% | .41% | .75% | .94% |
| Supplemental Data | | | | | | |
| Net assets, end of period (000 omitted) | $21,048 | $23,910 | $23,918 | $21,352 | $20,520 | $9,495 |
| Portfolio turnover rateI | 32%H | 15% | 35% | 112% | 68% | 52% |
A Calculated based on average shares outstanding during the period.
B Amount represents less than $.005 per share.
C Total returns for periods of less than one year are not annualized.
D Total returns would have been lower if certain expenses had not been reduced during the applicable periods shown.
E Total returns do not include the effect of the sales charges.
F Fees and expenses of any underlying Fidelity Central Funds are not included in the Fund's expense ratio. The Fund indirectly bears its proportionate share of the expenses of any underlying Fidelity Central Funds.
G Expense ratios reflect operating expenses of the class. Expenses before reductions do not reflect amounts reimbursed by the investment adviser or reductions from brokerage service arrangements or reductions from other expense offset arrangements and do not represent the amount paid by the class during periods when reimbursements or reductions occur. Expenses net of fee waivers reflect expenses after reimbursement by the investment adviser but prior to reductions from brokerage service arrangements or other expense offset arrangements. Expenses net of all reductions represent the net expenses paid by the class.
H Annualized
I Amount does not include the portfolio activity of any underlying Fidelity Central Funds.
See accompanying notes which are an integral part of the financial statements.
Financial Highlights — Fidelity Japan Fund Class M
| | Six months ended (Unaudited) April 30, | Years ended October 31, | | | | |
| | 2017 | 2016 | 2015 | 2014 | 2013 | 2012 |
| Selected Per–Share Data | | | | | | |
| Net asset value, beginning of period | $12.57 | $11.85 | $11.62 | $11.96 | $9.28 | $9.51 |
| Income from Investment Operations | | | | | | |
| Net investment income (loss)A | .02 | .02 | –B | .01 | .05 | .06 |
| Net realized and unrealized gain (loss) | .54 | .71 | .23 | (.30) | 2.78 | (.13) |
| Total from investment operations | .56 | .73 | .23 | (.29) | 2.83 | (.07) |
| Distributions from net investment income | (.01) | –B | – | (.04) | (.08) | (.11) |
| Distributions from net realized gain | (.03) | (.01) | – | (.01) | (.08) | (.05) |
| Total distributions | (.04) | (.01) | – | (.05) | (.16) | (.16) |
| Redemption fees added to paid in capitalA | –B | –B | –B | –B | .01 | –B |
| Net asset value, end of period | $13.09 | $12.57 | $11.85 | $11.62 | $11.96 | $9.28 |
| Total ReturnC,D,E | 4.51% | 6.15% | 1.98% | (2.42)% | 31.04% | (.75)% |
| Ratios to Average Net AssetsF,G | | | | | | |
| Expenses before reductions | 1.43%H | 1.44% | 1.43% | 1.54% | 1.55% | 1.70% |
| Expenses net of fee waivers, if any | 1.43%H | 1.44% | 1.43% | 1.54% | 1.55% | 1.66% |
| Expenses net of all reductions | 1.43%H | 1.44% | 1.42% | 1.54% | 1.53% | 1.64% |
| Net investment income (loss) | .29%H | .16% | .04% | .10% | .46% | .66% |
| Supplemental Data | | | | | | |
| Net assets, end of period (000 omitted) | $4,183 | $4,193 | $4,809 | $4,104 | $5,357 | $3,934 |
| Portfolio turnover rateI | 32%H | 15% | 35% | 112% | 68% | 52% |
A Calculated based on average shares outstanding during the period.
B Amount represents less than $.005 per share.
C Total returns for periods of less than one year are not annualized.
D Total returns would have been lower if certain expenses had not been reduced during the applicable periods shown.
E Total returns do not include the effect of the sales charges.
F Fees and expenses of any underlying Fidelity Central Funds are not included in the Fund's expense ratio. The Fund indirectly bears its proportionate share of the expenses of any underlying Fidelity Central Funds.
G Expense ratios reflect operating expenses of the class. Expenses before reductions do not reflect amounts reimbursed by the investment adviser or reductions from brokerage service arrangements or reductions from other expense offset arrangements and do not represent the amount paid by the class during periods when reimbursements or reductions occur. Expenses net of fee waivers reflect expenses after reimbursement by the investment adviser but prior to reductions from brokerage service arrangements or other expense offset arrangements. Expenses net of all reductions represent the net expenses paid by the class.
H Annualized
I Amount does not include the portfolio activity of any underlying Fidelity Central Funds.
See accompanying notes which are an integral part of the financial statements.
Financial Highlights — Fidelity Japan Fund Class C
| | Six months ended (Unaudited) April 30, | Years ended October 31, | | | | |
| | 2017 | 2016 | 2015 | 2014 | 2013 | 2012 |
| Selected Per–Share Data | | | | | | |
| Net asset value, beginning of period | $12.44 | $11.77 | $11.58 | $11.96 | $9.25 | $9.48 |
| Income from Investment Operations | | | | | | |
| Net investment income (loss)A | –B | (.02) | (.04) | (.03) | –B | .02 |
| Net realized and unrealized gain (loss) | .54 | .69 | .23 | (.32) | 2.79 | (.14) |
| Total from investment operations | .54 | .67 | .19 | (.35) | 2.79 | (.12) |
| Distributions from net investment income | – | – | – | (.03) | (.01) | (.06) |
| Distributions from net realized gain | – | – | – | (.01) | (.08) | (.05) |
| Total distributions | – | – | – | (.03)C | (.09) | (.11) |
| Redemption fees added to paid in capitalA | –B | –B | –B | –B | .01 | –B |
| Net asset value, end of period | $12.98 | $12.44 | $11.77 | $11.58 | $11.96 | $9.25 |
| Total ReturnD,E,F | 4.34% | 5.69% | 1.64% | (2.90)% | 30.55% | (1.27)% |
| Ratios to Average Net AssetsG,H | | | | | | |
| Expenses before reductions | 1.79%I | 1.81% | 1.81% | 1.93% | 1.97% | 2.15% |
| Expenses net of fee waivers, if any | 1.79%I | 1.81% | 1.81% | 1.93% | 1.97% | 2.11% |
| Expenses net of all reductions | 1.79%I | 1.81% | 1.80% | 1.93% | 1.95% | 2.09% |
| Net investment income (loss) | (.07)%I | (.21)% | (.34)% | (.29)% | .04% | .21% |
| Supplemental Data | | | | | | |
| Net assets, end of period (000 omitted) | $13,816 | $15,077 | $18,491 | $13,162 | $11,824 | $7,015 |
| Portfolio turnover rateJ | 32%I | 15% | 35% | 112% | 68% | 52% |
A Calculated based on average shares outstanding during the period.
B Amount represents less than $.005 per share.
C Total distributions of $.03 per share is comprised of distributions from net investment income of $.025 and distributions from net realized gain of $.009 per share.
D Total returns for periods of less than one year are not annualized.
E Total returns would have been lower if certain expenses had not been reduced during the applicable periods shown.
F Total returns do not include the effect of the contingent deferred sales charge.
G Fees and expenses of any underlying Fidelity Central Funds are not included in the Fund's expense ratio. The Fund indirectly bears its proportionate share of the expenses of any underlying Fidelity Central Funds.
H Expense ratios reflect operating expenses of the class. Expenses before reductions do not reflect amounts reimbursed by the investment adviser or reductions from brokerage service arrangements or reductions from other expense offset arrangements and do not represent the amount paid by the class during periods when reimbursements or reductions occur. Expenses net of fee waivers reflect expenses after reimbursement by the investment adviser but prior to reductions from brokerage service arrangements or other expense offset arrangements. Expenses net of all reductions represent the net expenses paid by the class.
I Annualized
J Amount does not include the portfolio activity of any underlying Fidelity Central Funds.
See accompanying notes which are an integral part of the financial statements.
Financial Highlights — Fidelity Japan Fund
| | Six months ended (Unaudited) April 30, | Years ended October 31, | | | | |
| | 2017 | 2016 | 2015 | 2014 | 2013 | 2012 |
| Selected Per–Share Data | | | | | | |
| Net asset value, beginning of period | $12.64 | $11.91 | $11.69 | $12.03 | $9.34 | $9.57 |
| Income from Investment Operations | | | | | | |
| Net investment income (loss)A | .06 | .09 | .08 | .09 | .12 | .12 |
| Net realized and unrealized gain (loss) | .55 | .72 | .23 | (.32) | 2.79 | (.14) |
| Total from investment operations | .61 | .81 | .31 | (.23) | 2.91 | (.02) |
| Distributions from net investment income | (.11) | (.07) | (.09) | (.11) | (.15) | (.16) |
| Distributions from net realized gain | (.03) | (.01) | – | (.01) | (.08) | (.05) |
| Total distributions | (.15)B | (.08) | (.09) | (.11)C | (.23) | (.21) |
| Redemption fees added to paid in capitalA | –D | –D | –D | –D | .01 | –D |
| Net asset value, end of period | $13.10 | $12.64 | $11.91 | $11.69 | $12.03 | $9.34 |
| Total ReturnE,F | 4.88% | 6.80% | 2.66% | (1.90)% | 31.92% | (.19)% |
| Ratios to Average Net AssetsG,H | | | | | | |
| Expenses before reductions | .80%I | .78% | .80% | .90% | .93% | 1.09% |
| Expenses net of fee waivers, if any | .80%I | .78% | .80% | .90% | .93% | 1.06% |
| Expenses net of all reductions | .79%I | .78% | .79% | .90% | .91% | 1.04% |
| Net investment income (loss) | .93%I | .81% | .67% | .74% | 1.08% | 1.26% |
| Supplemental Data | | | | | | |
| Net assets, end of period (000 omitted) | $221,495 | $352,936 | $485,803 | $415,612 | $480,773 | $353,550 |
| Portfolio turnover rateJ | 32%I | 15% | 35% | 112% | 68% | 52% |
A Calculated based on average shares outstanding during the period.
B Total distributions of $.15 per share is comprised of distributions from net investment income of $.112 and distributions from net realized gain of $.034 per share.
C Total distributions of $.11 per share is comprised of distributions from net investment income of $.105 and distributions from net realized gain of $.009 per share.
D Amount represents less than $.005 per share.
E Total returns for periods of less than one year are not annualized.
F Total returns would have been lower if certain expenses had not been reduced during the applicable periods shown.
G Fees and expenses of any underlying Fidelity Central Funds are not included in the Fund's expense ratio. The Fund indirectly bears its proportionate share of the expenses of any underlying Fidelity Central Funds.
H Expense ratios reflect operating expenses of the class. Expenses before reductions do not reflect amounts reimbursed by the investment adviser or reductions from brokerage service arrangements or reductions from other expense offset arrangements and do not represent the amount paid by the class during periods when reimbursements or reductions occur. Expenses net of fee waivers reflect expenses after reimbursement by the investment adviser but prior to reductions from brokerage service arrangements or other expense offset arrangements. Expenses net of all reductions represent the net expenses paid by the class.
I Annualized
J Amount does not include the portfolio activity of any underlying Fidelity Central Funds.
See accompanying notes which are an integral part of the financial statements.
Financial Highlights — Fidelity Japan Fund Class I
| | Six months ended (Unaudited) April 30, | Years ended October 31, | | | | |
| | 2017 | 2016 | 2015 | 2014 | 2013 | 2012 |
| Selected Per–Share Data | | | | | | |
| Net asset value, beginning of period | $12.62 | $11.89 | $11.67 | $12.02 | $9.33 | $9.57 |
| Income from Investment Operations | | | | | | |
| Net investment income (loss)A | .06 | .10 | .08 | .09 | .13 | .12 |
| Net realized and unrealized gain (loss) | .55 | .70 | .23 | (.32) | 2.78 | (.14) |
| Total from investment operations | .61 | .80 | .31 | (.23) | 2.91 | (.02) |
| Distributions from net investment income | (.11) | (.07) | (.09) | (.12) | (.15) | (.17) |
| Distributions from net realized gain | (.03) | (.01) | – | (.01) | (.08) | (.05) |
| Total distributions | (.14) | (.07)B | (.09) | (.12)C | (.23) | (.22) |
| Redemption fees added to paid in capitalA | –D | –D | –D | –D | .01 | –D |
| Net asset value, end of period | $13.09 | $12.62 | $11.89 | $11.67 | $12.02 | $9.33 |
| Total ReturnE,F | 4.95% | 6.77% | 2.72% | (1.90)% | 32.04% | (.18)% |
| Ratios to Average Net AssetsG,H | | | | | | |
| Expenses before reductions | .75%I | .77% | .80% | .89% | .90% | 1.03% |
| Expenses net of fee waivers, if any | .75%I | .77% | .80% | .89% | .90% | 1.01% |
| Expenses net of all reductions | .74%I | .76% | .79% | .89% | .88% | .99% |
| Net investment income (loss) | .98%I | .83% | .67% | .76% | 1.11% | 1.31% |
| Supplemental Data | | | | | | |
| Net assets, end of period (000 omitted) | $153,645 | $7,032 | $13,957 | $20,253 | $20,033 | $1,488 |
| Portfolio turnover rateJ | 32%I | 15% | 35% | 112% | 68% | 52% |
A Calculated based on average shares outstanding during the period.
B Total distributions of $.07 per share is comprised of distributions from net investment income of $.065 and distributions from net realized gain of $.006 per share.
C Total distributions of $.12 per share is comprised of distributions from net investment income of $.115 and distributions from net realized gain of $.009 per share.
D Amount represents less than $.005 per share.
E Total returns for periods of less than one year are not annualized.
F Total returns would have been lower if certain expenses had not been reduced during the applicable periods shown.
G Fees and expenses of any underlying Fidelity Central Funds are not included in the Fund's expense ratio. The Fund indirectly bears its proportionate share of the expenses of any underlying Fidelity Central Funds.
H Expense ratios reflect operating expenses of the class. Expenses before reductions do not reflect amounts reimbursed by the investment adviser or reductions from brokerage service arrangements or reductions from other expense offset arrangements and do not represent the amount paid by the class during periods when reimbursements or reductions occur. Expenses net of fee waivers reflect expenses after reimbursement by the investment adviser but prior to reductions from brokerage service arrangements or other expense offset arrangements. Expenses net of all reductions represent the net expenses paid by the class.
I Annualized
J Amount does not include the portfolio activity of any underlying Fidelity Central Funds.
See accompanying notes which are an integral part of the financial statements.
Notes to Financial Statements (Unaudited)
For the period ended April 30, 2017
1. Organization.
Fidelity Japan Fund (the Fund) is a fund of Fidelity Investment Trust (the Trust) and is authorized to issue an unlimited number of shares. The Trust is registered under the Investment Company Act of 1940, as amended (the 1940 Act), as an open-end management investment company organized as a Massachusetts business trust. The Fund offers Class A, Class M (formerly Class T), Class C, Japan and Class I shares, each of which has equal rights as to assets and voting privileges. Each class has exclusive voting rights with respect to matters that affect that class.
After the close of business on June 24, 2016, all outstanding Class B shares were converted to Class A shares. All prior fiscal period dollar and share amounts for Class B presented in the Notes to Financial Statements are for the period November 1, 2015 through June 24, 2016.
2. Investments in Fidelity Central Funds.
The Fund invests in Fidelity Central Funds, which are open-end investment companies generally available only to other investment companies and accounts managed by the investment adviser and its affiliates. The Fund's Schedule of Investments lists each of the Fidelity Central Funds held as of period end, if any, as an investment of the Fund, but does not include the underlying holdings of each Fidelity Central Fund. As an Investing Fund, the Fund indirectly bears its proportionate share of the expenses of the underlying Fidelity Central Funds.
The Money Market Central Funds seek preservation of capital and current income and are managed by Fidelity Investments Money Management, Inc. (FIMM), an affiliate of the investment adviser. Annualized expenses of the Money Market Central Funds as of their most recent shareholder report date are less than .005%.
A complete unaudited list of holdings for each Fidelity Central Fund is available upon request or at the Securities and Exchange Commission (the SEC) website at www.sec.gov. In addition, the financial statements of the Fidelity Central Funds are available on the SEC website or upon request.
3. Significant Accounting Policies.
The Fund is an investment company and applies the accounting and reporting guidance of the Financial Accounting Standards Board (FASB) Accounting Standards Codification Topic 946 Financial Services – Investments Companies. The financial statements have been prepared in conformity with accounting principles generally accepted in the United States of America (GAAP), which require management to make certain estimates and assumptions at the date of the financial statements. Actual results could differ from those estimates. Subsequent events, if any, through the date that the financial statements were issued have been evaluated in the preparation of the financial statements. The following summarizes the significant accounting policies of the Fund:
Investment Valuation. Investments are valued as of 4:00 p.m. Eastern time on the last calendar day of the period. The Board of Trustees (the Board) has delegated the day to day responsibility for the valuation of the Fund's investments to the Fair Value Committee (the Committee) established by the Fund's investment adviser. In accordance with valuation policies and procedures approved by the Board, the Fund attempts to obtain prices from one or more third party pricing vendors or brokers to value its investments. When current market prices, quotations or currency exchange rates are not readily available or reliable, investments will be fair valued in good faith by the Committee, in accordance with procedures adopted by the Board. Factors used in determining fair value vary by investment type and may include market or investment specific events. The frequency with which these procedures are used cannot be predicted and they may be utilized to a significant extent. The Committee oversees the Fund's valuation policies and procedures and reports to the Board on the Committee's activities and fair value determinations. The Board monitors the appropriateness of the procedures used in valuing the Fund's investments and ratifies the fair value determinations of the Committee.
The Fund categorizes the inputs to valuation techniques used to value its investments into a disclosure hierarchy consisting of three levels as shown below:
- Level 1 – quoted prices in active markets for identical investments
- Level 2 – other significant observable inputs (including quoted prices for similar investments, interest rates, prepayment speeds, etc.)
- Level 3 – unobservable inputs (including the Fund's own assumptions based on the best information available)
Valuation techniques used to value the Fund's investments by major category are as follows:
Equity securities, including restricted securities, for which market quotations are readily available, are valued at the last reported sale price or official closing price as reported by a third party pricing vendor on the primary market or exchange on which they are traded and are categorized as Level 1 in the hierarchy. In the event there were no sales during the day or closing prices are not available, securities are valued at the last quoted bid price or may be valued using the last available price and are generally categorized as Level 2 in the hierarchy. For foreign equity securities, when market or security specific events arise, comparisons to the valuation of American Depositary Receipts (ADRs), futures contracts, Exchange-Traded Funds (ETFs) and certain indexes as well as quoted prices for similar securities may be used and would be categorized as Level 2 in the hierarchy. Utilizing these techniques may result in transfers between Level 1 and Level 2. For equity securities, including restricted securities, where observable inputs are limited, assumptions about market activity and risk are used and these securities may be categorized as Level 3 in the hierarchy.
Investments in open-end mutual funds, including the Fidelity Central Funds, are valued at their closing net asset value (NAV) each business day and are categorized as Level 1 in the hierarchy.
Changes in valuation techniques may result in transfers in or out of an assigned level within the disclosure hierarchy. The aggregate value of investments by input level as of April 30, 2017 is included at the end of the Fund's Schedule of Investments.
Foreign Currency. The Fund may use foreign currency contracts to facilitate transactions in foreign-denominated securities. Gains and losses from these transactions may arise from changes in the value of the foreign currency or if the counterparties do not perform under the contracts' terms.
Foreign-denominated assets, including investment securities, and liabilities are translated into U.S. dollars at the exchange rates at period end. Purchases and sales of investment securities, income and dividends received and expenses denominated in foreign currencies are translated into U.S. dollars at the exchange rate in effect on the transaction date.
The effects of exchange rate fluctuations on investments are included with the net realized and unrealized gain (loss) on investment securities. Other foreign currency transactions resulting in realized and unrealized gain (loss) are disclosed separately.
Investment Transactions and Income. For financial reporting purposes, the Fund's investment holdings and NAV include trades executed through the end of the last business day of the period. The NAV per share for processing shareholder transactions is calculated as of the close of business of the New York Stock Exchange (NYSE), normally 4:00 p.m. Eastern time and includes trades executed through the end of the prior business day. Gains and losses on securities sold are determined on the basis of identified cost. Dividend income is recorded on the ex-dividend date, except for certain dividends from foreign securities where the ex-dividend date may have passed, which are recorded as soon as the Fund is informed of the ex-dividend date. Non-cash dividends included in dividend income, if any, are recorded at the fair market value of the securities received. Income and capital gain distributions from Fidelity Central Funds, if any, are recorded on the ex-dividend date. Investment income is recorded net of foreign taxes withheld where recovery of such taxes is uncertain.
Class Allocations and Expenses. Investment income, realized and unrealized capital gains and losses, common expenses of the Fund, and certain fund-level expense reductions, if any, are allocated daily on a pro-rata basis to each class based on the relative net assets of each class to the total net assets of the Fund. Each class differs with respect to transfer agent and distribution and service plan fees incurred. Certain expense reductions may also differ by class. For the reporting period, the allocated portion of income and expenses to each class as a percent of its average net assets may vary due to the timing of recording these transactions in relation to fluctuating net assets of the classes. Expenses directly attributable to a fund are charged to that fund. Expenses attributable to more than one fund are allocated among the respective funds on the basis of relative net assets or other appropriate methods. Expense estimates are accrued in the period to which they relate and adjustments are made when actual amounts are known.
Income Tax Information and Distributions to Shareholders. Each year, the Fund intends to qualify as a regulated investment company under Subchapter M of the Internal Revenue Code, including distributing substantially all of its taxable income and realized gains. As a result, no provision for U.S. Federal income taxes is required. The Fund files a U.S. federal tax return, in addition to state and local tax returns as required. The Fund's federal income tax returns are subject to examination by the Internal Revenue Service (IRS) for a period of three fiscal years after they are filed. State and local tax returns may be subject to examination for an additional fiscal year depending on the jurisdiction. Foreign taxes are provided for based on the Fund's understanding of the tax rules and rates that exist in the foreign markets in which it invests.
Distributions are declared and recorded on the ex-dividend date. Income dividends and capital gain distributions are declared separately for each class. Income and capital gain distributions are determined in accordance with income tax regulations, which may differ from GAAP.
Capital accounts within the financial statements are adjusted for permanent book-tax differences. These adjustments have no impact on net assets or the results of operations. Capital accounts are not adjusted for temporary book-tax differences which will reverse in a subsequent period.
Book-tax differences are primarily due to foreign currency transactions, passive foreign investment companies (PFIC), expiring capital loss carryforwards, partnerships, deferred trustee compensation, capital loss carryforwards and losses deferred due to wash sales.
The federal tax cost of investment securities and unrealized appreciation (depreciation) as of period end were as follows:
| Gross unrealized appreciation | $68,795,133 |
| Gross unrealized depreciation | (12,578,266) |
| Net unrealized appreciation (depreciation) on securities | $56,216,867 |
| Tax cost | $367,405,788 |
Capital loss carryforwards are only available to offset future capital gains of the Fund to the extent provided by regulations and may be limited. Under the Regulated Investment Company Modernization Act of 2010 (the Act), the Fund is permitted to carry forward capital losses incurred in taxable years beginning after December 22, 2010 for an unlimited period and such capital losses are required to be used prior to any losses that expire. The capital loss carryforward information presented below, including any applicable limitation, is estimated as of prior fiscal period end and is subject to adjustment.
| Fiscal year of expiration | |
| 2017 | $(41,604,069) |
| 2018 | (26,887,863) |
| 2019 | (98,806,037) |
| Total with expiration | (167,297,969) |
| No expiration | |
| Short-term | (10,932,314) |
| Long-term | (16,850,008) |
| Total no expiration | (27,782,322) |
| Total capital loss carryforward | $(195,080,291) |
Due to large redemptions in a prior period, $141,955,883 of capital losses that will be available to offset future capital gains of the Fund will be limited to approximately $18,885,324 per year.
The Fund acquired $1,617,303 of its capital loss carryforward as part of a merger in a prior period. The losses acquired that will be available to offset future capital gains of the Fund will be limited to approximately $1,371,973 per year.
Short-Term Trading (Redemption) Fees. Shares held by investors in the Fund less than 90 days may have been subject to a redemption fee equal to 1.50% of the NAV of shares redeemed. All redemption fees, which reduce the proceeds of the shareholder redemption, are retained by the Fund and accounted for as an addition to paid in capital.
4. Purchases and Sales of Investments.
Purchases and sales of securities, other than short-term securities, aggregated $63,843,359 and $68,772,267, respectively.
5. Fees and Other Transactions with Affiliates.
Management Fee. Fidelity Management & Research Company (the investment adviser) and its affiliates provide the Fund with investment management related services for which the Fund pays a monthly management fee. The management fee is the sum of an individual fund fee rate that is based on an annual rate of .45% of the Fund's average net assets and an annualized group fee rate that averaged .25% during the period. The group fee rate is based upon the average net assets of all the mutual funds advised by the investment adviser, including any mutual funds previously advised by the investment adviser that are currently advised by Fidelity SelectCo, LLC, an affiliate of the investment adviser. The group fee rate decreases as assets under management increase and increases as assets under management decrease. In addition, the management fee is subject to a performance adjustment (up to a maximum of +/- .20% of the Fund's average net assets over a 36 month performance period). The upward or downward adjustment to the management fee is based on the relative investment performance of Japan as compared to its benchmark index, the TOPIX, over the same 36 month performance period. For the reporting period, the total annualized management fee rate, including the performance adjustment, was .48% of the Fund's average net assets. The performance adjustment included in the management fee rate may be higher or lower than the maximum performance adjustment rate due to the difference between the average net assets for the reporting and performance periods.
Distribution and Service Plan Fees. In accordance with Rule 12b-1 of the 1940 Act, the Fund has adopted separate Distribution and Service Plans for each class of shares. Certain classes pay Fidelity Distributors Corporation (FDC), an affiliate of the investment adviser, separate Distribution and Service Fees, each of which is based on an annual percentage of each class' average net assets. In addition, FDC may pay financial intermediaries for selling shares of the Fund and providing shareholder support services. For the period, the Distribution and Service Fee rates, total fees and amounts retained by FDC were as follows:
| | Distribution
Fee | Service
Fee | Total Fees | Retained
by FDC |
| Class A | -% | .25% | $26,691 | $1,587 |
| Class M | .25% | .25% | 10,138 | 109 |
| Class C | .75% | .25% | 70,012 | 7,995 |
| | | | $106,841 | $9,691 |
Sales Load. FDC may receive a front-end sales charge of up to 5.75% for selling Class A shares and 3.50% for selling Class M shares, some of which is paid to financial intermediaries for selling shares of the Fund. Depending on the holding period, FDC may receive contingent deferred sales charges levied on Class A, Class M and Class C redemptions. The deferred sales charges are 1.00% for Class C shares, 1.00% for certain purchases of Class A shares and .25% for certain purchases of Class M shares.
For the period, sales charge amounts retained by FDC were as follows:
| | Retained
by FDC |
| Class A | $2,313 |
| Class M | 436 |
| Class C(a) | 600 |
| | $3,349 |
(a) When Class C shares are initially sold, FDC pays commissions from its own resources to financial intermediaries through which the sales are made.
Transfer Agent Fees. Fidelity Investments Institutional Operations Company, Inc., (FIIOC), an affiliate of the investment adviser, is the transfer, dividend disbursing and shareholder servicing agent for each class of the Fund. FIIOC receives account fees and asset-based fees that vary according to the account size and type of account of the shareholders of the respective classes of the Fund. FIIOC pays for typesetting, printing and mailing of shareholder reports, except proxy statements.
For the period, transfer agent fees for each class were as follows:
| | Amount | % of
Class-Level Average
Net Assets(a) |
| Class A | $25,262 | .24 |
| Class M | 6,877 | .34 |
| Class C | 13,881 | .20 |
| Japan | 344,879 | .20 |
| Class I | 21,343 | .15 |
| | $412,242 | |
(a) Annualized
Accounting and Security Lending Fees. Fidelity Service Company, Inc. (FSC), an affiliate of the investment adviser, maintains the Fund's accounting records. The accounting fee is based on the level of average net assets for each month. Under a separate contract, FSC administers the security lending program. The security lending fee is based on the number and duration of lending transactions.
Interfund Trades. The Fund may purchase from or sell securities to other Fidelity Funds under procedures adopted by the Board. The procedures have been designed to ensure these interfund trades are executed in accordance with Rule 17a-7 of the 1940 Act. Interfund trades are included within the respective purchases and sales amounts shown in the Purchases and Sales of Investments note.
6. Committed Line of Credit.
The Fund participates with other funds managed by the investment adviser or an affiliate in a $4.25 billion credit facility (the "line of credit") to be utilized for temporary or emergency purposes to fund shareholder redemptions or for other short-term liquidity purposes. The Fund has agreed to pay commitment fees on its pro-rata portion of the line of credit, which amounted to $686 and is reflected in Miscellaneous expenses on the Statement of Operations. During the period, the Fund did not borrow on this line of credit.
7. Security Lending.
The Fund lends portfolio securities through a lending agent from time to time in order to earn additional income. For equity securities, a lending agent is used and may loan securities to certain qualified borrowers, including Fidelity Capital Markets (FCM), a broker-dealer affiliated with the Fund. On the settlement date of the loan, the Fund receives collateral (in the form of U.S. Treasury obligations, letters of credit and/or cash) against the loaned securities and maintains collateral in an amount not less than 100% of the market value of the loaned securities during the period of the loan. The market value of the loaned securities is determined at the close of business of the Fund and any additional required collateral is delivered to the Fund on the next business day. The Fund or borrower may terminate the loan at any time, and if the borrower defaults on its obligation to return the securities loaned because of insolvency or other reasons, the Fund may apply collateral received from the borrower against the obligation. The Fund may experience delays and costs in recovering the securities loaned. Any cash collateral received is invested in the Fidelity Securities Lending Cash Central Fund. The value of loaned securities and cash collateral at period end are disclosed on the Fund's Statement of Assets and Liabilities. Security lending income represents the income earned on investing cash collateral, less rebates paid to borrowers and any lending agent fees associated with the loan, plus any premium payments received for lending certain types of securities. Security lending income is presented in the Statement of Operations as a component of income from Fidelity Central Funds. Total security lending income during the period amounted to $60,511. During the period, there were no securities loaned to FCM.
8. Expense Reductions.
Commissions paid to certain brokers with whom the investment adviser, or its affiliates, places trades on behalf of the Fund include an amount in addition to trade execution, which may be rebated back to the Fund to offset certain expenses. This amount totaled $11,557 for the period.
In addition, during the period the investment adviser reimbursed and/or waived a portion of fund-level operating expenses in the amount of $1,784.
9. Distributions to Shareholders.
Distributions to shareholders of each class were as follows:
| | Six months ended April 30, 2017 | Year ended October 31, 2016 |
| From net investment income | | |
| Class A | $104,209 | $121,415 |
| Class M | 3,257 | 822 |
| Japan | 3,209,793 | 2,828,514 |
| Class I | 51,808 | 76,342 |
| Total | $3,369,067 | $3,027,093 |
| From net realized gain | | |
| Class A | $59,052 | $14,867 |
| Class M | 11,074 | 2,466 |
| Japan | 974,401 | 245,958 |
| Class I | 16,013 | 7,047 |
| Total | $1,060,540 | $270,338 |
10. Share Transactions.
Share transactions for each class were as follows and may contain automatic conversions between classes or exchanges between affiliated funds:
| | Shares | Shares | Dollars | Dollars |
| | Six months ended
April 30, 2017 | Year ended October 31, 2016 | Six months ended
April 30, 2017 | Year ended October 31, 2016 |
| Class A | | | | |
| Shares sold | 90,851 | 813,081 | $1,138,031 | $9,592,333 |
| Reinvestment of distributions | 12,680 | 10,746 | 155,198 | 128,096 |
| Shares redeemed | (393,820) | (938,856) | (4,893,260) | (10,914,042) |
| Net increase (decrease) | (290,289) | (115,029) | $(3,600,031) | $(1,193,613) |
| Class M | | | | |
| Shares sold | 26,155 | 36,363 | $328,798 | $424,255 |
| Reinvestment of distributions | 1,137 | 269 | 13,940 | 3,216 |
| Shares redeemed | (41,317) | (108,870) | (515,437) | (1,266,529) |
| Net increase (decrease) | (14,025) | (72,238) | $(172,699) | $(839,058) |
| Class B | | | | |
| Shares sold | – | 1,967 | $– | $21,930 |
| Shares redeemed | – | (31,378) | – | (356,692) |
| Net increase (decrease) | – | (29,411) | $– | $(334,762) |
| Class C | | | | |
| Shares sold | 57,340 | 261,804 | $708,106 | $3,054,392 |
| Shares redeemed | (204,806) | (621,443) | (2,527,380) | (7,129,408) |
| Net increase (decrease) | (147,466) | (359,639) | $(1,819,274) | $(4,075,016) |
| Japan | | | | |
| Shares sold | 4,396,651 | 4,048,778 | $54,385,476 | $48,328,822 |
| Reinvestment of distributions | 332,957 | 251,274 | 4,075,396 | 3,000,214 |
| Shares redeemed | (15,738,057) | (17,176,238) | (197,795,472) | (197,588,759) |
| Net increase (decrease) | (11,008,449) | (12,876,186) | $(139,334,600) | $(146,259,723) |
| Class I | | | | |
| Shares sold | 11,564,746 | 323,014 | $145,383,208 | $3,826,994 |
| Reinvestment of distributions | 4,957 | 6,575 | 60,627 | 78,372 |
| Shares redeemed | (387,481) | (946,812) | (4,915,366) | (10,911,965) |
| Net increase (decrease) | 11,182,222 | (617,223) | $140,528,469 | $(7,006,599) |
11. Other.
The Fund's organizational documents provide former and current trustees and officers with a limited indemnification against liabilities arising in connection with the performance of their duties to the Fund. In the normal course of business, the Fund may also enter into contracts that provide general indemnifications. The Fund's maximum exposure under these arrangements is unknown as this would be dependent on future claims that may be made against the Fund. The risk of material loss from such claims is considered remote.
At the end of the period, Strategic Advisers International Fund and Strategic Advisers International II Fund were the owners of record of approximately 12% and 23%, respectively, of the total outstanding shares of the Fund. Mutual Funds managed by the investment adviser or its affiliates were the owners of record, in the aggregate, of approximately 51% of the total outstanding shares of the Fund.
Shareholder Expense Example
As a shareholder of the Fund, you incur two types of costs: (1) transaction costs, including sales charges (loads) on purchase payments or redemption proceeds, redemption fees and (2) ongoing costs, including management fees, distribution and/or service (12b-1) fees and other Fund expenses. This Example is intended to help you understand your ongoing costs (in dollars) of investing in the Fund and to compare these costs with the ongoing costs of investing in other mutual funds.
The Example is based on an investment of $1,000 invested at the beginning of the period and held for the entire period (November 1, 2016 to April 30, 2017).
Actual Expenses
The first line of the accompanying table for each class of the Fund provides information about actual account values and actual expenses. You may use the information in this line, together with the amount you invested, to estimate the expenses that you paid over the period. Simply divide your account value by $1,000.00 (for example, an $8,600 account value divided by $1,000.00 = 8.6), then multiply the result by the number in the first line for a class of the Fund under the heading entitled "Expenses Paid During Period" to estimate the expenses you paid on your account during this period. A small balance maintenance fee of $12.00 that is charged once a year may apply for certain accounts with a value of less than $2,000. This fee is not included in the table below. If it was, the estimate of expenses you paid during the period would be higher, and your ending account value lower, by this amount. In addition, the Fund, as a shareholder in the underlying Fidelity Central Funds, will indirectly bear its pro-rata share of the fees and expenses incurred by the underlying Fidelity Central Funds. These fees and expenses are not included in the Fund's annualized expense ratio used to calculate the expense estimate in the table below.
Hypothetical Example for Comparison Purposes
The second line of the accompanying table for each class of the Fund provides information about hypothetical account values and hypothetical expenses based on a Class' actual expense ratio and an assumed rate of return of 5% per year before expenses, which is not the Class' actual return. The hypothetical account values and expenses may not be used to estimate the actual ending account balance or expenses you paid for the period. You may use this information to compare the ongoing costs of investing in the Fund and other funds. To do so, compare this 5% hypothetical example with the 5% hypothetical examples that appear in the shareholder reports of the other funds. A small balance maintenance fee of $12.00 that is charged once a year may apply for certain accounts with a value of less than $2,000. This fee is not included in the table below. If it was, the estimate of expenses you paid during the period would be higher, and your ending account value lower, by this amount. In addition, the Fund, as a shareholder in the underlying Fidelity Central Funds, will indirectly bear its pro-rata share of the fees and expenses incurred by the underlying Fidelity Central Funds. These fees and expenses are not included in the Fund's annualized expense ratio used to calculate the expense estimate in the table below.
Please note that the expenses shown in the table are meant to highlight your ongoing costs only and do not reflect any transaction costs. Therefore, the second line of the table is useful in comparing ongoing costs only, and will not help you determine the relative total costs of owning different funds. In addition, if these transactional costs were included, your costs would have been higher.
| | Annualized Expense Ratio-A | Beginning
Account Value
November 1, 2016 | Ending
Account Value
April 30, 2017 | Expenses Paid
During Period-B
November 1, 2016
to April 30, 2017 |
| Class A | 1.08% | | | |
| Actual | | $1,000.00 | $1,046.90 | $5.48 |
| Hypothetical-C | | $1,000.00 | $1,019.44 | $5.41 |
| Class M | 1.43% | | | |
| Actual | | $1,000.00 | $1,045.10 | $7.25 |
| Hypothetical-C | | $1,000.00 | $1,017.70 | $7.15 |
| Class C | 1.79% | | | |
| Actual | | $1,000.00 | $1,043.40 | $9.07 |
| Hypothetical-C | | $1,000.00 | $1,015.92 | $8.95 |
| Japan | .80% | | | |
| Actual | | $1,000.00 | $1,048.80 | $4.06 |
| Hypothetical-C | | $1,000.00 | $1,020.83 | $4.01 |
| Class I | .75% | | | |
| Actual | | $1,000.00 | $1,049.50 | $3.81 |
| Hypothetical-C | | $1,000.00 | $1,021.08 | $3.76 |
A Annualized expense ratio reflects expenses net of applicable fee waivers.
B Expenses are equal to each Class' annualized expense ratio, multiplied by the average account value over the period, multiplied by 181/365 (to reflect the one-half year period).
C 5% return per year before expenses
AJPNA-SANN-0617
1.917401.106
Fidelity Advisor® International Small Cap Opportunities Fund -
Class A, Class M (formerly Class T), Class C and Class I
Semi-Annual Report April 30, 2017 Class A, Class M, Class C and Class I are classes of Fidelity® International Small Cap Opportunities Fund |
|
Contents
To view a fund's proxy voting guidelines and proxy voting record for the 12-month period ended June 30, visit http://www.fidelity.com/proxyvotingresults or visit the Securities and Exchange Commission's (SEC) web site at http://www.sec.gov.
You may also call 1-877-208-0098 to request a free copy of the proxy voting guidelines.
Standard & Poor's, S&P and S&P 500 are registered service marks of The McGraw-Hill Companies, Inc. and have been licensed for use by Fidelity Distributors Corporation.
Other third-party marks appearing herein are the property of their respective owners.
All other marks appearing herein are registered or unregistered trademarks or service marks of FMR LLC or an affiliated company. © 2017 FMR LLC. All rights reserved.
This report and the financial statements contained herein are submitted for the general information of the shareholders of the Fund. This report is not authorized for distribution to prospective investors in the Fund unless preceded or accompanied by an effective prospectus.
A fund files its complete schedule of portfolio holdings with the SEC for the first and third quarters of each fiscal year on Form N-Q. Forms N-Q are available on the SEC’s web site at http://www.sec.gov. A fund's Forms N-Q may be reviewed and copied at the SEC’s Public Reference Room in Washington, DC. Information regarding the operation of the SEC's Public Reference Room may be obtained by calling 1-800-SEC-0330.
For a complete list of a fund's portfolio holdings, view the most recent holdings listing, semiannual report, or annual report on Fidelity's web site at http://www.fidelity.com, http://www.institutional.fidelity.com, or http://www.401k.com, as applicable.
NOT FDIC INSURED •MAY LOSE VALUE •NO BANK GUARANTEE
Neither the Fund nor Fidelity Distributors Corporation is a bank.
Investment Summary (Unaudited)
Geographic Diversification (% of fund's net assets)
| As of April 30, 2017 |
| | Japan | 30.4% |
| | United Kingdom | 18.8% |
| | Germany | 6.8% |
| | Sweden | 5.5% |
| | United States of America * | 5.4% |
| | Italy | 3.4% |
| | Australia | 2.5% |
| | Spain | 2.4% |
| | France | 2.4% |
| | Other | 22.4% |

| As of October 31, 2016 |
| | Japan | 30.1% |
| | United Kingdom | 18.2% |
| | United States of America* | 8.5% |
| | Germany | 7.0% |
| | Sweden | 4.1% |
| | Italy | 3.2% |
| | Australia | 2.5% |
| | Netherlands | 2.4% |
| | France | 2.3% |
| | Other | 21.7% |

* Includes Short-Term Investments and Net Other Assets (Liabilities).
Percentages are based on country or territory of incorporation and are adjusted for the effect of futures contracts, if applicable.
Asset Allocation as of April 30, 2017
| | % of fund's net assets | % of fund's net assets 6 months ago |
| Stocks | 98.4 | 98.4 |
| Short-Term Investments and Net Other Assets (Liabilities) | 1.6 | 1.6 |
Top Ten Stocks as of April 30, 2017
| | % of fund's net assets | % of fund's net assets 6 months ago |
| Spirax-Sarco Engineering PLC (United Kingdom, Machinery) | 2.3 | 1.8 |
| Interpump Group SpA (Italy, Machinery) | 2.2 | 1.5 |
| CompuGroup Medical AG (Germany, Health Care Technology) | 2.1 | 2.0 |
| Sartorius AG (non-vtg.) (Germany, Health Care Equipment & Supplies) | 2.1 | 1.8 |
| Spectris PLC (United Kingdom, Electronic Equipment & Components) | 2.0 | 1.4 |
| Azbil Corp. (Japan, Electronic Equipment & Components) | 1.9 | 1.6 |
| Fagerhult AB (Sweden, Electrical Equipment) | 1.9 | 1.4 |
| BGFretail Co. Ltd. (Korea (South), Food & Staples Retailing) | 1.8 | 1.4 |
| OBIC Co. Ltd. (Japan, IT Services) | 1.8 | 1.7 |
| USS Co. Ltd. (Japan, Specialty Retail) | 1.7 | 2.2 |
| | 19.8 | |
Market Sectors as of April 30, 2017
| | % of fund's net assets | % of fund's net assets 6 months ago |
| Industrials | 23.6 | 20.9 |
| Consumer Discretionary | 15.0 | 19.4 |
| Health Care | 13.4 | 12.6 |
| Information Technology | 13.1 | 11.7 |
| Consumer Staples | 10.0 | 10.1 |
| Materials | 8.5 | 7.8 |
| Real Estate | 7.3 | 8.1 |
| Financials | 5.7 | 6.4 |
| Energy | 1.8 | 1.4 |
Investments April 30, 2017 (Unaudited)
Showing Percentage of Net Assets
| Common Stocks - 96.3% | | | |
| | | Shares | Value |
| Australia - 2.5% | | | |
| Adelaide Brighton Ltd. | | 802,063 | $3,555,462 |
| Beacon Lighting Group Ltd. | | 2,695,741 | 3,633,428 |
| DuluxGroup Ltd. | | 1,736,117 | 8,801,030 |
| Imdex Ltd. (a) | | 3,940,102 | 1,829,216 |
| Quintis Ltd. (b) | | 3,070,587 | 2,759,107 |
| RCG Corp. Ltd. (b) | | 6,879,148 | 4,275,418 |
|
| TOTAL AUSTRALIA | | | 24,853,661 |
|
| Austria - 1.7% | | | |
| Andritz AG | | 172,500 | 9,539,899 |
| Buwog-Gemeinnuetzige Wohnung | | 283,444 | 7,654,050 |
|
| TOTAL AUSTRIA | | | 17,193,949 |
|
| Bailiwick of Jersey - 0.4% | | | |
| Integrated Diagnostics Holdings PLC | | 1,483,779 | 4,466,175 |
| Belgium - 1.2% | | | |
| KBC Ancora (a) | | 257,848 | 12,262,951 |
| Bermuda - 0.6% | | | |
| Vostok New Ventures Ltd. (depositary receipt) (a) | | 707,589 | 5,512,249 |
| Canada - 1.7% | | | |
| McCoy Global, Inc. (a) | | 636,215 | 908,845 |
| New Look Vision Group, Inc. | | 207,200 | 4,325,995 |
| Pason Systems, Inc. | | 262,000 | 3,890,510 |
| PrairieSky Royalty Ltd. | | 107,800 | 2,349,401 |
| ShawCor Ltd. Class A | | 132,500 | 3,324,512 |
| Tesco Corp. (a) | | 274,047 | 1,795,008 |
|
| TOTAL CANADA | | | 16,594,271 |
|
| Cayman Islands - 0.3% | | | |
| 58.com, Inc. ADR (a) | | 87,900 | 3,479,082 |
| Denmark - 2.2% | | | |
| Jyske Bank A/S (Reg.) | | 183,127 | 9,786,262 |
| Scandinavian Tobacco Group A/S | | 264,149 | 4,611,220 |
| Spar Nord Bank A/S | | 651,369 | 7,383,438 |
|
| TOTAL DENMARK | | | 21,780,920 |
|
| Finland - 0.8% | | | |
| Tikkurila Oyj | | 382,646 | 7,586,056 |
| France - 2.4% | | | |
| Elis SA | | 414,962 | 8,588,344 |
| Laurent-Perrier Group SA | | 51,163 | 3,939,128 |
| Vetoquinol SA | | 101,184 | 5,557,279 |
| Virbac SA (a) | | 37,052 | 5,834,145 |
|
| TOTAL FRANCE | | | 23,918,896 |
|
| Germany - 4.7% | | | |
| CompuGroup Medical AG | | 424,478 | 20,899,752 |
| CTS Eventim AG | | 360,354 | 13,881,951 |
| Fielmann AG | | 68,873 | 5,265,139 |
| Nexus AG | | 281,358 | 6,773,280 |
|
| TOTAL GERMANY | | | 46,820,122 |
|
| India - 0.7% | | | |
| Jyothy Laboratories Ltd. | | 1,189,354 | 7,399,932 |
| Ireland - 1.7% | | | |
| FBD Holdings PLC (a) | | 240,328 | 2,133,583 |
| James Hardie Industries PLC CDI | | 894,067 | 15,177,052 |
|
| TOTAL IRELAND | | | 17,310,635 |
|
| Isle of Man - 0.9% | | | |
| Playtech Ltd. | | 743,143 | 9,230,555 |
| Israel - 2.3% | | | |
| Azrieli Group | | 96,505 | 5,139,934 |
| Ituran Location & Control Ltd. | | 300,908 | 9,418,420 |
| Strauss Group Ltd. | | 483,344 | 8,499,691 |
|
| TOTAL ISRAEL | | | 23,058,045 |
|
| Italy - 3.4% | | | |
| Azimut Holding SpA | | 427,797 | 8,350,707 |
| Beni Stabili SpA SIIQ | | 6,607,875 | 4,196,410 |
| Interpump Group SpA | | 823,043 | 21,830,767 |
|
| TOTAL ITALY | | | 34,377,884 |
|
| Japan - 30.4% | | | |
| Ai Holdings Corp. | | 202,400 | 4,978,523 |
| Aoki Super Co. Ltd. | | 318,000 | 3,936,667 |
| Artnature, Inc. | | 595,800 | 3,816,113 |
| Asahi Co. Ltd. | | 345,700 | 4,425,332 |
| Azbil Corp. | | 551,900 | 18,565,822 |
| Broadleaf Co. Ltd. | | 287,300 | 1,863,359 |
| Central Automotive Products Ltd. | | 134,000 | 1,388,383 |
| Century21 Real Estate Japan Ltd. | | 73,000 | 941,027 |
| Coca-Cola West Co. Ltd. | | 175,275 | 5,212,259 |
| Daiichikosho Co. Ltd. | | 222,300 | 9,641,808 |
| Daikokutenbussan Co. Ltd. | | 171,700 | 8,209,563 |
| Funai Soken Holdings, Inc. | | 235,700 | 4,528,992 |
| GCA Savvian Group Corp. | | 555,461 | 4,489,530 |
| Goldcrest Co. Ltd. | | 534,130 | 9,487,126 |
| Iwatsuka Confectionary Co. Ltd. | | 22,800 | 869,253 |
| Kobayashi Pharmaceutical Co. Ltd. | | 221,900 | 11,624,992 |
| Koshidaka Holdings Co. Ltd. | | 166,900 | 4,121,782 |
| Kusuri No Aoki Holdings Co. Ltd. | | 94,300 | 4,073,151 |
| Lasertec Corp. | | 702,272 | 9,141,033 |
| Medikit Co. Ltd. | | 96,100 | 4,000,036 |
| Miroku Jyoho Service Co., Ltd. | | 105,500 | 1,999,744 |
| Misumi Group, Inc. | | 481,400 | 9,116,263 |
| Nabtesco Corp. | | 191,300 | 5,422,812 |
| Nagaileben Co. Ltd. | | 500,800 | 11,536,707 |
| Nakano Refrigerators Co. Ltd. | | 146,500 | 4,021,440 |
| ND Software Co. Ltd. | | 91,682 | 828,202 |
| Nihon Parkerizing Co. Ltd. | | 1,243,000 | 15,956,340 |
| NS Tool Co. Ltd. (b) | | 71,200 | 1,025,127 |
| OBIC Co. Ltd. | | 336,500 | 18,172,057 |
| OSG Corp. (b) | | 745,200 | 15,341,861 |
| Paramount Bed Holdings Co. Ltd. | | 234,600 | 9,838,574 |
| ProNexus, Inc. | | 527,800 | 6,609,633 |
| San-Ai Oil Co. Ltd. | | 607,700 | 5,157,068 |
| SHO-BOND Holdings Co. Ltd. | | 238,700 | 10,920,565 |
| Shoei Co. Ltd. | | 309,926 | 8,604,808 |
| SK Kaken Co. Ltd. | | 83,000 | 7,892,353 |
| Software Service, Inc. | | 65,900 | 2,991,290 |
| Techno Medica Co. Ltd. | | 79,491 | 1,413,332 |
| The Monogatari Corp. | | 99,300 | 4,462,821 |
| TKC Corp. | | 247,400 | 6,724,575 |
| Tocalo Co. Ltd. | | 117,000 | 3,153,936 |
| USS Co. Ltd. | | 966,500 | 17,080,108 |
| Welcia Holdings Co. Ltd. | | 156,900 | 5,052,891 |
| Workman Co. Ltd. | | 229,500 | 6,711,550 |
| Yamada Consulting Group Co. Ltd. | | 135,700 | 6,220,471 |
| Yamato Kogyo Co. Ltd. | | 104,100 | 2,603,551 |
|
| TOTAL JAPAN | | | 304,172,830 |
|
| Korea (South) - 2.1% | | | |
| BGFretail Co. Ltd. | | 190,044 | 18,292,737 |
| Leeno Industrial, Inc. | | 63,110 | 2,363,296 |
|
| TOTAL KOREA (SOUTH) | | | 20,656,033 |
|
| Mexico - 0.4% | | | |
| Consorcio ARA S.A.B. de CV | | 11,546,078 | 3,851,708 |
| Netherlands - 2.2% | | | |
| Aalberts Industries NV | | 319,501 | 12,675,341 |
| Takeaway.com Holding BV (c) | | 74,887 | 2,522,281 |
| VastNed Retail NV | | 178,200 | 6,657,114 |
|
| TOTAL NETHERLANDS | | | 21,854,736 |
|
| Norway - 0.8% | | | |
| Kongsberg Gruppen ASA (b) | | 331,100 | 5,167,412 |
| Skandiabanken ASA | | 317,700 | 2,839,911 |
|
| TOTAL NORWAY | | | 8,007,323 |
|
| Philippines - 0.5% | | | |
| Jollibee Food Corp. | | 1,259,030 | 5,271,952 |
| South Africa - 0.9% | | | |
| Clicks Group Ltd. | | 884,913 | 8,888,364 |
| Spain - 2.4% | | | |
| Hispania Activos Inmobiliarios SA | | 366,631 | 5,535,284 |
| Merlin Properties Socimi SA | | 545,300 | 6,453,759 |
| Prosegur Compania de Seguridad SA (Reg.) | | 1,848,490 | 12,061,225 |
|
| TOTAL SPAIN | | | 24,050,268 |
|
| Sweden - 5.5% | | | |
| Addlife AB (a) | | 173,500 | 3,300,639 |
| AddTech AB (B Shares) | | 405,143 | 7,295,712 |
| Fagerhult AB | | 445,203 | 18,371,479 |
| Lagercrantz Group AB (B Shares) | | 617,207 | 6,741,871 |
| Loomis AB (B Shares) | | 224,700 | 8,156,103 |
| Saab AB (B Shares) | | 221,100 | 10,963,513 |
|
| TOTAL SWEDEN | | | 54,829,317 |
|
| Switzerland - 0.6% | | | |
| Tecan Group AG | | 34,420 | 5,873,885�� |
| Taiwan - 0.4% | | | |
| Addcn Technology Co. Ltd. | | 588,435 | 4,390,434 |
| United Kingdom - 18.8% | | | |
| Alliance Pharma PLC | | 4,548,400 | 2,798,267 |
| Avon Rubber PLC | | 93,200 | 1,266,276 |
| Berendsen PLC | | 1,079,163 | 11,726,971 |
| Dechra Pharmaceuticals PLC | | 617,609 | 13,518,769 |
| Domino's Pizza UK & IRL PLC | | 746,000 | 3,193,354 |
| DP Poland PLC (a)(d) | | 7,057,200 | 4,638,796 |
| Elementis PLC | | 3,059,010 | 12,052,495 |
| Great Portland Estates PLC | | 1,015,989 | 9,106,090 |
| Hilton Food Group PLC | | 263,272 | 2,623,917 |
| Howden Joinery Group PLC | | 1,695,300 | 10,166,334 |
| Informa PLC | | 1,684,956 | 14,010,719 |
| InterContinental Hotel Group PLC ADR (b) | | 109,975 | 5,805,580 |
| ITE Group PLC | | 3,080,234 | 7,061,449 |
| Just Eat Holding Ltd. (a) | | 608,770 | 4,549,523 |
| Rightmove PLC | | 182,147 | 9,875,477 |
| Shaftesbury PLC | | 974,573 | 11,764,328 |
| Spectris PLC | | 560,078 | 20,021,400 |
| Spirax-Sarco Engineering PLC | | 339,491 | 22,864,852 |
| Ted Baker PLC | | 26,142 | 946,362 |
| Topps Tiles PLC | | 3,398,615 | 4,566,957 |
| Ultra Electronics Holdings PLC | | 342,558 | 9,281,809 |
| Unite Group PLC | | 674,423 | 5,651,627 |
|
| TOTAL UNITED KINGDOM | | | 187,491,352 |
|
| United States of America - 3.8% | | | |
| Autoliv, Inc. (b) | | 52,200 | 5,229,918 |
| China Biologic Products, Inc. (a)(b) | | 72,780 | 8,588,040 |
| Domino's Pizza, Inc. | | 10,700 | 1,940,873 |
| Martin Marietta Materials, Inc. | | 24,820 | 5,465,116 |
| Mohawk Industries, Inc. (a) | | 18,300 | 4,296,657 |
| PriceSmart, Inc. | | 84,074 | 7,310,234 |
| ResMed, Inc. | | 75,095 | 5,105,709 |
|
| TOTAL UNITED STATES OF AMERICA | | | 37,936,547 |
|
| TOTAL COMMON STOCKS | | | |
| (Cost $812,073,795) | | | 963,120,132 |
|
| Nonconvertible Preferred Stocks - 2.1% | | | |
| Germany - 2.1% | | | |
| Sartorius AG (non-vtg.) | | | |
| (Cost $8,600,093) | | 223,080 | 20,426,668 |
|
| Money Market Funds - 2.4% | | | |
| Fidelity Cash Central Fund, 0.85% (e) | | 8,966,089 | 8,967,883 |
| Fidelity Securities Lending Cash Central Fund 0.86% (e)(f) | | 14,966,068 | 14,967,564 |
| TOTAL MONEY MARKET FUNDS | | | |
| (Cost $23,936,241) | | | 23,935,447 |
| TOTAL INVESTMENT PORTFOLIO - 100.8% | | | |
| (Cost $844,610,129) | | | 1,007,482,247 |
| NET OTHER ASSETS (LIABILITIES) - (0.8)% | | | (7,746,682) |
| NET ASSETS - 100% | | | $999,735,565 |
Categorizations in the Schedule of Investments are based on country or territory of incorporation.
Legend
(a) Non-income producing
(b) Security or a portion of the security is on loan at period end.
(c) Security exempt from registration under Rule 144A of the Securities Act of 1933. These securities may be resold in transactions exempt from registration, normally to qualified institutional buyers. At the end of the period, the value of these securities amounted to $2,522,281 or 0.3% of net assets.
(d) Affiliated company
(e) Affiliated fund that is generally available only to investment companies and other accounts managed by Fidelity Investments. The rate quoted is the annualized seven-day yield of the fund at period end. A complete unaudited listing of the fund's holdings as of its most recent quarter end is available upon request. In addition, each Fidelity Central Fund's financial statements are available on the SEC's website or upon request.
(f) Investment made with cash collateral received from securities on loan.
Affiliated Central Funds
Information regarding fiscal year to date income earned by the Fund from investments in Fidelity Central Funds is as follows:
| Fund | Income earned |
| Fidelity Cash Central Fund | $76,120 |
| Fidelity Securities Lending Cash Central Fund | 106,612 |
| Total | $182,732 |
Other Affiliated Issuers
An affiliated company is a company in which the Fund has ownership of at least 5% of the voting securities. Fiscal year to date transactions with companies which are or were affiliates are as follows:
| Affiliate | Value, beginning of period | Purchases | Sales Proceeds | Dividend Income | Value, end of period |
| DP Poland PLC | $5,450,276 | $64,232 | $907,568 | $-- | $4,638,796 |
| Total | $5,450,276 | $64,232 | $907,568 | $-- | $4,638,796 |
Investment Valuation
All investments are categorized as Level 1 under the Fair Value Hierarchy. The inputs or methodology used for valuing securities may not be an indication of the risk associated with investing in those securities. For more information on valuation inputs please refer to the Investment Valuation section in the accompanying Notes to Financial Statements.
See accompanying notes which are an integral part of the financial statements.
Financial Statements
Statement of Assets and Liabilities
| | | April 30, 2017 (Unaudited) |
| Assets | | |
Investment in securities, at value (including securities loaned of $14,172,150) — See accompanying schedule:
Unaffiliated issuers (cost $818,797,323) | $978,908,004 | |
| Fidelity Central Funds (cost $23,936,241) | 23,935,447 | |
| Other affiliated issuers (cost $1,876,565) | 4,638,796 | |
| Total Investments (cost $844,610,129) | | $1,007,482,247 |
| Receivable for investments sold | | 5,488,258 |
| Receivable for fund shares sold | | 1,189,162 |
| Dividends receivable | | 5,048,474 |
| Distributions receivable from Fidelity Central Funds | | 39,530 |
| Prepaid expenses | | 739 |
| Other receivables | | 14,652 |
| Total assets | | 1,019,263,062 |
| Liabilities | | |
| Payable for investments purchased | $2,364,536 | |
| Payable for fund shares redeemed | 1,182,921 | |
| Accrued management fee | 728,238 | |
| Distribution and service plan fees payable | 22,834 | |
| Other affiliated payables | 205,983 | |
| Other payables and accrued expenses | 56,049 | |
| Collateral on securities loaned | 14,966,936 | |
| Total liabilities | | 19,527,497 |
| Net Assets | | $999,735,565 |
| Net Assets consist of: | | |
| Paid in capital | | $1,013,074,959 |
| Undistributed net investment income | | 2,712,899 |
| Accumulated undistributed net realized gain (loss) on investments and foreign currency transactions | | (178,921,818) |
| Net unrealized appreciation (depreciation) on investments and assets and liabilities in foreign currencies | | 162,869,525 |
| Net Assets | | $999,735,565 |
| Calculation of Maximum Offering Price | | |
| Class A: | | |
| Net Asset Value and redemption price per share ($39,215,065 ÷ 2,382,078 shares) | | $16.46 |
| Maximum offering price per share (100/94.25 of $16.46) | | $17.46 |
| Class M: | | |
| Net Asset Value and redemption price per share ($12,067,399 ÷ 737,837 shares) | | $16.36 |
| Maximum offering price per share (100/96.50 of $16.36) | | $16.95 |
| Class C: | | |
| Net Asset Value and offering price per share ($12,536,393 ÷ 785,142 shares)(a) | | $15.97 |
| International Small Cap Opportunities: | | |
| Net Asset Value, offering price and redemption price per share ($804,353,447 ÷ 48,362,640 shares) | | $16.63 |
| Class I: | | |
| Net Asset Value, offering price and redemption price per share ($131,563,261 ÷ 7,920,155 shares) | | $16.61 |
(a) Redemption price per share is equal to net asset value less any applicable contingent deferred sales charge.
See accompanying notes which are an integral part of the financial statements.
Statement of Operations
| | | Six months ended April 30, 2017 (Unaudited) |
| Investment Income | | |
| Dividends | | $10,382,535 |
| Income from Fidelity Central Funds | | 182,732 |
| Income before foreign taxes withheld | | 10,565,267 |
| Less foreign taxes withheld | | (1,001,818) |
| Total income | | 9,563,449 |
| Expenses | | |
| Management fee | | |
| Basic fee | $4,127,157 | |
| Performance adjustment | 74,067 | |
| Transfer agent fees | 998,611 | |
| Distribution and service plan fees | 140,161 | |
| Accounting and security lending fees | 229,336 | |
| Custodian fees and expenses | 84,070 | |
| Independent trustees' fees and expenses | 2,011 | |
| Registration fees | 42,545 | |
| Audit | 38,720 | |
| Legal | 1,533 | |
| Interest | 2,066 | |
| Miscellaneous | 5,741 | |
| Total expenses before reductions | 5,746,018 | |
| Expense reductions | (21,960) | 5,724,058 |
| Net investment income (loss) | | 3,839,391 |
| Realized and Unrealized Gain (Loss) | | |
| Net realized gain (loss) on: | | |
| Investment securities: | | |
| Unaffiliated issuers | 30,961,072 | |
| Fidelity Central Funds | (904) | |
| Other affiliated issuers | 599,349 | |
| Foreign currency transactions | (136,477) | |
| Total net realized gain (loss) | | 31,423,040 |
Change in net unrealized appreciation (depreciation) on:
Investment securities | 77,011,792 | |
| Assets and liabilities in foreign currencies | 123,402 | |
| Total change in net unrealized appreciation (depreciation) | | 77,135,194 |
| Net gain (loss) | | 108,558,234 |
| Net increase (decrease) in net assets resulting from operations | | $112,397,625 |
See accompanying notes which are an integral part of the financial statements.
Statement of Changes in Net Assets
| | Six months ended April 30, 2017 (Unaudited) | Year ended October 31, 2016 |
| Increase (Decrease) in Net Assets | | |
| Operations | | |
| Net investment income (loss) | $3,839,391 | $9,502,103 |
| Net realized gain (loss) | 31,423,040 | 53,842,316 |
| Change in net unrealized appreciation (depreciation) | 77,135,194 | (43,765,071) |
| Net increase (decrease) in net assets resulting from operations | 112,397,625 | 19,579,348 |
| Distributions to shareholders from net investment income | (10,623,894) | (4,852,691) |
| Distributions to shareholders from net realized gain | (2,566,471) | (4,655,673) |
| Total distributions | (13,190,365) | (9,508,364) |
| Share transactions - net increase (decrease) | (135,200,456) | 68,430,907 |
| Redemption fees | 141,153 | 241,368 |
| Total increase (decrease) in net assets | (35,852,043) | 78,743,259 |
| Net Assets | | |
| Beginning of period | 1,035,587,608 | 956,844,349 |
| End of period | $999,735,565 | $1,035,587,608 |
| Other Information | | |
| Undistributed net investment income end of period | $2,712,899 | $9,497,402 |
See accompanying notes which are an integral part of the financial statements.
Financial Highlights — Fidelity International Small Cap Opportunities Fund Class A
| | Six months ended (Unaudited) April 30, | Years ended October 31, | | | | |
| | 2017 | 2016 | 2015 | 2014 | 2013 | 2012 |
| Selected Per–Share Data | | | | | | |
| Net asset value, beginning of period | $14.82 | $14.75 | $13.65 | $13.68 | $10.78 | $9.75 |
| Income from Investment Operations | | | | | | |
| Net investment income (loss)A | .04 | .09 | .06 | .05 | .07 | .08 |
| Net realized and unrealized gain (loss) | 1.76 | .10 | 1.11 | .05 | 2.91 | 1.07 |
| Total from investment operations | 1.80 | .19 | 1.17 | .10 | 2.98 | 1.15 |
| Distributions from net investment income | (.12) | (.05) | (.05) | (.06) | (.08) | (.11) |
| Distributions from net realized gain | (.04) | (.07) | (.02) | (.08) | (.01) | (.01) |
| Total distributions | (.16) | (.12) | (.07) | (.13)B | (.08)C | (.12) |
| Redemption fees added to paid in capitalA,D | – | – | – | – | – | – |
| Net asset value, end of period | $16.46 | $14.82 | $14.75 | $13.65 | $13.68 | $10.78 |
| Total ReturnE,F,G | 12.29% | 1.30% | 8.62% | .78% | 27.85% | 12.00% |
| Ratios to Average Net AssetsH,I | | | | | | |
| Expenses before reductions | 1.44%J | 1.45% | 1.52% | 1.63% | 1.70% | 1.75% |
| Expenses net of fee waivers, if any | 1.44%J | 1.45% | 1.52% | 1.63% | 1.65% | 1.65% |
| Expenses net of all reductions | 1.44%J | 1.45% | 1.51% | 1.63% | 1.64% | 1.64% |
| Net investment income (loss) | .52%J | .62% | .38% | .33% | .59% | .85% |
| Supplemental Data | | | | | | |
| Net assets, end of period (000 omitted) | $39,215 | $45,151 | $42,289 | $25,041 | $22,052 | $18,194 |
| Portfolio turnover rateK | 12%J | 24% | 21% | 18% | 31% | 28% |
A Calculated based on average shares outstanding during the period.
B Total distributions of $.13 per share is comprised of distributions from net investment income of $.055 and net realized gain of $.079 per share.
C Total distributions of $.08 per share is comprised of distributions from net investment income of $.077 and distributions from net realized gain of $.005 per share.
D Amount represents less than $.005 per share.
E Total returns for periods of less than one year are not annualized.
F Total returns would have been lower if certain expenses had not been reduced during the applicable periods shown.
G Total returns do not include the effect of the sales charges.
H Fees and expenses of any underlying Fidelity Central Funds are not included in the Fund's expense ratio. The Fund indirectly bears its proportionate share of the expenses of any underlying Fidelity Central Funds.
I Expense ratios reflect operating expenses of the class. Expenses before reductions do not reflect amounts reimbursed by the investment adviser or reductions from brokerage service arrangements or reductions from other expense offset arrangements and do not represent the amount paid by the class during periods when reimbursements or reductions occur. Expenses net of fee waivers reflect expenses after reimbursement by the investment adviser but prior to reductions from brokerage service arrangements or other expense offset arrangements. Expenses net of all reductions represent the net expenses paid by the class.
J Annualized
K Amount does not include the portfolio activity of any underlying Fidelity Central Funds.
See accompanying notes which are an integral part of the financial statements.
Financial Highlights — Fidelity International Small Cap Opportunities Fund Class M
| | Six months ended (Unaudited) April 30, | Years ended October 31, | | | | |
| | 2017 | 2016 | 2015 | 2014 | 2013 | 2012 |
| Selected Per–Share Data | | | | | | |
| Net asset value, beginning of period | $14.68 | $14.62 | $13.53 | $13.56 | $10.69 | $9.66 |
| Income from Investment Operations | | | | | | |
| Net investment income (loss)A | .02 | .04 | .01 | .01 | .04 | .06 |
| Net realized and unrealized gain (loss) | 1.76 | .10 | 1.11 | .06 | 2.89 | 1.06 |
| Total from investment operations | 1.78 | .14 | 1.12 | .07 | 2.93 | 1.12 |
| Distributions from net investment income | (.06) | (.01) | (.01) | (.02) | (.05) | (.08) |
| Distributions from net realized gain | (.04) | (.07) | (.02) | (.08) | (.01) | (.01) |
| Total distributions | (.10) | (.08) | (.03) | (.10) | (.06) | (.09) |
| Redemption fees added to paid in capitalA,B | – | – | – | – | – | – |
| Net asset value, end of period | $16.36 | $14.68 | $14.62 | $13.53 | $13.56 | $10.69 |
| Total ReturnC,D,E | 12.19% | .95% | 8.27% | .55% | 27.53% | 11.72% |
| Ratios to Average Net AssetsF,G | | | | | | |
| Expenses before reductions | 1.75%H | 1.77% | 1.80% | 1.89% | 1.96% | 2.02% |
| Expenses net of fee waivers, if any | 1.75%H | 1.77% | 1.80% | 1.89% | 1.90% | 1.90% |
| Expenses net of all reductions | 1.75%H | 1.77% | 1.80% | 1.89% | 1.89% | 1.89% |
| Net investment income (loss) | .21%H | .30% | .10% | .07% | .34% | .60% |
| Supplemental Data | | | | | | |
| Net assets, end of period (000 omitted) | $12,067 | $12,308 | $13,296 | $9,913 | $9,634 | $8,169 |
| Portfolio turnover rateI | 12%H | 24% | 21% | 18% | 31% | 28% |
A Calculated based on average shares outstanding during the period.
B Amount represents less than $.005 per share.
C Total returns for periods of less than one year are not annualized.
D Total returns would have been lower if certain expenses had not been reduced during the applicable periods shown.
E Total returns do not include the effect of the sales charges.
F Fees and expenses of any underlying Fidelity Central Funds are not included in the Fund's expense ratio. The Fund indirectly bears its proportionate share of the expenses of any underlying Fidelity Central Funds.
G Expense ratios reflect operating expenses of the class. Expenses before reductions do not reflect amounts reimbursed by the investment adviser or reductions from brokerage service arrangements or reductions from other expense offset arrangements and do not represent the amount paid by the class during periods when reimbursements or reductions occur. Expenses net of fee waivers reflect expenses after reimbursement by the investment adviser but prior to reductions from brokerage service arrangements or other expense offset arrangements. Expenses net of all reductions represent the net expenses paid by the class.
H Annualized
I Amount does not include the portfolio activity of any underlying Fidelity Central Funds.
See accompanying notes which are an integral part of the financial statements.
Financial Highlights — Fidelity International Small Cap Opportunities Fund Class C
| | Six months ended (Unaudited) April 30, | Years ended October 31, | | | | |
| | 2017 | 2016 | 2015 | 2014 | 2013 | 2012 |
| Selected Per–Share Data | | | | | | |
| Net asset value, beginning of period | $14.27 | $14.26 | $13.23 | $13.28 | $10.48 | $9.47 |
| Income from Investment Operations | | | | | | |
| Net investment income (loss)A | (.02) | (.03) | (.05) | (.06) | (.02) | .01 |
| Net realized and unrealized gain (loss) | 1.72 | .09 | 1.08 | .06 | 2.84 | 1.04 |
| Total from investment operations | 1.70 | .06 | 1.03 | – | 2.82 | 1.05 |
| Distributions from net investment income | – | – | – | – | (.01) | (.03) |
| Distributions from net realized gain | – | (.05) | – | (.05) | (.01) | (.01) |
| Total distributions | – | (.05) | – | (.05) | (.02) | (.04) |
| Redemption fees added to paid in capitalA,B | – | – | – | – | – | – |
| Net asset value, end of period | $15.97 | $14.27 | $14.26 | $13.23 | $13.28 | $10.48 |
| Total ReturnC,D,E | 11.91% | .44% | 7.79% | .03% | 26.91% | 11.13% |
| Ratios to Average Net AssetsF,G | | | | | | |
| Expenses before reductions | 2.24%H | 2.26% | 2.27% | 2.38% | 2.45% | 2.50% |
| Expenses net of fee waivers, if any | 2.23%H | 2.26% | 2.27% | 2.38% | 2.40% | 2.40% |
| Expenses net of all reductions | 2.23%H | 2.25% | 2.26% | 2.38% | 2.39% | 2.39% |
| Net investment income (loss) | (.27)%H | (.19)% | (.36)% | (.42)% | (.16)% | .10% |
| Supplemental Data | | | | | | |
| Net assets, end of period (000 omitted) | $12,536 | $12,625 | $17,370 | $8,438 | $8,070 | $6,608 |
| Portfolio turnover rateI | 12%H | 24% | 21% | 18% | 31% | 28% |
A Calculated based on average shares outstanding during the period.
B Amount represents less than $.005 per share.
C Total returns for periods of less than one year are not annualized.
D Total returns would have been lower if certain expenses had not been reduced during the applicable periods shown.
E Total returns do not include the effect of the contingent deferred sales charge.
F Fees and expenses of any underlying Fidelity Central Funds are not included in the Fund's expense ratio. The Fund indirectly bears its proportionate share of the expenses of any underlying Fidelity Central Funds.
G Expense ratios reflect operating expenses of the class. Expenses before reductions do not reflect amounts reimbursed by the investment adviser or reductions from brokerage service arrangements or reductions from other expense offset arrangements and do not represent the amount paid by the class during periods when reimbursements or reductions occur. Expenses net of fee waivers reflect expenses after reimbursement by the investment adviser but prior to reductions from brokerage service arrangements or other expense offset arrangements. Expenses net of all reductions represent the net expenses paid by the class.
H Annualized
I Amount does not include the portfolio activity of any underlying Fidelity Central Funds.
See accompanying notes which are an integral part of the financial statements.
Financial Highlights — Fidelity International Small Cap Opportunities Fund
| | Six months ended (Unaudited) April 30, | Years ended October 31, | | | | |
| | 2017 | 2016 | 2015 | 2014 | 2013 | 2012 |
| Selected Per–Share Data | | | | | | |
| Net asset value, beginning of period | $15.00 | $14.91 | $13.80 | $13.82 | $10.88 | $9.85 |
| Income from Investment Operations | | | | | | |
| Net investment income (loss)A | .06 | .13 | .10 | .09 | .10 | .11 |
| Net realized and unrealized gain (loss) | 1.78 | .11 | 1.12 | .06 | 2.95 | 1.07 |
| Total from investment operations | 1.84 | .24 | 1.22 | .15 | 3.05 | 1.18 |
| Distributions from net investment income | (.17) | (.08) | (.09) | (.09) | (.10) | (.14) |
| Distributions from net realized gain | (.04) | (.07) | (.02) | (.08) | (.01) | (.01) |
| Total distributions | (.21) | (.15) | (.11) | (.17) | (.11) | (.15) |
| Redemption fees added to paid in capitalA,B | – | – | – | – | – | – |
| Net asset value, end of period | $16.63 | $15.00 | $14.91 | $13.80 | $13.82 | $10.88 |
| Total ReturnC,D | 12.46% | 1.58% | 8.92% | 1.11% | 28.24% | 12.21% |
| Ratios to Average Net AssetsE,F | | | | | | |
| Expenses before reductions | 1.14%G | 1.17% | 1.23% | 1.30% | 1.39% | 1.47% |
| Expenses net of fee waivers, if any | 1.14%G | 1.17% | 1.22% | 1.30% | 1.39% | 1.40% |
| Expenses net of all reductions | 1.14%G | 1.16% | 1.22% | 1.30% | 1.38% | 1.39% |
| Net investment income (loss) | .82%G | .90% | .68% | .65% | .85% | 1.10% |
| Supplemental Data | | | | | | |
| Net assets, end of period (000 omitted) | $804,353 | $809,952 | $762,563 | $584,253 | $518,121 | $334,918 |
| Portfolio turnover rateH | 12%G | 24% | 21% | 18% | 31% | 28% |
A Calculated based on average shares outstanding during the period.
B Amount represents less than $.005 per share.
C Total returns for periods of less than one year are not annualized.
D Total returns would have been lower if certain expenses had not been reduced during the applicable periods shown.
E Fees and expenses of any underlying Fidelity Central Funds are not included in the Fund's expense ratio. The Fund indirectly bears its proportionate share of the expenses of any underlying Fidelity Central Funds.
F Expense ratios reflect operating expenses of the class. Expenses before reductions do not reflect amounts reimbursed by the investment adviser or reductions from brokerage service arrangements or reductions from other expense offset arrangements and do not represent the amount paid by the class during periods when reimbursements or reductions occur. Expenses net of fee waivers reflect expenses after reimbursement by the investment adviser but prior to reductions from brokerage service arrangements or other expense offset arrangements. Expenses net of all reductions represent the net expenses paid by the class.
G Annualized
H Amount does not include the portfolio activity of any underlying Fidelity Central Funds.
See accompanying notes which are an integral part of the financial statements.
Financial Highlights — Fidelity International Small Cap Opportunities Fund Class I
| | Six months ended (Unaudited) April 30, | Years ended October 31, | | | | |
| | 2017 | 2016 | 2015 | 2014 | 2013 | 2012 |
| Selected Per–Share Data | | | | | | |
| Net asset value, beginning of period | $14.99 | $14.91 | $13.81 | $13.83 | $10.90 | $9.86 |
| Income from Investment Operations | | | | | | |
| Net investment income (loss)A | .06 | .13 | .10 | .08 | .11 | .11 |
| Net realized and unrealized gain (loss) | 1.78 | .10 | 1.13 | .07 | 2.93 | 1.08 |
| Total from investment operations | 1.84 | .23 | 1.23 | .15 | 3.04 | 1.19 |
| Distributions from net investment income | (.18) | (.08) | (.11) | (.09) | (.10) | (.14) |
| Distributions from net realized gain | (.04) | (.07) | (.02) | (.08) | (.01) | (.01) |
| Total distributions | (.22) | (.15) | (.13) | (.17) | (.11) | (.15) |
| Redemption fees added to paid in capitalA,B | – | – | – | – | – | – |
| Net asset value, end of period | $16.61 | $14.99 | $14.91 | $13.81 | $13.83 | $10.90 |
| Total ReturnC,D | 12.46% | 1.56% | 8.98% | 1.11% | 28.11% | 12.32% |
| Ratios to Average Net AssetsE,F | | | | | | |
| Expenses before reductions | 1.15%G | 1.16% | 1.19% | 1.36% | 1.38% | 1.44% |
| Expenses net of fee waivers, if any | 1.15%G | 1.16% | 1.19% | 1.36% | 1.37% | 1.40% |
| Expenses net of all reductions | 1.15%G | 1.16% | 1.18% | 1.36% | 1.37% | 1.39% |
| Net investment income (loss) | .81%G | .91% | .71% | .60% | .87% | 1.10% |
| Supplemental Data | | | | | | |
| Net assets, end of period (000 omitted) | $131,563 | $155,551 | $120,723 | $29,822 | $5,670 | $4,591 |
| Portfolio turnover rateH | 12%G | 24% | 21% | 18% | 31% | 28% |
A Calculated based on average shares outstanding during the period.
B Amount represents less than $.005 per share.
C Total returns for periods of less than one year are not annualized.
D Total returns would have been lower if certain expenses had not been reduced during the applicable periods shown.
E Fees and expenses of any underlying Fidelity Central Funds are not included in the Fund's expense ratio. The Fund indirectly bears its proportionate share of the expenses of any underlying Fidelity Central Funds.
F Expense ratios reflect operating expenses of the class. Expenses before reductions do not reflect amounts reimbursed by the investment adviser or reductions from brokerage service arrangements or reductions from other expense offset arrangements and do not represent the amount paid by the class during periods when reimbursements or reductions occur. Expenses net of fee waivers reflect expenses after reimbursement by the investment adviser but prior to reductions from brokerage service arrangements or other expense offset arrangements. Expenses net of all reductions represent the net expenses paid by the class.
G Annualized
H Amount does not include the portfolio activity of any underlying Fidelity Central Funds.
See accompanying notes which are an integral part of the financial statements.
Notes to Financial Statements (Unaudited)
For the period ended April 30, 2017
1. Organization.
Fidelity International Small Cap Opportunities Fund (the Fund) is a fund of Fidelity Investment Trust (the Trust) and is authorized to issue an unlimited number of shares. The Trust is registered under the Investment Company Act of 1940, as amended (the 1940 Act), as an open-end management investment company organized as a Massachusetts business trust. The Fund offers Class A, Class M (formerly Class T), Class C, International Small Cap Opportunities and Class I, each of which has equal rights as to assets and voting privileges. Each class has exclusive voting rights with respect to matters that affect that class.
After the close of business on June 24, 2016, all outstanding Class B shares were converted to Class A shares. All prior fiscal period dollar and share amounts for Class B presented in the Notes to Financial Statements are for the period November 1, 2015 through June 24, 2016.
2. Investments in Fidelity Central Funds.
The Fund invests in Fidelity Central Funds, which are open-end investment companies generally available only to other investment companies and accounts managed by the investment adviser and its affiliates. The Fund's Schedule of Investments lists each of the Fidelity Central Funds held as of period end, if any, as an investment of the Fund, but does not include the underlying holdings of each Fidelity Central Fund. As an Investing Fund, the Fund indirectly bears its proportionate share of the expenses of the underlying Fidelity Central Funds.
The Money Market Central Funds seek preservation of capital and current income and are managed by Fidelity Investments Money Management, Inc. (FIMM), an affiliate of the investment adviser. Annualized expenses of the Money Market Central Funds as of their most recent shareholder report date are less than .005%.
A complete unaudited list of holdings for each Fidelity Central Fund is available upon request or at the Securities and Exchange Commission (the SEC) website at www.sec.gov. In addition, the financial statements of the Fidelity Central Funds are available on the SEC website or upon request.
3. Significant Accounting Policies.
The Fund is an investment company and applies the accounting and reporting guidance of the Financial Accounting Standards Board (FASB) Accounting Standards Codification Topic 946 Financial Services – Investments Companies. The financial statements have been prepared in conformity with accounting principles generally accepted in the United States of America (GAAP), which require management to make certain estimates and assumptions at the date of the financial statements. Actual results could differ from those estimates. Subsequent events, if any, through the date that the financial statements were issued have been evaluated in the preparation of the financial statements. The following summarizes the significant accounting policies of the Fund:
Investment Valuation. Investments are valued as of 4:00 p.m. Eastern time on the last calendar day of the period. The Board of Trustees (the Board) has delegated the day to day responsibility for the valuation of the Fund's investments to the Fair Value Committee (the Committee) established by the Fund's investment adviser. In accordance with valuation policies and procedures approved by the Board, the Fund attempts to obtain prices from one or more third party pricing vendors or brokers to value its investments. When current market prices, quotations or currency exchange rates are not readily available or reliable, investments will be fair valued in good faith by the Committee, in accordance with procedures adopted by the Board. Factors used in determining fair value vary by investment type and may include market or investment specific events. The frequency with which these procedures are used cannot be predicted and they may be utilized to a significant extent. The Committee oversees the Fund's valuation policies and procedures and reports to the Board on the Committee's activities and fair value determinations. The Board monitors the appropriateness of the procedures used in valuing the Fund's investments and ratifies the fair value determinations of the Committee.
The Fund categorizes the inputs to valuation techniques used to value its investments into a disclosure hierarchy consisting of three levels as shown below:
- Level 1 – quoted prices in active markets for identical investments
- Level 2 – other significant observable inputs (including quoted prices for similar investments, interest rates, prepayment speeds, etc.)
- Level 3 – unobservable inputs (including the Fund's own assumptions based on the best information available)
Valuation techniques used to value the Fund's investments by major category are as follows:
Equity securities, including restricted securities, for which market quotations are readily available, are valued at the last reported sale price or official closing price as reported by a third party pricing vendor on the primary market or exchange on which they are traded and are categorized as Level 1 in the hierarchy. In the event there were no sales during the day or closing prices are not available, securities are valued at the last quoted bid price or may be valued using the last available price and are generally categorized as Level 2 in the hierarchy. For foreign equity securities, when market or security specific events arise, comparisons to the valuation of American Depositary Receipts (ADRs), futures contracts, Exchange-Traded Funds (ETFs) and certain indexes as well as quoted prices for similar securities may be used and would be categorized as Level 2 in the hierarchy. Utilizing these techniques may result in transfers between Level 1 and Level 2. For equity securities, including restricted securities, where observable inputs are limited, assumptions about market activity and risk are used and these securities may be categorized as Level 3 in the hierarchy.
Investments in open-end mutual funds, including the Fidelity Central Funds, are valued at their closing net asset value (NAV) each business day and are categorized as Level 1 in the hierarchy.
Changes in valuation techniques may result in transfers in or out of an assigned level within the disclosure hierarchy. The aggregate value of investments by input level as of April 30, 2017, is included at the end of the Fund's Schedule of Investments.
Foreign Currency. The Fund may use foreign currency contracts to facilitate transactions in foreign-denominated securities. Gains and losses from these transactions may arise from changes in the value of the foreign currency or if the counterparties do not perform under the contracts' terms.
Foreign-denominated assets, including investment securities, and liabilities are translated into U.S. dollars at the exchange rates at period end. Purchases and sales of investment securities, income and dividends received and expenses denominated in foreign currencies are translated into U.S. dollars at the exchange rate in effect on the transaction date.
The effects of exchange rate fluctuations on investments are included with the net realized and unrealized gain (loss) on investment securities. Other foreign currency transactions resulting in realized and unrealized gain (loss) are disclosed separately.
Investment Transactions and Income. For financial reporting purposes, the Fund's investment holdings and NAV include trades executed through the end of the last business day of the period. The NAV per share for processing shareholder transactions is calculated as of the close of business of the New York Stock Exchange (NYSE), normally 4:00 p.m. Eastern time and includes trades executed through the end of the prior business day. Gains and losses on securities sold are determined on the basis of identified cost. Dividend income is recorded on the ex-dividend date, except for certain dividends from foreign securities where the ex-dividend date may have passed, which are recorded as soon as the Fund is informed of the ex-dividend date. Non-cash dividends included in dividend income, if any, are recorded at the fair market value of the securities received. Income and capital gain distributions from Fidelity Central Funds, if any, are recorded on the ex-dividend date. Certain distributions received by the Fund represent a return of capital or capital gain. The Fund determines the components of these distributions subsequent to the ex-dividend date, based upon receipt of tax filings or other correspondence relating to the underlying investment. These distributions are recorded as a reduction of cost of investments and/or as a realized gain. Investment income is recorded net of foreign taxes withheld where recovery of such taxes is uncertain.
Class Allocations and Expenses. Investment income, realized and unrealized capital gains and losses, common expenses of the Fund, and certain fund-level expense reductions, if any, are allocated daily on a pro-rata basis to each class based on the relative net assets of each class to the total net assets of the Fund. Each class differs with respect to transfer agent and distribution and service plan fees incurred. Certain expense reductions may also differ by class. For the reporting period, the allocated portion of income and expenses to each class as a percent of its average net assets may vary due to the timing of recording these transactions in relation to fluctuating net assets of the classes. Expenses directly attributable to a fund are charged to that fund. Expenses attributable to more than one fund are allocated among the respective funds on the basis of relative net assets or other appropriate methods. Expense estimates are accrued in the period to which they relate and adjustments are made when actual amounts are known.
Income Tax Information and Distributions to Shareholders. Each year, the Fund intends to qualify as a regulated investment company under Subchapter M of the Internal Revenue Code, including distributing substantially all of its taxable income and realized gains. As a result, no provision for U.S. Federal income taxes is required. The Fund files a U.S. federal tax return, in addition to state and local tax returns as required. The Fund's federal income tax returns are subject to examination by the Internal Revenue Service (IRS) for a period of three fiscal years after they are filed. State and local tax returns may be subject to examination for an additional fiscal year depending on the jurisdiction. Foreign taxes are provided for based on the Fund's understanding of the tax rules and rates that exist in the foreign markets in which it invests.
Distributions are declared and recorded on the ex-dividend date. Income dividends and capital gain distributions are declared separately for each class. Income and capital gain distributions are determined in accordance with income tax regulations, which may differ from GAAP.
Capital accounts within the financial statements are adjusted for permanent book-tax differences. These adjustments have no impact on net assets or the results of operations. Capital accounts are not adjusted for temporary book-tax differences which will reverse in a subsequent period.
Book-tax differences are primarily due to foreign currency transactions, passive foreign investment companies (PFIC), capital loss carryforwards and losses deferred due to wash sales.
The federal tax cost of investment securities and unrealized appreciation (depreciation) as of period end were as follows:
| Gross unrealized appreciation | $209,557,645 |
| Gross unrealized depreciation | (52,839,150) |
| Net unrealized appreciation (depreciation) on securities | $156,718,495 |
| Tax cost | $850,763,752 |
Capital loss carryforwards are only available to offset future capital gains of the Fund to the extent provided by regulations and may be limited. Under the Regulated Investment Company Modernization Act of 2010 (the Act), the Fund is permitted to carry forward capital losses incurred in taxable years beginning after December 22, 2010 for an unlimited period and such capital losses are required to be used prior to any losses that expire. The capital loss carryforward information presented below, including any applicable limitation, is estimated as of prior fiscal period end and is subject to adjustment.
| Fiscal year of expiration | |
| 2017 | $(201,465,311) |
Short-Term Trading (Redemption) Fees. Shares held by investors in the Fund less than 90 days may have been subject to a redemption fee equal to 2.00% of the NAV of shares redeemed. All redemption fees, which reduce the proceeds of the shareholder redemption, are retained by the Fund and accounted for as an addition to paid in capital.
Restricted Securities. The Fund may invest in securities that are subject to legal or contractual restrictions on resale. These securities generally may be resold in transactions exempt from registration or to the public if the securities are registered. Disposal of these securities may involve time-consuming negotiations and expense, and prompt sale at an acceptable price may be difficult. Information regarding restricted securities is included at the end of the Fund's Schedule of Investments.
4. Purchases and Sales of Investments.
Purchases and sales of securities, other than short-term securities, aggregated $57,360,998 and $201,269,981, respectively.
5. Fees and Other Transactions with Affiliates.
Management Fee. Fidelity Management & Research Company (the investment adviser) and its affiliates provide the Fund with investment management related services for which the Fund pays a monthly management fee. The management fee is the sum of an individual fund fee rate that is based on an annual rate of .60% of the Fund's average net assets and an annualized group fee rate that averaged .25% during the period. The group fee rate is based upon the average net assets of all the mutual funds advised by the investment adviser, including any mutual funds previously advised by the investment adviser that are currently advised by Fidelity SelectCo, LLC, an affiliate of the investment adviser. The group fee rate decreases as assets under management increase and increases as assets under management decrease. In addition, the management fee is subject to a performance adjustment (up to a maximum of +/- .20% of the Fund's average net assets over a 36 month performance period). The upward or downward adjustment to the management fee is based on the relative investment performance of International Small Cap Opportunities as compared to its benchmark index, the MSCI EAFE Small Cap Index, over the same 36 month performance period. For the reporting period, the total annualized management fee rate, including the performance adjustment, was .86% of the Fund's average net assets. The performance adjustment included in the management fee rate may be higher or lower than the maximum performance adjustment rate due to the difference between the average net assets for the reporting and performance periods.
Distribution and Service Plan Fees. In accordance with Rule 12b-1 of the 1940 Act, the Fund has adopted separate Distribution and Service Plans for each class of shares. Certain classes pay Fidelity Distributors Corporation (FDC), an affiliate of the investment adviser, separate Distribution and Service Fees, each of which is based on an annual percentage of each class' average net assets. In addition, FDC may pay financial intermediaries for selling shares of the Fund and providing shareholder support services. For the period, the Distribution and Service Fee rates, total fees and amounts retained by FDC were as follows:
| | Distribution
Fee | Service
Fee | Total Fees | Retained
by FDC |
| Class A | -% | .25% | $51,828 | $1,396 |
| Class M | .25% | .25% | 28,790 | – |
| Class C | .75% | .25% | 59,543 | 5,542 |
| | | | $140,161 | $ 6,938 |
Sales Load. FDC may receive a front-end sales charge of up to 5.75% for selling Class A shares and 3.50% for selling Class M shares, some of which is paid to financial intermediaries for selling shares of the Fund. Depending on the holding period, FDC may receive contingent deferred sales charges levied on Class A, Class M and Class C redemptions. The deferred sales charges are 1.00% for Class C shares, 1.00% for certain purchases of Class A shares and .25% for certain purchases of Class M shares.
For the period, sales charge amounts retained by FDC were as follows:
| | Retained
by FDC |
| Class A | $3,132 |
| Class M | 1,342 |
| Class C(a) | 733 |
| | $5,207 |
(a) When Class C shares are initially sold, FDC pays commissions from its own resources to financial intermediaries through which the sales are made.
Transfer Agent Fees. Fidelity Investments Institutional Operations Company, Inc., (FIIOC), an affiliate of the investment adviser, is the transfer, dividend disbursing and shareholder servicing agent for each class of the Fund. FIIOC receives account fees and asset-based fees that vary according to the account size and type of account of the shareholders of the respective classes of the Fund. FIIOC pays for typesetting, printing and mailing of shareholder reports, except proxy statements.
For the period, transfer agent fees for each applicable class were as follows:
| | Amount | % of
Class-Level Average
Net Assets(a) |
| Class A | $50,887 | .25 |
| Class M | 17,832 | .31 |
| Class C | 17,358 | .29 |
| International Small Cap Opportunities | 748,529 | .20 |
| Class I | 164,005 | .21 |
| | $998,611 | |
(a) Annualized
Accounting and Security Lending Fees. Fidelity Service Company, Inc. (FSC), an affiliate of the investment adviser, maintains the Fund's accounting records. The accounting fee is based on the level of average net assets for each month. Under a separate contract, FSC administers the security lending program. The security lending fee is based on the number and duration of lending transactions.
Brokerage Commissions. The Fund placed a portion of its portfolio transactions with brokerage firms which are affiliates of the investment adviser. Brokerage commissions are included in net realized gain (loss) and change in net unrealized appreciation (depreciation) in the Statement of Operations. The commissions paid to these affiliated firms were $716 for the period.
Interfund Lending Program. Pursuant to an Exemptive Order issued by the SEC, the Fund, along with other registered investment companies having management contracts with FMR or other affiliated entities of FMR, may participate in an interfund lending program. This program provides an alternative credit facility allowing the funds to borrow from, or lend money to, other participating affiliated funds. At period end, there were no interfund loans outstanding. The Fund's activity in this program during the period for which loans were outstanding was as follows:
| Borrower or Lender | Average Loan Balance | Weighted Average Interest Rate | Interest Expense |
| Borrower | $7,779,000 | .58% | $1,257 |
Interfund Trades. The Fund may purchase from or sell securities to other Fidelity Funds under procedures adopted by the Board. The procedures have been designed to ensure these interfund trades are executed in accordance with Rule 17a-7 of the 1940 Act. Interfund trades are included within the respective purchases and sales amounts shown in the Purchases and Sales of Investments note.
6. Committed Line of Credit.
The Fund participates with other funds managed by the investment adviser or an affiliate in a $4.25 billion credit facility (the "line of credit") to be utilized for temporary or emergency purposes to fund shareholder redemptions or for other short-term liquidity purposes. The Fund has agreed to pay commitment fees on its pro-rata portion of the line of credit, which amounted to $1,675 and is reflected in Miscellaneous expenses on the Statement of Operations. During the period, the Fund did not borrow on this line of credit.
7. Security Lending.
The Fund lends portfolio securities through a lending agent from time to time in order to earn additional income. For equity securities, a lending agent is used and may loan securities to certain qualified borrowers, including Fidelity Capital Markets (FCM), a broker-dealer affiliated with the Fund. On the settlement date of the loan, the Fund receives collateral (in the form of U.S. Treasury obligations, letters of credit and/or cash) against the loaned securities and maintains collateral in an amount not less than 100% of the market value of the loaned securities during the period of the loan. The market value of the loaned securities is determined at the close of business of the Fund and any additional required collateral is delivered to the Fund on the next business day. The Fund or borrower may terminate the loan at any time, and if the borrower defaults on its obligation to return the securities loaned because of insolvency or other reasons, the Fund may apply collateral received from the borrower against the obligation. The Fund may experience delays and costs in recovering the securities loaned. Any cash collateral received is invested in Fidelity Securities Lending Cash Central Fund. The value of loaned securities and cash collateral at period end are disclosed on the Fund's Statement of Assets and Liabilities. The value of securities loaned to FCM at period end was $360,684. Security lending income represents the income earned on investing cash collateral, less rebates paid to borrowers and any lending agent fees associated with the loan, plus any premium payments received for lending certain types of securities. Security lending income is presented in the Statement of Operations as a component of income from Fidelity Central Funds. Total security lending income during the period amounted to $106,612, including $29 from securities loaned to FCM.
8. Bank Borrowings.
The Fund is permitted to have bank borrowings for temporary or emergency purposes to fund shareholder redemptions or for other short-term liquidity requirements. The Fund has established borrowing arrangements with certain banks. The interest rate on the borrowings is the bank's base rate, as revised from time to time. The average loan balance during the period for which loans were outstanding amounted to $5,334,167. The weighted average interest rate was .91%. The interest expense amounted to $809 under the bank borrowing program. At period end, there were no bank borrowings outstanding.
9. Expense Reductions.
Commissions paid to certain brokers with whom the investment adviser, or its affiliates, places trades on behalf of the Fund include an amount in addition to trade execution, which may be rebated back to the Fund to offset certain expenses. This amount totaled $17,717 for the period.
In addition, during the period the investment adviser reimbursed and/or waived a portion of fund-level operating expenses in the amount of $4,243.
10. Distributions to Shareholders.
Distributions to shareholders of each class were as follows:
| | Six months ended
April 30, 2017 | Year ended October 31, 2016 |
| From net investment income | | |
| Class A | $345,530 | $159,395 |
| Class M | 44,101 | 9,385 |
| International Small Cap Opportunities | 8,436,081 | 3,989,748 |
| Class I | 1,798,182 | 694,163 |
| Total | $10,623,894 | $4,852,691 |
| From net realized gain | | |
| Class A | $117,129 | $214,570 |
| Class M | 32,073 | 65,696 |
| Class C | – | 66,143 |
| International Small Cap Opportunities | 2,008,591 | 3,723,825 |
| Class I | 408,678 | 585,439 |
| Total | $2,566,471 | $4,655,673 |
11. Share Transactions.
Share transactions for each class were as follows and may contain automatic conversions between classes or exchanges between affiliated funds:
| | Shares | Shares | Dollars | Dollars |
| | Six months ended April 30, 2017 | Year ended October 31, 2016 | Six months ended April 30, 2017 | Year ended October 31, 2016 |
| Class A | | | | |
| Shares sold | 365,099 | 1,351,287 | $5,442,812 | $19,658,244 |
| Reinvestment of distributions | 30,737 | 24,184 | 441,386 | 359,376 |
| Shares redeemed | (1,060,238) | (1,195,179) | (15,880,127) | (17,426,031) |
| Net increase (decrease) | (664,402) | 180,292 | $(9,995,929) | $2,591,589 |
| Class M | | | | |
| Shares sold | 50,846 | 193,483 | $769,295 | $2,768,529 |
| Reinvestment of distributions | 5,229 | 5,021 | 74,673 | 74,158 |
| Shares redeemed | (156,449) | (269,450) | (2,314,840) | (3,846,732) |
| Net increase (decrease) | (100,374) | (70,946) | $(1,470,872) | $(1,004,045) |
| Class B | | | | |
| Shares sold | – | 3,601 | $– | $51,563 |
| Shares redeemed | – | (45,696) | – | (635,715) |
| Net increase (decrease) | – | (42,095) | $– | $(584,152) |
| Class C | | | | |
| Shares sold | 57,882 | 246,339 | $847,816 | $3,449,372 |
| Reinvestment of distributions | – | 4,483 | – | 64,648 |
| Shares redeemed | (157,157) | (584,363) | (2,262,768) | (8,102,721) |
| Net increase (decrease) | (99,275) | (333,541) | $(1,414,952) | $(4,588,701) |
| International Small Cap Opportunities | | | | |
| Shares sold | 3,077,675 | 26,676,267 | $46,619,140 | $389,947,202 |
| Reinvestment of distributions | 594,324 | 402,267 | 8,611,758 | 6,034,011 |
| Shares redeemed | (9,305,420) | (24,218,791) | (138,022,412) | (357,874,849) |
| Net increase (decrease) | (5,633,421) | 2,859,743 | $(82,791,514) | $38,106,364 |
| Class I | | | | |
| Shares sold | 2,368,566 | 5,357,445 | $36,078,168 | $78,823,330 |
| Reinvestment of distributions | 138,286 | 75,351 | 2,000,992 | 1,129,506 |
| Shares redeemed | (4,962,513) | (3,153,630) | (77,606,349) | (46,042,984) |
| Net increase (decrease) | (2,455,661) | 2,279,166 | $(39,527,189) | $33,909,852 |
12. Other.
The Fund's organizational documents provide former and current trustees and officers with a limited indemnification against liabilities arising in connection with the performance of their duties to the Fund. In the normal course of business, the Fund may also enter into contracts that provide general indemnifications. The Fund's maximum exposure under these arrangements is unknown as this would be dependent on future claims that may be made against the Fund. The risk of material loss from such claims is considered remote.
Shareholder Expense Example
As a shareholder of the Fund, you incur two types of costs: (1) transaction costs, including sales charges (loads) on purchase payments or redemption proceeds, redemption fees and (2) ongoing costs, including management fees, distribution and/or service (12b-1) fees and other Fund expenses. This Example is intended to help you understand your ongoing costs (in dollars) of investing in the Fund and to compare these costs with the ongoing costs of investing in other mutual funds.
The Example is based on an investment of $1,000 invested at the beginning of the period and held for the entire period (November 1, 2016 to April 30, 2017).
Actual Expenses
The first line of the accompanying table for each class of the Fund provides information about actual account values and actual expenses. You may use the information in this line, together with the amount you invested, to estimate the expenses that you paid over the period. Simply divide your account value by $1,000.00 (for example, an $8,600 account value divided by $1,000.00 = 8.6), then multiply the result by the number in the first line for a class of the Fund under the heading entitled "Expenses Paid During Period" to estimate the expenses you paid on your account during this period. A small balance maintenance fee of $12.00 that is charged once a year may apply for certain accounts with a value of less than $2,000. This fee is not included in the table below. If it was, the estimate of expenses you paid during the period would be higher, and your ending account value lower, by this amount. In addition, the Fund, as a shareholder in the underlying Fidelity Central Funds, will indirectly bear its pro-rata share of the fees and expenses incurred by the underlying Fidelity Central Funds. These fees and expenses are not included in the Fund's annualized expense ratio used to calculate the expense estimate in the table below.
Hypothetical Example for Comparison Purposes
The second line of the accompanying table for each class of the Fund provides information about hypothetical account values and hypothetical expenses based on a Class' actual expense ratio and an assumed rate of return of 5% per year before expenses, which is not the Class' actual return. The hypothetical account values and expenses may not be used to estimate the actual ending account balance or expenses you paid for the period. You may use this information to compare the ongoing costs of investing in the Fund and other funds. To do so, compare this 5% hypothetical example with the 5% hypothetical examples that appear in the shareholder reports of the other funds. A small balance maintenance fee of $12.00 that is charged once a year may apply for certain accounts with a value of less than $2,000. This fee is not included in the table below. If it was, the estimate of expenses you paid during the period would be higher, and your ending account value lower, by this amount. In addition, the Fund, as a shareholder in the underlying Fidelity Central Funds, will indirectly bear its pro-rata share of the fees and expenses incurred by the underlying Fidelity Central Funds. These fees and expenses are not included in the Fund's annualized expense ratio used to calculate the expense estimate in the table below.
Please note that the expenses shown in the table are meant to highlight your ongoing costs only and do not reflect any transaction costs. Therefore, the second line of the table is useful in comparing ongoing costs only, and will not help you determine the relative total costs of owning different funds. In addition, if these transactional costs were included, your costs would have been higher.
| | Annualized Expense Ratio-A | Beginning
Account Value
November 1, 2016 | Ending
Account Value
April 30, 2017 | Expenses Paid
During Period-B
November 1, 2016
to April 30, 2017 |
| Class A | 1.44% | | | |
| Actual | | $1,000.00 | $1,122.90 | $7.58 |
| Hypothetical-C | | $1,000.00 | $1,017.65 | $7.20 |
| Class M | 1.75% | | | |
| Actual | | $1,000.00 | $1,121.90 | $9.21 |
| Hypothetical-C | | $1,000.00 | $1,016.12 | $8.75 |
| | | | | |
| | | | | |
| | | | | |
| Class C | 2.23% | | | |
| Actual | | $1,000.00 | $1,119.10 | $11.72 |
| Hypothetical-C | | $1,000.00 | $1,013.74 | $11.13 |
| International Small Cap Opportunities | 1.14% | | | |
| Actual | | $1,000.00 | $1,124.60 | $6.01 |
| Hypothetical-C | | $1,000.00 | $1,019.14 | $5.71 |
| Class I | 1.15% | | | |
| Actual | | $1,000.00 | $1,124.60 | $6.06 |
| Hypothetical-C | | $1,000.00 | $1,019.09 | $5.76 |
A Annualized expense ratio reflects expenses net of applicable fee waivers.
B Expenses are equal to each Class' annualized expense ratio, multiplied by the average account value over the period, multiplied by 181/365 (to reflect the one-half year period).
C 5% return per year before expenses
AILS-SANN-0617
1.815094.111
Fidelity's Broadly Diversified International Equity Funds Fidelity® Diversified International Fund
Fidelity® International Capital Appreciation Fund
Fidelity® Overseas Fund
Fidelity® Worldwide Fund
Semi-Annual Report April 30, 2017 |
|
Contents
To view a fund's proxy voting guidelines and proxy voting record for the 12-month period ended June 30, visit http://www.fidelity.com/proxyvotingresults or visit the Securities and Exchange Commission's (SEC) web site at http://www.sec.gov.
You may also call 1-800-544-8544 to request a free copy of the proxy voting guidelines.
Standard & Poor's, S&P and S&P 500 are registered service marks of The McGraw-Hill Companies, Inc. and have been licensed for use by Fidelity Distributors Corporation.
Other third-party marks appearing herein are the property of their respective owners.
All other marks appearing herein are registered or unregistered trademarks or service marks of FMR LLC or an affiliated company. © 2017 FMR LLC. All rights reserved.
This report and the financial statements contained herein are submitted for the general information of the shareholders of the Funds. This report is not authorized for distribution to prospective investors in the Funds unless preceded or accompanied by an effective prospectus.
A fund files its complete schedule of portfolio holdings with the SEC for the first and third quarters of each fiscal year on Form N-Q. Forms N-Q are available on the SEC’s web site at http://www.sec.gov. A fund's Forms N-Q may be reviewed and copied at the SEC’s Public Reference Room in Washington, DC. Information regarding the operation of the SEC's Public Reference Room may be obtained by calling 1-800-SEC-0330.
For a complete list of a fund's portfolio holdings, view the most recent holdings listing, semiannual report, or annual report on Fidelity's web site at http://www.fidelity.com, http://www.institutional.fidelity.com, or http://www.401k.com, as applicable.
NOT FDIC INSURED •MAY LOSE VALUE •NO BANK GUARANTEE
Neither the Funds nor Fidelity Distributors Corporation is a bank.
Fidelity® Diversified International Fund
Investment Summary (Unaudited)
Geographic Diversification (% of fund's net assets)
| As of April 30, 2017 |
| | United Kingdom | 16.4% |
| | Japan | 14.9% |
| | United States of America* | 10.2% |
| | Germany | 8.3% |
| | Netherlands | 6.2% |
| | France | 5.1% |
| | Canada | 3.7% |
| | India | 3.6% |
| | Ireland | 3.6% |
| | Other | 28.0% |

* Includes Short-Term investments and Net Other Assets (Liabilities).
Percentages are based on country or territory of incorporation and are adjusted for the effect of futures contracts, if applicable.
| As of October 31, 2016 |
| | Japan | 15.9% |
| | United Kingdom | 13.2% |
| | United States of America* | 10.7% |
| | Germany | 8.9% |
| | Netherlands | 5.2% |
| | France | 5.0% |
| | Canada | 4.3% |
| | India | 3.5% |
| | Ireland | 3.2% |
| | Other | 30.1% |

* Includes Short-Term investments and Net Other Assets (Liabilities).
Percentages are based on country or territory of incorporation and are adjusted for the effect of futures contracts, if applicable.
Asset Allocation as of April 30, 2017
| | % of fund's net assets | % of fund's net assets 6 months ago |
| Stocks | 96.0 | 96.9 |
| Bonds | 0.1 | 0.0 |
| Short-Term Investments and Net Other Assets (Liabilities) | 3.9 | 3.1 |
Top Ten Stocks as of April 30, 2017
| | % of fund's net assets | % of fund's net assets 6 months ago |
| Bayer AG (Germany, Pharmaceuticals) | 2.2 | 1.9 |
| Hoya Corp. (Japan, Health Care Equipment & Supplies) | 1.5 | 1.6 |
| ORIX Corp. (Japan, Diversified Financial Services) | 1.5 | 1.9 |
| Lloyds Banking Group PLC (United Kingdom, Banks) | 1.5 | 1.2 |
| Prudential PLC (United Kingdom, Insurance) | 1.5 | 1.0 |
| British American Tobacco PLC sponsored ADR (United Kingdom, Tobacco) | 1.3 | 0.5 |
| SAP AG (Germany, Software) | 1.3 | 1.3 |
| Keyence Corp. (Japan, Electronic Equipment & Components) | 1.2 | 1.3 |
| HDFC Bank Ltd. (India, Banks) | 1.2 | 1.2 |
| Anheuser-Busch InBev SA NV (Belgium, Beverages) | 1.2 | 1.6 |
| | 14.4 | |
Top Market Sectors as of April 30, 2017
| | % of fund's net assets | % of fund's net assets 6 months ago |
| Financials | 22.6 | 21.2 |
| Consumer Staples | 14.2 | 14.9 |
| Health Care | 13.2 | 15.8 |
| Information Technology | 12.4 | 14.8 |
| Consumer Discretionary | 12.4 | 12.2 |
| Industrials | 10.9 | 7.8 |
| Energy | 4.3 | 3.5 |
| Materials | 3.4 | 3.0 |
| Telecommunication Services | 2.1 | 2.9 |
| Real Estate | 0.4 | 0.5 |
Percentages shown as 0.0% may reflect amounts less than 0.05%.
Fidelity® Diversified International Fund
Investments April 30, 2017
Showing Percentage of Net Assets
| Common Stocks - 94.6% | | | |
| | | Shares | Value |
| Australia - 1.5% | | | |
| Amcor Ltd. | | 1,601,729 | $18,842,176 |
| Australia & New Zealand Banking Group Ltd. | | 5,003,676 | 122,743,614 |
| Bapcor Ltd. | | 865,084 | 3,387,863 |
| CSL Ltd. | | 478,787 | 47,521,257 |
| Magellan Financial Group Ltd. | | 3,006,204 | 53,079,654 |
| Ramsay Health Care Ltd. | | 738,117 | 39,628,734 |
|
| TOTAL AUSTRALIA | | | 285,203,298 |
|
| Bailiwick of Guernsey - 0.0% | | | |
| Burford Capital Ltd. | | 614,700 | 6,210,044 |
| Bailiwick of Jersey - 2.5% | | | |
| Shire PLC | | 2,721,200 | 160,438,638 |
| Shire PLC sponsored ADR | | 168,129 | 29,752,108 |
| Wolseley PLC | | 2,906,649 | 184,738,310 |
| WPP PLC | | 5,042,009 | 107,967,185 |
|
| TOTAL BAILIWICK OF JERSEY | | | 482,896,241 |
|
| Belgium - 2.2% | | | |
| Anheuser-Busch InBev SA NV | | 1,948,430 | 219,725,168 |
| KBC Groep NV | | 2,700,990 | 195,008,247 |
|
| TOTAL BELGIUM | | | 414,733,415 |
|
| Bermuda - 0.6% | | | |
| Credicorp Ltd. (United States) | | 288,400 | 44,315,544 |
| IHS Markit Ltd. (a) | | 1,541,700 | 66,909,780 |
|
| TOTAL BERMUDA | | | 111,225,324 |
|
| Canada - 3.7% | | | |
| Alimentation Couche-Tard, Inc. Class B (sub. vtg.) | | 4,000,881 | 184,004,475 |
| Cenovus Energy, Inc. | | 8,494,900 | 84,696,963 |
| CGI Group, Inc. Class A (sub. vtg.) (a) | | 1,061,600 | 51,234,906 |
| Constellation Software, Inc. | | 60,338 | 27,596,662 |
| Fairfax India Holdings Corp. (a) | | 5,606,600 | 77,875,674 |
| Imperial Oil Ltd. | | 2,529,500 | 73,584,444 |
| PrairieSky Royalty Ltd. | | 822,398 | 17,923,402 |
| Suncor Energy, Inc. | | 6,002,000 | 188,099,747 |
|
| TOTAL CANADA | | | 705,016,273 |
|
| Cayman Islands - 1.1% | | | |
| Alibaba Group Holding Ltd. sponsored ADR (a) | | 1,130,000 | 130,515,000 |
| JD.com, Inc. sponsored ADR (a) | | 1,444,792 | 50,668,855 |
| Melco Crown Entertainment Ltd. sponsored ADR | | 901,200 | 19,781,340 |
| Yihai International Holding Ltd. | | 20,356,000 | 9,525,907 |
|
| TOTAL CAYMAN ISLANDS | | | 210,491,102 |
|
| China - 0.9% | | | |
| Kweichow Moutai Co. Ltd. (A Shares) | | 1,752,010 | 105,087,560 |
| Qingdao Haier Co. Ltd. | | 35,425,678 | 62,644,377 |
|
| TOTAL CHINA | | | 167,731,937 |
|
| Curacao - 0.7% | | | |
| Schlumberger Ltd. | | 1,750,025 | 127,034,315 |
| Denmark - 0.5% | | | |
| A.P. Moller - Maersk A/S Series B | | 10,655 | 18,380,239 |
| NNIT A/S (a) | | 651,651 | 18,371,152 |
| Novo Nordisk A/S Series B | | 1,616,195 | 62,929,550 |
|
| TOTAL DENMARK | | | 99,680,941 |
|
| Finland - 0.3% | | | |
| Sampo Oyj (A Shares) (b) | | 1,278,400 | 61,258,763 |
| France - 5.1% | | | |
| Amundi SA | | 2,959,013 | 194,684,472 |
| AXA SA (b) | | 4,035,000 | 107,654,416 |
| BNP Paribas SA | | 1,426,800 | 100,681,933 |
| LVMH Moet Hennessy - Louis Vuitton SA (b) | | 429,124 | 105,937,374 |
| Maisons du Monde SA | | 891,300 | 30,932,654 |
| Rubis | | 199,800 | 20,301,659 |
| Sanofi SA | | 2,243,715 | 212,017,239 |
| Societe Generale Series A | | 1,863,200 | 102,164,332 |
| VINCI SA | | 1,157,700 | 98,680,707 |
| Worldline SA (a)(c) | | 95,117 | 3,154,435 |
|
| TOTAL FRANCE | | | 976,209,221 |
|
| Germany - 7.0% | | | |
| adidas AG | | 602,424 | 120,678,943 |
| Aumann AG | | 332,400 | 21,862,591 |
| Axel Springer Verlag AG | | 869,800 | 48,804,341 |
| Bayer AG | | 3,421,662 | 423,373,043 |
| Brenntag AG | | 95,600 | 5,669,223 |
| Deutsche Borse AG | | 64,992 | 6,361,001 |
| Deutsche Post AG | | 2,022,759 | 72,705,684 |
| Fresenius Medical Care AG & Co. KGaA | | 216,300 | 19,200,798 |
| Fresenius SE & Co. KGaA | | 2,404,200 | 194,871,981 |
| ProSiebenSat.1 Media AG | | 1,893,290 | 80,369,529 |
| Rational AG | | 34,516 | 17,344,086 |
| SAP AG | | 2,353,846 | 235,775,443 |
| Symrise AG | | 1,098,900 | 76,933,232 |
|
| TOTAL GERMANY | | | 1,323,949,895 |
|
| Hong Kong - 1.1% | | | |
| AIA Group Ltd. | | 25,979,000 | 179,854,230 |
| Techtronic Industries Co. Ltd. | | 8,211,500 | 35,259,933 |
|
| TOTAL HONG KONG | | | 215,114,163 |
|
| India - 3.6% | | | |
| Adani Ports & Special Economic Zone Ltd. (a) | | 666,389 | 3,396,729 |
| Axis Bank Ltd. | | 3,625,258 | 28,738,727 |
| Godrej Consumer Products Ltd. | | 167,651 | 4,544,753 |
| HDFC Bank Ltd. | | 9,449,055 | 230,669,153 |
| Housing Development Finance Corp. Ltd. | | 7,369,819 | 176,209,633 |
| ICICI Bank Ltd. | | 9,531,499 | 41,126,022 |
| ITC Ltd. | | 20,903,933 | 90,391,871 |
| LIC Housing Finance Ltd. | | 3,151,798 | 32,792,622 |
| Reliance Industries Ltd. | | 3,832,853 | 83,179,289 |
|
| TOTAL INDIA | | | 691,048,799 |
|
| Indonesia - 0.8% | | | |
| PT Bank Central Asia Tbk | | 49,044,200 | 65,311,317 |
| PT Bank Rakyat Indonesia Tbk | | 85,630,900 | 82,874,830 |
|
| TOTAL INDONESIA | | | 148,186,147 |
|
| Ireland - 3.6% | | | |
| Allergan PLC | | 417,700 | 101,860,322 |
| CRH PLC | | 1,777,100 | 64,794,802 |
| DCC PLC (United Kingdom) | | 765,289 | 70,672,725 |
| Kerry Group PLC Class A | | 892,900 | 72,967,150 |
| Kingspan Group PLC (Ireland) | | 1,135,800 | 39,510,842 |
| Medtronic PLC | | 998,800 | 82,990,292 |
| Ryanair Holdings PLC sponsored ADR (a) | | 2,288,132 | 210,347,975 |
| Weatherford International PLC (a) | | 6,773,300 | 39,081,941 |
|
| TOTAL IRELAND | | | 682,226,049 |
|
| Isle of Man - 0.3% | | | |
| Paysafe Group PLC (a) | | 10,849,449 | 63,782,965 |
| Israel - 1.4% | | | |
| Check Point Software Technologies Ltd. (a) | | 1,325,300 | 137,844,453 |
| Elbit Systems Ltd. (Israel) | | 288,593 | 34,382,870 |
| SodaStream International Ltd. (a) | | 417,260 | 22,694,771 |
| Teva Pharmaceutical Industries Ltd. sponsored ADR | | 2,523,900 | 79,704,762 |
|
| TOTAL ISRAEL | | | 274,626,856 |
|
| Italy - 0.6% | | | |
| Buzzi Unicem SpA | | 291,900 | 7,504,013 |
| Intesa Sanpaolo SpA | | 25,088,000 | 73,234,444 |
| Prada SpA | | 8,915,500 | 41,836,090 |
|
| TOTAL ITALY | | | 122,574,547 |
|
| Japan - 14.8% | | | |
| Astellas Pharma, Inc. | | 10,466,900 | 138,028,184 |
| Bridgestone Corp. | | 721,500 | 30,083,265 |
| Daito Trust Construction Co. Ltd. | | 349,800 | 51,461,942 |
| Dentsu, Inc. | | 1,246,300 | 70,210,935 |
| Don Quijote Holdings Co. Ltd. | | 1,285,200 | 46,865,557 |
| Hoya Corp. | | 6,178,200 | 295,068,283 |
| Japan Exchange Group, Inc. | | 409,000 | 5,727,284 |
| Japan Tobacco, Inc. | | 2,901,100 | 96,447,424 |
| Kaken Pharmaceutical Co. Ltd. | | 275,500 | 16,335,995 |
| Kao Corp. | | 186,500 | 10,285,732 |
| KDDI Corp. | | 6,215,800 | 164,806,178 |
| Keyence Corp. | | 581,420 | 233,663,297 |
| Minebea Mitsumi, Inc. | | 3,731,100 | 53,920,629 |
| Misumi Group, Inc. | | 2,181,500 | 41,311,025 |
| Morinaga & Co. Ltd. | | 942,500 | 44,556,851 |
| Nabtesco Corp. | | 917,600 | 26,011,357 |
| Nidec Corp. | | 199,800 | 18,317,614 |
| Nippon Telegraph & Telephone Corp. | | 1,075,100 | 46,074,107 |
| Nitori Holdings Co. Ltd. | | 1,042,700 | 135,721,704 |
| Olympus Corp. | | 2,731,300 | 105,111,254 |
| ORIX Corp. | | 19,160,300 | 292,367,529 |
| Outsourcing, Inc. | | 352,000 | 13,498,991 |
| Recruit Holdings Co. Ltd. | | 3,632,600 | 183,463,001 |
| Seria Co. Ltd. | | 245,700 | 11,020,408 |
| Seven & i Holdings Co. Ltd. | | 1,760,300 | 74,375,537 |
| Shin-Etsu Chemical Co. Ltd. | | 104,600 | 9,086,758 |
| Shinsei Bank Ltd. | | 23,502,000 | 43,852,128 |
| Shionogi & Co. Ltd. | | 684,000 | 35,177,143 |
| SMC Corp. | | 126,400 | 35,592,698 |
| SoftBank Corp. | | 1,510,800 | 114,598,289 |
| Sohgo Security Services Co., Ltd. | | 349,200 | 15,239,812 |
| Sony Corp. | | 2,277,700 | 78,157,781 |
| Start Today Co. Ltd. | | 1,606,100 | 34,290,361 |
| Sundrug Co. Ltd. | | 523,300 | 18,354,815 |
| Tsuruha Holdings, Inc. | | 1,496,600 | 151,707,378 |
| Welcia Holdings Co. Ltd. | | 2,223,100 | 71,593,891 |
|
| TOTAL JAPAN | | | 2,812,385,137 |
|
| Luxembourg - 1.4% | | | |
| B&M European Value Retail S.A. | | 35,854,800 | 156,499,892 |
| Eurofins Scientific SA | | 233,800 | 115,140,077 |
|
| TOTAL LUXEMBOURG | | | 271,639,969 |
|
| Netherlands - 6.2% | | | |
| AerCap Holdings NV (a) | | 991,900 | 45,637,319 |
| Altice NV: | | | |
| Class A (a) | | 6,848,470 | 170,126,175 |
| Class B (a) | | 1,816,636 | 45,177,410 |
| ASML Holding NV | | 561,600 | 74,046,960 |
| Gree Electric Appliances, Inc. of Zhuhai ELS (A Shares) (BNP Paribas Warrant Program) warrants 11/14/17 (a)(c) | | 4,182,893 | 20,024,004 |
| IMCD Group BV | | 1,506,247 | 81,135,327 |
| ING Groep NV (Certificaten Van Aandelen) | | 8,063,600 | 131,432,990 |
| Koninklijke Philips Electronics NV | | 2,434,700 | 84,076,248 |
| LyondellBasell Industries NV Class A | | 681,000 | 57,721,560 |
| NXP Semiconductors NV (a) | | 792,400 | 83,796,300 |
| RELX NV | | 6,925,370 | 133,940,267 |
| Unilever NV: | | | |
| (Certificaten Van Aandelen) (Bearer) | | 3,586,657 | 187,888,785 |
| (NY Reg.) (a) | | 449,300 | 23,471,432 |
| Wolters Kluwer NV | | 806,300 | 34,245,018 |
|
| TOTAL NETHERLANDS | | | 1,172,719,795 |
|
| New Zealand - 0.1% | | | |
| Ryman Healthcare Group Ltd. | | 4,273,045 | 25,319,321 |
| Norway - 0.7% | | | |
| Statoil ASA (b) | | 8,356,100 | 137,615,735 |
| Philippines - 0.1% | | | |
| Alliance Global Group, Inc. | | 68,432,356 | 20,194,787 |
| Singapore - 0.4% | | | |
| Broadcom Ltd. | | 347,500 | 76,731,475 |
| South Africa - 1.1% | | | |
| Capitec Bank Holdings Ltd. | | 304,900 | 17,397,695 |
| Naspers Ltd. Class N | | 1,026,379 | 195,167,520 |
|
| TOTAL SOUTH AFRICA | | | 212,565,215 |
|
| Spain - 2.9% | | | |
| Amadeus IT Holding SA Class A | | 2,952,800 | 159,216,009 |
| CaixaBank SA | | 24,223,200 | 109,984,068 |
| Grifols SA ADR | | 259,307 | 5,629,555 |
| Hispania Activos Inmobiliarios SA | | 1,093,780 | 16,513,560 |
| Inditex SA | | 4,169,300 | 159,910,387 |
| Neinor Homes SLU | | 2,261,900 | 44,608,686 |
| Prosegur Cash SA | | 21,180,200 | 53,987,525 |
|
| TOTAL SPAIN | | | 549,849,790 |
|
| Sweden - 3.0% | | | |
| ASSA ABLOY AB (B Shares) (b) | | 5,359,800 | 116,124,058 |
| Coor Service Management Holding AB (d) | | 4,940,000 | 30,814,695 |
| HEXPOL AB (B Shares) | | 2,087,300 | 23,200,601 |
| Nordea Bank AB | | 14,030,400 | 172,661,375 |
| Svenska Cellulosa AB (SCA) (B Shares) | | 5,459,900 | 180,860,382 |
| Svenska Handelsbanken AB (A Shares) | | 3,430,300 | 48,681,733 |
|
| TOTAL SWEDEN | | | 572,342,844 |
|
| Switzerland - 2.5% | | | |
| Credit Suisse Group AG | | 7,852,601 | 119,759,735 |
| Dufry AG (a) | | 14,080 | 2,306,573 |
| Forbo Holding AG (Reg.) | | 2,440 | 3,999,638 |
| Julius Baer Group Ltd. | | 890,740 | 46,449,153 |
| Sika AG | | 25,331 | 161,660,151 |
| UBS Group AG | | 7,873,537 | 134,522,743 |
|
| TOTAL SWITZERLAND | | | 468,697,993 |
|
| Taiwan - 1.0% | | | |
| Taiwan Semiconductor Manufacturing Co. Ltd. sponsored ADR | | 5,705,100 | 188,667,657 |
| Thailand - 0.2% | | | |
| Kasikornbank PCL (For. Reg.) | | 8,066,300 | 43,129,061 |
| United Kingdom - 16.4% | | | |
| Ascential PLC | | 5,788,321 | 26,449,534 |
| Booker Group PLC | | 30,017,100 | 75,423,607 |
| British American Tobacco PLC sponsored ADR (b) | | 3,654,200 | 248,631,768 |
| Bunzl PLC | | 2,089,770 | 65,176,616 |
| Close Brothers Group PLC | | 365,400 | 8,007,662 |
| Coca-Cola European Partners PLC | | 1,595,500 | 61,618,210 |
| Compass Group PLC | | 5,821,076 | 117,532,234 |
| Dialog Semiconductor PLC (a) | | 1,265,600 | 59,211,646 |
| Dignity PLC | | 1,100,672 | 35,539,968 |
| Domino's Pizza UK & IRL PLC | | 3,102,000 | 13,278,533 |
| Essentra PLC | | 12,950,820 | 90,830,680 |
| GlaxoSmithKline PLC | | 1,969,300 | 39,637,808 |
| Halma PLC | | 1,985,656 | 27,081,282 |
| Hastings Group Holdings PLC | | 2,092,566 | 8,193,211 |
| Howden Joinery Group PLC | | 1,831,200 | 10,981,296 |
| Ibstock PLC | | 6,893,100 | 20,444,990 |
| IMI PLC | | 1,397,035 | 23,142,734 |
| Imperial Tobacco Group PLC | | 2,139,590 | 104,806,670 |
| Indivior PLC | | 7,595,400 | 32,955,833 |
| Informa PLC | | 4,030,910 | 33,517,758 |
| ITV PLC | | 21,304,300 | 57,945,992 |
| John Wood Group PLC | | 2,360,400 | 23,219,359 |
| Liberty Global PLC Class A (a) | | 1,176,300 | 41,664,546 |
| LivaNova PLC (a) | | 201,600 | 10,624,320 |
| Lloyds Banking Group PLC | | 319,343,100 | 286,938,335 |
| London Stock Exchange Group PLC | | 2,452,700 | 107,469,014 |
| Melrose Industries PLC | | 45,491,037 | 139,345,779 |
| Micro Focus International PLC | | 4,020,383 | 134,762,338 |
| Next PLC | | 1,515,300 | 84,490,643 |
| Polypipe Group PLC | | 3,334,400 | 17,201,441 |
| Prudential PLC | | 12,721,883 | 282,347,725 |
| Reckitt Benckiser Group PLC | | 2,201,587 | 202,848,823 |
| Rio Tinto PLC | | 2,883,000 | 113,735,017 |
| Softcat PLC | | 4,814,100 | 25,689,116 |
| Spectris PLC | | 1,954,100 | 69,854,229 |
| St. James's Place Capital PLC | | 11,611,300 | 172,647,213 |
| Standard Chartered PLC (United Kingdom) (a) | | 4,673,076 | 43,651,121 |
| Standard Life PLC | | 9,250,943 | 43,601,848 |
| TechnipFMC PLC (France) (a) | | 548,370 | 16,486,569 |
| Tesco PLC (a) | | 24,969,200 | 59,257,286 |
| Vodafone Group PLC sponsored ADR | | 3,079,900 | 80,662,581 |
|
| TOTAL UNITED KINGDOM | | | 3,116,905,335 |
|
| United States of America - 6.3% | | | |
| Activision Blizzard, Inc. | | 673,000 | 35,164,250 |
| Alexion Pharmaceuticals, Inc. (a) | | 329,400 | 42,090,732 |
| Alphabet, Inc. Class C (a) | | 184,903 | 167,514,722 |
| Amgen, Inc. | | 668,200 | 109,130,424 |
| Bio-Rad Laboratories, Inc. Class A (a) | | 92,900 | 20,276,354 |
| Coty, Inc. Class A | | 7,810,300 | 139,413,855 |
| Fidelity National Information Services, Inc. | | 570,700 | 48,047,233 |
| MasterCard, Inc. Class A | | 1,127,600 | 131,162,432 |
| Molson Coors Brewing Co. Class B | | 502,600 | 48,194,314 |
| MSCI, Inc. | | 284,900 | 28,581,168 |
| NJOY, Inc. (a)(e) | | 9,361,811 | 94 |
| Oceaneering International, Inc. | | 1,246,700 | 32,900,413 |
| Qualcomm, Inc. | | 1,410,300 | 75,789,522 |
| Quintiles Transnational Holdings, Inc. (a) | | 298,800 | 25,182,864 |
| S&P Global, Inc. | | 938,400 | 125,923,896 |
| Vertex Pharmaceuticals, Inc. (a) | | 286,200 | 33,857,460 |
| Visa, Inc. Class A | | 1,406,700 | 128,319,174 |
|
| TOTAL UNITED STATES OF AMERICA | | | 1,191,548,907 |
|
| TOTAL COMMON STOCKS | | | |
| (Cost $13,488,133,380) | | | 18,029,513,316 |
|
| Nonconvertible Preferred Stocks - 1.4% | | | |
| Brazil - 0.1% | | | |
| Itau Unibanco Holding SA | | 1,554,050 | 19,222,130 |
| Germany - 1.3% | | | |
| Henkel AG & Co. KGaA | | 1,423,000 | 193,759,237 |
| Jungheinrich AG | | 415,400 | 14,466,272 |
| Sartorius AG (non-vtg.) | | 501,684 | 45,937,477 |
|
| TOTAL GERMANY | | | 254,162,986 |
|
| TOTAL NONCONVERTIBLE PREFERRED STOCKS | | | |
| (Cost $178,756,424) | | | 273,385,116 |
| | | Principal Amount(f) | Value |
|
| Government Obligations - 0.1% | | | |
| Japan - 0.1% | | | |
Japan Government 0.1% 4/15/19
(Cost $18,475,883) | JPY | 2,014,800,000 | 18,178,295 |
| | | Shares | Value |
|
| Money Market Funds - 6.4% | | | |
| Fidelity Cash Central Fund, 0.85% (g) | | 626,029,193 | 626,154,399 |
| Fidelity Securities Lending Cash Central Fund 0.86% (g)(h) | | 588,137,491 | 588,196,305 |
| TOTAL MONEY MARKET FUNDS | | | |
| (Cost $1,214,300,424) | | | 1,214,350,704 |
| TOTAL INVESTMENT PORTFOLIO - 102.5% | | | |
| (Cost $14,899,666,111) | | | 19,535,427,431 |
| NET OTHER ASSETS (LIABILITIES) - (2.5)% | | | (483,866,851) |
| NET ASSETS - 100% | | | $19,051,560,580 |
Currency Abbreviations
JPY – Japanese yen
Security Type Abbreviations
ELS – Equity-Linked Security
Categorizations in the Schedule of Investments are based on country or territory of incorporation.
Legend
(a) Non-income producing
(b) Security or a portion of the security is on loan at period end.
(c) Security exempt from registration under Rule 144A of the Securities Act of 1933. These securities may be resold in transactions exempt from registration, normally to qualified institutional buyers. At the end of the period, the value of these securities amounted to $23,178,439 or 0.1% of net assets.
(d) Affiliated company
(e) Restricted securities - Investment in securities not registered under the Securities Act of 1933 (excluding 144A issues). At the end of the period, the value of restricted securities (excluding 144A issues) amounted to $94 or 0.0% of net assets.
(f) Amount is stated in United States dollars unless otherwise noted.
(g) Affiliated fund that is generally available only to investment companies and other accounts managed by Fidelity Investments. The rate quoted is the annualized seven-day yield of the fund at period end. A complete unaudited listing of the fund's holdings as of its most recent quarter end is available upon request. In addition, each Fidelity Central Fund's financial statements, which are not covered by the Fund's Report of Independent Registered Public Accounting Firm, are available on the SEC's website or upon request.
(h) Investment made with cash collateral received from securities on loan.
Additional information on each restricted holding is as follows:
| Security | Acquisition Date | Acquisition Cost |
| NJOY, Inc. | 6/7/13 - 2/14/14 | $10,471,244 |
Affiliated Central Funds
Information regarding fiscal year to date income earned by the Fund from investments in Fidelity Central Funds is as follows:
| Fund | Income earned |
| Fidelity Cash Central Fund | $1,808,513 |
| Fidelity Securities Lending Cash Central Fund | 3,454,069 |
| Total | $5,262,582 |
Other Affiliated Issuers
An affiliated company is a company in which the Fund has ownership of at least 5% of the voting securities. Fiscal year to date transactions with companies which are or were affiliates are as follows:
| Affiliate | Value, beginning of period | Purchases | Sales Proceeds* | Dividend Income | Value, end of period |
| Coor Service Management Holding AB | $30,536,334 | $-- | $1,809,026 | $-- | $30,814,695 |
| Essentra PLC | 88,602,878 | 1,804,660 | 9,651,540 | 2,457,025 | -- |
| Total | $119,139,212 | $1,804,660 | $11,460,566 | $2,457,025 | $30,814,695 |
* Includes the value of securities delivered through in-kind transactions, if applicable.
Investment Valuation
The following is a summary of the inputs used, as of April 30, 2017, involving the Fund's assets and liabilities carried at fair value. The inputs or methodology used for valuing securities may not be an indication of the risk associated with investing in those securities. For more information on valuation inputs, and their aggregation into the levels used below, please refer to the Investment Valuation section in the accompanying Notes to Financial Statements.
| | Valuation Inputs at Reporting Date: |
| Description | Total | Level 1 | Level 2 | Level 3 |
| Investments in Securities: | | | | |
| Equities: | | | | |
| Consumer Discretionary | $2,325,528,849 | $1,640,397,132 | $685,131,623 | $94 |
| Consumer Staples | 2,670,216,974 | 2,000,496,912 | 669,720,062 | -- |
| Energy | 823,822,177 | 686,206,442 | 137,615,735 | -- |
| Financials | 4,358,934,925 | 2,807,150,548 | 1,551,784,377 | -- |
| Health Care | 2,568,162,960 | 1,512,537,700 | 1,055,625,260 | -- |
| Industrials | 2,048,438,745 | 1,589,857,557 | 458,581,188 | -- |
| Information Technology | 2,368,621,506 | 2,132,846,063 | 235,775,443 | -- |
| Materials | 644,753,980 | 466,224,161 | 178,529,819 | -- |
| Real Estate | 67,975,502 | 67,975,502 | -- | -- |
| Telecommunication Services | 406,141,155 | 80,662,581 | 325,478,574 | -- |
| Utilities | 20,301,659 | 20,301,659 | -- | -- |
| Government Obligations | 18,178,295 | -- | 18,178,295 | -- |
| Money Market Funds | 1,214,350,704 | 1,214,350,704 | -- | -- |
| Total Investments in Securities: | $19,535,427,431 | $14,219,006,961 | $5,316,420,376 | $94 |
The following is a summary of transfers between Level 1 and Level 2 for the period ended April 30, 2017. Transfers are assumed to have occurred at the beginning of the period, and are primarily attributable to the valuation techniques used for foreign equity securities, as discussed in the accompanying Notes to Financial Statements:
| Transfers | Total |
| Level 1 to Level 2 | $973,567,419 |
| Level 2 to Level 1 | $517,406,319 |
See accompanying notes which are an integral part of the financial statements.
Fidelity® Diversified International Fund
Financial Statements
Statement of Assets and Liabilities
| | | April 30, 2017 |
| Assets | | |
Investment in securities, at value (including securities loaned of $563,233,857) — See accompanying schedule:
Unaffiliated issuers (cost $13,662,462,321) | $18,290,262,032 | |
| Fidelity Central Funds (cost $1,214,300,424) | 1,214,350,704 | |
| Other affiliated issuers (cost $22,903,366) | 30,814,695 | |
| Total Investments (cost $14,899,666,111) | | $19,535,427,431 |
| Receivable for investments sold | | 74,559,933 |
| Receivable for fund shares sold | | 14,124,963 |
| Dividends receivable | | 99,463,301 |
| Interest receivable | | 792 |
| Distributions receivable from Fidelity Central Funds | | 1,718,151 |
| Prepaid expenses | | 13,155 |
| Other receivables | | 2,251,904 |
| Total assets | | 19,727,559,630 |
| Liabilities | | |
| Payable to custodian bank | $1,223,790 | |
| Payable for investments purchased | 58,625,597 | |
| Payable for fund shares redeemed | 9,230,689 | |
| Accrued management fee | 12,312,244 | |
| Other affiliated payables | 1,984,439 | |
| Other payables and accrued expenses | 4,412,957 | |
| Collateral on securities loaned | 588,209,334 | |
| Total liabilities | | 675,999,050 |
| Net Assets | | $19,051,560,580 |
| Net Assets consist of: | | |
| Paid in capital | | $14,056,726,936 |
| Undistributed net investment income | | 75,737,388 |
| Accumulated undistributed net realized gain (loss) on investments and foreign currency transactions | | 285,620,539 |
| Net unrealized appreciation (depreciation) on investments and assets and liabilities in foreign currencies | | 4,633,475,717 |
| Net Assets | | $19,051,560,580 |
| Diversified International: | | |
| Net Asset Value, offering price and redemption price per share ($10,740,010,702 ÷ 286,835,821 shares) | | $37.44 |
| Class K: | | |
| Net Asset Value, offering price and redemption price per share ($8,311,549,878 ÷ 222,370,796 shares) | | $37.38 |
See accompanying notes which are an integral part of the financial statements.
Statement of Operations
| | | Six months ended April 30, 2017 |
| Investment Income | | |
| Dividends (including $2,457,025 earned from other affiliated issuers) | | $170,170,401 |
| Interest | | 7 |
| Income from Fidelity Central Funds | | 5,262,582 |
| Income before foreign taxes withheld | | 175,432,990 |
| Less foreign taxes withheld | | (12,979,594) |
| Total income | | 162,453,396 |
| Expenses | | |
| Management fee | | |
| Basic fee | $61,761,768 | |
| Performance adjustment | 5,051,076 | |
| Transfer agent fees | 10,898,483 | |
| Accounting and security lending fees | 1,074,405 | |
| Custodian fees and expenses | 995,673 | |
| Independent trustees' fees and expenses | 37,928 | |
| Appreciation in deferred trustee compensation account | 9 | |
| Registration fees | 90,301 | |
| Audit | 77,638 | |
| Legal | 56,468 | |
| Miscellaneous | 77,298 | |
| Total expenses before reductions | 80,121,047 | |
| Expense reductions | (952,117) | 79,168,930 |
| Net investment income (loss) | | 83,284,466 |
| Realized and Unrealized Gain (Loss) | | |
| Net realized gain (loss) on: | | |
| Investment securities: | | |
| Unaffiliated issuers | 792,964,950 | |
| Fidelity Central Funds | (28,010) | |
| Other affiliated issuers | (4,923,429) | |
| Foreign currency transactions | (2,293,960) | |
| Total net realized gain (loss) | | 785,719,551 |
Change in net unrealized appreciation (depreciation) on:
Investment securities (net of increase in deferred foreign taxes of $1,615,432) | 983,933,279 | |
| Assets and liabilities in foreign currencies | 1,958,111 | |
| Total change in net unrealized appreciation (depreciation) | | 985,891,390 |
| Net gain (loss) | | 1,771,610,941 |
| Net increase (decrease) in net assets resulting from operations | | $1,854,895,407 |
See accompanying notes which are an integral part of the financial statements.
Statement of Changes in Net Assets
| | Six months ended April 30, 2017 | Year ended October 31, 2016 |
| Increase (Decrease) in Net Assets | | |
| Operations | | |
| Net investment income (loss) | $83,284,466 | $250,383,197 |
| Net realized gain (loss) | 785,719,551 | (116,794,131) |
| Change in net unrealized appreciation (depreciation) | 985,891,390 | (1,001,178,165) |
| Net increase (decrease) in net assets resulting from operations | 1,854,895,407 | (867,589,099) |
| Distributions to shareholders from net investment income | (223,211,879) | (225,471,164) |
| Distributions to shareholders from net realized gain | (38,126,771) | (89,601,901) |
| Total distributions | (261,338,650) | (315,073,065) |
| Share transactions - net increase (decrease) | (2,141,680,284) | (2,421,343,717) |
| Redemption fees | 24,751 | 142,450 |
| Total increase (decrease) in net assets | (548,098,776) | (3,603,863,431) |
| Net Assets | | |
| Beginning of period | 19,599,659,356 | 23,203,522,787 |
| End of period | $19,051,560,580 | $19,599,659,356 |
| Other Information | | |
| Undistributed net investment income end of period | $75,737,388 | $215,664,801 |
See accompanying notes which are an integral part of the financial statements.
Financial Highlights — Fidelity Diversified International Fund
| | Six months ended April 30, | Years ended October 31, | | | | |
| | 2017 | 2016 | 2015 | 2014 | 2013 | 2012 |
| Selected Per���Share Data | | | | | | |
| Net asset value, beginning of period | $34.28 | $36.07 | $36.22 | $35.89 | $29.07 | $27.49 |
| Income from Investment Operations | | | | | | |
| Net investment income (loss)A | .15 | .39 | .36 | .60B | .44 | .42 |
| Net realized and unrealized gain (loss) | 3.46 | (1.71) | .80 | .28 | 6.90 | 1.65 |
| Total from investment operations | 3.61 | (1.32) | 1.16 | .88 | 7.34 | 2.07 |
| Distributions from net investment income | (.38) | (.33)C | (.40) | (.32) | (.46) | (.49) |
| Distributions from net realized gain | (.07) | (.14)C | (.92) | (.23) | (.07) | – |
| Total distributions | (.45) | (.47) | (1.31)D | (.55) | (.52)E | (.49) |
| Redemption fees added to paid in capitalA,F | – | – | – | – | – | – |
| Net asset value, end of period | $37.44 | $34.28 | $36.07 | $36.22 | $35.89 | $29.07 |
| Total ReturnG,H | 10.70% | (3.70)% | 3.29% | 2.48% | 25.66% | 7.72% |
| Ratios to Average Net AssetsI,J | | | | | | |
| Expenses before reductions | .93%K | 1.05% | 1.00% | .93% | .94% | 1.01% |
| Expenses net of fee waivers, if any | .93%K | 1.05% | .99% | .93% | .94% | 1.01% |
| Expenses net of all reductions | .92%K | 1.05% | .99% | .92% | .92% | .99% |
| Net investment income (loss) | .85%K | 1.15% | .98% | 1.65%B | 1.38% | 1.53% |
| Supplemental Data | | | | | | |
| Net assets, end of period (000 omitted) | $10,740,011 | $10,990,703 | $13,059,983 | $13,781,306 | $14,432,586 | $13,269,769 |
| Portfolio turnover rateL | 36%K,M | 24%M | 31%M | 39%M | 52% | 35% |
A Calculated based on average shares outstanding during the period.
B Net Investment income per share reflects a large, non-recurring dividend which amounted to $.18 per share. Excluding this non-recurring dividend, the ratio of net investment income (loss) to average net assets would have been 1.16%.
C The amounts shown reflect certain reclassifications related to book to tax differences that were made in the year shown.
D Total distributions of $1.31 per share is comprised of distributions from net investment income of $.397 and distributions from net realized gain of $.917 per share.
E Total distributions of $.52 per share is comprised of distributions from net investment income of $.456 and distributions from net realized gain of $.068 per share.
F Amount represents less than $.005 per share.
G Total returns for periods of less than one year are not annualized.
H Total returns would have been lower if certain expenses had not been reduced during the applicable periods shown.
I Fees and expenses of any underlying Fidelity Central Funds are not included in the Fund's expense ratio. The Fund indirectly bears its proportionate share of the expenses of any underlying Fidelity Central Funds.
J Expense ratios reflect operating expenses of the class. Expenses before reductions do not reflect amounts reimbursed by the investment adviser or reductions from brokerage service arrangements or reductions from other expense offset arrangements and do not represent the amount paid by the class during periods when reimbursements or reductions occur. Expenses net of fee waivers reflect expenses after reimbursement by the investment adviser but prior to reductions from brokerage service arrangements or other expense offset arrangements. Expenses net of all reductions represent the net expenses paid by the class.
K Annualized
L Amount does not include the portfolio activity of any underlying Fidelity Central Funds.
M Portfolio turnover rate excludes securities received or delivered in-kind.
See accompanying notes which are an integral part of the financial statements.
Financial Highlights — Fidelity Diversified International Fund Class K
| | Six months ended April 30, | Years ended October 31, | | | | |
| | 2017 | 2016 | 2015 | 2014 | 2013 | 2012 |
| Selected Per–Share Data | | | | | | |
| Net asset value, beginning of period | $34.25 | $36.04 | $36.20 | $35.87 | $29.06 | $27.51 |
| Income from Investment Operations | | | | | | |
| Net investment income (loss)A | .17 | .44 | .40 | .65B | .49 | .47 |
| Net realized and unrealized gain (loss) | 3.46 | (1.71) | .80 | .28 | 6.90 | 1.63 |
| Total from investment operations | 3.63 | (1.27) | 1.20 | .93 | 7.39 | 2.10 |
| Distributions from net investment income | (.43) | (.38)C | (.45) | (.37) | (.51) | (.55) |
| Distributions from net realized gain | (.07) | (.14)C | (.92) | (.23) | (.07) | – |
| Total distributions | (.50) | (.52) | (1.36)D | (.60) | (.58) | (.55) |
| Redemption fees added to paid in capitalA,E | – | – | – | – | – | – |
| Net asset value, end of period | $37.38 | $34.25 | $36.04 | $36.20 | $35.87 | $29.06 |
| Total ReturnF,G | 10.78% | (3.57)% | 3.40% | 2.63% | 25.86% | 7.86% |
| Ratios to Average Net AssetsH,I | | | | | | |
| Expenses before reductions | .80%J | .92% | .87% | .80% | .80% | .84% |
| Expenses net of fee waivers, if any | .80%J | .92% | .87% | .80% | .80% | .84% |
| Expenses net of all reductions | .79%J | .92% | .86% | .79% | .78% | .83% |
| Net investment income (loss) | .98%J | 1.28% | 1.10% | 1.78%B | 1.52% | 1.70% |
| Supplemental Data | | | | | | |
| Net assets, end of period (000 omitted) | $8,311,550 | $8,608,956 | $10,143,540 | $11,134,431 | $11,541,599 | $8,885,304 |
| Portfolio turnover rateK | 36%J,L | 24%L | 31%L | 39%L | 52% | 35% |
A Calculated based on average shares outstanding during the period.
B Net Investment income per share reflects a large, non-recurring dividend which amounted to $.18 per share. Excluding this non-recurring dividend, the ratio of net investment income (loss) to average net assets would have been 1.29%.
C The amounts shown reflect certain reclassifications related to book to tax differences that were made in the year shown.
D Total distributions of $1.36 per share is comprised of distributions from net investment income of $.446 and distributions from net realized gain of $.917 per share.
E Amount represents less than $.005 per share.
F Total returns for periods of less than one year are not annualized.
G Total returns would have been lower if certain expenses had not been reduced during the applicable periods shown.
H Fees and expenses of any underlying Fidelity Central Funds are not included in the Fund's expense ratio. The Fund indirectly bears its proportionate share of the expenses of any underlying Fidelity Central Funds.
I Expense ratios reflect operating expenses of the class. Expenses before reductions do not reflect amounts reimbursed by the investment adviser or reductions from brokerage service arrangements or reductions from other expense offset arrangements and do not represent the amount paid by the class during periods when reimbursements or reductions occur. Expenses net of fee waivers reflect expenses after reimbursement by the investment adviser but prior to reductions from brokerage service arrangements or other expense offset arrangements. Expenses net of all reductions represent the net expenses paid by the class.
J Annualized
K Amount does not include the portfolio activity of any underlying Fidelity Central Funds.
L Portfolio turnover rate excludes securities received or delivered in-kind.
See accompanying notes which are an integral part of the financial statements.
See accompanying notes which are an integral part of the financial statements.
Notes to Financial Statements
For the period ended April 30, 2017
1. Organization.
Fidelity Diversified International Fund (the Fund) is a fund of Fidelity Investment Trust (the Trust) and is authorized to issue an unlimited number of shares. The Trust is registered under the Investment Company Act of 1940, as amended (the 1940 Act), as an open-end management investment company organized as a Massachusetts business trust. The Fund offers Diversified International and Class K shares, each of which has equal rights as to assets and voting privileges. Each class has exclusive voting rights with respect to matters that affect that class.
2. Investments in Fidelity Central Funds.
The Fund invests in Fidelity Central Funds, which are open-end investment companies generally available only to other investment companies and accounts managed by the investment adviser and its affiliates. The Fund's Schedule of Investments lists each of the Fidelity Central Funds held as of period end, if any, as an investment of the Fund, but does not include the underlying holdings of each Fidelity Central Fund. As an Investing Fund, the Fund indirectly bears its proportionate share of the expenses of the underlying Fidelity Central Funds.
The Money Market Central Funds seek preservation of capital and current income and are managed by Fidelity Investments Money Management, Inc. (FIMM), an affiliate of the investment adviser. Annualized expenses of the Money Market Central Funds as of their most recent shareholder report date are less than .005%.
A complete unaudited list of holdings for each Fidelity Central Fund is available upon request or at the Securities and Exchange Commission (the SEC) website at www.sec.gov. In addition, the financial statements of the Fidelity Central Funds, which are not covered by the Fund's Report of Independent Registered Public Accounting Firm, are available on the SEC website or upon request.
3. Significant Accounting Policies.
The Fund is an investment company and applies the accounting and reporting guidance of the Financial Accounting Standards Board (FASB) Accounting Standards Codification Topic 946 Financial Services – Investments Companies. The financial statements have been prepared in conformity with accounting principles generally accepted in the United States of America (GAAP), which require management to make certain estimates and assumptions at the date of the financial statements. Actual results could differ from those estimates. Subsequent events, if any, through the date that the financial statements were issued have been evaluated in the preparation of the financial statements. The following summarizes the significant accounting policies of the Fund:
Investment Valuation. Investments are valued as of 4:00 p.m. Eastern time on the last calendar day of the period. The Board of Trustees (the Board) has delegated the day to day responsibility for the valuation of the Fund's investments to the Fair Value Committee (the Committee) established by the Fund's investment adviser. In accordance with valuation policies and procedures approved by the Board, the Fund attempts to obtain prices from one or more third party pricing vendors or brokers to value its investments. When current market prices, quotations or currency exchange rates are not readily available or reliable, investments will be fair valued in good faith by the Committee, in accordance with procedures adopted by the Board. Factors used in determining fair value vary by investment type and may include market or investment specific events, changes in interest rates and credit quality. The frequency with which these procedures are used cannot be predicted and they may be utilized to a significant extent. The Committee oversees the Fund's valuation policies and procedures and reports to the Board on the Committee's activities and fair value determinations. The Board monitors the appropriateness of the procedures used in valuing the Fund's investments and ratifies the fair value determinations of the Committee.
The Fund categorizes the inputs to valuation techniques used to value its investments into a disclosure hierarchy consisting of three levels as shown below:
- Level 1 – quoted prices in active markets for identical investments
- Level 2 – other significant observable inputs (including quoted prices for similar investments, interest rates, prepayment speeds, etc.)
- Level 3 – unobservable inputs (including the Fund's own assumptions based on the best information available)
Valuation techniques used to value the Fund's investments by major category are as follows:
Equity securities, including restricted securities, for which market quotations are readily available, are valued at the last reported sale price or official closing price as reported by a third party pricing vendor on the primary market or exchange on which they are traded and are categorized as Level 1 in the hierarchy. In the event there were no sales during the day or closing prices are not available, securities are valued at the last quoted bid price or may be valued using the last available price and are generally categorized as Level 2 in the hierarchy. For foreign equity securities, when market or security specific events arise, comparisons to the valuation of American Depositary Receipts (ADRs), futures contracts, Exchange-Traded Funds (ETFs) and certain indexes as well as quoted prices for similar securities may be used and would be categorized as Level 2 in the hierarchy. Utilizing these techniques may result in transfers between Level 1 and Level 2. For equity securities, including restricted securities, where observable inputs are limited, assumptions about market activity and risk are used and these securities may be categorized as Level 3 in the hierarchy.
Debt securities, including restricted securities, are valued based on evaluated prices received from third party pricing vendors or from brokers who make markets in such securities. Foreign government and government agency obligations are valued by pricing vendors who utilize matrix pricing which considers yield or price of bonds of comparable quality, coupon, maturity and type or by broker-supplied prices. When independent prices are unavailable or unreliable, debt securities may be valued utilizing pricing methodologies which consider similar factors that would be used by third party pricing vendors. Debt securities are generally categorized as Level 2 in the hierarchy but may be Level 3 depending on the circumstances.
Investments in open-end mutual funds, including the Fidelity Central Funds, are valued at their closing net asset value (NAV) each business day and are categorized as Level 1 in the hierarchy.
Changes in valuation techniques may result in transfers in or out of an assigned level within the disclosure hierarchy. The aggregate value of investments by input level as of April 30, 2017, including information on transfers between Levels 1 and 2, is included at the end of each Fund's Schedule of Investments.
Foreign Currency. The Fund may use foreign currency contracts to facilitate transactions in foreign-denominated securities. Gains and losses from these transactions may arise from changes in the value of the foreign currency or if the counterparties do not perform under the contracts' terms.
Foreign-denominated assets, including investment securities, and liabilities are translated into U.S. dollars at the exchange rates at period end. Purchases and sales of investment securities, income and dividends received and expenses denominated in foreign currencies are translated into U.S. dollars at the exchange rate in effect on the transaction date.
The effects of exchange rate fluctuations on investments are included with the net realized and unrealized gain (loss) on investment securities. Other foreign currency transactions resulting in realized and unrealized gain (loss) are disclosed separately.
Investment Transactions and Income. For financial reporting purposes, the Fund's investment holdings and NAV include trades executed through the end of the last business day of the period. The NAV per share for processing shareholder transactions is calculated as of the close of business of the New York Stock Exchange (NYSE), normally 4:00 p.m. Eastern time and includes trades executed through the end of the prior business day. Gains and losses on securities sold are determined on the basis of identified cost and may include proceeds received from litigation. Dividend income is recorded on the ex-dividend date, except for certain dividends from foreign securities where the ex-dividend date may have passed, which are recorded as soon as the Fund is informed of the ex-dividend date. Non-cash dividends included in dividend income, if any, are recorded at the fair market value of the securities received. Income and capital gain distributions from Fidelity Central Funds, if any, are recorded on the ex-dividend date. Certain distributions received by the Fund represent a return of capital or capital gain. The Fund determines the components of these distributions subsequent to the ex-dividend date, based upon receipt of tax filings or other correspondence relating to the underlying investment. These distributions are recorded as a reduction of cost of investments and/or as a realized gain. Interest income is accrued as earned and includes coupon interest and amortization of premium and accretion of discount on debt securities as applicable. Investment income is recorded net of foreign taxes withheld where recovery of such taxes is uncertain.
Class Allocations and Expenses. Investment income, realized and unrealized capital gains and losses, common expenses of the Fund, and certain fund-level expense reductions, if any, are allocated daily on a pro-rata basis to each class based on the relative net assets of each class to the total net assets of the Fund. Each class differs with respect to transfer agent fees incurred. Certain expense reductions may also differ by class. For the reporting period, the allocated portion of income and expenses to each class as a percent of its average net assets may vary due to the timing of recording these transactions in relation to fluctuating net assets of the classes. Expenses directly attributable to a fund are charged to that fund. Expenses attributable to more than one fund are allocated among the respective funds on the basis of relative net assets or other appropriate methods. Expense estimates are accrued in the period to which they relate and adjustments are made when actual amounts are known.
Deferred Trustee Compensation. Under a Deferred Compensation Plan (the Plan), independent Trustees may elect to defer receipt of a portion of their annual compensation. Deferred amounts are invested in a cross-section of Fidelity funds, are marked-to-market and remain in the Fund until distributed in accordance with the Plan. The investment of deferred amounts and the offsetting payable to the Trustees are included in the accompanying Statement of Assets and Liabilities.
Income Tax Information and Distributions to Shareholders. Each year, the Fund intends to qualify as a regulated investment company under Subchapter M of the Internal Revenue Code, including distributing substantially all of its taxable income and realized gains. As a result, no provision for U.S. Federal income taxes is required. The Fund files a U.S. federal tax return, in addition to state and local tax returns as required. The Fund's federal income tax returns are subject to examination by the Internal Revenue Service (IRS) for a period of three fiscal years after they are filed. State and local tax returns may be subject to examination for an additional fiscal year depending on the jurisdiction. Foreign taxes are provided for based on the Fund's understanding of the tax rules and rates that exist in the foreign markets in which it invests. The Fund is subject to a tax imposed on capital gains by certain countries in which it invests. An estimated deferred tax liability for net unrealized appreciation on the applicable securities is included in Other payables and accrued expenses on the Statement of Assets & Liabilities.
Distributions are declared and recorded on the ex-dividend date. Income dividends and capital gain distributions are declared separately for each class. Income and capital gain distributions are determined in accordance with income tax regulations, which may differ from GAAP.
Capital accounts within the financial statements are adjusted for permanent book-tax differences. These adjustments have no impact on net assets or the results of operations. Capital accounts are not adjusted for temporary book-tax differences which will reverse in a subsequent period.
Book-tax differences are primarily due to in-kind transactions, futures contracts, foreign currency transactions, passive foreign investment companies (PFIC), market discount, partnerships, deferred trustees compensation, capital loss carryforwards and losses deferred due to wash sales.
The federal tax cost of investment securities and unrealized appreciation (depreciation) as of period end were as follows:
| Gross unrealized appreciation | $4,956,344,552 |
| Gross unrealized depreciation | (513,976,999) |
| Net unrealized appreciation (depreciation) on securities | $4,442,367,553 |
| Tax cost | $15,093,059,878 |
Capital loss carryforwards are only available to offset future capital gains of the Fund to the extent provided by regulations and may be limited. Under the Regulated Investment Company Modernization Act of 2010 (the Act), the Fund is permitted to carry forward capital losses incurred in taxable years beginning after December 22, 2010 for an unlimited period and such capital losses are required to be used prior to any losses that expire. The capital loss carryforward information presented below, including any applicable limitation, is estimated as of prior fiscal period end and is subject to adjustment.
| No expiration | |
| Short-term | $(253,503,329) |
| Long-term | (25,640,185) |
| Total capital loss carryforward | $(279,143,514) |
Short-Term Trading (Redemption) Fees. Shares held by investors in the Fund less than 30 days may have been subject to a redemption fee equal to 1.00% of the NAV of shares redeemed. All redemption fees, which reduce the proceeds of the shareholder redemption, are retained by the Fund and accounted for as an addition to paid in capital. In November 2016, the Board of Trustees approved the elimination of these redemption fees effective December 12, 2016.
Restricted Securities. The Fund may invest in securities that are subject to legal or contractual restrictions on resale. These securities generally may be resold in transactions exempt from registration or to the public if the securities are registered. Disposal of these securities may involve time-consuming negotiations and expense, and prompt sale at an acceptable price may be difficult. Information regarding restricted securities is included at the end of the Fund's Schedule of Investments.
4. Purchases and Sales of Investments.
Purchases and sales of securities, other than short-term securities and in-kind transactions, aggregated $3,216,511,189 and $4,602,699,032, respectively.
Redemptions In-Kind. During the period, 31,504,308 shares of the Fund held by an unaffiliated entity were redeemed in-kind for investments and cash with a value of $1,072,402,638. The net realized gain of $328,380,653 on investments delivered through the in-kind redemptions is included in the accompanying Statement of Operations. The amount of the redemptions is included in share transactions activity shown in the accompanying Statement of Changes in Net Assets as well as the Notes to Financial Statements. The Fund recognized no gain or loss for federal income tax purposes.
Prior Fiscal Year Redemptions In-Kind. During the prior period, 15,503,523 shares of the Fund held by an unaffiliated entity were redeemed in-kind for investments and cash with a value of $522,690,109. The Fund had a net realized gain of $150,666,425 on investments delivered through the in-kind redemptions. The amount of the redemptions is included in share transactions activity shown in the accompanying Statement of Changes in Net Assets as well as the Notes to Financial Statements. The Fund recognized no gain or loss for federal income tax purposes.
5. Fees and Other Transactions with Affiliates.
Management Fee. Fidelity Management & Research Company (the investment adviser) and its affiliates provide the Fund with investment management related services for which the Fund pays a monthly management fee. The management fee is the sum of an individual fund fee rate that is based on an annual rate of .424% of the Fund's average net assets and an annualized group fee rate that averaged .25% during the period. The group fee rate is based upon the average net assets of all the mutual funds advised by the investment adviser, including any mutual funds previously advised by the investment adviser that are currently advised by Fidelity SelectCo, LLC, an affiliate of the investment adviser. The group fee rate decreases as assets under management increase and increases as assets under management decrease. In addition, the management fee is subject to a performance adjustment (up to a maximum of +/- .20% of the Fund's average net assets over a 36 month performance period). The upward or downward adjustment to the management fee is based on the relative investment performance of Diversified International as compared to its benchmark index, the MSCI EAFE Index, over the same 36 month performance period. For the reporting period, the total annualized management fee rate, including the performance adjustment, was .73% of the Fund's average net assets. The performance adjustment included in the management fee rate may be higher or lower than the maximum performance adjustment rate due to the difference between the average net assets for the reporting and performance periods.
Transfer Agent Fees. Fidelity Investments Institutional Operations Company, Inc., (FIIOC), an affiliate of the investment adviser, is the transfer, dividend disbursing and shareholder servicing agent for each class of the Fund. FIIOC receives account fees and asset-based fees that vary according to the account size and type of account of the shareholders of Diversified International. FIIOC receives an asset-based fee of Class K's average net assets. FIIOC pays for typesetting, printing and mailing of shareholder reports, except proxy statements.
For the period, transfer agent fees for each class were as follows:
| | Amount | % of
Class-Level Average
Net Assets(a) |
| Diversified International | $8,982,024 | .17 |
| Class K | 1,916,459 | .05 |
| | $10,898,483 | |
(a) Annualized
Accounting and Security Lending Fees. Fidelity Service Company, Inc. (FSC), an affiliate of the investment adviser, maintains the Fund's accounting records. The accounting fee is based on the level of average net assets for each month. Under a separate contract, FSC administers the security lending program. The security lending fee is based on the number and duration of lending transactions.
Brokerage Commissions. The Fund placed a portion of its portfolio transactions with brokerage firms which are affiliates of the investment adviser. Brokerage commissions are included in net realized gain (loss) and change in net unrealized appreciation (depreciation) in the Statement of Operations. The commissions paid to these affiliated firms were $21,114 for the period.
Interfund Trades. The Fund may purchase from or sell securities to other Fidelity Funds under procedures adopted by the Board. The procedures have been designed to ensure these interfund trades are executed in accordance with Rule 17a-7 of the 1940 Act. Interfund trades are included within the respective purchases and sales amounts shown in the Purchases and Sales of Investments note.
Other. During the period, the investment adviser reimbursed the Fund for certain losses in the amount of $2,106.
6. Committed Line of Credit.
The Fund participates with other funds managed by the investment adviser or an affiliate in a $4.25 billion credit facility (the "line of credit") to be utilized for temporary or emergency purposes to fund shareholder redemptions or for other short-term liquidity purposes. The Fund has agreed to pay commitment fees on its pro-rata portion of the line of credit, which amounted to $31,668 and is reflected in Miscellaneous expenses on the Statement of Operations. During the period, the Fund did not borrow on this line of credit.
7. Security Lending.
The Fund lends portfolio securities through a lending agent from time to time in order to earn additional income. For equity securities, a lending agent is used and may loan securities to certain qualified borrowers, including Fidelity Capital Markets (FCM), a broker-dealer affiliated with the Fund. On the settlement date of the loan, the Fund receives collateral (in the form of U.S. Treasury obligations, letters of credit and/or cash) against the loaned securities and maintains collateral in an amount not less than 100% of the market value of the loaned securities during the period of the loan. The market value of the loaned securities is determined at the close of business of the Fund and any additional required collateral is delivered to the Fund on the next business day. The Fund or borrower may terminate the loan at any time, and if the borrower defaults on its obligation to return the securities loaned because of insolvency or other reasons, the Fund may apply collateral received from the borrower against the obligation. The Fund may experience delays and costs in recovering the securities loaned. Any cash collateral received is invested in the Fidelity Securities Lending Cash Central Fund. The value of loaned securities and cash collateral at period end are disclosed on the Fund's Statement of Assets and Liabilities. Security lending income represents the income earned on investing cash collateral, less rebates paid to borrowers and any lending agent fees associated with the loan, plus any premium payments received for lending certain types of securities. Security lending income is presented in the Statement of Operations as a component of Income from Fidelity Central Funds. Total security lending income during the period amounted to $3,454,069. During the period, there were no securities loaned to FCM.
8. Expense Reductions.
Commissions paid to certain brokers with whom the investment adviser, or its affiliates, places trades on behalf of the Fund include an amount in addition to trade execution, which may be rebated back to the Fund to offset certain expenses. This amount totaled $868,765 for the period. Through arrangements with the Fund's custodian, credits realized as a result of certain uninvested cash balances were used to reduce the Fund's expenses. During the period, these credits reduced the Fund's custody expenses by $508.
In addition, during the period the investment adviser reimbursed and/or waived a portion of fund-level operating expenses in the amount of $82,844.
9. Distributions to Shareholders.
Distributions to shareholders of each class were as follows:
| | Six months ended
April 30, 2017 | Year ended October 31, 2016 |
| From net investment income | | |
| Diversified International | $117,261,561 | $119,184,629 |
| Class K | 105,950,318 | 106,286,535 |
| Total | $223,211,879 | $225,471,164 |
| From net realized gain | | |
| Diversified International | $21,125,448 | $50,476,541 |
| Class K | 17,001,323 | 39,125,360 |
| Total | $38,126,771 | $89,601,901 |
10. Share Transactions.
Share transactions for each class were as follows and may contain automatic conversions between classes or exchanges between affiliated funds:
| | Shares | Shares | Dollars | Dollars |
| | Six months ended
April 30, 2017 | Year ended October 31, 2016 | Six months ended
April 30, 2017 | Year ended October 31, 2016 |
| Diversified International | | | | |
| Shares sold | 17,519,187 | 36,129,943 | $604,418,549 | $1,223,164,498 |
| Reinvestment of distributions | 3,851,054 | 4,457,297 | 128,009,018 | 158,724,354 |
| Shares redeemed | (55,129,627)(a) | (82,034,474) | (1,875,998,098)(a) | (2,791,426,898) |
| Net increase (decrease) | (33,759,386) | (41,447,234) | $(1,143,570,531) | $(1,409,538,046) |
| Class K | | | | |
| Shares sold | 19,112,015 | 41,707,314 | $657,593,510 | $1,421,802,525 |
| Reinvestment of distributions | 3,707,830 | 4,092,651 | 122,951,641 | 145,411,895 |
| Shares redeemed | (51,816,109)(a) | (75,871,461)(b) | (1,778,654,904)(a) | (2,579,020,091)(b) |
| Net increase (decrease) | (28,996,264) | (30,071,496) | $(998,109,753) | $(1,011,805,671) |
(a) Amount includes in-kind redemptions (see the Redemptions In-Kind note for additional details).
(b) Amount includes in-kind redemptions (see the prior Redemptions In-Kind note for additional details).
11. Other.
The Fund's organizational documents provide former and current trustees and officers with a limited indemnification against liabilities arising in connection with the performance of their duties to the Fund. In the normal course of business, the Fund may also enter into contracts that provide general indemnifications. The Fund's maximum exposure under these arrangements is unknown as this would be dependent on future claims that may be made against the Fund. The risk of material loss from such claims is considered remote.
Fidelity® International Capital Appreciation Fund
Investment Summary (Unaudited)
Geographic Diversification (% of fund's net assets)
| As of April 30, 2017 |
| | United Kingdom | 15.3% |
| | United States of America* | 14.8% |
| | France | 8.8% |
| | Japan | 5.5% |
| | Germany | 5.2% |
| | India | 5.1% |
| | Canada | 4.1% |
| | Sweden | 3.6% |
| | Switzerland | 3.4% |
| | Other | 34.2% |
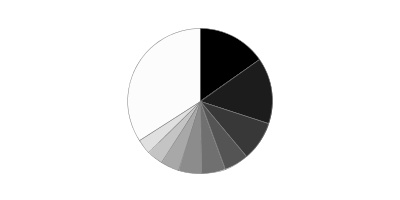
* Includes Short-Term investments and Net Other Assets (Liabilities).
Percentages are based on country or territory of incorporation and are adjusted for the effect of futures contracts, if applicable.
| As of October 31, 2016 |
| | United States of America* | 21.5% |
| | Japan | 12.4% |
| | United Kingdom | 10.7% |
| | Germany | 5.1% |
| | Ireland | 4.3% |
| | France | 3.2% |
| | Switzerland | 3.0% |
| | Cayman Islands | 2.8% |
| | Canada | 2.8% |
| | Other | 34.2% |
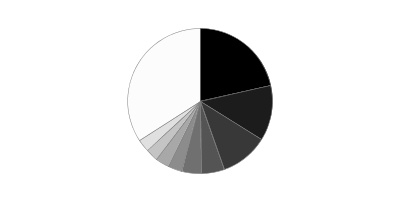
* Includes Short-Term investments and Net Other Assets (Liabilities).
Percentages are based on country or territory of incorporation and are adjusted for the effect of futures contracts, if applicable.
Asset Allocation as of April 30, 2017
| | % of fund's net assets | % of fund's net assets 6 months ago |
| Stocks | 97.5 | 98.6 |
| Short-Term Investments and Net Other Assets (Liabilities) | 2.5 | 1.4 |
Top Ten Stocks as of April 30, 2017
| | % of fund's net assets | % of fund's net assets 6 months ago |
| Nestle SA (Reg. S) (Switzerland, Food Products) | 1.7 | 1.8 |
| Tencent Holdings Ltd. (Cayman Islands, Internet Software & Services) | 1.4 | 1.2 |
| Taiwan Semiconductor Manufacturing Co. Ltd. sponsored ADR (Taiwan, Semiconductors & Semiconductor Equipment) | 1.3 | 1.3 |
| Unilever PLC (United Kingdom, Personal Products) | 1.3 | 1.2 |
| British American Tobacco PLC (United Kingdom) (United Kingdom, Tobacco) | 1.2 | 1.1 |
| Alibaba Group Holding Ltd. sponsored ADR (Cayman Islands, Internet Software & Services) | 1.2 | 1.1 |
| SAP AG (Germany, Software) | 1.0 | 0.0 |
| Naspers Ltd. Class N (South Africa, Media) | 1.0 | 0.9 |
| AIA Group Ltd. (Hong Kong, Insurance) | 1.0 | 0.9 |
| Anheuser-Busch InBev SA NV (Belgium, Beverages) | 0.9 | 1.0 |
| | 12.0 | |
Top Market Sectors as of April 30, 2017
| | % of fund's net assets | % of fund's net assets 6 months ago |
| Industrials | 22.1 | 17.9 |
| Information Technology | 17.1 | 17.7 |
| Consumer Staples | 13.5 | 18.4 |
| Consumer Discretionary | 13.2 | 14.5 |
| Financials | 12.2 | 7.9 |
| Materials | 9.4 | 7.5 |
| Health Care | 6.3 | 8.6 |
| Real Estate | 1.7 | 3.6 |
| Utilities | 1.0 | 0.0 |
| Energy | 0.5 | 0.5 |
Percentages shown as 0.0% may reflect amounts less than 0.05%.
Fidelity® International Capital Appreciation Fund
Investments April 30, 2017 (Unaudited)
Showing Percentage of Net Assets
| Common Stocks - 96.8% | | | |
| | | Shares | Value |
| Australia - 2.3% | | | |
| Amcor Ltd. | | 911,718 | $10,725,130 |
| CSL Ltd. | | 128,975 | 12,801,212 |
| realestate.com.au Ltd. | | 208,761 | 9,612,131 |
| Sydney Airport unit | | 1,882,966 | 9,714,658 |
|
| TOTAL AUSTRALIA | | | 42,853,131 |
|
| Bailiwick of Guernsey - 0.5% | | | |
| Burford Capital Ltd. | | 930,600 | 9,401,442 |
| Bailiwick of Jersey - 1.9% | | | |
| Experian PLC | | 503,500 | 10,831,680 |
| Wolseley PLC | | 185,999 | 11,821,565 |
| WPP PLC | | 539,300 | 11,548,314 |
|
| TOTAL BAILIWICK OF JERSEY | | | 34,201,559 |
|
| Belgium - 0.9% | | | |
| Anheuser-Busch InBev SA NV | | 150,460 | 16,967,430 |
| Bermuda - 1.0% | | | |
| Credicorp Ltd. (United States) | | 66,100 | 10,156,926 |
| IHS Markit Ltd. (a) | | 203,900 | 8,849,260 |
|
| TOTAL BERMUDA | | | 19,006,186 |
|
| Brazil - 1.6% | | | |
| Equatorial Energia SA | | 546,600 | 9,900,296 |
| Kroton Educacional SA | | 2,105,700 | 9,917,996 |
| Ultrapar Participacoes SA | | 425,100 | 9,431,339 |
|
| TOTAL BRAZIL | | | 29,249,631 |
|
| Canada - 4.1% | | | |
| Alimentation Couche-Tard, Inc. Class B (sub. vtg.) | | 251,700 | 11,575,932 |
| Canadian National Railway Co. | | 197,900 | 14,304,819 |
| CCL Industries, Inc. Class B | | 44,220 | 10,236,636 |
| Constellation Software, Inc. | | 20,880 | 9,549,841 |
| Descartes Systems Group, Inc. (a) | | 392,200 | 9,050,438 |
| Open Text Corp. | | 290,700 | 10,079,360 |
| Waste Connection, Inc. (Canada) | | 108,800 | 10,009,233 |
|
| TOTAL CANADA | | | 74,806,259 |
|
| Cayman Islands - 3.2% | | | |
| Alibaba Group Holding Ltd. sponsored ADR (a) | | 181,630 | 20,978,265 |
| NetEase, Inc. ADR | | 42,100 | 11,172,919 |
| Tencent Holdings Ltd. | | 842,300 | 26,392,071 |
|
| TOTAL CAYMAN ISLANDS | | | 58,543,255 |
|
| Denmark - 1.2% | | | |
| Coloplast A/S Series B | | 126,300 | 10,814,540 |
| DSV de Sammensluttede Vognmaend A/S | | 183,100 | 10,200,453 |
|
| TOTAL DENMARK | | | 21,014,993 |
|
| France - 8.8% | | | |
| ALTEN | | 26,000 | 2,203,436 |
| Dassault Systemes SA | | 116,100 | 10,361,501 |
| Essilor International SA | | 88,962 | 11,527,005 |
| Imerys SA | | 112,600 | 9,688,533 |
| L'Oreal SA | | 67,400 | 13,424,631 |
| Legrand SA | | 176,400 | 11,419,624 |
| LVMH Moet Hennessy - Louis Vuitton SA (b) | | 66,338 | 16,376,790 |
| Orpea | | 99,600 | 10,172,424 |
| Rubis | | 97,200 | 9,876,483 |
| Sartorius Stedim Biotech | | 147,900 | 9,919,387 |
| Sodexo SA | | 83,730 | 10,643,867 |
| SR Teleperformance SA | | 86,000 | 10,805,965 |
| Thales SA | | 98,400 | 10,345,701 |
| Valeo SA | | 151,900 | 10,920,668 |
| VINCI SA (b) | | 162,300 | 13,834,222 |
|
| TOTAL FRANCE | | | 161,520,237 |
|
| Germany - 5.2% | | | |
| adidas AG | | 60,091 | 12,037,565 |
| Fresenius SE & Co. KGaA | | 151,220 | 12,257,109 |
| HeidelbergCement Finance AG | | 120,900 | 11,194,191 |
| Henkel AG & Co. KGaA | | 106,489 | 12,429,236 |
| Rheinmetall AG | | 99,800 | 9,158,998 |
| SAP AG | | 177,383 | 17,767,753 |
| Symrise AG | | 154,800 | 10,837,441 |
| Wirecard AG (b) | | 156,611 | 9,248,029 |
|
| TOTAL GERMANY | | | 94,930,322 |
|
| Hong Kong - 1.5% | | | |
| AIA Group Ltd. | | 2,494,800 | 17,271,655 |
| Techtronic Industries Co. Ltd. | | 2,290,500 | 9,835,338 |
|
| TOTAL HONG KONG | | | 27,106,993 |
|
| India - 5.1% | | | |
| Adani Ports & Special Economic Zone Ltd. (a) | | 1,907,767 | 9,724,300 |
| Asian Paints Ltd. | | 598,983 | 10,439,112 |
| HDFC Bank Ltd. | | 428,344 | 10,456,680 |
| Housing Development Finance Corp. Ltd. | | 530,377 | 12,681,117 |
| IndusInd Bank Ltd. (a) | | 436,109 | 9,801,769 |
| ITC Ltd. | | 2,260,525 | 9,774,863 |
| LIC Housing Finance Ltd. | | 1,006,201 | 10,468,935 |
| Maruti Suzuki India Ltd. | | 101,796 | 10,331,368 |
| Zee Entertainment Enterprises Ltd. | | 1,149,050 | 9,416,348 |
|
| TOTAL INDIA | | | 93,094,492 |
|
| Indonesia - 1.1% | | | |
| PT Bank Central Asia Tbk | | 8,445,100 | 11,246,194 |
| PT Bank Rakyat Indonesia Tbk | | 9,993,400 | 9,671,758 |
|
| TOTAL INDONESIA | | | 20,917,952 |
|
| Ireland - 2.4% | | | |
| CRH PLC | | 368,300 | 13,428,578 |
| James Hardie Industries PLC CDI | | 574,764 | 9,756,789 |
| Kerry Group PLC Class A | | 126,100 | 10,304,802 |
| Kingspan Group PLC (Ireland) | | 298,108 | 10,370,222 |
|
| TOTAL IRELAND | | | 43,860,391 |
|
| Israel - 1.1% | | | |
| Check Point Software Technologies Ltd. (a) | | 95,600 | 9,943,356 |
| Frutarom Industries Ltd. | | 170,800 | 10,040,124 |
|
| TOTAL ISRAEL | | | 19,983,480 |
|
| Italy - 1.1% | | | |
| Buzzi Unicem SpA | | 402,200 | 10,339,548 |
| Davide Campari-Milano SpA | | 814,700 | 9,637,736 |
|
| TOTAL ITALY | | | 19,977,284 |
|
| Japan - 5.5% | | | |
| Benefit One, Inc. | | 286,100 | 8,738,915 |
| Daikin Industries Ltd. | | 115,900 | 11,254,698 |
| Kansai Paint Co. Ltd. | | 471,500 | 10,438,771 |
| Keyence Corp. | | 29,640 | 11,911,837 |
| Misumi Group, Inc. | | 490,800 | 9,294,270 |
| Nitori Holdings Co. Ltd. | | 75,800 | 9,866,410 |
| Recruit Holdings Co. Ltd. | | 204,700 | 10,338,291 |
| Relo Holdings Corp. | | 600,600 | 9,859,592 |
| Sundrug Co. Ltd. | | 276,300 | 9,691,258 |
| Tsuruha Holdings, Inc. | | 99,500 | 10,086,118 |
|
| TOTAL JAPAN | | | 101,480,160 |
|
| Kenya - 0.5% | | | |
| Safaricom Ltd. | | 50,026,800 | 9,331,549 |
| Luxembourg - 0.6% | | | |
| Eurofins Scientific SA | | 21,900 | 10,785,148 |
| Mexico - 1.9% | | | |
| CEMEX S.A.B. de CV sponsored ADR | | 1,160,200 | 10,697,044 |
| Grupo Aeroportuario del Pacifico S.A.B. de CV Series B | | 1,017,800 | 10,467,116 |
| Grupo Aeroportuario del Sureste S.A.B. de CV Series B | | 566,855 | 10,756,401 |
| Grupo Cementos de Chihuahua S.A.B. de CV | | 677,700 | 3,214,397 |
|
| TOTAL MEXICO | | | 35,134,958 |
|
| Netherlands - 2.6% | | | |
| ASML Holding NV (Netherlands) | | 95,500 | 12,623,816 |
| Heineken NV (Bearer) | | 124,900 | 11,135,985 |
| RELX NV | | 687,560 | 13,297,769 |
| Wolters Kluwer NV | | 247,100 | 10,494,783 |
|
| TOTAL NETHERLANDS | | | 47,552,353 |
|
| New Zealand - 0.5% | | | |
| Auckland International Airport Ltd. | | 1,944,433 | 9,211,829 |
| Philippines - 1.2% | | | |
| Ayala Land, Inc. | | 4,424,100 | 3,113,979 |
| SM Investments Corp. | | 648,524 | 9,413,985 |
| SM Prime Holdings, Inc. | | 14,722,000 | 8,747,806 |
|
| TOTAL PHILIPPINES | | | 21,275,770 |
|
| Russia - 0.7% | | | |
| Sberbank of Russia | | 4,210,790 | 12,230,484 |
| South Africa - 2.1% | | | |
| Capitec Bank Holdings Ltd. | | 176,521 | 10,072,347 |
| FirstRand Ltd. | | 2,655,000 | 9,903,788 |
| Naspers Ltd. Class N | | 91,777 | 17,451,535 |
|
| TOTAL SOUTH AFRICA | | | 37,427,670 |
|
| Spain - 1.8% | | | |
| Aena SA | | 62,930 | 11,105,043 |
| Amadeus IT Holding SA Class A | | 229,500 | 12,374,720 |
| Grifols SA | | 374,900 | 10,068,574 |
|
| TOTAL SPAIN | | | 33,548,337 |
|
| Sweden - 3.6% | | | |
| ASSA ABLOY AB (B Shares) | | 548,362 | 11,880,671 |
| Atlas Copco AB (A Shares) (b) | | 334,600 | 12,511,659 |
| Hexagon AB (B Shares) (b) | | 232,600 | 10,128,800 |
| Indutrade AB (b) | | 471,660 | 11,145,432 |
| Saab AB (B Shares) | | 205,700 | 10,199,885 |
| Svenska Cellulosa AB (SCA) (B Shares) | | 317,900 | 10,530,507 |
|
| TOTAL SWEDEN | | | 66,396,954 |
|
| Switzerland - 3.4% | | | |
| Kaba Holding AG (B Shares) (Reg.) | | 12,410 | 10,632,688 |
| Nestle SA (Reg. S) | | 402,555 | 31,004,995 |
| Partners Group Holding AG | | 17,140 | 10,361,518 |
| Sika AG | | 1,600 | 10,211,055 |
|
| TOTAL SWITZERLAND | | | 62,210,256 |
|
| Taiwan - 1.3% | | | |
| Taiwan Semiconductor Manufacturing Co. Ltd. sponsored ADR | | 713,900 | 23,608,673 |
| Thailand - 0.5% | | | |
| Airports of Thailand PCL (For. Reg.) | | 7,674,700 | 8,927,939 |
| United Kingdom - 15.3% | | | |
| Ascential PLC | | 2,285,444 | 10,443,258 |
| Ashtead Group PLC | | 509,100 | 10,754,591 |
| BAE Systems PLC | | 1,459,700 | 11,855,648 |
| British American Tobacco PLC (United Kingdom) | | 311,500 | 21,045,990 |
| Bunzl PLC | | 352,242 | 10,985,870 |
| Cineworld Group PLC | | 449,596 | 4,099,510 |
| Compass Group PLC | | 660,176 | 13,329,488 |
| ConvaTec Group PLC | | 2,498,200 | 9,936,738 |
| Halma PLC | | 728,000 | 9,928,796 |
| Imperial Tobacco Group PLC | | 279,717 | 13,701,787 |
| Inchcape PLC | | 804,800 | 8,907,111 |
| InterContinental Hotel Group PLC | | 189,700 | 10,063,849 |
| Intertek Group PLC | | 202,500 | 10,664,224 |
| John David Group PLC | | 1,662,600 | 9,582,628 |
| London Stock Exchange Group PLC | | 248,800 | 10,901,574 |
| Mondi PLC | | 403,600 | 10,460,082 |
| Prudential PLC | | 652,349 | 14,478,144 |
| Reckitt Benckiser Group PLC | | 154,480 | 14,233,408 |
| Rentokil Initial PLC | | 3,054,800 | 9,851,877 |
| Rightmove PLC | | 184,454 | 10,000,556 |
| Sage Group PLC | | 1,234,700 | 10,714,529 |
| St. James's Place Capital PLC | | 725,200 | 10,782,923 |
| Unilever PLC | | 452,200 | 23,264,936 |
| Worldpay Group PLC | | 2,592,400 | 10,073,029 |
|
| TOTAL UNITED KINGDOM | | | 280,060,546 |
|
| United States of America - 12.3% | | | |
| A.O. Smith Corp. | | 176,260 | 9,496,889 |
| Adobe Systems, Inc. (a) | | 71,900 | 9,615,906 |
| Alphabet, Inc. Class C (a) | | 10,903 | 9,877,682 |
| Altria Group, Inc. | | 129,000 | 9,259,620 |
| Amazon.com, Inc. (a) | | 10,797 | 9,987,117 |
| American Tower Corp. | | 73,020 | 9,196,139 |
| Amphenol Corp. Class A | | 125,678 | 9,087,776 |
| Ecolab, Inc. | | 68,100 | 8,791,029 |
| Equifax, Inc. | | 68,230 | 9,232,201 |
| Facebook, Inc. Class A (a) | | 67,240 | 10,102,810 |
| Fiserv, Inc. (a) | | 77,505 | 9,233,946 |
| Henry Schein, Inc. (a) | | 53,700 | 9,333,060 |
| Home Depot, Inc. | | 61,700 | 9,631,370 |
| Marriott International, Inc. Class A | | 97,820 | 9,236,164 |
| MasterCard, Inc. Class A | | 80,830 | 9,402,146 |
| Mettler-Toledo International, Inc. (a) | | 19,070 | 9,790,919 |
| Moody's Corp. | | 85,130 | 10,072,582 |
| MSCI, Inc. | | 88,930 | 8,921,458 |
| Philip Morris International, Inc. | | 82,240 | 9,115,482 |
| Priceline Group, Inc. (a) | | 5,010 | 9,252,568 |
| S&P Global, Inc. | | 71,993 | 9,660,741 |
| Sherwin-Williams Co. | | 27,890 | 9,334,225 |
| The Walt Disney Co. | | 77,200 | 8,924,320 |
| Visa, Inc. Class A | | 103,868 | 9,474,839 |
|
| TOTAL UNITED STATES OF AMERICA | | | 226,030,989 |
|
| TOTAL COMMON STOCKS | | | |
| (Cost $1,443,715,913) | | | 1,772,648,652 |
|
| Nonconvertible Preferred Stocks - 0.7% | | | |
| Brazil - 0.7% | | | |
| Itau Unibanco Holding SA sponsored ADR | | | |
| (Cost $10,870,017) | | 1,040,200 | 12,794,460 |
|
| Money Market Funds - 3.2% | | | |
| Fidelity Cash Central Fund, 0.85% (c) | | 35,303,419 | 35,310,480 |
| Fidelity Securities Lending Cash Central Fund 0.86% (c)(d) | | 24,294,811 | 24,297,240 |
| TOTAL MONEY MARKET FUNDS | | | |
| (Cost $59,607,720) | | | 59,607,720 |
| TOTAL INVESTMENT PORTFOLIO - 100.7% | | | |
| (Cost $1,514,193,650) | | | 1,845,050,832 |
| NET OTHER ASSETS (LIABILITIES) - (0.7)% | | | (13,147,518) |
| NET ASSETS - 100% | | | $1,831,903,314 |
Categorizations in the Schedule of Investments are based on country or territory of incorporation.
Legend
(a) Non-income producing
(b) Security or a portion of the security is on loan at period end.
(c) Affiliated fund that is generally available only to investment companies and other accounts managed by Fidelity Investments. The rate quoted is the annualized seven-day yield of the fund at period end. A complete unaudited listing of the fund's holdings as of its most recent quarter end is available upon request. In addition, each Fidelity Central Fund's financial statements are available on the SEC's website or upon request.
(d) Includes investment made with cash collateral received from securities on loan.
Affiliated Central Funds
Information regarding fiscal year to date income earned by the Fund from investments in Fidelity Central Funds is as follows:
| Fund | Income earned |
| Fidelity Cash Central Fund | $35,455 |
| Fidelity Securities Lending Cash Central Fund | 141,614 |
| Total | $177,069 |
Investment Valuation
The following is a summary of the inputs used, as of April 30, 2017, involving the Fund's assets and liabilities carried at fair value. The inputs or methodology used for valuing securities may not be an indication of the risk associated with investing in those securities. For more information on valuation inputs, and their aggregation into the levels used below, please refer to the Investment Valuation section in the accompanying Notes to Financial Statements.
| | Valuation Inputs at Reporting Date: |
| Description | Total | Level 1 | Level 2 | Level 3 |
| Investments in Securities: | | | | |
| Equities: | | | | |
| Consumer Discretionary | $241,415,713 | $182,709,586 | $58,706,127 | $-- |
| Consumer Staples | 247,184,716 | 140,667,957 | 106,516,759 | -- |
| Energy | 9,431,339 | 9,431,339 | -- | -- |
| Financials | 221,336,495 | 184,171,187 | 37,165,308 | -- |
| Health Care | 117,406,116 | 106,591,576 | 10,814,540 | -- |
| Industrials | 403,903,374 | 355,560,259 | 48,343,115 | -- |
| Information Technology | 314,906,830 | 270,747,006 | 44,159,824 | -- |
| Materials | 169,832,685 | 156,404,107 | 13,428,578 | -- |
| Real Estate | 30,917,516 | 30,917,516 | -- | -- |
| Telecommunication Services | 9,331,549 | 9,331,549 | -- | -- |
| Utilities | 19,776,779 | 19,776,779 | -- | -- |
| Money Market Funds | 59,607,720 | 59,607,720 | -- | -- |
| Total Investments in Securities: | $1,845,050,832 | $1,525,916,581 | $319,134,251 | $-- |
The following is a summary of transfers between Level 1 and Level 2 for the period ended April 30, 2017. Transfers are assumed to have occurred at the beginning of the period, and are primarily attributable to the valuation techniques used for foreign equity securities, as discussed in the accompanying Notes to Financial Statements:
| Transfers | Total |
| Level 1 to Level 2 | $79,274,012 |
| Level 2 to Level 1 | $23,723,322 |
See accompanying notes which are an integral part of the financial statements.
Fidelity® International Capital Appreciation Fund
Financial Statements
Statement of Assets and Liabilities
| | | April 30, 2017 (Unaudited) |
| Assets | | |
Investment in securities, at value (including securities loaned of $23,449,447) — See accompanying schedule:
Unaffiliated issuers (cost $1,454,585,930) | $1,785,443,112 | |
| Fidelity Central Funds (cost $59,607,720) | 59,607,720 | |
| Total Investments (cost $1,514,193,650) | | $1,845,050,832 |
| Cash | | 223,624 |
| Foreign currency held at value (cost $3,014,155) | | 3,013,374 |
| Receivable for investments sold | | 46,976,560 |
| Receivable for fund shares sold | | 1,771,681 |
| Dividends receivable | | 5,691,982 |
| Distributions receivable from Fidelity Central Funds | | 58,486 |
| Prepaid expenses | | 1,128 |
| Other receivables | | 1,116,212 |
| Total assets | | 1,903,903,879 |
| Liabilities | | |
| Payable for investments purchased | $43,421,379 | |
| Payable for fund shares redeemed | 881,637 | |
| Accrued management fee | 1,282,164 | |
| Other affiliated payables | 385,575 | |
| Other payables and accrued expenses | 1,733,409 | |
| Collateral on securities loaned | 24,296,401 | |
| Total liabilities | | 72,000,565 |
| Net Assets | | $1,831,903,314 |
| Net Assets consist of: | | |
| Paid in capital | | $1,512,006,421 |
| Undistributed net investment income | | 2,328,736 |
| Accumulated undistributed net realized gain (loss) on investments and foreign currency transactions | | (11,597,932) |
| Net unrealized appreciation (depreciation) on investments and assets and liabilities in foreign currencies | | 329,166,089 |
| Net Assets, for 99,237,174 shares outstanding | | $1,831,903,314 |
| Net Asset Value, offering price and redemption price per share ($1,831,903,314 ÷ 99,237,174 shares) | | $18.46 |
See accompanying notes which are an integral part of the financial statements.
Statement of Operations
| | | Six months ended April 30, 2017 (Unaudited) |
| Investment Income | | |
| Dividends | | $14,554,458 |
| Income from Fidelity Central Funds | | 177,069 |
| Income before foreign taxes withheld | | 14,731,527 |
| Less foreign taxes withheld | | (1,247,857) |
| Total income | | 13,483,670 |
| Expenses | | |
| Management fee | | |
| Basic fee | $5,994,065 | |
| Performance adjustment | 1,251,192 | |
| Transfer agent fees | 1,894,120 | |
| Accounting and security lending fees | 384,128 | |
| Custodian fees and expenses | 207,695 | |
| Independent trustees' fees and expenses | 3,502 | |
| Registration fees | 31,143 | |
| Audit | 45,016 | |
| Legal | 3,083 | |
| Interest | 9,420 | |
| Miscellaneous | 6,748 | |
| Total expenses before reductions | 9,830,112 | |
| Expense reductions | (316,741) | 9,513,371 |
| Net investment income (loss) | | 3,970,299 |
| Realized and Unrealized Gain (Loss) | | |
| Net realized gain (loss) on: | | |
| Investment securities: | | |
| Unaffiliated issuers | 21,701,807 | |
| Fidelity Central Funds | (1,014) | |
| Foreign currency transactions | 273,800 | |
| Total net realized gain (loss) | | 21,974,593 |
Change in net unrealized appreciation (depreciation) on:
Investment securities (net of increase in deferred foreign taxes of $1,635,299) | 147,555,427 | |
| Assets and liabilities in foreign currencies | 161,680 | |
| Total change in net unrealized appreciation (depreciation) | | 147,717,107 |
| Net gain (loss) | | 169,691,700 |
| Net increase (decrease) in net assets resulting from operations | | $173,661,999 |
See accompanying notes which are an integral part of the financial statements.
Statement of Changes in Net Assets
| | Six months ended April 30, 2017 (Unaudited) | Year ended October 31, 2016 |
| Increase (Decrease) in Net Assets | | |
| Operations | | |
| Net investment income (loss) | $3,970,299 | $10,859,104 |
| Net realized gain (loss) | 21,974,593 | (29,008,640) |
| Change in net unrealized appreciation (depreciation) | 147,717,107 | 25,818,745 |
| Net increase (decrease) in net assets resulting from operations | 173,661,999 | 7,669,209 |
| Distributions to shareholders from net investment income | (11,269,814) | (5,627,463) |
| Distributions to shareholders from net realized gain | – | (15,577,465) |
| Total distributions | (11,269,814) | (21,204,928) |
| Share transactions | | |
| Proceeds from sales of shares | 223,306,634 | 842,025,223 |
| Reinvestment of distributions | 8,894,166 | 16,837,345 |
| Cost of shares redeemed | (345,607,194) | (442,103,123) |
| Net increase (decrease) in net assets resulting from share transactions | (113,406,394) | 416,759,445 |
| Redemption fees | 5,994 | 27,867 |
| Total increase (decrease) in net assets | 48,991,785 | 403,251,593 |
| Net Assets | | |
| Beginning of period | 1,782,911,529 | 1,379,659,936 |
| End of period | $1,831,903,314 | $1,782,911,529 |
| Other Information | | |
| Undistributed net investment income end of period | $2,328,736 | $9,628,251 |
| Shares | | |
| Sold | 13,455,439 | 51,214,325 |
| Issued in reinvestment of distributions | 557,628 | 1,001,031 |
| Redeemed | (20,832,146) | (27,391,439) |
| Net increase (decrease) | (6,819,079) | 24,823,917 |
See accompanying notes which are an integral part of the financial statements.
Financial Highlights — Fidelity International Capital Appreciation Fund
| | Six months ended (Unaudited) April 30, | Years ended October 31, | | | | |
| | 2017 | 2016 | 2015 | 2014 | 2013 | 2012 |
| Selected Per–Share Data | | | | | | |
| Net asset value, beginning of period | $16.81 | $16.98 | $17.22 | $16.28 | $13.12 | $11.89 |
| Income from Investment Operations | | | | | | |
| Net investment income (loss)A | .04 | .12 | .11 | .13 | .13 | .12 |
| Net realized and unrealized gain (loss) | 1.72 | (.03) | .56 | .93 | 3.16 | 1.24 |
| Total from investment operations | 1.76 | .09 | .67 | 1.06 | 3.29 | 1.36 |
| Distributions from net investment income | (.11) | (.07) | (.09) | (.12) | (.13) | (.12) |
| Distributions from net realized gain | – | (.19) | (.81) | – | – | (.01) |
| Total distributions | (.11) | (.26) | (.91)B | (.12) | (.13) | (.13) |
| Redemption fees added to paid in capitalA,C | – | – | – | – | – | – |
| Net asset value, end of period | $18.46 | $16.81 | $16.98 | $17.22 | $16.28 | $13.12 |
| Total ReturnD,E | 10.56% | .53% | 3.96% | 6.55% | 25.24% | 11.57% |
| Ratios to Average Net AssetsF,G | | | | | | |
| Expenses before reductions | 1.14%H | 1.14% | 1.13% | 1.14% | 1.17% | 1.22% |
| Expenses net of fee waivers, if any | 1.14%H | 1.14% | 1.13% | 1.14% | 1.17% | 1.22% |
| Expenses net of all reductions | 1.11%H | 1.12% | 1.11% | 1.14% | 1.12% | 1.19% |
| Net investment income (loss) | .46%H | .69% | .64% | .74% | .87% | 1.01% |
| Supplemental Data | | | | | | |
| Net assets, end of period (000 omitted) | $1,831,903 | $1,782,912 | $1,379,660 | $1,145,744 | $939,945 | $730,515 |
| Portfolio turnover rateI | 196%H | 167% | 187% | 178% | 136% | 127% |
A Calculated based on average shares outstanding during the period.
B Total distributions of $.91 per share is comprised of distributions from net investment income of $.092 and distributions from net realized gain of $.813 per share.
C Amount represents less than $.005 per share.
D Total returns for periods of less than one year are not annualized.
E Total returns would have been lower if certain expenses had not been reduced during the applicable periods shown.
F Fees and expenses of any underlying Fidelity Central Funds are not included in the Fund's expense ratio. The Fund indirectly bears its proportionate share of the expenses of any underlying Fidelity Central Funds.
G Expense ratios reflect operating expenses of the Fund. Expenses before reductions do not reflect amounts reimbursed by the investment adviser or reductions from brokerage service arrangements or reductions from other expense offset arrangements and do not represent the amount paid by the Fund during periods when reimbursements or reductions occur. Expenses net of fee waivers reflect expenses after reimbursement by the investment adviser but prior to reductions from brokerage service arrangements or other expense offset arrangements. Expenses net of all reductions represent the net expenses paid by the Fund.
H Annualized
I Amount does not include the portfolio activity of any underlying Fidelity Central Funds.
See accompanying notes which are an integral part of the financial statements.
Notes to Financial Statements (Unaudited)
For the period ended April 30, 2017
1. Organization.
Fidelity International Capital Appreciation Fund (the Fund) is a fund of Fidelity Investment Trust (the Trust) and is authorized to issue an unlimited number of shares. Share transactions on the Statement of Changes in Net Assets may contain exchanges between affiliated funds. The Trust is registered under the Investment Company Act of 1940, as amended (the 1940 Act), as an open-end management investment company organized as a Massachusetts business trust. The Fund's investments in emerging markets can be subject to social, economic, regulatory, and political uncertainties and can be extremely volatile.
2. Investments in Fidelity Central Funds.
The Fund invests in Fidelity Central Funds, which are open-end investment companies generally available only to other investment companies and accounts managed by the investment adviser and its affiliates. The Fund's Schedule of Investments lists each of the Fidelity Central Funds held as of period end, if any, as an investment of the Fund, but does not include the underlying holdings of each Fidelity Central Fund. As an Investing Fund, the Fund indirectly bears its proportionate share of the expenses of the underlying Fidelity Central Funds.
The Money Market Central Funds seek preservation of capital and current income and are managed by Fidelity Investments Money Management, Inc. (FIMM), an affiliate of the investment adviser. Annualized expenses of the Money Market Central Funds as of their most recent shareholder report date are less than .005%.
A complete unaudited list of holdings for each Fidelity Central Fund is available upon request or at the Securities and Exchange Commission (the SEC) website at www.sec.gov. In addition, the financial statements of the Fidelity Central Funds are available on the SEC website or upon request.
3. Significant Accounting Policies.
The Fund is an investment company and applies the accounting and reporting guidance of the Financial Accounting Standards Board (FASB) Accounting Standards Codification Topic 946 Financial Services – Investments Companies. The financial statements have been prepared in conformity with accounting principles generally accepted in the United States of America (GAAP), which require management to make certain estimates and assumptions at the date of the financial statements. Actual results could differ from those estimates. Subsequent events, if any, through the date that the financial statements were issued have been evaluated in the preparation of the financial statements. The following summarizes the significant accounting policies of the Fund:
Investment Valuation. Investments are valued as of 4:00 p.m. Eastern time on the last calendar day of the period. The Board of Trustees (the Board) has delegated the day to day responsibility for the valuation of the Fund's investments to the Fair Value Committee (the Committee) established by the Fund's investment adviser. In accordance with valuation policies and procedures approved by the Board, the Fund attempts to obtain prices from one or more third party pricing vendors or brokers to value its investments. When current market prices, quotations or currency exchange rates are not readily available or reliable, investments will be fair valued in good faith by the Committee, in accordance with procedures adopted by the Board. Factors used in determining fair value vary by investment type and may include market or investment specific events. The frequency with which these procedures are used cannot be predicted and they may be utilized to a significant extent. The Committee oversees the Fund's valuation policies and procedures and reports to the Board on the Committee's activities and fair value determinations. The Board monitors the appropriateness of the procedures used in valuing the Fund's investments and ratifies the fair value determinations of the Committee.
The Fund categorizes the inputs to valuation techniques used to value its investments into a disclosure hierarchy consisting of three levels as shown below:
- Level 1 – quoted prices in active markets for identical investments
- Level 2 – other significant observable inputs (including quoted prices for similar investments, interest rates, prepayment speeds, etc.)
- Level 3 – unobservable inputs (including the Fund's own assumptions based on the best information available)
Valuation techniques used to value the Fund's investments by major category are as follows:
Equity securities, including restricted securities, for which market quotations are readily available, are valued at the last reported sale price or official closing price as reported by a third party pricing vendor on the primary market or exchange on which they are traded and are categorized as Level 1 in the hierarchy. In the event there were no sales during the day or closing prices are not available, securities are valued at the last quoted bid price or may be valued using the last available price and are generally categorized as Level 2 in the hierarchy. For foreign equity securities, when market or security specific events arise, comparisons to the valuation of American Depositary Receipts (ADRs), futures contracts, Exchange-Traded Funds (ETFs) and certain indexes as well as quoted prices for similar securities may be used and would be categorized as Level 2 in the hierarchy. Utilizing these techniques may result in transfers between Level 1 and Level 2. For equity securities, including restricted securities, where observable inputs are limited, assumptions about market activity and risk are used and these securities may be categorized as Level 3 in the hierarchy.
Investments in open-end mutual funds, including the Fidelity Central Funds, are valued at their closing net asset value (NAV) each business day and are categorized as Level 1 in the hierarchy.
Changes in valuation techniques may result in transfers in or out of an assigned level within the disclosure hierarchy. The aggregate value of investments by input level as of April 30, 2017, including information on transfers between Levels 1 and 2 is included at the end of the Fund's Schedule of Investments.
Foreign Currency. The Fund may use foreign currency contracts to facilitate transactions in foreign-denominated securities. Gains and losses from these transactions may arise from changes in the value of the foreign currency or if the counterparties do not perform under the contracts' terms.
Foreign-denominated assets, including investment securities, and liabilities are translated into U.S. dollars at the exchange rates at period end. Purchases and sales of investment securities, income and dividends received and expenses denominated in foreign currencies are translated into U.S. dollars at the exchange rate in effect on the transaction date.
The effects of exchange rate fluctuations on investments are included with the net realized and unrealized gain (loss) on investment securities. Other foreign currency transactions resulting in realized and unrealized gain (loss) are disclosed separately.
Investment Transactions and Income. For financial reporting purposes, the Fund's investment holdings and NAV include trades executed through the end of the last business day of the period. The NAV per share for processing shareholder transactions is calculated as of the close of business of the New York Stock Exchange (NYSE), normally 4:00 p.m. Eastern time and includes trades executed through the end of the prior business day. Gains and losses on securities sold are determined on the basis of identified cost and may include proceeds received from litigation. Dividend income is recorded on the ex-dividend date, except for certain dividends from foreign securities where the ex-dividend date may have passed, which are recorded as soon as the Fund is informed of the ex-dividend date. Non-cash dividends included in dividend income, if any, are recorded at the fair market value of the securities received. Income and capital gain distributions from Fidelity Central Funds, if any, are recorded on the ex-dividend date. Certain distributions received by the Fund represent a return of capital or capital gain. The Fund determines the components of these distributions subsequent to the ex-dividend date, based upon receipt of tax filings or other correspondence relating to the underlying investment. These distributions are recorded as a reduction of cost of investments and/or as a realized gain. Interest income is accrued as earned and includes coupon interest and amortization of premium and accretion of discount on debt securities as applicable. Investment income is recorded net of foreign taxes withheld where recovery of such taxes is uncertain.
Expenses. Expenses directly attributable to a fund are charged to that fund. Expenses attributable to more than one fund are allocated among the respective funds on the basis of relative net assets or other appropriate methods. Expense estimates are accrued in the period to which they relate and adjustments are made when actual amounts are known.
Income Tax Information and Distributions to Shareholders. Each year, the Fund intends to qualify as a regulated investment company under Subchapter M of the Internal Revenue Code, including distributing substantially all of its taxable income and realized gains. As a result, no provision for U.S. Federal income taxes is required. The Fund files a U.S. federal tax return, in addition to state and local tax returns as required. The Fund's federal income tax returns are subject to examination by the Internal Revenue Service (IRS) for a period of three fiscal years after they are filed. State and local tax returns may be subject to examination for an additional fiscal year depending on the jurisdiction. Foreign taxes are provided for based on the Fund's understanding of the tax rules and rates that exist in the foreign markets in which it invests. The Fund is subject to a tax imposed on capital gains by certain countries in which it invests. An estimated deferred tax liability for net unrealized appreciation on the applicable securities is included in Other payables and accrued expenses on the Statement of Assets & Liabilities.
Distributions are declared and recorded on the ex-dividend date. Income and capital gain distributions are determined in accordance with income tax regulations, which may differ from GAAP.
Capital accounts within the financial statements are adjusted for permanent book-tax differences. These adjustments have no impact on net assets or the results of operations. Capital accounts are not adjusted for temporary book-tax differences which will reverse in a subsequent period.
Book-tax differences are primarily due to foreign currency transactions, passive foreign investment companies (PFIC), partnerships, deferred trustees compensation and losses deferred due to wash sales.
The federal tax cost of investment securities and unrealized appreciation (depreciation) as of period end were as follows:
| Gross unrealized appreciation | $334,150,680 |
| Gross unrealized depreciation | (8,760,632) |
| Net unrealized appreciation (depreciation) on securities | $325,390,048 |
| Tax cost | $1,519,660,784 |
Capital loss carryforwards are only available to offset future capital gains of the Fund to the extent provided by regulations and may be limited. Under the Regulated Investment Company Modernization Act of 2010 (the Act), the Fund is permitted to carry forward capital losses incurred in taxable years beginning after December 22, 2010 for an unlimited period and such capital losses are required to be used prior to any losses that expire. The capital loss carryforward information presented below, including any applicable limitation, is estimated as of prior fiscal period end and is subject to adjustment.
| No expiration | |
| Short-term | $(21,968,056) |
Short-Term Trading (Redemption) Fees. During the period, shares held by investors in the Fund less than 30 days may have been subject to a redemption fee equal to 1.00% of the NAV of shares redeemed. All redemption fees, which reduce the proceeds of the shareholder redemption, are retained by the Fund and accounted for as an addition to paid in capital. In November 2016, the Board of Trustees approved the elimination of these redemption fees effective December 12, 2016.
4. Purchases and Sales of Investments.
Purchases and sales of securities, other than short-term securities, aggregated $1,678,213,881 and $1,821,252,292, respectively.
5. Fees and Other Transactions with Affiliates.
Management Fee. Fidelity Management & Research Company and its affiliates provide the Fund with investment management related services for which the Fund pays a monthly management fee. The management fee is the sum of an individual fund fee rate that is based on an annual rate of .45% of the Fund's average net assets and an annualized group fee rate that averaged .25% during the period. The group fee rate is based upon the average net assets of all the mutual funds advised by the investment adviser, including any mutual funds previously advised by the investment adviser that are currently advised by Fidelity SelectCo, LLC, an affiliate of the investment adviser. The group fee rate decreases as assets under management increase and increases as assets under management decrease. In addition, the management fee is subject to a performance adjustment (up to a maximum of +/- .20% of the Fund's average net assets over a 36 month performance period). The upward or downward adjustment to the management fee is based on the Fund's relative investment performance as compared to its benchmark index, the MSCI All Country World ex USA Index, over the same 36 month performance period. For the reporting period, the total annualized management fee rate, including the performance adjustment, was .84% of the Fund's average net assets. The performance adjustment included in the management fee rate may be higher or lower than the maximum performance adjustment rate due to the difference between the average net assets for the reporting and performance periods.
Transfer Agent Fees. Fidelity Investments Institutional Operations Company, Inc. (FIIOC), an affiliate of the investment adviser, is the Fund's transfer, dividend disbursing and shareholder servicing agent. FIIOC receives account fees and asset-based fees that vary according to account size and type of account. FIIOC pays for typesetting, printing and mailing of shareholder reports, except proxy statements. For the period, the transfer agent fees were equivalent to an annualized rate of .22% of average net assets.
Accounting and Security Lending Fees. Fidelity Service Company, Inc. (FSC), an affiliate of the investment adviser, maintains the Fund's accounting records. The fee is based on the level of average net assets for each month. Under a separate contract, FSC administers the security lending program. The security lending fee is based on the number and duration of lending transactions.
Brokerage Commissions. The Fund placed a portion of its portfolio transactions with brokerage firms which are affiliates of the investment adviser. Brokerage commissions are included in net realized gain (loss) and change in net unrealized appreciation (depreciation) in the Statement of Operations. The commissions paid to these affiliated firms were $11,442 for the period.
Interfund Lending Program. Pursuant to an Exemptive Order issued by the SEC, the Fund, along with other registered investment companies having management contracts with Fidelity Management & Research Company (FMR) or other affiliated entities of FMR, may participate in an interfund lending program. This program provides an alternative credit facility allowing the funds to borrow from, or lend money to, other participating affiliated funds. The Fund's activity in this program during the period for which loans were outstanding was as follows:
| Borrower or Lender | Average Loan Balance | Weighted Average Interest Rate | Interest Expense |
| Borrower | $12,299,229 | .79% | $9,420 |
Interfund Trades. The Fund may purchase from or sell securities to other Fidelity Funds under procedures adopted by the Board. The procedures have been designed to ensure these interfund trades are executed in accordance with Rule 17a-7 of the 1940 Act. Interfund trades are included within the respective purchases and sales amounts shown in the Purchases and Sales of Investments note.
6. Committed Line of Credit.
The Fund participates with other funds managed by the investment adviser or an affiliate in a $4.25 billion credit facility (the "line of credit") to be utilized for temporary or emergency purposes to fund shareholder redemptions or for other short-term liquidity purposes. The Fund has agreed to pay commitment fees on its pro-rata portion of the line of credit, which amounted to $2,919 and is reflected in Miscellaneous expenses on the Statement of Operations.
7. Security Lending.
The Fund lends portfolio securities through a lending agent from time to time in order to earn additional income. For equity securities, a lending agent is used and may loan securities to certain qualified borrowers, including Fidelity Capital Markets (FCM), a broker-dealer affiliated with the Fund. On the settlement date of the loan, the Fund receives collateral (in the form of U.S. Treasury obligations, letters of credit and/or cash) against the loaned securities and maintains collateral in an amount not less than 100% of the market value of the loaned securities during the period of the loan. The market value of the loaned securities is determined at the close of business of the Fund and any additional required collateral is delivered to the Fund on the next business day. The Fund or borrower may terminate the loan at any time, and if the borrower defaults on its obligation to return the securities loaned because of insolvency or other reasons, the Fund may apply collateral received from the borrower against the obligation. The Fund may experience delays and costs in recovering the securities loaned. Any cash collateral received is invested in the Fidelity Securities Lending Cash Central Fund. At period end, there were no security loans outstanding. Security lending income represents the income earned on investing cash collateral, less rebates paid to borrowers and any lending agent fees associated with the loan, plus any premium payments received for lending certain types of securities. Security lending income is presented in the Statement of Operations as a component of interest income from Fidelity Central Funds. Total security lending income during the period amounted to $141,614. During the period, there were no securities loaned to FCM.
8. Expense Reductions.
Commissions paid to certain brokers with whom the investment adviser, or its affiliates, places trades on behalf of the Fund include an amount in addition to trade execution, which may be rebated back to the Fund to offset certain expenses. This amount totaled $309,293 for the period.
In addition, during the period the investment adviser reimbursed and/or waived a portion of operating expenses in the amount of $7,448.
9. Other.
The Fund's organizational documents provide former and current trustees and officers with a limited indemnification against liabilities arising in connection with the performance of their duties to the Fund. In the normal course of business, the Fund may also enter into contracts that provide general indemnifications. The Fund's maximum exposure under these arrangements is unknown as this would be dependent on future claims that may be made against the Fund. The risk of material loss from such claims is considered remote.
At the end of the period, Strategic Advisers International II Fund was the owner of record of approximately 21% of the total outstanding shares of the Fund. Mutual funds managed by the investment adviser or its affiliates were the owners of record, in the aggregate, of approximately 25% of the total outstanding shares of the Fund.
Fidelity® Overseas Fund
Investment Summary (Unaudited)
Geographic Diversification (% of fund's net assets)
| As of April 30, 2017 |
| | United Kingdom | 21.9% |
| | Japan | 18.1% |
| | Germany | 8.9% |
| | France | 8.5% |
| | United States of America* | 6.6% |
| | Switzerland | 5.4% |
| | Netherlands | 4.5% |
| | Sweden | 4.2% |
| | Spain | 3.1% |
| | Other | 18.8% |

* Includes Short-Term investments and Net Other Assets (Liabilities).
Percentages are based on country or territory of incorporation and are adjusted for the effect of futures contracts, if applicable.
| As of October 31, 2016 |
| | Japan | 20.6% |
| | United Kingdom | 19.0% |
| | Germany | 9.7% |
| | France | 8.6% |
| | United States of America* | 6.4% |
| | Switzerland | 5.9% |
| | Sweden | 4.6% |
| | Netherlands | 3.3% |
| | Ireland | 2.8% |
| | Other | 19.1% |

* Includes Short-Term investments and Net Other Assets (Liabilities).
Percentages are based on country or territory of incorporation and are adjusted for the effect of futures contracts, if applicable.
Asset Allocation as of April 30, 2017
| | % of fund's net assets | % of fund's net assets 6 months ago |
| Stocks | 96.6 | 98.0 |
| Short-Term Investments and Net Other Assets (Liabilities) | 3.4 | 2.0 |
Top Ten Stocks as of April 30, 2017
| | % of fund's net assets | % of fund's net assets 6 months ago |
| Nestle SA (Reg. S) (Switzerland, Food Products) | 2.1 | 2.3 |
| Unilever NV (NY Reg.) (Netherlands, Personal Products) | 1.5 | 0.0 |
| Bayer AG (Germany, Pharmaceuticals) | 1.5 | 1.2 |
| British American Tobacco PLC (United Kingdom) (United Kingdom, Tobacco) | 1.4 | 1.3 |
| Total SA (France, Oil, Gas & Consumable Fuels) | 1.3 | 1.5 |
| Sanofi SA (France, Pharmaceuticals) | 1.2 | 1.4 |
| SAP AG (Germany, Software) | 1.1 | 1.4 |
| Prudential PLC (United Kingdom, Insurance) | 1.1 | 0.9 |
| UBS Group AG (Switzerland, Capital Markets) | 1.1 | 1.0 |
| AIA Group Ltd. (Hong Kong, Insurance) | 1.1 | 1.1 |
| | 13.4 | |
Top Market Sectors as of April 30, 2017
| | % of fund's net assets | % of fund's net assets 6 months ago |
| Financials | 21.6 | 20.2 |
| Industrials | 15.6 | 12.1 |
| Consumer Staples | 13.2 | 13.1 |
| Health Care | 12.5 | 15.6 |
| Consumer Discretionary | 11.6 | 13.2 |
| Information Technology | 11.1 | 11.8 |
| Materials | 6.4 | 6.8 |
| Energy | 2.6 | 2.3 |
| Telecommunication Services | 1.5 | 1.8 |
| Real Estate | 0.5 | 1.1 |
Percentages shown as 0.0% may reflect amounts less than 0.05%.
Fidelity® Overseas Fund
Investments April 30, 2017 (Unaudited)
Showing Percentage of Net Assets
| Common Stocks - 95.6% | | | |
| | | Shares | Value |
| Australia - 1.8% | | | |
| Adelaide Brighton Ltd. | | 4,044,528 | $17,928,972 |
| Amcor Ltd. | | 4,271,593 | 50,249,516 |
| Aub Group Ltd. | | 2,971,406 | 26,833,365 |
| Life Healthcare Group Ltd. | | 1,672,012 | 2,679,286 |
| Pact Group Holdings Ltd. | | 3,431,805 | 18,116,636 |
|
| TOTAL AUSTRALIA | | | 115,807,775 |
|
| Austria - 0.3% | | | |
| Andritz AG | | 382,600 | 21,159,219 |
| Bailiwick of Guernsey - 0.3% | | | |
| Burford Capital Ltd. | | 2,037,000 | 20,578,915 |
| Bailiwick of Jersey - 2.3% | | | |
| IWG PLC | | 6,169,081 | 25,960,139 |
| Sanne Group PLC | | 2,737,937 | 23,103,337 |
| Wolseley PLC | | 705,130 | 44,816,049 |
| WPP PLC | | 2,250,133 | 48,183,279 |
|
| TOTAL BAILIWICK OF JERSEY | | | 142,062,804 |
|
| Belgium - 2.0% | | | |
| Anheuser-Busch InBev SA NV | | 567,512 | 63,998,537 |
| KBC Groep NV | | 824,651 | 59,538,816 |
|
| TOTAL BELGIUM | | | 123,537,353 |
|
| Bermuda - 1.2% | | | |
| Credicorp Ltd. (United States) | | 116,300 | 17,870,658 |
| IHS Markit Ltd. (a) | | 1,334,800 | 57,930,320 |
|
| TOTAL BERMUDA | | | 75,800,978 |
|
| Canada - 0.5% | | | |
| Constellation Software, Inc. | | 70,400 | 32,198,697 |
| Denmark - 0.2% | | | |
| NNIT A/S (a)(b) | | 496,970 | 14,010,431 |
| France - 8.5% | | | |
| ALTEN | | 363,400 | 30,797,256 |
| Amundi SA | | 700,500 | 46,088,501 |
| AXA SA (b) | | 1,527,000 | 40,740,593 |
| Capgemini SA | | 459,500 | 46,006,057 |
| Christian Dior SA | | 182,497 | 50,086,144 |
| Compagnie de St. Gobain | | 863,100 | 46,585,663 |
| Maisons du Monde SA | | 994,900 | 34,528,102 |
| Publicis Groupe SA | | 642,700 | 46,395,170 |
| Sanofi SA | | 818,742 | 77,366,073 |
| Sodexo SA | | 276,400 | 35,136,330 |
| Total SA | | 1,634,300 | 83,893,908 |
|
| TOTAL FRANCE | | | 537,623,797 |
|
| Germany - 7.9% | | | |
| adidas AG | | 238,734 | 47,823,737 |
| Axel Springer Verlag AG | | 689,700 | 38,698,959 |
| Bayer AG | | 739,897 | 91,549,792 |
| CompuGroup Medical AG | | 470,900 | 23,185,402 |
| Deutsche Post AG | | 1,841,540 | 66,191,981 |
| Fresenius Medical Care AG & Co. KGaA | | 385,800 | 34,247,193 |
| Fresenius SE & Co. KGaA | | 785,500 | 63,668,555 |
| mutares AG | | 305,427 | 4,657,823 |
| ProSiebenSat.1 Media AG | | 777,800 | 33,017,350 |
| SAP AG | | 715,998 | 71,718,688 |
| Wirecard AG (b) | | 393,400 | 23,230,645 |
|
| TOTAL GERMANY | | | 497,990,125 |
|
| Hong Kong - 1.1% | | | |
| AIA Group Ltd. | | 9,714,800 | 67,256,164 |
| India - 0.3% | | | |
| Axis Bank Ltd. | | 2,691,848 | 21,339,249 |
| Indonesia - 0.5% | | | |
| PT Bank Rakyat Indonesia Tbk | | 32,462,500 | 31,417,680 |
| Ireland - 2.7% | | | |
| DCC PLC (United Kingdom) | | 307,600 | 28,406,171 |
| Kerry Group PLC Class A | | 463,264 | 37,857,603 |
| Kingspan Group PLC (Ireland) | | 828,515 | 28,821,382 |
| Medtronic PLC | | 483,200 | 40,149,088 |
| United Drug PLC (United Kingdom) | | 3,294,996 | 31,879,561 |
|
| TOTAL IRELAND | | | 167,113,805 |
|
| Israel - 0.6% | | | |
| Frutarom Industries Ltd. | | 620,172 | 36,455,525 |
| Italy - 1.7% | | | |
| Banca Generali SpA | | 1,190,200 | 34,214,235 |
| Intesa Sanpaolo SpA | | 17,308,900 | 50,526,454 |
| Reply SpA | | 143,400 | 25,133,484 |
|
| TOTAL ITALY | | | 109,874,173 |
|
| Japan - 18.1% | | | |
| AEON Financial Service Co. Ltd. | | 1,331,800 | 25,578,684 |
| Ai Holdings Corp. | | 1,385,700 | 34,084,677 |
| Arc Land Sakamoto Co. Ltd. | | 1,059,400 | 13,105,294 |
| Astellas Pharma, Inc. | | 3,590,300 | 47,345,689 |
| Bridgestone Corp. | | 1,120,200 | 46,707,240 |
| Broadleaf Co. Ltd. | | 1,028,600 | 6,671,252 |
| Daiichikosho Co. Ltd. | | 600,500 | 26,045,459 |
| Daito Trust Construction Co. Ltd. | | 221,600 | 32,601,390 |
| Dentsu, Inc. | | 732,200 | 41,248,854 |
| GMO Internet, Inc. | | 1,523,900 | 18,085,846 |
| Hoya Corp. | | 1,236,800 | 59,069,058 |
| Iriso Electronics Co. Ltd. | | 185,800 | 11,750,527 |
| Japan Tobacco, Inc. | | 1,084,400 | 36,051,011 |
| Kaken Pharmaceutical Co. Ltd. | | 359,900 | 21,340,561 |
| KDDI Corp. | | 1,704,300 | 45,187,936 |
| Keyence Corp. | | 118,080 | 47,454,443 |
| KOMEDA Holdings Co. Ltd. | | 1,044,100 | 18,011,252 |
| Miroku Jyoho Service Co., Ltd. | | 798,300 | 15,131,715 |
| Misumi Group, Inc. | | 1,359,900 | 25,752,401 |
| Morinaga & Co. Ltd. | | 468,000 | 22,124,781 |
| Nabtesco Corp. | | 1,238,700 | 35,113,631 |
| Nakanishi, Inc. | | 779,100 | 30,611,868 |
| Nippon Paint Holdings Co. Ltd. | | 897,100 | 34,403,252 |
| Nitori Holdings Co. Ltd. | | 325,400 | 42,355,272 |
| NOF Corp. | | 1,477,000 | 16,641,507 |
| OBIC Co. Ltd. | | 436,200 | 23,556,170 |
| Olympus Corp. | | 1,695,500 | 65,249,563 |
| ORIX Corp. | | 3,389,000 | 51,712,841 |
| Otsuka Corp. | | 360,200 | 19,290,370 |
| Outsourcing, Inc. (b) | | 509,400 | 19,535,187 |
| Recruit Holdings Co. Ltd. | | 877,900 | 44,337,986 |
| S Foods, Inc. | | 6,800 | 211,976 |
| Ship Healthcare Holdings, Inc. | | 6,400 | 172,064 |
| SMC Corp. | | 119,000 | 33,508,948 |
| Software Service, Inc. | | 108,400 | 4,920,422 |
| Sundrug Co. Ltd. | | 642,600 | 22,539,278 |
| The Suruga Bank Ltd. | | 1,223,900 | 25,570,425 |
| Tsuruha Holdings, Inc. | | 339,900 | 34,454,990 |
| VT Holdings Co. Ltd. | | 3,332,400 | 16,949,727 |
| Welcia Holdings Co. Ltd. | | 914,300 | 29,444,602 |
|
| TOTAL JAPAN | | | 1,143,928,149 |
|
| Kenya - 0.2% | | | |
| Safaricom Ltd. | | 64,839,100 | 12,094,503 |
| Luxembourg - 0.4% | | | |
| Eurofins Scientific SA | | 56,784 | 27,964,560 |
| Netherlands - 4.5% | | | |
| IMCD Group BV | | 1,012,578 | 54,543,410 |
| ING Groep NV (Certificaten Van Aandelen) | | 3,573,800 | 58,251,304 |
| Intertrust NV | | 968,900 | 19,419,779 |
| Koninklijke Philips Electronics NV | | 1,659,400 | 57,303,211 |
| Unilever NV (NY Reg.) (a)(b) | | 1,801,974 | 94,135,122 |
|
| TOTAL NETHERLANDS | | | 283,652,826 |
|
| New Zealand - 0.8% | | | |
| EBOS Group Ltd. | | 2,276,701 | 28,621,879 |
| Trade Maine Group Ltd. | | 6,128,845 | 22,302,744 |
|
| TOTAL NEW ZEALAND | | | 50,924,623 |
|
| Norway - 0.5% | | | |
| Statoil ASA (b) | | 1,702,500 | 28,038,294 |
| Panama - 0.4% | | | |
| Copa Holdings SA Class A | | 219,100 | 25,507,622 |
| Portugal - 0.5% | | | |
| NOS SGPS SA | | 5,170,400 | 29,613,670 |
| Spain - 3.1% | | | |
| Amadeus IT Holding SA Class A | | 1,171,100 | 63,146,122 |
| CaixaBank SA | | 10,197,500 | 46,301,171 |
| Grifols SA ADR | | 2,294,100 | 49,804,911 |
| Prosegur Cash SA | | 13,289,500 | 33,874,430 |
|
| TOTAL SPAIN | | | 193,126,634 |
|
| Sweden - 4.2% | | | |
| Addlife AB (a) | | 838,800 | 15,957,210 |
| Alfa Laval AB (b) | | 1,737,734 | 35,648,140 |
| HEXPOL AB (B Shares) (b) | | 3,223,600 | 35,830,718 |
| Indutrade AB | | 1,143,500 | 27,021,163 |
| Nordea Bank AB | | 5,142,000 | 63,278,652 |
| Svenska Cellulosa AB (SCA) (B Shares) | | 1,418,000 | 46,971,560 |
| Swedbank AB (A Shares) | | 1,598,200 | 37,874,090 |
|
| TOTAL SWEDEN | | | 262,581,533 |
|
| Switzerland - 5.4% | | | |
| Credit Suisse Group AG | | 3,160,830 | 48,205,704 |
| Julius Baer Group Ltd. | | 860,410 | 44,867,544 |
| Nestle SA (Reg. S) | | 1,697,834 | 130,768,030 |
| Sika AG | | 7,900 | 50,417,085 |
| UBS Group AG | | 3,937,566 | 67,274,997 |
|
| TOTAL SWITZERLAND | | | 341,533,360 |
|
| Taiwan - 0.5% | | | |
| Taiwan Semiconductor Manufacturing Co. Ltd. | | 4,353,000 | 27,993,321 |
| United Kingdom - 21.9% | | | |
| Aon PLC | | 228,400 | 27,371,456 |
| Ascential PLC | | 6,751,503 | 30,850,761 |
| Booker Group PLC | | 14,350,000 | 36,057,073 |
| British American Tobacco PLC (United Kingdom) | | 1,292,100 | 87,298,630 |
| BT Group PLC | | 9,269,900 | 36,569,298 |
| Cineworld Group PLC | | 4,271,800 | 38,951,161 |
| Close Brothers Group PLC | | 1,459,321 | 31,980,705 |
| Coca-Cola European Partners PLC | | 672,100 | 25,956,502 |
| Compass Group PLC | | 2,401,300 | 48,484,190 |
| ConvaTec Group PLC | | 9,001,400 | 35,803,601 |
| Cranswick PLC | | 488,600 | 16,972,627 |
| Dechra Pharmaceuticals PLC | | 477,895 | 10,460,586 |
| Diploma PLC | | 2,172,603 | 31,206,766 |
| Equiniti Group PLC | | 5,585,385 | 15,969,476 |
| Essentra PLC | | 3,528,543 | 24,747,465 |
| Exova Group Ltd. PLC | | 8,574,435 | 26,486,876 |
| Halma PLC | | 2,438,900 | 33,262,830 |
| Hastings Group Holdings PLC | | 5,148,350 | 20,157,796 |
| Hikma Pharmaceuticals PLC | | 541,022 | 13,573,173 |
| Hilton Food Group PLC | | 1,138,579 | 11,347,721 |
| Howden Joinery Group PLC | | 4,687,400 | 28,109,288 |
| IMI PLC | | 1,829,199 | 30,301,794 |
| Intertek Group PLC | | 693,400 | 36,516,408 |
| James Fisher and Sons PLC | | 998,358 | 20,766,757 |
| Jardine Lloyd Thompson Group PLC | | 1,698,399 | 24,131,437 |
| John Wood Group PLC | | 3,350,596 | 32,959,960 |
| London Stock Exchange Group PLC | | 754,745 | 33,070,372 |
| Melrose Industries PLC | | 15,054,914 | 46,115,430 |
| Micro Focus International PLC | | 1,261,900 | 42,298,605 |
| Next PLC | | 236,500 | 13,186,852 |
| Prudential PLC | | 3,099,080 | 68,780,556 |
| Reckitt Benckiser Group PLC | | 578,800 | 53,329,212 |
| Rio Tinto PLC | | 1,361,000 | 53,691,765 |
| Rolls-Royce Holdings PLC | | 2,776,266 | 29,198,056 |
| Rotork PLC | | 5,155,247 | 16,418,930 |
| Schroders PLC | | 843,300 | 34,809,758 |
| Shawbrook Group PLC | | 2,815,186 | 12,470,103 |
| Sinclair Pharma PLC (a) | | 10,471,424 | 4,543,467 |
| Spectris PLC | | 1,002,800 | 35,847,613 |
| St. James's Place Capital PLC | | 3,289,805 | 48,915,769 |
| Standard Life PLC | | 7,294,781 | 34,382,001 |
| Tesco PLC (a) | | 5,071,200 | 12,035,049 |
| Ultra Electronics Holdings PLC | | 813,200 | 22,034,129 |
| Victrex PLC | | 909,100 | 22,560,255 |
| Volution Group PLC | | 9,211,967 | 23,385,426 |
|
| TOTAL UNITED KINGDOM | | | 1,383,367,685 |
|
| United States of America - 3.2% | | | |
| Alphabet, Inc. Class C (a) | | 57,493 | 52,086,358 |
| Moody's Corp. | | 234,600 | 27,757,872 |
| PPG Industries, Inc. | | 351,500 | 38,608,760 |
| S&P Global, Inc. | | 411,100 | 55,165,509 |
| Total System Services, Inc. | | 475,800 | 27,268,098 |
|
| TOTAL UNITED STATES OF AMERICA | | | 200,886,597 |
|
| TOTAL COMMON STOCKS | | | |
| (Cost $5,025,999,091) | | | 6,025,440,067 |
|
| Nonconvertible Preferred Stocks - 1.0% | | | |
| Germany - 1.0% | | | |
| Henkel AG & Co. KGaA | | 473,600 | 64,486,560 |
| United Kingdom - 0.0% | | | |
| Rolls-Royce Holdings PLC (C Shares) | | 197,114,886 | 255,303 |
| TOTAL NONCONVERTIBLE PREFERRED STOCKS | | | |
| (Cost $45,884,993) | | | 64,741,863 |
|
| Money Market Funds - 6.1% | | | |
| Fidelity Cash Central Fund, 0.85% (c) | | 190,242,709 | 190,280,758 |
| Fidelity Securities Lending Cash Central Fund 0.86% (c)(d) | | 194,847,305 | 194,866,790 |
| TOTAL MONEY MARKET FUNDS | | | |
| (Cost $385,153,758) | | | 385,147,548 |
| TOTAL INVESTMENT PORTFOLIO - 102.7% | | | |
| (Cost $5,457,037,842) | | | 6,475,329,478 |
| NET OTHER ASSETS (LIABILITIES) - (2.7)% | | | (170,052,233) |
| NET ASSETS - 100% | | | $6,305,277,245 |
Categorizations in the Schedule of Investments are based on country or territory of incorporation.
Legend
(a) Non-income producing
(b) Security or a portion of the security is on loan at period end.
(c) Affiliated fund that is generally available only to investment companies and other accounts managed by Fidelity Investments. The rate quoted is the annualized seven-day yield of the fund at period end. A complete unaudited listing of the fund's holdings as of its most recent quarter end is available upon request. In addition, each Fidelity Central Fund's financial statements are available on the SEC's website or upon request.
(d) Investment made with cash collateral received from securities on loan.
Affiliated Central Funds
Information regarding fiscal year to date income earned by the Fund from investments in Fidelity Central Funds is as follows:
| Fund | Income earned |
| Fidelity Cash Central Fund | $264,427 |
| Fidelity Securities Lending Cash Central Fund | 1,174,652 |
| Total | $1,439,079 |
Investment Valuation
The following is a summary of the inputs used, as of April 30, 2017, involving the Fund's assets and liabilities carried at fair value. The inputs or methodology used for valuing securities may not be an indication of the risk associated with investing in those securities. For more information on valuation inputs, and their aggregation into the levels used below, please refer to the Investment Valuation section in the accompanying Notes to Financial Statements.
| | Valuation Inputs at Reporting Date: |
| Description | Total | Level 1 | Level 2 | Level 3 |
| Investments in Securities: | | | | |
| Equities: | | | | |
| Consumer Discretionary | $721,681,547 | $591,996,728 | $129,684,819 | $-- |
| Consumer Staples | 826,040,864 | 478,611,406 | 347,429,458 | -- |
| Energy | 165,658,919 | 53,726,717 | 111,932,202 | -- |
| Financials | 1,365,948,966 | 1,008,275,640 | 357,673,326 | -- |
| Health Care | 794,173,993 | 543,665,246 | 250,508,747 | -- |
| Industrials | 987,590,808 | 819,279,567 | 168,311,241 | -- |
| Information Technology | 702,982,250 | 557,264,184 | 145,718,066 | -- |
| Materials | 399,651,456 | 345,959,691 | 53,691,765 | -- |
| Real Estate | 32,601,390 | 32,601,390 | -- | -- |
| Telecommunication Services | 93,851,737 | 12,094,503 | 81,757,234 | -- |
| Money Market Funds | 385,147,548 | 385,147,548 | -- | -- |
| Total Investments in Securities: | $6,475,329,478 | $4,828,622,620 | $1,646,706,858 | $-- |
The following is a summary of transfers between Level 1 and Level 2 for the period ended April 30, 2017. Transfers are assumed to have occurred at the beginning of the period, and are primarily attributable to the valuation techniques used for foreign equity securities, as discussed in the accompanying Notes to Financial Statements:
| Transfers | Total |
| Level 1 to Level 2 | $190,226,278 |
| Level 2 to Level 1 | $57,632,360 |
See accompanying notes which are an integral part of the financial statements.
Fidelity® Overseas Fund
Financial Statements
Statement of Assets and Liabilities
| | | April 30, 2017 (Unaudited) |
| Assets | | |
Investment in securities, at value (including securities loaned of $189,260,696) — See accompanying schedule:
Unaffiliated issuers (cost $5,071,884,084) | $6,090,181,930 | |
| Fidelity Central Funds (cost $385,153,758) | 385,147,548 | |
| Total Investments (cost $5,457,037,842) | | $6,475,329,478 |
| Foreign currency held at value (cost $3,628) | | 3,653 |
| Receivable for investments sold | | 15,522,388 |
| Receivable for fund shares sold | | 6,842,795 |
| Dividends receivable | | 27,770,825 |
| Distributions receivable from Fidelity Central Funds | | 372,907 |
| Prepaid expenses | | 3,393 |
| Other receivables | | 392,135 |
| Total assets | | 6,526,237,574 |
| Liabilities | | |
| Payable to custodian bank | $942 | |
| Payable for investments purchased | 18,324,320 | |
| Payable for fund shares redeemed | 2,156,983 | |
| Accrued management fee | 4,094,822 | |
| Other affiliated payables | 862,180 | |
| Other payables and accrued expenses | 649,901 | |
| Collateral on securities loaned | 194,871,181 | |
| Total liabilities | | 220,960,329 |
| Net Assets | | $6,305,277,245 |
| Net Assets consist of: | | |
| Paid in capital | | $6,244,769,799 |
| Undistributed net investment income | | 26,516,672 |
| Accumulated undistributed net realized gain (loss) on investments and foreign currency transactions | | (984,458,215) |
| Net unrealized appreciation (depreciation) on investments and assets and liabilities in foreign currencies | | 1,018,448,989 |
| Net Assets | | $6,305,277,245 |
| Overseas: | | |
| Net Asset Value, offering price and redemption price per share ($5,390,078,788 ÷ 119,449,931 shares) | | $45.12 |
| Class K: | | |
| Net Asset Value, offering price and redemption price per share ($915,198,457 ÷ 20,324,252 shares) | | $45.03 |
See accompanying notes which are an integral part of the financial statements.
Statement of Operations
| | | Six months ended April 30, 2017 (Unaudited) |
| Investment Income | | |
| Dividends | | $60,433,859 |
| Interest | | 1,772 |
| Income from Fidelity Central Funds | | 1,439,079 |
| Income before foreign taxes withheld | | 61,874,710 |
| Less foreign taxes withheld | | (5,070,888) |
| Total income | | 56,803,822 |
| Expenses | | |
| Management fee | | |
| Basic fee | $18,449,554 | |
| Performance adjustment | 3,626,320 | |
| Transfer agent fees | 4,205,900 | |
| Accounting and security lending fees | 798,289 | |
| Custodian fees and expenses | 270,659 | |
| Independent trustees' fees and expenses | 10,941 | |
| Appreciation in deferred trustee compensation account | 95 | |
| Registration fees | 100,298 | |
| Audit | 47,469 | |
| Legal | 27,115 | |
| Miscellaneous | 20,768 | |
| Total expenses before reductions | 27,557,408 | |
| Expense reductions | (158,475) | 27,398,933 |
| Net investment income (loss) | | 29,404,889 |
| Realized and Unrealized Gain (Loss) | | |
| Net realized gain (loss) on: | | |
| Investment securities: | | |
| Unaffiliated issuers | 33,997,926 | |
| Fidelity Central Funds | (4,982) | |
| Foreign currency transactions | (547,296) | |
| Total net realized gain (loss) | | 33,445,648 |
Change in net unrealized appreciation (depreciation) on:
Investment securities | 641,442,202 | |
| Assets and liabilities in foreign currencies | 744,451 | |
| Total change in net unrealized appreciation (depreciation) | | 642,186,653 |
| Net gain (loss) | | 675,632,301 |
| Net increase (decrease) in net assets resulting from operations | | $705,037,190 |
See accompanying notes which are an integral part of the financial statements.
Statement of Changes in Net Assets
| | Six months ended April 30, 2017 (Unaudited) | Year ended October 31, 2016 |
| Increase (Decrease) in Net Assets | | |
| Operations | | |
| Net investment income (loss) | $29,404,889 | $95,870,128 |
| Net realized gain (loss) | 33,445,648 | (60,892,494) |
| Change in net unrealized appreciation (depreciation) | 642,186,653 | (60,859,999) |
| Net increase (decrease) in net assets resulting from operations | 705,037,190 | (25,882,365) |
| Distributions to shareholders from net investment income | (95,770,395) | (49,659,846) |
| Distributions to shareholders from net realized gain | (6,822,055) | (685,981) |
| Total distributions | (102,592,450) | (50,345,827) |
| Share transactions - net increase (decrease) | 389,058,312 | 854,054,931 |
| Redemption fees | 11,066 | 61,587 |
| Total increase (decrease) in net assets | 991,514,118 | 777,888,326 |
| Net Assets | | |
| Beginning of period | 5,313,763,127 | 4,535,874,801 |
| End of period | $6,305,277,245 | $5,313,763,127 |
| Other Information | | |
| Undistributed net investment income end of period | $26,516,672 | $92,882,178 |
See accompanying notes which are an integral part of the financial statements.
Financial Highlights — Fidelity Overseas Fund
| | Six months ended (Unaudited) April 30, | Years ended October 31, | | | | |
| | 2017 | 2016 | 2015 | 2014 | 2013 | 2012 |
| Selected Per–Share Data | | | | | | |
| Net asset value, beginning of period | $40.73 | $41.56 | $39.02 | $39.22 | $31.35 | $29.28 |
| Income from Investment Operations | | | | | | |
| Net investment income (loss)A | .22 | .75B | .52 | .77C | .54 | .73 |
| Net realized and unrealized gain (loss) | 4.95 | (1.15) | 2.69 | (.28) | 8.10 | 2.19 |
| Total from investment operations | 5.17 | (.40) | 3.21 | .49 | 8.64 | 2.92 |
| Distributions from net investment income | (.72) | (.43) | (.67) | (.51) | (.77) | (.83) |
| Distributions from net realized gain | (.05) | (.01) | – | (.18) | – | (.02) |
| Total distributions | (.78)D | (.43)E | (.67) | (.69) | (.77) | (.85) |
| Redemption fees added to paid in capitalA,F | – | – | – | – | – | – |
| Net asset value, end of period | $45.12 | $40.73 | $41.56 | $39.02 | $39.22 | $31.35 |
| Total ReturnG,H | 12.97% | (.97)% | 8.34% | 1.27% | 28.17% | 10.37% |
| Ratios to Average Net AssetsI,J | | | | | | |
| Expenses before reductions | 1.02%K | 1.03% | 1.04% | 1.04% | 1.09% | .69% |
| Expenses net of fee waivers, if any | 1.02%K | 1.03% | 1.04% | 1.04% | 1.09% | .69% |
| Expenses net of all reductions | 1.01%K | 1.03% | 1.03% | 1.04% | 1.06% | .67% |
| Net investment income (loss) | 1.05%K | 1.88%B | 1.28% | 1.93%C | 1.54% | 2.52% |
| Supplemental Data | | | | | | |
| Net assets, end of period (000 omitted) | $5,390,079 | $4,569,084 | $3,844,290 | $2,738,667 | $1,874,922 | $1,639,725 |
| Portfolio turnover rateL | 29%K | 33% | 28% | 41% | 42% | 90% |
A Calculated based on average shares outstanding during the period.
B Net Investment income per share reflects a large, non-recurring dividend which amounted to $.18 per share. Excluding this non-recurring dividend, the ratio of net investment income (loss) to average net assets would have been 1.42%.
C Net Investment income per share reflects a large, non-recurring dividend which amounted to $.24 per share. Excluding this non-recurring dividend, the ratio of net investment income (loss) to average net assets would have been 1.34%.
D Total distributions of $.78 per share is comprised of distributions from net investment income of $.723 and distributions from net realized gain of $.052 per share.
E Total distributions of $.43 per share is comprised of distributions from net investment income of $.428 and distributions from net realized gain of $.006 per share.
F Amount represents less than $.005 per share.
G Total returns for periods of less than one year are not annualized.
H Total returns would have been lower if certain expenses had not been reduced during the applicable periods shown.
I Fees and expenses of any underlying Fidelity Central Funds are not included in the Fund's expense ratio. The Fund indirectly bears its proportionate share of the expenses of any underlying Fidelity Central Funds.
J Expense ratios reflect operating expenses of the class. Expenses before reductions do not reflect amounts reimbursed by the investment adviser or reductions from brokerage service arrangements or reductions from other expense offset arrangements and do not represent the amount paid by the class during periods when reimbursements or reductions occur. Expenses net of fee waivers reflect expenses after reimbursement by the investment adviser but prior to reductions from brokerage service arrangements or other expense offset arrangements. Expenses net of all reductions represent the net expenses paid by the class.
K Annualized
L Amount does not include the portfolio activity of any underlying Fidelity Central Funds.
See accompanying notes which are an integral part of the financial statements.
Financial Highlights — Fidelity Overseas Fund Class K
| | Six months ended (Unaudited) April 30, | Years ended October 31, | | | | |
| | 2017 | 2016 | 2015 | 2014 | 2013 | 2012 |
| Selected Per–Share Data | | | | | | |
| Net asset value, beginning of period | $40.67 | $41.49 | $38.96 | $39.17 | $31.32 | $29.29 |
| Income from Investment Operations | | | | | | |
| Net investment income (loss)A | .24 | .80B | .57 | .82C | .60 | .79 |
| Net realized and unrealized gain (loss) | 4.94 | (1.14) | 2.68 | (.28) | 8.08 | 2.18 |
| Total from investment operations | 5.18 | (.34) | 3.25 | .54 | 8.68 | 2.97 |
| Distributions from net investment income | (.77) | (.47) | (.72) | (.58) | (.83) | (.92) |
| Distributions from net realized gain | (.05) | (.01) | – | (.18) | – | (.02) |
| Total distributions | (.82) | (.48) | (.72) | (.75)D | (.83) | (.94) |
| Redemption fees added to paid in capitalA,E | – | – | – | – | – | – |
| Net asset value, end of period | $45.03 | $40.67 | $41.49 | $38.96 | $39.17 | $31.32 |
| Total ReturnF,G | 13.05% | (.85)% | 8.47% | 1.41% | 28.37% | 10.59% |
| Ratios to Average Net AssetsH,I | | | | | | |
| Expenses before reductions | .90%J | .91% | .91% | .90% | .93% | .51% |
| Expenses net of fee waivers, if any | .90%J | .91% | .91% | .90% | .92% | .51% |
| Expenses net of all reductions | .89%J | .90% | .90% | .90% | .90% | .48% |
| Net investment income (loss) | 1.17%J | 2.00%B | 1.40% | 2.06%C | 1.71% | 2.70% |
| Supplemental Data | | | | | | |
| Net assets, end of period (000 omitted) | $915,198 | $744,679 | $691,585 | $626,817 | $562,490 | $265,484 |
| Portfolio turnover rateK | 29%J | 33% | 28% | 41% | 42% | 90% |
A Calculated based on average shares outstanding during the period.
B Net Investment income per share reflects a large, non-recurring dividend which amounted to $.18 per share. Excluding this non-recurring dividend, the ratio of net investment income (loss) to average net assets would have been 1.55%.
C Net Investment income per share reflects a large, non-recurring dividend which amounted to $.24 per share. Excluding this non-recurring dividend, the ratio of net investment income (loss) to average net assets would have been 1.47%.
D Total distributions of $.75 per share is comprised of distributions from net investment income of $.575 and distributions from net realized gain of $.177 per share.
E Amount represents less than $.005 per share.
F Total returns for periods of less than one year are not annualized.
G Total returns would have been lower if certain expenses had not been reduced during the applicable periods shown.
H Fees and expenses of any underlying Fidelity Central Funds are not included in the Fund's expense ratio. The Fund indirectly bears its proportionate share of the expenses of any underlying Fidelity Central Funds.
I Expense ratios reflect operating expenses of the class. Expenses before reductions do not reflect amounts reimbursed by the investment adviser or reductions from brokerage service arrangements or reductions from other expense offset arrangements and do not represent the amount paid by the class during periods when reimbursements or reductions occur. Expenses net of fee waivers reflect expenses after reimbursement by the investment adviser but prior to reductions from brokerage service arrangements or other expense offset arrangements. Expenses net of all reductions represent the net expenses paid by the class.
J Annualized
K Amount does not include the portfolio activity of any underlying Fidelity Central Funds.
See accompanying notes which are an integral part of the financial statements.
See accompanying notes which are an integral part of the financial statements.
Notes to Financial Statements (Unaudited)
For the period ended April 30, 2017
1. Organization.
Fidelity Overseas Fund (the Fund) is a fund of Fidelity Investment Trust (the Trust) and is authorized to issue an unlimited number of shares. The Trust is registered under the Investment Company Act of 1940, as amended (the 1940 Act), as an open-end management investment company organized as a Massachusetts business trust. The Fund offers Overseas and Class K shares, each of which has equal rights as to assets and voting privileges. Each class has exclusive voting rights with respect to matters that affect that class.
2. Investments in Fidelity Central Funds.
The Fund invests in Fidelity Central Funds, which are open-end investment companies generally available only to other investment companies and accounts managed by the investment adviser and its affiliates. The Fund's Schedule of Investments lists each of the Fidelity Central Funds held as of period end, if any, as an investment of the Fund, but does not include the underlying holdings of each Fidelity Central Fund. As an Investing Fund, the Fund indirectly bears its proportionate share of the expenses of the underlying Fidelity Central Funds.
The Money Market Central Funds seek preservation of capital and current income and are managed by Fidelity Investments Money Management, Inc. (FIMM), an affiliate of the investment adviser. Annualized expenses of the Money Market Central Funds as of their most recent shareholder report date are less than .005%.
A complete unaudited list of holdings for each Fidelity Central Fund is available upon request or at the Securities and Exchange Commission (the SEC) website at www.sec.gov. In addition, the financial statements of the Fidelity Central Funds are available on the SEC website or upon request.
3. Significant Accounting Policies.
The Fund is an investment company and applies the accounting and reporting guidance of the Financial Accounting Standards Board (FASB) Accounting Standards Codification Topic 946 Financial Services – Investments Companies. The financial statements have been prepared in conformity with accounting principles generally accepted in the United States of America (GAAP), which require management to make certain estimates and assumptions at the date of the financial statements. Actual results could differ from those estimates. Subsequent events, if any, through the date that the financial statements were issued have been evaluated in the preparation of the financial statements. The following summarizes the significant accounting policies of the Fund:
Investment Valuation. Investments are valued as of 4:00 p.m. Eastern time on the last calendar day of the period. The Board of Trustees (the Board) has delegated the day to day responsibility for the valuation of the Fund's investments to the Fair Value Committee (the Committee) established by the Fund's investment adviser. In accordance with valuation policies and procedures approved by the Board, the Fund attempts to obtain prices from one or more third party pricing vendors or brokers to value its investments. When current market prices, quotations or currency exchange rates are not readily available or reliable, investments will be fair valued in good faith by the Committee, in accordance with procedures adopted by the Board. Factors used in determining fair value vary by investment type and may include market or investment specific events. The frequency with which these procedures are used cannot be predicted and they may be utilized to a significant extent. The Committee oversees the Fund's valuation policies and procedures and reports to the Board on the Committee's activities and fair value determinations. The Board monitors the appropriateness of the procedures used in valuing the Fund's investments and ratifies the fair value determinations of the Committee.
The Fund categorizes the inputs to valuation techniques used to value its investments into a disclosure hierarchy consisting of three levels as shown below:
- Level 1 – quoted prices in active markets for identical investments
- Level 2 – other significant observable inputs (including quoted prices for similar investments, interest rates, prepayment speeds, etc.)
- Level 3 – unobservable inputs (including the Fund's own assumptions based on the best information available)
Valuation techniques used to value the Fund's investments by major category are as follows:
Equity securities, including restricted securities, for which market quotations are readily available, are valued at the last reported sale price or official closing price as reported by a third party pricing vendor on the primary market or exchange on which they are traded and are categorized as Level 1 in the hierarchy. In the event there were no sales during the day or closing prices are not available, securities are valued at the last quoted bid price or may be valued using the last available price and are generally categorized as Level 2 in the hierarchy. For foreign equity securities, when market or security specific events arise, comparisons to the valuation of American Depositary Receipts (ADRs), futures contracts, Exchange-Traded Funds (ETFs) and certain indexes as well as quoted prices for similar securities may be used and would be categorized as Level 2 in the hierarchy. Utilizing these techniques may result in transfers between Level 1 and Level 2. For equity securities, including restricted securities, where observable inputs are limited, assumptions about market activity and risk are used and these securities may be categorized as Level 3 in the hierarchy.
Investments in open-end mutual funds, including the Fidelity Central Funds, are valued at their closing net asset value (NAV) each business day and are categorized as Level 1 in the hierarchy.
Changes in valuation techniques may result in transfers in or out of an assigned level within the disclosure hierarchy. The aggregate value of investments by input level as of April 30, 2017, including information on transfers between Levels 1 and 2, is included at the end of the Fund's Schedule of Investments.
Foreign Currency. The Fund may use foreign currency contracts to facilitate transactions in foreign-denominated securities. Gains and losses from these transactions may arise from changes in the value of the foreign currency or if the counterparties do not perform under the contracts' terms.
Foreign-denominated assets, including investment securities, and liabilities are translated into U.S. dollars at the exchange rates at period end. Purchases and sales of investment securities, income and dividends received and expenses denominated in foreign currencies are translated into U.S. dollars at the exchange rate in effect on the transaction date.
The effects of exchange rate fluctuations on investments are included with the net realized and unrealized gain (loss) on investment securities. Other foreign currency transactions resulting in realized and unrealized gain (loss) are disclosed separately.
Investment Transactions and Income. For financial reporting purposes, the Fund's investment holdings and NAV include trades executed through the end of the last business day of the period. The NAV per share for processing shareholder transactions is calculated as of the close of business of the New York Stock Exchange (NYSE), normally 4:00 p.m. Eastern time and includes trades executed through the end of the prior business day. Gains and losses on securities sold are determined on the basis of identified cost. Dividend income is recorded on the ex-dividend date, except for certain dividends from foreign securities where the ex-dividend date may have passed, which are recorded as soon as the Fund is informed of the ex-dividend date. Non-cash dividends included in dividend income, if any, are recorded at the fair market value of the securities received. Income and capital gain distributions from Fidelity Central Funds, if any, are recorded on the ex-dividend date. Certain distributions received by the Fund represent a return of capital or capital gain. The Fund determines the components of these distributions subsequent to the ex-dividend date, based upon receipt of tax filings or other correspondence relating to the underlying investment. These distributions are recorded as a reduction of cost of investments and/or as a realized gain. Interest income is accrued as earned and includes coupon interest and amortization of premium and accretion of discount on debt securities as applicable. Investment income is recorded net of foreign taxes withheld where recovery of such taxes is uncertain.
Class Allocations and Expenses. Investment income, realized and unrealized capital gains and losses, common expenses of the Fund, and certain fund-level expense reductions, if any, are allocated daily on a pro-rata basis to each class based on the relative net assets of each class to the total net assets of the Fund. Each class differs with respect to transfer agent fees incurred. Certain expense reductions may also differ by class. For the reporting period, the allocated portion of income and expenses to each class as a percent of its average net assets may vary due to the timing of recording these transactions in relation to fluctuating net assets of the classes. Expenses directly attributable to a fund are charged to that fund. Expenses attributable to more than one fund are allocated among the respective funds on the basis of relative net assets or other appropriate methods. Expense estimates are accrued in the period to which they relate and adjustments are made when actual amounts are known.
Deferred Trustee Compensation. Under a Deferred Compensation Plan (the Plan), independent Trustees may elect to defer receipt of a portion of their annual compensation. Deferred amounts are invested in a cross-section of Fidelity funds, are marked-to-market and remain in the Fund until distributed in accordance with the Plan. The investment of deferred amounts and the offsetting payable to the Trustees are included in the accompanying Statement of Assets and Liabilities.
Income Tax Information and Distributions to Shareholders. Each year, the Fund intends to qualify as a regulated investment company under Subchapter M of the Internal Revenue Code, including distributing substantially all of its taxable income and realized gains. As a result, no provision for U.S. Federal income taxes is required. The Fund files a U.S. federal tax return, in addition to state and local tax returns as required. The Fund's federal income tax returns are subject to examination by the Internal Revenue Service (IRS) for a period of three fiscal years after they are filed. State and local tax returns may be subject to examination for an additional fiscal year depending on the jurisdiction. Foreign taxes are provided for based on the Fund's understanding of the tax rules and rates that exist in the foreign markets in which it invests.
Distributions are declared and recorded on the ex-dividend date. Income dividends and capital gain distributions are declared separately for each class. Income and capital gain distributions are determined in accordance with income tax regulations, which may differ from GAAP.
Capital accounts within the financial statements are adjusted for permanent book-tax differences. These adjustments have no impact on net assets or the results of operations. Capital accounts are not adjusted for temporary book-tax differences which will reverse in a subsequent period.
Book-tax differences are primarily due to foreign currency transactions, passive foreign investment companies (PFIC), deferred trustees compensation, capital loss carryforwards and losses deferred due to wash sales.
The federal tax cost of investment securities and unrealized appreciation (depreciation) as of period end were as follows:
| Gross unrealized appreciation | $1,153,790,595 |
| Gross unrealized depreciation | (137,112,120) |
| Net unrealized appreciation (depreciation) on securities | $1,016,678,475 |
| Tax cost | $5,458,651,003 |
Capital loss carryforwards are only available to offset future capital gains of the Fund to the extent provided by regulations and may be limited. Under the Regulated Investment Company Modernization Act of 2010 (the Act), the Fund is permitted to carry forward capital losses incurred in taxable years beginning after December 22, 2010 for an unlimited period and such capital losses are required to be used prior to any losses that expire. The capital loss carryforward information presented below, including any applicable limitation, is estimated as of prior fiscal period end and is subject to adjustment.
| Fiscal year of expiration | |
| 2017 | $(939,719,765) |
| No expiration | |
| Short-term | (64,208,536) |
| Total capital loss carryforward | $(1,003,928,301) |
Short-Term Trading (Redemption) Fees. Shares held by investors in the Fund less than 30 days may have been subject to a redemption fee equal to 1.00% of the NAV of shares redeemed. All redemption fees, which reduce the proceeds of the shareholder redemption, are retained by the Fund and accounted for as an addition to paid in capital. In November 2016, the Board of Trustees approved the elimination of these redemption fees effective December 12, 2016.
4. Purchases and Sales of Investments.
Purchases and sales of securities, other than short-term securities, aggregated $1,003,425,239 and $794,234,015, respectively.
5. Fees and Other Transactions with Affiliates.
Management Fee. Fidelity Management & Research Company (the investment adviser) and its affiliates provide the Fund with investment management related services for which the Fund pays a monthly management fee. The management fee is the sum of an individual fund fee rate that is based on an annual rate of .424% of the Fund's average net assets and an annualized group fee rate that averaged .25% during the period. The group fee rate is based upon the average net assets of all the mutual funds advised by the investment adviser, including any mutual funds previously advised by the investment adviser that are currently advised by Fidelity SelectCo, LLC, an affiliate of the investment adviser. The group fee rate decreases as assets under management increase and increases as assets under management decrease. In addition, the management fee is subject to a performance adjustment (up to a maximum of +/- .20% of the Fund's average net assets over a 36 month performance period). The upward or downward adjustment to the management fee is based on the relative investment performance of Overseas as compared to its benchmark index, the MSCI EAFE Index, over the same 36 month performance period. For the reporting period, the total annualized management fee rate, including the performance adjustment, was .80% of the Fund's average net assets. The performance adjustment included in the management fee rate may be higher or lower than the maximum performance adjustment rate due to the difference between the average net assets for the reporting and performance periods.
Transfer Agent Fees. Fidelity Investments Institutional Operations Company, Inc., (FIIOC), an affiliate of the investment adviser, is the transfer, dividend disbursing and shareholder servicing agent for each class of the Fund. FIIOC receives account fees and asset-based fees that vary according to the account size and type of account of the shareholders of Overseas. FIIOC receives an asset-based fee of Class K's average net assets. FIIOC pays for typesetting, printing and mailing of shareholder reports, except proxy statements.
For the period, transfer agent fees for each class were as follows:
| | Amount | % of
Class-Level Average
Net Assets(a) |
| Overseas | $4,016,424 | .17 |
| Class K | 189,476 | .05 |
| | $4,205,900 | |
(a) Annualized
Accounting and Security Lending Fees. Fidelity Service Company, Inc. (FSC), an affiliate of the investment adviser, maintains the Fund's accounting records. The accounting fee is based on the level of average net assets for each month. Under a separate contract, FSC administers the security lending program. The security lending fee is based on the number and duration of lending transactions.
Brokerage Commissions. The Fund placed a portion of its portfolio transactions with brokerage firms which are affiliates of the investment adviser. Brokerage commissions are included in net realized gain (loss) and change in net unrealized appreciation (depreciation) in the Statement of Operations. The commissions paid to these affiliated firms were $3,495 for the period.
Interfund Trades. The Fund may purchase from or sell securities to other Fidelity Funds under procedures adopted by the Board. The procedures have been designed to ensure these interfund trades are executed in accordance with Rule 17a-7 of the 1940 Act. Interfund trades are included within the respective purchases and sales amounts shown in the Purchases and Sales of Investments note.
6. Committed Line of Credit.
The Fund participates with other funds managed by the investment adviser or an affiliate in a $4.25 billion credit facility (the "line of credit") to be utilized for temporary or emergency purposes to fund shareholder redemptions or for other short-term liquidity purposes. The Fund has agreed to pay commitment fees on its pro-rata portion of the line of credit, which amounted to $9,146 and is reflected in Miscellaneous expenses on the Statement of Operations.
7. Security Lending.
The Fund lends portfolio securities through a lending agent from time to time in order to earn additional income. For equity securities, a lending agent is used and may loan securities to certain qualified borrowers, including Fidelity Capital Markets (FCM), a broker-dealer affiliated with the Fund. On the settlement date of the loan, the Fund receives collateral (in the form of U.S. Treasury obligations, letters of credit and/or cash) against the loaned securities and maintains collateral in an amount not less than 100% of the market value of the loaned securities during the period of the loan. The market value of the loaned securities is determined at the close of business of the Fund and any additional required collateral is delivered to the Fund on the next business day. The Fund or borrower may terminate the loan at any time, and if the borrower defaults on its obligation to return the securities loaned because of insolvency or other reasons, the Fund may apply collateral received from the borrower against the obligation. The Fund may experience delays and costs in recovering the securities loaned. Any cash collateral received is invested in the Fidelity Securities Lending Cash Central Fund. The value of loaned securities and cash collateral at period end are disclosed on the Fund's Statement of Assets and Liabilities. Security lending income represents the income earned on investing cash collateral, less rebates paid to borrowers and any lending agent fees associated with the loan, plus any premium payments received for lending certain types of securities. Security lending income is presented in the Statement of Operations as a component of Income from Fidelity Central Funds. Total security lending income during the period amounted to $1,174,652. During the period, there were no securities loaned to FCM.
8. Expense Reductions.
Commissions paid to certain brokers with whom the investment adviser, or its affiliates, places trades on behalf of the Fund include an amount in addition to trade execution, which may be rebated back to the Fund to offset certain expenses. This amount totaled $134,924 for the period.
In addition, during the period the investment adviser reimbursed and/or waived a portion of fund-level operating expenses in the amount of $23,551.
9. Distributions to Shareholders.
Distributions to shareholders of each class were as follows:
| | Six months ended
April 30, 2017 | Year ended October 31, 2016 |
| From net investment income | | |
| Overseas | $81,032,152 | $41,702,378 |
| Class K | 14,738,243 | 7,957,468 |
| Total | $95,770,395 | $49,659,846 |
| From net realized gain | | |
| Overseas | $5,828,037 | $584,612 |
| Class K | 994,018 | 101,369 |
| Total | $6,822,055 | $685,981 |
10. Share Transactions.
Share transactions for each class were as follows and may contain automatic conversions between classes or exchanges between affiliated funds:
| | Shares | Shares | Dollars | Dollars |
| | Six months ended
April 30, 2017 | Year ended October 31, 2016 | Six months ended
April 30, 2017 | Year ended October 31, 2016 |
| Overseas | | | | |
| Shares sold | 18,094,751 | 37,524,563 | $751,636,440 | $1,504,705,495 |
| Reinvestment of distributions | 2,111,922 | 981,115 | 82,914,053 | 40,667,201 |
| Shares redeemed | (12,931,845) | (18,839,855) | (526,088,544) | (756,461,832) |
| Net increase (decrease) | 7,274,828 | 19,665,823 | $308,461,949 | $788,910,864 |
| Class K | | | | |
| Shares sold | 4,446,364 | 5,594,348 | $181,807,765 | $223,588,949 |
| Reinvestment of distributions | 401,743 | 194,940 | 15,732,261 | 8,058,837 |
| Shares redeemed | (2,833,149) | (4,150,582) | (116,943,663) | (166,503,719) |
| Net increase (decrease) | 2,014,958 | 1,638,706 | $80,596,363 | $65,144,067 |
11. Other.
The Fund's organizational documents provide former and current trustees and officers with a limited indemnification against liabilities arising in connection with the performance of their duties to the Fund. In the normal course of business, the Fund may also enter into contracts that provide general indemnifications. The Fund's maximum exposure under these arrangements is unknown as this would be dependent on future claims that may be made against the Fund. The risk of material loss from such claims is considered remote.
At the end of the period, mutual funds managed by the investment adviser or its affiliates were the owners of record, in the aggregate, of approximately 33% of the total outstanding shares of the Fund.
Fidelity® Worldwide Fund
Investment Summary (Unaudited)
Geographic Diversification (% of fund's net assets)
| As of April 30, 2017 |
| | United States of America* | 51.3% |
| | United Kingdom | 7.5% |
| | Japan | 6.8% |
| | Germany | 4.9% |
| | France | 3.5% |
| | Netherlands | 3.0% |
| | Switzerland | 2.4% |
| | Canada | 2.2% |
| | Ireland | 1.9% |
| | Other | 16.5% |

* Includes Short-Term investments and Net Other Assets (Liabilities).
Percentages are based on country or territory of incorporation and are adjusted for the effect of futures contracts, if applicable.
| As of October 31, 2016 |
| | United States of America* | 52.4% |
| | Japan | 7.1% |
| | United Kingdom | 5.5% |
| | Germany | 4.8% |
| | Ireland | 3.7% |
| | France | 3.6% |
| | Canada | 2.0% |
| | Netherlands | 2.0% |
| | Switzerland | 1.7% |
| | Other | 17.2% |

* Includes Short-Term investments and Net Other Assets (Liabilities).
Percentages are based on country or territory of incorporation and are adjusted for the effect of futures contracts, if applicable.
Asset Allocation as of April 30, 2017
| | % of fund's net assets | % of fund's net assets 6 months ago |
| Stocks | 98.9 | 97.9 |
| Short-Term Investments and Net Other Assets (Liabilities) | 1.1 | 2.1 |
Top Ten Stocks as of April 30, 2017
| | % of fund's net assets | % of fund's net assets 6 months ago |
| Apple, Inc. (United States of America, Technology Hardware, Storage & Peripherals) | 2.8 | 2.3 |
| adidas AG (Germany, Textiles, Apparel & Luxury Goods) | 2.7 | 1.8 |
| Adobe Systems, Inc. (United States of America, Software) | 2.6 | 3.3 |
| Bank of America Corp. (United States of America, Banks) | 2.6 | 0.0 |
| Alphabet, Inc. Class A (United States of America, Internet Software & Services) | 2.5 | 3.4 |
| Microsoft Corp. (United States of America, Software) | 1.9 | 1.6 |
| British American Tobacco PLC (United Kingdom, Tobacco) | 1.7 | 0.3 |
| S&P Global, Inc. (United States of America, Capital Markets) | 1.5 | 3.3 |
| IHS Markit Ltd. (Bermuda, Professional Services) | 1.5 | 1.2 |
| Activision Blizzard, Inc. (United States of America, Software) | 1.4 | 0.8 |
| | 21.2 | |
Top Market Sectors as of April 30, 2017
| | % of fund's net assets | % of fund's net assets 6 months ago |
| Information Technology | 23.5 | 25.5 |
| Financials | 19.4 | 16.9 |
| Industrials | 14.3 | 11.8 |
| Consumer Discretionary | 13.5 | 12.9 |
| Health Care | 10.3 | 8.3 |
| Consumer Staples | 7.3 | 8.4 |
| Materials | 4.5 | 2.8 |
| Energy | 3.1 | 6.7 |
| Telecommunication Services | 1.6 | 1.4 |
| Real Estate | 1.1 | 2.7 |
Percentages shown as 0.0% may reflect amounts less than 0.05%.
Fidelity® Worldwide Fund
Investments April 30, 2017 (Unaudited)
Showing Percentage of Net Assets
| Common Stocks - 98.8% | | | |
| | | Shares | Value |
| Australia - 0.9% | | | |
| Altium Ltd. | | 99,765 | $612,573 |
| Australia & New Zealand Banking Group Ltd. | | 155,719 | 3,819,894 |
| Bapcor Ltd. | | 597,660 | 2,340,570 |
| Magellan Financial Group Ltd. | | 81,493 | 1,438,898 |
| Ramsay Health Care Ltd. | | 65,163 | 3,498,534 |
| Spark Infrastructure Group unit | | 1,160,368 | 2,163,520 |
|
| TOTAL AUSTRALIA | | | 13,873,989 |
|
| Austria - 0.6% | | | |
| ams AG | | 42,000 | 2,701,508 |
| Erste Group Bank AG | | 85,200 | 3,045,970 |
| Wienerberger AG | | 142,700 | 3,342,027 |
|
| TOTAL AUSTRIA | | | 9,089,505 |
|
| Bailiwick of Jersey - 0.8% | | | |
| Glencore Xstrata PLC | | 1,079,712 | 4,246,372 |
| IWG PLC | | 416,421 | 1,752,343 |
| Randgold Resources Ltd. sponsored ADR | | 13,010 | 1,144,750 |
| Shire PLC | | 38,100 | 2,246,330 |
| Wizz Air Holdings PLC (a) | | 34,000 | 777,250 |
| Wolseley PLC | | 34,278 | 2,178,612 |
|
| TOTAL BAILIWICK OF JERSEY | | | 12,345,657 |
|
| Belgium - 0.5% | | | |
| Anheuser-Busch InBev SA NV | | 13,411 | 1,512,363 |
| KBC Groep NV | | 83,303 | 6,014,377 |
|
| TOTAL BELGIUM | | | 7,526,740 |
|
| Bermuda - 1.5% | | | |
| Axovant Sciences Ltd. (a) | | 5,000 | 121,200 |
| IHS Markit Ltd. (a) | | 527,900 | 22,910,860 |
|
| TOTAL BERMUDA | | | 23,032,060 |
|
| Canada - 2.2% | | | |
| Alimentation Couche-Tard, Inc. Class B (sub. vtg.) | | 51,100 | 2,350,140 |
| Cenovus Energy, Inc. | | 228,100 | 2,274,232 |
| Constellation Software, Inc. | | 5,800 | 2,652,734 |
| First Quantum Minerals Ltd. | | 1,287,000 | 12,266,122 |
| Franco-Nevada Corp. | | 15,400 | 1,049,048 |
| PrairieSky Royalty Ltd. (b) | | 532,999 | 11,616,219 |
| Suncor Energy, Inc. | | 39,400 | 1,234,777 |
|
| TOTAL CANADA | | | 33,443,272 |
|
| Cayman Islands - 1.2% | | | |
| Alibaba Group Holding Ltd. sponsored ADR (a) | | 30,000 | 3,465,000 |
| Ctrip.com International Ltd. ADR (a) | | 17,500 | 883,925 |
| Goodbaby International Holdings Ltd. | | 5,171,000 | 2,346,723 |
| JD.com, Inc. sponsored ADR (a) | | 141,700 | 4,969,419 |
| Melco Crown Entertainment Ltd. sponsored ADR | | 86,300 | 1,894,285 |
| New Oriental Education & Technology Group, Inc. sponsored ADR (a) | | 68,800 | 4,440,352 |
|
| TOTAL CAYMAN ISLANDS | | | 17,999,704 |
|
| Chile - 0.2% | | | |
| Vina San Pedro SA | | 306,277,514 | 2,982,902 |
| China - 0.4% | | | |
| Kweichow Moutai Co. Ltd. (A Shares) | | 41,800 | 2,507,212 |
| Shanghai International Airport Co. Ltd. (A Shares) | | 377,300 | 1,874,596 |
| Wuliangye Yibin Co. Ltd. Class A | | 332,300 | 2,193,320 |
|
| TOTAL CHINA | | | 6,575,128 |
|
| Denmark - 0.6% | | | |
| Nets A/S (c) | | 103,400 | 1,880,757 |
| NNIT A/S (a) | | 110,402 | 3,112,420 |
| Novo Nordisk A/S Series B | | 49,780 | 1,938,277 |
| Novozymes A/S Series B | | 38,200 | 1,650,350 |
|
| TOTAL DENMARK | | | 8,581,804 |
|
| Finland - 0.2% | | | |
| Sampo Oyj (A Shares) (b) | | 53,500 | 2,563,629 |
| France - 3.5% | | | |
| ALTEN | | 23,200 | 1,966,143 |
| Altran Technologies SA | | 112,500 | 1,888,438 |
| Amundi SA | | 70,020 | 4,606,876 |
| Atos Origin SA | | 11,483 | 1,504,764 |
| AXA SA | | 82,400 | 2,198,445 |
| BNP Paribas SA | | 51,300 | 3,619,977 |
| Capgemini SA | | 22,900 | 2,292,794 |
| Cegedim SA (a) | | 35,010 | 974,003 |
| Havas SA | | 315,012 | 2,912,937 |
| Kaufman & Broad SA | | 19,500 | 764,689 |
| Kering SA | | 9,000 | 2,789,643 |
| Maisons du Monde SA | | 84,200 | 2,922,169 |
| Rexel SA | | 98,400 | 1,757,869 |
| Rubis | | 23,800 | 2,418,316 |
| Societe Generale Series A | | 48,800 | 2,675,837 |
| Sodexo SA | | 24,700 | 3,139,896 |
| Total SA | | 202,457 | 10,392,773 |
| VINCI SA | | 51,500 | 4,389,787 |
|
| TOTAL FRANCE | | | 53,215,356 |
|
| Germany - 4.9% | | | |
| adidas AG | | 205,300 | 41,126,162 |
| Aumann AG | | 5,500 | 361,746 |
| Axel Springer Verlag AG | | 43,237 | 2,426,021 |
| Deutsche Borse AG | | 9,362 | 916,293 |
| Deutsche Post AG | | 111,581 | 4,010,647 |
| Deutsche Telekom AG | | 112,300 | 1,969,832 |
| Fresenius SE & Co. KGaA | | 29,600 | 2,399,222 |
| Henkel AG & Co. KGaA | | 23,400 | 2,731,213 |
| Nexus AG | | 47,000 | 1,131,456 |
| Rational AG | | 6,400 | 3,215,962 |
| SAP AG | | 117,326 | 11,752,081 |
| Wirecard AG (b) | | 38,000 | 2,243,936 |
|
| TOTAL GERMANY | | | 74,284,571 |
|
| Greece - 0.1% | | | |
| Ff Group (a) | | 59,300 | 1,262,196 |
| Hong Kong - 0.2% | | | |
| AIA Group Ltd. | | 315,800 | 2,186,303 |
| Techtronic Industries Co. Ltd. | | 231,000 | 991,907 |
|
| TOTAL HONG KONG | | | 3,178,210 |
|
| India - 1.3% | | | |
| Avenue Supermarts Ltd. | | 1,642 | 18,811 |
| Bharti Infratel Ltd. | | 567,859 | 3,132,985 |
| HDFC Bank Ltd. | | 65,958 | 1,610,158 |
| HDFC Bank Ltd. sponsored ADR | | 79,493 | 6,328,438 |
| Housing Development Finance Corp. Ltd. | | 238,717 | 5,707,635 |
| Lupin Ltd. | | 1,335 | 27,791 |
| Reliance Industries Ltd. | | 145,596 | 3,159,676 |
|
| TOTAL INDIA | | | 19,985,494 |
|
| Indonesia - 0.2% | | | |
| PT Bank Central Asia Tbk | | 1,068,000 | 1,422,237 |
| PT Bank Rakyat Indonesia Tbk | | 2,121,200 | 2,052,928 |
| PT Kino Indonesia Tbk | | 234,500 | 42,224 |
|
| TOTAL INDONESIA | | | 3,517,389 |
|
| Ireland - 1.9% | | | |
| Accenture PLC Class A | | 17,800 | 2,159,140 |
| Alkermes PLC (a) | | 173,036 | 10,079,347 |
| Cairn Homes PLC (a) | | 1,347,939 | 2,297,905 |
| CRH PLC | | 134,700 | 4,906,327 |
| DCC PLC (United Kingdom) | | 16,900 | 1,560,677 |
| Green REIT PLC | | 621,300 | 923,808 |
| Greencore Group PLC | | 364,056 | 1,075,078 |
| James Hardie Industries PLC CDI | | 119,520 | 2,028,887 |
| Kerry Group PLC Class A | | 29,800 | 2,435,235 |
| Ryanair Holdings PLC sponsored ADR (a) | | 21,470 | 1,973,737 |
|
| TOTAL IRELAND | | | 29,440,141 |
|
| Isle of Man - 0.3% | | | |
| Paysafe Group PLC (a) | | 734,888 | 4,320,342 |
| Israel - 0.2% | | | |
| Frutarom Industries Ltd. | | 55,500 | 3,262,452 |
| Italy - 0.2% | | | |
| De Longhi SpA | | 50,400 | 1,537,220 |
| Intesa Sanpaolo SpA | | 716,700 | 2,092,121 |
|
| TOTAL ITALY | | | 3,629,341 |
|
| Japan - 6.8% | | | |
| A/S One Corp. | | 61,700 | 2,731,460 |
| ACOM Co. Ltd. (a) | | 119,900 | 532,411 |
| Ain Holdings, Inc. | | 37,900 | 2,624,696 |
| Aozora Bank Ltd. | | 577,000 | 2,101,476 |
| Daiichikosho Co. Ltd. | | 46,200 | 2,003,830 |
| Daito Trust Construction Co. Ltd. | | 15,400 | 2,265,620 |
| Dentsu, Inc. | | 66,900 | 3,768,845 |
| Hoya Corp. | | 86,000 | 4,107,325 |
| KDDI Corp. | | 207,700 | 5,506,973 |
| Keyence Corp. | | 9,820 | 3,946,499 |
| Komatsu Ltd. | | 103,400 | 2,763,008 |
| Misumi Group, Inc. | | 169,500 | 3,209,818 |
| Mitsubishi UFJ Financial Group, Inc. | | 672,600 | 4,261,995 |
| Monex Group, Inc. | | 831,000 | 2,079,830 |
| Morinaga & Co. Ltd. | | 37,000 | 1,749,181 |
| Nidec Corp. | | 19,300 | 1,769,419 |
| Nintendo Co. Ltd. | | 8,800 | 2,226,977 |
| Nitori Holdings Co. Ltd. | | 24,500 | 3,189,011 |
| Olympus Corp. | | 119,100 | 4,583,440 |
| OMRON Corp. | | 58,900 | 2,464,844 |
| ORIX Corp. | | 290,700 | 4,435,799 |
| Panasonic Corp. | | 260,900 | 3,119,907 |
| Recruit Holdings Co. Ltd. | | 91,800 | 4,636,322 |
| Relo Holdings Corp. | | 114,000 | 1,871,451 |
| Shionogi & Co. Ltd. | | 43,400 | 2,232,000 |
| SMC Corp. | | 8,900 | 2,506,131 |
| SMS Co., Ltd. | | 73,400 | 1,953,602 |
| SoftBank Corp. | | 53,500 | 4,058,121 |
| Sony Corp. | | 176,400 | 6,053,050 |
| Start Today Co. Ltd. | | 163,200 | 3,484,333 |
| Sundrug Co. Ltd. | | 72,200 | 2,532,424 |
| Tsuruha Holdings, Inc. | | 36,300 | 3,679,659 |
| VT Holdings Co. Ltd. | | 280,200 | 1,425,193 |
| Welcia Holdings Co. Ltd. | | 122,800 | 3,954,716 |
|
| TOTAL JAPAN | | | 103,829,366 |
|
| Kenya - 0.1% | | | |
| Safaricom Ltd. | | 6,251,600 | 1,166,117 |
| Luxembourg - 0.3% | | | |
| Eurofins Scientific SA | | 9,500 | 4,678,489 |
| Marshall Islands - 0.1% | | | |
| Hoegh LNG Partners LP | | 49,800 | 1,008,450 |
| Netherlands - 3.0% | | | |
| ASML Holding NV | | 8,000 | 1,054,800 |
| ASML Holding NV (Netherlands) | | 40,600 | 5,366,774 |
| Basic-Fit NV | | 37,100 | 648,629 |
| IMCD Group BV | | 106,500 | 5,736,717 |
| ING Groep NV (Certificaten Van Aandelen) | | 316,800 | 5,163,695 |
| Intertrust NV | | 98,600 | 1,976,252 |
| Koninklijke Philips Electronics NV | | 211,000 | 7,286,355 |
| Takeaway.com Holding BV (c) | | 31,700 | 1,067,693 |
| Unilever NV: | | | |
| (Certificaten Van Aandelen) (Bearer) | | 145,500 | 7,622,089 |
| (NY Reg.) (a) | | 194,000 | 10,134,560 |
| Van Lanschot NV (Bearer) | | 17,200 | 467,462 |
|
| TOTAL NETHERLANDS | | | 46,525,026 |
|
| New Zealand - 0.3% | | | |
| EBOS Group Ltd. | | 210,137 | 2,641,768 |
| Ryman Healthcare Group Ltd. | | 436,814 | 2,588,279 |
|
| TOTAL NEW ZEALAND | | | 5,230,047 |
|
| Norway - 0.6% | | | |
| Schibsted ASA (A Shares) | | 86,600 | 2,153,401 |
| Statoil ASA (b) | | 465,085 | 7,659,436 |
|
| TOTAL NORWAY | | | 9,812,837 |
|
| Philippines - 0.3% | | | |
| D&L Industries, Inc. | | 8,349,900 | 2,131,117 |
| SM Investments Corp. | | 137,205 | 1,991,670 |
|
| TOTAL PHILIPPINES | | | 4,122,787 |
|
| Singapore - 1.0% | | | |
| Broadcom Ltd. | | 71,000 | 15,677,510 |
| South Africa - 0.7% | | | |
| Aspen Pharmacare Holdings Ltd. | | 51,600 | 1,070,438 |
| Distell Group Ltd. | | 126,410 | 1,269,988 |
| EOH Holdings Ltd. | | 209,322 | 2,215,590 |
| Naspers Ltd. Class N | | 30,800 | 5,856,667 |
|
| TOTAL SOUTH AFRICA | | | 10,412,683 |
|
| Spain - 1.6% | | | |
| Amadeus IT Holding SA Class A | | 37,400 | 2,016,621 |
| Atresmedia Corporacion de Medios de Comunicacion SA | | 108,300 | 1,360,208 |
| CaixaBank SA | | 1,165,084 | 5,289,998 |
| Grifols SA ADR | | 170,873 | 3,709,653 |
| Hispania Activos Inmobiliarios SA | | 99,880 | 1,507,958 |
| Inditex SA | | 104,302 | 4,000,425 |
| Mediaset Espana Comunicacion SA | | 183,300 | 2,526,807 |
| Neinor Homes SLU | | 91,300 | 1,800,598 |
| Prosegur Cash SA | | 804,500 | 2,050,640 |
|
| TOTAL SPAIN | | | 24,262,908 |
|
| Sweden - 1.6% | | | |
| ASSA ABLOY AB (B Shares) | | 176,600 | 3,826,171 |
| Com Hem Holding AB | | 54,500 | 678,689 |
| HEXPOL AB (B Shares) | | 118,900 | 1,321,588 |
| Indutrade AB | | 87,000 | 2,055,830 |
| Nordea Bank AB | | 253,200 | 3,115,938 |
| Saab AB (B Shares) | | 66,000 | 3,272,690 |
| Sandvik AB | | 173,800 | 2,790,281 |
| Svenska Cellulosa AB (SCA) (B Shares) | | 165,600 | 5,485,536 |
| Svenska Handelsbanken AB (A Shares) | | 154,000 | 2,185,519 |
|
| TOTAL SWEDEN | | | 24,732,242 |
|
| Switzerland - 2.4% | | | |
| ABB Ltd. (Reg.) | | 236,230 | 5,788,643 |
| Credit Suisse Group AG | | 191,807 | 2,925,242 |
| EDAG Engineering Group AG | | 77,800 | 1,436,047 |
| Forbo Holding AG (Reg.) | | 1,170 | 1,917,859 |
| Julius Baer Group Ltd. | | 59,790 | 3,117,851 |
| Kaba Holding AG (B Shares) (Reg.) | | 2,620 | 2,244,774 |
| Nestle SA (Reg. S) | | 54,639 | 4,208,324 |
| Panalpina Welttransport Holding AG | | 18,370 | 2,431,486 |
| Partners Group Holding AG | | 6,758 | 4,085,364 |
| Schindler Holding AG (participation certificate) | | 10,829 | 2,212,599 |
| Syngenta AG (a) | | 7,621 | 3,533,233 |
| UBS Group AG | | 210,740 | 3,600,583 |
|
| TOTAL SWITZERLAND | | | 37,502,005 |
|
| Taiwan - 0.4% | | | |
| Largan Precision Co. Ltd. | | 18,000 | 2,986,798 |
| Taiwan Semiconductor Manufacturing Co. Ltd. | | 477,000 | 3,067,497 |
|
| TOTAL TAIWAN | | | 6,054,295 |
|
| United Kingdom - 7.5% | | | |
| Aggreko PLC | | 180,300 | 2,072,530 |
| Ascential PLC | | 207,619 | 948,708 |
| BAE Systems PLC | | 275,100 | 2,234,356 |
| Barclays PLC | | 898,378 | 2,460,125 |
| BCA Marketplace PLC | | 511,600 | 1,302,057 |
| BHP Billiton PLC | | 274,852 | 4,190,176 |
| Booker Group PLC | | 1,155,900 | 2,904,416 |
| British American Tobacco PLC: | | | |
| (United Kingdom) | | 77,600 | 5,242,917 |
| sponsored ADR (b) | | 300,000 | 20,412,000 |
| Bunzl PLC | | 101,900 | 3,178,100 |
| Cineworld Group PLC | | 138,500 | 1,262,872 |
| CMC Markets PLC | | 899,700 | 1,462,441 |
| Compass Group PLC | | 131,200 | 2,649,034 |
| Countryside Properties PLC | | 256,100 | 894,929 |
| Dialog Semiconductor PLC (a) | | 37,200 | 1,740,418 |
| Diploma PLC | | 147,500 | 2,118,656 |
| GlaxoSmithKline PLC | | 210,100 | 4,228,865 |
| Hilton Food Group PLC | | 350,100 | 3,489,294 |
| Imperial Tobacco Group PLC | | 42,203 | 2,067,291 |
| Jiangsu Yanghe Brewery JSC Ltd. ELS (HSBC Warrant Program) warrants 9/19/19 (a)(c) | | 157,700 | 1,830,130 |
| John Wood Group PLC | | 178,300 | 1,753,945 |
| LivaNova PLC (a) | | 39,000 | 2,055,300 |
| London Stock Exchange Group PLC | | 69,481 | 3,044,422 |
| Melrose Industries PLC | | 1,888,986 | 5,786,244 |
| Micro Focus International PLC | | 252,200 | 8,453,688 |
| Moneysupermarket.com Group PLC | | 393,500 | 1,762,918 |
| NCC Group Ltd. (b) | | 584,200 | 1,078,235 |
| Reckitt Benckiser Group PLC | | 42,200 | 3,888,204 |
| Rex Bionics PLC (a) | | 100,000 | 8,419 |
| Rio Tinto PLC | | 116,200 | 4,584,117 |
| Senior Engineering Group PLC | | 457,700 | 1,270,991 |
| Softcat PLC | | 333,193 | 1,777,992 |
| Spirax-Sarco Engineering PLC | | 33,846 | 2,279,542 |
| St. James's Place Capital PLC | | 123,700 | 1,839,282 |
| Standard Chartered PLC (United Kingdom) (a) | | 591,667 | 5,526,751 |
| Zpg PLC | | 603,000 | 2,889,721 |
|
| TOTAL UNITED KINGDOM | | | 114,689,086 |
|
| United States of America - 50.2% | | | |
| Activision Blizzard, Inc. | | 405,000 | 21,161,250 |
| Adobe Systems, Inc. (a) | | 301,124 | 40,272,324 |
| Alaska Air Group, Inc. | | 89,000 | 7,573,010 |
| Albemarle Corp. U.S. | | 3,000 | 326,730 |
| Alexion Pharmaceuticals, Inc. (a) | | 52,900 | 6,759,562 |
| Allison Transmission Holdings, Inc. | | 377,200 | 14,590,096 |
| Alphabet, Inc. Class A (a) | | 40,500 | 37,443,060 |
| Amazon.com, Inc. (a) | | 20,500 | 18,962,295 |
| American Tower Corp. | | 75,000 | 9,445,500 |
| AMETEK, Inc. | | 36,000 | 2,059,200 |
| Amgen, Inc. | | 129,300 | 21,117,276 |
| Amphenol Corp. Class A | | 135,000 | 9,761,850 |
| Analog Devices, Inc. | | 16,000 | 1,219,200 |
| Apple, Inc. | | 293,000 | 42,089,451 |
| athenahealth, Inc. (a) | | 1,200 | 117,612 |
| Autodesk, Inc. (a) | | 19,000 | 1,711,330 |
| Bank of America Corp. | | 1,678,000 | 39,164,520 |
| Berkshire Hathaway, Inc. Class B (a) | | 38,000 | 6,277,980 |
| Bio-Rad Laboratories, Inc. Class A (a) | | 3,000 | 654,780 |
| Boston Scientific Corp. (a) | | 779,000 | 20,550,020 |
| Burlington Stores, Inc. (a) | | 3,000 | 296,760 |
| CalAtlantic Group, Inc. | | 63,000 | 2,281,860 |
| Caterpillar, Inc. | | 185,000 | 18,918,100 |
| Cavium, Inc. (a) | | 1,700 | 117,045 |
| CBOE Holdings, Inc. | | 242,000 | 19,943,220 |
| Celanese Corp. Class A | | 10,000 | 870,400 |
| Charles Schwab Corp. | | 122,000 | 4,739,700 |
| Charter Communications, Inc. Class A (a) | | 52,000 | 17,948,320 |
| Cintas Corp. | | 5,000 | 612,350 |
| CME Group, Inc. | | 25,000 | 2,904,750 |
| Comcast Corp. Class A | | 12,000 | 470,280 |
| CSX Corp. | | 248,000 | 12,608,320 |
| Cummins, Inc. | | 69,000 | 10,414,860 |
| Cypress Semiconductor Corp. | | 170,000 | 2,381,700 |
| Edwards Lifesciences Corp. (a) | | 5,000 | 548,350 |
| Electronic Arts, Inc. (a) | | 53,900 | 5,110,798 |
| Entegris, Inc. (a) | | 59,000 | 1,463,200 |
| EOG Resources, Inc. | | 33,000 | 3,052,500 |
| Facebook, Inc. Class A (a) | | 121,500 | 18,255,375 |
| First Republic Bank | | 36,000 | 3,328,560 |
| FMC Corp. | | 183,000 | 13,401,090 |
| Global Payments, Inc. | | 29,700 | 2,428,272 |
| Goldman Sachs Group, Inc. | | 27,000 | 6,042,600 |
| Great Western Bancorp, Inc. | | 15,000 | 618,000 |
| HealthSouth Corp. | | 2 | 94 |
| Humana, Inc. | | 62,000 | 13,762,760 |
| Intercept Pharmaceuticals, Inc. (a) | | 48,060 | 5,399,541 |
| Intuit, Inc. | | 40,000 | 5,008,400 |
| Intuitive Surgical, Inc. (a) | | 2,500 | 2,089,675 |
| J.B. Hunt Transport Services, Inc. | | 25,000 | 2,241,500 |
| JPMorgan Chase & Co. | | 207,000 | 18,009,000 |
| KLA-Tencor Corp. | | 85,000 | 8,348,700 |
| Kulicke & Soffa Industries, Inc. (a) | | 67,000 | 1,495,440 |
| Lamb Weston Holdings, Inc. | | 27,000 | 1,127,250 |
| Lennar Corp. Class A | | 79,000 | 3,989,500 |
| Marriott International, Inc. Class A | | 92,000 | 8,686,640 |
| Microsemi Corp. (a) | | 3,000 | 140,820 |
| Microsoft Corp. | | 421,000 | 28,821,660 |
| Molson Coors Brewing Co. Class B | | 17,300 | 1,658,897 |
| Monsanto Co. | | 19,700 | 2,297,217 |
| Morgan Stanley | | 236,000 | 10,235,320 |
| MSC Industrial Direct Co., Inc. Class A | | 127,000 | 11,370,310 |
| MSCI, Inc. | | 122,400 | 12,279,168 |
| Netflix, Inc. (a) | | 21,000 | 3,196,200 |
| Northern Trust Corp. | | 87,000 | 7,830,000 |
| PACCAR, Inc. | | 34,000 | 2,268,820 |
| PayPal Holdings, Inc. (a) | | 417,000 | 19,899,240 |
| Performance Food Group Co. (a) | | 135,000 | 3,361,500 |
| Pioneer Natural Resources Co. | | 24,000 | 4,151,760 |
| Post Holdings, Inc. (a) | | 51,000 | 4,293,690 |
| Prestige Brands Holdings, Inc. (a) | | 138,900 | 7,974,249 |
| Qualcomm, Inc. | | 40,000 | 2,149,600 |
| Quest Diagnostics, Inc. | | 4,000 | 422,040 |
| Roper Technologies, Inc. | | 3,000 | 656,100 |
| S&P Global, Inc. | | 176,092 | 23,629,785 |
| Sirius XM Holdings, Inc. | | 160,000 | 792,000 |
| SLM Corp. (a) | | 65,000 | 815,100 |
| SunTrust Banks, Inc. | | 237,000 | 13,463,970 |
| SVB Financial Group (a) | | 71,000 | 12,491,740 |
| Symantec Corp. | | 5,000 | 158,150 |
| T-Mobile U.S., Inc. (a) | | 102,000 | 6,861,540 |
| Terex Corp. | | 39,000 | 1,364,220 |
| Texas Instruments, Inc. | | 61,000 | 4,829,980 |
| The Walt Disney Co. | | 55,000 | 6,358,000 |
| Twenty-First Century Fox, Inc. Class B | | 65,000 | 1,940,900 |
| U.S. Bancorp | | 57,000 | 2,922,960 |
| U.S. Foods Holding Corp. | | 102,000 | 2,876,400 |
| Union Pacific Corp. | | 82,000 | 9,180,720 |
| United Rentals, Inc. (a) | | 17,000 | 1,864,220 |
| UnitedHealth Group, Inc. | | 106,000 | 18,537,280 |
| Univar, Inc. (a) | | 170,700 | 5,095,395 |
| Vertex Pharmaceuticals, Inc. (a) | | 26,000 | 3,075,800 |
| Visa, Inc. Class A | | 89,500 | 8,164,190 |
| Western Digital Corp. | | 13,000 | 1,157,910 |
|
| TOTAL UNITED STATES OF AMERICA | | | 768,758,807 |
|
| TOTAL COMMON STOCKS | | | |
| (Cost $1,238,005,173) | | | 1,512,572,537 |
|
| Convertible Preferred Stocks - 0.1% | | | |
| Cayman Islands - 0.1% | | | |
| China Internet Plus Holdings Ltd. Series A-11 (a)(d) | | | |
| (Cost $1,166,878) | | 369,166 | 1,768,305 |
|
| Money Market Funds - 3.6% | | | |
| Fidelity Cash Central Fund, 0.85% (e) | | 13,905,475 | 13,908,257 |
| Fidelity Securities Lending Cash Central Fund 0.86% (e)(f) | | 40,926,552 | 40,930,644 |
| TOTAL MONEY MARKET FUNDS | | | |
| (Cost $54,838,486) | | | 54,838,901 |
| TOTAL INVESTMENT PORTFOLIO - 102.5% | | | |
| (Cost $1,294,010,537) | | | 1,569,179,743 |
| NET OTHER ASSETS (LIABILITIES) - (2.5)% | | | (38,958,629) |
| NET ASSETS - 100% | | | $1,530,221,114 |
Categorizations in the Schedule of Investments are based on country or territory of incorporation.
Legend
(a) Non-income producing
(b) Security or a portion of the security is on loan at period end.
(c) Security exempt from registration under Rule 144A of the Securities Act of 1933. These securities may be resold in transactions exempt from registration, normally to qualified institutional buyers. At the end of the period, the value of these securities amounted to $4,778,580 or 0.3% of net assets.
(d) Restricted securities - Investment in securities not registered under the Securities Act of 1933 (excluding 144A issues). At the end of the period, the value of restricted securities (excluding 144A issues) amounted to $1,768,305 or 0.1% of net assets.
(e) Affiliated fund that is generally available only to investment companies and other accounts managed by Fidelity Investments. The rate quoted is the annualized seven-day yield of the fund at period end. A complete unaudited listing of the fund's holdings as of its most recent quarter end is available upon request. In addition, each Fidelity Central Fund's financial statements are available on the SEC's website or upon request.
(f) Investment made with cash collateral received from securities on loan.
Additional information on each restricted holding is as follows:
| Security | Acquisition Date | Acquisition Cost |
| China Internet Plus Holdings Ltd. Series A-11 | 1/26/15 | $1,166,878 |
Affiliated Central Funds
Information regarding fiscal year to date income earned by the Fund from investments in Fidelity Central Funds is as follows:
| Fund | Income earned |
| Fidelity Cash Central Fund | $53,602 |
| Fidelity Securities Lending Cash Central Fund | 183,932 |
| Total | $237,534 |
Investment Valuation
The following is a summary of the inputs used, as of April 30, 2017, involving the Fund's assets and liabilities carried at fair value. The inputs or methodology used for valuing securities may not be an indication of the risk associated with investing in those securities. For more information on valuation inputs, and their aggregation into the levels used below, please refer to the Investment Valuation section in the accompanying Notes to Financial Statements.
| | Valuation Inputs at Reporting Date: |
| Description | Total | Level 1 | Level 2 | Level 3 |
| Investments in Securities: | | | | |
| Equities: | | | | |
| Consumer Discretionary | $201,502,393 | $182,055,430 | $17,678,658 | $1,768,305 |
| Consumer Staples | 109,536,319 | 87,062,422 | 22,473,897 | -- |
| Energy | 46,303,768 | 28,251,559 | 18,052,209 | -- |
| Financials | 298,573,343 | 264,947,746 | 33,625,597 | -- |
| Health Care | 161,173,055 | 152,751,164 | 8,421,891 | -- |
| Industrials | 223,019,892 | 194,368,484 | 28,651,408 | -- |
| Information Technology | 363,709,639 | 344,370,290 | 19,339,349 | -- |
| Materials | 66,552,003 | 52,871,383 | 13,680,620 | -- |
| Real Estate | 16,014,337 | 16,014,337 | -- | -- |
| Telecommunication Services | 23,374,257 | 11,839,331 | 11,534,926 | -- |
| Utilities | 4,581,836 | 4,581,836 | -- | -- |
| Money Market Funds | 54,838,901 | 54,838,901 | -- | -- |
| Total Investments in Securities: | $1,569,179,743 | $1,393,952,883 | $173,458,555 | $1,768,305 |
The following is a summary of transfers between Level 1 and Level 2 for the period ended April 30, 2017. Transfers are assumed to have occurred at the beginning of the period, and are primarily attributable to the valuation techniques used for foreign equity securities, as discussed in the accompanying Notes to Financial Statements:
| Transfers | Total |
| Level 1 to Level 2 | $36,987,288 |
| Level 2 to Level 1 | $34,193,712 |
See accompanying notes which are an integral part of the financial statements.
Fidelity® Worldwide Fund
Financial Statements
Statement of Assets and Liabilities
| | | April 30, 2017 (Unaudited) |
| Assets | | |
Investment in securities, at value (including securities loaned of $39,618,264) — See accompanying schedule:
Unaffiliated issuers (cost $1,239,172,051) | $1,514,340,842 | |
| Fidelity Central Funds (cost $54,838,486) | 54,838,901 | |
| Total Investments (cost $1,294,010,537) | | $1,569,179,743 |
| Cash | | 27,492 |
| Receivable for investments sold | | 22,200,997 |
| Receivable for fund shares sold | | 973,802 |
| Dividends receivable | | 3,297,189 |
| Distributions receivable from Fidelity Central Funds | | 78,109 |
| Prepaid expenses | | 1,005 |
| Other receivables | | 115,539 |
| Total assets | | 1,595,873,876 |
| Liabilities | | |
| Payable for investments purchased | $22,676,976 | |
| Payable for fund shares redeemed | 882,402 | |
| Accrued management fee | 739,165 | |
| Distribution and service plan fees payable | 17,628 | |
| Other affiliated payables | 268,627 | |
| Other payables and accrued expenses | 134,825 | |
| Collateral on securities loaned | 40,933,139 | |
| Total liabilities | | 65,652,762 |
| Net Assets | | $1,530,221,114 |
| Net Assets consist of: | | |
| Paid in capital | | $1,220,227,761 |
| Undistributed net investment income | | 3,945,371 |
| Accumulated undistributed net realized gain (loss) on investments and foreign currency transactions | | 30,968,335 |
| Net unrealized appreciation (depreciation) on investments and assets and liabilities in foreign currencies | | 275,079,647 |
| Net Assets | | $1,530,221,114 |
| Calculation of Maximum Offering Price | | |
| Class A: | | |
| Net Asset Value and redemption price per share ($29,321,924 ÷ 1,227,146 shares) | | $23.89 |
| Maximum offering price per share (100/94.25 of $23.89) | | $25.35 |
| Class M: | | |
| Net Asset Value and redemption price per share ($9,515,091 ÷ 400,071 shares) | | $23.78 |
| Maximum offering price per share (100/96.50 of $23.78) | | $24.64 |
| Class C: | | |
| Net Asset Value and offering price per share ($9,565,130 ÷ 407,901 shares)(a) | | $23.45 |
| Worldwide: | | |
| Net Asset Value, offering price and redemption price per share ($1,465,808,041 ÷ 60,705,679 shares) | | $24.15 |
| Class I: | | |
| Net Asset Value, offering price and redemption price per share ($16,010,928 ÷ 665,982 shares) | | $24.04 |
(a) Redemption price per share is equal to net asset value less any applicable contingent deferred sales charge.
See accompanying notes which are an integral part of the financial statements.
Statement of Operations
| | | Six months ended April 30, 2017 (Unaudited) |
| Investment Income | | |
| Dividends | | $11,699,924 |
| Income from Fidelity Central Funds | | 237,534 |
| Income before foreign taxes withheld | | 11,937,458 |
| Less foreign taxes withheld | | (621,561) |
| Total income | | 11,315,897 |
| Expenses | | |
| Management fee | | |
| Basic fee | $4,932,982 | |
| Performance adjustment | (1,309,912) | |
| Transfer agent fees | 1,374,434 | |
| Distribution and service plan fees | 107,179 | |
| Accounting and security lending fees | 231,827 | |
| Custodian fees and expenses | 92,227 | |
| Independent trustees' fees and expenses | 3,019 | |
| Registration fees | 75,421 | |
| Audit | 37,014 | |
| Legal | 7,518 | |
| Miscellaneous | 5,979 | |
| Total expenses before reductions | 5,557,688 | |
| Expense reductions | (98,456) | 5,459,232 |
| Net investment income (loss) | | 5,856,665 |
| Realized and Unrealized Gain (Loss) | | |
| Net realized gain (loss) on: | | |
| Investment securities: | | |
| Unaffiliated issuers | 75,700,542 | |
| Fidelity Central Funds | (4,658) | |
| Foreign currency transactions | (112,550) | |
| Total net realized gain (loss) | | 75,583,334 |
Change in net unrealized appreciation (depreciation) on:
Investment securities | 67,419,095 | |
| Assets and liabilities in foreign currencies | 55,876 | |
| Total change in net unrealized appreciation (depreciation) | | 67,474,971 |
| Net gain (loss) | | 143,058,305 |
| Net increase (decrease) in net assets resulting from operations | | $148,914,970 |
See accompanying notes which are an integral part of the financial statements.
Statement of Changes in Net Assets
| | Six months ended April 30, 2017 (Unaudited) | Year ended October 31, 2016 |
| Increase (Decrease) in Net Assets | | |
| Operations | | |
| Net investment income (loss) | $5,856,665 | $13,077,907 |
| Net realized gain (loss) | 75,583,334 | (34,179,863) |
| Change in net unrealized appreciation (depreciation) | 67,474,971 | 7,184,648 |
| Net increase (decrease) in net assets resulting from operations | 148,914,970 | (13,917,308) |
| Distributions to shareholders from net investment income | (12,665,603) | (9,278,911) |
| Distributions to shareholders from net realized gain | (4,590,851) | (52,672,015) |
| Total distributions | (17,256,454) | (61,950,926) |
| Share transactions - net increase (decrease) | (84,364,952) | (65,607,542) |
| Redemption fees | 2,108 | 16,394 |
| Total increase (decrease) in net assets | 47,295,672 | (141,459,382) |
| Net Assets | | |
| Beginning of period | 1,482,925,442 | 1,624,384,824 |
| End of period | $1,530,221,114 | $1,482,925,442 |
| Other Information | | |
| Undistributed net investment income end of period | $3,945,371 | $10,754,309 |
See accompanying notes which are an integral part of the financial statements.
Financial Highlights — Fidelity Worldwide Fund Class A
| | Six months ended (Unaudited) April 30, | Years ended October 31, | | | | |
| | 2017 | 2016 | 2015 | 2014 | 2013 | 2012 |
| Selected Per–Share Data | | | | | | |
| Net asset value, beginning of period | $21.83 | $22.88 | $24.64 | $25.18 | $19.69 | $17.89 |
| Income from Investment Operations | | | | | | |
| Net investment income (loss)A | .06 | .12 | .06 | .02 | .02 | .10 |
| Net realized and unrealized gain (loss) | 2.19 | (.35) | .58 | 1.46 | 5.66 | 1.72 |
| Total from investment operations | 2.25 | (.23) | .64 | 1.48 | 5.68 | 1.82 |
| Distributions from net investment income | (.12) | (.07) | – | (.04) | (.11) | (.02) |
| Distributions from net realized gain | (.07) | (.75) | (2.40) | (1.98) | (.08) | – |
| Total distributions | (.19) | (.82) | (2.40) | (2.02) | (.19) | (.02) |
| Redemption fees added to paid in capitalA,B | – | – | – | – | – | – |
| Net asset value, end of period | $23.89 | $21.83 | $22.88 | $24.64 | $25.18 | $19.69 |
| Total ReturnC,D,E | 10.39% | (1.09)% | 2.73% | 6.29% | 29.10% | 10.20% |
| Ratios to Average Net AssetsF,G | | | | | | |
| Expenses before reductions | 1.06%H | 1.22% | 1.27% | 1.31% | 1.45% | 1.43% |
| Expenses net of fee waivers, if any | 1.06%H | 1.22% | 1.26% | 1.31% | 1.45% | 1.43% |
| Expenses net of all reductions | 1.04%H | 1.22% | 1.26% | 1.31% | 1.42% | 1.41% |
| Net investment income (loss) | .49%H | .55% | .27% | .10% | .09% | .52% |
| Supplemental Data | | | | | | |
| Net assets, end of period (000 omitted) | $29,322 | $29,052 | $31,043 | $33,788 | $28,661 | $18,723 |
| Portfolio turnover rateI | 133%H | 117% | 151% | 163% | 161% | 186% |
A Calculated based on average shares outstanding during the period.
B Amount represents less than $.005 per share.
C Total returns for periods of less than one year are not annualized.
D Total returns would have been lower if certain expenses had not been reduced during the applicable periods shown.
E Total returns do not include the effect of the sales charges.
F Fees and expenses of any underlying Fidelity Central Funds are not included in the Fund's expense ratio. The Fund indirectly bears its proportionate share of the expenses of any underlying Fidelity Central Funds.
G Expense ratios reflect operating expenses of the class. Expenses before reductions do not reflect amounts reimbursed by the investment adviser or reductions from brokerage service arrangements or reductions from other expense offset arrangements and do not represent the amount paid by the class during periods when reimbursements or reductions occur. Expenses net of fee waivers reflect expenses after reimbursement by the investment adviser but prior to reductions from brokerage service arrangements or other expense offset arrangements. Expenses net of all reductions represent the net expenses paid by the class.
H Annualized
I Amount does not include the portfolio activity of any underlying Fidelity Central Funds.
See accompanying notes which are an integral part of the financial statements.
Financial Highlights — Fidelity Worldwide Fund Class M
| | Six months ended (Unaudited) April 30, | Years ended October 31, | | | | |
| | 2017 | 2016 | 2015 | 2014 | 2013 | 2012 |
| Selected Per–Share Data | | | | | | |
| Net asset value, beginning of period | $21.67 | $22.72 | $24.49 | $25.05 | $19.61 | $17.83 |
| Income from Investment Operations | | | | | | |
| Net investment income (loss)A | .02 | .05 | (.01) | (.04) | (.04) | .05 |
| Net realized and unrealized gain (loss) | 2.19 | (.35) | .57 | 1.46 | 5.63 | 1.73 |
| Total from investment operations | 2.21 | (.30) | .56 | 1.42 | 5.59 | 1.78 |
| Distributions from net investment income | (.03) | –B | – | – | (.07) | – |
| Distributions from net realized gain | (.07) | (.75) | (2.33) | (1.98) | (.08) | – |
| Total distributions | (.10) | (.75) | (2.33) | (1.98) | (.15) | – |
| Redemption fees added to paid in capitalA,B | – | – | – | – | – | – |
| Net asset value, end of period | $23.78 | $21.67 | $22.72 | $24.49 | $25.05 | $19.61 |
| Total ReturnC,D,E | 10.25% | (1.38)% | 2.36% | 6.05% | 28.73% | 9.98% |
| Ratios to Average Net AssetsF,G | | | | | | |
| Expenses before reductions | 1.36%H | 1.53% | 1.57% | 1.58% | 1.71% | 1.68% |
| Expenses net of fee waivers, if any | 1.36%H | 1.52% | 1.56% | 1.58% | 1.70% | 1.68% |
| Expenses net of all reductions | 1.35%H | 1.52% | 1.56% | 1.58% | 1.68% | 1.66% |
| Net investment income (loss) | .19%H | .25% | (.04)% | (.17)% | (.16)% | .26% |
| Supplemental Data | | | | | | |
| Net assets, end of period (000 omitted) | $9,515 | $9,270 | $13,055 | $12,160 | $9,822 | $5,550 |
| Portfolio turnover rateI | 133%H | 117% | 151% | 163% | 161% | 186% |
A Calculated based on average shares outstanding during the period.
B Amount represents less than $.005 per share.
C Total returns for periods of less than one year are not annualized.
D Total returns would have been lower if certain expenses had not been reduced during the applicable periods shown.
E Total returns do not include the effect of the sales charges.
F Fees and expenses of any underlying Fidelity Central Funds are not included in the Fund's expense ratio. The Fund indirectly bears its proportionate share of the expenses of any underlying Fidelity Central Funds.
G Expense ratios reflect operating expenses of the class. Expenses before reductions do not reflect amounts reimbursed by the investment adviser or reductions from brokerage service arrangements or reductions from other expense offset arrangements and do not represent the amount paid by the class during periods when reimbursements or reductions occur. Expenses net of fee waivers reflect expenses after reimbursement by the investment adviser but prior to reductions from brokerage service arrangements or other expense offset arrangements. Expenses net of all reductions represent the net expenses paid by the class.
H Annualized
I Amount does not include the portfolio activity of any underlying Fidelity Central Funds.
See accompanying notes which are an integral part of the financial statements.
Financial Highlights — Fidelity Worldwide Fund Class C
| | Six months ended (Unaudited) April 30, | Years ended October 31, | | | | |
| | 2017 | 2016 | 2015 | 2014 | 2013 | 2012 |
| Selected Per–Share Data | | | | | | |
| Net asset value, beginning of period | $21.33 | $22.48 | $24.12 | $24.78 | $19.41 | $17.74 |
| Income from Investment Operations | | | | | | |
| Net investment income (loss)A | (.03) | (.05) | (.12) | (.15) | (.14) | (.04) |
| Net realized and unrealized gain (loss) | 2.16 | (.35) | .57 | 1.44 | 5.58 | 1.71 |
| Total from investment operations | 2.13 | (.40) | .45 | 1.29 | 5.44 | 1.67 |
| Distributions from net investment income | – | – | – | – | – | – |
| Distributions from net realized gain | (.01) | (.75) | (2.09) | (1.95) | (.07) | – |
| Total distributions | (.01) | (.75) | (2.09) | (1.95) | (.07) | – |
| Redemption fees added to paid in capitalA,B | – | – | – | – | – | – |
| Net asset value, end of period | $23.45 | $21.33 | $22.48 | $24.12 | $24.78 | $19.41 |
| Total ReturnC,D,E | 10.00% | (1.88)% | 1.90% | 5.55% | 28.12% | 9.41% |
| Ratios to Average Net AssetsF,G | | | | | | |
| Expenses before reductions | 1.82%H | 2.01% | 2.07% | 2.04% | 2.15% | 2.18% |
| Expenses net of fee waivers, if any | 1.82%H | 2.01% | 2.07% | 2.04% | 2.14% | 2.18% |
| Expenses net of all reductions | 1.81%H | 2.00% | 2.06% | 2.03% | 2.12% | 2.16% |
| Net investment income (loss) | (.27)%H | (.24)% | (.54)% | (.63)% | (.60)% | (.23)% |
| Supplemental Data | | | | | | |
| Net assets, end of period (000 omitted) | $9,565 | $10,315 | $11,231 | $9,229 | $10,778 | $1,726 |
| Portfolio turnover rateI | 133%H | 117% | 151% | 163% | 161% | 186% |
A Calculated based on average shares outstanding during the period.
B Amount represents less than $.005 per share.
C Total returns for periods of less than one year are not annualized.
D Total returns would have been lower if certain expenses had not been reduced during the applicable periods shown.
E Total returns do not include the effect of the contingent deferred sales charge.
F Fees and expenses of any underlying Fidelity Central Funds are not included in the Fund's expense ratio. The Fund indirectly bears its proportionate share of the expenses of any underlying Fidelity Central Funds.
G Expense ratios reflect operating expenses of the class. Expenses before reductions do not reflect amounts reimbursed by the investment adviser or reductions from brokerage service arrangements or reductions from other expense offset arrangements and do not represent the amount paid by the class during periods when reimbursements or reductions occur. Expenses net of fee waivers reflect expenses after reimbursement by the investment adviser but prior to reductions from brokerage service arrangements or other expense offset arrangements. Expenses net of all reductions represent the net expenses paid by the class.
H Annualized
I Amount does not include the portfolio activity of any underlying Fidelity Central Funds.
See accompanying notes which are an integral part of the financial statements.
Financial Highlights — Fidelity Worldwide Fund
| | Six months ended (Unaudited) April 30, | Years ended October 31, | | | | |
| | 2017 | 2016 | 2015 | 2014 | 2013 | 2012 |
| Selected Per–Share Data | | | | | | |
| Net asset value, beginning of period | $22.09 | $23.14 | $24.92 | $25.41 | $19.85 | $18.02 |
| Income from Investment Operations | | | | | | |
| Net investment income (loss)A | .09 | .19 | .13 | .11 | .10 | .16 |
| Net realized and unrealized gain (loss) | 2.24 | (.35) | .58 | 1.47 | 5.70 | 1.74 |
| Total from investment operations | 2.33 | (.16) | .71 | 1.58 | 5.80 | 1.90 |
| Distributions from net investment income | (.20) | (.14) | (.08) | (.09) | (.16) | (.07) |
| Distributions from net realized gain | (.07) | (.75) | (2.41) | (1.98) | (.08) | – |
| Total distributions | (.27) | (.89) | (2.49) | (2.07) | (.24) | (.07) |
| Redemption fees added to paid in capitalA,B | – | – | – | – | – | – |
| Net asset value, end of period | $24.15 | $22.09 | $23.14 | $24.92 | $25.41 | $19.85 |
| Total ReturnC,D | 10.64% | (.78)% | 3.01% | 6.64% | 29.54% | 10.56% |
| Ratios to Average Net AssetsE,F | | | | | | |
| Expenses before reductions | .74%G | .91% | .96% | .98% | 1.11% | 1.11% |
| Expenses net of fee waivers, if any | .74%G | .91% | .96% | .97% | 1.11% | 1.11% |
| Expenses net of all reductions | .72%G | .90% | .95% | .97% | 1.08% | 1.09% |
| Net investment income (loss) | .81%G | .87% | .57% | .44% | .43% | .84% |
| Supplemental Data | | | | | | |
| Net assets, end of period (000 omitted) | $1,465,808 | $1,421,364 | $1,543,516 | $1,535,658 | $1,464,415 | $1,081,240 |
| Portfolio turnover rateH | 133%G | 117% | 151% | 163% | 161% | 186% |
A Calculated based on average shares outstanding during the period.
B Amount represents less than $.005 per share.
C Total returns for periods of less than one year are not annualized.
D Total returns would have been lower if certain expenses had not been reduced during the applicable periods shown.
E Fees and expenses of any underlying Fidelity Central Funds are not included in the Fund's expense ratio. The Fund indirectly bears its proportionate share of the expenses of any underlying Fidelity Central Funds.
F Expense ratios reflect operating expenses of the class. Expenses before reductions do not reflect amounts reimbursed by the investment adviser or reductions from brokerage service arrangements or reductions from other expense offset arrangements and do not represent the amount paid by the class during periods when reimbursements or reductions occur. Expenses net of fee waivers reflect expenses after reimbursement by the investment adviser but prior to reductions from brokerage service arrangements or other expense offset arrangements. Expenses net of all reductions represent the net expenses paid by the class.
G Annualized
H Amount does not include the portfolio activity of any underlying Fidelity Central Funds.
See accompanying notes which are an integral part of the financial statements.
Financial Highlights — Fidelity Worldwide Fund Class I
| | Six months ended (Unaudited) April 30, | Years ended October 31, | | | | |
| | 2017 | 2016 | 2015 | 2014 | 2013 | 2012 |
| Selected Per–Share Data | | | | | | |
| Net asset value, beginning of period | $21.99 | $23.03 | $24.81 | $25.31 | $19.78 | $17.98 |
| Income from Investment Operations | | | | | | |
| Net investment income (loss)A | .09 | .17 | .13 | .10 | .08 | .14 |
| Net realized and unrealized gain (loss) | 2.21 | (.35) | .58 | 1.47 | 5.68 | 1.74 |
| Total from investment operations | 2.30 | (.18) | .71 | 1.57 | 5.76 | 1.88 |
| Distributions from net investment income | (.18) | (.11) | (.07) | (.09) | (.15) | (.08) |
| Distributions from net realized gain | (.07) | (.75) | (2.41) | (1.98) | (.08) | – |
| Total distributions | (.25) | (.86) | (2.49)B | (2.07) | (.23) | (.08) |
| Redemption fees added to paid in capitalA,C | – | – | – | – | – | – |
| Net asset value, end of period | $24.04 | $21.99 | $23.03 | $24.81 | $25.31 | $19.78 |
| Total ReturnD,E | 10.58% | (.86)% | 3.00% | 6.63% | 29.44% | 10.49% |
| Ratios to Average Net AssetsF,G | | | | | | |
| Expenses before reductions | .76%H | .99% | .98% | 1.01% | 1.17% | 1.18% |
| Expenses net of fee waivers, if any | .76%H | .99% | .98% | 1.01% | 1.17% | 1.18% |
| Expenses net of all reductions | .75%H | .98% | .97% | 1.00% | 1.14% | 1.16% |
| Net investment income (loss) | .79%H | .78% | .55% | .40% | .37% | .77% |
| Supplemental Data | | | | | | |
| Net assets, end of period (000 omitted) | $16,011 | $12,924 | $25,173 | $19,107 | $10,639 | $4,291 |
| Portfolio turnover rateI | 133%H | 117% | 151% | 163% | 161% | 186% |
A Calculated based on average shares outstanding during the period.
B Total distributions of $2.49 per share is comprised of distributions from net investment income of $.074 and distributions from net realized gain of $2.413 per share.
C Amount represents less than $.005 per share.
D Total returns for periods of less than one year are not annualized.
E Total returns would have been lower if certain expenses had not been reduced during the applicable periods shown.
F Fees and expenses of any underlying Fidelity Central Funds are not included in the Fund's expense ratio. The Fund indirectly bears its proportionate share of the expenses of any underlying Fidelity Central Funds.
G Expense ratios reflect operating expenses of the class. Expenses before reductions do not reflect amounts reimbursed by the investment adviser or reductions from brokerage service arrangements or reductions from other expense offset arrangements and do not represent the amount paid by the class during periods when reimbursements or reductions occur. Expenses net of fee waivers reflect expenses after reimbursement by the investment adviser but prior to reductions from brokerage service arrangements or other expense offset arrangements. Expenses net of all reductions represent the net expenses paid by the class.
H Annualized
I Amount does not include the portfolio activity of any underlying Fidelity Central Funds.
See accompanying notes which are an integral part of the financial statements.
Notes to Financial Statements (Unaudited)
For the period ended April 30, 2017
1. Organization.
Fidelity Worldwide Fund (the Fund) is a fund of Fidelity Investment Trust (the Trust) and is authorized to issue an unlimited number of shares. The Trust is registered under the Investment Company Act of 1940, as amended (the 1940 Act), as an open-end management investment company organized as a Massachusetts business trust. The Fund offers Class A, Class M (formerly Class T), Class C, Worldwide and Class I shares, each of which has equal rights as to assets and voting privileges. Each class has exclusive voting rights with respect to matters that affect that class.
After the close of business on June 24, 2016, all outstanding Class B shares were converted to Class A shares. All prior fiscal period dollar and share amounts for Class B presented in the Notes to Financial Statements are for the period November 1, 2015 through June 24, 2016.
2. Investments in Fidelity Central Funds.
The Fund invests in Fidelity Central Funds, which are open-end investment companies generally available only to other investment companies and accounts managed by the investment adviser and its affiliates. The Fund's Schedule of Investments lists each of the Fidelity Central Funds held as of period end, if any, as an investment of the Fund, but does not include the underlying holdings of each Fidelity Central Fund. As an Investing Fund, the Fund indirectly bears its proportionate share of the expenses of the underlying Fidelity Central Funds.
The Money Market Central Funds seek preservation of capital and current income and are managed by Fidelity Investments Money Management, Inc. (FIMM), an affiliate of the investment adviser. Annualized expenses of the Money Market Central Funds as of their most recent shareholder report date are less than .005%.
A complete unaudited list of holdings for each Fidelity Central Fund is available upon request or at the Securities and Exchange Commission (the SEC) website at www.sec.gov. In addition, the financial statements of the Fidelity Central Funds are available on the SEC website or upon request.
3. Significant Accounting Policies.
The Fund is an investment company and applies the accounting and reporting guidance of the Financial Accounting Standards Board (FASB) Accounting Standards Codification Topic 946 Financial Services – Investments Companies. The financial statements have been prepared in conformity with accounting principles generally accepted in the United States of America (GAAP), which require management to make certain estimates and assumptions at the date of the financial statements. Actual results could differ from those estimates. Subsequent events, if any, through the date that the financial statements were issued have been evaluated in the preparation of the financial statements. The following summarizes the significant accounting policies of the Fund:
Investment Valuation. Investments are valued as of 4:00 p.m. Eastern time on the last calendar day of the period. The Board of Trustees (the Board) has delegated the day to day responsibility for the valuation of the Fund's investments to the Fair Value Committee (the Committee) established by the Fund's investment adviser. In accordance with valuation policies and procedures approved by the Board, the Fund attempts to obtain prices from one or more third party pricing vendors or brokers to value its investments. When current market prices, quotations or currency exchange rates are not readily available or reliable, investments will be fair valued in good faith by the Committee, in accordance with procedures adopted by the Board. Factors used in determining fair value vary by investment type and may include market or investment specific events. The frequency with which these procedures are used cannot be predicted and they may be utilized to a significant extent. The Committee oversees the Fund's valuation policies and procedures and reports to the Board on the Committee's activities and fair value determinations. The Board monitors the appropriateness of the procedures used in valuing the Fund's investments and ratifies the fair value determinations of the Committee.
The Fund categorizes the inputs to valuation techniques used to value its investments into a disclosure hierarchy consisting of three levels as shown below:
- Level 1 – quoted prices in active markets for identical investments
- Level 2 – other significant observable inputs (including quoted prices for similar investments, interest rates, prepayment speeds, etc.)
- Level 3 – unobservable inputs (including the Fund's own assumptions based on the best information available)
Valuation techniques used to value the Fund's investments by major category are as follows:
Equity securities, including restricted securities, for which market quotations are readily available, are valued at the last reported sale price or official closing price as reported by a third party pricing vendor on the primary market or exchange on which they are traded and are categorized as Level 1 in the hierarchy. In the event there were no sales during the day or closing prices are not available, securities are valued at the last quoted bid price or may be valued using the last available price and are generally categorized as Level 2 in the hierarchy. For foreign equity securities, when market or security specific events arise, comparisons to the valuation of American Depositary Receipts (ADRs), futures contracts, Exchange-Traded Funds (ETFs) and certain indexes as well as quoted prices for similar securities may be used and would be categorized as Level 2 in the hierarchy. Utilizing these techniques may result in transfers between Level 1 and Level 2. For equity securities, including restricted securities, where observable inputs are limited, assumptions about market activity and risk are used and these securities may be categorized as Level 3 in the hierarchy.
Investments in open-end mutual funds, including the Fidelity Central Funds, are valued at their closing net asset value (NAV) each business day and are categorized as Level 1 in the hierarchy.
Changes in valuation techniques may result in transfers in or out of an assigned level within the disclosure hierarchy. The aggregate value of investments by input level as of April 30, 2017, including information on transfers between Levels 1 and 2, is included at the end of the Fund's Schedule of Investments.
Foreign Currency. The Fund may use foreign currency contracts to facilitate transactions in foreign-denominated securities. Gains and losses from these transactions may arise from changes in the value of the foreign currency or if the counterparties do not perform under the contracts' terms.
Foreign-denominated assets, including investment securities, and liabilities are translated into U.S. dollars at the exchange rates at period end. Purchases and sales of investment securities, income and dividends received and expenses denominated in foreign currencies are translated into U.S. dollars at the exchange rate in effect on the transaction date.
The effects of exchange rate fluctuations on investments are included with the net realized and unrealized gain (loss) on investment securities. Other foreign currency transactions resulting in realized and unrealized gain (loss) are disclosed separately.
Investment Transactions and Income. For financial reporting purposes, the Fund's investment holdings and NAV include trades executed through the end of the last business day of the period. The NAV per share for processing shareholder transactions is calculated as of the close of business of the New York Stock Exchange (NYSE), normally 4:00 p.m. Eastern time and includes trades executed through the end of the prior business day. Gains and losses on securities sold are determined on the basis of identified cost and may include proceeds received from litigation. Dividend income is recorded on the ex-dividend date, except for certain dividends from foreign securities where the ex-dividend date may have passed, which are recorded as soon as the Fund is informed of the ex-dividend date. Non-cash dividends included in dividend income, if any, are recorded at the fair market value of the securities received. Income and capital gain distributions from Fidelity Central Funds, if any, are recorded on the ex-dividend date. Certain distributions received by the Fund represent a return of capital or capital gain. The Fund determines the components of these distributions subsequent to the ex-dividend date, based upon receipt of tax filings or other correspondence relating to the underlying investment. These distributions are recorded as a reduction of cost of investments and/or as a realized gain. Investment income is recorded net of foreign taxes withheld where recovery of such taxes is uncertain.
Class Allocations and Expenses. Investment income, realized and unrealized capital gains and losses, common expenses of the Fund, and certain fund-level expense reductions, if any, are allocated daily on a pro-rata basis to each class based on the relative net assets of each class to the total net assets of the Fund. Each class differs with respect to transfer agent and distribution and service plan fees incurred. Certain expense reductions may also differ by class. For the reporting period, the allocated portion of income and expenses to each class as a percent of its average net assets may vary due to the timing of recording these transactions in relation to fluctuating net assets of the classes. Expenses directly attributable to a fund are charged to that fund. Expenses attributable to more than one fund are allocated among the respective funds on the basis of relative net assets or other appropriate methods. Expense estimates are accrued in the period to which they relate and adjustments are made when actual amounts are known.
Income Tax Information and Distributions to Shareholders. Each year, the Fund intends to qualify as a regulated investment company under Subchapter M of the Internal Revenue Code, including distributing substantially all of its taxable income and realized gains. As a result, no provision for U.S. Federal income taxes is required. The Fund files a U.S. federal tax return, in addition to state and local tax returns as required. The Fund's federal income tax returns are subject to examination by the Internal Revenue Service (IRS) for a period of three fiscal years after they are filed. State and local tax returns may be subject to examination for an additional fiscal year depending on the jurisdiction. Foreign taxes are provided for based on the Fund's understanding of the tax rules and rates that exist in the foreign markets in which it invests. The Fund is subject to a tax imposed on capital gains by certain countries in which it invests.
Distributions are declared and recorded on the ex-dividend date. Income dividends and capital gain distributions are declared separately for each class. Income and capital gain distributions are determined in accordance with income tax regulations, which may differ from GAAP.
Capital accounts within the financial statements are adjusted for permanent book-tax differences. These adjustments have no impact on net assets or the results of operations. Capital accounts are not adjusted for temporary book-tax differences which will reverse in a subsequent period.
Book-tax differences are primarily due to foreign currency transactions, certain foreign taxes, passive foreign income companies (PFIC), deferred trustees compensation and losses deferred due to wash sales.
The federal tax cost of investment securities and unrealized appreciation (depreciation) as of period end were as follows:
| Gross unrealized appreciation | $293,533,179 |
| Gross unrealized depreciation | (25,064,459) |
| Net unrealized appreciation (depreciation) on securities | $268,468,720 |
| Tax cost | $1,300,711,023 |
Capital loss carryforwards are only available to offset future capital gains of the Fund to the extent provided by regulations and may be limited. Under the Regulated Investment Company Modernization Act of 2010 (the Act), the Fund is permitted to carry forward capital losses incurred in taxable years beginning after December 22, 2010 for an unlimited period and such capital losses are required to be used prior to any losses that expire. The capital loss carryforward information presented below, including any applicable limitation, is estimated as of prior fiscal period end and is subject to adjustment.
| No expiration | |
| Short-term | $(35,963,442) |
Short-Term Trading (Redemption) Fees. Shares held by investors in the Fund less than 30 days may have been subject to a redemption fee equal to 1.00% of the NAV of shares redeemed. All redemption fees, which reduce the proceeds of the shareholder redemption, are retained by the Fund and accounted for as an addition to paid in capital. In November 2016, the Board of Trustees approved the elimination of these redemption fees effective December 12, 2016.
Restricted Securities. The Fund may invest in securities that are subject to legal or contractual restrictions on resale. These securities generally may be resold in transactions exempt from registration or to the public if the securities are registered. Disposal of these securities may involve time-consuming negotiations and expense, and prompt sale at an acceptable price may be difficult. Information regarding restricted securities is included at the end of the Fund's Schedule of Investments.
4. Purchases and Sales of Investments.
Purchases and sales of securities, other than short-term securities, aggregated $967,813,890 and $1,048,807,326, respectively.
5. Fees and Other Transactions with Affiliates.
Management Fee. Fidelity Management & Research Company (the investment adviser) and its affiliates provide the Fund with investment management related services for which the Fund pays a monthly management fee. The management fee is the sum of an individual fund fee rate that is based on an annual rate of .424% of the Fund's average net assets and an annualized group fee rate that averaged .25% during the period. The group fee rate is based upon the average net assets of all the mutual funds advised by the investment adviser, including any mutual funds previously advised by the investment adviser that are currently advised by Fidelity SelectCo, LLC, an affiliate of the investment adviser. The group fee rate decreases as assets under management increase and increases as assets under management decrease. In addition, the management fee is subject to a performance adjustment (up to a maximum of +/- .20% of the Fund's average net assets over a 36 month performance period). The upward or downward adjustment to the management fee is based on the relative investment performance of Overseas as compared to its benchmark index, the MSCI World Index, over the same 36 month performance period. For the reporting period, the total annualized management fee rate, including the performance adjustment, was .49% of the Fund's average net assets. The performance adjustment included in the management fee rate may be higher or lower than the maximum performance adjustment rate due to the difference between the average net assets for the reporting and performance periods.
Distribution and Service Plan Fees. In accordance with Rule 12b-1 of the 1940 Act, the Fund has adopted separate Distribution and Service Plans for each class of shares. Certain classes pay Fidelity Distributors Corporation (FDC), an affiliate of the investment adviser, separate Distribution and Service Fees, each of which is based on an annual percentage of each class' average net assets. In addition, FDC may pay financial intermediaries for selling shares of the Fund and providing shareholder support services. For the period, the Distribution and Service Fee rates, total fees and amounts retained by FDC were as follows:
| | Distribution
Fee | Service
Fee | Total Fees | Retained
by FDC |
| Class A | -% | .25% | $35,246 | $614 |
| Class M | .25% | .25% | 22,872 | 276 |
| Class C | .75% | .25% | 49,061 | 5,522 |
| | | | $107,179 | $6,412 |
Sales Load. FDC may receive a front-end sales charge of up to 5.75% for selling Class A shares and 3.50% for selling Class M shares, some of which is paid to financial intermediaries for selling shares of the Fund. Depending on the holding period, FDC may receive contingent deferred sales charges levied on Class A, Class M and Class C redemptions. The deferred sales charges are 1.00% for Class C shares, 1.00% for certain purchases of Class A shares and .25% for certain purchases of Class M shares.
For the period, sales charge amounts retained by FDC were as follows:
| | Retained
by FDC |
| Class A | $4,985 |
| Class M | 952 |
| Class C(a) | 738 |
| | $6,675 |
(a) When Class C shares are initially sold, FDC pays commissions from its own resources to financial intermediaries through which the sales are made.
Transfer Agent Fees. Fidelity Investments Institutional Operations Company, Inc., (FIIOC), an affiliate of the investment adviser, is the transfer, dividend disbursing and shareholder servicing agent for each class of the Fund. FIIOC receives account fees and asset-based fees that vary according to the account size and type of account of the shareholders of the respective classes of the Fund. FIIOC pays for typesetting, printing and mailing of shareholder reports, except proxy statements.
For the period, transfer agent fees for each class were as follows:
| | Amount | % of
Class-Level Average
Net Assets(a) |
| Class A | $35,803 | .25 |
| Class M | 14,181 | .31 |
| Class C | 13,281 | .27 |
| Worldwide | 1,296,523 | .18 |
| Class I | 14,646 | .21 |
| | $1,374,434 | |
(a) Annualized
Accounting and Security Lending Fees. Fidelity Service Company, Inc. (FSC), an affiliate of the investment adviser, maintains the Fund's accounting records. The accounting fee is based on the level of average net assets for each month. Under a separate contract, FSC administers the security lending program. The security lending fee is based on the number and duration of lending transactions.
Brokerage Commissions. The Fund placed a portion of its portfolio transactions with brokerage firms which are affiliates of the investment adviser. Brokerage commissions are included in net realized gain (loss) and change in net unrealized appreciation (depreciation) in the Statement of Operations. The commissions paid to these affiliated firms were $14,614 for the period.
Interfund Trades. The Fund may purchase from or sell securities to other Fidelity Funds under procedures adopted by the Board. The procedures have been designed to ensure these interfund trades are executed in accordance with Rule 17a-7 of the 1940 Act. Interfund trades are included within the respective purchases and sales amounts shown in the Purchases and Sales of Investments note.
6. Committed Line of Credit.
The Fund participates with other funds managed by the investment adviser or an affiliate in a $4.25 billion credit facility (the "line of credit") to be utilized for temporary or emergency purposes to fund shareholder redemptions or for other short-term liquidity purposes. The Fund has agreed to pay commitment fees on its pro-rata portion of the line of credit, which amounted to $2,509 and is reflected in Miscellaneous expenses on the Statement of Operations. During the period, the Fund did not borrow on this line of credit.
7. Security Lending.
The Fund lends portfolio securities through a lending agent from time to time in order to earn additional income. For equity securities, a lending agent is used and may loan securities to certain qualified borrowers, including Fidelity Capital Markets (FCM), a broker-dealer affiliated with the Fund. On the settlement date of the loan, the Fund receives collateral (in the form of U.S. Treasury obligations, letters of credit and/or cash) against the loaned securities and maintains collateral in an amount not less than 100% of the market value of the loaned securities during the period of the loan. The market value of the loaned securities is determined at the close of business of the Fund and any additional required collateral is delivered to the Fund on the next business day. The Fund or borrower may terminate the loan at any time, and if the borrower defaults on its obligation to return the securities loaned because of insolvency or other reasons, the Fund may apply collateral received from the borrower against the obligation. The Fund may experience delays and costs in recovering the securities loaned. Any cash collateral received is invested in the Fidelity Securities Lending Cash Central Fund. The value of loaned securities and cash collateral at period end are disclosed on the Fund's Statement of Assets and Liabilities. Security lending income represents the income earned on investing cash collateral, less rebates paid to borrowers and any lending agent fees associated with the loan, plus any premium payments received for lending certain types of securities. Security lending income is presented in the Statement of Operations as a component of Income from Fidelity Central Funds. Total security lending income during the period amounted to $183,932, including $10,852 from securities loaned to FCM. During the period, there were no securities loaned to FCM.
8. Expense Reductions.
Commissions paid to certain brokers with whom the investment adviser, or its affiliates, places trades on behalf of the Fund include an amount in addition to trade execution, which may be rebated back to the Fund to offset certain expenses. This amount totaled $91,914 for the period.
In addition, during the period the investment adviser reimbursed and/or waived a portion of fund-level operating expenses in the amount of $6,542.
9. Distributions to Shareholders.
Distributions to shareholders of each class were as follows:
| | Six months ended
April 30, 2017 | Year ended October 31, 2016 |
| From net investment income | | |
| Class A | $156,477 | $95,208 |
| Class M | 13,192 | 2,313 |
| Worldwide | 12,387,164 | 9,064,407 |
| Class I | 108,770 | 116,983 |
| Total | $12,665,603 | $9,278,911 |
| From net realized gain | | |
| Class A | $90,524 | $1,050,091 |
| Class M | 29,788 | 433,754 |
| Class B | – | 11,494 |
| Class C | 5,172 | 384,211 |
| Worldwide | 4,423,987 | 49,987,535 |
| Class I | 41,380 | 804,930 |
| Total | $4,590,851 | $52,672,015 |
10. Share Transactions.
Share transactions for each class were as follows and may contain automatic conversions between classes or exchanges between affiliated funds:
| | Shares | Shares | Dollars | Dollars |
| | Six months ended
April 30, 2017 | Year ended October 31, 2016 | Six months ended
April 30, 2017 | Year ended October 31, 2016 |
| Class A | | | | |
| Shares sold | 120,515 | 331,876 | $2,719,789 | $7,164,455 |
| Reinvestment of distributions | 11,046 | 49,536 | 241,804 | 1,105,146 |
| Shares redeemed | (235,474) | (407,262) | (5,254,213) | (8,799,726) |
| Net increase (decrease) | (103,913) | (25,850) | $(2,292,620) | $(530,125) |
| Class M | | | | |
| Shares sold | 27,960 | 92,065 | $629,375 | $1,986,009 |
| Reinvestment of distributions | 1,947 | 19,370 | 42,456 | 430,197 |
| Shares redeemed | (57,604) | (258,217) | (1,275,858) | (5,563,782) |
| Net increase (decrease) | (27,697) | (146,782) | $(604,027) | $(3,147,576) |
| Class B | | | | |
| Shares sold | – | 457 | $– | $8,678 |
| Reinvestment of distributions | – | 487 | – | 10,726 |
| Shares redeemed | – | (17,206) | – | (357,745) |
| Net increase (decrease) | – | (16,262) | $– | $(338,341) |
| Class C | | | | |
| Shares sold | 26,872 | 109,109 | $590,395 | $2,300,381 |
| Reinvestment of distributions | 220 | 15,568 | 4,750 | 341,870 |
| Shares redeemed | (102,865) | (140,660) | (2,264,024) | (2,969,570) |
| Net increase (decrease) | (75,773) | (15,983) | $(1,668,879) | $(327,319) |
| Worldwide | | | | |
| Shares sold | 2,811,611 | 8,058,052 | $63,844,968 | $175,292,628 |
| Reinvestment of distributions | 735,217 | 2,542,668 | 16,240,943 | 57,260,887 |
| Shares redeemed | (7,175,802) | (12,958,622) | (161,678,433) | (282,800,632) |
| Net increase (decrease) | (3,628,974) | (2,357,902) | $(81,592,522) | $(50,247,117) |
| Class I | | | | |
| Shares sold | 183,773 | 401,119 | $4,162,492 | $8,728,970 |
| Reinvestment of distributions | 6,375 | 28,687 | 140,244 | 643,439 |
| Shares redeemed | (111,928) | (935,107) | (2,509,640) | (20,389,473) |
| Net increase (decrease) | 78,220 | (505,301) | $1,793,096 | $(11,017,064) |
11. Other.
The Fund's organizational documents provide former and current trustees and officers with a limited indemnification against liabilities arising in connection with the performance of their duties to the Fund. In the normal course of business, the Fund may also enter into contracts that provide general indemnifications. The Fund's maximum exposure under these arrangements is unknown as this would be dependent on future claims that may be made against the Fund. The risk of material loss from such claims is considered remote.
Report of Independent Registered Public Accounting Firm
To the Trustees of Fidelity Investment Trust and Shareholders of Fidelity Diversified International Fund:
We have audited the accompanying statement of assets and liabilities of Fidelity Diversified International Fund (the Fund), a fund of Fidelity Investment Trust, including the schedule of investments, as of April 30, 2017, and the related statement of operations for the six months then ended, the statement of changes in net assets for the six months ended April 30, 2017 and for the year ended October 31, 2016, and the financial highlights for the six months ended April 30, 2017 and each of the five years in the period ended October 31, 2016. These financial statements and financial highlights are the responsibility of the Fund’s management. Our responsibility is to express an opinion on these financial statements and financial highlights based on our audits.
We conducted our audits in accordance with the standards of the Public Company Accounting Oversight Board (United States). Those standards require that we plan and perform the audit to obtain reasonable assurance about whether the financial statements and financial highlights are free of material misstatement. The Fund is not required to have, nor were we engaged to perform, an audit of its internal control over financial reporting. Our audits included consideration of internal control over financial reporting as a basis for designing audit procedures that are appropriate in the circumstances, but not for the purpose of expressing an opinion on the effectiveness of the Fund's internal control over financial reporting. Accordingly, we express no such opinion. An audit also includes examining, on a test basis, evidence supporting the amounts and disclosures in the financial statements, assessing the accounting principles used and significant estimates made by management, as well as evaluating the overall financial statement presentation. Our procedures included confirmation of securities owned as of April 30, 2017, by correspondence with the custodians and brokers; when replies were not received from brokers, we performed other auditing procedures. We believe that our audits provide a reasonable basis for our opinion.
In our opinion, such financial statements and financial highlights referred to above present fairly, in all material respects, the financial position of Fidelity Diversified International Fund as of April 30, 2017, the results of its operations for the six-months then ended, the changes in its net assets for the six months ended April 30, 2017 and for the year ended October 31, 2016, and the financial highlights for the six months ended April 30, 2017 and each of the five years in the period ended October 31, 2016, in conformity with accounting principles generally accepted in the United States of America.
DELOITTE & TOUCHE LLP
Boston, Massachusetts
June 14, 2017
Shareholder Expense Example
As a shareholder of the Fund, you incur two types of costs: (1) transaction costs, including sales charges (loads) on purchase payments or redemption proceeds, redemption fees and (2) ongoing costs, including management fees, distribution and/or service (12b-1) fees and other Fund expenses. This Example is intended to help you understand your ongoing costs (in dollars) of investing in the Fund and to compare these costs with the ongoing costs of investing in other mutual funds.
The Example is based on an investment of $1,000 invested at the beginning of the period and held for the entire period (November 1, 2016 to April 30, 2017).
Actual Expenses
The first line of the accompanying table for each class of the Fund provides information about actual account values and actual expenses. You may use the information in this line, together with the amount you invested, to estimate the expenses that you paid over the period. Simply divide your account value by $1,000.00 (for example, an $8,600 account value divided by $1,000.00 = 8.6), then multiply the result by the number in the first line for a class of the Fund under the heading entitled "Expenses Paid During Period" to estimate the expenses you paid on your account during this period. A small balance maintenance fee of $12.00 that is charged once a year may apply for certain accounts with a value of less than $2,000. This fee is not included in the table below. If it was, the estimate of expenses you paid during the period would be higher, and your ending account value lower, by this amount. In addition, the Fund, as a shareholder in the underlying Fidelity Central Funds, will indirectly bear its pro-rata share of the fees and expenses incurred by the underlying Fidelity Central Funds. These fees and expenses are not included in the Fund's annualized expense ratio used to calculate the expense estimate in the table below.
Hypothetical Example for Comparison Purposes
The second line of the accompanying table for each class of the Fund provides information about hypothetical account values and hypothetical expenses based on a Class' actual expense ratio and an assumed rate of return of 5% per year before expenses, which is not the Class' actual return. The hypothetical account values and expenses may not be used to estimate the actual ending account balance or expenses you paid for the period. You may use this information to compare the ongoing costs of investing in the Fund and other funds. To do so, compare this 5% hypothetical example with the 5% hypothetical examples that appear in the shareholder reports of the other funds. A small balance maintenance fee of $12.00 that is charged once a year may apply for certain accounts with a value of less than $2,000. This fee is not included in the table below. If it was, the estimate of expenses you paid during the period would be higher, and your ending account value lower, by this amount. In addition, the Fund, as a shareholder in the underlying Fidelity Central Funds, will indirectly bear its pro-rata share of the fees and expenses incurred by the underlying Fidelity Central Funds. These fees and expenses are not included in the Fund's annualized expense ratio used to calculate the expense estimate in the table below.
Please note that the expenses shown in the table are meant to highlight your ongoing costs only and do not reflect any transaction costs. Therefore, the second line of the table is useful in comparing ongoing costs only, and will not help you determine the relative total costs of owning different funds. In addition, if these transactional costs were included, your costs would have been higher.
| | Annualized Expense RatioA | Beginning
Account Value
November 1, 2016 | Ending
Account Value
April 30, 2017 | Expenses Paid
During Period-B
November 1, 2016
to April 30, 2017 |
| Fidelity Diversified International Fund | | | | |
| Diversified International | .93% | | | |
| Actual | | $1,000.00 | $1,107.00 | $4.86 |
| Hypothetical-C | | $1,000.00 | $1,020.18 | $4.66 |
| Class K | .80% | | | |
| Actual | | $1,000.00 | $1,107.80 | $4.18 |
| Hypothetical-C | | $1,000.00 | $1,020.83 | $4.01 |
| Fidelity International Capital Appreciation Fund | | | | |
| International Capital Appreciation | 1.14% | | | |
| Actual | | $1,000.00 | $1,105.60 | $5.95 |
| Hypothetical-C | | $1,000.00 | $1,019.14 | $5.71 |
| Fidelity Overseas Fund | | | | |
| Overseas | 1.02% | | | |
| Actual | | $1,000.00 | $1,129.70 | $5.39 |
| Hypothetical-C | | $1,000.00 | $1,019.74 | $5.11 |
| Class K | .90% | | | |
| Actual | | $1,000.00 | $1,130.50 | $4.75 |
| Hypothetical-C | | $1,000.00 | $1,020.33 | $4.51 |
| Fidelity Worldwide Fund | | | | |
| Class A | 1.06% | | | |
| Actual | | $1,000.00 | $1,103.90 | $5.53 |
| Hypothetical-C | | $1,000.00 | $1,019.54 | $5.31 |
| Class M | 1.36% | | | |
| Actual | | $1,000.00 | $1,102.50 | $7.09 |
| Hypothetical-C | | $1,000.00 | $1,018.05 | $6.81 |
| Class C | 1.82% | | | |
| Actual | | $1,000.00 | $1,100.00 | $9.48 |
| Hypothetical-C | | $1,000.00 | $1,015.77 | $9.10 |
| Worldwide | .74% | | | |
| Actual | | $1,000.00 | $1,106.40 | $3.86 |
| Hypothetical-C | | $1,000.00 | $1,021.12 | $3.71 |
| Class I | .76% | | | |
| Actual | | $1,000.00 | $1,105.80 | $3.97 |
| Hypothetical-C | | $1,000.00 | $1,021.03 | $3.81 |
A Annualized expense ratio reflects expenses net of applicable fee waivers.
B Expenses are equal to each Class' annualized expense ratio, multiplied by the average account value over the period, multiplied by 181/365 (to reflect the one-half year period).
C 5% return per year before expenses
Corporate Headquarters
245 Summer St.
Boston, MA 02210
www.fidelity.com
IBD-SANN-0617
1.703569.119
Fidelity's Targeted International Equity Funds® Fidelity® Canada Fund
Fidelity® China Region Fund
Fidelity® Emerging Asia Fund
Fidelity® Emerging Markets Fund
Fidelity® Europe Fund
Fidelity® Japan Fund
Fidelity® Japan Smaller Companies Fund
Fidelity® Latin America Fund
Fidelity® Nordic Fund
Fidelity® Pacific Basin Fund
Semi-Annual Report April 30, 2017 |
|
Contents
To view a fund's proxy voting guidelines and proxy voting record for the 12-month period ended June 30, visit http://www.fidelity.com/proxyvotingresults or visit the Securities and Exchange Commission's (SEC) web site at http://www.sec.gov.
You may also call 1-800-544-8544 to request a free copy of the proxy voting guidelines.
Standard & Poor's, S&P and S&P 500 are registered service marks of The McGraw-Hill Companies, Inc. and have been licensed for use by Fidelity Distributors Corporation.
Other third-party marks appearing herein are the property of their respective owners.
All other marks appearing herein are registered or unregistered trademarks or service marks of FMR LLC or an affiliated company. © 2017 FMR LLC. All rights reserved.
This report and the financial statements contained herein are submitted for the general information of the shareholders of the Funds. This report is not authorized for distribution to prospective investors in the Funds unless preceded or accompanied by an effective prospectus.
A fund files its complete schedule of portfolio holdings with the SEC for the first and third quarters of each fiscal year on Form N-Q. Forms N-Q are available on the SEC’s web site at http://www.sec.gov. A fund's Forms N-Q may be reviewed and copied at the SEC’s Public Reference Room in Washington, DC. Information regarding the operation of the SEC's Public Reference Room may be obtained by calling 1-800-SEC-0330.
For a complete list of a fund's portfolio holdings, view the most recent holdings listing, semiannual report, or annual report on Fidelity's web site at http://www.fidelity.com, http://www.institutional.fidelity.com, or http://www.401k.com, as applicable.
NOT FDIC INSURED •MAY LOSE VALUE •NO BANK GUARANTEE
Neither the Funds nor Fidelity Distributors Corporation is a bank.
Fidelity® Canada Fund
Investment Summary (Unaudited)
Geographic Diversification (% of fund's net assets)
| As of April 30, 2017 |
| | Canada | 93.4% |
| | United States of America* | 3.3% |
| | Bailiwick of Jersey | 0.8% |
| | United Kingdom | 0.7% |
| | Germany | 0.6% |
| | France | 0.6% |
| | Ireland | 0.6% |

* Includes Short-Term investments and Net Other Assets (Liabilities).
Percentages are based on country or territory of incorporation and are adjusted for the effect of futures contracts, if applicable.
| As of October 31, 2016 |
| | Canada | 93.2% |
| | United States of America* | 3.8% |
| | Bailiwick of Jersey | 0.9% |
| | United Kingdom | 0.8% |
| | France | 0.5% |
| | Ireland | 0.4% |
| | Israel | 0.4% |

* Includes Short-Term investments and Net Other Assets (Liabilities).
Percentages are based on country or territory of incorporation and are adjusted for the effect of futures contracts, if applicable.
Asset Allocation as of April 30, 2017
| | % of fund's net assets | % of fund's net assets 6 months ago |
| Stocks | 97.1 | 97.0 |
| Short-Term Investments and Net Other Assets (Liabilities) | 2.9 | 3.0 |
Top Ten Stocks as of April 30, 2017
| | % of fund's net assets | % of fund's net assets 6 months ago |
| Royal Bank of Canada (Banks) | 9.9 | 9.3 |
| The Toronto-Dominion Bank (Banks) | 8.9 | 8.7 |
| Suncor Energy, Inc. (Oil, Gas & Consumable Fuels) | 5.9 | 5.4 |
| Enbridge, Inc. (Oil, Gas & Consumable Fuels) | 4.3 | 4.1 |
| Rogers Communications, Inc. Class B (non-vtg.) (Wireless Telecommunication Services) | 3.7 | 3.7 |
| Manulife Financial Corp. (Insurance) | 3.6 | 0.0 |
| Canadian National Railway Co. (Road & Rail) | 3.1 | 5.4 |
| Canadian Pacific Railway Ltd. (Road & Rail) | 3.1 | 0.0 |
| TELUS Corp. (Diversified Telecommunication Services) | 2.8 | 2.9 |
| Alimentation Couche-Tard, Inc. Class B (sub. vtg.) (Food & Staples Retailing) | 2.5 | 2.4 |
| | 47.8 | |
Top Market Sectors as of April 30, 2017
| | % of fund's net assets | % of fund's net assets 6 months ago |
| Financials | 31.0 | 31.1 |
| Energy | 19.6 | 21.8 |
| Materials | 13.0 | 13.7 |
| Industrials | 8.5 | 7.4 |
| Consumer Staples | 8.1 | 7.4 |
| Telecommunication Services | 6.5 | 6.6 |
| Information Technology | 4.6 | 4.6 |
| Consumer Discretionary | 3.6 | 2.5 |
| Real Estate | 0.9 | 0.8 |
| Utilities | 0.7 | 0.7 |
Market Sectors may include more than one industry category.
The Fund may invest up to 35% of its total assets in any industry that represents more than 20% of the Canadian market. As of April 30, 2017, 20.8% of the Fund’s total assets were invested in the Diversified Banks industry, which accounts for more than 20% of the Canadian market.
Percentages shown as 0.0% may reflect amounts less than 0.05%.
Fidelity® Canada Fund
Investments April 30, 2017 (Unaudited)
Showing Percentage of Net Assets
| Common Stocks - 97.1% | | | |
| | | Shares | Value |
| CONSUMER DISCRETIONARY - 3.6% | | | |
| Auto Components - 0.4% | | | |
| Magna International, Inc. Class A (sub. vtg.) | | 136,400 | $5,697,614 |
| Hotels, Restaurants & Leisure - 0.2% | | | |
| Freshii, Inc. | | 258,500 | 2,348,192 |
| Media - 2.2% | | | |
| Cogeco Communications, Inc. | | 176,900 | 10,122,456 |
| Corus Entertainment, Inc. Class B (non-vtg.) | | 588,000 | 5,772,096 |
| Quebecor, Inc. Class B (sub. vtg.) | | 404,600 | 12,350,963 |
| | | | 28,245,515 |
| Specialty Retail - 0.8% | | | |
| AutoCanada, Inc. (a) | | 282,300 | 4,855,796 |
| Sleep Country Canada Holdings, Inc. | | 224,400 | 5,804,596 |
| | | | 10,660,392 |
|
| TOTAL CONSUMER DISCRETIONARY | | | 46,951,713 |
|
| CONSUMER STAPLES - 8.1% | | | |
| Food & Staples Retailing - 7.6% | | | |
| Alimentation Couche-Tard, Inc. Class B (sub. vtg.) | | 719,200 | 33,076,720 |
| Empire Co. Ltd. Class A (non-vtg.) | | 416,300 | 6,413,530 |
| George Weston Ltd. | | 330,800 | 29,707,902 |
| Jean Coutu Group, Inc. Class A (sub. vtg.) | | 395,700 | 6,475,908 |
| Metro, Inc. Class A (sub. vtg.) | | 375,295 | 12,861,287 |
| North West Co., Inc. | | 429,400 | 10,129,065 |
| | | | 98,664,412 |
| Tobacco - 0.5% | | | |
| Imperial Tobacco Group PLC | | 137,773 | 6,748,737 |
|
| TOTAL CONSUMER STAPLES | | | 105,413,149 |
|
| ENERGY - 19.6% | | | |
| Energy Equipment & Services - 1.5% | | | |
| Canadian Energy Services & Technology Corp. | | 1,654,100 | 7,815,791 |
| Pason Systems, Inc. | | 348,200 | 5,170,517 |
| ShawCor Ltd. Class A | | 293,400 | 7,361,598 |
| | | | 20,347,906 |
| Oil, Gas & Consumable Fuels - 18.1% | | | |
| ARC Resources Ltd. | | 772,800 | 10,145,105 |
| Canadian Natural Resources Ltd. | | 874,498 | 27,854,784 |
| Cenovus Energy, Inc. | | 1,197,300 | 11,937,477 |
| Enbridge, Inc. | | 1,354,200 | 56,130,278 |
| Imperial Oil Ltd. | | 381,300 | 11,092,211 |
| NuVista Energy Ltd. (b) | | 1,064,900 | 4,797,725 |
| Parkland Fuel Corp. (b)(c)(d) | | 81,300 | 1,591,992 |
| Peyto Exploration & Development Corp. | | 380,600 | 6,925,830 |
| PrairieSky Royalty Ltd. | | 1,032,018 | 22,491,876 |
| Raging River Exploration, Inc. (b) | | 1,057,900 | 6,176,670 |
| Suncor Energy, Inc. | | 2,425,100 | 76,001,449 |
| | | | 235,145,397 |
|
| TOTAL ENERGY | | | 255,493,303 |
|
| FINANCIALS - 31.0% | | | |
| Banks - 20.8% | | | |
| Bank of Nova Scotia | | 470,800 | 26,170,693 |
| Royal Bank of Canada | | 1,875,400 | 128,415,541 |
| The Toronto-Dominion Bank | | 2,472,000 | 116,315,564 |
| | | | 270,901,798 |
| Capital Markets - 3.1% | | | |
| Amundi SA | | 120,480 | 7,926,827 |
| Brookfield Asset Management, Inc. Class A | | 193,900 | 7,167,645 |
| CI Financial Corp. | | 575,700 | 11,260,533 |
| Fairfax India Holdings Corp. (b) | | 102,000 | 1,416,780 |
| TMX Group Ltd. | | 208,000 | 11,751,189 |
| | | | 39,522,974 |
| Insurance - 7.1% | | | |
| Intact Financial Corp. | | 220,525 | 15,106,621 |
| Manulife Financial Corp. | | 2,713,300 | 47,585,365 |
| Power Corp. of Canada (sub. vtg.) | | 1,286,700 | 29,814,528 |
| | | | 92,506,514 |
|
| TOTAL FINANCIALS | | | 402,931,286 |
|
| HEALTH CARE - 0.6% | | | |
| Pharmaceuticals - 0.6% | | | |
| Bayer AG | | 64,300 | 7,956,042 |
| INDUSTRIALS - 8.5% | | | |
| Airlines - 0.5% | | | |
| WestJet Airlines Ltd. | | 341,100 | 5,642,312 |
| Professional Services - 0.7% | | | |
| Stantec, Inc. | | 343,000 | 8,802,088 |
| Road & Rail - 6.7% | | | |
| Canadian National Railway Co. | | 570,600 | 41,244,718 |
| Canadian Pacific Railway Ltd. | | 261,300 | 40,037,733 |
| TransForce, Inc. | | 286,000 | 6,226,820 |
| | | | 87,509,271 |
| Trading Companies & Distributors - 0.6% | | | |
| Toromont Industries Ltd. | | 229,600 | 8,167,742 |
|
| TOTAL INDUSTRIALS | | | 110,121,413 |
|
| INFORMATION TECHNOLOGY - 4.6% | | | |
| IT Services - 1.8% | | | |
| CGI Group, Inc. Class A (sub. vtg.) (b) | | 479,900 | 23,160,919 |
| Semiconductors & Semiconductor Equipment - 0.2% | | | |
| Dialog Semiconductor PLC(b) | | 65,800 | 3,078,482 |
| Software - 2.6% | | | |
| Constellation Software, Inc. | | 33,300 | 15,230,350 |
| Open Text Corp. | | 543,628 | 18,849,063 |
| | | | 34,079,413 |
|
| TOTAL INFORMATION TECHNOLOGY | | | 60,318,814 |
|
| MATERIALS - 13.0% | | | |
| Chemicals - 2.9% | | | |
| Agrium, Inc. | | 340,400 | 31,949,048 |
| Monsanto Co. | | 49,300 | 5,748,873 |
| | | | 37,697,921 |
| Construction Materials - 0.6% | | | |
| CRH PLC | | 199,200 | 7,255,682 |
| Containers & Packaging - 1.0% | | | |
| CCL Industries, Inc. Class B | | 55,800 | 12,917,329 |
| Metals & Mining - 7.8% | | | |
| Agnico Eagle Mines Ltd. (Canada) | | 323,600 | 15,468,225 |
| Barrick Gold Corp. | | 589,500 | 9,854,870 |
| Detour Gold Corp. (b) | | 444,400 | 5,615,838 |
| Franco-Nevada Corp. | | 299,000 | 20,335,636 |
| Goldcorp, Inc. | | 320,100 | 4,460,131 |
| Lundin Mining Corp. | | 2,485,000 | 13,252,848 |
| Premier Gold Mines Ltd. (b) | | 1,839,800 | 3,719,899 |
| Randgold Resources Ltd. | | 118,964 | 10,464,834 |
| Silver Wheaton Corp. | | 672,200 | 13,413,961 |
| Torex Gold Resources, Inc. (b) | | 295,070 | 4,997,633 |
| | | | 101,583,875 |
| Paper & Forest Products - 0.7% | | | |
| Western Forest Products, Inc. | | 6,174,300 | 9,724,732 |
|
| TOTAL MATERIALS | | | 169,179,539 |
|
| REAL ESTATE - 0.9% | | | |
| Equity Real Estate Investment Trusts (REITs) - 0.9% | | | |
| Allied Properties (REIT) | | 413,000 | 11,082,517 |
| TELECOMMUNICATION SERVICES - 6.5% | | | |
| Diversified Telecommunication Services - 2.8% | | | |
| TELUS Corp. | | 1,109,100 | 36,903,646 |
| Wireless Telecommunication Services - 3.7% | | | |
| Rogers Communications, Inc. Class B (non-vtg.) | | 1,038,300 | 47,607,924 |
|
| TOTAL TELECOMMUNICATION SERVICES | | | 84,511,570 |
|
| UTILITIES - 0.7% | | | |
| Electric Utilities - 0.7% | | | |
| Hydro One Ltd. | | 526,100 | 9,265,187 |
| TOTAL COMMON STOCKS | | | |
| (Cost $1,004,899,915) | | | 1,263,224,533 |
|
| Money Market Funds - 2.7% | | | |
| Fidelity Cash Central Fund, 0.85% (e) | | 30,990,102 | 30,996,300 |
| Fidelity Securities Lending Cash Central Fund 0.86% (e)(f) | | 4,266,184 | 4,266,611 |
| TOTAL MONEY MARKET FUNDS | | | |
| (Cost $35,257,776) | | | 35,262,911 |
| TOTAL INVESTMENT PORTFOLIO - 99.8% | | | |
| (Cost $1,040,157,691) | | | 1,298,487,444 |
| NET OTHER ASSETS (LIABILITIES) - 0.2% | | | 2,149,052 |
| NET ASSETS - 100% | | | $1,300,636,496 |
Legend
(a) Security or a portion of the security is on loan at period end.
(b) Non-income producing
(c) Security exempt from registration under Rule 144A of the Securities Act of 1933. These securities may be resold in transactions exempt from registration, normally to qualified institutional buyers. At the end of the period, the value of these securities amounted to $1,591,992 or 0.1% of net assets.
(d) Security or a portion of the security purchased on a delayed delivery or when-issued basis.
(e) Affiliated fund that is generally available only to investment companies and other accounts managed by Fidelity Investments. The rate quoted is the annualized seven-day yield of the fund at period end. A complete unaudited listing of the fund's holdings as of its most recent quarter end is available upon request. In addition, each Fidelity Central Fund's financial statements are available on the SEC's website or upon request.
(f) Investment made with cash collateral received from securities on loan.
Affiliated Central Funds
Information regarding fiscal year to date income earned by the Fund from investments in Fidelity Central Funds is as follows:
| Fund | Income earned |
| Fidelity Cash Central Fund | $96,720 |
| Fidelity Securities Lending Cash Central Fund | 451,748 |
| Total | $548,468 |
Investment Valuation
The following is a summary of the inputs used, as of April 30, 2017, involving the Fund's assets and liabilities carried at fair value. The inputs or methodology used for valuing securities may not be an indication of the risk associated with investing in those securities. For more information on valuation inputs, and their aggregation into the levels used below, please refer to the Investment Valuation section in the accompanying Notes to Financial Statements.
| | Valuation Inputs at Reporting Date: |
| Description | Total | Level 1 | Level 2 | Level 3 |
| Investments in Securities: | | | | |
| Equities: | | | | |
| Consumer Discretionary | $46,951,713 | $46,951,713 | $-- | $-- |
| Consumer Staples | 105,413,149 | 105,413,149 | -- | -- |
| Energy | 255,493,303 | 253,901,311 | 1,591,992 | -- |
| Financials | 402,931,286 | 402,931,286 | -- | -- |
| Health Care | 7,956,042 | -- | 7,956,042 | -- |
| Industrials | 110,121,413 | 110,121,413 | -- | -- |
| Information Technology | 60,318,814 | 60,318,814 | -- | -- |
| Materials | 169,179,539 | 151,459,023 | 17,720,516 | -- |
| Real Estate | 11,082,517 | 11,082,517 | -- | -- |
| Telecommunication Services | 84,511,570 | 84,511,570 | -- | -- |
| Utilities | 9,265,187 | 9,265,187 | -- | -- |
| Money Market Funds | 35,262,911 | 35,262,911 | -- | -- |
| Total Investments in Securities: | $1,298,487,444 | $1,271,218,894 | $27,268,550 | $-- |
See accompanying notes which are an integral part of the financial statements.
Fidelity® Canada Fund
Financial Statements
Statement of Assets and Liabilities
| | | April 30, 2017 (Unaudited) |
| Assets | | |
Investment in securities, at value (including securities loaned of $4,060,598) — See accompanying schedule:
Unaffiliated issuers (cost $1,004,899,915) | $1,263,224,533 | |
| Fidelity Central Funds (cost $35,257,776) | 35,262,911 | |
| Total Investments (cost $1,040,157,691) | | $1,298,487,444 |
| Foreign currency held at value (cost $36,466) | | 36,466 |
| Receivable for investments sold | | 11,901,380 |
| Receivable for fund shares sold | | 430,734 |
| Dividends receivable | | 2,407,802 |
| Distributions receivable from Fidelity Central Funds | | 37,489 |
| Prepaid expenses | | 905 |
| Other receivables | | 11,464 |
| Total assets | | 1,313,313,684 |
| Liabilities | | |
| Payable to custodian bank | $669 | |
| Payable for investments purchased | | |
| Regular delivery | 3,340,994 | |
| Delayed delivery | 1,649,764 | |
| Payable for fund shares redeemed | 2,208,027 | |
| Accrued management fee | 855,917 | |
| Distribution and service plan fees payable | 27,227 | |
| Other affiliated payables | 288,393 | |
| Other payables and accrued expenses | 39,257 | |
| Collateral on securities loaned | 4,266,940 | |
| Total liabilities | | 12,677,188 |
| Net Assets | | $1,300,636,496 |
| Net Assets consist of: | | |
| Paid in capital | | $1,061,454,950 |
| Undistributed net investment income | | 5,294,279 |
| Accumulated undistributed net realized gain (loss) on investments and foreign currency transactions | | (24,457,222) |
| Net unrealized appreciation (depreciation) on investments and assets and liabilities in foreign currencies | | 258,344,489 |
| Net Assets | | $1,300,636,496 |
| Calculation of Maximum Offering Price | | |
| Class A: | | |
| Net Asset Value and redemption price per share ($38,054,780 ÷ 776,913 shares) | | $48.98 |
| Maximum offering price per share (100/94.25 of $48.98) | | $51.97 |
| Class M: | | |
| Net Asset Value and redemption price per share ($11,353,837 ÷ 232,924 shares) | | $48.74 |
| Maximum offering price per share (100/96.50 of $48.74) | | $50.51 |
| Class C: | | |
| Net Asset Value and offering price per share ($16,661,912 ÷ 347,882 shares)(a) | | $47.90 |
| Canada: | | |
| Net Asset Value, offering price and redemption price per share ($1,189,095,294 ÷ 24,180,640 shares) | | $49.18 |
| Class I: | | |
| Net Asset Value, offering price and redemption price per share ($45,470,673 ÷ 926,823 shares) | | $49.06 |
(a) Redemption price per share is equal to net asset value less any applicable contingent deferred sales charge.
See accompanying notes which are an integral part of the financial statements.
Statement of Operations
| | | Six months ended April 30, 2017 (Unaudited) |
| Investment Income | | |
| Dividends | | $17,404,149 |
| Income from Fidelity Central Funds | | 548,468 |
| Income before foreign taxes withheld | | 17,952,617 |
| Less foreign taxes withheld | | (2,539,493) |
| Total income | | 15,413,124 |
| Expenses | | |
| Management fee | | |
| Basic fee | $4,725,386 | |
| Performance adjustment | 323,022 | |
| Transfer agent fees | 1,457,347 | |
| Distribution and service plan fees | 173,256 | |
| Accounting and security lending fees | 312,692 | |
| Custodian fees and expenses | 11,056 | |
| Independent trustees' fees and expenses | 2,774 | |
| Registration fees | 66,720 | |
| Audit | 40,975 | |
| Legal | 2,142 | |
| Miscellaneous | 5,428 | |
| Total expenses before reductions | 7,120,798 | |
| Expense reductions | (14,891) | 7,105,907 |
| Net investment income (loss) | | 8,307,217 |
| Realized and Unrealized Gain (Loss) | | |
| Net realized gain (loss) on: | | |
| Investment securities: | | |
| Unaffiliated issuers | 26,096,203 | |
| Fidelity Central Funds | (1,175) | |
| Foreign currency transactions | 7,313 | |
| Total net realized gain (loss) | | 26,102,341 |
Change in net unrealized appreciation (depreciation) on:
Investment securities | 10,434,273 | |
| Assets and liabilities in foreign currencies | 18,466 | |
| Total change in net unrealized appreciation (depreciation) | | 10,452,739 |
| Net gain (loss) | | 36,555,080 |
| Net increase (decrease) in net assets resulting from operations | | $44,862,297 |
See accompanying notes which are an integral part of the financial statements.
Statement of Changes in Net Assets
| | Six months ended April 30, 2017 (Unaudited) | Year ended October 31, 2016 |
| Increase (Decrease) in Net Assets | | |
| Operations | | |
| Net investment income (loss) | $8,307,217 | $17,076,194 |
| Net realized gain (loss) | 26,102,341 | (32,588,329) |
| Change in net unrealized appreciation (depreciation) | 10,452,739 | 98,530,458 |
| Net increase (decrease) in net assets resulting from operations | 44,862,297 | 83,018,323 |
| Distributions to shareholders from net investment income | (16,443,381) | (17,462,078) |
| Distributions to shareholders from net realized gain | (5,168,976) | (1,771,774) |
| Total distributions | (21,612,357) | (19,233,852) |
| Share transactions - net increase (decrease) | (70,682,526) | (105,554,211) |
| Redemption fees | 29,954 | 81,286 |
| Total increase (decrease) in net assets | (47,402,632) | (41,688,454) |
| Net Assets | | |
| Beginning of period | 1,348,039,128 | 1,389,727,582 |
| End of period | $1,300,636,496 | $1,348,039,128 |
| Other Information | | |
| Undistributed net investment income end of period | $5,294,279 | $13,430,443 |
See accompanying notes which are an integral part of the financial statements.
Financial Highlights — Fidelity Canada Fund Class A
| | Six months ended (Unaudited) April 30, | Years ended October 31, | | | | |
| | 2017 | 2016 | 2015 | 2014 | 2013 | 2012 |
| Selected Per–Share Data | | | | | | |
| Net asset value, beginning of period | $48.09 | $45.25 | $60.56 | $57.31 | $53.65 | $52.20 |
| Income from Investment Operations | | | | | | |
| Net investment income (loss)A | .23 | .48 | .45 | .47 | .60 | .57 |
| Net realized and unrealized gain (loss) | 1.30 | 2.84 | (8.04) | 3.13 | 3.63 | 1.50 |
| Total from investment operations | 1.53 | 3.32 | (7.59) | 3.60 | 4.23 | 2.07 |
| Distributions from net investment income | (.45) | (.42) | (.50) | (.03) | (.57) | (.33) |
| Distributions from net realized gain | (.19) | (.06) | (7.22) | (.32) | – | (.29) |
| Total distributions | (.64) | (.48) | (7.72) | (.35) | (.57) | (.62) |
| Redemption fees added to paid in capitalA,B | – | – | – | – | – | – |
| Net asset value, end of period | $48.98 | $48.09 | $45.25 | $60.56 | $57.31 | $53.65 |
| Total ReturnC,D,E | 3.17% | 7.45% | (14.32)% | 6.32% | 7.98% | 4.04% |
| Ratios to Average Net AssetsF,G | | | | | | |
| Expenses before reductions | 1.34%H | 1.48% | 1.43% | 1.29% | 1.19% | 1.08% |
| Expenses net of fee waivers, if any | 1.34%H | 1.48% | 1.43% | 1.29% | 1.19% | 1.08% |
| Expenses net of all reductions | 1.34%H | 1.48% | 1.43% | 1.29% | 1.18% | 1.08% |
| Net investment income (loss) | .94%H | 1.06% | .90% | .79% | 1.11% | 1.11% |
| Supplemental Data | | | | | | |
| Net assets, end of period (000 omitted) | $38,055 | $44,144 | $58,286 | $95,004 | $116,661 | $159,597 |
| Portfolio turnover rateI | 40%H | 44% | 24% | 85% | 64% | 86% |
A Calculated based on average shares outstanding during the period.
B Amount represents less than $.005 per share.
C Total returns for periods of less than one year are not annualized.
D Total returns would have been lower if certain expenses had not been reduced during the applicable periods shown.
E Total returns do not include the effect of the sales charges.
F Fees and expenses of any underlying Fidelity Central Funds are not included in the Fund's expense ratio. The Fund indirectly bears its proportionate share of the expenses of any underlying Fidelity Central Funds.
G Expense ratios reflect operating expenses of the class. Expenses before reductions do not reflect amounts reimbursed by the investment adviser or reductions from brokerage service arrangements or reductions from other expense offset arrangements and do not represent the amount paid by the class during periods when reimbursements or reductions occur. Expenses net of fee waivers reflect expenses after reimbursement by the investment adviser but prior to reductions from brokerage service arrangements or other expense offset arrangements. Expenses net of all reductions represent the net expenses paid by the class.
H Annualized
I Amount does not include the portfolio activity of any underlying Fidelity Central Funds.
See accompanying notes which are an integral part of the financial statements.
Financial Highlights — Fidelity Canada Fund Class M
| | Six months ended (Unaudited) April 30, | Years ended October 31, | | | | |
| | 2017 | 2016 | 2015 | 2014 | 2013 | 2012 |
| Selected Per–Share Data | | | | | | |
| Net asset value, beginning of period | $47.82 | $44.99 | $60.22 | $57.14 | $53.48 | $52.01 |
| Income from Investment Operations | | | | | | |
| Net investment income (loss)A | .16 | .35 | .29 | .29 | .45 | .43 |
| Net realized and unrealized gain (loss) | 1.29 | 2.83 | (8.00) | 3.11 | 3.63 | 1.49 |
| Total from investment operations | 1.45 | 3.18 | (7.71) | 3.40 | 4.08 | 1.92 |
| Distributions from net investment income | (.34) | (.29) | (.30) | – | (.42) | (.16) |
| Distributions from net realized gain | (.19) | (.06) | (7.22) | (.32) | – | (.29) |
| Total distributions | (.53) | (.35) | (7.52) | (.32) | (.42) | (.45) |
| Redemption fees added to paid in capitalA,B | – | – | – | – | – | – |
| Net asset value, end of period | $48.74 | $47.82 | $44.99 | $60.22 | $57.14 | $53.48 |
| Total ReturnC,D,E | 3.01% | 7.14% | (14.58)% | 5.99% | 7.69% | 3.74% |
| Ratios to Average Net AssetsF,G | | | | | | |
| Expenses before reductions | 1.63%H | 1.77% | 1.75% | 1.59% | 1.47% | 1.36% |
| Expenses net of fee waivers, if any | 1.63%H | 1.77% | 1.75% | 1.59% | 1.47% | 1.36% |
| Expenses net of all reductions | 1.63%H | 1.77% | 1.75% | 1.59% | 1.46% | 1.36% |
| Net investment income (loss) | .65%H | .78% | .58% | .48% | .83% | .83% |
| Supplemental Data | | | | | | |
| Net assets, end of period (000 omitted) | $11,354 | $11,140 | $12,820 | $21,989 | $23,751 | $29,626 |
| Portfolio turnover rateI | 40%H | 44% | 24% | 85% | 64% | 86% |
A Calculated based on average shares outstanding during the period.
B Amount represents less than $.005 per share.
C Total returns for periods of less than one year are not annualized.
D Total returns would have been lower if certain expenses had not been reduced during the applicable periods shown.
E Total returns do not include the effect of the sales charges.
F Fees and expenses of any underlying Fidelity Central Funds are not included in the Fund's expense ratio. The Fund indirectly bears its proportionate share of the expenses of any underlying Fidelity Central Funds.
G Expense ratios reflect operating expenses of the class. Expenses before reductions do not reflect amounts reimbursed by the investment adviser or reductions from brokerage service arrangements or reductions from other expense offset arrangements and do not represent the amount paid by the class during periods when reimbursements or reductions occur. Expenses net of fee waivers reflect expenses after reimbursement by the investment adviser but prior to reductions from brokerage service arrangements or other expense offset arrangements. Expenses net of all reductions represent the net expenses paid by the class.
H Annualized
I Amount does not include the portfolio activity of any underlying Fidelity Central Funds.
See accompanying notes which are an integral part of the financial statements.
Financial Highlights — Fidelity Canada Fund Class C
| | Six months ended (Unaudited) April 30, | Years ended October 31, | | | | |
| | 2017 | 2016 | 2015 | 2014 | 2013 | 2012 |
| Selected Per–Share Data | | | | | | |
| Net asset value, beginning of period | $46.87 | $44.02 | $59.04 | $56.27 | $52.61 | $51.19 |
| Income from Investment Operations | | | | | | |
| Net investment income (loss)A | .05 | .15 | .07 | .02 | .20 | .19 |
| Net realized and unrealized gain (loss) | 1.27 | 2.78 | (7.85) | 3.07 | 3.58 | 1.46 |
| Total from investment operations | 1.32 | 2.93 | (7.78) | 3.09 | 3.78 | 1.65 |
| Distributions from net investment income | (.11) | (.02) | (.02) | – | (.12) | – |
| Distributions from net realized gain | (.19) | (.06) | (7.22) | (.32) | – | (.23) |
| Total distributions | (.29)B | (.08) | (7.24) | (.32) | (.12) | (.23) |
| Redemption fees added to paid in capitalA,C | – | – | – | – | – | – |
| Net asset value, end of period | $47.90 | $46.87 | $44.02 | $59.04 | $56.27 | $52.61 |
| Total ReturnD,E,F | 2.82% | 6.67% | (14.96)% | 5.53% | 7.21% | 3.26% |
| Ratios to Average Net AssetsG,H | | | | | | |
| Expenses before reductions | 2.06%I | 2.21% | 2.19% | 2.03% | 1.93% | 1.82% |
| Expenses net of fee waivers, if any | 2.06%I | 2.21% | 2.19% | 2.03% | 1.92% | 1.82% |
| Expenses net of all reductions | 2.06%I | 2.21% | 2.18% | 2.03% | 1.92% | 1.82% |
| Net investment income (loss) | .21%I | .33% | .14% | .04% | .37% | .37% |
| Supplemental Data | | | | | | |
| Net assets, end of period (000 omitted) | $16,662 | $18,489 | $21,610 | $38,749 | $46,040 | $66,500 |
| Portfolio turnover rateJ | 40%I | 44% | 24% | 85% | 64% | 86% |
A Calculated based on average shares outstanding during the period.
B Total distributions of $.29 per share is comprised of distributions from net investment income of $.105 and distributions from net realized gain of $.188 per share.
C Amount represents less than $.005 per share.
D Total returns for periods of less than one year are not annualized.
E Total returns would have been lower if certain expenses had not been reduced during the applicable periods shown.
F Total returns do not include the effect of the contingent deferred sales charge.
G Fees and expenses of any underlying Fidelity Central Funds are not included in the Fund's expense ratio. The Fund indirectly bears its proportionate share of the expenses of any underlying Fidelity Central Funds.
H Expense ratios reflect operating expenses of the class. Expenses before reductions do not reflect amounts reimbursed by the investment adviser or reductions from brokerage service arrangements or reductions from other expense offset arrangements and do not represent the amount paid by the class during periods when reimbursements or reductions occur. Expenses net of fee waivers reflect expenses after reimbursement by the investment adviser but prior to reductions from brokerage service arrangements or other expense offset arrangements. Expenses net of all reductions represent the net expenses paid by the class.
I Annualized
J Amount does not include the portfolio activity of any underlying Fidelity Central Funds.
See accompanying notes which are an integral part of the financial statements.
Financial Highlights — Fidelity Canada Fund
| | Six months ended (Unaudited) April 30, | Years ended October 31, | | | | |
| | 2017 | 2016 | 2015 | 2014 | 2013 | 2012 |
| Selected Per–Share Data | | | | | | |
| Net asset value, beginning of period | $48.35 | $45.55 | $60.95 | $57.72 | $54.05 | $52.59 |
| Income from Investment Operations | | | | | | |
| Net investment income (loss)A | .31 | .62 | .60 | .66 | .77 | .73 |
| Net realized and unrealized gain (loss) | 1.32 | 2.85 | (8.09) | 3.13 | 3.66 | 1.51 |
| Total from investment operations | 1.63 | 3.47 | (7.49) | 3.79 | 4.43 | 2.24 |
| Distributions from net investment income | (.61) | (.61) | (.69) | (.24) | (.76) | (.49) |
| Distributions from net realized gain | (.19) | (.06) | (7.22) | (.32) | – | (.29) |
| Total distributions | (.80) | (.67) | (7.91) | (.56) | (.76) | (.78) |
| Redemption fees added to paid in capitalA,B | – | – | – | – | – | – |
| Net asset value, end of period | $49.18 | $48.35 | $45.55 | $60.95 | $57.72 | $54.05 |
| Total ReturnC,D | 3.36% | 7.79% | (14.08)% | 6.64% | 8.32% | 4.36% |
| Ratios to Average Net AssetsE,F | | | | | | |
| Expenses before reductions | 1.02%G | 1.17% | 1.15% | .98% | .87% | .77% |
| Expenses net of fee waivers, if any | 1.02%G | 1.17% | 1.15% | .98% | .87% | .77% |
| Expenses net of all reductions | 1.02%G | 1.17% | 1.14% | .98% | .86% | .77% |
| Net investment income (loss) | 1.25%G | 1.37% | 1.18% | 1.09% | 1.42% | 1.42% |
| Supplemental Data | | | | | | |
| Net assets, end of period (000 omitted) | $1,189,095 | $1,233,050 | $1,279,488 | $2,057,843 | $2,262,380 | $2,992,597 |
| Portfolio turnover rateH | 40%G | 44% | 24% | 85% | 64% | 86% |
A Calculated based on average shares outstanding during the period.
B Amount represents less than $.005 per share.
C Total returns for periods of less than one year are not annualized.
D Total returns would have been lower if certain expenses had not been reduced during the applicable periods shown.
E Fees and expenses of any underlying Fidelity Central Funds are not included in the Fund's expense ratio. The Fund indirectly bears its proportionate share of the expenses of any underlying Fidelity Central Funds.
F Expense ratios reflect operating expenses of the class. Expenses before reductions do not reflect amounts reimbursed by the investment adviser or reductions from brokerage service arrangements or reductions from other expense offset arrangements and do not represent the amount paid by the class during periods when reimbursements or reductions occur. Expenses net of fee waivers reflect expenses after reimbursement by the investment adviser but prior to reductions from brokerage service arrangements or other expense offset arrangements. Expenses net of all reductions represent the net expenses paid by the class.
G Annualized
H Amount does not include the portfolio activity of any underlying Fidelity Central Funds.
See accompanying notes which are an integral part of the financial statements.
Financial Highlights — Fidelity Canada Fund Class I
| | Six months ended (Unaudited) April 30, | Years ended October 31, | | | | |
| | 2017 | 2016 | 2015 | 2014 | 2013 | 2012 |
| Selected Per–Share Data | | | | | | |
| Net asset value, beginning of period | $48.28 | $45.44 | $60.80 | $57.57 | $53.91 | $52.44 |
| Income from Investment Operations | | | | | | |
| Net investment income (loss)A | .32 | .66 | .61 | .65 | .78 | .74 |
| Net realized and unrealized gain (loss) | 1.31 | 2.83 | (8.07) | 3.12 | 3.64 | 1.50 |
| Total from investment operations | 1.63 | 3.49 | (7.46) | 3.77 | 4.42 | 2.24 |
| Distributions from net investment income | (.66) | (.59) | (.68) | (.22) | (.76) | (.48) |
| Distributions from net realized gain | (.19) | (.06) | (7.22) | (.32) | – | (.29) |
| Total distributions | (.85) | (.65) | (7.90) | (.54) | (.76) | (.77) |
| Redemption fees added to paid in capitalA,B | – | – | – | – | – | – |
| Net asset value, end of period | $49.06 | $48.28 | $45.44 | $60.80 | $57.57 | $53.91 |
| Total ReturnC,D | 3.36% | 7.83% | (14.05)% | 6.62% | 8.34% | 4.38% |
| Ratios to Average Net AssetsE,F | | | | | | |
| Expenses before reductions | .99%G | 1.14% | 1.13% | 1.00% | .86% | .76% |
| Expenses net of fee waivers, if any | .99%G | 1.13% | 1.12% | 1.00% | .86% | .76% |
| Expenses net of all reductions | .99%G | 1.13% | 1.12% | 1.00% | .85% | .76% |
| Net investment income (loss) | 1.28%G | 1.41% | 1.21% | 1.08% | 1.43% | 1.42% |
| Supplemental Data | | | | | | |
| Net assets, end of period (000 omitted) | $45,471 | $41,217 | $14,846 | $30,165 | $30,831 | $59,245 |
| Portfolio turnover rateH | 40%G | 44% | 24% | 85% | 64% | 86% |
A Calculated based on average shares outstanding during the period.
B Amount represents less than $.005 per share.
C Total returns for periods of less than one year are not annualized.
D Total returns would have been lower if certain expenses had not been reduced during the applicable periods shown.
E Fees and expenses of any underlying Fidelity Central Funds are not included in the Fund's expense ratio. The Fund indirectly bears its proportionate share of the expenses of any underlying Fidelity Central Funds.
F Expense ratios reflect operating expenses of the class. Expenses before reductions do not reflect amounts reimbursed by the investment adviser or reductions from brokerage service arrangements or reductions from other expense offset arrangements and do not represent the amount paid by the class during periods when reimbursements or reductions occur. Expenses net of fee waivers reflect expenses after reimbursement by the investment adviser but prior to reductions from brokerage service arrangements or other expense offset arrangements. Expenses net of all reductions represent the net expenses paid by the class.
G Annualized
H Amount does not include the portfolio activity of any underlying Fidelity Central Funds.
See accompanying notes which are an integral part of the financial statements.
Notes to Financial Statements (Unaudited)
For the period ended April 30, 2017
1. Organization.
Fidelity Canada Fund (the Fund) is a fund of Fidelity Investment Trust (the Trust) and is authorized to issue an unlimited number of shares. The Trust is registered under the Investment Company Act of 1940, as amended (the 1940 Act), as an open-end management investment company organized as a Massachusetts business trust. The Fund offers Class A, Class M (formerly Class T), Class C, Canada and Class I shares, each of which has equal rights as to assets and voting privileges. Each class has exclusive voting rights with respect to matters that affect that class.
After the close of business on June 24, 2016, all outstanding Class B shares were converted to Class A shares. All prior fiscal period dollar and share amounts for Class B presented in the Notes to Financial Statements are for the period November 1, 2015 through June 24, 2016.
2. Investments in Fidelity Central Funds.
The Fund invests in Fidelity Central Funds, which are open-end investment companies generally available only to other investment companies and accounts managed by the investment adviser and its affiliates. The Fund's Schedule of Investments lists each of the Fidelity Central Funds held as of period end, if any, as an investment of the Fund, but does not include the underlying holdings of each Fidelity Central Fund. As an Investing Fund, the Fund indirectly bears its proportionate share of the expenses of the underlying Fidelity Central Funds.
The Money Market Central Funds seek preservation of capital and current income and are managed by Fidelity Investments Money Management, Inc. (FIMM), an affiliate of the investment adviser. Annualized expenses of the Money Market Central Funds as of their most recent shareholder report date are less than .005%.
A complete unaudited list of holdings for each Fidelity Central Fund is available upon request or at the Securities and Exchange Commission (the SEC) website at www.sec.gov. In addition, the financial statements of the Fidelity Central Funds are available on the SEC website or upon request.
3. Significant Accounting Policies.
The Fund is an investment company and applies the accounting and reporting guidance of the Financial Accounting Standards Board (FASB) Accounting Standards Codification Topic 946 Financial Services – Investments Companies. The financial statements have been prepared in conformity with accounting principles generally accepted in the United States of America (GAAP), which require management to make certain estimates and assumptions at the date of the financial statements. Actual results could differ from those estimates. Subsequent events, if any, through the date that the financial statements were issued have been evaluated in the preparation of the financial statements. The following summarizes the significant accounting policies of the Fund:
Investment Valuation. Investments are valued as of 4:00 p.m. Eastern time on the last calendar day of the period. The Board of Trustees (the Board) has delegated the day to day responsibility for the valuation of the Fund's investments to the Fair Value Committee (the Committee) established by the Fund's investment adviser. In accordance with valuation policies and procedures approved by the Board, the Fund attempts to obtain prices from one or more third party pricing vendors or brokers to value its investments. When current market prices, quotations or currency exchange rates are not readily available or reliable, investments will be fair valued in good faith by the Committee, in accordance with procedures adopted by the Board. Factors used in determining fair value vary by investment type and may include market or investment specific events. The frequency with which these procedures are used cannot be predicted and they may be utilized to a significant extent. The Committee oversees the Fund's valuation policies and procedures and reports to the Board on the Committee's activities and fair value determinations. The Board monitors the appropriateness of the procedures used in valuing the Fund's investments and ratifies the fair value determinations of the Committee.
The Fund categorizes the inputs to valuation techniques used to value its investments into a disclosure hierarchy consisting of three levels as shown below:
- Level 1 – quoted prices in active markets for identical investments
- Level 2 – other significant observable inputs (including quoted prices for similar investments, interest rates, prepayment speeds, etc.)
- Level 3 – unobservable inputs (including the Fund's own assumptions based on the best information available)
Valuation techniques used to value the Fund's investments by major category are as follows:
Equity securities, including restricted securities, for which market quotations are readily available, are valued at the last reported sale price or official closing price as reported by a third party pricing vendor on the primary market or exchange on which they are traded and are categorized as Level 1 in the hierarchy. In the event there were no sales during the day or closing prices are not available, securities are valued at the last quoted bid price or may be valued using the last available price and are generally categorized as Level 2 in the hierarchy. For foreign equity securities, when market or security specific events arise, comparisons to the valuation of American Depositary Receipts (ADRs), futures contracts, Exchange-Traded Funds (ETFs) and certain indexes as well as quoted prices for similar securities may be used and would be categorized as Level 2 in the hierarchy. Utilizing these techniques may result in transfers between Level 1 and Level 2. For equity securities, including restricted securities, where observable inputs are limited, assumptions about market activity and risk are used and these securities may be categorized as Level 3 in the hierarchy.
Investments in open-end mutual funds, including the Fidelity Central Funds, are valued at their closing net asset value (NAV) each business day and are categorized as Level 1 in the hierarchy.
Changes in valuation techniques may result in transfers in or out of an assigned level within the disclosure hierarchy. The aggregate value of investments by input level as of April 30, 2017 is included at the end of the Fund's Schedule of Investments.
Foreign Currency. The Fund may use foreign currency contracts to facilitate transactions in foreign-denominated securities. Gains and losses from these transactions may arise from changes in the value of the foreign currency or if the counterparties do not perform under the contracts' terms.
Foreign-denominated assets, including investment securities, and liabilities are translated into U.S. dollars at the exchange rates at period end. Purchases and sales of investment securities, income and dividends received and expenses denominated in foreign currencies are translated into U.S. dollars at the exchange rate in effect on the transaction date.
The effects of exchange rate fluctuations on investments are included with the net realized and unrealized gain (loss) on investment securities. Other foreign currency transactions resulting in realized and unrealized gain (loss) are disclosed separately.
Investment Transactions and Income. For financial reporting purposes, the Fund's investment holdings and NAV include trades executed through the end of the last business day of the period. The NAV per share for processing shareholder transactions is calculated as of the close of business of the New York Stock Exchange (NYSE), normally 4:00 p.m. Eastern time and includes trades executed through the end of the prior business day. Gains and losses on securities sold are determined on the basis of identified cost and may include proceeds received from litigation. Dividend income is recorded on the ex-dividend date, except for certain dividends from foreign securities where the ex-dividend date may have passed, which are recorded as soon as the Fund is informed of the ex-dividend date. Non-cash dividends included in dividend income, if any, are recorded at the fair market value of the securities received. Income and capital gain distributions from Fidelity Central Funds, if any, are recorded on the ex-dividend date. Certain distributions received by the Fund represent a return of capital or capital gain. The Fund determines the components of these distributions subsequent to the ex-dividend date, based upon receipt of tax filings or other correspondence relating to the underlying investment. These distributions are recorded as a reduction of cost of investments and/or as a realized gain. Investment income is recorded net of foreign taxes withheld where recovery of such taxes is uncertain.
Class Allocations and Expenses. Investment income, realized and unrealized capital gains and losses, common expenses of the Fund, and certain fund-level expense reductions, if any, are allocated daily on a pro-rata basis to each class based on the relative net assets of each class to the total net assets of the Fund. Each class differs with respect to transfer agent and distribution and service plan fees incurred. Certain expense reductions may also differ by class. For the reporting period, the allocated portion of income and expenses to each class as a percent of its average net assets may vary due to the timing of recording these transactions in relation to fluctuating net assets of the classes. Expenses directly attributable to a fund are charged to that fund. Expenses attributable to more than one fund are allocated among the respective funds on the basis of relative net assets or other appropriate methods. Expense estimates are accrued in the period to which they relate and adjustments are made when actual amounts are known.
Income Tax Information and Distributions to Shareholders. Each year, the Fund intends to qualify as a regulated investment company under Subchapter M of the Internal Revenue Code, including distributing substantially all of its taxable income and realized gains. As a result, no provision for U.S. Federal income taxes is required. The Fund files a U.S. federal tax return, in addition to state and local tax returns as required. The Fund's federal income tax returns are subject to examination by the Internal Revenue Service (IRS) for a period of three fiscal years after they are filed. State and local tax returns may be subject to examination for an additional fiscal year depending on the jurisdiction. Foreign taxes are provided for based on the Fund's understanding of the tax rules and rates that exist in the foreign markets in which it invests.
Distributions are declared and recorded on the ex-dividend date. Income dividends and capital gain distributions are declared separately for each class. Income and capital gain distributions are determined in accordance with income tax regulations, which may differ from GAAP.
Capital accounts within the financial statements are adjusted for permanent book-tax differences. These adjustments have no impact on net assets or the results of operations. Capital accounts are not adjusted for temporary book-tax differences which will reverse in a subsequent period.
Book-tax differences are primarily due to foreign currency transactions, passive foreign investment companies (PFIC), partnerships, capital loss carryforwards, deferred trustees compensation and losses deferred due to wash sales.
The federal tax cost of investment securities and unrealized appreciation (depreciation) as of period end were as follows:
| Gross unrealized appreciation | $306,056,975 |
| Gross unrealized depreciation | (52,684,122) |
| Net unrealized appreciation (depreciation) on securities | $253,372,853 |
| Tax cost | $1,045,114,591 |
Capital loss carryforwards are only available to offset future capital gains of the Fund to the extent provided by regulations and may be limited. Under the Regulated Investment Company Modernization Act of 2010 (the Act), the Fund is permitted to carry forward capital losses incurred in taxable years beginning after December 22, 2010 for an unlimited period and such capital losses are required to be used prior to any losses that expire. The capital loss carryforward information presented below, including any applicable limitation, is estimated as of prior fiscal period end and is subject to adjustment.
| No expiration | |
| Short-term | $(3,213,379) |
| Long-term | (34,724,041) |
| Total capital loss carryforward | $(37,937,420) |
Short-Term Trading (Redemption) Fees. Shares held by investors in the Fund less than 90 days may have been subject to a redemption fee equal to 1.50% of the NAV of shares redeemed. All redemption fees, which reduce the proceeds of the shareholder redemption, are retained by the Fund and accounted for as an addition to paid in capital.
Delayed Delivery Transactions and When-Issued Securities. During the period, the Fund transacted in securities on a delayed delivery or when-issued basis. Payment and delivery may take place after the customary settlement period for that security. The price of the underlying securities and the date when the securities will be delivered and paid for are fixed at the time the transaction is negotiated. The securities purchased on a delayed delivery or when-issued basis are identified as such in the Fund's Schedule of Investments. With respect to purchase commitments, the Fund identifies securities as segregated in its records with a value at least equal to the amount of the commitment. Losses may arise due to changes in the value of the underlying securities or if the counterparty does not perform under the contract's terms, or if the issuer does not issue the securities due to political, economic, or other factors.
Restricted Securities. The Fund may invest in securities that are subject to legal or contractual restrictions on resale. These securities generally may be resold in transactions exempt from registration or to the public if the securities are registered. Disposal of these securities may involve time-consuming negotiations and expense, and prompt sale at an acceptable price may be difficult. Information regarding restricted securities is included at the end of the Fund's Schedule of Investments.
4. Purchases and Sales of Investments.
Purchases and sales of securities, other than short-term securities, aggregated $261,518,704 and $343,965,365, respectively.
5. Fees and Other Transactions with Affiliates.
Management Fee. Fidelity Management & Research Company (the investment adviser) and its affiliates provide the Fund with investment management related services for which the Fund pays a monthly management fee. The management fee is the sum of an individual fund fee rate that is based on an annual rate of .45% of the Fund's average net assets and an annualized group fee rate that averaged .25% during the period. The group fee rate is based upon the average net assets of all the mutual funds advised by the investment adviser, including any mutual funds previously advised by the investment adviser that are currently advised by Fidelity SelectCo, LLC, an affiliate of the investment adviser. The group fee rate decreases as assets under management increase and increases as assets under management decrease. In addition, the management fee is subject to a performance adjustment (up to a maximum of +/- .20% of the Fund's average net assets over a 36 month performance period). The upward or downward adjustment to the management fee is based on the relative investment performance of Canada as compared to its benchmark index, the S&P/TSX Composite Index, over the same 36 month performance period. For the reporting period, the total annualized management fee rate, including the performance adjustment, was .74% of the Fund's average net assets. The performance adjustment included in the management fee rate may be higher or lower than the maximum performance adjustment rate due to the difference between the average net assets for the reporting and performance periods.
Distribution and Service Plan Fees. In accordance with Rule 12b-1 of the 1940 Act, the Fund has adopted separate Distribution and Service Plans for each class of shares. Certain classes pay Fidelity Distributors Corporation (FDC), an affiliate of the investment adviser, separate Distribution and Service Fees, each of which is based on an annual percentage of each class' average net assets. In addition, FDC may pay financial intermediaries for selling shares of the Fund and providing shareholder support services. For the period, the Distribution and Service Fee rates, total fees and amounts retained by FDC were as follows:
| | Distribution
Fee | Service
Fee | Total Fees | Retained
by FDC |
| Class A | -% | .25% | $53,571 | $189 |
| Class M | .25% | .25% | 29,016 | 137 |
| Class C | .75% | .25% | 90,669 | 3,886 |
| | | | $173,256 | $4,212 |
Sales Load. FDC may receive a front-end sales charge of up to 5.75% for selling Class A shares and 3.50% for selling Class M shares, some of which is paid to financial intermediaries for selling shares of the Fund. Depending on the holding period, FDC may receive contingent deferred sales charges levied on Class A, Class M, and Class C redemptions. The deferred sales charges are 1.00% for Class C shares, 1.00% for certain purchases of Class A shares and .25% for certain purchases of Class M shares.
For the period, sales charge amounts retained by FDC were as follows:
| | Retained
by FDC |
| Class A | $3,544 |
| Class M | 1,299 |
| Class C(a) | 104 |
| | $4,947 |
(a) When Class C shares are initially sold, FDC pays commissions from its own resources to financial intermediaries through which the sales are made.
Transfer Agent Fees. Fidelity Investments Institutional Operations Company, Inc., (FIIOC), an affiliate of the investment adviser, is the transfer, dividend disbursing and shareholder servicing agent for each class of the Fund. FIIOC receives account fees and asset-based fees that vary according to the account size and type of account of the shareholders of the respective classes of the Fund. FIIOC pays for typesetting, printing and mailing of shareholder reports, except proxy statements.
For the period, transfer agent fees for each class were as follows:
| | Amount | % of
Class-Level Average
Net Assets(a) |
| Class A | $60,050 | .28 |
| Class M | 18,556 | .32 |
| Class C | 23,029 | .25 |
| Canada | 1,315,494 | .21 |
| Class I | 40,218 | .18 |
| | $1,457,347 | |
(a) Annualized
Accounting and Security Lending Fees. Fidelity Service Company, Inc. (FSC), an affiliate of the investment adviser, maintains the Fund's accounting records. The accounting fee is based on the level of average net assets for each month. Under a separate contract, FSC administers the security lending program. The security lending fee is based on the number and duration of lending transactions.
Brokerage Commissions. The Fund placed a portion of its portfolio transactions with brokerage firms which are affiliates of the investment adviser. Brokerage commissions are included in net realized gain (loss) and change in net unrealized appreciation (depreciation) in the Statement of Operations. The commissions paid to these affiliated firms were $43 for the period.
Interfund Trades. The Fund may purchase from or sell securities to other Fidelity Funds under procedures adopted by the Board. The procedures have been designed to ensure these interfund trades are executed in accordance with Rule 17a-7 of the 1940 Act. Interfund trades are included within the respective purchases and sales amounts shown in the Purchases and Sales of Investments note.
6. Committed Line of Credit.
The Fund participates with other funds managed by the investment adviser or an affiliate in a $4.25 billion credit facility (the "line of credit") to be utilized for temporary or emergency purposes to fund shareholder redemptions or for other short-term liquidity purposes. The Fund has agreed to pay commitment fees on its pro-rata portion of the line of credit, which amounted to $2,333 and is reflected in Miscellaneous expenses on the Statement of Operations. During the period, the Fund did not borrow on this line of credit.
7. Security Lending.
The Fund lends portfolio securities through a lending agent from time to time in order to earn additional income. For equity securities, a lending agent is used and may loan securities to certain qualified borrowers, including Fidelity Capital Markets (FCM), a broker-dealer affiliated with the Fund. On the settlement date of the loan, the Fund receives collateral (in the form of U.S. Treasury obligations, letters of credit and/or cash) against the loaned securities and maintains collateral in an amount not less than 100% of the market value of the loaned securities during the period of the loan. The market value of the loaned securities is determined at the close of business of the Fund and any additional required collateral is delivered to the Fund on the next business day. The Fund or borrower may terminate the loan at any time, and if the borrower defaults on its obligation to return the securities loaned because of insolvency or other reasons, the Fund may apply collateral received from the borrower against the obligation. The Fund may experience delays and costs in recovering the securities loaned. Any cash collateral received is invested in the Fidelity Securities Lending Cash Central Fund. The value of loaned securities and cash collateral at period end are disclosed on the Fund's Statement of Assets and Liabilities. The value of securities loaned to FCM at period end was $429,313. Security lending income represents the income earned on investing cash collateral, less rebates paid to borrowers and any lending agent fees associated with the loan, plus any premium payments received for lending certain types of securities. Security lending income is presented in the Statement of Operations as a component of income from Fidelity Central Funds. Total security lending income during the period amounted to $451,748, including $3,696 from securities loaned to FCM.
8. Expense Reductions.
Commissions paid to certain brokers with whom the investment adviser, or its affiliates, places trades on behalf of the Fund include an amount in addition to trade execution, which may be rebated back to the Fund to offset certain expenses. This amount totaled $8,751 for the period. In addition, through arrangements with the Fund's custodian, credits realized as a result of certain uninvested cash balances were used to reduce the Fund's expenses. During the period, these credits reduced the Fund's custody expenses by $2.
In addition, during the period the investment adviser reimbursed and/or waived a portion of fund level operating expenses in the amount of $6,138.
9. Distributions to Shareholders.
Distributions to shareholders of each class were as follows:
| | Six months ended April 30, 2017 | Year ended October 31, 2016 |
| From net investment income | | |
| Class A | $406,836 | $482,934 |
| Class M | 78,661 | 79,315 |
| Class C | 39,905 | 8,502 |
| Canada | 15,352,959 | 16,735,044 |
| Class I | 565,020 | 156,283 |
| Total | $16,443,381 | $17,462,078 |
| From net realized gain | | |
| Class A | $168,842 | $69,321 |
| Class M | 43,752 | 16,639 |
| Class B | – | 3,460 |
| Class C | 71,450 | 28,339 |
| Canada | 4,723,987 | 1,638,014 |
| Class I | 160,945 | 16,001 |
| Total | $5,168,976 | $1,771,774 |
10. Share Transactions.
Share transactions for each class were as follows and may contain automatic conversions between classes or exchanges between affiliated funds:
| | Shares | Shares | Dollars | Dollars |
| | Six months ended April 30, 2017 | Year ended October 31, 2016 | Six months ended April 30, 2017 | Year ended October 31, 2016 |
| Class A | | | | |
| Shares sold | 42,681 | 134,113 | $2,103,413 | $6,147,050 |
| Reinvestment of distributions | 10,631 | 11,425 | 525,595 | 496,287 |
| Shares redeemed | (194,308) | (515,795) | (9,610,765) | (23,017,589) |
| Net increase (decrease) | (140,996) | (370,257) | $(6,981,757) | $(16,374,252) |
| Class M | | | | |
| Shares sold | 16,981 | 23,059 | $835,568 | $1,036,279 |
| Reinvestment of distributions | 2,464 | 2,169 | 121,397 | 93,951 |
| Shares redeemed | (19,476) | (77,250) | (959,360) | (3,322,138) |
| Net increase (decrease) | (31) | (52,022) | $(2,395) | $(2,191,908) |
| Class B | | | | |
| Shares sold | – | 499 | $– | $21,798 |
| Reinvestment of distributions | – | 68 | – | 2,895 |
| Shares redeemed | – | (61,115) | – | (2,725,253) |
| Net increase (decrease) | – | (60,548) | $– | $(2,700,560) |
| Class C | | | | |
| Shares sold | 19,473 | 41,578 | $941,259 | $1,834,681 |
| Reinvestment of distributions | 1,995 | 731 | 96,717 | 31,141 |
| Shares redeemed | (68,036) | (138,754) | (3,280,065) | (5,980,751) |
| Net increase (decrease) | (46,568) | (96,445) | $(2,242,089) | $(4,114,929) |
| Canada | | | | |
| Shares sold | 1,318,095 | 3,590,664 | $65,362,039 | $166,771,731 |
| Reinvestment of distributions | 381,896 | 388,588 | 18,930,598 | 16,926,879 |
| Shares redeemed | (3,019,477) | (6,566,019) | (149,388,409) | (289,731,847) |
| Net increase (decrease) | (1,319,486) | (2,586,767) | $(65,095,772) | $(106,033,237) |
| Class I | | | | |
| Shares sold | 140,001 | 807,708 | $6,942,151 | $37,813,282 |
| Reinvestment of distributions | 14,338 | 2,849 | 709,005 | 123,890 |
| Shares redeemed | (81,143) | (283,652) | (4,011,669) | (12,076,497) |
| Net increase (decrease) | 73,196 | 526,905 | $3,639,487 | $25,860,675 |
11. Other.
The Fund's organizational documents provide former and current trustees and officers with a limited indemnification against liabilities arising in connection with the performance of their duties to the Fund. In the normal course of business, the Fund may also enter into contracts that provide general indemnifications. The Fund's maximum exposure under these arrangements is unknown as this would be dependent on future claims that may be made against the Fund. The risk of material loss from such claims is considered remote.
Fidelity® China Region Fund
Investment Summary (Unaudited)
Geographic Diversification (% of fund's net assets)
| As of April 30, 2017 |
| | China | 39.7% |
| | Cayman Islands | 34.3% |
| | Taiwan | 15.2% |
| | Hong Kong | 4.7% |
| | United States of America* | 2.6% |
| | Bailiwick of Jersey | 1.2% |
| | British Virgin Islands | 1.0% |
| | Bermuda | 0.8% |
| | United Kingdom | 0.5% |
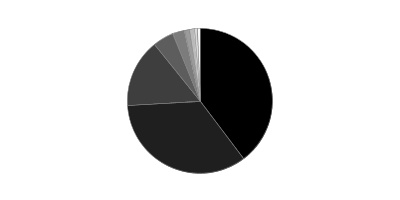
* Includes Short-Term investments and Net Other Assets (Liabilities).
Percentages are based on country or territory of incorporation and are adjusted for the effect of futures contracts, if applicable.
| As of October 31, 2016 |
| | Cayman Islands | 30.6% |
| | China | 29.0% |
| | Taiwan | 20.3% |
| | United States of America* | 6.1% |
| | United Kingdom | 4.8% |
| | Bermuda | 3.0% |
| | Hong Kong | 2.7% |
| | Netherlands | 2.1% |
| | British Virgin Islands | 1.1% |
| | Other | 0.3% |

* Includes Short-Term investments and Net Other Assets (Liabilities).
Percentages are based on country or territory of incorporation and are adjusted for the effect of futures contracts, if applicable.
Asset Allocation as of April 30, 2017
| | % of fund's net assets | % of fund's net assets 6 months ago |
| Stocks | 97.6 | 93.9 |
| Short-Term Investments and Net Other Assets (Liabilities) | 2.4 | 6.1 |
Top Ten Stocks as of April 30, 2017
| | % of fund's net assets | % of fund's net assets 6 months ago |
| Tencent Holdings Ltd. (Internet Software & Services) | 9.2 | 9.2 |
| Taiwan Semiconductor Manufacturing Co. Ltd. (Semiconductors & Semiconductor Equipment) | 6.8 | 8.8 |
| Alibaba Group Holding Ltd. sponsored ADR (Internet Software & Services) | 5.7 | 5.8 |
| JD.com, Inc. sponsored ADR (Internet & Direct Marketing Retail) | 3.2 | 0.9 |
| China Construction Bank Corp. (H Shares) (Banks) | 2.8 | 2.8 |
| Hon Hai Precision Industry Co. Ltd. (Foxconn) (Electronic Equipment & Components) | 2.7 | 2.1 |
| NetEase, Inc. ADR (Internet Software & Services) | 2.3 | 1.6 |
| Industrial & Commercial Bank of China Ltd. (H Shares) (Banks) | 2.1 | 1.9 |
| China Oilfield Services Ltd. (H Shares) (Energy Equipment & Services) | 1.9 | 0.8 |
| Kweichow Moutai Co. Ltd. (A Shares) (Beverages) | 1.8 | 2.0 |
| | 38.5 | |
Top Market Sectors as of April 30, 2017
| | % of fund's net assets | % of fund's net assets 6 months ago |
| Information Technology | 37.5 | 36.2 |
| Consumer Discretionary | 14.0 | 12.6 |
| Financials | 10.7 | 17.0 |
| Materials | 7.9 | 4.0 |
| Industrials | 7.1 | 5.1 |
| Consumer Staples | 5.9 | 3.5 |
| Energy | 5.1 | 3.9 |
| Health Care | 5.1 | 3.2 |
| Utilities | 2.4 | 3.3 |
| Real Estate | 1.3 | 3.6 |
Market Sectors may include more than one industry category.
The Fund may invest up to 35% of its total assets in any industry that represents more than 20% of the Hong Kong, Taiwanese and Chinese markets. As of April 30, 2017, the Fund did not have more than 25% of its total assets invested in any one industry.
Fidelity® China Region Fund
Investments April 30, 2017 (Unaudited)
Showing Percentage of Net Assets
| Common Stocks - 96.7% | | | |
| | | Shares | Value |
| CONSUMER DISCRETIONARY - 13.1% | | | |
| Automobiles - 1.8% | | | |
| Guangzhou Automobile Group Co. Ltd. (H Shares) | | 2,966,000 | $4,613,909 |
| SAIC Motor Corp. Ltd. | | 3,622,515 | 14,319,799 |
| | | | 18,933,708 |
| Diversified Consumer Services - 1.4% | | | |
| New Oriental Education & Technology Group, Inc. sponsored ADR (a) | | 229,800 | 14,831,292 |
| Hotels, Restaurants & Leisure - 1.2% | | | |
| China Travel International Investment HK Ltd. | | 17,560,000 | 5,079,483 |
| Huangshan Tourism Development Co. Ltd. | | 14 | 21 |
| Melco Crown Entertainment Ltd. sponsored ADR | | 354,300 | 7,776,885 |
| | | | 12,856,389 |
| Household Durables - 3.0% | | | |
| Hangzhou Robam Appliances Co. Ltd. Class A | | 762,963 | 6,031,984 |
| Midea Group Co. Ltd. Class A | | 2,288,400 | 11,173,938 |
| Nien Made Enterprise Co. Ltd. | | 432,000 | 4,366,741 |
| Sundart Holdings Ltd. | | 20,000,000 | 11,030,617 |
| | | | 32,603,280 |
| Internet & Direct Marketing Retail - 4.7% | | | |
| Ctrip.com International Ltd. ADR (a) | | 99,400 | 5,020,694 |
| JD.com, Inc. sponsored ADR (a) | | 994,300 | 34,870,101 |
| Vipshop Holdings Ltd. ADR (a) | | 758,900 | 10,525,943 |
| | | | 50,416,738 |
| Specialty Retail - 0.5% | | | |
| Chow Tai Fook Jewellery Group Ltd. | | 5,333,800 | 5,856,082 |
| Textiles, Apparel & Luxury Goods - 0.5% | | | |
| JNBY Design Ltd. | | 6,510,000 | 5,197,388 |
|
| TOTAL CONSUMER DISCRETIONARY | | | 140,694,877 |
|
| CONSUMER STAPLES - 5.9% | | | |
| Beverages - 5.0% | | | |
| Jiangsu Yanghe Brewery Joint-Stock Co. Ltd. Class A | | 1,374,789 | 15,954,612 |
| Kweichow Moutai Co. Ltd. (A Shares) | | 314,832 | 18,883,983 |
| Wuliangye Yibin Co. Ltd. Class A | | 2,801,656 | 18,492,108 |
| | | | 53,330,703 |
| Food & Staples Retailing - 0.9% | | | |
| COFCO Meat Holdings Ltd. | | 30,491,000 | 6,624,771 |
| Zhou Hei Ya International Holdings Co. Ltd. | | 3,442,000 | 3,646,285 |
| | | | 10,271,056 |
|
| TOTAL CONSUMER STAPLES | | | 63,601,759 |
|
| ENERGY - 5.1% | | | |
| Energy Equipment & Services - 1.9% | | | |
| China Oilfield Services Ltd. (H Shares) | | 22,508,000 | 20,776,571 |
| Oil, Gas & Consumable Fuels - 3.2% | | | |
| CNOOC Ltd. | | 15,768,000 | 18,394,917 |
| PetroChina Co. Ltd. (H Shares) | | 22,126,000 | 15,545,317 |
| | | | 33,940,234 |
|
| TOTAL ENERGY | | | 54,716,805 |
|
| FINANCIALS - 10.7% | | | |
| Banks - 4.9% | | | |
| China Construction Bank Corp. (H Shares) | | 37,614,000 | 30,561,813 |
| Industrial & Commercial Bank of China Ltd. (H Shares) | | 33,821,000 | 22,088,320 |
| | | | 52,650,133 |
| Capital Markets - 0.7% | | | |
| CITIC Securities Co. Ltd. (H Shares) | | 1,156,000 | 2,425,440 |
| Shanghai International Airport Co. Ltd. (UBS Warrant Programme) warrants 5/11/18 (a)(b) | | 1,119,000 | 5,559,694 |
| | | | 7,985,134 |
| Diversified Financial Services - 0.2% | | | |
| GDS Holdings Ltd. ADR | | 237,800 | 1,921,424 |
| Insurance - 4.9% | | | |
| China Life Insurance Co. Ltd. (H Shares) | | 5,682,000 | 17,286,148 |
| China Pacific Insurance (Group) Co. Ltd. (H Shares) | | 5,009,600 | 18,516,266 |
| Ping An Insurance (Group) Co. of China Ltd. (H Shares) | | 3,041,500 | 17,126,730 |
| | | | 52,929,144 |
|
| TOTAL FINANCIALS | | | 115,485,835 |
|
| HEALTH CARE - 5.1% | | | |
| Health Care Providers & Services - 0.9% | | | |
| China Resources Phoenix Health (c) | | 7,070,000 | 9,080,242 |
| Life Sciences Tools & Services - 0.7% | | | |
| JHL Biotech, Inc. (a) | | 3,976,696 | 7,960,497 |
| Pharmaceuticals - 3.5% | | | |
| China Resources Pharmaceutical Group Ltd. | | 4,485,000 | 5,281,660 |
| CSPC Pharmaceutical Group Ltd. | | 10,938,000 | 15,187,077 |
| Jiangsu Hengrui Medicine Co. Ltd. (A Shares) | | 799,944 | 6,223,398 |
| Tonghua Dongbao Pharmaceutical Co. Ltd. Class A | | 1,163,336 | 3,646,869 |
| Yunnan Baiyao Group Co. Ltd. | | 559,400 | 6,938,232 |
| | | | 37,277,236 |
|
| TOTAL HEALTH CARE | | | 54,317,975 |
|
| INDUSTRIALS - 7.1% | | | |
| Commercial Services & Supplies - 0.2% | | | |
| Focused Photonics Hangzhou, Inc. | | 561,697 | 2,411,871 |
| Construction & Engineering - 4.8% | | | |
| Beijing Urban Consolidated & Development Group Ltd. (H Shares) | | 20,963,000 | 12,774,511 |
| China Communications Construction Co. Ltd. (H Shares) | | 12,960,000 | 17,827,946 |
| China Energy Engineering Corp. Ltd. | | 27,132,000 | 5,057,808 |
| China State Construction International Holdings Ltd. | | 8,562,000 | 15,542,556 |
| | | | 51,202,821 |
| Machinery - 0.7% | | | |
| Sany Heavy Industry Co. Ltd. Class A | | 7,886,277 | 8,042,435 |
| Road & Rail - 0.6% | | | |
| Daqin Railway Co. Ltd. (A Shares) | | 6,192,097 | 7,006,362 |
| Trading Companies & Distributors - 0.8% | | | |
| Summit Ascent Holdings Ltd. (a)(c) | | 31,652,000 | 8,179,179 |
|
| TOTAL INDUSTRIALS | | | 76,842,668 |
|
| INFORMATION TECHNOLOGY - 37.5% | | | |
| Electronic Equipment & Components - 9.0% | | | |
| AVIC Jonhon OptronicTechnology Co. Ltd. | | 1,890,360 | 10,382,103 |
| Chroma ATE, Inc. | | 3,145,000 | 9,823,247 |
| Hangzhou Hikvision Digital Technology Co. Ltd. Class A | | 2,839,100 | 15,061,418 |
| Hon Hai Precision Industry Co. Ltd. (Foxconn) | | 8,856,400 | 28,951,868 |
| Largan Precision Co. Ltd. | | 93,000 | 15,431,790 |
| Lens Technology Co. Ltd. Class A | | 839,047 | 4,473,051 |
| Sunny Optical Technology Group Co. Ltd. | | 606,000 | 4,986,147 |
| Tongda Group Holdings Ltd. | | 20,390,000 | 8,021,418 |
| | | | 97,131,042 |
| Internet Software & Services - 17.6% | | | |
| 58.com, Inc. ADR (a) | | 107,000 | 4,235,060 |
| Alibaba Group Holding Ltd. sponsored ADR (a) | | 534,600 | 61,746,300 |
| NetEase, Inc. ADR | | 92,300 | 24,495,497 |
| Tencent Holdings Ltd. | | 3,151,300 | 98,740,754 |
| Weibo Corp. sponsored ADR (a)(c) | | 9,970 | 556,924 |
| | | | 189,774,535 |
| Semiconductors & Semiconductor Equipment - 8.6% | | | |
| Advanced Semiconductor Engineering, Inc. | | 9,595,000 | 12,004,612 |
| ASM Pacific Technology Ltd. | | 114,400 | 1,703,127 |
| GlobalWafers Co. Ltd. unit (a) | | 738,500 | 5,278,060 |
| Taiwan Semiconductor Manufacturing Co. Ltd. | | 11,388,000 | 73,234,077 |
| | | | 92,219,876 |
| Software - 0.9% | | | |
| China City Railway Transportation Technology Holdings Co. Ltd. (a) | | 48,540,000 | 9,547,809 |
| Technology Hardware, Storage & Peripherals - 1.4% | | | |
| ADLINK Technology, Inc. | | 3,682,844 | 8,079,031 |
| Advantech Co. Ltd. | | 346,000 | 2,793,369 |
| Axiomtek Co. Ltd. | | 2,000,000 | 3,897,694 |
| | | | 14,770,094 |
|
| TOTAL INFORMATION TECHNOLOGY | | | 403,443,356 |
|
| MATERIALS - 7.9% | | | |
| Construction Materials - 3.8% | | | |
| BBMG Corp. (H Shares) | | 33,657,000 | 18,043,633 |
| China Shanshui Cement Group Ltd. (a)(c) | | 6,687,000 | 3,782,653 |
| TCC International Holdings Ltd. | | 13,948,000 | 6,383,729 |
| West China Cement Ltd. (a) | | 85,964,000 | 12,930,490 |
| | | | 41,140,505 |
| Metals & Mining - 4.1% | | | |
| Angang Steel Co. Ltd.: | | | |
| (A Shares) (a) | | 5,819,352 | 4,499,477 |
| (H Shares) (a) | | 10,712,000 | 7,202,525 |
| Baoshan Iron & Steel Co. Ltd. | | 4,184,268 | 3,787,602 |
| Jiangxi Copper Co. Ltd. (H Shares) | | 4,214,000 | 6,576,968 |
| Zhaojin Mining Industry Co. Ltd. (H Shares) (c) | | 12,973,000 | 11,274,561 |
| Zijin Mng Group Co. Ltd. (H Shares) | | 29,330,000 | 10,369,487 |
| | | | 43,710,620 |
|
| TOTAL MATERIALS | | | 84,851,125 |
|
| REAL ESTATE - 1.3% | | | |
| Real Estate Management & Development - 1.3% | | | |
| Beijing Capital Land Ltd. (H Shares) | | 29,448,000 | 14,310,675 |
| TELECOMMUNICATION SERVICES - 0.6% | | | |
| Diversified Telecommunication Services - 0.6% | | | |
| China Unicom Ltd. | | 4,694,000 | 6,074,148 |
| UTILITIES - 2.4% | | | |
| Independent Power and Renewable Electricity Producers - 2.4% | | | |
| Beijing Jingneng Clean Energy Co. Ltd. (H Shares) | | 16,792,000 | 5,094,798 |
| Canvest Environmental Protection Group Co. Ltd. (c) | | 16,700,000 | 9,532,613 |
| Huaneng Renewables Corp. Ltd. (H Shares) | | 31,944,000 | 11,170,451 |
| | | | 25,797,862 |
| TOTAL COMMON STOCKS | | | |
| (Cost $866,816,845) | | | 1,040,137,085 |
|
| Convertible Preferred Stocks - 0.9% | | | |
| CONSUMER DISCRETIONARY - 0.9% | | | |
| Internet & Direct Marketing Retail - 0.9% | | | |
| China Internet Plus Holdings Ltd. Series A-11 (a)(d) | | | |
| (Cost $6,268,244) | | 1,983,088 | 9,498,992 |
|
| Money Market Funds - 2.6% | | | |
| Fidelity Cash Central Fund, 0.85% (e) | | 16,347,759 | 16,351,028 |
| Fidelity Securities Lending Cash Central Fund 0.86% (e)(f) | | 12,013,876 | 12,015,077 |
| TOTAL MONEY MARKET FUNDS | | | |
| (Cost $28,365,111) | | | 28,366,105 |
| TOTAL INVESTMENT PORTFOLIO - 100.2% | | | |
| (Cost $901,450,200) | | | 1,078,002,182 |
| NET OTHER ASSETS (LIABILITIES) - (0.2)% | | | (2,484,062) |
| NET ASSETS - 100% | | | $1,075,518,120 |
Legend
(a) Non-income producing
(b) Security exempt from registration under Rule 144A of the Securities Act of 1933. These securities may be resold in transactions exempt from registration, normally to qualified institutional buyers. At the end of the period, the value of these securities amounted to $5,559,694 or 0.5% of net assets.
(c) Security or a portion of the security is on loan at period end.
(d) Restricted securities - Investment in securities not registered under the Securities Act of 1933 (excluding 144A issues). At the end of the period, the value of restricted securities (excluding 144A issues) amounted to $9,498,992 or 0.9% of net assets.
(e) Affiliated fund that is generally available only to investment companies and other accounts managed by Fidelity Investments. The rate quoted is the annualized seven-day yield of the fund at period end. A complete unaudited listing of the fund's holdings as of its most recent quarter end is available upon request. In addition, each Fidelity Central Fund's financial statements are available on the SEC's website or upon request.
(f) Investment made with cash collateral received from securities on loan.
Additional information on each restricted holding is as follows:
| Security | Acquisition Date | Acquisition Cost |
| China Internet Plus Holdings Ltd. Series A-11 | 1/26/15 | $6,268,244 |
Affiliated Central Funds
Information regarding fiscal year to date income earned by the Fund from investments in Fidelity Central Funds is as follows:
| Fund | Income earned |
| Fidelity Cash Central Fund | $45,639 |
| Fidelity Securities Lending Cash Central Fund | 356,846 |
| Total | $402,485 |
Investment Valuation
The following is a summary of the inputs used, as of April 30, 2017, involving the Fund's assets and liabilities carried at fair value. The inputs or methodology used for valuing securities may not be an indication of the risk associated with investing in those securities. For more information on valuation inputs, and their aggregation into the levels used below, please refer to the Investment Valuation section in the accompanying Notes to Financial Statements.
| | Valuation Inputs at Reporting Date: |
| Description | Total | Level 1 | Level 2 | Level 3 |
| Investments in Securities: | | | | |
| Equities: | | | | |
| Consumer Discretionary | $150,193,869 | $140,694,877 | $-- | $9,498,992 |
| Consumer Staples | 63,601,759 | 63,601,759 | -- | -- |
| Energy | 54,716,805 | 20,776,571 | 33,940,234 | -- |
| Financials | 115,485,835 | 92,639,993 | 22,845,842 | -- |
| Health Care | 54,317,975 | 54,317,975 | -- | -- |
| Industrials | 76,842,668 | 76,842,668 | -- | -- |
| Information Technology | 403,443,356 | 219,463,913 | 183,979,443 | -- |
| Materials | 84,851,125 | 81,068,472 | -- | 3,782,653 |
| Real Estate | 14,310,675 | 14,310,675 | -- | -- |
| Telecommunication Services | 6,074,148 | -- | 6,074,148 | -- |
| Utilities | 25,797,862 | 25,797,862 | -- | -- |
| Money Market Funds | 28,366,105 | 28,366,105 | -- | -- |
| Total Investments in Securities: | $1,078,002,182 | $817,880,870 | $246,839,667 | $13,281,645 |
The following is a summary of transfers between Level 1 and Level 2 for the period ended April 30, 2017. Transfers are assumed to have occurred at the beginning of the period, and are primarily attributable to the valuation techniques used for foreign equity securities, as discussed in the accompanying Notes to Financial Statements:
| Transfers | Total |
| Level 1 to Level 2 | $0 |
| Level 2 to Level 1 | $20,300,707 |
The following is a reconciliation of Investments in Securities for which Level 3 inputs were used in determining value:
| Investments in Securities: | |
| Beginning Balance | $16,032,916 |
| Net Realized Gain (Loss) on Investment Securities | 1,787,345 |
| Net Unrealized Gain (Loss) on Investment Securities | 9,243,798 |
| Cost of Purchases | -- |
| Proceeds of Sales | (13,782,414) |
| Amortization/Accretion | -- |
| Transfers into Level 3 | -- |
| Transfers out of Level 3 | -- |
| Ending Balance | $13,281,645 |
| The change in unrealized gain (loss) for the period attributable to Level 3 securities held at April 30, 2017 | $8,573,262 |
The information used in the above reconciliation represents fiscal year to date activity for any Investments in Securities identified as using Level 3 inputs at either the beginning or the end of the current fiscal period. Transfers in or out of Level 3 represent the beginning value of any Security or Instrument where a change in the pricing level occurred from the beginning to the end of the period. The cost of purchases and the proceeds of sales may include securities received or delivered through corporate actions or exchanges.
See accompanying notes which are an integral part of the financial statements.
Fidelity® China Region Fund
Financial Statements
Statement of Assets and Liabilities
| | | April 30, 2017 (Unaudited) |
| Assets | | |
Investment in securities, at value (including securities loaned of $11,259,645) — See accompanying schedule:
Unaffiliated issuers (cost $873,085,089) | $1,049,636,077 | |
| Fidelity Central Funds (cost $28,365,111) | 28,366,105 | |
| Total Investments (cost $901,450,200) | | $1,078,002,182 |
| Receivable for investments sold | | 10,516,603 |
| Receivable for fund shares sold | | 940,931 |
| Distributions receivable from Fidelity Central Funds | | 67,682 |
| Prepaid expenses | | 688 |
| Other receivables | | 172,030 |
| Total assets | | 1,089,700,116 |
| Liabilities | | |
| Payable for investments purchased | $39,390 | |
| Payable for fund shares redeemed | 1,191,973 | |
| Accrued management fee | 613,208 | |
| Distribution and service plan fees payable | 14,781 | |
| Other affiliated payables | 216,843 | |
| Other payables and accrued expenses | 90,881 | |
| Collateral on securities loaned | 12,014,920 | |
| Total liabilities | | 14,181,996 |
| Net Assets | | $1,075,518,120 |
| Net Assets consist of: | | |
| Paid in capital | | $1,095,231,215 |
| Accumulated net investment loss | | (3,761,519) |
| Accumulated undistributed net realized gain (loss) on investments and foreign currency transactions | | (192,502,575) |
| Net unrealized appreciation (depreciation) on investments and assets and liabilities in foreign currencies | | 176,550,999 |
| Net Assets | | $1,075,518,120 |
| Calculation of Maximum Offering Price | | |
| Class A: | | |
| Net Asset Value and redemption price per share ($22,428,998 ÷ 799,149 shares) | | $28.07 |
| Maximum offering price per share (100/94.25 of $28.07) | | $29.78 |
| Class M: | | |
| Net Asset Value and redemption price per share ($6,097,886 ÷ 217,978 shares) | | $27.97 |
| Maximum offering price per share (100/96.50 of $27.97) | | $28.98 |
| Class C: | | |
| Net Asset Value and offering price per share ($9,489,886 ÷ 345,040 shares)(a) | | $27.50 |
| China Region: | | |
| Net Asset Value, offering price and redemption price per share ($1,017,915,078 ÷ 35,883,667 shares) | | $28.37 |
| Class I: | | |
| Net Asset Value, offering price and redemption price per share ($19,586,272 ÷ 694,979 shares) | | $28.18 |
(a) Redemption price per share is equal to net asset value less any applicable contingent deferred sales charge.
See accompanying notes which are an integral part of the financial statements.
Statement of Operations
| | | Six months ended April 30, 2017 (Unaudited) |
| Investment Income | | |
| Dividends | | $313,459 |
| Special dividends | | 468,101 |
| Income from Fidelity Central Funds (including $356,846 from security lending) | | 402,485 |
| Income before foreign taxes withheld | | 1,184,045 |
| Less foreign taxes withheld | | (27,989) |
| Total income | | 1,156,056 |
| Expenses | | |
| Management fee | $3,503,912 | |
| Transfer agent fees | 1,058,887 | |
| Distribution and service plan fees | 88,600 | |
| Accounting and security lending fees | 236,042 | |
| Custodian fees and expenses | 175,869 | |
| Independent trustees' fees and expenses | 2,061 | |
| Registration fees | 62,470 | |
| Audit | 43,344 | |
| Legal | 1,593 | |
| Interest | 5,462 | |
| Miscellaneous | 4,108 | |
| Total expenses before reductions | 5,182,348 | |
| Expense reductions | (265,829) | 4,916,519 |
| Net investment income (loss) | | (3,760,463) |
| Realized and Unrealized Gain (Loss) | | |
| Net realized gain (loss) on: | | |
| Investment securities: | | |
| Unaffiliated issuers | 26,955,277 | |
| Fidelity Central Funds | (3,531) | |
| Foreign currency transactions | (42,611) | |
| Total net realized gain (loss) | | 26,909,135 |
Change in net unrealized appreciation (depreciation) on:
Investment securities | 83,798,219 | |
| Assets and liabilities in foreign currencies | (6,044) | |
| Total change in net unrealized appreciation (depreciation) | | 83,792,175 |
| Net gain (loss) | | 110,701,310 |
| Net increase (decrease) in net assets resulting from operations | | $106,940,847 |
See accompanying notes which are an integral part of the financial statements.
Statement of Changes in Net Assets
| | Six months ended April 30, 2017 (Unaudited) | Year ended October 31, 2016 |
| Increase (Decrease) in Net Assets | | |
| Operations | | |
| Net investment income (loss) | $(3,760,463) | $11,358,761 |
| Net realized gain (loss) | 26,909,135 | (213,446,905) |
| Change in net unrealized appreciation (depreciation) | 83,792,175 | 180,733,105 |
| Net increase (decrease) in net assets resulting from operations | 106,940,847 | (21,355,039) |
| Distributions to shareholders from net investment income | (10,635,218) | (15,103,497) |
| Distributions to shareholders from net realized gain | (1,988,847) | (159,831,115) |
| Total distributions | (12,624,065) | (174,934,612) |
| Share transactions - net increase (decrease) | (82,973,681) | (83,319,865) |
| Redemption fees | 56,550 | 164,633 |
| Total increase (decrease) in net assets | 11,399,651 | (279,444,883) |
| Net Assets | | |
| Beginning of period | 1,064,118,469 | 1,343,563,352 |
| End of period | $1,075,518,120 | $1,064,118,469 |
| Other Information | | |
| Undistributed net investment income end of period | $– | $10,634,162 |
| Accumulated net investment loss end of period | $(3,761,519) | $– |
See accompanying notes which are an integral part of the financial statements.
Financial Highlights — Fidelity China Region Fund Class A
| | Six months ended (Unaudited) April 30, | Years ended October 31, | | | | |
| | 2017 | 2016 | 2015 | 2014 | 2013 | 2012 |
| Selected Per–Share Data | | | | | | |
| Net asset value, beginning of period | $25.46 | $29.34 | $34.18 | $35.56 | $28.53 | $27.28 |
| Income from Investment Operations | | | | | | |
| Net investment income (loss)A | (.13)B | .18 | .40C | .21 | .30 | .36 |
| Net realized and unrealized gain (loss) | 2.97 | (.20) | (.83) | 2.01D | 7.06 | 1.42 |
| Total from investment operations | 2.84 | (.02) | (.43) | 2.22 | 7.36 | 1.78 |
| Distributions from net investment income | (.18) | (.27) | (.22) | (.30) | (.34) | (.19) |
| Distributions from net realized gain | (.05) | (3.59) | (4.24) | (3.31) | – | (.34) |
| Total distributions | (.23) | (3.86) | (4.46) | (3.61) | (.34) | (.53) |
| Redemption fees added to paid in capitalA | –E | –E | .05 | .01 | .01 | –E |
| Net asset value, end of period | $28.07 | $25.46 | $29.34 | $34.18 | $35.56 | $28.53 |
| Total ReturnF,G,H | 11.29% | (.13)% | (1.45)% | 6.45%D | 26.07% | 6.70% |
| Ratios to Average Net AssetsI,J | | | | | | |
| Expenses before reductions | 1.32%K | 1.33% | 1.28% | 1.35% | 1.35% | 1.36% |
| Expenses net of fee waivers, if any | 1.32%K | 1.33% | 1.28% | 1.35% | 1.35% | 1.36% |
| Expenses net of all reductions | 1.27%K | 1.32% | 1.26% | 1.35% | 1.31% | 1.29% |
| Net investment income (loss) | (1.04)%B,K | .75% | 1.26%C | .64% | .94% | 1.35% |
| Supplemental Data | | | | | | |
| Net assets, end of period (000 omitted) | $22,429 | $22,937 | $32,761 | $21,728 | $20,623 | $13,539 |
| Portfolio turnover rateL | 82%K | 70% | 151% | 87% | 92% | 107% |
A Calculated based on average shares outstanding during the period.
B Net Investment income per share reflects a large, non-recurring dividend which amounted to $.01 per share. Excluding this non-recurring dividend, the ratio of net investment income (loss) to average net assets would have been (1.13) %.
C Net Investment income per share reflects a large, non-recurring dividend which amounted to $.13 per share. Excluding this non-recurring dividend, the ratio of net investment income (loss) to average net assets would have been .85%.
D Amount includes a reimbursement from the adviser for an operations error which amounted to $.01 per share. Excluding this reimbursement, the total return would have been 6.42%.
E Amount represents less than $.005 per share.
F Total returns for periods of less than one year are not annualized.
G Total returns would have been lower if certain expenses had not been reduced during the applicable periods shown.
H Total returns do not include the effect of the sales charges.
I Fees and expenses of any underlying Fidelity Central Funds are not included in the Fund's expense ratio. The Fund indirectly bears its proportionate share of the expenses of any underlying Fidelity Central Funds.
J Expense ratios reflect operating expenses of the class. Expenses before reductions do not reflect amounts reimbursed by the investment adviser or reductions from brokerage service arrangements or reductions from other expense offset arrangements and do not represent the amount paid by the class during periods when reimbursements or reductions occur. Expenses net of fee waivers reflect expenses after reimbursement by the investment adviser but prior to reductions from brokerage service arrangements or other expense offset arrangements. Expenses net of all reductions represent the net expenses paid by the class.
K Annualized
L Amount does not include the portfolio activity of any underlying Fidelity Central Funds.
See accompanying notes which are an integral part of the financial statements.
Financial Highlights — Fidelity China Region Fund Class M
| | Six months ended (Unaudited) April 30, | Years ended October 31, | | | | |
| | 2017 | 2016 | 2015 | 2014 | 2013 | 2012 |
| Selected Per–Share Data | | | | | | |
| Net asset value, beginning of period | $25.34 | $29.18 | $34.02 | $35.40 | $28.40 | $27.13 |
| Income from Investment Operations | | | | | | |
| Net investment income (loss)A | (.18)B | .10 | .30C | .12 | .21 | .29 |
| Net realized and unrealized gain (loss) | 2.97 | (.22) | (.83) | 1.99D | 7.04 | 1.40 |
| Total from investment operations | 2.79 | (.12) | (.53) | 2.11 | 7.25 | 1.69 |
| Distributions from net investment income | (.11) | (.13) | (.12) | (.19) | (.26) | (.08) |
| Distributions from net realized gain | (.05) | (3.59) | (4.24) | (3.31) | – | (.34) |
| Total distributions | (.16) | (3.72) | (4.36) | (3.50) | (.26) | (.42) |
| Redemption fees added to paid in capitalA | –E | –E | .05 | .01 | .01 | –E |
| Net asset value, end of period | $27.97 | $25.34 | $29.18 | $34.02 | $35.40 | $28.40 |
| Total ReturnF,G,H | 11.10% | (.50)% | (1.79)% | 6.15%D | 25.74% | 6.38% |
| Ratios to Average Net AssetsI,J | | | | | | |
| Expenses before reductions | 1.66%K | 1.67% | 1.62% | 1.65% | 1.64% | 1.64% |
| Expenses net of fee waivers, if any | 1.66%K | 1.67% | 1.62% | 1.65% | 1.64% | 1.64% |
| Expenses net of all reductions | 1.61%K | 1.67% | 1.60% | 1.65% | 1.60% | 1.57% |
| Net investment income (loss) | (1.38)%B,K | .40% | .92%C | .35% | .65% | 1.06% |
| Supplemental Data | | | | | | |
| Net assets, end of period (000 omitted) | $6,098 | $5,644 | $6,409 | $6,305 | $5,965 | $4,349 |
| Portfolio turnover rateL | 82%K | 70% | 151% | 87% | 92% | 107% |
A Calculated based on average shares outstanding during the period.
B Net Investment income per share reflects a large, non-recurring dividend which amounted to $.01 per share. Excluding this non-recurring dividend, the ratio of net investment income (loss) to average net assets would have been (1.47) %.
C Net Investment income per share reflects a large, non-recurring dividend which amounted to $.13 per share. Excluding this non-recurring dividend, the ratio of net investment income (loss) to average net assets would have been .51%.
D Amount includes a reimbursement from the adviser for an operations error which amounted to $.01 per share. Excluding this reimbursement, the total return would have been 6.12%.
E Amount represents less than $.005 per share.
F Total returns for periods of less than one year are not annualized.
G Total returns would have been lower if certain expenses had not been reduced during the applicable periods shown.
H Total returns do not include the effect of the sales charges.
I Fees and expenses of any underlying Fidelity Central Funds are not included in the Fund's expense ratio. The Fund indirectly bears its proportionate share of the expenses of any underlying Fidelity Central Funds.
J Expense ratios reflect operating expenses of the class. Expenses before reductions do not reflect amounts reimbursed by the investment adviser or reductions from brokerage service arrangements or reductions from other expense offset arrangements and do not represent the amount paid by the class during periods when reimbursements or reductions occur. Expenses net of fee waivers reflect expenses after reimbursement by the investment adviser but prior to reductions from brokerage service arrangements or other expense offset arrangements. Expenses net of all reductions represent the net expenses paid by the class.
K Annualized
L Amount does not include the portfolio activity of any underlying Fidelity Central Funds.
See accompanying notes which are an integral part of the financial statements.
Financial Highlights — Fidelity China Region Fund Class C
| | Six months ended (Unaudited) April 30, | Years ended October 31, | | | | |
| | 2017 | 2016 | 2015 | 2014 | 2013 | 2012 |
| Selected Per–Share Data | | | | | | |
| Net asset value, beginning of period | $24.82 | $28.68 | $33.56 | $34.99 | $28.07 | $26.86 |
| Income from Investment Operations | | | | | | |
| Net investment income (loss)A | (.22)B | –C | .15D | (.02) | .06 | .16 |
| Net realized and unrealized gain (loss) | 2.92 | (.21) | (.80) | 1.97E | 6.97 | 1.39 |
| Total from investment operations | 2.70 | (.21) | (.65) | 1.95 | 7.03 | 1.55 |
| Distributions from net investment income | – | (.06) | (.04) | (.08) | (.12) | – |
| Distributions from net realized gain | (.02) | (3.59) | (4.24) | (3.31) | – | (.34) |
| Total distributions | (.02) | (3.65) | (4.28) | (3.39) | (.12) | (.34) |
| Redemption fees added to paid in capitalA | –C | –C | .05 | .01 | .01 | –C |
| Net asset value, end of period | $27.50 | $24.82 | $28.68 | $33.56 | $34.99 | $28.07 |
| Total ReturnF,G,H | 10.88% | (.88)% | (2.21)% | 5.71%E | 25.14% | 5.88% |
| Ratios to Average Net AssetsI,J | | | | | | |
| Expenses before reductions | 2.05%K | 2.07% | 2.05% | 2.07% | 2.10% | 2.11% |
| Expenses net of fee waivers, if any | 2.05%K | 2.07% | 2.05% | 2.07% | 2.10% | 2.11% |
| Expenses net of all reductions | 2.00%K | 2.06% | 2.02% | 2.07% | 2.07% | 2.04% |
| Net investment income (loss) | (1.77)%B,K | .01% | .49%D | (.07)% | .19% | .59% |
| Supplemental Data | | | | | | |
| Net assets, end of period (000 omitted) | $9,490 | $11,218 | $14,355 | $10,445 | $6,957 | $4,515 |
| Portfolio turnover rateL | 82%K | 70% | 151% | 87% | 92% | 107% |
A Calculated based on average shares outstanding during the period.
B Net Investment income per share reflects a large, non-recurring dividend which amounted to $.01 per share. Excluding this non-recurring dividend, the ratio of net investment income (loss) to average net assets would have been (1.86) %.
C Amount represents less than $.005 per share.
D Net Investment income per share reflects a large, non-recurring dividend which amounted to $.13 per share. Excluding this non-recurring dividend, the ratio of net investment income (loss) to average net assets would have been .09%.
E Amount includes a reimbursement from the adviser for an operations error which amounted to $.01 per share. Excluding this reimbursement, the total return would have been 5.68%.
F Total returns for periods of less than one year are not annualized.
G Total returns would have been lower if certain expenses had not been reduced during the applicable periods shown.
H Total returns do not include the effect of the contingent deferred sales charge.
I Fees and expenses of any underlying Fidelity Central Funds are not included in the Fund's expense ratio. The Fund indirectly bears its proportionate share of the expenses of any underlying Fidelity Central Funds.
J Expense ratios reflect operating expenses of the class. Expenses before reductions do not reflect amounts reimbursed by the investment adviser or reductions from brokerage service arrangements or reductions from other expense offset arrangements and do not represent the amount paid by the class during periods when reimbursements or reductions occur. Expenses net of fee waivers reflect expenses after reimbursement by the investment adviser but prior to reductions from brokerage service arrangements or other expense offset arrangements. Expenses net of all reductions represent the net expenses paid by the class.
K Annualized
L Amount does not include the portfolio activity of any underlying Fidelity Central Funds.
See accompanying notes which are an integral part of the financial statements.
Financial Highlights — Fidelity China Region Fund
| | Six months ended (Unaudited) April 30, | Years ended October 31, | | | | |
| | 2017 | 2016 | 2015 | 2014 | 2013 | 2012 |
| Selected Per–Share Data | | | | | | |
| Net asset value, beginning of period | $25.78 | $29.66 | $34.51 | $35.83 | $28.73 | $27.49 |
| Income from Investment Operations | | | | | | |
| Net investment income (loss)A | (.09)B | .26 | .51C | .33 | .41 | .45 |
| Net realized and unrealized gain (loss) | 3.00 | (.21) | (.84) | 2.03D | 7.11 | 1.42 |
| Total from investment operations | 2.91 | .05 | (.33) | 2.36 | 7.52 | 1.87 |
| Distributions from net investment income | (.27) | (.35) | (.33) | (.38) | (.43) | (.29) |
| Distributions from net realized gain | (.05) | (3.59) | (4.24) | (3.31) | – | (.34) |
| Total distributions | (.32) | (3.93)E | (4.57) | (3.69) | (.43) | (.63) |
| Redemption fees added to paid in capitalA | –F | –F | .05 | .01 | .01 | –F |
| Net asset value, end of period | $28.37 | $25.78 | $29.66 | $34.51 | $35.83 | $28.73 |
| Total ReturnG,H | 11.47% | .15% | (1.14)% | 6.83%D | 26.51% | 7.01% |
| Ratios to Average Net AssetsI,J | | | | | | |
| Expenses before reductions | 1.01%K | 1.02% | .99% | 1.01% | 1.02% | 1.04% |
| Expenses net of fee waivers, if any | 1.01%K | 1.02% | .98% | 1.01% | 1.02% | 1.04% |
| Expenses net of all reductions | .96%K | 1.01% | .96% | 1.01% | .98% | .98% |
| Net investment income (loss) | (.73)%B,K | 1.06% | 1.55%C | .99% | 1.27% | 1.66% |
| Supplemental Data | | | | | | |
| Net assets, end of period (000 omitted) | $1,017,915 | $1,004,985 | $1,262,274 | $1,352,761 | $1,425,828 | $1,265,488 |
| Portfolio turnover rateL | 82%K | 70% | 151% | 87% | 92% | 107% |
A Calculated based on average shares outstanding during the period.
B Net Investment income per share reflects a large, non-recurring dividend which amounted to $.01 per share. Excluding this non-recurring dividend, the ratio of net investment income (loss) to average net assets would have been (.82) %.
C Net Investment income per share reflects a large, non-recurring dividend which amounted to $.13 per share. Excluding this non-recurring dividend, the ratio of net investment income (loss) to average net assets would have been 1.15%.
D Amount includes a reimbursement from the adviser for an operations error which amounted to $.01 per share. Excluding this reimbursement, the total return would have been 6.80%.
E Total distributions of $3.93 per share is comprised of distributions from net investment income of $.345 and distributions from net realized gain of $3.588 per share.
F Amount represents less than $.005 per share.
G Total returns for periods of less than one year are not annualized.
H Total returns would have been lower if certain expenses had not been reduced during the applicable periods shown.
I Fees and expenses of any underlying Fidelity Central Funds are not included in the Fund's expense ratio. The Fund indirectly bears its proportionate share of the expenses of any underlying Fidelity Central Funds.
J Expense ratios reflect operating expenses of the class. Expenses before reductions do not reflect amounts reimbursed by the investment adviser or reductions from brokerage service arrangements or reductions from other expense offset arrangements and do not represent the amount paid by the class during periods when reimbursements or reductions occur. Expenses net of fee waivers reflect expenses after reimbursement by the investment adviser but prior to reductions from brokerage service arrangements or other expense offset arrangements. Expenses net of all reductions represent the net expenses paid by the class.
K Annualized
L Amount does not include the portfolio activity of any underlying Fidelity Central Funds.
See accompanying notes which are an integral part of the financial statements.
Financial Highlights — Fidelity China Region Fund Class I
| | Six months ended (Unaudited) April 30, | Years ended October 31, | | | | |
| | 2017 | 2016 | 2015 | 2014 | 2013 | 2012 |
| Selected Per–Share Data | | | | | | |
| Net asset value, beginning of period | $25.62 | $29.51 | $34.39 | $35.75 | $28.68 | $27.46 |
| Income from Investment Operations | | | | | | |
| Net investment income (loss)A | (.09)B | .26 | .51C | .34 | .42 | .45 |
| Net realized and unrealized gain (loss) | 2.98 | (.20) | (.84) | 2.02D | 7.10 | 1.42 |
| Total from investment operations | 2.89 | .06 | (.33) | 2.36 | 7.52 | 1.87 |
| Distributions from net investment income | (.28) | (.36) | (.36) | (.43) | (.46) | (.31) |
| Distributions from net realized gain | (.05) | (3.59) | (4.24) | (3.31) | – | (.34) |
| Total distributions | (.33) | (3.95) | (4.60) | (3.73)E | (.46) | (.65) |
| Redemption fees added to paid in capitalA | –F | –F | .05 | .01 | .01 | –F |
| Net asset value, end of period | $28.18 | $25.62 | $29.51 | $34.39 | $35.75 | $28.68 |
| Total ReturnG,H | 11.47% | .16% | (1.14)% | 6.87%D | 26.58% | 7.02% |
| Ratios to Average Net AssetsI,J | | | | | | |
| Expenses before reductions | 1.01%K | 1.00% | .97% | .98% | .97% | 1.04% |
| Expenses net of fee waivers, if any | 1.01%K | 1.00% | .97% | .98% | .97% | 1.04% |
| Expenses net of all reductions | .95%K | .99% | .95% | .98% | .93% | .98% |
| Net investment income (loss) | (.72)%B,K | 1.07% | 1.57%C | 1.01% | 1.32% | 1.66% |
| Supplemental Data | | | | | | |
| Net assets, end of period (000 omitted) | $19,586 | $19,334 | $26,961 | $19,404 | $10,206 | $1,958 |
| Portfolio turnover rateL | 82%K | 70% | 151% | 87% | 92% | 107% |
A Calculated based on average shares outstanding during the period.
B Net Investment income per share reflects a large, non-recurring dividend which amounted to $.01 per share. Excluding this non-recurring dividend, the ratio of net investment income (loss) to average net assets would have been (.82) %.
C Net Investment income per share reflects a large, non-recurring dividend which amounted to $.13 per share. Excluding this non-recurring dividend, the ratio of net investment income (loss) to average net assets would have been 1.16%.
D Amount includes a reimbursement from the adviser for an operations error which amounted to $.01 per share. Excluding this reimbursement, the total return would have been 6.84%.
E Total distributions of $3.73 per share is comprised of distributions from net investment income of $.425 and distributions from net realized gain of $3.306 per share.
F Amount represents less than $.005 per share.
G Total returns for periods of less than one year are not annualized.
H Total returns would have been lower if certain expenses had not been reduced during the applicable periods shown.
I Fees and expenses of any underlying Fidelity Central Funds are not included in the Fund's expense ratio. The Fund indirectly bears its proportionate share of the expenses of any underlying Fidelity Central Funds.
J Expense ratios reflect operating expenses of the class. Expenses before reductions do not reflect amounts reimbursed by the investment adviser or reductions from brokerage service arrangements or reductions from other expense offset arrangements and do not represent the amount paid by the class during periods when reimbursements or reductions occur. Expenses net of fee waivers reflect expenses after reimbursement by the investment adviser but prior to reductions from brokerage service arrangements or other expense offset arrangements. Expenses net of all reductions represent the net expenses paid by the class.
K Annualized
L Amount does not include the portfolio activity of any underlying Fidelity Central Funds.
See accompanying notes which are an integral part of the financial statements.
Notes to Financial Statements (Unaudited)
For the period ended April 30, 2017
1. Organization.
Fidelity China Region Fund (the Fund) is a fund of Fidelity Investment Trust (the Trust) and is authorized to issue an unlimited number of shares. The Trust is registered under the Investment Company Act of 1940, as amended (the 1940 Act), as an open-end management investment company organized as a Massachusetts business trust. The Fund offers Class A, Class M (formerly Class T), Class C, China Region and Class I shares, each of which has equal rights as to assets and voting privileges. Each class has exclusive voting rights with respect to matters that affect that class. The Fund's investments in emerging markets can be subject to social, economic, regulatory, and political uncertainties and can be extremely volatile.
After the close of business on June 24, 2016, all outstanding Class B shares were converted to Class A shares. All prior fiscal period dollar and share amounts for Class B presented in the Notes to Financial Statements are for the period November 1, 2015 through June 24, 2016.
2. Investments in Fidelity Central Funds.
The Fund invests in Fidelity Central Funds, which are open-end investment companies generally available only to other investment companies and accounts managed by the investment adviser and its affiliates. The Fund's Schedule of Investments lists each of the Fidelity Central Funds held as of period end, if any, as an investment of the Fund, but does not include the underlying holdings of each Fidelity Central Fund. As an Investing Fund, the Fund indirectly bears its proportionate share of the expenses of the underlying Fidelity Central Funds.
The Money Market Central Funds seek preservation of capital and current income and are managed by Fidelity Investments Money Management, Inc. (FIMM), an affiliate of the investment adviser. Annualized expenses of the Money Market Central Funds as of their most recent shareholder report date are less than .005%.
A complete unaudited list of holdings for each Fidelity Central Fund is available upon request or at the Securities and Exchange Commission (the SEC) website at www.sec.gov. In addition, the financial statements of the Fidelity Central Funds are available on the SEC website or upon request.
3. Significant Accounting Policies.
The Fund is an investment company and applies the accounting and reporting guidance of the Financial Accounting Standards Board (FASB) Accounting Standards Codification Topic 946 Financial Services – Investments Companies. The financial statements have been prepared in conformity with accounting principles generally accepted in the United States of America (GAAP), which require management to make certain estimates and assumptions at the date of the financial statements. Actual results could differ from those estimates. Subsequent events, if any, through the date that the financial statements were issued have been evaluated in the preparation of the financial statements. The following summarizes the significant accounting policies of the Fund:
Investment Valuation. Investments are valued as of 4:00 p.m. Eastern time on the last calendar day of the period. The Board of Trustees (the Board) has delegated the day to day responsibility for the valuation of the Fund's investments to the Fair Value Committee (the Committee) established by the Fund's investment adviser. In accordance with valuation policies and procedures approved by the Board, the Fund attempts to obtain prices from one or more third party pricing vendors or brokers to value its investments. When current market prices, quotations or currency exchange rates are not readily available or reliable, investments will be fair valued in good faith by the Committee, in accordance with procedures adopted by the Board. Factors used in determining fair value vary by investment type and may include market or investment specific events. The frequency with which these procedures are used cannot be predicted and they may be utilized to a significant extent. The Committee oversees the Fund's valuation policies and procedures and reports to the Board on the Committee's activities and fair value determinations. The Board monitors the appropriateness of the procedures used in valuing the Fund's investments and ratifies the fair value determinations of the Committee.
The Fund categorizes the inputs to valuation techniques used to value its investments into a disclosure hierarchy consisting of three levels as shown below:
- Level 1 – quoted prices in active markets for identical investments
- Level 2 – other significant observable inputs (including quoted prices for similar investments, interest rates, prepayment speeds, etc.)
- Level 3 – unobservable inputs (including the Fund's own assumptions based on the best information available)
Valuation techniques used to value the Fund's investments by major category are as follows:
Equity securities, including restricted securities, for which market quotations are readily available, are valued at the last reported sale price or official closing price as reported by a third party pricing vendor on the primary market or exchange on which they are traded and are categorized as Level 1 in the hierarchy. In the event there were no sales during the day or closing prices are not available, securities are valued at the last quoted bid price or may be valued using the last available price and are generally categorized as Level 2 in the hierarchy. For foreign equity securities, when market or security specific events arise, comparisons to the valuation of American Depositary Receipts (ADRs), futures contracts, Exchange-Traded Funds (ETFs) and certain indexes as well as quoted prices for similar securities may be used and would be categorized as Level 2 in the hierarchy. Utilizing these techniques may result in transfers between Level 1 and Level 2. For equity securities, including restricted securities, where observable inputs are limited, assumptions about market activity and risk are used and these securities may be categorized as Level 3 in the hierarchy. Equity securities, including restricted securities, for which observable inputs are not available are valued using alternate valuation approaches, including the market approach and the income approach and are categorized as Level 3 in the hierarchy. The market approach generally consists of using comparable market transactions while the income approach generally consists of using the net present value of estimated future cash flows, adjusted as appropriate for liquidity, credit, market and/or other risk factors.
Investments in open-end mutual funds , including the Fidelity Central Funds, are valued at their closing net asset value (NAV) each business day and are categorized as Level 1 in the hierarchy.
The following provides information on Level 3 securities held by the Fund that were valued at period end based on unobservable inputs. These amounts exclude valuations provided by a broker.
| Asset Type | Fair Value | Valuation Technique(s) | Unobservable Input | Amount or Range/Weighted Average | Impact to Valuation from an Increase in Input(a) |
| Equities | $13,281,645 | Market comparable | Enterprise value/Gross profit multiple (EV/GP) | 12.5 | Increase |
| | | | Discount rate | 2.3% | Decrease |
| | | | Discount for lack of marketability | 15.0% | Decrease |
| | | Market approach | Transaction price | $0.57 | Increase |
(a) Represents the expected directional change in the fair value of the Level 3 investments that would result from an increase in the corresponding input. A decrease to the unobservable input would have the opposite effect. Significant changes in these inputs could result in significantly higher or lower fair value measurements.
Changes in valuation techniques may result in transfers in or out of an assigned level within the disclosure hierarchy. The aggregate value of investments by input level as of April 30, 2017, including information on transfers between Levels 1 and 2, as well as a roll forward of Level 3 investments, is included at the end of the Fund's Schedule of Investments.
Foreign Currency. The Fund may use foreign currency contracts to facilitate transactions in foreign-denominated securities. Gains and losses from these transactions may arise from changes in the value of the foreign currency or if the counterparties do not perform under the contracts' terms.
Foreign-denominated assets, including investment securities, and liabilities are translated into U.S. dollars at the exchange rates at period end. Purchases and sales of investment securities, income and dividends received and expenses denominated in foreign currencies are translated into U.S. dollars at the exchange rate in effect on the transaction date.
The effects of exchange rate fluctuations on investments are included with the net realized and unrealized gain (loss) on investment securities. Other foreign currency transactions resulting in realized and unrealized gain (loss) are disclosed separately.
Investment Transactions and Income. For financial reporting purposes, the Fund's investment holdings and NAV include trades executed through the end of the last business day of the period. The NAV per share for processing shareholder transactions is calculated as of the close of business of the New York Stock Exchange (NYSE), normally 4:00 p.m. Eastern time and includes trades executed through the end of the prior business day. Gains and losses on securities sold are determined on the basis of identified cost. Dividend income is recorded on the ex-dividend date, except for certain dividends from foreign securities where the ex-dividend date may have passed, which are recorded as soon as the Fund is informed of the ex-dividend date. Non-cash dividends included in dividend income, if any, are recorded at the fair market value of the securities received. Income and capital gain distributions from Fidelity Central Funds, if any, are recorded on the ex-dividend date. Investment income is recorded net of foreign taxes withheld where recovery of such taxes is uncertain.
Class Allocations and Expenses. Investment income, realized and unrealized capital gains and losses, common expenses of the Fund, and certain fund-level expense reductions, if any, are allocated daily on a pro-rata basis to each class based on the relative net assets of each class to the total net assets of the Fund. Each class differs with respect to transfer agent and distribution and service plan fees incurred. Certain expense reductions may also differ by class. For the reporting period, the allocated portion of income and expenses to each class as a percent of its average net assets may vary due to the timing of recording these transactions in relation to fluctuating net assets of the classes. Expenses directly attributable to a fund are charged to that fund. Expenses attributable to more than one fund are allocated among the respective funds on the basis of relative net assets or other appropriate methods. Expense estimates are accrued in the period to which they relate and adjustments are made when actual amounts are known.
Income Tax Information and Distributions to Shareholders. Each year, the Fund intends to qualify as a regulated investment company under Subchapter M of the Internal Revenue Code, including distributing substantially all of its taxable income and realized gains. As a result, no provision for U.S. Federal income taxes is required. The Fund files a U.S. federal tax return, in addition to state and local tax returns as required. The Fund's federal income tax returns are subject to examination by the Internal Revenue Service (IRS) for a period of three fiscal years after they are filed. State and local tax returns may be subject to examination for an additional fiscal year depending on the jurisdiction. Foreign taxes are provided for based on the Fund's understanding of the tax rules and rates that exist in the foreign markets in which it invests.
Distributions are declared and recorded on the ex-dividend date. Income dividends and capital gain distributions are declared separately for each class. Income and capital gain distributions are determined in accordance with income tax regulations, which may differ from GAAP.
Capital accounts within the financial statements are adjusted for permanent book-tax differences. These adjustments have no impact on net assets or the results of operations. Capital accounts are not adjusted for temporary book-tax differences which will reverse in a subsequent period.
Book-tax differences are primarily due to foreign currency transactions, certain foreign taxes, passive foreign investment companies (PFIC), deferred trustees compensation, capital loss carryfowards and losses deferred due to wash sales.
The federal tax cost of investment securities and unrealized appreciation (depreciation) as of period end were as follows:
| Gross unrealized appreciation | $209,666,123 |
| Gross unrealized depreciation | (34,744,290) |
| Net unrealized appreciation (depreciation) on securities | $174,921,833 |
| Tax cost | $903,080,349 |
Capital loss carryforwards are only available to offset future capital gains of the Fund to the extent provided by regulations and may be limited. Under the Regulated Investment Company Modernization Act of 2010 (the Act), the Fund is permitted to carry forward capital losses incurred in taxable years beginning after December 22, 2010 for an unlimited period and such capital losses are required to be used prior to any losses that expire. The capital loss carryforward information presented below, including any applicable limitation, is estimated as of prior fiscal period end and is subject to adjustment.
| No expiration | |
| Short-term | $(180,168,755) |
| Long-term | (33,286,830) |
| Total capital loss carryforward | $(213,455,585) |
Short-Term Trading (Redemption) Fees. Shares held by investors in the Fund less than 90 days may have been subject to a redemption fee equal to 1.50% of the NAV of shares redeemed. All redemption fees, which reduce the proceeds of the shareholder redemption, are retained by the Fund and accounted for as an addition to paid in capital.
Restricted Securities. The Fund may invest in securities that are subject to legal or contractual restrictions on resale. These securities generally may be resold in transactions exempt from registration or to the public if the securities are registered. Disposal of these securities may involve time-consuming negotiations and expense, and prompt sale at an acceptable price may be difficult. Information regarding restricted securities is included at the end of the Fund's Schedule of Investments.
4. Purchases and Sales of Investments.
Purchases and sales of securities, other than short-term securities, aggregated $407,613,724 and $459,637,020, respectively.
5. Fees and Other Transactions with Affiliates.
Management Fee. Fidelity Management & Research Company (the investment adviser) and its affiliates provide the Fund with investment management related services for which the Fund pays a monthly management fee. The management fee is the sum of an individual fund fee rate that is based on an annual rate of .45% of the Fund's average net assets and an annualized group fee rate that averaged .25% during the period. The group fee rate is based upon the average net assets of all the mutual funds advised by the investment adviser, including any mutual funds previously advised by the investment adviser that are currently advised by Fidelity SelectCo, LLC, an affiliate of the investment adviser. The group fee rate decreases as assets under management increase and increases as assets under management decrease. For the reporting period, the total annualized management fee rate was .70% of the Fund's average net assets.
Distribution and Service Plan Fees. In accordance with Rule 12b-1 of the 1940 Act, the Fund has adopted separate Distribution and Service Plans for each class of shares. Certain classes pay Fidelity Distributors Corporation (FDC), an affiliate of the investment adviser, separate Distribution and Service Fees, each of which is based on an annual percentage of each class' average net assets. In addition, FDC may pay financial intermediaries for selling shares of the Fund and providing shareholder support services. For the period, the Distribution and Service Fee rates, total fees and amounts retained by FDC were as follows:
| | Distribution
Fee | Service
Fee | Total Fees | Retained
by FDC |
| Class A | -% | .25% | $26,646 | $36 |
| Class M | .25% | .25% | 14,058 | 283 |
| Class C | .75% | .25% | 47,896 | 4,066 |
| | | | $88,600 | $4,385 |
Sales Load. FDC may receive a front-end sales charge of up to 5.75% for selling Class A shares and 3.50% for selling Class M shares, some of which is paid to financial intermediaries for selling shares of the Fund. Depending on the holding period, FDC may receive contingent deferred sales charges levied on Class A, Class M, and Class C redemptions. The deferred sales charges are 1.00% for Class C shares, 1.00% for certain purchases of Class A shares and .25% for certain purchases of Class M shares.
For the period, sales charge amounts retained by FDC were as follows:
| | Retained
by FDC |
| Class A | $3,736 |
| Class M | 1,270 |
| Class C(a) | 1,354 |
| | $6,360 |
(a) When Class C shares are initially sold, FDC pays commissions from its own resources to financial intermediaries through which the sales are made.
Transfer Agent Fees. Fidelity Investments Institutional Operations Company, Inc., (FIIOC), an affiliate of the investment adviser, is the transfer, dividend disbursing and shareholder servicing agent for each class of the Fund. FIIOC receives account fees and asset-based fees that vary according to the account size and type of account of the shareholders of the respective classes of the Fund. FIIOC pays for typesetting, printing and mailing of shareholder reports, except proxy statements.
For the period, transfer agent fees for each class were as follows:
| | Amount | % of
Class-Level Average
Net Assets(a) |
| Class A | $28,877 | .27 |
| Class M | 10,187 | .36 |
| Class C | 11,957 | .25 |
| China Region | 988,218 | .21 |
| Class I | 19,648 | .20 |
| | $1,058,887 | |
(a) Annualized
Accounting and Security Lending Fees. Fidelity Service Company, Inc. (FSC), an affiliate of the investment adviser, maintains the Fund's accounting records. The accounting fee is based on the level of average net assets for each month. Under a separate contract, FSC administers the security lending program. The security lending fee is based on the number and duration of lending transactions.
Brokerage Commissions. The Fund placed a portion of its portfolio transactions with brokerage firms which are affiliates of the investment adviser. Brokerage commissions are included in net realized gain (loss) and change in net unrealized appreciation (depreciation) in the Statement of Operations. The commissions paid to these affiliated firms were $1,011 for the period.
Interfund Lending Program. Pursuant to an Exemptive Order issued by the SEC, the Fund, along with other registered investment companies having management contracts with FMR or other affiliated entities of FMR, may participate in an interfund lending program. This program provides an alternative credit facility allowing the funds to borrow from, or lend money to, other participating affiliated funds. At period end, there were no interfund loans outstanding. The Fund's activity in this program during the period for which loans were outstanding was as follows:
| Borrower or Lender | Average Loan Balance | Weighted Average Interest Rate | Interest Expense |
| Borrower | $12,213,000 | .71% | $5,088 |
Interfund Trades. The Fund may purchase from or sell securities to other Fidelity Funds under procedures adopted by the Board. The procedures have been designed to ensure these interfund trades are executed in accordance with Rule 17a-7 of the 1940 Act. Interfund trades are included within the respective purchases and sales amounts shown in the Purchases and Sales of Investments note.
6. Committed Line of Credit.
The Fund participates with other funds managed by the investment adviser or an affiliate in a $4.25 billion credit facility (the "line of credit") to be utilized for temporary or emergency purposes to fund shareholder redemptions or for other short-term liquidity purposes. The Fund has agreed to pay commitment fees on its pro-rata portion of the line of credit, which amounted to $1,712 and is reflected in Miscellaneous expenses on the Statement of Operations. During the period, the Fund did not borrow on this line of credit.
7. Security Lending.
The Fund lends portfolio securities through a lending agent from time to time in order to earn additional income. For equity securities, a lending agent is used and may loan securities to certain qualified borrowers, including Fidelity Capital Markets (FCM), a broker-dealer affiliated with the Fund. On the settlement date of the loan, the Fund receives collateral (in the form of U.S. Treasury obligations, letters of credit and/or cash) against the loaned securities and maintains collateral in an amount not less than 100% of the market value of the loaned securities during the period of the loan. The market value of the loaned securities is determined at the close of business of the Fund and any additional required collateral is delivered to the Fund on the next business day. The Fund or borrower may terminate the loan at any time, and if the borrower defaults on its obligation to return the securities loaned because of insolvency or other reasons, the Fund may apply collateral received from the borrower against the obligation. The Fund may experience delays and costs in recovering the securities loaned. Any cash collateral received is invested in the Fidelity Securities Lending Cash Central Fund. The value of loaned securities and cash collateral at period end are disclosed on the Fund's Statement of Assets and Liabilities. Security lending income represents the income earned on investing cash collateral, less rebates paid to borrowers and any lending agent fees associated with the loan, plus any premium payments received for lending certain types of securities. Security lending income is presented in the Statement of Operations as a component of income from Fidelity Central Funds. During the period, there were no securities loaned to FCM.
8. Bank Borrowings.
The Fund is permitted to have bank borrowings for temporary or emergency purposes to fund shareholder redemptions or for other short-term liquidity requirements. The Fund has established borrowing arrangements with certain banks. The interest rate on the borrowings is the bank's base rate, as revised from time to time. The average loan balance during the period for which loans were outstanding amounted to $4,033,333. The weighted average interest rate was 1.11%. The interest expense amounted to $374 under the bank borrowing program. At period end, there were no bank borrowings outstanding.
9. Expense Reductions.
Commissions paid to certain brokers with whom the investment adviser, or its affiliates, places trades on behalf of the Fund include an amount in addition to trade execution, which may be rebated back to the Fund to offset certain expenses. This amount totaled $261,477 for the period.
In addition, during the period the investment adviser reimbursed and/or waived a portion of fund-level operating expenses in the amount of $4,352.
10. Distributions to Shareholders.
Distributions to shareholders of each class were as follows:
| | Six months ended
April 30, 2017 | Year ended October 31, 2016 |
| From net investment income | | |
| Class A | $157,254 | $297,014 |
| Class M | 24,256 | 28,522 |
| Class C | – | 29,301 |
| China Region | 10,241,399 | 14,431,516 |
| Class I | $212,309 | $317,144 |
| Total | $10,635,218 | $15,103,497 |
| From net realized gain | | |
| Class A | $43,202 | $3,946,989 |
| Class M | 10,926 | 763,704 |
| Class B | – | 93,006 |
| Class C | 7,384 | 1,752,229 |
| China Region | 1,889,558 | 150,087,760 |
| Class I | 37,777 | 3,187,427 |
| Total | $1,988,847 | $159,831,115 |
11. Share Transactions.
Share transactions for each class were as follows and may contain automatic conversions between classes or exchanges between affiliated funds:
| | Shares | Shares | Dollars | Dollars |
| | Six months ended April 30, 2017 | Year ended October 31, 2016 | Six months ended April 30, 2017 | Year ended October 31, 2016 |
| Class A | | | | |
| Shares sold | 110,593 | 240,368 | $2,907,714 | $5,824,186 |
| Reinvestment of distributions | 7,951 | 162,605 | 195,750 | 4,157,811 |
| Shares redeemed | (220,425) | (618,365) | (5,603,531) | (14,282,494) |
| Net increase (decrease) | (101,881) | (215,392) | $(2,500,067) | $(4,300,497) |
| Class M | | | | |
| Shares sold | 23,659 | 43,307 | $599,639 | $1,037,492 |
| Reinvestment of distributions | 1,419 | 30,599 | 34,859 | 781,504 |
| Shares redeemed | (29,803) | (70,825) | (753,758) | (1,686,295) |
| Net increase (decrease) | (4,725) | 3,081 | $(119,260) | $132,701 |
| Class B | | | | |
| Shares sold | – | 30 | $– | $648 |
| Reinvestment of distributions | – | 3,443 | – | 87,630 |
| Shares redeemed | – | (31,204) | – | (704,876) |
| Net increase (decrease) | – | (27,731) | $– | $(616,598) |
| Class C | | | | |
| Shares sold | 35,440 | 98,283 | $901,963 | $2,387,271 |
| Reinvestment of distributions | 254 | 55,713 | 6,148 | 1,398,404 |
| Shares redeemed | (142,611) | (202,505) | (3,523,893) | (4,847,372) |
| Net increase (decrease) | (106,917) | (48,509) | $(2,615,782) | $(1,061,697) |
| China Region | | | | |
| Shares sold | 2,408,244 | 3,781,033 | $63,571,325 | $92,584,217 |
| Reinvestment of distributions | 469,803 | 6,142,435 | 11,674,597 | 158,659,097 |
| Shares redeemed | (5,980,331) | (13,494,506) | (151,379,293) | (325,219,240) |
| Net increase (decrease) | (3,102,284) | (3,571,038) | $(76,133,371) | $(73,975,926) |
| Class I | | | | |
| Shares sold | 209,292 | 405,852 | $5,379,622 | $10,200,502 |
| Reinvestment of distributions | 8,728 | 99,936 | 215,492 | 2,565,348 |
| Shares redeemed | (277,604) | (664,751) | (7,200,315) | (16,263,698) |
| Net increase (decrease) | (59,584) | (158,963) | $(1,605,201) | $(3,497,848) |
12. Other.
The Fund's organizational documents provide former and current trustees and officers with a limited indemnification against liabilities arising in connection with the performance of their duties to the Fund. In the normal course of business, the Fund may also enter into contracts that provide general indemnifications. The Fund's maximum exposure under these arrangements is unknown as this would be dependent on future claims that may be made against the Fund. The risk of material loss from such claims is considered remote.
Fidelity® Emerging Asia Fund
Investment Summary (Unaudited)
Geographic Diversification (% of fund's net assets)
| As of April 30, 2017 |
| | Cayman Islands | 17.2% |
| | India | 15.4% |
| | China | 13.9% |
| | Taiwan | 13.5% |
| | Korea (South) | 12.8% |
| | Hong Kong | 8.8% |
| | Bermuda | 3.9% |
| | Indonesia | 3.6% |
| | United States of America* | 3.4% |
| | Other | 7.5% |
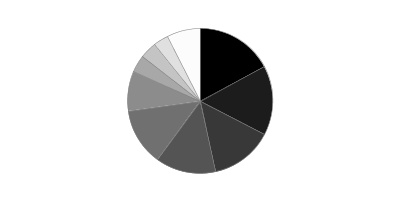
* Includes Short-Term investments and Net Other Assets (Liabilities).
Percentages are based on country or territory of incorporation and are adjusted for the effect of futures contracts, if applicable.
| As of October 31, 2016 |
| | Cayman Islands | 15.5% |
| | Taiwan | 15.0% |
| | India | 14.6% |
| | Hong Kong | 11.6% |
| | Korea (South) | 11.3% |
| | China | 9.9% |
| | United States of America* | 5.6% |
| | Indonesia | 3.8% |
| | Bermuda | 3.8% |
| | Other | 8.9% |

* Includes Short-Term investments and Net Other Assets (Liabilities).
Percentages are based on country or territory of incorporation and are adjusted for the effect of futures contracts, if applicable.
Asset Allocation as of April 30, 2017
| | % of fund's net assets | % of fund's net assets 6 months ago |
| Stocks | 97.2 | 95.3 |
| Bonds | 0.0 | 0.1 |
| Short-Term Investments and Net Other Assets (Liabilities) | 2.8 | 4.6 |
Top Ten Stocks as of April 30, 2017
| | % of fund's net assets | % of fund's net assets 6 months ago |
| Samsung Electronics Co. Ltd. (Korea (South), Technology Hardware, Storage & Peripherals) | 6.2 | 5.1 |
| Tencent Holdings Ltd. (Cayman Islands, Internet Software & Services) | 6.2 | 5.3 |
| Taiwan Semiconductor Manufacturing Co. Ltd. (Taiwan, Semiconductors & Semiconductor Equipment) | 5.6 | 5.4 |
| Alibaba Group Holding Ltd. sponsored ADR (Cayman Islands, Internet Software & Services) | 4.2 | 3.9 |
| AIA Group Ltd. (Hong Kong, Insurance) | 2.8 | 2.7 |
| China Construction Bank Corp. (H Shares) (China, Banks) | 2.2 | 2.1 |
| Hon Hai Precision Industry Co. Ltd. (Foxconn) (Taiwan, Electronic Equipment & Components) | 1.9 | 1.9 |
| Housing Development Finance Corp. Ltd. (India, Thrifts & Mortgage Finance) | 1.7 | 1.4 |
| Reliance Industries Ltd. (India, Oil, Gas & Consumable Fuels) | 1.6 | 1.3 |
| PT Bank Central Asia Tbk (Indonesia, Banks) | 1.3 | 1.1 |
| | 33.7 | |
Top Market Sectors as of April 30, 2017
| | % of fund's net assets | % of fund's net assets 6 months ago |
| Information Technology | 31.1 | 26.2 |
| Financials | 17.5 | 17.6 |
| Consumer Discretionary | 9.1 | 9.4 |
| Health Care | 7.1 | 4.8 |
| Industrials | 7.1 | 5.4 |
| Consumer Staples | 6.9 | 6.8 |
| Real Estate | 4.6 | 5.0 |
| Utilities | 4.3 | 5.9 |
| Energy | 4.1 | 5.0 |
| Telecommunication Services | 2.9 | 5.9 |
Percentages shown as 0.0% may reflect amounts less than 0.05%.
Fidelity® Emerging Asia Fund
Investments April 30, 2017 (Unaudited)
Showing Percentage of Net Assets
| Common Stocks - 97.2% | | | |
| | | Shares | Value |
| Australia - 0.6% | | | |
| Beacon Lighting Group Ltd. | | 438,521 | $591,056 |
| SpeedCast International Ltd. | | 892,904 | 2,547,391 |
| Woodside Petroleum Ltd. | | 102,898 | 2,479,470 |
|
| TOTAL AUSTRALIA | | | 5,617,917 |
|
| Bermuda - 3.9% | | | |
| Brilliance China Automotive Holdings Ltd. | | 2,752,000 | 4,613,585 |
| Cheung Kong Infrastructure Holdings Ltd. | | 1,077,000 | 9,436,134 |
| Hongkong Land Holdings Ltd. | | 1,058,500 | 8,161,035 |
| Man Wah Holdings Ltd. | | 6,192,800 | 5,135,223 |
| PAX Global Technology Ltd. | | 1,980,000 | 1,226,944 |
| Tai Cheung Holdings Ltd. | | 2,870,000 | 2,700,881 |
| Vtech Holdings Ltd. | | 447,800 | 5,673,528 |
|
| TOTAL BERMUDA | | | 36,947,330 |
|
| Cayman Islands - 17.2% | | | |
| Alibaba Group Holding Ltd. sponsored ADR (a) | | 351,600 | 40,609,800 |
| China State Construction International Holdings Ltd. | | 3,758,000 | 6,821,879 |
| Cogobuy Group (a) | | 1,181,000 | 1,700,515 |
| Ctrip.com International Ltd. ADR (a) | | 184,900 | 9,339,299 |
| Haitian International Holdings Ltd. | | 1,227,000 | 3,006,630 |
| International Housewares Retail Co. Ltd. | | 11,015,000 | 2,492,354 |
| JD.com, Inc. sponsored ADR (a) | | 302,200 | 10,598,154 |
| Lee's Pharmaceutical Holdings Ltd. | | 3,187,500 | 3,163,589 |
| Longfor Properties Co. Ltd. | | 3,621,500 | 6,276,115 |
| NetEase, Inc. ADR | | 32,100 | 8,519,019 |
| Silergy Corp. | | 257,000 | 4,642,888 |
| SITC International Holdings Co. Ltd. | | 5,435,000 | 3,891,950 |
| Tencent Holdings Ltd. | | 1,882,400 | 58,981,877 |
| Value Partners Group Ltd. | | 3,607,000 | 3,338,806 |
| Xingda International Holdings Ltd. | | 114,000 | 45,727 |
| Xinyi Glass Holdings Ltd. | | 1,748,000 | 1,550,612 |
|
| TOTAL CAYMAN ISLANDS | | | 164,979,214 |
|
| China - 13.9% | | | |
| BBMG Corp. (H Shares) | | 6,279,000 | 3,366,193 |
| Beijing Jingneng Clean Energy Co. Ltd. (H Shares) | | 6,062,000 | 1,839,249 |
| Beijing Urban Consolidated & Development Group Ltd. (H Shares) | | 4,328,000 | 2,637,413 |
| China Construction Bank Corp. (H Shares) | | 25,449,000 | 20,677,609 |
| China Pacific Insurance (Group) Co. Ltd. (H Shares) | | 2,107,000 | 7,787,802 |
| China Telecom Corp. Ltd. (H Shares) | | 11,750,000 | 5,740,292 |
| Gree Electric Appliances, Inc. of Zhuhai Class A | | 2,014,600 | 9,644,129 |
| Hangzhou Hikvision Digital Technology Co. Ltd. Class A | | 1,810,800 | 9,606,289 |
| Huaneng Renewables Corp. Ltd. (H Shares) | | 8,644,000 | 3,022,708 |
| Inner Mongoli Yili Industries Co. Ltd. (A Shares) | | 1,740,800 | 4,611,157 |
| Jiangsu Hengrui Medicine Co. Ltd. (A Shares) | | 1,557,251 | 12,115,090 |
| Jiangsu Yanghe Brewery Joint-Stock Co. Ltd. Class A | | 660,536 | 7,665,610 |
| Kweichow Moutai Co. Ltd. (A Shares) | | 197,575 | 11,850,774 |
| PICC Property & Casualty Co. Ltd. (H Shares) | | 3,075,120 | 4,949,700 |
| Shanghai International Airport Co. Ltd. (A Shares) | | 1,174,100 | 5,833,455 |
| Shenzhen Expressway Co. (H Shares) | | 3,940,000 | 3,591,327 |
| Weifu High-Technology Co. Ltd. (B Shares) | | 1,333,439 | 3,240,018 |
| Yunnan Baiyao Group Co. Ltd. | | 751,791 | 9,324,455 |
| Zhengzhou Yutong Bus Co. Ltd. | | 1,912,399 | 5,587,251 |
|
| TOTAL CHINA | | | 133,090,521 |
|
| Hong Kong - 8.8% | | | |
| AIA Group Ltd. | | 3,894,800 | 26,963,942 |
| China Resources Beer Holdings Co. Ltd. | | 2,412,666 | 5,806,515 |
| CNOOC Ltd. sponsored ADR (b) | | 46,700 | 5,424,205 |
| CSPC Pharmaceutical Group Ltd. | | 6,956,000 | 9,658,192 |
| Dah Sing Financial Holdings Ltd. | | 557,600 | 4,229,483 |
| Hysan Development Co. Ltd. | | 1,065,000 | 5,024,909 |
| Power Assets Holdings Ltd. | | 1,213,000 | 10,916,197 |
| Sino Land Ltd. | | 2,958,000 | 5,012,174 |
| Techtronic Industries Co. Ltd. | | 2,615,500 | 11,230,878 |
|
| TOTAL HONG KONG | | | 84,266,495 |
|
| India - 15.4% | | | |
| Adani Ports & Special Economic Zone Ltd. (a) | | 729,813 | 3,720,014 |
| Amara Raja Batteries Ltd. (a) | | 322,466 | 4,464,567 |
| Asian Paints Ltd. | | 457,783 | 7,978,270 |
| Axis Bank Ltd. | | 1,146,726 | 9,090,510 |
| Bajaj Corp. Ltd. | | 511,162 | 3,125,888 |
| Bharat Petroleum Corp. Ltd. | | 447,639 | 5,008,000 |
| Bharti Infratel Ltd. | | 984,765 | 5,433,133 |
| CCL Products (India) Ltd. (a) | | 310,552 | 1,651,302 |
| Gujarat Gas Ltd. (a) | | 389,109 | 5,112,162 |
| Havells India Ltd. (a) | | 891,782 | 6,712,293 |
| HCL Technologies Ltd. | | 321,191 | 4,067,220 |
| HDFC Bank Ltd. | | 475,065 | 11,597,228 |
| Housing Development Finance Corp. Ltd. | | 682,823 | 16,326,044 |
| Indian Oil Corp. Ltd. | | 508,321 | 3,479,338 |
| Indraprastha Gas Ltd. | | 402,064 | 6,614,763 |
| Petronet LNG Ltd. | | 1,155,068 | 7,613,316 |
| Power Grid Corp. of India Ltd. | | 1,356,066 | 4,387,334 |
| Redington India Ltd. | | 533,540 | 1,035,710 |
| Reliance Industries Ltd. | | 690,823 | 14,992,009 |
| Sterlite Optical Technologies Ltd. (a) | | 1,400,909 | 3,202,109 |
| Sun Pharmaceutical Industries Ltd. | | 955,617 | 9,542,049 |
| Torrent Pharmaceuticals Ltd. (a) | | 164,827 | 3,637,398 |
| UPL Ltd. (a) | | 296,415 | 3,716,829 |
| Vakrangee Ltd. (a) | | 566,046 | 3,012,485 |
| VST Industries Ltd. (a) | | 31,444 | 1,490,888 |
|
| TOTAL INDIA | | | 147,010,859 |
|
| Indonesia - 3.6% | | | |
| PT Bank Central Asia Tbk | | 9,294,500 | 12,377,326 |
| PT Bank Rakyat Indonesia Tbk | | 10,915,900 | 10,564,567 |
| PT Gudang Garam Tbk | | 1,257,000 | 6,261,895 |
| PT Indofood Sukses Makmur Tbk | | 7,887,900 | 4,956,198 |
|
| TOTAL INDONESIA | | | 34,159,986 |
|
| Israel - 0.5% | | | |
| Sarine Technologies Ltd. | | 3,165,100 | 4,349,563 |
| Japan - 0.9% | | | |
| KDDI Corp. | | 139,900 | 3,709,319 |
| Olympus Corp. | | 137,200 | 5,280,000 |
|
| TOTAL JAPAN | | | 8,989,319 |
|
| Korea (South) - 12.8% | | | |
| BGFretail Co. Ltd. | | 65,901 | 6,343,319 |
| Coway Co. Ltd. | | 48,530 | 4,287,329 |
| Hyundai Fire & Marine Insurance Co. Ltd. | | 138,187 | 4,458,037 |
| Hyundai Motor Co. | | 37,030 | 4,687,342 |
| KB Financial Group, Inc. | | 151,171 | 6,646,842 |
| KEPCO Plant Service & Engineering Co. Ltd. | | 93,493 | 4,717,386 |
| Korea Petro Chemical Industries Co. Ltd. (a) | | 9,528 | 1,980,812 |
| Korea Zinc Co. Ltd. | | 11,200 | 4,189,170 |
| LG Household & Health Care Ltd. | | 8,807 | 6,704,344 |
| Loen Entertainment, Inc. | | 80,026 | 6,183,444 |
| LS Industrial Systems Ltd. | | 70,383 | 3,142,982 |
| Medy-Tox, Inc. | | 11,371 | 4,999,802 |
| Osstem Implant Co. Ltd. (a) | | 99,210 | 4,604,684 |
| Samsung Electronics Co. Ltd. | | 30,188 | 59,203,084 |
|
| TOTAL KOREA (SOUTH) | | | 122,148,577 |
|
| Malaysia - 0.1% | | | |
| Bursa Malaysia Bhd | | 408,400 | 965,258 |
| Multi-National - 1.0% | | | |
| HKT Trust/HKT Ltd. unit | | 7,360,300 | 9,415,234 |
| Philippines - 1.0% | | | |
| Ayala Land, Inc. | | 5,931,600 | 4,175,059 |
| Robinsons Land Corp. | | 5,896,700 | 3,015,869 |
| Security Bank Corp. | | 467,698 | 1,988,240 |
|
| TOTAL PHILIPPINES | | | 9,179,168 |
|
| Singapore - 1.0% | | | |
| UOL Group Ltd. | | 1,075,700 | 5,574,253 |
| Wing Tai Holdings Ltd. | | 3,018,300 | 4,083,017 |
|
| TOTAL SINGAPORE | | | 9,657,270 |
|
| Taiwan - 13.5% | | | |
| Advanced Semiconductor Engineering, Inc. | | 4,986,013 | 6,238,160 |
| CTCI Corp. | | 2,238,000 | 3,909,817 |
| E.SUN Financial Holdings Co. Ltd. | | 10,114,343 | 6,107,493 |
| E.SUN Financial Holdings Co. Ltd. rights 5/2/17 (a) | | 605,794 | 65,143 |
| ECLAT Textile Co. Ltd. | | 311,000 | 3,400,903 |
| Fubon Financial Holding Co. Ltd. | | 4,389,000 | 6,868,931 |
| Hon Hai Precision Industry Co. Ltd. (Foxconn) | | 5,438,460 | 17,778,508 |
| Largan Precision Co. Ltd. | | 58,000 | 9,624,127 |
| Micro-Star International Co. Ltd. | | 2,058,000 | 4,119,677 |
| Nien Made Enterprise Co. Ltd. | | 676,000 | 6,833,140 |
| PChome Online, Inc. | | 312,963 | 2,671,623 |
| Taiwan Semiconductor Manufacturing Co. Ltd. | | 8,364,192 | 53,788,539 |
| Vanguard International Semiconductor Corp. | | 1,699,000 | 3,238,011 |
| Voltronic Power Technology Corp. | | 304,000 | 4,330,212 |
|
| TOTAL TAIWAN | | | 128,974,284 |
|
| Thailand - 2.4% | | | |
| Bangkok Bank PCL (For. Reg.) | | 878,900 | 4,750,124 |
| Delta Electronics PCL (For. Reg.) | | 454,500 | 1,208,497 |
| Kasikornbank PCL (For. Reg.) | | 1,669,200 | 8,924,913 |
| PTT Global Chemical PCL (For. Reg.) | | 1,577,200 | 3,418,786 |
| Thai Beverage PCL | | 7,650,300 | 5,064,973 |
|
| TOTAL THAILAND | | | 23,367,293 |
|
| United States of America - 0.6% | | | |
| China Biologic Products, Inc. (a) | | 50,800 | 5,994,400 |
| TOTAL COMMON STOCKS | | | |
| (Cost $762,990,196) | | | 929,112,688 |
|
| Money Market Funds - 2.9% | | | |
| Fidelity Cash Central Fund, 0.85% (c) | | 26,834,378 | 26,839,745 |
| Fidelity Securities Lending Cash Central Fund 0.86% (c)(d) | | 959,307 | 959,402 |
| TOTAL MONEY MARKET FUNDS | | | |
| (Cost $27,799,465) | | | 27,799,147 |
| TOTAL INVESTMENT PORTFOLIO - 100.1% | | | |
| (Cost $790,789,661) | | | 956,911,835 |
| NET OTHER ASSETS (LIABILITIES) - (0.1)% | | | (598,653) |
| NET ASSETS - 100% | | | $956,313,182 |
Categorizations in the Schedule of Investments are based on country or territory of incorporation.
Legend
(a) Non-income producing
(b) Security or a portion of the security is on loan at period end.
(c) Affiliated fund that is generally available only to investment companies and other accounts managed by Fidelity Investments. The rate quoted is the annualized seven-day yield of the fund at period end. A complete unaudited listing of the fund's holdings as of its most recent quarter end is available upon request. In addition, each Fidelity Central Fund's financial statements are available on the SEC's website or upon request.
(d) Investment made with cash collateral received from securities on loan.
Affiliated Central Funds
Information regarding fiscal year to date income earned by the Fund from investments in Fidelity Central Funds is as follows:
| Fund | Income earned |
| Fidelity Cash Central Fund | $59,254 |
| Fidelity Securities Lending Cash Central Fund | 3,772 |
| Total | $63,026 |
Investment Valuation
The following is a summary of the inputs used, as of April 30, 2017, involving the Fund's assets and liabilities carried at fair value. The inputs or methodology used for valuing securities may not be an indication of the risk associated with investing in those securities. For more information on valuation inputs, and their aggregation into the levels used below, please refer to the Investment Valuation section in the accompanying Notes to Financial Statements.
| | Valuation Inputs at Reporting Date: |
| Description | Total | Level 1 | Level 2 | Level 3 |
| Investments in Securities: | | | | |
| Equities: | | | | |
| Consumer Discretionary | $85,573,708 | $85,573,708 | $-- | $-- |
| Consumer Staples | 65,532,863 | 65,532,863 | -- | -- |
| Energy | 38,996,338 | 38,996,338 | -- | -- |
| Financials | 168,677,998 | 150,368,785 | 18,309,213 | -- |
| Health Care | 68,319,659 | 68,319,659 | -- | -- |
| Industrials | 66,716,739 | 66,716,739 | -- | -- |
| Information Technology | 298,448,095 | 179,439,519 | 119,008,576 | -- |
| Materials | 24,650,060 | 24,650,060 | -- | -- |
| Real Estate | 44,023,312 | 44,023,312 | -- | -- |
| Telecommunication Services | 26,845,369 | 23,136,050 | 3,709,319 | -- |
| Utilities | 41,328,547 | 41,328,547 | -- | -- |
| Money Market Funds | 27,799,147 | 27,799,147 | -- | -- |
| Total Investments in Securities: | $956,911,835 | $815,884,727 | $141,027,108 | $-- |
See accompanying notes which are an integral part of the financial statements.
Fidelity® Emerging Asia Fund
Financial Statements
Statement of Assets and Liabilities
| | | April 30, 2017 (Unaudited) |
| Assets | | |
Investment in securities, at value (including securities loaned of $952,430) — See accompanying schedule:
Unaffiliated issuers (cost $762,990,196) | $929,112,688 | |
| Fidelity Central Funds (cost $27,799,465) | 27,799,147 | |
| Total Investments (cost $790,789,661) | | $956,911,835 |
| Foreign currency held at value (cost $419,054) | | 419,051 |
| Receivable for investments sold | | 1,747,714 |
| Receivable for fund shares sold | | 1,192,757 |
| Dividends receivable | | 717,767 |
| Distributions receivable from Fidelity Central Funds | | 18,608 |
| Prepaid expenses | | 586 |
| Other receivables | | 552,995 |
| Total assets | | 961,561,313 |
| Liabilities | | |
| Payable for investments purchased | $1,207,192 | |
| Payable for fund shares redeemed | 827,505 | |
| Accrued management fee | 662,827 | |
| Other affiliated payables | 182,384 | |
| Other payables and accrued expenses | 1,408,823 | |
| Collateral on securities loaned | 959,400 | |
| Total liabilities | | 5,248,131 |
| Net Assets | | $956,313,182 |
| Net Assets consist of: | | |
| Paid in capital | | $945,479,226 |
| Undistributed net investment income | | 642,003 |
| Accumulated undistributed net realized gain (loss) on investments and foreign currency transactions | | (154,450,041) |
| Net unrealized appreciation (depreciation) on investments and assets and liabilities in foreign currencies | | 164,641,994 |
| Net Assets, for 26,113,015 shares outstanding | | $956,313,182 |
| Net Asset Value, offering price and redemption price per share ($956,313,182 ÷ 26,113,015 shares) | | $36.62 |
See accompanying notes which are an integral part of the financial statements.
Statement of Operations
| | | Six months ended April 30, 2017 (Unaudited) |
| Investment Income | | |
| Dividends | | $6,156,108 |
| Interest | | 109 |
| Income from Fidelity Central Funds | | 63,026 |
| Income before foreign taxes withheld | | 6,219,243 |
| Less foreign taxes withheld | | (529,088) |
| Total income | | 5,690,155 |
| Expenses | | |
| Management fee | | |
| Basic fee | $3,094,759 | |
| Performance adjustment | 446,418 | |
| Transfer agent fees | 865,902 | |
| Accounting and security lending fees | 210,294 | |
| Custodian fees and expenses | 256,785 | |
| Independent trustees' fees and expenses | 1,829 | |
| Registration fees | 20,450 | |
| Audit | 47,968 | |
| Legal | 1,417 | |
| Miscellaneous | 3,533 | |
| Total expenses before reductions | 4,949,355 | |
| Expense reductions | (271,423) | 4,677,932 |
| Net investment income (loss) | | 1,012,223 |
| Realized and Unrealized Gain (Loss) | | |
| Net realized gain (loss) on: | | |
| Investment securities: | | |
| Unaffiliated issuers | (5,457,653) | |
| Fidelity Central Funds | (2,176) | |
| Foreign currency transactions | 67,975 | |
| Total net realized gain (loss) | | (5,391,854) |
Change in net unrealized appreciation (depreciation) on:
Investment securities (net of increase in deferred foreign taxes of $924,615) | 97,821,769 | |
| Assets and liabilities in foreign currencies | 18,105 | |
| Total change in net unrealized appreciation (depreciation) | | 97,839,874 |
| Net gain (loss) | | 92,448,020 |
| Net increase (decrease) in net assets resulting from operations | | $93,460,243 |
See accompanying notes which are an integral part of the financial statements.
Statement of Changes in Net Assets
| | Six months ended April 30, 2017 (Unaudited) | Year ended October 31, 2016 |
| Increase (Decrease) in Net Assets | | |
| Operations | | |
| Net investment income (loss) | $1,012,223 | $11,443,160 |
| Net realized gain (loss) | (5,391,854) | (42,125,134) |
| Change in net unrealized appreciation (depreciation) | 97,839,874 | 88,111,910 |
| Net increase (decrease) in net assets resulting from operations | 93,460,243 | 57,429,936 |
| Distributions to shareholders from net investment income | (9,244,715) | (4,222,099) |
| Distributions to shareholders from net realized gain | (1,418,067) | – |
| Total distributions | (10,662,782) | (4,222,099) |
| Share transactions | | |
| Proceeds from sales of shares | 38,955,638 | 45,716,202 |
| Reinvestment of distributions | 9,644,724 | 3,878,736 |
| Cost of shares redeemed | (97,377,467) | (188,738,895) |
| Net increase (decrease) in net assets resulting from share transactions | (48,777,105) | (139,143,957) |
| Redemption fees | 27,463 | 23,028 |
| Total increase (decrease) in net assets | 34,047,819 | (85,913,092) |
| Net Assets | | |
| Beginning of period | 922,265,363 | 1,008,178,455 |
| End of period | $956,313,182 | $922,265,363 |
| Other Information | | |
| Undistributed net investment income end of period | $642,003 | $8,874,495 |
| Shares | | |
| Sold | 1,155,412 | 1,462,017 |
| Issued in reinvestment of distributions | 301,021 | 126,673 |
| Redeemed | (2,977,732) | (6,266,447) |
| Net increase (decrease) | (1,521,299) | (4,677,757) |
See accompanying notes which are an integral part of the financial statements.
Financial Highlights — Fidelity Emerging Asia Fund
| | Six months ended (Unaudited) April 30, | Years ended October 31, | | | | |
| | 2017 | 2016 | 2015 | 2014 | 2013 | 2012 |
| Selected Per–Share Data | | | | | | |
| Net asset value, beginning of period | $33.37 | $31.20 | $33.03 | $30.91 | $28.57 | $27.32 |
| Income from Investment Operations | | | | | | |
| Net investment income (loss)A | .04 | .39 | .42 | .43 | .39 | .46 |
| Net realized and unrealized gain (loss) | 3.60 | 1.91 | (1.96) | 2.08 | 2.49 | 1.30 |
| Total from investment operations | 3.64 | 2.30 | (1.54) | 2.51 | 2.88 | 1.76 |
| Distributions from net investment income | (.34) | (.13) | (.29) | (.39) | (.46) | (.51) |
| Distributions from net realized gain | (.05) | – | – | – | (.08) | – |
| Total distributions | (.39) | (.13) | (.29) | (.39) | (.54) | (.51) |
| Redemption fees added to paid in capitalA,B | – | – | – | – | – | – |
| Net asset value, end of period | $36.62 | $33.37 | $31.20 | $33.03 | $30.91 | $28.57 |
| Total ReturnC,D | 11.08% | 7.42% | (4.69)% | 8.21% | 10.19% | 6.60% |
| Ratios to Average Net AssetsE,F | | | | | | |
| Expenses before reductions | 1.11%G | 1.16% | 1.09% | 1.04% | 1.08% | .94% |
| Expenses net of fee waivers, if any | 1.11%G | 1.16% | 1.09% | 1.04% | 1.08% | .94% |
| Expenses net of all reductions | 1.05%G | 1.16% | 1.09% | 1.04% | 1.05% | .91% |
| Net investment income (loss) | .23%G | 1.25% | 1.26% | 1.36% | 1.31% | 1.68% |
| Supplemental Data | | | | | | |
| Net assets, end of period (000 omitted) | $956,313 | $922,265 | $1,008,178 | $1,111,277 | $1,172,348 | $1,325,208 |
| Portfolio turnover rateH | 37%G | 77% | 68% | 90% | 97% | 94% |
A Calculated based on average shares outstanding during the period.
B Amount represents less than $.005 per share.
C Total returns for periods of less than one year are not annualized.
D Total returns would have been lower if certain expenses had not been reduced during the applicable periods shown.
E Fees and expenses of any underlying Fidelity Central Funds are not included in the Fund's expense ratio. The Fund indirectly bears its proportionate share of the expenses of any underlying Fidelity Central Funds.
F Expense ratios reflect operating expenses of the Fund. Expenses before reductions do not reflect amounts reimbursed by the investment adviser or reductions from brokerage service arrangements or reductions from other expense offset arrangements and do not represent the amount paid by the Fund during periods when reimbursements or reductions occur. Expenses net of fee waivers reflect expenses after reimbursement by the investment adviser but prior to reductions from brokerage service arrangements or other expense offset arrangements. Expenses net of all reductions represent the net expenses paid by the Fund.
G Annualized
H Amount does not include the portfolio activity of any underlying Fidelity Central Funds.
See accompanying notes which are an integral part of the financial statements.
Notes to Financial Statements (Unaudited)
For the period ended April 30, 2017
1. Organization.
Fidelity Emerging Asia Fund (the Fund) is a fund of Fidelity Investment Trust (the Trust) and is authorized to issue an unlimited number of shares. Share transactions on the Statement of Changes in Net Assets may contain exchanges between affiliated funds. The Trust is registered under the Investment Company Act of 1940, as amended (the 1940 Act), as an open-end management investment company organized as a Massachusetts business trust. The Fund's investments in emerging markets can be subject to social, economic, regulatory, and political uncertainties and can be extremely volatile.
2. Investments in Fidelity Central Funds.
The Fund invests in Fidelity Central Funds, which are open-end investment companies generally available only to other investment companies and accounts managed by the investment adviser and its affiliates. The Fund's Schedule of Investments lists each of the Fidelity Central Funds held as of period end, if any, as an investment of the Fund, but does not include the underlying holdings of each Fidelity Central Fund. As an Investing Fund, the Fund indirectly bears its proportionate share of the expenses of the underlying Fidelity Central Funds.
The Money Market Central Funds seek preservation of capital and current income and are managed by Fidelity Investments Money Management, Inc. (FIMM), an affiliate of the investment adviser. Annualized expenses of the Money Market Central Funds as of their most recent shareholder report date are less than .005%.
A complete unaudited list of holdings for each Fidelity Central Fund is available upon request or at the Securities and Exchange Commission (the SEC) website at www.sec.gov. In addition, the financial statements of the Fidelity Central Funds are available on the SEC website or upon request.
3. Significant Accounting Policies.
The Fund is an investment company and applies the accounting and reporting guidance of the Financial Accounting Standards Board (FASB) Accounting Standards Codification Topic 946 Financial Services – Investments Companies. The financial statements have been prepared in conformity with accounting principles generally accepted in the United States of America (GAAP), which require management to make certain estimates and assumptions at the date of the financial statements. Actual results could differ from those estimates. Subsequent events, if any, through the date that the financial statements were issued have been evaluated in the preparation of the financial statements. The following summarizes the significant accounting policies of the Fund:
Investment Valuation. Investments are valued as of 4:00 p.m. Eastern time on the last calendar day of the period. The Board of Trustees (the Board) has delegated the day to day responsibility for the valuation of the Fund's investments to the Fair Value Committee (the Committee) established by the Fund's investment adviser. In accordance with valuation policies and procedures approved by the Board, the Fund attempts to obtain prices from one or more third party pricing vendors or brokers to value its investments. When current market prices, quotations or currency exchange rates are not readily available or reliable, investments will be fair valued in good faith by the Committee, in accordance with procedures adopted by the Board. Factors used in determining fair value vary by investment type and may include market or investment specific events, changes in interest rates and credit quality. The frequency with which these procedures are used cannot be predicted and they may be utilized to a significant extent. The Committee oversees the Fund's valuation policies and procedures and reports to the Board on the Committee's activities and fair value determinations. The Board monitors the appropriateness of the procedures used in valuing the Fund's investments and ratifies the fair value determinations of the Committee.
The Fund categorizes the inputs to valuation techniques used to value its investments into a disclosure hierarchy consisting of three levels as shown below:
- Level 1 – quoted prices in active markets for identical investments
- Level 2 – other significant observable inputs (including quoted prices for similar investments, interest rates, prepayment speeds, etc.)
- Level 3 – unobservable inputs (including the Fund's own assumptions based on the best information available)
Valuation techniques used to value the Fund's investments by major category are as follows:
Equity securities, including restricted securities, for which market quotations are readily available, are valued at the last reported sale price or official closing price as reported by a third party pricing vendor on the primary market or exchange on which they are traded and are categorized as Level 1 in the hierarchy. In the event there were no sales during the day or closing prices are not available, securities are valued at the last quoted bid price or may be valued using the last available price and are generally categorized as Level 2 in the hierarchy. For foreign equity securities, when market or security specific events arise, comparisons to the valuation of American Depositary Receipts (ADRs), futures contracts, Exchange-Traded Funds (ETFs) and certain indexes as well as quoted prices for similar securities may be used and would be categorized as Level 2 in the hierarchy. Utilizing these techniques may result in transfers between Level 1 and Level 2. For equity securities, including restricted securities, where observable inputs are limited, assumptions about market activity and risk are used and these securities may be categorized as Level 3 in the hierarchy.
Investments in open-end mutual funds, including the Fidelity Central Funds, are valued at their closing net asset value (NAV) each business day and are categorized as Level 1 in the hierarchy.
Changes in valuation techniques may result in transfers in or out of an assigned level within the disclosure hierarchy. The aggregate value of investments by input level as of April 30, 2017, including information on transfers between Levels 1 and 2, is included at the end of the Fund's Schedule of Investments.
Foreign Currency. The Fund may use foreign currency contracts to facilitate transactions in foreign-denominated securities. Gains and losses from these transactions may arise from changes in the value of the foreign currency or if the counterparties do not perform under the contracts' terms.
Foreign-denominated assets, including investment securities, and liabilities are translated into U.S. dollars at the exchange rates at period end. Purchases and sales of investment securities, income and dividends received and expenses denominated in foreign currencies are translated into U.S. dollars at the exchange rate in effect on the transaction date.
The effects of exchange rate fluctuations on investments are included with the net realized and unrealized gain (loss) on investment securities. Other foreign currency transactions resulting in realized and unrealized gain (loss) are disclosed separately.
Investment Transactions and Income. For financial reporting purposes, the Fund's investment holdings and NAV include trades executed through the end of the last business day of the period. The NAV per share for processing shareholder transactions is calculated as of the close of business of the New York Stock Exchange (NYSE), normally 4:00 p.m. Eastern time and includes trades executed through the end of the prior business day. Gains and losses on securities sold are determined on the basis of identified cost. Dividend income is recorded on the ex-dividend date, except for certain dividends from foreign securities where the ex-dividend date may have passed, which are recorded as soon as the Fund is informed of the ex-dividend date. Non-cash dividends included in dividend income, if any, are recorded at the fair market value of the securities received. Income and capital gain distributions from Fidelity Central Funds, if any, are recorded on the ex-dividend date. Certain distributions received by the Fund represent a return of capital or capital gain. The Fund determines the components of these distributions subsequent to the ex-dividend date, based upon receipt of tax filings or other correspondence relating to the underlying investment. These distributions are recorded as a reduction of cost of investments and/or as a realized gain. Interest income is accrued as earned and includes coupon interest and amortization of premium and accretion of discount on debt securities as applicable. Investment income is recorded net of foreign taxes withheld where recovery of such taxes is uncertain.
Expenses. Expenses directly attributable to a fund are charged to that fund. Expenses attributable to more than one fund are allocated among the respective funds on the basis of relative net assets or other appropriate methods. Expense estimates are accrued in the period to which they relate and adjustments are made when actual amounts are known.
Income Tax Information and Distributions to Shareholders. Each year, the Fund intends to qualify as a regulated investment company under Subchapter M of the Internal Revenue Code, including distributing substantially all of its taxable income and realized gains. As a result, no provision for U.S. Federal income taxes is required. The Fund files a U.S. federal tax return, in addition to state and local tax returns as required. The Fund's federal income tax returns are subject to examination by the Internal Revenue Service (IRS) for a period of three fiscal years after they are filed. State and local tax returns may be subject to examination for an additional fiscal year depending on the jurisdiction. Foreign taxes are provided for based on the Fund's understanding of the tax rules and rates that exist in the foreign markets in which it invests. The Fund is subject to a tax imposed on capital gains by certain countries in which it invests. An estimated deferred tax liability for net unrealized appreciation on the applicable securities is included in Other payables and accrued expenses on the Statement of Assets & Liabilities.
Distributions are declared and recorded on the ex-dividend date. Income and capital gain distributions are determined in accordance with income tax regulations, which may differ from GAAP.
Capital accounts within the financial statements are adjusted for permanent book-tax differences. These adjustments have no impact on net assets or the results of operations. Capital accounts are not adjusted for temporary book-tax differences which will reverse in a subsequent period.
Book-tax differences are primarily due to foreign currency transactions, passive foreign investment companies (PFIC), deferred trustees compensation, capital loss carryforwards and losses deferred due to wash sales.
The federal tax cost of investment securities and unrealized appreciation (depreciation) as of period end were as follows:
| Gross unrealized appreciation | $192,020,945 |
| Gross unrealized depreciation | (26,074,941) |
| Net unrealized appreciation (depreciation) on securities | $165,946,004 |
| Tax cost | $790,965,831 |
Capital loss carryforwards are only available to offset future capital gains of the Fund to the extent provided by regulations and may be limited. Under the Regulated Investment Company Modernization Act of 2010 (the Act), the Fund is permitted to carry forward capital losses incurred in taxable years beginning after December 22, 2010 for an unlimited period and such capital losses are required to be used prior to any losses that expire. The capital loss carryforward information presented below, including any applicable limitation, is estimated as of prior fiscal period end and is subject to adjustment.
| Fiscal year of expiration | |
| 2017 | $(104,856,402) |
| No expiration | |
| Short-term | (16,191,445) |
| Long-term | (27,676,954) |
| Total no expiration | (43,868,399) |
| Total capital loss carryforward | $(148,724,801) |
Short-Term Trading (Redemption) Fees. Shares held by investors in the Fund less than 90 days may have been subject to a redemption fee equal to 1.50% of the NAV of shares redeemed. All redemption fees, which reduce the proceeds of the shareholder redemption, are retained by the Fund and accounted for as an addition to paid in capital.
4. Purchases and Sales of Investments.
Purchases and sales of securities, other than short-term securities, aggregated $161,063,454 and $199,521,905, respectively.
5. Fees and Other Transactions with Affiliates.
Management Fee. Fidelity Management & Research Company (the investment adviser) and its affiliates provide the Fund with investment management related services for which the Fund pays a monthly management fee. The management fee is the sum of an individual fund fee rate that is based on an annual rate of .45% of the Fund's average net assets and an annualized group fee rate that averaged .25% during the period. The group fee rate is based upon the average net assets of all the mutual funds advised by the investment adviser, including any mutual funds previously advised by the investment adviser that are currently advised by Fidelity SelectCo, LLC, an affiliate of the investment adviser. The group fee rate decreases as assets under management increase and increases as assets under management decrease. In addition, the management fee is subject to a performance adjustment (up to a maximum of +/- .20% of the Fund's average net assets over a 36 month performance period). The upward or downward adjustment to the management fee is based on the Fund's relative investment performance as compared to its benchmark index, the MSCI All Country Asia ex Japan Index, over the same 36 month performance period. For the reporting period, the total annualized management fee rate, including the performance adjustment, was .80% of the Fund's average net assets. The performance adjustment included in the management fee rate may be higher or lower than the maximum performance adjustment rate due to the difference between the average net assets for the reporting and performance periods.
Transfer Agent Fees. Fidelity Investments Institutional Operations Company, Inc. (FIIOC), an affiliate of the investment adviser, is the Fund's transfer, dividend disbursing and shareholder servicing agent. FIIOC receives account fees and asset-based fees that vary according to account size and type of account. FIIOC pays for typesetting, printing and mailing of shareholder reports, except proxy statements. For the period, the transfer agent fees were equivalent to an annualized rate of .19% of average net assets.
Accounting and Security Lending Fees. Fidelity Service Company, Inc. (FSC), an affiliate of the investment adviser, maintains the Fund's accounting records. The accounting fee is based on the level of average net assets for each month. Under a separate contract, FSC administers the security lending program. The security lending fee is based on the number and duration of lending transactions.
Brokerage Commissions. The Fund placed a portion of its portfolio transactions with brokerage firms which are affiliates of the investment adviser. Brokerage commissions are included in net realized gain (loss) and change in net unrealized appreciation (depreciation) in the Statement of Operations. The commissions paid to these affiliated firms were $271 for the period.
Interfund Trades. The Fund may purchase from or sell securities to other Fidelity Funds under procedures adopted by the Board. The procedures have been designed to ensure these interfund trades are executed in accordance with Rule 17a-7 of the 1940 Act. Interfund trades are included within the respective purchases and sales amounts shown in the Purchases and Sales of Investments note.
6. Committed Line of Credit.
The Fund participates with other funds managed by the investment adviser or an affiliate in a $4.25 billion credit facility (the "line of credit") to be utilized for temporary or emergency purposes to fund shareholder redemptions or for other short-term liquidity purposes. The Fund has agreed to pay commitment fees on its pro-rata portion of the line of credit, which amounted to $1,505 and is reflected in Miscellaneous expenses on the Statement of Operations. During the period, the Fund did not borrow on this line of credit.
7. Security Lending.
The Fund lends portfolio securities through a lending agent from time to time in order to earn additional income. For equity securities, a lending agent is used and may loan securities to certain qualified borrowers, including Fidelity Capital Markets (FCM), a broker-dealer affiliated with the Fund. On the settlement date of the loan, the Fund receives collateral (in the form of U.S. Treasury obligations, letters of credit and/or cash) against the loaned securities and maintains collateral in an amount not less than 100% of the market value of the loaned securities during the period of the loan. The market value of the loaned securities is determined at the close of business of the Fund and any additional required collateral is delivered to the Fund on the next business day. The Fund or borrower may terminate the loan at any time, and if the borrower defaults on its obligation to return the securities loaned because of insolvency or other reasons, the Fund may apply collateral received from the borrower against the obligation. The Fund may experience delays and costs in recovering the securities loaned. Any cash collateral received is invested in the Fidelity Securities Lending Cash Central Fund. The value of loaned securities and cash collateral at period end are disclosed on the Fund's Statement of Assets and Liabilities. Security lending income represents the income earned on investing cash collateral, less rebates paid to borrowers and any lending agent fees associated with the loan, plus any premium payments received for lending certain types of securities. Security lending income is presented in the Statement of Operations as a component of income from Fidelity Central Funds. Total security lending income during the period amounted to $3,772. During the period, there were no securities loaned to FCM.
8. Expense Reductions.
Commissions paid to certain brokers with whom the investment adviser, or its affiliates, places trades on behalf of the Fund include an amount in addition to trade execution, which may be rebated back to the Fund to offset certain expenses. This amount totaled $267,380 for the period. In addition, through arrangements with the Fund's custodian, credits realized as a result of certain uninvested cash balances were used to reduce the Fund's expenses. During the period, these credits reduced the Fund's custody expenses by $182.
In addition, during the period the investment adviser reimbursed and/or waived a portion of operating expenses in the amount of $3,861.
9. Other.
The Fund's organizational documents provide former and current trustees and officers with a limited indemnification against liabilities arising in connection with the performance of their duties to the Fund. In the normal course of business, the Fund may also enter into contracts that provide general indemnifications. The Fund's maximum exposure under these arrangements is unknown as this would be dependent on future claims that may be made against the Fund. The risk of material loss from such claims is considered remote.
Fidelity® Emerging Markets Fund
Investment Summary (Unaudited)
Geographic Diversification (% of fund's net assets)
| As of April 30, 2017 |
| | India | 11.6% |
| | Cayman Islands | 10.9% |
| | United States of America* | 9.7% |
| | Brazil | 9.7% |
| | Korea (South) | 8.1% |
| | South Africa | 6.9% |
| | Mexico | 6.4% |
| | Taiwan | 5.4% |
| | China | 5.3% |
| | Other | 26.0% |

* Includes Short-Term investments and Net Other Assets (Liabilities).
Percentages are based on country or territory of incorporation and are adjusted for the effect of futures contracts, if applicable.
| As of October 31, 2016 |
| | Cayman Islands | 13.4% |
| | India | 11.5% |
| | United States of America* | 10.6% |
| | Brazil | 8.9% |
| | Korea (South) | 7.8% |
| | South Africa | 7.5% |
| | Mexico | 7.3% |
| | Taiwan | 6.0% |
| | Indonesia | 3.6% |
| | Other | 23.4% |

* Includes Short-Term investments and Net Other Assets (Liabilities).
Percentages are based on country or territory of incorporation and are adjusted for the effect of futures contracts, if applicable.
Asset Allocation as of April 30, 2017
| | % of fund's net assets | % of fund's net assets 6 months ago |
| Stocks | 98.0 | 99.2 |
| Short-Term Investments and Net Other Assets (Liabilities) | 2.0 | 0.8 |
Top Ten Stocks as of April 30, 2017
| | % of fund's net assets | % of fund's net assets 6 months ago |
| Samsung Electronics Co. Ltd. (Korea (South), Technology Hardware, Storage & Peripherals) | 5.4 | 3.4 |
| Tencent Holdings Ltd. (Cayman Islands, Internet Software & Services) | 4.5 | 4.2 |
| Taiwan Semiconductor Manufacturing Co. Ltd. (Taiwan, Semiconductors & Semiconductor Equipment) | 4.0 | 4.2 |
| Alibaba Group Holding Ltd. sponsored ADR (Cayman Islands, Internet Software & Services) | 3.4 | 3.2 |
| Naspers Ltd. Class N (South Africa, Media) | 2.3 | 2.4 |
| Itau Unibanco Holding SA (Brazil, Banks) | 1.4 | 1.5 |
| Housing Development Finance Corp. Ltd. (India, Thrifts & Mortgage Finance) | 1.4 | 1.3 |
| Sberbank of Russia (Russia, Banks) | 1.2 | 1.0 |
| Reliance Industries Ltd. (India, Oil, Gas & Consumable Fuels) | 1.1 | 0.0 |
| Ambev SA sponsored ADR (Brazil, Beverages) | 1.0 | 1.2 |
| | 25.7 | |
Top Market Sectors as of April 30, 2017
| | % of fund's net assets | % of fund's net assets 6 months ago |
| Information Technology | 27.5 | 26.2 |
| Financials | 16.3 | 16.8 |
| Consumer Discretionary | 12.8 | 13.5 |
| Consumer Staples | 12.1 | 16.0 |
| Materials | 9.6 | 4.6 |
| Industrials | 7.5 | 8.2 |
| Health Care | 5.8 | 7.6 |
| Energy | 2.4 | 1.4 |
| Utilities | 1.6 | 2.7 |
| Telecommunication Services | 1.2 | 0.5 |
Percentages shown as 0.0% may reflect amounts less than 0.05%.
Fidelity® Emerging Markets Fund
Investments April 30, 2017 (Unaudited)
Showing Percentage of Net Assets
| Common Stocks - 94.2% | | | |
| | | Shares | Value |
| Australia - 0.5% | | | |
| Amcor Ltd. | | 1,683,018 | $19,798,431 |
| Belgium - 0.5% | | | |
| Anheuser-Busch InBev SA NV | | 180,800 | 20,388,883 |
| Bermuda - 0.7% | | | |
| Credicorp Ltd. (United States) | | 188,532 | 28,969,827 |
| Brazil - 6.5% | | | |
| BB Seguridade Participacoes SA | | 2,758,820 | 25,979,783 |
| Cielo SA | | 3,476,744 | 26,398,302 |
| Drogasil SA (a) | | 1,198,400 | 25,466,543 |
| Equatorial Energia SA | | 1,209,300 | 21,903,454 |
| Kroton Educacional SA | | 5,528,160 | 26,038,025 |
| Qualicorp SA | | 3,265,400 | 23,250,434 |
| Smiles SA | | 984,800 | 21,420,769 |
| Ultrapar Participacoes SA | | 1,152,100 | 25,560,682 |
| Vale SA sponsored ADR | | 4,590,900 | 39,389,922 |
| Weg SA (a) | | 4,196,290 | 23,400,492 |
|
| TOTAL BRAZIL | | | 258,808,406 |
|
| Cayman Islands - 10.9% | | | |
| Alibaba Group Holding Ltd. sponsored ADR (a) | | 1,167,400 | 134,834,700 |
| Ctrip.com International Ltd. ADR (a) | | 699,100 | 35,311,541 |
| NetEase, Inc. ADR | | 141,600 | 37,579,224 |
| New Oriental Education & Technology Group, Inc. sponsored ADR (a) | | 427,400 | 27,584,396 |
| Shenzhou International Group Holdings Ltd. | | 3,407,000 | 22,426,144 |
| Tencent Holdings Ltd. | | 5,716,800 | 179,126,432 |
|
| TOTAL CAYMAN ISLANDS | | | 436,862,437 |
|
| Chile - 0.6% | | | |
| Sociedad Quimica y Minera de Chile SA (PN-B) sponsored ADR | | 645,500 | 22,947,525 |
| China - 5.3% | | | |
| Gree Electric Appliances, Inc. of Zhuhai Class A | | 4,815,167 | 23,050,774 |
| Hangzhou Hikvision Digital Technology Co. Ltd. Class A | | 4,459,800 | 23,659,228 |
| Inner Mongoli Yili Industries Co. Ltd. (A Shares) | | 6,940,808 | 18,385,313 |
| Jiangsu Hengrui Medicine Co. Ltd. (A Shares) | | 2,678,268 | 20,836,369 |
| Kweichow Moutai Co. Ltd. (A Shares) | | 353,998 | 21,233,204 |
| Midea Group Co. Ltd. Class A | | 4,120,700 | 20,120,804 |
| Shanghai International Airport Co. Ltd. (A Shares) | | 4,524,900 | 22,481,733 |
| Sinopharm Group Co. Ltd. (H Shares) | | 5,007,600 | 22,468,164 |
| Wuliangye Yibin Co. Ltd. Class A | | 3,265,100 | 21,551,034 |
| Yunnan Baiyao Group Co. Ltd. | | 1,572,897 | 19,508,623 |
|
| TOTAL CHINA | | | 213,295,246 |
|
| France - 1.0% | | | |
| Dassault Systemes SA | | 226,762 | 20,237,681 |
| LVMH Moet Hennessy - Louis Vuitton SA | | 82,339 | 20,326,939 |
|
| TOTAL FRANCE | | | 40,564,620 |
|
| Germany - 0.5% | | | |
| Symrise AG | | 296,000 | 20,722,756 |
| Greece - 0.5% | | | |
| Titan Cement Co. SA (Reg.) | | 814,400 | 21,282,151 |
| Hong Kong - 2.3% | | | |
| AIA Group Ltd. | | 3,148,200 | 21,795,184 |
| CSPC Pharmaceutical Group Ltd. | | 17,990,000 | 24,978,562 |
| Guangdong Investment Ltd. | | 16,109,000 | 24,934,898 |
| Techtronic Industries Co. Ltd. | | 4,695,000 | 20,160,188 |
|
| TOTAL HONG KONG | | | 91,868,832 |
|
| India - 11.0% | | | |
| Adani Ports & Special Economic Zone Ltd. (a) | | 4,577,285 | 23,331,409 |
| Amara Raja Batteries Ltd. (a) | | 1,493,643 | 20,679,602 |
| Asian Paints Ltd. | | 1,414,085 | 24,644,759 |
| Eicher Motors Ltd. | | 58,476 | 23,710,567 |
| Godrej Consumer Products Ltd. | | 922,442 | 25,005,941 |
| HDFC Bank Ltd. | | 1,067,970 | 26,071,151 |
| Hero Motocorp Ltd. | | 406,199 | 20,967,678 |
| Hindustan Zinc Ltd. | | 4,532,075 | 18,888,933 |
| Housing Development Finance Corp. Ltd. | | 2,258,779 | 54,006,566 |
| IndusInd Bank Ltd. (a) | | 1,048,802 | 23,572,351 |
| ITC Ltd. | | 7,640,825 | 33,040,121 |
| LIC Housing Finance Ltd. | | 2,595,838 | 27,008,182 |
| Maruti Suzuki India Ltd. | | 292,978 | 29,734,601 |
| Power Grid Corp. of India Ltd. | | 6,452,598 | 20,876,348 |
| Reliance Industries Ltd. | | 2,043,154 | 44,339,842 |
| Zee Entertainment Enterprises Ltd. | | 2,972,445 | 24,358,884 |
|
| TOTAL INDIA | | | 440,236,935 |
|
| Indonesia - 2.5% | | | |
| PT Bank Central Asia Tbk | | 26,084,900 | 34,736,813 |
| PT Bank Rakyat Indonesia Tbk | | 30,827,200 | 29,835,012 |
| PT Surya Citra Media Tbk | | 16,365,600 | 3,511,562 |
| PT Telkomunikasi Indonesia Tbk Series B | | 90,143,200 | 29,737,029 |
|
| TOTAL INDONESIA | | | 97,820,416 |
|
| Ireland - 0.5% | | | |
| Accenture PLC Class A | | 166,400 | 20,184,320 |
| Israel - 1.2% | | | |
| Check Point Software Technologies Ltd. (a) | | 186,200 | 19,366,662 |
| Elbit Systems Ltd. (Israel) | | 37,177 | 4,762,846 |
| Frutarom Industries Ltd. | | 374,100 | 21,990,692 |
|
| TOTAL ISRAEL | | | 46,120,200 |
|
| Kenya - 0.5% | | | |
| Safaricom Ltd. | | 107,079,700 | 19,973,684 |
| Korea (South) - 8.1% | | | |
| BGFretail Co. Ltd. | | 207,950 | 20,016,284 |
| Coway Co. Ltd. | | 283,638 | 25,057,682 |
| LG Household & Health Care Ltd. | | 36,948 | 28,126,730 |
| NAVER Corp. | | 51,873 | 36,478,903 |
| Samsung Electronics Co. Ltd. | | 108,834 | 213,439,391 |
|
| TOTAL KOREA (SOUTH) | | | 323,118,990 |
|
| Luxembourg - 0.6% | | | |
| Eurofins Scientific SA | | 43,560 | 21,452,103 |
| Mexico - 6.4% | | | |
| CEMEX S.A.B. de CV sponsored ADR | | 3,425,500 | 31,583,110 |
| Embotelladoras Arca S.A.B. de CV | | 3,439,700 | 25,373,960 |
| Fomento Economico Mexicano S.A.B. de CV unit | | 3,791,767 | 34,122,429 |
| Gruma S.A.B. de CV Series B | | 1,677,810 | 22,404,371 |
| Grupo Aeroportuario del Pacifico S.A.B. de CV Series B | | 2,360,857 | 24,279,195 |
| Grupo Aeroportuario del Sureste S.A.B. de CV Series B | | 1,333,505 | 25,304,028 |
| Grupo Aeroportuario Norte S.A.B. de CV | | 3,617,200 | 20,073,512 |
| Grupo Cementos de Chihuahua S.A.B. de CV | | 4,216,400 | 19,998,797 |
| Grupo Mexico SA de CV Series B | | 9,943,800 | 29,247,325 |
| Promotora y Operadora de Infraestructura S.A.B. de CV | | 2,203,045 | 23,505,856 |
|
| TOTAL MEXICO | | | 255,892,583 |
|
| Netherlands - 1.1% | | | |
| ASML Holding NV (Netherlands) | | 144,500 | 19,100,957 |
| Yandex NV Series A (a) | | 872,500 | 23,784,350 |
|
| TOTAL NETHERLANDS | | | 42,885,307 |
|
| Philippines - 2.9% | | | |
| Ayala Corp. | | 1,419,650 | 24,528,214 |
| Ayala Land, Inc. | | 34,435,800 | 24,238,233 |
| D&L Industries, Inc. | | 74,318,700 | 18,968,114 |
| SM Investments Corp. | | 1,656,903 | 24,051,631 |
| SM Prime Holdings, Inc. | | 40,026,600 | 23,783,789 |
|
| TOTAL PHILIPPINES | | | 115,569,981 |
|
| Russia - 3.2% | | | |
| Alrosa Co. Ltd. (a) | | 13,213,000 | 22,771,050 |
| Magnit OJSC | | 182,544 | 28,140,547 |
| NOVATEK OAO GDR (Reg. S) | | 238,100 | 28,857,720 |
| Sberbank of Russia | | 16,836,460 | 48,902,476 |
|
| TOTAL RUSSIA | | | 128,671,793 |
|
| South Africa - 6.9% | | | |
| Aspen Pharmacare Holdings Ltd. | | 1,266,090 | 26,264,943 |
| Bidcorp Ltd. | | 1,239,098 | 26,252,976 |
| Capitec Bank Holdings Ltd. | | 413,200 | 23,577,329 |
| Discovery Ltd. | | 2,264,085 | 22,668,381 |
| FirstRand Ltd. | | 8,964,700 | 33,440,486 |
| Mondi Ltd. | | 971,866 | 25,215,609 |
| Naspers Ltd. Class N | | 495,612 | 94,241,372 |
| Sanlam Ltd. | | 4,740,100 | 25,144,566 |
|
| TOTAL SOUTH AFRICA | | | 276,805,662 |
|
| Spain - 0.5% | | | |
| Amadeus IT Holding SA Class A | | 378,500 | 20,408,852 |
| Sweden - 0.5% | | | |
| ASSA ABLOY AB (B Shares) | | 940,200 | 20,370,133 |
| Switzerland - 0.6% | | | |
| Sika AG | | 3,570 | 22,783,417 |
| Taiwan - 5.4% | | | |
| Advantech Co. Ltd. | | 2,710,000 | 21,878,702 |
| Largan Precision Co. Ltd. | | 215,000 | 35,675,644 |
| Taiwan Semiconductor Manufacturing Co. Ltd. | | 24,812,000 | 159,561,285 |
|
| TOTAL TAIWAN | | | 217,115,631 |
|
| Thailand - 1.1% | | | |
| Airports of Thailand PCL (For. Reg.) | | 20,182,400 | 23,478,081 |
| Thai Beverage PCL | | 32,033,000 | 21,207,834 |
|
| TOTAL THAILAND | | | 44,685,915 |
|
| Turkey - 0.5% | | | |
| Tofas Turk Otomobil Fabrikasi A/S | | 2,469,930 | 20,569,132 |
| United Arab Emirates - 0.6% | | | |
| National Bank of Abu Dhabi PJSC (a) | | 7,810,734 | 23,391,798 |
| United Kingdom - 3.1% | | | |
| British American Tobacco PLC (United Kingdom) | | 311,400 | 21,039,233 |
| InterContinental Hotel Group PLC | | 378,700 | 20,090,562 |
| NMC Health PLC | | 859,200 | 22,112,048 |
| Prudential PLC | | 970,914 | 21,548,332 |
| Reckitt Benckiser Group PLC | | 219,000 | 20,178,123 |
| Unilever PLC | | 381,300 | 19,617,249 |
|
| TOTAL UNITED KINGDOM | | | 124,585,547 |
|
| United States of America - 7.7% | | | |
| A.O. Smith Corp. | | 365,500 | 19,693,140 |
| Alphabet, Inc. Class C (a) | | 23,245 | 21,059,040 |
| Amazon.com, Inc. (a) | | 21,980 | 20,331,280 |
| Amphenol Corp. Class A | | 269,400 | 19,480,314 |
| China Biologic Products, Inc. (a) | | 189,078 | 22,311,204 |
| Facebook, Inc. Class A (a) | | 146,000 | 21,936,500 |
| MasterCard, Inc. Class A | | 173,400 | 20,169,888 |
| Mettler-Toledo International, Inc. (a) | | 40,080 | 20,577,874 |
| Moody's Corp. | | 183,700 | 21,735,384 |
| MSCI, Inc. | | 201,200 | 20,184,384 |
| Philip Morris International, Inc. | | 176,400 | 19,552,176 |
| S&P Global, Inc. | | 157,000 | 21,067,830 |
| Sherwin-Williams Co. | | 65,000 | 21,754,200 |
| The Walt Disney Co. | | 166,300 | 19,224,280 |
| Visa, Inc. Class A | | 220,200 | 20,086,644 |
|
| TOTAL UNITED STATES OF AMERICA | | | 309,164,138 |
|
| TOTAL COMMON STOCKS | | | |
| (Cost $2,814,368,845) | | | 3,767,315,651 |
|
| Preferred Stocks - 3.8% | | | |
| Convertible Preferred Stocks - 0.6% | | | |
| India - 0.6% | | | |
| PC Jeweller Ltd. 13.00% (b) | | 169,426,966 | 26,192,687 |
| Nonconvertible Preferred Stocks - 3.2% | | | |
| Brazil - 3.2% | | | |
| Ambev SA sponsored ADR | | 7,382,580 | 42,302,183 |
| Itau Unibanco Holding SA | | 4,400,510 | 54,430,152 |
| Itausa-Investimentos Itau SA (PN) | | 9,748,900 | 30,376,529 |
| | | | 127,108,864 |
| TOTAL PREFERRED STOCKS | | | |
| (Cost $133,133,926) | | | 153,301,551 |
|
| Money Market Funds - 2.3% | | | |
| Fidelity Cash Central Fund, 0.85% (c) | | 91,891,825 | 91,910,204 |
| Fidelity Securities Lending Cash Central Fund 0.86% (c)(d) | | 4,093 | 4,094 |
| TOTAL MONEY MARKET FUNDS | | | |
| (Cost $91,914,297) | | | 91,914,298 |
| TOTAL INVESTMENT PORTFOLIO - 100.3% | | | |
| (Cost $3,039,417,068) | | | 4,012,531,500 |
| NET OTHER ASSETS (LIABILITIES) - (0.3)% | | | (12,469,496) |
| NET ASSETS - 100% | | | $4,000,062,004 |
Categorizations in the Schedule of Investments are based on country or territory of incorporation.
Legend
(a) Non-income producing
(b) Restricted securities - Investment in securities not registered under the Securities Act of 1933 (excluding 144A issues). At the end of the period, the value of restricted securities (excluding 144A issues) amounted to $26,192,687 or 0.7% of net assets.
(c) Affiliated fund that is generally available only to investment companies and other accounts managed by Fidelity Investments. The rate quoted is the annualized seven-day yield of the fund at period end. A complete unaudited listing of the fund's holdings as of its most recent quarter end is available upon request. In addition, each Fidelity Central Fund's financial statements are available on the SEC's website or upon request.
(d) Investment made with cash collateral received from securities on loan.
Additional information on each restricted holding is as follows:
| Security | Acquisition Date | Acquisition Cost |
| PC Jeweller Ltd. 13.00% | 7/28/16 | $25,285,041 |
Affiliated Central Funds
Information regarding fiscal year to date income earned by the Fund from investments in Fidelity Central Funds is as follows:
| Fund | Income earned |
| Fidelity Cash Central Fund | $101,332 |
| Fidelity Securities Lending Cash Central Fund | 128,250 |
| Total | $229,582 |
Investment Valuation
The following is a summary of the inputs used, as of April 30, 2017, involving the Fund's assets and liabilities carried at fair value. The inputs or methodology used for valuing securities may not be an indication of the risk associated with investing in those securities. For more information on valuation inputs, and their aggregation into the levels used below, please refer to the Investment Valuation section in the accompanying Notes to Financial Statements.
| | Valuation Inputs at Reporting Date: |
| Description | Total | Level 1 | Level 2 | Level 3 |
| Investments in Securities: | | | | |
| Equities: | | | | |
| Consumer Discretionary | $520,719,300 | $379,958,302 | $140,760,998 | $-- |
| Consumer Staples | 493,405,134 | 412,181,646 | 81,223,488 | -- |
| Energy | 98,758,244 | 98,758,244 | -- | -- |
| Financials | 642,970,730 | 546,448,771 | 96,521,959 | -- |
| Health Care | 223,760,324 | 223,760,324 | -- | -- |
| Industrials | 299,122,225 | 299,122,225 | -- | -- |
| Information Technology | 1,094,447,019 | 755,759,302 | 338,687,717 | -- |
| Materials | 381,986,791 | 381,986,791 | -- | -- |
| Real Estate | 48,022,022 | 48,022,022 | -- | -- |
| Telecommunication Services | 49,710,713 | 19,973,684 | 29,737,029 | -- |
| Utilities | 67,714,700 | 67,714,700 | -- | -- |
| Money Market Funds | 91,914,298 | 91,914,298 | -- | -- |
| Total Investments in Securities: | $4,012,531,500 | $3,325,600,309 | $686,931,191 | $-- |
The following is a summary of transfers between Level 1 and Level 2 for the period ended April 30, 2017. Transfers are assumed to have occurred at the beginning of the period, and are primarily attributable to the valuation techniques used for foreign equity securities, as discussed in the accompanying Notes to Financial Statements:
| Transfers | Total |
| Level 1 to Level 2 | $103,316,862 |
| Level 2 to Level 1 | $18,242,515 |
See accompanying notes which are an integral part of the financial statements.
Fidelity® Emerging Markets Fund
Financial Statements
Statement of Assets and Liabilities
| | | April 30, 2017 (Unaudited) |
| Assets | | |
Investment in securities, at value — See accompanying schedule:
Unaffiliated issuers (cost $2,947,502,771) | $3,920,617,203 | |
| Fidelity Central Funds (cost $91,914,297) | 91,914,297 | |
| Total Investments (cost $3,039,417,068) | | $4,012,531,500 |
| Foreign currency held at value (cost $1,379,123) | | 1,379,123 |
| Receivable for investments sold | | 12,821,590 |
| Receivable for fund shares sold | | 5,752,296 |
| Dividends receivable | | 5,774,355 |
| Distributions receivable from Fidelity Central Funds | | 30,358 |
| Prepaid expenses | | 2,343 |
| Other receivables | | 4,725,762 |
| Total assets | | 4,043,017,327 |
| Liabilities | | |
| Payable to custodian bank | $2,229,090 | |
| Payable for investments purchased | 32,097,417 | |
| Payable for fund shares redeemed | 2,102,049 | |
| Accrued management fee | 2,259,909 | |
| Other affiliated payables | 672,473 | |
| Other payables and accrued expenses | 3,594,385 | |
| Total liabilities | | 42,955,323 |
| Net Assets | | $4,000,062,004 |
| Net Assets consist of: | | |
| Paid in capital | | $3,488,719,822 |
| Undistributed net investment income | | 8,638,278 |
| Accumulated undistributed net realized gain (loss) on investments and foreign currency transactions | | (469,853,254) |
| Net unrealized appreciation (depreciation) on investments and assets and liabilities in foreign currencies | | 972,557,158 |
| Net Assets | | $4,000,062,004 |
| Emerging Markets: | | |
| Net Asset Value, offering price and redemption price per share ($3,260,510,330 ÷ 123,448,382 shares) | | $26.41 |
| Class K: | | |
| Net Asset Value, offering price and redemption price per share ($739,551,674 ÷ 27,986,768 shares) | | $26.43 |
See accompanying notes which are an integral part of the financial statements.
Statement of Operations
| | | Six months ended April 30, 2017 (Unaudited) |
| Investment Income | | |
| Dividends | | $34,173,788 |
| Income from Fidelity Central Funds | | 229,582 |
| Income before foreign taxes withheld | | 34,403,370 |
| Less foreign taxes withheld | | (2,900,981) |
| Total income | | 31,502,389 |
| Expenses | | |
| Management fee | $12,696,117 | |
| Transfer agent fees | 3,151,546 | |
| Accounting and security lending fees | 754,994 | |
| Custodian fees and expenses | 736,596 | |
| Independent trustees' fees and expenses | 7,353 | |
| Registration fees | 63,993 | |
| Audit | 57,754 | |
| Legal | 4,510 | |
| Interest | 6,301 | |
| Miscellaneous | 14,132 | |
| Total expenses before reductions | 17,493,296 | |
| Expense reductions | (668,426) | 16,824,870 |
| Net investment income (loss) | | 14,677,519 |
| Realized and Unrealized Gain (Loss) | | |
| Net realized gain (loss) on: | | |
| Investment securities: | | |
| Unaffiliated issuers | 19,774,673 | |
| Fidelity Central Funds | 2,709 | |
| Foreign currency transactions | (822,580) | |
| Total net realized gain (loss) | | 18,954,802 |
Change in net unrealized appreciation (depreciation) on:
Investment securities | 322,263,434 | |
| Assets and liabilities in foreign currencies | 123,006 | |
| Total change in net unrealized appreciation (depreciation) | | 322,386,440 |
| Net gain (loss) | | 341,341,242 |
| Net increase (decrease) in net assets resulting from operations | | $356,018,761 |
See accompanying notes which are an integral part of the financial statements.
Statement of Changes in Net Assets
| | Six months ended April 30, 2017 (Unaudited) | Year ended October 31, 2016 |
| Increase (Decrease) in Net Assets | | |
| Operations | | |
| Net investment income (loss) | $14,677,519 | $21,682,785 |
| Net realized gain (loss) | 18,954,802 | (227,815,936) |
| Change in net unrealized appreciation (depreciation) | 322,386,440 | 470,369,169 |
| Net increase (decrease) in net assets resulting from operations | 356,018,761 | 264,236,018 |
| Distributions to shareholders from net investment income | (23,974,554) | (17,361,594) |
| Share transactions - net increase (decrease) | (5,386,378) | 131,573,266 |
| Redemption fees | 171,864 | 1,810,193 |
| Total increase (decrease) in net assets | 326,829,693 | 380,257,883 |
| Net Assets | | |
| Beginning of period | 3,673,232,311 | 3,292,974,428 |
| End of period | $4,000,062,004 | $3,673,232,311 |
| Other Information | | |
| Undistributed net investment income end of period | $8,638,278 | $17,935,313 |
See accompanying notes which are an integral part of the financial statements.
Financial Highlights — Fidelity Emerging Markets Fund
| | Six months ended (Unaudited) April 30, | Years ended October 31, | | | | |
| | 2017 | 2016 | 2015 | 2014 | 2013 | 2012 |
| Selected Per–Share Data | | | | | | |
| Net asset value, beginning of period | $24.25 | $22.55 | $25.44 | $24.43 | $22.15 | $22.23 |
| Income from Investment Operations | | | | | | |
| Net investment income (loss)A | .09 | .14 | .19 | .17 | .20 | .33 |
| Net realized and unrealized gain (loss) | 2.22 | 1.66 | (2.91) | .86 | 2.38 | (.11) |
| Total from investment operations | 2.31 | 1.80 | (2.72) | 1.03 | 2.58 | .22 |
| Distributions from net investment income | (.15) | (.11) | (.14) | (.02) | (.30) | (.30) |
| Distributions from net realized gain | – | – | (.03) | – | – | – |
| Total distributions | (.15) | (.11) | (.17) | (.02) | (.30) | (.30) |
| Redemption fees added to paid in capitalA | –B | .01 | –B | –B | –B | –B |
| Net asset value, end of period | $26.41 | $24.25 | $22.55 | $25.44 | $24.43 | $22.15 |
| Total ReturnC,D | 9.63% | 8.07% | (10.76)% | 4.22% | 11.78% | 1.03% |
| Ratios to Average Net AssetsE,F | | | | | | |
| Expenses before reductions | .99%G | 1.01% | 1.05% | 1.07% | 1.08% | 1.09% |
| Expenses net of fee waivers, if any | .99%G | 1.01% | 1.05% | 1.07% | 1.08% | 1.09% |
| Expenses net of all reductions | .95%G | 1.00% | 1.03% | 1.07% | 1.03% | 1.03% |
| Net investment income (loss) | .78%G | .61% | .78% | .71% | .85% | 1.50% |
| Supplemental Data | | | | | | |
| Net assets, end of period (000 omitted) | $3,260,510 | $3,014,957 | $2,738,934 | $2,370,927 | $2,241,338 | $2,203,756 |
| Portfolio turnover rateH | 74%G | 79% | 107% | 94% | 119% | 176% |
A Calculated based on average shares outstanding during the period.
B Amount represents less than $.005 per share.
C Total returns for periods of less than one year are not annualized.
D Total returns would have been lower if certain expenses had not been reduced during the applicable periods shown.
E Fees and expenses of any underlying Fidelity Central Funds are not included in the Fund's expense ratio. The Fund indirectly bears its proportionate share of the expenses of any underlying Fidelity Central Funds.
F Expense ratios reflect operating expenses of the class. Expenses before reductions do not reflect amounts reimbursed by the investment adviser or reductions from brokerage service arrangements or reductions from other expense offset arrangements and do not represent the amount paid by the class during periods when reimbursements or reductions occur. Expenses net of fee waivers reflect expenses after reimbursement by the investment adviser but prior to reductions from brokerage service arrangements or other expense offset arrangements. Expenses net of all reductions represent the net expenses paid by the class.
G Annualized
H Amount does not include the portfolio activity of any underlying Fidelity Central Funds.
See accompanying notes which are an integral part of the financial statements.
Financial Highlights — Fidelity Emerging Markets Fund Class K
| | Six months ended (Unaudited) April 30, | Years ended October 31, | | | | |
| | 2017 | 2016 | 2015 | 2014 | 2013 | 2012 |
| Selected Per–Share Data | | | | | | |
| Net asset value, beginning of period | $24.28 | $22.58 | $25.48 | $24.42 | $22.15 | $22.23 |
| Income from Investment Operations | | | | | | |
| Net investment income (loss)A | .11 | .18 | .24 | .23 | .25 | .37 |
| Net realized and unrealized gain (loss) | 2.23 | 1.66 | (2.92) | .86 | 2.38 | (.10) |
| Total from investment operations | 2.34 | 1.84 | (2.68) | 1.09 | 2.63 | .27 |
| Distributions from net investment income | (.19) | (.15) | (.20) | (.03) | (.36) | (.35) |
| Distributions from net realized gain | – | – | (.03) | – | – | – |
| Total distributions | (.19) | (.15) | (.22)B | (.03) | (.36) | (.35) |
| Redemption fees added to paid in capitalA | –C | .01 | –C | –C | –C | –C |
| Net asset value, end of period | $26.43 | $24.28 | $22.58 | $25.48 | $24.42 | $22.15 |
| Total ReturnD,E | 9.76% | 8.27% | (10.60)% | 4.47% | 12.01% | 1.25% |
| Ratios to Average Net AssetsF,G | | | | | | |
| Expenses before reductions | .83%H | .84% | .85% | .86% | .87% | .87% |
| Expenses net of fee waivers, if any | .83%H | .84% | .85% | .85% | .87% | .87% |
| Expenses net of all reductions | .80%H | .83% | .83% | .85% | .82% | .81% |
| Net investment income (loss) | .93%H | .78% | .98% | .92% | 1.07% | 1.72% |
| Supplemental Data | | | | | | |
| Net assets, end of period (000 omitted) | $739,552 | $658,276 | $554,041 | $623,430 | $547,369 | $607,919 |
| Portfolio turnover rateI | 74%H | 79% | 107% | 94% | 119% | 176% |
A Calculated based on average shares outstanding during the period.
B Total distributions of $.22 per share is comprised of distributions from net investment income of $.195 and distributions from net realized gain of $.025 per share.
C Amount represents less than $.005 per share.
D Total returns for periods of less than one year are not annualized.
E Total returns would have been lower if certain expenses had not been reduced during the applicable periods shown.
F Fees and expenses of any underlying Fidelity Central Funds are not included in the Fund's expense ratio. The Fund indirectly bears its proportionate share of the expenses of any underlying Fidelity Central Funds.
G Expense ratios reflect operating expenses of the class. Expenses before reductions do not reflect amounts reimbursed by the investment adviser or reductions from brokerage service arrangements or reductions from other expense offset arrangements and do not represent the amount paid by the class during periods when reimbursements or reductions occur. Expenses net of fee waivers reflect expenses after reimbursement by the investment adviser but prior to reductions from brokerage service arrangements or other expense offset arrangements. Expenses net of all reductions represent the net expenses paid by the class.
H Annualized
I Amount does not include the portfolio activity of any underlying Fidelity Central Funds.
See accompanying notes which are an integral part of the financial statements.
Notes to Financial Statements (Unaudited)
For the period ended April 30, 2017
1. Organization.
Fidelity Emerging Markets Fund (the Fund) is a fund of Fidelity Investment Trust (the Trust) and is authorized to issue an unlimited number of shares. The Trust is registered under the Investment Company Act of 1940, as amended (the 1940 Act), as an open-end management investment company organized as a Massachusetts business trust. The Fund offers Emerging Markets and Class K shares, each of which has equal rights as to assets and voting privileges. Each class has exclusive voting rights with respect to matters that affect that class. The Fund's investments in emerging markets can be subject to social, economic, regulatory, and political uncertainties and can be extremely volatile.
2. Investments in Fidelity Central Funds.
The Fund invests in Fidelity Central Funds, which are open-end investment companies generally available only to other investment companies and accounts managed by the investment adviser and its affiliates. The Fund's Schedule of Investments lists each of the Fidelity Central Funds held as of period end, if any, as an investment of the Fund, but does not include the underlying holdings of each Fidelity Central Fund. As an Investing Fund, the Fund indirectly bears its proportionate share of the expenses of the underlying Fidelity Central Funds.
The Money Market Central Funds seek preservation of capital and current income and are managed by Fidelity Investments Money Management, Inc. (FIMM), an affiliate of the investment adviser. Annualized expenses of the Money Market Central Funds as of their most recent shareholder report date are less than .005%.
A complete unaudited list of holdings for each Fidelity Central Fund is available upon request or at the Securities and Exchange Commission (the SEC) website at www.sec.gov. In addition, the financial statements of the Fidelity Central Funds are available on the SEC website or upon request.
3. Significant Accounting Policies.
The Fund is an investment company and applies the accounting and reporting guidance of the Financial Accounting Standards Board (FASB) Accounting Standards Codification Topic 946 Financial Services – Investments Companies. The financial statements have been prepared in conformity with accounting principles generally accepted in the United States of America (GAAP), which require management to make certain estimates and assumptions at the date of the financial statements. Actual results could differ from those estimates. Subsequent events, if any, through the date that the financial statements were issued have been evaluated in the preparation of the financial statements. The following summarizes the significant accounting policies of the Fund:
Investment Valuation. Investments are valued as of 4:00 p.m. Eastern time on the last calendar day of the period. The Board of Trustees (the Board) has delegated the day to day responsibility for the valuation of the Fund's investments to the Fair Value Committee (the Committee) established by the Fund's investment adviser. In accordance with valuation policies and procedures approved by the Board, the Fund attempts to obtain prices from one or more third party pricing vendors or brokers to value its investments. When current market prices, quotations or currency exchange rates are not readily available or reliable, investments will be fair valued in good faith by the Committee, in accordance with procedures adopted by the Board. Factors used in determining fair value vary by investment type and may include market or investment specific events. The frequency with which these procedures are used cannot be predicted and they may be utilized to a significant extent. The Committee oversees the Fund's valuation policies and procedures and reports to the Board on the Committee's activities and fair value determinations. The Board monitors the appropriateness of the procedures used in valuing the Fund's investments and ratifies the fair value determinations of the Committee.
The Fund categorizes the inputs to valuation techniques used to value its investments into a disclosure hierarchy consisting of three levels as shown below:
- Level 1 – quoted prices in active markets for identical investments
- Level 2 – other significant observable inputs (including quoted prices for similar investments, interest rates, prepayment speeds, etc.)
- Level 3 – unobservable inputs (including the Fund's own assumptions based on the best information available)
Valuation techniques used to value the Fund's investments by major category are as follows:
Equity securities, including restricted securities, for which market quotations are readily available, are valued at the last reported sale price or official closing price as reported by a third party pricing vendor on the primary market or exchange on which they are traded and are categorized as Level 1 in the hierarchy. In the event there were no sales during the day or closing prices are not available, securities are valued at the last quoted bid price or may be valued using the last available price and are generally categorized as Level 2 in the hierarchy. For foreign equity securities, when market or security specific events arise, comparisons to the valuation of American Depositary Receipts (ADRs), futures contracts, Exchange-Traded Funds (ETFs) and certain indexes as well as quoted prices for similar securities may be used and would be categorized as Level 2 in the hierarchy. Utilizing these techniques may result in transfers between Level 1 and Level 2. For equity securities, including restricted securities, where observable inputs are limited, assumptions about market activity and risk are used and these securities may be categorized as Level 3 in the hierarchy.
Investments in open-end mutual funds, including the Fidelity Central Funds, are valued at their closing net asset value (NAV) each business day and are categorized as Level 1 in the hierarchy.
Changes in valuation techniques may result in transfers in or out of an assigned level within the disclosure hierarchy. The aggregate value of investments by input level as of April 30, 2017, including information on transfers between Levels 1 and 2, is included at the end of the Fund's Schedule of Investments.
Foreign Currency. The Fund may use foreign currency contracts to facilitate transactions in foreign-denominated securities. Gains and losses from these transactions may arise from changes in the value of the foreign currency or if the counterparties do not perform under the contracts' terms.
Foreign-denominated assets, including investment securities, and liabilities are translated into U.S. dollars at the exchange rates at period end. Purchases and sales of investment securities, income and dividends received and expenses denominated in foreign currencies are translated into U.S. dollars at the exchange rate in effect on the transaction date.
The effects of exchange rate fluctuations on investments are included with the net realized and unrealized gain (loss) on investment securities. Other foreign currency transactions resulting in realized and unrealized gain (loss) are disclosed separately.
Investment Transactions and Income. For financial reporting purposes, the Fund's investment holdings and NAV include trades executed through the end of the last business day of the period. The NAV per share for processing shareholder transactions is calculated as of the close of business of the New York Stock Exchange (NYSE), normally 4:00 p.m. Eastern time and includes trades executed through the end of the prior business day. Gains and losses on securities sold are determined on the basis of identified cost. Dividend income is recorded on the ex-dividend date, except for certain dividends from foreign securities where the ex-dividend date may have passed, which are recorded as soon as the Fund is informed of the ex-dividend date. Non-cash dividends included in dividend income, if any, are recorded at the fair market value of the securities received. Income and capital gain distributions from Fidelity Central Funds, if any, are recorded on the ex-dividend date. Certain distributions received by the Fund represent a return of capital or capital gain. The Fund determines the components of these distributions subsequent to the ex-dividend date, based upon receipt of tax filings or other correspondence relating to the underlying investment. These distributions are recorded as a reduction of cost of investments and/or as a realized gain. Investment income is recorded net of foreign taxes withheld where recovery of such taxes is uncertain.
Class Allocations and Expenses. Investment income, realized and unrealized capital gains and losses, common expenses of the Fund, and certain fund-level expense reductions, if any, are allocated daily on a pro-rata basis to each class based on the relative net assets of each class to the total net assets of the Fund. Each class differs with respect to transfer agent fees incurred. Certain expense reductions may also differ by class. For the reporting period, the allocated portion of income and expenses to each class as a percent of its average net assets may vary due to the timing of recording these transactions in relation to fluctuating net assets of the classes. Expenses directly attributable to a fund are charged to that fund. Expenses attributable to more than one fund are allocated among the respective funds on the basis of relative net assets or other appropriate methods. Expense estimates are accrued in the period to which they relate and adjustments are made when actual amounts are known.
Income Tax Information and Distributions to Shareholders. Each year, the Fund intends to qualify as a regulated investment company under Subchapter M of the Internal Revenue Code, including distributing substantially all of its taxable income and realized gains. As a result, no provision for U.S. Federal income taxes is required. The Fund files a U.S. federal tax return, in addition to state and local tax returns as required. The Fund's federal income tax returns are subject to examination by the Internal Revenue Service (IRS) for a period of three fiscal years after they are filed. State and local tax returns may be subject to examination for an additional fiscal year depending on the jurisdiction. Foreign taxes are provided for based on the Fund's understanding of the tax rules and rates that exist in the foreign markets in which it invests. The Fund is subject to a tax imposed on capital gains by certain countries in which it invests.
Distributions are declared and recorded on the ex-dividend date. Income dividends and capital gain distributions are declared separately for each class. Income and capital gain distributions are determined in accordance with income tax regulations, which may differ from GAAP.
Capital accounts within the financial statements are adjusted for permanent book-tax differences. These adjustments have no impact on net assets or the results of operations. Capital accounts are not adjusted for temporary book-tax differences which will reverse in a subsequent period.
Book-tax differences are primarily due to foreign currency transactions, certain foreign taxes, passive foreign investment companies (PFIC), deferred trustees compensation, capital loss carryforwards and losses deferred due to wash sales.
The federal tax cost of investment securities and unrealized appreciation (depreciation) as of period end were as follows:
| Gross unrealized appreciation | $995,288,231 |
| Gross unrealized depreciation | (32,853,324) |
| Net unrealized appreciation (depreciation) on securities | $962,434,907 |
| Tax cost | $3,050,096,593 |
Capital loss carryforwards are only available to offset future capital gains of the Fund to the extent provided by regulations and may be limited. Under the Regulated Investment Company Modernization Act of 2010 (the Act), the Fund is permitted to carry forward capital losses incurred in taxable years beginning after December 22, 2010 for an unlimited period and such capital losses are required to be used prior to any losses that expire. The capital loss carryforward information presented below, including any applicable limitation, is estimated as of prior fiscal period end and is subject to adjustment.
| Fiscal year of expiration | |
| 2017 | $(24,838,920) |
| No expiration | |
| Short-term | (360,338,760) |
| Long-term | (85,169,192) |
| Total no expiration | (445,507,952) |
| Total capital loss carryforward | $(470,346,872) |
Short-Term Trading (Redemption) Fees. Shares held by investors in the Fund less than 90 days may have been subject to a redemption fee equal to 1.50% of the NAV of shares redeemed. All redemption fees, which reduce the proceeds of the shareholder redemption, are retained by the Fund and accounted for as an addition to paid in capital.
Restricted Securities. The Fund may invest in securities that are subject to legal or contractual restrictions on resale. These securities generally may be resold in transactions exempt from registration or to the public if the securities are registered. Disposal of these securities may involve time-consuming negotiations and expense, and prompt sale at an acceptable price may be difficult. Information regarding restricted securities is included at the end of the Fund's Schedule of Investments.
4. Purchases and Sales of Investments.
Purchases and sales of securities, other than short-term securities, aggregated $1,343,043,234 and $1,407,100,085, respectively.
5. Fees and Other Transactions with Affiliates.
Management Fee. Fidelity Management & Research Company (the investment adviser) and its affiliates provide the Fund with investment management related services for which the Fund pays a monthly management fee. The management fee is the sum of an individual fund fee rate that is based on an annual rate of .45% of the Fund's average net assets and an annualized group fee rate that averaged .25% during the period. The group fee rate is based upon the average net assets of all the mutual funds advised by the investment adviser, including any mutual funds previously advised by the investment adviser that are currently advised by Fidelity SelectCo, LLC, an affiliate of the investment adviser. The group fee rate decreases as assets under management increase and increases as assets under management decrease. For the reporting period, the total annualized management fee rate was .70% of the Fund's average net assets.
Transfer Agent Fees. Fidelity Investments Institutional Operations Company, Inc., (FIIOC), an affiliate of the investment adviser, is the transfer, dividend disbursing and shareholder servicing agent for each class of the Fund. FIIOC receives account fees and asset-based fees that vary according to the account size and type of account of the shareholders of Emerging Markets, except for Class K. FIIOC receives an asset-based fee of Class K's average net assets.FIIOC pays for typesetting, printing and mailing of shareholder reports, except proxy statements.
For the period, transfer agent fees for each class were as follows:
| | Amount | % of
Class-Level Average
Net Assets(a) |
| Emerging Markets | $2,995,502 | .20 |
| Class K | 156,044 | .05 |
| | $3,151,546 | |
(a) Annualized
Accounting and Security Lending Fees. Fidelity Service Company, Inc. (FSC), an affiliate of the investment adviser, maintains the Fund's accounting records. The accounting fee is based on the level of average net assets for each month. Under a separate contract, FSC administers the security lending program. The security lending fee is based on the number and duration of lending transactions.
Brokerage Commissions. The Fund placed a portion of its portfolio transactions with brokerage firms which are affiliates of the investment adviser. Brokerage commissions are included in net realized gain (loss) and change in net unrealized appreciation (depreciation) in the Statement of Operations. The commissions paid to these affiliated firms were $6,672 for the period.
Interfund Lending Program. Pursuant to an Exemptive Order issued by the SEC, the Fund, along with other registered investment companies having management contracts with FMR or other affiliated entities of FMR, may participate in an interfund lending program. This program provides an alternative credit facility allowing the funds to borrow from, or lend money to, other participating affiliated funds. At period end, there were no interfund loans outstanding. The Fund's activity in this program during the period for which loans were outstanding was as follows:
| Borrower or Lender | Average Loan Balance | Weighted Average Interest Rate | Interest Expense |
| Borrower | $12,129,818 | .85% | $6,301 |
Interfund Trades. The Fund may purchase from or sell securities to other Fidelity Funds under procedures adopted by the Board. The procedures have been designed to ensure these interfund trades are executed in accordance with Rule 17a-7 of the 1940 Act. Interfund trades are included within the respective purchases and sales amounts shown in the Purchases and Sales of Investments note.
6. Committed Line of Credit.
The Fund participates with other funds managed by the investment adviser or an affiliate in a $4.25 billion credit facility (the "line of credit") to be utilized for temporary or emergency purposes to fund shareholder redemptions or for other short-term liquidity purposes. The Fund has agreed to pay commitment fees on its pro-rata portion of the line of credit, which amounted to $6,119 and is reflected in Miscellaneous expenses on the Statement of Operations. During the period, the Fund did not borrow on this line of credit.
7. Security Lending.
The Fund lends portfolio securities through a lending agent from time to time in order to earn additional income. For equity securities, a lending agent is used and may loan securities to certain qualified borrowers, including Fidelity Capital Markets (FCM), a broker-dealer affiliated with the Fund. On the settlement date of the loan, the Fund receives collateral (in the form of U.S. Treasury obligations, letters of credit and/or cash) against the loaned securities and maintains collateral in an amount not less than 100% of the market value of the loaned securities during the period of the loan. The market value of the loaned securities is determined at the close of business of the Fund and any additional required collateral is delivered to the Fund on the next business day. The Fund or borrower may terminate the loan at any time, and if the borrower defaults on its obligation to return the securities loaned because of insolvency or other reasons, the Fund may apply collateral received from the borrower against the obligation. The Fund may experience delays and costs in recovering the securities loaned. Any cash collateral received is invested in the Fidelity Securities Lending Cash Central Fund. At period end, there were no security loans outstanding. Security lending income represents the income earned on investing cash collateral, less rebates paid to borrowers and any lending agent fees associated with the loan, plus any premium payments received for lending certain types of securities. Security lending income is presented in the Statement of Operations as a component of income from Fidelity Central Funds. Total security lending income during the period amounted to $128,250, including $1,060 from securities loaned to FCM.
8. Expense Reductions.
Commissions paid to certain brokers with whom the investment adviser, or its affiliates, places trades on behalf of the Fund include an amount in addition to trade execution, which may be rebated back to the Fund to offset certain expenses. This amount totaled $652,995 for the period.
In addition, during the period the investment adviser reimbursed and/or waived a portion of fund-level operating expenses in the amount of $15,431.
9.��Distributions to Shareholders.
Distributions to shareholders of each class were as follows:
| | Six months ended
April 30, 2017 | Year ended October 31, 2016 |
| From net investment income | | |
| Emerging Markets | $18,744,412 | $13,660,209 |
| Class K | 5,230,142 | 3,701,385 |
| Total | $23,974,554 | $17,361,594 |
10. Share Transactions.
Share transactions for each class were as follows and may contain automatic conversions between classes or exchanges between affiliated funds:
| | Shares | Shares | Dollars | Dollars |
| | Six months ended April 30, 2017 | Year ended October 31, 2016 | Six months ended April 30, 2017 | Year ended October 31, 2016 |
| Emerging Markets | | | | |
| Shares sold | 16,265,862 | 40,381,882 | $382,796,383 | $879,217,354 |
| Reinvestment of distributions | 790,787 | 572,542 | 17,864,538 | 12,670,348 |
| Shares redeemed | (17,959,036) | (38,074,038) | (425,830,637) | (819,023,837) |
| Net increase (decrease) | (902,387) | 2,880,386 | $(25,169,716) | $72,863,865 |
| Class K | | | | |
| Shares sold | 4,961,080 | 8,389,679 | $117,341,002 | $189,089,919 |
| Reinvestment of distributions | 231,437 | 167,256 | 5,230,142 | 3,701,385 |
| Shares redeemed | (4,318,358) | (5,977,816) | (102,787,806) | (134,081,903) |
| Net increase (decrease) | 874,159 | 2,579,119 | $19,783,338 | $58,709,401 |
11. Other.
The Fund's organizational documents provide former and current trustees and officers with a limited indemnification against liabilities arising in connection with the performance of their duties to the Fund. In the normal course of business, the Fund may also enter into contracts that provide general indemnifications. The Fund's maximum exposure under these arrangements is unknown as this would be dependent on future claims that may be made against the Fund. The risk of material loss from such claims is considered remote.
Fidelity® Europe Fund
Investment Summary (Unaudited)
Geographic Diversification (% of fund's net assets)
| As of April 30, 2017 |
| | Germany | 15.0% |
| | Sweden | 14.2% |
| | United Kingdom | 13.1% |
| | France | 10.4% |
| | Netherlands | 7.6% |
| | Italy | 7.3% |
| | Spain | 6.2% |
| | Switzerland | 6.0% |
| | United States of America* | 3.9% |
| | Other | 16.3% |
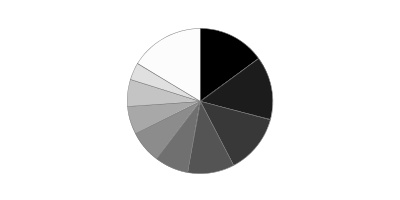
* Includes Short-Term investments and Net Other Assets (Liabilities).
Percentages are based on country or territory of incorporation and are adjusted for the effect of futures contracts, if applicable.
| As of October 31, 2016 |
| | United Kingdom | 20.5% |
| | Sweden | 15.4% |
| | Germany | 14.2% |
| | France | 8.7% |
| | Netherlands | 8.3% |
| �� | Switzerland | 8.2% |
| | Bailiwick of Jersey | 4.6% |
| | Bermuda | 3.5% |
| | Ireland | 3.3% |
| | Other* | 13.3% |

* Includes Short-Term investments and Net Other Assets (Liabilities).
Percentages are based on country or territory of incorporation and are adjusted for the effect of futures contracts, if applicable.
Asset Allocation as of April 30, 2017
| | % of fund's net assets | % of fund's net assets 6 months ago |
| Stocks | 98.7 | 99.6 |
| Short-Term Investments and Net Other Assets (Liabilities) | 1.3 | 0.4 |
Top Ten Stocks as of April 30, 2017
| | % of fund's net assets | % of fund's net assets 6 months ago |
| SAP AG (Germany, Software) | 4.3 | 4.7 |
| Getinge AB (B Shares) (Sweden, Health Care Equipment & Supplies) | 3.3 | 3.1 |
| Prudential PLC (United Kingdom, Insurance) | 3.1 | 2.2 |
| Investor AB (B Shares) (Sweden, Diversified Financial Services) | 2.8 | 2.3 |
| Autoliv, Inc. (depositary receipt) (United States of America, Auto Components) | 2.6 | 0.0 |
| Vostok New Ventures Ltd. (depositary receipt) (Bermuda, Capital Markets) | 2.6 | 2.7 |
| Unilever NV (Certificaten Van Aandelen) (Bearer) (Netherlands, Personal Products) | 2.4 | 0.0 |
| Svenska Cellulosa AB (SCA) (B Shares) (Sweden, Household Products) | 2.2 | 2.2 |
| Koninklijke Philips Electronics NV (Netherlands, Industrial Conglomerates) | 2.2 | 3.8 |
| LEG Immobilien AG (Germany, Real Estate Management & Development) | 2.2 | 0.9 |
| | 27.7 | |
Top Market Sectors as of April 30, 2017
| | % of fund's net assets | % of fund's net assets 6 months ago |
| Industrials | 19.4 | 22.2 |
| Financials | 18.6 | 21.1 |
| Consumer Discretionary | 17.0 | 12.7 |
| Health Care | 12.6 | 12.4 |
| Information Technology | 12.2 | 16.3 |
| Consumer Staples | 7.6 | 7.8 |
| Materials | 6.4 | 2.4 |
| Real Estate | 3.3 | 2.0 |
| Utilities | 1.6 | 1.2 |
| Energy | 0.0 | 1.5 |
Percentages shown as 0.0% may reflect amounts less than 0.05%.
Fidelity® Europe Fund
Investments April 30, 2017 (Unaudited)
Showing Percentage of Net Assets
| Common Stocks - 96.1% | | | |
| | | Shares | Value |
| Bailiwick of Jersey - 1.8% | | | |
| Shire PLC | | 359,100 | $21,172,099 |
| Bermuda - 3.4% | | | |
| Vostok Emerging Finance Ltd. (depository receipt) (a)(b)(c) | | 53,380,307 | 9,883,791 |
| Vostok New Ventures Ltd. (depositary receipt) (a)(b) | | 3,842,161 | 29,931,143 |
|
| TOTAL BERMUDA | | | 39,814,934 |
|
| Denmark - 3.5% | | | |
| Nets A/S (d) | | 918,000 | 16,697,631 |
| Novozymes A/S Series B | | 380,100 | 16,421,411 |
| Scandinavian Tobacco Group A/S | | 424,443 | 7,409,454 |
|
| TOTAL DENMARK | | | 40,528,496 |
|
| Finland - 0.1% | | | |
| Valmet Corp. | | 57,679 | 1,051,141 |
| France - 10.4% | | | |
| Capgemini SA | | 235,900 | 23,618,779 |
| Havas SA | | 2,550,000 | 23,580,023 |
| Rubis | | 188,400 | 19,143,306 |
| Thales SA | | 224,000 | 23,551,189 |
| The Vicat Group | | 158,300 | 11,261,808 |
| Wendel SA | | 152,800 | 21,413,154 |
|
| TOTAL FRANCE | | | 122,568,259 |
|
| Germany - 15.0% | | | |
| Bertrandt AG (a) | | 85,700 | 8,949,753 |
| Brenntag AG | | 155,000 | 9,191,731 |
| CompuGroup Medical AG | | 243,325 | 11,980,437 |
| CTS Eventim AG | | 624,196 | 24,045,961 |
| Fresenius Medical Care AG & Co. KGaA | | 160,000 | 14,203,087 |
| LEG Immobilien AG | | 299,746 | 25,748,840 |
| MTU Aero Engines Holdings AG | | 124,800 | 17,897,112 |
| SAP AG | | 501,109 | 50,194,109 |
| Vonovia SE | | 370,800 | 13,424,030 |
|
| TOTAL GERMANY | | | 175,635,060 |
|
| Ireland - 3.5% | | | |
| DCC PLC (United Kingdom) | | 149,700 | 13,824,460 |
| Ryanair Holdings PLC sponsored ADR (b) | | 152,467 | 14,016,291 |
| United Drug PLC (United Kingdom) | | 1,416,741 | 13,707,173 |
|
| TOTAL IRELAND | | | 41,547,924 |
|
| Italy - 6.2% | | | |
| Banca Generali SpA | | 418,800 | 12,039,087 |
| Buzzi Unicem SpA | | 490,500 | 12,609,519 |
| Intesa Sanpaolo SpA | | 4,144,800 | 12,099,096 |
| Prada SpA | | 3,455,400 | 16,214,506 |
| UniCredit SpA | | 1,199,100 | 19,514,324 |
|
| TOTAL ITALY | | | 72,476,532 |
|
| Luxembourg - 0.2% | | | |
| B&M European Value Retail S.A. | | 551,621 | 2,407,729 |
| Malta - 0.7% | | | |
| Kambi Group PLC (a)(b) | | 764,217 | 7,851,574 |
| Netherlands - 7.6% | | | |
| CSM NV (exchangeable) | | 301,832 | 9,370,390 |
| Intertrust NV | | 725,025 | 14,531,763 |
| Koninklijke Philips Electronics NV | | 763,400 | 26,362,101 |
| Koninklijke Wessanen NV (a) | | 799,800 | 11,948,812 |
| Unilever NV (Certificaten Van Aandelen) (Bearer) | | 527,000 | 27,607,153 |
|
| TOTAL NETHERLANDS | | | 89,820,219 |
|
| Norway - 3.1% | | | |
| Orkla ASA (a) | | 1,410,200 | 12,769,980 |
| Schibsted ASA (A Shares) | | 970,800 | 24,139,972 |
|
| TOTAL NORWAY | | | 36,909,952 |
|
| Spain - 4.7% | | | |
| Amadeus IT Holding SA Class A | | 296,300 | 15,976,600 |
| CaixaBank SA | | 2,082,500 | 9,455,473 |
| Grifols SA | | 497,800 | 13,369,261 |
| Prosegur Cash SA | | 6,419,600 | 16,363,316 |
|
| TOTAL SPAIN | | | 55,164,650 |
|
| Sweden - 14.2% | | | |
| AF AB (B Shares) (a) | | 132,500 | 2,788,434 |
| Dometic Group AB | | 2,921,200 | 21,767,265 |
| Getinge AB (B Shares) | | 2,003,100 | 39,146,987 |
| Indutrade AB | | 1,079,000 | 25,497,014 |
| Investor AB (B Shares) | | 726,024 | 33,189,247 |
| Nobia AB | | 636,200 | 6,583,014 |
| Pandox AB | | 711,347 | 11,942,386 |
| Svenska Cellulosa AB (SCA) (B Shares) | | 797,500 | 26,417,362 |
|
| TOTAL SWEDEN | | | 167,331,709 |
|
| Switzerland - 6.0% | | | |
| ABB Ltd. (Reg.) | | 850,440 | 20,839,407 |
| EDAG Engineering Group AG | | 297,000 | 5,482,082 |
| Panalpina Welttransport Holding AG (a) | | 151,670 | 20,075,316 |
| Swatch Group AG (Bearer) | | 58,680 | 23,489,692 |
|
| TOTAL SWITZERLAND | | | 69,886,497 |
|
| United Kingdom - 13.1% | | | |
| British American Tobacco PLC (United Kingdom) | | 164,100 | 11,087,149 |
| Bunzl PLC | | 377,758 | 11,781,674 |
| Dechra Pharmaceuticals PLC | | 879,100 | 19,242,514 |
| Diploma PLC | | 1,204,800 | 17,305,468 |
| Essentra PLC | | 1,724,000 | 12,091,288 |
| International Personal Finance PLC | | 4,916,572 | 10,220,550 |
| Micro Focus International PLC | | 422,900 | 14,175,513 |
| NCC Group Ltd. (a) | | 11,819,524 | 21,814,823 |
| Prudential PLC | | 1,633,202 | 36,247,061 |
|
| TOTAL UNITED KINGDOM | | | 153,966,040 |
|
| United States of America - 2.6% | | | |
| Autoliv, Inc. (depositary receipt) (a) | | 300,900 | 30,116,158 |
| TOTAL COMMON STOCKS | | | |
| (Cost $1,008,804,438) | | | 1,128,248,973 |
|
| Nonconvertible Preferred Stocks - 2.6% | | | |
| Italy - 1.1% | | | |
| Buzzi Unicem SpA (Risparmio Shares) | | 889,200 | 13,143,977 |
| Spain - 1.5% | | | |
| Grifols SA Class B | | 848,950 | 18,120,696 |
| TOTAL NONCONVERTIBLE PREFERRED STOCKS | | | |
| (Cost $23,516,306) | | | 31,264,673 |
|
| Money Market Funds - 5.5% | | | |
| Fidelity Cash Central Fund, 0.85% (e) | | 34,116,993 | 34,123,816 |
| Fidelity Securities Lending Cash Central Fund 0.86% (e)(f) | | 30,306,720 | 30,309,751 |
| TOTAL MONEY MARKET FUNDS | | | |
| (Cost $64,434,039) | | | 64,433,567 |
| TOTAL INVESTMENT PORTFOLIO - 104.2% | | | |
| (Cost $1,096,754,783) | | | 1,223,947,213 |
| NET OTHER ASSETS (LIABILITIES) - (4.2)% | | | (49,505,391) |
| NET ASSETS - 100% | | | $1,174,441,822 |
Categorizations in the Schedule of Investments are based on country or territory of incorporation.
Legend
(a) Security or a portion of the security is on loan at period end.
(b) Non-income producing
(c) Affiliated company
(d) Security exempt from registration under Rule 144A of the Securities Act of 1933. These securities may be resold in transactions exempt from registration, normally to qualified institutional buyers. At the end of the period, the value of these securities amounted to $16,697,631 or 1.4% of net assets.
(e) Affiliated fund that is generally available only to investment companies and other accounts managed by Fidelity Investments. The rate quoted is the annualized seven-day yield of the fund at period end. A complete unaudited listing of the fund's holdings as of its most recent quarter end is available upon request. In addition, each Fidelity Central Fund's financial statements are available on the SEC's website or upon request.
(f) Investment made with cash collateral received from securities on loan.
Affiliated Central Funds
Information regarding fiscal year to date income earned by the Fund from investments in Fidelity Central Funds is as follows:
| Fund | Income earned |
| Fidelity Cash Central Fund | $30,823 |
| Fidelity Securities Lending Cash Central Fund | 154,957 |
| Total | $185,780 |
Other Affiliated Issuers
An affiliated company is a company in which the Fund has ownership of at least 5% of the voting securities. Fiscal year to date transactions with companies which are or were affiliates are as follows:
| Affiliate | Value, beginning of period | Purchases | Sales Proceeds | Dividend Income | Value, end of period |
| Vostok Emerging Finance Ltd. (depository receipt) | $8,746,849 | $-- | $-- | $-- | $9,883,791 |
| Total | $8,746,849 | $-- | $-- | $-- | $9,883,791 |
Investment Valuation
The following is a summary of the inputs used, as of April 30, 2017, involving the Fund's assets and liabilities carried at fair value. The inputs or methodology used for valuing securities may not be an indication of the risk associated with investing in those securities. For more information on valuation inputs, and their aggregation into the levels used below, please refer to the Investment Valuation section in the accompanying Notes to Financial Statements.
| | Valuation Inputs at Reporting Date: |
| Description | Total | Level 1 | Level 2 | Level 3 |
| Investments in Securities: | | | | |
| Equities: | | | | |
| Consumer Discretionary | $197,620,362 | $197,620,362 | $-- | $-- |
| Consumer Staples | 89,830,456 | 51,136,154 | 38,694,302 | -- |
| Financials | 217,765,696 | 159,964,066 | 57,801,630 | -- |
| Health Care | 150,942,254 | 115,567,068 | 35,375,186 | -- |
| Industrials | 227,662,854 | 180,461,346 | 47,201,508 | -- |
| Information Technology | 142,477,455 | 68,664,567 | 73,812,888 | -- |
| Materials | 74,898,393 | 74,898,393 | -- | -- |
| Real Estate | 39,172,870 | 39,172,870 | -- | -- |
| Utilities | 19,143,306 | 19,143,306 | -- | -- |
| Money Market Funds | 64,433,567 | 64,433,567 | -- | -- |
| Total Investments in Securities: | $1,223,947,213 | $971,061,699 | $252,885,514 | $-- |
The following is a summary of transfers between Level 1 and Level 2 for the period ended April 30, 2017. Transfers are assumed to have occurred at the beginning of the period, and are primarily attributable to the valuation techniques used for foreign equity securities, as discussed in the accompanying Notes to Financial Statements:
| Transfers | Total |
| Level 1 to Level 2 | $18,651,374 |
| Level 2 to Level 1 | $0 |
See accompanying notes which are an integral part of the financial statements.
Fidelity® Europe Fund
Financial Statements
Statement of Assets and Liabilities
| | | April 30, 2017 (Unaudited) |
| Assets | | |
Investment in securities, at value (including securities loaned of $28,471,055) — See accompanying schedule:
Unaffiliated issuers (cost $1,025,508,726) | $1,149,629,855 | |
| Fidelity Central Funds (cost $64,434,039) | 64,433,567 | |
| Other affiliated issuers (cost $6,812,018) | 9,883,791 | |
| Total Investments (cost $1,096,754,783) | | $1,223,947,213 |
| Foreign currency held at value (cost $92,292) | | 92,298 |
| Receivable for investments sold | | 15,131,733 |
| Receivable for fund shares sold | | 2,760,119 |
| Dividends receivable | | 4,500,931 |
| Interest receivable | | 198,554 |
| Distributions receivable from Fidelity Central Funds | | 92,119 |
| Prepaid expenses | | 765 |
| Other receivables | | 269,758 |
| Total assets | | 1,246,993,490 |
| Liabilities | | |
| Payable for investments purchased | $25,010,230 | |
| Payable for fund shares redeemed | 16,241,574 | |
| Accrued management fee | 704,228 | |
| Distribution and service plan fees payable | 13,096 | |
| Other affiliated payables | 220,251 | |
| Other payables and accrued expenses | 54,792 | |
| Collateral on securities loaned | 30,307,497 | |
| Total liabilities | | 72,551,668 |
| Net Assets | | $1,174,441,822 |
| Net Assets consist of: | | |
| Paid in capital | | $1,295,034,400 |
| Undistributed net investment income | | 3,947,009 |
| Accumulated undistributed net realized gain (loss) on investments and foreign currency transactions | | (251,671,319) |
| Net unrealized appreciation (depreciation) on investments and assets and liabilities in foreign currencies | | 127,131,732 |
| Net Assets | | $1,174,441,822 |
| Calculation of Maximum Offering Price | | |
| Class A: | | |
| Net Asset Value and redemption price per share ($16,041,580 ÷ 423,791 shares) | | $37.85 |
| Maximum offering price per share (100/94.25 of $37.85) | | $40.16 |
| Class M: | | |
| Net Asset Value and redemption price per share ($7,276,678 ÷ 191,959 shares) | | $37.91 |
| Maximum offering price per share (100/96.50 of $37.91) | | $39.28 |
| Class C: | | |
| Net Asset Value and offering price per share ($8,806,571 ÷ 233,509 shares)(a) | | $37.71 |
| Europe: | | |
| Net Asset Value, offering price and redemption price per share ($1,136,055,763 ÷ 30,021,383 shares) | | $37.84 |
| Class I: | | |
| Net Asset Value, offering price and redemption price per share ($6,261,230 ÷ 165,473 shares) | | $37.84 |
(a) Redemption price per share is equal to net asset value less any applicable contingent deferred sales charge.
See accompanying notes which are an integral part of the financial statements.
Statement of Operations
| | | Six months ended April 30, 2017 (Unaudited) |
| Investment Income | | |
| Dividends | | $9,848,230 |
| Income from Fidelity Central Funds | | 185,780 |
| Income before foreign taxes withheld | | 10,034,010 |
| Less foreign taxes withheld | | (919,231) |
| Total income | | 9,114,779 |
| Expenses | | |
| Management fee | | |
| Basic fee | $3,772,806 | |
| Performance adjustment | 57,143 | |
| Transfer agent fees | 1,046,732 | |
| Distribution and service plan fees | 78,809 | |
| Accounting and security lending fees | 251,736 | |
| Custodian fees and expenses | 57,797 | |
| Independent trustees' fees and expenses | 2,202 | |
| Registration fees | 68,257 | |
| Audit | 47,320 | |
| Legal | 3,145 | |
| Interest | 2,747 | |
| Miscellaneous | 4,515 | |
| Total expenses before reductions | 5,393,209 | |
| Expense reductions | (436,283) | 4,956,926 |
| Net investment income (loss) | | 4,157,853 |
| Realized and Unrealized Gain (Loss) | | |
| Net realized gain (loss) on: | | |
| Investment securities: | | |
| Unaffiliated issuers | (32,144,735) | |
| Fidelity Central Funds | 144 | |
| Foreign currency transactions | (228,800) | |
| Total net realized gain (loss) | | (32,373,391) |
Change in net unrealized appreciation (depreciation) on:
Investment securities | 155,051,748 | |
| Assets and liabilities in foreign currencies | 76,961 | |
| Total change in net unrealized appreciation (depreciation) | | 155,128,709 |
| Net gain (loss) | | 122,755,318 |
| Net increase (decrease) in net assets resulting from operations | | $126,913,171 |
See accompanying notes which are an integral part of the financial statements.
Statement of Changes in Net Assets
| | Six months ended April 30, 2017 (Unaudited) | Year ended October 31, 2016 |
| Increase (Decrease) in Net Assets | | |
| Operations | | |
| Net investment income (loss) | $4,157,853 | $11,518,138 |
| Net realized gain (loss) | (32,373,391) | (10,272,498) |
| Change in net unrealized appreciation (depreciation) | 155,128,709 | (89,926,922) |
| Net increase (decrease) in net assets resulting from operations | 126,913,171 | (88,681,282) |
| Distributions to shareholders from net investment income | (11,727,745) | (15,981,681) |
| Distributions to shareholders from net realized gain | (3,911,424) | (5,885,187) |
| Total distributions | (15,639,169) | (21,866,868) |
| Share transactions - net increase (decrease) | (41,914,148) | (219,773,724) |
| Redemption fees | 405 | 22,478 |
| Total increase (decrease) in net assets | 69,360,259 | (330,299,396) |
| Net Assets | | |
| Beginning of period | 1,105,081,563 | 1,435,380,959 |
| End of period | $1,174,441,822 | $1,105,081,563 |
| Other Information | | |
| Undistributed net investment income end of period | $3,947,009 | $11,516,901 |
See accompanying notes which are an integral part of the financial statements.
Financial Highlights — Fidelity Europe Fund Class A
| | Six months ended (Unaudited) April 30, | Years ended October 31, | | |
| | 2017 | 2016 | 2015 | 2014 A |
| Selected Per–Share Data | | | | |
| Net asset value, beginning of period | $34.17 | $37.06 | $36.24 | $39.45 |
| Income from Investment Operations | | | | |
| Net investment income (loss)B | .08 | .22 | .37 | .47 |
| Net realized and unrealized gain (loss) | 3.95 | (2.67) | 1.29 | (3.68) |
| Total from investment operations | 4.03 | (2.45) | 1.66 | (3.21) |
| Distributions from net investment income | (.22) | (.29) | (.84) | – |
| Distributions from net realized gain | (.13) | (.15) | – | – |
| Total distributions | (.35) | (.44) | (.84) | – |
| Redemption fees added to paid in capitalB,C | – | – | – | – |
| Net asset value, end of period | $37.85 | $34.17 | $37.06 | $36.24 |
| Total ReturnD,E,F | 11.95% | (6.69)% | 4.63% | (8.14)% |
| Ratios to Average Net AssetsG,H | | | | |
| Expenses before reductions | 1.31%I | 1.39% | 1.33% | 1.35%I |
| Expenses net of fee waivers, if any | 1.31%I | 1.39% | 1.33% | 1.35%I |
| Expenses net of all reductions | 1.23%I | 1.38% | 1.31% | 1.35%I |
| Net investment income (loss) | .45%I | .62% | .98% | 1.94%I |
| Supplemental Data | | | | |
| Net assets, end of period (000 omitted) | $16,042 | $17,267 | $23,381 | $23,633 |
| Portfolio turnover rateJ | 96%I | 62% | 87% | 80%K |
A For the period March 18, 2014 (commencement of sale of shares) to October 31, 2014.
B Calculated based on average shares outstanding during the period.
C Amount represents less than $.005 per share.
D Total returns for periods of less than one year are not annualized.
E Total returns would have been lower if certain expenses had not been reduced during the applicable periods shown.
F Total returns do not include the effect of the sales charges.
G Fees and expenses of any underlying Fidelity Central Funds are not included in the Fund's expense ratio. The Fund indirectly bears its proportionate share of the expenses of any underlying Fidelity Central Funds.
H Expense ratios reflect operating expenses of the class. Expenses before reductions do not reflect amounts reimbursed by the investment adviser or reductions from brokerage service arrangements or reductions from other expense offset arrangements and do not represent the amount paid by the class during periods when reimbursements or reductions occur. Expenses net of fee waivers reflect expenses after reimbursement by the investment adviser but prior to reductions from brokerage service arrangements or other expense offset arrangements. Expenses net of all reductions represent the net expenses paid by the class.
I Annualized
J Amount does not include the portfolio activity of any underlying Fidelity Central Funds.
K The portfolio turnover rate does not include the assets acquired in the merger.
See accompanying notes which are an integral part of the financial statements.
Financial Highlights — Fidelity Europe Fund Class M
| | Six months ended (Unaudited) April 30, | Years ended October 31, | | |
| | 2017 | 2016 | 2015 | 2014 A |
| Selected Per–Share Data | | | | |
| Net asset value, beginning of period | $34.13 | $36.94 | $36.18 | $39.45 |
| Income from Investment Operations | | | | |
| Net investment income (loss)B | .03 | .11 | .26 | .40 |
| Net realized and unrealized gain (loss) | 3.97 | (2.67) | 1.29 | (3.67) |
| Total from investment operations | 4.00 | (2.56) | 1.55 | (3.27) |
| Distributions from net investment income | (.09) | (.09) | (.79) | – |
| Distributions from net realized gain | (.13) | (.15) | – | – |
| Total distributions | (.22) | (.25)C | (.79) | – |
| Redemption fees added to paid in capitalB,D | – | – | – | – |
| Net asset value, end of period | $37.91 | $34.13 | $36.94 | $36.18 |
| Total ReturnE,F,G | 11.80% | (6.99)% | 4.33% | (8.29)% |
| Ratios to Average Net AssetsH,I | | | | |
| Expenses before reductions | 1.60%J | 1.70% | 1.61% | 1.62%J |
| Expenses net of fee waivers, if any | 1.60%J | 1.70% | 1.61% | 1.61%J |
| Expenses net of all reductions | 1.52%J | 1.68% | 1.59% | 1.61%J |
| Net investment income (loss) | .16%J | .31% | .70% | 1.68%J |
| Supplemental Data | | | | |
| Net assets, end of period (000 omitted) | $7,277 | $6,980 | $9,632 | $13,679 |
| Portfolio turnover rateK | 96%J | 62% | 87% | 80%L |
A For the period March 18, 2014 (commencement of sale of shares) to October 31, 2014.
B Calculated based on average shares outstanding during the period.
C Total distributions of $.25 per share is comprised of distributions from net investment income of $.092 and distributions from net realized gain of $.154 per share.
D Amount represents less than $.005 per share.
E Total returns for periods of less than one year are not annualized.
F Total returns would have been lower if certain expenses had not been reduced during the applicable periods shown.
G Total returns do not include the effect of the sales charges.
H Fees and expenses of any underlying Fidelity Central Funds are not included in the Fund's expense ratio. The Fund indirectly bears its proportionate share of the expenses of any underlying Fidelity Central Funds.
I Expense ratios reflect operating expenses of the class. Expenses before reductions do not reflect amounts reimbursed by the investment adviser or reductions from brokerage service arrangements or reductions from other expense offset arrangements and do not represent the amount paid by the class during periods when reimbursements or reductions occur. Expenses net of fee waivers reflect expenses after reimbursement by the investment adviser but prior to reductions from brokerage service arrangements or other expense offset arrangements. Expenses net of all reductions represent the net expenses paid by the class.
J Annualized
K Amount does not include the portfolio activity of any underlying Fidelity Central Funds.
L The portfolio turnover rate does not include the assets acquired in the merger.
See accompanying notes which are an integral part of the financial statements.
Financial Highlights — Fidelity Europe Fund Class C
| | Six months ended (Unaudited) April 30, | Years ended October 31, | | |
| | 2017 | 2016 | 2015 | 2014 A |
| Selected Per–Share Data | | | | |
| Net asset value, beginning of period | $33.82 | $36.81 | $36.07 | $39.45 |
| Income from Investment Operations | | | | |
| Net investment income (loss)B | (.06) | (.06) | .07 | .29 |
| Net realized and unrealized gain (loss) | 3.95 | (2.65) | 1.29 | (3.67) |
| Total from investment operations | 3.89 | (2.71) | 1.36 | (3.38) |
| Distributions from net investment income | – | (.12) | (.62) | – |
| Distributions from net realized gain | – | (.15) | – | – |
| Total distributions | – | (.28)C | (.62) | – |
| Redemption fees added to paid in capitalB,D | – | – | – | – |
| Net asset value, end of period | $37.71 | $33.82 | $36.81 | $36.07 |
| Total ReturnE,F,G | 11.50% | (7.43)% | 3.79% | (8.57)% |
| Ratios to Average Net AssetsH,I | | | | |
| Expenses before reductions | 2.09%J | 2.18% | 2.13% | 2.10%J |
| Expenses net of fee waivers, if any | 2.09%J | 2.18% | 2.13% | 2.10%J |
| Expenses net of all reductions | 2.01%J | 2.17% | 2.11% | 2.10%J |
| Net investment income (loss) | (.32)%J | (.17)% | .18% | 1.19%J |
| Supplemental Data | | | | |
| Net assets, end of period (000 omitted) | $8,807 | $9,007 | $11,151 | $6,818 |
| Portfolio turnover rateK | 96%J | 62% | 87% | 80%L |
A For the period March 18, 2014 (commencement of sale of shares) to October 31, 2014.
B Calculated based on average shares outstanding during the period.
C Total distributions of $.28 per share is comprised of distributions from net investment income of $.123 and distributions from net realized gain of $.154 per share.
D Amount represents less than $.005 per share.
E Total returns for periods of less than one year are not annualized.
F Total returns would have been lower if certain expenses had not been reduced during the applicable periods shown.
G Total returns do not include the effect of the contingent deferred sales charge.
H Fees and expenses of any underlying Fidelity Central Funds are not included in the Fund's expense ratio. The Fund indirectly bears its proportionate share of the expenses of any underlying Fidelity Central Funds.
I Expense ratios reflect operating expenses of the class. Expenses before reductions do not reflect amounts reimbursed by the investment adviser or reductions from brokerage service arrangements or reductions from other expense offset arrangements and do not represent the amount paid by the class during periods when reimbursements or reductions occur. Expenses net of fee waivers reflect expenses after reimbursement by the investment adviser but prior to reductions from brokerage service arrangements or other expense offset arrangements. Expenses net of all reductions represent the net expenses paid by the class.
J Annualized
K Amount does not include the portfolio activity of any underlying Fidelity Central Funds.
L The portfolio turnover rate does not include the assets acquired in the merger.
See accompanying notes which are an integral part of the financial statements.
Financial Highlights — Fidelity Europe Fund
| | Six months ended (Unaudited) April 30, | Years ended October 31, | | | | |
| | 2017 | 2016 | 2015 | 2014 | 2013 | 2012 |
| Selected Per–Share Data | | | | | | |
| Net asset value, beginning of period | $34.26 | $37.19 | $36.32 | $37.92 | $30.15 | $27.67 |
| Income from Investment Operations | | | | | | |
| Net investment income (loss)A | .14 | .33 | .48 | .94B | .61 | .64 |
| Net realized and unrealized gain (loss) | 3.95 | (2.68) | 1.30 | (2.00) | 7.87 | 2.45 |
| Total from investment operations | 4.09 | (2.35) | 1.78 | (1.06) | 8.48 | 3.09 |
| Distributions from net investment income | (.38) | (.43) | (.91) | (.52) | (.70) | (.60) |
| Distributions from net realized gain | (.13) | (.15) | – | (.02) | (.01) | (.02) |
| Total distributions | (.51) | (.58) | (.91) | (.54) | (.71) | (.61)C |
| Redemption fees added to paid in capitalA,D | – | – | – | – | – | – |
| Net asset value, end of period | $37.84 | $34.26 | $37.19 | $36.32 | $37.92 | $30.15 |
| Total ReturnE,F | 12.15% | (6.42)% | 4.97% | (2.82)% | 28.71% | 11.53% |
| Ratios to Average Net AssetsG,H | | | | | | |
| Expenses before reductions | .98%I | 1.07% | 1.03% | .97% | 1.06% | .83% |
| Expenses net of fee waivers, if any | .98%I | 1.07% | 1.03% | .97% | 1.05% | .83% |
| Expenses net of all reductions | .90%I | 1.06% | 1.01% | .96% | 1.02% | .80% |
| Net investment income (loss) | .78%I | .94% | 1.28% | 2.43%B | 1.82% | 2.33% |
| Supplemental Data | | | | | | |
| Net assets, end of period (000 omitted) | $1,136,056 | $1,066,488 | $1,384,134 | $1,237,047 | $957,048 | $602,520 |
| Portfolio turnover rateJ | 96%I | 62% | 87% | 80%K | 59% | 127% |
A Calculated based on average shares outstanding during the period.
B Net Investment income per share reflects a large, non-recurring dividend which amounted to $.19 per share. Excluding this non-recurring dividend, the ratio of net investment income (loss) to average net assets would have been 1.93%.
C Total distributions of $.61 per share is comprised of distributions from net investment income of $.595 and distributions from net realized gain of $.017 per share.
D Amount represents less than $.005 per share.
E Total returns for periods of less than one year are not annualized.
F Total returns would have been lower if certain expenses had not been reduced during the applicable periods shown.
G Fees and expenses of any underlying Fidelity Central Funds are not included in the Fund's expense ratio. The Fund indirectly bears its proportionate share of the expenses of any underlying Fidelity Central Funds.
H Expense ratios reflect operating expenses of the class. Expenses before reductions do not reflect amounts reimbursed by the investment adviser or reductions from brokerage service arrangements or reductions from other expense offset arrangements and do not represent the amount paid by the class during periods when reimbursements or reductions occur. Expenses net of fee waivers reflect expenses after reimbursement by the investment adviser but prior to reductions from brokerage service arrangements or other expense offset arrangements. Expenses net of all reductions represent the net expenses paid by the class.
I Annualized
J Amount does not include the portfolio activity of any underlying Fidelity Central Funds.
K The portfolio turnover rate does not include the assets acquired in the merger.
See accompanying notes which are an integral part of the financial statements.
Financial Highlights — Fidelity Europe Fund Class I
| | Six months ended (Unaudited) April 30, | Years ended October 31, | | |
| | 2017 | 2016 | 2015 | 2014 A |
| Selected Per–Share Data | | | | |
| Net asset value, beginning of period | $34.29 | $37.21 | $36.32 | $39.45 |
| Income from Investment Operations | | | | |
| Net investment income (loss)B | .14 | .35 | .50 | .56 |
| Net realized and unrealized gain (loss) | 3.94 | (2.67) | 1.30 | (3.69) |
| Total from investment operations | 4.08 | (2.32) | 1.80 | (3.13) |
| Distributions from net investment income | (.41) | (.45) | (.91) | – |
| Distributions from net realized gain | (.13) | (.15) | – | – |
| Total distributions | (.53)C | (.60) | (.91) | – |
| Redemption fees added to paid in capitalB,D | – | – | – | – |
| Net asset value, end of period | $37.84 | $34.29 | $37.21 | $36.32 |
| Total ReturnE,F | 12.14% | (6.33)% | 5.02% | (7.93)% |
| Ratios to Average Net AssetsG,H | | | | |
| Expenses before reductions | .97%I | 1.01% | .98% | .97%I |
| Expenses net of fee waivers, if any | .97%I | 1.01% | .98% | .97%I |
| Expenses net of all reductions | .89%I | 1.00% | .96% | .96%I |
| Net investment income (loss) | .79%I | 1.00% | 1.33% | 2.33%I |
| Supplemental Data | | | | |
| Net assets, end of period (000 omitted) | $6,261 | $5,340 | $6,552 | $5,666 |
| Portfolio turnover rateJ | 96%I | 62% | 87% | 80%K |
A For the period March 18, 2014 (commencement of sale of shares) to October 31, 2014.
B Calculated based on average shares outstanding during the period.
C Total distributions of $.53 per share is comprised of distributions from net investment income of $.408 and distributions from net realized gain of $.126 per share.
D Amount represents less than $.005 per share.
E Total returns for periods of less than one year are not annualized.
F Total returns would have been lower if certain expenses had not been reduced during the applicable periods shown.
G Fees and expenses of any underlying Fidelity Central Funds are not included in the Fund's expense ratio. The Fund indirectly bears its proportionate share of the expenses of any underlying Fidelity Central Funds.
H Expense ratios reflect operating expenses of the class. Expenses before reductions do not reflect amounts reimbursed by the investment adviser or reductions from brokerage service arrangements or reductions from other expense offset arrangements and do not represent the amount paid by the class during periods when reimbursements or reductions occur. Expenses net of fee waivers reflect expenses after reimbursement by the investment adviser but prior to reductions from brokerage service arrangements or other expense offset arrangements. Expenses net of all reductions represent the net expenses paid by the class.
I Annualized
J Amount does not include the portfolio activity of any underlying Fidelity Central Funds.
K The portfolio turnover rate does not include the assets acquired in the merger.
See accompanying notes which are an integral part of the financial statements.
Notes to Financial Statements (Unaudited)
For the period ended April 30, 2017
1. Organization.
Fidelity Europe Fund (the Fund) is a fund of Fidelity Investment Trust (the Trust) and is authorized to issue an unlimited number of shares. The Trust is registered under the Investment Company Act of 1940, as amended (the 1940 Act), as an open-end management investment company organized as a Massachusetts business trust. The Fund offers Class A, Class M (formerly Class T), Class C, Europe and Class I shares, each of which has equal rights as to assets and voting privileges. Each class has exclusive voting rights with respect to matters that affect that class.
After the close of business on June 24, 2016, all outstanding Class B shares were converted to Class A shares. All prior fiscal period dollar and share amounts for Class B presented in the Notes to Financial Statements are for the period November 1, 2015 through June 24, 2016.
2. Investments in Fidelity Central Funds.
The Fund invests in Fidelity Central Funds, which are open-end investment companies generally available only to other investment companies and accounts managed by the investment adviser and its affiliates. The Fund's Schedule of Investments list each of the Fidelity Central Funds held as of period end, if any, as an investment of the Fund, but does not include the underlying holdings of each Fidelity Central Fund. As an Investing Fund, the/each Fund indirectly bears its proportionate share of the expenses of the underlying Fidelity Central Funds.
The Money Market Central Funds seek preservation of capital and current income and are managed by Fidelity Investments Money Management, Inc. (FIMM), an affiliate of the investment adviser. Annualized expenses of the Money Market Central Funds as of their most recent shareholder report date are less than .005%.
A complete unaudited list of holdings for each Fidelity Central Fund is available upon request or at the Securities and Exchange Commission (the SEC) website at www.sec.gov. In addition, the financial statements of the Fidelity Central Funds are available on the SEC website or upon request.
3. Significant Accounting Policies.
The Fund is an investment company and applies the accounting and reporting guidance of the Financial Accounting Standards Board (FASB) Accounting Standards Codification Topic 946 Financial Services – Investments Companies. The financial statements have been prepared in conformity with accounting principles generally accepted in the United States of America (GAAP), which require management to make certain estimates and assumptions at the date of the financial statements. Actual results could differ from those estimates. Subsequent events, if any, through the date that the financial statements were issued have been evaluated in the preparation of the financial statements. The following summarizes the significant accounting policies of the Fund:
Investment Valuation. Investments are valued as of 4:00 p.m. Eastern time on the last calendar day of the period. The Board of Trustees (the Board) has delegated the day to day responsibility for the valuation of the Fund's investments to the Fair Value Committee (the Committee) established by the Fund's investment adviser. In accordance with valuation policies and procedures approved by the Board, the Fund attempts to obtain prices from one or more third party pricing vendors or brokers to value its investments. When current market prices, quotations or currency exchange rates are not readily available or reliable, investments will be fair valued in good faith by the Committee, in accordance with procedures adopted by the Board. Factors used in determining fair value vary by investment type and may include market or investment specific events. The frequency with which these procedures are used cannot be predicted and they may be utilized to a significant extent. The Committee oversees the Fund's valuation policies and procedures and reports to the Board on the Committee's activities and fair value determinations. The Board monitors the appropriateness of the procedures used in valuing the Fund's investments and ratifies the fair value determinations of the Committee.
The Fund categorizes the inputs to valuation techniques used to value its investments into a disclosure hierarchy consisting of three levels as shown below:
- Level 1 – quoted prices in active markets for identical investments
- Level 2 – other significant observable inputs (including quoted prices for similar investments, interest rates, prepayment speeds, etc.)
- Level 3 – unobservable inputs (including the Fund's own assumptions based on the best information available)
Valuation techniques used to value the Fund's investments by major category are as follows:
Equity securities, including restricted securities, for which market quotations are readily available, are valued at the last reported sale price or official closing price as reported by a third party pricing vendor on the primary market or exchange on which they are traded and are categorized as Level 1 in the hierarchy. In the event there were no sales during the day or closing prices are not available, securities are valued at the last quoted bid price or may be valued using the last available price and are generally categorized as Level 2 in the hierarchy. For foreign equity securities, when market or security specific events arise, comparisons to the valuation of American Depositary Receipts (ADRs), futures contracts, Exchange-Traded Funds (ETFs) and certain indexes as well as quoted prices for similar securities may be used and would be categorized as Level 2 in the hierarchy. Utilizing these techniques may result in transfers between Level 1 and Level 2. For equity securities, including restricted securities, where observable inputs are limited, assumptions about market activity and risk are used and these securities may be categorized as Level 3 in the hierarchy.
Investments in open-end mutual funds, including the Fidelity Central Funds, are valued at their closing net asset value (NAV) each business day and are categorized as Level 1 in the hierarchy.
Changes in valuation techniques may result in transfers in or out of an assigned level within the disclosure hierarchy. The aggregate value of investments by input level as of April 30, 2017, including information on transfers between Levels 1 and 2, is included at the end of the Fund's Schedule of Investments.
Foreign Currency. The Fund may use foreign currency contracts to facilitate transactions in foreign-denominated securities. Gains and losses from these transactions may arise from changes in the value of the foreign currency or if the counterparties do not perform under the contracts' terms.
Foreign-denominated assets, including investment securities, and liabilities are translated into U.S. dollars at the exchange rates at period end. Purchases and sales of investment securities, income and dividends received and expenses denominated in foreign currencies are translated into U.S. dollars at the exchange rate in effect on the transaction date.
The effects of exchange rate fluctuations on investments are included with the net realized and unrealized gain (loss) on investment securities. Other foreign currency transactions resulting in realized and unrealized gain (loss) are disclosed separately.
Investment Transactions and Income. For financial reporting purposes, the Fund's investment holdings and NAV include trades executed through the end of the last business day of the period. The NAV per share for processing shareholder transactions is calculated as of the close of business of the New York Stock Exchange (NYSE), normally 4:00 p.m. Eastern time and includes trades executed through the end of the prior business day. Gains and losses on securities sold are determined on the basis of identified cost and may include proceeds received from litigation. Dividend income is recorded on the ex-dividend date, except for certain dividends from foreign securities where the ex-dividend date may have passed, which are recorded as soon as the Fund is informed of the ex-dividend date. Non-cash dividends included in dividend income, if any, are recorded at the fair market value of the securities received. Income and capital gain distributions from Fidelity Central Funds, if any, are recorded on the ex-dividend date. Investment income is recorded net of foreign taxes withheld where recovery of such taxes is uncertain.
Class Allocations and Expenses. Investment income, realized and unrealized capital gains and losses, common expenses of the Fund, and certain fund-level expense reductions, if any, are allocated daily on a pro-rata basis to each class based on the relative net assets of each class to the total net assets of the Fund. Each class differs with respect to transfer agent and distribution and service plan fees incurred. Certain expense reductions may also differ by class. For the reporting period, the allocated portion of income and expenses to each class as a percent of its average net assets may vary due to the timing of recording these transactions in relation to fluctuating net assets of the classes. Expenses directly attributable to a fund are charged to that fund. Expenses attributable to more than one fund are allocated among the respective funds on the basis of relative net assets or other appropriate methods. Expense estimates are accrued in the period to which they relate and adjustments are made when actual amounts are known.
Income Tax Information and Distributions to Shareholders. Each year, the Fund intends to qualify as a regulated investment company under Subchapter M of the Internal Revenue Code, including distributing substantially all of its taxable income and realized gains. As a result, no provision for U.S. Federal income taxes is required. The Fund Portfolio files a U.S. federal tax return, in addition to state and local tax returns as required. The Fund's federal income tax returns are subject to examination by the Internal Revenue Service (IRS) for a period of three fiscal years after they are filed. State and local tax returns may be subject to examination for an additional fiscal year depending on the jurisdiction. Foreign taxes are provided for based on the Fund's understanding of the tax rules and rates that exist in the foreign markets in which it invests.
Distributions are declared and recorded on the ex-dividend date. Income dividends and capital gain distributions are declared separately for each class. Income and capital gain distributions are determined in accordance with income tax regulations, which may differ from GAAP.
Capital accounts within the financial statements are adjusted for permanent book-tax differences. These adjustments have no impact on net assets or the results of operations. Capital accounts are not adjusted for temporary book-tax differences which will reverse in a subsequent period.
Book-tax differences are primarily due to foreign currency transactions, passive foreign investment companies (PFIC), deferred trustees compensation, expiring capital loss carryforwards, capital loss carryforwards and losses deferred due to wash sales.
The federal tax cost of investment securities and unrealized appreciation (depreciation) as of period end were as follows:
| Gross unrealized appreciation | $169,361,273 |
| Gross unrealized depreciation | (50,019,993) |
| Net unrealized appreciation (depreciation) on securities | $119,341,280 |
| Tax cost | $1,104,605,933 |
Capital loss carryforwards are only available to offset future capital gains of the Fund to the extent provided by regulations and may be limited. Under the Regulated Investment Company Modernization Act of 2010 (the Act), the Fund is permitted to carry forward capital losses incurred in taxable years beginning after December 22, 2010 for an unlimited period and such capital losses are required to be used prior to any losses that expire. The capital loss carryforward information presented below, including any applicable limitation, is estimated as of prior fiscal period end and is subject to adjustment.
| Fiscal year of expiration | |
| 2017 | $(199,044,876) |
| No expiration | |
| Short-term | (11,846,683) |
| Total capital loss carryforward | $(210,891,559) |
In addition, due to large redemptions in a prior period, $199,044,876 of capital losses will be limited to approximately $32,029,274 per year.
Short-Term Trading (Redemption) Fees. Shares held by investors in the Fund less than 30 days may have been subject to a redemption fee equal to 1.00% of the NAV of shares redeemed. All redemption fees, which reduce the proceeds of the shareholder redemption, are retained by the Fund and accounted for as an addition to paid in capital. In November 2016, the Board of Trustees approved the elimination of these redemption fees effective December 12, 2016.
4. Purchases and Sales of Investments.
Purchases and sales of securities, other than short-term securities, aggregated $521,855,586 and $586,140,249, respectively.
5. Fees and Other Transactions with Affiliates.
Management Fee. Fidelity Management & Research Company (the investment adviser) and its affiliates provide the Fund with investment management related services for which the Fund pays a monthly management fee. The management fee is the sum of an individual fund fee rate that is based on an annual rate of .45% of the Fund's average net assets and an annualized group fee rate that averaged .25% during the period. The group fee rate is based upon the average net assets of all the mutual funds advised by the investment adviser, including any mutual funds previously advised by the investment adviser that are currently advised by Fidelity SelectCo, LLC, an affiliate of the investment adviser. The group fee rate decreases as assets under management increase and increases as assets under management decrease. In addition, the management fee is subject to a performance adjustment (up to a maximum of +/- .20% of the Fund's average net assets over a 36 month performance period). The upward or downward adjustment to the management fee is based on the relative investment performance of Europe as compared to its benchmark index, the MSCI Europe Index, over the same 36 month performance period. For the reporting period, the total annualized management fee rate, including the performance adjustment, was .71% of the Fund's average net assets. The performance adjustment included in the management fee rate may be higher or lower than the maximum performance adjustment rate due to the difference between the average net assets for the reporting and performance periods.
Distribution and Service Plan Fees. In accordance with Rule 12b-1 of the 1940 Act, the Fund has adopted separate Distribution and Service Plans for each class of shares. Certain classes pay Fidelity Distributors Corporation (FDC), an affiliate of the investment adviser, separate Distribution and Service Fees, each of which is based on an annual percentage of each class' average net assets. In addition, FDC may pay financial intermediaries for selling shares of the Fund and providing shareholder support services. For the period, the Distribution and Service Fee rates, total fees and amounts retained by FDC were as follows:
| | Distribution
Fee | Service
Fee | Total Fees | Retained
by FDC |
| Class A | -% | .25% | $19,670 | $896 |
| Class M | .25% | .25% | 17,015 | – |
| Class C | .75% | .25% | 42,124 | 4,445 |
| | | | $78,809 | $5,341 |
Sales Load. FDC may receive a front-end sales charge of up to 5.75% for selling Class A shares and 3.50% for selling Class M shares, some of which is paid to financial intermediaries for selling shares of the Fund. Depending on the holding period, FDC may receive contingent deferred sales charges levied on Class A, Class M, and Class C redemptions. The deferred sales charges are 1.00% for Class C shares, 1.00% for certain purchases of Class A shares and .25% for certain purchases of Class M shares.
For the period, sales charge amounts retained by FDC were as follows:
| | Retained
by FDC |
| Class A | $1,860 |
| Class M | 1,161 |
| Class C(a) | 159 |
| | $3,180 |
(a) When Class C shares are initially sold, FDC pays commissions from its own resources to financial intermediaries through which the sales are made.
Transfer Agent Fees. Fidelity Investments Institutional Operations Company, Inc., (FIIOC), an affiliate of the investment adviser, is the transfer, dividend disbursing and shareholder servicing agent for each class of the Fund. FIIOC receives account fees and asset-based fees that vary according to the account size and type of account of the shareholders of the respective classes of the Fund. FIIOC pays for typesetting, printing and mailing of shareholder reports, except proxy statements.
For the period, transfer agent fees for each class were as follows:
| | Amount | % of
Class-Level Average
Net Assets(a) |
| Class A | $21,522 | .27 |
| Class M | 10,680 | .31 |
| Class C | 12,610 | .30 |
| Europe | 997,363 | .19 |
| Class I | 4,557 | .18 |
| | $1,046,732 | |
(a) Annualized
Accounting and Security Lending Fees. Fidelity Service Company, Inc. (FSC), an affiliate of the investment adviser, maintains the Fund's accounting records. The accounting fee is based on the level of average net assets for each month. Under a separate contract, FSC administers the security lending program. The security lending fee is based on the number and duration of lending transactions.
Interfund Lending Program. Pursuant to an Exemptive Order issued by the SEC, the Fund, along with other registered investment companies having management contracts with FMR or other affiliated entities of FMR, may participate in an interfund lending program. This program provides an alternative credit facility allowing the funds to borrow from, or lend money to, other participating affiliated funds. At period end, there were no interfund loans outstanding. The Fund's activity in this program during the period for which loans were outstanding was as follows:
| Borrower or Lender | Average Loan Balance | Weighted Average Interest Rate | Interest Expense |
| Borrower | $16,487,800 | .60% | $2,747 |
Interfund Trades. The Fund may purchase from or sell securities to other Fidelity Funds under procedures adopted by the Board. The procedures have been designed to ensure these interfund trades are executed in accordance with Rule 17a-7 of the 1940 Act. Interfund trades are included within the respective purchases and sales amounts shown in the Purchases and Sales of Investments note.
6. Committed Line of Credit.
The Fund participates with other funds managed by the investment adviser or an affiliate in a $4.25 billion credit facility (the "line of credit") to be utilized for temporary or emergency purposes to fund shareholder redemptions or for other short-term liquidity purposes. The Fund has agreed to pay commitment fees on its pro-rata portion of the line of credit, which amounted to $1,847 and is reflected in Miscellaneous expenses on the Statement of Operations. During the period, the Fund did not borrow on this line of credit.
7. Security Lending.
The Fund lends portfolio securities through a lending agent from time to time in order to earn additional income. For equity securities, a lending agent is used and may loan securities to certain qualified borrowers, including Fidelity Capital Markets (FCM), a broker-dealer affiliated with the Fund. On the settlement date of the loan, the Fund receives collateral (in the form of U.S. Treasury obligations, letters of credit and/or cash) against the loaned securities and maintains collateral in an amount not less than 100% of the market value of the loaned securities during the period of the loan. The market value of the loaned securities is determined at the close of business of the Fund and any additional required collateral is delivered to the Fund on the next business day. The Fund or borrower may terminate the loan at any time, and if the borrower defaults on its obligation to return the securities loaned because of insolvency or other reasons, the Fund may apply collateral received from the borrower against the obligation. The Fund may experience delays and costs in recovering the securities loaned. Any cash collateral received is invested in the Fidelity Securities Lending Cash Central Fund. The value of loaned securities at period end are disclosed on the Fund's Statement of Assets and Liabilities. Security lending income represents the income earned on investing cash collateral, less rebates paid to borrowers and any lending agent fees associated with the loan, plus any premium payments received for lending certain types of securities. Security lending income is presented in the Statement of Operations as a component of income from Fidelity Central Funds. Total security lending income during the period amounted to $154,957. During the period, there were no securities loaned to FCM.
8. Expense Reductions.
Commissions paid to certain brokers with whom the investment adviser, or its affiliates, places trades on behalf of the Fund include an amount in addition to trade execution, which may be rebated back to the Fund to offset certain expenses. This amount totaled $431,551 for the period.
In addition, during the period the investment adviser reimbursed and/or waived a portion of fund-level operating expenses in the amount of $4,732.
9. Distributions to Shareholders.
Distributions to shareholders of each class were as follows:
| | Six months ended April 30, 2017 | Year ended October 31, 2016 |
| From net investment income | | |
| Class A | $107,755 | $174,443 |
| Class M | 18,340 | 23,347 |
| Class C | – | 38,160 |
| Europe | 11,539,594 | 15,664,870 |
| Class I | 62,056 | 80,861 |
| Total | $11,727,745 | $15,981,681 |
| From net realized gain | | |
| Class A | $60,612 | $94,260 |
| Class M | 25,394 | 39,080 |
| Class C | – | 47,778 |
| Europe | 3,806,254 | 5,676,211 |
| Class I | 19,164 | 27,858 |
| Total | $3,911,424 | $5,885,187 |
10. Share Transactions.
Share Transactions for each class were as follows and may contain automatic conversions between classes or exchanges between affiliated funds:
| | Shares | Shares | Dollars | Dollars |
| | Six months ended April 30, 2017 | Year ended October 31, 2016 | Six months ended April 30, 2017 | Year ended October 31, 2016 |
| Class A | | | | |
| Shares sold | 37,895 | 144,459 | $1,311,824 | $5,004,460 |
| Reinvestment of distributions | 4,870 | 7,044 | 160,602 | 257,822 |
| Shares redeemed | (124,326) | (277,024) | (4,239,762) | (9,579,027) |
| Net increase (decrease) | (81,561) | (125,521) | $(2,767,336) | $(4,316,745) |
| Class M | | | | |
| Shares sold | 22,531 | 18,157 | $773,832 | $629,088 |
| Reinvestment of distributions | 1,308 | 1,677 | 43,249 | 61,481 |
| Shares redeemed | (36,394) | (76,071) | (1,250,315) | (2,635,140) |
| Net increase (decrease) | (12,555) | (56,237) | $(433,234) | $(1,944,571) |
| Class B | | | | |
| Shares sold | – | 183 | $– | $6,069 |
| Shares redeemed | – | (14,607) | – | (499,471) |
| Net increase (decrease) | – | (14,424) | $– | $(493,402) |
| Class C | | | | |
| Shares sold | 17,585 | 64,049 | $598,431 | $2,232,592 |
| Reinvestment of distributions | – | 2,232 | – | 81,438 |
| Shares redeemed | (50,424) | (102,859) | (1,711,243) | (3,518,604) |
| Net increase (decrease) | (32,839) | (36,578) | $(1,112,812) | $(1,204,574) |
| Europe | | | | |
| Shares sold | 2,346,878 | 2,489,815 | $82,035,246 | $86,835,858 |
| Reinvestment of distributions | 443,964 | 559,844 | 14,619,746 | 20,484,708 |
| Shares redeemed | (3,895,796) | (9,143,028) | (134,689,605) | (318,516,566) |
| Net increase (decrease) | (1,104,954) | (6,093,369) | $(38,034,613) | $(211,196,000) |
| Class I | | | | |
| Shares sold | 74,386 | 73,750 | $2,652,731 | $2,648,638 |
| Reinvestment of distributions | 2,369 | 2,803 | 78,022 | 102,586 |
| Shares redeemed | (67,031) | (96,879) | (2,296,906) | (3,369,656) |
| Net increase (decrease) | 9,724 | (20,326) | $433,847 | $(618,432) |
11. Other.
The Fund's organizational documents provide former and current trustees and officers with a limited indemnification against liabilities arising in connection with the performance of their duties to the Fund. In the normal course of business, the Fund may also enter into contracts that provide general indemnifications. The Fund's maximum exposure under these arrangements is unknown as this would be dependent on future claims that may be made against the Fund. The risk of material loss from such claims is considered remote.
Fidelity® Japan Fund
Investment Summary (Unaudited)
Geographic Diversification (% of fund's net assets)
| As of April 30, 2017 |
| | Japan | 97.8% |
| | Hong Kong | 1.0% |
| | Cayman Islands | 0.7% |
| | United States of America* | 0.5% |

* Includes Short-Term investments and Net Other Assets (Liabilities).
Percentages are based on country or territory of incorporation and are adjusted for the effect of futures contracts, if applicable.
| As of October 31, 2016 |
| | Japan | 98.3% |
| | United States of America* | 1.1% |
| | Cayman Islands | 0.6% |

* Includes Short-Term investments and Net Other Assets (Liabilities).
Percentages are based on country or territory of incorporation and are adjusted for the effect of futures contracts, if applicable.
Asset Allocation as of April 30, 2017
| | % of fund's net assets | % of fund's net assets 6 months ago |
| Stocks | 99.5 | 98.9 |
| Short-Term Investments and Net Other Assets (Liabilities) | 0.5 | 1.1 |
Top Ten Stocks as of April 30, 2017
| | % of fund's net assets | % of fund's net assets 6 months ago |
| SoftBank Corp. (Wireless Telecommunication Services) | 4.4 | 3.7 |
| Mitsubishi UFJ Financial Group, Inc. (Banks) | 3.9 | 3.3 |
| KDDI Corp. (Wireless Telecommunication Services) | 3.7 | 4.4 |
| Sony Corp. (Household Durables) | 3.7 | 3.6 |
| Hoya Corp. (Health Care Equipment & Supplies) | 3.6 | 3.2 |
| ORIX Corp. (Diversified Financial Services) | 3.4 | 3.6 |
| East Japan Railway Co. (Road & Rail) | 2.7 | 3.0 |
| Shimadzu Corp. (Electronic Equipment & Components) | 2.5 | 2.2 |
| Olympus Corp. (Health Care Equipment & Supplies) | 2.4 | 2.3 |
| Honda Motor Co. Ltd. (Automobiles) | 2.4 | 2.6 |
| | 32.7 | |
Top Market Sectors as of April 30, 2017
| | % of fund's net assets | % of fund's net assets 6 months ago |
| Consumer Discretionary | 19.9 | 21.2 |
| Industrials | 17.0 | 14.1 |
| Information Technology | 14.6 | 13.2 |
| Financials | 12.7 | 11.6 |
| Consumer Staples | 10.0 | 11.1 |
| Health Care | 9.6 | 12.3 |
| Telecommunication Services | 8.1 | 9.9 |
| Materials | 7.6 | 5.2 |
| Real Estate | 0.0 | 0.3 |
Percentages shown as 0.0% may reflect amounts less than 0.05%.
Fidelity® Japan Fund
Investments April 30, 2017 (Unaudited)
Showing Percentage of Net Assets
| Common Stocks - 99.5% | | | |
| | | Shares | Value |
| CONSUMER DISCRETIONARY - 19.9% | | | |
| Auto Components - 3.4% | | | |
| Bridgestone Corp. | | 143,900 | $5,999,975 |
| DaikyoNishikawa Corp. | | 109,000 | 1,383,584 |
| Hi-Lex Corp. | | 17,200 | 424,928 |
| NGK Spark Plug Co. Ltd. | | 97,600 | 2,110,909 |
| Sumitomo Electric Industries Ltd. | | 249,000 | 4,057,488 |
| | | | 13,976,884 |
| Automobiles - 5.6% | | | |
| Honda Motor Co. Ltd. | | 339,100 | 9,869,731 |
| Subaru Corp. | | 104,500 | 3,948,455 |
| Suzuki Motor Corp. | | 223,300 | 9,318,606 |
| | | | 23,136,792 |
| Household Durables - 7.6% | | | |
| Panasonic Corp. | | 399,400 | 4,776,125 |
| Rinnai Corp. | | 38,600 | 3,206,423 |
| Sekisui Chemical Co. Ltd. | | 123,500 | 2,071,720 |
| Sekisui House Ltd. | | 121,100 | 2,009,190 |
| Sony Corp. | | 445,200 | 15,276,746 |
| Techtronic Industries Co. Ltd. | | 1,010,000 | 4,336,910 |
| | | | 31,677,114 |
| Media - 1.6% | | | |
| Dentsu, Inc. | | 70,000 | 3,943,485 |
| LIFULL Co. Ltd. (a) | | 388,900 | 2,728,144 |
| | | | 6,671,629 |
| Multiline Retail - 0.4% | | | |
| Don Quijote Holdings Co. Ltd. | | 50,700 | 1,848,805 |
| Specialty Retail - 1.3% | | | |
| Nitori Holdings Co. Ltd. | | 15,600 | 2,030,554 |
| USS Co. Ltd. | | 179,400 | 3,170,379 |
| | | | 5,200,933 |
|
| TOTAL CONSUMER DISCRETIONARY | | | 82,512,157 |
|
| CONSUMER STAPLES - 10.0% | | | |
| Food & Staples Retailing - 5.7% | | | |
| Ain Holdings, Inc. | | 39,300 | 2,721,651 |
| San-A Co. Ltd. | | 49,600 | 2,255,860 |
| Seven & i Holdings Co. Ltd. | | 182,500 | 7,710,922 |
| Sundrug Co. Ltd. | | 101,600 | 3,563,633 |
| Tsuruha Holdings, Inc. | | 22,800 | 2,311,191 |
| Welcia Holdings Co. Ltd. | | 149,400 | 4,811,357 |
| | | | 23,374,614 |
| Food Products - 0.8% | | | |
| Japan Meat Co. Ltd. | | 34,100 | 567,441 |
| Morinaga & Co. Ltd. | | 59,700 | 2,822,328 |
| | | | 3,389,769 |
| Personal Products - 1.8% | | | |
| Kao Corp. | | 85,500 | 4,715,443 |
| Kose Corp. | | 29,700 | 2,816,138 |
| | | | 7,531,581 |
| Tobacco - 1.7% | | | |
| Japan Tobacco, Inc. | | 205,800 | 6,841,846 |
|
| TOTAL CONSUMER STAPLES | | | 41,137,810 |
|
| FINANCIALS - 12.7% | | | |
| Banks - 5.1% | | | |
| Mitsubishi UFJ Financial Group, Inc. | | 2,551,400 | 16,167,192 |
| Shinsei Bank Ltd. | | 2,594,000 | 4,840,117 |
| | | | 21,007,309 |
| Capital Markets - 0.5% | | | |
| Monex Group, Inc. | | 824,100 | 2,062,560 |
| Consumer Finance - 0.7% | | | |
| AEON Financial Service Co. Ltd. | | 149,300 | 2,867,471 |
| Diversified Financial Services - 3.4% | | | |
| ORIX Corp. | | 912,300 | 13,920,810 |
| Insurance - 3.0% | | | |
| Sony Financial Holdings, Inc. | | 201,600 | 3,349,300 |
| Tokio Marine Holdings, Inc. | | 217,800 | 9,167,236 |
| | | | 12,516,536 |
|
| TOTAL FINANCIALS | | | 52,374,686 |
|
| HEALTH CARE - 9.6% | | | |
| Biotechnology - 0.6% | | | |
| PeptiDream, Inc. (a)(b) | | 44,300 | 2,650,648 |
| Health Care Equipment & Supplies - 7.2% | | | |
| Hoya Corp. | | 310,500 | 14,829,352 |
| Nakanishi, Inc. | | 26,500 | 1,041,220 |
| Olympus Corp. | | 259,300 | 9,978,892 |
| Paramount Bed Holdings Co. Ltd. | | 88,800 | 3,724,064 |
| | | | 29,573,528 |
| Health Care Providers & Services - 0.9% | | | |
| Ship Healthcare Holdings, Inc. | | 140,300 | 3,771,959 |
| Pharmaceuticals - 0.9% | | | |
| Shionogi & Co. Ltd. | | 75,600 | 3,888,000 |
|
| TOTAL HEALTH CARE | | | 39,884,135 |
|
| INDUSTRIALS - 17.0% | | | |
| Building Products - 2.0% | | | |
| Daikin Industries Ltd. | | 64,500 | 6,263,400 |
| Toto Ltd. | | 49,200 | 1,877,964 |
| | | | 8,141,364 |
| Commercial Services & Supplies - 0.9% | | | |
| Sohgo Security Services Co., Ltd. | | 81,300 | 3,548,100 |
| Construction & Engineering - 1.0% | | | |
| Toshiba Plant Systems & Services Corp. | | 265,900 | 4,324,527 |
| Electrical Equipment - 3.5% | | | |
| Mitsubishi Electric Corp. | | 447,000 | 6,231,334 |
| Nidec Corp. | | 88,900 | 8,150,330 |
| | | | 14,381,664 |
| Machinery - 2.9% | | | |
| Komatsu Ltd. | | 78,800 | 2,105,658 |
| Kubota Corp. | | 219,600 | 3,453,320 |
| SMC Corp. | | 22,400 | 6,307,567 |
| | | | 11,866,545 |
| Professional Services - 2.2% | | | |
| Benefit One, Inc. | | 89,500 | 2,733,774 |
| Outsourcing, Inc. (a) | | 77,300 | 2,964,409 |
| Recruit Holdings Co. Ltd. | | 71,700 | 3,621,180 |
| | | | 9,319,363 |
| Road & Rail - 2.7% | | | |
| East Japan Railway Co. | | 127,300 | 11,367,071 |
| Trading Companies & Distributors - 1.8% | | | |
| Misumi Group, Inc. | | 310,600 | 5,881,826 |
| Trusco Nakayama Corp. | | 74,300 | 1,696,286 |
| | | | 7,578,112 |
|
| TOTAL INDUSTRIALS | | | 70,526,746 |
|
| INFORMATION TECHNOLOGY - 14.6% | | | |
| Electronic Equipment & Components - 7.5% | | | |
| Azbil Corp. | | 162,900 | 5,479,928 |
| Iriso Electronics Co. Ltd. | | 18,100 | 1,144,696 |
| Murata Manufacturing Co. Ltd. | | 26,500 | 3,552,747 |
| OMRON Corp. | | 60,600 | 2,535,986 |
| Shimadzu Corp. | | 613,000 | 10,393,093 |
| TDK Corp. | | 55,400 | 3,429,110 |
| Topcon Corp. | | 259,500 | 4,578,933 |
| | | | 31,114,493 |
| Internet Software & Services - 4.1% | | | |
| Alibaba Group Holding Ltd. sponsored ADR (b) | | 23,400 | 2,702,700 |
| DeNA Co. Ltd. | | 143,800 | 3,079,171 |
| Kakaku.com, Inc. | | 411,900 | 5,937,863 |
| SMS Co., Ltd. | | 83,700 | 2,227,745 |
| Yahoo! Japan Corp. | | 742,400 | 3,176,719 |
| | | | 17,124,198 |
| IT Services - 0.3% | | | |
| Otsuka Corp. | | 25,900 | 1,387,064 |
| Semiconductors & Semiconductor Equipment - 1.6% | | | |
| Sumco Corp. | | 367,100 | 6,418,281 |
| Software - 1.1% | | | |
| Nintendo Co. Ltd. | | 17,600 | 4,453,955 |
|
| TOTAL INFORMATION TECHNOLOGY | | | 60,497,991 |
|
| MATERIALS - 7.6% | | | |
| Chemicals - 7.6% | | | |
| Daicel Chemical Industries Ltd. | | 208,300 | 2,389,914 |
| Hitachi Chemical Co. Ltd. | | 134,900 | 3,860,336 |
| JSR Corp. | | 245,000 | 4,474,725 |
| Kansai Paint Co. Ltd. | | 172,100 | 3,810,207 |
| Okamoto Industries, Inc. | | 111,000 | 1,202,853 |
| Shin-Etsu Chemical Co. Ltd. | | 87,600 | 7,609,943 |
| Sumitomo Chemical Co. Ltd. | | 602,000 | 3,396,797 |
| Toray Industries, Inc. | | 524,000 | 4,635,267 |
| | | | 31,380,042 |
| TELECOMMUNICATION SERVICES - 8.1% | | | |
| Wireless Telecommunication Services - 8.1% | | | |
| KDDI Corp. | | 580,800 | 15,399,374 |
| SoftBank Corp. | | 240,400 | 18,234,991 |
| | | | 33,634,365 |
| TOTAL COMMON STOCKS | | | |
| (Cost $351,359,401) | | | 411,947,932 |
|
| Money Market Funds - 2.8% | | | |
| Fidelity Cash Central Fund, 0.85% (c) | | 4,818,153 | 4,819,117 |
| Fidelity Securities Lending Cash Central Fund 0.86% (c)(d) | | 6,854,921 | 6,855,606 |
| TOTAL MONEY MARKET FUNDS | | | |
| (Cost $11,675,203) | | | 11,674,723 |
| TOTAL INVESTMENT PORTFOLIO - 102.3% | | | |
| (Cost $363,034,604) | | | 423,622,655 |
| NET OTHER ASSETS (LIABILITIES) - (2.3)% | | | (9,435,140) |
| NET ASSETS - 100% | | | $414,187,515 |
Legend
(a) Security or a portion of the security is on loan at period end.
(b) Non-income producing
(c) Affiliated fund that is generally available only to investment companies and other accounts managed by Fidelity Investments. The rate quoted is the annualized seven-day yield of the fund at period end. A complete unaudited listing of the fund's holdings as of its most recent quarter end is available upon request. In addition, each Fidelity Central Fund's financial statements are available on the SEC's website or upon request.
(d) Investment made with cash collateral received from securities on loan.
Affiliated Central Funds
Information regarding fiscal year to date income earned by the Fund from investments in Fidelity Central Funds is as follows:
| Fund | Income earned |
| Fidelity Cash Central Fund | $6,905 |
| Fidelity Securities Lending Cash Central Fund | 60,511 |
| Total | $67,416 |
Investment Valuation
The following is a summary of the inputs used, as of April 30, 2017, involving the Fund's assets and liabilities carried at fair value. The inputs or methodology used for valuing securities may not be an indication of the risk associated with investing in those securities. For more information on valuation inputs, and their aggregation into the levels used below, please refer to the Investment Valuation section in the accompanying Notes to Financial Statements.
| | Valuation Inputs at Reporting Date: |
| Description | Total | Level 1 | Level 2 | Level 3 |
| Investments in Securities: | | | | |
| Equities: | | | | |
| Consumer Discretionary | $82,512,157 | $52,589,555 | $29,922,602 | $-- |
| Consumer Staples | 41,137,810 | 41,137,810 | -- | -- |
| Financials | 52,374,686 | 36,207,494 | 16,167,192 | -- |
| Health Care | 39,884,135 | 39,884,135 | -- | -- |
| Industrials | 70,526,746 | 68,421,088 | 2,105,658 | -- |
| Information Technology | 60,497,991 | 56,044,036 | 4,453,955 | -- |
| Materials | 31,380,042 | 31,380,042 | -- | -- |
| Telecommunication Services | 33,634,365 | -- | 33,634,365 | -- |
| Money Market Funds | 11,674,723 | 11,674,723 | -- | -- |
| Total Investments in Securities: | $423,622,655 | $337,338,883 | $86,283,772 | $-- |
See accompanying notes which are an integral part of the financial statements.
Fidelity® Japan Fund
Financial Statements
Statement of Assets and Liabilities
| | | April 30, 2017 (Unaudited) |
| Assets | | |
Investment in securities, at value (including securities loaned of $6,524,398) — See accompanying schedule:
Unaffiliated issuers (cost $351,359,401) | $411,947,932 | |
| Fidelity Central Funds (cost $11,675,203) | 11,674,723 | |
| Total Investments (cost $363,034,604) | | $423,622,655 |
| Receivable for investments sold | | 4,121,947 |
| Receivable for fund shares sold | | 215,650 |
| Dividends receivable | | 2,873,866 |
| Distributions receivable from Fidelity Central Funds | | 11,226 |
| Prepaid expenses | | 263 |
| Other receivables | | 7,929 |
| Total assets | | 430,853,536 |
| Liabilities | | |
| Payable for fund shares redeemed | $9,448,211 | |
| Accrued management fee | 184,625 | |
| Distribution and service plan fees payable | 17,452 | |
| Other affiliated payables | 100,450 | |
| Other payables and accrued expenses | 60,781 | |
| Collateral on securities loaned | 6,854,502 | |
| Total liabilities | | 16,666,021 |
| Net Assets | | $414,187,515 |
| Net Assets consist of: | | |
| Paid in capital | | $549,345,476 |
| Undistributed net investment income | | 1,770,842 |
| Accumulated undistributed net realized gain (loss) on investments and foreign currency transactions | | (197,503,056) |
| Net unrealized appreciation (depreciation) on investments and assets and liabilities in foreign currencies | | 60,574,253 |
| Net Assets | | $414,187,515 |
| Calculation of Maximum Offering Price | | |
| Class A: | | |
| Net Asset Value and redemption price per share ($21,048,203 ÷ 1,609,128 shares) | | $13.08 |
| Maximum offering price per share (100/94.25 of $13.08) | | $13.88 |
| Class M: | | |
| Net Asset Value and redemption price per share ($4,183,050 ÷ 319,608 shares) | | $13.09 |
| Maximum offering price per share (100/96.50 of $13.09) | | $13.56 |
| Class C: | | |
| Net Asset Value and offering price per share ($13,816,328 ÷ 1,064,113 shares)(a) | | $12.98 |
| Japan: | | |
| Net Asset Value, offering price and redemption price per share ($221,494,711 ÷ 16,907,602 shares) | | $13.10 |
| Class I: | | |
| Net Asset Value, offering price and redemption price per share ($153,645,223 ÷ 11,739,262 shares) | | $13.09 |
(a) Redemption price per share is equal to net asset value less any applicable contingent deferred sales charge.
See accompanying notes which are an integral part of the financial statements.
Statement of Operations
| | | Six months ended April 30, 2017 (Unaudited) |
| Investment Income | | |
| Dividends | | $3,801,833 |
| Income from Fidelity Central Funds | | 67,416 |
| Income before foreign taxes withheld | | 3,869,249 |
| Less foreign taxes withheld | | (380,183) |
| Total income | | 3,489,066 |
| Expenses | | |
| Management fee | | |
| Basic fee | $1,416,755 | |
| Performance adjustment | (442,082) | |
| Transfer agent fees | 412,242 | |
| Distribution and service plan fees | 106,841 | |
| Accounting and security lending fees | 106,115 | |
| Custodian fees and expenses | 21,460 | |
| Independent trustees' fees and expenses | 825 | |
| Registration fees | 60,350 | |
| Audit | 42,124 | |
| Legal | 475 | |
| Miscellaneous | 1,612 | |
| Total expenses before reductions | 1,726,717 | |
| Expense reductions | (13,341) | 1,713,376 |
| Net investment income (loss) | | 1,775,690 |
| Realized and Unrealized Gain (Loss) | | |
| Net realized gain (loss) on: | | |
| Investment securities: | | |
| Unaffiliated issuers | 2,426,120 | |
| Fidelity Central Funds | 975 | |
| Foreign currency transactions | (305,538) | |
| Total net realized gain (loss) | | 2,121,557 |
Change in net unrealized appreciation (depreciation) on:
Investment securities | 15,865,728 | |
| Assets and liabilities in foreign currencies | 80,225 | |
| Total change in net unrealized appreciation (depreciation) | | 15,945,953 |
| Net gain (loss) | | 18,067,510 |
| Net increase (decrease) in net assets resulting from operations | | $19,843,200 |
See accompanying notes which are an integral part of the financial statements.
Statement of Changes in Net Assets
| | Six months ended April 30, 2017 (Unaudited) | Year ended October 31, 2016 |
| Increase (Decrease) in Net Assets | | |
| Operations | | |
| Net investment income (loss) | $1,775,690 | $3,375,493 |
| Net realized gain (loss) | 2,121,557 | (19,947,501) |
| Change in net unrealized appreciation (depreciation) | 15,945,953 | 35,358,570 |
| Net increase (decrease) in net assets resulting from operations | 19,843,200 | 18,786,562 |
| Distributions to shareholders from net investment income | (3,369,067) | (3,027,093) |
| Distributions to shareholders from net realized gain | (1,060,540) | (270,338) |
| Total distributions | (4,429,607) | (3,297,431) |
| Share transactions - net increase (decrease) | (4,398,135) | (159,708,771) |
| Redemption fees | 23,848 | 43,507 |
| Total increase (decrease) in net assets | 11,039,306 | (144,176,133) |
| Net Assets | | |
| Beginning of period | 403,148,209 | 547,324,342 |
| End of period | $414,187,515 | $403,148,209 |
| Other Information | | |
| Undistributed net investment income end of period | $1,770,842 | $3,364,219 |
See accompanying notes which are an integral part of the financial statements.
Financial Highlights — Fidelity Japan Fund Class A
| | Six months ended (Unaudited) April 30, | Years ended October 31, | | | | |
| | 2017 | 2016 | 2015 | 2014 | 2013 | 2012 |
| Selected Per–Share Data | | | | | | |
| Net asset value, beginning of period | $12.59 | $11.87 | $11.65 | $12.00 | $9.30 | $9.54 |
| Income from Investment Operations | | | | | | |
| Net investment income (loss)A | .04 | .06 | .04 | .05 | .08 | .09 |
| Net realized and unrealized gain (loss) | .54 | .72 | .23 | (.31) | 2.80 | (.15) |
| Total from investment operations | .58 | .78 | .27 | (.26) | 2.88 | (.06) |
| Distributions from net investment income | (.06) | (.05) | (.05) | (.08) | (.11) | (.13) |
| Distributions from net realized gain | (.03) | (.01) | – | (.01) | (.08) | (.05) |
| Total distributions | (.09) | (.06) | (.05) | (.09) | (.19) | (.18) |
| Redemption fees added to paid in capitalA | –B | –B | –B | –B | .01 | –B |
| Net asset value, end of period | $13.08 | $12.59 | $11.87 | $11.65 | $12.00 | $9.30 |
| Total ReturnC,D,E | 4.69% | 6.56% | 2.31% | (2.18)% | 31.58% | (.64)% |
| Ratios to Average Net AssetsF,G | | | | | | |
| Expenses before reductions | 1.08%H | 1.08% | 1.10% | 1.23% | 1.26% | 1.42% |
| Expenses net of fee waivers, if any | 1.08%H | 1.08% | 1.10% | 1.23% | 1.26% | 1.38% |
| Expenses net of all reductions | 1.07%H | 1.08% | 1.09% | 1.23% | 1.25% | 1.36% |
| Net investment income (loss) | .64%H | .51% | .37% | .41% | .75% | .94% |
| Supplemental Data | | | | | | |
| Net assets, end of period (000 omitted) | $21,048 | $23,910 | $23,918 | $21,352 | $20,520 | $9,495 |
| Portfolio turnover rateI | 32%H | 15% | 35% | 112% | 68% | 52% |
A Calculated based on average shares outstanding during the period.
B Amount represents less than $.005 per share.
C Total returns for periods of less than one year are not annualized.
D Total returns would have been lower if certain expenses had not been reduced during the applicable periods shown.
E Total returns do not include the effect of the sales charges.
F Fees and expenses of any underlying Fidelity Central Funds are not included in the Fund's expense ratio. The Fund indirectly bears its proportionate share of the expenses of any underlying Fidelity Central Funds.
G Expense ratios reflect operating expenses of the class. Expenses before reductions do not reflect amounts reimbursed by the investment adviser or reductions from brokerage service arrangements or reductions from other expense offset arrangements and do not represent the amount paid by the class during periods when reimbursements or reductions occur. Expenses net of fee waivers reflect expenses after reimbursement by the investment adviser but prior to reductions from brokerage service arrangements or other expense offset arrangements. Expenses net of all reductions represent the net expenses paid by the class.
H Annualized
I Amount does not include the portfolio activity of any underlying Fidelity Central Funds.
See accompanying notes which are an integral part of the financial statements.
Financial Highlights — Fidelity Japan Fund Class M
| | Six months ended (Unaudited) April 30, | Years ended October 31, | | | | |
| | 2017 | 2016 | 2015 | 2014 | 2013 | 2012 |
| Selected Per–Share Data | | | | | | |
| Net asset value, beginning of period | $12.57 | $11.85 | $11.62 | $11.96 | $9.28 | $9.51 |
| Income from Investment Operations | | | | | | |
| Net investment income (loss)A | .02 | .02 | –B | .01 | .05 | .06 |
| Net realized and unrealized gain (loss) | .54 | .71 | .23 | (.30) | 2.78 | (.13) |
| Total from investment operations | .56 | .73 | .23 | (.29) | 2.83 | (.07) |
| Distributions from net investment income | (.01) | –B | – | (.04) | (.08) | (.11) |
| Distributions from net realized gain | (.03) | (.01) | – | (.01) | (.08) | (.05) |
| Total distributions | (.04) | (.01) | – | (.05) | (.16) | (.16) |
| Redemption fees added to paid in capitalA | –B | –B | –B | –B | .01 | –B |
| Net asset value, end of period | $13.09 | $12.57 | $11.85 | $11.62 | $11.96 | $9.28 |
| Total ReturnC,D,E | 4.51% | 6.15% | 1.98% | (2.42)% | 31.04% | (.75)% |
| Ratios to Average Net AssetsF,G | | | | | | |
| Expenses before reductions | 1.43%H | 1.44% | 1.43% | 1.54% | 1.55% | 1.70% |
| Expenses net of fee waivers, if any | 1.43%H | 1.44% | 1.43% | 1.54% | 1.55% | 1.66% |
| Expenses net of all reductions | 1.43%H | 1.44% | 1.42% | 1.54% | 1.53% | 1.64% |
| Net investment income (loss) | .29%H | .16% | .04% | .10% | .46% | .66% |
| Supplemental Data | | | | | | |
| Net assets, end of period (000 omitted) | $4,183 | $4,193 | $4,809 | $4,104 | $5,357 | $3,934 |
| Portfolio turnover rateI | 32%H | 15% | 35% | 112% | 68% | 52% |
A Calculated based on average shares outstanding during the period.
B Amount represents less than $.005 per share.
C Total returns for periods of less than one year are not annualized.
D Total returns would have been lower if certain expenses had not been reduced during the applicable periods shown.
E Total returns do not include the effect of the sales charges.
F Fees and expenses of any underlying Fidelity Central Funds are not included in the Fund's expense ratio. The Fund indirectly bears its proportionate share of the expenses of any underlying Fidelity Central Funds.
G Expense ratios reflect operating expenses of the class. Expenses before reductions do not reflect amounts reimbursed by the investment adviser or reductions from brokerage service arrangements or reductions from other expense offset arrangements and do not represent the amount paid by the class during periods when reimbursements or reductions occur. Expenses net of fee waivers reflect expenses after reimbursement by the investment adviser but prior to reductions from brokerage service arrangements or other expense offset arrangements. Expenses net of all reductions represent the net expenses paid by the class.
H Annualized
I Amount does not include the portfolio activity of any underlying Fidelity Central Funds.
See accompanying notes which are an integral part of the financial statements.
Financial Highlights — Fidelity Japan Fund Class C
| | Six months ended (Unaudited) April 30, | Years ended October 31, | | | | |
| | 2017 | 2016 | 2015 | 2014 | 2013 | 2012 |
| Selected Per–Share Data | | | | | | |
| Net asset value, beginning of period | $12.44 | $11.77 | $11.58 | $11.96 | $9.25 | $9.48 |
| Income from Investment Operations | | | | | | |
| Net investment income (loss)A | –B | (.02) | (.04) | (.03) | –B | .02 |
| Net realized and unrealized gain (loss) | .54 | .69 | .23 | (.32) | 2.79 | (.14) |
| Total from investment operations | .54 | .67 | .19 | (.35) | 2.79 | (.12) |
| Distributions from net investment income | – | – | – | (.03) | (.01) | (.06) |
| Distributions from net realized gain | – | – | – | (.01) | (.08) | (.05) |
| Total distributions | – | – | – | (.03)C | (.09) | (.11) |
| Redemption fees added to paid in capitalA | –B | –B | –B | –B | .01 | –B |
| Net asset value, end of period | $12.98 | $12.44 | $11.77 | $11.58 | $11.96 | $9.25 |
| Total ReturnD,E,F | 4.34% | 5.69% | 1.64% | (2.90)% | 30.55% | (1.27)% |
| Ratios to Average Net AssetsG,H | | | | | | |
| Expenses before reductions | 1.79%I | 1.81% | 1.81% | 1.93% | 1.97% | 2.15% |
| Expenses net of fee waivers, if any | 1.79%I | 1.81% | 1.81% | 1.93% | 1.97% | 2.11% |
| Expenses net of all reductions | 1.79%I | 1.81% | 1.80% | 1.93% | 1.95% | 2.09% |
| Net investment income (loss) | (.07)%I | (.21)% | (.34)% | (.29)% | .04% | .21% |
| Supplemental Data | | | | | | |
| Net assets, end of period (000 omitted) | $13,816 | $15,077 | $18,491 | $13,162 | $11,824 | $7,015 |
| Portfolio turnover rateJ | 32%I | 15% | 35% | 112% | 68% | 52% |
A Calculated based on average shares outstanding during the period.
B Amount represents less than $.005 per share.
C Total distributions of $.03 per share is comprised of distributions from net investment income of $.025 and distributions from net realized gain of $.009 per share.
D Total returns for periods of less than one year are not annualized.
E Total returns would have been lower if certain expenses had not been reduced during the applicable periods shown.
F Total returns do not include the effect of the contingent deferred sales charge.
G Fees and expenses of any underlying Fidelity Central Funds are not included in the Fund's expense ratio. The Fund indirectly bears its proportionate share of the expenses of any underlying Fidelity Central Funds.
H Expense ratios reflect operating expenses of the class. Expenses before reductions do not reflect amounts reimbursed by the investment adviser or reductions from brokerage service arrangements or reductions from other expense offset arrangements and do not represent the amount paid by the class during periods when reimbursements or reductions occur. Expenses net of fee waivers reflect expenses after reimbursement by the investment adviser but prior to reductions from brokerage service arrangements or other expense offset arrangements. Expenses net of all reductions represent the net expenses paid by the class.
I Annualized
J Amount does not include the portfolio activity of any underlying Fidelity Central Funds.
See accompanying notes which are an integral part of the financial statements.
Financial Highlights — Fidelity Japan Fund
| | Six months ended (Unaudited) April 30, | Years ended October 31, | | | | |
| | 2017 | 2016 | 2015 | 2014 | 2013 | 2012 |
| Selected Per–Share Data | | | | | | |
| Net asset value, beginning of period | $12.64 | $11.91 | $11.69 | $12.03 | $9.34 | $9.57 |
| Income from Investment Operations | | | | | | |
| Net investment income (loss)A | .06 | .09 | .08 | .09 | .12 | .12 |
| Net realized and unrealized gain (loss) | .55 | .72 | .23 | (.32) | 2.79 | (.14) |
| Total from investment operations | .61 | .81 | .31 | (.23) | 2.91 | (.02) |
| Distributions from net investment income | (.11) | (.07) | (.09) | (.11) | (.15) | (.16) |
| Distributions from net realized gain | (.03) | (.01) | – | (.01) | (.08) | (.05) |
| Total distributions | (.15)B | (.08) | (.09) | (.11)C | (.23) | (.21) |
| Redemption fees added to paid in capitalA | –D | –D | –D | –D | .01 | –D |
| Net asset value, end of period | $13.10 | $12.64 | $11.91 | $11.69 | $12.03 | $9.34 |
| Total ReturnE,F | 4.88% | 6.80% | 2.66% | (1.90)% | 31.92% | (.19)% |
| Ratios to Average Net AssetsG,H | | | | | | |
| Expenses before reductions | .80%I | .78% | .80% | .90% | .93% | 1.09% |
| Expenses net of fee waivers, if any | .80%I | .78% | .80% | .90% | .93% | 1.06% |
| Expenses net of all reductions | .79%I | .78% | .79% | .90% | .91% | 1.04% |
| Net investment income (loss) | .93%I | .81% | .67% | .74% | 1.08% | 1.26% |
| Supplemental Data | | | | | | |
| Net assets, end of period (000 omitted) | $221,495 | $352,936 | $485,803 | $415,612 | $480,773 | $353,550 |
| Portfolio turnover rateJ | 32%I | 15% | 35% | 112% | 68% | 52% |
A Calculated based on average shares outstanding during the period.
B Total distributions of $.15 per share is comprised of distributions from net investment income of $.112 and distributions from net realized gain of $.034 per share.
C Total distributions of $.11 per share is comprised of distributions from net investment income of $.105 and distributions from net realized gain of $.009 per share.
D Amount represents less than $.005 per share.
E Total returns for periods of less than one year are not annualized.
F Total returns would have been lower if certain expenses had not been reduced during the applicable periods shown.
G Fees and expenses of any underlying Fidelity Central Funds are not included in the Fund's expense ratio. The Fund indirectly bears its proportionate share of the expenses of any underlying Fidelity Central Funds.
H Expense ratios reflect operating expenses of the class. Expenses before reductions do not reflect amounts reimbursed by the investment adviser or reductions from brokerage service arrangements or reductions from other expense offset arrangements and do not represent the amount paid by the class during periods when reimbursements or reductions occur. Expenses net of fee waivers reflect expenses after reimbursement by the investment adviser but prior to reductions from brokerage service arrangements or other expense offset arrangements. Expenses net of all reductions represent the net expenses paid by the class.
I Annualized
J Amount does not include the portfolio activity of any underlying Fidelity Central Funds.
See accompanying notes which are an integral part of the financial statements.
Financial Highlights — Fidelity Japan Fund Class I
| | Six months ended (Unaudited) April 30, | Years ended October 31, | | | | |
| | 2017 | 2016 | 2015 | 2014 | 2013 | 2012 |
| Selected Per–Share Data | | | | | | |
| Net asset value, beginning of period | $12.62 | $11.89 | $11.67 | $12.02 | $9.33 | $9.57 |
| Income from Investment Operations | | | | | | |
| Net investment income (loss)A | .06 | .10 | .08 | .09 | .13 | .12 |
| Net realized and unrealized gain (loss) | .55 | .70 | .23 | (.32) | 2.78 | (.14) |
| Total from investment operations | .61 | .80 | .31 | (.23) | 2.91 | (.02) |
| Distributions from net investment income | (.11) | (.07) | (.09) | (.12) | (.15) | (.17) |
| Distributions from net realized gain | (.03) | (.01) | – | (.01) | (.08) | (.05) |
| Total distributions | (.14) | (.07)B | (.09) | (.12)C | (.23) | (.22) |
| Redemption fees added to paid in capitalA | –D | –D | –D | –D | .01 | –D |
| Net asset value, end of period | $13.09 | $12.62 | $11.89 | $11.67 | $12.02 | $9.33 |
| Total ReturnE,F | 4.95% | 6.77% | 2.72% | (1.90)% | 32.04% | (.18)% |
| Ratios to Average Net AssetsG,H | | | | | | |
| Expenses before reductions | .75%I | .77% | .80% | .89% | .90% | 1.03% |
| Expenses net of fee waivers, if any | .75%I | .77% | .80% | .89% | .90% | 1.01% |
| Expenses net of all reductions | .74%I | .76% | .79% | .89% | .88% | .99% |
| Net investment income (loss) | .98%I | .83% | .67% | .76% | 1.11% | 1.31% |
| Supplemental Data | | | | | | |
| Net assets, end of period (000 omitted) | $153,645 | $7,032 | $13,957 | $20,253 | $20,033 | $1,488 |
| Portfolio turnover rateJ | 32%I | 15% | 35% | 112% | 68% | 52% |
A Calculated based on average shares outstanding during the period.
B Total distributions of $.07 per share is comprised of distributions from net investment income of $.065 and distributions from net realized gain of $.006 per share.
C Total distributions of $.12 per share is comprised of distributions from net investment income of $.115 and distributions from net realized gain of $.009 per share.
D Amount represents less than $.005 per share.
E Total returns for periods of less than one year are not annualized.
F Total returns would have been lower if certain expenses had not been reduced during the applicable periods shown.
G Fees and expenses of any underlying Fidelity Central Funds are not included in the Fund's expense ratio. The Fund indirectly bears its proportionate share of the expenses of any underlying Fidelity Central Funds.
H Expense ratios reflect operating expenses of the class. Expenses before reductions do not reflect amounts reimbursed by the investment adviser or reductions from brokerage service arrangements or reductions from other expense offset arrangements and do not represent the amount paid by the class during periods when reimbursements or reductions occur. Expenses net of fee waivers reflect expenses after reimbursement by the investment adviser but prior to reductions from brokerage service arrangements or other expense offset arrangements. Expenses net of all reductions represent the net expenses paid by the class.
I Annualized
J Amount does not include the portfolio activity of any underlying Fidelity Central Funds.
See accompanying notes which are an integral part of the financial statements.
Notes to Financial Statements (Unaudited)
For the period ended April 30, 2017
1. Organization.
Fidelity Japan Fund (the Fund) is a fund of Fidelity Investment Trust (the Trust) and is authorized to issue an unlimited number of shares. The Trust is registered under the Investment Company Act of 1940, as amended (the 1940 Act), as an open-end management investment company organized as a Massachusetts business trust. The Fund offers Class A, Class M (formerly Class T), Class C, Japan and Class I shares, each of which has equal rights as to assets and voting privileges. Each class has exclusive voting rights with respect to matters that affect that class.
After the close of business on June 24, 2016, all outstanding Class B shares were converted to Class A shares. All prior fiscal period dollar and share amounts for Class B presented in the Notes to Financial Statements are for the period November 1, 2015 through June 24, 2016.
2. Investments in Fidelity Central Funds.
The Fund invests in Fidelity Central Funds, which are open-end investment companies generally available only to other investment companies and accounts managed by the investment adviser and its affiliates. The Fund's Schedule of Investments lists each of the Fidelity Central Funds held as of period end, if any, as an investment of the Fund, but does not include the underlying holdings of each Fidelity Central Fund. As an Investing Fund, the Fund indirectly bears its proportionate share of the expenses of the underlying Fidelity Central Funds.
The Money Market Central Funds seek preservation of capital and current income and are managed by Fidelity Investments Money Management, Inc. (FIMM), an affiliate of the investment adviser. Annualized expenses of the Money Market Central Funds as of their most recent shareholder report date are less than .005%.
A complete unaudited list of holdings for each Fidelity Central Fund is available upon request or at the Securities and Exchange Commission (the SEC) website at www.sec.gov. In addition, the financial statements of the Fidelity Central Funds are available on the SEC website or upon request.
3. Significant Accounting Policies.
The Fund is an investment company and applies the accounting and reporting guidance of the Financial Accounting Standards Board (FASB) Accounting Standards Codification Topic 946 Financial Services – Investments Companies. The financial statements have been prepared in conformity with accounting principles generally accepted in the United States of America (GAAP), which require management to make certain estimates and assumptions at the date of the financial statements. Actual results could differ from those estimates. Subsequent events, if any, through the date that the financial statements were issued have been evaluated in the preparation of the financial statements. The following summarizes the significant accounting policies of the Fund:
Investment Valuation. Investments are valued as of 4:00 p.m. Eastern time on the last calendar day of the period. The Board of Trustees (the Board) has delegated the day to day responsibility for the valuation of the Fund's investments to the Fair Value Committee (the Committee) established by the Fund's investment adviser. In accordance with valuation policies and procedures approved by the Board, the Fund attempts to obtain prices from one or more third party pricing vendors or brokers to value its investments. When current market prices, quotations or currency exchange rates are not readily available or reliable, investments will be fair valued in good faith by the Committee, in accordance with procedures adopted by the Board. Factors used in determining fair value vary by investment type and may include market or investment specific events. The frequency with which these procedures are used cannot be predicted and they may be utilized to a significant extent. The Committee oversees the Fund's valuation policies and procedures and reports to the Board on the Committee's activities and fair value determinations. The Board monitors the appropriateness of the procedures used in valuing the Fund's investments and ratifies the fair value determinations of the Committee.
The Fund categorizes the inputs to valuation techniques used to value its investments into a disclosure hierarchy consisting of three levels as shown below:
- Level 1 – quoted prices in active markets for identical investments
- Level 2 – other significant observable inputs (including quoted prices for similar investments, interest rates, prepayment speeds, etc.)
- Level 3 – unobservable inputs (including the Fund's own assumptions based on the best information available)
Valuation techniques used to value the Fund's investments by major category are as follows:
Equity securities, including restricted securities, for which market quotations are readily available, are valued at the last reported sale price or official closing price as reported by a third party pricing vendor on the primary market or exchange on which they are traded and are categorized as Level 1 in the hierarchy. In the event there were no sales during the day or closing prices are not available, securities are valued at the last quoted bid price or may be valued using the last available price and are generally categorized as Level 2 in the hierarchy. For foreign equity securities, when market or security specific events arise, comparisons to the valuation of American Depositary Receipts (ADRs), futures contracts, Exchange-Traded Funds (ETFs) and certain indexes as well as quoted prices for similar securities may be used and would be categorized as Level 2 in the hierarchy. Utilizing these techniques may result in transfers between Level 1 and Level 2. For equity securities, including restricted securities, where observable inputs are limited, assumptions about market activity and risk are used and these securities may be categorized as Level 3 in the hierarchy.
Investments in open-end mutual funds, including the Fidelity Central Funds, are valued at their closing net asset value (NAV) each business day and are categorized as Level 1 in the hierarchy.
Changes in valuation techniques may result in transfers in or out of an assigned level within the disclosure hierarchy. The aggregate value of investments by input level as of April 30, 2017 is included at the end of the Fund's Schedule of Investments.
Foreign Currency. The Fund may use foreign currency contracts to facilitate transactions in foreign-denominated securities. Gains and losses from these transactions may arise from changes in the value of the foreign currency or if the counterparties do not perform under the contracts' terms.
Foreign-denominated assets, including investment securities, and liabilities are translated into U.S. dollars at the exchange rates at period end. Purchases and sales of investment securities, income and dividends received and expenses denominated in foreign currencies are translated into U.S. dollars at the exchange rate in effect on the transaction date.
The effects of exchange rate fluctuations on investments are included with the net realized and unrealized gain (loss) on investment securities. Other foreign currency transactions resulting in realized and unrealized gain (loss) are disclosed separately.
Investment Transactions and Income. For financial reporting purposes, the Fund's investment holdings and NAV include trades executed through the end of the last business day of the period. The NAV per share for processing shareholder transactions is calculated as of the close of business of the New York Stock Exchange (NYSE), normally 4:00 p.m. Eastern time and includes trades executed through the end of the prior business day. Gains and losses on securities sold are determined on the basis of identified cost. Dividend income is recorded on the ex-dividend date, except for certain dividends from foreign securities where the ex-dividend date may have passed, which are recorded as soon as the Fund is informed of the ex-dividend date. Non-cash dividends included in dividend income, if any, are recorded at the fair market value of the securities received. Income and capital gain distributions from Fidelity Central Funds, if any, are recorded on the ex-dividend date. Investment income is recorded net of foreign taxes withheld where recovery of such taxes is uncertain.
Class Allocations and Expenses. Investment income, realized and unrealized capital gains and losses, common expenses of the Fund, and certain fund-level expense reductions, if any, are allocated daily on a pro-rata basis to each class based on the relative net assets of each class to the total net assets of the Fund. Each class differs with respect to transfer agent and distribution and service plan fees incurred. Certain expense reductions may also differ by class. For the reporting period, the allocated portion of income and expenses to each class as a percent of its average net assets may vary due to the timing of recording these transactions in relation to fluctuating net assets of the classes. Expenses directly attributable to a fund are charged to that fund. Expenses attributable to more than one fund are allocated among the respective funds on the basis of relative net assets or other appropriate methods. Expense estimates are accrued in the period to which they relate and adjustments are made when actual amounts are known.
Income Tax Information and Distributions to Shareholders. Each year, the Fund intends to qualify as a regulated investment company under Subchapter M of the Internal Revenue Code, including distributing substantially all of its taxable income and realized gains. As a result, no provision for U.S. Federal income taxes is required. The Fund files a U.S. federal tax return, in addition to state and local tax returns as required. The Fund's federal income tax returns are subject to examination by the Internal Revenue Service (IRS) for a period of three fiscal years after they are filed. State and local tax returns may be subject to examination for an additional fiscal year depending on the jurisdiction. Foreign taxes are provided for based on the Fund's understanding of the tax rules and rates that exist in the foreign markets in which it invests.
Distributions are declared and recorded on the ex-dividend date. Income dividends and capital gain distributions are declared separately for each class. Income and capital gain distributions are determined in accordance with income tax regulations, which may differ from GAAP.
Capital accounts within the financial statements are adjusted for permanent book-tax differences. These adjustments have no impact on net assets or the results of operations. Capital accounts are not adjusted for temporary book-tax differences which will reverse in a subsequent period.
Book-tax differences are primarily due to foreign currency transactions, passive foreign investment companies (PFIC), expiring capital loss carryforwards, partnerships, deferred trustee compensation, capital loss carryforwards and losses deferred due to wash sales.
The federal tax cost of investment securities and unrealized appreciation (depreciation) as of period end were as follows:
| Gross unrealized appreciation | $68,795,133 |
| Gross unrealized depreciation | (12,578,266) |
| Net unrealized appreciation (depreciation) on securities | $56,216,867 |
| Tax cost | $367,405,788 |
Capital loss carryforwards are only available to offset future capital gains of the Fund to the extent provided by regulations and may be limited. Under the Regulated Investment Company Modernization Act of 2010 (the Act), the Fund is permitted to carry forward capital losses incurred in taxable years beginning after December 22, 2010 for an unlimited period and such capital losses are required to be used prior to any losses that expire. The capital loss carryforward information presented below, including any applicable limitation, is estimated as of prior fiscal period end and is subject to adjustment.
| Fiscal year of expiration | |
| 2017 | $(41,604,069) |
| 2018 | (26,887,863) |
| 2019 | (98,806,037) |
| Total with expiration | (167,297,969) |
| No expiration | |
| Short-term | (10,932,314) |
| Long-term | (16,850,008) |
| Total no expiration | (27,782,322) |
| Total capital loss carryforward | $(195,080,291) |
Due to large redemptions in a prior period, $141,955,883 of capital losses that will be available to offset future capital gains of the Fund will be limited to approximately $18,885,324 per year.
The Fund acquired $1,617,303 of its capital loss carryforward as part of a merger in a prior period. The losses acquired that will be available to offset future capital gains of the Fund will be limited to approximately $1,371,973 per year.
Short-Term Trading (Redemption) Fees. Shares held by investors in the Fund less than 90 days may have been subject to a redemption fee equal to 1.50% of the NAV of shares redeemed. All redemption fees, which reduce the proceeds of the shareholder redemption, are retained by the Fund and accounted for as an addition to paid in capital.
4. Purchases and Sales of Investments.
Purchases and sales of securities, other than short-term securities, aggregated $63,843,359 and $68,772,267, respectively.
5. Fees and Other Transactions with Affiliates.
Management Fee. Fidelity Management & Research Company (the investment adviser) and its affiliates provide the Fund with investment management related services for which the Fund pays a monthly management fee. The management fee is the sum of an individual fund fee rate that is based on an annual rate of .45% of the Fund's average net assets and an annualized group fee rate that averaged .25% during the period. The group fee rate is based upon the average net assets of all the mutual funds advised by the investment adviser, including any mutual funds previously advised by the investment adviser that are currently advised by Fidelity SelectCo, LLC, an affiliate of the investment adviser. The group fee rate decreases as assets under management increase and increases as assets under management decrease. In addition, the management fee is subject to a performance adjustment (up to a maximum of +/- .20% of the Fund's average net assets over a 36 month performance period). The upward or downward adjustment to the management fee is based on the relative investment performance of Japan as compared to its benchmark index, the TOPIX, over the same 36 month performance period. For the reporting period, the total annualized management fee rate, including the performance adjustment, was .48% of the Fund's average net assets. The performance adjustment included in the management fee rate may be higher or lower than the maximum performance adjustment rate due to the difference between the average net assets for the reporting and performance periods.
Distribution and Service Plan Fees. In accordance with Rule 12b-1 of the 1940 Act, the Fund has adopted separate Distribution and Service Plans for each class of shares. Certain classes pay Fidelity Distributors Corporation (FDC), an affiliate of the investment adviser, separate Distribution and Service Fees, each of which is based on an annual percentage of each class' average net assets. In addition, FDC may pay financial intermediaries for selling shares of the Fund and providing shareholder support services. For the period, the Distribution and Service Fee rates, total fees and amounts retained by FDC were as follows:
| | Distribution
Fee | Service
Fee | Total Fees | Retained
by FDC |
| Class A | -% | .25% | $26,691 | $1,587 |
| Class M | .25% | .25% | 10,138 | 109 |
| Class C | .75% | .25% | 70,012 | 7,995 |
| | | | $106,841 | $9,691 |
Sales Load. FDC may receive a front-end sales charge of up to 5.75% for selling Class A shares and 3.50% for selling Class M shares, some of which is paid to financial intermediaries for selling shares of the Fund. Depending on the holding period, FDC may receive contingent deferred sales charges levied on Class A, Class M and Class C redemptions. The deferred sales charges are 1.00% for Class C shares, 1.00% for certain purchases of Class A shares and .25% for certain purchases of Class M shares.
For the period, sales charge amounts retained by FDC were as follows:
| | Retained
by FDC |
| Class A | $2,313 |
| Class M | 436 |
| Class C(a) | 600 |
| | $3,349 |
(a) When Class C shares are initially sold, FDC pays commissions from its own resources to financial intermediaries through which the sales are made.
Transfer Agent Fees. Fidelity Investments Institutional Operations Company, Inc., (FIIOC), an affiliate of the investment adviser, is the transfer, dividend disbursing and shareholder servicing agent for each class of the Fund. FIIOC receives account fees and asset-based fees that vary according to the account size and type of account of the shareholders of the respective classes of the Fund. FIIOC pays for typesetting, printing and mailing of shareholder reports, except proxy statements.
For the period, transfer agent fees for each class were as follows:
| | Amount | % of
Class-Level Average
Net Assets(a) |
| Class A | $25,262 | .24 |
| Class M | 6,877 | .34 |
| Class C | 13,881 | .20 |
| Japan | 344,879 | .20 |
| Class I | 21,343 | .15 |
| | $412,242 | |
(a) Annualized
Accounting and Security Lending Fees. Fidelity Service Company, Inc. (FSC), an affiliate of the investment adviser, maintains the Fund's accounting records. The accounting fee is based on the level of average net assets for each month. Under a separate contract, FSC administers the security lending program. The security lending fee is based on the number and duration of lending transactions.
Interfund Trades. The Fund may purchase from or sell securities to other Fidelity Funds under procedures adopted by the Board. The procedures have been designed to ensure these interfund trades are executed in accordance with Rule 17a-7 of the 1940 Act. Interfund trades are included within the respective purchases and sales amounts shown in the Purchases and Sales of Investments note.
6. Committed Line of Credit.
The Fund participates with other funds managed by the investment adviser or an affiliate in a $4.25 billion credit facility (the "line of credit") to be utilized for temporary or emergency purposes to fund shareholder redemptions or for other short-term liquidity purposes. The Fund has agreed to pay commitment fees on its pro-rata portion of the line of credit, which amounted to $686 and is reflected in Miscellaneous expenses on the Statement of Operations. During the period, the Fund did not borrow on this line of credit.
7. Security Lending.
The Fund lends portfolio securities through a lending agent from time to time in order to earn additional income. For equity securities, a lending agent is used and may loan securities to certain qualified borrowers, including Fidelity Capital Markets (FCM), a broker-dealer affiliated with the Fund. On the settlement date of the loan, the Fund receives collateral (in the form of U.S. Treasury obligations, letters of credit and/or cash) against the loaned securities and maintains collateral in an amount not less than 100% of the market value of the loaned securities during the period of the loan. The market value of the loaned securities is determined at the close of business of the Fund and any additional required collateral is delivered to the Fund on the next business day. The Fund or borrower may terminate the loan at any time, and if the borrower defaults on its obligation to return the securities loaned because of insolvency or other reasons, the Fund may apply collateral received from the borrower against the obligation. The Fund may experience delays and costs in recovering the securities loaned. Any cash collateral received is invested in the Fidelity Securities Lending Cash Central Fund. The value of loaned securities and cash collateral at period end are disclosed on the Fund's Statement of Assets and Liabilities. Security lending income represents the income earned on investing cash collateral, less rebates paid to borrowers and any lending agent fees associated with the loan, plus any premium payments received for lending certain types of securities. Security lending income is presented in the Statement of Operations as a component of income from Fidelity Central Funds. Total security lending income during the period amounted to $60,511. During the period, there were no securities loaned to FCM.
8. Expense Reductions.
Commissions paid to certain brokers with whom the investment adviser, or its affiliates, places trades on behalf of the Fund include an amount in addition to trade execution, which may be rebated back to the Fund to offset certain expenses. This amount totaled $11,557 for the period.
In addition, during the period the investment adviser reimbursed and/or waived a portion of fund-level operating expenses in the amount of $1,784.
9. Distributions to Shareholders.
Distributions to shareholders of each class were as follows:
| | Six months ended April 30, 2017 | Year ended October 31, 2016 |
| From net investment income | | |
| Class A | $104,209 | $121,415 |
| Class M | 3,257 | 822 |
| Japan | 3,209,793 | 2,828,514 |
| Class I | 51,808 | 76,342 |
| Total | $3,369,067 | $3,027,093 |
| From net realized gain | | |
| Class A | $59,052 | $14,867 |
| Class M | 11,074 | 2,466 |
| Japan | 974,401 | 245,958 |
| Class I | 16,013 | 7,047 |
| Total | $1,060,540 | $270,338 |
10. Share Transactions.
Share transactions for each class were as follows and may contain automatic conversions between classes or exchanges between affiliated funds:
| | Shares | Shares | Dollars | Dollars |
| | Six months ended
April 30, 2017 | Year ended October 31, 2016 | Six months ended
April 30, 2017 | Year ended October 31, 2016 |
| Class A | | | | |
| Shares sold | 90,851 | 813,081 | $1,138,031 | $9,592,333 |
| Reinvestment of distributions | 12,680 | 10,746 | 155,198 | 128,096 |
| Shares redeemed | (393,820) | (938,856) | (4,893,260) | (10,914,042) |
| Net increase (decrease) | (290,289) | (115,029) | $(3,600,031) | $(1,193,613) |
| Class M | | | | |
| Shares sold | 26,155 | 36,363 | $328,798 | $424,255 |
| Reinvestment of distributions | 1,137 | 269 | 13,940 | 3,216 |
| Shares redeemed | (41,317) | (108,870) | (515,437) | (1,266,529) |
| Net increase (decrease) | (14,025) | (72,238) | $(172,699) | $(839,058) |
| Class B | | | | |
| Shares sold | – | 1,967 | $– | $21,930 |
| Shares redeemed | – | (31,378) | – | (356,692) |
| Net increase (decrease) | – | (29,411) | $– | $(334,762) |
| Class C | | | | |
| Shares sold | 57,340 | 261,804 | $708,106 | $3,054,392 |
| Shares redeemed | (204,806) | (621,443) | (2,527,380) | (7,129,408) |
| Net increase (decrease) | (147,466) | (359,639) | $(1,819,274) | $(4,075,016) |
| Japan | | | | |
| Shares sold | 4,396,651 | 4,048,778 | $54,385,476 | $48,328,822 |
| Reinvestment of distributions | 332,957 | 251,274 | 4,075,396 | 3,000,214 |
| Shares redeemed | (15,738,057) | (17,176,238) | (197,795,472) | (197,588,759) |
| Net increase (decrease) | (11,008,449) | (12,876,186) | $(139,334,600) | $(146,259,723) |
| Class I | | | | |
| Shares sold | 11,564,746 | 323,014 | $145,383,208 | $3,826,994 |
| Reinvestment of distributions | 4,957 | 6,575 | 60,627 | 78,372 |
| Shares redeemed | (387,481) | (946,812) | (4,915,366) | (10,911,965) |
| Net increase (decrease) | 11,182,222 | (617,223) | $140,528,469 | $(7,006,599) |
11. Other.
The Fund's organizational documents provide former and current trustees and officers with a limited indemnification against liabilities arising in connection with the performance of their duties to the Fund. In the normal course of business, the Fund may also enter into contracts that provide general indemnifications. The Fund's maximum exposure under these arrangements is unknown as this would be dependent on future claims that may be made against the Fund. The risk of material loss from such claims is considered remote.
At the end of the period, Strategic Advisers International Fund and Strategic Advisers International II Fund were the owners of record of approximately 12% and 23%, respectively, of the total outstanding shares of the Fund. Mutual Funds managed by the investment adviser or its affiliates were the owners of record, in the aggregate, of approximately 51% of the total outstanding shares of the Fund.
Fidelity® Japan Smaller Companies Fund
Investment Summary (Unaudited)
Geographic Diversification (% of fund's net assets)
| As of April 30, 2017 |
| | Japan | 98.0% |
| | United States of America* | 2.0% |

* Includes Short-Term investments and Net Other Assets (Liabilities).
Percentages are based on country or territory of incorporation and are adjusted for the effect of futures contracts, if applicable.
| As of October 31, 2016 |
| | Japan | 97.9% |
| | United States of America* | 2.1% |

* Includes Short-Term investments and Net Other Assets (Liabilities).
Percentages are based on country or territory of incorporation and are adjusted for the effect of futures contracts, if applicable.
Asset Allocation as of April 30, 2017
| | % of fund's net assets | % of fund's net assets 6 months ago |
| Stocks | 98.0 | 97.9 |
| Short-Term Investments and Net Other Assets (Liabilities) | 2.0 | 2.1 |
Top Ten Stocks as of April 30, 2017
| | % of fund's net assets | % of fund's net assets 6 months ago |
| Elecom Co. Ltd. (Technology Hardware, Storage & Peripherals) | 2.1 | 2.4 |
| Kotobuki Spirits Co. Ltd. (Food Products) | 2.0 | 1.7 |
| Fujitsu Ltd. (IT Services) | 1.9 | 0.0 |
| ORIX Corp. (Diversified Financial Services) | 1.8 | 1.9 |
| Mitsubishi Shokuhin Co. Ltd. (Food & Staples Retailing) | 1.8 | 1.9 |
| Mitsubishi Chemical Holdings Corp. (Chemicals) | 1.8 | 1.0 |
| Amano Corp. (Electronic Equipment & Components) | 1.7 | 1.9 |
| A/S One Corp. (Health Care Providers & Services) | 1.7 | 1.8 |
| Sumitomo Electric Industries Ltd. (Auto Components) | 1.7 | 1.2 |
| Tokyo Gas Co. Ltd. (Gas Utilities) | 1.7 | 1.6 |
| | 18.2 | |
Top Market Sectors as of April 30, 2017
| | % of fund's net assets | % of fund's net assets 6 months ago |
| Industrials | 23.9 | 22.7 |
| Consumer Discretionary | 20.3 | 19.1 |
| Information Technology | 11.1 | 10.2 |
| Materials | 10.1 | 8.2 |
| Financials | 10.1 | 9.4 |
| Consumer Staples | 9.5 | 11.0 |
| Health Care | 5.3 | 7.3 |
| Utilities | 3.5 | 3.6 |
| Energy | 2.1 | 2.0 |
| Real Estate | 1.6 | 2.8 |
Percentages shown as 0.0% may reflect amounts less than 0.05%.
Fidelity® Japan Smaller Companies Fund
Investments April 30, 2017 (Unaudited)
Showing Percentage of Net Assets
| Common Stocks - 98.0% | | | |
| | | Shares | Value |
| CONSUMER DISCRETIONARY - 20.3% | | | |
| Auto Components - 4.4% | | | |
| Bridgestone Corp. | | 224,900 | $9,377,306 |
| Hi-Lex Corp. | | 271,100 | 6,697,550 |
| Sumitomo Electric Industries Ltd. | | 644,500 | 10,502,214 |
| | | | 26,577,070 |
| Automobiles - 1.9% | | | |
| Isuzu Motors Ltd. | | 450,000 | 6,103,611 |
| Subaru Corp. | | 149,000 | 5,629,854 |
| | | | 11,733,465 |
| Distributors - 3.1% | | | |
| Central Automotive Products Ltd. | | 885,000 | 9,169,545 |
| Chori Co. Ltd. | | 346,100 | 6,169,102 |
| PALTAC Corp. | | 130,000 | 3,836,735 |
| | | | 19,175,382 |
| Diversified Consumer Services - 0.5% | | | |
| Asante, Inc. | | 207,500 | 3,155,080 |
| Hotels, Restaurants & Leisure - 1.7% | | | |
| KOMEDA Holdings Co. Ltd. (a) | | 189,500 | 3,268,971 |
| Koshidaka Holdings Co. Ltd. | | 286,600 | 7,077,908 |
| | | | 10,346,879 |
| Household Durables - 0.6% | | | |
| Panasonic Corp. | | 305,000 | 3,647,266 |
| Media - 1.3% | | | |
| Daiichikosho Co. Ltd. | | 187,900 | 8,149,778 |
| Specialty Retail - 5.7% | | | |
| Arc Land Sakamoto Co. Ltd. | | 466,700 | 5,773,306 |
| Fuji Corp. | | 303,300 | 5,447,020 |
| Nitori Holdings Co. Ltd. | | 68,600 | 8,929,231 |
| VT Holdings Co. Ltd. | | 1,487,400 | 7,565,425 |
| Workman Co. Ltd. | | 237,000 | 6,930,881 |
| | | | 34,645,863 |
| Textiles, Apparel & Luxury Goods - 1.1% | | | |
| Hagihara Industries, Inc. | | 282,800 | 6,727,837 |
|
| TOTAL CONSUMER DISCRETIONARY | | | 124,158,620 |
|
| CONSUMER STAPLES - 9.5% | | | |
| Food & Staples Retailing - 3.1% | | | |
| Mitsubishi Shokuhin Co. Ltd. | | 342,300 | 10,946,845 |
| San-A Co. Ltd. | | 184,000 | 8,368,513 |
| | | | 19,315,358 |
| Food Products - 5.9% | | | |
| Japan Meat Co. Ltd. | | 487,400 | 8,110,581 |
| Kotobuki Spirits Co. Ltd. (a) | | 444,000 | 11,968,782 |
| Morinaga & Co. Ltd. | | 154,700 | 7,313,469 |
| S Foods, Inc. (a) | | 282,700 | 8,812,581 |
| | | | 36,205,413 |
| Tobacco - 0.5% | | | |
| Japan Tobacco, Inc. | | 90,000 | 2,992,061 |
|
| TOTAL CONSUMER STAPLES | | | 58,512,832 |
|
| ENERGY - 2.1% | | | |
| Energy Equipment & Services - 1.0% | | | |
| Shinko Plantech Co. Ltd. | | 798,000 | 5,963,077 |
| Oil, Gas & Consumable Fuels - 1.1% | | | |
| San-Ai Oil Co. Ltd. | | 820,800 | 6,965,479 |
|
| TOTAL ENERGY | | | 12,928,556 |
|
| FINANCIALS - 10.1% | | | |
| Banks - 3.6% | | | |
| Fukuoka Financial Group, Inc. | | 1,272,000 | 5,796,600 |
| Mitsubishi UFJ Financial Group, Inc. | | 1,224,600 | 7,759,796 |
| Shinsei Bank Ltd. | | 4,483,000 | 8,364,781 |
| | | | 21,921,177 |
| Consumer Finance - 0.9% | | | |
| AEON Financial Service Co. Ltd. | | 291,600 | 5,600,499 |
| Diversified Financial Services - 2.8% | | | |
| Fuyo General Lease Co. Ltd. | | 135,300 | 6,311,370 |
| ORIX Corp. | | 731,800 | 11,166,556 |
| | | | 17,477,926 |
| Insurance - 2.8% | | | |
| T&D Holdings, Inc. | | 578,000 | 8,573,429 |
| Tokio Marine Holdings, Inc. | | 199,500 | 8,396,986 |
| | | | 16,970,415 |
|
| TOTAL FINANCIALS | | | 61,970,017 |
|
| HEALTH CARE - 5.3% | | | |
| Health Care Equipment & Supplies - 2.4% | | | |
| Medikit Co. Ltd. | | 208,200 | 8,666,051 |
| Paramount Bed Holdings Co. Ltd. | | 138,900 | 5,825,140 |
| | | | 14,491,191 |
| Health Care Providers & Services - 1.7% | | | |
| A/S One Corp. | | 241,000 | 10,669,074 |
| Pharmaceuticals - 1.2% | | | |
| Astellas Pharma, Inc. | | 543,500 | 7,167,195 |
|
| TOTAL HEALTH CARE | | | 32,327,460 |
|
| INDUSTRIALS - 23.9% | | | |
| Air Freight & Logistics - 0.8% | | | |
| AIT Corp. | | 525,400 | 4,807,428 |
| Airlines - 1.1% | | | |
| Japan Airlines Co. Ltd. | | 214,600 | 6,776,336 |
| Building Products - 3.3% | | | |
| Sekisui Jushi Corp. | | 581,300 | 10,241,518 |
| Sinko Industries Ltd. | | 621,300 | 9,653,210 |
| | | | 19,894,728 |
| Commercial Services & Supplies - 2.6% | | | |
| Aeon Delight Co. Ltd. | | 281,300 | 8,579,682 |
| ProNexus, Inc. | | 594,900 | 7,449,925 |
| | | | 16,029,607 |
| Construction & Engineering - 2.2% | | | |
| Hokuriku Electrical Construction Co. Ltd. | | 859,300 | 6,675,522 |
| Toshiba Plant Systems & Services Corp. | | 431,500 | 7,017,802 |
| | | | 13,693,324 |
| Electrical Equipment - 2.0% | | | |
| Aichi Electric Co. Ltd. | | 175,100 | 4,319,578 |
| Denyo Co. Ltd. | | 543,100 | 7,960,757 |
| | | | 12,280,335 |
| Machinery - 2.5% | | | |
| Mitsubishi Heavy Industries Ltd. | | 1,677,000 | 6,709,504 |
| NGK Insulators Ltd. | | 399,000 | 8,522,261 |
| | | | 15,231,765 |
| Marine - 0.9% | | | |
| Nippon Concept Corp. | | 490,000 | 5,758,242 |
| Professional Services - 3.1% | | | |
| Funai Soken Holdings, Inc. | | 349,320 | 6,712,208 |
| Meitec Corp. | | 80,900 | 3,494,357 |
| Yamada Consulting Group Co. Ltd. | | 190,600 | 8,737,080 |
| | | | 18,943,645 |
| Trading Companies & Distributors - 4.0% | | | |
| Inaba Denki Sangyo Co. Ltd. | | 228,800 | 8,312,536 |
| Mitani Shoji Co. Ltd. | | 98,100 | 3,058,062 |
| Trusco Nakayama Corp. | | 295,500 | 6,746,333 |
| Yuasa Trading Co. Ltd. | | 220,800 | 6,387,800 |
| | | | 24,504,731 |
| Transportation Infrastructure - 1.4% | | | |
| Kamigumi Co. Ltd. | | 924,000 | 8,388,320 |
|
| TOTAL INDUSTRIALS | | | 146,308,461 |
|
| INFORMATION TECHNOLOGY - 11.1% | | | |
| Electronic Equipment & Components - 2.8% | | | |
| Amano Corp. | | 503,200 | 10,743,360 |
| Dexerials Corp. | | 731,500 | 6,575,133 |
| | | | 17,318,493 |
| Internet Software & Services - 0.4% | | | |
| Aucnet, Inc. | | 220,200 | 2,656,820 |
| IT Services - 4.1% | | | |
| Fujitsu Ltd. | | 1,820,000 | 11,343,673 |
| Otsuka Corp. | | 131,000 | 7,015,654 |
| TKC Corp. | | 238,200 | 6,474,510 |
| | | | 24,833,837 |
| Software - 1.7% | | | |
| Broadleaf Co. Ltd. | | 624,000 | 4,047,114 |
| Oracle Corp. Japan | | 114,200 | 6,576,937 |
| | | | 10,624,051 |
| Technology Hardware, Storage & Peripherals - 2.1% | | | |
| Elecom Co. Ltd. | | 618,500 | 12,783,349 |
|
| TOTAL INFORMATION TECHNOLOGY | | | 68,216,550 |
|
| MATERIALS - 10.1% | | | |
| Chemicals - 7.1% | | | |
| C. Uyemura & Co. Ltd. | | 131,400 | 6,883,839 |
| Lintec Corp. | | 458,000 | 10,082,368 |
| Mitsubishi Chemical Holdings Corp. | | 1,379,800 | 10,797,036 |
| Sakata INX Corp. | | 584,000 | 8,245,939 |
| SK Kaken Co. Ltd. | | 83,000 | 7,892,353 |
| | | | 43,901,535 |
| Construction Materials - 1.4% | | | |
| Taiheiyo Cement Corp. | | 2,515,000 | 8,370,173 |
| Metals & Mining - 1.6% | | | |
| JFE Holdings, Inc. | | 572,000 | 9,751,837 |
|
| TOTAL MATERIALS | | | 62,023,545 |
|
| REAL ESTATE - 1.6% | | | |
| Real Estate Management & Development - 1.6% | | | |
| Century21 Real Estate Japan Ltd. | | 275,400 | 3,550,122 |
| Daito Trust Construction Co. Ltd. | | 42,400 | 6,237,811 |
| | | | 9,787,933 |
| TELECOMMUNICATION SERVICES - 0.5% | | | |
| Wireless Telecommunication Services - 0.5% | | | |
| KDDI Corp. | | 107,900 | 2,860,869 |
| UTILITIES - 3.5% | | | |
| Electric Utilities - 1.8% | | | |
| Hokuriku Electric Power Co., Inc. | | 384,600 | 3,553,604 |
| The Okinawa Electric Power Co., Inc. | | 324,175 | 7,906,991 |
| | | | 11,460,595 |
| Gas Utilities - 1.7% | | | |
| Tokyo Gas Co. Ltd. | | 2,211,000 | 10,264,118 |
|
| TOTAL UTILITIES | | | 21,724,713 |
|
| TOTAL COMMON STOCKS | | | |
| (Cost $479,865,174) | | | 600,819,556 |
|
| Money Market Funds - 2.7% | | | |
| Fidelity Cash Central Fund, 0.85% (b) | | 7,132,813 | 7,134,240 |
| Fidelity Securities Lending Cash Central Fund 0.86% (b)(c) | | 9,418,265 | 9,419,206 |
| TOTAL MONEY MARKET FUNDS | | | |
| (Cost $16,553,128) | | | 16,553,446 |
| TOTAL INVESTMENT PORTFOLIO - 100.7% | | | |
| (Cost $496,418,302) | | | 617,373,002 |
| NET OTHER ASSETS (LIABILITIES) - (0.7)% | | | (4,400,339) |
| NET ASSETS - 100% | | | $612,972,663 |
Legend
(a) Security or a portion of the security is on loan at period end.
(b) Affiliated fund that is generally available only to investment companies and other accounts managed by Fidelity Investments. The rate quoted is the annualized seven-day yield of the fund at period end. A complete unaudited listing of the fund's holdings as of its most recent quarter end is available upon request. In addition, each Fidelity Central Fund's financial statements are available on the SEC's website or upon request.
(c) Investment made with cash collateral received from securities on loan.
Affiliated Central Funds
Information regarding fiscal year to date income earned by the Fund from investments in Fidelity Central Funds is as follows:
| Fund | Income earned |
| Fidelity Cash Central Fund | $22,095 |
| Fidelity Securities Lending Cash Central Fund | 81,933 |
| Total | $104,028 |
Investment Valuation
The following is a summary of the inputs used, as of April 30, 2017, involving the Fund's assets and liabilities carried at fair value. The inputs or methodology used for valuing securities may not be an indication of the risk associated with investing in those securities. For more information on valuation inputs, and their aggregation into the levels used below, please refer to the Investment Valuation section in the accompanying Notes to Financial Statements.
| | Valuation Inputs at Reporting Date: |
| Description | Total | Level 1 | Level 2 | Level 3 |
| Investments in Securities: | | | | |
| Equities: | | | | |
| Consumer Discretionary | $124,158,620 | $120,511,354 | $3,647,266 | $-- |
| Consumer Staples | 58,512,832 | 58,512,832 | -- | -- |
| Energy | 12,928,556 | 12,928,556 | -- | -- |
| Financials | 61,970,017 | 54,210,221 | 7,759,796 | -- |
| Health Care | 32,327,460 | 25,160,265 | 7,167,195 | -- |
| Industrials | 146,308,461 | 146,308,461 | -- | -- |
| Information Technology | 68,216,550 | 68,216,550 | -- | -- |
| Materials | 62,023,545 | 62,023,545 | -- | -- |
| Real Estate | 9,787,933 | 9,787,933 | -- | -- |
| Telecommunication Services | 2,860,869 | -- | 2,860,869 | -- |
| Utilities | 21,724,713 | 21,724,713 | -- | -- |
| Money Market Funds | 16,553,446 | 16,553,446 | -- | -- |
| Total Investments in Securities: | $617,373,002 | $595,937,876 | $21,435,126 | $-- |
See accompanying notes which are an integral part of the financial statements.
Fidelity® Japan Smaller Companies Fund
Financial Statements
Statement of Assets and Liabilities
| | | April 30, 2017 (Unaudited) |
| Assets | | |
Investment in securities, at value (including securities loaned of $8,964,893) — See accompanying schedule:
Unaffiliated issuers (cost $479,865,174) | $600,819,556 | |
| Fidelity Central Funds (cost $16,553,128) | 16,553,446 | |
| Total Investments (cost $496,418,302) | | $617,373,002 |
| Receivable for investments sold | | 650,115 |
| Receivable for fund shares sold | | 160,656 |
| Dividends receivable | | 5,946,713 |
| Distributions receivable from Fidelity Central Funds | | 26,117 |
| Prepaid expenses | | 376 |
| Other receivables | | 13,483 |
| Total assets | | 624,170,462 |
| Liabilities | | |
| Payable for investments purchased | $976,652 | |
| Payable for fund shares redeemed | 295,352 | |
| Accrued management fee | 349,860 | |
| Other affiliated payables | 114,590 | |
| Other payables and accrued expenses | 42,030 | |
| Collateral on securities loaned | 9,419,315 | |
| Total liabilities | | 11,197,799 |
| Net Assets | | $612,972,663 |
| Net Assets consist of: | | |
| Paid in capital | | $489,044,854 |
| Undistributed net investment income | | 4,172,450 |
| Accumulated undistributed net realized gain (loss) on investments and foreign currency transactions | | (1,179,350) |
| Net unrealized appreciation (depreciation) on investments and assets and liabilities in foreign currencies | | 120,934,709 |
| Net Assets, for 38,278,035 shares outstanding | | $612,972,663 |
| Net Asset Value, offering price and redemption price per share ($612,972,663 ÷ 38,278,035 shares) | | $16.01 |
See accompanying notes which are an integral part of the financial statements.
Statement of Operations
| | | Six months ended April 30, 2017 (Unaudited) |
| Investment Income | | |
| Dividends | | $7,618,683 |
| Income from Fidelity Central Funds | | 104,028 |
| Income before foreign taxes withheld | | 7,722,711 |
| Less foreign taxes withheld | | (730,853) |
| Total income | | 6,991,858 |
| Expenses | | |
| Management fee | $2,033,451 | |
| Transfer agent fees | 527,602 | |
| Accounting and security lending fees | 147,611 | |
| Custodian fees and expenses | 33,427 | |
| Independent trustees' fees and expenses | 1,177 | |
| Registration fees | 12,304 | |
| Audit | 35,328 | |
| Legal | 672 | |
| Miscellaneous | 2,272 | |
| Total expenses before reductions | 2,793,844 | |
| Expense reductions | (27,561) | 2,766,283 |
| Net investment income (loss) | | 4,225,575 |
| Realized and Unrealized Gain (Loss) | | |
| Net realized gain (loss) on: | | |
| Investment securities: | | |
| Unaffiliated issuers | 15,747,900 | |
| Fidelity Central Funds | 335 | |
| Foreign currency transactions | (490,498) | |
| Total net realized gain (loss) | | 15,257,737 |
Change in net unrealized appreciation (depreciation) on:
Investment securities | 10,114,740 | |
| Assets and liabilities in foreign currencies | 137,402 | |
| Total change in net unrealized appreciation (depreciation) | | 10,252,142 |
| Net gain (loss) | | 25,509,879 |
| Net increase (decrease) in net assets resulting from operations | | $29,735,454 |
See accompanying notes which are an integral part of the financial statements.
Statement of Changes in Net Assets
| | Six months ended April 30, 2017 (Unaudited) | Year ended October 31, 2016 |
| Increase (Decrease) in Net Assets | | |
| Operations | | |
| Net investment income (loss) | $4,225,575 | $6,457,657 |
| Net realized gain (loss) | 15,257,737 | 13,937,326 |
| Change in net unrealized appreciation (depreciation) | 10,252,142 | 60,582,606 |
| Net increase (decrease) in net assets resulting from operations | 29,735,454 | 80,977,589 |
| Distributions to shareholders from net investment income | (6,334,246) | (3,361,556) |
| Distributions to shareholders from net realized gain | (9,182,783) | (3,952,599) |
| Total distributions | (15,517,029) | (7,314,155) |
| Share transactions | | |
| Proceeds from sales of shares | 38,726,891 | 106,869,419 |
| Reinvestment of distributions | 14,528,831 | 6,515,367 |
| Cost of shares redeemed | (41,554,956) | (102,939,703) |
| Net increase (decrease) in net assets resulting from share transactions | 11,700,766 | 10,445,083 |
| Redemption fees | 19,339 | 83,902 |
| Total increase (decrease) in net assets | 25,938,530 | 84,192,419 |
| Net Assets | | |
| Beginning of period | 587,034,133 | 502,841,714 |
| End of period | $612,972,663 | $587,034,133 |
| Other Information | | |
| Undistributed net investment income end of period | $4,172,450 | $6,281,121 |
| Shares | | |
| Sold | 2,533,103 | 7,750,747 |
| Issued in reinvestment of distributions | 984,338 | 472,128 |
| Redeemed | (2,721,689) | (7,291,814) |
| Net increase (decrease) | 795,752 | 931,061 |
See accompanying notes which are an integral part of the financial statements.
Financial Highlights — Fidelity Japan Smaller Companies Fund
| | Six months ended (Unaudited) April 30, | Years ended October 31, | | | | |
| | 2017 | 2016 | 2015 | 2014 | 2013 | 2012 |
| Selected Per–Share Data | | | | | | |
| Net asset value, beginning of period | $15.66 | $13.76 | $13.10 | $13.86 | $9.12 | $8.62 |
| Income from Investment Operations | | | | | | |
| Net investment income (loss)A | .11 | .17 | .10 | .09 | .02 | .06 |
| Net realized and unrealized gain (loss) | .65 | 1.93 | .78 | (.53) | 4.91 | .55 |
| Total from investment operations | .76 | 2.10 | .88 | (.44) | 4.93 | .61 |
| Distributions from net investment income | (.17) | (.09) | (.03) | (.02) | (.07) | (.08) |
| Distributions from net realized gain | (.25) | (.11) | (.19) | (.31) | (.15) | (.03) |
| Total distributions | (.41)B | (.20) | (.22) | (.33) | (.22) | (.11) |
| Redemption fees added to paid in capitalA | –C | –C | –C | .01 | .03 | –C |
| Net asset value, end of period | $16.01 | $15.66 | $13.76 | $13.10 | $13.86 | $9.12 |
| Total ReturnD,E | 5.10% | 15.44% | 6.93% | (3.16)% | 55.79% | 7.13% |
| Ratios to Average Net AssetsF,G | | | | | | |
| Expenses before reductions | .96%H | .96% | .98% | 1.00% | 1.01% | 1.05% |
| Expenses net of fee waivers, if any | .96%H | .96% | .98% | 1.00% | 1.01% | 1.05% |
| Expenses net of all reductions | .95%H | .96% | .97% | 1.00% | .98% | 1.02% |
| Net investment income (loss) | 1.45%H | 1.18% | .77% | .70% | .18% | .67% |
| Supplemental Data | | | | | | |
| Net assets, end of period (000 omitted) | $612,973 | $587,034 | $502,842 | $416,052 | $661,445 | $237,893 |
| Portfolio turnover rateI | 35%H | 30% | 41% | 112% | 91% | 86% |
A Calculated based on average shares outstanding during the period.
B Total distributions of $.41 per share is comprised of distributions from net investment income of $.169 and distributions from net realized gain of $.245 per share.
C Amount represents less than $.005 per share.
D Total returns for periods of less than one year are not annualized.
E Total returns would have been lower if certain expenses had not been reduced during the applicable periods shown.
F Fees and expenses of any underlying Fidelity Central Funds are not included in the Fund's expense ratio. The Fund indirectly bears its proportionate share of the expenses of any underlying Fidelity Central Funds.
G Expense ratios reflect operating expenses of the Fund. Expenses before reductions do not reflect amounts reimbursed by the investment adviser or reductions from brokerage service arrangements or reductions from other expense offset arrangements and do not represent the amount paid by the Fund during periods when reimbursements or reductions occur. Expenses net of fee waivers reflect expenses after reimbursement by the investment adviser but prior to reductions from brokerage service arrangements or other expense offset arrangements. Expenses net of all reductions represent the net expenses paid by the Fund.
H Annualized
I Amount does not include the portfolio activity of any underlying Fidelity Central Funds.
See accompanying notes which are an integral part of the financial statements.
Notes to Financial Statements (Unaudited)
For the period ended April 30, 2017
1. Organization.
Fidelity Japan Smaller Companies Fund (the Fund) is a fund of Fidelity Investment Trust (the Trust) and is authorized to issue an unlimited number of shares. Share transactions on the Statement of Changes in Net Assets may contain exchanges between affiliated funds. The Trust is registered under the Investment Company Act of 1940, as amended (the 1940 Act), as an open-end management investment company organized as a Massachusetts business trust.
2. Investments in Fidelity Central Funds.
The Fund invests in Fidelity Central Funds, which are open-end investment companies generally available only to other investment companies and accounts managed by the investment adviser and its affiliates. The Fund's Schedule of Investments lists each of the Fidelity Central Funds held as of period end, if any, as an investment of the Fund, but does not include the underlying holdings of each Fidelity Central Fund. As an Investing Fund, the Fund indirectly bears its proportionate share of the expenses of the underlying Fidelity Central Funds.
The Money Market Central Funds seek preservation of capital and current income and are managed by Fidelity Investments Money Management, Inc. (FIMM), an affiliate of the investment adviser. Annualized expenses of the Money Market Central Funds as of their most recent shareholder report date are less than .005%.
A complete unaudited list of holdings for each Fidelity Central Fund is available upon request or at the Securities and Exchange Commission (the SEC) website at www.sec.gov. In addition, the financial statements of the Fidelity Central Funds are available on the SEC website or upon request.
3. Significant Accounting Policies.
The Fund is an investment company and applies the accounting and reporting guidance of the Financial Accounting Standards Board (FASB) Accounting Standards Codification Topic 946 Financial Services – Investments Companies. The financial statements have been prepared in conformity with accounting principles generally accepted in the United States of America (GAAP), which require management to make certain estimates and assumptions at the date of the financial statements. Actual results could differ from those estimates. Subsequent events, if any, through the date that the financial statements were issued have been evaluated in the preparation of the financial statements. The following summarizes the significant accounting policies of the Fund:
Investment Valuation. Investments are valued as of 4:00 p.m. Eastern time on the last calendar day of the period. The Board of Trustees (the Board) has delegated the day to day responsibility for the valuation of the Fund's investments to the Fair Value Committee (the Committee) established by the Fund's investment adviser. In accordance with valuation policies and procedures approved by the Board, the Fund attempts to obtain prices from one or more third party pricing vendors or brokers to value its investments. When current market prices, quotations or currency exchange rates are not readily available or reliable, investments will be fair valued in good faith by the Committee, in accordance with procedures adopted by the Board. Factors used in determining fair value vary by investment type and may include market or investment specific events. The frequency with which these procedures are used cannot be predicted and they may be utilized to a significant extent. The Committee oversees the Fund's valuation policies and procedures and reports to the Board on the Committee's activities and fair value determinations. The Board monitors the appropriateness of the procedures used in valuing the Fund's investments and ratifies the fair value determinations of the Committee.
The Fund categorizes the inputs to valuation techniques used to value its investments into a disclosure hierarchy consisting of three levels as shown below:
- Level 1 – quoted prices in active markets for identical investments
- Level 2 – other significant observable inputs (including quoted prices for similar investments, interest rates, prepayment speeds, etc.)
- Level 3 – unobservable inputs (including the Fund's own assumptions based on the best information available)
Valuation techniques used to value the Fund's investments by major category are as follows:
Equity securities, including restricted securities, for which market quotations are readily available, are valued at the last reported sale price or official closing price as reported by a third party pricing vendor on the primary market or exchange on which they are traded and are categorized as Level 1 in the hierarchy. In the event there were no sales during the day or closing prices are not available, securities are valued at the last quoted bid price or may be valued using the last available price and are generally categorized as Level 2 in the hierarchy. For foreign equity securities, when market or security specific events arise, comparisons to the valuation of American Depositary Receipts (ADRs), futures contracts, Exchange-Traded Funds (ETFs) and certain indexes as well as quoted prices for similar securities may be used and would be categorized as Level 2 in the hierarchy. Utilizing these techniques may result in transfers between Level 1 and Level 2. For equity securities, including restricted securities, where observable inputs are limited, assumptions about market activity and risk are used and these securities may be categorized as Level 3 in the hierarchy.
Investments in open-end mutual funds, including the Fidelity Central Funds, are valued at their closing net asset value (NAV) each business day and are categorized as Level 1 in the hierarchy.
Changes in valuation techniques may result in transfers in or out of an assigned level within the disclosure hierarchy. The aggregate value of investments by input level as of April 30, 2017 is included at the end of the Fund's Schedule of Investments.
Foreign Currency. The Fund may use foreign currency contracts to facilitate transactions in foreign-denominated securities. Gains and losses from these transactions may arise from changes in the value of the foreign currency or if the counterparties do not perform under the contracts' terms.
Foreign-denominated assets, including investment securities, and liabilities are translated into U.S. dollars at the exchange rates at period end. Purchases and sales of investment securities, income and dividends received and expenses denominated in foreign currencies are translated into U.S. dollars at the exchange rate in effect on the transaction date.
The effects of exchange rate fluctuations on investments are included with the net realized and unrealized gain (loss) on investment securities. Other foreign currency transactions resulting in realized and unrealized gain (loss) are disclosed separately.
Investment Transactions and Income. For financial reporting purposes, the Fund's investment holdings and NAV include trades executed through the end of the last business day of the period. The NAV per share for processing shareholder transactions is calculated as of the close of business of the New York Stock Exchange (NYSE), normally 4:00 p.m. Eastern time and includes trades executed through the end of the prior business day. Gains and losses on securities sold are determined on the basis of identified cost. Dividend income is recorded on the ex-dividend date, except for certain dividends from foreign securities where the ex-dividend date may have passed, which are recorded as soon as the Fund is informed of the ex-dividend date. Non-cash dividends included in dividend income, if any, are recorded at the fair market value of the securities received. Income and capital gain distributions from Fidelity Central Funds, if any, are recorded on the ex-dividend date. Investment income is recorded net of foreign taxes withheld where recovery of such taxes is uncertain.
Expenses. Expenses directly attributable to a fund are charged to that fund. Expenses attributable to more than one fund are allocated among the respective funds on the basis of relative net assets or other appropriate methods. Expense estimates are accrued in the period to which they relate and adjustments are made when actual amounts are known.
Income Tax Information and Distributions to Shareholders. Each year, the Fund intends to qualify as a regulated investment company under Subchapter M of the Internal Revenue Code, including distributing substantially all of its taxable income and realized gains. As a result, no provision for U.S. Federal income taxes is required. The Fund files a U.S. federal tax return, in addition to state and local tax returns as required. The Fund's federal income tax returns are subject to examination by the Internal Revenue Service (IRS) for a period of three fiscal years after they are filed. State and local tax returns may be subject to examination for an additional fiscal year depending on the jurisdiction. Foreign taxes are provided for based on the Fund's understanding of the tax rules and rates that exist in the foreign markets in which it invests.
Distributions are declared and recorded on the ex-dividend date. Income and capital gain distributions are determined in accordance with income tax regulations, which may differ from GAAP.
Capital accounts within the financial statements are adjusted for permanent book-tax differences. These adjustments have no impact on net assets or the results of operations. Capital accounts are not adjusted for temporary book-tax differences which will reverse in a subsequent period.
Book-tax differences are primarily due to foreign currency transactions, passive foreign investment companies (PFIC), deferred trustees compensation, capital loss carryforwards and losses deferred due to wash sales.
The federal tax cost of investment securities and unrealized appreciation (depreciation) as of period end were as follows:
| Gross unrealized appreciation | $120,635,893 |
| Gross unrealized depreciation | (10,387,554) |
| Net unrealized appreciation (depreciation) on securities | $110,248,339 |
| Tax cost | $507,124,663 |
Capital loss carryforwards are only available to offset future capital gains of the Fund to the extent provided by regulations and may be limited. Under the Regulated Investment Company Modernization Act of 2010 (the Act), the Fund is permitted to carry forward capital losses incurred in taxable years beginning after December 22, 2010 for an unlimited period and such capital losses are required to be used prior to any losses that expire. The capital loss carryforward information presented below, including any applicable limitation, is estimated as of prior fiscal period end and is subject to adjustment.
| No expiration | |
| Short-term | $(1,945,816) |
Short-Term Trading (Redemption) Fees. Shares held by investors in the Fund less than 90 days may have been subject to a redemption fee equal to 1.50% of the NAV of shares redeemed. All redemption fees, which reduce the proceeds of the shareholder redemption, are retained by the Fund and accounted for as an addition to paid in capital.
4. Purchases and Sales of Investments.
Purchases and sales of securities, other than short-term securities, aggregated $99,977,536 and $99,951,517, respectively.
5. Fees and Other Transactions with Affiliates.
Management Fee. Fidelity Management & Research Company (the investment adviser) and its affiliates provide the Fund with investment management related services for which the Fund pays a monthly management fee. The management fee is the sum of an individual fund fee rate that is based on an annual rate of .45% of the Fund's average net assets and an annualized group fee rate that averaged .25% during the period. The group fee rate is based upon the average net assets of all the mutual funds advised by the investment adviser, including any mutual funds previously advised by the investment adviser that are currently advised by Fidelity SelectCo, LLC, an affiliate of the investment adviser. The group fee rate decreases as assets under management increase and increases as assets under management decrease. For the reporting period, the total annualized management fee rate was .70% of the Fund's average net assets.
Transfer Agent Fees. Fidelity Investments Institutional Operations Company, Inc. (FIIOC), an affiliate of the investment adviser, is the Fund's transfer, dividend disbursing and shareholder servicing agent. FIIOC receives account fees and asset-based fees that vary according to account size and type of account. FIIOC pays for typesetting, printing and mailing of shareholder reports, except proxy statements. For the period, the transfer agent fees were equivalent to an annualized rate of .18% of average net assets.
Accounting and Security Lending Fees. Fidelity Service Company, Inc. (FSC), an affiliate of the investment adviser, maintains the Fund's accounting records. The accounting fee is based on the level of average net assets for each month. Under a separate contract, FSC administers the security lending program. The security lending fee is based on the number and duration of lending transactions.
Interfund Trades. The Fund may purchase from or sell securities to other Fidelity Funds under procedures adopted by the Board. The procedures have been designed to ensure these interfund trades are executed in accordance with Rule 17a-7 of the 1940 Act. Interfund trades are included within the respective purchases and sales amounts shown in the Purchases and Sales of Investments note.
6. Committed Line of Credit.
The Fund participates with other funds managed by the investment adviser or an affiliate in a $4.25 billion credit facility (the "line of credit") to be utilized for temporary or emergency purposes to fund shareholder redemptions or for other short-term liquidity purposes. The Fund has agreed to pay commitment fees on its pro-rata portion of the line of credit, which amounted to $984 and is reflected in Miscellaneous expenses on the Statement of Operations. During the period, the Fund did not borrow on this line of credit.
7. Security Lending.
The Fund lends portfolio securities through a lending agent from time to time in order to earn additional income. For equity securities, a lending agent is used and may loan securities to certain qualified borrowers, including Fidelity Capital Markets (FCM), a broker-dealer affiliated with the Fund. On the settlement date of the loan, the Fund receives collateral (in the form of U.S. Treasury obligations, letters of credit and/or cash) against the loaned securities and maintains collateral in an amount not less than 100% of the market value of the loaned securities during the period of the loan. The market value of the loaned securities is determined at the close of business of the Fund and any additional required collateral is delivered to the Fund on the next business day. The Fund or borrower may terminate the loan at any time, and if the borrower defaults on its obligation to return the securities loaned because of insolvency or other reasons, the Fund may apply collateral received from the borrower against the obligation. The Fund may experience delays and costs in recovering the securities loaned. Any cash collateral received is invested in the Fidelity Securities Lending Cash Central Fund. The value of loaned securities and cash collateral at period end are disclosed on the Fund's Statement of Assets and Liabilities. Security lending income represents the income earned on investing cash collateral, less rebates paid to borrowers and any lending agent fees associated with the loan, plus any premium payments received for lending certain types of securities. Security lending income is presented in the Statement of Operations as a component of income from Fidelity Central Funds. Total security lending income during the period amounted to $81,933. During the period, there were no securities loaned to FCM.
8. Expense Reductions.
Commissions paid to certain brokers with whom the investment adviser, or its affiliates, places trades on behalf of the Fund include an amount in addition to trade execution, which may be rebated back to the Fund to offset certain expenses. This amount totaled $25,032 for the period.
In addition, during the period the investment adviser reimbursed and/or waived a portion of operating expenses in the amount of $2,529.
9. Other.
The Fund's organizational documents provide former and current trustees and officers with a limited indemnification against liabilities arising in connection with the performance of their duties to the Fund. In the normal course of business, the Fund may also enter into contracts that provide general indemnifications. The Fund's maximum exposure under these arrangements is unknown as this would be dependent on future claims that may be made against the Fund. The risk of material loss from such claims is considered remote.
At the end of the period, Strategic Advisers International Fund, VIP FundsManager 50% Portfolio, and VIP FundsManager 60% Portfolio were the owners of record of approximately 15%, 11%, and 11%, respectively of the total outstanding shares of the Fund. Mutual funds managed by the investment adviser or its affiliates were the owners of record, in the aggregate, of approximately 48% of the total outstanding shares of the Fund.
Fidelity® Latin America Fund
Investment Summary (Unaudited)
Geographic Diversification (% of fund's net assets)
| As of April 30, 2017 |
| | Brazil | 61.9% |
| | Mexico | 20.3% |
| | Bermuda | 4.6% |
| | Panama | 4.5% |
| | United States of America* | 2.8% |
| | United Kingdom | 1.8% |
| | Spain | 1.4% |
| | Chile | 0.9% |
| | Peru | 0.9% |
| | Other | 0.9% |

* Includes Short-Term investments and Net Other Assets (Liabilities).
Percentages are based on country or territory of incorporation and are adjusted for the effect of futures contracts, if applicable.
| As of October 31, 2016 |
| | Brazil | 57.9% |
| | Mexico | 22.8% |
| | Bermuda | 4.8% |
| | Panama | 4.0% |
| | United States of America* | 2.6% |
| | Argentina | 2.1% |
| | United Kingdom | 2.0% |
| | France | 1.5% |
| | Peru | 1.2% |
| | Other | 1.1% |

* Includes Short-Term investments and Net Other Assets (Liabilities).
Percentages are based on country or territory of incorporation and are adjusted for the effect of futures contracts, if applicable.
Asset Allocation as of April 30, 2017
| | % of fund's net assets | % of fund's net assets 6 months ago |
| Stocks | 98.6 | 99.1 |
| Short-Term Investments and Net Other Assets (Liabilities) | 1.4 | 0.9 |
Top Ten Stocks as of April 30, 2017
| | % of fund's net assets | % of fund's net assets 6 months ago |
| Itau Unibanco Holding SA (Brazil, Banks) | 10.4 | 10.2 |
| Itausa-Investimentos Itau SA (Brazil, Banks) | 7.4 | 4.5 |
| Petroleo Brasileiro SA - Petrobras (PN) (non-vtg.) (Brazil, Oil, Gas & Consumable Fuels) | 4.5 | 6.5 |
| Smiles SA (Brazil, Media) | 3.9 | 2.7 |
| Kroton Educacional SA (Brazil, Diversified Consumer Services) | 3.5 | 3.5 |
| Credicorp Ltd. (United States) (Bermuda, Banks) | 3.2 | 3.6 |
| Promotora y Operadora de Infraestructura S.A.B. de CV (Mexico, Transportation Infrastructure) | 3.0 | 2.3 |
| Compartamos S.A.B. de CV (Mexico, Consumer Finance) | 3.0 | 2.3 |
| Cielo SA (Brazil, IT Services) | 3.0 | 3.7 |
| Copa Holdings SA Class A (Panama, Airlines) | 3.0 | 2.5 |
| | 44.9 | |
Top Market Sectors as of April 30, 2017
| | % of fund's net assets | % of fund's net assets 6 months ago |
| Financials | 37.5 | 39.2 |
| Consumer Discretionary | 18.5 | 17.3 |
| Industrials | 12.8 | 9.4 |
| Health Care | 8.6 | 4.3 |
| Information Technology | 5.3 | 4.9 |
| Energy | 4.5 | 6.5 |
| Consumer Staples | 4.2 | 13.3 |
| Materials | 4.0 | 1.2 |
| Utilities | 2.0 | 1.9 |
| Real Estate | 1.2 | 1.1 |
Market Sectors may include more than one industry category.
The Fund may invest up to 35% of its total assets in any industry that represents more than 20% of the Latin American market. As of April 30, 2017, 24.1% of the Fund’s total assets were invested in the Diversified Banks industry, which accounts for more than 20% of the Latin American market.
Fidelity® Latin America Fund
Investments April 30, 2017 (Unaudited)
Showing Percentage of Net Assets
| Common Stocks - 73.1% | | | |
| | | Shares | Value |
| Bermuda - 4.6% | | | |
| Credicorp Ltd. (United States) | | 124,815 | $19,179,073 |
| PAX Global Technology Ltd. (a) | | 13,526,721 | 8,382,086 |
|
| TOTAL BERMUDA | | | 27,561,159 |
|
| Brazil - 36.4% | | | |
| Alliar Medicos a Frente SA | | 1,548,498 | 9,064,474 |
| BB Seguridade Participacoes SA | | 1,248,512 | 11,757,226 |
| Cielo SA | | 2,328,871 | 17,682,705 |
| CVC Brasil Operadora e Agencia de Viagens SA | | 1,090,057 | 10,632,525 |
| Equatorial Energia SA | | 664,993 | 12,044,690 |
| Estacio Participacoes SA | | 2,729,012 | 15,330,031 |
| FPC Par Corretora de Seguros | | 1,090,297 | 6,492,214 |
| Grendene SA | | 1,116,015 | 8,667,088 |
| Hypermarcas SA | | 974,128 | 9,225,528 |
| Instituto Hermes Pardini SA | | 1,136,000 | 8,056,382 |
| Itausa-Investimentos Itau SA (b) | | 237,116 | 735,840 |
| Itausa-Investimentos Itau SA (b) | | 9,329 | 27,128 |
| Kroton Educacional SA | | 4,457,759 | 20,996,360 |
| Localiza Rent A Car SA | | 708,038 | 10,551,251 |
| Multiplus SA | | 796,822 | 9,810,748 |
| Qualicorp SA | | 2,300,671 | 16,381,331 |
| Rumo SA (b) | | 3,395,059 | 9,337,870 |
| Ser Educacional SA | | 863,936 | 6,668,588 |
| Smiles SA | | 1,071,796�� | 23,313,053 |
| Tegma Gestao Logistica SA | | 1,535,960 | 6,310,209 |
| Valid Solucoes SA | | 659,175 | 4,662,333 |
|
| TOTAL BRAZIL | | | 217,747,574 |
|
| Chile - 0.9% | | | |
| Vina San Pedro SA | | 574,573,084 | 5,595,890 |
| Luxembourg - 0.9% | | | |
| Globant SA (a)(b) | | 135,223 | 5,123,599 |
| Mexico - 20.3% | | | |
| Compartamos S.A.B. de CV | | 10,877,852 | 18,236,412 |
| Credito Real S.A.B. de CV | | 7,465,314 | 10,465,180 |
| Genomma Lab Internacional SA de CV (b) | | 7,383,634 | 9,315,218 |
| Gruma S.A.B. de CV Series B | | 649,535 | 8,673,463 |
| Grupo Aeroportuario Norte S.A.B. de CV | | 1,596,230 | 8,858,217 |
| Grupo Cementos de Chihuahua S.A.B. de CV | | 1,523,296 | 7,225,142 |
| Grupo GICSA SA de CV (b) | | 11,122,362 | 7,184,389 |
| Grupo Mexico SA de CV Series B | | 3,764,169 | 11,071,409 |
| Megacable Holdings S.A.B. de CV unit | | 1,478,496 | 5,610,749 |
| Promotora y Operadora de Infraestructura S.A.B. de CV | | 2,191,429 | 18,240,130 |
| Qualitas Controladora S.A.B. de CV | | 5,446,845 | 8,914,479 |
| Unifin Financiera SAPI de CV (b) | | 2,918,439 | 7,638,225 |
|
| TOTAL MEXICO | | | 121,433,013 |
|
| Panama - 4.5% | | | |
| Copa Holdings SA Class A | | 150,893 | 17,566,963 |
| Intergroup Financial Services Corp. | | 281,654 | 9,049,543 |
|
| TOTAL PANAMA | | | 26,616,506 |
|
| Peru - 0.9% | | | |
| Cementos Pacasmayo SAA | | 2,483,996 | 5,360,454 |
| Fossal SAA (b) | | 692,314 | 83,238 |
|
| TOTAL PERU | | | 5,443,692 |
|
| Spain - 1.4% | | | |
| Prosegur Cash SA | | 3,218,690 | 8,204,318 |
| United Kingdom - 1.8% | | | |
| British American Tobacco PLC (United Kingdom) | | 163,562 | 11,050,800 |
| United States of America - 1.4% | | | |
| First Cash Financial Services, Inc. | | 162,320 | 8,432,524 |
| TOTAL COMMON STOCKS | | | |
| (Cost $341,483,620) | | | 437,209,075 |
|
| Nonconvertible Preferred Stocks - 25.5% | | | |
| Brazil - 25.5% | | | |
| Alpargatas SA (PN) | | 2,412,389 | 10,108,465 |
| Banco ABC Brasil SA | | 1,694,072 | 9,510,992 |
| Itau Unibanco Holding SA | | 5,026,068 | 62,167,713 |
| Itausa-Investimentos Itau SA (PN) | | 14,093,474 | 43,913,756 |
| Petroleo Brasileiro SA - Petrobras (PN) (non-vtg.) (b) | | 6,099,786 | 26,847,091 |
| TOTAL NONCONVERTIBLE PREFERRED STOCKS | | | |
| (Cost $85,945,058) | | | 152,548,017 |
|
| Money Market Funds - 1.8% | | | |
| Fidelity Cash Central Fund, 0.85% (c) | | 6,453,054 | 6,454,344 |
| Fidelity Securities Lending Cash Central Fund 0.86% (c)(d) | | 4,303,897 | 4,304,328 |
| TOTAL MONEY MARKET FUNDS | | | |
| (Cost $10,758,776) | | | 10,758,672 |
| TOTAL INVESTMENT PORTFOLIO - 100.4% | | | |
| (Cost $438,187,454) | | | 600,515,764 |
| NET OTHER ASSETS (LIABILITIES) - (0.4)% | | | (2,231,777) |
| NET ASSETS - 100% | | | $598,283,987 |
Categorizations in the Schedule of Investments are based on country or territory of incorporation.
Legend
(a) Security or a portion of the security is on loan at period end.
(b) Non-income producing
(c) Affiliated fund that is generally available only to investment companies and other accounts managed by Fidelity Investments. The rate quoted is the annualized seven-day yield of the fund at period end. A complete unaudited listing of the fund's holdings as of its most recent quarter end is available upon request. In addition, each Fidelity Central Fund's financial statements are available on the SEC's website or upon request.
(d) Investment made with cash collateral received from securities on loan.
Affiliated Central Funds
Information regarding fiscal year to date income earned by the Fund from investments in Fidelity Central Funds is as follows:
| Fund | Income earned |
| Fidelity Cash Central Fund | $16,790 |
| Fidelity Securities Lending Cash Central Fund | 20,250 |
| Total | $37,040 |
Investment Valuation
The following is a summary of the inputs used, as of April 30, 2017, involving the Fund's assets and liabilities carried at fair value. The inputs or methodology used for valuing securities may not be an indication of the risk associated with investing in those securities. For more information on valuation inputs, and their aggregation into the levels used below, please refer to the Investment Valuation section in the accompanying Notes to Financial Statements.
| | Valuation Inputs at Reporting Date: |
| Description | Total | Level 1 | Level 2 | Level 3 |
| Investments in Securities: | | | | |
| Equities: | | | | |
| Consumer Discretionary | $111,137,607 | $111,137,607 | $-- | $-- |
| Consumer Staples | 25,320,153 | 14,269,353 | 11,050,800 | -- |
| Energy | 26,847,091 | 26,847,091 | -- | -- |
| Financials | 224,807,861 | 224,807,861 | -- | -- |
| Health Care | 52,042,933 | 52,042,933 | -- | -- |
| Industrials | 75,526,973 | 75,526,973 | -- | -- |
| Information Technology | 31,188,390 | 31,188,390 | -- | -- |
| Materials | 23,657,005 | 23,657,005 | -- | -- |
| Real Estate | 7,184,389 | 7,184,389 | -- | -- |
| Utilities | 12,044,690 | 12,044,690 | -- | -- |
| Money Market Funds | 10,758,672 | 10,758,672 | -- | -- |
| Total Investments in Securities: | $600,515,764 | $589,464,964 | $11,050,800 | $-- |
See accompanying notes which are an integral part of the financial statements.
Fidelity® Latin America Fund
Financial Statements
Statement of Assets and Liabilities
| | | April 30, 2017 (Unaudited) |
| Assets | | |
Investment in securities, at value (including securities loaned of $4,284,353) — See accompanying schedule:
Unaffiliated issuers (cost $427,428,678) | $589,757,092 | |
| Fidelity Central Funds (cost $10,758,776) | 10,758,672 | |
| Total Investments (cost $438,187,454) | | $600,515,764 |
| Cash | | 196,705 |
| Foreign currency held at value (cost $389) | | 13 |
| Receivable for investments sold | | 7,897,360 |
| Receivable for fund shares sold | | 479,580 |
| Dividends receivable | | 1,712,804 |
| Distributions receivable from Fidelity Central Funds | | 5,234 |
| Prepaid expenses | | 371 |
| Other receivables | | 1,766 |
| Total assets | | 610,809,597 |
| Liabilities | | |
| Payable for investments purchased | $6,152,719 | |
| Payable for fund shares redeemed | 1,468,780 | |
| Accrued management fee | 341,884 | |
| Distribution and service plan fees payable | 10,869 | |
| Other affiliated payables | 153,509 | |
| Other payables and accrued expenses | 93,777 | |
| Collateral on securities loaned | 4,304,072 | |
| Total liabilities | | 12,525,610 |
| Net Assets | | $598,283,987 |
| Net Assets consist of: | | |
| Paid in capital | | $604,505,233 |
| Undistributed net investment income | | 5,006,182 |
| Accumulated undistributed net realized gain (loss) on investments and foreign currency transactions | | (173,551,488) |
| Net unrealized appreciation (depreciation) on investments and assets and liabilities in foreign currencies | | 162,324,060 |
| Net Assets | | $598,283,987 |
| Calculation of Maximum Offering Price | | |
| Class A: | | |
| Net Asset Value and redemption price per share ($18,596,574 ÷ 824,924 shares) | | $22.54 |
| Maximum offering price per share (100/94.25 of $22.54) | | $23.92 |
| Class M: | | |
| Net Asset Value and redemption price per share ($6,695,424 ÷ 296,256 shares) | | $22.60 |
| Maximum offering price per share (100/96.50 of $22.60) | | $23.42 |
| Class C: | | |
| Net Asset Value and offering price per share ($5,269,599 ÷ 231,104 shares)(a) | | $22.80 |
| Latin America: | | |
| Net Asset Value, offering price and redemption price per share ($561,901,210 ÷ 24,998,212 shares) | | $22.48 |
| Class I: | | |
| Net Asset Value, offering price and redemption price per share ($5,821,180 ÷ 259,230 shares) | | $22.46 |
(a) Redemption price per share is equal to net asset value less any applicable contingent deferred sales charge.
See accompanying notes which are an integral part of the financial statements.
Statement of Operations
| | | Six months ended April 30, 2017 (Unaudited) |
| Investment Income | | |
| Dividends | | $13,946,609 |
| Income from Fidelity Central Funds | | 37,040 |
| Income before foreign taxes withheld | | 13,983,649 |
| Less foreign taxes withheld | | (820,047) |
| Total income | | 13,163,602 |
| Expenses | | |
| Management fee | $1,938,286 | |
| Transfer agent fees | 772,148 | |
| Distribution and service plan fees | 64,150 | |
| Accounting and security lending fees | 141,404 | |
| Custodian fees and expenses | 166,712 | |
| Independent trustees' fees and expenses | 1,173 | |
| Registration fees | 46,851 | |
| Audit | 41,185 | |
| Legal | 1,218 | |
| Miscellaneous | 2,215 | |
| Total expenses before reductions | 3,175,342 | |
| Expense reductions | (4,437) | 3,170,905 |
| Net investment income (loss) | | 9,992,697 |
| Realized and Unrealized Gain (Loss) | | |
| Net realized gain (loss) on: | | |
| Investment securities: | | |
| Unaffiliated issuers | 2,206,133 | |
| Fidelity Central Funds | 1,997 | |
| Foreign currency transactions | (348,520) | |
| Total net realized gain (loss) | | 1,859,610 |
Change in net unrealized appreciation (depreciation) on:
Investment securities | (2,432,087) | |
| Assets and liabilities in foreign currencies | (22,396) | |
| Total change in net unrealized appreciation (depreciation) | | (2,454,483) |
| Net gain (loss) | | (594,873) |
| Net increase (decrease) in net assets resulting from operations | | $9,397,824 |
See accompanying notes which are an integral part of the financial statements.
Statement of Changes in Net Assets
| | Six months ended April 30, 2017 (Unaudited) | Year ended October 31, 2016 |
| Increase (Decrease) in Net Assets | | |
| Operations | | |
| Net investment income (loss) | $9,992,697 | $12,329,425 |
| Net realized gain (loss) | 1,859,610 | (87,982,612) |
| Change in net unrealized appreciation (depreciation) | (2,454,483) | 203,562,799 |
| Net increase (decrease) in net assets resulting from operations | 9,397,824 | 127,909,612 |
| Distributions to shareholders from net investment income | (12,696,990) | (10,264,003) |
| Share transactions - net increase (decrease) | (31,997,140) | 5,109,952 |
| Redemption fees | 158,926 | 103,536 |
| Total increase (decrease) in net assets | (35,137,380) | 122,859,097 |
| Net Assets | | |
| Beginning of period | 633,421,367 | 510,562,270 |
| End of period | $598,283,987 | $633,421,367 |
| Other Information | | |
| Undistributed net investment income end of period | $5,006,182 | $7,710,475 |
See accompanying notes which are an integral part of the financial statements.
Financial Highlights — Fidelity Latin America Fund Class A
| | Six months ended (Unaudited) April 30, | Years ended October 31, | | | | |
| | 2017 | 2016 | 2015 | 2014 | 2013 | 2012 |
| Selected Per–Share Data | | | | | | |
| Net asset value, beginning of period | $22.45 | $18.09 | $30.31 | $40.71 | $48.95 | $52.38 |
| Income from Investment Operations | | | | | | |
| Net investment income (loss)A | .35 | .40 | .28 | .49 | .72 | .92 |
| Net realized and unrealized gain (loss) | .16B | 4.27 | (10.11) | (4.08) | (4.73) | (3.66) |
| Total from investment operations | .51 | 4.67 | (9.83) | (3.59) | (4.01) | (2.74) |
| Distributions from net investment income | (.43) | (.31) | (.31) | (.57) | (.79) | (.70) |
| Distributions from net realized gain | – | – | (2.08) | (6.25) | (3.45) | – |
| Total distributions | (.43) | (.31) | (2.39) | (6.82) | (4.24) | (.70) |
| Redemption fees added to paid in capitalA | .01 | –C | –C | .01 | .01 | .01 |
| Net asset value, end of period | $22.54 | $22.45 | $18.09 | $30.31 | $40.71 | $48.95 |
| Total ReturnD,E,F | 2.66% | 26.29% | (34.60)% | (9.06)% | (8.93)% | (5.23)% |
| Ratios to Average Net AssetsG,H | | | | | | |
| Expenses before reductions | 1.39%I | 1.40% | 1.40% | 1.38% | 1.37% | 1.35% |
| Expenses net of fee waivers, if any | 1.39%I | 1.40% | 1.40% | 1.38% | 1.37% | 1.35% |
| Expenses net of all reductions | 1.39%I | 1.39% | 1.39% | 1.38% | 1.35% | 1.35% |
| Net investment income (loss) | 3.34%I | 2.14% | 1.26% | 1.52% | 1.66% | 1.80% |
| Supplemental Data | | | | | | |
| Net assets, end of period (000 omitted) | $18,597 | $19,115 | $16,424 | $34,898 | $48,464 | $69,654 |
| Portfolio turnover rateJ | 58%I | 108% | 30% | 30% | 23% | 23% |
A Calculated based on average shares outstanding during the period.
B The amount shown for a share outstanding does not correspond with the aggregate net gain (loss) on investments for the period due to the timing of sales and repurchases of shares in relation to fluctuating market values of the investments of the Fund.
C Amount represents less than $.005 per share.
D Total returns for periods of less than one year are not annualized.
E Total returns would have been lower if certain expenses had not been reduced during the applicable periods shown.
F Total returns do not include the effect of the sales charges.
G Fees and expenses of any underlying Fidelity Central Funds are not included in the Fund's expense ratio. The Fund indirectly bears its proportionate share of the expenses of any underlying Fidelity Central Funds.
H Expense ratios reflect operating expenses of the class. Expenses before reductions do not reflect amounts reimbursed by the investment adviser or reductions from brokerage service arrangements or reductions from other expense offset arrangements and do not represent the amount paid by the class during periods when reimbursements or reductions occur. Expenses net of fee waivers reflect expenses after reimbursement by the investment adviser but prior to reductions from brokerage service arrangements or other expense offset arrangements. Expenses net of all reductions represent the net expenses paid by the class.
I Annualized
J Amount does not include the portfolio activity of any underlying Fidelity Central Funds.
See accompanying notes which are an integral part of the financial statements.
Financial Highlights — Fidelity Latin America Fund Class M
| | Six months ended (Unaudited) April 30, | Years ended October 31, | | | | |
| | 2017 | 2016 | 2015 | 2014 | 2013 | 2012 |
| Selected Per–Share Data | | | | | | |
| Net asset value, beginning of period | $22.47 | $18.11 | $30.33 | $40.68 | $48.88 | $52.27 |
| Income from Investment Operations | | | | | | |
| Net investment income (loss)A | .32 | .35 | .22 | .40 | .61 | .78 |
| Net realized and unrealized gain (loss) | .17B | 4.27 | (10.13) | (4.08) | (4.74) | (3.65) |
| Total from investment operations | .49 | 4.62 | (9.91) | (3.68) | (4.13) | (2.87) |
| Distributions from net investment income | (.37) | (.26) | (.23) | (.43) | (.63) | (.53) |
| Distributions from net realized gain | – | – | (2.08) | (6.25) | (3.45) | – |
| Total distributions | (.37) | (.26) | (2.31) | (6.68) | (4.08) | (.53) |
| Redemption fees added to paid in capitalA | .01 | –C | –C | .01 | .01 | .01 |
| Net asset value, end of period | $22.60 | $22.47 | $18.11 | $30.33 | $40.68 | $48.88 |
| Total ReturnD,E,F | 2.53% | 25.93% | (34.78)% | (9.30)% | (9.17)% | (5.49)% |
| Ratios to Average Net AssetsG,H | | | | | | |
| Expenses before reductions | 1.68%I | 1.68% | 1.67% | 1.65% | 1.63% | 1.61% |
| Expenses net of fee waivers, if any | 1.67%I | 1.68% | 1.67% | 1.65% | 1.63% | 1.61% |
| Expenses net of all reductions | 1.67%I | 1.68% | 1.66% | 1.65% | 1.61% | 1.61% |
| Net investment income (loss) | 3.06%I | 1.86% | .99% | 1.25% | 1.40% | 1.54% |
| Supplemental Data | | | | | | |
| Net assets, end of period (000 omitted) | $6,695 | $7,378 | $5,284 | $9,761 | $12,705 | $19,334 |
| Portfolio turnover rateJ | 58%I | 108% | 30% | 30% | 23% | 23% |
A Calculated based on average shares outstanding during the period.
B The amount shown for a share outstanding does not correspond with the aggregate net gain (loss) on investments for the period due to the timing of sales and repurchases of shares in relation to fluctuating market values of the investments of the Fund.
C Amount represents less than $.005 per share.
D Total returns for periods of less than one year are not annualized.
E Total returns would have been lower if certain expenses had not been reduced during the applicable periods shown.
F Total returns do not include the effect of the sales charges.
G Fees and expenses of any underlying Fidelity Central Funds are not included in the Fund's expense ratio. The Fund indirectly bears its proportionate share of the expenses of any underlying Fidelity Central Funds.
H Expense ratios reflect operating expenses of the class. Expenses before reductions do not reflect amounts reimbursed by the investment adviser or reductions from brokerage service arrangements or reductions from other expense offset arrangements and do not represent the amount paid by the class during periods when reimbursements or reductions occur. Expenses net of fee waivers reflect expenses after reimbursement by the investment adviser but prior to reductions from brokerage service arrangements or other expense offset arrangements. Expenses net of all reductions represent the net expenses paid by the class.
I Annualized
J Amount does not include the portfolio activity of any underlying Fidelity Central Funds.
See accompanying notes which are an integral part of the financial statements.
Financial Highlights — Fidelity Latin America Fund Class C
| | Six months ended (Unaudited) April 30, | Years ended October 31, | | | | |
| | 2017 | 2016 | 2015 | 2014 | 2013 | 2012 |
| Selected Per–Share Data | | | | | | |
| Net asset value, beginning of period | $22.61 | $18.18 | $30.37 | $40.59 | $48.73 | $52.05 |
| Income from Investment Operations | | | | | | |
| Net investment income (loss)A | .27 | .26 | .11 | .25 | .40 | .54 |
| Net realized and unrealized gain (loss) | .19B | 4.30 | (10.17) | (4.07) | (4.74) | (3.64) |
| Total from investment operations | .46 | 4.56 | (10.06) | (3.82) | (4.34) | (3.10) |
| Distributions from net investment income | (.28) | (.13) | (.05) | (.16) | (.36) | (.23) |
| Distributions from net realized gain | – | – | (2.08) | (6.25) | (3.45) | – |
| Total distributions | (.28) | (.13) | (2.13) | (6.41) | (3.81) | (.23) |
| Redemption fees added to paid in capitalA | .01 | –C | –C | .01 | .01 | .01 |
| Net asset value, end of period | $22.80 | $22.61 | $18.18 | $30.37 | $40.59 | $48.73 |
| Total ReturnD,E,F | 2.30% | 25.31% | (35.08)% | (9.74)% | (9.62)% | (5.94)% |
| Ratios to Average Net AssetsG,H | | | | | | |
| Expenses before reductions | 2.15%I | 2.15% | 2.15% | 2.13% | 2.12% | 2.10% |
| Expenses net of fee waivers, if any | 2.15%I | 2.14% | 2.15% | 2.13% | 2.12% | 2.10% |
| Expenses net of all reductions | 2.15%I | 2.14% | 2.15% | 2.13% | 2.10% | 2.10% |
| Net investment income (loss) | 2.59%I | 1.39% | .51% | .77% | .91% | 1.06% |
| Supplemental Data | | | | | | |
| Net assets, end of period (000 omitted) | $5,270 | $6,590 | $5,394 | $11,349 | $15,185 | $27,405 |
| Portfolio turnover rateJ | 58%I | 108% | 30% | 30% | 23% | 23% |
A Calculated based on average shares outstanding during the period.
B The amount shown for a share outstanding does not correspond with the aggregate net gain (loss) on investments for the period due to the timing of sales and repurchases of shares in relation to fluctuating market values of the investments of the Fund.
C Amount represents less than $.005 per share.
D Total returns for periods of less than one year are not annualized.
E Total returns would have been lower if certain expenses had not been reduced during the applicable periods shown.
F Total returns do not include the effect of the contingent deferred sales charge.
G Fees and expenses of any underlying Fidelity Central Funds are not included in the Fund's expense ratio. The Fund indirectly bears its proportionate share of the expenses of any underlying Fidelity Central Funds.
H Expense ratios reflect operating expenses of the class. Expenses before reductions do not reflect amounts reimbursed by the investment adviser or reductions from brokerage service arrangements or reductions from other expense offset arrangements and do not represent the amount paid by the class during periods when reimbursements or reductions occur. Expenses net of fee waivers reflect expenses after reimbursement by the investment adviser but prior to reductions from brokerage service arrangements or other expense offset arrangements. Expenses net of all reductions represent the net expenses paid by the class.
I Annualized
J Amount does not include the portfolio activity of any underlying Fidelity Central Funds.
See accompanying notes which are an integral part of the financial statements.
Financial Highlights — Fidelity Latin America Fund
| | Six months ended (Unaudited) April 30, | Years ended October 31, | | | | |
| | 2017 | 2016 | 2015 | 2014 | 2013 | 2012 |
| Selected Per–Share Data | | | | | | |
| Net asset value, beginning of period | $22.41 | $18.08 | $30.34 | $40.80 | $49.09 | $52.48 |
| Income from Investment Operations | | | | | | |
| Net investment income (loss)A | .37 | .45 | .34 | .59 | .87 | 1.09 |
| Net realized and unrealized gain (loss) | .17B | 4.26 | (10.11) | (4.10) | (4.74) | (3.67) |
| Total from investment operations | .54 | 4.71 | (9.77) | (3.51) | (3.87) | (2.58) |
| Distributions from net investment income | (.48) | (.38) | (.41) | (.71) | (.98) | (.82) |
| Distributions from net realized gain | – | – | (2.08) | (6.25) | (3.45) | – |
| Total distributions | (.48) | (.38) | (2.49) | (6.96) | (4.43) | (.82) |
| Redemption fees added to paid in capitalA | .01 | –C | –C | .01 | .01 | .01 |
| Net asset value, end of period | $22.48 | $22.41 | $18.08 | $30.34 | $40.80 | $49.09 |
| Total ReturnD,E | 2.84% | 26.65% | (34.45)% | (8.79)% | (8.63)% | (4.91)% |
| Ratios to Average Net AssetsF,G | | | | | | |
| Expenses before reductions | 1.12%H | 1.14% | 1.13% | 1.08% | 1.04% | 1.02% |
| Expenses net of fee waivers, if any | 1.12%H | 1.14% | 1.12% | 1.08% | 1.04% | 1.02% |
| Expenses net of all reductions | 1.12%H | 1.13% | 1.12% | 1.07% | 1.03% | 1.02% |
| Net investment income (loss) | 3.62%H | 2.40% | 1.53% | 1.83% | 1.99% | 2.14% |
| Supplemental Data | | | | | | |
| Net assets, end of period (000 omitted) | $561,901 | $596,514 | $481,005 | $933,298 | $1,324,748 | $2,274,601 |
| Portfolio turnover rateI | 58%H | 108% | 30% | 30% | 23% | 23% |
A Calculated based on average shares outstanding during the period.
B The amount shown for a share outstanding does not correspond with the aggregate net gain (loss) on investments for the period due to the timing of sales and repurchases of shares in relation to fluctuating market values of the investments of the Fund.
C Amount represents less than $.005 per share.
D Total returns for periods of less than one year are not annualized.
E Total returns would have been lower if certain expenses had not been reduced during the applicable periods shown.
F Fees and expenses of any underlying Fidelity Central Funds are not included in the Fund's expense ratio. The Fund indirectly bears its proportionate share of the expenses of any underlying Fidelity Central Funds.
G Expense ratios reflect operating expenses of the class. Expenses before reductions do not reflect amounts reimbursed by the investment adviser or reductions from brokerage service arrangements or reductions from other expense offset arrangements and do not represent the amount paid by the class during periods when reimbursements or reductions occur. Expenses net of fee waivers reflect expenses after reimbursement by the investment adviser but prior to reductions from brokerage service arrangements or other expense offset arrangements. Expenses net of all reductions represent the net expenses paid by the class.
H Annualized
I Amount does not include the portfolio activity of any underlying Fidelity Central Funds.
See accompanying notes which are an integral part of the financial statements.
Financial Highlights — Fidelity Latin America Fund Class I
| | Six months ended (Unaudited) April 30, | Years ended October 31, | | | | |
| | 2017 | 2016 | 2015 | 2014 | 2013 | 2012 |
| Selected Per–Share Data | | | | | | |
| Net asset value, beginning of period | $22.40 | $18.08 | $30.35 | $40.79 | $49.07 | $52.51 |
| Income from Investment Operations | | | | | | |
| Net investment income (loss)A | .38 | .46 | .36 | .60 | .87 | 1.08 |
| Net realized and unrealized gain (loss) | .16B | 4.26 | (10.13) | (4.07) | (4.74) | (3.67) |
| Total from investment operations | .54 | 4.72 | (9.77) | (3.47) | (3.87) | (2.59) |
| Distributions from net investment income | (.49) | (.40) | (.42) | (.73) | (.97) | (.86) |
| Distributions from net realized gain | – | – | (2.08) | (6.25) | (3.45) | – |
| Total distributions | (.49) | (.40) | (2.50) | (6.98) | (4.42) | (.86) |
| Redemption fees added to paid in capitalA | .01 | –C | –C | .01 | .01 | .01 |
| Net asset value, end of period | $22.46 | $22.40 | $18.08 | $30.35 | $40.79 | $49.07 |
| Total ReturnD,E | 2.86% | 26.77% | (34.42)% | (8.69)% | (8.63)% | (4.93)% |
| Ratios to Average Net AssetsF,G | | | | | | |
| Expenses before reductions | 1.03%H | 1.07% | 1.06% | 1.04% | 1.03% | 1.04% |
| Expenses net of fee waivers, if any | 1.03%H | 1.07% | 1.06% | 1.04% | 1.03% | 1.04% |
| Expenses net of all reductions | 1.03%H | 1.06% | 1.05% | 1.04% | 1.01% | 1.04% |
| Net investment income (loss) | 3.70%H | 2.47% | 1.60% | 1.86% | 2.00% | 2.12% |
| Supplemental Data | | | | | | |
| Net assets, end of period (000 omitted) | $5,821 | $3,825 | $1,828 | $4,531 | $5,131 | $7,928 |
| Portfolio turnover rateI | 58%H | 108% | 30% | 30% | 23% | 23% |
A Calculated based on average shares outstanding during the period.
B The amount shown for a share outstanding does not correspond with the aggregate net gain (loss) on investments for the period due to the timing of sales and repurchases of shares in relation to fluctuating market values of the investments of the Fund.
C Amount represents less than $.005 per share.
D Total returns for periods of less than one year are not annualized.
E Total returns would have been lower if certain expenses had not been reduced during the applicable periods shown.
F Fees and expenses of any underlying Fidelity Central Funds are not included in the Fund's expense ratio. The Fund indirectly bears its proportionate share of the expenses of any underlying Fidelity Central Funds.
G Expense ratios reflect operating expenses of the class. Expenses before reductions do not reflect amounts reimbursed by the investment adviser or reductions from brokerage service arrangements or reductions from other expense offset arrangements and do not represent the amount paid by the class during periods when reimbursements or reductions occur. Expenses net of fee waivers reflect expenses after reimbursement by the investment adviser but prior to reductions from brokerage service arrangements or other expense offset arrangements. Expenses net of all reductions represent the net expenses paid by the class.
H Annualized
I Amount does not include the portfolio activity of any underlying Fidelity Central Funds.
See accompanying notes which are an integral part of the financial statements.
Notes to Financial Statements (Unaudited)
For the period ended April 30, 2017
1. Organization.
Fidelity Latin America Fund (the Fund) is a non-diversified fund of Fidelity Investment Trust (the Trust) and is authorized to issue an unlimited number of shares. The Trust is registered under the Investment Company Act of 1940, as amended (the 1940 Act), as an open-end management investment company organized as a Massachusetts business trust. The Fund offers Class A, Class M (formerly Class T), Class C, Latin America and Class I shares, each of which has equal rights as to assets and voting privileges. Each class has exclusive voting rights with respect to matters that affect that class. The Fund's investments in emerging markets can be subject to social, economic, regulatory, and political uncertainties and can be extremely volatile.
After the close of business on June 24, 2016, all outstanding Class B shares were converted to Class A shares. All prior fiscal period dollar and share amounts for Class B presented in the Notes to Financial Statements are for the period November 1, 2015 through June 24, 2016.
2. Investments in Fidelity Central Funds.
The Fund invests in Fidelity Central Funds, which are open-end investment companies generally available only to other investment companies and accounts managed by the investment adviser and its affiliates. The Fund's Schedule of Investments lists each of the Fidelity Central Funds held as of period end, if any, as an investment of the Fund, but does not include the underlying holdings of each Fidelity Central Fund. As an Investing Fund, the Fund indirectly bears its proportionate share of the expenses of the underlying Fidelity Central Funds.
The Money Market Central Funds seek preservation of capital and current income and are managed by Fidelity Investments Money Management, Inc. (FIMM), an affiliate of the investment adviser. Annualized expenses of the Money Market Central Funds as of their most recent shareholder report date are less than .005%.
A complete unaudited list of holdings for each Fidelity Central Fund is available upon request or at the Securities and Exchange Commission (the SEC) website at www.sec.gov. In addition, the financial statements of the Fidelity Central Funds are available on the SEC website or upon request.
3. Significant Accounting Policies.
The Fund is an investment company and applies the accounting and reporting guidance of the Financial Accounting Standards Board (FASB) Accounting Standards Codification Topic 946 Financial Services – Investments Companies. The financial statements have been prepared in conformity with accounting principles generally accepted in the United States of America (GAAP), which require management to make certain estimates and assumptions at the date of the financial statements. Actual results could differ from those estimates. Subsequent events, if any, through the date that the financial statements were issued have been evaluated in the preparation of the financial statements. The following summarizes the significant accounting policies of the Fund:
Investment Valuation. Investments are valued as of 4:00 p.m. Eastern time on the last calendar day of the period. The Board of Trustees (the Board) has delegated the day to day responsibility for the valuation of the Fund's investments to the Fair Value Committee (the Committee) established by the Fund's investment adviser. In accordance with valuation policies and procedures approved by the Board, the Fund attempts to obtain prices from one or more third party pricing vendors or brokers to value its investments. When current market prices, quotations or currency exchange rates are not readily available or reliable, investments will be fair valued in good faith by the Committee, in accordance with procedures adopted by the Board. Factors used in determining fair value vary by investment type and may include market or investment specific events. The frequency with which these procedures are used cannot be predicted and they may be utilized to a significant extent. The Committee oversees the Fund's valuation policies and procedures and reports to the Board on the Committee's activities and fair value determinations. The Board monitors the appropriateness of the procedures used in valuing the Fund's investments and ratifies the fair value determinations of the Committee.
The Fund categorizes the inputs to valuation techniques used to value its investments into a disclosure hierarchy consisting of three levels as shown below:
- Level 1 – quoted prices in active markets for identical investments
- Level 2 – other significant observable inputs (including quoted prices for similar investments, interest rates, prepayment speeds, etc.)
- Level 3 – unobservable inputs (including the Fund's own assumptions based on the best information available)
Valuation techniques used to value the Fund's investments by major category are as follows:
Equity securities, including restricted securities, for which market quotations are readily available, are valued at the last reported sale price or official closing price as reported by a third party pricing vendor on the primary market or exchange on which they are traded and are categorized as Level 1 in the hierarchy. In the event there were no sales during the day or closing prices are not available, securities are valued at the last quoted bid price or may be valued using the last available price and are generally categorized as Level 2 in the hierarchy. For foreign equity securities, when market or security specific events arise, comparisons to the valuation of American Depositary Receipts (ADRs), futures contracts, Exchange-Traded Funds (ETFs) and certain indexes as well as quoted prices for similar securities may be used and would be categorized as Level 2 in the hierarchy. Utilizing these techniques may result in transfers between Level 1 and Level 2. For equity securities, including restricted securities, where observable inputs are limited, assumptions about market activity and risk are used and these securities may be categorized as Level 3 in the hierarchy.
Investments in open-end mutual funds, including the Fidelity Central Funds, are valued at their closing net asset value (NAV) each business day and are categorized as Level 1 in the hierarchy.
Changes in valuation techniques may result in transfers in or out of an assigned level within the disclosure hierarchy. The aggregate value of investments by input level as of April 30, 2017 is included at the end of the Fund's Schedule of Investments.
Foreign Currency. The Fund may use foreign currency contracts to facilitate transactions in foreign-denominated securities. Gains and losses from these transactions may arise from changes in the value of the foreign currency or if the counterparties do not perform under the contracts' terms.
Foreign-denominated assets, including investment securities, and liabilities are translated into U.S. dollars at the exchange rates at period end. Purchases and sales of investment securities, income and dividends received and expenses denominated in foreign currencies are translated into U.S. dollars at the exchange rate in effect on the transaction date.
The effects of exchange rate fluctuations on investments are included with the net realized and unrealized gain (loss) on investment securities. Other foreign currency transactions resulting in realized and unrealized gain (loss) are disclosed separately.
Investment Transactions and Income. For financial reporting purposes, the Fund's investment holdings and NAV include trades executed through the end of the last business day of the period. The NAV per share for processing shareholder transactions is calculated as of the close of business of the New York Stock Exchange (NYSE), normally 4:00 p.m. Eastern time and includes trades executed through the end of the prior business day. Gains and losses on securities sold are determined on the basis of identified cost. Dividend income is recorded on the ex-dividend date, except for certain dividends from foreign securities where the ex-dividend date may have passed, which are recorded as soon as the Fund is informed of the ex-dividend date. Non-cash dividends included in dividend income, if any, are recorded at the fair market value of the securities received. Income and capital gain distributions from Fidelity Central Funds, if any, are recorded on the ex-dividend date. Certain distributions received by the Fund represent a return of capital or capital gain. The Fund determines the components of these distributions subsequent to the ex-dividend date, based upon receipt of tax filings or other correspondence relating to the underlying investment. These distributions are recorded as a reduction of cost of investments and/or as a realized gain. Investment income is recorded net of foreign taxes withheld where recovery of such taxes is uncertain.
Class Allocations and Expenses. Investment income, realized and unrealized capital gains and losses, common expenses of the Fund, and certain fund-level expense reductions, if any, are allocated daily on a pro-rata basis to each class based on the relative net assets of each class to the total net assets of the Fund. Each class differs with respect to transfer agent and distribution and service plan fees incurred. Certain expense reductions may also differ by class. For the reporting period, the allocated portion of income and expenses to each class as a percent of its average net assets may vary due to the timing of recording these transactions in relation to fluctuating net assets of the classes. Expenses directly attributable to a fund are charged to that fund. Expenses attributable to more than one fund are allocated among the respective funds on the basis of relative net assets or other appropriate methods. Expense estimates are accrued in the period to which they relate and adjustments are made when actual amounts are known.
Income Tax Information and Distributions to Shareholders. Each year, the Fund intends to qualify as a regulated investment company under Subchapter M of the Internal Revenue Code, including distributing substantially all of its taxable income and realized gains. As a result, no provision for U.S. Federal income taxes is required. The Fund files a U.S. federal tax return, in addition to state and local tax returns as required. The Fund's federal income tax returns are subject to examination by the Internal Revenue Service (IRS) for a period of three fiscal years after they are filed. State and local tax returns may be subject to examination for an additional fiscal year depending on the jurisdiction. Foreign taxes are provided for based on the Fund's understanding of the tax rules and rates that exist in the foreign markets in which it invests.
Distributions are declared and recorded on the ex-dividend date. Income dividends and capital gain distributions are declared separately for each class. Income and capital gain distributions are determined in accordance with income tax regulations, which may differ from GAAP.
Capital accounts within the financial statements are adjusted for permanent book-tax differences. These adjustments have no impact on net assets or the results of operations. Capital accounts are not adjusted for temporary book-tax differences which will reverse in a subsequent period.
Book-tax differences are primarily due to foreign currency transactions, capital loss carryforwards, deferred trustees compensation, and losses deferred due to wash sales.
The federal tax cost of investment securities and unrealized appreciation (depreciation) as of period end were as follows:
| Gross unrealized appreciation | $182,413,344 |
| Gross unrealized depreciation | (21,751,895) |
| Net unrealized appreciation (depreciation) on securities | $160,661,449 |
| Tax cost | $439,854,315 |
Capital loss carryforwards are only available to offset future capital gains of the Fund to the extent provided by regulations and may be limited. Under the Regulated Investment Company Modernization Act of 2010 (the Act), the Fund is permitted to carry forward capital losses incurred in taxable years beginning after December 22, 2010 for an unlimited period and such capital losses are required to be used prior to any losses that expire. The capital loss carryforward information presented below, including any applicable limitation, is estimated as of prior fiscal period end and is subject to adjustment.
| No expiration | |
| Short-term | $(44,509,664) |
| Long-term | (127,757,231) |
| Total capital loss carryforward | $(172,266,895) |
Short-Term Trading (Redemption) Fees. Shares held by investors in the Fund less than 90 days may have been subject to a redemption fee equal to 1.50% of the NAV of shares redeemed. All redemption fees, which reduce the proceeds of the shareholder redemption, are retained by the Fund and accounted for as an addition to paid in capital.
4. Purchases and Sales of Investments.
Purchases and sales of securities, other than short-term securities, aggregated $163,148,370 and $200,918,744, respectively.
5. Fees and Other Transactions with Affiliates.
Management Fee. Fidelity Management & Research Company (the investment adviser) and its affiliates provide the Fund with investment management related services for which the Fund pays a monthly management fee. The management fee is the sum of an individual fund fee rate that is based on an annual rate of .45% of the Fund's average net assets and an annualized group fee rate that averaged .25% during the period. The group fee rate is based upon the average net assets of all the mutual funds advised by the investment adviser, including any mutual funds previously advised by the investment adviser that are currently advised by Fidelity SelectCo, LLC, an affiliate of the investment adviser. The group fee rate decreases as assets under management increase and increases as assets under management decrease. For the reporting period, the total annualized management fee rate was .70% of the Fund's average net assets.
Distribution and Service Plan Fees. In accordance with Rule 12b-1 of the 1940 Act, the Fund has adopted separate Distribution and Service Plans for each class of shares. Certain classes pay Fidelity Distributors Corporation (FDC), an affiliate of the investment adviser, separate Distribution and Service Fees, each of which is based on an annual percentage of each class' average net assets. In addition, FDC may pay financial intermediaries for selling shares of the Fund and providing shareholder support services. For the period, the Distribution and Service Fee rates, total fees and amounts retained by FDC were as follows:
| | Distribution
Fee | Service
Fee | Total Fees | Retained
by FDC |
| Class A | -% | .25% | $21,659 | $– |
| Class M | .25% | .25% | 15,682 | – |
| Class C | .75% | .25% | 26,809 | 1,647 |
| | | | $64,150 | $1,647 |
Sales Load. FDC may receive a front-end sales charge of up to 5.75% for selling Class A shares and 3.50% for selling Class M shares, some of which is paid to financial intermediaries for selling shares of the Fund. Depending on the holding period, FDC may receive contingent deferred sales charges levied on Class A, Class M, and Class C redemptions. The deferred sales charges are 1.00% for Class C shares, 1.00% for certain purchases of Class A shares and .25% for certain purchases of Class M shares.
For the period, sales charge amounts retained by FDC were as follows:
| | Retained
by FDC |
| Class A | $3,016 |
| Class M | 576 |
| Class C(a) | 445 |
| | $4,037 |
(a) When Class C shares are initially sold, FDC pays commissions from its own resources to financial intermediaries through which the sales are made.
Transfer Agent Fees. Fidelity Investments Institutional Operations Company, Inc., (FIIOC), an affiliate of the investment adviser, is the transfer, dividend disbursing and shareholder servicing agent for each class of the Fund. FIIOC receives account fees and asset-based fees that vary according to the account size and type of account of the shareholders of the respective classes of the Fund. FIIOC pays for typesetting, printing and mailing of shareholder reports, except proxy statements.
For the period, transfer agent fees for each class were as follows:
| | Amount | % of
Class-Level Average
Net Assets(a) |
| Class A | $26,261 | .30 |
| Class M | 10,489 | .33 |
| Class C | 8,224 | .31 |
| Latin America | 723,224 | .28 |
| Class I | 3,950 | .19 |
| | $772,148 | |
(a) Annualized
Accounting and Security Lending Fees. Fidelity Service Company, Inc. (FSC), an affiliate of the investment adviser, maintains the Fund's accounting records. The accounting fee is based on the level of average net assets for each month. Under a separate contract, FSC administers the security lending program. The security lending fee is based on the number and duration of lending transactions.
Brokerage Commissions. The Fund placed a portion of its portfolio transactions with brokerage firms which are affiliates of the investment adviser. Brokerage commissions are included in net realized gain (loss) and change in net unrealized appreciation (depreciation) in the Statement of Operations. The commissions paid to these affiliated firms were $399 for the period.
Interfund Trades. The Fund may purchase from or sell securities to other Fidelity Funds under procedures adopted by the Board. The procedures have been designed to ensure these interfund trades are executed in accordance with Rule 17a-7 of the 1940 Act. Interfund trades are included within the respective purchases and sales amounts shown in the Purchases and Sales of Investments note.
6. Committed Line of Credit.
The Fund participates with other funds managed by the investment adviser or an affiliate in a $4.25 billion credit facility (the "line of credit") to be utilized for temporary or emergency purposes to fund shareholder redemptions or for other short-term liquidity purposes. The Fund has agreed to pay commitment fees on its pro-rata portion of the line of credit, which amounted to $952 and is reflected in Miscellaneous expenses on the Statement of Operations. During the period, the Fund did not borrow on this line of credit.
7. Security Lending.
The Fund lends portfolio securities through a lending agent from time to time in order to earn additional income. For equity securities, a lending agent is used and may loan securities to certain qualified borrowers, including Fidelity Capital Markets (FCM), a broker-dealer affiliated with the Fund. On the settlement date of the loan, the Fund receives collateral (in the form of U.S. Treasury obligations, letters of credit and/or cash) against the loaned securities and maintains collateral in an amount not less than 100% of the market value of the loaned securities during the period of the loan. The market value of the loaned securities is determined at the close of business of the Fund and any additional required collateral is delivered to the Fund on the next business day. The Fund or borrower may terminate the loan at any time, and if the borrower defaults on its obligation to return the securities loaned because of insolvency or other reasons, the Fund may apply collateral received from the borrower against the obligation. The Fund may experience delays and costs in recovering the securities loaned. Any cash collateral received is invested in the Fidelity Securities Lending Cash Central Fund. The value of loaned securities and cash collateral at period end are disclosed on the Fund's Statement of Assets and Liabilities. Security lending income represents the income earned on investing cash collateral, less rebates paid to borrowers and any lending agent fees associated with the loan, plus any premium payments received for lending certain types of securities. Security lending income is presented in the Statement of Operations as a component of income from Fidelity Central Funds. Total security lending income during the period amounted to $20,250. During the period, there were no securities loaned to FCM.
8. Expense Reductions.
Commissions paid to certain brokers with whom the investment adviser, or its affiliates, places trades on behalf of the Fund include an amount in addition to trade execution, which may be rebated back to the Fund to offset certain expenses. This amount totaled $2,147 for the period.
In addition, during the period the investment adviser reimbursed and/or waived a portion of fund-level operating expenses in the amount of $2,290.
9. Distributions to Shareholders.
Distributions to shareholders of each class were as follows:
| | Six months ended April 30, 2017 | Year ended October 31, 2016 |
| From net investment income | | |
| Class A | $361,857 | $264,922 |
| Class M | 112,037 | 74,433 |
| Class B | – | 1,059 |
| Class C | 77,689 | 37,419 |
| Latin America | 12,062,883 | 9,833,214 |
| Class I | 82,524 | 52,956 |
| Total | $12,696,990 | $10,264,003 |
10. Share Transactions.
Share transactions for each class were as follows and may contain automatic conversions between classes or exchanges between affiliated funds:
| | Shares | Shares | Dollars | Dollars |
| | Six months ended April 30, 2017 | Year ended October 31, 2016 | Six months ended April 30, 2017 | Year ended October 31, 2016 |
| Class A | | | | |
| Shares sold | 107,263 | 225,272 | $2,262,225 | $4,334,307 |
| Reinvestment of distributions | 18,202 | 14,810 | 345,275 | 256,538 |
| Shares redeemed | (151,946) | (296,685) | (3,103,006) | (5,448,405) |
| Net increase (decrease) | (26,481) | (56,603) | $(495,506) | $(857,560) |
| Class M | | | | |
| Shares sold | 20,201 | 88,506 | $416,765 | $1,738,665 |
| Reinvestment of distributions | 5,687 | 4,243 | 108,338 | 73,689 |
| Shares redeemed | (57,951) | (56,211) | (1,154,038) | (1,058,502) |
| Net increase (decrease) | (32,063) | 36,538 | $(628,935) | $753,852 |
| Class B | | | | |
| Shares sold | – | 1 | $– | $10 |
| Reinvestment of distributions | – | 59 | – | 1,009 |
| Shares redeemed | – | (34,427) | – | (635,494) |
| Net increase (decrease) | – | (34,367) | $– | $(634,475) |
| Class C | | | | |
| Shares sold | 12,390 | 75,193 | $259,277 | $1,418,728 |
| Reinvestment of distributions | 3,179 | 1,720 | 61,288 | 30,044 |
| Shares redeemed | (75,876) | (82,272) | (1,552,956) | (1,513,384) |
| Net increase (decrease) | (60,307) | (5,359) | $(1,232,391) | $(64,612) |
| Latin America | | | | |
| Shares sold | 2,743,526 | 5,528,011 | $56,927,574 | $106,883,642 |
| Reinvestment of distributions | 610,971 | 545,601 | 11,541,877 | 9,420,593 |
| Shares redeemed | (4,970,178) | (6,058,036) | (99,979,802) | (111,613,300) |
| Net increase (decrease) | (1,615,681) | 15,576 | $(31,510,351) | $4,690,935 |
| Class I | | | | |
| Shares sold | 119,976 | 136,401 | $2,505,288 | $2,463,122 |
| Reinvestment of distributions | 3,896 | 2,787 | 73,478 | 48,070 |
| Shares redeemed | (35,418) | (69,501) | (708,723) | (1,289,380) |
| Net increase (decrease) | 88,454 | 69,687 | $1,870,043 | $1,221,812 |
11. Other.
The Fund's organizational documents provide former and current trustees and officers with a limited indemnification against liabilities arising in connection with the performance of their duties to the Fund. In the normal course of business, the Fund may also enter into contracts that provide general indemnifications. The Fund's maximum exposure under these arrangements is unknown as this would be dependent on future claims that may be made against the Fund. The risk of material loss from such claims is considered remote.
Fidelity® Nordic Fund
Investment Summary (Unaudited)
Geographic Diversification (% of fund's net assets)
| As of April 30, 2017 |
| | Sweden | 49.1% |
| | Denmark | 13.6% |
| | Finland | 12.3% |
| | Malta | 8.9% |
| | Norway | 8.5% |
| | United States of America* | 4.9% |
| | Bermuda | 2.7% |

* Includes Short-Term investments and Net Other Assets (Liabilities).
Percentages are based on country or territory of incorporation and are adjusted for the effect of futures contracts, if applicable.
| As of October 31, 2016 |
| | Sweden | 50.5% |
| | Finland | 13.8% |
| | Denmark | 13.4% |
| | Norway | 9.1% |
| | Malta | 8.3% |
| | United States of America* | 2.8% |
| | Bermuda | 2.1% |

* Includes Short-Term investments and Net Other Assets (Liabilities).
Percentages are based on country or territory of incorporation and are adjusted for the effect of futures contracts, if applicable.
Asset Allocation as of April 30, 2017
| | % of fund's net assets | % of fund's net assets 6 months ago |
| Stocks | 97.3 | 97.2 |
| Short-Term Investments and Net Other Assets (Liabilities) | 2.7 | 2.8 |
Top Ten Stocks as of April 30, 2017
| | % of fund's net assets | % of fund's net assets 6 months ago |
| Svenska Cellulosa AB (SCA) (B Shares) (Sweden, Household Products) | 6.5 | 6.5 |
| Investor AB (B Shares) (Sweden, Diversified Financial Services) | 5.6 | 3.6 |
| Vaisala Oyj (Finland, Electronic Equipment & Components) | 5.4 | 3.6 |
| Kindred Group PLC (depositary receipt) (Malta, Hotels, Restaurants & Leisure) | 4.8 | 3.6 |
| Getinge AB (B Shares) (Sweden, Health Care Equipment & Supplies) | 4.8 | 3.7 |
| Kambi Group PLC (Malta, Hotels, Restaurants & Leisure) | 4.1 | 4.7 |
| Pandox AB (Sweden, Hotels, Restaurants & Leisure) | 4.1 | 1.0 |
| Nobia AB (Sweden, Household Durables) | 3.9 | 3.1 |
| Bravida AB (Sweden, Commercial Services & Supplies) | 3.9 | 4.3 |
| Dometic Group AB (Sweden, Auto Components) | 3.9 | 3.6 |
| | 47.0 | |
Top Market Sectors as of April 30, 2017
| | % of fund's net assets | % of fund's net assets 6 months ago |
| Consumer Discretionary | 32.8 | 23.8 |
| Industrials | 19.3 | 18.5 |
| Consumer Staples | 14.0 | 14.2 |
| Financials | 9.9 | 20.1 |
| Health Care | 8.8 | 8.7 |
| Information Technology | 8.5 | 6.8 |
| Materials | 3.5 | 0.0 |
| Telecommunication Services | 0.5 | 0.0 |
| Real Estate | 0.0 | 3.6 |
| Energy | 0.0 | 0.8 |
Market Sectors may include more than one industry category.
The Fund may invest up to 35% of its total assets in any industry that represents more than 20% of the Nordic market. As of April 30, 2017, the Fund did not have more than 25% of its total assets invested in any one industry.
Percentages shown as 0.0% may reflect amounts less than 0.05%.
Fidelity® Nordic Fund
Investments April 30, 2017 (Unaudited)
Showing Percentage of Net Assets
| Common Stocks - 97.3% | | | |
| | | Shares | Value |
| Bermuda - 2.7% | | | |
| Vostok Emerging Finance Ltd. (depository receipt) (a) | | 9,489,995 | $1,757,149 |
| Vostok New Ventures Ltd. (depositary receipt) (a) | | 1,015,554 | 7,911,353 |
|
| TOTAL BERMUDA | | | 9,668,502 |
|
| Denmark - 13.6% | | | |
| Nets A/S (b) | | 612,800 | 11,146,305 |
| Novo Nordisk A/S Series B | | 257,905 | 10,042,010 |
| Novozymes A/S Series B | | 295,600 | 12,770,769 |
| Royal Unibrew A/S | | 212,142 | 9,224,173 |
| Scandinavian Tobacco Group A/S | | 326,634 | 5,702,013 |
|
| TOTAL DENMARK | | | 48,885,270 |
|
| Finland - 12.3% | | | |
| Amer Group PLC (A Shares) | | 241,600 | 5,355,609 |
| Nokian Tyres PLC | | 169,500 | 7,293,136 |
| Olvi PLC (A Shares) | | 289,146 | 8,945,055 |
| Vaisala Oyj | | 404,500 | 19,382,955 |
| Valmet Corp. | | 77,085 | 1,404,796 |
| Wartsila Corp. | | 29,800 | 1,814,578 |
|
| TOTAL FINLAND | | | 44,196,129 |
|
| Malta - 8.9% | | | |
| Kambi Group PLC (a) | | 1,440,211 | 14,796,744 |
| Kindred Group PLC (depositary receipt) | | 1,678,698 | 17,408,060 |
|
| TOTAL MALTA | | | 32,204,804 |
|
| Norway - 8.5% | | | |
| Orkla ASA | | 932,600 | 8,445,102 |
| Schibsted ASA: | | | |
| (A Shares) | | 311,400 | 7,743,291 |
| (B Shares) | | 262,847 | 5,893,087 |
| Zalaris ASA (A Shares) (c) | | 1,688,300 | 8,415,938 |
|
| TOTAL NORWAY | | | 30,497,418 |
|
| Sweden - 49.1% | | | |
| Addlife AB (a) | | 227,375 | 4,325,549 |
| AddTech AB (B Shares) | | 623,800 | 11,233,231 |
| AF AB (B Shares) (d) | | 433,300 | 9,118,707 |
| Alimak Group AB (d) | | 535,100 | 8,110,505 |
| Bravida AB | | 1,999,444 | 14,131,303 |
| Com Hem Holding AB | | 136,200 | 1,696,099 |
| Coor Service Management Holding AB | | 565,300 | 3,526,224 |
| Dometic Group AB | | 1,889,300 | 14,078,082 |
| Getinge AB (B Shares) | | 883,500 | 17,266,419 |
| Investor AB (B Shares) | | 441,986 | 20,204,818 |
| Mekonomen AB (d) | | 449,190 | 8,900,325 |
| Nobia AB (d) | | 1,371,187 | 14,188,216 |
| Pandox AB | | 881,348 | 14,796,433 |
| Svenska Cellulosa AB (SCA) (B Shares) | | 708,200 | 23,459,281 |
| Systemair AB | | 670,479 | 11,922,419 |
|
| TOTAL SWEDEN | | | 176,957,611 |
|
| United States of America - 2.2% | | | |
| Autoliv, Inc. (depositary receipt) | | 81,200 | 8,127,059 |
| TOTAL COMMON STOCKS | | | |
| (Cost $312,549,940) | | | 350,536,793 |
|
| Money Market Funds - 4.6% | | | |
| Fidelity Cash Central Fund, 0.85% (e) | | 4,217,476 | 4,218,319 |
| Fidelity Securities Lending Cash Central Fund 0.86% (e)(f) | | 12,399,102 | 12,400,342 |
| TOTAL MONEY MARKET FUNDS | | | |
| (Cost $16,618,849) | | | 16,618,661 |
| TOTAL INVESTMENT PORTFOLIO - 101.9% | | | |
| (Cost $329,168,789) | | | 367,155,454 |
| NET OTHER ASSETS (LIABILITIES) - (1.9)% | | | (6,736,410) |
| NET ASSETS - 100% | | | $360,419,044 |
Categorizations in the Schedule of Investments are based on country or territory of incorporation.
Legend
(a) Non-income producing
(b) Security exempt from registration under Rule 144A of the Securities Act of 1933. These securities may be resold in transactions exempt from registration, normally to qualified institutional buyers. At the end of the period, the value of these securities amounted to $11,146,305 or 3.1% of net assets.
(c) Affiliated company
(d) Security or a portion of the security is on loan at period end.
(e) Affiliated fund that is generally available only to investment companies and other accounts managed by Fidelity Investments. The rate quoted is the annualized seven-day yield of the fund at period end. A complete unaudited listing of the fund's holdings as of its most recent quarter end is available upon request. In addition, each Fidelity Central Fund's financial statements are available on the SEC's website or upon request.
(f) Investment made with cash collateral received from securities on loan.
Affiliated Central Funds
Information regarding fiscal year to date income earned by the Fund from investments in Fidelity Central Funds is as follows:
| Fund | Income earned |
| Fidelity Cash Central Fund | $6,474 |
| Fidelity Securities Lending Cash Central Fund | 97,612 |
| Total | $104,086 |
Other Affiliated Issuers
An affiliated company is a company in which the Fund has ownership of at least 5% of the voting securities. Fiscal year to date transactions with companies which are or were affiliates are as follows:
| Affiliate | Value, beginning of period | Purchases | Sales Proceeds | Dividend Income | Value, end of period |
| East Capital Explorer AB | $9,439,560 | $-- | $10,988,626 | $-- | $-- |
| Zalaris ASA (A Shares) | 7,059,517 | -- | 908,065 | -- | 8,415,938 |
| Total | $16,499,077 | $-- | $11,896,691 | $-- | $8,415,938 |
Investment Valuation
The following is a summary of the inputs used, as of April 30, 2017, involving the Fund's assets and liabilities carried at fair value. The inputs or methodology used for valuing securities may not be an indication of the risk associated with investing in those securities. For more information on valuation inputs, and their aggregation into the levels used below, please refer to the Investment Valuation section in the accompanying Notes to Financial Statements.
| | Valuation Inputs at Reporting Date: |
| Description | Total | Level 1 | Level 2 | Level 3 |
| Investments in Securities: | | | | |
| Equities: | | | | |
| Consumer Discretionary | $118,580,042 | $118,580,042 | $-- | $-- |
| Consumer Staples | 50,073,611 | 50,073,611 | -- | -- |
| Financials | 35,575,333 | 35,575,333 | -- | -- |
| Health Care | 31,633,978 | 21,591,968 | 10,042,010 | -- |
| Industrials | 69,677,701 | 69,677,701 | -- | -- |
| Information Technology | 30,529,260 | 30,529,260 | -- | -- |
| Materials | 12,770,769 | 12,770,769 | -- | -- |
| Telecommunication Services | 1,696,099 | 1,696,099 | -- | -- |
| Money Market Funds | 16,618,661 | 16,618,661 | -- | -- |
| Total Investments in Securities: | $367,155,454 | $357,113,444 | $10,042,010 | $-- |
See accompanying notes which are an integral part of the financial statements.
Fidelity® Nordic Fund
Financial Statements
Statement of Assets and Liabilities
| | | April 30, 2017 (Unaudited) |
| Assets | | |
Investment in securities, at value (including securities loaned of $11,885,189) — See accompanying schedule:
Unaffiliated issuers (cost $306,024,339) | $342,120,855 | |
| Fidelity Central Funds (cost $16,618,849) | 16,618,661 | |
| Other affiliated issuers (cost $6,525,601) | 8,415,938 | |
| Total Investments (cost $329,168,789) | | $367,155,454 |
| Foreign currency held at value (cost $1,340,570) | | 1,340,570 |
| Receivable for investments sold | | 16,862,821 |
| Receivable for fund shares sold | | 170,180 |
| Dividends receivable | | 1,722,116 |
| Distributions receivable from Fidelity Central Funds | | 66,302 |
| Prepaid expenses | | 304 |
| Other receivables | | 50,867 |
| Total assets | | 387,368,614 |
| Liabilities | | |
| Payable for investments purchased | $13,842,677 | |
| Payable for fund shares redeemed | 392,580 | |
| Accrued management fee | 202,603 | |
| Other affiliated payables | 73,161 | |
| Other payables and accrued expenses | 39,469 | |
| Collateral on securities loaned | 12,399,080 | |
| Total liabilities | | 26,949,570 |
| Net Assets | | $360,419,044 |
| Net Assets consist of: | | |
| Paid in capital | | $336,407,743 |
| Undistributed net investment income | | 2,936,403 |
| Accumulated undistributed net realized gain (loss) on investments and foreign currency transactions | | (16,905,541) |
| Net unrealized appreciation (depreciation) on investments and assets and liabilities in foreign currencies | | 37,980,439 |
| Net Assets, for 7,268,659 shares outstanding | | $360,419,044 |
| Net Asset Value, offering price and redemption price per share ($360,419,044 ÷ 7,268,659 shares) | | $49.59 |
See accompanying notes which are an integral part of the financial statements.
Statement of Operations
| | | Six months ended April 30, 2017 (Unaudited) |
| Investment Income | | |
| Dividends | | $5,409,029 |
| Income from Fidelity Central Funds | | 104,086 |
| Income before foreign taxes withheld | | 5,513,115 |
| Less foreign taxes withheld | | (826,688) |
| Total income | | 4,686,427 |
| Expenses | | |
| Management fee | $1,281,397 | |
| Transfer agent fees | 365,474 | |
| Accounting and security lending fees | 95,705 | |
| Custodian fees and expenses | 37,093 | |
| Independent trustees' fees and expenses | 786 | |
| Registration fees | 12,651 | |
| Audit | 35,090 | |
| Legal | 538 | |
| Interest | 906 | |
| Miscellaneous | 1,693 | |
| Total expenses before reductions | 1,831,333 | |
| Expense reductions | (86,206) | 1,745,127 |
| Net investment income (loss) | | 2,941,300 |
| Realized and Unrealized Gain (Loss) | | |
| Net realized gain (loss) on: | | |
| Investment securities: | | |
| Unaffiliated issuers | 12,517,431 | |
| Fidelity Central Funds | (99) | |
| Other affiliated issuers | 1,083,829 | |
| Foreign currency transactions | (87,779) | |
| Total net realized gain (loss) | | 13,513,382 |
Change in net unrealized appreciation (depreciation) on:
Investment securities | 20,301,226 | |
| Assets and liabilities in foreign currencies | 739 | |
| Total change in net unrealized appreciation (depreciation) | | 20,301,965 |
| Net gain (loss) | | 33,815,347 |
| Net increase (decrease) in net assets resulting from operations | | $36,756,647 |
See accompanying notes which are an integral part of the financial statements.
Statement of Changes in Net Assets
| | Six months ended April 30, 2017 (Unaudited) | Year ended October 31, 2016 |
| Increase (Decrease) in Net Assets | | |
| Operations | | |
| Net investment income (loss) | $2,941,300 | $6,119,558 |
| Net realized gain (loss) | 13,513,382 | (1,723,759) |
| Change in net unrealized appreciation (depreciation) | 20,301,965 | 3,076,831 |
| Net increase (decrease) in net assets resulting from operations | 36,756,647 | 7,472,630 |
| Distributions to shareholders from net investment income | (5,594,124) | (5,087,442) |
| Distributions to shareholders from net realized gain | (1,032,760) | (468,224) |
| Total distributions | (6,626,884) | (5,555,666) |
| Share transactions | | |
| Proceeds from sales of shares | 12,052,991 | 96,625,403 |
| Reinvestment of distributions | 6,272,273 | 5,260,046 |
| Cost of shares redeemed | (118,064,814) | (79,556,474) |
| Net increase (decrease) in net assets resulting from share transactions | (99,739,550) | 22,328,975 |
| Redemption fees | 8,869 | 47,548 |
| Total increase (decrease) in net assets | (69,600,918) | 24,293,487 |
| Net Assets | | |
| Beginning of period | 430,019,962 | 405,726,475 |
| End of period | $360,419,044 | $430,019,962 |
| Other Information | | |
| Undistributed net investment income end of period | $2,936,403 | $5,589,227 |
| Shares | | |
| Sold | 266,250 | 2,066,948 |
| Issued in reinvestment of distributions | 144,389 | 111,940 |
| Redeemed | (2,639,383) | (1,699,653) |
| Net increase (decrease) | (2,228,744) | 479,235 |
See accompanying notes which are an integral part of the financial statements.
Financial Highlights — Fidelity Nordic Fund
| | Six months ended (Unaudited) April 30, | Years ended October 31, | | | | |
| | 2017 | 2016 | 2015 | 2014 | 2013 | 2012 |
| Selected Per–Share Data | | | | | | |
| Net asset value, beginning of period | $45.28 | $44.99 | $43.36 | $43.91 | $30.60 | $29.60 |
| Income from Investment Operations | | | | | | |
| Net investment income (loss)A | .36 | .64 | .56 | .71 | .90 | .70B |
| Net realized and unrealized gain (loss) | 4.72 | .27 | 1.06 | 1.35 | 13.04 | .91 |
| Total from investment operations | 5.08 | .91 | 1.62 | 2.06 | 13.94 | 1.61 |
| Distributions from net investment income | (.65) | (.57) | – | (.83) | (.63) | (.61) |
| Distributions from net realized gain | (.12) | (.05) | – | (1.80) | – | – |
| Total distributions | (.77) | (.62) | – | (2.63) | (.63) | (.61) |
| Redemption fees added to paid in capitalA | –C | –C | .01 | .02 | –C | –C |
| Net asset value, end of period | $49.59 | $45.28 | $44.99 | $43.36 | $43.91 | $30.60 |
| Total ReturnD,E | 11.46% | 1.97% | 3.76% | 4.88% | 46.42% | 5.69% |
| Ratios to Average Net AssetsF,G | | | | | | |
| Expenses before reductions | .99%H | .99% | 1.00% | .99% | 1.04% | 1.08% |
| Expenses net of fee waivers, if any | .99%H | .98% | 1.00% | .99% | 1.04% | 1.08% |
| Expenses net of all reductions | .95%H | .98% | .99% | .98% | 1.02% | 1.04% |
| Net investment income (loss) | 1.60%H | 1.37% | 1.26% | 1.56% | 2.50% | 2.40%B |
| Supplemental Data | | | | | | |
| Net assets, end of period (000 omitted) | $360,419 | $430,020 | $405,726 | $487,582 | $439,147 | $296,951 |
| Portfolio turnover rateI | 66%H | 63% | 80% | 103% | 61% | 193% |
A Calculated based on average shares outstanding during the period.
B Net Investment income per share reflects a large, non-recurring dividend which amounted to $.17 per share. Excluding this non-recurring dividend, the ratio of net investment income (loss) to average net assets would have been 1.83%.
C Amount represents less than $.005 per share.
D Total returns for periods of less than one year are not annualized.
E Total returns would have been lower if certain expenses had not been reduced during the applicable periods shown.
F Fees and expenses of any underlying Fidelity Central Funds are not included in the Fund's expense ratio. The Fund indirectly bears its proportionate share of the expenses of any underlying Fidelity Central Funds.
G Expense ratios reflect operating expenses of the Fund. Expenses before reductions do not reflect amounts reimbursed by the investment adviser or reductions from brokerage service arrangements or reductions from other expense offset arrangements and do not represent the amount paid by the Fund during periods when reimbursements or reductions occur. Expenses net of fee waivers reflect expenses after reimbursement by the investment adviser but prior to reductions from brokerage service arrangements or other expense offset arrangements. Expenses net of all reductions represent the net expenses paid by the Fund.
H Annualized
I Amount does not include the portfolio activity of any underlying Fidelity Central Funds.
See accompanying notes which are an integral part of the financial statements.
Notes to Financial Statements (Unaudited)
For the period ended April 30, 2017
1. Organization.
Fidelity Nordic Fund (the Fund) is a fund of Fidelity Investment Trust (the Trust) and is authorized to issue an unlimited number of shares. Share transactions on the Statement of Changes in Net Assets may contain exchanges between affiliated funds. The Trust is registered under the Investment Company Act of 1940, as amended (the 1940 Act), as an open-end management investment company organized as a Massachusetts business trust.
2. Investments in Fidelity Central Funds.
The Fund invests in Fidelity Central Funds, which are open-end investment companies generally available only to other investment companies and accounts managed by the investment adviser and its affiliates. The Fund's Schedule of Investments lists each of the Fidelity Central Funds held as of period end, if any, as an investment of the Fund, but does not include the underlying holdings of each Fidelity Central Fund. As an Investing Fund, the Fund indirectly bears its proportionate share of the expenses of the underlying Fidelity Central Funds.
The Money Market Central Funds seek preservation of capital and current income and are managed by Fidelity Investments Money Management, Inc. (FIMM), an affiliate of the investment adviser. Annualized expenses of the Money Market Central Funds as of their most recent shareholder report date are less than .005%.
A complete unaudited list of holdings for each Fidelity Central Fund is available upon request or at the Securities and Exchange Commission (the SEC) website at www.sec.gov. In addition, the financial statements of the Fidelity Central Funds are available on the SEC website or upon request.
3. Significant Accounting Policies.
The Fund is an investment company and applies the accounting and reporting guidance of the Financial Accounting Standards Board (FASB) Accounting Standards Codification Topic 946 Financial Services – Investments Companies. The financial statements have been prepared in conformity with accounting principles generally accepted in the United States of America (GAAP), which require management to make certain estimates and assumptions at the date of the financial statements. Actual results could differ from those estimates. Subsequent events, if any, through the date that the financial statements were issued have been evaluated in the preparation of the financial statements. The following summarizes the significant accounting policies of the Fund:
Investment Valuation. Investments are valued as of 4:00 p.m. Eastern time on the last calendar day of the period. The Board of Trustees (the Board) has delegated the day to day responsibility for the valuation of the Fund's investments to the Fair Value Committee (the Committee) established by the Fund's investment adviser. In accordance with valuation policies and procedures approved by the Board, the Fund attempts to obtain prices from one or more third party pricing vendors or brokers to value its investments. When current market prices, quotations or currency exchange rates are not readily available or reliable, investments will be fair valued in good faith by the Committee, in accordance with procedures adopted by the Board. Factors used in determining fair value vary by investment type and may include market or investment specific events. The frequency with which these procedures are used cannot be predicted and they may be utilized to a significant extent. The Committee oversees the Fund's valuation policies and procedures and reports to the Board on the Committee's activities and fair value determinations. The Board monitors the appropriateness of the procedures used in valuing the Fund's investments and ratifies the fair value determinations of the Committee.
The Fund categorizes the inputs to valuation techniques used to value its investments into a disclosure hierarchy consisting of three levels as shown below:
- Level 1 – quoted prices in active markets for identical investments
- Level 2 – other significant observable inputs (including quoted prices for similar investments, interest rates, prepayment speeds, etc.)
- Level 3 – unobservable inputs (including the Fund's own assumptions based on the best information available)
Valuation techniques used to value the Fund's investments by major category are as follows:
Equity securities, including restricted securities, for which market quotations are readily available, are valued at the last reported sale price or official closing price as reported by a third party pricing vendor on the primary market or exchange on which they are traded and are categorized as Level 1 in the hierarchy. In the event there were no sales during the day or closing prices are not available, securities are valued at the last quoted bid price or may be valued using the last available price and are generally categorized as Level 2 in the hierarchy. For foreign equity securities, when market or security specific events arise, comparisons to the valuation of American Depositary Receipts (ADRs), futures contracts, Exchange-Traded Funds (ETFs) and certain indexes as well as quoted prices for similar securities may be used and would be categorized as Level 2 in the hierarchy. Utilizing these techniques may result in transfers between Level 1 and Level 2. For equity securities, including restricted securities, where observable inputs are limited, assumptions about market activity and risk are used and these securities may be categorized as Level 3 in the hierarchy.
Investments in open-end mutual funds, including the Fidelity Central Funds, are valued at their closing net asset value (NAV) each business day and are categorized as Level 1 in the hierarchy.
Changes in valuation techniques may result in transfers in or out of an assigned level within the disclosure hierarchy. The aggregate value of investments by input level as of April 30, 2017 is included at the end of the Fund's Schedule of Investments.
Foreign Currency. The Fund may use foreign currency contracts to facilitate transactions in foreign-denominated securities. Gains and losses from these transactions may arise from changes in the value of the foreign currency or if the counterparties do not perform under the contracts' terms.
Foreign-denominated assets, including investment securities, and liabilities are translated into U.S. dollars at the exchange rates at period end. Purchases and sales of investment securities, income and dividends received and expenses denominated in foreign currencies are translated into U.S. dollars at the exchange rate in effect on the transaction date.
The effects of exchange rate fluctuations on investments are included with the net realized and unrealized gain (loss) on investment securities. Other foreign currency transactions resulting in realized and unrealized gain (loss) are disclosed separately.
Investment Transactions and Income. For financial reporting purposes, the Fund's investment holdings and NAV include trades executed through the end of the last business day of the period. The NAV per share for processing shareholder transactions is calculated as of the close of business of the New York Stock Exchange (NYSE), normally 4:00 p.m. Eastern time and includes trades executed through the end of the prior business day. Gains and losses on securities sold are determined on the basis of identified cost. Dividend income is recorded on the ex-dividend date, except for certain dividends from foreign securities where the ex-dividend date may have passed, which are recorded as soon as the Fund is informed of the ex-dividend date. Non-cash dividends included in dividend income, if any, are recorded at the fair market value of the securities received. Income and capital gain distributions from Fidelity Central Funds, if any, are recorded on the ex-dividend date. Investment income is recorded net of foreign taxes withheld where recovery of such taxes is uncertain.
Expenses. Expenses directly attributable to a fund are charged to that fund. Expenses attributable to more than one fund are allocated among the respective funds on the basis of relative net assets or other appropriate methods. Expense estimates are accrued in the period to which they relate and adjustments are made when actual amounts are known.
Income Tax Information and Distributions to Shareholders. Each year, the Fund intends to qualify as a regulated investment company under Subchapter M of the Internal Revenue Code, including distributing substantially all of its taxable income and realized gains. As a result, no provision for U.S. Federal income taxes is required. The Fund files a U.S. federal tax return, in addition to state and local tax returns as required. The Fund's federal income tax returns are subject to examination by the Internal Revenue Service (IRS) for a period of three fiscal years after they are filed. State and local tax returns may be subject to examination for an additional fiscal year depending on the jurisdiction. Foreign taxes are provided for based on the Fund's understanding of the tax rules and rates that exist in the foreign markets in which it invests.
Distributions are declared and recorded on the ex-dividend date. Income and capital gain distributions are determined in accordance with income tax regulations, which may differ from GAAP.
Capital accounts within the financial statements are adjusted for permanent book-tax differences. These adjustments have no impact on net assets or the results of operations. Capital accounts are not adjusted for temporary book-tax differences which will reverse in a subsequent period.
Book-tax differences are primarily due to foreign currency transactions, passive foreign investment companies (PFIC), deferred trustees compensation, capital loss carryforwards and losses deferred due to wash sales.
The federal tax cost of investment securities and unrealized appreciation (depreciation) as of period end were as follows:
| Gross unrealized appreciation | $53,325,632 |
| Gross unrealized depreciation | (18,192,147) |
| Net unrealized appreciation (depreciation) on securities | $35,133,485 |
| Tax cost | $332,021,969 |
Capital loss carryforwards are only available to offset future capital gains of the Fund to the extent provided by regulations and may be limited. Under the Regulated Investment Company Modernization Act of 2010 (the Act), the Fund is permitted to carry forward capital losses incurred in taxable years beginning after December 22, 2010 for an unlimited period and such capital losses are required to be used prior to any losses that expire. The capital loss carryforward information presented below, including any applicable limitation, is estimated as of prior fiscal period end and is subject to adjustment.
| Fiscal year of expiration | |
| 2017 | $(24,086,581) |
| No expiration | |
| Short-term | (998,155) |
| Long-term | (1,640,614) |
| Total no expiration | (2,638,769) |
| Total capital loss carryforward | $(26,725,350) |
Short-Term Trading (Redemption) Fees. Shares held by investors in the Fund less than 90 days may have been subject to a redemption fee equal to 1.50% of the NAV of shares redeemed. All redemption fees, which reduce the proceeds of the shareholder redemption, are retained by the Fund and accounted for as an addition to paid in capital.
Restricted Securities. The Fund may invest in securities that are subject to legal or contractual restrictions on resale. These securities generally may be resold in transactions exempt from registration or to the public if the securities are registered. Disposal of these securities may involve time-consuming negotiations and expense, and prompt sale at an acceptable price may be difficult. Information regarding restricted securities is included at the end of the Fund's Schedule of Investments.
4. Purchases and Sales of Investments.
Purchases and sales of securities, other than short-term securities, aggregated $122,491,560 and $223,831,817, respectively.
5. Fees and Other Transactions with Affiliates.
Management Fee. Fidelity Management & Research Company (the investment adviser) and its affiliates provide the Fund with investment management related services for which the Fund pays a monthly management fee. The management fee is the sum of an individual fund fee rate that is based on an annual rate of .45% of the Fund's average net assets and an annualized group fee rate that averaged .25% during the period. The group fee rate is based upon the average net assets of all the mutual funds advised by the investment adviser, including any mutual funds previously advised by the investment adviser that are currently advised by Fidelity SelectCo, LLC, an affiliate of the investment adviser. The group fee rate decreases as assets under management increase and increases as assets under management decrease. For the reporting period, the total annualized management fee rate was .70% of the Fund's average net assets.
Transfer Agent Fees. Fidelity Investments Institutional Operations Company, Inc. (FIIOC), an affiliate of the investment adviser, is the Fund's transfer, dividend disbursing and shareholder servicing agent. FIIOC receives account fees and asset-based fees that vary according to account size and type of account. FIIOC pays for typesetting, printing and mailing of shareholder reports, except proxy statements. For the period, the transfer agent fees were equivalent to an annualized rate of .20% of average net assets.
Accounting and Security Lending Fees. Fidelity Service Company, Inc. (FSC), an affiliate of the investment adviser, maintains the Fund's accounting records. The accounting fee is based on the level of average net assets for each month. Under a separate contract, FSC administers the security lending program. The security lending fee is based on the number and duration of lending transactions.
Interfund Lending Program. Pursuant to an Exemptive Order issued by the SEC, the Fund, along with other registered investment companies having management contracts with Fidelity Management & Research Company (FMR) or other affiliated entities of FMR, may participate in an interfund lending program. This program provides an alternative credit facility allowing the funds to borrow from, or lend money to, other participating affiliated funds. At period end, there were no interfund loans outstanding. The Fund's activity in this program during the period for which loans were outstanding was as follows:
| Borrower or Lender | Average Loan Balance | Weighted Average Interest Rate | Interest Expense |
| Borrower | $9,059,500 | .60% | $906 |
Interfund Trades. The Fund may purchase from or sell securities to other Fidelity Funds under procedures adopted by the Board. The procedures have been designed to ensure these interfund trades are executed in accordance with Rule 17a-7 of the 1940 Act. Interfund trades are included within the respective purchases and sales amounts shown in the Purchases and Sales of Investments note.
6. Committed Line of Credit.
The Fund participates with other funds managed by the investment adviser or an affiliate in a $4.25 billion credit facility (the "line of credit") to be utilized for temporary or emergency purposes to fund shareholder redemptions or for other short-term liquidity purposes. The Fund has agreed to pay commitment fees on its pro-rata portion of the line of credit, which amounted to $656 and is reflected in Miscellaneous expenses on the Statement of Operations. During the period, the Fund did not borrow on this line of credit.
7. Security Lending.
The Fund lends portfolio securities through a lending agent from time to time in order to earn additional income. For equity securities, a lending agent is used and may loan securities to certain qualified borrowers, including Fidelity Capital Markets (FCM), a broker-dealer affiliated with the Fund. On the settlement date of the loan, the Fund receives collateral (in the form of U.S. Treasury obligations, letters of credit and/or cash) against the loaned securities and maintains collateral in an amount not less than 100% of the market value of the loaned securities during the period of the loan. The market value of the loaned securities is determined at the close of business of the Fund and any additional required collateral is delivered to the Fund on the next business day. The Fund or borrower may terminate the loan at any time, and if the borrower defaults on its obligation to return the securities loaned because of insolvency or other reasons, the Fund may apply collateral received from the borrower against the obligation. The Fund may experience delays and costs in recovering the securities loaned. Any cash collateral received is invested in the Fidelity Securities Lending Cash Central Fund. The value of loaned securities and cash collateral at period end are disclosed on the Fund's Statement of Assets and Liabilities. Security lending income represents the income earned on investing cash collateral, less rebates paid to borrowers and any lending agent fees associated with the loan, plus any premium payments received for lending certain types of securities. Security lending income is presented in the Statement of Operations as a component of income from Fidelity Central Funds. Total security lending income during the period amounted to $97,612. During the period, there were no securities loaned to FCM.
8. Expense Reductions.
Commissions paid to certain brokers with whom the investment adviser, or its affiliates, places trades on behalf of the Fund include an amount in addition to trade execution, which may be rebated back to the Fund to offset certain expenses. This amount totaled $84,519 for the period.
In addition, during the period the investment adviser reimbursed and/or waived a portion of operating expenses in the amount of $1,687.
9. Other.
The Fund's organizational documents provide former and current trustees and officers with a limited indemnification against liabilities arising in connection with the performance of their duties to the Fund. In the normal course of business, the Fund may also enter into contracts that provide general indemnifications. The Fund's maximum exposure under these arrangements is unknown as this would be dependent on future claims that may be made against the Fund. The risk of material loss from such claims is considered remote.
Fidelity® Pacific Basin Fund
Investment Summary (Unaudited)
Geographic Diversification (% of fund's net assets)
| As of April 30, 2017 |
| | Japan | 34.0% |
| | Australia | 13.5% |
| | China | 8.2% |
| | India | 6.3% |
| | Taiwan | 6.3% |
| | Hong Kong | 5.8% |
| | Cayman Islands | 4.8% |
| | United States of America* | 3.8% |
| | Korea (South) | 3.3% |
| | Other | 14.0% |
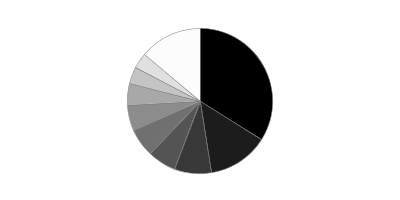
* Includes Short-Term investments and Net Other Assets (Liabilities).
Percentages are based on country or territory of incorporation and are adjusted for the effect of futures contracts, if applicable.
| As of October 31, 2016 |
| | Japan | 36.0% |
| | Australia | 13.4% |
| | India | 7.9% |
| | Taiwan | 7.4% |
| | China | 5.4% |
| | Hong Kong | 5.3% |
| | Bermuda | 4.1% |
| | United States of America* | 3.2% |
| | Indonesia | 3.2% |
| | Other | 14.1% |

* Includes Short-Term investments and Net Other Assets (Liabilities).
Percentages are based on country or territory of incorporation and are adjusted for the effect of futures contracts, if applicable.
Asset Allocation as of April 30, 2017
| | % of fund's net assets | % of fund's net assets 6 months ago |
| Stocks | 97.7 | 99.4 |
| Short-Term Investments and Net Other Assets (Liabilities) | 2.3 | 0.6 |
Top Ten Stocks as of April 30, 2017
| | % of fund's net assets | % of fund's net assets 6 months ago |
| Naspers Ltd. Class N (South Africa, Media) | 3.2 | 2.9 |
| Taiwan Semiconductor Manufacturing Co. Ltd. (Taiwan, Semiconductors & Semiconductor Equipment) | 3.0 | 3.3 |
| Alibaba Group Holding Ltd. sponsored ADR (Cayman Islands, Internet Software & Services) | 2.1 | 1.9 |
| Commonwealth Bank of Australia (Australia, Banks) | 2.0 | 2.0 |
| AIA Group Ltd. (Hong Kong, Insurance) | 2.0 | 2.0 |
| Kweichow Moutai Co. Ltd. (A Shares) (China, Beverages) | 1.8 | 1.8 |
| PT Bank Central Asia Tbk (Indonesia, Banks) | 1.5 | 1.4 |
| CSL Ltd. (Australia, Biotechnology) | 1.5 | 1.2 |
| SoftBank Corp. (Japan, Wireless Telecommunication Services) | 1.5 | 1.3 |
| Jiangsu Hengrui Medicine Co. Ltd. (A Shares) (China, Pharmaceuticals) | 1.4 | 1.4 |
| | 20.0 | |
Top Market Sectors as of April 30, 2017
| | % of fund's net assets | % of fund's net assets 6 months ago |
| Financials | 18.4 | 19.9 |
| Consumer Discretionary | 15.9 | 14.0 |
| Information Technology | 12.8 | 11.6 |
| Industrials | 12.2 | 10.6 |
| Health Care | 11.6 | 14.6 |
| Consumer Staples | 10.1 | 11.5 |
| Real Estate | 4.8 | 4.8 |
| Telecommunication Services | 4.2 | 4.2 |
| Materials | 3.3 | 4.0 |
| Energy | 2.5 | 2.3 |
Fidelity® Pacific Basin Fund
Investments April 30, 2017 (Unaudited)
Showing Percentage of Net Assets
| Common Stocks - 97.7% | | | |
| | | Shares | Value |
| Australia - 13.5% | | | |
| 1-Page Ltd. (a)(b) | | 872,167 | $107,758 |
| Aconex Ltd. (a)(b) | | 1,056,194 | 3,471,955 |
| Amcor Ltd. | | 527,187 | 6,201,642 |
| Arena (REIT) unit | | 2,192,142 | 3,496,344 |
| Asaleo Care Ltd. | | 2,957,365 | 3,974,982 |
| Australia & New Zealand Banking Group Ltd. | | 402,514 | 9,873,945 |
| Blue Sky Alternative Investments Ltd. | | 1,304,870 | 7,816,693 |
| Commonwealth Bank of Australia | | 240,378 | 15,731,567 |
| CSL Ltd. | | 120,544 | 11,964,407 |
| Hansen Technologies Ltd. | | 1,848,148 | 4,982,016 |
| HUB24 Ltd. (b) | | 1,142,609 | 4,192,370 |
| Magellan Financial Group Ltd. | | 227,615 | 4,018,931 |
| NIB Holdings Ltd. | | 1,269,267 | 5,702,563 |
| realestate.com.au Ltd. | | 175,807 | 8,094,807 |
| Reliance Worldwide Corp. Ltd. | | 1,334,827 | 3,048,531 |
| SpeedCast International Ltd. | | 735,710 | 2,098,928 |
| Sydney Airport unit | | 791,380 | 4,082,913 |
| Woodside Petroleum Ltd. | | 309,417 | 7,455,831 |
|
| TOTAL AUSTRALIA | | | 106,316,183 |
|
| Bermuda - 3.1% | | | |
| Brilliance China Automotive Holdings Ltd. | | 2,248,000 | 3,768,655 |
| Cheung Kong Infrastructure Holdings Ltd. | | 1,211,000 | 10,610,174 |
| Hongkong Land Holdings Ltd. | | 875,100 | 6,747,021 |
| PAX Global Technology Ltd. (a) | | 4,667,000 | 2,891,994 |
|
| TOTAL BERMUDA | | | 24,017,844 |
|
| Cayman Islands - 4.8% | | | |
| Alibaba Group Holding Ltd. sponsored ADR (b) | | 140,700 | 16,250,850 |
| China High Precision Automation Group Ltd. (b) | | 1,875,000 | 2 |
| China Metal Recycling (Holdings) Ltd. (b) | | 2,572,200 | 3 |
| Haitian International Holdings Ltd. | | 1,013,000 | 2,482,246 |
| International Housewares Retail Co. Ltd. | | 17,378,000 | 3,932,104 |
| NetEase, Inc. ADR | | 21,600 | 5,732,424 |
| Silergy Corp. | | 313,000 | 5,654,568 |
| SITC International Holdings Co. Ltd. | | 5,566,000 | 3,985,758 |
|
| TOTAL CAYMAN ISLANDS | | | 38,037,955 |
|
| China - 8.2% | | | |
| Gree Electric Appliances, Inc. of Zhuhai Class A | | 1,470,794 | 7,040,865 |
| Hangzhou Hikvision Digital Technology Co. Ltd. Class A | | 1,480,811 | 7,855,699 |
| Industrial & Commercial Bank of China Ltd. (H Shares) | | 13,110,000 | 8,562,073 |
| Jiangsu Hengrui Medicine Co. Ltd. (A Shares) | | 1,381,079 | 10,744,508 |
| Jiangsu Yanghe Brewery Joint-Stock Co. Ltd. Class A | | 357,688 | 4,151,018 |
| Kweichow Moutai Co. Ltd. (A Shares) | | 235,450 | 14,122,560 |
| Shanghai International Airport Co. Ltd. (A Shares) | | 960,105 | 4,770,232 |
| Shenzhen Expressway Co. (H Shares) | | 4,216,000 | 3,842,902 |
| Weifu High-Technology Co. Ltd. (B Shares) | | 1,382,213 | 3,358,531 |
|
| TOTAL CHINA | | | 64,448,388 |
|
| Hong Kong - 5.8% | | | |
| AIA Group Ltd. | | 2,207,800 | 15,284,736 |
| China Resources Beer Holdings Co. Ltd. | | 2,050,666 | 4,935,297 |
| CSPC Pharmaceutical Group Ltd. | | 2,992,000 | 4,154,300 |
| Hang Seng Bank Ltd. | | 430,600 | 8,730,080 |
| Magnificent Hotel Investment Ltd. | | 90,048,000 | 2,188,005 |
| Techtronic Industries Co. Ltd. | | 2,368,500 | 10,170,267 |
|
| TOTAL HONG KONG | | | 45,462,685 |
|
| India - 6.3% | | | |
| Asian Paints Ltd. | | 364,050 | 6,344,685 |
| Bharti Infratel Ltd. | | 1,673,826 | 9,234,812 |
| CCL Products (India) Ltd. (b) | | 142,151 | 755,861 |
| HDFC Bank Ltd. | | 394,066 | 9,619,890 |
| Housing Development Finance Corp. Ltd. | | 291,623 | 6,972,598 |
| Indraprastha Gas Ltd. | | 269,883 | 4,440,119 |
| Petronet LNG Ltd. | | 1,254,516 | 8,268,800 |
| Reliance Industries Ltd. | | 193,102 | 4,190,635 |
|
| TOTAL INDIA | | | 49,827,400 |
|
| Indonesia - 3.1% | | | |
| PT Bank Central Asia Tbk | | 9,167,900 | 12,208,735 |
| PT Bank Rakyat Indonesia Tbk | | 8,236,100 | 7,971,017 |
| PT Gudang Garam Tbk | | 886,300 | 4,415,209 |
|
| TOTAL INDONESIA | | | 24,594,961 |
|
| Israel - 0.8% | | | |
| Sarine Technologies Ltd. | | 4,391,400 | 6,034,777 |
| Japan - 34.0% | | | |
| Arcland Service Holdings Co. Ltd. (b) | | 191,500 | 5,282,462 |
| Astellas Pharma, Inc. | | 442,600 | 5,836,616 |
| Bank of Kyoto Ltd. | | 722,000 | 5,712,527 |
| Broadleaf Co. Ltd. | | 293,902 | 1,906,178 |
| Create SD Holdings Co. Ltd. | | 211,800 | 4,974,141 |
| DaikyoNishikawa Corp. | | 186,500 | 2,367,325 |
| Daito Trust Construction Co. Ltd. | | 51,200 | 7,532,451 |
| Dentsu, Inc. | | 102,100 | 5,751,855 |
| East Japan Railway Co. | | 78,300 | 6,991,686 |
| Fanuc Corp. | | 41,400 | 8,428,878 |
| Harmonic Drive Systems, Inc. (a) | | 96,500 | 3,034,156 |
| Hoya Corp. | | 151,200 | 7,221,250 |
| Hulic Co. Ltd. | | 321,400 | 3,027,316 |
| Japan Tobacco, Inc. | | 233,600 | 7,766,061 |
| Kakaku.com, Inc. | | 304,100 | 4,383,841 |
| Kao Corp. | | 149,000 | 8,217,556 |
| KDDI Corp. | | 355,000 | 9,412,496 |
| Keyence Corp. | | 21,800 | 8,761,068 |
| Misumi Group, Inc. | | 262,700 | 4,974,745 |
| Mitsubishi Pencil Co. Ltd. | | 71,300 | 3,952,761 |
| Mitsui Fudosan Co. Ltd. | | 227,000 | 4,987,993 |
| Morinaga & Co. Ltd. | | 94,600 | 4,472,231 |
| Murata Manufacturing Co. Ltd. | | 42,000 | 5,630,769 |
| Nakanishi, Inc. | | 143,500 | 5,638,305 |
| Nidec Corp. | | 70,700 | 6,481,758 |
| Nihon M&A Center, Inc. | | 113,600 | 3,882,628 |
| Nihon Parkerizing Co. Ltd. | | 337,200 | 4,328,623 |
| Nitori Holdings Co. Ltd. | | 56,500 | 7,354,250 |
| Olympus Corp. | | 116,400 | 4,479,534 |
| Open House Co. Ltd. | | 191,800 | 4,704,025 |
| ORIX Corp. | | 513,500 | 7,835,510 |
| PALTAC Corp. | | 95,500 | 2,818,524 |
| PeptiDream, Inc. (a)(b) | | 51,000 | 3,051,536 |
| ProNexus, Inc. | | 276,400 | 3,461,354 |
| Rakuten, Inc. | | 432,400 | 4,425,821 |
| Shionogi & Co. Ltd. | | 170,700 | 8,778,857 |
| SK Kaken Co. Ltd. | | 48,000 | 4,564,252 |
| SMC Corp. | | 20,600 | 5,800,709 |
| SMS Co., Ltd. | | 210,300 | 5,597,310 |
| SoftBank Corp. | | 154,600 | 11,726,830 |
| Sosei Group Corp. (a)(b) | | 22,700 | 2,331,599 |
| Start Today Co. Ltd. | | 256,400 | 5,474,160 |
| Subaru Corp. | | 256,700 | 9,699,219 |
| Sundrug Co. Ltd. | | 144,600 | 5,071,864 |
| The Suruga Bank Ltd. | | 313,800 | 6,556,091 |
| Tokyo Century Corp. | | 111,800 | 3,851,195 |
| Toshiba Plant Systems & Services Corp. | | 355,900 | 5,788,264 |
| Welcia Holdings Co. Ltd. | | 95,800 | 3,085,194 |
|
| TOTAL JAPAN | | | 267,413,774 |
|
| Korea (South) - 3.3% | | | |
| BGFretail Co. Ltd. | | 44,752 | 4,307,616 |
| Coway Co. Ltd. | | 35,473 | 3,133,823 |
| KEPCO Plant Service & Engineering Co. Ltd. | | 88,695 | 4,475,293 |
| LG Household & Health Care Ltd. | | 5,939 | 4,521,074 |
| Loen Entertainment, Inc. | | 60,869 | 4,703,222 |
| Medy-Tox, Inc. | | 10,750 | 4,726,749 |
|
| TOTAL KOREA (SOUTH) | | | 25,867,777 |
|
| New Zealand - 1.4% | | | |
| EBOS Group Ltd. | | 408,279 | 5,132,739 |
| Ryman Healthcare Group Ltd. | | 925,540 | 5,484,156 |
|
| TOTAL NEW ZEALAND | | | 10,616,895 |
|
| Philippines - 1.0% | | | |
| Ayala Land, Inc. | | 5,832,700 | 4,105,447 |
| D&L Industries, Inc. | | 13,974,600 | 3,566,691 |
|
| TOTAL PHILIPPINES | | | 7,672,138 |
|
| Singapore - 0.3% | | | |
| Wing Tai Holdings Ltd. | | 1,890,100 | 2,556,840 |
| South Africa - 3.2% | | | |
| Naspers Ltd. Class N | | 131,400 | 24,985,905 |
| Taiwan - 6.3% | | | |
| Advantech Co. Ltd. | | 590,000 | 4,763,260 |
| CTCI Corp. | | 3,474,000 | 6,069,126 |
| ECLAT Textile Co. Ltd. | | 317,000 | 3,466,516 |
| Nien Made Enterprise Co. Ltd. | | 643,000 | 6,499,570 |
| Taiwan Semiconductor Manufacturing Co. Ltd. | | 3,690,000 | 23,729,693 |
| Voltronic Power Technology Corp. | | 329,703 | 4,696,329 |
|
| TOTAL TAIWAN | | | 49,224,494 |
|
| Thailand - 1.1% | | | |
| Bangkok Bank PCL (For. Reg.) | | 882,400 | 4,769,040 |
| Thai Beverage PCL | | 6,086,700 | 4,029,773 |
|
| TOTAL THAILAND | | | 8,798,813 |
|
| United States of America - 1.5% | | | |
| China Biologic Products, Inc. (b) | | 41,600 | 4,908,800 |
| GI Dynamics, Inc. CDI (b) | | 5,561,290 | 274,843 |
| ResMed, Inc. CDI | | 923,110 | 6,331,619 |
|
| TOTAL UNITED STATES OF AMERICA | | | 11,515,262 |
|
| TOTAL COMMON STOCKS | | | |
| (Cost $612,405,598) | | | 767,392,091 |
|
| Money Market Funds - 3.3% | | | |
| Fidelity Cash Central Fund, 0.85% (c) | | 16,365,966 | 16,369,239 |
| Fidelity Securities Lending Cash Central Fund 0.86% (c)(d) | | 9,668,007 | 9,668,975 |
| TOTAL MONEY MARKET FUNDS | | | |
| (Cost $26,037,890) | | | 26,038,214 |
| TOTAL INVESTMENT PORTFOLIO - 101.0% | | | |
| (Cost $638,443,488) | | | 793,430,305 |
| NET OTHER ASSETS (LIABILITIES) - (1.0)% | | | (7,509,176) |
| NET ASSETS - 100% | | | $785,921,129 |
Categorizations in the Schedule of Investments are based on country or territory of incorporation.
Legend
(a) Security or a portion of the security is on loan at period end.
(b) Non-income producing
(c) Affiliated fund that is generally available only to investment companies and other accounts managed by Fidelity Investments. The rate quoted is the annualized seven-day yield of the fund at period end. A complete unaudited listing of the fund's holdings as of its most recent quarter end is available upon request. In addition, each Fidelity Central Fund's financial statements are available on the SEC's website or upon request.
(d) Investment made with cash collateral received from securities on loan.
Affiliated Central Funds
Information regarding fiscal year to date income earned by the Fund from investments in Fidelity Central Funds is as follows:
| Fund | Income earned |
| Fidelity Cash Central Fund | $50,065 |
| Fidelity Securities Lending Cash Central Fund | 145,828 |
| Total | $195,893 |
Investment Valuation
The following is a summary of the inputs used, as of April 30, 2017, involving the Fund's assets and liabilities carried at fair value. The inputs or methodology used for valuing securities may not be an indication of the risk associated with investing in those securities. For more information on valuation inputs, and their aggregation into the levels used below, please refer to the Investment Valuation section in the accompanying Notes to Financial Statements.
| | Valuation Inputs at Reporting Date: |
| Description | Total | Level 1 | Level 2 | Level 3 |
| Investments in Securities: | | | | |
| Equities: | | | | |
| Consumer Discretionary | $124,515,886 | $99,529,981 | $24,985,905 | $-- |
| Consumer Staples | 78,800,437 | 78,800,437 | -- | -- |
| Energy | 19,915,266 | 19,915,266 | -- | -- |
| Financials | 145,409,561 | 135,789,671 | 9,619,890 | -- |
| Health Care | 91,059,818 | 85,223,202 | 5,836,616 | -- |
| Industrials | 96,285,046 | 87,856,168 | 8,428,878 | -- |
| Information Technology | 101,719,385 | 77,881,932 | 23,729,693 | 107,760 |
| Materials | 25,005,896 | 25,005,893 | -- | 3 |
| Real Estate | 37,157,437 | 37,157,437 | -- | -- |
| Telecommunication Services | 32,473,066 | 11,333,740 | 21,139,326 | -- |
| Utilities | 15,050,293 | 15,050,293 | -- | -- |
| Money Market Funds | 26,038,214 | 26,038,214 | -- | -- |
| Total Investments in Securities: | $793,430,305 | $699,582,234 | $93,740,308 | $107,763 |
The following is a summary of transfers between Level 1 and Level 2 for the period ended April 30, 2017. Transfers are assumed to have occurred at the beginning of the period, and are primarily attributable to the valuation techniques used for foreign equity securities, as discussed in the accompanying Notes to Financial Statements:
| Transfers | Total |
| Level 1 to Level 2 | $19,827,286 |
| Level 2 to Level 1 | $7,869,143 |
See accompanying notes which are an integral part of the financial statements.
Fidelity® Pacific Basin Fund
Financial Statements
Statement of Assets and Liabilities
| | | April 30, 2017 (Unaudited) |
| Assets | | |
Investment in securities, at value (including securities loaned of $9,183,913) — See accompanying schedule:
Unaffiliated issuers (cost $612,405,598) | $767,392,091 | |
| Fidelity Central Funds (cost $26,037,890) | 26,038,214 | |
| Total Investments (cost $638,443,488) | | $793,430,305 |
| Receivable for investments sold | | 3,984,885 |
| Receivable for fund shares sold | | 721,047 |
| Dividends receivable | | 1,950,313 |
| Distributions receivable from Fidelity Central Funds | | 56,285 |
| Prepaid expenses | | 437 |
| Other receivables | | 60,545 |
| Total assets | | 800,203,817 |
| Liabilities | | |
| Payable for investments purchased | $2,931,164 | |
| Payable for fund shares redeemed | 344,411 | |
| Accrued management fee | 546,590 | |
| Other affiliated payables | 139,983 | |
| Other payables and accrued expenses | 652,126 | |
| Collateral on securities loaned | 9,668,414 | |
| Total liabilities | | 14,282,688 |
| Net Assets | | $785,921,129 |
| Net Assets consist of: | | |
| Paid in capital | | $629,603,668 |
| Undistributed net investment income | | 1,390,363 |
| Accumulated undistributed net realized gain (loss) on investments and foreign currency transactions | | 471,816 |
| Net unrealized appreciation (depreciation) on investments and assets and liabilities in foreign currencies | | 154,455,282 |
| Net Assets, for 26,293,002 shares outstanding | | $785,921,129 |
| Net Asset Value, offering price and redemption price per share ($785,921,129 ÷ 26,293,002 shares) | | $29.89 |
See accompanying notes which are an integral part of the financial statements.
Statement of Operations
| | | Six months ended April 30, 2017 (Unaudited) |
| Investment Income | | |
| Dividends | | $5,528,761 |
| Income from Fidelity Central Funds | | 195,893 |
| Income before foreign taxes withheld | | 5,724,654 |
| Less foreign taxes withheld | | (401,127) |
| Total income | | 5,323,527 |
| Expenses | | |
| Management fee | | |
| Basic fee | $2,465,048 | |
| Performance adjustment | 524,820 | |
| Transfer agent fees | 632,051 | |
| Accounting and security lending fees | 173,412 | |
| Custodian fees and expenses | 95,201 | |
| Independent trustees' fees and expenses | 1,415 | |
| Registration fees | 18,898 | |
| Audit | 46,005 | |
| Legal | 800 | |
| Miscellaneous | 2,679 | |
| Total expenses before reductions | 3,960,329 | |
| Expense reductions | (45,130) | 3,915,199 |
| Net investment income (loss) | | 1,408,328 |
| Realized and Unrealized Gain (Loss) | | |
| Net realized gain (loss) on: | | |
| Investment securities: | | |
| Unaffiliated issuers | 7,142,109 | |
| Fidelity Central Funds | 593 | |
| Foreign currency transactions | (423,496) | |
| Total net realized gain (loss) | | 6,719,206 |
Change in net unrealized appreciation (depreciation) on:
Investment securities (net of increase in deferred foreign taxes of $477,073) | 37,691,428 | |
| Assets and liabilities in foreign currencies | 49,585 | |
| Total change in net unrealized appreciation (depreciation) | | 37,741,013 |
| Net gain (loss) | | 44,460,219 |
| Net increase (decrease) in net assets resulting from operations | | $45,868,547 |
See accompanying notes which are an integral part of the financial statements.
Statement of Changes in Net Assets
| | Six months ended April 30, 2017 (Unaudited) | Year ended October 31, 2016 |
| Increase (Decrease) in Net Assets | | |
| Operations | | |
| Net investment income (loss) | $1,408,328 | $5,670,296 |
| Net realized gain (loss) | 6,719,206 | 12,054,415 |
| Change in net unrealized appreciation (depreciation) | 37,741,013 | 55,378,405 |
| Net increase (decrease) in net assets resulting from operations | 45,868,547 | 73,103,116 |
| Distributions to shareholders from net investment income | (4,211,416) | (8,723,132) |
| Distributions to shareholders from net realized gain | (11,304,324) | (22,916,293) |
| Total distributions | (15,515,740) | (31,639,425) |
| Share transactions | | |
| Proceeds from sales of shares | 132,900,178 | 74,529,168 |
| Reinvestment of distributions | 14,752,434 | 30,030,138 |
| Cost of shares redeemed | (80,467,265) | (111,767,463) |
| Net increase (decrease) in net assets resulting from share transactions | 67,185,347 | (7,208,157) |
| Redemption fees | 64,628 | 30,553 |
| Total increase (decrease) in net assets | 97,602,782 | 34,286,087 |
| Net Assets | | |
| Beginning of period | 688,318,347 | 654,032,260 |
| End of period | $785,921,129 | $688,318,347 |
| Other Information | | |
| Undistributed net investment income end of period | $1,390,363 | $4,193,451 |
| Shares | | |
| Sold | 4,765,622 | 2,706,719 |
| Issued in reinvestment of distributions | 557,537 | 1,147,503 |
| Redeemed | (2,916,360) | (4,183,480) |
| Net increase (decrease) | 2,406,799 | (329,258) |
See accompanying notes which are an integral part of the financial statements.
Financial Highlights — Fidelity Pacific Basin Fund
| | Six months ended (Unaudited) April 30, | Years ended October 31, | | | | |
| | 2017 | 2016 | 2015 | 2014 | 2013 | 2012 |
| Selected Per–Share Data | | | | | | |
| Net asset value, beginning of period | $28.82 | $27.01 | $28.92 | $31.47 | $24.85 | $22.96 |
| Income from Investment Operations | | | | | | |
| Net investment income (loss)A | .06 | .24 | .37B | .31 | .12 | .30 |
| Net realized and unrealized gain (loss) | 1.64 | 2.88 | (.49) | 1.25 | 7.26 | 1.79 |
| Total from investment operations | 1.70 | 3.12 | (.12) | 1.56 | 7.38 | 2.09 |
| Distributions from net investment income | (.17) | (.36) | (.18) | (.18) | (.29) | (.12) |
| Distributions from net realized gain | (.46) | (.95) | (1.61) | (3.93) | (.47) | (.08) |
| Total distributions | (.63) | (1.31) | (1.79) | (4.11) | (.76) | (.20) |
| Redemption fees added to paid in capitalA,C | – | – | – | – | – | – |
| Net asset value, end of period | $29.89 | $28.82 | $27.01 | $28.92 | $31.47 | $24.85 |
| Total ReturnD,E | 6.18% | 12.05% | (.29)% | 5.68% | 30.58% | 9.22% |
| Ratios to Average Net AssetsF,G | | | | | | |
| Expenses before reductions | 1.12%H | 1.19% | 1.17% | 1.18% | 1.23% | 1.28% |
| Expenses net of fee waivers, if any | 1.12%H | 1.19% | 1.17% | 1.18% | 1.22% | 1.28% |
| Expenses net of all reductions | 1.11%H | 1.19% | 1.17% | 1.18% | 1.21% | 1.26% |
| Net investment income (loss) | .40%H | .87% | 1.34%B | 1.09% | .42% | 1.29% |
| Supplemental Data | | | | | | |
| Net assets, end of period (000 omitted) | $785,921 | $688,318 | $654,032 | $697,202 | $719,675 | $581,254 |
| Portfolio turnover rateI | 30%H | 30% | 36% | 30% | 82% | 26% |
A Calculated based on average shares outstanding during the period.
B Net Investment income per share reflects a large, non-recurring dividend which amounted to $.10 per share. Excluding this non-recurring dividend, the ratio of net investment income (loss) to average net assets would have been .99%.
C Amount represents less than $.005 per share.
D Total returns for periods of less than one year are not annualized.
E Total returns would have been lower if certain expenses had not been reduced during the applicable periods shown.
F Fees and expenses of any underlying Fidelity Central Funds are not included in the Fund's expense ratio. The Fund indirectly bears its proportionate share of the expenses of any underlying Fidelity Central Funds.
G Expense ratios reflect operating expenses of the Fund. Expenses before reductions do not reflect amounts reimbursed by the investment adviser or reductions from brokerage service arrangements or reductions from other expense offset arrangements and do not represent the amount paid by the Fund during periods when reimbursements or reductions occur. Expenses net of fee waivers reflect expenses after reimbursement by the investment adviser but prior to reductions from brokerage service arrangements or other expense offset arrangements. Expenses net of all reductions represent the net expenses paid by the Fund.
H Annualized
I Amount does not include the portfolio activity of any underlying Fidelity Central Funds.
See accompanying notes which are an integral part of the financial statements.
Notes to Financial Statements (Unaudited)
For the period ended April 30, 2017
1. Organization.
Fidelity Pacific Basin Fund (the Fund) is a fund of Fidelity Investment Trust (the Trust) and is authorized to issue an unlimited number of shares. Share transactions on the Statement of Changes in Net Assets may contain exchanges between affiliated funds. The Trust is registered under the Investment Company Act of 1940, as amended (the 1940 Act), as an open-end management investment company organized as a Massachusetts business trust. The Fund's investments in emerging markets can be subject to social, economic, regulatory, and political uncertainties and can be extremely volatile.
2. Investments in Fidelity Central Funds.
The Fund invests in Fidelity Central Funds, which are open-end investment companies generally available only to other investment companies and accounts managed by the investment adviser and its affiliates. The Fund's Schedule of Investments lists each of the Fidelity Central Funds held as of period end, if any, as an investment of the Fund, but does not include the underlying holdings of each Fidelity Central Fund. As an Investing Fund, the Fund indirectly bears its proportionate share of the expenses of the underlying Fidelity Central Funds.
The Money Market Central Funds seek preservation of capital and current income and are managed by Fidelity Investments Money Management, Inc. (FIMM), an affiliate of the investment adviser. Annualized expenses of the Money Market Central Funds as of their most recent shareholder report date are less than .005%.
A complete unaudited list of holdings for each Fidelity Central Fund is available upon request or at the Securities and Exchange Commission (the SEC) website at www.sec.gov. In addition, the financial statements of the Fidelity Central Funds are available on the SEC website or upon request.
3. Significant Accounting Policies.
The Fund is an investment company and applies the accounting and reporting guidance of the Financial Accounting Standards Board (FASB) Accounting Standards Codification Topic 946 Financial Services – Investments Companies. The financial statements have been prepared in conformity with accounting principles generally accepted in the United States of America (GAAP), which require management to make certain estimates and assumptions at the date of the financial statements. Actual results could differ from those estimates. Subsequent events, if any, through the date that the financial statements were issued have been evaluated in the preparation of the financial statements. The following summarizes the significant accounting policies of the Fund:
Investment Valuation. Investments are valued as of 4:00 p.m. Eastern time on the last calendar day of the period. The Board of Trustees (the Board) has delegated the day to day responsibility for the valuation of the Fund's investments to the Fair Value Committee (the Committee) established by the Fund's investment adviser. In accordance with valuation policies and procedures approved by the Board, the Fund attempts to obtain prices from one or more third party pricing vendors or brokers to value its investments. When current market prices, quotations or currency exchange rates are not readily available or reliable, investments will be fair valued in good faith by the Committee, in accordance with procedures adopted by the Board. Factors used in determining fair value vary by investment type and may include market or investment specific events. The frequency with which these procedures are used cannot be predicted and they may be utilized to a significant extent. The Committee oversees the Fund's valuation policies and procedures and reports to the Board on the Committee's activities and fair value determinations. The Board monitors the appropriateness of the procedures used in valuing the Fund's investments and ratifies the fair value determinations of the Committee.
The Fund categorizes the inputs to valuation techniques used to value its investments into a disclosure hierarchy consisting of three levels as shown below:
- Level 1 – quoted prices in active markets for identical investments
- Level 2 – other significant observable inputs (including quoted prices for similar investments, interest rates, prepayment speeds, etc.)
- Level 3 – unobservable inputs (including the Fund's own assumptions based on the best information available)
Valuation techniques used to value the Fund's investments by major category are as follows:
Equity securities, including restricted securities, for which market quotations are readily available, are valued at the last reported sale price or official closing price as reported by a third party pricing vendor on the primary market or exchange on which they are traded and are categorized as Level 1 in the hierarchy. In the event there were no sales during the day or closing prices are not available, securities are valued at the last quoted bid price or may be valued using the last available price and are generally categorized as Level 2 in the hierarchy. For foreign equity securities, when market or security specific events arise, comparisons to the valuation of American Depositary Receipts (ADRs), futures contracts, Exchange-Traded Funds (ETFs) and certain indexes as well as quoted prices for similar securities may be used and would be categorized as Level 2 in the hierarchy. Utilizing these techniques may result in transfers between Level 1 and Level 2. For equity securities, including restricted securities, where observable inputs are limited, assumptions about market activity and risk are used and these securities may be categorized as Level 3 in the hierarchy.
Investments in open-end mutual funds, including the Fidelity Central Funds, are valued at their closing net asset value (NAV) each business day and are categorized as Level 1 in the hierarchy.
Changes in valuation techniques may result in transfers in or out of an assigned level within the disclosure hierarchy. The aggregate value of investments by input level as of April 30, 2017, including information on transfers between Levels 1 and 2, is included at the end of the Fund's Schedule of Investments.
Foreign Currency. The Fund may use foreign currency contracts to facilitate transactions in foreign-denominated securities. Gains and losses from these transactions may arise from changes in the value of the foreign currency or if the counterparties do not perform under the contracts' terms.
Foreign-denominated assets, including investment securities, and liabilities are translated into U.S. dollars at the exchange rates at period end. Purchases and sales of investment securities, income and dividends received and expenses denominated in foreign currencies are translated into U.S. dollars at the exchange rate in effect on the transaction date.
The effects of exchange rate fluctuations on investments are included with the net realized and unrealized gain (loss) on investment securities. Other foreign currency transactions resulting in realized and unrealized gain (loss) are disclosed separately.
Investment Transactions and Income. For financial reporting purposes, the Fund's investment holdings and NAV include trades executed through the end of the last business day of the period. The NAV per share for processing shareholder transactions is calculated as of the close of business of the New York Stock Exchange (NYSE), normally 4:00 p.m. Eastern time and includes trades executed through the end of the prior business day. Gains and losses on securities sold are determined on the basis of identified cost. Dividend income is recorded on the ex-dividend date, except for certain dividends from foreign securities where the ex-dividend date may have passed, which are recorded as soon as the Fund is informed of the ex-dividend date. Non-cash dividends included in dividend income, if any, are recorded at the fair market value of the securities received. Income and capital gain distributions from Fidelity Central Funds, if any, are recorded on the ex-dividend date. Investment income is recorded net of foreign taxes withheld where recovery of such taxes is uncertain.
Expenses. Expenses directly attributable to a fund are charged to that fund. Expenses attributable to more than one fund are allocated among the respective funds on the basis of relative net assets or other appropriate methods. Expense estimates are accrued in the period to which they relate and adjustments are made when actual amounts are known.
Income Tax Information and Distributions to Shareholders. Each year, the Fund intends to qualify as a regulated investment company under Subchapter M of the Internal Revenue Code, including distributing substantially all of its taxable income and realized gains. As a result, no provision for U.S. Federal income taxes is required. The Fund files a U.S. federal tax return, in addition to state and local tax returns as required. The Fund's federal income tax returns are subject to examination by the Internal Revenue Service (IRS) for a period of three fiscal years after they are filed. State and local tax returns may be subject to examination for an additional fiscal year depending on the jurisdiction. Foreign taxes are provided for based on the Fund's understanding of the tax rules and rates that exist in the foreign markets in which it invests. The Fund is subject to a tax imposed on capital gains by certain countries in which it invests. An estimated deferred tax liability for net unrealized appreciation on the applicable securities is included in Other payables and accrued expenses on the Statement of Assets & Liabilities.
Distributions are declared and recorded on the ex-dividend date. Income and capital gain distributions are determined in accordance with income tax regulations, which may differ from GAAP.
Capital accounts within the financial statements are adjusted for permanent book-tax differences. These adjustments have no impact on net assets or the results of operations. Capital accounts are not adjusted for temporary book-tax differences which will reverse in a subsequent period.
Book-tax differences are primarily due to foreign currency transactions, passive foreign investment companies (PFIC), deferred trustees compensation and losses deferred due to wash sales.
The federal tax cost of investment securities and unrealized appreciation (depreciation) as of period end were as follows:
| Gross unrealized appreciation | $180,996,135 |
| Gross unrealized depreciation | (32,186,761) |
| Net unrealized appreciation (depreciation) on securities | $148,809,374 |
| Tax cost | $644,620,931 |
Short-Term Trading (Redemption) Fees. Shares held by investors in the Fund less than 90 days may have been subject to a redemption fee equal to 1.50% of the NAV of shares redeemed. All redemption fees, which reduce the proceeds of the shareholder redemption, are retained by the Fund and accounted for as an addition to paid in capital.
4. Purchases and Sales of Investments.
Purchases and sales of securities, other than short-term securities, aggregated $140,780,953 and $103,153,262, respectively.
5. Fees and Other Transactions with Affiliates.
Management Fee. Fidelity Management & Research Company (the investment adviser) and its affiliates provide the Fund with investment management related services for which the Fund pays a monthly management fee. The management fee is the sum of an individual fund fee rate that is based on an annual rate of .45% of the Fund's average net assets and an annualized group fee rate that averaged .25% during the period. The group fee rate is based upon the average net assets of all the mutual funds advised by the investment adviser, including any mutual funds previously advised by the investment adviser that are currently advised by Fidelity SelectCo, LLC, an affiliate of the investment adviser. The group fee rate decreases as assets under management increase and increases as assets under management decrease. In addition, the management fee is subject to a performance adjustment (up to a maximum of +/- .20% of the Fund's average net assets over a 36 month performance period). The upward or downward adjustment to the management fee is based on the Fund's relative investment performance as compared to its benchmark index, the MSCI All Country Pacific Index, over the same 36 month performance period. For the reporting period, the total annualized management fee rate, including the performance adjustment, was .85% of the Fund's average net assets. The performance adjustment included in the management fee rate may be higher or lower than the maximum performance adjustment rate due to the difference between the average net assets for the reporting and performance periods.
Transfer Agent Fees. Fidelity Investments Institutional Operations Company, Inc. (FIIOC), an affiliate of the investment adviser, is the Fund's transfer, dividend disbursing and shareholder servicing agent. FIIOC receives account fees and asset-based fees that vary according to account size and type of account. FIIOC pays for typesetting, printing and mailing of shareholder reports, except proxy statements. For the period, the transfer agent fees were equivalent to an annualized rate of .18% of average net assets.
Accounting and Security Lending Fees. Fidelity Service Company, Inc. (FSC), an affiliate of the investment adviser, maintains the Fund's accounting records. The accounting fee is based on the level of average net assets for each month. Under a separate contract, FSC administers the security lending program. The security lending fee is based on the number and duration of lending transactions.
Brokerage Commissions. The Fund placed a portion of its portfolio transactions with brokerage firms which are affiliates of the investment adviser. Brokerage commissions are included in net realized gain (loss) and change in net unrealized appreciation (depreciation) in the Statement of Operations. The commissions paid to these affiliated firms were $328 for the period.
Interfund Trades. The Fund may purchase from or sell securities to other Fidelity Funds under procedures adopted by the Board. The procedures have been designed to ensure these interfund trades are executed in accordance with Rule 17a-7 of the 1940 Act. Interfund trades are included within the respective purchases and sales amounts shown in the Purchases and Sales of Investments note.
6. Committed Line of Credit.
The Fund participates with other funds managed by the investment adviser or an affiliate in a $4.25 billion credit facility (the "line of credit") to be utilized for temporary or emergency purposes to fund shareholder redemptions or for other short-term liquidity purposes. The Fund has agreed to pay commitment fees on its pro-rata portion of the line of credit, which amounted to $1,176 and is reflected in Miscellaneous expenses on the Statement of Operations. During the period, the Fund did not borrow on this line of credit.
7. Security Lending.
The Fund lends portfolio securities through a lending agent from time to time in order to earn additional income. For equity securities, a lending agent is used and may loan securities to certain qualified borrowers, including Fidelity Capital Markets (FCM), a broker-dealer affiliated with the Fund. On the settlement date of the loan, the Fund receives collateral (in the form of U.S. Treasury obligations, letters of credit and/or cash) against the loaned securities and maintains collateral in an amount not less than 100% of the market value of the loaned securities during the period of the loan. The market value of the loaned securities is determined at the close of business of the Fund and any additional required collateral is delivered to the Fund on the next business day. The Fund or borrower may terminate the loan at any time, and if the borrower defaults on its obligation to return the securities loaned because of insolvency or other reasons, the Fund may apply collateral received from the borrower against the obligation. The Fund may experience delays and costs in recovering the securities loaned. Any cash collateral received is invested in the Fidelity Securities Lending Cash Central Fund. The value of loaned securities and cash collateral at period end are disclosed on the Fund's Statement of Assets and Liabilities. The value of securities loaned to FCM at period end was $4,934. Security lending income represents the income earned on investing cash collateral, less rebates paid to borrowers and any lending agent fees associated with the loan, plus any premium payments received for lending certain types of securities. Security lending income is presented in the Statement of Operations as a component of income from Fidelity Central Funds. Total security lending income during the period amounted to $145,828, including $247 from securities loaned to FCM.
8. Expense Reductions.
Commissions paid to certain brokers with whom the investment adviser, or its affiliates, places trades on behalf of the Fund include an amount in addition to trade execution, which may be rebated back to the Fund to offset certain expenses. This amount totaled $42,127 for the period.
In addition, during the period the investment adviser reimbursed and/or waived a portion of operating expenses in the amount of $3,003.
9. Other.
The Fund's organizational documents provide former and current trustees and officers with a limited indemnification against liabilities arising in connection with the performance of their duties to the Fund. In the normal course of business, the Fund may also enter into contracts that provide general indemnifications. The Fund's maximum exposure under these arrangements is unknown as this would be dependent on future claims that may be made against the Fund. The risk of material loss from such claims is considered remote.
At the end of the period, Strategic Advisers International II Fund was the owner of record of approximately 13% of the total outstanding shares of the Fund. Mutual funds managed by the investment adviser or its affiliates were the owners of record, in the aggregate, of approximately 21% of the total outstanding shares of the Fund.
Shareholder Expense Example
As a shareholder of the Fund, you incur two types of costs: (1) transaction costs, including sales charges (loads) on purchase payments or redemption proceeds, redemption fees and (2) ongoing costs, including management fees, distribution and/or service (12b-1) fees and other Fund expenses. This Example is intended to help you understand your ongoing costs (in dollars) of investing in the Fund and to compare these costs with the ongoing costs of investing in other mutual funds.
The Example is based on an investment of $1,000 invested at the beginning of the period and held for the entire period (November 1, 2016 to April 30, 2017).
Actual Expenses
The first line of the accompanying table for each class of the Fund provides information about actual account values and actual expenses. You may use the information in this line, together with the amount you invested, to estimate the expenses that you paid over the period. Simply divide your account value by $1,000.00 (for example, an $8,600 account value divided by $1,000.00 = 8.6), then multiply the result by the number in the first line for a class of the Fund under the heading entitled "Expenses Paid During Period" to estimate the expenses you paid on your account during this period. A small balance maintenance fee of $12.00 that is charged once a year may apply for certain accounts with a value of less than $2,000. This fee is not included in the table below. If it was, the estimate of expenses you paid during the period would be higher, and your ending account value lower, by this amount. In addition, the Fund, as a shareholder in the underlying Fidelity Central Funds, will indirectly bear its pro-rata share of the fees and expenses incurred by the underlying Fidelity Central Funds. These fees and expenses are not included in the Fund's annualized expense ratio used to calculate the expense estimate in the table below.
Hypothetical Example for Comparison Purposes
The second line of the accompanying table for each class of the Fund provides information about hypothetical account values and hypothetical expenses based on a Class' actual expense ratio and an assumed rate of return of 5% per year before expenses, which is not the Class' actual return. The hypothetical account values and expenses may not be used to estimate the actual ending account balance or expenses you paid for the period. You may use this information to compare the ongoing costs of investing in the Fund and other funds. To do so, compare this 5% hypothetical example with the 5% hypothetical examples that appear in the shareholder reports of the other funds. A small balance maintenance fee of $12.00 that is charged once a year may apply for certain accounts with a value of less than $2,000. This fee is not included in the table below. If it was, the estimate of expenses you paid during the period would be higher, and your ending account value lower, by this amount. In addition, the Fund, as a shareholder in the underlying Fidelity Central Funds, will indirectly bear its pro-rata share of the fees and expenses incurred by the underlying Fidelity Central Funds. These fees and expenses are not included in the Fund's annualized expense ratio used to calculate the expense estimate in the table below.
Please note that the expenses shown in the table are meant to highlight your ongoing costs only and do not reflect any transaction costs. Therefore, the second line of the table is useful in comparing ongoing costs only, and will not help you determine the relative total costs of owning different funds. In addition, if these transactional costs were included, your costs would have been higher.
| | Annualized Expense Ratio-A | Beginning
Account Value
November 1, 2016 | Ending
Account Value
April 30, 2017 | Expenses Paid
During Period-B
November 1, 2016
to April 30, 2017 |
| Fidelity Canada | | | | |
| Class A | 1.34% | | | |
| Actual | | $1,000.00 | $1,031.70 | $6.75 |
| Hypothetical-C | | $1,000.00 | $1,018.15 | $6.71 |
| Class M | 1.63% | | | |
| Actual | | $1,000.00 | $1,030.10 | $8.20 |
| Hypothetical-C | | $1,000.00 | $1,016.71 | $8.15 |
| Class C | 2.06% | | | |
| Actual | | $1,000.00 | $1,028.20 | $10.36 |
| Hypothetical-C | | $1,000.00 | $1,014.58 | $10.29 |
| Canada | 1.02% | | | |
| Actual | | $1,000.00 | $1,033.60 | $5.14 |
| Hypothetical-C | | $1,000.00 | $1,019.74 | $5.11 |
| Class I | .99% | | | |
| Actual | | $1,000.00 | $1,033.60 | $4.99 |
| Hypothetical-C | | $1,000.00 | $1,019.89 | $4.96 |
| Fidelity China Region | | | | |
| Class A | 1.32% | | | |
| Actual | | $1,000.00 | $1,112.90 | $6.92 |
| Hypothetical-C | | $1,000.00 | $1,018.25 | $6.61 |
| Class M | 1.66% | | | |
| Actual | | $1,000.00 | $1,111.00 | $8.69 |
| Hypothetical-C | | $1,000.00 | $1,016.56 | $8.30 |
| Class C | 2.05% | | | |
| Actual | | $1,000.00 | $1,108.80 | $10.72 |
| Hypothetical-C | | $1,000.00 | $1,014.63 | $10.24 |
| China Region | 1.01% | | | |
| Actual | | $1,000.00 | $1,114.70 | $5.30 |
| Hypothetical-C | | $1,000.00 | $1,019.79 | $5.06 |
| Class I | 1.01% | | | |
| Actual | | $1,000.00 | $1,114.70 | $5.30 |
| Hypothetical-C | | $1,000.00 | $1,019.79 | $5.06 |
| Fidelity Emerging Asia | 1.11% | | | |
| Actual | | $1,000.00 | $1,110.80 | $5.81 |
| Hypothetical-C | | $1,000.00 | $1,019.29 | $5.56 |
| Fidelity Emerging Markets | | | | |
| Emerging Markets | .99% | | | |
| Actual | | $1,000.00 | $1,096.30 | $5.15 |
| Hypothetical-C | | $1,000.00 | $1,019.89 | $4.96 |
| Class K | .83% | | | |
| Actual | | $1,000.00 | $1,097.60 | $4.32 |
| Hypothetical-C | | $1,000.00 | $1,020.68 | $4.16 |
| Fidelity Europe | | | | |
| Class A | 1.31% | | | |
| Actual | | $1,000.00 | $1,119.50 | $6.88 |
| Hypothetical-C | | $1,000.00 | $1,018.30 | $6.56 |
| Class M | 1.60% | | | |
| Actual | | $1,000.00 | $1,118.00 | $8.40 |
| Hypothetical-C | | $1,000.00 | $1,016.86 | $8.00 |
| Class C | 2.09% | | | |
| Actual | | $1,000.00 | $1,115.00 | $10.96 |
| Hypothetical-C | | $1,000.00 | $1,014.43 | $10.44 |
| Europe | .98% | | | |
| Actual | | $1,000.00 | $1,121.50 | $5.15 |
| Hypothetical-C | | $1,000.00 | $1,019.93 | $4.91 |
| Class I | .97% | | | |
| Actual | | $1,000.00 | $1,121.40 | $5.10 |
| Hypothetical-C | | $1,000.00 | $1,019.98 | $4.86 |
| Fidelity Japan Fund | | | | |
| Class A | 1.08% | | | |
| Actual | | $1,000.00 | $1,046.90 | $5.48 |
| Hypothetical-C | | $1,000.00 | $1,019.44 | $5.41 |
| Class M | 1.43% | | | |
| Actual | | $1,000.00 | $1,045.10 | $7.25 |
| Hypothetical-C | | $1,000.00 | $1,017.70 | $7.15 |
| Class C | 1.79% | | | |
| Actual | | $1,000.00 | $1,043.40 | $9.07 |
| Hypothetical-C | | $1,000.00 | $1,015.92 | $8.95 |
| Japan | .80% | | | |
| Actual | | $1,000.00 | $1,048.80 | $4.06 |
| Hypothetical-C | | $1,000.00 | $1,020.83 | $4.01 |
| Class I | .75% | | | |
| Actual | | $1,000.00 | $1,049.50 | $3.81 |
| Hypothetical-C | | $1,000.00 | $1,021.08 | $3.76 |
| Fidelity Japan Smaller Companies | .96% | | | |
| Actual | | $1,000.00 | $1,051.00 | $4.88 |
| Hypothetical-C | | $1,000.00 | $1,020.03 | $4.81 |
| Fidelity Latin America Fund | | | | |
| Class A | 1.39% | | | |
| Actual | | $1,000.00 | $1,026.60 | $6.98 |
| Hypothetical-C | | $1,000.00 | $1,017.90 | $6.95 |
| Class M | 1.67% | | | |
| Actual | | $1,000.00 | $1,025.30 | $8.39 |
| Hypothetical-C | | $1,000.00 | $1,016.51 | $8.35 |
| Class C | 2.15% | | | |
| Actual | | $1,000.00 | $1,023.00 | $10.78 |
| Hypothetical-C | | $1,000.00 | $1,014.13 | $10.74 |
| Latin America | 1.12% | | | |
| Actual | | $1,000.00 | $1,028.40 | $5.63 |
| Hypothetical-C | | $1,000.00 | $1,019.24 | $5.61 |
| Class I | 1.03% | | | |
| Actual | | $1,000.00 | $1,028.60 | $5.18 |
| Hypothetical-C | | $1,000.00 | $1,019.69 | $5.16 |
| Fidelity Nordic | .99% | | | |
| Actual | | $1,000.00 | $1,114.60 | $5.19 |
| Hypothetical-C | | $1,000.00 | $1,019.89 | $4.96 |
| Fidelity Pacific Basin | 1.12% | | | |
| Actual | | $1,000.00 | $1,061.80 | $5.73 |
| Hypothetical-C | | $1,000.00 | $1,019.24 | $5.61 |
A Annualized expense ratio reflects expenses net of applicable fee waivers.
B Expenses are equal to each Class' annualized expense ratio, multiplied by the average account value over the period, multiplied by 181/ 365 (to reflect the one-half year period).
C 5% return per year before expenses
Corporate Headquarters
245 Summer St.
Boston, MA 02210
www.fidelity.com
TIF-SANN-0617
1.703611.119
Fidelity® Global Equity Income Fund
Semi-Annual Report April 30, 2017 |
|
Contents
To view a fund's proxy voting guidelines and proxy voting record for the 12-month period ended June 30, visit http://www.fidelity.com/proxyvotingresults or visit the Securities and Exchange Commission's (SEC) web site at http://www.sec.gov.
You may also call 1-800-544-8544 to request a free copy of the proxy voting guidelines.
Standard & Poor's, S&P and S&P 500 are registered service marks of The McGraw-Hill Companies, Inc. and have been licensed for use by Fidelity Distributors Corporation.
Other third-party marks appearing herein are the property of their respective owners.
All other marks appearing herein are registered or unregistered trademarks or service marks of FMR LLC or an affiliated company. © 2017 FMR LLC. All rights reserved.
This report and the financial statements contained herein are submitted for the general information of the shareholders of the Fund. This report is not authorized for distribution to prospective investors in the Fund unless preceded or accompanied by an effective prospectus.
A fund files its complete schedule of portfolio holdings with the SEC for the first and third quarters of each fiscal year on Form N-Q. Forms N-Q are available on the SEC’s web site at http://www.sec.gov. A fund's Forms N-Q may be reviewed and copied at the SEC’s Public Reference Room in Washington, DC. Information regarding the operation of the SEC's Public Reference Room may be obtained by calling 1-800-SEC-0330.
For a complete list of a fund's portfolio holdings, view the most recent holdings listing, semiannual report, or annual report on Fidelity's web site at http://www.fidelity.com, http://www.institutional.fidelity.com, or http://www.401k.com, as applicable.
NOT FDIC INSURED •MAY LOSE VALUE •NO BANK GUARANTEE
Neither the Fund nor Fidelity Distributors Corporation is a bank.
Investment Summary (Unaudited)
Geographic Diversification (% of fund's net assets)
| As of April 30, 2017 |
| | United States of America* | 47.7% |
| | United Kingdom | 10.0% |
| | Japan | 9.5% |
| | Canada | 4.3% |
| | Ireland | 3.4% |
| | Netherlands | 2.8% |
| | Switzerland | 2.4% |
| | Germany | 2.4% |
| | Israel | 1.9% |
| | Other | 15.6% |

* Includes Short-Term investments and Net Other Assets (Liabilities).
Percentages are based on country or territory of incorporation and are adjusted for the effect of futures contracts, if applicable.
| As of October 31, 2016 |
| | United States of America* | 45.1% |
| | Japan | 13.2% |
| | United Kingdom | 9.8% |
| | Canada | 5.1% |
| | Ireland | 4.0% |
| | Taiwan | 3.0% |
| | Germany | 3.0% |
| | Israel | 2.3% |
| | France | 1.9% |
| | Other | 12.6% |

* Includes Short-Term investments and Net Other Assets (Liabilities).
Percentages are based on country or territory of incorporation and are adjusted for the effect of futures contracts, if applicable.
Asset Allocation as of April 30, 2017
| | % of fund's net assets | % of fund's net assets 6 months ago |
| Stocks | 94.4 | 97.5 |
| Short-Term Investments and Net Other Assets (Liabilities) | 5.6 | 2.5 |
Top Ten Stocks as of April 30, 2017
| | % of fund's net assets | % of fund's net assets 6 months ago |
| Apple, Inc. (United States of America, Technology Hardware, Storage & Peripherals) | 2.9 | 3.0 |
| Micro Focus International PLC (United Kingdom, Software) | 2.2 | 1.8 |
| Chevron Corp. (United States of America, Oil, Gas & Consumable Fuels) | 2.0 | 2.1 |
| Microsoft Corp. (United States of America, Software) | 1.9 | 2.3 |
| Bank of America Corp. (United States of America, Banks) | 1.8 | 1.5 |
| JPMorgan Chase & Co. (United States of America, Banks) | 1.8 | 1.7 |
| Suncor Energy, Inc. (Canada, Oil, Gas & Consumable Fuels) | 1.7 | 1.8 |
| Wells Fargo & Co. (United States of America, Banks) | 1.7 | 1.7 |
| GlaxoSmithKline PLC (United Kingdom, Pharmaceuticals) | 1.6 | 0.7 |
| Johnson & Johnson (United States of America, Pharmaceuticals) | 1.5 | 2.1 |
| | 19.1 | |
Top Market Sectors as of April 30, 2017
| | % of fund's net assets | % of fund's net assets 6 months ago |
| Financials | 17.7 | 16.1 |
| Information Technology | 16.3 | 17.8 |
| Consumer Staples | 13.9 | 14.1 |
| Health Care | 12.4 | 14.2 |
| Consumer Discretionary | 10.6 | 12.8 |
| Industrials | 7.6 | 5.7 |
| Energy | 7.4 | 7.7 |
| Materials | 3.6 | 3.0 |
| Telecommunication Services | 3.1 | 3.5 |
| Real Estate | 1.8 | 2.6 |
Investments April 30, 2017 (Unaudited)
Showing Percentage of Net Assets
| Common Stocks - 93.7% | | | |
| | | Shares | Value |
| Australia - 0.2% | | | |
| Asaleo Care Ltd. | | 129,316 | $173,813 |
| Austria - 0.0% | | | |
| RHI AG | | 1,000 | 29,139 |
| Bailiwick of Jersey - 1.0% | | | |
| Wolseley PLC | | 12,146 | 771,965 |
| Belgium - 1.6% | | | |
| Anheuser-Busch InBev SA NV | | 6,500 | 733,007 |
| KBC Groep NV | | 6,461 | 466,476 |
|
| TOTAL BELGIUM | | | 1,199,483 |
|
| Canada - 4.3% | | | |
| Alimentation Couche-Tard, Inc. Class B (sub. vtg.) | | 7,200 | 331,135 |
| Constellation Software, Inc. | | 1,300 | 594,578 |
| Fairfax Financial Holdings Ltd. (sub. vtg.) | | 541 | 247,305 |
| Imperial Oil Ltd. | | 22,800 | 663,264 |
| PrairieSky Royalty Ltd. | | 5,100 | 111,150 |
| Suncor Energy, Inc. | | 42,500 | 1,331,929 |
|
| TOTAL CANADA | | | 3,279,361 |
|
| Cayman Islands - 0.7% | | | |
| Goodbaby International Holdings Ltd. | | 263,000 | 119,356 |
| SITC International Holdings Co. Ltd. | | 551,000 | 394,566 |
|
| TOTAL CAYMAN ISLANDS | | | 513,922 |
|
| Chile - 0.5% | | | |
| Vina San Pedro SA | | 37,219,054 | 362,484 |
| China - 0.2% | | | |
| Shanghai International Airport Co. Ltd. (A Shares) | | 37,168 | 184,667 |
| Denmark - 0.2% | | | |
| Pandora A/S | | 1,300 | 140,505 |
| France - 1.0% | | | |
| Cegedim SA (a) | | 6,000 | 166,924 |
| Maisons du Monde SA | | 6,400 | 222,113 |
| VINCI SA | | 4,700 | 400,621 |
|
| TOTAL FRANCE | | | 789,658 |
|
| Germany - 2.4% | | | |
| adidas AG | | 2,868 | 574,524 |
| AURELIUS AG (b) | | 8,099 | 399,648 |
| SAP AG | | 8,269 | 828,273 |
|
| TOTAL GERMANY | | | 1,802,445 |
|
| Hong Kong - 1.2% | | | |
| Techtronic Industries Co. Ltd. | | 220,500 | 946,820 |
| Ireland - 3.4% | | | |
| Accenture PLC Class A | | 7,640 | 926,732 |
| Allergan PLC | | 2,100 | 512,106 |
| Medtronic PLC | | 13,800 | 1,146,642 |
|
| TOTAL IRELAND | | | 2,585,480 |
|
| Isle of Man - 1.5% | | | |
| Paysafe Group PLC (a) | | 124,700 | 733,100 |
| Playtech Ltd. | | 32,778 | 407,134 |
|
| TOTAL ISLE OF MAN | | | 1,140,234 |
|
| Israel - 1.9% | | | |
| Bezeq The Israel Telecommunication Corp. Ltd. | | 279,400 | 470,192 |
| Rami Levi Chain Stores Hashikma Marketing 2006 Ltd. | | 2,896 | 138,331 |
| Teva Pharmaceutical Industries Ltd. sponsored ADR | | 26,950 | 851,081 |
|
| TOTAL ISRAEL | | | 1,459,604 |
|
| Italy - 0.3% | | | |
| Prada SpA | | 44,000 | 206,471 |
| Japan - 9.5% | | | |
| A/S One Corp. | | 11,200 | 495,824 |
| Astellas Pharma, Inc. | | 14,000 | 184,620 |
| Broadleaf Co. Ltd. | | 21,600 | 140,092 |
| Daiichikosho Co. Ltd. | | 21,800 | 945,530 |
| Daito Trust Construction Co. Ltd. | | 1,500 | 220,677 |
| Hoya Corp. | | 16,400 | 783,257 |
| Inaba Denki Sangyo Co. Ltd. | | 5,800 | 210,720 |
| Japan Meat Co. Ltd. | | 18,600 | 309,513 |
| KDDI Corp. | | 20,900 | 554,144 |
| Morinaga & Co. Ltd. | | 8,600 | 406,566 |
| Nippon Telegraph & Telephone Corp. | | 13,100 | 561,409 |
| Olympus Corp. | | 11,000 | 423,324 |
| Recruit Holdings Co. Ltd. | | 9,100 | 459,592 |
| Shinsei Bank Ltd. | | 106,000 | 197,784 |
| Sony Corp. | | 26,000 | 892,173 |
| Tsuruha Holdings, Inc. | | 4,500 | 456,156 |
|
| TOTAL JAPAN | | | 7,241,381 |
|
| Kenya - 0.3% | | | |
| Safaricom Ltd. | | 1,433,700 | 267,430 |
| Korea (South) - 1.1% | | | |
| Coway Co. Ltd. | | 1,811 | 159,991 |
| Hyundai Fire & Marine Insurance Co. Ltd. | | 3,037 | 97,976 |
| Samsung Electronics Co. Ltd. | | 294 | 576,577 |
|
| TOTAL KOREA (SOUTH) | | | 834,544 |
|
| Luxembourg - 0.3% | | | |
| B&M European Value Retail S.A. | | 46,571 | 203,274 |
| Multi-National - 0.6% | | | |
| HKT Trust/HKT Ltd. unit | | 351,600 | 449,764 |
| Netherlands - 2.8% | | | |
| Koninklijke Philips Electronics NV | | 14,100 | 486,908 |
| LyondellBasell Industries NV Class A | | 9,900 | 839,124 |
| Unilever NV (Certificaten Van Aandelen) (Bearer) | | 16,000 | 838,168 |
|
| TOTAL NETHERLANDS | | | 2,164,200 |
|
| South Africa - 1.0% | | | |
| Capitec Bank Holdings Ltd. | | 8,000 | 456,483 |
| EOH Holdings Ltd. | | 26,000 | 275,200 |
|
| TOTAL SOUTH AFRICA | | | 731,683 |
|
| Spain - 0.8% | | | |
| Amadeus IT Holding SA Class A | | 8,000 | 431,363 |
| Prosegur Cash SA | | 82,800 | 211,054 |
|
| TOTAL SPAIN | | | 642,417 |
|
| Sweden - 0.6% | | | |
| Loomis AB (B Shares) | | 13,000 | 471,871 |
| Switzerland - 2.4% | | | |
| Banque Cantonale Vaudoise | | 570 | 413,035 |
| Chubb Ltd. | | 3,800 | 521,550 |
| Galenica Sante Ltd. | | 970 | 42,407 |
| Nestle SA (Reg. S) | | 11,447 | 881,654 |
|
| TOTAL SWITZERLAND | | | 1,858,646 |
|
| Taiwan - 1.8% | | | |
| ECLAT Textile Co. Ltd. | | 25,298 | 276,643 |
| Taiwan Semiconductor Manufacturing Co. Ltd. | | 173,000 | 1,112,530 |
|
| TOTAL TAIWAN | | | 1,389,173 |
|
| United Kingdom - 10.0% | | | |
| BAE Systems PLC | | 43,400 | 352,494 |
| Beijing Yanjing Brewery ELS (UBS Warrant Programme) warrants 10/6/17 (a)(c) | | 62,500 | 63,194 |
| Booker Group PLC | | 211,700 | 531,936 |
| British American Tobacco PLC (United Kingdom) | | 16,800 | 1,135,065 |
| GlaxoSmithKline PLC | | 60,812 | 1,224,016 |
| Hilton Food Group PLC | | 56,200 | 560,121 |
| Imperial Tobacco Group PLC | | 9,433 | 462,070 |
| ITV PLC | | 174,900 | 475,714 |
| Jiangsu Yanghe Brewery JSC Ltd. ELS (UBS Warrant Programme) warrants 10/23/17 (a)(c) | | 7,672 | 89,035 |
| London Stock Exchange Group PLC | | 2,500 | 109,542 |
| Mears Group PLC | | 25,900 | 174,773 |
| Micro Focus International PLC | | 50,000 | 1,675,989 |
| Moneysupermarket.com Group PLC | | 40,600 | 181,892 |
| St. James's Place Capital PLC | | 30,291 | 450,394 |
| The Restaurant Group PLC | | 13,200 | 59,753 |
| Wuliangye Yibin Co. Ltd. ELS (A Shares) (UBS Warrant Programme) warrants 3/7/19 (a)(c) | | 13,648 | 90,083 |
|
| TOTAL UNITED KINGDOM | | | 7,636,071 |
|
| United States of America - 42.1% | | | |
| American Tower Corp. | | 8,960 | 1,128,422 |
| AMETEK, Inc. | | 16,600 | 949,520 |
| Amgen, Inc. | | 7,220 | 1,179,170 |
| Apple, Inc. | | 15,650 | 2,248,123 |
| AutoZone, Inc. (a) | | 800 | 553,752 |
| Ball Corp. | | 3,900 | 299,871 |
| Bank of America Corp. | | 59,880 | 1,397,599 |
| Bristol-Myers Squibb Co. | | 4,600 | 257,830 |
| Capital One Financial Corp. | | 5,600 | 450,128 |
| Caterpillar, Inc. | | 4,600 | 470,396 |
| Cedar Fair LP (depositary unit) | | 4,100 | 293,847 |
| Charter Communications, Inc. Class A (a) | | 1,000 | 345,160 |
| Chevron Corp. | | 14,465 | 1,543,416 |
| Citigroup, Inc. | | 16,800 | 993,216 |
| Comcast Corp. Class A | | 18,700 | 732,853 |
| ConocoPhillips Co. | | 21,600 | 1,034,856 |
| Danaher Corp. | | 7,000 | 583,310 |
| Deluxe Corp. | | 2,700 | 194,157 |
| Diamond Hill Investment Group, Inc. | | 2,900 | 586,235 |
| Dr. Pepper Snapple Group, Inc. | | 4,841 | 443,678 |
| E.I. du Pont de Nemours & Co. | | 8,300 | 661,925 |
| Exxon Mobil Corp. | | 11,030 | 900,600 |
| Fortive Corp. | | 4,200 | 265,692 |
| Johnson & Johnson | | 9,600 | 1,185,312 |
| JPMorgan Chase & Co. | | 15,630 | 1,359,810 |
| L Brands, Inc. | | 8,800 | 464,728 |
| Microsoft Corp. | | 21,664 | 1,483,117 |
| Molson Coors Brewing Co. Class B | | 8,200 | 786,298 |
| Monsanto Co. | | 3,200 | 373,152 |
| MSCI, Inc. | | 8,400 | 842,688 |
| PepsiCo, Inc. | | 6,300 | 713,664 |
| PPG Industries, Inc. | | 2,700 | 296,568 |
| Procter & Gamble Co. | | 8,159 | 712,525 |
| Qualcomm, Inc. | | 6,100 | 327,814 |
| Roper Technologies, Inc. | | 700 | 153,090 |
| S&P Global, Inc. | | 6,340 | 850,765 |
| Sabre Corp. | | 9,600 | 224,736 |
| Stock Yards Bancorp, Inc. | | 3,000 | 123,000 |
| SunTrust Banks, Inc. | | 14,900 | 846,469 |
| The Coca-Cola Co. | | 16,400 | 707,660 |
| Total System Services, Inc. | | 6,900 | 395,439 |
| U.S. Bancorp | | 17,580 | 901,502 |
| Verizon Communications, Inc. | | 3,900 | 179,049 |
| VF Corp. | | 5,800 | 316,854 |
| W.R. Grace & Co. | | 2,800 | 195,216 |
| Wells Fargo & Co. | | 23,757 | 1,279,077 |
|
| TOTAL UNITED STATES OF AMERICA | | | 32,232,289 |
|
| TOTAL COMMON STOCKS | | | |
| (Cost $60,049,284) | | | 71,708,794 |
|
| Nonconvertible Preferred Stocks - 0.7% | | | |
| Spain - 0.7% | | | |
| Grifols SA Class B | | | |
| (Cost $420,916) | | 25,200 | 537,890 |
| | | Principal Amount(d) | Value |
|
| Nonconvertible Bonds - 0.0% | | | |
| Canada - 0.0% | | | |
| Constellation Software, Inc. 7.9% 3/31/40(e) | CAD | | |
| (Cost $2,060) | | 2,400 | 2,044 |
| | | Shares | Value |
|
| Money Market Funds - 6.1% | | | |
| Fidelity Cash Central Fund, 0.85% (f) | | 4,360,072 | 4,360,944 |
| Fidelity Securities Lending Cash Central Fund 0.86% (f)(g) | | 314,971 | 315,002 |
| TOTAL MONEY MARKET FUNDS | | | |
| (Cost $4,675,793) | | | 4,675,946 |
| TOTAL INVESTMENT PORTFOLIO - 100.5% | | | |
| (Cost $65,148,053) | | | 76,924,674 |
| NET OTHER ASSETS (LIABILITIES) - (0.5)% | | | (368,812) |
| NET ASSETS - 100% | | | $76,555,862 |
Currency Abbreviations
CAD – Canadian dollar
Security Type Abbreviations
ELS – Equity-Linked Security
Categorizations in the Schedule of Investments are based on country or territory of incorporation.
Legend
(a) Non-income producing
(b) Security or a portion of the security is on loan at period end.
(c) Security exempt from registration under Rule 144A of the Securities Act of 1933. These securities may be resold in transactions exempt from registration, normally to qualified institutional buyers. At the end of the period, the value of these securities amounted to $242,312 or 0.3% of net assets.
(d) Amount is stated in United States dollars unless otherwise noted.
(e) Coupon rates for floating and adjustable rate securities reflect the rates in effect at period end.
(f) Affiliated fund that is generally available only to investment companies and other accounts managed by Fidelity Investments. The rate quoted is the annualized seven-day yield of the fund at period end. A complete unaudited listing of the fund's holdings as of its most recent quarter end is available upon request. In addition, each Fidelity Central Fund's financial statements are available on the SEC's website or upon request.
(g) Investment made with cash collateral received from securities on loan.
Affiliated Central Funds
Information regarding fiscal year to date income earned by the Fund from investments in Fidelity Central Funds is as follows:
| Fund | Income earned |
| Fidelity Cash Central Fund | $8,535 |
| Fidelity Securities Lending Cash Central Fund | 1,156 |
| Total | $9,691 |
Investment Valuation
The following is a summary of the inputs used, as of April 30, 2017, involving the Fund's assets and liabilities carried at fair value. The inputs or methodology used for valuing securities may not be an indication of the risk associated with investing in those securities. For more information on valuation inputs, and their aggregation into the levels used below, please refer to the Investment Valuation section in the accompanying Notes to Financial Statements.
| | Valuation Inputs at Reporting Date: |
| Description | Total | Level 1 | Level 2 | Level 3 |
| Investments in Securities: | | | | |
| Equities: | | | | |
| Consumer Discretionary | $7,930,061 | $7,037,888 | $892,173 | $-- |
| Consumer Staples | 10,726,251 | 7,138,357 | 3,587,894 | -- |
| Energy | 5,585,215 | 5,585,215 | -- | -- |
| Financials | 13,444,048 | 13,201,736 | 242,312 | -- |
| Health Care | 9,531,306 | 8,122,670 | 1,408,636 | -- |
| Industrials | 5,941,032 | 3,929,044 | 2,011,988 | -- |
| Information Technology | 12,562,689 | 10,621,886 | 1,940,803 | -- |
| Materials | 2,694,995 | 2,694,995 | -- | -- |
| Real Estate | 1,349,099 | 1,349,099 | -- | -- |
| Telecommunication Services | 2,481,988 | 1,366,435 | 1,115,553 | -- |
| Corporate Bonds | 2,044 | -- | 2,044 | -- |
| Money Market Funds | 4,675,946 | 4,675,946 | -- | -- |
| Total Investments in Securities: | $76,924,674 | $65,723,271 | $11,201,403 | $-- |
The following is a summary of transfers between Level 1 and Level 2 for the period ended April 30, 2017. Transfers are assumed to have occurred at the beginning of the period, and are primarily attributable to the valuation techniques used for foreign equity securities, as discussed in the accompanying Notes to Financial Statements:
| Transfers | Total |
| Level 1 to Level 2 | $1,201,202 |
| Level 2 to Level 1 | $837,899 |
See accompanying notes which are an integral part of the financial statements.
Financial Statements
Statement of Assets and Liabilities
| | | April 30, 2017 (Unaudited) |
| Assets | | |
Investment in securities, at value (including securities loaned of $295,977) — See accompanying schedule:
Unaffiliated issuers (cost $60,472,260) | $72,248,728 | |
| Fidelity Central Funds (cost $4,675,793) | 4,675,946 | |
| Total Investments (cost $65,148,053) | | $76,924,674 |
| Receivable for investments sold | | 18,510 |
| Receivable for fund shares sold | | 80,015 |
| Dividends receivable | | 206,543 |
| Interest receivable | | 12 |
| Distributions receivable from Fidelity Central Funds | | 3,874 |
| Prepaid expenses | | 49 |
| Other receivables | | 704 |
| Total assets | | 77,234,381 |
| Liabilities | | |
| Payable for fund shares redeemed | $260,104 | |
| Accrued management fee | 43,855 | |
| Other affiliated payables | 19,907 | |
| Other payables and accrued expenses | 39,653 | |
| Collateral on securities loaned | 315,000 | |
| Total liabilities | | 678,519 |
| Net Assets | | $76,555,862 |
| Net Assets consist of: | | |
| Paid in capital | | $65,695,592 |
| Undistributed net investment income | | 120,333 |
| Accumulated undistributed net realized gain (loss) on investments and foreign currency transactions | | (1,036,598) |
| Net unrealized appreciation (depreciation) on investments and assets and liabilities in foreign currencies | | 11,776,535 |
| Net Assets, for 5,854,973 shares outstanding | | $76,555,862 |
| Net Asset Value, offering price and redemption price per share ($76,555,862 ÷ 5,854,973 shares) | | $13.08 |
See accompanying notes which are an integral part of the financial statements.
Statement of Operations
| | | Six months ended April 30, 2017 (Unaudited) |
| Investment Income | | |
| Dividends | | $809,504 |
| Interest | | 103 |
| Income from Fidelity Central Funds | | 9,691 |
| Income before foreign taxes withheld | | 819,298 |
| Less foreign taxes withheld | | (47,349) |
| Total income | | 771,949 |
| Expenses | | |
| Management fee | $255,479 | |
| Transfer agent fees | 97,115 | |
| Accounting and security lending fees | 19,025 | |
| Custodian fees and expenses | 8,771 | |
| Independent trustees' fees and expenses | 149 | |
| Registration fees | 20,869 | |
| Audit | 32,534 | |
| Legal | 87 | |
| Miscellaneous | 293 | |
| Total expenses before reductions | 434,322 | |
| Expense reductions | (1,024) | 433,298 |
| Net investment income (loss) | | 338,651 |
| Realized and Unrealized Gain (Loss) | | |
| Net realized gain (loss) on: | | |
| Investment securities: | | |
| Unaffiliated issuers | 357,146 | |
| Fidelity Central Funds | (89) | |
| Foreign currency transactions | (12,928) | |
| Total net realized gain (loss) | | 344,129 |
Change in net unrealized appreciation (depreciation) on:
Investment securities | 5,554,876 | |
| Assets and liabilities in foreign currencies | 4,643 | |
| Total change in net unrealized appreciation (depreciation) | | 5,559,519 |
| Net gain (loss) | | 5,903,648 |
| Net increase (decrease) in net assets resulting from operations | | $6,242,299 |
See accompanying notes which are an integral part of the financial statements.
Statement of Changes in Net Assets
| | Six months ended April 30, 2017 (Unaudited) | Year ended October 31, 2016 |
| Increase (Decrease) in Net Assets | | |
| Operations | | |
| Net investment income (loss) | $338,651 | $898,420 |
| Net realized gain (loss) | 344,129 | (1,275,087) |
| Change in net unrealized appreciation (depreciation) | 5,559,519 | 1,963,524 |
| Net increase (decrease) in net assets resulting from operations | 6,242,299 | 1,586,857 |
| Distributions to shareholders from net investment income | (284,999) | (921,832) |
| Distributions to shareholders from net realized gain | – | (910,524) |
| Total distributions | (284,999) | (1,832,356) |
| Share transactions | | |
| Proceeds from sales of shares | 11,227,326 | 29,645,365 |
| Reinvestment of distributions | 265,998 | 1,694,504 |
| Cost of shares redeemed | (12,571,061) | (27,349,989) |
| Net increase (decrease) in net assets resulting from share transactions | (1,077,737) | 3,989,880 |
| Redemption fees | 1,610 | 4,736 |
| Total increase (decrease) in net assets | 4,881,173 | 3,749,117 |
| Net Assets | | |
| Beginning of period | 71,674,689 | 67,925,572 |
| End of period | $76,555,862 | $71,674,689 |
| Other Information | | |
| Undistributed net investment income end of period | $120,333 | $66,681 |
| Shares | | |
| Sold | 900,105 | 2,505,409 |
| Issued in reinvestment of distributions | 21,606 | 141,047 |
| Redeemed | (1,010,431) | (2,305,213) |
| Net increase (decrease) | (88,720) | 341,243 |
See accompanying notes which are an integral part of the financial statements.
Financial Highlights — Fidelity Global Equity Income Fund
| | Six months ended (Unaudited) April 30, | Years ended October 31, | | | | |
| | 2017 | 2016 | 2015 | 2014 | 2013 | 2012 A |
| Selected Per–Share Data | | | | | | |
| Net asset value, beginning of period | $12.06 | $12.12 | $12.87 | $12.20 | $10.16 | $10.00 |
| Income from Investment Operations | | | | | | |
| Net investment income (loss)B | .06 | .15 | .16 | .28C | .22 | .08 |
| Net realized and unrealized gain (loss) | 1.01 | .11 | .21 | .92 | 2.06 | .15 |
| Total from investment operations | 1.07 | .26 | .37 | 1.20 | 2.28 | .23 |
| Distributions from net investment income | (.05) | (.15) | (.16) | (.25) | (.21) | (.07) |
| Distributions from net realized gain | – | (.16) | (.95) | (.28) | (.03) | – |
| Total distributions | (.05) | (.32)D | (1.12)E | (.53) | (.24) | (.07) |
| Redemption fees added to paid in capitalB,F | – | – | – | – | – | – |
| Net asset value, end of period | $13.08 | $12.06 | $12.12 | $12.87 | $12.20 | $10.16 |
| Total ReturnG,H | 8.88% | 2.13% | 2.93% | 10.10% | 22.73% | 2.25% |
| Ratios to Average Net AssetsI,J | | | | | | |
| Expenses before reductions | 1.18%K | 1.18% | 1.15% | 1.16% | 1.28% | 2.18%K |
| Expenses net of fee waivers, if any | 1.18%K | 1.18% | 1.15% | 1.16% | 1.20% | 1.20%K |
| Expenses net of all reductions | 1.18%K | 1.18% | 1.14% | 1.16% | 1.19% | 1.17%K |
| Net investment income (loss) | .92%K | 1.24% | 1.27% | 2.21%C | 1.94% | 1.62%K |
| Supplemental Data | | | | | | |
| Net assets, end of period (000 omitted) | $76,556 | $71,675 | $67,926 | $52,038 | $42,271 | $26,838 |
| Portfolio turnover rateL | 47%K | 40% | 64% | 92% | 66% | 33%M |
A For the period May 2, 2012 (commencement of operations) to October 31, 2012.
B Calculated based on average shares outstanding during the period.
C Net Investment income per share reflects a large, non-recurring dividend which amounted to $.08 per share. Excluding this non-recurring dividend, the ratio of net investment income (loss) to average net assets would have been 1.56%.
D Total distributions of $.32 per share is comprised of distributions from net investment income of $.153 and distributions from net realized gain of $.162 per share.
E Total distributions of $1.12 per share is comprised of distributions from net investment income of $.164 and distributions from net realized gain of $.954 per share.
F Amount represents less than $.005 per share.
G Total returns for periods of less than one year are not annualized.
H Total returns would have been lower if certain expenses had not been reduced during the applicable periods shown.
I Fees and expenses of any underlying Fidelity Central Funds are not included in the Fund's expense ratio. The Fund indirectly bears its proportionate share of the expenses of any underlying Fidelity Central Funds.
J Expense ratios reflect operating expenses of the Fund. Expenses before reductions do not reflect amounts reimbursed by the investment adviser or reductions from brokerage service arrangements or reductions from other expense offset arrangements and do not represent the amount paid by the Fund during periods when reimbursements or reductions occur. Expense ratios before reductions for start-up periods may not be representative of longer term operating periods. Expenses net of fee waivers reflect expenses after reimbursement by the investment adviser but prior to reductions from brokerage service arrangements or other expense offset arrangements. Expenses net of all reductions represent the net expenses paid by the Fund.
K Annualized
L Amount does not include the portfolio activity of any underlying Fidelity Central Funds.
M Amount not annualized.
See accompanying notes which are an integral part of the financial statements.
Notes to Financial Statements (Unaudited)
For the period ended April 30, 2017
1. Organization.
Fidelity Global Equity Income Fund (the Fund) is a fund of Fidelity Investment Trust (the Trust) and is authorized to issue an unlimited number of shares. Share transactions on the Statement of Changes in Net Assets may contain exchanges between affiliated funds. The Trust is registered under the Investment Company Act of 1940, as amended (the 1940 Act), as an open-end management investment company organized as a Massachusetts business trust.
2. Investments in Fidelity Central Funds.
The Fund invests in Fidelity Central Funds, which are open-end investment companies generally available only to other investment companies and accounts managed by the investment adviser and its affiliates. The Fund's Schedule of Investments lists each of the Fidelity Central Funds held as of period end, if any, as an investment of the Fund, but does not include the underlying holdings of each Fidelity Central Fund. As an Investing Fund, the Fund indirectly bears its proportionate share of the expenses of the underlying Fidelity Central Funds.
The Money Market Central Funds seek preservation of capital and current income and are managed by Fidelity Investments Money Management, Inc. (FIMM), an affiliate of the investment adviser. Annualized expenses of the Money Market Central Funds as of their most recent shareholder report date are less than .005%.
A complete unaudited list of holdings for each Fidelity Central Fund is available upon request or at the Securities and Exchange Commission (the SEC) website at www.sec.gov. In addition, the financial statements of the Fidelity Central Funds are available on the SEC website or upon request.
3. Significant Accounting Policies.
The Fund is an investment company and applies the accounting and reporting guidance of the Financial Accounting Standards Board (FASB) Accounting Standards Codification Topic 946 Financial Services – Investments Companies. The financial statements have been prepared in conformity with accounting principles generally accepted in the United States of America (GAAP), which require management to make certain estimates and assumptions at the date of the financial statements. Actual results could differ from those estimates. Subsequent events, if any, through the date that the financial statements were issued have been evaluated in the preparation of the financial statements. The following summarizes the significant accounting policies of the Fund:
Investment Valuation. Investments are valued as of 4:00 p.m. Eastern time on the last calendar day of the period. The Board of Trustees (the Board) has delegated the day to day responsibility for the valuation of the Fund's investments to the Fair Value Committee (the Committee) established by the Fund's investment adviser. In accordance with valuation policies and procedures approved by the Board, the Fund attempts to obtain prices from one or more third party pricing vendors or brokers to value its investments. When current market prices, quotations or currency exchange rates are not readily available or reliable, investments will be fair valued in good faith by the Committee, in accordance with procedures adopted by the Board. Factors used in determining fair value vary by investment type and may include market or investment specific events, changes in interest rates and credit quality. The frequency with which these procedures are used cannot be predicted and they may be utilized to a significant extent. The Committee oversees the Fund's valuation policies and procedures and reports to the Board on the Committee's activities and fair value determinations. The Board monitors the appropriateness of the procedures used in valuing the Fund's investments and ratifies the fair value determinations of the Committee.
The Fund categorizes the inputs to valuation techniques used to value its investments into a disclosure hierarchy consisting of three levels as shown below:
- Level 1 – quoted prices in active markets for identical investments
- Level 2 – other significant observable inputs (including quoted prices for similar investments, interest rates, prepayment speeds, etc.)
- Level 3 – unobservable inputs (including the Fund's own assumptions based on the best information available)
Valuation techniques used to value the Fund's investments by major category are as follows:
Equity securities, including restricted securities, for which market quotations are readily available, are valued at the last reported sale price or official closing price as reported by a third party pricing vendor on the primary market or exchange on which they are traded and are categorized as Level 1 in the hierarchy. In the event there were no sales during the day or closing prices are not available, securities are valued at the last quoted bid price or may be valued using the last available price and are generally categorized as Level 2 in the hierarchy. For foreign equity securities, when market or security specific events arise, comparisons to the valuation of American Depositary Receipts (ADRs), futures contracts, Exchange-Traded Funds (ETFs) and certain indexes as well as quoted prices for similar securities may be used and would be categorized as Level 2 in the hierarchy. Utilizing these techniques may result in transfers between Level 1 and Level 2. For equity securities, including restricted securities, where observable inputs are limited, assumptions about market activity and risk are used and these securities may be categorized as Level 3 in the hierarchy.
Debt securities, including restricted securities, are valued based on evaluated prices received from third party pricing vendors or from brokers who make markets in such securities. Corporate bonds are valued by pricing vendors who utilize matrix pricing which considers prepayment speed assumptions, attributes of the collateral, yield or price of bonds of comparable quality, coupon, maturity and type or by broker-supplied prices. When independent prices are unavailable or unreliable, debt securities may be valued utilizing pricing methodologies which consider similar factors that would be used by third party pricing vendors. Debt securities are generally categorized as Level 2 in the hierarchy but may be Level 3 depending on the circumstances.
Investments in open-end mutual funds, including the Fidelity Central Funds, are valued at their closing net asset value (NAV) each business day and are categorized as Level 1 in the hierarchy.
Changes in valuation techniques may result in transfers in or out of an assigned level within the disclosure hierarchy. The aggregate value of investments by input level as of April 30, 2017, including information on transfers between Levels 1 and 2 is included at the end of the Fund's Schedule of Investments.
Foreign Currency. The Fund may use foreign currency contracts to facilitate transactions in foreign-denominated securities. Gains and losses from these transactions may arise from changes in the value of the foreign currency or if the counterparties do not perform under the contracts' terms.
Foreign-denominated assets, including investment securities, and liabilities are translated into U.S. dollars at the exchange rates at period end. Purchases and sales of investment securities, income and dividends received and expenses denominated in foreign currencies are translated into U.S. dollars at the exchange rate in effect on the transaction date.
The effects of exchange rate fluctuations on investments are included with the net realized and unrealized gain (loss) on investment securities. Other foreign currency transactions resulting in realized and unrealized gain (loss) are disclosed separately.
Investment Transactions and Income. For financial reporting purposes, the Fund's investment holdings and NAV include trades executed through the end of the last business day of the period. The NAV per share for processing shareholder transactions is calculated as of the close of business of the New York Stock Exchange (NYSE), normally 4:00 p.m. Eastern time and includes trades executed through the end of the prior business day. Gains and losses on securities sold are determined on the basis of identified cost. Dividend income is recorded on the ex-dividend date, except for certain dividends from foreign securities where the ex-dividend date may have passed, which are recorded as soon as the Fund is informed of the ex-dividend date. Non-cash dividends included in dividend income, if any, are recorded at the fair market value of the securities received. Income and capital gain distributions from Fidelity Central Funds, if any, are recorded on the ex-dividend date. Certain distributions received by the Fund represent a return of capital or capital gain. The Fund determines the components of these distributions subsequent to the ex-dividend date, based upon receipt of tax filings or other correspondence relating to the underlying investment. These distributions are recorded as a reduction of cost of investments and/or as a realized gain. Interest income is accrued as earned and includes coupon interest and amortization of premium and accretion of discount on debt securities as applicable. Investment income is recorded net of foreign taxes withheld where recovery of such taxes is uncertain.
Expenses. Expenses directly attributable to a fund are charged to that fund. Expenses attributable to more than one fund are allocated among the respective funds on the basis of relative net assets or other appropriate methods. Expense estimates are accrued in the period to which they relate and adjustments are made when actual amounts are known.
Income Tax Information and Distributions to Shareholders. Each year, the Fund intends to qualify as a regulated investment company under Subchapter M of the Internal Revenue Code, including distributing substantially all of its taxable income and realized gains. As a result, no provision for U.S. Federal income taxes is required. The Fund files a U.S. federal tax return, in addition to state and local tax returns as required. The Fund's federal income tax returns are subject to examination by the Internal Revenue Service (IRS) for a period of three fiscal years after they are filed. State and local tax returns may be subject to examination for an additional fiscal year depending on the jurisdiction. Foreign taxes are provided for based on the Fund's understanding of the tax rules and rates that exist in the foreign markets in which it invests.
Distributions are declared and recorded on the ex-dividend date. Income and capital gain distributions are determined in accordance with income tax regulations, which may differ from GAAP.
Capital accounts within the financial statements are adjusted for permanent book-tax differences. These adjustments have no impact on net assets or the results of operations. Capital accounts are not adjusted for temporary book-tax differences which will reverse in a subsequent period.
Book-tax differences are primarily due to foreign currency transactions, passive foreign investment companies (PFIC) and losses deferred due to wash sales.
The federal tax cost of investment securities and unrealized appreciation (depreciation) as of period end were as follows:
| Gross unrealized appreciation | $13,560,022 |
| Gross unrealized depreciation | (1,845,721) |
| Net unrealized appreciation (depreciation) on securities | $11,714,301 |
| Tax cost | $65,210,373 |
Capital loss carryforwards are only available to offset future capital gains of the Fund to the extent provided by regulations and may be limited. Under the Regulated Investment Company Modernization Act of 2010 (the Act), the Fund is permitted to carry forward capital losses incurred in taxable years beginning after December 22, 2010 for an unlimited period and such capital losses are required to be used prior to any losses that expire. The capital loss carryforward information presented below, including any applicable limitation, is estimated as of prior fiscal period end and is subject to adjustment.
| No expiration | |
| Short-term | $(854,867) |
| Long-term | (246,944) |
| Total no expiration | $(1,101,811) |
Short-Term Trading (Redemption) Fees. Shares held by investors in the Fund less than 30 days may have been subject to a redemption fee equal to 1.00% of the NAV of shares redeemed. All redemption fees, which reduce the proceeds of the shareholder redemption, are retained by the Fund and accounted for as an addition to paid in capital.
Restricted Securities. The Fund may invest in securities that are subject to legal or contractual restrictions on resale. These securities generally may be resold in transactions exempt from registration or to the public if the securities are registered. Disposal of these securities may involve time-consuming negotiations and expense, and prompt sale at an acceptable price may be difficult. Information regarding restricted securities is included at the end of the Fund's Schedule of Investments.
4. Purchases and Sales of Investments.
Purchases and sales of securities, other than short-term securities, aggregated $16,664,258 and $20,238,070, respectively.
5. Fees and Other Transactions with Affiliates.
Management Fee. Fidelity Management & Research Company (the investment adviser) and its affiliates provide the Fund with investment management related services for which the Fund pays a monthly management fee. The management fee is the sum of an individual fund fee rate that is based on an annual rate of .45% of the Fund's average net assets and an annualized group fee rate that averaged .25% during the period. The group fee rate is based upon the average net assets of all the mutual funds advised by the investment adviser, including any mutual funds previously advised by the investment adviser that are currently advised by Fidelity SelectCo, LLC, an affiliate of the investment adviser. The group fee rate decreases as assets under management increase and increases as assets under management decrease. For the reporting period, the total annualized management fee rate was .70% of the Fund's average net assets.
Transfer Agent Fees. Fidelity Investments Institutional Operations Company, Inc. (FIIOC), an affiliate of the investment adviser, is the Fund's transfer, dividend disbursing and shareholder servicing agent. FIIOC receives account fees and asset-based fees that vary according to account size and type of account. FIIOC pays for typesetting, printing and mailing of shareholder reports, except proxy statements. For the period, the transfer agent fees were equivalent to an annualized rate of .26% of average net assets.
Accounting and Security Lending Fees. Fidelity Service Company, Inc. (FSC), an affiliate of the investment adviser, maintains the Fund's accounting records. The accounting fee is based on the level of average net assets for each month. Under a separate contract, FSC administers the security lending program. The security lending fee is based on the number and duration of lending transactions.
Brokerage Commissions. The Fund placed a portion of its portfolio transactions with brokerage firms which are affiliates of the investment adviser. Brokerage commissions are included in net realized gain (loss) and change in net unrealized appreciation (depreciation) in the Statement of Operations. The commissions paid to these affiliated firms were $212 for the period.
Interfund Trades. The Fund may purchase from or sell securities to other Fidelity Funds under procedures adopted by the Board. The procedures have been designed to ensure these interfund trades are executed in accordance with Rule 17a-7 of the 1940 Act. Interfund trades are included within the respective purchases and sales amounts shown in the Purchases and Sales of Investments note.
6. Committed Line of Credit.
The Fund participates with other funds managed by the investment adviser or an affiliate in a $4.25 billion credit facility (the "line of credit") to be utilized for temporary or emergency purposes to fund shareholder redemptions or for other short-term liquidity purposes. The Fund has agreed to pay commitment fees on its pro-rata portion of the line of credit, which amounted to $124 and is reflected in Miscellaneous expenses on the Statement of Operations. During the period, the Fund did not borrow on this line of credit.
7. Security Lending.
The Fund lends portfolio securities through a lending agent from time to time in order to earn additional income. For equity securities, a lending agent is used and may loan securities to certain qualified borrowers, including Fidelity Capital Markets (FCM), a broker-dealer affiliated with the Fund. On the settlement date of the loan, the Fund receives collateral (in the form of U.S. Treasury obligations, letters of credit and/or cash) against the loaned securities and maintains collateral in an amount not less than 100% of the market value of the loaned securities during the period of the loan. The market value of the loaned securities is determined at the close of business of the Fund and any additional required collateral is delivered to the Fund on the next business day. The Fund or borrower may terminate the loan at any time, and if the borrower defaults on its obligation to return the securities loaned because of insolvency or other reasons, the Fund may apply collateral received from the borrower against the obligation. The Fund may experience delays and costs in recovering the securities loaned. Any cash collateral received is invested in the Fidelity Securities Lending Cash Central Fund. The value of loaned securities and cash collateral at period end are disclosed on the Fund's Statement of Assets and Liabilities. The value of securities loaned to FCM at period end was $202,251. Security lending income represents the income earned on investing cash collateral, less rebates paid to borrowers and any lending agent fees associated with the loan, plus any premium payments received for lending certain types of securities. Security lending income is presented in the Statement of Operations as a component of income from Fidelity Central Funds. Total security lending income during the period amounted to $1,156, including $294 from securities loaned to FCM.
8. Expense Reductions.
Commissions paid to certain brokers with whom the investment adviser, or its affiliates, places trades on behalf of the Fund include an amount in addition to trade execution, which may be rebated back to the Fund to offset certain expenses. This amount totaled $699 for the period.
In addition, during the period the investment adviser reimbursed and/or waived a portion of operating expenses in the amount of $325.
9. Other.
The Fund's organizational documents provide former and current trustees and officers with a limited indemnification against liabilities arising in connection with the performance of their duties to the Fund. In the normal course of business, the Fund may also enter into contracts that provide general indemnifications. The Fund's maximum exposure under these arrangements is unknown as this would be dependent on future claims that may be made against the Fund. The risk of material loss from such claims is considered remote.
Shareholder Expense Example
As a shareholder of the Fund, you incur two types of costs: (1) transaction costs, including redemption fees and (2) ongoing costs, including management fees and other Fund expenses. This Example is intended to help you understand your ongoing costs (in dollars) of investing in the Fund and to compare these costs with the ongoing costs of investing in other mutual funds.
The Example is based on an investment of $1,000 invested at the beginning of the period and held for the entire period (November 1, 2016 to April 30, 2017).
Actual Expenses
The first line of the accompanying table provides information about actual account values and actual expenses. You may use the information in this line, together with the amount you invested, to estimate the expenses that you paid over the period. Simply divide your account value by $1,000.00 (for example, an $8,600 account value divided by $1,000.00 = 8.6), then multiply the result by the number in the first line under the heading entitled "Expenses Paid During Period" to estimate the expenses you paid on your account during this period. A small balance maintenance fee of $12.00 that is charged once a year may apply for certain accounts with a value of less than $2,000. This fee is not included in the table below. If it was, the estimate of expenses you paid during the period would be higher, and your ending account value lower, by this amount. In addition, the Fund, as a shareholder in the underlying Fidelity Central Funds, will indirectly bear its pro-rata share of the fees and expenses incurred by the underlying Fidelity Central Funds. These fees and expenses are not included in the Fund's annualized expense ratio used to calculate the expense estimate in the table below.
Hypothetical Example for Comparison Purposes
The second line of the accompanying table provides information about hypothetical account values and hypothetical expenses based on the Fund's actual expense ratio and an assumed rate of return of 5% per year before expenses, which is not the Fund's actual return. The hypothetical account values and expenses may not be used to estimate the actual ending account balance or expenses you paid for the period. You may use this information to compare the ongoing costs of investing in the Fund and other funds. To do so, compare this 5% hypothetical example with the 5% hypothetical examples that appear in the shareholder reports of the other funds. A small balance maintenance fee of $12.00 that is charged once a year may apply for certain accounts with a value of less than $2,000. This fee is not included in the table below. If it was, the estimate of expenses you paid during the period would be higher, and your ending account value lower, by this amount. In addition, the Fund, as a shareholder in the underlying Fidelity Central Funds, will indirectly bear its pro-rata share of the fees and expenses incurred by the underlying Fidelity Central Funds. These fees and expenses are not included in the Fund's annualized expense ratio used to calculate the expense estimate in the table below.
Please note that the expenses shown in the table are meant to highlight your ongoing costs only and do not reflect any transaction costs. Therefore, the second line of the table is useful in comparing ongoing costs only, and will not help you determine the relative total costs of owning different funds. In addition, if these transactional costs were included, your costs would have been higher.
| | Annualized Expense Ratio-A | Beginning
Account Value
November 1, 2016 | Ending
Account Value
April 30, 2017 | Expenses Paid
During Period-B
November 1, 2016
to April 30, 2017 |
| Actual | 1.18% | $1,000.00 | $1,088.80 | $6.11 |
| Hypothetical-C | | $1,000.00 | $1,018.94 | $5.91 |
A Annualized expense ratio reflects expenses net of applicable fee waivers.
B Expenses are equal to the Fund's annualized expense ratio, multiplied by the average account value over the period, multiplied by 181/365 (to reflect the one-half year period).
C 5% return per year before expenses
Corporate Headquarters
245 Summer St.
Boston, MA 02210
www.fidelity.com
GED-SANN-0617
1.938166.104
Fidelity® Global Commodity Stock Fund
Semi-Annual Report April 30, 2017 |
|
Contents
To view a fund's proxy voting guidelines and proxy voting record for the 12-month period ended June 30, visit http://www.fidelity.com/proxyvotingresults or visit the Securities and Exchange Commission's (SEC) web site at http://www.sec.gov.
You may also call 1-800-544-8544 to request a free copy of the proxy voting guidelines.
Standard & Poor's, S&P and S&P 500 are registered service marks of The McGraw-Hill Companies, Inc. and have been licensed for use by Fidelity Distributors Corporation.
Other third-party marks appearing herein are the property of their respective owners.
All other marks appearing herein are registered or unregistered trademarks or service marks of FMR LLC or an affiliated company. © 2017 FMR LLC. All rights reserved.
This report and the financial statements contained herein are submitted for the general information of the shareholders of the Fund. This report is not authorized for distribution to prospective investors in the Fund unless preceded or accompanied by an effective prospectus.
A fund files its complete schedule of portfolio holdings with the SEC for the first and third quarters of each fiscal year on Form N-Q. Forms N-Q are available on the SEC’s web site at http://www.sec.gov. A fund's Forms N-Q may be reviewed and copied at the SEC’s Public Reference Room in Washington, DC. Information regarding the operation of the SEC's Public Reference Room may be obtained by calling 1-800-SEC-0330.
For a complete list of a fund's portfolio holdings, view the most recent holdings listing, semiannual report, or annual report on Fidelity's web site at http://www.fidelity.com, http://www.institutional.fidelity.com, or http://www.401k.com, as applicable.
NOT FDIC INSURED •MAY LOSE VALUE •NO BANK GUARANTEE
Neither the Fund nor Fidelity Distributors Corporation is a bank.
Investment Summary (Unaudited)
Top Ten Stocks as of April 30, 2017
| | % of fund's net assets | % of fund's net assets 6 months ago |
| Monsanto Co. | 6.4 | 5.7 |
| BHP Billiton PLC | 4.4 | 4.2 |
| Chevron Corp. | 4.2 | 4.0 |
| Rio Tinto PLC | 4.1 | 3.5 |
| Archer Daniels Midland Co. | 3.5 | 3.4 |
| Glencore Xstrata PLC | 3.4 | 2.4 |
| Potash Corp. of Saskatchewan, Inc. | 2.6 | 2.3 |
| Suncor Energy, Inc. | 2.2 | 2.4 |
| Anadarko Petroleum Corp. | 2.2 | 2.3 |
| Total SA | 2.2 | 2.2 |
| | 35.2 | |
Top Sectors (% of fund's net assets)
| As of April 30, 2017 |
| | Energy | 34.5% |
| | Metals | 31.3% |
| | Agriculture | 28.7% |
| | Other | 3.9% |
| | Short-Term Investments and Net Other Assets | 1.6% |

| As of October 31, 2016 |
| | Agriculture | 32.2% |
| | Energy | 30.3% |
| | Metals | 30.2% |
| | Other | 6.3% |
| | Short-Term Investments and Net Other Assets | 1.0% |

Investments April 30, 2017 (Unaudited)
Showing Percentage of Net Assets
| Common Stocks - 96.9% | | | |
| | | Shares | Value |
| Chemicals - 20.9% | | | |
| Commodity Chemicals - 0.6% | | | |
| LyondellBasell Industries NV Class A | | 27,100 | $2,296,996 |
| Westlake Chemical Corp. | | 3,300 | 205,425 |
| | | | 2,502,421 |
| Diversified Chemicals - 0.4% | | | |
| E.I. du Pont de Nemours & Co. | | 10,500 | 837,375 |
| The Chemours Co. LLC | | 21,300 | 858,177 |
| The Dow Chemical Co. | | 700 | 43,960 |
| | | | 1,739,512 |
| Fertilizers & Agricultural Chemicals - 19.6% | | | |
| Agrium, Inc. | | 97,000 | 9,104,165 |
| CF Industries Holdings, Inc. | | 257,160 | 6,876,458 |
| FMC Corp. | | 71,000 | 5,199,330 |
| Intrepid Potash, Inc. (a) | | 149,300 | 270,233 |
| K&S AG (b) | | 120,300 | 2,870,492 |
| Monsanto Co. | | 230,200 | 26,843,625 |
| Potash Corp. of Saskatchewan, Inc. | | 646,200 | 10,897,421 |
| Sociedad Quimica y Minera de Chile SA (PN-B) sponsored ADR | | 51,000 | 1,813,050 |
| Syngenta AG (a) | | 16,496 | 7,647,844 |
| The Mosaic Co. | | 205,561 | 5,535,758 |
| UPL Ltd. (a) | | 75,800 | 950,477 |
| Yara International ASA | | 98,000 | 3,643,326 |
| | | | 81,652,179 |
| Specialty Chemicals - 0.3% | | | |
| Novozymes A/S Series B | | 1,000 | 43,203 |
| Platform Specialty Products Corp. (a) | | 29,500 | 418,015 |
| W.R. Grace & Co. | | 12,400 | 864,528 |
| | | | 1,325,746 |
|
| TOTAL CHEMICALS | | | 87,219,858 |
|
| Construction & Engineering - 0.3% | | | |
| Construction & Engineering - 0.3% | | | |
| KBR, Inc. | | 85,200 | 1,197,060 |
| Construction Materials - 0.2% | | | |
| Construction Materials - 0.2% | | | |
| Eagle Materials, Inc. | | 9,100 | 873,327 |
| Containers & Packaging - 0.0% | | | |
| Paper Packaging - 0.0% | | | |
| WestRock Co. | | 359 | 19,228 |
| Energy Equipment & Services - 0.3% | | | |
| Oil & Gas Equipment & Services - 0.3% | | | |
| Baker Hughes, Inc. | | 18,200 | 1,080,534 |
| Food Products - 7.1% | | | |
| Agricultural Products - 6.9% | | | |
| Archer Daniels Midland Co. | | 316,400 | 14,475,300 |
| Bunge Ltd. | | 83,500 | 6,599,005 |
| Darling International, Inc. (a) | | 180,800 | 2,735,504 |
| First Resources Ltd. | | 1,505,600 | 2,020,542 |
| Ingredion, Inc. | | 6,900 | 854,358 |
| SLC Agricola SA | | 350,000 | 2,161,277 |
| | | | 28,845,986 |
| Packaged Foods & Meats - 0.2% | | | |
| Adecoagro SA (a) | | 72,600 | 805,134 |
|
| TOTAL FOOD PRODUCTS | | | 29,651,120 |
|
| Independent Power and Renewable Electricity Producers - 0.6% | | | |
| Independent Power Producers & Energy Traders - 0.6% | | | |
| Calpine Corp. (a) | | 111,600 | 1,138,320 |
| China Resources Power Holdings Co. Ltd. | | 478,000 | 861,566 |
| The AES Corp. | | 37,100 | 419,601 |
| | | | 2,419,487 |
| Machinery - 1.0% | | | |
| Agricultural & Farm Machinery - 0.6% | | | |
| AGCO Corp. | | 13,500 | 863,865 |
| Deere & Co. | | 1,900 | 212,059 |
| Jain Irrigation Systems Ltd. | | 824,359 | 1,436,121 |
| | | | 2,512,045 |
| Construction Machinery & Heavy Trucks - 0.4% | | | |
| Allison Transmission Holdings, Inc. | | 43,100 | 1,667,108 |
| Caterpillar, Inc. | | 600 | 61,356 |
| | | | 1,728,464 |
|
| TOTAL MACHINERY | | | 4,240,509 |
|
| Metals & Mining - 30.3% | | | |
| Copper - 2.2% | | | |
| Antofagasta PLC | | 4,100 | 44,500 |
| First Quantum Minerals Ltd. | | 483,324 | 4,606,458 |
| Freeport-McMoRan, Inc. (a) | | 343,800 | 4,383,450 |
| | | | 9,034,408 |
| Diversified Metals & Mining - 15.8% | | | |
| Anglo American PLC (United Kingdom) (a) | | 329,951 | 4,728,656 |
| Arizona Mining, Inc. (a) | | 620,900 | 859,676 |
| BHP Billiton PLC | | 1,188,404 | 18,117,466 |
| Boliden AB (b) | | 27,900 | 797,566 |
| Glencore Xstrata PLC | | 3,563,919 | 14,016,447 |
| Grupo Mexico SA de CV Series B | | 272,611 | 801,820 |
| Ivanhoe Mines Ltd. (a) | | 395,500 | 1,387,821 |
| Korea Zinc Co. Ltd. | | 2,792 | 1,044,300 |
| MMC Norilsk Nickel PJSC sponsored ADR | | 51,300 | 789,251 |
| Rio Tinto PLC | | 437,387 | 17,255,018 |
| South32 Ltd. | | 655,278 | 1,357,930 |
| Sumitomo Metal Mining Co. Ltd. | | 103,000 | 1,396,587 |
| Teck Resources Ltd. Class B (sub. vtg.) | | 122,200 | 2,535,221 |
| Turquoise Hill Resources Ltd. (a) | | 271,300 | 739,340 |
| | | | 65,827,099 |
| Gold - 6.7% | | | |
| Acacia Mining PLC | | 40,000 | 204,952 |
| Agnico Eagle Mines Ltd. (Canada) | | 45,800 | 2,189,260 |
| AngloGold Ashanti Ltd. sponsored ADR | | 88,000 | 1,005,840 |
| B2Gold Corp. (a) | | 691,280 | 1,736,999 |
| Barrick Gold Corp. | | 250,400 | 4,186,021 |
| Compania de Minas Buenaventura SA sponsored ADR | | 54,200 | 650,942 |
| Continental Gold, Inc. (a) | | 375,900 | 848,154 |
| Eldorado Gold Corp. | | 178,200 | 651,418 |
| Franco-Nevada Corp. | | 20,100 | 1,367,044 |
| Goldcorp, Inc. | | 42,510 | 592,315 |
| Newcrest Mining Ltd. | | 120,542 | 1,909,941 |
| Newmont Mining Corp. | | 147,100 | 4,973,451 |
| Premier Gold Mines Ltd. (a) | | 1,433,200 | 2,897,793 |
| Randgold Resources Ltd. sponsored ADR | | 22,900 | 2,014,971 |
| SEMAFO, Inc. (a) | | 362,500 | 833,852 |
| Tahoe Resources, Inc. | | 121,000 | 980,374 |
| Torex Gold Resources, Inc. (a) | | 50,070 | 848,041 |
| | | | 27,891,368 |
| Precious Metals & Minerals - 0.4% | | | |
| Fresnillo PLC | | 42,800 | 804,910 |
| Gold Standard Ventures Corp. (a) | | 477,700 | 808,386 |
| Impala Platinum Holdings Ltd. (a) | | 67,400 | 216,273 |
| | | | 1,829,569 |
| Silver - 0.5% | | | |
| Silver Wheaton Corp. | | 110,200 | 2,199,075 |
| Steel - 4.7% | | | |
| ArcelorMittal SA Class A unit (a)(b) | | 504,610 | 3,935,958 |
| Fortescue Metals Group Ltd. | | 220,700 | 877,531 |
| Hyundai Steel Co. | | 24,552 | 1,184,867 |
| JFE Holdings, Inc. | | 117,500 | 2,003,218 |
| Nippon Steel & Sumitomo Metal Corp. | | 68,400 | 1,540,419 |
| Nucor Corp. | | 75,192 | 4,611,525 |
| POSCO | | 17,262 | 4,076,341 |
| Thyssenkrupp AG | | 67,100 | 1,597,426 |
| | | | 19,827,285 |
|
| TOTAL METALS & MINING | | | 126,608,804 |
|
| Oil, Gas & Consumable Fuels - 33.9% | | | |
| Coal & Consumable Fuels - 0.2% | | | |
| Arch Coal, Inc. (a)(b) | | 12,200 | 856,928 |
| Integrated Oil & Gas - 15.4% | | | |
| BP PLC | | 793,100 | 4,540,193 |
| Cenovus Energy, Inc. | | 300,300 | 2,994,090 |
| Chevron Corp. | | 162,400 | 17,328,080 |
| China Petroleum & Chemical Corp. (H Shares) | | 1,932,000 | 1,568,888 |
| Exxon Mobil Corp. | | 77,700 | 6,344,205 |
| Imperial Oil Ltd. | | 37,100 | 1,079,258 |
| Lukoil PJSC sponsored ADR | | 44,700 | 2,220,026 |
| Occidental Petroleum Corp. | | 41,400 | 2,547,756 |
| Royal Dutch Shell PLC: | | | |
| Class A (United Kingdom) | | 136,500 | 3,544,694 |
| Class B (United Kingdom) | | 44,393 | 1,181,164 |
| Statoil ASA (b) | | 135,400 | 2,229,888 |
| Suncor Energy, Inc. | | 297,832 | 9,333,909 |
| Total SA | | 180,400 | 9,260,516 |
| | | | 64,172,667 |
| Oil & Gas Exploration & Production - 16.7% | | | |
| Anadarko Petroleum Corp. | | 163,500 | 9,322,770 |
| Apache Corp. | | 59,200 | 2,879,488 |
| Cabot Oil & Gas Corp. | | 86,200 | 2,003,288 |
| Callon Petroleum Co. (a) | | 70,900 | 839,456 |
| Canadian Natural Resources Ltd. | | 95,000 | 3,025,970 |
| Cimarex Energy Co. | | 7,100 | 828,428 |
| CNOOC Ltd. sponsored ADR | | 18,400 | 2,137,160 |
| Concho Resources, Inc. (a) | | 6,700 | 848,622 |
| ConocoPhillips Co. | | 171,100 | 8,197,401 |
| Continental Resources, Inc. (a) | | 41,400 | 1,755,774 |
| Crescent Point Energy Corp. | | 20,400 | 201,900 |
| Devon Energy Corp. | | 56,800 | 2,243,032 |
| Diamondback Energy, Inc. (a) | | 19,200 | 1,916,928 |
| EOG Resources, Inc. | | 57,300 | 5,300,250 |
| EQT Corp. | | 53,801 | 3,127,990 |
| Hess Corp. | | 34,900 | 1,704,167 |
| INPEX Corp. | | 84,600 | 810,900 |
| Marathon Oil Corp. | | 163,000 | 2,423,810 |
| Murphy Oil Corp. | | 31,400 | 822,052 |
| Newfield Exploration Co. (a) | | 27,400 | 948,588 |
| Noble Energy, Inc. | | 123,300 | 3,986,289 |
| NOVATEK OAO GDR (Reg. S) | | 13,400 | 1,624,080 |
| Parsley Energy, Inc. Class A (a) | | 28,900 | 860,931 |
| PDC Energy, Inc. (a) | | 13,900 | 767,697 |
| Pioneer Natural Resources Co. | | 16,610 | 2,873,364 |
| PrairieSky Royalty Ltd. | | 83,798 | 1,826,300 |
| Range Resources Corp. | | 77,800 | 2,060,922 |
| Rice Energy, Inc. (a) | | 37,800 | 804,762 |
| RSP Permian, Inc. (a) | | 22,200 | 844,710 |
| Seven Generations Energy Ltd. (a) | | 25,800 | 456,823 |
| Southwestern Energy Co. (a) | | 151,500 | 1,137,765 |
| Woodside Petroleum Ltd. | | 59,111 | 1,424,361 |
| | | | 70,005,978 |
| Oil & Gas Refining & Marketing - 0.1% | | | |
| Reliance Industries Ltd. | | 20,400 | 442,714 |
| Oil & Gas Storage & Transport - 1.5% | | | |
| Boardwalk Pipeline Partners, LP | | 58,000 | 1,052,120 |
| Cheniere Energy Partners LP | | 6,600 | 209,550 |
| Cheniere Energy, Inc. (a) | | 4,600 | 208,610 |
| Golar LNG Ltd. | | 33,600 | 857,136 |
| Kinder Morgan, Inc. | | 41,600 | 858,208 |
| Plains All American Pipeline LP | | 28,500 | 833,625 |
| Scorpio Tankers, Inc. | | 282,700 | 1,243,880 |
| The Williams Companies, Inc. | | 36,100 | 1,105,743 |
| | | | 6,368,872 |
|
| TOTAL OIL, GAS & CONSUMABLE FUELS | | | 141,847,159 |
|
| Paper & Forest Products - 2.0% | | | |
| Forest Products - 0.4% | | | |
| Quintis Ltd. | | 1,732,347 | 1,556,618 |
| Paper Products - 1.6% | | | |
| Mondi PLC | | 79,700 | 2,065,581 |
| Sappi Ltd. | | 115,361 | 857,196 |
| Stora Enso Oyj (R Shares) (b) | | 65,500 | 779,133 |
| UPM-Kymmene Corp. | | 122,400 | 3,230,594 |
| | | | 6,932,504 |
|
| TOTAL PAPER & FOREST PRODUCTS | | | 8,489,122 |
|
| Semiconductors & Semiconductor Equipment - 0.3% | | | |
| Semiconductor Equipment - 0.3% | | | |
| SolarEdge Technologies, Inc. (a) | | 69,100 | 1,115,965 |
| TOTAL COMMON STOCKS | | | |
| (Cost $463,831,753) | | | 404,762,173 |
|
| Nonconvertible Preferred Stocks - 1.5% | | | |
| Metals & Mining - 1.0% | | | |
| Steel - 1.0% | | | |
| Gerdau SA: | | | |
| (PN) | | 52,000 | 160,552 |
| sponsored ADR | | 496,600 | 1,514,630 |
| Vale SA (PN-A) sponsored ADR | | 329,800 | 2,707,658 |
| | | | 4,382,840 |
| Oil, Gas & Consumable Fuels - 0.3% | | | |
| Integrated Oil & Gas - 0.3% | | | |
| Petroleo Brasileiro SA - Petrobras (PN) sponsored (non-vtg.) (a) | | 145,600 | 1,271,088 |
| Paper & Forest Products - 0.2% | | | |
| Paper Products - 0.2% | | | |
| Suzano Papel e Celulose SA | | 210,600 | 889,761 |
| TOTAL NONCONVERTIBLE PREFERRED STOCKS | | | |
| (Cost $8,573,677) | | | 6,543,689 |
|
| Money Market Funds - 4.1% | | | |
| Fidelity Cash Central Fund, 0.85% (c) | | 6,963,625 | 6,965,017 |
| Fidelity Securities Lending Cash Central Fund 0.86% (c)(d) | | 10,022,235 | 10,023,238 |
| TOTAL MONEY MARKET FUNDS | | | |
| (Cost $16,988,603) | | | 16,988,255 |
| TOTAL INVESTMENT PORTFOLIO - 102.5% | | | |
| (Cost $489,394,033) | | | 428,294,117 |
| NET OTHER ASSETS (LIABILITIES) - (2.5)% | | | (10,584,983) |
| NET ASSETS - 100% | | | $417,709,134 |
Legend
(a) Non-income producing
(b) Security or a portion of the security is on loan at period end.
(c) Affiliated fund that is generally available only to investment companies and other accounts managed by Fidelity Investments. The rate quoted is the annualized seven-day yield of the fund at period end. A complete unaudited listing of the fund's holdings as of its most recent quarter end is available upon request. In addition, each Fidelity Central Fund's financial statements are available on the SEC's website or upon request.
(d) Investment made with cash collateral received from securities on loan.
Affiliated Central Funds
Information regarding fiscal year to date income earned by the Fund from investments in Fidelity Central Funds is as follows:
| Fund | Income earned |
| Fidelity Cash Central Fund | $20,214 |
| Fidelity Securities Lending Cash Central Fund | 68,368 |
| Total | $88,582 |
Investment Valuation
The following is a summary of the inputs used, as of April 30, 2017, involving the Fund's assets and liabilities carried at fair value. The inputs or methodology used for valuing securities may not be an indication of the risk associated with investing in those securities. For more information on valuation inputs, and their aggregation into the levels used below, please refer to the Investment Valuation section in the accompanying Notes to Financial Statements.
| | Valuation Inputs at Reporting Date: |
| Description | Total | Level 1 | Level 2 | Level 3 |
| Investments in Securities: | | | | |
| Common Stocks | $404,762,173 | $341,413,802 | $63,348,371 | $-- |
| Nonconvertible Preferred Stocks | 6,543,689 | 6,543,689 | -- | -- |
| Money Market Funds | 16,988,255 | 16,988,255 | -- | -- |
| Total Investments in Securities: | $428,294,117 | $364,945,746 | $63,348,371 | $-- |
Other Information
Distribution of investments by country or territory of incorporation, as a percentage of Total Net Assets, is as follows (Unaudited):
| United States of America | 44.6% |
| Canada | 16.3% |
| United Kingdom | 12.7% |
| Bailiwick of Jersey | 3.9% |
| France | 2.2% |
| Brazil | 2.0% |
| Switzerland | 1.8% |
| Bermuda | 1.8% |
| Australia | 1.7% |
| Korea (South) | 1.6% |
| Norway | 1.4% |
| Japan | 1.3% |
| Luxembourg | 1.1% |
| Russia | 1.1% |
| Germany | 1.1% |
| Others (Individually Less Than 1%) | 5.4% |
| | 100.0% |
See accompanying notes which are an integral part of the financial statements.
Financial Statements
Statement of Assets and Liabilities
| | | April 30, 2017 (Unaudited) |
| Assets | | |
Investment in securities, at value (including securities loaned of $9,638,469) — See accompanying schedule:
Unaffiliated issuers (cost $472,405,430) | $411,305,862 | |
| Fidelity Central Funds (cost $16,988,603) | 16,988,255 | |
| Total Investments (cost $489,394,033) | | $428,294,117 |
| Foreign currency held at value (cost $264,429) | | 264,429 |
| Receivable for investments sold | | 3,523,654 |
| Receivable for fund shares sold | | 172,884 |
| Dividends receivable | | 706,809 |
| Distributions receivable from Fidelity Central Funds | | 16,144 |
| Prepaid expenses | | 222 |
| Other receivables | | 23,105 |
| Total assets | | 433,001,364 |
| Liabilities | | |
| Payable for investments purchased | $4,076,467 | |
| Payable for fund shares redeemed | 777,124 | |
| Accrued management fee | 247,093 | |
| Distribution and service plan fees payable | 21,581 | |
| Other affiliated payables | 112,107 | |
| Other payables and accrued expenses | 34,593 | |
| Collateral on securities loaned | 10,023,265 | |
| Total liabilities | | 15,292,230 |
| Net Assets | | $417,709,134 |
| Net Assets consist of: | | |
| Paid in capital | | $558,036,940 |
| Undistributed net investment income | | 1,552,637 |
| Accumulated undistributed net realized gain (loss) on investments and foreign currency transactions | | (80,762,992) |
| Net unrealized appreciation (depreciation) on investments and assets and liabilities in foreign currencies | | (61,117,451) |
| Net Assets | | $417,709,134 |
| Calculation of Maximum Offering Price | | |
| Class A: | | |
| Net Asset Value and redemption price per share ($30,816,014 ÷ 2,696,693 shares) | | $11.43 |
| Maximum offering price per share (100/94.25 of $11.43) | | $12.13 |
| Class M: | | |
| Net Asset Value and redemption price per share ($6,793,860 ÷ 594,854 shares) | | $11.42 |
| Maximum offering price per share (100/96.50 of $11.42) | | $11.83 |
| Class C: | | |
| Net Asset Value and offering price per share ($14,316,822 ÷ 1,264,687 shares)(a) | | $11.32 |
| Global Commodity Stock: | | |
| Net Asset Value, offering price and redemption price per share ($264,991,026 ÷ 23,148,159 shares) | | $11.45 |
| Class I: | | |
| Net Asset Value, offering price and redemption price per share ($100,791,412 ÷ 8,809,496 shares) | | $11.44 |
(a) Redemption price per share is equal to net asset value less any applicable contingent deferred sales charge.
See accompanying notes which are an integral part of the financial statements.
Statement of Operations
| | | Six months ended April 30, 2017 (Unaudited) |
| Investment Income | | |
| Dividends | | $4,564,919 |
| Income from Fidelity Central Funds | | 88,582 |
| Income before foreign taxes withheld | | 4,653,501 |
| Less foreign taxes withheld | | (235,395) |
| Total income | | 4,418,106 |
| Expenses | | |
| Management fee | $1,443,839 | |
| Transfer agent fees | 553,313 | |
| Distribution and service plan fees | 133,247 | |
| Accounting and security lending fees | 108,081 | |
| Custodian fees and expenses | 33,284 | |
| Independent trustees' fees and expenses | 816 | |
| Registration fees | 81,203 | |
| Audit | 28,347 | |
| Legal | 620 | |
| Miscellaneous | 1,433 | |
| Total expenses before reductions | 2,384,183 | |
| Expense reductions | (19,894) | 2,364,289 |
| Net investment income (loss) | | 2,053,817 |
| Realized and Unrealized Gain (Loss) | | |
| Net realized gain (loss) on: | | |
| Investment securities: | | |
| Unaffiliated issuers | 13,679,313 | |
| Fidelity Central Funds | (908) | |
| Foreign currency transactions | (60,004) | |
| Total net realized gain (loss) | | 13,618,401 |
Change in net unrealized appreciation (depreciation) on:
Investment securities | 12,340,635 | |
| Assets and liabilities in foreign currencies | 12,956 | |
| Total change in net unrealized appreciation (depreciation) | | 12,353,591 |
| Net gain (loss) | | 25,971,992 |
| Net increase (decrease) in net assets resulting from operations | | $28,025,809 |
See accompanying notes which are an integral part of the financial statements.
Statement of Changes in Net Assets
| | Six months ended April 30, 2017 (Unaudited) | Year ended October 31, 2016 |
| Increase (Decrease) in Net Assets | | |
| Operations | | |
| Net investment income (loss) | $2,053,817 | $3,732,641 |
| Net realized gain (loss) | 13,618,401 | (22,456,882) |
| Change in net unrealized appreciation (depreciation) | 12,353,591 | 48,478,395 |
| Net increase (decrease) in net assets resulting from operations | 28,025,809 | 29,754,154 |
| Distributions to shareholders from net investment income | (3,511,036) | (5,140,876) |
| Distributions to shareholders from net realized gain | (2,362,260) | (224,075) |
| Total distributions | (5,873,296) | (5,364,951) |
| Share transactions - net increase (decrease) | 43,020,634 | 97,100,151 |
| Redemption fees | 6,938 | 14,543 |
| Total increase (decrease) in net assets | 65,180,085 | 121,503,897 |
| Net Assets | | |
| Beginning of period | 352,529,049 | 231,025,152 |
| End of period | $417,709,134 | $352,529,049 |
| Other Information | | |
| Undistributed net investment income end of period | $1,552,637 | $3,009,856 |
See accompanying notes which are an integral part of the financial statements.
Financial Highlights — Fidelity Global Commodity Stock Fund Class A
| | Six months ended (Unaudited) April 30, | Years ended October 31, | | | | |
| | 2017 | 2016 | 2015 | 2014 | 2013 | 2012 |
| Selected Per–Share Data | | | | | | |
| Net asset value, beginning of period | $10.73 | $10.05 | $13.25 | $14.17 | $14.59 | $15.14 |
| Income from Investment Operations | | | | | | |
| Net investment income (loss)A | .05 | .11 | .22 | .15 | .16 | .11 |
| Net realized and unrealized gain (loss) | .80 | .79 | (3.25) | (.91) | (.45) | (.59) |
| Total from investment operations | .85 | .90 | (3.03) | (.76) | (.29) | (.48) |
| Distributions from net investment income | (.08) | (.21) | (.14) | (.15) | (.13) | (.05) |
| Distributions from net realized gain | (.07) | (.01) | (.03) | (.01) | – | (.01) |
| Total distributions | (.15) | (.22) | (.17) | (.16) | (.13) | (.07)B |
| Redemption fees added to paid in capitalA,C | – | – | – | – | – | – |
| Net asset value, end of period | $11.43 | $10.73 | $10.05 | $13.25 | $14.17 | $14.59 |
| Total ReturnD,E,F | 7.87% | 9.29% | (23.16)% | (5.41)% | (2.00)% | (3.19)% |
| Ratios to Average Net AssetsG,H | | | | | | |
| Expenses before reductions | 1.35%I | 1.38% | 1.34% | 1.35% | 1.36% | 1.34% |
| Expenses net of fee waivers, if any | 1.35%I | 1.38% | 1.34% | 1.35% | 1.35% | 1.34% |
| Expenses net of all reductions | 1.34%I | 1.37% | 1.34% | 1.35% | 1.34% | 1.33% |
| Net investment income (loss) | .79%I | 1.18% | 1.85% | 1.05% | 1.12% | .80% |
| Supplemental Data | | | | | | |
| Net assets, end of period (000 omitted) | $30,816 | $34,791 | $31,391 | $51,586 | $71,293 | $99,694 |
| Portfolio turnover rateJ | 85%I | 85% | 77% | 75% | 65% | 91% |
A Calculated based on average shares outstanding during the period.
B Total distributions of $.07 per share is comprised of distributions from net investment income of $.052 and distributions from net realized gain of $.014 per share.
C Amount represents less than $.005 per share.
D Total returns for periods of less than one year are not annualized.
E Total returns would have been lower if certain expenses had not been reduced during the applicable periods shown.
F Total returns do not include the effect of the sales charges.
G Fees and expenses of any underlying Fidelity Central Funds are not included in the Fund's expense ratio. The Fund indirectly bears its proportionate share of the expenses of any underlying Fidelity Central Funds.
H Expense ratios reflect operating expenses of the class. Expenses before reductions do not reflect amounts reimbursed by the investment adviser or reductions from brokerage service arrangements or reductions from other expense offset arrangements and do not represent the amount paid by the class during periods when reimbursements or reductions occur. Expenses net of fee waivers reflect expenses after reimbursement by the investment adviser but prior to reductions from brokerage service arrangements or other expense offset arrangements. Expenses net of all reductions represent the net expenses paid by the class.
I Annualized
J Amount does not include the portfolio activity of any underlying Fidelity Central Funds.
See accompanying notes which are an integral part of the financial statements.
Financial Highlights — Fidelity Global Commodity Stock Fund Class M
| | Six months ended (Unaudited) April 30, | Years ended October 31, | | | | |
| | 2017 | 2016 | 2015 | 2014 | 2013 | 2012 |
| Selected Per–Share Data | | | | | | |
| Net asset value, beginning of period | $10.72 | $10.02 | $13.21 | $14.13 | $14.54 | $15.08 |
| Income from Investment Operations | | | | | | |
| Net investment income (loss)A | .03 | .09 | .19 | .11 | .12 | .08 |
| Net realized and unrealized gain (loss) | .79 | .79 | (3.25) | (.90) | (.45) | (.60) |
| Total from investment operations | .82 | .88 | (3.06) | (.79) | (.33) | (.52) |
| Distributions from net investment income | (.05) | (.17) | (.10) | (.11) | (.08) | (.01) |
| Distributions from net realized gain | (.07) | (.01) | (.03) | (.01) | – | (.01) |
| Total distributions | (.12) | (.18) | (.13) | (.13)B | (.08) | (.02) |
| Redemption fees added to paid in capitalA,C | – | – | – | – | – | – |
| Net asset value, end of period | $11.42 | $10.72 | $10.02 | $13.21 | $14.13 | $14.54 |
| Total ReturnD,E,F | 7.63% | 9.08% | (23.40)% | (5.65)% | (2.26)% | (3.43)% |
| Ratios to Average Net AssetsG,H | | | | | | |
| Expenses before reductions | 1.64%I | 1.65% | 1.63% | 1.62% | 1.62% | 1.61% |
| Expenses net of fee waivers, if any | 1.64%I | 1.65% | 1.63% | 1.62% | 1.61% | 1.61% |
| Expenses net of all reductions | 1.63%I | 1.64% | 1.62% | 1.62% | 1.60% | 1.60% |
| Net investment income (loss) | .50%I | .90% | 1.57% | .78% | .86% | .53% |
| Supplemental Data | | | | | | |
| Net assets, end of period (000 omitted) | $6,794 | $6,068 | $6,335 | $9,867 | $12,551 | $16,692 |
| Portfolio turnover rateJ | 85%I | 85% | 77% | 75% | 65% | 91% |
A Calculated based on average shares outstanding during the period.
B Total distributions of $.13 per share is comprised of distributions from net investment income of $.113 and distributions from net realized gain of $.013 per share.
C Amount represents less than $.005 per share.
D Total returns for periods of less than one year are not annualized.
E Total returns would have been lower if certain expenses had not been reduced during the applicable periods shown.
F Total returns do not include the effect of the sales charges.
G Fees and expenses of any underlying Fidelity Central Funds are not included in the Fund's expense ratio. The Fund indirectly bears its proportionate share of the expenses of any underlying Fidelity Central Funds.
H Expense ratios reflect operating expenses of the class. Expenses before reductions do not reflect amounts reimbursed by the investment adviser or reductions from brokerage service arrangements or reductions from other expense offset arrangements and do not represent the amount paid by the class during periods when reimbursements or reductions occur. Expenses net of fee waivers reflect expenses after reimbursement by the investment adviser but prior to reductions from brokerage service arrangements or other expense offset arrangements. Expenses net of all reductions represent the net expenses paid by the class.
I Annualized
J Amount does not include the portfolio activity of any underlying Fidelity Central Funds.
See accompanying notes which are an integral part of the financial statements.
Financial Highlights — Fidelity Global Commodity Stock Fund Class C
| | Six months ended (Unaudited) April 30, | Years ended October 31, | | | | |
| | 2017 | 2016 | 2015 | 2014 | 2013 | 2012 |
| Selected Per–Share Data | | | | | | |
| Net asset value, beginning of period | $10.61 | $9.92 | $13.06 | $13.96 | $14.37 | $14.95 |
| Income from Investment Operations | | | | | | |
| Net investment income (loss)A | –B | .04 | .13 | .04 | .05 | .01 |
| Net realized and unrealized gain (loss) | .79 | .78 | (3.22) | (.89) | (.44) | (.59) |
| Total from investment operations | .79 | .82 | (3.09) | (.85) | (.39) | (.58) |
| Distributions from net investment income | (.01) | (.12) | (.03) | (.03) | (.02) | – |
| Distributions from net realized gain | (.07) | (.01) | (.03) | (.01) | – | – |
| Total distributions | (.08) | (.13) | (.05)C | (.05)D | (.02) | – |
| Redemption fees added to paid in capitalA,B | – | – | – | – | – | – |
| Net asset value, end of period | $11.32 | $10.61 | $9.92 | $13.06 | $13.96 | $14.37 |
| Total ReturnE,F,G | 7.44% | 8.46% | (23.74)% | (6.13)% | (2.75)% | (3.88)% |
| Ratios to Average Net AssetsH,I | | | | | | |
| Expenses before reductions | 2.10%J | 2.13% | 2.12% | 2.11% | 2.11% | 2.10% |
| Expenses net of fee waivers, if any | 2.10%J | 2.13% | 2.12% | 2.11% | 2.11% | 2.10% |
| Expenses net of all reductions | 2.09%J | 2.12% | 2.11% | 2.11% | 2.10% | 2.09% |
| Net investment income (loss) | .05%J | .43% | 1.08% | .29% | .36% | .03% |
| Supplemental Data | | | | | | |
| Net assets, end of period (000 omitted) | $14,317 | $12,620 | $11,274 | $17,659 | $23,830 | $31,865 |
| Portfolio turnover rateK | 85%J | 85% | 77% | 75% | 65% | 91% |
A Calculated based on average shares outstanding during the period.
B Amount represents less than $.005 per share.
C Total distributions of $.05 per share is comprised of distributions from net investment income of $.025 and distributions from net realized gain of $.026 per share.
D Total distributions of $.05 per share is comprised of distributions from net investment income of $.033 and distributions from net realized gain of $.013 per share.
E Total returns for periods of less than one year are not annualized.
F Total returns would have been lower if certain expenses had not been reduced during the applicable periods shown.
G Total returns do not include the effect of the contingent deferred sales charge.
H Fees and expenses of any underlying Fidelity Central Funds are not included in the Fund's expense ratio. The Fund indirectly bears its proportionate share of the expenses of any underlying Fidelity Central Funds.
I Expense ratios reflect operating expenses of the class. Expenses before reductions do not reflect amounts reimbursed by the investment adviser or reductions from brokerage service arrangements or reductions from other expense offset arrangements and do not represent the amount paid by the class during periods when reimbursements or reductions occur. Expenses net of fee waivers reflect expenses after reimbursement by the investment adviser but prior to reductions from brokerage service arrangements or other expense offset arrangements. Expenses net of all reductions represent the net expenses paid by the class.
J Annualized
K Amount does not include the portfolio activity of any underlying Fidelity Central Funds.
See accompanying notes which are an integral part of the financial statements.
Financial Highlights — Fidelity Global Commodity Stock Fund
| | Six months ended (Unaudited) April 30, | Years ended October 31, | | | | |
| | 2017 | 2016 | 2015 | 2014 | 2013 | 2012 |
| Selected Per–Share Data | | | | | | |
| Net asset value, beginning of period | $10.77 | $10.09 | $13.31 | $14.24 | $14.66 | $15.21 |
| Income from Investment Operations | | | | | | |
| Net investment income (loss)A | .06 | .14 | .25 | .19 | .19 | .15 |
| Net realized and unrealized gain (loss) | .79 | .79 | (3.27) | (.92) | (.45) | (.60) |
| Total from investment operations | .85 | .93 | (3.02) | (.73) | (.26) | (.45) |
| Distributions from net investment income | (.11) | (.24) | (.18) | (.19) | (.16) | (.08) |
| Distributions from net realized gain | (.07) | (.01) | (.03) | (.01) | – | (.01) |
| Total distributions | (.17)B | (.25) | (.20)C | (.20) | (.16) | (.10)D |
| Redemption fees added to paid in capitalA,E | – | – | – | – | – | – |
| Net asset value, end of period | $11.45 | $10.77 | $10.09 | $13.31 | $14.24 | $14.66 |
| Total ReturnF,G | 7.90% | 9.62% | (22.97)% | (5.16)% | (1.75)% | (2.96)% |
| Ratios to Average Net AssetsH,I | | | | | | |
| Expenses before reductions | 1.12%J | 1.13% | 1.12% | 1.11% | 1.11% | 1.10% |
| Expenses net of fee waivers, if any | 1.12%J | 1.13% | 1.12% | 1.11% | 1.11% | 1.10% |
| Expenses net of all reductions | 1.11%J | 1.12% | 1.11% | 1.11% | 1.09% | 1.09% |
| Net investment income (loss) | 1.02%J | 1.43% | 2.08% | 1.29% | 1.37% | 1.04% |
| Supplemental Data | | | | | | |
| Net assets, end of period (000 omitted) | $264,991 | $228,982 | $156,320 | $223,084 | $273,476 | $387,242 |
| Portfolio turnover rateK | 85%J | 85% | 77% | 75% | 65% | 91% |
A Calculated based on average shares outstanding during the period.
B Total distributions of $.17 per share is comprised of distributions from net investment income of $.105 and distributions from net realized gain of $.068 per share.
C Total distributions of $.20 per share is comprised of distributions from net investment income of $.178 and distributions from net realized gain of $.026 per share.
D Total distributions of $.10 per share is comprised of distributions from net investment income of $.084 and distributions from net realized gain of $.014 per share.
E Amount represents less than $.005 per share.
F Total returns for periods of less than one year are not annualized.
G Total returns would have been lower if certain expenses had not been reduced during the applicable periods shown.
H Fees and expenses of any underlying Fidelity Central Funds are not included in the Fund's expense ratio. The Fund indirectly bears its proportionate share of the expenses of any underlying Fidelity Central Funds.
I Expense ratios reflect operating expenses of the class. Expenses before reductions do not reflect amounts reimbursed by the investment adviser or reductions from brokerage service arrangements or reductions from other expense offset arrangements and do not represent the amount paid by the class during periods when reimbursements or reductions occur. Expenses net of fee waivers reflect expenses after reimbursement by the investment adviser but prior to reductions from brokerage service arrangements or other expense offset arrangements. Expenses net of all reductions represent the net expenses paid by the class.
J Annualized
K Amount does not include the portfolio activity of any underlying Fidelity Central Funds.
See accompanying notes which are an integral part of the financial statements.
Financial Highlights — Fidelity Global Commodity Stock Fund Class I
| | Six months ended (Unaudited) April 30, | Years ended October 31, | | | | |
| | 2017 | 2016 | 2015 | 2014 | 2013 | 2012 |
| Selected Per–Share Data | | | | | | |
| Net asset value, beginning of period | $10.76 | $10.09 | $13.31 | $14.24 | $14.67 | $15.22 |
| Income from Investment Operations | | | | | | |
| Net investment income (loss)A | .07 | .16 | .25 | .19 | .20 | .16 |
| Net realized and unrealized gain (loss) | .80 | .77 | (3.26) | (.92) | (.45) | (.60) |
| Total from investment operations | .87 | .93 | (3.01) | (.73) | (.25) | (.44) |
| Distributions from net investment income | (.12) | (.25) | (.19) | (.19) | (.18) | (.09) |
| Distributions from net realized gain | (.07) | (.01) | (.03) | (.01) | – | (.01) |
| Total distributions | (.19) | (.26) | (.21)B | (.20) | (.18) | (.11)C |
| Redemption fees added to paid in capitalA,D | – | – | – | – | – | – |
| Net asset value, end of period | $11.44 | $10.76 | $10.09 | $13.31 | $14.24 | $14.67 |
| Total ReturnE,F | 8.03% | 9.63% | (22.93)% | (5.16)% | (1.71)% | (2.90)% |
| Ratios to Average Net AssetsG,H | | | | | | |
| Expenses before reductions | .98%I | 1.01% | 1.09% | 1.06% | 1.04% | 1.04% |
| Expenses net of fee waivers, if any | .98%I | 1.01% | 1.08% | 1.06% | 1.04% | 1.04% |
| Expenses net of all reductions | .97%I | 1.00% | 1.08% | 1.06% | 1.03% | 1.03% |
| Net investment income (loss) | 1.16%I | 1.55% | 2.11% | 1.34% | 1.43% | 1.10% |
| Supplemental Data | | | | | | |
| Net assets, end of period (000 omitted) | $100,791 | $70,068 | $24,841 | $23,840 | $31,613 | $50,540 |
| Portfolio turnover rateJ | 85%I | 85% | 77% | 75% | 65% | 91% |
A Calculated based on average shares outstanding during the period.
B Total distributions of $.21 per share is comprised of distributions from net investment income of $.186 and distributions from net realized gain of $.026 per share.
C Total distributions of $.11 per share is comprised of distributions from net investment income of $.093 and distributions from net realized gain of $.014 per share.
D Amount represents less than $.005 per share.
E Total returns for periods of less than one year are not annualized.
F Total returns would have been lower if certain expenses had not been reduced during the applicable periods shown.
G Fees and expenses of any underlying Fidelity Central Funds are not included in the Fund's expense ratio. The Fund indirectly bears its proportionate share of the expenses of any underlying Fidelity Central Funds.
H Expense ratios reflect operating expenses of the class. Expenses before reductions do not reflect amounts reimbursed by the investment adviser or reductions from brokerage service arrangements or reductions from other expense offset arrangements and do not represent the amount paid by the class during periods when reimbursements or reductions occur. Expenses net of fee waivers reflect expenses after reimbursement by the investment adviser but prior to reductions from brokerage service arrangements or other expense offset arrangements. Expenses net of all reductions represent the net expenses paid by the class.
I Annualized
J Amount does not include the portfolio activity of any underlying Fidelity Central Funds.
See accompanying notes which are an integral part of the financial statements.
Notes to Financial Statements (Unaudited)
For the period ended April 30, 2017
1. Organization.
Fidelity Global Commodity Stock Fund (the Fund) is a non-diversified fund of Fidelity Investment Trust (the Trust) and is authorized to issue an unlimited number of shares. The Trust is registered under the Investment Company Act of 1940, as amended (the 1940 Act), as an open-end management investment company organized as a Massachusetts business trust. The Fund offers Class A, Class M (formerly Class T), Class C, Global Commodity Stock and Class I shares, each of which has equal rights as to assets and voting privileges. Each class has exclusive voting rights with respect to matters that affect that class.
After the close of business on June 24, 2016, all outstanding Class B shares were converted to Class A shares. All prior fiscal period dollar and share amounts for Class B presented in the Notes to Financial Statements are for the period November 1, 2015 through June 24, 2016.
2. Investments in Fidelity Central Funds.
The Fund invests in Fidelity Central Funds, which are open-end investment companies generally available only to other investment companies and accounts managed by the investment adviser and its affiliates. The Fund's Schedule of Investments lists each of the Fidelity Central Funds held as of period end, if any, as an investment of the Fund, but does not include the underlying holdings of each Fidelity Central Fund. As an Investing Fund, the Fund indirectly bears its proportionate share of the expenses of the underlying Fidelity Central Funds.
The Money Market Central Funds seek preservation of capital and current income and are managed by Fidelity Investments Money Management, Inc. (FIMM), an affiliate of the investment adviser. Annualized expenses of the Money Market Central Funds as of their most recent shareholder report date are less than .005%.
A complete unaudited list of holdings for each Fidelity Central Fund is available upon request or at the Securities and Exchange Commission (the SEC) website at www.sec.gov. In addition, the financial statements of the Fidelity Central Funds are available on the SEC website or upon request.
3. Significant Accounting Policies.
The Fund is an investment company and applies the accounting and reporting guidance of the Financial Accounting Standards Board (FASB) Accounting Standards Codification Topic 946 Financial Services – Investments Companies. The financial statements have been prepared in conformity with accounting principles generally accepted in the United States of America (GAAP), which require management to make certain estimates and assumptions at the date of the financial statements. Actual results could differ from those estimates. Subsequent events, if any, through the date that the financial statements were issued have been evaluated in the preparation of the financial statements. The following summarizes the significant accounting policies of the Fund:
Investment Valuation. Investments are valued as of 4:00 p.m. Eastern time on the last calendar day of the period. The Board of Trustees (the Board) has delegated the day to day responsibility for the valuation of the Fund's investments to the Fair Value Committee (the Committee) established by the Fund's investment adviser. In accordance with valuation policies and procedures approved by the Board, the Fund attempts to obtain prices from one or more third party pricing vendors or brokers to value its investments. When current market prices, quotations or currency exchange rates are not readily available or reliable, investments will be fair valued in good faith by the Committee, in accordance with procedures adopted by the Board. Factors used in determining fair value vary by investment type and may include market or investment specific events. The frequency with which these procedures are used cannot be predicted and they may be utilized to a significant extent. The Committee oversees the Fund's valuation policies and procedures and reports to the Board on the Committee's activities and fair value determinations. The Board monitors the appropriateness of the procedures used in valuing the Fund's investments and ratifies the fair value determinations of the Committee.
The Fund categorizes the inputs to valuation techniques used to value its investments into a disclosure hierarchy consisting of three levels as shown below:
- Level 1 – quoted prices in active markets for identical investments
- Level 2 – other significant observable inputs (including quoted prices for similar investments, interest rates, prepayment speeds, etc.)
- Level 3 – unobservable inputs (including the Fund's own assumptions based on the best information available)
Valuation techniques used to value the Fund's investments by major category are as follows:
Equity securities, including restricted securities, for which market quotations are readily available, are valued at the last reported sale price or official closing price as reported by a third party pricing vendor on the primary market or exchange on which they are traded and are categorized as Level 1 in the hierarchy. In the event there were no sales during the day or closing prices are not available, securities are valued at the last quoted bid price or may be valued using the last available price and are generally categorized as Level 2 in the hierarchy. For foreign equity securities, when market or security specific events arise, comparisons to the valuation of American Depositary Receipts (ADRs), futures contracts, Exchange-Traded Funds (ETFs) and certain indexes as well as quoted prices for similar securities may be used and would be categorized as Level 2 in the hierarchy. Utilizing these techniques may result in transfers between Level 1 and Level 2. For equity securities, including restricted securities, where observable inputs are limited, assumptions about market activity and risk are used and these securities may be categorized as Level 3 in the hierarchy.
Investments in open-end mutual funds, including the Fidelity Central Funds, are valued at their closing net asset value (NAV) each business day and are categorized as Level 1 in the hierarchy.
Changes in valuation techniques may result in transfers in or out of an assigned level within the disclosure hierarchy. The aggregate value of investments by input level as of April 30, 2017 is included at the end of the Fund's Schedule of Investments.
Foreign Currency. The Fund may use foreign currency contracts to facilitate transactions in foreign-denominated securities. Gains and losses from these transactions may arise from changes in the value of the foreign currency or if the counterparties do not perform under the contracts' terms.
Foreign-denominated assets, including investment securities, and liabilities are translated into U.S. dollars at the exchange rates at period end. Purchases and sales of investment securities, income and dividends received and expenses denominated in foreign currencies are translated into U.S. dollars at the exchange rate in effect on the transaction date.
The effects of exchange rate fluctuations on investments are included with the net realized and unrealized gain (loss) on investment securities. Other foreign currency transactions resulting in realized and unrealized gain (loss) are disclosed separately.
Investment Transactions and Income. For financial reporting purposes, the Fund's investment holdings and NAV include trades executed through the end of the last business day of the period. The NAV per share for processing shareholder transactions is calculated as of the close of business of the New York Stock Exchange (NYSE), normally 4:00 p.m. Eastern time and includes trades executed through the end of the prior business day. Gains and losses on securities sold are determined on the basis of identified cost and may include proceeds received from litigation. Dividend income is recorded on the ex-dividend date, except for certain dividends from foreign securities where the ex-dividend date may have passed, which are recorded as soon as the Fund is informed of the ex-dividend date. Non-cash dividends included in dividend income, if any, are recorded at the fair market value of the securities received. Income and capital gain distributions from Fidelity Central Funds, if any, are recorded on the ex-dividend date. Certain distributions received by the Fund represent a return of capital or capital gain. The Fund determines the components of these distributions subsequent to the ex-dividend date, based upon receipt of tax filings or other correspondence relating to the underlying investment. These distributions are recorded as a reduction of cost of investments and/or as a realized gain. Investment income is recorded net of foreign taxes withheld where recovery of such taxes is uncertain.
Class Allocations and Expenses. Investment income, realized and unrealized capital gains and losses, common expenses of the Fund, and certain fund-level expense reductions, if any, are allocated daily on a pro-rata basis to each class based on the relative net assets of each class to the total net assets of the Fund. Each class differs with respect to transfer agent and distribution and service plan fees incurred. Certain expense reductions may also differ by class. For the reporting period, the allocated portion of income and expenses to each class as a percent of its average net assets may vary due to the timing of recording these transactions in relation to fluctuating net assets of the classes. Expenses directly attributable to a fund are charged to that fund. Expenses attributable to more than one fund are allocated among the respective funds on the basis of relative net assets or other appropriate methods. Expense estimates are accrued in the period to which they relate and adjustments are made when actual amounts are known.
Income Tax Information and Distributions to Shareholders. Each year, the Fund intends to qualify as a regulated investment company under Subchapter M of the Internal Revenue Code, including distributing substantially all of its taxable income and realized gains. As a result, no provision for U.S. Federal income taxes is required. The Fund files a U.S. federal tax return, in addition to state and local tax returns as required. The Fund's federal income tax returns are subject to examination by the Internal Revenue Service (IRS) for a period of three fiscal years after they are filed. State and local tax returns may be subject to examination for an additional fiscal year depending on the jurisdiction. Foreign taxes are provided for based on the Fund's understanding of the tax rules and rates that exist in the foreign markets in which it invests.
Distributions are declared and recorded on the ex-dividend date. Income dividends and capital gain distributions are declared separately for each class. Income and capital gain distributions are determined in accordance with income tax regulations, which may differ from GAAP.
Capital accounts within the financial statements are adjusted for permanent book-tax differences. These adjustments have no impact on net assets or the results of operations. Capital accounts are not adjusted for temporary book-tax differences which will reverse in a subsequent period.
Book-tax differences are primarily due to foreign currency transactions, passive foreign investment companies (PFIC),partnerships, capital loss carryforwards and losses deferred due to wash sales.
The federal tax cost of investment securities and unrealized appreciation (depreciation) as of period end were as follows:
| Gross unrealized appreciation | $21,052,475 |
| Gross unrealized depreciation | (88,323,728) |
| Net unrealized appreciation (depreciation) on securities | $(67,271,253) |
| Tax cost | $495,565,370 |
Capital loss carryforwards are only available to offset future capital gains of the Fund to the extent provided by regulations and may be limited. Under the Regulated Investment Company Modernization Act of 2010 (the Act), the Fund is permitted to carry forward capital losses incurred in taxable years beginning after December 22, 2010 for an unlimited period and such capital losses are required to be used prior to any losses that expire. The capital loss carryforward information presented below, including any applicable limitation, is estimated as of prior fiscal period end and is subject to adjustment.
| Fiscal year of expiration | |
| 2019 | $(6,952,413) |
| No expiration | |
| Short-term | (8,754,263) |
| Long-term | (72,167,588) |
| Total no expiration | (80,921,851) |
| Total capital loss carryforward | $(87,874,264) |
Short-Term Trading (Redemption) Fees. Shares held by investors in the Fund less than 30 days may have been subject to a redemption fee equal to 1.00% of the NAV of shares redeemed. All redemption fees, which reduce the proceeds of the shareholder redemption, are retained by the Fund and accounted for as an addition to paid in capital.
4. Purchases and Sales of Investments.
Purchases and sales of securities, other than short-term securities, aggregated $206,841,374 and $170,436,102, respectively.
5. Fees and Other Transactions with Affiliates.
Management Fee. Fidelity Management & Research Company (the investment adviser) and its affiliates provide the Fund with investment management related services for which the Fund pays a monthly management fee. The management fee is the sum of an individual fund fee rate that is based on an annual rate of .45% of the Fund's average net assets and an annualized group fee rate that averaged .25% during the period. The group fee rate is based upon the average net assets of all the mutual funds advised by the investment adviser, including any mutual funds previously advised by the investment adviser that are currently advised by Fidelity SelectCo, LLC, an affiliate of the investment adviser. The group fee rate decreases as assets under management increase and increases as assets under management decrease. For the reporting period, the total annualized management fee rate was .70% of the Fund's average net assets.
Distribution and Service Plan Fees. In accordance with Rule 12b-1 of the 1940 Act, the Fund has adopted separate Distribution and Service Plans for each class of shares. Certain classes pay Fidelity Distributors Corporation (FDC), an affiliate of the investment adviser, separate Distribution and Service Fees, each of which is based on an annual percentage of each class' average net assets. In addition, FDC may pay financial intermediaries for selling shares of the Fund and providing shareholder support services. For the period, the Distribution and Service Fee rates, total fees and amounts retained by FDC were as follows:
| | Distribution
Fee | Service
Fee | Total Fees | Retained
by FDC |
| Class A | -% | .25% | $44,819 | $952 |
| Class M | .25% | .25% | 16,736 | 104 |
| Class C | .75% | .25% | 71,692 | 14,981 |
| | | | $133,247 | $16,037 |
Sales Load. FDC may receive a front-end sales charge of up to 5.75% for selling Class A shares and 3.50% for selling Class M shares, some of which is paid to financial intermediaries for selling shares of the Fund. Depending on the holding period, FDC may receive contingent deferred sales charges levied on Class A, Class M, and Class C redemptions. The deferred sales charges are 1.00% for Class C shares, 1.00% for certain purchases of Class A shares and .25% for certain purchases of Class M shares.
For the period, sales charge amounts retained by FDC were as follows:
| | Retained
by FDC |
| Class A | $16,952 |
| Class M | 1,860 |
| Class C(a) | 1,522 |
| | $20,334 |
(a) When Class C shares are initially sold, FDC pays commissions from its own resources to financial intermediaries through which the sales are made.
Transfer Agent Fees. Fidelity Investments Institutional Operations Company, Inc., (FIIOC), an affiliate of the investment adviser, is the transfer, dividend disbursing and shareholder servicing agent for each class of the Fund. FIIOC receives account fees and asset-based fees that vary according to the account size and type of account of the shareholders of the respective classes of the Fund. FIIOC pays for typesetting, printing and mailing of shareholder reports, except proxy statements.
For the period, transfer agent fees for each class were as follows:
| | Amount | % of
Class-Level Average
Net Assets(a) |
| Class A | $50,232 | .28 |
| Class M | 10,638 | .32 |
| Class C | 19,809 | .28 |
| Global Commodity Stock | 398,054 | .30 |
| Class I | 74,580 | .16 |
| | $553,313 | |
(a) Annualized
Accounting and Security Lending Fees. Fidelity Service Company, Inc. (FSC), an affiliate of the investment adviser, maintains the Fund's accounting records. The accounting fee is based on the level of average net assets for each month. Under a separate contract, FSC administers the security lending program. The security lending fee is based on the number and duration of lending transactions.
Brokerage Commissions. The Fund placed a portion of its portfolio transactions with brokerage firms which are affiliates of the investment adviser. Brokerage commissions are included in net realized gain (loss) and change in net unrealized appreciation (depreciation) in the Statement of Operations. The commissions paid to these affiliated firms were $4,759 for the period.
Interfund Trades. The Fund may purchase from or sell securities to other Fidelity Funds under procedures adopted by the Board. The procedures have been designed to ensure these interfund trades are executed in accordance with Rule 17a-7 of the 1940 Act. Interfund trades are included within the respective purchases and sales amounts shown in the Purchases and Sales of Investments note.
6. Committed Line of Credit.
The Fund participates with other funds managed by the investment adviser or an affiliate in a $4.25 billion credit facility (the "line of credit") to be utilized for temporary or emergency purposes to fund shareholder redemptions or for other short-term liquidity purposes. The Fund has agreed to pay commitment fees on its pro-rata portion of the line of credit, which amounted to $690 and is reflected in Miscellaneous expenses on the Statement of Operations. During the period, the Fund did not borrow on this line of credit.
7. Security Lending.
The Fund lends portfolio securities through a lending agent from time to time in order to earn additional income. For equity securities, a lending agent is used and may loan securities to certain qualified borrowers, including Fidelity Capital Markets (FCM), a broker-dealer affiliated with the Fund. On the settlement date of the loan, the Fund receives collateral (in the form of U.S. Treasury obligations, letters of credit and/or cash) against the loaned securities and maintains collateral in an amount not less than 100% of the market value of the loaned securities during the period of the loan. The market value of the loaned securities is determined at the close of business of the Fund and any additional required collateral is delivered to the Fund on the next business day. The Fund or borrower may terminate the loan at any time, and if the borrower defaults on its obligation to return the securities loaned because of insolvency or other reasons, the Fund may apply collateral received from the borrower against the obligation. The Fund may experience delays and costs in recovering the securities loaned. Any cash collateral received is invested in the Fidelity Securities Lending Cash Central Fund. The value of loaned securities and cash collateral at period end are disclosed on the Fund's Statement of Assets and Liabilities. At period end, there were no security loans outstanding with FCM. Security lending income represents the income earned on investing cash collateral, less rebates paid to borrowers and any lending agent fees associated with the loan, plus any premium payments received for lending certain types of securities. Security lending income is presented in the Statement of Operations as a component of income from Fidelity Central Funds. Total security lending income during the period amounted to $68,368, including $341 from securities loaned to FCM.
8. Expense Reductions.
Commissions paid to certain brokers with whom the investment adviser, or its affiliates, places trades on behalf of the Fund include an amount in addition to trade execution, which may be rebated back to the Fund to offset certain expenses. This amount totaled $18,080 for the period. In addition, through arrangements with the Fund's custodian, credits realized as a result of certain uninvested cash balances were used to reduce the Fund's expenses. During the period, these credits reduced the Fund's custody expenses by $16.
In addition, during the period the investment adviser reimbursed and/or waived a portion of fund-level operating expenses in the amount of $1,798.
9. Distributions to Shareholders.
Distributions to shareholders of each class were as follows:
| | Six months ended
April 30, 2017 | Year ended October 31, 2016 |
| From net investment income | | |
| Class A | $252,767 | $638,599 |
| Class M | 29,683 | 103,956 |
| Class B | – | 8,861 |
| Class C | 14,849 | 133,173 |
| Global Commodity Stock | 2,329,358 | 3,642,366 |
| Class I | 884,379 | 613,921 |
| Total | $3,511,036 | $5,140,876 |
| From net realized gain | | |
| Class A | $220,361 | $30,410 |
| Class M | 39,578 | 6,044 |
| Class B | – | 836 |
| Class C | 84,142 | 11,098 |
| Global Commodity Stock | 1,508,537 | 151,130 |
| Class I | 509,642 | 24,557 |
| Total | $2,362,260 | $224,075 |
10. Share Transactions.
Share transactions for each class were as follows and may contain automatic conversions between classes or exchanges between affiliated funds:
| | Shares | Shares | Dollars | Dollars |
| | Six months ended April 30, 2017 | Year ended October 31, 2016 | Six months ended April 30, 2017 | Year ended October 31, 2016 |
| Class A | | | | |
| Shares sold | 527,554 | 995,820 | $6,122,558 | $9,707,856 |
| Reinvestment of distributions | 39,394 | 70,559 | 455,002 | 655,495 |
| Shares redeemed | (1,111,518) | (948,589) | (12,952,144) | (9,072,163) |
| Net increase (decrease) | (544,570) | 117,790 | $(6,374,584) | $1,291,188 |
| Class M | | | | |
| Shares sold | 104,498 | 109,904 | $1,201,597 | $1,057,407 |
| Reinvestment of distributions | 5,865 | 11,521 | 67,801 | 107,030 |
| Shares redeemed | (81,654) | (187,357) | (935,110) | (1,802,838) |
| Net increase (decrease) | 28,709 | (65,932) | $334,288 | $(638,401) |
| Class B | | | | |
| Shares sold | – | 2,904 | $– | $29,587 |
| Reinvestment of distributions | – | 982 | – | 9,133 |
| Shares redeemed | – | (90,607) | – | (897,527) |
| Net increase (decrease) | – | (86,721) | $– | $(858,807) |
| Class C | | | | |
| Shares sold | 247,260 | 318,100 | $2,830,752 | $3,098,053 |
| Reinvestment of distributions | 8,150 | 14,787 | 93,566 | 136,635 |
| Shares redeemed | (179,775) | (280,508) | (2,055,431) | (2,667,860) |
| Net increase (decrease) | 75,635 | 52,379 | $868,887 | $566,828 |
| Global Commodity Stock | | | | |
| Shares sold | 5,384,437 | 11,244,608 | $62,248,308 | $110,744,052 |
| Reinvestment of distributions | 315,142 | 376,092 | 3,643,039 | 3,493,876 |
| Shares redeemed | (3,821,995) | (5,847,902) | (44,051,864) | (57,190,452) |
| Net increase (decrease) | 1,877,584 | 5,772,798 | $21,839,483 | $57,047,476 |
| Class I | | | | |
| Shares sold | 3,288,953 | 6,770,473 | $37,841,011 | $66,305,135 |
| Reinvestment of distributions | 58,242 | 60,388 | 672,698 | 560,405 |
| Shares redeemed | (1,047,537) | (2,783,838) | (12,161,149) | (27,173,673) |
| Net increase (decrease) | 2,299,658 | 4,047,023 | $26,352,560 | $39,691,867 |
11. Other.
The Fund's organizational documents provide former and current trustees and officers with a limited indemnification against liabilities arising in connection with the performance of their duties to the Fund. In the normal course of business, the Fund may also enter into contracts that provide general indemnifications. The Fund's maximum exposure under these arrangements is unknown as this would be dependent on future claims that may be made against the Fund. The risk of material loss from such claims is considered remote.
At the end of the period, the investment adviser or its affiliates were the owners of record of 20% of the total outstanding shares of the Fund.
Shareholder Expense Example
As a shareholder of the Fund, you incur two types of costs: (1) transaction costs, including sales charges (loads) on purchase payments or redemption proceeds, redemption fees and (2) ongoing costs, including management fees, distribution and/or service (12b-1) fees and other Fund expenses. This Example is intended to help you understand your ongoing costs (in dollars) of investing in the Fund and to compare these costs with the ongoing costs of investing in other mutual funds.
The Example is based on an investment of $1,000 invested at the beginning of the period and held for the entire period (November 1, 2016 to April 30, 2017).
Actual Expenses
The first line of the accompanying table for each class of the Fund provides information about actual account values and actual expenses. You may use the information in this line, together with the amount you invested, to estimate the expenses that you paid over the period. Simply divide your account value by $1,000.00 (for example, an $8,600 account value divided by $1,000.00 = 8.6), then multiply the result by the number in the first line for a class of the Fund under the heading entitled "Expenses Paid During Period" to estimate the expenses you paid on your account during this period. A small balance maintenance fee of $12.00 that is charged once a year may apply for certain accounts with a value of less than $2,000. This fee is not included in the table below. If it was, the estimate of expenses you paid during the period would be higher, and your ending account value lower, by this amount. In addition, the Fund, as a shareholder in the underlying Fidelity Central Funds, will indirectly bear its pro-rata share of the fees and expenses incurred by the underlying Fidelity Central Funds. These fees and expenses are not included in the Fund's annualized expense ratio used to calculate the expense estimate in the table below.
Hypothetical Example for Comparison Purposes
The second line of the accompanying table for each class of the Fund provides information about hypothetical account values and hypothetical expenses based on a Class' actual expense ratio and an assumed rate of return of 5% per year before expenses, which is not the Class' actual return. The hypothetical account values and expenses may not be used to estimate the actual ending account balance or expenses you paid for the period. You may use this information to compare the ongoing costs of investing in the Fund and other funds. To do so, compare this 5% hypothetical example with the 5% hypothetical examples that appear in the shareholder reports of the other funds. A small balance maintenance fee of $12.00 that is charged once a year may apply for certain accounts with a value of less than $2,000. This fee is not included in the table below. If it was, the estimate of expenses you paid during the period would be higher, and your ending account value lower, by this amount. In addition, the Fund, as a shareholder in the underlying Fidelity Central Funds, will indirectly bear its pro-rata share of the fees and expenses incurred by the underlying Fidelity Central Funds. These fees and expenses are not included in the Fund's annualized expense ratio used to calculate the expense estimate in the table below.
Please note that the expenses shown in the table are meant to highlight your ongoing costs only and do not reflect any transaction costs. Therefore, the second line of the table is useful in comparing ongoing costs only, and will not help you determine the relative total costs of owning different funds. In addition, if these transactional costs were included, your costs would have been higher.
| | Annualized Expense Ratio-A | Beginning
Account Value
November 1, 2016 | Ending
Account Value
April 30, 2017 | Expenses Paid
During Period-B
November 1, 2016
to April 30, 2017 |
| Class A | 1.35% | | | |
| Actual | | $1,000.00 | $1,078.70 | $6.96 |
| Hypothetical-C | | $1,000.00 | $1,018.10 | $6.76 |
| Class M | 1.64% | | | |
| Actual | | $1,000.00 | $1,076.30 | $8.44 |
| Hypothetical-C | | $1,000.00 | $1,016.66 | $8.20 |
| Class C | 2.10% | | | |
| Actual | | $1,000.00 | $1,074.40 | $10.80 |
| Hypothetical-C | | $1,000.00 | $1,014.38 | $10.49 |
| Global Commodity Stock | 1.12% | | | |
| Actual | | $1,000.00 | $1,079.00 | $5.77 |
| Hypothetical-C | | $1,000.00 | $1,019.24 | $5.61 |
| Class I | .98% | | | |
| Actual | | $1,000.00 | $1,080.30 | $5.05 |
| Hypothetical-C | | $1,000.00 | $1,019.93 | $4.91 |
A Annualized expense ratio reflects expenses net of applicable fee waivers.
B Expenses are equal to each Class' annualized expense ratio, multiplied by the average account value over the period, multiplied by 181/365 (to reflect the one-half year period).
C 5% return per year before expenses
Corporate Headquarters
245 Summer St.
Boston, MA 02210
www.fidelity.com
GCS-SANN-0617
1.879383.108
Fidelity Advisor® Latin America Fund -
Class A, Class M (formerly Class T), Class C and Class I
Semi-Annual Report April 30, 2017 Class A, Class M, Class C and Class I are classes of Fidelity® Latin America Fund |
|
Contents
To view a fund's proxy voting guidelines and proxy voting record for the 12-month period ended June 30, visit http://www.fidelity.com/proxyvotingresults or visit the Securities and Exchange Commission's (SEC) web site at http://www.sec.gov.
You may also call 1-877-208-0098 to request a free copy of the proxy voting guidelines.
Standard & Poor's, S&P and S&P 500 are registered service marks of The McGraw-Hill Companies, Inc. and have been licensed for use by Fidelity Distributors Corporation.
Other third-party marks appearing herein are the property of their respective owners.
All other marks appearing herein are registered or unregistered trademarks or service marks of FMR LLC or an affiliated company. © 2017 FMR LLC. All rights reserved.
This report and the financial statements contained herein are submitted for the general information of the shareholders of the Fund. This report is not authorized for distribution to prospective investors in the Fund unless preceded or accompanied by an effective prospectus.
A fund files its complete schedule of portfolio holdings with the SEC for the first and third quarters of each fiscal year on Form N-Q. Forms N-Q are available on the SEC’s web site at http://www.sec.gov. A fund's Forms N-Q may be reviewed and copied at the SEC’s Public Reference Room in Washington, DC. Information regarding the operation of the SEC's Public Reference Room may be obtained by calling 1-800-SEC-0330.
For a complete list of a fund's portfolio holdings, view the most recent holdings listing, semiannual report, or annual report on Fidelity's web site at http://www.fidelity.com, http://www.institutional.fidelity.com, or http://www.401k.com, as applicable.
NOT FDIC INSURED •MAY LOSE VALUE •NO BANK GUARANTEE
Neither the Fund nor Fidelity Distributors Corporation is a bank.
Investment Summary (Unaudited)
Geographic Diversification (% of fund's net assets)
| As of April 30, 2017 |
| | Brazil | 61.9% |
| | Mexico | 20.3% |
| | Bermuda | 4.6% |
| | Panama | 4.5% |
| | United States of America* | 2.8% |
| | United Kingdom | 1.8% |
| | Spain | 1.4% |
| | Chile | 0.9% |
| | Peru | 0.9% |
| | Other | 0.9% |

* Includes Short-Term investments and Net Other Assets (Liabilities).
Percentages are based on country or territory of incorporation and are adjusted for the effect of futures contracts, if applicable.
| As of October 31, 2016 |
| | Brazil | 57.9% |
| | Mexico | 22.8% |
| | Bermuda | 4.8% |
| | Panama | 4.0% |
| | United States of America* | 2.6% |
| | Argentina | 2.1% |
| | United Kingdom | 2.0% |
| | France | 1.5% |
| | Peru | 1.2% |
| | Other | 1.1% |

* Includes Short-Term investments and Net Other Assets (Liabilities).
Percentages are based on country or territory of incorporation and are adjusted for the effect of futures contracts, if applicable.
Asset Allocation as of April 30, 2017
| | % of fund's net assets | % of fund's net assets 6 months ago |
| Stocks | 98.6 | 99.1 |
| Short-Term Investments and Net Other Assets (Liabilities) | 1.4 | 0.9 |
Top Ten Stocks as of April 30, 2017
| | % of fund's net assets | % of fund's net assets 6 months ago |
| Itau Unibanco Holding SA (Brazil, Banks) | 10.4 | 10.2 |
| Itausa-Investimentos Itau SA (Brazil, Banks) | 7.4 | 4.5 |
| Petroleo Brasileiro SA - Petrobras (PN) (non-vtg.) (Brazil, Oil, Gas & Consumable Fuels) | 4.5 | 6.5 |
| Smiles SA (Brazil, Media) | 3.9 | 2.7 |
| Kroton Educacional SA (Brazil, Diversified Consumer Services) | 3.5 | 3.5 |
| Credicorp Ltd. (United States) (Bermuda, Banks) | 3.2 | 3.6 |
| Promotora y Operadora de Infraestructura S.A.B. de CV (Mexico, Transportation Infrastructure) | 3.0 | 2.3 |
| Compartamos S.A.B. de CV (Mexico, Consumer Finance) | 3.0 | 2.3 |
| Cielo SA (Brazil, IT Services) | 3.0 | 3.7 |
| Copa Holdings SA Class A (Panama, Airlines) | 3.0 | 2.5 |
| | 44.9 | |
Top Market Sectors as of April 30, 2017
| | % of fund's net assets | % of fund's net assets 6 months ago |
| Financials | 37.5 | 39.2 |
| Consumer Discretionary | 18.5 | 17.3 |
| Industrials | 12.8 | 9.4 |
| Health Care | 8.6 | 4.3 |
| Information Technology | 5.3 | 4.9 |
| Energy | 4.5 | 6.5 |
| Consumer Staples | 4.2 | 13.3 |
| Materials | 4.0 | 1.2 |
| Utilities | 2.0 | 1.9 |
| Real Estate | 1.2 | 1.1 |
Market Sectors may include more than one industry category.
The Fund may invest up to 35% of its total assets in any industry that represents more than 20% of the Latin American market. As of April 30, 2017, 24.1% of the Fund’s total assets were invested in the Diversified Banks industry, which accounts for more than 20% of the Latin American market.
Investments April 30, 2017 (Unaudited)
Showing Percentage of Net Assets
| Common Stocks - 73.1% | | | |
| | | Shares | Value |
| Bermuda - 4.6% | | | |
| Credicorp Ltd. (United States) | | 124,815 | $19,179,073 |
| PAX Global Technology Ltd. (a) | | 13,526,721 | 8,382,086 |
|
| TOTAL BERMUDA | | | 27,561,159 |
|
| Brazil - 36.4% | | | |
| Alliar Medicos a Frente SA | | 1,548,498 | 9,064,474 |
| BB Seguridade Participacoes SA | | 1,248,512 | 11,757,226 |
| Cielo SA | | 2,328,871 | 17,682,705 |
| CVC Brasil Operadora e Agencia de Viagens SA | | 1,090,057 | 10,632,525 |
| Equatorial Energia SA | | 664,993 | 12,044,690 |
| Estacio Participacoes SA | | 2,729,012 | 15,330,031 |
| FPC Par Corretora de Seguros | | 1,090,297 | 6,492,214 |
| Grendene SA | | 1,116,015 | 8,667,088 |
| Hypermarcas SA | | 974,128 | 9,225,528 |
| Instituto Hermes Pardini SA | | 1,136,000 | 8,056,382 |
| Itausa-Investimentos Itau SA (b) | | 237,116 | 735,840 |
| Itausa-Investimentos Itau SA (b) | | 9,329 | 27,128 |
| Kroton Educacional SA | | 4,457,759 | 20,996,360 |
| Localiza Rent A Car SA | | 708,038 | 10,551,251 |
| Multiplus SA | | 796,822 | 9,810,748 |
| Qualicorp SA | | 2,300,671 | 16,381,331 |
| Rumo SA (b) | | 3,395,059 | 9,337,870 |
| Ser Educacional SA | | 863,936 | 6,668,588 |
| Smiles SA | | 1,071,796 | 23,313,053 |
| Tegma Gestao Logistica SA | | 1,535,960 | 6,310,209 |
| Valid Solucoes SA | | 659,175 | 4,662,333 |
|
| TOTAL BRAZIL | | | 217,747,574 |
|
| Chile - 0.9% | | | |
| Vina San Pedro SA | | 574,573,084 | 5,595,890 |
| Luxembourg - 0.9% | | | |
| Globant SA (a)(b) | | 135,223 | 5,123,599 |
| Mexico - 20.3% | | | |
| Compartamos S.A.B. de CV | | 10,877,852 | 18,236,412 |
| Credito Real S.A.B. de CV | | 7,465,314 | 10,465,180 |
| Genomma Lab Internacional SA de CV (b) | | 7,383,634 | 9,315,218 |
| Gruma S.A.B. de CV Series B | | 649,535 | 8,673,463 |
| Grupo Aeroportuario Norte S.A.B. de CV | | 1,596,230 | 8,858,217 |
| Grupo Cementos de Chihuahua S.A.B. de CV | | 1,523,296 | 7,225,142 |
| Grupo GICSA SA de CV (b) | | 11,122,362 | 7,184,389 |
| Grupo Mexico SA de CV Series B | | 3,764,169 | 11,071,409 |
| Megacable Holdings S.A.B. de CV unit | | 1,478,496 | 5,610,749 |
| Promotora y Operadora de Infraestructura S.A.B. de CV | | 2,191,429 | 18,240,130 |
| Qualitas Controladora S.A.B. de CV | | 5,446,845 | 8,914,479 |
| Unifin Financiera SAPI de CV (b) | | 2,918,439 | 7,638,225 |
|
| TOTAL MEXICO | | | 121,433,013 |
|
| Panama - 4.5% | | | |
| Copa Holdings SA Class A | | 150,893 | 17,566,963 |
| Intergroup Financial Services Corp. | | 281,654 | 9,049,543 |
|
| TOTAL PANAMA | | | 26,616,506 |
|
| Peru - 0.9% | | | |
| Cementos Pacasmayo SAA | | 2,483,996 | 5,360,454 |
| Fossal SAA (b) | | 692,314 | 83,238 |
|
| TOTAL PERU | | | 5,443,692 |
|
| Spain - 1.4% | | | |
| Prosegur Cash SA | | 3,218,690 | 8,204,318 |
| United Kingdom - 1.8% | | | |
| British American Tobacco PLC (United Kingdom) | | 163,562 | 11,050,800 |
| United States of America - 1.4% | | | |
| First Cash Financial Services, Inc. | | 162,320 | 8,432,524 |
| TOTAL COMMON STOCKS | | | |
| (Cost $341,483,620) | | | 437,209,075 |
|
| Nonconvertible Preferred Stocks - 25.5% | | | |
| Brazil - 25.5% | | | |
| Alpargatas SA (PN) | | 2,412,389 | 10,108,465 |
| Banco ABC Brasil SA | | 1,694,072 | 9,510,992 |
| Itau Unibanco Holding SA | | 5,026,068 | 62,167,713 |
| Itausa-Investimentos Itau SA (PN) | | 14,093,474 | 43,913,756 |
| Petroleo Brasileiro SA - Petrobras (PN) (non-vtg.) (b) | | 6,099,786 | 26,847,091 |
| TOTAL NONCONVERTIBLE PREFERRED STOCKS | | | |
| (Cost $85,945,058) | | | 152,548,017 |
|
| Money Market Funds - 1.8% | | | |
| Fidelity Cash Central Fund, 0.85% (c) | | 6,453,054 | 6,454,344 |
| Fidelity Securities Lending Cash Central Fund 0.86% (c)(d) | | 4,303,897 | 4,304,328 |
| TOTAL MONEY MARKET FUNDS | | | |
| (Cost $10,758,776) | | | 10,758,672 |
| TOTAL INVESTMENT PORTFOLIO - 100.4% | | | |
| (Cost $438,187,454) | | | 600,515,764 |
| NET OTHER ASSETS (LIABILITIES) - (0.4)% | | | (2,231,777) |
| NET ASSETS - 100% | | | $598,283,987 |
Categorizations in the Schedule of Investments are based on country or territory of incorporation.
Legend
(a) Security or a portion of the security is on loan at period end.
(b) Non-income producing
(c) Affiliated fund that is generally available only to investment companies and other accounts managed by Fidelity Investments. The rate quoted is the annualized seven-day yield of the fund at period end. A complete unaudited listing of the fund's holdings as of its most recent quarter end is available upon request. In addition, each Fidelity Central Fund's financial statements are available on the SEC's website or upon request.
(d) Investment made with cash collateral received from securities on loan.
Affiliated Central Funds
Information regarding fiscal year to date income earned by the Fund from investments in Fidelity Central Funds is as follows:
| Fund | Income earned |
| Fidelity Cash Central Fund | $16,790 |
| Fidelity Securities Lending Cash Central Fund | 20,250 |
| Total | $37,040 |
Investment Valuation
The following is a summary of the inputs used, as of April 30, 2017, involving the Fund's assets and liabilities carried at fair value. The inputs or methodology used for valuing securities may not be an indication of the risk associated with investing in those securities. For more information on valuation inputs, and their aggregation into the levels used below, please refer to the Investment Valuation section in the accompanying Notes to Financial Statements.
| | Valuation Inputs at Reporting Date: |
| Description | Total | Level 1 | Level 2 | Level 3 |
| Investments in Securities: | | | | |
| Equities: | | | | |
| Consumer Discretionary | $111,137,607 | $111,137,607 | $-- | $-- |
| Consumer Staples | 25,320,153 | 14,269,353 | 11,050,800 | -- |
| Energy | 26,847,091 | 26,847,091 | -- | -- |
| Financials | 224,807,861 | 224,807,861 | -- | -- |
| Health Care | 52,042,933 | 52,042,933 | -- | -- |
| Industrials | 75,526,973 | 75,526,973 | -- | -- |
| Information Technology | 31,188,390 | 31,188,390 | -- | -- |
| Materials | 23,657,005 | 23,657,005 | -- | -- |
| Real Estate | 7,184,389 | 7,184,389 | -- | -- |
| Utilities | 12,044,690 | 12,044,690 | -- | -- |
| Money Market Funds | 10,758,672 | 10,758,672 | -- | -- |
| Total Investments in Securities: | $600,515,764 | $589,464,964 | $11,050,800 | $-- |
See accompanying notes which are an integral part of the financial statements.
Financial Statements
Statement of Assets and Liabilities
| | | April 30, 2017 (Unaudited) |
| Assets | | |
Investment in securities, at value (including securities loaned of $4,284,353) — See accompanying schedule:
Unaffiliated issuers (cost $427,428,678) | $589,757,092 | |
| Fidelity Central Funds (cost $10,758,776) | 10,758,672 | |
| Total Investments (cost $438,187,454) | | $600,515,764 |
| Cash | | 196,705 |
| Foreign currency held at value (cost $389) | | 13 |
| Receivable for investments sold | | 7,897,360 |
| Receivable for fund shares sold | | 479,580 |
| Dividends receivable | | 1,712,804 |
| Distributions receivable from Fidelity Central Funds | | 5,234 |
| Prepaid expenses | | 371 |
| Other receivables | | 1,766 |
| Total assets | | 610,809,597 |
| Liabilities | | |
| Payable for investments purchased | $6,152,719 | |
| Payable for fund shares redeemed | 1,468,780 | |
| Accrued management fee | 341,884 | |
| Distribution and service plan fees payable | 10,869 | |
| Other affiliated payables | 153,509 | |
| Other payables and accrued expenses | 93,777 | |
| Collateral on securities loaned | 4,304,072 | |
| Total liabilities | | 12,525,610 |
| Net Assets | | $598,283,987 |
| Net Assets consist of: | | |
| Paid in capital | | $604,505,233 |
| Undistributed net investment income | | 5,006,182 |
| Accumulated undistributed net realized gain (loss) on investments and foreign currency transactions | | (173,551,488) |
| Net unrealized appreciation (depreciation) on investments and assets and liabilities in foreign currencies | | 162,324,060 |
| Net Assets | | $598,283,987 |
| Calculation of Maximum Offering Price | | |
| Class A: | | |
| Net Asset Value and redemption price per share ($18,596,574 ÷ 824,924 shares) | | $22.54 |
| Maximum offering price per share (100/94.25 of $22.54) | | $23.92 |
| Class M: | | |
| Net Asset Value and redemption price per share ($6,695,424 ÷ 296,256 shares) | | $22.60 |
| Maximum offering price per share (100/96.50 of $22.60) | | $23.42 |
| Class C: | | |
| Net Asset Value and offering price per share ($5,269,599 ÷ 231,104 shares)(a) | | $22.80 |
| Latin America: | | |
| Net Asset Value, offering price and redemption price per share ($561,901,210 ÷ 24,998,212 shares) | | $22.48 |
| Class I: | | |
| Net Asset Value, offering price and redemption price per share ($5,821,180 ÷ 259,230 shares) | | $22.46 |
(a) Redemption price per share is equal to net asset value less any applicable contingent deferred sales charge.
See accompanying notes which are an integral part of the financial statements.
Statement of Operations
| | | Six months ended April 30, 2017 (Unaudited) |
| Investment Income | | |
| Dividends | | $13,946,609 |
| Income from Fidelity Central Funds | | 37,040 |
| Income before foreign taxes withheld | | 13,983,649 |
| Less foreign taxes withheld | | (820,047) |
| Total income | | 13,163,602 |
| Expenses | | |
| Management fee | $1,938,286 | |
| Transfer agent fees | 772,148 | |
| Distribution and service plan fees | 64,150 | |
| Accounting and security lending fees | 141,404 | |
| Custodian fees and expenses | 166,712 | |
| Independent trustees' fees and expenses | 1,173 | |
| Registration fees | 46,851 | |
| Audit | 41,185 | |
| Legal | 1,218 | |
| Miscellaneous | 2,215 | |
| Total expenses before reductions | 3,175,342 | |
| Expense reductions | (4,437) | 3,170,905 |
| Net investment income (loss) | | 9,992,697 |
| Realized and Unrealized Gain (Loss) | | |
| Net realized gain (loss) on: | | |
| Investment securities: | | |
| Unaffiliated issuers | 2,206,133 | |
| Fidelity Central Funds | 1,997 | |
| Foreign currency transactions | (348,520) | |
| Total net realized gain (loss) | | 1,859,610 |
Change in net unrealized appreciation (depreciation) on:
Investment securities | (2,432,087) | |
| Assets and liabilities in foreign currencies | (22,396) | |
| Total change in net unrealized appreciation (depreciation) | | (2,454,483) |
| Net gain (loss) | | (594,873) |
| Net increase (decrease) in net assets resulting from operations | | $9,397,824 |
See accompanying notes which are an integral part of the financial statements.
Statement of Changes in Net Assets
| | Six months ended April 30, 2017 (Unaudited) | Year ended October 31, 2016 |
| Increase (Decrease) in Net Assets | | |
| Operations | | |
| Net investment income (loss) | $9,992,697 | $12,329,425 |
| Net realized gain (loss) | 1,859,610 | (87,982,612) |
| Change in net unrealized appreciation (depreciation) | (2,454,483) | 203,562,799 |
| Net increase (decrease) in net assets resulting from operations | 9,397,824 | 127,909,612 |
| Distributions to shareholders from net investment income | (12,696,990) | (10,264,003) |
| Share transactions - net increase (decrease) | (31,997,140) | 5,109,952 |
| Redemption fees | 158,926 | 103,536 |
| Total increase (decrease) in net assets | (35,137,380) | 122,859,097 |
| Net Assets | | |
| Beginning of period | 633,421,367 | 510,562,270 |
| End of period | $598,283,987 | $633,421,367 |
| Other Information | | |
| Undistributed net investment income end of period | $5,006,182 | $7,710,475 |
See accompanying notes which are an integral part of the financial statements.
Financial Highlights — Fidelity Latin America Fund Class A
| | Six months ended (Unaudited) April 30, | Years ended October 31, | | | | |
| | 2017 | 2016 | 2015 | 2014 | 2013 | 2012 |
| Selected Per–Share Data | | | | | | |
| Net asset value, beginning of period | $22.45 | $18.09 | $30.31 | $40.71 | $48.95 | $52.38 |
| Income from Investment Operations | | | | | | |
| Net investment income (loss)A | .35 | .40 | .28 | .49 | .72 | .92 |
| Net realized and unrealized gain (loss) | .16B | 4.27 | (10.11) | (4.08) | (4.73) | (3.66) |
| Total from investment operations | .51 | 4.67 | (9.83) | (3.59) | (4.01) | (2.74) |
| Distributions from net investment income | (.43) | (.31) | (.31) | (.57) | (.79) | (.70) |
| Distributions from net realized gain | – | – | (2.08) | (6.25) | (3.45) | – |
| Total distributions | (.43) | (.31) | (2.39) | (6.82) | (4.24) | (.70) |
| Redemption fees added to paid in capitalA | .01 | –C | –C | .01 | .01 | .01 |
| Net asset value, end of period | $22.54 | $22.45 | $18.09 | $30.31 | $40.71 | $48.95 |
| Total ReturnD,E,F | 2.66% | 26.29% | (34.60)% | (9.06)% | (8.93)% | (5.23)% |
| Ratios to Average Net AssetsG,H | | | | | | |
| Expenses before reductions | 1.39%I | 1.40% | 1.40% | 1.38% | 1.37% | 1.35% |
| Expenses net of fee waivers, if any | 1.39%I | 1.40% | 1.40% | 1.38% | 1.37% | 1.35% |
| Expenses net of all reductions | 1.39%I | 1.39% | 1.39% | 1.38% | 1.35% | 1.35% |
| Net investment income (loss) | 3.34%I | 2.14% | 1.26% | 1.52% | 1.66% | 1.80% |
| Supplemental Data | | | | | | |
| Net assets, end of period (000 omitted) | $18,597 | $19,115 | $16,424 | $34,898 | $48,464 | $69,654 |
| Portfolio turnover rateJ | 58%I | 108% | 30% | 30% | 23% | 23% |
A Calculated based on average shares outstanding during the period.
B The amount shown for a share outstanding does not correspond with the aggregate net gain (loss) on investments for the period due to the timing of sales and repurchases of shares in relation to fluctuating market values of the investments of the Fund.
C Amount represents less than $.005 per share.
D Total returns for periods of less than one year are not annualized.
E Total returns would have been lower if certain expenses had not been reduced during the applicable periods shown.
F Total returns do not include the effect of the sales charges.
G Fees and expenses of any underlying Fidelity Central Funds are not included in the Fund's expense ratio. The Fund indirectly bears its proportionate share of the expenses of any underlying Fidelity Central Funds.
H Expense ratios reflect operating expenses of the class. Expenses before reductions do not reflect amounts reimbursed by the investment adviser or reductions from brokerage service arrangements or reductions from other expense offset arrangements and do not represent the amount paid by the class during periods when reimbursements or reductions occur. Expenses net of fee waivers reflect expenses after reimbursement by the investment adviser but prior to reductions from brokerage service arrangements or other expense offset arrangements. Expenses net of all reductions represent the net expenses paid by the class.
I Annualized
J Amount does not include the portfolio activity of any underlying Fidelity Central Funds.
See accompanying notes which are an integral part of the financial statements.
Financial Highlights — Fidelity Latin America Fund Class M
| | Six months ended (Unaudited) April 30, | Years ended October 31, | | | | |
| | 2017 | 2016 | 2015 | 2014 | 2013 | 2012 |
| Selected Per–Share Data | | | | | | |
| Net asset value, beginning of period | $22.47 | $18.11 | $30.33 | $40.68 | $48.88 | $52.27 |
| Income from Investment Operations | | | | | | |
| Net investment income (loss)A | .32 | .35 | .22 | .40 | .61 | .78 |
| Net realized and unrealized gain (loss) | .17B | 4.27 | (10.13) | (4.08) | (4.74) | (3.65) |
| Total from investment operations | .49 | 4.62 | (9.91) | (3.68) | (4.13) | (2.87) |
| Distributions from net investment income | (.37) | (.26) | (.23) | (.43) | (.63) | (.53) |
| Distributions from net realized gain | – | – | (2.08) | (6.25) | (3.45) | – |
| Total distributions | (.37) | (.26) | (2.31) | (6.68) | (4.08) | (.53) |
| Redemption fees added to paid in capitalA | .01 | –C | –C | .01 | .01 | .01 |
| Net asset value, end of period | $22.60 | $22.47 | $18.11 | $30.33 | $40.68 | $48.88 |
| Total ReturnD,E,F | 2.53% | 25.93% | (34.78)% | (9.30)% | (9.17)% | (5.49)% |
| Ratios to Average Net AssetsG,H | | | | | | |
| Expenses before reductions | 1.68%I | 1.68% | 1.67% | 1.65% | 1.63% | 1.61% |
| Expenses net of fee waivers, if any | 1.67%I | 1.68% | 1.67% | 1.65% | 1.63% | 1.61% |
| Expenses net of all reductions | 1.67%I | 1.68% | 1.66% | 1.65% | 1.61% | 1.61% |
| Net investment income (loss) | 3.06%I | 1.86% | .99% | 1.25% | 1.40% | 1.54% |
| Supplemental Data | | | | | | |
| Net assets, end of period (000 omitted) | $6,695 | $7,378 | $5,284 | $9,761 | $12,705 | $19,334 |
| Portfolio turnover rateJ | 58%I | 108% | 30% | 30% | 23% | 23% |
A Calculated based on average shares outstanding during the period.
B The amount shown for a share outstanding does not correspond with the aggregate net gain (loss) on investments for the period due to the timing of sales and repurchases of shares in relation to fluctuating market values of the investments of the Fund.
C Amount represents less than $.005 per share.
D Total returns for periods of less than one year are not annualized.
E Total returns would have been lower if certain expenses had not been reduced during the applicable periods shown.
F Total returns do not include the effect of the sales charges.
G Fees and expenses of any underlying Fidelity Central Funds are not included in the Fund's expense ratio. The Fund indirectly bears its proportionate share of the expenses of any underlying Fidelity Central Funds.
H Expense ratios reflect operating expenses of the class. Expenses before reductions do not reflect amounts reimbursed by the investment adviser or reductions from brokerage service arrangements or reductions from other expense offset arrangements and do not represent the amount paid by the class during periods when reimbursements or reductions occur. Expenses net of fee waivers reflect expenses after reimbursement by the investment adviser but prior to reductions from brokerage service arrangements or other expense offset arrangements. Expenses net of all reductions represent the net expenses paid by the class.
I Annualized
J Amount does not include the portfolio activity of any underlying Fidelity Central Funds.
See accompanying notes which are an integral part of the financial statements.
Financial Highlights — Fidelity Latin America Fund Class C
| | Six months ended (Unaudited) April 30, | Years ended October 31, | | | | |
| | 2017 | 2016 | 2015 | 2014 | 2013 | 2012 |
| Selected Per–Share Data | | | | | | |
| Net asset value, beginning of period | $22.61 | $18.18 | $30.37 | $40.59 | $48.73 | $52.05 |
| Income from Investment Operations | | | | | | |
| Net investment income (loss)A | .27 | .26 | .11 | .25 | .40 | .54 |
| Net realized and unrealized gain (loss) | .19B | 4.30 | (10.17) | (4.07) | (4.74) | (3.64) |
| Total from investment operations | .46 | 4.56 | (10.06) | (3.82) | (4.34) | (3.10) |
| Distributions from net investment income | (.28) | (.13) | (.05) | (.16) | (.36) | (.23) |
| Distributions from net realized gain | – | – | (2.08) | (6.25) | (3.45) | – |
| Total distributions | (.28) | (.13) | (2.13) | (6.41) | (3.81) | (.23) |
| Redemption fees added to paid in capitalA | .01 | –C | –C | .01 | .01 | .01 |
| Net asset value, end of period | $22.80 | $22.61 | $18.18 | $30.37 | $40.59 | $48.73 |
| Total ReturnD,E,F | 2.30% | 25.31% | (35.08)% | (9.74)% | (9.62)% | (5.94)% |
| Ratios to Average Net AssetsG,H | | | | | | |
| Expenses before reductions | 2.15%I | 2.15% | 2.15% | 2.13% | 2.12% | 2.10% |
| Expenses net of fee waivers, if any | 2.15%I | 2.14% | 2.15% | 2.13% | 2.12% | 2.10% |
| Expenses net of all reductions | 2.15%I | 2.14% | 2.15% | 2.13% | 2.10% | 2.10% |
| Net investment income (loss) | 2.59%I | 1.39% | .51% | .77% | .91% | 1.06% |
| Supplemental Data | | | | | | |
| Net assets, end of period (000 omitted) | $5,270 | $6,590 | $5,394 | $11,349 | $15,185 | $27,405 |
| Portfolio turnover rateJ | 58%I | 108% | 30% | 30% | 23% | 23% |
A Calculated based on average shares outstanding during the period.
B The amount shown for a share outstanding does not correspond with the aggregate net gain (loss) on investments for the period due to the timing of sales and repurchases of shares in relation to fluctuating market values of the investments of the Fund.
C Amount represents less than $.005 per share.
D Total returns for periods of less than one year are not annualized.
E Total returns would have been lower if certain expenses had not been reduced during the applicable periods shown.
F Total returns do not include the effect of the contingent deferred sales charge.
G Fees and expenses of any underlying Fidelity Central Funds are not included in the Fund's expense ratio. The Fund indirectly bears its proportionate share of the expenses of any underlying Fidelity Central Funds.
H Expense ratios reflect operating expenses of the class. Expenses before reductions do not reflect amounts reimbursed by the investment adviser or reductions from brokerage service arrangements or reductions from other expense offset arrangements and do not represent the amount paid by the class during periods when reimbursements or reductions occur. Expenses net of fee waivers reflect expenses after reimbursement by the investment adviser but prior to reductions from brokerage service arrangements or other expense offset arrangements. Expenses net of all reductions represent the net expenses paid by the class.
I Annualized
J Amount does not include the portfolio activity of any underlying Fidelity Central Funds.
See accompanying notes which are an integral part of the financial statements.
Financial Highlights — Fidelity Latin America Fund
| | Six months ended (Unaudited) April 30, | Years ended October 31, | | | | |
| | 2017 | 2016 | 2015 | 2014 | 2013 | 2012 |
| Selected Per–Share Data | | | | | | |
| Net asset value, beginning of period | $22.41 | $18.08 | $30.34 | $40.80 | $49.09 | $52.48 |
| Income from Investment Operations | | | | | | |
| Net investment income (loss)A | .37 | .45 | .34 | .59 | .87 | 1.09 |
| Net realized and unrealized gain (loss) | .17B | 4.26 | (10.11) | (4.10) | (4.74) | (3.67) |
| Total from investment operations | .54 | 4.71 | (9.77) | (3.51) | (3.87) | (2.58) |
| Distributions from net investment income | (.48) | (.38) | (.41) | (.71) | (.98) | (.82) |
| Distributions from net realized gain | – | – | (2.08) | (6.25) | (3.45) | – |
| Total distributions | (.48) | (.38) | (2.49) | (6.96) | (4.43) | (.82) |
| Redemption fees added to paid in capitalA | .01 | –C | –C | .01 | .01 | .01 |
| Net asset value, end of period | $22.48 | $22.41 | $18.08 | $30.34 | $40.80 | $49.09 |
| Total ReturnD,E | 2.84% | 26.65% | (34.45)% | (8.79)% | (8.63)% | (4.91)% |
| Ratios to Average Net AssetsF,G | | | | | | |
| Expenses before reductions | 1.12%H | 1.14% | 1.13% | 1.08% | 1.04% | 1.02% |
| Expenses net of fee waivers, if any | 1.12%H | 1.14% | 1.12% | 1.08% | 1.04% | 1.02% |
| Expenses net of all reductions | 1.12%H | 1.13% | 1.12% | 1.07% | 1.03% | 1.02% |
| Net investment income (loss) | 3.62%H | 2.40% | 1.53% | 1.83% | 1.99% | 2.14% |
| Supplemental Data | | | | | | |
| Net assets, end of period (000 omitted) | $561,901 | $596,514 | $481,005 | $933,298 | $1,324,748 | $2,274,601 |
| Portfolio turnover rateI | 58%H | 108% | 30% | 30% | 23% | 23% |
A Calculated based on average shares outstanding during the period.
B The amount shown for a share outstanding does not correspond with the aggregate net gain (loss) on investments for the period due to the timing of sales and repurchases of shares in relation to fluctuating market values of the investments of the Fund.
C Amount represents less than $.005 per share.
D Total returns for periods of less than one year are not annualized.
E Total returns would have been lower if certain expenses had not been reduced during the applicable periods shown.
F Fees and expenses of any underlying Fidelity Central Funds are not included in the Fund's expense ratio. The Fund indirectly bears its proportionate share of the expenses of any underlying Fidelity Central Funds.
G Expense ratios reflect operating expenses of the class. Expenses before reductions do not reflect amounts reimbursed by the investment adviser or reductions from brokerage service arrangements or reductions from other expense offset arrangements and do not represent the amount paid by the class during periods when reimbursements or reductions occur. Expenses net of fee waivers reflect expenses after reimbursement by the investment adviser but prior to reductions from brokerage service arrangements or other expense offset arrangements. Expenses net of all reductions represent the net expenses paid by the class.
H Annualized
I Amount does not include the portfolio activity of any underlying Fidelity Central Funds.
See accompanying notes which are an integral part of the financial statements.
Financial Highlights — Fidelity Latin America Fund Class I
| | Six months ended (Unaudited) April 30, | Years ended October 31, | | | | |
| | 2017 | 2016 | 2015 | 2014 | 2013 | 2012 |
| Selected Per–Share Data | | | | | | |
| Net asset value, beginning of period | $22.40 | $18.08 | $30.35 | $40.79 | $49.07 | $52.51 |
| Income from Investment Operations | | | | | | |
| Net investment income (loss)A | .38 | .46 | .36 | .60 | .87 | 1.08 |
| Net realized and unrealized gain (loss) | .16B | 4.26 | (10.13) | (4.07) | (4.74) | (3.67) |
| Total from investment operations | .54 | 4.72 | (9.77) | (3.47) | (3.87) | (2.59) |
| Distributions from net investment income | (.49) | (.40) | (.42) | (.73) | (.97) | (.86) |
| Distributions from net realized gain | – | – | (2.08) | (6.25) | (3.45) | – |
| Total distributions | (.49) | (.40) | (2.50) | (6.98) | (4.42) | (.86) |
| Redemption fees added to paid in capitalA | .01 | –C | –C | .01 | .01 | .01 |
| Net asset value, end of period | $22.46 | $22.40 | $18.08 | $30.35 | $40.79 | $49.07 |
| Total ReturnD,E | 2.86% | 26.77% | (34.42)% | (8.69)% | (8.63)% | (4.93)% |
| Ratios to Average Net AssetsF,G | | | | | | |
| Expenses before reductions | 1.03%H | 1.07% | 1.06% | 1.04% | 1.03% | 1.04% |
| Expenses net of fee waivers, if any | 1.03%H | 1.07% | 1.06% | 1.04% | 1.03% | 1.04% |
| Expenses net of all reductions | 1.03%H | 1.06% | 1.05% | 1.04% | 1.01% | 1.04% |
| Net investment income (loss) | 3.70%H | 2.47% | 1.60% | 1.86% | 2.00% | 2.12% |
| Supplemental Data | | | | | | |
| Net assets, end of period (000 omitted) | $5,821 | $3,825 | $1,828 | $4,531 | $5,131 | $7,928 |
| Portfolio turnover rateI | 58%H | 108% | 30% | 30% | 23% | 23% |
A Calculated based on average shares outstanding during the period.
B The amount shown for a share outstanding does not correspond with the aggregate net gain (loss) on investments for the period due to the timing of sales and repurchases of shares in relation to fluctuating market values of the investments of the Fund.
C Amount represents less than $.005 per share.
D Total returns for periods of less than one year are not annualized.
E Total returns would have been lower if certain expenses had not been reduced during the applicable periods shown.
F Fees and expenses of any underlying Fidelity Central Funds are not included in the Fund's expense ratio. The Fund indirectly bears its proportionate share of the expenses of any underlying Fidelity Central Funds.
G Expense ratios reflect operating expenses of the class. Expenses before reductions do not reflect amounts reimbursed by the investment adviser or reductions from brokerage service arrangements or reductions from other expense offset arrangements and do not represent the amount paid by the class during periods when reimbursements or reductions occur. Expenses net of fee waivers reflect expenses after reimbursement by the investment adviser but prior to reductions from brokerage service arrangements or other expense offset arrangements. Expenses net of all reductions represent the net expenses paid by the class.
H Annualized
I Amount does not include the portfolio activity of any underlying Fidelity Central Funds.
See accompanying notes which are an integral part of the financial statements.
Notes to Financial Statements (Unaudited)
For the period ended April 30, 2017
1. Organization.
Fidelity Latin America Fund (the Fund) is a non-diversified fund of Fidelity Investment Trust (the Trust) and is authorized to issue an unlimited number of shares. The Trust is registered under the Investment Company Act of 1940, as amended (the 1940 Act), as an open-end management investment company organized as a Massachusetts business trust. The Fund offers Class A, Class M (formerly Class T), Class C, Latin America and Class I shares, each of which has equal rights as to assets and voting privileges. Each class has exclusive voting rights with respect to matters that affect that class. The Fund's investments in emerging markets can be subject to social, economic, regulatory, and political uncertainties and can be extremely volatile.
After the close of business on June 24, 2016, all outstanding Class B shares were converted to Class A shares. All prior fiscal period dollar and share amounts for Class B presented in the Notes to Financial Statements are for the period November 1, 2015 through June 24, 2016.
2. Investments in Fidelity Central Funds.
The Fund invests in Fidelity Central Funds, which are open-end investment companies generally available only to other investment companies and accounts managed by the investment adviser and its affiliates. The Fund's Schedule of Investments lists each of the Fidelity Central Funds held as of period end, if any, as an investment of the Fund, but does not include the underlying holdings of each Fidelity Central Fund. As an Investing Fund, the Fund indirectly bears its proportionate share of the expenses of the underlying Fidelity Central Funds.
The Money Market Central Funds seek preservation of capital and current income and are managed by Fidelity Investments Money Management, Inc. (FIMM), an affiliate of the investment adviser. Annualized expenses of the Money Market Central Funds as of their most recent shareholder report date are less than .005%.
A complete unaudited list of holdings for each Fidelity Central Fund is available upon request or at the Securities and Exchange Commission (the SEC) website at www.sec.gov. In addition, the financial statements of the Fidelity Central Funds are available on the SEC website or upon request.
3. Significant Accounting Policies.
The Fund is an investment company and applies the accounting and reporting guidance of the Financial Accounting Standards Board (FASB) Accounting Standards Codification Topic 946 Financial Services – Investments Companies. The financial statements have been prepared in conformity with accounting principles generally accepted in the United States of America (GAAP), which require management to make certain estimates and assumptions at the date of the financial statements. Actual results could differ from those estimates. Subsequent events, if any, through the date that the financial statements were issued have been evaluated in the preparation of the financial statements. The following summarizes the significant accounting policies of the Fund:
Investment Valuation. Investments are valued as of 4:00 p.m. Eastern time on the last calendar day of the period. The Board of Trustees (the Board) has delegated the day to day responsibility for the valuation of the Fund's investments to the Fair Value Committee (the Committee) established by the Fund's investment adviser. In accordance with valuation policies and procedures approved by the Board, the Fund attempts to obtain prices from one or more third party pricing vendors or brokers to value its investments. When current market prices, quotations or currency exchange rates are not readily available or reliable, investments will be fair valued in good faith by the Committee, in accordance with procedures adopted by the Board. Factors used in determining fair value vary by investment type and may include market or investment specific events. The frequency with which these procedures are used cannot be predicted and they may be utilized to a significant extent. The Committee oversees the Fund's valuation policies and procedures and reports to the Board on the Committee's activities and fair value determinations. The Board monitors the appropriateness of the procedures used in valuing the Fund's investments and ratifies the fair value determinations of the Committee.
The Fund categorizes the inputs to valuation techniques used to value its investments into a disclosure hierarchy consisting of three levels as shown below:
- Level 1 – quoted prices in active markets for identical investments
- Level 2 – other significant observable inputs (including quoted prices for similar investments, interest rates, prepayment speeds, etc.)
- Level 3 – unobservable inputs (including the Fund's own assumptions based on the best information available)
Valuation techniques used to value the Fund's investments by major category are as follows:
Equity securities, including restricted securities, for which market quotations are readily available, are valued at the last reported sale price or official closing price as reported by a third party pricing vendor on the primary market or exchange on which they are traded and are categorized as Level 1 in the hierarchy. In the event there were no sales during the day or closing prices are not available, securities are valued at the last quoted bid price or may be valued using the last available price and are generally categorized as Level 2 in the hierarchy. For foreign equity securities, when market or security specific events arise, comparisons to the valuation of American Depositary Receipts (ADRs), futures contracts, Exchange-Traded Funds (ETFs) and certain indexes as well as quoted prices for similar securities may be used and would be categorized as Level 2 in the hierarchy. Utilizing these techniques may result in transfers between Level 1 and Level 2. For equity securities, including restricted securities, where observable inputs are limited, assumptions about market activity and risk are used and these securities may be categorized as Level 3 in the hierarchy.
Investments in open-end mutual funds, including the Fidelity Central Funds, are valued at their closing net asset value (NAV) each business day and are categorized as Level 1 in the hierarchy.
Changes in valuation techniques may result in transfers in or out of an assigned level within the disclosure hierarchy. The aggregate value of investments by input level as of April 30, 2017 is included at the end of the Fund's Schedule of Investments.
Foreign Currency. The Fund may use foreign currency contracts to facilitate transactions in foreign-denominated securities. Gains and losses from these transactions may arise from changes in the value of the foreign currency or if the counterparties do not perform under the contracts' terms.
Foreign-denominated assets, including investment securities, and liabilities are translated into U.S. dollars at the exchange rates at period end. Purchases and sales of investment securities, income and dividends received and expenses denominated in foreign currencies are translated into U.S. dollars at the exchange rate in effect on the transaction date.
The effects of exchange rate fluctuations on investments are included with the net realized and unrealized gain (loss) on investment securities. Other foreign currency transactions resulting in realized and unrealized gain (loss) are disclosed separately.
Investment Transactions and Income. For financial reporting purposes, the Fund's investment holdings and NAV include trades executed through the end of the last business day of the period. The NAV per share for processing shareholder transactions is calculated as of the close of business of the New York Stock Exchange (NYSE), normally 4:00 p.m. Eastern time and includes trades executed through the end of the prior business day. Gains and losses on securities sold are determined on the basis of identified cost. Dividend income is recorded on the ex-dividend date, except for certain dividends from foreign securities where the ex-dividend date may have passed, which are recorded as soon as the Fund is informed of the ex-dividend date. Non-cash dividends included in dividend income, if any, are recorded at the fair market value of the securities received. Income and capital gain distributions from Fidelity Central Funds, if any, are recorded on the ex-dividend date. Certain distributions received by the Fund represent a return of capital or capital gain. The Fund determines the components of these distributions subsequent to the ex-dividend date, based upon receipt of tax filings or other correspondence relating to the underlying investment. These distributions are recorded as a reduction of cost of investments and/or as a realized gain. Investment income is recorded net of foreign taxes withheld where recovery of such taxes is uncertain.
Class Allocations and Expenses. Investment income, realized and unrealized capital gains and losses, common expenses of the Fund, and certain fund-level expense reductions, if any, are allocated daily on a pro-rata basis to each class based on the relative net assets of each class to the total net assets of the Fund. Each class differs with respect to transfer agent and distribution and service plan fees incurred. Certain expense reductions may also differ by class. For the reporting period, the allocated portion of income and expenses to each class as a percent of its average net assets may vary due to the timing of recording these transactions in relation to fluctuating net assets of the classes. Expenses directly attributable to a fund are charged to that fund. Expenses attributable to more than one fund are allocated among the respective funds on the basis of relative net assets or other appropriate methods. Expense estimates are accrued in the period to which they relate and adjustments are made when actual amounts are known.
Income Tax Information and Distributions to Shareholders. Each year, the Fund intends to qualify as a regulated investment company under Subchapter M of the Internal Revenue Code, including distributing substantially all of its taxable income and realized gains. As a result, no provision for U.S. Federal income taxes is required. The Fund files a U.S. federal tax return, in addition to state and local tax returns as required. The Fund's federal income tax returns are subject to examination by the Internal Revenue Service (IRS) for a period of three fiscal years after they are filed. State and local tax returns may be subject to examination for an additional fiscal year depending on the jurisdiction. Foreign taxes are provided for based on the Fund's understanding of the tax rules and rates that exist in the foreign markets in which it invests.
Distributions are declared and recorded on the ex-dividend date. Income dividends and capital gain distributions are declared separately for each class. Income and capital gain distributions are determined in accordance with income tax regulations, which may differ from GAAP.
Capital accounts within the financial statements are adjusted for permanent book-tax differences. These adjustments have no impact on net assets or the results of operations. Capital accounts are not adjusted for temporary book-tax differences which will reverse in a subsequent period.
Book-tax differences are primarily due to foreign currency transactions, capital loss carryforwards, deferred trustees compensation, and losses deferred due to wash sales.
The federal tax cost of investment securities and unrealized appreciation (depreciation) as of period end were as follows:
| Gross unrealized appreciation | $182,413,344 |
| Gross unrealized depreciation | (21,751,895) |
| Net unrealized appreciation (depreciation) on securities | $160,661,449 |
| Tax cost | $439,854,315 |
Capital loss carryforwards are only available to offset future capital gains of the Fund to the extent provided by regulations and may be limited. Under the Regulated Investment Company Modernization Act of 2010 (the Act), the Fund is permitted to carry forward capital losses incurred in taxable years beginning after December 22, 2010 for an unlimited period and such capital losses are required to be used prior to any losses that expire. The capital loss carryforward information presented below, including any applicable limitation, is estimated as of prior fiscal period end and is subject to adjustment.
| No expiration | |
| Short-term | $(44,509,664) |
| Long-term | (127,757,231) |
| Total capital loss carryforward | $(172,266,895) |
Short-Term Trading (Redemption) Fees. Shares held by investors in the Fund less than 90 days may have been subject to a redemption fee equal to 1.50% of the NAV of shares redeemed. All redemption fees, which reduce the proceeds of the shareholder redemption, are retained by the Fund and accounted for as an addition to paid in capital.
4. Purchases and Sales of Investments.
Purchases and sales of securities, other than short-term securities, aggregated $163,148,370 and $200,918,744, respectively.
5. Fees and Other Transactions with Affiliates.
Management Fee. Fidelity Management & Research Company (the investment adviser) and its affiliates provide the Fund with investment management related services for which the Fund pays a monthly management fee. The management fee is the sum of an individual fund fee rate that is based on an annual rate of .45% of the Fund's average net assets and an annualized group fee rate that averaged .25% during the period. The group fee rate is based upon the average net assets of all the mutual funds advised by the investment adviser, including any mutual funds previously advised by the investment adviser that are currently advised by Fidelity SelectCo, LLC, an affiliate of the investment adviser. The group fee rate decreases as assets under management increase and increases as assets under management decrease. For the reporting period, the total annualized management fee rate was .70% of the Fund's average net assets.
Distribution and Service Plan Fees. In accordance with Rule 12b-1 of the 1940 Act, the Fund has adopted separate Distribution and Service Plans for each class of shares. Certain classes pay Fidelity Distributors Corporation (FDC), an affiliate of the investment adviser, separate Distribution and Service Fees, each of which is based on an annual percentage of each class' average net assets. In addition, FDC may pay financial intermediaries for selling shares of the Fund and providing shareholder support services. For the period, the Distribution and Service Fee rates, total fees and amounts retained by FDC were as follows:
| | Distribution
Fee | Service
Fee | Total Fees | Retained
by FDC |
| Class A | -% | .25% | $21,659 | $– |
| Class M | .25% | .25% | 15,682 | – |
| Class C | .75% | .25% | 26,809 | 1,647 |
| | | | $64,150 | $1,647 |
Sales Load. FDC may receive a front-end sales charge of up to 5.75% for selling Class A shares and 3.50% for selling Class M shares, some of which is paid to financial intermediaries for selling shares of the Fund. Depending on the holding period, FDC may receive contingent deferred sales charges levied on Class A, Class M, and Class C redemptions. The deferred sales charges are 1.00% for Class C shares, 1.00% for certain purchases of Class A shares and .25% for certain purchases of Class M shares.
For the period, sales charge amounts retained by FDC were as follows:
| | Retained
by FDC |
| Class A | $3,016 |
| Class M | 576 |
| Class C(a) | 445 |
| | $4,037 |
(a) When Class C shares are initially sold, FDC pays commissions from its own resources to financial intermediaries through which the sales are made.
Transfer Agent Fees. Fidelity Investments Institutional Operations Company, Inc., (FIIOC), an affiliate of the investment adviser, is the transfer, dividend disbursing and shareholder servicing agent for each class of the Fund. FIIOC receives account fees and asset-based fees that vary according to the account size and type of account of the shareholders of the respective classes of the Fund. FIIOC pays for typesetting, printing and mailing of shareholder reports, except proxy statements.
For the period, transfer agent fees for each class were as follows:
| | Amount | % of
Class-Level Average
Net Assets(a) |
| Class A | $26,261 | .30 |
| Class M | 10,489 | .33 |
| Class C | 8,224 | .31 |
| Latin America | 723,224 | .28 |
| Class I | 3,950 | .19 |
| | $772,148 | |
(a) Annualized
Accounting and Security Lending Fees. Fidelity Service Company, Inc. (FSC), an affiliate of the investment adviser, maintains the Fund's accounting records. The accounting fee is based on the level of average net assets for each month. Under a separate contract, FSC administers the security lending program. The security lending fee is based on the number and duration of lending transactions.
Brokerage Commissions. The Fund placed a portion of its portfolio transactions with brokerage firms which are affiliates of the investment adviser. Brokerage commissions are included in net realized gain (loss) and change in net unrealized appreciation (depreciation) in the Statement of Operations. The commissions paid to these affiliated firms were $399 for the period.
Interfund Trades. The Fund may purchase from or sell securities to other Fidelity Funds under procedures adopted by the Board. The procedures have been designed to ensure these interfund trades are executed in accordance with Rule 17a-7 of the 1940 Act. Interfund trades are included within the respective purchases and sales amounts shown in the Purchases and Sales of Investments note.
6. Committed Line of Credit.
The Fund participates with other funds managed by the investment adviser or an affiliate in a $4.25 billion credit facility (the "line of credit") to be utilized for temporary or emergency purposes to fund shareholder redemptions or for other short-term liquidity purposes. The Fund has agreed to pay commitment fees on its pro-rata portion of the line of credit, which amounted to $952 and is reflected in Miscellaneous expenses on the Statement of Operations. During the period, the Fund did not borrow on this line of credit.
7. Security Lending.
The Fund lends portfolio securities through a lending agent from time to time in order to earn additional income. For equity securities, a lending agent is used and may loan securities to certain qualified borrowers, including Fidelity Capital Markets (FCM), a broker-dealer affiliated with the Fund. On the settlement date of the loan, the Fund receives collateral (in the form of U.S. Treasury obligations, letters of credit and/or cash) against the loaned securities and maintains collateral in an amount not less than 100% of the market value of the loaned securities during the period of the loan. The market value of the loaned securities is determined at the close of business of the Fund and any additional required collateral is delivered to the Fund on the next business day. The Fund or borrower may terminate the loan at any time, and if the borrower defaults on its obligation to return the securities loaned because of insolvency or other reasons, the Fund may apply collateral received from the borrower against the obligation. The Fund may experience delays and costs in recovering the securities loaned. Any cash collateral received is invested in the Fidelity Securities Lending Cash Central Fund. The value of loaned securities and cash collateral at period end are disclosed on the Fund's Statement of Assets and Liabilities. Security lending income represents the income earned on investing cash collateral, less rebates paid to borrowers and any lending agent fees associated with the loan, plus any premium payments received for lending certain types of securities. Security lending income is presented in the Statement of Operations as a component of income from Fidelity Central Funds. Total security lending income during the period amounted to $20,250. During the period, there were no securities loaned to FCM.
8. Expense Reductions.
Commissions paid to certain brokers with whom the investment adviser, or its affiliates, places trades on behalf of the Fund include an amount in addition to trade execution, which may be rebated back to the Fund to offset certain expenses. This amount totaled $2,147 for the period.
In addition, during the period the investment adviser reimbursed and/or waived a portion of fund-level operating expenses in the amount of $2,290.
9. Distributions to Shareholders.
Distributions to shareholders of each class were as follows:
| | Six months ended April 30, 2017 | Year ended October 31, 2016 |
| From net investment income | | |
| Class A | $361,857 | $264,922 |
| Class M | 112,037 | 74,433 |
| Class B | – | 1,059 |
| Class C | 77,689 | 37,419 |
| Latin America | 12,062,883 | 9,833,214 |
| Class I | 82,524 | 52,956 |
| Total | $12,696,990 | $10,264,003 |
10. Share Transactions.
Share transactions for each class were as follows and may contain automatic conversions between classes or exchanges between affiliated funds:
| | Shares | Shares | Dollars | Dollars |
| | Six months ended April 30, 2017 | Year ended October 31, 2016 | Six months ended April 30, 2017 | Year ended October 31, 2016 |
| Class A | | | | |
| Shares sold | 107,263 | 225,272 | $2,262,225 | $4,334,307 |
| Reinvestment of distributions | 18,202 | 14,810 | 345,275 | 256,538 |
| Shares redeemed | (151,946) | (296,685) | (3,103,006) | (5,448,405) |
| Net increase (decrease) | (26,481) | (56,603) | $(495,506) | $(857,560) |
| Class M | | | | |
| Shares sold | 20,201 | 88,506 | $416,765 | $1,738,665 |
| Reinvestment of distributions | 5,687 | 4,243 | 108,338 | 73,689 |
| Shares redeemed | (57,951) | (56,211) | (1,154,038) | (1,058,502) |
| Net increase (decrease) | (32,063) | 36,538 | $(628,935) | $753,852 |
| Class B | | | | |
| Shares sold | – | 1 | $– | $10 |
| Reinvestment of distributions | – | 59 | – | 1,009 |
| Shares redeemed | – | (34,427) | – | (635,494) |
| Net increase (decrease) | – | (34,367) | $– | $(634,475) |
| Class C | | | | |
| Shares sold | 12,390 | 75,193 | $259,277 | $1,418,728 |
| Reinvestment of distributions | 3,179 | 1,720 | 61,288 | 30,044 |
| Shares redeemed | (75,876) | (82,272) | (1,552,956) | (1,513,384) |
| Net increase (decrease) | (60,307) | (5,359) | $(1,232,391) | $(64,612) |
| Latin America | | | | |
| Shares sold | 2,743,526 | 5,528,011 | $56,927,574 | $106,883,642 |
| Reinvestment of distributions | 610,971 | 545,601 | 11,541,877 | 9,420,593 |
| Shares redeemed | (4,970,178) | (6,058,036) | (99,979,802) | (111,613,300) |
| Net increase (decrease) | (1,615,681) | 15,576 | $(31,510,351) | $4,690,935 |
| Class I | | | | |
| Shares sold | 119,976 | 136,401 | $2,505,288 | $2,463,122 |
| Reinvestment of distributions | 3,896 | 2,787 | 73,478 | 48,070 |
| Shares redeemed | (35,418) | (69,501) | (708,723) | (1,289,380) |
| Net increase (decrease) | 88,454 | 69,687 | $1,870,043 | $1,221,812 |
11. Other.
The Fund's organizational documents provide former and current trustees and officers with a limited indemnification against liabilities arising in connection with the performance of their duties to the Fund. In the normal course of business, the Fund may also enter into contracts that provide general indemnifications. The Fund's maximum exposure under these arrangements is unknown as this would be dependent on future claims that may be made against the Fund. The risk of material loss from such claims is considered remote.
Shareholder Expense Example
As a shareholder of the Fund, you incur two types of costs: (1) transaction costs, including sales charges (loads) on purchase payments or redemption proceeds, redemption fees and (2) ongoing costs, including management fees, distribution and/or service (12b-1) fees and other Fund expenses. This Example is intended to help you understand your ongoing costs (in dollars) of investing in the Fund and to compare these costs with the ongoing costs of investing in other mutual funds.
The Example is based on an investment of $1,000 invested at the beginning of the period and held for the entire period (November 1, 2016 to April 30, 2017).
Actual Expenses
The first line of the accompanying table for each class of the Fund provides information about actual account values and actual expenses. You may use the information in this line, together with the amount you invested, to estimate the expenses that you paid over the period. Simply divide your account value by $1,000.00 (for example, an $8,600 account value divided by $1,000.00 = 8.6), then multiply the result by the number in the first line for a class of the Fund under the heading entitled "Expenses Paid During Period" to estimate the expenses you paid on your account during this period. A small balance maintenance fee of $12.00 that is charged once a year may apply for certain accounts with a value of less than $2,000. This fee is not included in the table below. If it was, the estimate of expenses you paid during the period would be higher, and your ending account value lower, by this amount. In addition, the Fund, as a shareholder in the underlying Fidelity Central Funds, will indirectly bear its pro-rata share of the fees and expenses incurred by the underlying Fidelity Central Funds. These fees and expenses are not included in the Fund's annualized expense ratio used to calculate the expense estimate in the table below.
Hypothetical Example for Comparison Purposes
The second line of the accompanying table for each class of the Fund provides information about hypothetical account values and hypothetical expenses based on a Class' actual expense ratio and an assumed rate of return of 5% per year before expenses, which is not the Class' actual return. The hypothetical account values and expenses may not be used to estimate the actual ending account balance or expenses you paid for the period. You may use this information to compare the ongoing costs of investing in the Fund and other funds. To do so, compare this 5% hypothetical example with the 5% hypothetical examples that appear in the shareholder reports of the other funds. A small balance maintenance fee of $12.00 that is charged once a year may apply for certain accounts with a value of less than $2,000. This fee is not included in the table below. If it was, the estimate of expenses you paid during the period would be higher, and your ending account value lower, by this amount. In addition, the Fund, as a shareholder in the underlying Fidelity Central Funds, will indirectly bear its pro-rata share of the fees and expenses incurred by the underlying Fidelity Central Funds. These fees and expenses are not included in the Fund's annualized expense ratio used to calculate the expense estimate in the table below.
Please note that the expenses shown in the table are meant to highlight your ongoing costs only and do not reflect any transaction costs. Therefore, the second line of the table is useful in comparing ongoing costs only, and will not help you determine the relative total costs of owning different funds. In addition, if these transactional costs were included, your costs would have been higher.
| | Annualized Expense Ratio-A | Beginning
Account Value
November 1, 2016 | Ending
Account Value
April 30, 2017 | Expenses Paid
During Period-B
November 1, 2016
to April 30, 2017 |
| Class A | 1.39% | | | |
| Actual | | $1,000.00 | $1,026.60 | $6.98 |
| Hypothetical-C | | $1,000.00 | $1,017.90 | $6.95 |
| Class M | 1.67% | | | |
| Actual | | $1,000.00 | $1,025.30 | $8.39 |
| Hypothetical-C | | $1,000.00 | $1,016.51 | $8.35 |
| Class C | 2.15% | | | |
| Actual | | $1,000.00 | $1,023.00 | $10.78 |
| Hypothetical-C | | $1,000.00 | $1,014.13 | $10.74 |
| Latin America | 1.12% | | | |
| Actual | | $1,000.00 | $1,028.40 | $5.63 |
| Hypothetical-C | | $1,000.00 | $1,019.24 | $5.61 |
| Class I | 1.03% | | | |
| Actual | | $1,000.00 | $1,028.60 | $5.18 |
| Hypothetical-C | | $1,000.00 | $1,019.69 | $5.16 |
A Annualized expense ratio reflects expenses net of applicable fee waivers.
B Expenses are equal to each Class' annualized expense ratio, multiplied by the average account value over the period, multiplied by 181/365 (to reflect the one-half year period).
C 5% return per year before expenses
FALAA-SANN-0617
1.917421.106
Fidelity® Diversified International Fund
Class K
Semi-Annual Report April 30, 2017 |
|
Contents
To view a fund's proxy voting guidelines and proxy voting record for the 12-month period ended June 30, visit http://www.fidelity.com/proxyvotingresults or visit the Securities and Exchange Commission's (SEC) web site at http://www.sec.gov.
You may also call 1-800-835-5092 to request a free copy of the proxy voting guidelines.
Standard & Poor's, S&P and S&P 500 are registered service marks of The McGraw-Hill Companies, Inc. and have been licensed for use by Fidelity Distributors Corporation.
Other third-party marks appearing herein are the property of their respective owners.
All other marks appearing herein are registered or unregistered trademarks or service marks of FMR LLC or an affiliated company. © 2017 FMR LLC. All rights reserved.
This report and the financial statements contained herein are submitted for the general information of the shareholders of the Fund. This report is not authorized for distribution to prospective investors in the Fund unless preceded or accompanied by an effective prospectus.
A fund files its complete schedule of portfolio holdings with the SEC for the first and third quarters of each fiscal year on Form N-Q. Forms N-Q are available on the SEC’s web site at http://www.sec.gov. A fund's Forms N-Q may be reviewed and copied at the SEC’s Public Reference Room in Washington, DC. Information regarding the operation of the SEC's Public Reference Room may be obtained by calling 1-800-SEC-0330.
For a complete list of a fund's portfolio holdings, view the most recent holdings listing, semiannual report, or annual report on Fidelity's web site at http://www.fidelity.com, http://www.institutional.fidelity.com, or http://www.401k.com, as applicable.
NOT FDIC INSURED •MAY LOSE VALUE •NO BANK GUARANTEE
Neither the Fund nor Fidelity Distributors Corporation is a bank.
Investment Summary (Unaudited)
Geographic Diversification (% of fund's net assets)
| As of April 30, 2017 |
| | United Kingdom | 16.4% |
| | Japan | 14.9% |
| | United States of America* | 10.2% |
| | Germany | 8.3% |
| | Netherlands | 6.2% |
| | France | 5.1% |
| | Canada | 3.7% |
| | India | 3.6% |
| | Ireland | 3.6% |
| | Other | 28.0% |

* Includes Short-Term investments and Net Other Assets (Liabilities).
Percentages are based on country or territory of incorporation and are adjusted for the effect of futures contracts, if applicable.
| As of October 31, 2016 |
| | Japan | 15.9% |
| | United Kingdom | 13.2% |
| | United States of America* | 10.7% |
| | Germany | 8.9% |
| | Netherlands | 5.2% |
| | France | 5.0% |
| | Canada | 4.3% |
| | India | 3.5% |
| | Ireland | 3.2% |
| | Other | 30.1% |
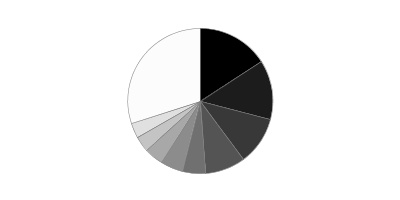
* Includes Short-Term investments and Net Other Assets (Liabilities).
Percentages are based on country or territory of incorporation and are adjusted for the effect of futures contracts, if applicable.
Asset Allocation as of April 30, 2017
| | % of fund's net assets | % of fund's net assets 6 months ago |
| Stocks | 96.0 | 96.9 |
| Bonds | 0.1 | 0.0 |
| Short-Term Investments and Net Other Assets (Liabilities) | 3.9 | 3.1 |
Top Ten Stocks as of April 30, 2017
| | % of fund's net assets | % of fund's net assets 6 months ago |
| Bayer AG (Germany, Pharmaceuticals) | 2.2 | 1.9 |
| Hoya Corp. (Japan, Health Care Equipment & Supplies) | 1.5 | 1.6 |
| ORIX Corp. (Japan, Diversified Financial Services) | 1.5 | 1.9 |
| Lloyds Banking Group PLC (United Kingdom, Banks) | 1.5 | 1.2 |
| Prudential PLC (United Kingdom, Insurance) | 1.5 | 1.0 |
| British American Tobacco PLC sponsored ADR (United Kingdom, Tobacco) | 1.3 | 0.5 |
| SAP AG (Germany, Software) | 1.3 | 1.3 |
| Keyence Corp. (Japan, Electronic Equipment & Components) | 1.2 | 1.3 |
| HDFC Bank Ltd. (India, Banks) | 1.2 | 1.2 |
| Anheuser-Busch InBev SA NV (Belgium, Beverages) | 1.2 | 1.6 |
| | 14.4 | |
Top Market Sectors as of April 30, 2017
| | % of fund's net assets | % of fund's net assets 6 months ago |
| Financials | 22.6 | 21.2 |
| Consumer Staples | 14.2 | 14.9 |
| Health Care | 13.2 | 15.8 |
| Information Technology | 12.4 | 14.8 |
| Consumer Discretionary | 12.4 | 12.2 |
| Industrials | 10.9 | 7.8 |
| Energy | 4.3 | 3.5 |
| Materials | 3.4 | 3.0 |
| Telecommunication Services | 2.1 | 2.9 |
| Real Estate | 0.4 | 0.5 |
Percentages shown as 0.0% may reflect amounts less than 0.05%.
Investments April 30, 2017
Showing Percentage of Net Assets
| Common Stocks - 94.6% | | | |
| | | Shares | Value |
| Australia - 1.5% | | | |
| Amcor Ltd. | | 1,601,729 | $18,842,176 |
| Australia & New Zealand Banking Group Ltd. | | 5,003,676 | 122,743,614 |
| Bapcor Ltd. | | 865,084 | 3,387,863 |
| CSL Ltd. | | 478,787 | 47,521,257 |
| Magellan Financial Group Ltd. | | 3,006,204 | 53,079,654 |
| Ramsay Health Care Ltd. | | 738,117 | 39,628,734 |
|
| TOTAL AUSTRALIA | | | 285,203,298 |
|
| Bailiwick of Guernsey - 0.0% | | | |
| Burford Capital Ltd. | | 614,700 | 6,210,044 |
| Bailiwick of Jersey - 2.5% | | | |
| Shire PLC | | 2,721,200 | 160,438,638 |
| Shire PLC sponsored ADR | | 168,129 | 29,752,108 |
| Wolseley PLC | | 2,906,649 | 184,738,310 |
| WPP PLC | | 5,042,009 | 107,967,185 |
|
| TOTAL BAILIWICK OF JERSEY | | | 482,896,241 |
|
| Belgium - 2.2% | | | |
| Anheuser-Busch InBev SA NV | | 1,948,430 | 219,725,168 |
| KBC Groep NV | | 2,700,990 | 195,008,247 |
|
| TOTAL BELGIUM | | | 414,733,415 |
|
| Bermuda - 0.6% | | | |
| Credicorp Ltd. (United States) | | 288,400 | 44,315,544 |
| IHS Markit Ltd. (a) | | 1,541,700 | 66,909,780 |
|
| TOTAL BERMUDA | | | 111,225,324 |
|
| Canada - 3.7% | | | |
| Alimentation Couche-Tard, Inc. Class B (sub. vtg.) | | 4,000,881 | 184,004,475 |
| Cenovus Energy, Inc. | | 8,494,900 | 84,696,963 |
| CGI Group, Inc. Class A (sub. vtg.) (a) | | 1,061,600 | 51,234,906 |
| Constellation Software, Inc. | | 60,338 | 27,596,662 |
| Fairfax India Holdings Corp. (a) | | 5,606,600 | 77,875,674 |
| Imperial Oil Ltd. | | 2,529,500 | 73,584,444 |
| PrairieSky Royalty Ltd. | | 822,398 | 17,923,402 |
| Suncor Energy, Inc. | | 6,002,000 | 188,099,747 |
|
| TOTAL CANADA | | | 705,016,273 |
|
| Cayman Islands - 1.1% | | | |
| Alibaba Group Holding Ltd. sponsored ADR (a) | | 1,130,000 | 130,515,000 |
| JD.com, Inc. sponsored ADR (a) | | 1,444,792 | 50,668,855 |
| Melco Crown Entertainment Ltd. sponsored ADR | | 901,200 | 19,781,340 |
| Yihai International Holding Ltd. | | 20,356,000 | 9,525,907 |
|
| TOTAL CAYMAN ISLANDS | | | 210,491,102 |
|
| China - 0.9% | | | |
| Kweichow Moutai Co. Ltd. (A Shares) | | 1,752,010 | 105,087,560 |
| Qingdao Haier Co. Ltd. | | 35,425,678 | 62,644,377 |
|
| TOTAL CHINA | | | 167,731,937 |
|
| Curacao - 0.7% | | | |
| Schlumberger Ltd. | | 1,750,025 | 127,034,315 |
| Denmark - 0.5% | | | |
| A.P. Moller - Maersk A/S Series B | | 10,655 | 18,380,239 |
| NNIT A/S (a) | | 651,651 | 18,371,152 |
| Novo Nordisk A/S Series B | | 1,616,195 | 62,929,550 |
|
| TOTAL DENMARK | | | 99,680,941 |
|
| Finland - 0.3% | | | |
| Sampo Oyj (A Shares) (b) | | 1,278,400 | 61,258,763 |
| France - 5.1% | | | |
| Amundi SA | | 2,959,013 | 194,684,472 |
| AXA SA (b) | | 4,035,000 | 107,654,416 |
| BNP Paribas SA | | 1,426,800 | 100,681,933 |
| LVMH Moet Hennessy - Louis Vuitton SA (b) | | 429,124 | 105,937,374 |
| Maisons du Monde SA | | 891,300 | 30,932,654 |
| Rubis | | 199,800 | 20,301,659 |
| Sanofi SA | | 2,243,715 | 212,017,239 |
| Societe Generale Series A | | 1,863,200 | 102,164,332 |
| VINCI SA | | 1,157,700 | 98,680,707 |
| Worldline SA (a)(c) | | 95,117 | 3,154,435 |
|
| TOTAL FRANCE | | | 976,209,221 |
|
| Germany - 7.0% | | | |
| adidas AG | | 602,424 | 120,678,943 |
| Aumann AG | | 332,400 | 21,862,591 |
| Axel Springer Verlag AG | | 869,800 | 48,804,341 |
| Bayer AG | | 3,421,662 | 423,373,043 |
| Brenntag AG | | 95,600 | 5,669,223 |
| Deutsche Borse AG | | 64,992 | 6,361,001 |
| Deutsche Post AG | | 2,022,759 | 72,705,684 |
| Fresenius Medical Care AG & Co. KGaA | | 216,300 | 19,200,798 |
| Fresenius SE & Co. KGaA | | 2,404,200 | 194,871,981 |
| ProSiebenSat.1 Media AG | | 1,893,290 | 80,369,529 |
| Rational AG | | 34,516 | 17,344,086 |
| SAP AG | | 2,353,846 | 235,775,443 |
| Symrise AG | | 1,098,900 | 76,933,232 |
|
| TOTAL GERMANY | | | 1,323,949,895 |
|
| Hong Kong - 1.1% | | | |
| AIA Group Ltd. | | 25,979,000 | 179,854,230 |
| Techtronic Industries Co. Ltd. | | 8,211,500 | 35,259,933 |
|
| TOTAL HONG KONG | | | 215,114,163 |
|
| India - 3.6% | | | |
| Adani Ports & Special Economic Zone Ltd. (a) | | 666,389 | 3,396,729 |
| Axis Bank Ltd. | | 3,625,258 | 28,738,727 |
| Godrej Consumer Products Ltd. | | 167,651 | 4,544,753 |
| HDFC Bank Ltd. | | 9,449,055 | 230,669,153 |
| Housing Development Finance Corp. Ltd. | | 7,369,819 | 176,209,633 |
| ICICI Bank Ltd. | | 9,531,499 | 41,126,022 |
| ITC Ltd. | | 20,903,933 | 90,391,871 |
| LIC Housing Finance Ltd. | | 3,151,798 | 32,792,622 |
| Reliance Industries Ltd. | | 3,832,853 | 83,179,289 |
|
| TOTAL INDIA | | | 691,048,799 |
|
| Indonesia - 0.8% | | | |
| PT Bank Central Asia Tbk | | 49,044,200 | 65,311,317 |
| PT Bank Rakyat Indonesia Tbk | | 85,630,900 | 82,874,830 |
|
| TOTAL INDONESIA | | | 148,186,147 |
|
| Ireland - 3.6% | | | |
| Allergan PLC | | 417,700 | 101,860,322 |
| CRH PLC | | 1,777,100 | 64,794,802 |
| DCC PLC (United Kingdom) | | 765,289 | 70,672,725 |
| Kerry Group PLC Class A | | 892,900 | 72,967,150 |
| Kingspan Group PLC (Ireland) | | 1,135,800 | 39,510,842 |
| Medtronic PLC | | 998,800 | 82,990,292 |
| Ryanair Holdings PLC sponsored ADR (a) | | 2,288,132 | 210,347,975 |
| Weatherford International PLC (a) | | 6,773,300 | 39,081,941 |
|
| TOTAL IRELAND | | | 682,226,049 |
|
| Isle of Man - 0.3% | | | |
| Paysafe Group PLC (a) | | 10,849,449 | 63,782,965 |
| Israel - 1.4% | | | |
| Check Point Software Technologies Ltd. (a) | | 1,325,300 | 137,844,453 |
| Elbit Systems Ltd. (Israel) | | 288,593 | 34,382,870 |
| SodaStream International Ltd. (a) | | 417,260 | 22,694,771 |
| Teva Pharmaceutical Industries Ltd. sponsored ADR | | 2,523,900 | 79,704,762 |
|
| TOTAL ISRAEL | | | 274,626,856 |
|
| Italy - 0.6% | | | |
| Buzzi Unicem SpA | | 291,900 | 7,504,013 |
| Intesa Sanpaolo SpA | | 25,088,000 | 73,234,444 |
| Prada SpA | | 8,915,500 | 41,836,090 |
|
| TOTAL ITALY | | | 122,574,547 |
|
| Japan - 14.8% | | | |
| Astellas Pharma, Inc. | | 10,466,900 | 138,028,184 |
| Bridgestone Corp. | | 721,500 | 30,083,265 |
| Daito Trust Construction Co. Ltd. | | 349,800 | 51,461,942 |
| Dentsu, Inc. | | 1,246,300 | 70,210,935 |
| Don Quijote Holdings Co. Ltd. | | 1,285,200 | 46,865,557 |
| Hoya Corp. | | 6,178,200 | 295,068,283 |
| Japan Exchange Group, Inc. | | 409,000 | 5,727,284 |
| Japan Tobacco, Inc. | | 2,901,100 | 96,447,424 |
| Kaken Pharmaceutical Co. Ltd. | | 275,500 | 16,335,995 |
| Kao Corp. | | 186,500 | 10,285,732 |
| KDDI Corp. | | 6,215,800 | 164,806,178 |
| Keyence Corp. | | 581,420 | 233,663,297 |
| Minebea Mitsumi, Inc. | | 3,731,100 | 53,920,629 |
| Misumi Group, Inc. | | 2,181,500 | 41,311,025 |
| Morinaga & Co. Ltd. | | 942,500 | 44,556,851 |
| Nabtesco Corp. | | 917,600 | 26,011,357 |
| Nidec Corp. | | 199,800 | 18,317,614 |
| Nippon Telegraph & Telephone Corp. | | 1,075,100 | 46,074,107 |
| Nitori Holdings Co. Ltd. | | 1,042,700 | 135,721,704 |
| Olympus Corp. | | 2,731,300 | 105,111,254 |
| ORIX Corp. | | 19,160,300 | 292,367,529 |
| Outsourcing, Inc. | | 352,000 | 13,498,991 |
| Recruit Holdings Co. Ltd. | | 3,632,600 | 183,463,001 |
| Seria Co. Ltd. | | 245,700 | 11,020,408 |
| Seven & i Holdings Co. Ltd. | | 1,760,300 | 74,375,537 |
| Shin-Etsu Chemical Co. Ltd. | | 104,600 | 9,086,758 |
| Shinsei Bank Ltd. | | 23,502,000 | 43,852,128 |
| Shionogi & Co. Ltd. | | 684,000 | 35,177,143 |
| SMC Corp. | | 126,400 | 35,592,698 |
| SoftBank Corp. | | 1,510,800 | 114,598,289 |
| Sohgo Security Services Co., Ltd. | | 349,200 | 15,239,812 |
| Sony Corp. | | 2,277,700 | 78,157,781 |
| Start Today Co. Ltd. | | 1,606,100 | 34,290,361 |
| Sundrug Co. Ltd. | | 523,300 | 18,354,815 |
| Tsuruha Holdings, Inc. | | 1,496,600 | 151,707,378 |
| Welcia Holdings Co. Ltd. | | 2,223,100 | 71,593,891 |
|
| TOTAL JAPAN | | | 2,812,385,137 |
|
| Luxembourg - 1.4% | | | |
| B&M European Value Retail S.A. | | 35,854,800 | 156,499,892 |
| Eurofins Scientific SA | | 233,800 | 115,140,077 |
|
| TOTAL LUXEMBOURG | | | 271,639,969 |
|
| Netherlands - 6.2% | | | |
| AerCap Holdings NV (a) | | 991,900 | 45,637,319 |
| Altice NV: | | | |
| Class A (a) | | 6,848,470 | 170,126,175 |
| Class B (a) | | 1,816,636 | 45,177,410 |
| ASML Holding NV | | 561,600 | 74,046,960 |
| Gree Electric Appliances, Inc. of Zhuhai ELS (A Shares) (BNP Paribas Warrant Program) warrants 11/14/17 (a)(c) | | 4,182,893 | 20,024,004 |
| IMCD Group BV | | 1,506,247 | 81,135,327 |
| ING Groep NV (Certificaten Van Aandelen) | | 8,063,600 | 131,432,990 |
| Koninklijke Philips Electronics NV | | 2,434,700 | 84,076,248 |
| LyondellBasell Industries NV Class A | | 681,000 | 57,721,560 |
| NXP Semiconductors NV (a) | | 792,400 | 83,796,300 |
| RELX NV | | 6,925,370 | 133,940,267 |
| Unilever NV: | | | |
| (Certificaten Van Aandelen) (Bearer) | | 3,586,657 | 187,888,785 |
| (NY Reg.) (a) | | 449,300 | 23,471,432 |
| Wolters Kluwer NV | | 806,300 | 34,245,018 |
|
| TOTAL NETHERLANDS | | | 1,172,719,795 |
|
| New Zealand - 0.1% | | | |
| Ryman Healthcare Group Ltd. | | 4,273,045 | 25,319,321 |
| Norway - 0.7% | | | |
| Statoil ASA (b) | | 8,356,100 | 137,615,735 |
| Philippines - 0.1% | | | |
| Alliance Global Group, Inc. | | 68,432,356 | 20,194,787 |
| Singapore - 0.4% | | | |
| Broadcom Ltd. | | 347,500 | 76,731,475 |
| South Africa - 1.1% | | | |
| Capitec Bank Holdings Ltd. | | 304,900 | 17,397,695 |
| Naspers Ltd. Class N | | 1,026,379 | 195,167,520 |
|
| TOTAL SOUTH AFRICA | | | 212,565,215 |
|
| Spain - 2.9% | | | |
| Amadeus IT Holding SA Class A | | 2,952,800 | 159,216,009 |
| CaixaBank SA | | 24,223,200 | 109,984,068 |
| Grifols SA ADR | | 259,307 | 5,629,555 |
| Hispania Activos Inmobiliarios SA | | 1,093,780 | 16,513,560 |
| Inditex SA | | 4,169,300 | 159,910,387 |
| Neinor Homes SLU | | 2,261,900 | 44,608,686 |
| Prosegur Cash SA | | 21,180,200 | 53,987,525 |
|
| TOTAL SPAIN | | | 549,849,790 |
|
| Sweden - 3.0% | | | |
| ASSA ABLOY AB (B Shares) (b) | | 5,359,800 | 116,124,058 |
| Coor Service Management Holding AB (d) | | 4,940,000 | 30,814,695 |
| HEXPOL AB (B Shares) | | 2,087,300 | 23,200,601 |
| Nordea Bank AB | | 14,030,400 | 172,661,375 |
| Svenska Cellulosa AB (SCA) (B Shares) | | 5,459,900 | 180,860,382 |
| Svenska Handelsbanken AB (A Shares) | | 3,430,300 | 48,681,733 |
|
| TOTAL SWEDEN | | | 572,342,844 |
|
| Switzerland - 2.5% | | | |
| Credit Suisse Group AG | | 7,852,601 | 119,759,735 |
| Dufry AG (a) | | 14,080 | 2,306,573 |
| Forbo Holding AG (Reg.) | | 2,440 | 3,999,638 |
| Julius Baer Group Ltd. | | 890,740 | 46,449,153 |
| Sika AG | | 25,331 | 161,660,151 |
| UBS Group AG | | 7,873,537 | 134,522,743 |
|
| TOTAL SWITZERLAND | | | 468,697,993 |
|
| Taiwan - 1.0% | | | |
| Taiwan Semiconductor Manufacturing Co. Ltd. sponsored ADR | | 5,705,100 | 188,667,657 |
| Thailand - 0.2% | | | |
| Kasikornbank PCL (For. Reg.) | | 8,066,300 | 43,129,061 |
| United Kingdom - 16.4% | | | |
| Ascential PLC | | 5,788,321 | 26,449,534 |
| Booker Group PLC | | 30,017,100 | 75,423,607 |
| British American Tobacco PLC sponsored ADR (b) | | 3,654,200 | 248,631,768 |
| Bunzl PLC | | 2,089,770 | 65,176,616 |
| Close Brothers Group PLC | | 365,400 | 8,007,662 |
| Coca-Cola European Partners PLC | | 1,595,500 | 61,618,210 |
| Compass Group PLC | | 5,821,076 | 117,532,234 |
| Dialog Semiconductor PLC (a) | | 1,265,600 | 59,211,646 |
| Dignity PLC | | 1,100,672 | 35,539,968 |
| Domino's Pizza UK & IRL PLC | | 3,102,000 | 13,278,533 |
| Essentra PLC | | 12,950,820 | 90,830,680 |
| GlaxoSmithKline PLC | | 1,969,300 | 39,637,808 |
| Halma PLC | | 1,985,656 | 27,081,282 |
| Hastings Group Holdings PLC | | 2,092,566 | 8,193,211 |
| Howden Joinery Group PLC | | 1,831,200 | 10,981,296 |
| Ibstock PLC | | 6,893,100 | 20,444,990 |
| IMI PLC | | 1,397,035 | 23,142,734 |
| Imperial Tobacco Group PLC | | 2,139,590 | 104,806,670 |
| Indivior PLC | | 7,595,400 | 32,955,833 |
| Informa PLC | | 4,030,910 | 33,517,758 |
| ITV PLC | | 21,304,300 | 57,945,992 |
| John Wood Group PLC | | 2,360,400 | 23,219,359 |
| Liberty Global PLC Class A (a) | | 1,176,300 | 41,664,546 |
| LivaNova PLC (a) | | 201,600 | 10,624,320 |
| Lloyds Banking Group PLC | | 319,343,100 | 286,938,335 |
| London Stock Exchange Group PLC | | 2,452,700 | 107,469,014 |
| Melrose Industries PLC | | 45,491,037 | 139,345,779 |
| Micro Focus International PLC | | 4,020,383 | 134,762,338 |
| Next PLC | | 1,515,300 | 84,490,643 |
| Polypipe Group PLC | | 3,334,400 | 17,201,441 |
| Prudential PLC | | 12,721,883 | 282,347,725 |
| Reckitt Benckiser Group PLC | | 2,201,587 | 202,848,823 |
| Rio Tinto PLC | | 2,883,000 | 113,735,017 |
| Softcat PLC | | 4,814,100 | 25,689,116 |
| Spectris PLC | | 1,954,100 | 69,854,229 |
| St. James's Place Capital PLC | | 11,611,300 | 172,647,213 |
| Standard Chartered PLC (United Kingdom) (a) | | 4,673,076 | 43,651,121 |
| Standard Life PLC | | 9,250,943 | 43,601,848 |
| TechnipFMC PLC (France) (a) | | 548,370 | 16,486,569 |
| Tesco PLC (a) | | 24,969,200 | 59,257,286 |
| Vodafone Group PLC sponsored ADR | | 3,079,900 | 80,662,581 |
|
| TOTAL UNITED KINGDOM | | | 3,116,905,335 |
|
| United States of America - 6.3% | | | |
| Activision Blizzard, Inc. | | 673,000 | 35,164,250 |
| Alexion Pharmaceuticals, Inc. (a) | | 329,400 | 42,090,732 |
| Alphabet, Inc. Class C (a) | | 184,903 | 167,514,722 |
| Amgen, Inc. | | 668,200 | 109,130,424 |
| Bio-Rad Laboratories, Inc. Class A (a) | | 92,900 | 20,276,354 |
| Coty, Inc. Class A | | 7,810,300 | 139,413,855 |
| Fidelity National Information Services, Inc. | | 570,700 | 48,047,233 |
| MasterCard, Inc. Class A | | 1,127,600 | 131,162,432 |
| Molson Coors Brewing Co. Class B | | 502,600 | 48,194,314 |
| MSCI, Inc. | | 284,900 | 28,581,168 |
| NJOY, Inc. (a)(e) | | 9,361,811 | 94 |
| Oceaneering International, Inc. | | 1,246,700 | 32,900,413 |
| Qualcomm, Inc. | | 1,410,300 | 75,789,522 |
| Quintiles Transnational Holdings, Inc. (a) | | 298,800 | 25,182,864 |
| S&P Global, Inc. | | 938,400 | 125,923,896 |
| Vertex Pharmaceuticals, Inc. (a) | | 286,200 | 33,857,460 |
| Visa, Inc. Class A | | 1,406,700 | 128,319,174 |
|
| TOTAL UNITED STATES OF AMERICA | | | 1,191,548,907 |
|
| TOTAL COMMON STOCKS | | | |
| (Cost $13,488,133,380) | | | 18,029,513,316 |
|
| Nonconvertible Preferred Stocks - 1.4% | | | |
| Brazil - 0.1% | | | |
| Itau Unibanco Holding SA | | 1,554,050 | 19,222,130 |
| Germany - 1.3% | | | |
| Henkel AG & Co. KGaA | | 1,423,000 | 193,759,237 |
| Jungheinrich AG | | 415,400 | 14,466,272 |
| Sartorius AG (non-vtg.) | | 501,684 | 45,937,477 |
|
| TOTAL GERMANY | | | 254,162,986 |
|
| TOTAL NONCONVERTIBLE PREFERRED STOCKS | | | |
| (Cost $178,756,424) | | | 273,385,116 |
| | | Principal Amount(f) | Value |
|
| Government Obligations - 0.1% | | | |
| Japan - 0.1% | | | |
Japan Government 0.1% 4/15/19
(Cost $18,475,883) | JPY | 2,014,800,000 | 18,178,295 |
| | | Shares | Value |
|
| Money Market Funds - 6.4% | | | |
| Fidelity Cash Central Fund, 0.85% (g) | | 626,029,193 | 626,154,399 |
| Fidelity Securities Lending Cash Central Fund 0.86% (g)(h) | | 588,137,491 | 588,196,305 |
| TOTAL MONEY MARKET FUNDS | | | |
| (Cost $1,214,300,424) | | | 1,214,350,704 |
| TOTAL INVESTMENT PORTFOLIO - 102.5% | | | |
| (Cost $14,899,666,111) | | | 19,535,427,431 |
| NET OTHER ASSETS (LIABILITIES) - (2.5)% | | | (483,866,851) |
| NET ASSETS - 100% | | | $19,051,560,580 |
Currency Abbreviations
JPY – Japanese yen
Security Type Abbreviations
ELS – Equity-Linked Security
Categorizations in the Schedule of Investments are based on country or territory of incorporation.
Legend
(a) Non-income producing
(b) Security or a portion of the security is on loan at period end.
(c) Security exempt from registration under Rule 144A of the Securities Act of 1933. These securities may be resold in transactions exempt from registration, normally to qualified institutional buyers. At the end of the period, the value of these securities amounted to $23,178,439 or 0.1% of net assets.
(d) Affiliated company
(e) Restricted securities - Investment in securities not registered under the Securities Act of 1933 (excluding 144A issues). At the end of the period, the value of restricted securities (excluding 144A issues) amounted to $94 or 0.0% of net assets.
(f) Amount is stated in United States dollars unless otherwise noted.
(g) Affiliated fund that is generally available only to investment companies and other accounts managed by Fidelity Investments. The rate quoted is the annualized seven-day yield of the fund at period end. A complete unaudited listing of the fund's holdings as of its most recent quarter end is available upon request. In addition, each Fidelity Central Fund's financial statements, which are not covered by the Fund's Report of Independent Registered Public Accounting Firm, are available on the SEC's website or upon request.
(h) Investment made with cash collateral received from securities on loan.
Additional information on each restricted holding is as follows:
| Security | Acquisition Date | Acquisition Cost |
| NJOY, Inc. | 6/7/13 - 2/14/14 | $10,471,244 |
Affiliated Central Funds
Information regarding fiscal year to date income earned by the Fund from investments in Fidelity Central Funds is as follows:
| Fund | Income earned |
| Fidelity Cash Central Fund | $1,808,513 |
| Fidelity Securities Lending Cash Central Fund | 3,454,069 |
| Total | $5,262,582 |
Other Affiliated Issuers
An affiliated company is a company in which the Fund has ownership of at least 5% of the voting securities. Fiscal year to date transactions with companies which are or were affiliates are as follows:
| Affiliate | Value, beginning of period | Purchases | Sales Proceeds* | Dividend Income | Value, end of period |
| Coor Service Management Holding AB | $30,536,334 | $-- | $1,809,026 | $-- | $30,814,695 |
| Essentra PLC | 88,602,878 | 1,804,660 | 9,651,540 | 2,457,025 | -- |
| Total | $119,139,212 | $1,804,660 | $11,460,566 | $2,457,025 | $30,814,695 |
* Includes the value of securities delivered through in-kind transactions, if applicable.
Investment Valuation
The following is a summary of the inputs used, as of April 30, 2017, involving the Fund's assets and liabilities carried at fair value. The inputs or methodology used for valuing securities may not be an indication of the risk associated with investing in those securities. For more information on valuation inputs, and their aggregation into the levels used below, please refer to the Investment Valuation section in the accompanying Notes to Financial Statements.
| | Valuation Inputs at Reporting Date: |
| Description | Total | Level 1 | Level 2 | Level 3 |
| Investments in Securities: | | | | |
| Equities: | | | | |
| Consumer Discretionary | $2,325,528,849 | $1,640,397,132 | $685,131,623 | $94 |
| Consumer Staples | 2,670,216,974 | 2,000,496,912 | 669,720,062 | -- |
| Energy | 823,822,177 | 686,206,442 | 137,615,735 | -- |
| Financials | 4,358,934,925 | 2,807,150,548 | 1,551,784,377 | -- |
| Health Care | 2,568,162,960 | 1,512,537,700 | 1,055,625,260 | -- |
| Industrials | 2,048,438,745 | 1,589,857,557 | 458,581,188 | -- |
| Information Technology | 2,368,621,506 | 2,132,846,063 | 235,775,443 | -- |
| Materials | 644,753,980 | 466,224,161 | 178,529,819 | -- |
| Real Estate | 67,975,502 | 67,975,502 | -- | -- |
| Telecommunication Services | 406,141,155 | 80,662,581 | 325,478,574 | -- |
| Utilities | 20,301,659 | 20,301,659 | -- | -- |
| Government Obligations | 18,178,295 | -- | 18,178,295 | -- |
| Money Market Funds | 1,214,350,704 | 1,214,350,704 | -- | -- |
| Total Investments in Securities: | $19,535,427,431 | $14,219,006,961 | $5,316,420,376 | $94 |
The following is a summary of transfers between Level 1 and Level 2 for the period ended April 30, 2017. Transfers are assumed to have occurred at the beginning of the period, and are primarily attributable to the valuation techniques used for foreign equity securities, as discussed in the accompanying Notes to Financial Statements:
| Transfers | Total |
| Level 1 to Level 2 | $973,567,419 |
| Level 2 to Level 1 | $517,406,319 |
See accompanying notes which are an integral part of the financial statements.
Financial Statements
Statement of Assets and Liabilities
| | | April 30, 2017 |
| Assets | | |
Investment in securities, at value (including securities loaned of $563,233,857) — See accompanying schedule:
Unaffiliated issuers (cost $13,662,462,321) | $18,290,262,032 | |
| Fidelity Central Funds (cost $1,214,300,424) | 1,214,350,704 | |
| Other affiliated issuers (cost $22,903,366) | 30,814,695 | |
| Total Investments (cost $14,899,666,111) | | $19,535,427,431 |
| Receivable for investments sold | | 74,559,933 |
| Receivable for fund shares sold | | 14,124,963 |
| Dividends receivable | | 99,463,301 |
| Interest receivable | | 792 |
| Distributions receivable from Fidelity Central Funds | | 1,718,151 |
| Prepaid expenses | | 13,155 |
| Other receivables | | 2,251,904 |
| Total assets | | 19,727,559,630 |
| Liabilities | | |
| Payable to custodian bank | $1,223,790 | |
| Payable for investments purchased | 58,625,597 | |
| Payable for fund shares redeemed | 9,230,689 | |
| Accrued management fee | 12,312,244 | |
| Other affiliated payables | 1,984,439 | |
| Other payables and accrued expenses | 4,412,957 | |
| Collateral on securities loaned | 588,209,334 | |
| Total liabilities | | 675,999,050 |
| Net Assets | | $19,051,560,580 |
| Net Assets consist of: | | |
| Paid in capital | | $14,056,726,936 |
| Undistributed net investment income | | 75,737,388 |
| Accumulated undistributed net realized gain (loss) on investments and foreign currency transactions | | 285,620,539 |
| Net unrealized appreciation (depreciation) on investments and assets and liabilities in foreign currencies | | 4,633,475,717 |
| Net Assets | | $19,051,560,580 |
| Diversified International: | | |
| Net Asset Value, offering price and redemption price per share ($10,740,010,702 ÷ 286,835,821 shares) | | $37.44 |
| Class K: | | |
| Net Asset Value, offering price and redemption price per share ($8,311,549,878 ÷ 222,370,796 shares) | | $37.38 |
See accompanying notes which are an integral part of the financial statements.
Statement of Operations
| | | Six months ended April 30, 2017 |
| Investment Income | | |
| Dividends (including $2,457,025 earned from other affiliated issuers) | | $170,170,401 |
| Interest | | 7 |
| Income from Fidelity Central Funds | | 5,262,582 |
| Income before foreign taxes withheld | | 175,432,990 |
| Less foreign taxes withheld | | (12,979,594) |
| Total income | | 162,453,396 |
| Expenses | | |
| Management fee | | |
| Basic fee | $61,761,768 | |
| Performance adjustment | 5,051,076 | |
| Transfer agent fees | 10,898,483 | |
| Accounting and security lending fees | 1,074,405 | |
| Custodian fees and expenses | 995,673 | |
| Independent trustees' fees and expenses | 37,928 | |
| Appreciation in deferred trustee compensation account | 9 | |
| Registration fees | 90,301 | |
| Audit | 77,638 | |
| Legal | 56,468 | |
| Miscellaneous | 77,298 | |
| Total expenses before reductions | 80,121,047 | |
| Expense reductions | (952,117) | 79,168,930 |
| Net investment income (loss) | | 83,284,466 |
| Realized and Unrealized Gain (Loss) | | |
| Net realized gain (loss) on: | | |
| Investment securities: | | |
| Unaffiliated issuers | 792,964,950 | |
| Fidelity Central Funds | (28,010) | |
| Other affiliated issuers | (4,923,429) | |
| Foreign currency transactions | (2,293,960) | |
| Total net realized gain (loss) | | 785,719,551 |
Change in net unrealized appreciation (depreciation) on:
Investment securities (net of increase in deferred foreign taxes of $1,615,432) | 983,933,279 | |
| Assets and liabilities in foreign currencies | 1,958,111 | |
| Total change in net unrealized appreciation (depreciation) | | 985,891,390 |
| Net gain (loss) | | 1,771,610,941 |
| Net increase (decrease) in net assets resulting from operations | | $1,854,895,407 |
See accompanying notes which are an integral part of the financial statements.
Statement of Changes in Net Assets
| | Six months ended April 30, 2017 | Year ended October 31, 2016 |
| Increase (Decrease) in Net Assets | | |
| Operations | | |
| Net investment income (loss) | $83,284,466 | $250,383,197 |
| Net realized gain (loss) | 785,719,551 | (116,794,131) |
| Change in net unrealized appreciation (depreciation) | 985,891,390 | (1,001,178,165) |
| Net increase (decrease) in net assets resulting from operations | 1,854,895,407 | (867,589,099) |
| Distributions to shareholders from net investment income | (223,211,879) | (225,471,164) |
| Distributions to shareholders from net realized gain | (38,126,771) | (89,601,901) |
| Total distributions | (261,338,650) | (315,073,065) |
| Share transactions - net increase (decrease) | (2,141,680,284) | (2,421,343,717) |
| Redemption fees | 24,751 | 142,450 |
| Total increase (decrease) in net assets | (548,098,776) | (3,603,863,431) |
| Net Assets | | |
| Beginning of period | 19,599,659,356 | 23,203,522,787 |
| End of period | $19,051,560,580 | $19,599,659,356 |
| Other Information | | |
| Undistributed net investment income end of period | $75,737,388 | $215,664,801 |
See accompanying notes which are an integral part of the financial statements.
Financial Highlights — Fidelity Diversified International Fund
| | Six months ended April 30, | Years ended October 31, | | | | |
| | 2017 | 2016 | 2015 | 2014 | 2013 | 2012 |
| Selected Per–Share Data | | | | | | |
| Net asset value, beginning of period | $34.28 | $36.07 | $36.22 | $35.89 | $29.07 | $27.49 |
| Income from Investment Operations | | | | | | |
| Net investment income (loss)A | .15 | .39 | .36 | .60B | .44 | .42 |
| Net realized and unrealized gain (loss) | 3.46 | (1.71) | .80 | .28 | 6.90 | 1.65 |
| Total from investment operations | 3.61 | (1.32) | 1.16 | .88 | 7.34 | 2.07 |
| Distributions from net investment income | (.38) | (.33)C | (.40) | (.32) | (.46) | (.49) |
| Distributions from net realized gain | (.07) | (.14)C | (.92) | (.23) | (.07) | – |
| Total distributions | (.45) | (.47) | (1.31)D | (.55) | (.52)E | (.49) |
| Redemption fees added to paid in capitalA,F | – | – | – | – | – | – |
| Net asset value, end of period | $37.44 | $34.28 | $36.07 | $36.22 | $35.89 | $29.07 |
| Total ReturnG,H | 10.70% | (3.70)% | 3.29% | 2.48% | 25.66% | 7.72% |
| Ratios to Average Net AssetsI,J | | | | | | |
| Expenses before reductions | .93%K | 1.05% | 1.00% | .93% | .94% | 1.01% |
| Expenses net of fee waivers, if any | .93%K | 1.05% | .99% | .93% | .94% | 1.01% |
| Expenses net of all reductions | .92%K | 1.05% | .99% | .92% | .92% | .99% |
| Net investment income (loss) | .85%K | 1.15% | .98% | 1.65%B | 1.38% | 1.53% |
| Supplemental Data | | | | | | |
| Net assets, end of period (000 omitted) | $10,740,011 | $10,990,703 | $13,059,983 | $13,781,306 | $14,432,586 | $13,269,769 |
| Portfolio turnover rateL | 36%K,M | 24%M | 31%M | 39%M | 52% | 35% |
A Calculated based on average shares outstanding during the period.
B Net Investment income per share reflects a large, non-recurring dividend which amounted to $.18 per share. Excluding this non-recurring dividend, the ratio of net investment income (loss) to average net assets would have been 1.16%.
C The amounts shown reflect certain reclassifications related to book to tax differences that were made in the year shown.
D Total distributions of $1.31 per share is comprised of distributions from net investment income of $.397 and distributions from net realized gain of $.917 per share.
E Total distributions of $.52 per share is comprised of distributions from net investment income of $.456 and distributions from net realized gain of $.068 per share.
F Amount represents less than $.005 per share.
G Total returns for periods of less than one year are not annualized.
H Total returns would have been lower if certain expenses had not been reduced during the applicable periods shown.
I Fees and expenses of any underlying Fidelity Central Funds are not included in the Fund's expense ratio. The Fund indirectly bears its proportionate share of the expenses of any underlying Fidelity Central Funds.
J Expense ratios reflect operating expenses of the class. Expenses before reductions do not reflect amounts reimbursed by the investment adviser or reductions from brokerage service arrangements or reductions from other expense offset arrangements and do not represent the amount paid by the class during periods when reimbursements or reductions occur. Expenses net of fee waivers reflect expenses after reimbursement by the investment adviser but prior to reductions from brokerage service arrangements or other expense offset arrangements. Expenses net of all reductions represent the net expenses paid by the class.
K Annualized
L Amount does not include the portfolio activity of any underlying Fidelity Central Funds.
M Portfolio turnover rate excludes securities received or delivered in-kind.
See accompanying notes which are an integral part of the financial statements.
Financial Highlights — Fidelity Diversified International Fund Class K
| | Six months ended April 30, | Years ended October 31, | | | | |
| | 2017 | 2016 | 2015 | 2014 | 2013 | 2012 |
| Selected Per–Share Data | | | | | | |
| Net asset value, beginning of period | $34.25 | $36.04 | $36.20 | $35.87 | $29.06 | $27.51 |
| Income from Investment Operations | | | | | | |
| Net investment income (loss)A | .17 | .44 | .40 | .65B | .49 | .47 |
| Net realized and unrealized gain (loss) | 3.46 | (1.71) | .80 | .28 | 6.90 | 1.63 |
| Total from investment operations | 3.63 | (1.27) | 1.20 | .93 | 7.39 | 2.10 |
| Distributions from net investment income | (.43) | (.38)C | (.45) | (.37) | (.51) | (.55) |
| Distributions from net realized gain | (.07) | (.14)C | (.92) | (.23) | (.07) | – |
| Total distributions | (.50) | (.52) | (1.36)D | (.60) | (.58) | (.55) |
| Redemption fees added to paid in capitalA,E | – | – | – | – | – | – |
| Net asset value, end of period | $37.38 | $34.25 | $36.04 | $36.20 | $35.87 | $29.06 |
| Total ReturnF,G | 10.78% | (3.57)% | 3.40% | 2.63% | 25.86% | 7.86% |
| Ratios to Average Net AssetsH,I | | | | | | |
| Expenses before reductions | .80%J | .92% | .87% | .80% | .80% | .84% |
| Expenses net of fee waivers, if any | .80%J | .92% | .87% | .80% | .80% | .84% |
| Expenses net of all reductions | .79%J | .92% | .86% | .79% | .78% | .83% |
| Net investment income (loss) | .98%J | 1.28% | 1.10% | 1.78%B | 1.52% | 1.70% |
| Supplemental Data | | | | | | |
| Net assets, end of period (000 omitted) | $8,311,550 | $8,608,956 | $10,143,540 | $11,134,431 | $11,541,599 | $8,885,304 |
| Portfolio turnover rateK | 36%J,L | 24%L | 31%L | 39%L | 52% | 35% |
A Calculated based on average shares outstanding during the period.
B Net Investment income per share reflects a large, non-recurring dividend which amounted to $.18 per share. Excluding this non-recurring dividend, the ratio of net investment income (loss) to average net assets would have been 1.29%.
C The amounts shown reflect certain reclassifications related to book to tax differences that were made in the year shown.
D Total distributions of $1.36 per share is comprised of distributions from net investment income of $.446 and distributions from net realized gain of $.917 per share.
E Amount represents less than $.005 per share.
F Total returns for periods of less than one year are not annualized.
G Total returns would have been lower if certain expenses had not been reduced during the applicable periods shown.
H Fees and expenses of any underlying Fidelity Central Funds are not included in the Fund's expense ratio. The Fund indirectly bears its proportionate share of the expenses of any underlying Fidelity Central Funds.
I Expense ratios reflect operating expenses of the class. Expenses before reductions do not reflect amounts reimbursed by the investment adviser or reductions from brokerage service arrangements or reductions from other expense offset arrangements and do not represent the amount paid by the class during periods when reimbursements or reductions occur. Expenses net of fee waivers reflect expenses after reimbursement by the investment adviser but prior to reductions from brokerage service arrangements or other expense offset arrangements. Expenses net of all reductions represent the net expenses paid by the class.
J Annualized
K Amount does not include the portfolio activity of any underlying Fidelity Central Funds.
L Portfolio turnover rate excludes securities received or delivered in-kind.
See accompanying notes which are an integral part of the financial statements.
See accompanying notes which are an integral part of the financial statements.
Notes to Financial Statements
For the period ended April 30, 2017
1. Organization.
Fidelity Diversified International Fund (the Fund) is a fund of Fidelity Investment Trust (the Trust) and is authorized to issue an unlimited number of shares. The Trust is registered under the Investment Company Act of 1940, as amended (the 1940 Act), as an open-end management investment company organized as a Massachusetts business trust. The Fund offers Diversified International and Class K shares, each of which has equal rights as to assets and voting privileges. Each class has exclusive voting rights with respect to matters that affect that class.
2. Investments in Fidelity Central Funds.
The Fund invests in Fidelity Central Funds, which are open-end investment companies generally available only to other investment companies and accounts managed by the investment adviser and its affiliates. The Fund's Schedule of Investments lists each of the Fidelity Central Funds held as of period end, if any, as an investment of the Fund, but does not include the underlying holdings of each Fidelity Central Fund. As an Investing Fund, the Fund indirectly bears its proportionate share of the expenses of the underlying Fidelity Central Funds.
The Money Market Central Funds seek preservation of capital and current income and are managed by Fidelity Investments Money Management, Inc. (FIMM), an affiliate of the investment adviser. Annualized expenses of the Money Market Central Funds as of their most recent shareholder report date are less than .005%.
A complete unaudited list of holdings for each Fidelity Central Fund is available upon request or at the Securities and Exchange Commission (the SEC) website at www.sec.gov. In addition, the financial statements of the Fidelity Central Funds, which are not covered by the Fund's Report of Independent Registered Public Accounting Firm, are available on the SEC website or upon request.
3. Significant Accounting Policies.
The Fund is an investment company and applies the accounting and reporting guidance of the Financial Accounting Standards Board (FASB) Accounting Standards Codification Topic 946 Financial Services – Investments Companies. The financial statements have been prepared in conformity with accounting principles generally accepted in the United States of America (GAAP), which require management to make certain estimates and assumptions at the date of the financial statements. Actual results could differ from those estimates. Subsequent events, if any, through the date that the financial statements were issued have been evaluated in the preparation of the financial statements. The following summarizes the significant accounting policies of the Fund:
Investment Valuation. Investments are valued as of 4:00 p.m. Eastern time on the last calendar day of the period. The Board of Trustees (the Board) has delegated the day to day responsibility for the valuation of the Fund's investments to the Fair Value Committee (the Committee) established by the Fund's investment adviser. In accordance with valuation policies and procedures approved by the Board, the Fund attempts to obtain prices from one or more third party pricing vendors or brokers to value its investments. When current market prices, quotations or currency exchange rates are not readily available or reliable, investments will be fair valued in good faith by the Committee, in accordance with procedures adopted by the Board. Factors used in determining fair value vary by investment type and may include market or investment specific events, changes in interest rates and credit quality. The frequency with which these procedures are used cannot be predicted and they may be utilized to a significant extent. The Committee oversees the Fund's valuation policies and procedures and reports to the Board on the Committee's activities and fair value determinations. The Board monitors the appropriateness of the procedures used in valuing the Fund's investments and ratifies the fair value determinations of the Committee.
The Fund categorizes the inputs to valuation techniques used to value its investments into a disclosure hierarchy consisting of three levels as shown below:
- Level 1 – quoted prices in active markets for identical investments
- Level 2 – other significant observable inputs (including quoted prices for similar investments, interest rates, prepayment speeds, etc.)
- Level 3 – unobservable inputs (including the Fund's own assumptions based on the best information available)
Valuation techniques used to value the Fund's investments by major category are as follows:
Equity securities, including restricted securities, for which market quotations are readily available, are valued at the last reported sale price or official closing price as reported by a third party pricing vendor on the primary market or exchange on which they are traded and are categorized as Level 1 in the hierarchy. In the event there were no sales during the day or closing prices are not available, securities are valued at the last quoted bid price or may be valued using the last available price and are generally categorized as Level 2 in the hierarchy. For foreign equity securities, when market or security specific events arise, comparisons to the valuation of American Depositary Receipts (ADRs), futures contracts, Exchange-Traded Funds (ETFs) and certain indexes as well as quoted prices for similar securities may be used and would be categorized as Level 2 in the hierarchy. Utilizing these techniques may result in transfers between Level 1 and Level 2. For equity securities, including restricted securities, where observable inputs are limited, assumptions about market activity and risk are used and these securities may be categorized as Level 3 in the hierarchy.
Debt securities, including restricted securities, are valued based on evaluated prices received from third party pricing vendors or from brokers who make markets in such securities. Foreign government and government agency obligations are valued by pricing vendors who utilize matrix pricing which considers yield or price of bonds of comparable quality, coupon, maturity and type or by broker-supplied prices. When independent prices are unavailable or unreliable, debt securities may be valued utilizing pricing methodologies which consider similar factors that would be used by third party pricing vendors. Debt securities are generally categorized as Level 2 in the hierarchy but may be Level 3 depending on the circumstances.
Investments in open-end mutual funds, including the Fidelity Central Funds, are valued at their closing net asset value (NAV) each business day and are categorized as Level 1 in the hierarchy.
Changes in valuation techniques may result in transfers in or out of an assigned level within the disclosure hierarchy. The aggregate value of investments by input level as of April 30, 2017, including information on transfers between Levels 1 and 2, is included at the end of each Fund's Schedule of Investments.
Foreign Currency. The Fund may use foreign currency contracts to facilitate transactions in foreign-denominated securities. Gains and losses from these transactions may arise from changes in the value of the foreign currency or if the counterparties do not perform under the contracts' terms.
Foreign-denominated assets, including investment securities, and liabilities are translated into U.S. dollars at the exchange rates at period end. Purchases and sales of investment securities, income and dividends received and expenses denominated in foreign currencies are translated into U.S. dollars at the exchange rate in effect on the transaction date.
The effects of exchange rate fluctuations on investments are included with the net realized and unrealized gain (loss) on investment securities. Other foreign currency transactions resulting in realized and unrealized gain (loss) are disclosed separately.
Investment Transactions and Income. For financial reporting purposes, the Fund's investment holdings and NAV include trades executed through the end of the last business day of the period. The NAV per share for processing shareholder transactions is calculated as of the close of business of the New York Stock Exchange (NYSE), normally 4:00 p.m. Eastern time and includes trades executed through the end of the prior business day. Gains and losses on securities sold are determined on the basis of identified cost and may include proceeds received from litigation. Dividend income is recorded on the ex-dividend date, except for certain dividends from foreign securities where the ex-dividend date may have passed, which are recorded as soon as the Fund is informed of the ex-dividend date. Non-cash dividends included in dividend income, if any, are recorded at the fair market value of the securities received. Income and capital gain distributions from Fidelity Central Funds, if any, are recorded on the ex-dividend date. Certain distributions received by the Fund represent a return of capital or capital gain. The Fund determines the components of these distributions subsequent to the ex-dividend date, based upon receipt of tax filings or other correspondence relating to the underlying investment. These distributions are recorded as a reduction of cost of investments and/or as a realized gain. Interest income is accrued as earned and includes coupon interest and amortization of premium and accretion of discount on debt securities as applicable. Investment income is recorded net of foreign taxes withheld where recovery of such taxes is uncertain.
Class Allocations and Expenses. Investment income, realized and unrealized capital gains and losses, common expenses of the Fund, and certain fund-level expense reductions, if any, are allocated daily on a pro-rata basis to each class based on the relative net assets of each class to the total net assets of the Fund. Each class differs with respect to transfer agent fees incurred. Certain expense reductions may also differ by class. For the reporting period, the allocated portion of income and expenses to each class as a percent of its average net assets may vary due to the timing of recording these transactions in relation to fluctuating net assets of the classes. Expenses directly attributable to a fund are charged to that fund. Expenses attributable to more than one fund are allocated among the respective funds on the basis of relative net assets or other appropriate methods. Expense estimates are accrued in the period to which they relate and adjustments are made when actual amounts are known.
Deferred Trustee Compensation. Under a Deferred Compensation Plan (the Plan), independent Trustees may elect to defer receipt of a portion of their annual compensation. Deferred amounts are invested in a cross-section of Fidelity funds, are marked-to-market and remain in the Fund until distributed in accordance with the Plan. The investment of deferred amounts and the offsetting payable to the Trustees are included in the accompanying Statement of Assets and Liabilities.
Income Tax Information and Distributions to Shareholders. Each year, the Fund intends to qualify as a regulated investment company under Subchapter M of the Internal Revenue Code, including distributing substantially all of its taxable income and realized gains. As a result, no provision for U.S. Federal income taxes is required. The Fund files a U.S. federal tax return, in addition to state and local tax returns as required. The Fund's federal income tax returns are subject to examination by the Internal Revenue Service (IRS) for a period of three fiscal years after they are filed. State and local tax returns may be subject to examination for an additional fiscal year depending on the jurisdiction. Foreign taxes are provided for based on the Fund's understanding of the tax rules and rates that exist in the foreign markets in which it invests. The Fund is subject to a tax imposed on capital gains by certain countries in which it invests. An estimated deferred tax liability for net unrealized appreciation on the applicable securities is included in Other payables and accrued expenses on the Statement of Assets & Liabilities.
Distributions are declared and recorded on the ex-dividend date. Income dividends and capital gain distributions are declared separately for each class. Income and capital gain distributions are determined in accordance with income tax regulations, which may differ from GAAP.
Capital accounts within the financial statements are adjusted for permanent book-tax differences. These adjustments have no impact on net assets or the results of operations. Capital accounts are not adjusted for temporary book-tax differences which will reverse in a subsequent period.
Book-tax differences are primarily due to in-kind transactions, futures contracts, foreign currency transactions, passive foreign investment companies (PFIC), market discount, partnerships, deferred trustees compensation, capital loss carryforwards and losses deferred due to wash sales.
The federal tax cost of investment securities and unrealized appreciation (depreciation) as of period end were as follows:
| Gross unrealized appreciation | $4,956,344,552 |
| Gross unrealized depreciation | (513,976,999) |
| Net unrealized appreciation (depreciation) on securities | $4,442,367,553 |
| Tax cost | $15,093,059,878 |
Capital loss carryforwards are only available to offset future capital gains of the Fund to the extent provided by regulations and may be limited. Under the Regulated Investment Company Modernization Act of 2010 (the Act), the Fund is permitted to carry forward capital losses incurred in taxable years beginning after December 22, 2010 for an unlimited period and such capital losses are required to be used prior to any losses that expire. The capital loss carryforward information presented below, including any applicable limitation, is estimated as of prior fiscal period end and is subject to adjustment.
| No expiration | |
| Short-term | $(253,503,329) |
| Long-term | (25,640,185) |
| Total capital loss carryforward | $(279,143,514) |
Short-Term Trading (Redemption) Fees. Shares held by investors in the Fund less than 30 days may have been subject to a redemption fee equal to 1.00% of the NAV of shares redeemed. All redemption fees, which reduce the proceeds of the shareholder redemption, are retained by the Fund and accounted for as an addition to paid in capital. In November 2016, the Board of Trustees approved the elimination of these redemption fees effective December 12, 2016.
Restricted Securities. The Fund may invest in securities that are subject to legal or contractual restrictions on resale. These securities generally may be resold in transactions exempt from registration or to the public if the securities are registered. Disposal of these securities may involve time-consuming negotiations and expense, and prompt sale at an acceptable price may be difficult. Information regarding restricted securities is included at the end of the Fund's Schedule of Investments.
4. Purchases and Sales of Investments.
Purchases and sales of securities, other than short-term securities and in-kind transactions, aggregated $3,216,511,189 and $4,602,699,032, respectively.
Redemptions In-Kind. During the period, 31,504,308 shares of the Fund held by an unaffiliated entity were redeemed in-kind for investments and cash with a value of $1,072,402,638. The net realized gain of $328,380,653 on investments delivered through the in-kind redemptions is included in the accompanying Statement of Operations. The amount of the redemptions is included in share transactions activity shown in the accompanying Statement of Changes in Net Assets as well as the Notes to Financial Statements. The Fund recognized no gain or loss for federal income tax purposes.
Prior Fiscal Year Redemptions In-Kind. During the prior period, 15,503,523 shares of the Fund held by an unaffiliated entity were redeemed in-kind for investments and cash with a value of $522,690,109. The Fund had a net realized gain of $150,666,425 on investments delivered through the in-kind redemptions. The amount of the redemptions is included in share transactions activity shown in the accompanying Statement of Changes in Net Assets as well as the Notes to Financial Statements. The Fund recognized no gain or loss for federal income tax purposes.
5. Fees and Other Transactions with Affiliates.
Management Fee. Fidelity Management & Research Company (the investment adviser) and its affiliates provide the Fund with investment management related services for which the Fund pays a monthly management fee. The management fee is the sum of an individual fund fee rate that is based on an annual rate of .424% of the Fund's average net assets and an annualized group fee rate that averaged .25% during the period. The group fee rate is based upon the average net assets of all the mutual funds advised by the investment adviser, including any mutual funds previously advised by the investment adviser that are currently advised by Fidelity SelectCo, LLC, an affiliate of the investment adviser. The group fee rate decreases as assets under management increase and increases as assets under management decrease. In addition, the management fee is subject to a performance adjustment (up to a maximum of +/- .20% of the Fund's average net assets over a 36 month performance period). The upward or downward adjustment to the management fee is based on the relative investment performance of Diversified International as compared to its benchmark index, the MSCI EAFE Index, over the same 36 month performance period. For the reporting period, the total annualized management fee rate, including the performance adjustment, was .73% of the Fund's average net assets. The performance adjustment included in the management fee rate may be higher or lower than the maximum performance adjustment rate due to the difference between the average net assets for the reporting and performance periods.
Transfer Agent Fees. Fidelity Investments Institutional Operations Company, Inc., (FIIOC), an affiliate of the investment adviser, is the transfer, dividend disbursing and shareholder servicing agent for each class of the Fund. FIIOC receives account fees and asset-based fees that vary according to the account size and type of account of the shareholders of Diversified International. FIIOC receives an asset-based fee of Class K's average net assets. FIIOC pays for typesetting, printing and mailing of shareholder reports, except proxy statements.
For the period, transfer agent fees for each class were as follows:
| | Amount | % of
Class-Level Average
Net Assets(a) |
| Diversified International | $8,982,024 | .17 |
| Class K | 1,916,459 | .05 |
| | $10,898,483 | |
(a) Annualized
Accounting and Security Lending Fees. Fidelity Service Company, Inc. (FSC), an affiliate of the investment adviser, maintains the Fund's accounting records. The accounting fee is based on the level of average net assets for each month. Under a separate contract, FSC administers the security lending program. The security lending fee is based on the number and duration of lending transactions.
Brokerage Commissions. The Fund placed a portion of its portfolio transactions with brokerage firms which are affiliates of the investment adviser. Brokerage commissions are included in net realized gain (loss) and change in net unrealized appreciation (depreciation) in the Statement of Operations. The commissions paid to these affiliated firms were $21,114 for the period.
Interfund Trades. The Fund may purchase from or sell securities to other Fidelity Funds under procedures adopted by the Board. The procedures have been designed to ensure these interfund trades are executed in accordance with Rule 17a-7 of the 1940 Act. Interfund trades are included within the respective purchases and sales amounts shown in the Purchases and Sales of Investments note.
Other. During the period, the investment adviser reimbursed the Fund for certain losses in the amount of $2,106.
6. Committed Line of Credit.
The Fund participates with other funds managed by the investment adviser or an affiliate in a $4.25 billion credit facility (the "line of credit") to be utilized for temporary or emergency purposes to fund shareholder redemptions or for other short-term liquidity purposes. The Fund has agreed to pay commitment fees on its pro-rata portion of the line of credit, which amounted to $31,668 and is reflected in Miscellaneous expenses on the Statement of Operations. During the period, the Fund did not borrow on this line of credit.
7. Security Lending.
The Fund lends portfolio securities through a lending agent from time to time in order to earn additional income. For equity securities, a lending agent is used and may loan securities to certain qualified borrowers, including Fidelity Capital Markets (FCM), a broker-dealer affiliated with the Fund. On the settlement date of the loan, the Fund receives collateral (in the form of U.S. Treasury obligations, letters of credit and/or cash) against the loaned securities and maintains collateral in an amount not less than 100% of the market value of the loaned securities during the period of the loan. The market value of the loaned securities is determined at the close of business of the Fund and any additional required collateral is delivered to the Fund on the next business day. The Fund or borrower may terminate the loan at any time, and if the borrower defaults on its obligation to return the securities loaned because of insolvency or other reasons, the Fund may apply collateral received from the borrower against the obligation. The Fund may experience delays and costs in recovering the securities loaned. Any cash collateral received is invested in the Fidelity Securities Lending Cash Central Fund. The value of loaned securities and cash collateral at period end are disclosed on the Fund's Statement of Assets and Liabilities. Security lending income represents the income earned on investing cash collateral, less rebates paid to borrowers and any lending agent fees associated with the loan, plus any premium payments received for lending certain types of securities. Security lending income is presented in the Statement of Operations as a component of Income from Fidelity Central Funds. Total security lending income during the period amounted to $3,454,069. During the period, there were no securities loaned to FCM.
8. Expense Reductions.
Commissions paid to certain brokers with whom the investment adviser, or its affiliates, places trades on behalf of the Fund include an amount in addition to trade execution, which may be rebated back to the Fund to offset certain expenses. This amount totaled $868,765 for the period. Through arrangements with the Fund's custodian, credits realized as a result of certain uninvested cash balances were used to reduce the Fund's expenses. During the period, these credits reduced the Fund's custody expenses by $508.
In addition, during the period the investment adviser reimbursed and/or waived a portion of fund-level operating expenses in the amount of $82,844.
9. Distributions to Shareholders.
Distributions to shareholders of each class were as follows:
| | Six months ended
April 30, 2017 | Year ended October 31, 2016 |
| From net investment income | | |
| Diversified International | $117,261,561 | $119,184,629 |
| Class K | 105,950,318 | 106,286,535 |
| Total | $223,211,879 | $225,471,164 |
| From net realized gain | | |
| Diversified International | $21,125,448 | $50,476,541 |
| Class K | 17,001,323 | 39,125,360 |
| Total | $38,126,771 | $89,601,901 |
10. Share Transactions.
Share transactions for each class were as follows and may contain automatic conversions between classes or exchanges between affiliated funds:
| | Shares | Shares | Dollars | Dollars |
| | Six months ended
April 30, 2017 | Year ended October 31, 2016 | Six months ended
April 30, 2017 | Year ended October 31, 2016 |
| Diversified International | | | | |
| Shares sold | 17,519,187 | 36,129,943 | $604,418,549 | $1,223,164,498 |
| Reinvestment of distributions | 3,851,054 | 4,457,297 | 128,009,018 | 158,724,354 |
| Shares redeemed | (55,129,627)(a) | (82,034,474) | (1,875,998,098)(a) | (2,791,426,898) |
| Net increase (decrease) | (33,759,386) | (41,447,234) | $(1,143,570,531) | $(1,409,538,046) |
| Class K | | | | |
| Shares sold | 19,112,015 | 41,707,314 | $657,593,510 | $1,421,802,525 |
| Reinvestment of distributions | 3,707,830 | 4,092,651 | 122,951,641 | 145,411,895 |
| Shares redeemed | (51,816,109)(a) | (75,871,461)(b) | (1,778,654,904)(a) | (2,579,020,091)(b) |
| Net increase (decrease) | (28,996,264) | (30,071,496) | $(998,109,753) | $(1,011,805,671) |
(a) Amount includes in-kind redemptions (see the Redemptions In-Kind note for additional details).
(b) Amount includes in-kind redemptions (see the prior Redemptions In-Kind note for additional details).
11. Other.
The Fund's organizational documents provide former and current trustees and officers with a limited indemnification against liabilities arising in connection with the performance of their duties to the Fund. In the normal course of business, the Fund may also enter into contracts that provide general indemnifications. The Fund's maximum exposure under these arrangements is unknown as this would be dependent on future claims that may be made against the Fund. The risk of material loss from such claims is considered remote.
Report of Independent Registered Public Accounting Firm
To the Trustees of Fidelity Investment Trust and Shareholders of Fidelity Diversified International Fund:
We have audited the accompanying statement of assets and liabilities of Fidelity Diversified International Fund (the Fund), a fund of Fidelity Investment Trust, including the schedule of investments, as of April 30, 2017, and the related statement of operations for the six months then ended, the statement of changes in net assets for the six months ended April 30, 2017 and for the year ended October 31, 2016, and the financial highlights for the six months ended April 30, 2017 and each of the five years in the period ended October 31, 2016. These financial statements and financial highlights are the responsibility of the Fund's management. Our responsibility is to express an opinion on these financial statements and financial highlights based on our audits.
We conducted our audits in accordance with the standards of the Public Company Accounting Oversight Board (United States). Those standards require that we plan and perform the audit to obtain reasonable assurance about whether the financial statements and financial highlights are free of material misstatement. The Fund is not required to have, nor were we engaged to perform, an audit of its internal control over financial reporting. Our audits included consideration of internal control over financial reporting as a basis for designing audit procedures that are appropriate in the circumstances, but not for the purpose of expressing an opinion on the effectiveness of the Fund's internal control over financial reporting. Accordingly, we express no such opinion. An audit also includes examining, on a test basis, evidence supporting the amounts and disclosures in the financial statements, assessing the accounting principles used and significant estimates made by management, as well as evaluating the overall financial statement presentation. Our procedures included confirmation of securities owned as of April 30, 2017, by correspondence with the custodians and brokers; when replies were not received from brokers, we performed other auditing procedures. We believe that our audits provide a reasonable basis for our opinion.
In our opinion, such financial statements and financial highlights referred to above present fairly, in all material respects, the financial position of Fidelity Diversified International Fund as of April 30, 2017, the results of its operations for the six-months then ended, the changes in its net assets for the six months ended April 30, 2017 and for the year ended October 31, 2016, and the financial highlights for the six months ended April 30, 2017 and each of the five years in the period ended October 31, 2016, in conformity with accounting principles generally accepted in the United States of America.
DELOITTE & TOUCHE LLP
Boston, Massachusetts
June 14, 2017
Shareholder Expense Example
As a shareholder of the Fund, you incur two types of costs: (1) transaction costs, including redemption fees and (2) ongoing costs, including management fees and other Fund expenses. This Example is intended to help you understand your ongoing costs (in dollars) of investing in the Fund and to compare these costs with the ongoing costs of investing in other mutual funds.
The Example is based on an investment of $1,000 invested at the beginning of the period and held for the entire period (November 1, 2016 to April 30, 2017).
Actual Expenses
The first line of the accompanying table for each class of the Fund provides information about actual account values and actual expenses. You may use the information in this line, together with the amount you invested, to estimate the expenses that you paid over the period. Simply divide your account value by $1,000.00 (for example, an $8,600 account value divided by $1,000.00 = 8.6), then multiply the result by the number in the first line for a class of the Fund under the heading entitled "Expenses Paid During Period" to estimate the expenses you paid on your account during this period. A small balance maintenance fee of $12.00 that is charged once a year may apply for certain accounts with a value of less than $2,000. This fee is not included in the table below. If it was, the estimate of expenses you paid during the period would be higher, and your ending account value lower, by this amount. In addition, the Fund, as a shareholder in the underlying Fidelity Central Funds, will indirectly bear its pro-rata share of the fees and expenses incurred by the underlying Fidelity Central Funds. These fees and expenses are not included in the Fund's annualized expense ratio used to calculate the expense estimate in the table below.
Hypothetical Example for Comparison Purposes
The second line of the accompanying table for each class of the Fund provides information about hypothetical account values and hypothetical expenses based on a Class' actual expense ratio and an assumed rate of return of 5% per year before expenses, which is not the Class' actual return. The hypothetical account values and expenses may not be used to estimate the actual ending account balance or expenses you paid for the period. You may use this information to compare the ongoing costs of investing in the Fund and other funds. To do so, compare this 5% hypothetical example with the 5% hypothetical examples that appear in the shareholder reports of the other funds. A small balance maintenance fee of $12.00 that is charged once a year may apply for certain accounts with a value of less than $2,000. This fee is not included in the table below. If it was, the estimate of expenses you paid during the period would be higher, and your ending account value lower, by this amount. In addition, the Fund, as a shareholder in the underlying Fidelity Central Funds, will indirectly bear its pro-rata share of the fees and expenses incurred by the underlying Fidelity Central Funds. These fees and expenses are not included in the Fund's annualized expense ratio used to calculate the expense estimate in the table below.
Please note that the expenses shown in the table are meant to highlight your ongoing costs only and do not reflect any transaction costs. Therefore, the second line of the table is useful in comparing ongoing costs only, and will not help you determine the relative total costs of owning different funds. In addition, if these transactional costs were included, your costs would have been higher.
| | Annualized Expense Ratio-A | Beginning
Account Value
November 1, 2016 | Ending
Account Value
April 30, 2017 | Expenses Paid
During Period-B
November 1, 2016
to April 30, 2017 |
| Diversified International | .93% | | | |
| Actual | | $1,000.00 | $1,107.00 | $4.86 |
| Hypothetical-C | | $1,000.00 | $1,020.18 | $4.66 |
| Class K | .80% | | | |
| Actual | | $1,000.00 | $1,107.80 | $4.18 |
| Hypothetical-C | | $1,000.00 | $1,020.83 | $4.01 |
A Annualized expense ratio reflects expenses net of applicable fee waivers.
B Expenses are equal to each Class' annualized expense ratio, multiplied by the average account value over the period, multiplied by 181/365 (to reflect the one-half year period).
C 5% return per year before expenses
Corporate Headquarters
245 Summer St.
Boston, MA 02210
www.fidelity.com
DIF-K-SANN-0617
1.863008.108
Fidelity Advisor® Europe Fund -
Class A, Class M (formerly Class T), Class C and Class I
Semi-Annual Report April 30, 2017 Class A, Class M, Class C and Class I are classes of Fidelity® Europe Fund |
|
Contents
To view a fund's proxy voting guidelines and proxy voting record for the 12-month period ended June 30, visit http://www.fidelity.com/proxyvotingresults or visit the Securities and Exchange Commission's (SEC) web site at http://www.sec.gov.
You may also call 1-877-208-0098 to request a free copy of the proxy voting guidelines.
Standard & Poor's, S&P and S&P 500 are registered service marks of The McGraw-Hill Companies, Inc. and have been licensed for use by Fidelity Distributors Corporation.
Other third-party marks appearing herein are the property of their respective owners.
All other marks appearing herein are registered or unregistered trademarks or service marks of FMR LLC or an affiliated company. © 2017 FMR LLC. All rights reserved.
This report and the financial statements contained herein are submitted for the general information of the shareholders of the Fund. This report is not authorized for distribution to prospective investors in the Fund unless preceded or accompanied by an effective prospectus.
A fund files its complete schedule of portfolio holdings with the SEC for the first and third quarters of each fiscal year on Form N-Q. Forms N-Q are available on the SEC’s web site at http://www.sec.gov. A fund's Forms N-Q may be reviewed and copied at the SEC’s Public Reference Room in Washington, DC. Information regarding the operation of the SEC's Public Reference Room may be obtained by calling 1-800-SEC-0330.
For a complete list of a fund's portfolio holdings, view the most recent holdings listing, semiannual report, or annual report on Fidelity's web site at http://www.fidelity.com, http://www.institutional.fidelity.com, or http://www.401k.com, as applicable.
NOT FDIC INSURED •MAY LOSE VALUE •NO BANK GUARANTEE
Neither the Fund nor Fidelity Distributors Corporation is a bank.
Investment Summary (Unaudited)
Geographic Diversification (% of fund's net assets)
| As of April 30, 2017 |
| | Germany | 15.0% |
| | Sweden | 14.2% |
| | United Kingdom | 13.1% |
| | France | 10.4% |
| | Netherlands | 7.6% |
| | Italy | 7.3% |
| | Spain | 6.2% |
| | Switzerland | 6.0% |
| | United States of America* | 3.9% |
| | Other | 16.3% |

* Includes Short-Term investments and Net Other Assets (Liabilities).
Percentages are based on country or territory of incorporation and are adjusted for the effect of futures contracts, if applicable.
| As of October 31, 2016 |
| | United Kingdom | 20.5% |
| | Sweden | 15.4% |
| | Germany | 14.2% |
| | France | 8.7% |
| | Netherlands | 8.3% |
| | Switzerland | 8.2% |
| | Bailiwick of Jersey | 4.6% |
| | Bermuda | 3.5% |
| | Ireland | 3.3% |
| | Other* | 13.3% |

* Includes Short-Term investments and Net Other Assets (Liabilities).
Percentages are based on country or territory of incorporation and are adjusted for the effect of futures contracts, if applicable.
Asset Allocation as of April 30, 2017
| | % of fund's net assets | % of fund's net assets 6 months ago |
| Stocks | 98.7 | 99.6 |
| Short-Term Investments and Net Other Assets (Liabilities) | 1.3 | 0.4 |
Top Ten Stocks as of April 30, 2017
| | % of fund's net assets | % of fund's net assets 6 months ago |
| SAP AG (Germany, Software) | 4.3 | 4.7 |
| Getinge AB (B Shares) (Sweden, Health Care Equipment & Supplies) | 3.3 | 3.1 |
| Prudential PLC (United Kingdom, Insurance) | 3.1 | 2.2 |
| Investor AB (B Shares) (Sweden, Diversified Financial Services) | 2.8 | 2.3 |
| Autoliv, Inc. (depositary receipt) (United States of America, Auto Components) | 2.6 | 0.0 |
| Vostok New Ventures Ltd. (depositary receipt) (Bermuda, Capital Markets) | 2.6 | 2.7 |
| Unilever NV (Certificaten Van Aandelen) (Bearer) (Netherlands, Personal Products) | 2.4 | 0.0 |
| Svenska Cellulosa AB (SCA) (B Shares) (Sweden, Household Products) | 2.2 | 2.2 |
| Koninklijke Philips Electronics NV (Netherlands, Industrial Conglomerates) | 2.2 | 3.8 |
| LEG Immobilien AG (Germany, Real Estate Management & Development) | 2.2 | 0.9 |
| | 27.7 | |
Top Market Sectors as of April 30, 2017
| | % of fund's net assets | % of fund's net assets 6 months ago |
| Industrials | 19.4 | 22.2 |
| Financials | 18.6 | 21.1 |
| Consumer Discretionary | 17.0 | 12.7 |
| Health Care | 12.6 | 12.4 |
| Information Technology | 12.2 | 16.3 |
| Consumer Staples | 7.6 | 7.8 |
| Materials | 6.4 | 2.4 |
| Real Estate | 3.3 | 2.0 |
| Utilities | 1.6 | 1.2 |
| Energy | 0.0 | 1.5 |
Percentages shown as 0.0% may reflect amounts less than 0.05%.
Investments April 30, 2017 (Unaudited)
Showing Percentage of Net Assets
| Common Stocks - 96.1% | | | |
| | | Shares | Value |
| Bailiwick of Jersey - 1.8% | | | |
| Shire PLC | | 359,100 | $21,172,099 |
| Bermuda - 3.4% | | | |
| Vostok Emerging Finance Ltd. (depository receipt) (a)(b)(c) | | 53,380,307 | 9,883,791 |
| Vostok New Ventures Ltd. (depositary receipt) (a)(b) | | 3,842,161 | 29,931,143 |
|
| TOTAL BERMUDA | | | 39,814,934 |
|
| Denmark - 3.5% | | | |
| Nets A/S (d) | | 918,000 | 16,697,631 |
| Novozymes A/S Series B | | 380,100 | 16,421,411 |
| Scandinavian Tobacco Group A/S | | 424,443 | 7,409,454 |
|
| TOTAL DENMARK | | | 40,528,496 |
|
| Finland - 0.1% | | | |
| Valmet Corp. | | 57,679 | 1,051,141 |
| France - 10.4% | | | |
| Capgemini SA | | 235,900 | 23,618,779 |
| Havas SA | | 2,550,000 | 23,580,023 |
| Rubis | | 188,400 | 19,143,306 |
| Thales SA | | 224,000 | 23,551,189 |
| The Vicat Group | | 158,300 | 11,261,808 |
| Wendel SA | | 152,800 | 21,413,154 |
|
| TOTAL FRANCE | | | 122,568,259 |
|
| Germany - 15.0% | | | |
| Bertrandt AG (b) | | 85,700 | 8,949,753 |
| Brenntag AG | | 155,000 | 9,191,731 |
| CompuGroup Medical AG | | 243,325 | 11,980,437 |
| CTS Eventim AG | | 624,196 | 24,045,961 |
| Fresenius Medical Care AG & Co. KGaA | | 160,000 | 14,203,087 |
| LEG Immobilien AG | | 299,746 | 25,748,840 |
| MTU Aero Engines Holdings AG | | 124,800 | 17,897,112 |
| SAP AG | | 501,109 | 50,194,109 |
| Vonovia SE | | 370,800 | 13,424,030 |
|
| TOTAL GERMANY | | | 175,635,060 |
|
| Ireland - 3.5% | | | |
| DCC PLC (United Kingdom) | | 149,700 | 13,824,460 |
| Ryanair Holdings PLC sponsored ADR (a) | | 152,467 | 14,016,291 |
| United Drug PLC (United Kingdom) | | 1,416,741 | 13,707,173 |
|
| TOTAL IRELAND | | | 41,547,924 |
|
| Italy - 6.2% | | | |
| Banca Generali SpA | | 418,800 | 12,039,087 |
| Buzzi Unicem SpA | | 490,500 | 12,609,519 |
| Intesa Sanpaolo SpA | | 4,144,800 | 12,099,096 |
| Prada SpA | | 3,455,400 | 16,214,506 |
| UniCredit SpA | | 1,199,100 | 19,514,324 |
|
| TOTAL ITALY | | | 72,476,532 |
|
| Luxembourg - 0.2% | | | |
| B&M European Value Retail S.A. | | 551,621 | 2,407,729 |
| Malta - 0.7% | | | |
| Kambi Group PLC (a)(b) | | 764,217 | 7,851,574 |
| Netherlands - 7.6% | | | |
| CSM NV (exchangeable) | | 301,832 | 9,370,390 |
| Intertrust NV | | 725,025 | 14,531,763 |
| Koninklijke Philips Electronics NV | | 763,400 | 26,362,101 |
| Koninklijke Wessanen NV (b) | | 799,800 | 11,948,812 |
| Unilever NV (Certificaten Van Aandelen) (Bearer) | | 527,000 | 27,607,153 |
|
| TOTAL NETHERLANDS | | | 89,820,219 |
|
| Norway - 3.1% | | | |
| Orkla ASA (b) | | 1,410,200 | 12,769,980 |
| Schibsted ASA (A Shares) | | 970,800 | 24,139,972 |
|
| TOTAL NORWAY | | | 36,909,952 |
|
| Spain - 4.7% | | | |
| Amadeus IT Holding SA Class A | | 296,300 | 15,976,600 |
| CaixaBank SA | | 2,082,500 | 9,455,473 |
| Grifols SA | | 497,800 | 13,369,261 |
| Prosegur Cash SA | | 6,419,600 | 16,363,316 |
|
| TOTAL SPAIN | | | 55,164,650 |
|
| Sweden - 14.2% | | | |
| AF AB (B Shares) (b) | | 132,500 | 2,788,434 |
| Dometic Group AB | | 2,921,200 | 21,767,265 |
| Getinge AB (B Shares) | | 2,003,100 | 39,146,987 |
| Indutrade AB | | 1,079,000 | 25,497,014 |
| Investor AB (B Shares) | | 726,024 | 33,189,247 |
| Nobia AB | | 636,200 | 6,583,014 |
| Pandox AB | | 711,347 | 11,942,386 |
| Svenska Cellulosa AB (SCA) (B Shares) | | 797,500 | 26,417,362 |
|
| TOTAL SWEDEN | | | 167,331,709 |
|
| Switzerland - 6.0% | | | |
| ABB Ltd. (Reg.) | | 850,440 | 20,839,407 |
| EDAG Engineering Group AG | | 297,000 | 5,482,082 |
| Panalpina Welttransport Holding AG (b) | | 151,670 | 20,075,316 |
| Swatch Group AG (Bearer) | | 58,680 | 23,489,692 |
|
| TOTAL SWITZERLAND | | | 69,886,497 |
|
| United Kingdom - 13.1% | | | |
| British American Tobacco PLC (United Kingdom) | | 164,100 | 11,087,149 |
| Bunzl PLC | | 377,758 | 11,781,674 |
| Dechra Pharmaceuticals PLC | | 879,100 | 19,242,514 |
| Diploma PLC | | 1,204,800 | 17,305,468 |
| Essentra PLC | | 1,724,000 | 12,091,288 |
| International Personal Finance PLC | | 4,916,572 | 10,220,550 |
| Micro Focus International PLC | | 422,900 | 14,175,513 |
| NCC Group Ltd. (b) | | 11,819,524 | 21,814,823 |
| Prudential PLC | | 1,633,202 | 36,247,061 |
|
| TOTAL UNITED KINGDOM | | | 153,966,040 |
|
| United States of America - 2.6% | | | |
| Autoliv, Inc. (depositary receipt) (b) | | 300,900 | 30,116,158 |
| TOTAL COMMON STOCKS | | | |
| (Cost $1,008,804,438) | | | 1,128,248,973 |
|
| Nonconvertible Preferred Stocks - 2.6% | | | |
| Italy - 1.1% | | | |
| Buzzi Unicem SpA (Risparmio Shares) | | 889,200 | 13,143,977 |
| Spain - 1.5% | | | |
| Grifols SA Class B | | 848,950 | 18,120,696 |
| TOTAL NONCONVERTIBLE PREFERRED STOCKS | | | |
| (Cost $23,516,306) | | | 31,264,673 |
|
| Money Market Funds - 5.5% | | | |
| Fidelity Cash Central Fund, 0.85% (e) | | 34,116,993 | 34,123,816 |
| Fidelity Securities Lending Cash Central Fund 0.86% (e)(f) | | 30,306,720 | 30,309,751 |
| TOTAL MONEY MARKET FUNDS | | | |
| (Cost $64,434,039) | | | 64,433,567 |
| TOTAL INVESTMENT PORTFOLIO - 104.2% | | | |
| (Cost $1,096,754,783) | | | 1,223,947,213 |
| NET OTHER ASSETS (LIABILITIES) - (4.2)% | | | (49,505,391) |
| NET ASSETS - 100% | | | $1,174,441,822 |
Categorizations in the Schedule of Investments are based on country or territory of incorporation.
Legend
(a) Non-income producing
(b) Security or a portion of the security is on loan at period end.
(c) Affiliated company
(d) Security exempt from registration under Rule 144A of the Securities Act of 1933. These securities may be resold in transactions exempt from registration, normally to qualified institutional buyers. At the end of the period, the value of these securities amounted to $16,697,631 or 1.4% of net assets.
(e) Affiliated fund that is generally available only to investment companies and other accounts managed by Fidelity Investments. The rate quoted is the annualized seven-day yield of the fund at period end. A complete unaudited listing of the fund's holdings as of its most recent quarter end is available upon request. In addition, each Fidelity Central Fund's financial statements are available on the SEC's website or upon request.
(f) Investment made with cash collateral received from securities on loan.
Affiliated Central Funds
Information regarding fiscal year to date income earned by the Fund from investments in Fidelity Central Funds is as follows:
| Fund | Income earned |
| Fidelity Cash Central Fund | $30,823 |
| Fidelity Securities Lending Cash Central Fund | 154,957 |
| Total | $185,780 |
Other Affiliated Issuers
An affiliated company is a company in which the Fund has ownership of at least 5% of the voting securities. Fiscal year to date transactions with companies which are or were affiliates are as follows:
| Affiliate | Value, beginning of period | Purchases | Sales Proceeds | Dividend Income | Value, end of period |
| Vostok Emerging Finance Ltd. (depository receipt) | $8,746,849 | $-- | $-- | $-- | $9,883,791 |
| Total | $8,746,849 | $-- | $-- | $-- | $9,883,791 |
Investment Valuation
The following is a summary of the inputs used, as of April 30, 2017, involving the Fund's assets and liabilities carried at fair value. The inputs or methodology used for valuing securities may not be an indication of the risk associated with investing in those securities. For more information on valuation inputs, and their aggregation into the levels used below, please refer to the Investment Valuation section in the accompanying Notes to Financial Statements.
| | Valuation Inputs at Reporting Date: |
| Description | Total | Level 1 | Level 2 | Level 3 |
| Investments in Securities: | | | | |
| Equities: | | | | |
| Consumer Discretionary | $197,620,362 | $197,620,362 | $-- | $-- |
| Consumer Staples | 89,830,456 | 51,136,154 | 38,694,302 | -- |
| Financials | 217,765,696 | 159,964,066 | 57,801,630 | -- |
| Health Care | 150,942,254 | 115,567,068 | 35,375,186 | -- |
| Industrials | 227,662,854 | 180,461,346 | 47,201,508 | -- |
| Information Technology | 142,477,455 | 68,664,567 | 73,812,888 | -- |
| Materials | 74,898,393 | 74,898,393 | -- | -- |
| Real Estate | 39,172,870 | 39,172,870 | -- | -- |
| Utilities | 19,143,306 | 19,143,306 | -- | -- |
| Money Market Funds | 64,433,567 | 64,433,567 | -- | -- |
| Total Investments in Securities: | $1,223,947,213 | $971,061,699 | $252,885,514 | $-- |
The following is a summary of transfers between Level 1 and Level 2 for the period ended April 30, 2017. Transfers are assumed to have occurred at the beginning of the period, and are primarily attributable to the valuation techniques used for foreign equity securities, as discussed in the accompanying Notes to Financial Statements:
| Transfers | Total |
| Level 1 to Level 2 | $18,651,374 |
| Level 2 to Level 1 | $0 |
See accompanying notes which are an integral part of the financial statements.
Financial Statements
Statement of Assets and Liabilities
| | | April 30, 2017 (Unaudited) |
| Assets | | |
Investment in securities, at value (including securities loaned of $28,471,055) — See accompanying schedule:
Unaffiliated issuers (cost $1,025,508,726) | $1,149,629,855 | |
| Fidelity Central Funds (cost $64,434,039) | 64,433,567 | |
| Other affiliated issuers (cost $6,812,018) | 9,883,791 | |
| Total Investments (cost $1,096,754,783) | | $1,223,947,213 |
| Foreign currency held at value (cost $92,292) | | 92,298 |
| Receivable for investments sold | | 15,131,733 |
| Receivable for fund shares sold | | 2,760,119 |
| Dividends receivable | | 4,500,931 |
| Interest receivable | | 198,554 |
| Distributions receivable from Fidelity Central Funds | | 92,119 |
| Prepaid expenses | | 765 |
| Other receivables | | 269,758 |
| Total assets | | 1,246,993,490 |
| Liabilities | | |
| Payable for investments purchased | $25,010,230 | |
| Payable for fund shares redeemed | 16,241,574 | |
| Accrued management fee | 704,228 | |
| Distribution and service plan fees payable | 13,096 | |
| Other affiliated payables | 220,251 | |
| Other payables and accrued expenses | 54,792 | |
| Collateral on securities loaned | 30,307,497 | |
| Total liabilities | | 72,551,668 |
| Net Assets | | $1,174,441,822 |
| Net Assets consist of: | | |
| Paid in capital | | $1,295,034,400 |
| Undistributed net investment income | | 3,947,009 |
| Accumulated undistributed net realized gain (loss) on investments and foreign currency transactions | | (251,671,319) |
| Net unrealized appreciation (depreciation) on investments and assets and liabilities in foreign currencies | | 127,131,732 |
| Net Assets | | $1,174,441,822 |
| Calculation of Maximum Offering Price | | |
| Class A: | | |
| Net Asset Value and redemption price per share ($16,041,580 ÷ 423,791 shares) | | $37.85 |
| Maximum offering price per share (100/94.25 of $37.85) | | $40.16 |
| Class M: | | |
| Net Asset Value and redemption price per share ($7,276,678 ÷ 191,959 shares) | | $37.91 |
| Maximum offering price per share (100/96.50 of $37.91) | | $39.28 |
| Class C: | | |
| Net Asset Value and offering price per share ($8,806,571 ÷ 233,509 shares)(a) | | $37.71 |
| Europe: | | |
| Net Asset Value, offering price and redemption price per share ($1,136,055,763 ÷ 30,021,383 shares) | | $37.84 |
| Class I: | | |
| Net Asset Value, offering price and redemption price per share ($6,261,230 ÷ 165,473 shares) | | $37.84 |
(a) Redemption price per share is equal to net asset value less any applicable contingent deferred sales charge.
See accompanying notes which are an integral part of the financial statements.
Statement of Operations
| | | Six months ended April 30, 2017 (Unaudited) |
| Investment Income | | |
| Dividends | | $9,848,230 |
| Income from Fidelity Central Funds | | 185,780 |
| Income before foreign taxes withheld | | 10,034,010 |
| Less foreign taxes withheld | | (919,231) |
| Total income | | 9,114,779 |
| Expenses | | |
| Management fee | | |
| Basic fee | $3,772,806 | |
| Performance adjustment | 57,143 | |
| Transfer agent fees | 1,046,732 | |
| Distribution and service plan fees | 78,809 | |
| Accounting and security lending fees | 251,736 | |
| Custodian fees and expenses | 57,797 | |
| Independent trustees' fees and expenses | 2,202 | |
| Registration fees | 68,257 | |
| Audit | 47,320 | |
| Legal | 3,145 | |
| Interest | 2,747 | |
| Miscellaneous | 4,515 | |
| Total expenses before reductions | 5,393,209 | |
| Expense reductions | (436,283) | 4,956,926 |
| Net investment income (loss) | | 4,157,853 |
| Realized and Unrealized Gain (Loss) | | |
| Net realized gain (loss) on: | | |
| Investment securities: | | |
| Unaffiliated issuers | (32,144,735) | |
| Fidelity Central Funds | 144 | |
| Foreign currency transactions | (228,800) | |
| Total net realized gain (loss) | | (32,373,391) |
Change in net unrealized appreciation (depreciation) on:
Investment securities | 155,051,748 | |
| Assets and liabilities in foreign currencies | 76,961 | |
| Total change in net unrealized appreciation (depreciation) | | 155,128,709 |
| Net gain (loss) | | 122,755,318 |
| Net increase (decrease) in net assets resulting from operations | | $126,913,171 |
See accompanying notes which are an integral part of the financial statements.
Statement of Changes in Net Assets
| | Six months ended April 30, 2017 (Unaudited) | Year ended October 31, 2016 |
| Increase (Decrease) in Net Assets | | |
| Operations | | |
| Net investment income (loss) | $4,157,853 | $11,518,138 |
| Net realized gain (loss) | (32,373,391) | (10,272,498) |
| Change in net unrealized appreciation (depreciation) | 155,128,709 | (89,926,922) |
| Net increase (decrease) in net assets resulting from operations | 126,913,171 | (88,681,282) |
| Distributions to shareholders from net investment income | (11,727,745) | (15,981,681) |
| Distributions to shareholders from net realized gain | (3,911,424) | (5,885,187) |
| Total distributions | (15,639,169) | (21,866,868) |
| Share transactions - net increase (decrease) | (41,914,148) | (219,773,724) |
| Redemption fees | 405 | 22,478 |
| Total increase (decrease) in net assets | 69,360,259 | (330,299,396) |
| Net Assets | | |
| Beginning of period | 1,105,081,563 | 1,435,380,959 |
| End of period | $1,174,441,822 | $1,105,081,563 |
| Other Information | | |
| Undistributed net investment income end of period | $3,947,009 | $11,516,901 |
See accompanying notes which are an integral part of the financial statements.
Financial Highlights — Fidelity Europe Fund Class A
| | Six months ended (Unaudited) April 30, | Years ended October 31, | | |
| | 2017 | 2016 | 2015 | 2014 A |
| Selected Per–Share Data | | | | |
| Net asset value, beginning of period | $34.17 | $37.06 | $36.24 | $39.45 |
| Income from Investment Operations | | | | |
| Net investment income (loss)B | .08 | .22 | .37 | .47 |
| Net realized and unrealized gain (loss) | 3.95 | (2.67) | 1.29 | (3.68) |
| Total from investment operations | 4.03 | (2.45) | 1.66 | (3.21) |
| Distributions from net investment income | (.22) | (.29) | (.84) | – |
| Distributions from net realized gain | (.13) | (.15) | – | – |
| Total distributions | (.35) | (.44) | (.84) | – |
| Redemption fees added to paid in capitalB,C | – | – | – | – |
| Net asset value, end of period | $37.85 | $34.17 | $37.06 | $36.24 |
| Total ReturnD,E,F | 11.95% | (6.69)% | 4.63% | (8.14)% |
| Ratios to Average Net AssetsG,H | | | | |
| Expenses before reductions | 1.31%I | 1.39% | 1.33% | 1.35%I |
| Expenses net of fee waivers, if any | 1.31%I | 1.39% | 1.33% | 1.35%I |
| Expenses net of all reductions | 1.23%I | 1.38% | 1.31% | 1.35%I |
| Net investment income (loss) | .45%I | .62% | .98% | 1.94%I |
| Supplemental Data | | | | |
| Net assets, end of period (000 omitted) | $16,042 | $17,267 | $23,381 | $23,633 |
| Portfolio turnover rateJ | 96%I | 62% | 87% | 80%K |
A For the period March 18, 2014 (commencement of sale of shares) to October 31, 2014.
B Calculated based on average shares outstanding during the period.
C Amount represents less than $.005 per share.
D Total returns for periods of less than one year are not annualized.
E Total returns would have been lower if certain expenses had not been reduced during the applicable periods shown.
F Total returns do not include the effect of the sales charges.
G Fees and expenses of any underlying Fidelity Central Funds are not included in the Fund's expense ratio. The Fund indirectly bears its proportionate share of the expenses of any underlying Fidelity Central Funds.
H Expense ratios reflect operating expenses of the class. Expenses before reductions do not reflect amounts reimbursed by the investment adviser or reductions from brokerage service arrangements or reductions from other expense offset arrangements and do not represent the amount paid by the class during periods when reimbursements or reductions occur. Expenses net of fee waivers reflect expenses after reimbursement by the investment adviser but prior to reductions from brokerage service arrangements or other expense offset arrangements. Expenses net of all reductions represent the net expenses paid by the class.
I Annualized
J Amount does not include the portfolio activity of any underlying Fidelity Central Funds.
K The portfolio turnover rate does not include the assets acquired in the merger.
See accompanying notes which are an integral part of the financial statements.
Financial Highlights — Fidelity Europe Fund Class M
| | Six months ended (Unaudited) April 30, | Years ended October 31, | | |
| | 2017 | 2016 | 2015 | 2014 A |
| Selected Per–Share Data | | | | |
| Net asset value, beginning of period | $34.13 | $36.94 | $36.18 | $39.45 |
| Income from Investment Operations | | | | |
| Net investment income (loss)B | .03 | .11 | .26 | .40 |
| Net realized and unrealized gain (loss) | 3.97 | (2.67) | 1.29 | (3.67) |
| Total from investment operations | 4.00 | (2.56) | 1.55 | (3.27) |
| Distributions from net investment income | (.09) | (.09) | (.79) | – |
| Distributions from net realized gain | (.13) | (.15) | – | – |
| Total distributions | (.22) | (.25)C | (.79) | – |
| Redemption fees added to paid in capitalB,D | – | – | – | – |
| Net asset value, end of period | $37.91 | $34.13 | $36.94 | $36.18 |
| Total ReturnE,F,G | 11.80% | (6.99)% | 4.33% | (8.29)% |
| Ratios to Average Net AssetsH,I | | | | |
| Expenses before reductions | 1.60%J | 1.70% | 1.61% | 1.62%J |
| Expenses net of fee waivers, if any | 1.60%J | 1.70% | 1.61% | 1.61%J |
| Expenses net of all reductions | 1.52%J | 1.68% | 1.59% | 1.61%J |
| Net investment income (loss) | .16%J | .31% | .70% | 1.68%J |
| Supplemental Data | | | | |
| Net assets, end of period (000 omitted) | $7,277 | $6,980 | $9,632 | $13,679 |
| Portfolio turnover rateK | 96%J | 62% | 87% | 80%L |
A For the period March 18, 2014 (commencement of sale of shares) to October 31, 2014.
B Calculated based on average shares outstanding during the period.
C Total distributions of $.25 per share is comprised of distributions from net investment income of $.092 and distributions from net realized gain of $.154 per share.
D Amount represents less than $.005 per share.
E Total returns for periods of less than one year are not annualized.
F Total returns would have been lower if certain expenses had not been reduced during the applicable periods shown.
G Total returns do not include the effect of the sales charges.
H Fees and expenses of any underlying Fidelity Central Funds are not included in the Fund's expense ratio. The Fund indirectly bears its proportionate share of the expenses of any underlying Fidelity Central Funds.
I Expense ratios reflect operating expenses of the class. Expenses before reductions do not reflect amounts reimbursed by the investment adviser or reductions from brokerage service arrangements or reductions from other expense offset arrangements and do not represent the amount paid by the class during periods when reimbursements or reductions occur. Expenses net of fee waivers reflect expenses after reimbursement by the investment adviser but prior to reductions from brokerage service arrangements or other expense offset arrangements. Expenses net of all reductions represent the net expenses paid by the class.
J Annualized
K Amount does not include the portfolio activity of any underlying Fidelity Central Funds.
L The portfolio turnover rate does not include the assets acquired in the merger.
See accompanying notes which are an integral part of the financial statements.
Financial Highlights — Fidelity Europe Fund Class C
| | Six months ended (Unaudited) April 30, | Years ended October 31, | | |
| | 2017 | 2016 | 2015 | 2014 A |
| Selected Per–Share Data | | | | |
| Net asset value, beginning of period | $33.82 | $36.81 | $36.07 | $39.45 |
| Income from Investment Operations | | | | |
| Net investment income (loss)B | (.06) | (.06) | .07 | .29 |
| Net realized and unrealized gain (loss) | 3.95 | (2.65) | 1.29 | (3.67) |
| Total from investment operations | 3.89 | (2.71) | 1.36 | (3.38) |
| Distributions from net investment income | – | (.12) | (.62) | – |
| Distributions from net realized gain | – | (.15) | – | – |
| Total distributions | – | (.28)C | (.62) | – |
| Redemption fees added to paid in capitalB,D | – | – | – | – |
| Net asset value, end of period | $37.71 | $33.82 | $36.81 | $36.07 |
| Total ReturnE,F,G | 11.50% | (7.43)% | 3.79% | (8.57)% |
| Ratios to Average Net AssetsH,I | | | | |
| Expenses before reductions | 2.09%J | 2.18% | 2.13% | 2.10%J |
| Expenses net of fee waivers, if any | 2.09%J | 2.18% | 2.13% | 2.10%J |
| Expenses net of all reductions | 2.01%J | 2.17% | 2.11% | 2.10%J |
| Net investment income (loss) | (.32)%J | (.17)% | .18% | 1.19%J |
| Supplemental Data | | | | |
| Net assets, end of period (000 omitted) | $8,807 | $9,007 | $11,151 | $6,818 |
| Portfolio turnover rateK | 96%J | 62% | 87% | 80%L |
A For the period March 18, 2014 (commencement of sale of shares) to October 31, 2014.
B Calculated based on average shares outstanding during the period.
C Total distributions of $.28 per share is comprised of distributions from net investment income of $.123 and distributions from net realized gain of $.154 per share.
D Amount represents less than $.005 per share.
E Total returns for periods of less than one year are not annualized.
F Total returns would have been lower if certain expenses had not been reduced during the applicable periods shown.
G Total returns do not include the effect of the contingent deferred sales charge.
H Fees and expenses of any underlying Fidelity Central Funds are not included in the Fund's expense ratio. The Fund indirectly bears its proportionate share of the expenses of any underlying Fidelity Central Funds.
I Expense ratios reflect operating expenses of the class. Expenses before reductions do not reflect amounts reimbursed by the investment adviser or reductions from brokerage service arrangements or reductions from other expense offset arrangements and do not represent the amount paid by the class during periods when reimbursements or reductions occur. Expenses net of fee waivers reflect expenses after reimbursement by the investment adviser but prior to reductions from brokerage service arrangements or other expense offset arrangements. Expenses net of all reductions represent the net expenses paid by the class.
J Annualized
K Amount does not include the portfolio activity of any underlying Fidelity Central Funds.
L The portfolio turnover rate does not include the assets acquired in the merger.
See accompanying notes which are an integral part of the financial statements.
Financial Highlights — Fidelity Europe Fund
| | Six months ended (Unaudited) April 30, | Years ended October 31, | | | | |
| | 2017 | 2016 | 2015 | 2014 | 2013 | 2012 |
| Selected Per–Share Data | | | | | | |
| Net asset value, beginning of period | $34.26 | $37.19 | $36.32 | $37.92 | $30.15 | $27.67 |
| Income from Investment Operations | | | | | | |
| Net investment income (loss)A | .14 | .33 | .48 | .94B | .61 | .64 |
| Net realized and unrealized gain (loss) | 3.95 | (2.68) | 1.30 | (2.00) | 7.87 | 2.45 |
| Total from investment operations | 4.09 | (2.35) | 1.78 | (1.06) | 8.48 | 3.09 |
| Distributions from net investment income | (.38) | (.43) | (.91) | (.52) | (.70) | (.60) |
| Distributions from net realized gain | (.13) | (.15) | – | (.02) | (.01) | (.02) |
| Total distributions | (.51) | (.58) | (.91) | (.54) | (.71) | (.61)C |
| Redemption fees added to paid in capitalA,D | – | – | – | – | – | – |
| Net asset value, end of period | $37.84 | $34.26 | $37.19 | $36.32 | $37.92 | $30.15 |
| Total ReturnE,F | 12.15% | (6.42)% | 4.97% | (2.82)% | 28.71% | 11.53% |
| Ratios to Average Net AssetsG,H | | | | | | |
| Expenses before reductions | .98%I | 1.07% | 1.03% | .97% | 1.06% | .83% |
| Expenses net of fee waivers, if any | .98%I | 1.07% | 1.03% | .97% | 1.05% | .83% |
| Expenses net of all reductions | .90%I | 1.06% | 1.01% | .96% | 1.02% | .80% |
| Net investment income (loss) | .78%I | .94% | 1.28% | 2.43%B | 1.82% | 2.33% |
| Supplemental Data | | | | | | |
| Net assets, end of period (000 omitted) | $1,136,056 | $1,066,488 | $1,384,134 | $1,237,047 | $957,048 | $602,520 |
| Portfolio turnover rateJ | 96%I | 62% | 87% | 80%K | 59% | 127% |
A Calculated based on average shares outstanding during the period.
B Net Investment income per share reflects a large, non-recurring dividend which amounted to $.19 per share. Excluding this non-recurring dividend, the ratio of net investment income (loss) to average net assets would have been 1.93%.
C Total distributions of $.61 per share is comprised of distributions from net investment income of $.595 and distributions from net realized gain of $.017 per share.
D Amount represents less than $.005 per share.
E Total returns for periods of less than one year are not annualized.
F Total returns would have been lower if certain expenses had not been reduced during the applicable periods shown.
G Fees and expenses of any underlying Fidelity Central Funds are not included in the Fund's expense ratio. The Fund indirectly bears its proportionate share of the expenses of any underlying Fidelity Central Funds.
H Expense ratios reflect operating expenses of the class. Expenses before reductions do not reflect amounts reimbursed by the investment adviser or reductions from brokerage service arrangements or reductions from other expense offset arrangements and do not represent the amount paid by the class during periods when reimbursements or reductions occur. Expenses net of fee waivers reflect expenses after reimbursement by the investment adviser but prior to reductions from brokerage service arrangements or other expense offset arrangements. Expenses net of all reductions represent the net expenses paid by the class.
I Annualized
J Amount does not include the portfolio activity of any underlying Fidelity Central Funds.
K The portfolio turnover rate does not include the assets acquired in the merger.
See accompanying notes which are an integral part of the financial statements.
Financial Highlights — Fidelity Europe Fund Class I
| | Six months ended (Unaudited) April 30, | Years ended October 31, | | |
| | 2017 | 2016 | 2015 | 2014 A |
| Selected Per–Share Data | | | | |
| Net asset value, beginning of period | $34.29 | $37.21 | $36.32 | $39.45 |
| Income from Investment Operations | | | | |
| Net investment income (loss)B | .14 | .35 | .50 | .56 |
| Net realized and unrealized gain (loss) | 3.94 | (2.67) | 1.30 | (3.69) |
| Total from investment operations | 4.08 | (2.32) | 1.80 | (3.13) |
| Distributions from net investment income | (.41) | (.45) | (.91) | – |
| Distributions from net realized gain | (.13) | (.15) | – | – |
| Total distributions | (.53)C | (.60) | (.91) | – |
| Redemption fees added to paid in capitalB,D | – | – | – | – |
| Net asset value, end of period | $37.84 | $34.29 | $37.21 | $36.32 |
| Total ReturnE,F | 12.14% | (6.33)% | 5.02% | (7.93)% |
| Ratios to Average Net AssetsG,H | | | | |
| Expenses before reductions | .97%I | 1.01% | .98% | .97%I |
| Expenses net of fee waivers, if any | .97%I | 1.01% | .98% | .97%I |
| Expenses net of all reductions | .89%I | 1.00% | .96% | .96%I |
| Net investment income (loss) | .79%I | 1.00% | 1.33% | 2.33%I |
| Supplemental Data | | | | |
| Net assets, end of period (000 omitted) | $6,261 | $5,340 | $6,552 | $5,666 |
| Portfolio turnover rateJ | 96%I | 62% | 87% | 80%K |
A For the period March 18, 2014 (commencement of sale of shares) to October 31, 2014.
B Calculated based on average shares outstanding during the period.
C Total distributions of $.53 per share is comprised of distributions from net investment income of $.408 and distributions from net realized gain of $.126 per share.
D Amount represents less than $.005 per share.
E Total returns for periods of less than one year are not annualized.
F Total returns would have been lower if certain expenses had not been reduced during the applicable periods shown.
G Fees and expenses of any underlying Fidelity Central Funds are not included in the Fund's expense ratio. The Fund indirectly bears its proportionate share of the expenses of any underlying Fidelity Central Funds.
H Expense ratios reflect operating expenses of the class. Expenses before reductions do not reflect amounts reimbursed by the investment adviser or reductions from brokerage service arrangements or reductions from other expense offset arrangements and do not represent the amount paid by the class during periods when reimbursements or reductions occur. Expenses net of fee waivers reflect expenses after reimbursement by the investment adviser but prior to reductions from brokerage service arrangements or other expense offset arrangements. Expenses net of all reductions represent the net expenses paid by the class.
I Annualized
J Amount does not include the portfolio activity of any underlying Fidelity Central Funds.
K The portfolio turnover rate does not include the assets acquired in the merger.
See accompanying notes which are an integral part of the financial statements.
Notes to Financial Statements (Unaudited)
For the period ended April 30, 2017
1. Organization.
Fidelity Europe Fund (the Fund) is a fund of Fidelity Investment Trust (the Trust) and is authorized to issue an unlimited number of shares. The Trust is registered under the Investment Company Act of 1940, as amended (the 1940 Act), as an open-end management investment company organized as a Massachusetts business trust. The Fund offers Class A, Class M (formerly Class T), Class C, Europe and Class I shares, each of which has equal rights as to assets and voting privileges. Each class has exclusive voting rights with respect to matters that affect that class.
After the close of business on June 24, 2016, all outstanding Class B shares were converted to Class A shares. All prior fiscal period dollar and share amounts for Class B presented in the Notes to Financial Statements are for the period November 1, 2015 through June 24, 2016.
2. Investments in Fidelity Central Funds.
The Fund invests in Fidelity Central Funds, which are open-end investment companies generally available only to other investment companies and accounts managed by the investment adviser and its affiliates. The Fund's Schedule of Investments list each of the Fidelity Central Funds held as of period end, if any, as an investment of the Fund, but does not include the underlying holdings of each Fidelity Central Fund. As an Investing Fund, the/each Fund indirectly bears its proportionate share of the expenses of the underlying Fidelity Central Funds.
The Money Market Central Funds seek preservation of capital and current income and are managed by Fidelity Investments Money Management, Inc. (FIMM), an affiliate of the investment adviser. Annualized expenses of the Money Market Central Funds as of their most recent shareholder report date are less than .005%.
A complete unaudited list of holdings for each Fidelity Central Fund is available upon request or at the Securities and Exchange Commission (the SEC) website at www.sec.gov. In addition, the financial statements of the Fidelity Central Funds are available on the SEC website or upon request.
3. Significant Accounting Policies.
The Fund is an investment company and applies the accounting and reporting guidance of the Financial Accounting Standards Board (FASB) Accounting Standards Codification Topic 946 Financial Services – Investments Companies. The financial statements have been prepared in conformity with accounting principles generally accepted in the United States of America (GAAP), which require management to make certain estimates and assumptions at the date of the financial statements. Actual results could differ from those estimates. Subsequent events, if any, through the date that the financial statements were issued have been evaluated in the preparation of the financial statements. The following summarizes the significant accounting policies of the Fund:
Investment Valuation. Investments are valued as of 4:00 p.m. Eastern time on the last calendar day of the period. The Board of Trustees (the Board) has delegated the day to day responsibility for the valuation of the Fund's investments to the Fair Value Committee (the Committee) established by the Fund's investment adviser. In accordance with valuation policies and procedures approved by the Board, the Fund attempts to obtain prices from one or more third party pricing vendors or brokers to value its investments. When current market prices, quotations or currency exchange rates are not readily available or reliable, investments will be fair valued in good faith by the Committee, in accordance with procedures adopted by the Board. Factors used in determining fair value vary by investment type and may include market or investment specific events. The frequency with which these procedures are used cannot be predicted and they may be utilized to a significant extent. The Committee oversees the Fund's valuation policies and procedures and reports to the Board on the Committee's activities and fair value determinations. The Board monitors the appropriateness of the procedures used in valuing the Fund's investments and ratifies the fair value determinations of the Committee.
The Fund categorizes the inputs to valuation techniques used to value its investments into a disclosure hierarchy consisting of three levels as shown below:
- Level 1 – quoted prices in active markets for identical investments
- Level 2 – other significant observable inputs (including quoted prices for similar investments, interest rates, prepayment speeds, etc.)
- Level 3 – unobservable inputs (including the Fund's own assumptions based on the best information available)
Valuation techniques used to value the Fund's investments by major category are as follows:
Equity securities, including restricted securities, for which market quotations are readily available, are valued at the last reported sale price or official closing price as reported by a third party pricing vendor on the primary market or exchange on which they are traded and are categorized as Level 1 in the hierarchy. In the event there were no sales during the day or closing prices are not available, securities are valued at the last quoted bid price or may be valued using the last available price and are generally categorized as Level 2 in the hierarchy. For foreign equity securities, when market or security specific events arise, comparisons to the valuation of American Depositary Receipts (ADRs), futures contracts, Exchange-Traded Funds (ETFs) and certain indexes as well as quoted prices for similar securities may be used and would be categorized as Level 2 in the hierarchy. Utilizing these techniques may result in transfers between Level 1 and Level 2. For equity securities, including restricted securities, where observable inputs are limited, assumptions about market activity and risk are used and these securities may be categorized as Level 3 in the hierarchy.
Investments in open-end mutual funds, including the Fidelity Central Funds, are valued at their closing net asset value (NAV) each business day and are categorized as Level 1 in the hierarchy.
Changes in valuation techniques may result in transfers in or out of an assigned level within the disclosure hierarchy. The aggregate value of investments by input level as of April 30, 2017, including information on transfers between Levels 1 and 2, is included at the end of the Fund's Schedule of Investments.
Foreign Currency. The Fund may use foreign currency contracts to facilitate transactions in foreign-denominated securities. Gains and losses from these transactions may arise from changes in the value of the foreign currency or if the counterparties do not perform under the contracts' terms.
Foreign-denominated assets, including investment securities, and liabilities are translated into U.S. dollars at the exchange rates at period end. Purchases and sales of investment securities, income and dividends received and expenses denominated in foreign currencies are translated into U.S. dollars at the exchange rate in effect on the transaction date.
The effects of exchange rate fluctuations on investments are included with the net realized and unrealized gain (loss) on investment securities. Other foreign currency transactions resulting in realized and unrealized gain (loss) are disclosed separately.
Investment Transactions and Income. For financial reporting purposes, the Fund's investment holdings and NAV include trades executed through the end of the last business day of the period. The NAV per share for processing shareholder transactions is calculated as of the close of business of the New York Stock Exchange (NYSE), normally 4:00 p.m. Eastern time and includes trades executed through the end of the prior business day. Gains and losses on securities sold are determined on the basis of identified cost and may include proceeds received from litigation. Dividend income is recorded on the ex-dividend date, except for certain dividends from foreign securities where the ex-dividend date may have passed, which are recorded as soon as the Fund is informed of the ex-dividend date. Non-cash dividends included in dividend income, if any, are recorded at the fair market value of the securities received. Income and capital gain distributions from Fidelity Central Funds, if any, are recorded on the ex-dividend date. Investment income is recorded net of foreign taxes withheld where recovery of such taxes is uncertain.
Class Allocations and Expenses. Investment income, realized and unrealized capital gains and losses, common expenses of the Fund, and certain fund-level expense reductions, if any, are allocated daily on a pro-rata basis to each class based on the relative net assets of each class to the total net assets of the Fund. Each class differs with respect to transfer agent and distribution and service plan fees incurred. Certain expense reductions may also differ by class. For the reporting period, the allocated portion of income and expenses to each class as a percent of its average net assets may vary due to the timing of recording these transactions in relation to fluctuating net assets of the classes. Expenses directly attributable to a fund are charged to that fund. Expenses attributable to more than one fund are allocated among the respective funds on the basis of relative net assets or other appropriate methods. Expense estimates are accrued in the period to which they relate and adjustments are made when actual amounts are known.
Income Tax Information and Distributions to Shareholders. Each year, the Fund intends to qualify as a regulated investment company under Subchapter M of the Internal Revenue Code, including distributing substantially all of its taxable income and realized gains. As a result, no provision for U.S. Federal income taxes is required. The Fund Portfolio files a U.S. federal tax return, in addition to state and local tax returns as required. The Fund's federal income tax returns are subject to examination by the Internal Revenue Service (IRS) for a period of three fiscal years after they are filed. State and local tax returns may be subject to examination for an additional fiscal year depending on the jurisdiction. Foreign taxes are provided for based on the Fund's understanding of the tax rules and rates that exist in the foreign markets in which it invests.
Distributions are declared and recorded on the ex-dividend date. Income dividends and capital gain distributions are declared separately for each class. Income and capital gain distributions are determined in accordance with income tax regulations, which may differ from GAAP.
Capital accounts within the financial statements are adjusted for permanent book-tax differences. These adjustments have no impact on net assets or the results of operations. Capital accounts are not adjusted for temporary book-tax differences which will reverse in a subsequent period.
Book-tax differences are primarily due to foreign currency transactions, passive foreign investment companies (PFIC), deferred trustees compensation, expiring capital loss carryforwards, capital loss carryforwards and losses deferred due to wash sales.
The federal tax cost of investment securities and unrealized appreciation (depreciation) as of period end were as follows:
| Gross unrealized appreciation | $169,361,273 |
| Gross unrealized depreciation | (50,019,993) |
| Net unrealized appreciation (depreciation) on securities | $119,341,280 |
| Tax cost | $1,104,605,933 |
Capital loss carryforwards are only available to offset future capital gains of the Fund to the extent provided by regulations and may be limited. Under the Regulated Investment Company Modernization Act of 2010 (the Act), the Fund is permitted to carry forward capital losses incurred in taxable years beginning after December 22, 2010 for an unlimited period and such capital losses are required to be used prior to any losses that expire. The capital loss carryforward information presented below, including any applicable limitation, is estimated as of prior fiscal period end and is subject to adjustment.
| Fiscal year of expiration | |
| 2017 | $(199,044,876) |
| No expiration | |
| Short-term | (11,846,683) |
| Total capital loss carryforward | $(210,891,559) |
In addition, due to large redemptions in a prior period, $199,044,876 of capital losses will be limited to approximately $32,029,274 per year.
Short-Term Trading (Redemption) Fees. Shares held by investors in the Fund less than 30 days may have been subject to a redemption fee equal to 1.00% of the NAV of shares redeemed. All redemption fees, which reduce the proceeds of the shareholder redemption, are retained by the Fund and accounted for as an addition to paid in capital. In November 2016, the Board of Trustees approved the elimination of these redemption fees effective December 12, 2016.
4. Purchases and Sales of Investments.
Purchases and sales of securities, other than short-term securities, aggregated $521,855,586 and $586,140,249, respectively.
5. Fees and Other Transactions with Affiliates.
Management Fee. Fidelity Management & Research Company (the investment adviser) and its affiliates provide the Fund with investment management related services for which the Fund pays a monthly management fee. The management fee is the sum of an individual fund fee rate that is based on an annual rate of .45% of the Fund's average net assets and an annualized group fee rate that averaged .25% during the period. The group fee rate is based upon the average net assets of all the mutual funds advised by the investment adviser, including any mutual funds previously advised by the investment adviser that are currently advised by Fidelity SelectCo, LLC, an affiliate of the investment adviser. The group fee rate decreases as assets under management increase and increases as assets under management decrease. In addition, the management fee is subject to a performance adjustment (up to a maximum of +/- .20% of the Fund's average net assets over a 36 month performance period). The upward or downward adjustment to the management fee is based on the relative investment performance of Europe as compared to its benchmark index, the MSCI Europe Index, over the same 36 month performance period. For the reporting period, the total annualized management fee rate, including the performance adjustment, was .71% of the Fund's average net assets. The performance adjustment included in the management fee rate may be higher or lower than the maximum performance adjustment rate due to the difference between the average net assets for the reporting and performance periods.
Distribution and Service Plan Fees. In accordance with Rule 12b-1 of the 1940 Act, the Fund has adopted separate Distribution and Service Plans for each class of shares. Certain classes pay Fidelity Distributors Corporation (FDC), an affiliate of the investment adviser, separate Distribution and Service Fees, each of which is based on an annual percentage of each class' average net assets. In addition, FDC may pay financial intermediaries for selling shares of the Fund and providing shareholder support services. For the period, the Distribution and Service Fee rates, total fees and amounts retained by FDC were as follows:
| | Distribution
Fee | Service
Fee | Total Fees | Retained
by FDC |
| Class A | -% | .25% | $19,670 | $896 |
| Class M | .25% | .25% | 17,015 | – |
| Class C | .75% | .25% | 42,124 | 4,445 |
| | | | $78,809 | $5,341 |
Sales Load. FDC may receive a front-end sales charge of up to 5.75% for selling Class A shares and 3.50% for selling Class M shares, some of which is paid to financial intermediaries for selling shares of the Fund. Depending on the holding period, FDC may receive contingent deferred sales charges levied on Class A, Class M, and Class C redemptions. The deferred sales charges are 1.00% for Class C shares, 1.00% for certain purchases of Class A shares and .25% for certain purchases of Class M shares.
For the period, sales charge amounts retained by FDC were as follows:
| | Retained
by FDC |
| Class A | $1,860 |
| Class M | 1,161 |
| Class C(a) | 159 |
| | $3,180 |
(a) When Class C shares are initially sold, FDC pays commissions from its own resources to financial intermediaries through which the sales are made.
Transfer Agent Fees. Fidelity Investments Institutional Operations Company, Inc., (FIIOC), an affiliate of the investment adviser, is the transfer, dividend disbursing and shareholder servicing agent for each class of the Fund. FIIOC receives account fees and asset-based fees that vary according to the account size and type of account of the shareholders of the respective classes of the Fund. FIIOC pays for typesetting, printing and mailing of shareholder reports, except proxy statements.
For the period, transfer agent fees for each class were as follows:
| | Amount | % of
Class-Level Average
Net Assets(a) |
| Class A | $21,522 | .27 |
| Class M | 10,680 | .31 |
| Class C | 12,610 | .30 |
| Europe | 997,363 | .19 |
| Class I | 4,557 | .18 |
| | $1,046,732 | |
(a) Annualized
Accounting and Security Lending Fees. Fidelity Service Company, Inc. (FSC), an affiliate of the investment adviser, maintains the Fund's accounting records. The accounting fee is based on the level of average net assets for each month. Under a separate contract, FSC administers the security lending program. The security lending fee is based on the number and duration of lending transactions.
Interfund Lending Program. Pursuant to an Exemptive Order issued by the SEC, the Fund, along with other registered investment companies having management contracts with FMR or other affiliated entities of FMR, may participate in an interfund lending program. This program provides an alternative credit facility allowing the funds to borrow from, or lend money to, other participating affiliated funds. At period end, there were no interfund loans outstanding. The Fund's activity in this program during the period for which loans were outstanding was as follows:
| Borrower or Lender | Average Loan Balance | Weighted Average Interest Rate | Interest Expense |
| Borrower | $16,487,800 | .60% | $2,747 |
Interfund Trades. The Fund may purchase from or sell securities to other Fidelity Funds under procedures adopted by the Board. The procedures have been designed to ensure these interfund trades are executed in accordance with Rule 17a-7 of the 1940 Act. Interfund trades are included within the respective purchases and sales amounts shown in the Purchases and Sales of Investments note.
6. Committed Line of Credit.
The Fund participates with other funds managed by the investment adviser or an affiliate in a $4.25 billion credit facility (the "line of credit") to be utilized for temporary or emergency purposes to fund shareholder redemptions or for other short-term liquidity purposes. The Fund has agreed to pay commitment fees on its pro-rata portion of the line of credit, which amounted to $1,847 and is reflected in Miscellaneous expenses on the Statement of Operations. During the period, the Fund did not borrow on this line of credit.
7. Security Lending.
The Fund lends portfolio securities through a lending agent from time to time in order to earn additional income. For equity securities, a lending agent is used and may loan securities to certain qualified borrowers, including Fidelity Capital Markets (FCM), a broker-dealer affiliated with the Fund. On the settlement date of the loan, the Fund receives collateral (in the form of U.S. Treasury obligations, letters of credit and/or cash) against the loaned securities and maintains collateral in an amount not less than 100% of the market value of the loaned securities during the period of the loan. The market value of the loaned securities is determined at the close of business of the Fund and any additional required collateral is delivered to the Fund on the next business day. The Fund or borrower may terminate the loan at any time, and if the borrower defaults on its obligation to return the securities loaned because of insolvency or other reasons, the Fund may apply collateral received from the borrower against the obligation. The Fund may experience delays and costs in recovering the securities loaned. Any cash collateral received is invested in the Fidelity Securities Lending Cash Central Fund. The value of loaned securities at period end are disclosed on the Fund's Statement of Assets and Liabilities. Security lending income represents the income earned on investing cash collateral, less rebates paid to borrowers and any lending agent fees associated with the loan, plus any premium payments received for lending certain types of securities. Security lending income is presented in the Statement of Operations as a component of income from Fidelity Central Funds. Total security lending income during the period amounted to $154,957. During the period, there were no securities loaned to FCM.
8. Expense Reductions.
Commissions paid to certain brokers with whom the investment adviser, or its affiliates, places trades on behalf of the Fund include an amount in addition to trade execution, which may be rebated back to the Fund to offset certain expenses. This amount totaled $431,551 for the period.
In addition, during the period the investment adviser reimbursed and/or waived a portion of fund-level operating expenses in the amount of $4,732.
9. Distributions to Shareholders.
Distributions to shareholders of each class were as follows:
| | Six months ended April 30, 2017 | Year ended October 31, 2016 |
| From net investment income | | |
| Class A | $107,755 | $174,443 |
| Class M | 18,340 | 23,347 |
| Class C | – | 38,160 |
| Europe | 11,539,594 | 15,664,870 |
| Class I | 62,056 | 80,861 |
| Total | $11,727,745 | $15,981,681 |
| From net realized gain | | |
| Class A | $60,612 | $94,260 |
| Class M | 25,394 | 39,080 |
| Class C | – | 47,778 |
| Europe | 3,806,254 | 5,676,211 |
| Class I | 19,164 | 27,858 |
| Total | $3,911,424 | $5,885,187 |
10. Share Transactions.
Share Transactions for each class were as follows and may contain automatic conversions between classes or exchanges between affiliated funds:
| | Shares | Shares | Dollars | Dollars |
| | Six months ended April 30, 2017 | Year ended October 31, 2016 | Six months ended April 30, 2017 | Year ended October 31, 2016 |
| Class A | | | | |
| Shares sold | 37,895 | 144,459 | $1,311,824 | $5,004,460 |
| Reinvestment of distributions | 4,870 | 7,044 | 160,602 | 257,822 |
| Shares redeemed | (124,326) | (277,024) | (4,239,762) | (9,579,027) |
| Net increase (decrease) | (81,561) | (125,521) | $(2,767,336) | $(4,316,745) |
| Class M | | | | |
| Shares sold | 22,531 | 18,157 | $773,832 | $629,088 |
| Reinvestment of distributions | 1,308 | 1,677 | 43,249 | 61,481 |
| Shares redeemed | (36,394) | (76,071) | (1,250,315) | (2,635,140) |
| Net increase (decrease) | (12,555) | (56,237) | $(433,234) | $(1,944,571) |
| Class B | | | | |
| Shares sold | – | 183 | $– | $6,069 |
| Shares redeemed | – | (14,607) | – | (499,471) |
| Net increase (decrease) | – | (14,424) | $– | $(493,402) |
| Class C | | | | |
| Shares sold | 17,585 | 64,049 | $598,431 | $2,232,592 |
| Reinvestment of distributions | – | 2,232 | – | 81,438 |
| Shares redeemed | (50,424) | (102,859) | (1,711,243) | (3,518,604) |
| Net increase (decrease) | (32,839) | (36,578) | $(1,112,812) | $(1,204,574) |
| Europe | | | | |
| Shares sold | 2,346,878 | 2,489,815 | $82,035,246 | $86,835,858 |
| Reinvestment of distributions | 443,964 | 559,844 | 14,619,746 | 20,484,708 |
| Shares redeemed | (3,895,796) | (9,143,028) | (134,689,605) | (318,516,566) |
| Net increase (decrease) | (1,104,954) | (6,093,369) | $(38,034,613) | $(211,196,000) |
| Class I | | | | |
| Shares sold | 74,386 | 73,750 | $2,652,731 | $2,648,638 |
| Reinvestment of distributions | 2,369 | 2,803 | 78,022 | 102,586 |
| Shares redeemed | (67,031) | (96,879) | (2,296,906) | (3,369,656) |
| Net increase (decrease) | 9,724 | (20,326) | $433,847 | $(618,432) |
11. Other.
The Fund's organizational documents provide former and current trustees and officers with a limited indemnification against liabilities arising in connection with the performance of their duties to the Fund. In the normal course of business, the Fund may also enter into contracts that provide general indemnifications. The Fund's maximum exposure under these arrangements is unknown as this would be dependent on future claims that may be made against the Fund. The risk of material loss from such claims is considered remote.
Shareholder Expense Example
As a shareholder of the Fund, you incur two types of costs: (1) transaction costs, including sales charges (loads) on purchase payments or redemption proceeds, redemption fees and (2) ongoing costs, including management fees, distribution and/or service (12b-1) fees and other Fund expenses. This Example is intended to help you understand your ongoing costs (in dollars) of investing in the Fund and to compare these costs with the ongoing costs of investing in other mutual funds.
The Example is based on an investment of $1,000 invested at the beginning of the period and held for the entire period (November 1, 2016 to April 30, 2017).
Actual Expenses
The first line of the accompanying table for each class of the Fund provides information about actual account values and actual expenses. You may use the information in this line, together with the amount you invested, to estimate the expenses that you paid over the period. Simply divide your account value by $1,000.00 (for example, an $8,600 account value divided by $1,000.00 = 8.6), then multiply the result by the number in the first line for a class of the Fund under the heading entitled "Expenses Paid During Period" to estimate the expenses you paid on your account during this period. A small balance maintenance fee of $12.00 that is charged once a year may apply for certain accounts with a value of less than $2,000. This fee is not included in the table below. If it was, the estimate of expenses you paid during the period would be higher, and your ending account value lower, by this amount. In addition, the Fund, as a shareholder in the underlying Fidelity Central Funds, will indirectly bear its pro-rata share of the fees and expenses incurred by the underlying Fidelity Central Funds. These fees and expenses are not included in the Fund's annualized expense ratio used to calculate the expense estimate in the table below.
Hypothetical Example for Comparison Purposes
The second line of the accompanying table for each class of the Fund provides information about hypothetical account values and hypothetical expenses based on a Class' actual expense ratio and an assumed rate of return of 5% per year before expenses, which is not the Class' actual return. The hypothetical account values and expenses may not be used to estimate the actual ending account balance or expenses you paid for the period. You may use this information to compare the ongoing costs of investing in the Fund and other funds. To do so, compare this 5% hypothetical example with the 5% hypothetical examples that appear in the shareholder reports of the other funds. A small balance maintenance fee of $12.00 that is charged once a year may apply for certain accounts with a value of less than $2,000. This fee is not included in the table below. If it was, the estimate of expenses you paid during the period would be higher, and your ending account value lower, by this amount. In addition, the Fund, as a shareholder in the underlying Fidelity Central Funds, will indirectly bear its pro-rata share of the fees and expenses incurred by the underlying Fidelity Central Funds. These fees and expenses are not included in the Fund's annualized expense ratio used to calculate the expense estimate in the table below.
Please note that the expenses shown in the table are meant to highlight your ongoing costs only and do not reflect any transaction costs. Therefore, the second line of the table is useful in comparing ongoing costs only, and will not help you determine the relative total costs of owning different funds. In addition, if these transactional costs were included, your costs would have been higher.
| | Annualized Expense Ratio-A | Beginning
Account Value
November 1, 2016 | Ending
Account Value
April 30, 2017 | Expenses Paid
During Period-B
November 1, 2016
to April 30, 2017 |
| Class A | 1.31% | | | |
| Actual | | $1,000.00 | $1,119.50 | $6.88 |
| Hypothetical-C | | $1,000.00 | $1,018.30 | $6.56 |
| Class M | 1.60% | | | |
| Actual | | $1,000.00 | $1,118.00 | $8.40 |
| Hypothetical-C | | $1,000.00 | $1,016.86 | $8.00 |
| Class C | 2.09% | | | |
| Actual | | $1,000.00 | $1,115.00 | $10.96 |
| Hypothetical-C | | $1,000.00 | $1,014.43 | $10.44 |
| Europe | .98% | | | |
| Actual | | $1,000.00 | $1,121.50 | $5.15 |
| Hypothetical-C | | $1,000.00 | $1,019.93 | $4.91 |
| Class I | .97% | | | |
| Actual | | $1,000.00 | $1,121.40 | $5.10 |
| Hypothetical-C | | $1,000.00 | $1,019.98 | $4.86 |
A Annualized expense ratio reflects expenses net of applicable fee waivers.
B Expenses are equal to each Class' annualized expense ratio, multiplied by the average account value over the period, multiplied by 181/365 (to reflect the one-half year period).
C 5% return per year before expenses
AEUF-SANN-0617
1.9585995.103
Fidelity® International Small Cap Opportunities Fund
Semi-Annual Report April 30, 2017 |
|
Contents
To view a fund's proxy voting guidelines and proxy voting record for the 12-month period ended June 30, visit http://www.fidelity.com/proxyvotingresults or visit the Securities and Exchange Commission's (SEC) web site at http://www.sec.gov.
You may also call 1-800-544-8544 to request a free copy of the proxy voting guidelines.
Standard & Poor's, S&P and S&P 500 are registered service marks of The McGraw-Hill Companies, Inc. and have been licensed for use by Fidelity Distributors Corporation.
Other third-party marks appearing herein are the property of their respective owners.
All other marks appearing herein are registered or unregistered trademarks or service marks of FMR LLC or an affiliated company. © 2017 FMR LLC. All rights reserved.
This report and the financial statements contained herein are submitted for the general information of the shareholders of the Fund. This report is not authorized for distribution to prospective investors in the Fund unless preceded or accompanied by an effective prospectus.
A fund files its complete schedule of portfolio holdings with the SEC for the first and third quarters of each fiscal year on Form N-Q. Forms N-Q are available on the SEC’s web site at http://www.sec.gov. A fund's Forms N-Q may be reviewed and copied at the SEC’s Public Reference Room in Washington, DC. Information regarding the operation of the SEC's Public Reference Room may be obtained by calling 1-800-SEC-0330.
For a complete list of a fund's portfolio holdings, view the most recent holdings listing, semiannual report, or annual report on Fidelity's web site at http://www.fidelity.com, http://www.institutional.fidelity.com, or http://www.401k.com, as applicable.
NOT FDIC INSURED •MAY LOSE VALUE •NO BANK GUARANTEE
Neither the Fund nor Fidelity Distributors Corporation is a bank.
Investment Summary (Unaudited)
Geographic Diversification (% of fund's net assets)
| As of April 30, 2017 |
| | Japan | 30.4% |
| | United Kingdom | 18.8% |
| | Germany | 6.8% |
| | Sweden | 5.5% |
| | United States of America * | 5.4% |
| | Italy | 3.4% |
| | Australia | 2.5% |
| | Spain | 2.4% |
| | France | 2.4% |
| | Other | 22.4% |
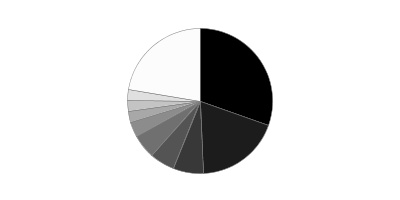
| As of October 31, 2016 |
| | Japan | 30.1% |
| | United Kingdom | 18.2% |
| | United States of America* | 8.5% |
| | Germany | 7.0% |
| | Sweden | 4.1% |
| | Italy | 3.2% |
| | Australia | 2.5% |
| | Netherlands | 2.4% |
| | France | 2.3% |
| | Other | 21.7% |

* Includes Short-Term Investments and Net Other Assets (Liabilities).
Percentages are based on country or territory of incorporation and are adjusted for the effect of futures contracts, if applicable.
Asset Allocation as of April 30, 2017
| | % of fund's net assets | % of fund's net assets 6 months ago |
| Stocks | 98.4 | 98.4 |
| Short-Term Investments and Net Other Assets (Liabilities) | 1.6 | 1.6 |
Top Ten Stocks as of April 30, 2017
| | % of fund's net assets | % of fund's net assets 6 months ago |
| Spirax-Sarco Engineering PLC (United Kingdom, Machinery) | 2.3 | 1.8 |
| Interpump Group SpA (Italy, Machinery) | 2.2 | 1.5 |
| CompuGroup Medical AG (Germany, Health Care Technology) | 2.1 | 2.0 |
| Sartorius AG (non-vtg.) (Germany, Health Care Equipment & Supplies) | 2.1 | 1.8 |
| Spectris PLC (United Kingdom, Electronic Equipment & Components) | 2.0 | 1.4 |
| Azbil Corp. (Japan, Electronic Equipment & Components) | 1.9 | 1.6 |
| Fagerhult AB (Sweden, Electrical Equipment) | 1.9 | 1.4 |
| BGFretail Co. Ltd. (Korea (South), Food & Staples Retailing) | 1.8 | 1.4 |
| OBIC Co. Ltd. (Japan, IT Services) | 1.8 | 1.7 |
| USS Co. Ltd. (Japan, Specialty Retail) | 1.7 | 2.2 |
| | 19.8 | |
Market Sectors as of April 30, 2017
| | % of fund's net assets | % of fund's net assets 6 months ago |
| Industrials | 23.6 | 20.9 |
| Consumer Discretionary | 15.0 | 19.4 |
| Health Care | 13.4 | 12.6 |
| Information Technology | 13.1 | 11.7 |
| Consumer Staples | 10.0 | 10.1 |
| Materials | 8.5 | 7.8 |
| Real Estate | 7.3 | 8.1 |
| Financials | 5.7 | 6.4 |
| Energy | 1.8 | 1.4 |
Investments April 30, 2017 (Unaudited)
Showing Percentage of Net Assets
| Common Stocks - 96.3% | | | |
| | | Shares | Value |
| Australia - 2.5% | | | |
| Adelaide Brighton Ltd. | | 802,063 | $3,555,462 |
| Beacon Lighting Group Ltd. | | 2,695,741 | 3,633,428 |
| DuluxGroup Ltd. | | 1,736,117 | 8,801,030 |
| Imdex Ltd. (a) | | 3,940,102 | 1,829,216 |
| Quintis Ltd. (b) | | 3,070,587 | 2,759,107 |
| RCG Corp. Ltd. (b) | | 6,879,148 | 4,275,418 |
|
| TOTAL AUSTRALIA | | | 24,853,661 |
|
| Austria - 1.7% | | | |
| Andritz AG | | 172,500 | 9,539,899 |
| Buwog-Gemeinnuetzige Wohnung | | 283,444 | 7,654,050 |
|
| TOTAL AUSTRIA | | | 17,193,949 |
|
| Bailiwick of Jersey - 0.4% | | | |
| Integrated Diagnostics Holdings PLC | | 1,483,779 | 4,466,175 |
| Belgium - 1.2% | | | |
| KBC Ancora (a) | | 257,848 | 12,262,951 |
| Bermuda - 0.6% | | | |
| Vostok New Ventures Ltd. (depositary receipt) (a) | | 707,589 | 5,512,249 |
| Canada - 1.7% | | | |
| McCoy Global, Inc. (a) | | 636,215 | 908,845 |
| New Look Vision Group, Inc. | | 207,200 | 4,325,995 |
| Pason Systems, Inc. | | 262,000 | 3,890,510 |
| PrairieSky Royalty Ltd. | | 107,800 | 2,349,401 |
| ShawCor Ltd. Class A | | 132,500 | 3,324,512 |
| Tesco Corp. (a) | | 274,047 | 1,795,008 |
|
| TOTAL CANADA | | | 16,594,271 |
|
| Cayman Islands - 0.3% | | | |
| 58.com, Inc. ADR (a) | | 87,900 | 3,479,082 |
| Denmark - 2.2% | | | |
| Jyske Bank A/S (Reg.) | | 183,127 | 9,786,262 |
| Scandinavian Tobacco Group A/S | | 264,149 | 4,611,220 |
| Spar Nord Bank A/S | | 651,369 | 7,383,438 |
|
| TOTAL DENMARK | | | 21,780,920 |
|
| Finland - 0.8% | | | |
| Tikkurila Oyj | | 382,646 | 7,586,056 |
| France - 2.4% | | | |
| Elis SA | | 414,962 | 8,588,344 |
| Laurent-Perrier Group SA | | 51,163 | 3,939,128 |
| Vetoquinol SA | | 101,184 | 5,557,279 |
| Virbac SA (a) | | 37,052 | 5,834,145 |
|
| TOTAL FRANCE | | | 23,918,896 |
|
| Germany - 4.7% | | | |
| CompuGroup Medical AG | | 424,478 | 20,899,752 |
| CTS Eventim AG | | 360,354 | 13,881,951 |
| Fielmann AG | | 68,873 | 5,265,139 |
| Nexus AG | | 281,358 | 6,773,280 |
|
| TOTAL GERMANY | | | 46,820,122 |
|
| India - 0.7% | | | |
| Jyothy Laboratories Ltd. | | 1,189,354 | 7,399,932 |
| Ireland - 1.7% | | | |
| FBD Holdings PLC (a) | | 240,328 | 2,133,583 |
| James Hardie Industries PLC CDI | | 894,067 | 15,177,052 |
|
| TOTAL IRELAND | | | 17,310,635 |
|
| Isle of Man - 0.9% | | | |
| Playtech Ltd. | | 743,143 | 9,230,555 |
| Israel - 2.3% | | | |
| Azrieli Group | | 96,505 | 5,139,934 |
| Ituran Location & Control Ltd. | | 300,908 | 9,418,420 |
| Strauss Group Ltd. | | 483,344 | 8,499,691 |
|
| TOTAL ISRAEL | | | 23,058,045 |
|
| Italy - 3.4% | | | |
| Azimut Holding SpA | | 427,797 | 8,350,707 |
| Beni Stabili SpA SIIQ | | 6,607,875 | 4,196,410 |
| Interpump Group SpA | | 823,043 | 21,830,767 |
|
| TOTAL ITALY | | | 34,377,884 |
|
| Japan - 30.4% | | | |
| Ai Holdings Corp. | | 202,400 | 4,978,523 |
| Aoki Super Co. Ltd. | | 318,000 | 3,936,667 |
| Artnature, Inc. | | 595,800 | 3,816,113 |
| Asahi Co. Ltd. | | 345,700 | 4,425,332 |
| Azbil Corp. | | 551,900 | 18,565,822 |
| Broadleaf Co. Ltd. | | 287,300 | 1,863,359 |
| Central Automotive Products Ltd. | | 134,000 | 1,388,383 |
| Century21 Real Estate Japan Ltd. | | 73,000 | 941,027 |
| Coca-Cola West Co. Ltd. | | 175,275 | 5,212,259 |
| Daiichikosho Co. Ltd. | | 222,300 | 9,641,808 |
| Daikokutenbussan Co. Ltd. | | 171,700 | 8,209,563 |
| Funai Soken Holdings, Inc. | | 235,700 | 4,528,992 |
| GCA Savvian Group Corp. | | 555,461 | 4,489,530 |
| Goldcrest Co. Ltd. | | 534,130 | 9,487,126 |
| Iwatsuka Confectionary Co. Ltd. | | 22,800 | 869,253 |
| Kobayashi Pharmaceutical Co. Ltd. | | 221,900 | 11,624,992 |
| Koshidaka Holdings Co. Ltd. | | 166,900 | 4,121,782 |
| Kusuri No Aoki Holdings Co. Ltd. | | 94,300 | 4,073,151 |
| Lasertec Corp. | | 702,272 | 9,141,033 |
| Medikit Co. Ltd. | | 96,100 | 4,000,036 |
| Miroku Jyoho Service Co., Ltd. | | 105,500 | 1,999,744 |
| Misumi Group, Inc. | | 481,400 | 9,116,263 |
| Nabtesco Corp. | | 191,300 | 5,422,812 |
| Nagaileben Co. Ltd. | | 500,800 | 11,536,707 |
| Nakano Refrigerators Co. Ltd. | | 146,500 | 4,021,440 |
| ND Software Co. Ltd. | | 91,682 | 828,202 |
| Nihon Parkerizing Co. Ltd. | | 1,243,000 | 15,956,340 |
| NS Tool Co. Ltd. (b) | | 71,200 | 1,025,127 |
| OBIC Co. Ltd. | | 336,500 | 18,172,057 |
| OSG Corp. (b) | | 745,200 | 15,341,861 |
| Paramount Bed Holdings Co. Ltd. | | 234,600 | 9,838,574 |
| ProNexus, Inc. | | 527,800 | 6,609,633 |
| San-Ai Oil Co. Ltd. | | 607,700 | 5,157,068 |
| SHO-BOND Holdings Co. Ltd. | | 238,700 | 10,920,565 |
| Shoei Co. Ltd. | | 309,926 | 8,604,808 |
| SK Kaken Co. Ltd. | | 83,000 | 7,892,353 |
| Software Service, Inc. | | 65,900 | 2,991,290 |
| Techno Medica Co. Ltd. | | 79,491 | 1,413,332 |
| The Monogatari Corp. | | 99,300 | 4,462,821 |
| TKC Corp. | | 247,400 | 6,724,575 |
| Tocalo Co. Ltd. | | 117,000 | 3,153,936 |
| USS Co. Ltd. | | 966,500 | 17,080,108 |
| Welcia Holdings Co. Ltd. | | 156,900 | 5,052,891 |
| Workman Co. Ltd. | | 229,500 | 6,711,550 |
| Yamada Consulting Group Co. Ltd. | | 135,700 | 6,220,471 |
| Yamato Kogyo Co. Ltd. | | 104,100 | 2,603,551 |
|
| TOTAL JAPAN | | | 304,172,830 |
|
| Korea (South) - 2.1% | | | |
| BGFretail Co. Ltd. | | 190,044 | 18,292,737 |
| Leeno Industrial, Inc. | | 63,110 | 2,363,296 |
|
| TOTAL KOREA (SOUTH) | | | 20,656,033 |
|
| Mexico - 0.4% | | | |
| Consorcio ARA S.A.B. de CV | | 11,546,078 | 3,851,708 |
| Netherlands - 2.2% | | | |
| Aalberts Industries NV | | 319,501 | 12,675,341 |
| Takeaway.com Holding BV (c) | | 74,887 | 2,522,281 |
| VastNed Retail NV | | 178,200 | 6,657,114 |
|
| TOTAL NETHERLANDS | | | 21,854,736 |
|
| Norway - 0.8% | | | |
| Kongsberg Gruppen ASA (b) | | 331,100 | 5,167,412 |
| Skandiabanken ASA | | 317,700 | 2,839,911 |
|
| TOTAL NORWAY | | | 8,007,323 |
|
| Philippines - 0.5% | | | |
| Jollibee Food Corp. | | 1,259,030 | 5,271,952 |
| South Africa - 0.9% | | | |
| Clicks Group Ltd. | | 884,913 | 8,888,364 |
| Spain - 2.4% | | | |
| Hispania Activos Inmobiliarios SA | | 366,631 | 5,535,284 |
| Merlin Properties Socimi SA | | 545,300 | 6,453,759 |
| Prosegur Compania de Seguridad SA (Reg.) | | 1,848,490 | 12,061,225 |
|
| TOTAL SPAIN | | | 24,050,268 |
|
| Sweden - 5.5% | | | |
| Addlife AB (a) | | 173,500 | 3,300,639 |
| AddTech AB (B Shares) | | 405,143 | 7,295,712 |
| Fagerhult AB | | 445,203 | 18,371,479 |
| Lagercrantz Group AB (B Shares) | | 617,207 | 6,741,871 |
| Loomis AB (B Shares) | | 224,700 | 8,156,103 |
| Saab AB (B Shares) | | 221,100 | 10,963,513 |
|
| TOTAL SWEDEN | | | 54,829,317 |
|
| Switzerland - 0.6% | | | |
| Tecan Group AG | | 34,420 | 5,873,885 |
| Taiwan - 0.4% | | | |
| Addcn Technology Co. Ltd. | | 588,435 | 4,390,434 |
| United Kingdom - 18.8% | | | |
| Alliance Pharma PLC | | 4,548,400 | 2,798,267 |
| Avon Rubber PLC | | 93,200 | 1,266,276 |
| Berendsen PLC | | 1,079,163 | 11,726,971 |
| Dechra Pharmaceuticals PLC | | 617,609 | 13,518,769 |
| Domino's Pizza UK & IRL PLC | | 746,000 | 3,193,354 |
| DP Poland PLC (a)(d) | | 7,057,200 | 4,638,796 |
| Elementis PLC | | 3,059,010 | 12,052,495 |
| Great Portland Estates PLC | | 1,015,989 | 9,106,090 |
| Hilton Food Group PLC | | 263,272 | 2,623,917 |
| Howden Joinery Group PLC | | 1,695,300 | 10,166,334 |
| Informa PLC | | 1,684,956 | 14,010,719 |
| InterContinental Hotel Group PLC ADR (b) | | 109,975 | 5,805,580 |
| ITE Group PLC | | 3,080,234 | 7,061,449 |
| Just Eat Holding Ltd. (a) | | 608,770 | 4,549,523 |
| Rightmove PLC | | 182,147 | 9,875,477 |
| Shaftesbury PLC | | 974,573 | 11,764,328 |
| Spectris PLC | | 560,078 | 20,021,400 |
| Spirax-Sarco Engineering PLC | | 339,491 | 22,864,852 |
| Ted Baker PLC | | 26,142 | 946,362 |
| Topps Tiles PLC | | 3,398,615 | 4,566,957 |
| Ultra Electronics Holdings PLC | | 342,558 | 9,281,809 |
| Unite Group PLC | | 674,423 | 5,651,627 |
|
| TOTAL UNITED KINGDOM | | | 187,491,352 |
|
| United States of America - 3.8% | | | |
| Autoliv, Inc. (b) | | 52,200 | 5,229,918 |
| China Biologic Products, Inc. (a)(b) | | 72,780 | 8,588,040 |
| Domino's Pizza, Inc. | | 10,700 | 1,940,873 |
| Martin Marietta Materials, Inc. | | 24,820 | 5,465,116 |
| Mohawk Industries, Inc. (a) | | 18,300 | 4,296,657 |
| PriceSmart, Inc. | | 84,074 | 7,310,234 |
| ResMed, Inc. | | 75,095 | 5,105,709 |
|
| TOTAL UNITED STATES OF AMERICA | | | 37,936,547 |
|
| TOTAL COMMON STOCKS | | | |
| (Cost $812,073,795) | | | 963,120,132 |
|
| Nonconvertible Preferred Stocks - 2.1% | | | |
| Germany - 2.1% | | | |
| Sartorius AG (non-vtg.) | | | |
| (Cost $8,600,093) | | 223,080 | 20,426,668 |
|
| Money Market Funds - 2.4% | | | |
| Fidelity Cash Central Fund, 0.85% (e) | | 8,966,089 | 8,967,883 |
| Fidelity Securities Lending Cash Central Fund 0.86% (e)(f) | | 14,966,068 | 14,967,564 |
| TOTAL MONEY MARKET FUNDS | | | |
| (Cost $23,936,241) | | | 23,935,447 |
| TOTAL INVESTMENT PORTFOLIO - 100.8% | | | |
| (Cost $844,610,129) | | | 1,007,482,247 |
| NET OTHER ASSETS (LIABILITIES) - (0.8)% | | | (7,746,682) |
| NET ASSETS - 100% | | | $999,735,565 |
Categorizations in the Schedule of Investments are based on country or territory of incorporation.
Legend
(a) Non-income producing
(b) Security or a portion of the security is on loan at period end.
(c) Security exempt from registration under Rule 144A of the Securities Act of 1933. These securities may be resold in transactions exempt from registration, normally to qualified institutional buyers. At the end of the period, the value of these securities amounted to $2,522,281 or 0.3% of net assets.
(d) Affiliated company
(e) Affiliated fund that is generally available only to investment companies and other accounts managed by Fidelity Investments. The rate quoted is the annualized seven-day yield of the fund at period end. A complete unaudited listing of the fund's holdings as of its most recent quarter end is available upon request. In addition, each Fidelity Central Fund's financial statements are available on the SEC's website or upon request.
(f) Investment made with cash collateral received from securities on loan.
Affiliated Central Funds
Information regarding fiscal year to date income earned by the Fund from investments in Fidelity Central Funds is as follows:
| Fund | Income earned |
| Fidelity Cash Central Fund | $76,120 |
| Fidelity Securities Lending Cash Central Fund | 106,612 |
| Total | $182,732 |
Other Affiliated Issuers
An affiliated company is a company in which the Fund has ownership of at least 5% of the voting securities. Fiscal year to date transactions with companies which are or were affiliates are as follows:
| Affiliate | Value, beginning of period | Purchases | Sales Proceeds | Dividend Income | Value, end of period |
| DP Poland PLC | $5,450,276 | $64,232 | $907,568 | $-- | $4,638,796 |
| Total | $5,450,276 | $64,232 | $907,568 | $-- | $4,638,796 |
Investment Valuation
All investments are categorized as Level 1 under the Fair Value Hierarchy. The inputs or methodology used for valuing securities may not be an indication of the risk associated with investing in those securities. For more information on valuation inputs please refer to the Investment Valuation section in the accompanying Notes to Financial Statements.
See accompanying notes which are an integral part of the financial statements.
Financial Statements
Statement of Assets and Liabilities
| | | April 30, 2017 (Unaudited) |
| Assets | | |
Investment in securities, at value (including securities loaned of $14,172,150) — See accompanying schedule:
Unaffiliated issuers (cost $818,797,323) | $978,908,004 | |
| Fidelity Central Funds (cost $23,936,241) | 23,935,447 | |
| Other affiliated issuers (cost $1,876,565) | 4,638,796 | |
| Total Investments (cost $844,610,129) | | $1,007,482,247 |
| Receivable for investments sold | | 5,488,258 |
| Receivable for fund shares sold | | 1,189,162 |
| Dividends receivable | | 5,048,474 |
| Distributions receivable from Fidelity Central Funds | | 39,530 |
| Prepaid expenses | | 739 |
| Other receivables | | 14,652 |
| Total assets | | 1,019,263,062 |
| Liabilities | | |
| Payable for investments purchased | $2,364,536 | |
| Payable for fund shares redeemed | 1,182,921 | |
| Accrued management fee | 728,238 | |
| Distribution and service plan fees payable | 22,834 | |
| Other affiliated payables | 205,983 | |
| Other payables and accrued expenses | 56,049 | |
| Collateral on securities loaned | 14,966,936 | |
| Total liabilities | | 19,527,497 |
| Net Assets | | $999,735,565 |
| Net Assets consist of: | | |
| Paid in capital | | $1,013,074,959 |
| Undistributed net investment income | | 2,712,899 |
| Accumulated undistributed net realized gain (loss) on investments and foreign currency transactions | | (178,921,818) |
| Net unrealized appreciation (depreciation) on investments and assets and liabilities in foreign currencies | | 162,869,525 |
| Net Assets | | $999,735,565 |
| Calculation of Maximum Offering Price | | |
| Class A: | | |
| Net Asset Value and redemption price per share ($39,215,065 ÷ 2,382,078 shares) | | $16.46 |
| Maximum offering price per share (100/94.25 of $16.46) | | $17.46 |
| Class M: | | |
| Net Asset Value and redemption price per share ($12,067,399 ÷ 737,837 shares) | | $16.36 |
| Maximum offering price per share (100/96.50 of $16.36) | | $16.95 |
| Class C: | | |
| Net Asset Value and offering price per share ($12,536,393 ÷ 785,142 shares)(a) | | $15.97 |
| International Small Cap Opportunities: | | |
| Net Asset Value, offering price and redemption price per share ($804,353,447 ÷ 48,362,640 shares) | | $16.63 |
| Class I: | | |
| Net Asset Value, offering price and redemption price per share ($131,563,261 ÷ 7,920,155 shares) | | $16.61 |
(a) Redemption price per share is equal to net asset value less any applicable contingent deferred sales charge.
See accompanying notes which are an integral part of the financial statements.
Statement of Operations
| | | Six months ended April 30, 2017 (Unaudited) |
| Investment Income | | |
| Dividends | | $10,382,535 |
| Income from Fidelity Central Funds | | 182,732 |
| Income before foreign taxes withheld | | 10,565,267 |
| Less foreign taxes withheld | | (1,001,818) |
| Total income | | 9,563,449 |
| Expenses | | |
| Management fee | | |
| Basic fee | $4,127,157 | |
| Performance adjustment | 74,067 | |
| Transfer agent fees | 998,611 | |
| Distribution and service plan fees | 140,161 | |
| Accounting and security lending fees | 229,336 | |
| Custodian fees and expenses | 84,070 | |
| Independent trustees' fees and expenses | 2,011 | |
| Registration fees | 42,545 | |
| Audit | 38,720 | |
| Legal | 1,533 | |
| Interest | 2,066 | |
| Miscellaneous | 5,741 | |
| Total expenses before reductions | 5,746,018 | |
| Expense reductions | (21,960) | 5,724,058 |
| Net investment income (loss) | | 3,839,391 |
| Realized and Unrealized Gain (Loss) | | |
| Net realized gain (loss) on: | | |
| Investment securities: | | |
| Unaffiliated issuers | 30,961,072 | |
| Fidelity Central Funds | (904) | |
| Other affiliated issuers | 599,349 | |
| Foreign currency transactions | (136,477) | |
| Total net realized gain (loss) | | 31,423,040 |
Change in net unrealized appreciation (depreciation) on:
Investment securities | 77,011,792 | |
| Assets and liabilities in foreign currencies | 123,402 | |
| Total change in net unrealized appreciation (depreciation) | | 77,135,194 |
| Net gain (loss) | | 108,558,234 |
| Net increase (decrease) in net assets resulting from operations | | $112,397,625 |
See accompanying notes which are an integral part of the financial statements.
Statement of Changes in Net Assets
| | Six months ended April 30, 2017 (Unaudited) | Year ended October 31, 2016 |
| Increase (Decrease) in Net Assets | | |
| Operations | | |
| Net investment income (loss) | $3,839,391 | $9,502,103 |
| Net realized gain (loss) | 31,423,040 | 53,842,316 |
| Change in net unrealized appreciation (depreciation) | 77,135,194 | (43,765,071) |
| Net increase (decrease) in net assets resulting from operations | 112,397,625 | 19,579,348 |
| Distributions to shareholders from net investment income | (10,623,894) | (4,852,691) |
| Distributions to shareholders from net realized gain | (2,566,471) | (4,655,673) |
| Total distributions | (13,190,365) | (9,508,364) |
| Share transactions - net increase (decrease) | (135,200,456) | 68,430,907 |
| Redemption fees | 141,153 | 241,368 |
| Total increase (decrease) in net assets | (35,852,043) | 78,743,259 |
| Net Assets | | |
| Beginning of period | 1,035,587,608 | 956,844,349 |
| End of period | $999,735,565 | $1,035,587,608 |
| Other Information | | |
| Undistributed net investment income end of period | $2,712,899 | $9,497,402 |
See accompanying notes which are an integral part of the financial statements.
Financial Highlights — Fidelity International Small Cap Opportunities Fund Class A
| | Six months ended (Unaudited) April 30, | Years ended October 31, | | | | |
| | 2017 | 2016 | 2015 | 2014 | 2013 | 2012 |
| Selected Per–Share Data | | | | | | |
| Net asset value, beginning of period | $14.82 | $14.75 | $13.65 | $13.68 | $10.78 | $9.75 |
| Income from Investment Operations | | | | | | |
| Net investment income (loss)A | .04 | .09 | .06 | .05 | .07 | .08 |
| Net realized and unrealized gain (loss) | 1.76 | .10 | 1.11 | .05 | 2.91 | 1.07 |
| Total from investment operations | 1.80 | .19 | 1.17 | .10 | 2.98 | 1.15 |
| Distributions from net investment income | (.12) | (.05) | (.05) | (.06) | (.08) | (.11) |
| Distributions from net realized gain | (.04) | (.07) | (.02) | (.08) | (.01) | (.01) |
| Total distributions | (.16) | (.12) | (.07) | (.13)B | (.08)C | (.12) |
| Redemption fees added to paid in capitalA,D | – | – | – | – | – | – |
| Net asset value, end of period | $16.46 | $14.82 | $14.75 | $13.65 | $13.68 | $10.78 |
| Total ReturnE,F,G | 12.29% | 1.30% | 8.62% | .78% | 27.85% | 12.00% |
| Ratios to Average Net AssetsH,I | | | | | | |
| Expenses before reductions | 1.44%J | 1.45% | 1.52% | 1.63% | 1.70% | 1.75% |
| Expenses net of fee waivers, if any | 1.44%J | 1.45% | 1.52% | 1.63% | 1.65% | 1.65% |
| Expenses net of all reductions | 1.44%J | 1.45% | 1.51% | 1.63% | 1.64% | 1.64% |
| Net investment income (loss) | .52%J | .62% | .38% | .33% | .59% | .85% |
| Supplemental Data | | | | | | |
| Net assets, end of period (000 omitted) | $39,215 | $45,151 | $42,289 | $25,041 | $22,052 | $18,194 |
| Portfolio turnover rateK | 12%J | 24% | 21% | 18% | 31% | 28% |
A Calculated based on average shares outstanding during the period.
B Total distributions of $.13 per share is comprised of distributions from net investment income of $.055 and net realized gain of $.079 per share.
C Total distributions of $.08 per share is comprised of distributions from net investment income of $.077 and distributions from net realized gain of $.005 per share.
D Amount represents less than $.005 per share.
E Total returns for periods of less than one year are not annualized.
F Total returns would have been lower if certain expenses had not been reduced during the applicable periods shown.
G Total returns do not include the effect of the sales charges.
H Fees and expenses of any underlying Fidelity Central Funds are not included in the Fund's expense ratio. The Fund indirectly bears its proportionate share of the expenses of any underlying Fidelity Central Funds.
I Expense ratios reflect operating expenses of the class. Expenses before reductions do not reflect amounts reimbursed by the investment adviser or reductions from brokerage service arrangements or reductions from other expense offset arrangements and do not represent the amount paid by the class during periods when reimbursements or reductions occur. Expenses net of fee waivers reflect expenses after reimbursement by the investment adviser but prior to reductions from brokerage service arrangements or other expense offset arrangements. Expenses net of all reductions represent the net expenses paid by the class.
J Annualized
K Amount does not include the portfolio activity of any underlying Fidelity Central Funds.
See accompanying notes which are an integral part of the financial statements.
Financial Highlights — Fidelity International Small Cap Opportunities Fund Class M
| | Six months ended (Unaudited) April 30, | Years ended October 31, | | | | |
| | 2017 | 2016 | 2015 | 2014 | 2013 | 2012 |
| Selected Per–Share Data | | | | | | |
| Net asset value, beginning of period | $14.68 | $14.62 | $13.53 | $13.56 | $10.69 | $9.66 |
| Income from Investment Operations | | | | | | |
| Net investment income (loss)A | .02 | .04 | .01 | .01 | .04 | .06 |
| Net realized and unrealized gain (loss) | 1.76 | .10 | 1.11 | .06 | 2.89 | 1.06 |
| Total from investment operations | 1.78 | .14 | 1.12 | .07 | 2.93 | 1.12 |
| Distributions from net investment income | (.06) | (.01) | (.01) | (.02) | (.05) | (.08) |
| Distributions from net realized gain | (.04) | (.07) | (.02) | (.08) | (.01) | (.01) |
| Total distributions | (.10) | (.08) | (.03) | (.10) | (.06) | (.09) |
| Redemption fees added to paid in capitalA,B | – | – | – | – | – | – |
| Net asset value, end of period | $16.36 | $14.68 | $14.62 | $13.53 | $13.56 | $10.69 |
| Total ReturnC,D,E | 12.19% | .95% | 8.27% | .55% | 27.53% | 11.72% |
| Ratios to Average Net AssetsF,G | | | | | | |
| Expenses before reductions | 1.75%H | 1.77% | 1.80% | 1.89% | 1.96% | 2.02% |
| Expenses net of fee waivers, if any | 1.75%H | 1.77% | 1.80% | 1.89% | 1.90% | 1.90% |
| Expenses net of all reductions | 1.75%H | 1.77% | 1.80% | 1.89% | 1.89% | 1.89% |
| Net investment income (loss) | .21%H | .30% | .10% | .07% | .34% | .60% |
| Supplemental Data | | | | | | |
| Net assets, end of period (000 omitted) | $12,067 | $12,308 | $13,296 | $9,913 | $9,634 | $8,169 |
| Portfolio turnover rateI | 12%H | 24% | 21% | 18% | 31% | 28% |
A Calculated based on average shares outstanding during the period.
B Amount represents less than $.005 per share.
C Total returns for periods of less than one year are not annualized.
D Total returns would have been lower if certain expenses had not been reduced during the applicable periods shown.
E Total returns do not include the effect of the sales charges.
F Fees and expenses of any underlying Fidelity Central Funds are not included in the Fund's expense ratio. The Fund indirectly bears its proportionate share of the expenses of any underlying Fidelity Central Funds.
G Expense ratios reflect operating expenses of the class. Expenses before reductions do not reflect amounts reimbursed by the investment adviser or reductions from brokerage service arrangements or reductions from other expense offset arrangements and do not represent the amount paid by the class during periods when reimbursements or reductions occur. Expenses net of fee waivers reflect expenses after reimbursement by the investment adviser but prior to reductions from brokerage service arrangements or other expense offset arrangements. Expenses net of all reductions represent the net expenses paid by the class.
H Annualized
I Amount does not include the portfolio activity of any underlying Fidelity Central Funds.
See accompanying notes which are an integral part of the financial statements.
Financial Highlights — Fidelity International Small Cap Opportunities Fund Class C
| | Six months ended (Unaudited) April 30, | Years ended October 31, | | | | |
| | 2017 | 2016 | 2015 | 2014 | 2013 | 2012 |
| Selected Per–Share Data | | | | | | |
| Net asset value, beginning of period | $14.27 | $14.26 | $13.23 | $13.28 | $10.48 | $9.47 |
| Income from Investment Operations | | | | | | |
| Net investment income (loss)A | (.02) | (.03) | (.05) | (.06) | (.02) | .01 |
| Net realized and unrealized gain (loss) | 1.72 | .09 | 1.08 | .06 | 2.84 | 1.04 |
| Total from investment operations | 1.70 | .06 | 1.03 | – | 2.82 | 1.05 |
| Distributions from net investment income | – | – | – | – | (.01) | (.03) |
| Distributions from net realized gain | – | (.05) | – | (.05) | (.01) | (.01) |
| Total distributions | – | (.05) | – | (.05) | (.02) | (.04) |
| Redemption fees added to paid in capitalA,B | – | – | – | – | – | – |
| Net asset value, end of period | $15.97 | $14.27 | $14.26 | $13.23 | $13.28 | $10.48 |
| Total ReturnC,D,E | 11.91% | .44% | 7.79% | .03% | 26.91% | 11.13% |
| Ratios to Average Net AssetsF,G | | | | | | |
| Expenses before reductions | 2.24%H | 2.26% | 2.27% | 2.38% | 2.45% | 2.50% |
| Expenses net of fee waivers, if any | 2.23%H | 2.26% | 2.27% | 2.38% | 2.40% | 2.40% |
| Expenses net of all reductions | 2.23%H | 2.25% | 2.26% | 2.38% | 2.39% | 2.39% |
| Net investment income (loss) | (.27)%H | (.19)% | (.36)% | (.42)% | (.16)% | .10% |
| Supplemental Data | | | | | | |
| Net assets, end of period (000 omitted) | $12,536 | $12,625 | $17,370 | $8,438 | $8,070 | $6,608 |
| Portfolio turnover rateI | 12%H | 24% | 21% | 18% | 31% | 28% |
A Calculated based on average shares outstanding during the period.
B Amount represents less than $.005 per share.
C Total returns for periods of less than one year are not annualized.
D Total returns would have been lower if certain expenses had not been reduced during the applicable periods shown.
E Total returns do not include the effect of the contingent deferred sales charge.
F Fees and expenses of any underlying Fidelity Central Funds are not included in the Fund's expense ratio. The Fund indirectly bears its proportionate share of the expenses of any underlying Fidelity Central Funds.
G Expense ratios reflect operating expenses of the class. Expenses before reductions do not reflect amounts reimbursed by the investment adviser or reductions from brokerage service arrangements or reductions from other expense offset arrangements and do not represent the amount paid by the class during periods when reimbursements or reductions occur. Expenses net of fee waivers reflect expenses after reimbursement by the investment adviser but prior to reductions from brokerage service arrangements or other expense offset arrangements. Expenses net of all reductions represent the net expenses paid by the class.
H Annualized
I Amount does not include the portfolio activity of any underlying Fidelity Central Funds.
See accompanying notes which are an integral part of the financial statements.
Financial Highlights — Fidelity International Small Cap Opportunities Fund
| | Six months ended (Unaudited) April 30, | Years ended October 31, | | | | |
| | 2017 | 2016 | 2015 | 2014 | 2013 | 2012 |
| Selected Per–Share Data | | | | | | |
| Net asset value, beginning of period | $15.00 | $14.91 | $13.80 | $13.82 | $10.88 | $9.85 |
| Income from Investment Operations | | | | | | |
| Net investment income (loss)A | .06 | .13 | .10 | .09 | .10 | .11 |
| Net realized and unrealized gain (loss) | 1.78 | .11 | 1.12 | .06 | 2.95 | 1.07 |
| Total from investment operations | 1.84 | .24 | 1.22 | .15 | 3.05 | 1.18 |
| Distributions from net investment income | (.17) | (.08) | (.09) | (.09) | (.10) | (.14) |
| Distributions from net realized gain | (.04) | (.07) | (.02) | (.08) | (.01) | (.01) |
| Total distributions | (.21) | (.15) | (.11) | (.17) | (.11) | (.15) |
| Redemption fees added to paid in capitalA,B | – | – | – | – | – | – |
| Net asset value, end of period | $16.63 | $15.00 | $14.91 | $13.80 | $13.82 | $10.88 |
| Total ReturnC,D | 12.46% | 1.58% | 8.92% | 1.11% | 28.24% | 12.21% |
| Ratios to Average Net AssetsE,F | | | | | | |
| Expenses before reductions | 1.14%G | 1.17% | 1.23% | 1.30% | 1.39% | 1.47% |
| Expenses net of fee waivers, if any | 1.14%G | 1.17% | 1.22% | 1.30% | 1.39% | 1.40% |
| Expenses net of all reductions | 1.14%G | 1.16% | 1.22% | 1.30% | 1.38% | 1.39% |
| Net investment income (loss) | .82%G | .90% | .68% | .65% | .85% | 1.10% |
| Supplemental Data | | | | | | |
| Net assets, end of period (000 omitted) | $804,353 | $809,952 | $762,563 | $584,253 | $518,121 | $334,918 |
| Portfolio turnover rateH | 12%G | 24% | 21% | 18% | 31% | 28% |
A Calculated based on average shares outstanding during the period.
B Amount represents less than $.005 per share.
C Total returns for periods of less than one year are not annualized.
D Total returns would have been lower if certain expenses had not been reduced during the applicable periods shown.
E Fees and expenses of any underlying Fidelity Central Funds are not included in the Fund's expense ratio. The Fund indirectly bears its proportionate share of the expenses of any underlying Fidelity Central Funds.
F Expense ratios reflect operating expenses of the class. Expenses before reductions do not reflect amounts reimbursed by the investment adviser or reductions from brokerage service arrangements or reductions from other expense offset arrangements and do not represent the amount paid by the class during periods when reimbursements or reductions occur. Expenses net of fee waivers reflect expenses after reimbursement by the investment adviser but prior to reductions from brokerage service arrangements or other expense offset arrangements. Expenses net of all reductions represent the net expenses paid by the class.
G Annualized
H Amount does not include the portfolio activity of any underlying Fidelity Central Funds.
See accompanying notes which are an integral part of the financial statements.
Financial Highlights — Fidelity International Small Cap Opportunities Fund Class I
| | Six months ended (Unaudited) April 30, | Years ended October 31, | | | | |
| | 2017 | 2016 | 2015 | 2014 | 2013 | 2012 |
| Selected Per–Share Data | | | | | | |
| Net asset value, beginning of period | $14.99 | $14.91 | $13.81 | $13.83 | $10.90 | $9.86 |
| Income from Investment Operations | | | | | | |
| Net investment income (loss)A | .06 | .13 | .10 | .08 | .11 | .11 |
| Net realized and unrealized gain (loss) | 1.78 | .10 | 1.13 | .07 | 2.93 | 1.08 |
| Total from investment operations | 1.84 | .23 | 1.23 | .15 | 3.04 | 1.19 |
| Distributions from net investment income | (.18) | (.08) | (.11) | (.09) | (.10) | (.14) |
| Distributions from net realized gain | (.04) | (.07) | (.02) | (.08) | (.01) | (.01) |
| Total distributions | (.22) | (.15) | (.13) | (.17) | (.11) | (.15) |
| Redemption fees added to paid in capitalA,B | – | – | – | – | – | – |
| Net asset value, end of period | $16.61 | $14.99 | $14.91 | $13.81 | $13.83 | $10.90 |
| Total ReturnC,D | 12.46% | 1.56% | 8.98% | 1.11% | 28.11% | 12.32% |
| Ratios to Average Net AssetsE,F | | | | | | |
| Expenses before reductions | 1.15%G | 1.16% | 1.19% | 1.36% | 1.38% | 1.44% |
| Expenses net of fee waivers, if any | 1.15%G | 1.16% | 1.19% | 1.36% | 1.37% | 1.40% |
| Expenses net of all reductions | 1.15%G | 1.16% | 1.18% | 1.36% | 1.37% | 1.39% |
| Net investment income (loss) | .81%G | .91% | .71% | .60% | .87% | 1.10% |
| Supplemental Data | | | | | | |
| Net assets, end of period (000 omitted) | $131,563 | $155,551 | $120,723 | $29,822 | $5,670 | $4,591 |
| Portfolio turnover rateH | 12%G | 24% | 21% | 18% | 31% | 28% |
A Calculated based on average shares outstanding during the period.
B Amount represents less than $.005 per share.
C Total returns for periods of less than one year are not annualized.
D Total returns would have been lower if certain expenses had not been reduced during the applicable periods shown.
E Fees and expenses of any underlying Fidelity Central Funds are not included in the Fund's expense ratio. The Fund indirectly bears its proportionate share of the expenses of any underlying Fidelity Central Funds.
F Expense ratios reflect operating expenses of the class. Expenses before reductions do not reflect amounts reimbursed by the investment adviser or reductions from brokerage service arrangements or reductions from other expense offset arrangements and do not represent the amount paid by the class during periods when reimbursements or reductions occur. Expenses net of fee waivers reflect expenses after reimbursement by the investment adviser but prior to reductions from brokerage service arrangements or other expense offset arrangements. Expenses net of all reductions represent the net expenses paid by the class.
G Annualized
H Amount does not include the portfolio activity of any underlying Fidelity Central Funds.
See accompanying notes which are an integral part of the financial statements.
Notes to Financial Statements (Unaudited)
For the period ended April 30, 2017
1. Organization.
Fidelity International Small Cap Opportunities Fund (the Fund) is a fund of Fidelity Investment Trust (the Trust) and is authorized to issue an unlimited number of shares. The Trust is registered under the Investment Company Act of 1940, as amended (the 1940 Act), as an open-end management investment company organized as a Massachusetts business trust. The Fund offers Class A, Class M (formerly Class T), Class C, International Small Cap Opportunities and Class I, each of which has equal rights as to assets and voting privileges. Each class has exclusive voting rights with respect to matters that affect that class.
After the close of business on June 24, 2016, all outstanding Class B shares were converted to Class A shares. All prior fiscal period dollar and share amounts for Class B presented in the Notes to Financial Statements are for the period November 1, 2015 through June 24, 2016.
2. Investments in Fidelity Central Funds.
The Fund invests in Fidelity Central Funds, which are open-end investment companies generally available only to other investment companies and accounts managed by the investment adviser and its affiliates. The Fund's Schedule of Investments lists each of the Fidelity Central Funds held as of period end, if any, as an investment of the Fund, but does not include the underlying holdings of each Fidelity Central Fund. As an Investing Fund, the Fund indirectly bears its proportionate share of the expenses of the underlying Fidelity Central Funds.
The Money Market Central Funds seek preservation of capital and current income and are managed by Fidelity Investments Money Management, Inc. (FIMM), an affiliate of the investment adviser. Annualized expenses of the Money Market Central Funds as of their most recent shareholder report date are less than .005%.
A complete unaudited list of holdings for each Fidelity Central Fund is available upon request or at the Securities and Exchange Commission (the SEC) website at www.sec.gov. In addition, the financial statements of the Fidelity Central Funds are available on the SEC website or upon request.
3. Significant Accounting Policies.
The Fund is an investment company and applies the accounting and reporting guidance of the Financial Accounting Standards Board (FASB) Accounting Standards Codification Topic 946 Financial Services – Investments Companies. The financial statements have been prepared in conformity with accounting principles generally accepted in the United States of America (GAAP), which require management to make certain estimates and assumptions at the date of the financial statements. Actual results could differ from those estimates. Subsequent events, if any, through the date that the financial statements were issued have been evaluated in the preparation of the financial statements. The following summarizes the significant accounting policies of the Fund:
Investment Valuation. Investments are valued as of 4:00 p.m. Eastern time on the last calendar day of the period. The Board of Trustees (the Board) has delegated the day to day responsibility for the valuation of the Fund's investments to the Fair Value Committee (the Committee) established by the Fund's investment adviser. In accordance with valuation policies and procedures approved by the Board, the Fund attempts to obtain prices from one or more third party pricing vendors or brokers to value its investments. When current market prices, quotations or currency exchange rates are not readily available or reliable, investments will be fair valued in good faith by the Committee, in accordance with procedures adopted by the Board. Factors used in determining fair value vary by investment type and may include market or investment specific events. The frequency with which these procedures are used cannot be predicted and they may be utilized to a significant extent. The Committee oversees the Fund's valuation policies and procedures and reports to the Board on the Committee's activities and fair value determinations. The Board monitors the appropriateness of the procedures used in valuing the Fund's investments and ratifies the fair value determinations of the Committee.
The Fund categorizes the inputs to valuation techniques used to value its investments into a disclosure hierarchy consisting of three levels as shown below:
- Level 1 – quoted prices in active markets for identical investments
- Level 2 – other significant observable inputs (including quoted prices for similar investments, interest rates, prepayment speeds, etc.)
- Level 3 – unobservable inputs (including the Fund's own assumptions based on the best information available)
Valuation techniques used to value the Fund's investments by major category are as follows:
Equity securities, including restricted securities, for which market quotations are readily available, are valued at the last reported sale price or official closing price as reported by a third party pricing vendor on the primary market or exchange on which they are traded and are categorized as Level 1 in the hierarchy. In the event there were no sales during the day or closing prices are not available, securities are valued at the last quoted bid price or may be valued using the last available price and are generally categorized as Level 2 in the hierarchy. For foreign equity securities, when market or security specific events arise, comparisons to the valuation of American Depositary Receipts (ADRs), futures contracts, Exchange-Traded Funds (ETFs) and certain indexes as well as quoted prices for similar securities may be used and would be categorized as Level 2 in the hierarchy. Utilizing these techniques may result in transfers between Level 1 and Level 2. For equity securities, including restricted securities, where observable inputs are limited, assumptions about market activity and risk are used and these securities may be categorized as Level 3 in the hierarchy.
Investments in open-end mutual funds, including the Fidelity Central Funds, are valued at their closing net asset value (NAV) each business day and are categorized as Level 1 in the hierarchy.
Changes in valuation techniques may result in transfers in or out of an assigned level within the disclosure hierarchy. The aggregate value of investments by input level as of April 30, 2017, is included at the end of the Fund's Schedule of Investments.
Foreign Currency. The Fund may use foreign currency contracts to facilitate transactions in foreign-denominated securities. Gains and losses from these transactions may arise from changes in the value of the foreign currency or if the counterparties do not perform under the contracts' terms.
Foreign-denominated assets, including investment securities, and liabilities are translated into U.S. dollars at the exchange rates at period end. Purchases and sales of investment securities, income and dividends received and expenses denominated in foreign currencies are translated into U.S. dollars at the exchange rate in effect on the transaction date.
The effects of exchange rate fluctuations on investments are included with the net realized and unrealized gain (loss) on investment securities. Other foreign currency transactions resulting in realized and unrealized gain (loss) are disclosed separately.
Investment Transactions and Income. For financial reporting purposes, the Fund's investment holdings and NAV include trades executed through the end of the last business day of the period. The NAV per share for processing shareholder transactions is calculated as of the close of business of the New York Stock Exchange (NYSE), normally 4:00 p.m. Eastern time and includes trades executed through the end of the prior business day. Gains and losses on securities sold are determined on the basis of identified cost. Dividend income is recorded on the ex-dividend date, except for certain dividends from foreign securities where the ex-dividend date may have passed, which are recorded as soon as the Fund is informed of the ex-dividend date. Non-cash dividends included in dividend income, if any, are recorded at the fair market value of the securities received. Income and capital gain distributions from Fidelity Central Funds, if any, are recorded on the ex-dividend date. Certain distributions received by the Fund represent a return of capital or capital gain. The Fund determines the components of these distributions subsequent to the ex-dividend date, based upon receipt of tax filings or other correspondence relating to the underlying investment. These distributions are recorded as a reduction of cost of investments and/or as a realized gain. Investment income is recorded net of foreign taxes withheld where recovery of such taxes is uncertain.
Class Allocations and Expenses. Investment income, realized and unrealized capital gains and losses, common expenses of the Fund, and certain fund-level expense reductions, if any, are allocated daily on a pro-rata basis to each class based on the relative net assets of each class to the total net assets of the Fund. Each class differs with respect to transfer agent and distribution and service plan fees incurred. Certain expense reductions may also differ by class. For the reporting period, the allocated portion of income and expenses to each class as a percent of its average net assets may vary due to the timing of recording these transactions in relation to fluctuating net assets of the classes. Expenses directly attributable to a fund are charged to that fund. Expenses attributable to more than one fund are allocated among the respective funds on the basis of relative net assets or other appropriate methods. Expense estimates are accrued in the period to which they relate and adjustments are made when actual amounts are known.
Income Tax Information and Distributions to Shareholders. Each year, the Fund intends to qualify as a regulated investment company under Subchapter M of the Internal Revenue Code, including distributing substantially all of its taxable income and realized gains. As a result, no provision for U.S. Federal income taxes is required. The Fund files a U.S. federal tax return, in addition to state and local tax returns as required. The Fund's federal income tax returns are subject to examination by the Internal Revenue Service (IRS) for a period of three fiscal years after they are filed. State and local tax returns may be subject to examination for an additional fiscal year depending on the jurisdiction. Foreign taxes are provided for based on the Fund's understanding of the tax rules and rates that exist in the foreign markets in which it invests.
Distributions are declared and recorded on the ex-dividend date. Income dividends and capital gain distributions are declared separately for each class. Income and capital gain distributions are determined in accordance with income tax regulations, which may differ from GAAP.
Capital accounts within the financial statements are adjusted for permanent book-tax differences. These adjustments have no impact on net assets or the results of operations. Capital accounts are not adjusted for temporary book-tax differences which will reverse in a subsequent period.
Book-tax differences are primarily due to foreign currency transactions, passive foreign investment companies (PFIC), capital loss carryforwards and losses deferred due to wash sales.
The federal tax cost of investment securities and unrealized appreciation (depreciation) as of period end were as follows:
| Gross unrealized appreciation | $209,557,645 |
| Gross unrealized depreciation | (52,839,150) |
| Net unrealized appreciation (depreciation) on securities | $156,718,495 |
| Tax cost | $850,763,752 |
Capital loss carryforwards are only available to offset future capital gains of the Fund to the extent provided by regulations and may be limited. Under the Regulated Investment Company Modernization Act of 2010 (the Act), the Fund is permitted to carry forward capital losses incurred in taxable years beginning after December 22, 2010 for an unlimited period and such capital losses are required to be used prior to any losses that expire. The capital loss carryforward information presented below, including any applicable limitation, is estimated as of prior fiscal period end and is subject to adjustment.
| Fiscal year of expiration | |
| 2017 | $(201,465,311) |
Short-Term Trading (Redemption) Fees. Shares held by investors in the Fund less than 90 days may have been subject to a redemption fee equal to 2.00% of the NAV of shares redeemed. All redemption fees, which reduce the proceeds of the shareholder redemption, are retained by the Fund and accounted for as an addition to paid in capital.
Restricted Securities. The Fund may invest in securities that are subject to legal or contractual restrictions on resale. These securities generally may be resold in transactions exempt from registration or to the public if the securities are registered. Disposal of these securities may involve time-consuming negotiations and expense, and prompt sale at an acceptable price may be difficult. Information regarding restricted securities is included at the end of the Fund's Schedule of Investments.
4. Purchases and Sales of Investments.
Purchases and sales of securities, other than short-term securities, aggregated $57,360,998 and $201,269,981, respectively.
5. Fees and Other Transactions with Affiliates.
Management Fee. Fidelity Management & Research Company (the investment adviser) and its affiliates provide the Fund with investment management related services for which the Fund pays a monthly management fee. The management fee is the sum of an individual fund fee rate that is based on an annual rate of .60% of the Fund's average net assets and an annualized group fee rate that averaged .25% during the period. The group fee rate is based upon the average net assets of all the mutual funds advised by the investment adviser, including any mutual funds previously advised by the investment adviser that are currently advised by Fidelity SelectCo, LLC, an affiliate of the investment adviser. The group fee rate decreases as assets under management increase and increases as assets under management decrease. In addition, the management fee is subject to a performance adjustment (up to a maximum of +/- .20% of the Fund's average net assets over a 36 month performance period). The upward or downward adjustment to the management fee is based on the relative investment performance of International Small Cap Opportunities as compared to its benchmark index, the MSCI EAFE Small Cap Index, over the same 36 month performance period. For the reporting period, the total annualized management fee rate, including the performance adjustment, was .86% of the Fund's average net assets. The performance adjustment included in the management fee rate may be higher or lower than the maximum performance adjustment rate due to the difference between the average net assets for the reporting and performance periods.
Distribution and Service Plan Fees. In accordance with Rule 12b-1 of the 1940 Act, the Fund has adopted separate Distribution and Service Plans for each class of shares. Certain classes pay Fidelity Distributors Corporation (FDC), an affiliate of the investment adviser, separate Distribution and Service Fees, each of which is based on an annual percentage of each class' average net assets. In addition, FDC may pay financial intermediaries for selling shares of the Fund and providing shareholder support services. For the period, the Distribution and Service Fee rates, total fees and amounts retained by FDC were as follows:
| | Distribution
Fee | Service
Fee | Total Fees | Retained
by FDC |
| Class A | -% | .25% | $51,828 | $1,396 |
| Class M | .25% | .25% | 28,790 | – |
| Class C | .75% | .25% | 59,543 | 5,542 |
| | | | $140,161 | $ 6,938 |
Sales Load. FDC may receive a front-end sales charge of up to 5.75% for selling Class A shares and 3.50% for selling Class M shares, some of which is paid to financial intermediaries for selling shares of the Fund. Depending on the holding period, FDC may receive contingent deferred sales charges levied on Class A, Class M and Class C redemptions. The deferred sales charges are 1.00% for Class C shares, 1.00% for certain purchases of Class A shares and .25% for certain purchases of Class M shares.
For the period, sales charge amounts retained by FDC were as follows:
| | Retained
by FDC |
| Class A | $3,132 |
| Class M | 1,342 |
| Class C(a) | 733 |
| | $5,207 |
(a) When Class C shares are initially sold, FDC pays commissions from its own resources to financial intermediaries through which the sales are made.
Transfer Agent Fees. Fidelity Investments Institutional Operations Company, Inc., (FIIOC), an affiliate of the investment adviser, is the transfer, dividend disbursing and shareholder servicing agent for each class of the Fund. FIIOC receives account fees and asset-based fees that vary according to the account size and type of account of the shareholders of the respective classes of the Fund. FIIOC pays for typesetting, printing and mailing of shareholder reports, except proxy statements.
For the period, transfer agent fees for each applicable class were as follows:
| | Amount | % of
Class-Level Average
Net Assets(a) |
| Class A | $50,887 | .25 |
| Class M | 17,832 | .31 |
| Class C | 17,358 | .29 |
| International Small Cap Opportunities | 748,529 | .20 |
| Class I | 164,005 | .21 |
| | $998,611 | |
(a) Annualized
Accounting and Security Lending Fees. Fidelity Service Company, Inc. (FSC), an affiliate of the investment adviser, maintains the Fund's accounting records. The accounting fee is based on the level of average net assets for each month. Under a separate contract, FSC administers the security lending program. The security lending fee is based on the number and duration of lending transactions.
Brokerage Commissions. The Fund placed a portion of its portfolio transactions with brokerage firms which are affiliates of the investment adviser. Brokerage commissions are included in net realized gain (loss) and change in net unrealized appreciation (depreciation) in the Statement of Operations. The commissions paid to these affiliated firms were $716 for the period.
Interfund Lending Program. Pursuant to an Exemptive Order issued by the SEC, the Fund, along with other registered investment companies having management contracts with FMR or other affiliated entities of FMR, may participate in an interfund lending program. This program provides an alternative credit facility allowing the funds to borrow from, or lend money to, other participating affiliated funds. At period end, there were no interfund loans outstanding. The Fund's activity in this program during the period for which loans were outstanding was as follows:
| Borrower or Lender | Average Loan Balance | Weighted Average Interest Rate | Interest Expense |
| Borrower | $7,779,000 | .58% | $1,257 |
Interfund Trades. The Fund may purchase from or sell securities to other Fidelity Funds under procedures adopted by the Board. The procedures have been designed to ensure these interfund trades are executed in accordance with Rule 17a-7 of the 1940 Act. Interfund trades are included within the respective purchases and sales amounts shown in the Purchases and Sales of Investments note.
6. Committed Line of Credit.
The Fund participates with other funds managed by the investment adviser or an affiliate in a $4.25 billion credit facility (the "line of credit") to be utilized for temporary or emergency purposes to fund shareholder redemptions or for other short-term liquidity purposes. The Fund has agreed to pay commitment fees on its pro-rata portion of the line of credit, which amounted to $1,675 and is reflected in Miscellaneous expenses on the Statement of Operations. During the period, the Fund did not borrow on this line of credit.
7. Security Lending.
The Fund lends portfolio securities through a lending agent from time to time in order to earn additional income. For equity securities, a lending agent is used and may loan securities to certain qualified borrowers, including Fidelity Capital Markets (FCM), a broker-dealer affiliated with the Fund. On the settlement date of the loan, the Fund receives collateral (in the form of U.S. Treasury obligations, letters of credit and/or cash) against the loaned securities and maintains collateral in an amount not less than 100% of the market value of the loaned securities during the period of the loan. The market value of the loaned securities is determined at the close of business of the Fund and any additional required collateral is delivered to the Fund on the next business day. The Fund or borrower may terminate the loan at any time, and if the borrower defaults on its obligation to return the securities loaned because of insolvency or other reasons, the Fund may apply collateral received from the borrower against the obligation. The Fund may experience delays and costs in recovering the securities loaned. Any cash collateral received is invested in Fidelity Securities Lending Cash Central Fund. The value of loaned securities and cash collateral at period end are disclosed on the Fund's Statement of Assets and Liabilities. The value of securities loaned to FCM at period end was $360,684. Security lending income represents the income earned on investing cash collateral, less rebates paid to borrowers and any lending agent fees associated with the loan, plus any premium payments received for lending certain types of securities. Security lending income is presented in the Statement of Operations as a component of income from Fidelity Central Funds. Total security lending income during the period amounted to $106,612, including $29 from securities loaned to FCM.
8. Bank Borrowings.
The Fund is permitted to have bank borrowings for temporary or emergency purposes to fund shareholder redemptions or for other short-term liquidity requirements. The Fund has established borrowing arrangements with certain banks. The interest rate on the borrowings is the bank's base rate, as revised from time to time. The average loan balance during the period for which loans were outstanding amounted to $5,334,167. The weighted average interest rate was .91%. The interest expense amounted to $809 under the bank borrowing program. At period end, there were no bank borrowings outstanding.
9. Expense Reductions.
Commissions paid to certain brokers with whom the investment adviser, or its affiliates, places trades on behalf of the Fund include an amount in addition to trade execution, which may be rebated back to the Fund to offset certain expenses. This amount totaled $17,717 for the period.
In addition, during the period the investment adviser reimbursed and/or waived a portion of fund-level operating expenses in the amount of $4,243.
10. Distributions to Shareholders.
Distributions to shareholders of each class were as follows:
| | Six months ended
April 30, 2017 | Year ended October 31, 2016 |
| From net investment income | | |
| Class A | $345,530 | $159,395 |
| Class M | 44,101 | 9,385 |
| International Small Cap Opportunities | 8,436,081 | 3,989,748 |
| Class I | 1,798,182 | 694,163 |
| Total | $10,623,894 | $4,852,691 |
| From net realized gain | | |
| Class A | $117,129 | $214,570 |
| Class M | 32,073 | 65,696 |
| Class C | – | 66,143 |
| International Small Cap Opportunities | 2,008,591 | 3,723,825 |
| Class I | 408,678 | 585,439 |
| Total | $2,566,471 | $4,655,673 |
11. Share Transactions.
Share transactions for each class were as follows and may contain automatic conversions between classes or exchanges between affiliated funds:
| | Shares | Shares | Dollars | Dollars |
| | Six months ended April 30, 2017 | Year ended October 31, 2016 | Six months ended April 30, 2017 | Year ended October 31, 2016 |
| Class A | | | | |
| Shares sold | 365,099 | 1,351,287 | $5,442,812 | $19,658,244 |
| Reinvestment of distributions | 30,737 | 24,184 | 441,386 | 359,376 |
| Shares redeemed | (1,060,238) | (1,195,179) | (15,880,127) | (17,426,031) |
| Net increase (decrease) | (664,402) | 180,292 | $(9,995,929) | $2,591,589 |
| Class M | | | | |
| Shares sold | 50,846 | 193,483 | $769,295 | $2,768,529 |
| Reinvestment of distributions | 5,229 | 5,021 | 74,673 | 74,158 |
| Shares redeemed | (156,449) | (269,450) | (2,314,840) | (3,846,732) |
| Net increase (decrease) | (100,374) | (70,946) | $(1,470,872) | $(1,004,045) |
| Class B | | | | |
| Shares sold | – | 3,601 | $– | $51,563 |
| Shares redeemed | – | (45,696) | – | (635,715) |
| Net increase (decrease) | – | (42,095) | $– | $(584,152) |
| Class C | | | | |
| Shares sold | 57,882 | 246,339 | $847,816 | $3,449,372 |
| Reinvestment of distributions | – | 4,483 | – | 64,648 |
| Shares redeemed | (157,157) | (584,363) | (2,262,768) | (8,102,721) |
| Net increase (decrease) | (99,275) | (333,541) | $(1,414,952) | $(4,588,701) |
| International Small Cap Opportunities | | | | |
| Shares sold | 3,077,675 | 26,676,267 | $46,619,140 | $389,947,202 |
| Reinvestment of distributions | 594,324 | 402,267 | 8,611,758 | 6,034,011 |
| Shares redeemed | (9,305,420) | (24,218,791) | (138,022,412) | (357,874,849) |
| Net increase (decrease) | (5,633,421) | 2,859,743 | $(82,791,514) | $38,106,364 |
| Class I | | | | |
| Shares sold | 2,368,566 | 5,357,445 | $36,078,168 | $78,823,330 |
| Reinvestment of distributions | 138,286 | 75,351 | 2,000,992 | 1,129,506 |
| Shares redeemed | (4,962,513) | (3,153,630) | (77,606,349) | (46,042,984) |
| Net increase (decrease) | (2,455,661) | 2,279,166 | $(39,527,189) | $33,909,852 |
12. Other.
The Fund's organizational documents provide former and current trustees and officers with a limited indemnification against liabilities arising in connection with the performance of their duties to the Fund. In the normal course of business, the Fund may also enter into contracts that provide general indemnifications. The Fund's maximum exposure under these arrangements is unknown as this would be dependent on future claims that may be made against the Fund. The risk of material loss from such claims is considered remote.
Shareholder Expense Example
As a shareholder of the Fund, you incur two types of costs: (1) transaction costs, including sales charges (loads) on purchase payments or redemption proceeds, redemption fees and (2) ongoing costs, including management fees, distribution and/or service (12b-1) fees and other Fund expenses. This Example is intended to help you understand your ongoing costs (in dollars) of investing in the Fund and to compare these costs with the ongoing costs of investing in other mutual funds.
The Example is based on an investment of $1,000 invested at the beginning of the period and held for the entire period (November 1, 2016 to April 30, 2017).
Actual Expenses
The first line of the accompanying table for each class of the Fund provides information about actual account values and actual expenses. You may use the information in this line, together with the amount you invested, to estimate the expenses that you paid over the period. Simply divide your account value by $1,000.00 (for example, an $8,600 account value divided by $1,000.00 = 8.6), then multiply the result by the number in the first line for a class of the Fund under the heading entitled "Expenses Paid During Period" to estimate the expenses you paid on your account during this period. A small balance maintenance fee of $12.00 that is charged once a year may apply for certain accounts with a value of less than $2,000. This fee is not included in the table below. If it was, the estimate of expenses you paid during the period would be higher, and your ending account value lower, by this amount. In addition, the Fund, as a shareholder in the underlying Fidelity Central Funds, will indirectly bear its pro-rata share of the fees and expenses incurred by the underlying Fidelity Central Funds. These fees and expenses are not included in the Fund's annualized expense ratio used to calculate the expense estimate in the table below.
Hypothetical Example for Comparison Purposes
The second line of the accompanying table for each class of the Fund provides information about hypothetical account values and hypothetical expenses based on a Class' actual expense ratio and an assumed rate of return of 5% per year before expenses, which is not the Class' actual return. The hypothetical account values and expenses may not be used to estimate the actual ending account balance or expenses you paid for the period. You may use this information to compare the ongoing costs of investing in the Fund and other funds. To do so, compare this 5% hypothetical example with the 5% hypothetical examples that appear in the shareholder reports of the other funds. A small balance maintenance fee of $12.00 that is charged once a year may apply for certain accounts with a value of less than $2,000. This fee is not included in the table below. If it was, the estimate of expenses you paid during the period would be higher, and your ending account value lower, by this amount. In addition, the Fund, as a shareholder in the underlying Fidelity Central Funds, will indirectly bear its pro-rata share of the fees and expenses incurred by the underlying Fidelity Central Funds. These fees and expenses are not included in the Fund's annualized expense ratio used to calculate the expense estimate in the table below.
Please note that the expenses shown in the table are meant to highlight your ongoing costs only and do not reflect any transaction costs. Therefore, the second line of the table is useful in comparing ongoing costs only, and will not help you determine the relative total costs of owning different funds. In addition, if these transactional costs were included, your costs would have been higher.
| | Annualized Expense Ratio-A | Beginning
Account Value
November 1, 2016 | Ending
Account Value
April 30, 2017 | Expenses Paid
During Period-B
November 1, 2016
to April 30, 2017 |
| Class A | 1.44% | | | |
| Actual | | $1,000.00 | $1,122.90 | $7.58 |
| Hypothetical-C | | $1,000.00 | $1,017.65 | $7.20 |
| Class M | 1.75% | | | |
| Actual | | $1,000.00 | $1,121.90 | $9.21 |
| Hypothetical-C | | $1,000.00 | $1,016.12 | $8.75 |
| | | | | |
| | | | | |
| | | | | |
| Class C | 2.23% | | | |
| Actual | | $1,000.00 | $1,119.10 | $11.72 |
| Hypothetical-C | | $1,000.00 | $1,013.74 | $11.13 |
| International Small Cap Opportunities | 1.14% | | | |
| Actual | | $1,000.00 | $1,124.60 | $6.01 |
| Hypothetical-C | | $1,000.00 | $1,019.14 | $5.71 |
| Class I | 1.15% | | | |
| Actual | | $1,000.00 | $1,124.60 | $6.06 |
| Hypothetical-C | | $1,000.00 | $1,019.09 | $5.76 |
A Annualized expense ratio reflects expenses net of applicable fee waivers.
B Expenses are equal to each Class' annualized expense ratio, multiplied by the average account value over the period, multiplied by 181/365 (to reflect the one-half year period).
C 5% return per year before expenses
Corporate Headquarters
245 Summer St.
Boston, MA 02210
www.fidelity.com
ILS-SANN-0617
1.815078.111
Fidelity Advisor® International Growth Fund -
Class A, Class M (formerly Class T), Class C, Class I and Class Z
Semi-Annual Report April 30, 2017 Class A, Class M, Class C, Class I and Class Z are classes of Fidelity® International Growth Fund |
|
Contents
To view a fund's proxy voting guidelines and proxy voting record for the 12-month period ended June 30, visit http://www.fidelity.com/proxyvotingresults or visit the Securities and Exchange Commission's (SEC) web site at http://www.sec.gov.
You may also call 1-877-208-0098 to request a free copy of the proxy voting guidelines.
Standard & Poor's, S&P and S&P 500 are registered service marks of The McGraw-Hill Companies, Inc. and have been licensed for use by Fidelity Distributors Corporation.
Other third-party marks appearing herein are the property of their respective owners.
All other marks appearing herein are registered or unregistered trademarks or service marks of FMR LLC or an affiliated company. © 2017 FMR LLC. All rights reserved.
This report and the financial statements contained herein are submitted for the general information of the shareholders of the Fund. This report is not authorized for distribution to prospective investors in the Fund unless preceded or accompanied by an effective prospectus.
A fund files its complete schedule of portfolio holdings with the SEC for the first and third quarters of each fiscal year on Form N-Q. Forms N-Q are available on the SEC’s web site at http://www.sec.gov. A fund's Forms N-Q may be reviewed and copied at the SEC’s Public Reference Room in Washington, DC. Information regarding the operation of the SEC's Public Reference Room may be obtained by calling 1-800-SEC-0330.
For a complete list of a fund's portfolio holdings, view the most recent holdings listing, semiannual report, or annual report on Fidelity's web site at http://www.fidelity.com, http://www.institutional.fidelity.com, or http://www.401k.com, as applicable.
NOT FDIC INSURED •MAY LOSE VALUE •NO BANK GUARANTEE
Neither the Fund nor Fidelity Distributors Corporation is a bank.
Investment Summary (Unaudited)
Geographic Diversification (% of fund's net assets)
| As of April 30, 2017 |
| | United States of America* | 20.3% |
| | Japan | 11.7% |
| | United Kingdom | 11.5% |
| | Switzerland | 10.7% |
| | Sweden | 5.9% |
| | Germany | 4.8% |
| | Spain | 4.6% |
| | Belgium | 3.9% |
| | Australia | 3.6% |
| | Other | 23.0% |

* Includes Short-Term investments and Net Other Assets (Liabilities).
Percentages are based on country or territory of incorporation and are adjusted for the effect of futures contracts, if applicable.
| As of October 31, 2016 |
| | United States of America* | 23.5% |
| | Japan | 13.9% |
| | Switzerland | 12.4% |
| | United Kingdom | 8.7% |
| | Spain | 5.2% |
| | Sweden | 4.1% |
| | Australia | 4.0% |
| | Belgium | 4.0% |
| | Germany | 3.9% |
| | Other | 20.3% |

* Includes Short-Term investments and Net Other Assets (Liabilities).
Percentages are based on country or territory of incorporation and are adjusted for the effect of futures contracts, if applicable.
Asset Allocation as of April 30, 2017
| | % of fund's net assets | % of fund's net assets 6 months ago |
| Stocks | 97.0 | 95.4 |
| Short-Term Investments and Net Other Assets (Liabilities) | 3.0 | 4.6 |
Top Ten Stocks as of April 30, 2017
| | % of fund's net assets | % of fund's net assets 6 months ago |
| Nestle SA (Reg. S) (Switzerland, Food Products) | 5.7 | 5.5 |
| Anheuser-Busch InBev SA NV (Belgium, Beverages) | 3.4 | 3.5 |
| CSL Ltd. (Australia, Biotechnology) | 2.9 | 3.0 |
| SAP AG (Germany, Software) | 2.7 | 2.2 |
| Roche Holding AG (participation certificate) (Switzerland, Pharmaceuticals) | 2.6 | 3.1 |
| Visa, Inc. Class A (United States of America, IT Services) | 2.4 | 2.4 |
| Reckitt Benckiser Group PLC (United Kingdom, Household Products) | 2.3 | 2.4 |
| British American Tobacco PLC (United Kingdom) (United Kingdom, Tobacco) | 2.2 | 0.0 |
| Inditex SA (Spain, Specialty Retail) | 2.2 | 2.7 |
| AIA Group Ltd. (Hong Kong, Insurance) | 2.2 | 2.1 |
| | 28.6 | |
Top Market Sectors as of April 30, 2017
| | % of fund's net assets | % of fund's net assets 6 months ago |
| Consumer Staples | 19.0 | 19.8 |
| Information Technology | 18.1 | 16.2 |
| Health Care | 14.5 | 17.8 |
| Industrials | 14.0 | 11.1 |
| Consumer Discretionary | 10.7 | 12.7 |
| Financials | 10.7 | 9.2 |
| Materials | 6.9 | 5.4 |
| Real Estate | 2.1 | 2.5 |
| Energy | 0.6 | 0.3 |
| Telecommunication Services | 0.4 | 0.4 |
Percentages shown as 0.0% may reflect amounts less than 0.05%.
Investments April 30, 2017 (Unaudited)
Showing Percentage of Net Assets
| Common Stocks - 96.6% | | | |
| | | Shares | Value |
| Australia - 3.6% | | | |
| CSL Ltd. | | 556,249 | $55,209,627 |
| Transurban Group unit | | 1,441,115 | 13,165,104 |
|
| TOTAL AUSTRALIA | | | 68,374,731 |
|
| Austria - 1.7% | | | |
| Andritz AG | | 410,121 | 22,681,234 |
| Buwog-Gemeinnuetzige Wohnung | | 348,328 | 9,406,161 |
|
| TOTAL AUSTRIA | | | 32,087,395 |
|
| Belgium - 3.9% | | | |
| Anheuser-Busch InBev SA NV | | 566,391 | 63,872,122 |
| KBC Groep NV | | 131,139 | 9,468,079 |
|
| TOTAL BELGIUM | | | 73,340,201 |
|
| Brazil - 0.1% | | | |
| Itau Unibanco Holding SA | | 141,900 | 1,522,696 |
| Canada - 1.3% | | | |
| Alimentation Couche-Tard, Inc. Class B (sub. vtg.) | | 176,600 | 8,122,009 |
| Franco-Nevada Corp. | | 135,400 | 9,208,847 |
| Pason Systems, Inc. | | 280,500 | 4,165,221 |
| PrairieSky Royalty Ltd. | | 194,500 | 4,238,947 |
|
| TOTAL CANADA | | | 25,735,024 |
|
| Cayman Islands - 1.1% | | | |
| 58.com, Inc. ADR (a)(b) | | 150,570 | 5,959,561 |
| Alibaba Group Holding Ltd. sponsored ADR (a) | | 136,100 | 15,719,550 |
|
| TOTAL CAYMAN ISLANDS | | | 21,679,111 |
|
| Denmark - 1.3% | | | |
| Jyske Bank A/S (Reg.) | | 189,200 | 10,110,801 |
| Novo Nordisk A/S Series B sponsored ADR | | 396,800 | 15,348,224 |
|
| TOTAL DENMARK | | | 25,459,025 |
|
| Finland - 0.3% | | | |
| Tikkurila Oyj | | 298,300 | 5,913,875 |
| France - 0.9% | | | |
| Essilor International SA | | 127,039 | 16,460,727 |
| Germany - 4.8% | | | |
| Bayer AG | | 319,400 | 39,520,370 |
| SAP AG | | 515,925 | 51,678,167 |
|
| TOTAL GERMANY | | | 91,198,537 |
|
| Hong Kong - 2.2% | | | |
| AIA Group Ltd. | | 5,948,200 | 41,179,758 |
| India - 1.0% | | | |
| Housing Development Finance Corp. Ltd. | | 771,267 | 18,440,707 |
| Ireland - 3.4% | | | |
| CRH PLC sponsored ADR | | 1,025,166 | 37,234,029 |
| James Hardie Industries PLC CDI | | 1,595,097 | 27,077,244 |
|
| TOTAL IRELAND | | | 64,311,273 |
|
| Isle of Man - 0.5% | | | |
| Playtech Ltd. | | 778,125 | 9,665,066 |
| Israel - 0.2% | | | |
| Azrieli Group | | 91,600 | 4,878,690 |
| Italy - 1.1% | | | |
| Azimut Holding SpA | | 234,600 | 4,579,452 |
| Interpump Group SpA | | 589,926 | 15,647,466 |
|
| TOTAL ITALY | | | 20,226,918 |
|
| Japan - 11.7% | | | |
| Astellas Pharma, Inc. | | 928,700 | 12,246,871 |
| DENSO Corp. | | 402,700 | 17,336,240 |
| East Japan Railway Co. | | 205,500 | 18,349,827 |
| Hoya Corp. | | 412,500 | 19,700,830 |
| Keyence Corp. | | 99,924 | 40,157,840 |
| Komatsu Ltd. | | 568,700 | 15,196,542 |
| Misumi Group, Inc. | | 793,400 | 15,024,601 |
| Mitsui Fudosan Co. Ltd. | | 563,000 | 12,371,101 |
| Nintendo Co. Ltd. | | 32,400 | 8,199,325 |
| Olympus Corp. | | 486,300 | 18,714,752 |
| OSG Corp. | | 469,800 | 9,672,043 |
| SHO-BOND Holdings Co. Ltd. | | 207,600 | 9,497,735 |
| USS Co. Ltd. | | 1,385,600 | 24,486,495 |
|
| TOTAL JAPAN | | | 220,954,202 |
|
| Kenya - 0.4% | | | |
| Safaricom Ltd. | | 44,623,900 | 8,323,741 |
| Korea (South) - 1.2% | | | |
| BGFretail Co. Ltd. | | 154,843 | 14,904,455 |
| NAVER Corp. | | 10,508 | 7,389,592 |
|
| TOTAL KOREA (SOUTH) | | | 22,294,047 |
|
| Mexico - 0.5% | | | |
| Fomento Economico Mexicano S.A.B. de CV sponsored ADR | | 97,255 | 8,756,840 |
| Netherlands - 2.0% | | | |
| ASML Holding NV (Netherlands) (b) | | 286,200 | 37,831,792 |
| New Zealand - 0.3% | | | |
| Auckland International Airport Ltd. | | 1,278,623 | 6,057,528 |
| South Africa - 2.0% | | | |
| Clicks Group Ltd. | | 937,084 | 9,412,387 |
| Naspers Ltd. Class N | | 154,900 | 29,454,469 |
|
| TOTAL SOUTH AFRICA | | | 38,866,856 |
|
| Spain - 4.6% | | | |
| Amadeus IT Holding SA Class A | | 494,200 | 26,647,437 |
| Hispania Activos Inmobiliarios SA | | 365,824 | 5,523,100 |
| Inditex SA | | 1,083,159 | 41,543,754 |
| Merlin Properties Socimi SA | | 412,400 | 4,880,855 |
| Prosegur Compania de Seguridad SA (Reg.) | | 1,346,749 | 8,787,412 |
|
| TOTAL SPAIN | | | 87,382,558 |
|
| Sweden - 5.9% | | | |
| ASSA ABLOY AB (B Shares) | | 1,848,083 | 40,040,094 |
| Atlas Copco AB (A Shares) | | 703,900 | 26,320,852 |
| Fagerhult AB | | 360,544 | 14,877,991 |
| Svenska Cellulosa AB (SCA) (B Shares) | | 463,900 | 15,366,789 |
| Svenska Handelsbanken AB (A Shares) | | 1,038,920 | 14,744,024 |
|
| TOTAL SWEDEN | | | 111,349,750 |
|
| Switzerland - 10.7% | | | |
| Nestle SA (Reg. S) | | 1,409,029 | 108,524,129 |
| Novartis AG | | 339,452 | 26,132,737 |
| Roche Holding AG (participation certificate) | | 184,397 | 48,250,148 |
| Schindler Holding AG: | | | |
| (participation certificate) | | 77,451 | 15,824,913 |
| (Reg.) | | 18,350 | 3,644,181 |
|
| TOTAL SWITZERLAND | | | 202,376,108 |
|
| Taiwan - 0.9% | | | |
| Taiwan Semiconductor Manufacturing Co. Ltd. | | 2,637,000 | 16,958,049 |
| Turkey - 0.2% | | | |
| Tupras Turkiye Petrol Rafinelleri A/S | | 143,012 | 3,603,534 |
| United Kingdom - 11.5% | | | |
| BAE Systems PLC | | 2,019,000 | 16,398,270 |
| Berendsen PLC | | 798,873 | 8,681,136 |
| British American Tobacco PLC (United Kingdom) | | 630,700 | 42,612,217 |
| Elementis PLC | | 1,253,900 | 4,940,364 |
| Howden Joinery Group PLC | | 775,100 | 4,648,101 |
| Informa PLC | | 2,095,926 | 17,428,010 |
| InterContinental Hotel Group PLC ADR (b) | | 611,546 | 32,283,513 |
| Prudential PLC | | 1,422,174 | 31,563,535 |
| Reckitt Benckiser Group PLC | | 465,145 | 42,857,319 |
| Rightmove PLC | | 89,200 | 4,836,163 |
| Shaftesbury PLC | | 377,933 | 4,562,129 |
| Spectris PLC | | 178,700 | 6,388,082 |
|
| TOTAL UNITED KINGDOM | | | 217,198,839 |
|
| United States of America - 17.3% | | | |
| Alphabet, Inc. Class A (a) | | 32,736 | 30,265,087 |
| Autoliv, Inc. (b) | | 168,569 | 16,888,928 |
| Berkshire Hathaway, Inc. Class B (a) | | 134,184 | 22,168,539 |
| China Biologic Products, Inc. (a) | | 80,266 | 9,471,388 |
| Domino's Pizza, Inc. | | 36,290 | 6,582,643 |
| Martin Marietta Materials, Inc. | | 84,900 | 18,694,131 |
| MasterCard, Inc. Class A | | 320,100 | 37,234,032 |
| Mohawk Industries, Inc. (a) | | 77,900 | 18,290,141 |
| Molson Coors Brewing Co. Class B | | 103,400 | 9,915,026 |
| Moody's Corp. | | 88,700 | 10,494,984 |
| MSCI, Inc. | | 131,400 | 13,182,048 |
| Philip Morris International, Inc. | | 252,808 | 28,021,239 |
| PPG Industries, Inc. | | 80,700 | 8,864,088 |
| PriceSmart, Inc. | | 82,600 | 7,182,070 |
| ResMed, Inc. | | 181,700 | 12,353,783 |
| S&P Global, Inc. | | 110,200 | 14,787,738 |
| Sherwin-Williams Co. | | 51,600 | 17,269,488 |
| Visa, Inc. Class A | | 500,160 | 45,624,595 |
|
| TOTAL UNITED STATES OF AMERICA | | | 327,289,948 |
|
| TOTAL COMMON STOCKS | | | |
| (Cost $1,516,974,032) | | | 1,829,717,526 |
|
| Nonconvertible Preferred Stocks - 0.4% | | | |
| Brazil - 0.4% | | | |
| Itau Unibanco Holding SA | | | |
| (Cost $7,326,348) | | 549,500 | 6,796,796 |
|
| Money Market Funds - 5.7% | | | |
| Fidelity Cash Central Fund, 0.85% (c) | | 50,237,817 | 50,247,865 |
| Fidelity Securities Lending Cash Central Fund 0.86% (c)(d) | | 57,874,220 | 57,880,007 |
| TOTAL MONEY MARKET FUNDS | | | |
| (Cost $108,126,129) | | | 108,127,872 |
| TOTAL INVESTMENT PORTFOLIO - 102.7% | | | |
| (Cost $1,632,426,509) | | | 1,944,642,194 |
| NET OTHER ASSETS (LIABILITIES) - (2.7)% | | | (51,311,106) |
| NET ASSETS - 100% | | | $1,893,331,088 |
Categorizations in the Schedule of Investments are based on country or territory of incorporation.
Legend
(a) Non-income producing
(b) Security or a portion of the security is on loan at period end.
(c) Affiliated fund that is generally available only to investment companies and other accounts managed by Fidelity Investments. The rate quoted is the annualized seven-day yield of the fund at period end. A complete unaudited listing of the fund's holdings as of its most recent quarter end is available upon request. In addition, each Fidelity Central Fund's financial statements are available on the SEC's website or upon request.
(d) Investment made with cash collateral received from securities on loan.
Affiliated Central Funds
Information regarding fiscal year to date income earned by the Fund from investments in Fidelity Central Funds is as follows:
| Fund | Income earned |
| Fidelity Cash Central Fund | $128,265 |
| Fidelity Securities Lending Cash Central Fund | 213,214 |
| Total | $341,479 |
Investment Valuation
The following is a summary of the inputs used, as of April 30, 2017, involving the Fund's assets and liabilities carried at fair value. The inputs or methodology used for valuing securities may not be an indication of the risk associated with investing in those securities. For more information on valuation inputs, and their aggregation into the levels used below, please refer to the Investment Valuation section in the accompanying Notes to Financial Statements.
| | Valuation Inputs at Reporting Date: |
| Description | Total | Level 1 | Level 2 | Level 3 |
| Investments in Securities: | | | | |
| Equities: | | | | |
| Consumer Discretionary | $204,294,193 | $174,839,724 | $29,454,469 | $-- |
| Consumer Staples | 359,546,602 | 101,680,815 | 257,865,787 | -- |
| Energy | 12,007,702 | 12,007,702 | -- | -- |
| Financials | 199,039,157 | 167,475,622 | 31,563,535 | -- |
| Health Care | 273,409,457 | 147,259,331 | 126,150,126 | -- |
| Industrials | 264,515,030 | 232,920,218 | 31,594,812 | -- |
| Information Technology | 344,554,338 | 267,718,797 | 76,835,541 | -- |
| Materials | 129,202,066 | 129,202,066 | -- | -- |
| Real Estate | 41,622,036 | 41,622,036 | -- | -- |
| Telecommunication Services | 8,323,741 | 8,323,741 | -- | -- |
| Money Market Funds | 108,127,872 | 108,127,872 | -- | -- |
| Total Investments in Securities: | $1,944,642,194 | $1,391,177,924 | $553,464,270 | $-- |
The following is a summary of transfers between Level 1 and Level 2 for the period ended April 30, 2017. Transfers are assumed to have occurred at the beginning of the period, and are primarily attributable to the valuation techniques used for foreign equity securities, as discussed in the accompanying Notes to Financial Statements:
| Transfers | Total |
| Level 1 to Level 2 | $83,144,029 |
| Level 2 to Level 1 | $68,746,581 |
See accompanying notes which are an integral part of the financial statements.
Financial Statements
Statement of Assets and Liabilities
| | | April 30, 2017 (Unaudited) |
| Assets | | |
Investment in securities, at value (including securities loaned of $54,483,263) — See accompanying schedule:
Unaffiliated issuers (cost $1,524,300,380) | $1,836,514,322 | |
| Fidelity Central Funds (cost $108,126,129) | 108,127,872 | |
| Total Investments (cost $1,632,426,509) | | $1,944,642,194 |
| Receivable for investments sold | | 180,933 |
| Receivable for fund shares sold | | 3,979,764 |
| Dividends receivable | | 10,653,819 |
| Distributions receivable from Fidelity Central Funds | | 60,171 |
| Prepaid expenses | | 1,119 |
| Other receivables | | 35,395 |
| Total assets | | 1,959,553,395 |
| Liabilities | | |
| Payable for investments purchased | $1,952,761 | |
| Payable for fund shares redeemed | 4,626,481 | |
| Accrued management fee | 1,153,657 | |
| Distribution and service plan fees payable | 89,645 | |
| Other affiliated payables | 367,476 | |
| Other payables and accrued expenses | 160,987 | |
| Collateral on securities loaned | 57,871,300 | |
| Total liabilities | | 66,222,307 |
| Net Assets | | $1,893,331,088 |
| Net Assets consist of: | | |
| Paid in capital | | $1,668,374,707 |
| Undistributed net investment income | | 9,046,431 |
| Accumulated undistributed net realized gain (loss) on investments and foreign currency transactions | | (96,206,991) |
| Net unrealized appreciation (depreciation) on investments and assets and liabilities in foreign currencies | | 312,116,941 |
| Net Assets | | $1,893,331,088 |
| Calculation of Maximum Offering Price | | |
| Class A: | | |
| Net Asset Value and redemption price per share ($145,127,708 ÷ 12,036,905 shares) | | $12.06 |
| Maximum offering price per share (100/94.25 of $12.06) | | $12.80 |
| Class M: | | |
| Net Asset Value and redemption price per share ($31,273,302 ÷ 2,598,446 shares) | | $12.04 |
| Maximum offering price per share (100/96.50 of $12.04) | | $12.48 |
| Class C: | | |
| Net Asset Value and offering price per share ($59,007,661 ÷ 4,967,586 shares)(a) | | $11.88 |
| International Growth: | | |
| Net Asset Value, offering price and redemption price per share ($792,767,299 ÷ 65,313,782 shares) | | $12.14 |
| Class I: | | |
| Net Asset Value, offering price and redemption price per share ($564,884,596 ÷ 46,619,452 shares) | | $12.12 |
| Class Z: | | |
| Net Asset Value, offering price and redemption price per share ($300,270,522 ÷ 24,754,795 shares) | | $12.13 |
(a) Redemption price per share is equal to net asset value less any applicable contingent deferred sales charge.
See accompanying notes which are an integral part of the financial statements.
Statement of Operations
| | | Six months ended April 30, 2017 (Unaudited) |
| Investment Income | | |
| Dividends | | $21,328,974 |
| Income from Fidelity Central Funds | | 341,479 |
| Income before foreign taxes withheld | | 21,670,453 |
| Less foreign taxes withheld | | (2,199,855) |
| Total income | | 19,470,598 |
| Expenses | | |
| Management fee | | |
| Basic fee | $5,969,494 | |
| Performance adjustment | 332,361 | |
| Transfer agent fees | 1,800,689 | |
| Distribution and service plan fees | 575,929 | |
| Accounting and security lending fees | 386,286 | |
| Custodian fees and expenses | 99,821 | |
| Independent trustees' fees and expenses | 3,463 | |
| Registration fees | 71,370 | |
| Audit | 40,092 | |
| Legal | 2,273 | |
| Interest | 942 | |
| Miscellaneous | 6,684 | |
| Total expenses before reductions | 9,289,404 | |
| Expense reductions | (58,726) | 9,230,678 |
| Net investment income (loss) | | 10,239,920 |
| Realized and Unrealized Gain (Loss) | | |
| Net realized gain (loss) on: | | |
| Investment securities: | | |
| Unaffiliated issuers | (16,972,827) | |
| Fidelity Central Funds | 4,505 | |
| Foreign currency transactions | (200,210) | |
| Total net realized gain (loss) | | (17,168,532) |
Change in net unrealized appreciation (depreciation) on:
Investment securities (net of decrease in deferred foreign taxes of $3,929) | 204,960,200 | |
| Assets and liabilities in foreign currencies | 142,461 | |
| Total change in net unrealized appreciation (depreciation) | | 205,102,661 |
| Net gain (loss) | | 187,934,129 |
| Net increase (decrease) in net assets resulting from operations | | $198,174,049 |
See accompanying notes which are an integral part of the financial statements.
Statement of Changes in Net Assets
| | Six months ended April 30, 2017 (Unaudited) | Year ended October 31, 2016 |
| Increase (Decrease) in Net Assets | | |
| Operations | | |
| Net investment income (loss) | $10,239,920 | $20,404,064 |
| Net realized gain (loss) | (17,168,532) | (41,385,367) |
| Change in net unrealized appreciation (depreciation) | 205,102,661 | (23,170,403) |
| Net increase (decrease) in net assets resulting from operations | 198,174,049 | (44,151,706) |
| Distributions to shareholders from net investment income | (18,629,181) | (9,313,588) |
| Distributions to shareholders from net realized gain | – | (1,062,130) |
| Total distributions | (18,629,181) | (10,375,718) |
| Share transactions - net increase (decrease) | (4,209,196) | 298,573,554 |
| Redemption fees | 6,819 | 63,422 |
| Total increase (decrease) in net assets | 175,342,491 | 244,109,552 |
| Net Assets | | |
| Beginning of period | 1,717,988,597 | 1,473,879,045 |
| End of period | $1,893,331,088 | $1,717,988,597 |
| Other Information | | |
| Undistributed net investment income end of period | $9,046,431 | $17,435,692 |
See accompanying notes which are an integral part of the financial statements.
Financial Highlights — Fidelity International Growth Fund Class A
| | Six months ended (Unaudited) April 30, | Years ended October 31, | | | | |
| | 2017 | 2016 | 2015 | 2014 | 2013 | 2012 |
| Selected Per–Share Data | | | | | | |
| Net asset value, beginning of period | $10.88 | $11.30 | $11.01 | $10.78 | $8.91 | $8.09 |
| Income from Investment Operations | | | | | | |
| Net investment income (loss)A | .05 | .12B | .07 | .09 | .08 | .08 |
| Net realized and unrealized gain (loss) | 1.23 | (.48) | .28 | .18 | 1.88 | .81 |
| Total from investment operations | 1.28 | (.36) | .35 | .27 | 1.96 | .89 |
| Distributions from net investment income | (.10) | (.05) | (.06) | (.03) | (.08) | (.06) |
| Distributions from net realized gain | – | (.01) | – | (.01) | (.01) | (.01) |
| Total distributions | (.10) | (.06) | (.06) | (.04) | (.09) | (.07) |
| Redemption fees added to paid in capitalA,C | – | – | – | – | – | – |
| Net asset value, end of period | $12.06 | $10.88 | $11.30 | $11.01 | $10.78 | $8.91 |
| Total ReturnD,E,F | 11.92% | (3.22)% | 3.20% | 2.54% | 22.18% | 11.10% |
| Ratios to Average Net AssetsG,H | | | | | | |
| Expenses before reductions | 1.28%I | 1.27% | 1.26% | 1.35% | 1.44% | 1.58% |
| Expenses net of fee waivers, if any | 1.28%I | 1.27% | 1.26% | 1.35% | 1.43% | 1.45% |
| Expenses net of all reductions | 1.28%I | 1.27% | 1.25% | 1.34% | 1.42% | 1.44% |
| Net investment income (loss) | .99%I | 1.05%B | .66% | .84% | .80% | .99% |
| Supplemental Data | | | | | | |
| Net assets, end of period (000 omitted) | $145,128 | $221,861 | $184,878 | $119,017 | $74,595 | $21,874 |
| Portfolio turnover rateJ | 35%I | 29% | 26% | 27% | 32% | 32% |
A Calculated based on average shares outstanding during the period.
B Net Investment income per share reflects a large, non-recurring dividend which amounted to $.04 per share. Excluding this non-recurring dividend, the ratio of net investment income (loss) to average net assets would have been .68%.
C Amount represents less than $.005 per share.
D Total returns for periods of less than one year are not annualized.
E Total returns would have been lower if certain expenses had not been reduced during the applicable periods shown.
F Total returns do not include the effect of the sales charges.
G Fees and expenses of any underlying Fidelity Central Funds are not included in the Fund's expense ratio. The Fund indirectly bears its proportionate share of the expenses of any underlying Fidelity Central Funds.
H Expense ratios reflect operating expenses of the class. Expenses before reductions do not reflect amounts reimbursed by the investment adviser or reductions from brokerage service arrangements or reductions from other expense offset arrangements and do not represent the amount paid by the class during periods when reimbursements or reductions occur. Expenses net of fee waivers reflect expenses after reimbursement by the investment adviser but prior to reductions from brokerage service arrangements or other expense offset arrangements. Expenses net of all reductions represent the net expenses paid by the class.
I Annualized
J Amount does not include the portfolio activity of any underlying Fidelity Central Funds.
See accompanying notes which are an integral part of the financial statements.
Financial Highlights — Fidelity International Growth Fund Class M
| | Six months ended (Unaudited) April 30, | Years ended October 31, | | | | |
| | 2017 | 2016 | 2015 | 2014 | 2013 | 2012 |
| Selected Per–Share Data | | | | | | |
| Net asset value, beginning of period | $10.84 | $11.26 | $10.96 | $10.75 | $8.89 | $8.08 |
| Income from Investment Operations | | | | | | |
| Net investment income (loss)A | .04 | .08B | .04 | .06 | .05 | .06 |
| Net realized and unrealized gain (loss) | 1.23 | (.48) | .27 | .18 | 1.88 | .81 |
| Total from investment operations | 1.27 | (.40) | .31 | .24 | 1.93 | .87 |
| Distributions from net investment income | (.07) | (.01) | (.01) | (.02) | (.07) | (.05) |
| Distributions from net realized gain | – | (.01) | – | (.01) | (.01) | (.01) |
| Total distributions | (.07) | (.02) | (.01) | (.03) | (.07)C | (.06) |
| Redemption fees added to paid in capitalA,D | – | – | – | – | – | – |
| Net asset value, end of period | $12.04 | $10.84 | $11.26 | $10.96 | $10.75 | $8.89 |
| Total ReturnE,F,G | 11.81% | (3.58)% | 2.85% | 2.21% | 21.91% | 10.82% |
| Ratios to Average Net AssetsH,I | | | | | | |
| Expenses before reductions | 1.61%J | 1.61% | 1.58% | 1.65% | 1.69% | 1.85% |
| Expenses net of fee waivers, if any | 1.61%J | 1.61% | 1.58% | 1.65% | 1.69% | 1.70% |
| Expenses net of all reductions | 1.60%J | 1.61% | 1.58% | 1.65% | 1.68% | 1.69% |
| Net investment income (loss) | .67%J | .71%B | .33% | .53% | .54% | .74% |
| Supplemental Data | | | | | | |
| Net assets, end of period (000 omitted) | $31,273 | $27,966 | $28,833 | $26,369 | $23,118 | $10,690 |
| Portfolio turnover rateK | 35%J | 29% | 26% | 27% | 32% | 32% |
A Calculated based on average shares outstanding during the period.
B Net Investment income per share reflects a large, non-recurring dividend which amounted to $.04 per share. Excluding this non-recurring dividend, the ratio of net investment income (loss) to average net assets would have been .34%.
C Total distributions of $0.07 per share is comprised of distributions from net investment income of $0.69 and distributions from net realized gain of $0.005 per share.
D Amount represents less than $.005 per share.
E Total returns for periods of less than one year are not annualized.
F Total returns would have been lower if certain expenses had not been reduced during the applicable periods shown.
G Total returns do not include the effect of the sales charges.
H Fees and expenses of any underlying Fidelity Central Funds are not included in the Fund's expense ratio. The Fund indirectly bears its proportionate share of the expenses of any underlying Fidelity Central Funds.
I Expense ratios reflect operating expenses of the class. Expenses before reductions do not reflect amounts reimbursed by the investment adviser or reductions from brokerage service arrangements or reductions from other expense offset arrangements and do not represent the amount paid by the class during periods when reimbursements or reductions occur. Expenses net of fee waivers reflect expenses after reimbursement by the investment adviser but prior to reductions from brokerage service arrangements or other expense offset arrangements. Expenses net of all reductions represent the net expenses paid by the class.
J Annualized
K Amount does not include the portfolio activity of any underlying Fidelity Central Funds.
See accompanying notes which are an integral part of the financial statements.
Financial Highlights — Fidelity International Growth Fund Class C
| | Six months ended (Unaudited) April 30, | Years ended October 31, | | | | |
| | 2017 | 2016 | 2015 | 2014 | 2013 | 2012 |
| Selected Per–Share Data | | | | | | |
| Net asset value, beginning of period | $10.67 | $11.12 | $10.87 | $10.69 | $8.84 | $8.03 |
| Income from Investment Operations | | | | | | |
| Net investment income (loss)A | .01 | .03B | (.02) | .01 | .01 | .02 |
| Net realized and unrealized gain (loss) | 1.22 | (.47) | .27 | .18 | 1.87 | .80 |
| Total from investment operations | 1.23 | (.44) | .25 | .19 | 1.88 | .82 |
| Distributions from net investment income | (.02) | – | – | – | (.02) | (.01) |
| Distributions from net realized gain | – | (.01) | – | (.01) | (.01) | (.01) |
| Total distributions | (.02) | (.01) | – | (.01) | (.03) | (.01)C |
| Redemption fees added to paid in capitalA,D | – | – | – | – | – | – |
| Net asset value, end of period | $11.88 | $10.67 | $11.12 | $10.87 | $10.69 | $8.84 |
| Total ReturnE,F,G | 11.51% | (3.98)% | 2.30% | 1.77% | 21.29% | 10.27% |
| Ratios to Average Net AssetsH,I | | | | | | |
| Expenses before reductions | 2.07%J | 2.07% | 2.06% | 2.12% | 2.19% | 2.33% |
| Expenses net of fee waivers, if any | 2.07%J | 2.07% | 2.06% | 2.12% | 2.18% | 2.20% |
| Expenses net of all reductions | 2.06%J | 2.06% | 2.05% | 2.12% | 2.17% | 2.19% |
| Net investment income (loss) | .21%J | .26%B | (.15)% | .06% | .05% | .24% |
| Supplemental Data | | | | | | |
| Net assets, end of period (000 omitted) | $59,008 | $52,738 | $52,378 | $32,737 | $17,196 | $5,648 |
| Portfolio turnover rateK | 35%J | 29% | 26% | 27% | 32% | 32% |
A Calculated based on average shares outstanding during the period.
B Net Investment income per share reflects a large, non-recurring dividend which amounted to $.04 per share. Excluding this non-recurring dividend, the ratio of net investment income (loss) to average net assets would have been (.12) %.
C Total distributions of $.01 per share is comprised of distributions from net investment income of $.007 and distributions from net realized gain of $.006 per share.
D Amount represents less than $.005 per share.
E Total returns for periods of less than one year are not annualized.
F Total returns would have been lower if certain expenses had not been reduced during the applicable periods shown.
G Total returns do not include the effect of the contingent deferred sales charge.
H Fees and expenses of any underlying Fidelity Central Funds are not included in the Fund's expense ratio. The Fund indirectly bears its proportionate share of the expenses of any underlying Fidelity Central Funds.
I Expense ratios reflect operating expenses of the class. Expenses before reductions do not reflect amounts reimbursed by the investment adviser or reductions from brokerage service arrangements or reductions from other expense offset arrangements and do not represent the amount paid by the class during periods when reimbursements or reductions occur. Expenses net of fee waivers reflect expenses after reimbursement by the investment adviser but prior to reductions from brokerage service arrangements or other expense offset arrangements. Expenses net of all reductions represent the net expenses paid by the class.
J Annualized
K Amount does not include the portfolio activity of any underlying Fidelity Central Funds.
See accompanying notes which are an integral part of the financial statements.
Financial Highlights — Fidelity International Growth Fund
| | Six months ended (Unaudited) April 30, | Years ended October 31, | | | | |
| | 2017 | 2016 | 2015 | 2014 | 2013 | 2012 |
| Selected Per–Share Data | | | | | | |
| Net asset value, beginning of period | $10.97 | $11.38 | $11.10 | $10.84 | $8.95 | $8.12 |
| Income from Investment Operations | | | | | | |
| Net investment income (loss)A | .07 | .15B | .11 | .13 | .11 | .11 |
| Net realized and unrealized gain (loss) | 1.23 | (.47) | .26 | .19 | 1.88 | .81 |
| Total from investment operations | 1.30 | (.32) | .37 | .32 | 1.99 | .92 |
| Distributions from net investment income | (.13) | (.08) | (.09) | (.05) | (.10) | (.08) |
| Distributions from net realized gain | – | (.01) | – | (.01) | (.01) | (.01) |
| Total distributions | (.13) | (.09) | (.09) | (.06) | (.10)C | (.09) |
| Redemption fees added to paid in capitalA,D | – | – | – | – | – | – |
| Net asset value, end of period | $12.14 | $10.97 | $11.38 | $11.10 | $10.84 | $8.95 |
| Total ReturnE,F | 12.04% | (2.87)% | 3.36% | 2.96% | 22.48% | 11.41% |
| Ratios to Average Net AssetsG,H | | | | | | |
| Expenses before reductions | 1.04%I | .99% | .97% | 1.04% | 1.13% | 1.28% |
| Expenses net of fee waivers, if any | 1.04%I | .99% | .97% | 1.04% | 1.13% | 1.20% |
| Expenses net of all reductions | 1.03%I | .98% | .96% | 1.04% | 1.11% | 1.19% |
| Net investment income (loss) | 1.24%I | 1.34%B | .94% | 1.14% | 1.11% | 1.24% |
| Supplemental Data | | | | | | |
| Net assets, end of period (000 omitted) | $792,767 | $1,038,771 | $938,348 | $635,607 | $430,914 | $149,526 |
| Portfolio turnover rateJ | 35%I | 29% | 26% | 27% | 32% | 32% |
A Calculated based on average shares outstanding during the period.
B Net Investment income per share reflects a large, non-recurring dividend which amounted to $.04 per share. Excluding this non-recurring dividend, the ratio of net investment income (loss) to average net assets would have been .96%.
C Total distributions of $.10 per share is comprised of distributions from net investment income of $.097 and distributions from net realized gain of $.005 per share.
D Amount represents less than $.005 per share.
E Total returns for periods of less than one year are not annualized.
F Total returns would have been lower if certain expenses had not been reduced during the applicable periods shown.
G Fees and expenses of any underlying Fidelity Central Funds are not included in the Fund's expense ratio. The Fund indirectly bears its proportionate share of the expenses of any underlying Fidelity Central Funds.
H Expense ratios reflect operating expenses of the class. Expenses before reductions do not reflect amounts reimbursed by the investment adviser or reductions from brokerage service arrangements or reductions from other expense offset arrangements and do not represent the amount paid by the class during periods when reimbursements or reductions occur. Expenses net of fee waivers reflect expenses after reimbursement by the investment adviser but prior to reductions from brokerage service arrangements or other expense offset arrangements. Expenses net of all reductions represent the net expenses paid by the class.
I Annualized
J Amount does not include the portfolio activity of any underlying Fidelity Central Funds.
See accompanying notes which are an integral part of the financial statements.
Financial Highlights — Fidelity International Growth Fund Class I
| | Six months ended (Unaudited) April 30, | Years ended October 31, | | | | |
| | 2017 | 2016 | 2015 | 2014 | 2013 | 2012 |
| Selected Per–Share Data | | | | | | |
| Net asset value, beginning of period | $10.95 | $11.36 | $11.08 | $10.84 | $8.94 | $8.12 |
| Income from Investment Operations | | | | | | |
| Net investment income (loss)A | .07 | .15B | .11 | .13 | .11 | .10 |
| Net realized and unrealized gain (loss) | 1.24 | (.47) | .27 | .18 | 1.90 | .81 |
| Total from investment operations | 1.31 | (.32) | .38 | .31 | 2.01 | .91 |
| Distributions from net investment income | (.14) | (.08) | (.10) | (.06) | (.10) | (.08) |
| Distributions from net realized gain | – | (.01) | – | (.01) | (.01) | (.01) |
| Total distributions | (.14) | (.09) | (.10) | (.07) | (.11) | (.09) |
| Redemption fees added to paid in capitalA,C | – | – | – | – | – | – |
| Net asset value, end of period | $12.12 | $10.95 | $11.36 | $11.08 | $10.84 | $8.94 |
| Total ReturnD,E | 12.11% | (2.87)% | 3.41% | 2.84% | 22.66% | 11.28% |
| Ratios to Average Net AssetsF,G | | | | | | |
| Expenses before reductions | .98%H | .98% | .98% | 1.04% | 1.11% | 1.27% |
| Expenses net of fee waivers, if any | .98%H | .98% | .98% | 1.04% | 1.11% | 1.20% |
| Expenses net of all reductions | .98%H | .98% | .97% | 1.04% | 1.09% | 1.19% |
| Net investment income (loss) | 1.29%H | 1.34%B | .94% | 1.14% | 1.13% | 1.24% |
| Supplemental Data | | | | | | |
| Net assets, end of period (000 omitted) | $564,885 | $359,676 | $267,745 | $121,554 | $38,771 | $3,992 |
| Portfolio turnover rateI | 35%H | 29% | 26% | 27% | 32% | 32% |
A Calculated based on average shares outstanding during the period.
B Net Investment income per share reflects a large, non-recurring dividend which amounted to $.04 per share. Excluding this non-recurring dividend, the ratio of net investment income (loss) to average net assets would have been .97%.
C Amount represents less than $.005 per share.
D Total returns for periods of less than one year are not annualized.
E Total returns would have been lower if certain expenses had not been reduced during the applicable periods shown.
F Fees and expenses of any underlying Fidelity Central Funds are not included in the Fund's expense ratio. The Fund indirectly bears its proportionate share of the expenses of any underlying Fidelity Central Funds.
G Expense ratios reflect operating expenses of the class. Expenses before reductions do not reflect amounts reimbursed by the investment adviser or reductions from brokerage service arrangements or reductions from other expense offset arrangements and do not represent the amount paid by the class during periods when reimbursements or reductions occur. Expenses net of fee waivers reflect expenses after reimbursement by the investment adviser but prior to reductions from brokerage service arrangements or other expense offset arrangements. Expenses net of all reductions represent the net expenses paid by the class.
H Annualized
I Amount does not include the portfolio activity of any underlying Fidelity Central Funds.
See accompanying notes which are an integral part of the financial statements.
Financial Highlights — Fidelity International Growth Fund Class Z
| | Six months ended (Unaudited) April 30, | Years ended October 31, | | | |
| | 2017 | 2016 | 2015 | 2014 | 2013 A |
| Selected Per–Share Data | | | | | |
| Net asset value, beginning of period | $10.97 | $11.38 | $11.10 | $10.84 | $10.26 |
| Income from Investment Operations | | | | | |
| Net investment income (loss)B | .08 | .16C | .12 | .14 | .02 |
| Net realized and unrealized gain (loss) | 1.23 | (.47) | .27 | .19 | .56 |
| Total from investment operations | 1.31 | (.31) | .39 | .33 | .58 |
| Distributions from net investment income | (.15) | (.09) | (.11) | (.06) | – |
| Distributions from net realized gain | – | (.01) | – | (.01) | – |
| Total distributions | (.15) | (.10) | (.11) | (.07) | – |
| Redemption fees added to paid in capitalB,D | – | – | – | – | – |
| Net asset value, end of period | $12.13 | $10.97 | $11.38 | $11.10 | $10.84 |
| Total ReturnE,F | 12.13% | (2.73)% | 3.52% | 3.07% | 5.65% |
| Ratios to Average Net AssetsG,H | | | | | |
| Expenses before reductions | .85%I | .85% | .84% | .88% | .94%I |
| Expenses net of fee waivers, if any | .85%I | .85% | .84% | .88% | .94%I |
| Expenses net of all reductions | .85%I | .84% | .83% | .88% | .93%I |
| Net investment income (loss) | 1.42%I | 1.48%C | 1.07% | 1.30% | .65%I |
| Supplemental Data | | | | | |
| Net assets, end of period (000 omitted) | $300,271 | $16,977 | $897 | $104 | $106 |
| Portfolio turnover rateJ | 35%I | 29% | 26% | 27% | 32% |
A For the period August 13, 2013 (commencement of sale of shares) to October 31, 2013.
B Calculated based on average shares outstanding during the period.
C Net Investment income per share reflects a large, non-recurring dividend which amounted to $.04 per share. Excluding this non-recurring dividend, the ratio of net investment income (loss) to average net assets would have been 1.10%.
D Amount represents less than $.005 per share.
E Total returns for periods of less than one year are not annualized.
F Total returns would have been lower if certain expenses had not been reduced during the applicable periods shown.
G Fees and expenses of any underlying Fidelity Central Funds are not included in the Fund's expense ratio. The Fund indirectly bears its proportionate share of the expenses of any underlying Fidelity Central Funds.
H Expense ratios reflect operating expenses of the class. Expenses before reductions do not reflect amounts reimbursed by the investment adviser or reductions from brokerage service arrangements or reductions from other expense offset arrangements and do not represent the amount paid by the class during periods when reimbursements or reductions occur. Expense ratios before reductions for start-up periods may not be representative of longer-term operating periods. Expenses net of fee waivers reflect expenses after reimbursement by the investment adviser but prior to reductions from brokerage service arrangements or other expense offset arrangements. Expenses net of all reductions represent the net expenses paid by the class.
I Annualized
J Amount does not include the portfolio activity of any underlying Fidelity Central Funds.
See accompanying notes which are an integral part of the financial statements.
Notes to Financial Statements (Unaudited)
For the period ended April 30, 2017
1. Organization.
Fidelity International Growth Fund (the Fund) is a fund of Fidelity Investment Trust (the Trust) and is authorized to issue an unlimited number of shares. The Trust is registered under the Investment Company Act of 1940, as amended (the 1940 Act), as an open-end management investment company organized as a Massachusetts business trust. The Fund offers Class A, Class M (formerly Class T), Class C, International Growth, Class I and Class Z shares, each of which has equal rights as to assets and voting privileges. Each class has exclusive voting rights with respect to matters that affect that class.
After the close of business on June 24, 2016, all outstanding Class B shares were converted to Class A shares. All prior fiscal period dollar and share amounts for Class B presented in the Notes to Financial Statements are for the period November 1, 2015 through June 24, 2016.
2. Investments in Fidelity Central Funds.
The Fund invests in Fidelity Central Funds, which are open-end investment companies generally available only to other investment companies and accounts managed by the investment adviser and its affiliates. The Fund's Schedule of Investments lists each of the Fidelity Central Funds held as of period end, if any, as an investment of the Fund, but does not include the underlying holdings of each Fidelity Central Fund. As an Investing Fund, the Fund indirectly bears its proportionate share of the expenses of the underlying Fidelity Central Funds.
The Money Market Central Funds seek preservation of capital and current income and are managed by Fidelity Investments Money Management, Inc. (FIMM), an affiliate of the investment adviser. Annualized expenses of the Money Market Central Funds as of their most recent shareholder report date are less than .005%.
A complete unaudited list of holdings for each Fidelity Central Fund is available upon request or at the Securities and Exchange Commission (the SEC) website at www.sec.gov. In addition, the financial statements of the Fidelity Central Funds are available on the SEC website or upon request.
3. Significant Accounting Policies.
The Fund is an investment company and applies the accounting and reporting guidance of the Financial Accounting Standards Board (FASB) Accounting Standards Codification Topic 946 Financial Services – Investments Companies. The financial statements have been prepared in conformity with accounting principles generally accepted in the United States of America (GAAP), which require management to make certain estimates and assumptions at the date of the financial statements. Actual results could differ from those estimates. Subsequent events, if any, through the date that the financial statements were issued have been evaluated in the preparation of the financial statements. The following summarizes the significant accounting policies of the Fund:
Investment Valuation. Investments are valued as of 4:00 p.m. Eastern time on the last calendar day of the period. The Board of Trustees (the Board) has delegated the day to day responsibility for the valuation of the Fund's investments to the Fair Value Committee (the Committee) established by the Fund's investment adviser. In accordance with valuation policies and procedures approved by the Board, the Fund attempts to obtain prices from one or more third party pricing vendors or brokers to value its investments. When current market prices, quotations or currency exchange rates are not readily available or reliable, investments will be fair valued in good faith by the Committee, in accordance with procedures adopted by the Board. Factors used in determining fair value vary by investment type and may include market or investment specific events. The frequency with which these procedures are used cannot be predicted and they may be utilized to a significant extent. The Committee oversees the Fund's valuation policies and procedures and reports to the Board on the Committee's activities and fair value determinations. The Board monitors the appropriateness of the procedures used in valuing the Fund's investments and ratifies the fair value determinations of the Committee.
The Fund categorizes the inputs to valuation techniques used to value its investments into a disclosure hierarchy consisting of three levels as shown below:
- Level 1 – quoted prices in active markets for identical investments
- Level 2 – other significant observable inputs (including quoted prices for similar investments, interest rates, prepayment speeds, etc.)
- Level 3 – unobservable inputs (including the Fund's own assumptions based on the best information available)
Valuation techniques used to value the Fund's investments by major category are as follows:
Equity securities, including restricted securities, for which market quotations are readily available, are valued at the last reported sale price or official closing price as reported by a third party pricing vendor on the primary market or exchange on which they are traded and are categorized as Level 1 in the hierarchy. In the event there were no sales during the day or closing prices are not available, securities are valued at the last quoted bid price or may be valued using the last available price and are generally categorized as Level 2 in the hierarchy. For foreign equity securities, when market or security specific events arise, comparisons to the valuation of American Depositary Receipts (ADRs), futures contracts, Exchange-Traded Funds (ETFs) and certain indexes as well as quoted prices for similar securities may be used and would be categorized as Level 2 in the hierarchy. Utilizing these techniques may result in transfers between Level 1 and Level 2. For equity securities, including restricted securities, where observable inputs are limited, assumptions about market activity and risk are used and these securities may be categorized as Level 3 in the hierarchy.
Changes in valuation techniques may result in transfers in or out of an assigned level within the disclosure hierarchy. The aggregate value of investments by input level as of April 30, 2017, including information on transfers between Levels 1 and 2 is included at the end of the Fund's Schedule of Investments.
Foreign Currency. The Fund may use foreign currency contracts to facilitate transactions in foreign-denominated securities. Gains and losses from these transactions may arise from changes in the value of the foreign currency or if the counterparties do not perform under the contracts' terms.
Foreign-denominated assets, including investment securities, and liabilities are translated into U.S. dollars at the exchange rates at period end. Purchases and sales of investment securities, income and dividends received and expenses denominated in foreign currencies are translated into U.S. dollars at the exchange rate in effect on the transaction date.
The effects of exchange rate fluctuations on investments are included with the net realized and unrealized gain (loss) on investment securities. Other foreign currency transactions resulting in realized and unrealized gain (loss) are disclosed separately.
Investment Transactions and Income. For financial reporting purposes, the Fund's investment holdings and NAV include trades executed through the end of the last business day of the period. The NAV per share for processing shareholder transactions is calculated as of the close of business of the New York Stock Exchange (NYSE), normally 4:00 p.m. Eastern time and includes trades executed through the end of the prior business day. Gains and losses on securities sold are determined on the basis of identified cost and may include proceeds received from litigation. Dividend income is recorded on the ex-dividend date, except for certain dividends from foreign securities where the ex-dividend date may have passed, which are recorded as soon as the Fund is informed of the ex-dividend date. Non-cash dividends included in dividend income, if any, are recorded at the fair market value of the securities received. Income and capital gain distributions from Fidelity Central Funds, if any, are recorded on the ex-dividend date. Certain distributions received by the Fund represent a return of capital or capital gain. The Fund determines the components of these distributions subsequent to the ex-dividend date, based upon receipt of tax filings or other correspondence relating to the underlying investment. These distributions are recorded as a reduction of cost of investments and/or as a realized gain. Investment income is recorded net of foreign taxes withheld where recovery of such taxes is uncertain.
Class Allocations and Expenses. Investment income, realized and unrealized capital gains and losses, common expenses of the Fund, and certain fund-level expense reductions, if any, are allocated daily on a pro-rata basis to each class based on the relative net assets of each class to the total net assets of the Fund. Each class differs with respect to transfer agent and distribution and service plan fees incurred. Certain expense reductions may also differ by class. For the reporting period, the allocated portion of income and expenses to each class as a percent of its average net assets may vary due to the timing of recording these transactions in relation to fluctuating net assets of the classes. Expenses directly attributable to a fund are charged to that fund. Expenses attributable to more than one fund are allocated among the respective funds on the basis of relative net assets or other appropriate methods. Expense estimates are accrued in the period to which they relate and adjustments are made when actual amounts are known.
Income Tax Information and Distributions to Shareholders. Each year, the Fund intends to qualify as a regulated investment company under Subchapter M of the Internal Revenue Code, including distributing substantially all of its taxable income and realized gains. As a result, no provision for U.S. Federal income taxes is required. The Fund files a U.S. federal tax return, in addition to state and local tax returns as required. The Fund's federal income tax returns are subject to examination by the Internal Revenue Service (IRS) for a period of three fiscal years after they are filed. State and local tax returns may be subject to examination for an additional fiscal year depending on the jurisdiction. Foreign taxes are provided for based on the Fund's understanding of the tax rules and rates that exist in the foreign markets in which it invests. The Fund is subject to a tax imposed on capital gains by certain countries in which it invests. An estimated deferred tax liability for net unrealized appreciation on the applicable securities is included in Other payables and accrued expenses on the Statement of Assets & Liabilities.
Distributions are declared and recorded on the ex-dividend date. Income dividends and capital gain distributions are declared separately for each class. Income and capital gain distributions are determined in accordance with income tax regulations, which may differ from GAAP.
Capital accounts within the financial statements are adjusted for permanent book-tax differences. These adjustments have no impact on net assets or the results of operations. Capital accounts are not adjusted for temporary book-tax differences which will reverse in a subsequent period.
Book-tax differences are primarily due to foreign currency transactions, passive foreign investment companies (PFIC), capital loss carryforwards and losses deferred due to wash sales.
The federal tax cost of investment securities and unrealized appreciation (depreciation) as of period end were as follows:
| Gross unrealized appreciation | $336,166,927 |
| Gross unrealized depreciation | (28,887,415) |
| Net unrealized appreciation (depreciation) on securities | $307,279,512 |
| Tax cost | $1,637,362,682 |
Capital loss carryforwards are only available to offset future capital gains of the Fund to the extent provided by regulations and may be limited. Under the Regulated Investment Company Modernization Act of 2010 (the Act), the Fund is permitted to carry forward capital losses incurred in taxable years beginning after December 22, 2010 for an unlimited period and such capital losses are required to be used prior to any losses that expire. The capital loss carryforward information presented below, including any applicable limitation, is estimated as of prior fiscal period end and is subject to adjustment.
| No expiration | |
| Short-term | $(52,216,684) |
| Long-term | (20,639,087) |
| Total no expiration | $(72,855,771) |
Short-Term Trading (Redemption) Fees. Shares held by investors in the Fund less than 30 days may have been subject to a redemption fee equal to 1.00% of the NAV of shares redeemed. All redemption fees, which reduce the proceeds of the shareholder redemption, are retained by the Fund and accounted for as an addition to paid in capital. In November 2016, the Board of Trustees approved the elimination of these redemption fees effective December 12, 2016.
4. Purchases and Sales of Investments.
Purchases and sales of securities, other than short-term securities, aggregated $300,726,925 and $291,854,565, respectively.
5. Fees and Other Transactions with Affiliates.
Management Fee. Fidelity Management & Research Company (the investment adviser) and its affiliates provide the Fund with investment management related services for which the Fund pays a monthly management fee. The management fee is the sum of an individual fund fee rate that is based on an annual rate of .45% of the Fund's average net assets and an annualized group fee rate that averaged .25% during the period. The group fee rate is based upon the average net assets of all the mutual funds advised by the investment adviser, including any mutual funds previously advised by the investment adviser that are currently advised by Fidelity SelectCo, LLC, an affiliate of the investment adviser. The group fee rate decreases as assets under management increase and increases as assets under management decrease. In addition, the management fee is subject to a performance adjustment(up to a maximum of +/- .20% of the Fund's average net assets over a 36 month performance period). The upward or downward adjustment to the management fee is based on the relative investment performance of International Growth as compared to its benchmark index, the MSCI EAFE Growth Index, over the same 36 month performance period. For the reporting period, the total annualized management fee rate, including the performance adjustment, was .73% of the Fund's average net assets. The performance adjustment included in the management fee rate may be higher or lower than the maximum performance adjustment rate due to the difference between the average net assets for the reporting and performance periods.
Distribution and Service Plan Fees. In accordance with Rule 12b-1 of the 1940 Act, the Fund has adopted separate Distribution and Service Plans for each class of shares. Certain classes pay Fidelity Distributors Corporation (FDC), an affiliate of the investment adviser, separate Distribution and Service Fees, each of which is based on an annual percentage of each class' average net assets. In addition, FDC may pay financial intermediaries for selling shares of the Fund and providing shareholder support services. For the period, the Distribution and Service Fee rates, total fees and amounts retained by FDC were as follows:
| | Distribution
Fee | Service
Fee | Total Fees | Retained
by FDC |
| Class A | -% | .25% | $236,193 | $333 |
| Class M | .25% | .25% | 72,288 | 650 |
| Class C | .75% | .25% | 267,448 | 45,863 |
| | | | $575,929 | $46,846 |
Sales Load. FDC may receive a front-end sales charge of up to 5.75% for selling Class A shares and 3.50% for selling Class M shares, some of which is paid to financial intermediaries for selling shares of the Fund. Depending on the holding period, FDC may receive contingent deferred sales charges levied on Class A, Class M and Class C redemptions. The deferred sales charges range from 1.00% for Class C shares, 1.00% for certain purchases of Class A shares and .25% for certain purchases of Class M shares.
For the period, sales charge amounts retained by FDC were as follows:
| | Retained
by FDC |
| Class A | $31,559 |
| Class M | 3,906 |
| Class C(a) | 3,165 |
| | $38,630 |
(a) When Class C shares are initially sold, FDC pays commissions from its own resources to financial intermediaries through which the sales are made.
Transfer Agent Fees. Fidelity Investments Institutional Operations Company, Inc., (FIIOC), an affiliate of the investment adviser, is the transfer, dividend disbursing and shareholder servicing agent for each class of the Fund. FIIOC receives account fees and asset-based fees that vary according to the account size and type of account of the shareholders of the respective classes of the Fund, except for Class Z. FIIOC receives an asset-based fee of Class Z's average net assets.FIIOC pays for typesetting, printing and mailing of shareholder reports, except proxy statements.
For the period, transfer agent fees for each class were as follows:
| | Amount | % of
Class-Level Average
Net Assets(a) |
| Class A | $214,309 | .23 |
| Class M | 43,682 | .30 |
| Class C | 70,030 | .26 |
| International Growth | 1,083,060 | .23 |
| Class I | 364,859 | .18 |
| Class Z | 24,749 | .05 |
| | $1,800,689 | |
(a) Annualized
Accounting and Security Lending Fees. Fidelity Service Company, Inc. (FSC), an affiliate of the investment adviser, maintains the Fund's accounting records. The accounting fee is based on the level of average net assets for each month. Under a separate contract, FSC administers the security lending program. The security lending fee is based on the number and duration of lending transactions.
Brokerage Commissions. The Fund placed a portion of its portfolio transactions with brokerage firms which are affiliates of the investment adviser. Brokerage commissions are included in net realized gain (loss) and change in net unrealized appreciation (depreciation) in the Statement of Operations. The commissions paid to these affiliated firms were $903 for the period.
Interfund Lending Program. Pursuant to an Exemptive Order issued by the SEC, the Fund, along with other registered investment companies having management contracts with FMR or other affiliated entities of FMR, may participate in an interfund lending program. This program provides an alternative credit facility allowing the funds to borrow from, or lend money to, other participating affiliated funds. At period end, there were no interfund loans outstanding. The Fund's activity in this program during the period for which loans were outstanding was as follows:
| Borrower or Lender | Average Loan Balance | Weighted Average Interest Rate | Interest Expense |
| Borrower | $10,417,333 | 1.09% | $942 |
Interfund Trades. The Fund may purchase from or sell securities to other Fidelity Funds under procedures adopted by the Board. The procedures have been designed to ensure these interfund trades are executed in accordance with Rule 17a-7 of the 1940 Act. Interfund trades are included within the respective purchases and sales amounts shown in the Purchases and Sales of Investments note.
6. Committed Line of Credit.
The Fund participates with other funds managed by the investment adviser or an affiliate in a $4.25 billion credit facility (the "line of credit") to be utilized for temporary or emergency purposes to fund shareholder redemptions or for other short-term liquidity purposes. The Fund has agreed to pay commitment fees on its pro-rata portion of the line of credit, which amounted to $2,880 and is reflected in Miscellaneous expenses on the Statement of Operations. During the period, the Fund did not borrow on this line of credit.
7. Security Lending.
The Fund lends portfolio securities through a lending agent from time to time in order to earn additional income. For equity securities, a lending agent is used and may loan securities to certain qualified borrowers, including Fidelity Capital Markets (FCM), a broker-dealer affiliated with the Fund. On the settlement date of the loan, the Fund receives collateral (in the form of U.S. Treasury obligations, letters of credit and/or cash) against the loaned securities and maintains collateral in an amount not less than 100% of the market value of the loaned securities during the period of the loan. The market value of the loaned securities is determined at the close of business of the Fund and any additional required collateral is delivered to the Fund on the next business day. The Fund or borrower may terminate the loan at any time, and if the borrower defaults on its obligation to return the securities loaned because of insolvency or other reasons, the Fund may apply collateral received from the borrower against the obligation. The Fund may experience delays and costs in recovering the securities loaned. Any cash collateral received is invested in the Fidelity Securities Lending Cash Central Fund. The value of loaned securities and cash collateral at period end are disclosed on the Fund's Statement of Assets and Liabilities. Security lending income represents the income earned on investing cash collateral, less rebates paid to borrowers and any lending agent fees associated with the loan, plus any premium payments received for lending certain types of securities. Security lending income is presented in the Statement of Operations as a component of income from Fidelity Central Funds. Total security lending income during the period amounted to $213,214. During the period, there were no securities loaned to FCM.
8. Expense Reductions.
Commissions paid to certain brokers with whom the investment adviser, or its affiliates, places trades on behalf of the Fund include an amount in addition to trade execution, which may be rebated back to the Fund to offset certain expenses. This amount totaled $51,424 for the period. Through arrangements with the Fund's custodian, credits realized as a result of certain uninvested cash balances were used to reduce the Fund's expenses. During the period, these credits reduced the Fund's expenses by $73.
In addition, during the period the investment adviser reimbursed and/or waived a portion of fund-level operating expenses in the amount of $7,229.
9. Distributions to Shareholders.
Distributions to shareholders of each class were as follows:
| | Six months ended
April 30, 2017 | Year ended October 31, 2016 |
| From net investment income | | |
| Class A | $1,997,030 | $857,372 |
| Class M | 186,824 | 25,900 |
| Class C | 77,926 | – |
| International Growth | 11,653,320 | 6,508,406 |
| Class I | 4,492,180 | 1,913,593 |
| Class Z | 221,901 | 8,317 |
| Total | $18,629,181 | $9,313,588 |
| From net realized gain | | |
| Class A | $– | $137,180 |
| Class M | – | 20,720 |
| Class B | – | 561 |
| Class C | – | 39,156 |
| International Growth | – | 667,539 |
| Class I | – | 196,266 |
| Class Z | – | 708 |
| Total | $– | $1,062,130 |
10. Share Transactions.
Share transactions for each class were as follows and may contain automatic conversions between classes or exchanges between affiliated funds:
| | Shares | Shares | Dollars | Dollars |
| | Six months ended
April 30, 2017 | Year ended October 31, 2016 | Six months ended
April 30, 2017 | Year ended October 31, 2016 |
| Class A | | | | |
| Shares sold | 2,569,091 | 9,759,153 | $28,204,412 | $106,168,466 |
| Reinvestment of distributions | 187,295 | 86,347 | 1,972,221 | 970,544 |
| Shares redeemed | (11,113,473) | (5,818,948) | (123,912,979) | (63,754,387) |
| Net increase (decrease) | (8,357,087) | 4,026,552 | $(93,736,346) | $43,384,623 |
| Class M | | | | |
| Shares sold | 377,474 | 648,968 | $4,110,523 | $7,086,728 |
| Reinvestment of distributions | 17,518 | 4,067 | 184,470 | 45,714 |
| Shares redeemed | (375,469) | (635,077) | (4,127,637) | (6,841,439) |
| Net increase (decrease) | 19,523 | 17,958 | $167,356 | $291,003 |
| Class B | | | | |
| Shares sold | – | 1,881 | $– | $19,626 |
| Reinvestment of distributions | – | 50 | – | 556 |
| Shares redeemed | – | (73,599) | – | (781,848) |
| Net increase (decrease) | – | (71,668) | $– | $(761,666) |
| Class C | | | | |
| Shares sold | 631,416 | 1,353,782 | $6,910,249 | $14,583,875 |
| Reinvestment of distributions | 7,327 | 3,485 | 76,279 | 38,678 |
| Shares redeemed | (612,420) | (1,125,675) | (6,612,250) | (12,076,750) |
| Net increase (decrease) | 26,323 | 231,592 | $374,278 | $2,545,803 |
| International Growth | | | | |
| Shares sold | 15,844,330 | 31,953,739 | $175,694,906 | $351,819,134 |
| Reinvestment of distributions | 929,056 | 515,203 | 9,838,706 | 5,821,794 |
| Shares redeemed | (46,165,183) | (20,188,262) | (515,037,609) | (220,612,157) |
| Net increase (decrease) | (29,391,797) | 12,280,680 | $(329,503,997) | $137,028,771 |
| Class I | | | | |
| Shares sold | 22,964,654 | 22,905,807 | $259,720,490 | $249,584,348 |
| Reinvestment of distributions | 415,087 | 177,277 | 4,387,467 | 1,999,688 |
| Shares redeemed | (9,605,092) | (13,798,950) | (106,156,960) | (151,305,009) |
| Net increase (decrease) | 13,774,649 | 9,284,134 | $157,950,997 | $100,279,027 |
| Class Z | | | | |
| Shares sold | 30,358,998 | 1,706,835 | $343,595,779 | $18,446,844 |
| Reinvestment of distributions | 20,974 | 799 | 221,901 | 9,025 |
| Shares redeemed | (7,172,969) | (238,655) | (83,279,164) | (2,649,876) |
| Net increase (decrease) | 23,207,003 | 1,468,979 | $260,538,516 | $15,805,993 |
11. Other.
The Fund's organizational documents provide former and current trustees and officers with a limited indemnification against liabilities arising in connection with the performance of their duties to the Fund. In the normal course of business, the Fund may also enter into contracts that provide general indemnifications. The Fund's maximum exposure under these arrangements is unknown as this would be dependent on future claims that may be made against the Fund. The risk of material loss from such claims is considered remote.
Shareholder Expense Example
As a shareholder of the Fund, you incur two types of costs: (1) transaction costs, including sales charges (loads) on purchase payments or redemption proceeds, redemption fees and (2) ongoing costs, including management fees, distribution and/or service (12b-1) fees and other Fund expenses. This Example is intended to help you understand your ongoing costs (in dollars) of investing in the Fund and to compare these costs with the ongoing costs of investing in other mutual funds.
The Example is based on an investment of $1,000 invested at the beginning of the period and held for the entire period (November 1, 2016 to April 30, 2017).
Actual Expenses
The first line of the accompanying table for each class of the Fund provides information about actual account values and actual expenses. You may use the information in this line, together with the amount you invested, to estimate the expenses that you paid over the period. Simply divide your account value by $1,000.00 (for example, an $8,600 account value divided by $1,000.00 = 8.6), then multiply the result by the number in the first line for a class of the Fund under the heading entitled "Expenses Paid During Period" to estimate the expenses you paid on your account during this period. A small balance maintenance fee of $12.00 that is charged once a year may apply for certain accounts with a value of less than $2,000. This fee is not included in the table below. If it was, the estimate of expenses you paid during the period would be higher, and your ending account value lower, by this amount. In addition, the Fund, as a shareholder in the underlying Fidelity Central Funds, will indirectly bear its pro-rata share of the fees and expenses incurred by the underlying Fidelity Central Funds. These fees and expenses are not included in the Fund's annualized expense ratio used to calculate the expense estimate in the table below.
Hypothetical Example for Comparison Purposes
The second line of the accompanying table for each class of the Fund provides information about hypothetical account values and hypothetical expenses based on a Class' actual expense ratio and an assumed rate of return of 5% per year before expenses, which is not the Class' actual return. The hypothetical account values and expenses may not be used to estimate the actual ending account balance or expenses you paid for the period. You may use this information to compare the ongoing costs of investing in the Fund and other funds. To do so, compare this 5% hypothetical example with the 5% hypothetical examples that appear in the shareholder reports of the other funds. A small balance maintenance fee of $12.00 that is charged once a year may apply for certain accounts with a value of less than $2,000. This fee is not included in the table below. If it was, the estimate of expenses you paid during the period would be higher, and your ending account value lower, by this amount. In addition, the Fund, as a shareholder in the underlying Fidelity Central Funds, will indirectly bear its pro-rata share of the fees and expenses incurred by the underlying Fidelity Central Funds. These fees and expenses are not included in the Fund's annualized expense ratio used to calculate the expense estimate in the table below.
Please note that the expenses shown in the table are meant to highlight your ongoing costs only and do not reflect any transaction costs. Therefore, the second line of the table is useful in comparing ongoing costs only, and will not help you determine the relative total costs of owning different funds. In addition, if these transactional costs were included, your costs would have been higher.
| | Annualized Expense Ratio-A | Beginning
Account Value
November 1, 2016 | Ending
Account Value
April 30, 2017 | Expenses Paid
During Period-B
November 1, 2016
to April 30, 2017 |
| Class A | 1.28% | | | |
| Actual | | $1,000.00 | $1,119.20 | $6.73 |
| Hypothetical-C | | $1,000.00 | $1,018.45 | $6.41 |
| Class M | 1.61% | | | |
| Actual | | $1,000.00 | $1,118.10 | $8.46 |
| Hypothetical-C | | $1,000.00 | $1,016.81 | $8.05 |
| Class C | 2.07% | | | |
| Actual | | $1,000.00 | $1,115.10 | $10.86 |
| Hypothetical-C | | $1,000.00 | $1,014.53 | $10.34 |
| International Growth | 1.04% | | | |
| Actual | | $1,000.00 | $1,120.40 | $5.47 |
| Hypothetical-C | | $1,000.00 | $1,019.64 | $5.21 |
| Class I | .98% | | | |
| Actual | | $1,000.00 | $1,121.10 | $5.15 |
| Hypothetical-C | | $1,000.00 | $1,019.93 | $4.91 |
| Class Z | .85% | | | |
| Actual | | $1,000.00 | $1,121.30 | $4.47 |
| Hypothetical-C | | $1,000.00 | $1,020.58 | $4.26 |
A Annualized expense ratio reflects expenses net of applicable fee waivers.
B Expenses are equal to each Class' annualized expense ratio, multiplied by the average account value over the period, multiplied by 181/365 (to reflect the one-half year period).
C 5% return per year before expenses
AIGF-SANN-0617
1.853352.109
Fidelity® International Small Cap Fund
Semi-Annual Report April 30, 2017 |
|
Contents
To view a fund's proxy voting guidelines and proxy voting record for the 12-month period ended June 30, visit http://www.fidelity.com/proxyvotingresults or visit the Securities and Exchange Commission's (SEC) web site at http://www.sec.gov.
You may also call 1-800-544-8544 to request a free copy of the proxy voting guidelines.
Standard & Poor's, S&P and S&P 500 are registered service marks of The McGraw-Hill Companies, Inc. and have been licensed for use by Fidelity Distributors Corporation.
Other third-party marks appearing herein are the property of their respective owners.
All other marks appearing herein are registered or unregistered trademarks or service marks of FMR LLC or an affiliated company. © 2017 FMR LLC. All rights reserved.
This report and the financial statements contained herein are submitted for the general information of the shareholders of the Fund. This report is not authorized for distribution to prospective investors in the Fund unless preceded or accompanied by an effective prospectus.
A fund files its complete schedule of portfolio holdings with the SEC for the first and third quarters of each fiscal year on Form N-Q. Forms N-Q are available on the SEC’s web site at http://www.sec.gov. A fund's Forms N-Q may be reviewed and copied at the SEC’s Public Reference Room in Washington, DC. Information regarding the operation of the SEC's Public Reference Room may be obtained by calling 1-800-SEC-0330.
For a complete list of a fund's portfolio holdings, view the most recent holdings listing, semiannual report, or annual report on Fidelity's web site at http://www.fidelity.com, http://www.institutional.fidelity.com, or http://www.401k.com, as applicable.
NOT FDIC INSURED •MAY LOSE VALUE •NO BANK GUARANTEE
Neither the Fund nor Fidelity Distributors Corporation is a bank.
Investment Summary (Unaudited)
Geographic Diversification (% of fund's net assets)
| As of April 30, 2017 |
| | Japan | 20.1% |
| | United Kingdom | 15.0% |
| | United States of America* | 5.6% |
| | Canada | 5.0% |
| | Australia | 4.9% |
| | Cayman Islands | 3.7% |
| | France | 3.5% |
| | Austria | 3.3% |
| | Finland | 3.0% |
| | Other | 35.9% |

* Includes Short-Term investments and Net Other Assets (Liabilities).
Percentages are based on country or territory of incorporation and are adjusted for the effect of futures contracts, if applicable.
| As of October 31, 2016 |
| | Japan | 22.1% |
| | United Kingdom | 13.5% |
| | United States of America* | 6.0% |
| | Canada | 5.2% |
| | Australia | 4.3% |
| | Cayman Islands | 4.0% |
| | France | 3.6% |
| | Switzerland | 2.9% |
| | Finland | 2.8% |
| | Other | 35.6% |
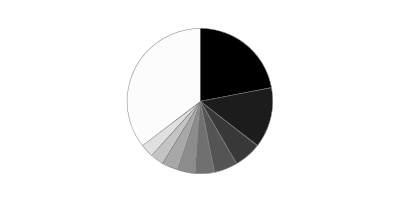
* Includes Short-Term investments and Net Other Assets (Liabilities).
Percentages are based on country or territory of incorporation and are adjusted for the effect of futures contracts, if applicable.
Asset Allocation as of April 30, 2017
| | % of fund's net assets | % of fund's net assets 6 months ago |
| Stocks | 94.8 | 94.8 |
| Short-Term Investments and Net Other Assets (Liabilities) | 5.2 | 5.2 |
Top Ten Stocks as of April 30, 2017
| | % of fund's net assets | % of fund's net assets 6 months ago |
| Micro Focus International PLC (United Kingdom, Software) | 1.2 | 1.2 |
| S Foods, Inc. (Japan, Food Products) | 0.9 | 0.9 |
| IWG PLC (Bailiwick of Jersey, Commercial Services & Supplies) | 0.9 | 0.6 |
| JSR Corp. (Japan, Chemicals) | 0.9 | 1.0 |
| GUD Holdings Ltd. (Australia, Household Durables) | 0.8 | 0.8 |
| Kaken Pharmaceutical Co. Ltd. (Japan, Pharmaceuticals) | 0.8 | 0.8 |
| Paysafe Group PLC (Isle of Man, IT Services) | 0.8 | 0.6 |
| Tsuruha Holdings, Inc. (Japan, Food & Staples Retailing) | 0.8 | 0.8 |
| Frutarom Industries Ltd. (Israel, Chemicals) | 0.8 | 0.9 |
| SITC International Holdings Co. Ltd. (Cayman Islands, Marine) | 0.8 | 0.8 |
| | 8.7 | |
Top Market Sectors as of April 30, 2017
| | % of fund's net assets | % of fund's net assets 6 months ago |
| Industrials | 18.3 | 18.4 |
| Consumer Discretionary | 17.2 | 16.2 |
| Financials | 12.7 | 13.9 |
| Materials | 9.8 | 9.7 |
| Information Technology | 9.3 | 9.7 |
| Consumer Staples | 8.8 | 8.4 |
| Health Care | 8.6 | 9.5 |
| Real Estate | 6.1 | 4.8 |
| Energy | 3.7 | 3.9 |
| Utilities | 0.3 | 0.3 |
Investments April 30, 2017 (Unaudited)
Showing Percentage of Net Assets
| Common Stocks - 93.4% | | | |
| | | Shares | Value |
| Australia - 4.9% | | | |
| Asaleo Care Ltd. | | 3,943,545 | $5,300,503 |
| Aub Group Ltd. | | 616,464 | 5,566,995 |
| Austal Ltd. | | 3,190,191 | 4,096,818 |
| Challenger Ltd. | | 517,919 | 5,126,951 |
| GUD Holdings Ltd. | | 1,209,665 | 11,268,117 |
| Imdex Ltd. (a) | | 15,092,652 | 7,006,854 |
| Life Healthcare Group Ltd. | | 2,135,290 | 3,421,657 |
| Nanosonics Ltd. (a) | | 1,806,209 | 4,273,866 |
| Pact Group Holdings Ltd. | | 1,183,938 | 6,250,056 |
| Programmed Maintenance Services Ltd. | | 4,927,825 | 6,346,723 |
| Servcorp Ltd. | | 861,308 | 3,798,740 |
| SomnoMed Ltd. (a)(b) | | 992,506 | 2,199,838 |
|
| TOTAL AUSTRALIA | | | 64,657,118 |
|
| Austria - 3.3% | | | |
| Andritz AG | | 145,932 | 8,070,588 |
| Buwog-Gemeinnuetzige Wohnung | | 341,791 | 9,229,638 |
| IMMOFINANZ Immobilien Anlagen AG (b) | | 4,183,443 | 8,703,917 |
| Palfinger AG (a) | | 33,893 | 1,384,117 |
| RHI AG | | 308,031 | 8,975,646 |
| Wienerberger AG | | 314,200 | 7,358,548 |
|
| TOTAL AUSTRIA | | | 43,722,454 |
|
| Bailiwick of Jersey - 0.9% | | | |
| IWG PLC | | 2,779,200 | 11,695,165 |
| Belgium - 0.5% | | | |
| Barco NV | | 67,583 | 6,655,818 |
| Bermuda - 1.4% | | | |
| BW Offshore Ltd. (a) | | 1,659,938 | 4,272,610 |
| Hiscox Ltd. | | 492,381 | 7,219,125 |
| Petra Diamonds Ltd. (a) | | 4,358,474 | 7,321,689 |
|
| TOTAL BERMUDA | | | 18,813,424 |
|
| Brazil - 0.3% | | | |
| MAHLE Metal Leve SA | | 662,300 | 4,217,036 |
| British Virgin Islands - 0.3% | | | |
| Gem Diamonds Ltd. | | 3,674,562 | 4,176,279 |
| Canada - 5.0% | | | |
| AutoCanada, Inc. (b) | | 382,084 | 6,572,164 |
| Dorel Industries, Inc. Class B (sub. vtg.) | | 195,603 | 4,700,032 |
| Genesis Land Development Corp. | | 1,872,122 | 4,388,697 |
| Lassonde Industries, Inc. Class A (sub. vtg.) | | 44,669 | 7,813,353 |
| McCoy Global, Inc. (a) | | 1,341,870 | 1,916,887 |
| North West Co., Inc. | | 279,700 | 6,597,810 |
| Open Text Corp. | | 272,096 | 9,434,309 |
| ShawCor Ltd. Class A | | 164,385 | 4,124,527 |
| TransForce, Inc. | | 261,000 | 5,682,517 |
| Western Forest Products, Inc. | | 4,516,800 | 7,114,113 |
| Whitecap Resources, Inc. (b) | | 1,131,353 | 8,006,205 |
|
| TOTAL CANADA | | | 66,350,614 |
|
| Cayman Islands - 3.7% | | | |
| AMVIG Holdings Ltd. | | 17,298,000 | 5,782,049 |
| Best Pacific International Holdings Ltd. | | 5,304,000 | 4,657,327 |
| China High Precision Automation Group Ltd. (a) | | 712,000 | 1 |
| China Metal Recycling (Holdings) Ltd. (a) | | 436,800 | 1 |
| Greatview Aseptic Pack Co. Ltd. | | 6,561,000 | 3,399,285 |
| Haitian International Holdings Ltd. | | 2,703,000 | 6,623,407 |
| Lifestyle International Holdings Ltd. | | 3,561,000 | 5,081,682 |
| Pico Far East Holdings Ltd. | | 18,482,000 | 7,484,659 |
| SITC International Holdings Co. Ltd. | | 14,414,000 | 10,321,724 |
| Value Partners Group Ltd. (b) | | 6,679,000 | 6,182,391 |
|
| TOTAL CAYMAN ISLANDS | | | 49,532,526 |
|
| Chile - 0.7% | | | |
| Quinenco SA | | 2,156,335 | 5,857,666 |
| Vina San Pedro SA | | 394,698,308 | 3,844,051 |
|
| TOTAL CHILE | | | 9,701,717 |
|
| China - 0.5% | | | |
| Qingdao Port International Co. Ltd. | | 11,307,000 | 6,018,112 |
| Denmark - 1.2% | | | |
| Jyske Bank A/S (Reg.) | | 156,703 | 8,374,170 |
| Scandinavian Tobacco Group A/S | | 401,913 | 7,016,150 |
|
| TOTAL DENMARK | | | 15,390,320 |
|
| Finland - 3.0% | | | |
| Amer Group PLC (A Shares) (b) | | 386,245 | 8,561,991 |
| Asiakastieto Group Oyj | | 376,423 | 7,368,375 |
| Cramo Oyj (B Shares) | | 233,810 | 6,079,432 |
| Olvi PLC (A Shares) | | 180,338 | 5,578,958 |
| Oriola-KD Oyj | | 1,700,800 | 7,169,877 |
| Tikkurila Oyj | | 285,646 | 5,663,006 |
|
| TOTAL FINLAND | | | 40,421,639 |
|
| France - 3.5% | | | |
| Altarea SCA | | 37,300 | 7,522,809 |
| Maisons du Monde SA | | 175,000 | 6,073,392 |
| Rexel SA | | 358,500 | 6,404,430 |
| The Lisi Group | | 94,909 | 3,721,837 |
| The Vicat Group | | 124,556 | 8,861,186 |
| Thermador Groupe SA | | 47,752 | 4,805,782 |
| Wendel SA | | 66,635 | 9,338,125 |
|
| TOTAL FRANCE | | | 46,727,561 |
|
| Germany - 1.9% | | | |
| Axel Springer Verlag AG | | 165,400 | 9,280,568 |
| CompuGroup Medical AG | | 133,049 | 6,550,848 |
| mutares AG | | 188,600 | 2,876,188 |
| SHW Group | | 171,439 | 6,013,302 |
|
| TOTAL GERMANY | | | 24,720,906 |
|
| Greece - 0.5% | | | |
| Metka Industrial-Construction | | 946,716 | 7,218,804 |
| Hong Kong - 2.6% | | | |
| Dah Sing Banking Group Ltd. | | 4,430,800 | 8,909,050 |
| Far East Horizon Ltd. | | 6,811,000 | 6,269,551 |
| Magnificent Hotel Investment Ltd. | | 160,416,000 | 3,897,822 |
| Sino Land Ltd. | | 4,832,440 | 8,188,312 |
| Techtronic Industries Co. Ltd. | | 1,607,500 | 6,902,556 |
|
| TOTAL HONG KONG | | | 34,167,291 |
|
| India - 0.5% | | | |
| Edelweiss Financial Services Ltd. | | 1,069,635 | 2,789,303 |
| Torrent Pharmaceuticals Ltd. (a) | | 201,745 | 4,452,103 |
|
| TOTAL INDIA | | | 7,241,406 |
|
| Indonesia - 0.7% | | | |
| PT ACE Hardware Indonesia Tbk | | 71,443,900 | 5,011,632 |
| PT Media Nusantara Citra Tbk | | 34,093,000 | 4,667,996 |
|
| TOTAL INDONESIA | | | 9,679,628 |
|
| Ireland - 2.0% | | | |
| C&C Group PLC | | 911,912 | 3,761,800 |
| Mincon Group PLC | | 5,972,545 | 6,766,129 |
| Origin Enterprises PLC | | 866,600 | 7,032,706 |
| United Drug PLC (United Kingdom) | | 989,149 | 9,570,159 |
|
| TOTAL IRELAND | | | 27,130,794 |
|
| Isle of Man - 0.8% | | | |
| Paysafe Group PLC (a) | | 1,820,600 | 10,703,149 |
| Israel - 0.8% | | | |
| Frutarom Industries Ltd. | | 177,789 | 10,450,958 |
| Italy - 1.4% | | | |
| Banca Generali SpA | | 247,100 | 7,103,292 |
| Banco di Desio e della Brianza SpA | | 1,862,695 | 5,092,874 |
| Recordati SpA | | 169,661 | 6,285,447 |
|
| TOTAL ITALY | | | 18,481,613 |
|
| Japan - 20.1% | | | |
| A/S One Corp. | | 142,500 | 6,308,477 |
| Aeon Delight Co. Ltd. | | 254,400 | 7,759,229 |
| Arc Land Sakamoto Co. Ltd. | | 564,200 | 6,979,429 |
| Aucnet, Inc. | | 233,600 | 2,818,497 |
| Broadleaf Co. Ltd. | | 819,600 | 5,315,728 |
| Central Automotive Products Ltd. | | 337,000 | 3,491,680 |
| Daiwa Industries Ltd. | | 495,600 | 4,881,532 |
| Dexerials Corp. | | 771,000 | 6,930,182 |
| Fuji Corp. | | 149,100 | 2,677,714 |
| Funai Soken Holdings, Inc. | | 203,520 | 3,910,651 |
| GMO Internet, Inc. | | 706,500 | 8,384,835 |
| Iida Group Holdings Co. Ltd. | | 533,351 | 8,487,685 |
| Japan Meat Co. Ltd. | | 380,900 | 6,338,367 |
| JSR Corp. | | 635,300 | 11,603,237 |
| Kaken Pharmaceutical Co. Ltd. | | 183,200 | 10,862,992 |
| Kotobuki Spirits Co. Ltd. | | 137,000 | 3,693,070 |
| Meitec Corp. | | 147,000 | 6,349,451 |
| Minebea Mitsumi, Inc. | | 534,000 | 7,717,192 |
| Miraca Holdings, Inc. | | 118,300 | 5,454,694 |
| Mitani Shoji Co. Ltd. | | 251,100 | 7,827,517 |
| Morinaga & Co. Ltd. | | 169,000 | 7,989,504 |
| Nihon Parkerizing Co. Ltd. | | 785,300 | 10,080,864 |
| Nitori Holdings Co. Ltd. | | 61,200 | 7,966,019 |
| Otsuka Corp. | | 121,400 | 6,501,529 |
| PALTAC Corp. | | 224,500 | 6,625,746 |
| Paramount Bed Holdings Co. Ltd. | | 237,400 | 9,955,999 |
| Ricoh Leasing Co. Ltd. | | 236,400 | 7,655,564 |
| S Foods, Inc. (b) | | 383,000 | 11,939,224 |
| San-Ai Oil Co. Ltd. | | 617,400 | 5,239,385 |
| Shinsei Bank Ltd. | | 5,058,000 | 9,437,668 |
| Ship Healthcare Holdings, Inc. | | 265,000 | 7,124,512 |
| TKC Corp. | | 242,200 | 6,583,234 |
| Toshiba Plant Systems & Services Corp. | | 617,200 | 10,037,978 |
| Tsuruha Holdings, Inc. | | 103,100 | 10,451,043 |
| VT Holdings Co. Ltd. | | 1,312,400 | 6,675,316 |
| Welcia Holdings Co. Ltd. | | 208,300 | 6,708,204 |
| Yamada Consulting Group Co. Ltd. | | 168,200 | 7,710,267 |
|
| TOTAL JAPAN | | | 266,474,215 |
|
| Korea (South) - 1.2% | | | |
| BGFretail Co. Ltd. | | 39,299 | 3,782,736 |
| Fila Korea Ltd. | | 54,731 | 3,338,899 |
| Hy-Lok Corp. | | 125,792 | 2,476,917 |
| NS Shopping Co. Ltd. | | 38,218 | 5,711,199 |
|
| TOTAL KOREA (SOUTH) | | | 15,309,751 |
|
| Luxembourg - 0.4% | | | |
| SAF-Holland SA | | 318,400 | 5,500,773 |
| Mexico - 0.2% | | | |
| Credito Real S.A.B. de CV | | 2,307,500 | 3,234,747 |
| Netherlands - 2.9% | | | |
| Amsterdam Commodities NV | | 261,855 | 7,302,109 |
| Arcadis NV (b) | | 212,989 | 3,690,102 |
| Basic-Fit NV | | 344,300 | 6,019,488 |
| BinckBank NV | | 1,026,016 | 5,099,788 |
| IMCD Group BV | | 142,000 | 7,648,956 |
| Philips Lighting NV | | 268,100 | 9,070,804 |
|
| TOTAL NETHERLANDS | | | 38,831,247 |
|
| New Zealand - 0.7% | | | |
| EBOS Group Ltd. | | 707,802 | 8,898,236 |
| Norway - 1.6% | | | |
| ABG Sundal Collier ASA | | 8,682,510 | 5,683,171 |
| Ekornes A/S | | 398,197 | 6,260,959 |
| Kongsberg Gruppen ASA (b) | | 318,133 | 4,965,039 |
| Spectrum ASA (a) | | 795,172 | 3,658,199 |
|
| TOTAL NORWAY | | | 20,567,368 |
|
| Philippines - 0.2% | | | |
| Century Pacific Food, Inc. | | 9,401,500 | 3,093,123 |
| Romania - 0.4% | | | |
| Banca Transilvania SA | | 7,850,048 | 5,199,019 |
| Singapore - 1.6% | | | |
| Boustead Projs. Pte Ltd. (a) | | 994,106 | 608,353 |
| Boustead Singapore Ltd. | | 4,499,905 | 2,866,489 |
| Hour Glass Ltd. | | 8,087,500 | 3,994,113 |
| Mapletree Industrial (REIT) | | 4,336,794 | 5,556,212 |
| Wing Tai Holdings Ltd. | | 5,630,000 | 7,616,004 |
|
| TOTAL SINGAPORE | | | 20,641,171 |
|
| South Africa - 0.6% | | | |
| Clicks Group Ltd. | | 726,051 | 7,292,700 |
| Spain - 0.7% | | | |
| Hispania Activos Inmobiliarios SA | | 576,585 | 8,705,106 |
| Sweden - 1.4% | | | |
| Addlife AB (a) | | 99,154 | 1,886,291 |
| AddTech AB (B Shares) | | 281,419 | 5,067,722 |
| Coor Service Management Holding AB | | 515,800 | 3,217,453 |
| Granges AB | | 825,021 | 8,569,421 |
|
| TOTAL SWEDEN | | | 18,740,887 |
|
| Switzerland - 1.4% | | | |
| Daetwyler Holdings AG | | 36,603 | 6,194,920 |
| Vontobel Holdings AG | | 145,334 | 8,559,369 |
| VZ Holding AG | | 15,361 | 4,272,519 |
|
| TOTAL SWITZERLAND | | | 19,026,808 |
|
| Taiwan - 2.8% | | | |
| King's Town Bank | | 5,243,000 | 5,030,837 |
| Lumax International Corp. Ltd. | | 314,000 | 537,134 |
| Makalot Industrial Co. Ltd. | | 1,616,540 | 6,792,859 |
| Test Research, Inc. | | 2,867,000 | 3,808,690 |
| Tripod Technology Corp. | | 2,812,000 | 7,936,459 |
| Yageo Corp. | | 2,485,000 | 8,756,659 |
| Yung Chi Paint & Varnish Manufacturing Co. Ltd. | | 1,578,000 | 4,281,375 |
|
| TOTAL TAIWAN | | | 37,144,013 |
|
| Thailand - 1.1% | | | |
| Delta Electronics PCL (For. Reg.) | | 2,800,300 | 7,445,884 |
| TISCO Financial Group PCL | | 3,290,000 | 7,250,361 |
|
| TOTAL THAILAND | | | 14,696,245 |
|
| Turkey - 0.3% | | | |
| Aygaz A/S | | 989,000 | 3,945,475 |
| United Kingdom - 15.0% | | | |
| AEW UK REIT PLC (b) | | 3,009,468 | 3,902,735 |
| Alliance Pharma PLC | | 8,615,465 | 5,300,406 |
| Amec Foster Wheeler PLC | | 857,310 | 6,029,406 |
| Ashmore Group PLC | | 1,267,607 | 5,710,196 |
| Bond International Software PLC (a) | | 899,666 | 12 |
| Cineworld Group PLC | | 687,076 | 6,264,902 |
| Close Brothers Group PLC | | 341,180 | 7,476,886 |
| Countrywide PLC | | 3,323,607 | 7,307,289 |
| Diploma PLC | | 295,551 | 4,245,226 |
| Elementis PLC | | 1,348,200 | 5,311,906 |
| Empiric Student Property PLC | | 3,213,272 | 4,557,204 |
| Essentra PLC | | 1,112,800 | 7,804,632 |
| Exova Group Ltd. PLC | | 1,395,369 | 4,310,367 |
| Informa PLC | | 1,072,291 | 8,916,297 |
| ITE Group PLC | | 2,854,064 | 6,542,953 |
| James Fisher and Sons PLC | | 182,700 | 3,800,327 |
| Jardine Lloyd Thompson Group PLC | | 402,000 | 5,711,754 |
| John Wood Group PLC | | 811,800 | 7,985,712 |
| LivaNova PLC (a) | | 189,100 | 9,965,570 |
| Luxfer Holdings PLC sponsored ADR | | 843,509 | 9,860,620 |
| McColl's Retail Group PLC | | 3,083,652 | 8,267,468 |
| Mears Group PLC | | 1,465,810 | 9,891,274 |
| Melrose Industries PLC | | 2,514,228 | 7,701,452 |
| Micro Focus International PLC | | 459,944 | 15,417,225 |
| PayPoint PLC | | 352,811 | 4,647,291 |
| Sinclair Pharma PLC (a) | | 12,139,907 | 5,267,409 |
| Spectris PLC | | 195,480 | 6,987,925 |
| Ten Entertainment Group PLC | | 2,193,500 | 4,694,788 |
| The Restaurant Group PLC | | 761,100 | 3,445,290 |
| Topps Tiles PLC | | 5,532,808 | 7,434,821 |
| Ultra Electronics Holdings PLC | | 114,125 | 3,092,284 |
| Volution Group PLC | | 114,700 | 291,177 |
|
| TOTAL UNITED KINGDOM | | | 198,142,804 |
|
| United States of America - 0.4% | | | |
| Dillard's, Inc. Class A (b) | | 86,694 | 4,800,247 |
| Wecast Network, Inc. warrants 8/30/17 (a)(c) | | 27,500 | 1,612 |
|
| TOTAL UNITED STATES OF AMERICA | | | 4,801,859 |
|
| TOTAL COMMON STOCKS | | | |
| (Cost $1,081,086,065) | | | 1,238,119,879 |
|
| Preferred Stocks - 1.4% | | | |
| Convertible Preferred Stocks - 0.2% | | | |
| India - 0.2% | | | |
| PC Jeweller Ltd. 13.00% (c) | | 20,810,176 | 3,217,165 |
| Nonconvertible Preferred Stocks - 1.2% | | | |
| Brazil - 1.2% | | | |
| Alpargatas SA (PN) | | 1,841,800 | 7,717,566 |
| Banco ABC Brasil SA | | 1,390,219 | 7,805,076 |
| | | | 15,522,642 |
| TOTAL PREFERRED STOCKS | | | |
| (Cost $14,008,204) | | | 18,739,807 |
|
| Money Market Funds - 6.4% | | | |
| Fidelity Cash Central Fund, 0.85% (d) | | 65,961,149 | 65,974,342 |
| Fidelity Securities Lending Cash Central Fund 0.86% (d)(e) | | 18,369,526 | 18,371,363 |
| TOTAL MONEY MARKET FUNDS | | | |
| (Cost $84,336,820) | | | 84,345,705 |
| TOTAL INVESTMENT PORTFOLIO - 101.2% | | | |
| (Cost $1,179,431,089) | | | 1,341,205,391 |
| NET OTHER ASSETS (LIABILITIES) - (1.2)% | | | (16,009,111) |
| NET ASSETS - 100% | | | $1,325,196,280 |
Categorizations in the Schedule of Investments are based on country or territory of incorporation.
Legend
(a) Non-income producing
(b) Security or a portion of the security is on loan at period end.
(c) Restricted securities - Investment in securities not registered under the Securities Act of 1933 (excluding 144A issues). At the end of the period, the value of restricted securities (excluding 144A issues) amounted to $3,218,777 or 0.2% of net assets.
(d) Affiliated fund that is generally available only to investment companies and other accounts managed by Fidelity Investments. The rate quoted is the annualized seven-day yield of the fund at period end. A complete unaudited listing of the fund's holdings as of its most recent quarter end is available upon request. In addition, each Fidelity Central Fund's financial statements are available on the SEC's website or upon request.
(e) Investment made with cash collateral received from securities on loan.
Additional information on each restricted holding is as follows:
| Security | Acquisition Date | Acquisition Cost |
| PC Jeweller Ltd. 13.00% | 7/28/16 | $3,105,681 |
| Wecast Network, Inc. warrants 8/30/17 | 9/14/12 | $0 |
Affiliated Central Funds
Information regarding fiscal year to date income earned by the Fund from investments in Fidelity Central Funds is as follows:
| Fund | Income earned |
| Fidelity Cash Central Fund | $171,359 |
| Fidelity Securities Lending Cash Central Fund | 112,622 |
| Total | $283,981 |
Investment Valuation
The following is a summary of the inputs used, as of April 30, 2017, involving the Fund's assets and liabilities carried at fair value. The inputs or methodology used for valuing securities may not be an indication of the risk associated with investing in those securities. For more information on valuation inputs, and their aggregation into the levels used below, please refer to the Investment Valuation section in the accompanying Notes to Financial Statements.
| | Valuation Inputs at Reporting Date: |
| Description | Total | Level 1 | Level 2 | Level 3 |
| Investments in Securities: | | | | |
| Equities: | | | | |
| Consumer Discretionary | $227,947,796 | $219,017,820 | $3,218,777 | $5,711,199 |
| Consumer Staples | 116,786,729 | 116,786,729 | -- | -- |
| Energy | 47,899,747 | 47,899,747 | -- | -- |
| Financials | 169,991,120 | 169,991,120 | -- | -- |
| Health Care | 114,948,381 | 114,948,381 | -- | -- |
| Industrials | 243,101,730 | 243,101,730 | -- | -- |
| Information Technology | 122,750,940 | 122,750,927 | -- | 13 |
| Materials | 130,011,105 | 130,011,104 | -- | 1 |
| Real Estate | 79,476,663 | 79,476,663 | -- | -- |
| Utilities | 3,945,475 | 3,945,475 | -- | -- |
| Money Market Funds | 84,345,705 | 84,345,705 | -- | -- |
| Total Investments in Securities: | $1,341,205,391 | $1,332,275,401 | $3,218,777 | $5,711,213 |
See accompanying notes which are an integral part of the financial statements.
Financial Statements
Statement of Assets and Liabilities
| | | April 30, 2017 (Unaudited) |
| Assets | | |
Investment in securities, at value (including securities loaned of $17,465,466) — See accompanying schedule:
Unaffiliated issuers (cost $1,095,094,269) | $1,256,859,686 | |
| Fidelity Central Funds (cost $84,336,820) | 84,345,705 | |
| Total Investments (cost $1,179,431,089) | | $1,341,205,391 |
| Receivable for investments sold | | 3,343 |
| Receivable for fund shares sold | | 3,346,211 |
| Dividends receivable | | 6,828,862 |
| Distributions receivable from Fidelity Central Funds | | 70,707 |
| Prepaid expenses | | 575 |
| Other receivables | | 555,557 |
| Total assets | | 1,352,010,646 |
| Liabilities | | |
| Payable to custodian bank | $264,922 | |
| Payable for investments purchased | 5,616,421 | |
| Payable for fund shares redeemed | 1,045,432 | |
| Accrued management fee | 1,049,176 | |
| Distribution and service plan fees payable | 26,355 | |
| Other affiliated payables | 236,342 | |
| Other payables and accrued expenses | 202,708 | |
| Collateral on securities loaned | 18,373,010 | |
| Total liabilities | | 26,814,366 |
| Net Assets | | $1,325,196,280 |
| Net Assets consist of: | | |
| Paid in capital | | $1,156,961,463 |
| Undistributed net investment income | | 6,128,094 |
| Accumulated undistributed net realized gain (loss) on investments and foreign currency transactions | | 467,665 |
| Net unrealized appreciation (depreciation) on investments and assets and liabilities in foreign currencies | | 161,639,058 |
| Net Assets | | $1,325,196,280 |
| Calculation of Maximum Offering Price | | |
| Class A: | | |
| Net Asset Value and redemption price per share ($40,308,447 ÷ 1,560,157 shares) | | $25.84 |
| Maximum offering price per share (100/94.25 of $25.84) | | $27.42 |
| Class M: | | |
| Net Asset Value and redemption price per share ($15,096,405 ÷ 586,994 shares) | | $25.72 |
| Maximum offering price per share (100/96.50 of $25.72) | | $26.65 |
| Class C: | | |
| Net Asset Value and offering price per share ($15,352,410 ÷ 613,564 shares)(a) | | $25.02 |
| International Small Cap: | | |
| Net Asset Value, offering price and redemption price per share ($1,180,177,592 ÷ 44,928,811 shares) | | $26.27 |
| Class I: | | |
| Net Asset Value, offering price and redemption price per share ($74,261,426 ÷ 2,808,295 shares) | | $26.44 |
(a) Redemption price per share is equal to net asset value less any applicable contingent deferred sales charge.
See accompanying notes which are an integral part of the financial statements.
Statement of Operations
| | | Six months ended April 30, 2017 (Unaudited) |
| Investment Income | | |
| Dividends | | $15,017,057 |
| Income from Fidelity Central Funds | | 283,981 |
| Income before foreign taxes withheld | | 15,301,038 |
| Less foreign taxes withheld | | (1,542,244) |
| Total income | | 13,758,794 |
| Expenses | | |
| Management fee | | |
| Basic fee | $4,718,749 | |
| Performance adjustment | 769,953 | |
| Transfer agent fees | 1,076,041 | |
| Distribution and service plan fees | 146,145 | |
| Accounting and security lending fees | 257,855 | |
| Custodian fees and expenses | 169,982 | |
| Independent trustees' fees and expenses | 2,159 | |
| Registration fees | 75,025 | |
| Audit | 42,318 | |
| Legal | 1,089 | |
| Miscellaneous | 3,793 | |
| Total expenses before reductions | 7,263,109 | |
| Expense reductions | (51,181) | 7,211,928 |
| Net investment income (loss) | | 6,546,866 |
| Realized and Unrealized Gain (Loss) | | |
| Net realized gain (loss) on: | | |
| Investment securities: | | |
| Unaffiliated issuers | 9,687,148 | |
| Fidelity Central Funds | (957) | |
| Foreign currency transactions | (65,079) | |
| Total net realized gain (loss) | | 9,621,112 |
Change in net unrealized appreciation (depreciation) on:
Investment securities (net of decrease in deferred foreign taxes of $7,171) | 112,488,557 | |
| Assets and liabilities in foreign currencies | 66,516 | |
| Total change in net unrealized appreciation (depreciation) | | 112,555,073 |
| Net gain (loss) | | 122,176,185 |
| Net increase (decrease) in net assets resulting from operations | | $128,723,051 |
See accompanying notes which are an integral part of the financial statements.
Statement of Changes in Net Assets
| | Six months ended April 30, 2017 (Unaudited) | Year ended October 31, 2016 |
| Increase (Decrease) in Net Assets | | |
| Operations | | |
| Net investment income (loss) | $6,546,866 | $15,277,971 |
| Net realized gain (loss) | 9,621,112 | 12,084,769 |
| Change in net unrealized appreciation (depreciation) | 112,555,073 | 49,975,496 |
| Net increase (decrease) in net assets resulting from operations | 128,723,051 | 77,338,236 |
| Distributions to shareholders from net investment income | (14,393,212) | (10,933,091) |
| Distributions to shareholders from net realized gain | (12,478,859) | (23,540,154) |
| Total distributions | (26,872,071) | (34,473,245) |
| Share transactions - net increase (decrease) | 232,106,959 | 74,066,306 |
| Redemption fees | 93,065 | 222,176 |
| Total increase (decrease) in net assets | 334,051,004 | 117,153,473 |
| Net Assets | | |
| Beginning of period | 991,145,276 | 873,991,803 |
| End of period | $1,325,196,280 | $991,145,276 |
| Other Information | | |
| Undistributed net investment income end of period | $6,128,094 | $13,974,440 |
See accompanying notes which are an integral part of the financial statements.
Financial Highlights — Fidelity International Small Cap Fund Class A
| | Six months ended (Unaudited) April 30, | Years ended October 31, | | | | |
| | 2017 | 2016 | 2015 | 2014 | 2013 | 2012 |
| Selected Per–Share Data | | | | | | |
| Net asset value, beginning of period | $23.81 | $22.69 | $24.98 | $26.34 | $19.74 | $18.97 |
| Income from Investment Operations | | | | | | |
| Net investment income (loss)A | .11 | .34 | .27 | .17 | .06 | .06 |
| Net realized and unrealized gain (loss) | 2.49 | 1.64 | 1.05 | (.89) | 6.94 | 1.09 |
| Total from investment operations | 2.60 | 1.98 | 1.32 | (.72) | 7.00 | 1.15 |
| Distributions from net investment income | (.28) | (.25) | (.16) | (.05) | (.07) | (.11) |
| Distributions from net realized gain | (.29) | (.62) | (3.45) | (.60) | (.33) | (.27) |
| Total distributions | (.57) | (.87) | (3.61) | (.65) | (.40) | (.38) |
| Redemption fees added to paid in capitalA | –B | .01 | –B | .01 | –B | –B |
| Net asset value, end of period | $25.84 | $23.81 | $22.69 | $24.98 | $26.34 | $19.74 |
| Total ReturnC,D,E | 11.20% | 9.11% | 6.21% | (2.79)% | 36.18% | 6.28% |
| Ratios to Average Net AssetsF,G | | | | | | |
| Expenses before reductions | 1.59%H | 1.61% | 1.59% | 1.50% | 1.61% | 1.63% |
| Expenses net of fee waivers, if any | 1.59%H | 1.61% | 1.58% | 1.50% | 1.61% | 1.63% |
| Expenses net of all reductions | 1.58%H | 1.61% | 1.58% | 1.50% | 1.60% | 1.60% |
| Net investment income (loss) | .89%H | 1.50% | 1.18% | .65% | .25% | .32% |
| Supplemental Data | | | | | | |
| Net assets, end of period (000 omitted) | $40,308 | $36,480 | $28,238 | $24,572 | $24,020 | $14,125 |
| Portfolio turnover rateI | 16%H | 29% | 36% | 102% | 54% | 68% |
A Calculated based on average shares outstanding during the period.
B Amount represents less than $.005 per share.
C Total returns for periods of less than one year are not annualized.
D Total returns would have been lower if certain expenses had not been reduced during the applicable periods shown.
E Total returns do not include the effect of the sales charges.
F Fees and expenses of any underlying Fidelity Central Funds are not included in the Fund's expense ratio. The Fund indirectly bears its proportionate share of the expenses of any underlying Fidelity Central Funds.
G Expense ratios reflect operating expenses of the class. Expenses before reductions do not reflect amounts reimbursed by the investment adviser or reductions from brokerage service arrangements or reductions from other expense offset arrangements and do not represent the amount paid by the class during periods when reimbursements or reductions occur. Expenses net of fee waivers reflect expenses after reimbursement by the investment adviser but prior to reductions from brokerage service arrangements or other expense offset arrangements. Expenses net of all reductions represent the net expenses paid by the class.
H Annualized
I Amount does not include the portfolio activity of any underlying Fidelity Central Funds.
See accompanying notes which are an integral part of the financial statements.
Financial Highlights — Fidelity International Small Cap Fund Class M
| | Six months ended (Unaudited) April 30, | Years ended October 31, | | | | |
| | 2017 | 2016 | 2015 | 2014 | 2013 | 2012 |
| Selected Per–Share Data | | | | | | |
| Net asset value, beginning of period | $23.65 | $22.55 | $24.81 | $26.17 | $19.59 | $18.80 |
| Income from Investment Operations | | | | | | |
| Net investment income (loss)A | .07 | .27 | .21 | .10 | –B | .01 |
| Net realized and unrealized gain (loss) | 2.48 | 1.63 | 1.04 | (.87) | 6.90 | 1.08 |
| Total from investment operations | 2.55 | 1.90 | 1.25 | (.77) | 6.90 | 1.09 |
| Distributions from net investment income | (.19) | (.19) | (.06) | – | – | (.03) |
| Distributions from net realized gain | (.29) | (.62) | (3.45) | (.60) | (.32) | (.27) |
| Total distributions | (.48) | (.81) | (3.51) | (.60) | (.32) | (.30) |
| Redemption fees added to paid in capitalA | –B | .01 | –B | .01 | –B | –B |
| Net asset value, end of period | $25.72 | $23.65 | $22.55 | $24.81 | $26.17 | $19.59 |
| Total ReturnC,D,E | 11.01% | 8.79% | 5.90% | (3.00)% | 35.80% | 5.97% |
| Ratios to Average Net AssetsF,G | | | | | | |
| Expenses before reductions | 1.87%H | 1.90% | 1.87% | 1.77% | 1.87% | 1.88% |
| Expenses net of fee waivers, if any | 1.87%H | 1.90% | 1.86% | 1.77% | 1.87% | 1.88% |
| Expenses net of all reductions | 1.86%H | 1.90% | 1.86% | 1.76% | 1.85% | 1.85% |
| Net investment income (loss) | .61%H | 1.21% | .90% | .38% | (.01)% | .07% |
| Supplemental Data | | | | | | |
| Net assets, end of period (000 omitted) | $15,096 | $13,331 | $12,400 | $12,296 | $13,530 | $9,262 |
| Portfolio turnover rateI | 16%H | 29% | 36% | 102% | 54% | 68% |
A Calculated based on average shares outstanding during the period.
B Amount represents less than $.005 per share.
C Total returns for periods of less than one year are not annualized.
D Total returns would have been lower if certain expenses had not been reduced during the applicable periods shown.
E Total returns do not include the effect of the sales charges.
F Fees and expenses of any underlying Fidelity Central Funds are not included in the Fund's expense ratio. The Fund indirectly bears its proportionate share of the expenses of any underlying Fidelity Central Funds.
G Expense ratios reflect operating expenses of the class. Expenses before reductions do not reflect amounts reimbursed by the investment adviser or reductions from brokerage service arrangements or reductions from other expense offset arrangements and do not represent the amount paid by the class during periods when reimbursements or reductions occur. Expenses net of fee waivers reflect expenses after reimbursement by the investment adviser but prior to reductions from brokerage service arrangements or other expense offset arrangements. Expenses net of all reductions represent the net expenses paid by the class.
H Annualized
I Amount does not include the portfolio activity of any underlying Fidelity Central Funds.
See accompanying notes which are an integral part of the financial statements.
Financial Highlights — Fidelity International Small Cap Fund Class C
| | Six months ended (Unaudited) April 30, | Years ended October 31, | | | | |
| | 2017 | 2016 | 2015 | 2014 | 2013 | 2012 |
| Selected Per–Share Data | | | | | | |
| Net asset value, beginning of period | $22.97 | $21.96 | $24.27 | $25.68 | $19.18 | $18.38 |
| Income from Investment Operations | | | | | | |
| Net investment income (loss)A | .01 | .16 | .09 | (.02) | (.11) | (.08) |
| Net realized and unrealized gain (loss) | 2.41 | 1.59 | 1.02 | (.85) | 6.79 | 1.07 |
| Total from investment operations | 2.42 | 1.75 | 1.11 | (.87) | 6.68 | .99 |
| Distributions from net investment income | (.08) | (.13) | – | – | – | – |
| Distributions from net realized gain | (.29) | (.62) | (3.42) | (.55) | (.18) | (.19) |
| Total distributions | (.37) | (.75) | (3.42) | (.55) | (.18) | (.19) |
| Redemption fees added to paid in capitalA | –B | .01 | –B | .01 | –B | –B |
| Net asset value, end of period | $25.02 | $22.97 | $21.96 | $24.27 | $25.68 | $19.18 |
| Total ReturnC,D,E | 10.73% | 8.26% | 5.37% | (3.43)% | 35.15% | 5.46% |
| Ratios to Average Net AssetsF,G | | | | | | |
| Expenses before reductions | 2.38%H | 2.40% | 2.36% | 2.23% | 2.33% | 2.38% |
| Expenses net of fee waivers, if any | 2.38%H | 2.40% | 2.35% | 2.22% | 2.33% | 2.38% |
| Expenses net of all reductions | 2.37%H | 2.39% | 2.35% | 2.22% | 2.32% | 2.35% |
| Net investment income (loss) | .10%H | .71% | .41% | (.07)% | (.47)% | (.43)% |
| Supplemental Data | | | | | | |
| Net assets, end of period (000 omitted) | $15,352 | $12,187 | $11,359 | $12,576 | $13,426 | $6,799 |
| Portfolio turnover rateI | 16%H | 29% | 36% | 102% | 54% | 68% |
A Calculated based on average shares outstanding during the period.
B Amount represents less than $.005 per share.
C Total returns for periods of less than one year are not annualized.
D Total returns would have been lower if certain expenses had not been reduced during the applicable periods shown.
E Total returns do not include the effect of the contingent deferred sales charge.
F Fees and expenses of any underlying Fidelity Central Funds are not included in the Fund's expense ratio. The Fund indirectly bears its proportionate share of the expenses of any underlying Fidelity Central Funds.
G Expense ratios reflect operating expenses of the class. Expenses before reductions do not reflect amounts reimbursed by the investment adviser or reductions from brokerage service arrangements or reductions from other expense offset arrangements and do not represent the amount paid by the class during periods when reimbursements or reductions occur. Expenses net of fee waivers reflect expenses after reimbursement by the investment adviser but prior to reductions from brokerage service arrangements or other expense offset arrangements. Expenses net of all reductions represent the net expenses paid by the class.
H Annualized
I Amount does not include the portfolio activity of any underlying Fidelity Central Funds.
See accompanying notes which are an integral part of the financial statements.
Financial Highlights — Fidelity International Small Cap Fund
| | Six months ended (Unaudited) April 30, | Years ended October 31, | | | | |
| | 2017 | 2016 | 2015 | 2014 | 2013 | 2012 |
| Selected Per–Share Data | | | | | | |
| Net asset value, beginning of period | $24.23 | $23.06 | $25.34 | $26.67 | $19.99 | $19.23 |
| Income from Investment Operations | | | | | | |
| Net investment income (loss)A | .15 | .40 | .34 | .25 | .12 | .11 |
| Net realized and unrealized gain (loss) | 2.52 | 1.67 | 1.07 | (.90) | 7.02 | 1.10 |
| Total from investment operations | 2.67 | 2.07 | 1.41 | (.65) | 7.14 | 1.21 |
| Distributions from net investment income | (.34) | (.29) | (.24) | (.09) | (.14) | (.18) |
| Distributions from net realized gain | (.29) | (.62) | (3.45) | (.60) | (.33) | (.27) |
| Total distributions | (.63) | (.91) | (3.69) | (.69) | (.46)B | (.45) |
| Redemption fees added to paid in capitalA | –C | .01 | –C | .01 | –C | –C |
| Net asset value, end of period | $26.27 | $24.23 | $23.06 | $25.34 | $26.67 | $19.99 |
| Total ReturnD,E | 11.34% | 9.39% | 6.53% | (2.48)% | 36.56% | 6.55% |
| Ratios to Average Net AssetsF,G | | | | | | |
| Expenses before reductions | 1.27%H | 1.34% | 1.31% | 1.21% | 1.33% | 1.35% |
| Expenses net of fee waivers, if any | 1.27%H | 1.34% | 1.31% | 1.20% | 1.32% | 1.35% |
| Expenses net of all reductions | 1.26%H | 1.33% | 1.31% | 1.20% | 1.31% | 1.33% |
| Net investment income (loss) | 1.21%H | 1.77% | 1.45% | .95% | .53% | .59% |
| Supplemental Data | | | | | | |
| Net assets, end of period (000 omitted) | $1,180,178 | $906,420 | $811,534 | $842,031 | $1,029,629 | $692,769 |
| Portfolio turnover rateI | 16%H | 29% | 36% | 102% | 54% | 68% |
A Calculated based on average shares outstanding during the period.
B Total distributions of $.46 per share is comprised of distributions from net investment income of $.136 and distributions from net realized gain of $.327 per share.
C Amount represents less than $.005 per share.
D Total returns for periods of less than one year are not annualized.
E Total returns would have been lower if certain expenses had not been reduced during the applicable periods shown.
F Fees and expenses of any underlying Fidelity Central Funds are not included in the Fund's expense ratio. The Fund indirectly bears its proportionate share of the expenses of any underlying Fidelity Central Funds.
G Expense ratios reflect operating expenses of the class. Expenses before reductions do not reflect amounts reimbursed by the investment adviser or reductions from brokerage service arrangements or reductions from other expense offset arrangements and do not represent the amount paid by the class during periods when reimbursements or reductions occur. Expenses net of fee waivers reflect expenses after reimbursement by the investment adviser but prior to reductions from brokerage service arrangements or other expense offset arrangements. Expenses net of all reductions represent the net expenses paid by the class.
H Annualized
I Amount does not include the portfolio activity of any underlying Fidelity Central Funds.
See accompanying notes which are an integral part of the financial statements.
Financial Highlights — Fidelity International Small Cap Fund Class I
| | Six months ended (Unaudited) April 30, | Years ended October 31, | | | | |
| | 2017 | 2016 | 2015 | 2014 | 2013 | 2012 |
| Selected Per–Share Data | | | | | | |
| Net asset value, beginning of period | $24.42 | $23.24 | $25.34 | $26.67 | $20.00 | $19.24 |
| Income from Investment Operations | | | | | | |
| Net investment income (loss)A | .14 | .41 | .36 | .29 | .16 | .13 |
| Net realized and unrealized gain (loss) | 2.54 | 1.69 | 1.07 | (.90) | 7.00 | 1.10 |
| Total from investment operations | 2.68 | 2.10 | 1.43 | (.61) | 7.16 | 1.23 |
| Distributions from net investment income | (.37) | (.31) | (.08) | (.13) | (.16) | (.20) |
| Distributions from net realized gain | (.29) | (.62) | (3.45) | (.60) | (.33) | (.27) |
| Total distributions | (.66) | (.93) | (3.53) | (.73) | (.49) | (.47) |
| Redemption fees added to paid in capitalA | –B | .01 | –B | .01 | –B | –B |
| Net asset value, end of period | $26.44 | $24.42 | $23.24 | $25.34 | $26.67 | $20.00 |
| Total ReturnC,D | 11.31% | 9.43% | 6.60% | (2.35)% | 36.68% | 6.65% |
| Ratios to Average Net AssetsE,F | | | | | | |
| Expenses before reductions | 1.31%G | 1.31% | 1.24% | 1.08% | 1.20% | 1.25% |
| Expenses net of fee waivers, if any | 1.31%G | 1.31% | 1.23% | 1.08% | 1.20% | 1.25% |
| Expenses net of all reductions | 1.30%G | 1.31% | 1.23% | 1.08% | 1.18% | 1.22% |
| Net investment income (loss) | 1.17%G | 1.80% | 1.53% | 1.07% | .66% | .70% |
| Supplemental Data | | | | | | |
| Net assets, end of period (000 omitted) | $74,261 | $22,727 | $10,070 | $8,092 | $67,038 | $9,503 |
| Portfolio turnover rateH | 16%G | 29% | 36% | 102% | 54% | 68% |
A Calculated based on average shares outstanding during the period.
B Amount represents less than $.005 per share.
C Total returns for periods of less than one year are not annualized.
D Total returns would have been lower if certain expenses had not been reduced during the applicable periods shown.
E Fees and expenses of any underlying Fidelity Central Funds are not included in the Fund's expense ratio. The Fund indirectly bears its proportionate share of the expenses of any underlying Fidelity Central Funds.
F Expense ratios reflect operating expenses of the class. Expenses before reductions do not reflect amounts reimbursed by the investment adviser or reductions from brokerage service arrangements or reductions from other expense offset arrangements and do not represent the amount paid by the class during periods when reimbursements or reductions occur. Expenses net of fee waivers reflect expenses after reimbursement by the investment adviser but prior to reductions from brokerage service arrangements or other expense offset arrangements. Expenses net of all reductions represent the net expenses paid by the class.
G Annualized
H Amount does not include the portfolio activity of any underlying Fidelity Central Funds.
See accompanying notes which are an integral part of the financial statements.
Notes to Financial Statements (Unaudited)
For the period ended April 30, 2017
1. Organization.
Fidelity International Small Cap Fund (the Fund) is a fund of Fidelity Investment Trust (the Trust) and is authorized to issue an unlimited number of shares. The Trust is registered under the Investment Company Act of 1940, as amended (the 1940 Act), as an open-end management investment company organized as a Massachusetts business trust. The Fund offers Class A, Class M (formerly Class T), Class C, International Small Cap and Class I shares, each of which has equal rights as to assets and voting privileges. Each class has exclusive voting rights with respect to matters that affect that class. The Fund's investments in emerging markets can be subject to social, economic, regulatory, and political uncertainties and can be extremely volatile.
After the close of business on June 24, 2016, all outstanding Class B shares were converted to Class A shares. All prior fiscal period dollar and share amounts for Class B presented in the Notes to Financial Statements are for the period November 1, 2015 through June 24, 2016.
2. Investments in Fidelity Central Funds.
The Fund invests in Fidelity Central Funds, which are open-end investment companies generally available only to other investment companies and accounts managed by the investment adviser and its affiliates. The Fund's Schedule of Investments lists each of the Fidelity Central Funds held as of period end, if any, as an investment of the Fund, but does not include the underlying holdings of each Fidelity Central Fund. As an Investing Fund, the Fund indirectly bears its proportionate share of the expenses of the underlying Fidelity Central Funds.
The Money Market Central Funds seek preservation of capital and current income and are managed by Fidelity Investments Money Management, Inc. (FIMM), an affiliate of the investment adviser. Annualized expenses of the Money Market Central Funds as of their most recent shareholder report date are less than .005%.
A complete unaudited list of holdings for each Fidelity Central Fund is available upon request or at the Securities and Exchange Commission (the SEC) website at www.sec.gov. In addition, the financial statements of the Fidelity Central Funds are available on the SEC website or upon request.
3. Significant Accounting Policies.
The Fund is an investment company and applies the accounting and reporting guidance of the Financial Accounting Standards Board (FASB) Accounting Standards Codification Topic 946 Financial Services – Investments Companies. The financial statements have been prepared in conformity with accounting principles generally accepted in the United States of America (GAAP), which require management to make certain estimates and assumptions at the date of the financial statements. Actual results could differ from those estimates. Subsequent events, if any, through the date that the financial statements were issued have been evaluated in the preparation of the financial statements. The following summarizes the significant accounting policies of the Fund:
Investment Valuation. Investments are valued as of 4:00 p.m. Eastern time on the last calendar day of the period. The Board of Trustees (the Board) has delegated the day to day responsibility for the valuation of the Fund's investments to the Fair Value Committee (the Committee) established by the Fund's investment adviser. In accordance with valuation policies and procedures approved by the Board, the Fund attempts to obtain prices from one or more third party pricing vendors or brokers to value its investments. When current market prices, quotations or currency exchange rates are not readily available or reliable, investments will be fair valued in good faith by the Committee, in accordance with procedures adopted by the Board. Factors used in determining fair value vary by investment type and may include market or investment specific events. The frequency with which these procedures are used cannot be predicted and they may be utilized to a significant extent. The Committee oversees the Fund's valuation policies and procedures and reports to the Board on the Committee's activities and fair value determinations. The Board monitors the appropriateness of the procedures used in valuing the Fund's investments and ratifies the fair value determinations of the Committee.
The Fund categorizes the inputs to valuation techniques used to value its investments into a disclosure hierarchy consisting of three levels as shown below:
- Level 1 – quoted prices in active markets for identical investments
- Level 2 – other significant observable inputs (including quoted prices for similar investments, interest rates, prepayment speeds, etc.)
- Level 3 – unobservable inputs (including the Fund's own assumptions based on the best information available)
Valuation techniques used to value the Fund's investments by major category are as follows:
Equity securities, including restricted securities, for which market quotations are readily available, are valued at the last reported sale price or official closing price as reported by a third party pricing vendor on the primary market or exchange on which they are traded and are categorized as Level 1 in the hierarchy. In the event there were no sales during the day or closing prices are not available, securities are valued at the last quoted bid price or may be valued using the last available price and are generally categorized as Level 2 in the hierarchy. For foreign equity securities, when market or security specific events arise, comparisons to the valuation of American Depositary Receipts (ADRs), futures contracts, Exchange-Traded Funds (ETFs) and certain indexes as well as quoted prices for similar securities may be used and would be categorized as Level 2 in the hierarchy. Utilizing these techniques may result in transfers between Level 1 and Level 2. For equity securities, including restricted securities, where observable inputs are limited, assumptions about market activity and risk are used and these securities may be categorized as Level 3 in the hierarchy.
Investments in open-end mutual funds, including the Fidelity Central Funds, are valued at their closing net asset value (NAV) each business day and are categorized as Level 1 in the hierarchy.
Changes in valuation techniques may result in transfers in or out of an assigned level within the disclosure hierarchy. The aggregate value of investments by input level as of April 30, 2017 is included at the end of the Fund's Schedule of Investments.
Foreign Currency. The Fund may use foreign currency contracts to facilitate transactions in foreign-denominated securities. Gains and losses from these transactions may arise from changes in the value of the foreign currency or if the counterparties do not perform under the contracts' terms.
Foreign-denominated assets, including investment securities, and liabilities are translated into U.S. dollars at the exchange rates at period end. Purchases and sales of investment securities, income and dividends received and expenses denominated in foreign currencies are translated into U.S. dollars at the exchange rate in effect on the transaction date.
The effects of exchange rate fluctuations on investments are included with the net realized and unrealized gain (loss) on investment securities. Other foreign currency transactions resulting in realized and unrealized gain (loss) are disclosed separately.
Investment Transactions and Income. For financial reporting purposes, the Fund's investment holdings and NAV include trades executed through the end of the last business day of the period. The NAV per share for processing shareholder transactions is calculated as of the close of business of the New York Stock Exchange (NYSE), normally 4:00 p.m. Eastern time and includes trades executed through the end of the prior business day. Gains and losses on securities sold are determined on the basis of identified cost and may include proceeds received from litigation. Dividend income is recorded on the ex-dividend date, except for certain dividends from foreign securities where the ex-dividend date may have passed, which are recorded as soon as the Fund is informed of the ex-dividend date. Non-cash dividends included in dividend income, if any, are recorded at the fair market value of the securities received. Income and capital gain distributions from Fidelity Central Funds, if any, are recorded on the ex-dividend date. Certain distributions received by the Fund represent a return of capital or capital gain. The Fund determines the components of these distributions subsequent to the ex-dividend date, based upon receipt of tax filings or other correspondence relating to the underlying investment. These distributions are recorded as a reduction of cost of investments and/or as a realized gain. Investment income is recorded net of foreign taxes withheld where recovery of such taxes is uncertain.
Class Allocations and Expenses. Investment income, realized and unrealized capital gains and losses, common expenses of the Fund, and certain fund-level expense reductions, if any, are allocated daily on a pro-rata basis to each class based on the relative net assets of each class to the total net assets of the Fund. Each class differs with respect to transfer agent and distribution and service plan fees incurred. Certain expense reductions may also differ by class. For the reporting period, the allocated portion of income and expenses to each class as a percent of its average net assets may vary due to the timing of recording these transactions in relation to fluctuating net assets of the classes. Expenses directly attributable to a fund are charged to that fund. Expenses attributable to more than one fund are allocated among the respective funds on the basis of relative net assets or other appropriate methods. Expense estimates are accrued in the period to which they relate and adjustments are made when actual amounts are known.
Income Tax Information and Distributions to Shareholders. Each year, the Fund intends to qualify as a regulated investment company under Subchapter M of the Internal Revenue Code, including distributing substantially all of its taxable income and realized gains. As a result, no provision for U.S. Federal income taxes is required. The Fund files a U.S. federal tax return, in addition to state and local tax returns as required. The Fund's federal income tax returns are subject to examination by the Internal Revenue Service (IRS) for a period of three fiscal years after they are filed. State and local tax returns may be subject to examination for an additional fiscal year depending on the jurisdiction. Foreign taxes are provided for based on the Fund's understanding of the tax rules and rates that exist in the foreign markets in which it invests. The Fund is subject to a tax imposed on capital gains by certain countries in which it invests. An estimated deferred tax liability for net unrealized appreciation on the applicable securities is included in Other payables and accrued expenses on the Statement of Assets & Liabilities.
Distributions are declared and recorded on the ex-dividend date. Income dividends and capital gain distributions are declared separately for each class. Income and capital gain distributions are determined in accordance with income tax regulations, which may differ from GAAP.
Capital accounts within the financial statements are adjusted for permanent book-tax differences. These adjustments have no impact on net assets or the results of operations. Capital accounts are not adjusted for temporary book-tax differences which will reverse in a subsequent period.
Book-tax differences are primarily due to foreign currency transactions, certain foreign taxes, passive foreign investment companies (PFIC) and losses deferred due to wash sales.
The federal tax cost of investment securities and unrealized appreciation (depreciation) as of period end were as follows:
| Gross unrealized appreciation | $238,432,680 |
| Gross unrealized depreciation | (77,233,134) |
| Net unrealized appreciation (depreciation) on securities | $161,199,546 |
| Tax cost | $1,180,005,845 |
Short-Term Trading (Redemption) Fees. Shares held by investors in the Fund less than 90 days may have been subject to a redemption fee equal to 2.00% of the NAV of shares redeemed. All redemption fees, which reduce the proceeds of the shareholder redemption, are retained by the Fund and accounted for as an addition to paid in capital.
Restricted Securities. The Fund may invest in securities that are subject to legal or contractual restrictions on resale. These securities generally may be resold in transactions exempt from registration or to the public if the securities are registered. Disposal of these securities may involve time-consuming negotiations and expense, and prompt sale at an acceptable price may be difficult. Information regarding restricted securities is included at the end of the Fund's Schedule of Investments.
4. Purchases and Sales of Investments.
Purchases and sales of securities, other than short-term securities, aggregated $278,457,187 and $82,932,855, respectively.
5. Fees and Other Transactions with Affiliates.
Management Fee. Fidelity Management & Research Company (the investment adviser) and its affiliates provide the Fund with investment management related services for which the Fund pays a monthly management fee. The management fee is the sum of an individual fund fee rate that is based on an annual rate of .60% of the Fund's average net assets and an annualized group fee rate that averaged .25% during the period. The group fee rate is based upon the average net assets of all the mutual funds advised by the investment adviser, including any mutual funds previously advised by the investment adviser that are currently advised by Fidelity SelectCo, LLC, an affiliate of the investment adviser. The group fee rate decreases as assets under management increase and increases as assets under management decrease. In addition, the management fee is subject to a performance adjustment (up to a maximum of +/- .20% of the Fund's average net assets over a 36 month performance period). The upward or downward adjustment to the management fee is based on the relative investment performance of International Small Cap as compared to its benchmark index, the MSCI ACWI (All Country World Index) ex USA Small Cap Index effective April 1, 2014 (the MSCI EAFE Small Cap Index prior to April 1, 2014), over the same 36 month performance period. For the reporting period, the total annualized management fee rate, including the performance adjustment, was .99% of the Fund's average net assets. The performance adjustment included in the management fee rate may be higher or lower than the maximum performance adjustment rate due to the difference between the average net assets for the reporting and performance periods.
Distribution and Service Plan Fees. In accordance with Rule 12b-1 of the 1940 Act, the Fund has adopted separate Distribution and Service Plans for each class of shares. Certain classes pay Fidelity Distributors Corporation (FDC), an affiliate of the investment adviser, separate Distribution and Service Fees, each of which is based on an annual percentage of each class' average net assets. In addition, FDC may pay financial intermediaries for selling shares of the Fund and providing shareholder support services. For the period, the Distribution and Service Fee rates, total fees and amounts retained by FDC were as follows:
| | Distribution
Fee | Service
Fee | Total Fees | Retained
by FDC |
| Class A | -% | .25% | $48,310 | $– |
| Class M | .25% | .25% | 34,852 | – |
| Class C | .75% | .25% | 62,983 | 11,728 |
| | | | $146,145 | $11,728 |
Sales Load. FDC may receive a front-end sales charge of up to 5.75% for selling Class A shares and 3.50% for selling Class M shares, some of which is paid to financial intermediaries for selling shares of the Fund. Depending on the holding period, FDC may receive contingent deferred sales charges levied on Class A, Class M and Class C redemptions. The deferred sales charges range from 1.00% for Class C shares, 1.00% for certain purchases of Class A shares and .25% for certain purchases of Class M shares.
For the period, sales charge amounts retained by FDC were as follows:
| | Retained
by FDC |
| Class A | $16,871 |
| Class M | 1,880 |
| Class C(a) | 1,020 |
| | $19,771 |
(a) When Class C shares are initially sold, FDC pays commissions from its own resources to financial intermediaries through which the sales are made.
Transfer Agent Fees. Fidelity Investments Institutional Operations Company, Inc., (FIIOC), an affiliate of the investment adviser, is the transfer, dividend disbursing and shareholder servicing agent for each class of the Fund. FIIOC receives account fees and asset-based fees that vary according to the account size and type of account of the shareholders of the respective classes of the Fund. IIOC pays for typesetting, printing and mailing of shareholder reports, except proxy statements.
For the period, transfer agent fees for each class were as follows:
| | Amount | % of
Class-Level Average
Net Assets(a) |
| Class A | $48,648 | .25 |
| Class M | 19,975 | .29 |
| Class C | 18,483 | .29 |
| International Small Cap | 939,656 | .19 |
| Class I | 49,279 | .23 |
| | $1,076,041 | |
(a) Annualized
Accounting and Security Lending Fees. Fidelity Service Company, Inc. (FSC), an affiliate of the investment adviser, maintains the Fund's accounting records. The accounting fee is based on the level of average net assets for each month. Under a separate contract, FSC administers the security lending program. The security lending fee is based on the number and duration of lending transactions.
Brokerage Commissions. The Fund placed a portion of its portfolio transactions with brokerage firms which are affiliates of the investment adviser. Brokerage commissions are included in net realized gain (loss) and change in net unrealized appreciation (depreciation) in the Statement of Operations. The commissions paid to these affiliated firms were $2,789 for the period.
Interfund Trades. The Fund may purchase from or sell securities to other Fidelity Funds under procedures adopted by the Board. The procedures have been designed to ensure these interfund trades are executed in accordance with Rule 17a-7 of the 1940 Act. Interfund trades are included within the respective purchases and sales amounts shown in the Purchases and Sales of Investments note.
6. Committed Line of Credit.
The Fund participates with other funds managed by the investment adviser or an affiliate in a $4.25 billion credit facility (the "line of credit") to be utilized for temporary or emergency purposes to fund shareholder redemptions or for other short-term liquidity purposes. The Fund has agreed to pay commitment fees on its pro-rata portion of the line of credit, which amounted to $1,807 and is reflected in Miscellaneous expenses on the Statement of Operations. During the period, the Fund did not borrow on this line of credit.
7. Security Lending.
The Fund lends portfolio securities through a lending agent from time to time in order to earn additional income. For equity securities, a lending agent is used and may loan securities to certain qualified borrowers, including Fidelity Capital Markets (FCM), a broker-dealer affiliated with the Fund. On the settlement date of the loan, the Fund receives collateral (in the form of U.S. Treasury obligations, letters of credit and/or cash) against the loaned securities and maintains collateral in an amount not less than 100% of the market value of the loaned securities during the period of the loan. The market value of the loaned securities is determined at the close of business of the Fund and any additional required collateral is delivered to the Fund on the next business day. The Fund or borrower may terminate the loan at any time, and if the borrower defaults on its obligation to return the securities loaned because of insolvency or other reasons, the Fund may apply collateral received from the borrower against the obligation. The Fund may experience delays and costs in recovering the securities loaned. Any cash collateral received is invested in the Fidelity Securities Lending Cash Central Fund. The value of loaned securities and cash collateral at period end are disclosed on the Fund's Statement of Assets and Liabilities. The value of securities loaned to FCM at period end was $903,189. Security lending income represents the income earned on investing cash collateral, less rebates paid to borrowers and any lending agent fees associated with the loan, plus any premium payments received for lending certain types of securities. Security lending income is presented in the Statement of Operations as a component of income from Fidelity Central Funds. Total security lending income during the period amounted to $112,622, including $11,707 from securities loaned to FCM.
8. Expense Reductions.
Commissions paid to certain brokers with whom the investment adviser, or its affiliates, places trades on behalf of the Fund include an amount in addition to trade execution, which may be rebated back to the Fund to offset certain expenses. This amount totaled $46,521 for the period. In addition, through arrangements with the Fund's custodian, credits realized as a result of certain uninvested cash balances were used to reduce the Fund's expenses. During the period, these credits reduced the Fund's expenses by $37.
In addition, during the period the investment adviser reimbursed and/or waived a portion of fund-level operating expenses in the amount of $4,623.
9. Distributions to Shareholders.
Distributions to shareholders of each class were as follows:
| | Six months ended April 30, 2017 | Year ended October 31, 2016 |
| From net investment income | | |
| Class A | $440,395 | $319,347 |
| Class M | 105,144 | 106,306 |
| Class B | – | 996 |
| Class C | 42,573 | 64,383 |
| International Small Cap | 13,342,577 | 10,307,620 |
| Class I | 462,523 | 134,439 |
| Total | $14,393,212 | $10,933,091 |
| From net realized gain | | |
| Class A | $461,138 | $788,825 |
| Class M | 163,369 | 339,739 |
| Class B | – | 10,287 |
| Class C | 151,895 | 319,340 |
| International Small Cap | 11,341,189 | 21,811,338 |
| Class I | 361,268 | 270,625 |
| Total | $12,478,859 | $23,540,154 |
10. Share Transactions.
Share transactions for each class were as follows and may contain automatic conversions between classes or exchanges between affiliated funds:
| | Shares | Shares | Dollars | Dollars |
| | Six months ended April 30, 2017 | Year ended October 31, 2016 | Six months ended April 30, 2017 | Year ended October 31, 2016 |
| Class A | | | | |
| Shares sold | 493,177 | 622,254 | $11,804,074 | $13,846,907 |
| Reinvestment of distributions | 38,390 | 49,226 | 881,445 | 1,077,561 |
| Shares redeemed | (503,251) | (383,922) | (12,141,598) | (8,560,022) |
| Net increase (decrease) | 28,316 | 287,558 | $543,921 | $6,364,446 |
| Class M | | | | |
| Shares sold | 70,799 | 133,036 | $1,669,865 | $2,846,482 |
| Reinvestment of distributions | 11,602 | 20,220 | 265,460 | 440,798 |
| Shares redeemed | (59,070) | (139,487) | (1,417,904) | (3,059,683) |
| Net increase (decrease) | 23,331 | 13,769 | $517,421 | $227,597 |
| Class B | | | | |
| Shares sold | – | 2,210 | $– | $44,410 |
| Reinvestment of distributions | – | 493 | – | 10,648 |
| Shares redeemed | – | (20,270) | – | (435,806) |
| Net increase (decrease) | – | (17,567) | $– | $(380,748) |
| Class C | | | | |
| Shares sold | 168,930 | 222,957 | $3,988,717 | $4,942,382 |
| Reinvestment of distributions | 8,175 | 16,869 | 182,379 | 358,801 |
| Shares redeemed | (93,994) | (226,514) | (2,152,912) | (4,770,771) |
| Net increase (decrease) | 83,111 | 13,312 | $2,018,184 | $530,412 |
| International Small Cap | | | | |
| Shares sold | 9,867,347 | 11,991,539 | $240,657,082 | $277,123,750 |
| Reinvestment of distributions | 1,029,746 | 1,408,054 | 24,013,687 | 31,286,953 |
| Shares redeemed | (3,376,773) | (11,188,601) | (82,018,784) | (253,612,350) |
| Net increase (decrease) | 7,520,320 | 2,210,992 | $182,651,985 | $54,798,353 |
| Class I | | | | |
| Shares sold | 2,063,330 | 924,076 | $50,964,089 | $21,994,159 |
| Reinvestment of distributions | 29,052 | 16,670 | 682,131 | 373,252 |
| Shares redeemed | (214,660) | (443,477) | (5,270,772) | (9,841,165) |
| Net increase (decrease) | 1,877,722 | 497,269 | $46,375,448 | $12,526,246 |
11. Other.
The Fund's organizational documents provide former and current trustees and officers with a limited indemnification against liabilities arising in connection with the performance of their duties to the Fund. In the normal course of business, the Fund may also enter into contracts that provide general indemnifications. The Fund's maximum exposure under these arrangements is unknown as this would be dependent on future claims that may be made against the Fund. The risk of material loss from such claims is considered remote.
Shareholder Expense Example
As a shareholder of the Fund, you incur two types of costs: (1) transaction costs, including sales charges (loads) on purchase payments or redemption proceeds, redemption fees and (2) ongoing costs, including management fees, distribution and/or service (12b-1) fees and other Fund expenses. This Example is intended to help you understand your ongoing costs (in dollars) of investing in the Fund and to compare these costs with the ongoing costs of investing in other mutual funds.
The Example is based on an investment of $1,000 invested at the beginning of the period and held for the entire period (November 1, 2016 to April 30, 2017).
Actual Expenses
The first line of the accompanying table for each class of the Fund provides information about actual account values and actual expenses. You may use the information in this line, together with the amount you invested, to estimate the expenses that you paid over the period. Simply divide your account value by $1,000.00 (for example, an $8,600 account value divided by $1,000.00 = 8.6), then multiply the result by the number in the first line for a class of the Fund under the heading entitled "Expenses Paid During Period" to estimate the expenses you paid on your account during this period. A small balance maintenance fee of $12.00 that is charged once a year may apply for certain accounts with a value of less than $2,000. This fee is not included in the table below. If it was, the estimate of expenses you paid during the period would be higher, and your ending account value lower, by this amount. In addition, the Fund, as a shareholder in the underlying Fidelity Central Funds, will indirectly bear its pro-rata share of the fees and expenses incurred by the underlying Fidelity Central Funds. These fees and expenses are not included in the Fund's annualized expense ratio used to calculate the expense estimate in the table below.
Hypothetical Example for Comparison Purposes
The second line of the accompanying table for each class of the Fund provides information about hypothetical account values and hypothetical expenses based on a Class' actual expense ratio and an assumed rate of return of 5% per year before expenses, which is not the Class' actual return. The hypothetical account values and expenses may not be used to estimate the actual ending account balance or expenses you paid for the period. You may use this information to compare the ongoing costs of investing in the Fund and other funds. To do so, compare this 5% hypothetical example with the 5% hypothetical examples that appear in the shareholder reports of the other funds. A small balance maintenance fee of $12.00 that is charged once a year may apply for certain accounts with a value of less than $2,000. This fee is not included in the table below. If it was, the estimate of expenses you paid during the period would be higher, and your ending account value lower, by this amount. In addition, the Fund, as a shareholder in the underlying Fidelity Central Funds, will indirectly bear its pro-rata share of the fees and expenses incurred by the underlying Fidelity Central Funds. These fees and expenses are not included in the Fund's annualized expense ratio used to calculate the expense estimate in the table below.
Please note that the expenses shown in the table are meant to highlight your ongoing costs only and do not reflect any transaction costs. Therefore, the second line of the table is useful in comparing ongoing costs only, and will not help you determine the relative total costs of owning different funds. In addition, if these transactional costs were included, your costs would have been higher.
| | Annualized Expense Ratio-A | Beginning
Account Value
November 1, 2016 | Ending
Account Value
April 30, 2017 | Expenses Paid
During Period-B
November 1, 2016
to April 30, 2017 |
| Class A | 1.59% | | | |
| Actual | | $1,000.00 | $1,112.00 | $8.33 |
| Hypothetical-C | | $1,000.00 | $1,016.91 | $7.95 |
| Class M | 1.87% | | | |
| Actual | | $1,000.00 | $1,110.10 | $9.78 |
| Hypothetical-C | | $1,000.00 | $1,015.52 | $9.35 |
| Class C | 2.38% | | | |
| Actual | | $1,000.00 | $1,107.30 | $12.44 |
| Hypothetical-C | | $1,000.00 | $1,012.99 | $11.88 |
| International Small Cap | 1.27% | | | |
| Actual | | $1,000.00 | $1,113.40 | $6.65 |
| Hypothetical-C | | $1,000.00 | $1,018.50 | $6.36 |
| Class I | 1.31% | | | |
| Actual | | $1,000.00 | $1,113.10 | $6.86 |
| Hypothetical-C | | $1,000.00 | $1,018.30 | $6.56 |
A Annualized expense ratio reflects expenses net of applicable fee waivers.
B Expenses are equal to each Class' annualized expense ratio, multiplied by the average account value over the period, multiplied by 181/365 (to reflect the one-half year period).
C 5% return per year before expenses
Corporate Headquarters
245 Summer St.
Boston, MA 02210
www.fidelity.com
ISC-SANN-0617
1.800662.113
Fidelity Advisor® Total Emerging Markets Fund -
Class A, Class M (formerly Class T), Class C and Class I
Semi-Annual Report April 30, 2017 Class A, Class M, Class C and Class I are classes of Fidelity® Total Emerging Markets Fund |
|
Contents
To view a fund's proxy voting guidelines and proxy voting record for the 12-month period ended June 30, visit http://www.fidelity.com/proxyvotingresults or visit the Securities and Exchange Commission's (SEC) web site at http://www.sec.gov.
You may also call 1-877-208-0098 to request a free copy of the proxy voting guidelines.
Standard & Poor's, S&P and S&P 500 are registered service marks of The McGraw-Hill Companies, Inc. and have been licensed for use by Fidelity Distributors Corporation.
Other third-party marks appearing herein are the property of their respective owners.
All other marks appearing herein are registered or unregistered trademarks or service marks of FMR LLC or an affiliated company. © 2017 FMR LLC. All rights reserved.
This report and the financial statements contained herein are submitted for the general information of the shareholders of the Fund. This report is not authorized for distribution to prospective investors in the Fund unless preceded or accompanied by an effective prospectus.
A fund files its complete schedule of portfolio holdings with the SEC for the first and third quarters of each fiscal year on Form N-Q. Forms N-Q are available on the SEC’s web site at http://www.sec.gov. A fund's Forms N-Q may be reviewed and copied at the SEC’s Public Reference Room in Washington, DC. Information regarding the operation of the SEC's Public Reference Room may be obtained by calling 1-800-SEC-0330.
For a complete list of a fund's portfolio holdings, view the most recent holdings listing, semiannual report, or annual report on Fidelity's web site at http://www.fidelity.com, http://www.institutional.fidelity.com, or http://www.401k.com, as applicable.
NOT FDIC INSURED •MAY LOSE VALUE •NO BANK GUARANTEE
Neither the Fund nor Fidelity Distributors Corporation is a bank.
Investment Summary (Unaudited)
Top Five Stocks as of April 30, 2017
| | % of fund's net assets | % of fund's net assets 6 months ago |
| Tencent Holdings Ltd. (Cayman Islands, Internet Software & Services) | 2.7 | 2.3 |
| Naspers Ltd. Class N (South Africa, Media) | 2.6 | 2.4 |
| Taiwan Semiconductor Manufacturing Co. Ltd. (Taiwan, Semiconductors & Semiconductor Equipment) | 2.1 | 2.8 |
| JD.com, Inc. sponsored ADR (Cayman Islands, Internet & Direct Marketing Retail) | 2.0 | 0.6 |
| Alibaba Group Holding Ltd. sponsored ADR (Cayman Islands, Internet Software & Services) | 1.5 | 1.4 |
| | 10.9 | |
Top Five Market Sectors as of April 30, 2017
| | % of fund's net assets | % of fund's net assets 6 months ago |
| Financials | 16.3 | 16.4 |
| Information Technology | 14.6 | 14.7 |
| Consumer Discretionary | 9.6 | 8.1 |
| Energy | 9.3 | 12.4 |
| Materials | 5.3 | 4.2 |
Top Five Countries as of April 30, 2017
| (excluding cash equivalents) | % of fund's net assets | % of fund's net assets 6 months ago |
| Cayman Islands | 10.3 | 7.1 |
| Korea (South) | 8.0 | 8.0 |
| Brazil | 6.4 | 6.7 |
| United States of America | 6.0 | 4.6 |
| Taiwan | 5.5 | 5.3 |
Percentages are adjusted for the effect of futures contracts, if applicable.
Asset Allocation (% of fund's net assets)
| As of April 30, 2017 |
| | Stocks and Equity Futures | 68.6% |
| | Bonds | 27.4% |
| | Short-Term Investments and Net Other Assets (Liabilities) | 4.0% |

| As of October 31, 2016 |
| | Stocks and Equity Futures | 68.3% |
| | Bonds | 26.6% |
| | Other Investments | 0.1% |
| | Short-Term Investments and Net Other Assets (Liabilities) | 5.0% |

Investments April 30, 2017 (Unaudited)
Showing Percentage of Net Assets
| Common Stocks - 60.1% | | | |
| | | Shares | Value |
| Argentina - 0.3% | | | |
| Grupo Superveille SA sponsored ADR | | 7,700 | $130,823 |
| Telecom Argentina SA Class B sponsored ADR | | 15,034 | 340,670 |
| YPF SA Class D sponsored ADR | | 25,600 | 661,248 |
|
| TOTAL ARGENTINA | | | 1,132,741 |
|
| Australia - 0.0% | | | |
| Frontier Digital Ventures Ltd. | | 250,635 | 93,838 |
| Austria - 0.4% | | | |
| Erste Group Bank AG | | 38,975 | 1,393,388 |
| Bermuda - 0.9% | | | |
| AGTech Holdings Ltd. (a) | | 1,148,000 | 221,384 |
| Credicorp Ltd. (United States) | | 6,560 | 1,008,010 |
| GP Investments Ltd. Class A (depositary receipt) (a) | | 22,922 | 48,530 |
| PAX Global Technology Ltd. | | 574,460 | 355,975 |
| Shangri-La Asia Ltd. | | 1,022,000 | 1,463,688 |
| VimpelCom Ltd. sponsored ADR | | 72,860 | 300,912 |
|
| TOTAL BERMUDA | | | 3,398,499 |
|
| Brazil - 2.3% | | | |
| B2W Companhia Global do Varejo (a) | | 249,740 | 1,052,763 |
| B2W Companhia Global do Varejo rights (a) | | 60,623 | 250,777 |
| BB Seguridade Participacoes SA | | 83,070 | 782,269 |
| BR Malls Participacoes SA | | 172,020 | 761,450 |
| Cielo SA | | 62,073 | 471,309 |
| Companhia de Saneamento de Minas Gerais | | 56,036 | 635,559 |
| Cosan SA Industria e Comercio | | 47,455 | 554,829 |
| Direcional Engenharia SA | | 95,000 | 182,574 |
| FPC Par Corretora de Seguros | | 135,700 | 808,031 |
| Localiza Rent A Car SA | | 51,900 | 773,419 |
| Minerva SA | | 164,600 | 523,766 |
| Smiles SA | | 108,700 | 2,364,376 |
|
| TOTAL BRAZIL | | | 9,161,122 |
|
| British Virgin Islands - 0.4% | | | |
| Mail.Ru Group Ltd. GDR (Reg. S) (a) | | 58,416 | 1,539,262 |
| Canada - 0.3% | | | |
| Pacific Exploration and Production Corp. | | 1,001 | 30,066 |
| Pan American Silver Corp. | | 52,800 | 885,456 |
| Torex Gold Resources, Inc. (a) | | 17,830 | 301,989 |
|
| TOTAL CANADA | | | 1,217,511 |
|
| Cayman Islands - 10.1% | | | |
| 51job, Inc. sponsored ADR (a) | | 14,200 | 582,058 |
| 58.com, Inc. ADR (a) | | 52,250 | 2,068,055 |
| Airtac International Group | | 32,000 | 365,285 |
| Alibaba Group Holding Ltd. sponsored ADR (a) | | 49,500 | 5,717,250 |
| ASM Pacific Technology Ltd. | | 32,500 | 483,843 |
| Bitauto Holdings Ltd. ADR (a) | | 27,600 | 809,232 |
| BizLink Holding, Inc. | | 42,294 | 252,591 |
| China State Construction International Holdings Ltd. | | 392,000 | 711,596 |
| CK Hutchison Holdings Ltd. | | 26,510 | 331,104 |
| Ctrip.com International Ltd. ADR (a) | | 41,900 | 2,116,369 |
| Haitian International Holdings Ltd. | | 255,000 | 624,850 |
| JD.com, Inc. sponsored ADR (a) | | 223,000 | 7,820,610 |
| Kingsoft Corp. Ltd. | | 172,000 | 490,901 |
| Momo, Inc. ADR (a) | | 17,200 | 653,256 |
| NetEase, Inc. ADR | | 6,900 | 1,831,191 |
| Sino Biopharmaceutical Ltd. | | 688,000 | 566,084 |
| Sunny Optical Technology Group Co. Ltd. | | 80,000 | 658,237 |
| Tencent Holdings Ltd. | | 335,050 | 10,498,219 |
| Uni-President China Holdings Ltd. | | 1,675,600 | 1,176,185 |
| Vipshop Holdings Ltd. ADR (a) | | 119,100 | 1,651,917 |
|
| TOTAL CAYMAN ISLANDS | | | 39,408,833 |
|
| Chile - 1.0% | | | |
| Compania Cervecerias Unidas SA sponsored ADR | | 41,300 | 1,064,301 |
| CorpBanca SA (a) | | 59,671,766 | 543,873 |
| Enersis SA | | 3,230,006 | 641,399 |
| Inversiones La Construccion SA | | 36,325 | 489,845 |
| Sociedad Quimica y Minera de Chile SA (PN-B) sponsored ADR | | 21,300 | 757,215 |
| Vina Concha y Toro SA | | 335,968 | 541,652 |
|
| TOTAL CHILE | | | 4,038,285 |
|
| China - 4.7% | | | |
| Anhui Conch Cement Co. Ltd. (H Shares) | | 256,000 | 896,848 |
| BBMG Corp. (H Shares) | | 1,506,000 | 807,372 |
| China Life Insurance Co. Ltd. (H Shares) | | 689,834 | 2,098,658 |
| China Longyuan Power Grid Corp. Ltd. (H Shares) | | 694,960 | 535,179 |
| China Oilfield Services Ltd. (H Shares) | | 598,000 | 551,999 |
| China Pacific Insurance (Group) Co. Ltd. (H Shares) | | 481,706 | 1,780,461 |
| China Petroleum & Chemical Corp. (H Shares) | | 908,000 | 737,345 |
| China Telecom Corp. Ltd. (H Shares) | | 1,614,949 | 788,960 |
| Hangzhou Hikvision Digital Technology Co. Ltd. Class A | | 70,950 | 376,390 |
| Industrial & Commercial Bank of China Ltd. (H Shares) | | 5,608,160 | 3,662,660 |
| Inner Mongoli Yili Industries Co. Ltd. (A Shares) | | 143,158 | 379,207 |
| Kweichow Moutai Co. Ltd. (A Shares) | | 14,299 | 857,670 |
| Maanshan Iron & Steel Ltd. (H Shares) (a) | | 1,190,000 | 402,360 |
| PICC Property & Casualty Co. Ltd. (H Shares) | | 544,580 | 876,554 |
| Qingdao Haier Co. Ltd. | | 910,904 | 1,610,781 |
| Shanghai International Airport Co. Ltd. (A Shares) | | 130,014 | 645,968 |
| Tsingtao Brewery Co. Ltd. (H Shares) | | 236,000 | 1,061,922 |
| Zhengzhou Yutong Bus Co. Ltd. | | 187,171 | 546,837 |
|
| TOTAL CHINA | | | 18,617,171 |
|
| Colombia - 0.2% | | | |
| Bancolombia SA sponsored ADR | | 22,435 | 885,958 |
| Czech Republic - 0.2% | | | |
| MONETA Money Bank A/S | | 262,100 | 846,431 |
| Greece - 0.3% | | | |
| Titan Cement Co. SA (Reg.) | | 40,800 | 1,066,198 |
| Hong Kong - 3.1% | | | |
| AIA Group Ltd. | | 110,920 | 767,906 |
| China Mobile Ltd. | | 54,250 | 577,579 |
| China Mobile Ltd. sponsored ADR | | 46,292 | 2,468,289 |
| China Resources Beer Holdings Co. Ltd. | | 768,666 | 1,849,933 |
| China Resources Power Holdings Co. Ltd. | | 331,809 | 598,065 |
| China Unicom Ltd. | | 97,900 | 126,685 |
| China Unicom Ltd. sponsored ADR | | 55,220 | 716,756 |
| CNOOC Ltd. | | 1,839,000 | 2,145,374 |
| CSPC Pharmaceutical Group Ltd. | | 288,000 | 399,879 |
| Far East Horizon Ltd. | | 2,006,980 | 1,847,433 |
| Sinotruk Hong Kong Ltd. | | 722,500 | 502,513 |
|
| TOTAL HONG KONG | | | 12,000,412 |
|
| India - 5.1% | | | |
| ACC Ltd. | | 7,376 | 186,614 |
| Adani Ports & Special Economic Zone Ltd. (a) | | 170,041 | 866,736 |
| Axis Bank Ltd. | | 115,761 | 917,679 |
| Bharti Infratel Ltd. | | 89,936 | 496,194 |
| Coal India Ltd. (a) | | 196,900 | 847,292 |
| Edelweiss Financial Services Ltd. | | 127,008 | 331,201 |
| Eicher Motors Ltd. | | 2,046 | 829,602 |
| Gujarat Gas Ltd. (a) | | 9,455 | 124,221 |
| ICICI Bank Ltd. | | 135,256 | 583,596 |
| ICICI Bank Ltd. sponsored ADR | | 68,100 | 583,617 |
| Indraprastha Gas Ltd. | | 29,371 | 483,212 |
| ITC Ltd. | | 264,569 | 1,144,038 |
| JK Cement Ltd. | | 52,422 | 794,810 |
| Larsen & Toubro Ltd. | | 41,949 | 1,141,738 |
| LIC Housing Finance Ltd. | | 77,853 | 810,015 |
| Lupin Ltd. | | 72,304 | 1,505,181 |
| Petronet LNG Ltd. | | 95,922 | 632,244 |
| Phoenix Mills Ltd. | | 112,888 | 725,897 |
| Power Grid Corp. of India Ltd. | | 318,923 | 1,031,824 |
| Reliance Industries Ltd. | | 130,558 | 2,833,326 |
| SREI Infrastructure Finance Ltd. | | 116,223 | 163,786 |
| State Bank of India | | 272,083 | 1,226,257 |
| Sun Pharmaceutical Industries Ltd. | | 158,946 | 1,587,111 |
|
| TOTAL INDIA | | | 19,846,191 |
|
| Indonesia - 1.2% | | | |
| PT Astra International Tbk | | 2,468,600 | 1,657,586 |
| PT Bank Mandiri (Persero) Tbk | | 1,228,950 | 1,078,754 |
| PT Bank Rakyat Indonesia Tbk | | 1,414,500 | 1,368,974 |
| PT Kalbe Farma Tbk | | 2,851,300 | 339,058 |
| PT Link Net Tbk | | 857,400 | 347,360 |
|
| TOTAL INDONESIA | | | 4,791,732 |
|
| Israel - 0.2% | | | |
| Bezeq The Israel Telecommunication Corp. Ltd. | | 564,655 | 950,238 |
| Japan - 0.7% | | | |
| Alps Electric Co. Ltd. | | 18,300 | 537,632 |
| Nissha Printing Co. Ltd. | | 3,000 | 74,600 |
| Sumco Corp. | | 99,800 | 1,744,877 |
| Suzuki Motor Corp. | | 13,700 | 571,719 |
|
| TOTAL JAPAN | | | 2,928,828 |
|
| Korea (South) - 6.9% | | | |
| AMOREPACIFIC Group, Inc. | | 5,526 | 638,774 |
| BS Financial Group, Inc. | | 70,265 | 590,483 |
| Daou Technology, Inc. | | 51,536 | 940,025 |
| Duk San Neolux Co. Ltd. (a) | | 6,656 | 219,117 |
| EO Technics Co. Ltd. | | 1,992 | 148,489 |
| Fila Korea Ltd. | | 9,005 | 549,356 |
| Hanon Systems | | 54,935 | 408,536 |
| Hyundai Fire & Marine Insurance Co. Ltd. | | 26,866 | 866,721 |
| Hyundai Glovis Co. Ltd. | | 4,198 | 535,083 |
| Hyundai Industrial Development & Construction Co. | | 4,504 | 176,977 |
| Hyundai Mipo Dockyard Co. Ltd. (a) | | 5,941 | 483,594 |
| Hyundai Mobis | | 10,631 | 2,074,615 |
| InterPark INT Corp. | | 23,097 | 218,260 |
| KB Financial Group, Inc. | | 70,630 | 3,105,533 |
| KEPCO Plant Service & Engineering Co. Ltd. | | 8,420 | 424,849 |
| Korea Electric Power Corp. | | 28,477 | 1,135,400 |
| Korea Express Co. Ltd. (a) | | 5,574 | 815,815 |
| Korean Reinsurance Co. | | 90,338 | 897,345 |
| KT Corp. | | 9,389 | 265,720 |
| KT Corp. sponsored ADR | | 8,290 | 137,531 |
| LG Chemical Ltd. | | 3,297 | 794,109 |
| LG Telecom Ltd. | | 27,683 | 351,634 |
| Netmarble Games Corp. | | 4,253 | 586,956 |
| Samsung Electronics Co. Ltd. | | 2,279 | 4,469,452 |
| Samsung Life Insurance Co. Ltd. (a) | | 11,712 | 1,127,342 |
| Samsung SDI Co. Ltd. | | 9,986 | 1,206,993 |
| Shinhan Financial Group Co. Ltd. | | 70,249 | 2,933,769 |
| Shinhan Financial Group Co. Ltd. sponsored ADR | | 700 | 29,232 |
| SK Telecom Co. Ltd. sponsored ADR | | 25,684 | 605,886 |
| Viatron Technologies, Inc. | | 9,101 | 164,804 |
|
| TOTAL KOREA (SOUTH) | | | 26,902,400 |
|
| Mauritius - 0.2% | | | |
| MakeMyTrip Ltd. (a) | | 17,600 | 675,840 |
| Mexico - 2.7% | | | |
| America Movil S.A.B. de CV Series L sponsored ADR | | 19,253 | 296,304 |
| CEMEX S.A.B. de CV sponsored ADR | | 164,888 | 1,520,267 |
| Fibra Uno Administracion SA de CV | | 335,760 | 586,435 |
| Gruma S.A.B. de CV Series B | | 99,885 | 1,333,799 |
| Grupo Aeroportuario del Pacifico S.A.B. de CV Series B | | 83,700 | 860,776 |
| Grupo Comercial Chedraui S.A.B. de CV | | 187,876 | 389,519 |
| Grupo Financiero Banorte S.A.B. de CV Series O | | 198,829 | 1,150,711 |
| Infraestructura Energetica Nova S.A.B. de CV | | 147,600 | 689,497 |
| Macquarie Mexican (REIT) | | 1,115,270 | 1,222,189 |
| Promotora y Operadora de Infraestructura S.A.B. de CV | | 48,975 | 522,549 |
| Tenedora Nemak SA de CV | | 553,367 | 584,959 |
| Wal-Mart de Mexico SA de CV Series V (a) | | 678,100 | 1,530,883 |
|
| TOTAL MEXICO | | | 10,687,888 |
|
| Netherlands - 0.7% | | | |
| Hangzhou Hikvision Digital Technology Co. Ltd. ELS (BNP Paribas Warrant Program) warrants 9/29/17 (a)(b) | | 66,550 | 353,048 |
| X5 Retail Group NV GDR (Reg. S) (a) | | 19,200 | 676,800 |
| Yandex NV Series A (a) | | 68,187 | 1,858,778 |
|
| TOTAL NETHERLANDS | | | 2,888,626 |
|
| Nigeria - 0.1% | | | |
| Guaranty Trust Bank PLC | | 476,923 | 41,566 |
| Guaranty Trust Bank PLC GDR (Reg. S) | | 23,480 | 103,312 |
| Transnational Corp. of Nigeria PLC | | 6,036,239 | 17,385 |
| Zenith Bank PLC | | 3,605,933 | 175,842 |
|
| TOTAL NIGERIA | | | 338,105 |
|
| Pakistan - 0.2% | | | |
| Habib Bank Ltd. | | 315,000 | 828,704 |
| Panama - 0.1% | | | |
| Copa Holdings SA Class A | | 2,449 | 285,113 |
| Philippines - 0.3% | | | |
| Metropolitan Bank & Trust Co. | | 330,531 | 556,910 |
| Robinsons Land Corp. | | 1,387,380 | 709,576 |
|
| TOTAL PHILIPPINES | | | 1,266,486 |
|
| Romania - 0.1% | | | |
| Banca Transilvania SA | | 636,993 | 421,875 |
| Russia - 3.7% | | | |
| Gazprom OAO sponsored ADR (Reg. S) | | 58,300 | 276,925 |
| Lukoil PJSC sponsored ADR | | 47,300 | 2,349,155 |
| Magnit OJSC GDR (Reg. S) | | 15,500 | 541,725 |
| MegaFon PJSC (a) | | 24,000 | 252,442 |
| MegaFon PJSC GDR | | 13,220 | 141,322 |
| MMC Norilsk Nickel PJSC sponsored ADR | | 81,100 | 1,247,724 |
| Mobile TeleSystems OJSC | | 143,782 | 691,827 |
| Mobile TeleSystems OJSC sponsored ADR | | 4,700 | 48,504 |
| NOVATEK OAO GDR (Reg. S) | | 12,700 | 1,539,240 |
| RusHydro PJSC (a) | | 38,549,800 | 606,057 |
| Sberbank of Russia | | 936,970 | 2,721,484 |
| Sberbank of Russia sponsored ADR | | 243,584 | 2,896,214 |
| Sistema JSFC | | 1,492,700 | 559,808 |
| Sistema JSFC sponsored GDR | | 11,560 | 97,220 |
| Unipro PJSC | | 10,020,700 | 443,575 |
|
| TOTAL RUSSIA | | | 14,413,222 |
|
| Singapore - 0.3% | | | |
| Ascendas Real Estate Investment Trust | | 263,590 | 482,976 |
| First Resources Ltd. | | 465,300 | 624,441 |
|
| TOTAL SINGAPORE | | | 1,107,417 |
|
| South Africa - 4.3% | | | |
| Alexander Forbes Group Holdings Ltd. | | 6,830 | 3,291 |
| Aspen Pharmacare Holdings Ltd. | | 40,802 | 846,434 |
| Barclays Africa Group Ltd. | | 46,136 | 507,492 |
| Bidcorp Ltd. | | 23,256 | 492,729 |
| Bidvest Group Ltd. | | 59,656 | 712,055 |
| FirstRand Ltd. | | 331,500 | 1,236,575 |
| Imperial Holdings Ltd. | | 58,700 | 742,285 |
| JSE Ltd. | | 27,510 | 293,138 |
| Life Healthcare Group Holdings Ltd. | | 274,600 | 590,348 |
| MTN Group Ltd. | | 35,600 | 336,986 |
| Naspers Ltd. Class N | | 52,531 | 9,988,849 |
| Nedbank Group Ltd. | | 31,980 | 539,511 |
| Telkom SA Ltd. | | 79,202 | 443,193 |
|
| TOTAL SOUTH AFRICA | | | 16,732,886 |
|
| Taiwan - 5.5% | | | |
| Advantech Co. Ltd. | | 48,000 | 387,519 |
| Chroma ATE, Inc. | | 105,000 | 327,962 |
| E.SUN Financial Holdings Co. Ltd. | | 842,200 | 508,558 |
| E.SUN Financial Holdings Co. Ltd. rights 5/2/17 (a) | | 54,635 | 5,875 |
| eMemory Technology, Inc. | | 14,995 | 206,148 |
| Genius Electronic Optical Co. Ltd. (a) | | 49,000 | 573,123 |
| GlobalWafers Co. Ltd. | | 108,000 | 771,862 |
| GlobalWafers Co. Ltd. unit (a) | | 83,300 | 595,345 |
| Hon Hai Precision Industry Co. Ltd. (Foxconn) | | 93,000 | 304,020 |
| King's Town Bank | | 341,600 | 327,777 |
| LandMark Optoelectronics Corp. | | 46,000 | 403,335 |
| Largan Precision Co. Ltd. | | 29,403 | 4,878,935 |
| PChome Online, Inc. | | 49,000 | 418,291 |
| Taiwan Cement Corp. | | 1,093,000 | 1,269,374 |
| Taiwan Fertilizer Co. Ltd. | | 219,000 | 295,642 |
| Taiwan Semiconductor Manufacturing Co. Ltd. | | 1,252,000 | 8,051,376 |
| Taiwan Semiconductor Manufacturing Co. Ltd. sponsored ADR | | 7,242 | 239,493 |
| Universal Cement Corp. | | 363,320 | 313,756 |
| Vanguard International Semiconductor Corp. | | 171,000 | 325,898 |
| Wistron NeWeb Corp. | | 89,780 | 257,253 |
| Yuanta Financial Holding Co. Ltd. | | 2,772,231 | 1,183,264 |
|
| TOTAL TAIWAN | | | 21,644,806 |
|
| Thailand - 1.1% | | | |
| Delta Electronics PCL (For. Reg.) | | 150,300 | 399,642 |
| Kasikornbank PCL (For. Reg.) | | 211,880 | 1,132,884 |
| PTT Global Chemical PCL (For. Reg.) | | 646,800 | 1,402,023 |
| PTT PCL (For. Reg.) | | 100,300 | 1,127,650 |
| Star Petroleum Refining PCL | | 1,126,300 | 429,687 |
|
| TOTAL THAILAND | | | 4,491,886 |
|
| Turkey - 0.9% | | | |
| Aselsan A/S | | 113,000 | 621,318 |
| Bim Birlesik Magazalar A/S JSC | | 64,000 | 1,045,961 |
| Enka Insaat ve Sanayi A/S | | 247,030 | 379,731 |
| Tupras Turkiye Petrol Rafinelleri A/S | | 50,200 | 1,264,911 |
| Turkiye Garanti Bankasi A/S | | 51,000 | 137,696 |
|
| TOTAL TURKEY | | | 3,449,617 |
|
| United Arab Emirates - 1.1% | | | |
| DP World Ltd. | | 37,957 | 775,841 |
| Emaar Properties PJSC | | 899,504 | 1,758,355 |
| National Bank of Abu Dhabi PJSC (a) | | 579,841 | 1,736,524 |
|
| TOTAL UNITED ARAB EMIRATES | | | 4,270,720 |
|
| United Kingdom - 0.4% | | | |
| Fresnillo PLC | | 33,000 | 620,608 |
| Mondi PLC | | 36,000 | 933,010 |
| Shanghai International Airport Co. Ltd. (UBS Warrant Programme) warrants 5/11/18 (a)(b) | | 9,200 | 45,710 |
|
| TOTAL UNITED KINGDOM | | | 1,599,328 |
|
| United States of America - 0.1% | | | |
| China Biologic Products, Inc. (a) | | 2,160 | 254,880 |
| TOTAL COMMON STOCKS | | | |
| (Cost $209,743,904) | | | 235,576,437 |
|
| Nonconvertible Preferred Stocks - 4.8% | | | |
| Brazil - 3.7% | | | |
| Ambev SA sponsored ADR | | 380,000 | 2,177,400 |
| Banco do Estado Rio Grande do Sul SA | | 131,920 | 590,597 |
| Companhia Paranaense de Energia-Copel: | | | |
| (PN-B) | | 2,215 | 20,356 |
| (PN-B) sponsored ADR | | 54,752 | 502,076 |
| Fibria Celulose SA sponsored ADR | | 101,000 | 927,180 |
| Itau Unibanco Holding SA sponsored ADR | | 398,441 | 4,900,824 |
| Metalurgica Gerdau SA (PN) (a) | | 543,470 | 787,625 |
| Petroleo Brasileiro SA - Petrobras (PN) sponsored (non-vtg.) (a) | | 201,206 | 1,756,528 |
| Telefonica Brasil SA | | 77,443 | 1,153,819 |
| Vale SA (PN-A) sponsored ADR | | 228,200 | 1,873,522 |
|
| TOTAL BRAZIL | | | 14,689,927 |
|
| Korea (South) - 1.1% | | | |
| Hyundai Motor Co. Series 2 | | 18,034 | 1,574,170 |
| Samsung Electronics Co. Ltd. | | 1,270 | 1,957,024 |
| Samsung Fire & Marine Insurance Co. Ltd. | | 5,089 | 802,985 |
|
| TOTAL KOREA (SOUTH) | | | 4,334,179 |
|
| TOTAL NONCONVERTIBLE PREFERRED STOCKS | | | |
| (Cost $17,265,756) | | | 19,024,106 |
| | | Principal Amount(c) | Value |
|
| Nonconvertible Bonds - 8.3% | | | |
| Azerbaijan - 0.6% | | | |
| International Bank of Azerbaijan OJSC 5.625% 6/11/19 (Reg. S) | | 600,000 | 603,072 |
| Southern Gas Corridor CJSC 6.875% 3/24/26 (b) | | 1,180,000 | 1,302,307 |
| State Oil Co. of Azerbaijan Republic 6.95% 3/18/30 (Reg. S) | | 275,000 | 297,688 |
|
| TOTAL AZERBAIJAN | | | 2,203,067 |
|
| British Virgin Islands - 0.2% | | | |
| 1MDB Global Investments Ltd. 4.4% 3/9/23 | | 1,000,000 | 937,502 |
| Canada - 0.2% | | | |
| Evraz, Inc. NA Canada 7.5% 11/15/19 (b) | | 10,000 | 10,375 |
| First Quantum Minerals Ltd.: | | | |
| 7% 2/15/21 (b) | | 250,000 | 258,750 |
| 7.25% 4/1/23 (b) | | 400,000 | 407,250 |
| 7.5% 4/1/25 (b) | | 200,000 | 204,000 |
| Pacific Exploration and Production Corp. 10% 11/2/21 pay-in-kind (d) | | 18,000 | 20,205 |
|
| TOTAL CANADA | | | 900,580 |
|
| Cayman Islands - 0.2% | | | |
| Ksa Sukuk Ltd. 3.628% 4/20/27 (b) | | 600,000 | 602,724 |
| Odebrecht Finance Ltd. 4.375% 4/25/25 (b) | | 400,000 | 179,500 |
|
| TOTAL CAYMAN ISLANDS | | | 782,224 |
|
| Georgia - 0.4% | | | |
| Georgian Oil & Gas Corp. 6.75% 4/26/21 (b) | | 250,000 | 262,550 |
| JSC BGEO Group 6% 7/26/23 (b) | | 600,000 | 603,750 |
| JSC Georgian Railway 7.75% 7/11/22 (b) | | 600,000 | 659,502 |
|
| TOTAL GEORGIA | | | 1,525,802 |
|
| Indonesia - 0.4% | | | |
| PT Pertamina Persero: | | | |
| 4.875% 5/3/22 (b) | | 275,000 | 290,136 |
| 5.625% 5/20/43 (b) | | 200,000 | 205,896 |
| 6% 5/3/42 (b) | | 400,000 | 425,026 |
| 6.5% 5/27/41 (b) | | 700,000 | 787,553 |
|
| TOTAL INDONESIA | | | 1,708,611 |
|
| Ireland - 0.3% | | | |
| Borets Finance DAC 6.5% 4/7/22 (b) | | 200,000 | 207,000 |
| Metalloinvest Finance Designated Activity Co. 4.85% 5/2/24 (b) | | 200,000 | 199,750 |
| Vnesheconombank Via VEB Finance PLC: | | | |
| 6.8% 11/22/25 (b) | | 425,000 | 474,445 |
| 6.902% 7/9/20 (b) | | 200,000 | 219,485 |
|
| TOTAL IRELAND | | | 1,100,680 |
|
| Israel - 0.1% | | | |
| Israel Electric Corp. Ltd. 7.75% 12/15/27 (Reg. S) | | 275,000 | 342,265 |
| Kazakhstan - 0.4% | | | |
| Kazagro National Management Holding JSC 4.625% 5/24/23 (b) | | 400,000 | 394,733 |
| KazMunaiGaz Finance Sub BV: | | | |
| 3.875% 4/19/22 (b) | | 240,000 | 240,348 |
| 5.75% 4/19/47 (b) | | 290,000 | 282,779 |
| 6.375% 4/9/21 (b) | | 250,000 | 274,446 |
| 7% 5/5/20 (b) | | 200,000 | 219,555 |
|
| TOTAL KAZAKHSTAN | | | 1,411,861 |
|
| Luxembourg - 0.6% | | | |
| EVRAZ Group SA 5.375% 3/20/23 (b) | | 245,000 | 246,519 |
| Kernel Holding SA 8.75% 1/31/22 (b) | | 400,000 | 424,000 |
| MHP SA 7.75% 5/10/24 (b)(e) | | 200,000 | 202,600 |
| Petrobras International Finance Co. Ltd. 8.375% 12/10/18 | | 300,000 | 324,000 |
| Rumo Luxembourg Sarl 7.375% 2/9/24 (b) | | 400,000 | 416,800 |
| Steel Capital SA LN Partner Net Program 3.85% 8/27/21 (b) | | 400,000 | 400,580 |
| VM Holding SA 5.375% 5/4/27 (b) | | 400,000 | 398,200 |
|
| TOTAL LUXEMBOURG | | | 2,412,699 |
|
| Mexico - 0.8% | | | |
| Petroleos Mexicanos: | | | |
| 4.7696% 3/11/22 (b)(d) | | 260,000 | 282,399 |
| 5.5% 6/27/44 | | 305,000 | 267,638 |
| 6.375% 2/4/21 | | 150,000 | 163,313 |
| 6.375% 1/23/45 | | 300,000 | 293,670 |
| 6.5% 6/2/41 | | 1,300,000 | 1,301,950 |
| 6.75% 9/21/47 | | 400,000 | 406,520 |
| 6.875% 8/4/26 | | 400,000 | 447,000 |
|
| TOTAL MEXICO | | | 3,162,490 |
|
| Mongolia - 0.1% | | | |
| Trade and Development Bank of Mongolia LLC 9.375% 5/19/20 (Reg. S) | | 450,000 | 484,528 |
| Morocco - 0.1% | | | |
| OCP SA 6.875% 4/25/44 (b) | | 275,000 | 297,688 |
| Netherlands - 1.0% | | | |
| Petrobras Global Finance BV: | | | |
| 6.85% 6/5/2115 | | 965,000 | 859,333 |
| 7.25% 3/17/44 | | 705,000 | 701,240 |
| 8.375% 5/23/21 | | 325,000 | 368,063 |
| 8.75% 5/23/26 | | 1,675,000 | 1,953,050 |
|
| TOTAL NETHERLANDS | | | 3,881,686 |
|
| South Africa - 0.3% | | | |
| Eskom Holdings SOC Ltd. 6.75% 8/6/23 (b) | | 1,225,000 | 1,258,935 |
| Trinidad & Tobago - 0.3% | | | |
| Petroleum Co. of Trinidad & Tobago Ltd.: | | | |
| 6% 5/8/22 (b) | | 313,958 | 310,181 |
| 9.75% 8/14/19 (b) | | 750,000 | 796,875 |
|
| TOTAL TRINIDAD & TOBAGO | | | 1,107,056 |
|
| Tunisia - 0.3% | | | |
| Banque Centrale de Tunisie: | | | |
| 5.625% 2/17/24 (Reg. S) | EUR | 500,000 | 556,224 |
| 5.75% 1/30/25 (b) | | 600,000 | 588,600 |
|
| TOTAL TUNISIA | | | 1,144,824 |
|
| Turkey - 0.2% | | | |
| Akbank TAS/Ak Finansal Kiralama A/S 7.2% 3/16/27 (b)(d) | | 700,000 | 738,956 |
| Turkiye Ihracat Kredi Bankasi A/S 5.375% 10/24/23 (b) | | 200,000 | 200,500 |
|
| TOTAL TURKEY | | | 939,456 |
|
| United Arab Emirates - 0.2% | | | |
| DP World Ltd. 6.85% 7/2/37 (Reg. S) | | 500,000 | 587,500 |
| United Kingdom - 0.3% | | | |
| Biz Finance PLC 9.625% 4/27/22 (b) | | 750,000 | 762,375 |
| Petra Diamonds U.S. Treasury PLC 7.25% 5/1/22 (b) | | 400,000 | 418,000 |
|
| TOTAL UNITED KINGDOM | | | 1,180,375 |
|
| United States of America - 0.4% | | | |
| Pemex Project Funding Master Trust: | | | |
| 6.625% 6/15/35 | | 1,275,000 | 1,326,000 |
| 8.625% 2/1/22 | | 300,000 | 351,000 |
|
| TOTAL UNITED STATES OF AMERICA | | | 1,677,000 |
|
| Venezuela - 0.9% | | | |
| Petroleos de Venezuela SA: | | | |
| 5.5% 4/12/37 | | 500,000 | 191,250 |
| 6% 5/16/24 (b) | | 1,000,000 | 391,250 |
| 6% 11/15/26 (Reg. S) | | 2,450,000 | 934,675 |
| 8.5% 10/27/20 (Reg. S) | | 1,750,000 | 1,371,125 |
| 9% 11/17/21 (Reg. S) | | 550,000 | 289,685 |
| 12.75% 2/17/22 (b) | | 600,000 | 373,440 |
|
| TOTAL VENEZUELA | | | 3,551,425 |
|
| TOTAL NONCONVERTIBLE BONDS | | | |
| (Cost $31,873,261) | | | 32,598,254 |
|
| Government Obligations - 19.3% | | | |
| Angola - 0.1% | | | |
| Angola Republic 9.5% 11/12/25 (b) | | 250,000 | 261,815 |
| Argentina - 1.5% | | | |
| Argentine Republic: | | | |
| 0% 4/3/22 (d) | ARS | 8,000,000 | 556,804 |
| 6.625% 7/6/28 | | 150,000 | 153,345 |
| 6.875% 1/26/27 | | 1,950,000 | 2,060,175 |
| 7.5% 4/22/26 | | 1,960,000 | 2,164,722 |
| 7.82% 12/31/33 | EUR | 447,234 | 523,710 |
| 8.28% 12/31/33 | | 315,459 | 352,525 |
|
| TOTAL ARGENTINA | | | 5,811,281 |
|
| Armenia - 0.4% | | | |
| Republic of Armenia: | | | |
| 6% 9/30/20 (b) | | 325,000 | 341,640 |
| 7.15% 3/26/25 (b) | | 1,095,000 | 1,193,725 |
|
| TOTAL ARMENIA | | | 1,535,365 |
|
| Barbados - 0.3% | | | |
| Barbados Government 7% 8/4/22 (b) | | 1,313,000 | 1,066,813 |
| Belarus - 0.3% | | | |
| Belarus Republic 8.95% 1/26/18 | | 1,125,000 | 1,164,992 |
| Brazil - 0.4% | | | |
| Brazilian Federative Republic: | | | |
| 5% 1/27/45 | | 200,000 | 181,250 |
| 5.625% 2/21/47 | | 200,000 | 198,000 |
| 7.125% 1/20/37 | | 200,000 | 232,000 |
| 8.25% 1/20/34 | | 500,000 | 635,025 |
| 12.25% 3/6/30 | | 100,000 | 165,000 |
|
| TOTAL BRAZIL | | | 1,411,275 |
|
| Cameroon - 0.4% | | | |
| Cameroon Republic 9.5% 11/19/25 (b) | | 1,300,000 | 1,478,958 |
| Colombia - 0.1% | | | |
| Colombian Republic: | | | |
| 6.125% 1/18/41 | | 100,000 | 115,000 |
| 7.375% 9/18/37 | | 250,000 | 321,500 |
|
| TOTAL COLOMBIA | | | 436,500 |
|
| Costa Rica - 0.3% | | | |
| Costa Rican Republic: | | | |
| 4.375% 4/30/25 (b) | | 225,000 | 214,866 |
| 7.158% 3/12/45 (b) | | 1,100,000 | 1,144,000 |
|
| TOTAL COSTA RICA | | | 1,358,866 |
|
| Croatia - 0.3% | | | |
| Croatia Republic: | | | |
| 6% 1/26/24 (b) | | 850,000 | 946,220 |
| 6.375% 3/24/21 (b) | | 200,000 | 221,225 |
|
| TOTAL CROATIA | | | 1,167,445 |
|
| Dominican Republic - 0.5% | | | |
| Dominican Republic: | | | |
| 5.95% 1/25/27 (b) | | 125,000 | 130,843 |
| 6.6% 1/28/24 (b) | | 1,025,000 | 1,132,625 |
| 6.85% 1/27/45 (b) | | 350,000 | 372,313 |
| 7.45% 4/30/44 (b) | | 225,000 | 255,094 |
|
| TOTAL DOMINICAN REPUBLIC | | | 1,890,875 |
|
| Ecuador - 0.1% | | | |
| Ecuador Republic: | | | |
| 7.95% 6/20/24 (b) | | 200,000 | 191,000 |
| 9.65% 12/13/26 (b) | | 200,000 | 203,500 |
| 10.75% 3/28/22 (b) | | 200,000 | 217,000 |
|
| TOTAL ECUADOR | | | 611,500 |
|
| Egypt - 0.6% | | | |
| Arab Republic 5.875% 6/11/25 (b) | | 200,000 | 197,308 |
| Arab Republic of Egypt: | | | |
| 6.125% 1/31/22 (b) | | 600,000 | 623,850 |
| 7.5% 1/31/27 (b) | | 400,000 | 431,160 |
| 8.5% 1/31/47 (b) | | 1,100,000 | 1,197,075 |
|
| TOTAL EGYPT | | | 2,449,393 |
|
| El Salvador - 0.6% | | | |
| El Salvador Republic: | | | |
| 6.375% 1/18/27 (b) | | 400,000 | 357,000 |
| 7.625% 2/1/41 (b) | | 650,000 | 581,750 |
| 8.625% 2/28/29 (b) | | 1,260,000 | 1,272,600 |
|
| TOTAL EL SALVADOR | | | 2,211,350 |
|
| Ethiopia - 0.3% | | | |
| Federal Democratic Republic of Ethiopia 6.625% 12/11/24 (b) | | 1,250,000 | 1,234,375 |
| Gabon - 0.2% | | | |
| Gabonese Republic: | | | |
| 6.375% 12/12/24 (b) | | 400,000 | 391,700 |
| 6.95% 6/16/25 (b) | | 550,000 | 544,544 |
|
| TOTAL GABON | | | 936,244 |
|
| Ghana - 0.6% | | | |
| Ghana Republic: | | | |
| 7.875% 8/7/23 (Reg.S) | | 400,000 | 396,200 |
| 9.25% 9/15/22 (b) | | 1,150,000 | 1,218,540 |
| 10.75% 10/14/30 (b) | | 600,000 | 723,900 |
|
| TOTAL GHANA | | | 2,338,640 |
|
| Indonesia - 0.1% | | | |
| Indonesian Republic 8.5% 10/12/35 (b) | | 400,000 | 573,234 |
| Iraq - 0.3% | | | |
| Republic of Iraq 5.8% 1/15/28 (Reg. S) | | 1,250,000 | 1,117,188 |
| Ivory Coast - 0.1% | | | |
| Ivory Coast 5.375% 7/23/24 (b) | | 400,000 | 389,500 |
| Jamaica - 0.1% | | | |
| Jamaican Government 8% 3/15/39 | | 200,000 | 232,392 |
| Jordan - 0.4% | | | |
| Jordanian Kingdom: | | | |
| 5.75% 1/31/27 (b) | | 1,050,000 | 1,037,211 |
| 6.125% 1/29/26 (b) | | 400,000 | 408,640 |
|
| TOTAL JORDAN | | | 1,445,851 |
|
| Kenya - 0.2% | | | |
| Republic of Kenya 6.875% 6/24/24 (b) | | 900,000 | 911,430 |
| Kuwait - 0.3% | | | |
| State of Kuwait 3.5% 3/20/27 (b) | | 1,025,000 | 1,048,167 |
| Lebanon - 1.6% | | | |
| Lebanese Republic: | | | |
| 4% 12/31/17 | | 197,000 | 196,367 |
| 5% 10/12/17 | | 275,000 | 276,507 |
| 5.15% 6/12/18 | | 1,400,000 | 1,421,000 |
| 5.15% 11/12/18 | | 100,000 | 101,359 |
| 5.45% 11/28/19 | | 700,000 | 712,782 |
| 6% 5/20/19 | | 675,000 | 694,103 |
| 6.1% 10/4/22 | | 965,000 | 989,974 |
| 6.375% 3/9/20 | | 1,125,000 | 1,162,125 |
| 6.6% 11/27/26 | | 570,000 | 575,871 |
| 6.65% 2/26/30 (Reg. S) | | 105,000 | 105,296 |
|
| TOTAL LEBANON | | | 6,235,384 |
|
| Mexico - 0.7% | | | |
| United Mexican States 10% 12/5/24 | MXN | 42,885,000 | 2,658,675 |
| Mongolia - 0.3% | | | |
| Mongolian People's Republic: | | | |
| 5.125% 12/5/22 (Reg. S) | | 400,000 | 382,017 |
| 8.75% 3/9/24 (b) | | 600,000 | 666,657 |
|
| TOTAL MONGOLIA | | | 1,048,674 |
|
| Netherlands - 0.1% | | | |
| Republic of Angola 7% 8/17/19 (Issued by Northern Lights III BV for Republic of Angola) (Reg. S) | | 312,500 | 322,641 |
| Nigeria - 0.1% | | | |
| Republic of Nigeria 7.875% 2/16/32 (b) | | 400,000 | 434,400 |
| Oman - 0.6% | | | |
| Sultanate of Oman: | | | |
| 4.75% 6/15/26 (b) | | 400,000 | 402,169 |
| 5.375% 3/8/27 (b) | | 335,000 | 349,519 |
| 6.5% 3/8/47 (b) | | 1,600,000 | 1,723,510 |
|
| TOTAL OMAN | | | 2,475,198 |
|
| Pakistan - 0.2% | | | |
| Islamic Republic of Pakistan: | | | |
| 7.25% 4/15/19 (b) | | 200,000 | 211,600 |
| 8.25% 4/15/24 (b) | | 200,000 | 222,578 |
| 8.25% 9/30/25 (b) | | 200,000 | 224,544 |
|
| TOTAL PAKISTAN | | | 658,722 |
|
| Paraguay - 0.2% | | | |
| Republic of Paraguay: | | | |
| 4.7% 3/27/27 (b) | | 200,000 | 203,800 |
| 6.1% 8/11/44 (b) | | 435,000 | 468,713 |
|
| TOTAL PARAGUAY | | | 672,513 |
|
| Poland - 0.3% | | | |
| Polish Government 2.5% 7/25/27 | PLN | 4,500,000 | 1,067,230 |
| Qatar - 0.4% | | | |
| State of Qatar 9.75% 6/15/30 (Reg. S) | | 875,000 | 1,404,632 |
| Romania - 0.1% | | | |
| Romanian Republic 5.85% 4/26/23 | RON | 1,500,000 | 411,117 |
| Russia - 0.3% | | | |
| Ministry of Finance Russian Federation 4.75% 5/27/26 (b) | | 200,000 | 211,062 |
| Russian Federation: | | | |
| 5.625% 4/4/42 (b) | | 200,000 | 222,740 |
| 12.75% 6/24/28 (Reg. S) | | 425,000 | 753,556 |
|
| TOTAL RUSSIA | | | 1,187,358 |
|
| Rwanda - 0.3% | | | |
| Republic of Rwanda 6.625% 5/2/23 (b) | | 1,225,000 | 1,246,001 |
| Saudi Arabia - 0.3% | | | |
| Kingdom of Saudi Arabia 3.25% 10/26/26 (b) | | 450,000 | 439,367 |
| Saudi Arabia Kingdom of 4.5% 10/26/46 (b) | | 760,000 | 750,979 |
|
| TOTAL SAUDI ARABIA | | | 1,190,346 |
|
| Senegal - 0.1% | | | |
| Republic of Senegal 8.75% 5/13/21 (b) | | 400,000 | 457,580 |
| Serbia - 0.1% | | | |
| Republic of Serbia 4.875% 2/25/20 (b) | | 400,000 | 417,000 |
| South Africa - 0.0% | | | |
| South African Republic 5.875% 9/16/25 | | 200,000 | 216,000 |
| Sri Lanka - 0.1% | | | |
| Democratic Socialist Republic of Sri Lanka: | | | |
| 5.125% 4/11/19 (b) | | 200,000 | 205,000 |
| 6.85% 11/3/25 (b) | | 250,000 | 263,147 |
|
| TOTAL SRI LANKA | | | 468,147 |
|
| Suriname - 0.4% | | | |
| Republic of Suriname 9.25% 10/26/26 (b) | | 1,725,000 | 1,742,250 |
| Tanzania - 0.0% | | | |
| United Republic of Tanzania 7.421% 3/9/20 (d) | | 133,334 | 140,643 |
| Turkey - 1.2% | | | |
| Turkish Republic: | | | |
| 4.875% 10/9/26 | | 400,000 | 396,000 |
| 6% 3/25/27 | | 900,000 | 963,000 |
| 6.25% 9/26/22 | | 850,000 | 923,620 |
| 6.875% 3/17/36 | | 250,000 | 283,313 |
| 7% 6/5/20 | | 700,000 | 770,210 |
| 7.375% 2/5/25 | | 100,000 | 116,011 |
| 8% 2/14/34 | | 250,000 | 312,490 |
| 10.6% 2/11/26 | TRY | 1,940,000 | 559,560 |
| 11.875% 1/15/30 | | 165,000 | 263,082 |
|
| TOTAL TURKEY | | | 4,587,286 |
|
| Ukraine - 1.1% | | | |
| Ukraine Government: | | | |
| 0% 5/31/40 (b)(d) | | 430,000 | 150,139 |
| 7.75% 9/1/19 (b) | | 1,200,000 | 1,224,048 |
| 7.75% 9/1/20 (b) | | 2,100,000 | 2,115,834 |
| 7.75% 9/1/21 (b) | | 400,000 | 398,768 |
| 7.75% 9/1/24 (b) | | 300,000 | 285,498 |
|
| TOTAL UKRAINE | | | 4,174,287 |
|
| United States of America - 1.8% | | | |
| U.S. Treasury Bills, yield at date of purchase 0.5% to 0.79% 5/18/17 to 7/20/17 (f) | | 780,000 | 779,446 |
| U.S. Treasury Bonds 2.875% 11/15/46 | | 6,270,000 | 6,161,498 |
|
| TOTAL UNITED STATES OF AMERICA | | | 6,940,944 |
|
| Venezuela - 0.4% | | | |
| Venezuelan Republic: | | | |
| 7% 12/1/18 (Reg. S) | | 200,000 | 140,740 |
| 7% 3/31/38 | | 650,000 | 293,605 |
| 7.75% 10/13/19 (Reg. S) | | 300,000 | 180,510 |
| 9% 5/7/23 (Reg. S) | | 300,000 | 149,310 |
| 9.25% 9/15/27 | | 650,000 | 346,970 |
| 9.25% 5/7/28 (Reg. S) | | 1,000,000 | 476,700 |
| 12.75% 8/23/22 | | 325,000 | 199,973 |
|
| TOTAL VENEZUELA | | | 1,787,808 |
|
| Vietnam - 0.1% | | | |
| Vietnamese Socialist Republic 4.8% 11/19/24 (b) | | 300,000 | 307,974 |
| Zambia - 0.0% | | | |
| Republic of Zambia 8.97% 7/30/27 (b) | | 200,000 | 213,540 |
| TOTAL GOVERNMENT OBLIGATIONS | | | |
| (Cost $73,880,465) | | | 75,549,799 |
|
| Preferred Securities - 0.0% | | | |
| Colombia - 0.0% | | | |
| Colombia Telecomunicacines SA 8.5%(b)(d)(g) | | | |
| (Cost $49,957) | | 55,000 | 55,128 |
| | | Shares | Value |
|
| Money Market Funds - 8.1% | | | |
| Fidelity Cash Central Fund, 0.85% (h) | | | |
| (Cost $31,650,303) | | 31,645,712 | 31,652,041 |
| TOTAL INVESTMENT PORTFOLIO - 100.6% | | | |
| (Cost $364,463,646) | | | 394,455,765 |
| NET OTHER ASSETS (LIABILITIES) - (0.6)% | | | (2,421,983) |
| NET ASSETS - 100% | | | $392,033,782 |
| Futures Contracts | | | |
| | Expiration Date | Underlying Face Amount at Value | Unrealized Appreciation/(Depreciation) |
| Purchased | | | |
| Equity Index Contracts | | | |
| 297 ICE E-mini MSCI Emerging Markets Index Contracts (United States) | June 2017 | 14,538,150 | $148,060 |
The face value of futures purchased as a percentage of Net Assets is 3.7%
Currency Abbreviations
ARS – Argentine peso
EUR – European Monetary Unit
MXN – Mexican peso
PLN – Polish zloty
RON – Romanian leu
TRY – Turkish Lira
Security Type Abbreviations
ELS – Equity-Linked Security
Categorizations in the Schedule of Investments are based on country or territory of incorporation.
Legend
(a) Non-income producing
(b) Security exempt from registration under Rule 144A of the Securities Act of 1933. These securities may be resold in transactions exempt from registration, normally to qualified institutional buyers. At the end of the period, the value of these securities amounted to $55,745,682 or 14.2% of net assets.
(c) Amount is stated in United States dollars unless otherwise noted.
(d) Coupon rates for floating and adjustable rate securities reflect the rates in effect at period end.
(e) Security or a portion of the security purchased on a delayed delivery or when-issued basis.
(f) Security or a portion of the security was pledged to cover margin requirements for futures contracts. At period end, the value of securities pledged amounted to $630,700.
(g) Security is perpetual in nature with no stated maturity date.
(h) Affiliated fund that is generally available only to investment companies and other accounts managed by Fidelity Investments. The rate quoted is the annualized seven-day yield of the fund at period end. A complete unaudited listing of the fund's holdings as of its most recent quarter end is available upon request. In addition, each Fidelity Central Fund's financial statements are available on the SEC's website or upon request.
Affiliated Central Funds
Information regarding fiscal year to date income earned by the Fund from investments in Fidelity Central Funds is as follows:
| Fund | Income earned |
| Fidelity Cash Central Fund | $72,148 |
| Fidelity Securities Lending Cash Central Fund | 310 |
| Total | $72,458 |
Investment Valuation
The following is a summary of the inputs used, as of April 30, 2017, involving the Fund's assets and liabilities carried at fair value. The inputs or methodology used for valuing securities may not be an indication of the risk associated with investing in those securities. For more information on valuation inputs, and their aggregation into the levels used below, please refer to the Investment Valuation section in the accompanying Notes to Financial Statements.
| | Valuation Inputs at Reporting Date: |
| Description | Total | Level 1 | Level 2 | Level 3 |
| Investments in Securities: | | | | |
| Equities: | | | | |
| Consumer Discretionary | $37,653,868 | $27,665,019 | $9,988,849 | $-- |
| Consumer Staples | 18,050,705 | 18,050,705 | -- | -- |
| Energy | 17,737,819 | 14,855,100 | 2,882,719 | -- |
| Financials | 57,787,501 | 45,939,828 | 11,847,673 | -- |
| Health Care | 6,088,975 | 6,088,975 | -- | -- |
| Industrials | 14,842,598 | 14,842,598 | -- | -- |
| Information Technology | 57,929,736 | 38,793,185 | 19,136,551 | -- |
| Materials | 18,302,819 | 18,302,819 | -- | -- |
| Real Estate | 6,246,878 | 6,246,878 | -- | -- |
| Telecommunication Services | 12,495,839 | 10,834,028 | 1,661,811 | -- |
| Utilities | 7,463,805 | 6,328,405 | 1,135,400 | -- |
| Corporate Bonds | 32,598,254 | 398,200 | 32,200,054 | -- |
| Government Obligations | 75,549,799 | -- | 75,549,799 | -- |
| Preferred Securities | 55,128 | -- | 55,128 | -- |
| Money Market Funds | 31,652,041 | 31,652,041 | -- | -- |
| Total Investments in Securities: | $394,455,765 | $239,997,781 | $154,457,984 | $-- |
| Derivative Instruments: | | | | |
| Assets | | | | |
| Futures Contracts | $148,060 | $148,060 | $-- | $-- |
| Total Assets | $148,060 | $148,060 | $-- | $-- |
| Total Derivative Instruments: | $148,060 | $148,060 | $-- | $-- |
The following is a summary of transfers between Level 1 and Level 2 for the period ended April 30, 2017. Transfers are assumed to have occurred at the beginning of the period, and are primarily attributable to the valuation techniques used for foreign equity securities, as discussed in the accompanying Notes to Financial Statements:
| Transfers | Total |
| Level 1 to Level 2 | $4,663,529 |
| Level 2 to Level 1 | $1,655,313 |
Value of Derivative Instruments
The following table is a summary of the Fund's value of derivative instruments by primary risk exposure as of April 30, 2017. For additional information on derivative instruments, please refer to the Derivative Instruments section in the accompanying Notes to Financial Statements.
| Primary Risk Exposure / Derivative Type | Value |
| | Asset | Liability |
| Equity Risk | | |
| Futures Contracts(a) | $148,060 | $0 |
| Total Equity Risk | 148,060 | 0 |
| Total Value of Derivatives | $148,060 | $0 |
(a) Reflects gross cumulative appreciation (depreciation) on futures contracts as presented in the Schedule of Investments. In the Statement of Assets and Liabilities, the period end daily variation margin is included in receivable or payable for daily variation margin for derivative instruments, and the net cumulative appreciation (depreciation) is included in net unrealized appreciation (depreciation).
Other Information
The composition of credit quality ratings as a percentage of Total Net Assets is as follows (Unaudited):
| U.S. Government and U.S. Government Agency Obligations | 1.6% |
| AAA,AA,A | 2.2% |
| BBB | 3.2% |
| BB | 4.4% |
| B | 10.5% |
| CCC,CC,C | 3.9% |
| Not Rated | 1.6% |
| Equities | 64.9% |
| Short-Term Investments and Net Other Assets | 7.7% |
| | 100% |
We have used ratings from Moody's Investors Service, Inc. Where Moody's® ratings are not available, we have used S&P® ratings. All ratings are as of the date indicated and do not reflect subsequent changes.
See accompanying notes which are an integral part of the financial statements.
Financial Statements
Statement of Assets and Liabilities
| | | April 30, 2017 (Unaudited) |
| Assets | | |
Investment in securities, at value — See accompanying schedule:
Unaffiliated issuers (cost $332,813,343) | $362,803,724 | |
| Fidelity Central Funds (cost $31,650,303) | 31,652,041 | |
| Total Investments (cost $364,463,646) | | $394,455,765 |
| Cash | | 84,220 |
| Foreign currency held at value (cost $712,275) | | 712,354 |
| Receivable for investments sold | | 2,398,500 |
| Receivable for fund shares sold | | 5,086,087 |
| Dividends receivable | | 411,371 |
| Interest receivable | | 1,912,716 |
| Distributions receivable from Fidelity Central Funds | | 19,340 |
| Receivable for daily variation margin for derivative instruments | | 49,005 |
| Prepaid expenses | | 57 |
| Other receivables | | 46,393 |
| Total assets | | 405,175,808 |
| Liabilities | | |
| Payable for investments purchased | | |
| Regular delivery | $11,241,376 | |
| Delayed delivery | 200,000 | |
| Payable for fund shares redeemed | 1,031,023 | |
| Accrued management fee | 235,114 | |
| Distribution and service plan fees payable | 20,944 | |
| Other affiliated payables | 73,534 | |
| Other payables and accrued expenses | 340,035 | |
| Total liabilities | | 13,142,026 |
| Net Assets | | $392,033,782 |
| Net Assets consist of: | | |
| Paid in capital | | $362,671,081 |
| Undistributed net investment income | | 2,130,441 |
| Accumulated undistributed net realized gain (loss) on investments | | (2,684,681) |
| Net unrealized appreciation (depreciation) on investments and assets and liabilities in foreign currencies | | 29,916,941 |
| Net Assets | | $392,033,782 |
| Calculation of Maximum Offering Price | | |
| Class A: | | |
| Net Asset Value and redemption price per share ($23,608,289 ÷ 1,951,354 shares) | | $12.10 |
| Maximum offering price per share (100/94.25 of $12.10) | | $12.84 |
| Class M: | | |
| Net Asset Value and redemption price per share ($4,091,918 ÷ 337,725 shares) | | $12.12 |
| Maximum offering price per share (100/96.50 of $12.12) | | $12.56 |
| Class C: | | |
| Net Asset Value and offering price per share ($19,010,981 ÷ 1,578,616 shares)(a) | | $12.04 |
| Total Emerging Markets: | | |
| Net Asset Value, offering price and redemption price per share ($180,949,088 ÷ 14,946,897 shares) | | $12.11 |
| Class I: | | |
| Net Asset Value, offering price and redemption price per share ($164,373,506 ÷ 13,587,382 shares) | | $12.10 |
(a) Redemption price per share is equal to net asset value less any applicable contingent deferred sales charge.
See accompanying notes which are an integral part of the financial statements.
Statement of Operations
| | | Six months ended April 30, 2017 (Unaudited) |
| Investment Income | | |
| Dividends | | $1,763,537 |
| Interest | | 2,358,307 |
| Income from Fidelity Central Funds | | 72,458 |
| Income before foreign taxes withheld | | 4,194,302 |
| Less foreign taxes withheld | | (176,361) |
| Total income | | 4,017,941 |
| Expenses | | |
| Management fee | $938,711 | |
| Transfer agent fees | 293,974 | |
| Distribution and service plan fees | 102,492 | |
| Accounting and security lending fees | 61,070 | |
| Custodian fees and expenses | 194,106 | |
| Independent trustees' fees and expenses | 406 | |
| Registration fees | 55,404 | |
| Audit | 47,413 | |
| Legal | 727 | |
| Miscellaneous | 529 | |
| Total expenses before reductions | 1,694,832 | |
| Expense reductions | (21,550) | 1,673,282 |
| Net investment income (loss) | | 2,344,659 |
| Realized and Unrealized Gain (Loss) | | |
| Net realized gain (loss) on: | | |
| Investment securities: | | |
| Unaffiliated issuers | 71,090 | |
| Fidelity Central Funds | (461) | |
| Futures contracts | 814,419 | |
| Total net realized gain (loss) | | 885,048 |
Change in net unrealized appreciation (depreciation) on:
Investment securities (net of increase in deferred foreign taxes of $161,553) | 20,408,330 | |
| Assets and liabilities in foreign currencies | 4,686 | |
| Futures contracts | 133,740 | |
| Total change in net unrealized appreciation (depreciation) | | 20,546,756 |
| Net gain (loss) | | 21,431,804 |
| Net increase (decrease) in net assets resulting from operations | | $23,776,463 |
See accompanying notes which are an integral part of the financial statements.
Statement of Changes in Net Assets
| | Six months ended April 30, 2017 (Unaudited) | Year ended October 31, 2016 |
| Increase (Decrease) in Net Assets | | |
| Operations | | |
| Net investment income (loss) | $2,344,659 | $2,170,894 |
| Net realized gain (loss) | 885,048 | (1,751,096) |
| Change in net unrealized appreciation (depreciation) | 20,546,756 | 9,508,420 |
| Net increase (decrease) in net assets resulting from operations | 23,776,463 | 9,928,218 |
| Distributions to shareholders from net investment income | (1,957,793) | (1,715,467) |
| Distributions to shareholders from net realized gain | (138,064) | – |
| Total distributions | (2,095,857) | (1,715,467) |
| Share transactions - net increase (decrease) | 215,900,351 | 80,624,262 |
| Redemption fees | 86,599 | 36,372 |
| Total increase (decrease) in net assets | 237,667,556 | 88,873,385 |
| Net Assets | | |
| Beginning of period | 154,366,226 | 65,492,841 |
| End of period | $392,033,782 | $154,366,226 |
| Other Information | | |
| Undistributed net investment income end of period | $2,130,441 | $1,743,575 |
See accompanying notes which are an integral part of the financial statements.
Financial Highlights — Fidelity Total Emerging Markets Fund Class A
| | Six months ended (Unaudited) April 30, | Years ended October 31, | | | | |
| | 2017 | 2016 | 2015 | 2014 | 2013 | 2012 A |
| Selected Per–Share Data | | | | | | |
| Net asset value, beginning of period | $11.33 | $10.35 | $11.56 | $11.37 | $10.86 | $10.00 |
| Income from Investment Operations | | | | | | |
| Net investment income (loss)B | .10 | .26 | .28 | .18 | .18 | .20 |
| Net realized and unrealized gain (loss) | .80 | .96 | (1.30) | .19 | .48 | .68 |
| Total from investment operations | .90 | 1.22 | (1.02) | .37 | .66 | .88 |
| Distributions from net investment income | (.12) | (.24) | (.17) | (.18) | (.15) | (.02) |
| Distributions from net realized gain | (.01) | – | (.02) | – | (.01) | – |
| Total distributions | (.13) | (.24) | (.19) | (.18) | (.16) | (.02) |
| Redemption fees added to paid in capitalB | –C | –C | –C | –C | .01 | –C |
| Net asset value, end of period | $12.10 | $11.33 | $10.35 | $11.56 | $11.37 | $10.86 |
| Total ReturnD,E,F | 8.09% | 12.13% | (8.92)% | 3.30% | 6.23% | 8.80% |
| Ratios to Average Net AssetsG,H | | | | | | |
| Expenses before reductions | 1.60%I | 1.87% | 1.93% | 1.98% | 1.89% | 1.87% |
| Expenses net of fee waivers, if any | 1.60%I | 1.65% | 1.65% | 1.65% | 1.65% | 1.65% |
| Expenses net of all reductions | 1.58%I | 1.64% | 1.64% | 1.65% | 1.62% | 1.62% |
| Net investment income (loss) | 1.84%I | 2.47% | 2.58% | 1.61% | 1.61% | 1.92% |
| Supplemental Data | | | | | | |
| Net assets, end of period (000 omitted) | $23,608 | $15,206 | $10,164 | $13,627 | $18,837 | $7,675 |
| Portfolio turnover rateJ | 35%I | 57% | 80% | 102% | 120% | 70% |
A For the period November 1, 2011 (commencement of operations) to October 31, 2012.
B Calculated based on average shares outstanding during the period.
C Amount represents less than $.005 per share.
D Total returns for periods of less than one year are not annualized.
E Total returns would have been lower if certain expenses had not been reduced during the applicable periods shown.
F Total returns do not include the effect of the sales charges.
G Fees and expenses of any underlying Fidelity Central Funds are not included in the Fund's expense ratio. The Fund indirectly bears its proportionate share of the expenses of any underlying Fidelity Central Funds.
H Expense ratios reflect operating expenses of the class. Expenses before reductions do not reflect amounts reimbursed by the investment adviser or reductions from brokerage service arrangements or reductions from other expense offset arrangements and do not represent the amount paid by the class during periods when reimbursements or reductions occur. Expense ratios before reductions for start-up periods may not be representative of longer-term operating periods. Expenses net of fee waivers reflect expenses after reimbursement by the investment adviser but prior to reductions from brokerage service arrangements or other expense offset arrangements. Expenses net of all reductions represent the net expenses paid by the class.
I Annualized
J Amount does not include the portfolio activity of any underlying Fidelity Central Funds.
See accompanying notes which are an integral part of the financial statements.
Financial Highlights — Fidelity Total Emerging Markets Fund Class M
| | Six months ended (Unaudited) April 30, | Years ended October 31, | | | | |
| | 2017 | 2016 | 2015 | 2014 | 2013 | 2012 A |
| Selected Per–Share Data | | | | | | |
| Net asset value, beginning of period | $11.33 | $10.33 | $11.54 | $11.34 | $10.84 | $10.00 |
| Income from Investment Operations | | | | | | |
| Net investment income (loss)B | .09 | .23 | .25 | .15 | .15 | .17 |
| Net realized and unrealized gain (loss) | .80 | .97 | (1.30) | .19 | .48 | .68 |
| Total from investment operations | .89 | 1.20 | (1.05) | .34 | .63 | .85 |
| Distributions from net investment income | (.09) | (.20) | (.14) | (.14) | (.12) | (.01) |
| Distributions from net realized gain | (.01) | – | (.02) | – | (.01) | – |
| Total distributions | (.10) | (.20) | (.16) | (.14) | (.14)C | (.01) |
| Redemption fees added to paid in capitalB | –D | –D | –D | –D | .01 | –D |
| Net asset value, end of period | $12.12 | $11.33 | $10.33 | $11.54 | $11.34 | $10.84 |
| Total ReturnE,F,G | 7.92% | 11.92% | (9.18)% | 3.04% | 5.93% | 8.56% |
| Ratios to Average Net AssetsH,I | | | | | | |
| Expenses before reductions | 1.95%J | 2.22% | 2.27% | 2.32% | 2.13% | 2.10% |
| Expenses net of fee waivers, if any | 1.90%J | 1.90% | 1.90% | 1.90% | 1.90% | 1.90% |
| Expenses net of all reductions | 1.88%J | 1.90% | 1.89% | 1.90% | 1.88% | 1.87% |
| Net investment income (loss) | 1.54%J | 2.22% | 2.33% | 1.36% | 1.36% | 1.67% |
| Supplemental Data | | | | | | |
| Net assets, end of period (000 omitted) | $4,092 | $3,019 | $3,331 | $5,277 | $5,967 | $5,823 |
| Portfolio turnover rateK | 35%J | 57% | 80% | 102% | 120% | 70% |
A For the period November 1, 2011 (commencement of operations) to October 31, 2012.
B Calculated based on average shares outstanding during the period.
C Total distributions of $.14 per share is comprised of distributions from net investment income of $1.24 and distributions from net realized gain of $.014 per share.
D Amount represents less than $.005 per share.
E Total returns for periods of less than one year are not annualized.
F Total returns would have been lower if certain expenses had not been reduced during the applicable periods shown.
G Total returns do not include the effect of the sales charges.
H Fees and expenses of any underlying Fidelity Central Funds are not included in the Fund's expense ratio. The Fund indirectly bears its proportionate share of the expenses of any underlying Fidelity Central Funds.
I Expense ratios reflect operating expenses of the class. Expenses before reductions do not reflect amounts reimbursed by the investment adviser or reductions from brokerage service arrangements or reductions from other expense offset arrangements and do not represent the amount paid by the class during periods when reimbursements or reductions occur. Expense ratios before reductions for start-up periods may not be representative of longer-term operating periods. Expenses net of fee waivers reflect expenses after reimbursement by the investment adviser but prior to reductions from brokerage service arrangements or other expense offset arrangements. Expenses net of all reductions represent the net expenses paid by the class.
J Annualized
K Amount does not include the portfolio activity of any underlying Fidelity Central Funds.
See accompanying notes which are an integral part of the financial statements.
Financial Highlights — Fidelity Total Emerging Markets Fund Class C
| | Six months ended (Unaudited) April 30, | Years ended October 31, | | | | |
| | 2017 | 2016 | 2015 | 2014 | 2013 | 2012 A |
| Selected Per–Share Data | | | | | | |
| Net asset value, beginning of period | $11.25 | $10.25 | $11.47 | $11.29 | $10.80 | $10.00 |
| Income from Investment Operations | | | | | | |
| Net investment income (loss)B | .06 | .18 | .20 | .10 | .09 | .12 |
| Net realized and unrealized gain (loss) | .80 | .97 | (1.30) | .19 | .47 | .69 |
| Total from investment operations | .86 | 1.15 | (1.10) | .29 | .56 | .81 |
| Distributions from net investment income | (.06) | (.15) | (.10) | (.11) | (.07) | (.01) |
| Distributions from net realized gain | (.01) | – | (.02) | – | (.01) | – |
| Total distributions | (.07) | (.15) | (.12) | (.11) | (.08) | (.01) |
| Redemption fees added to paid in capitalB | –C | –C | –C | –C | .01 | –C |
| Net asset value, end of period | $12.04 | $11.25 | $10.25 | $11.47 | $11.29 | $10.80 |
| Total ReturnD,E,F | 7.68% | 11.36% | (9.68)% | 2.56% | 5.31% | 8.07% |
| Ratios to Average Net AssetsG,H | | | | | | |
| Expenses before reductions | 2.34%I | 2.62% | 2.68% | 2.72% | 2.65% | 2.63% |
| Expenses net of fee waivers, if any | 2.34%I | 2.40% | 2.40% | 2.40% | 2.40% | 2.40% |
| Expenses net of all reductions | 2.32%I | 2.39% | 2.39% | 2.40% | 2.37% | 2.37% |
| Net investment income (loss) | 1.10%I | 1.72% | 1.83% | .86% | .86% | 1.17% |
| Supplemental Data | | | | | | |
| Net assets, end of period (000 omitted) | $19,011 | $10,710 | $7,736 | $10,104 | $7,436 | $5,824 |
| Portfolio turnover rateJ | 35%I | 57% | 80% | 102% | 120% | 70% |
A For the period November 1, 2011 (commencement of operations) to October 31, 2012.
B Calculated based on average shares outstanding during the period.
C Amount represents less than $.005 per share.
D Total returns for periods of less than one year are not annualized.
E Total returns would have been lower if certain expenses had not been reduced during the applicable periods shown.
F Total returns do not include the effect of the contingent deferred sales charge.
G Fees and expenses of any underlying Fidelity Central Funds are not included in the Fund's expense ratio. The Fund indirectly bears its proportionate share of the expenses of any underlying Fidelity Central Funds.
H Expense ratios reflect operating expenses of the class. Expenses before reductions do not reflect amounts reimbursed by the investment adviser or reductions from brokerage service arrangements or reductions from other expense offset arrangements and do not represent the amount paid by the class during periods when reimbursements or reductions occur. Expense ratios before reductions for start-up periods may not be representative of longer-term operating periods. Expenses net of fee waivers reflect expenses after reimbursement by the investment adviser but prior to reductions from brokerage service arrangements or other expense offset arrangements. Expenses net of all reductions represent the net expenses paid by the class.
I Annualized
J Amount does not include the portfolio activity of any underlying Fidelity Central Funds.
See accompanying notes which are an integral part of the financial statements.
Financial Highlights — Fidelity Total Emerging Markets Fund
| | Six months ended (Unaudited) April 30, | Years ended October 31, | | | | |
| | 2017 | 2016 | 2015 | 2014 | 2013 | 2012 A |
| Selected Per–Share Data | | | | | | |
| Net asset value, beginning of period | $11.34 | $10.38 | $11.60 | $11.40 | $10.89 | $10.00 |
| Income from Investment Operations | | | | | | |
| Net investment income (loss)B | .12 | .28 | .31 | .21 | .21 | .22 |
| Net realized and unrealized gain (loss) | .79 | .97 | (1.31) | .19 | .47 | .69 |
| Total from investment operations | .91 | 1.25 | (1.00) | .40 | .68 | .91 |
| Distributions from net investment income | (.14) | (.29) | (.20) | (.20) | (.17) | (.02) |
| Distributions from net realized gain | (.01) | – | (.02) | – | (.01) | – |
| Total distributions | (.14)C | (.29) | (.22) | (.20) | (.18) | (.02) |
| Redemption fees added to paid in capitalB | –D | –D | –D | –D | .01 | –D |
| Net asset value, end of period | $12.11 | $11.34 | $10.38 | $11.60 | $11.40 | $10.89 |
| Total ReturnE,F | 8.23% | 12.44% | (8.74)% | 3.56% | 6.44% | 9.15% |
| Ratios to Average Net AssetsG,H | | | | | | |
| Expenses before reductions | 1.40%I | 1.62% | 1.72% | 1.73% | 1.56% | 1.60% |
| Expenses net of fee waivers, if any | 1.40%I | 1.40% | 1.40% | 1.40% | 1.40% | 1.40% |
| Expenses net of all reductions | 1.38%I | 1.39% | 1.39% | 1.40% | 1.38% | 1.38% |
| Net investment income (loss) | 2.04%I | 2.72% | 2.83% | 1.86% | 1.85% | 2.16% |
| Supplemental Data | | | | | | |
| Net assets, end of period (000 omitted) | $180,949 | $104,332 | $37,918 | $45,763 | $49,959 | $81,416 |
| Portfolio turnover rateJ | 35%I | 57% | 80% | 102% | 120% | 70% |
A For the period November 1, 2011 (commencement of operations) to October 31, 2012.
B Calculated based on average shares outstanding during the period.
C Total distributions of $.14 per share is comprised of distributions from net investment income of $.135 and distributions from net realized gain of $.009 per share.
D Amount represents less than $.005 per share.
E Total returns for periods of less than one year are not annualized.
F Total returns would have been lower if certain expenses had not been reduced during the applicable periods shown.
G Fees and expenses of any underlying Fidelity Central Funds are not included in the Fund's expense ratio. The Fund indirectly bears its proportionate share of the expenses of any underlying Fidelity Central Funds.
H Expense ratios reflect operating expenses of the class. Expenses before reductions do not reflect amounts reimbursed by the investment adviser or reductions from brokerage service arrangements or reductions from other expense offset arrangements and do not represent the amount paid by the class during periods when reimbursements or reductions occur. Expense ratios before reductions for start-up periods may not be representative of longer-term operating periods. Expenses net of fee waivers reflect expenses after reimbursement by the investment adviser but prior to reductions from brokerage service arrangements or other expense offset arrangements. Expenses net of all reductions represent the net expenses paid by the class.
I Annualized
J Amount does not include the portfolio activity of any underlying Fidelity Central Funds.
See accompanying notes which are an integral part of the financial statements.
Financial Highlights — Fidelity Total Emerging Markets Fund Class I
| | Six months ended (Unaudited) April 30, | Years ended October 31, | | | | |
| | 2017 | 2016 | 2015 | 2014 | 2013 | 2012 A |
| Selected Per–Share Data | | | | | | |
| Net asset value, beginning of period | $11.33 | $10.37 | $11.59 | $11.40 | $10.89 | $10.00 |
| Income from Investment Operations | | | | | | |
| Net investment income (loss)B | .12 | .29 | .31 | .21 | .20 | .22 |
| Net realized and unrealized gain (loss) | .80 | .96 | (1.31) | .18 | .48 | .69 |
| Total from investment operations | .92 | 1.25 | (1.00) | .39 | .68 | .91 |
| Distributions from net investment income | (.14) | (.29) | (.20) | (.20) | (.17) | (.02) |
| Distributions from net realized gain | (.01) | – | (.02) | – | (.01) | – |
| Total distributions | (.15) | (.29) | (.22) | (.20) | (.18) | (.02) |
| Redemption fees added to paid in capitalB | –C | –C | –C | –C | .01 | –C |
| Net asset value, end of period | $12.10 | $11.33 | $10.37 | $11.59 | $11.40 | $10.89 |
| Total ReturnD,E | 8.26% | 12.48% | (8.74)% | 3.51% | 6.44% | 9.15% |
| Ratios to Average Net AssetsF,G | | | | | | |
| Expenses before reductions | 1.27%H | 1.54% | 1.58% | 1.71% | 1.63% | 1.62% |
| Expenses net of fee waivers, if any | 1.27%H | 1.40% | 1.40% | 1.40% | 1.40% | 1.40% |
| Expenses net of all reductions | 1.26%H | 1.39% | 1.39% | 1.40% | 1.37% | 1.37% |
| Net investment income (loss) | 2.16%H | 2.72% | 2.83% | 1.86% | 1.86% | 2.17% |
| Supplemental Data | | | | | | |
| Net assets, end of period (000 omitted) | $164,374 | $21,099 | $6,343 | $4,773 | $5,354 | $2,287 |
| Portfolio turnover rateI | 35%H | 57% | 80% | 102% | 120% | 70% |
A For the period November 1, 2011 (commencement of operations) to October 31, 2012.
B Calculated based on average shares outstanding during the period.
C Amount represents less than $.005 per share.
D Total returns for periods of less than one year are not annualized.
E Total returns would have been lower if certain expenses had not been reduced during the applicable periods shown.
F Fees and expenses of any underlying Fidelity Central Funds are not included in the Fund's expense ratio. The Fund indirectly bears its proportionate share of the expenses of any underlying Fidelity Central Funds.
G Expense ratios reflect operating expenses of the class. Expenses before reductions do not reflect amounts reimbursed by the investment adviser or reductions from brokerage service arrangements or reductions from other expense offset arrangements and do not represent the amount paid by the class during periods when reimbursements or reductions occur. Expense ratios before reductions for start-up periods may not be representative of longer-term operating periods. Expenses net of fee waivers reflect expenses after reimbursement by the investment adviser but prior to reductions from brokerage service arrangements or other expense offset arrangements. Expenses net of all reductions represent the net expenses paid by the class.
H Annualized
I Amount does not include the portfolio activity of any underlying Fidelity Central Funds.
See accompanying notes which are an integral part of the financial statements.
Notes to Financial Statements (Unaudited)
For the period ended April 30, 2017
1. Organization.
Fidelity Total Emerging Markets Fund (the Fund) is a fund of Fidelity Investment Trust (the Trust) and is authorized to issue an unlimited number of shares. The Trust is registered under the Investment Company Act of 1940, as amended (the 1940 Act), as an open-end management investment company organized as a Massachusetts business trust. The Fund offers Class A, Class M (formerly Class T), Class C, Total Emerging Markets and Class I shares, each of which has equal rights as to assets and voting privileges. Each class has exclusive voting rights with respect to matters that affect that class. The Fund's investments in emerging markets can be subject to social, economic, regulatory, and political uncertainties and can be extremely volatile.
2. Investments in Fidelity Central Funds.
The Fund invests in Fidelity Central Funds, which are open-end investment companies generally available only to other investment companies and accounts managed by the investment adviser and its affiliates. The Fund's Schedule of Investments lists each of the Fidelity Central Funds held as of period end, if any, as an investment of the Fund, but does not include the underlying holdings of each Fidelity Central Fund. As an Investing Fund, the Fund indirectly bears its proportionate share of the expenses of the underlying Fidelity Central Funds.
The Money Market Central Funds seek preservation of capital and current income and are managed by Fidelity Investments Money Management, Inc. (FIMM), an affiliate of the investment adviser. Annualized expenses of the Money Market Central Funds as of their most recent shareholder report date are less than .005%.
A complete unaudited list of holdings for each Fidelity Central Fund is available upon request or at the Securities and Exchange Commission (the SEC) website at www.sec.gov. In addition, the financial statements of the Fidelity Central Funds are available on the SEC website or upon request.
3. Significant Accounting Policies.
The Fund is an investment company and applies the accounting and reporting guidance of the Financial Accounting Standards Board (FASB) Accounting Standards Codification Topic 946 Financial Services – Investments Companies. The financial statements have been prepared in conformity with accounting principles generally accepted in the United States of America (GAAP), which require management to make certain estimates and assumptions at the date of the financial statements. Actual results could differ from those estimates. Subsequent events, if any, through the date that the financial statements were issued have been evaluated in the preparation of the financial statements. The following summarizes the significant accounting policies of the Fund:
Investment Valuation. Investments are valued as of 4:00 p.m. Eastern time on the last calendar day of the period. The Board of Trustees (the Board) has delegated the day to day responsibility for the valuation of the Fund's investments to the Fair Value Committee (the Committee) established by the Fund's investment adviser. In accordance with valuation policies and procedures approved by the Board, the Fund attempts to obtain prices from one or more third party pricing vendors or brokers to value its investments. When current market prices, quotations or currency exchange rates are not readily available or reliable, investments will be fair valued in good faith by the Committee, in accordance with procedures adopted by the Board. Factors used in determining fair value vary by investment type and may include market or investment specific events, changes in interest rates and credit quality. The frequency with which these procedures are used cannot be predicted and they may be utilized to a significant extent. The Committee oversees the Fund's valuation policies and procedures and reports to the Board on the Committee's activities and fair value determinations. The Board monitors the appropriateness of the procedures used in valuing the Fund's investments and ratifies the fair value determinations of the Committee.
The Fund categorizes the inputs to valuation techniques used to value its investments into a disclosure hierarchy consisting of three levels as shown below:
- Level 1 – quoted prices in active markets for identical investments
- Level 2 – other significant observable inputs (including quoted prices for similar investments, interest rates, prepayment speeds, etc.)
- Level 3 – unobservable inputs (including the Fund's own assumptions based on the best information available)
Valuation techniques used to value the Fund's investments by major category are as follows:
Equity securities, including restricted securities, for which market quotations are readily available, are valued at the last reported sale price or official closing price as reported by a third party pricing vendor on the primary market or exchange on which they are traded and are categorized as Level 1 in the hierarchy. In the event there were no sales during the day or closing prices are not available, securities are valued at the last quoted bid price or may be valued using the last available price and are generally categorized as Level 2 in the hierarchy. For foreign equity securities, when market or security specific events arise, comparisons to the valuation of American Depositary Receipts (ADRs), futures contracts, Exchange-Traded Funds (ETFs) and certain indexes as well as quoted prices for similar securities may be used and would be categorized as Level 2 in the hierarchy. Utilizing these techniques may result in transfers between Level 1 and Level 2. For equity securities, including restricted securities, where observable inputs are limited, assumptions about market activity and risk are used and these securities may be categorized as Level 3 in the hierarchy.
Debt securities, including restricted securities, are valued based on evaluated prices received from third party pricing vendors or from brokers who make markets in such securities. Corporate bonds, foreign government and government agency obligations, preferred securities and U.S. government and government agency obligations are valued by pricing vendors who utilize matrix pricing which considers yield or price of bonds of comparable quality, coupon, maturity and type or by broker-supplied prices. When independent prices are unavailable or unreliable, debt securities may be valued utilizing pricing methodologies which consider similar factors that would be used by third party pricing vendors. Debt securities are generally categorized as Level 2 in the hierarchy but may be Level 3 depending on the circumstances.
Futures contracts are valued at the settlement price established each day by the board of trade or exchange on which they are traded and are categorized as Level 1 in the hierarchy. Investments in open-end mutual funds, including the Fidelity Central Funds, are valued at their closing net asset value (NAV) each business day and are categorized as Level 1 in the hierarchy.
Changes in valuation techniques may result in transfers in or out of an assigned level within the disclosure hierarchy. The aggregate value of investments by input level as of April 30, 2017, including information on transfers between Levels 1 and 2, is included at the end of the Fund's Schedule of Investments.
Foreign Currency. The Fund may use foreign currency contracts to facilitate transactions in foreign-denominated securities. Gains and losses from these transactions may arise from changes in the value of the foreign currency or if the counterparties do not perform under the contracts' terms.
Foreign-denominated assets, including investment securities, and liabilities are translated into U.S. dollars at the exchange rates at period end. Purchases and sales of investment securities, income and dividends received and expenses denominated in foreign currencies are translated into U.S. dollars at the exchange rate in effect on the transaction date.
The effects of exchange rate fluctuations on investments are included with the net realized and unrealized gain (loss) on investment securities. Other foreign currency transactions resulting in realized and unrealized gain (loss) are disclosed separately.
Investment Transactions and Income. For financial reporting purposes, the Fund's investment holdings and NAV include trades executed through the end of the last business day of the period. The NAV per share for processing shareholder transactions is calculated as of the close of business of the New York Stock Exchange (NYSE), normally 4:00 p.m. Eastern time and includes trades executed through the end of the prior business day. Gains and losses on securities sold are determined on the basis of identified cost. Dividend income is recorded on the ex-dividend date, except for certain dividends from foreign securities where the ex-dividend date may have passed, which are recorded as soon as the Fund is informed of the ex-dividend date. Non-cash dividends included in dividend income, if any, are recorded at the fair market value of the securities received. Income and capital gain distributions from Fidelity Central Funds, if any, are recorded on the ex-dividend date. Certain distributions received by the Fund represent a return of capital or capital gain. The Fund determines the components of these distributions subsequent to the ex-dividend date, based upon receipt of tax filings or other correspondence relating to the underlying investment. These distributions are recorded as a reduction of cost of investments and/or as a realized gain. Interest income is accrued as earned and includes coupon interest and amortization of premium and accretion of discount on debt securities as applicable. Investment income is recorded net of foreign taxes withheld where recovery of such taxes is uncertain. Debt obligations may be placed on non-accrual status and related interest income may be reduced by ceasing current accruals and writing off interest receivables when the collection of all or a portion of interest has become doubtful based on consistently applied procedures. A debt obligation is removed from non-accrual status when the issuer resumes interest payments or when collectability of interest is reasonably assured.
Class Allocations and Expenses. Investment income, realized and unrealized capital gains and losses, common expenses of the Fund, and certain fund-level expense reductions, if any, are allocated daily on a pro-rata basis to each class based on the relative net assets of each class to the total net assets of the Fund. Each class differs with respect to transfer agent and distribution and service plan fees incurred. Certain expense reductions may also differ by class. For the reporting period, the allocated portion of income and expenses to each class as a percent of its average net assets may vary due to the timing of recording these transactions in relation to fluctuating net assets of the classes. Expenses directly attributable to a fund are charged to that fund. Expenses attributable to more than one fund are allocated among the respective funds on the basis of relative net assets or other appropriate methods. Expense estimates are accrued in the period to which they relate and adjustments are made when actual amounts are known.
Income Tax Information and Distributions to Shareholders. Each year, the Fund intends to qualify as a regulated investment company under Subchapter M of the Internal Revenue Code, including distributing substantially all of its taxable income and realized gains. As a result, no provision for U.S. Federal income taxes is required. The Fund files a U.S. federal tax return, in addition to state and local tax returns as required. The Fund's federal income tax returns are subject to examination by the Internal Revenue Service (IRS) for a period of three fiscal years after they are filed. State and local tax returns may be subject to examination for an additional fiscal year depending on the jurisdiction. Foreign taxes are provided for based on the Fund's understanding of the tax rules and rates that exist in the foreign markets in which it invests. The Fund is subject to a tax imposed on capital gains by certain countries in which it invests. An estimated deferred tax liability for net unrealized appreciation on the applicable securities is included in Other payables and accrued expenses on the Statement of Assets & Liabilities.
Distributions are declared and recorded on the ex-dividend date. Income dividends and capital gain distributions are declared separately for each class. Income and capital gain distributions are determined in accordance with income tax regulations, which may differ from GAAP.
Capital accounts within the financial statements are adjusted for permanent book-tax differences. These adjustments have no impact on net assets or the results of operations. Capital accounts are not adjusted for temporary book-tax differences which will reverse in a subsequent period.
Book-tax differences are primarily due to foreign currency transactions, futures contracts, certain foreign taxes, market discount, passive foreign investment companies (PFIC), defaulted bonds, capital loss carryforwards and losses deferred due to wash sales.
The federal tax cost of investment securities and unrealized appreciation (depreciation) as of period end were as follows:
| Gross unrealized appreciation | $35,683,685 |
| Gross unrealized depreciation | (6,508,852) |
| Net unrealized appreciation (depreciation) on securities | $29,174,833 |
| Tax cost | $365,280,932 |
Capital loss carryforwards are only available to offset future capital gains of the Fund to the extent provided by regulations and may be limited. Under the Regulated Investment Company Modernization Act of 2010 (the Act), the Fund is permitted to carry forward capital losses incurred in taxable years beginning after December 22, 2010 for an unlimited period and such capital losses are required to be used prior to any losses that expire. The capital loss carryforward information presented below, including any applicable limitation, is estimated as of prior fiscal period end and is subject to adjustment.
| No expiration | |
| Short-term | $(2,076,801) |
| Long-term | (482,739) |
| Total capital loss carryforward | $(2,559,540) |
Short-Term Trading (Redemption) Fees. Shares held by investors in the Fund less than 90 days may have been subject to a redemption fee equal to 1.50% of the NAV of shares redeemed. All redemption fees, which reduce the proceeds of the shareholder redemption, are retained by the Fund and accounted for as an addition to paid in capital.
Delayed Delivery Transactions and When-Issued Securities. During the period, the Fund transacted in securities on a delayed delivery or when-issued basis. Payment and delivery may take place after the customary settlement period for that security. The price of the underlying securities and the date when the securities will be delivered and paid for are fixed at the time the transaction is negotiated. The securities purchased on a delayed delivery or when-issued basis are identified as such in the Fund's Schedule of Investments. The Fund may receive compensation for interest forgone in the purchase of a delayed delivery or when-issued security. With respect to purchase commitments, the Fund identifies securities as segregated in its records with a value at least equal to the amount of the commitment. Losses may arise due to changes in the value of the underlying securities or if the counterparty does not perform under the contract's terms, or if the issuer does not issue the securities due to political, economic, or other factors.
Restricted Securities. The Fund may invest in securities that are subject to legal or contractual restrictions on resale. These securities generally may be resold in transactions exempt from registration or to the public if the securities are registered. Disposal of these securities may involve time-consuming negotiations and expense, and prompt sale at an acceptable price may be difficult. Information regarding restricted securities is included at the end of the Fund's Schedule of Investments.
4. Derivative Instruments.
Risk Exposures and the Use of Derivative Instruments. The Fund's investment objective allows the Fund to enter into various types of derivative contracts, including futures contracts. Derivatives are investments whose value is primarily derived from underlying assets, indices or reference rates and may be transacted on an exchange or over-the-counter (OTC). Derivatives may involve a future commitment to buy or sell a specified asset based on specified terms, to exchange future cash flows at periodic intervals based on a notional principal amount, or for one party to make one or more payments upon the occurrence of specified events in exchange for periodic payments from the other party.
The Fund used derivatives to increase returns and to manage exposure to certain risks as defined below. The success of any strategy involving derivatives depends on analysis of numerous economic factors, and if the strategies for investment do not work as intended, the Fund may not achieve its objectives.
The Fund's use of derivatives increased or decreased its exposure to the following risk:
| Equity Risk | Equity risk relates to the fluctuations in the value of financial instruments as a result of changes in market prices (other than those arising from interest rate risk or foreign exchange risk), whether caused by factors specific to an individual investment, its issuer, or all factors affecting all instruments traded in a market or market segment.
|
The Fund is also exposed to additional risks from investing in derivatives, such as liquidity risk and counterparty credit risk. Liquidity risk is the risk that the Fund will be unable to close out the derivative in the open market in a timely manner. Counterparty credit risk is the risk that the counterparty will not be able to fulfill its obligation to the Fund. Counterparty credit risk related to exchange-traded futures contracts may be mitigated by the protection provided by the exchange on which they trade.
Investing in derivatives may involve greater risks than investing in the underlying assets directly and, to varying degrees, may involve risk of loss in excess of any initial investment and collateral received and amounts recognized in the Statement of Assets and Liabilities. In addition, there may be the risk that the change in value of the derivative contract does not correspond to the change in value of the underlying instrument.
Futures Contracts. A futures contract is an agreement between two parties to buy or sell a specified underlying instrument for a fixed price at a specified future date. The Fund used futures contracts to manage its exposure to the stock market.
Upon entering into a futures contract, a fund is required to deposit either cash or securities (initial margin) with a clearing broker in an amount equal to a certain percentage of the face value of the contract. Futures contracts are marked-to-market daily and subsequent daily payments (variation margin) are made or received by a fund depending on the daily fluctuations in the value of the futures contracts and are recorded as unrealized appreciation or (depreciation). This receivable and/or payable, if any, is included in daily variation margin for derivative instruments in the Statement of Assets and Liabilities. Realized gain or (loss) is recorded upon the expiration or closing of a futures contract.
Any open futures contracts at period end are presented in the Schedule of Investments under the caption "Futures Contracts". The underlying face amount at value reflects each contract's exposure to the underlying instrument or index at period end and is representative of volume of activity during the period. Securities deposited to meet initial margin requirements are identified in the Schedule of Investments.
During the period the Fund recognized net realized gain (loss) of $814,419 and a change in net unrealized appreciation (depreciation) of $133,740 related to its investment in futures contracts. These amounts are included in the Statement of Operations.
5. Purchases and Sales of Investments.
Purchases and sales of securities, other than short-term securities, aggregated $232,831,436 and $38,608,922, respectively.
6. Fees and Other Transactions with Affiliates.
Management Fee. Fidelity Management & Research Company (the investment adviser) and its affiliates provide the Fund with investment management related services for which the Fund pays a monthly management fee. The management fee is the sum of an individual fund fee rate that is based on an annual rate of .55% of the Fund's average net assets and an annualized group fee rate that averaged .25% during the period. The group fee rate is based upon the average net assets of all the mutual funds advised by the investment adviser, including any mutual funds previously advised by the investment adviser that are currently advised by Fidelity SelectCo, LLC, an affiliate of the investment adviser. The group fee rate decreases as assets under management increase and increases as assets under management decrease. For the reporting period, the total annualized management fee rate was .80% of the Fund's average net assets.
Distribution and Service Plan Fees. In accordance with Rule 12b-1 of the 1940 Act, the Fund has adopted separate Distribution and Service Plans for each class of shares. Certain classes pay Fidelity Distributors Corporation (FDC), an affiliate of the investment adviser, separate Distribution and Service Fees, each of which is based on an annual percentage of each class' average net assets. In addition, FDC may pay financial intermediaries for selling shares of the Fund and providing shareholder support services. For the period, the Distribution and Service Fee rates, total fees and amounts retained by FDC were as follows:
| | Distribution
Fee | Service
Fee | Total Fees | Retained
by FDC |
| Class A | -% | .25% | $25,687 | $2,246 |
| Class M | .25% | .25% | 8,272 | 88 |
| Class C | .75% | .25% | 68,533 | 28,860 |
| | | | $102,492 | $31,194 |
Sales Load. FDC may receive a front-end sales charge of up to 5.75% for selling Class A shares and 3.50% for selling Class M shares, some of which is paid to financial intermediaries for selling shares of the Fund. Depending on the holding period, FDC may receive contingent deferred sales charges levied on Class A, Class M and Class C redemptions. The deferred sales charges are 1.00% for Class C shares, 1.00% for certain purchases of Class A shares and .25% for certain purchases of Class M shares.
For the period, sales charge amounts retained by FDC were as follows:
| | Retained
by FDC |
| Class A | $15,174 |
| Class M | 1,544 |
| Class C(a) | 3,777 |
| | $20,495 |
(a) When Class C shares are initially sold, FDC pays commissions from its own resources to financial intermediaries through which the sales are made.
Transfer Agent Fees. Fidelity Investments Institutional Operations Company, Inc., (FIIOC), an affiliate of the investment adviser, is the transfer, dividend disbursing and shareholder servicing agent for each class of the Fund. FIIOC receives account fees and asset-based fees that vary according to the account size and type of account of the shareholders of the respective classes of the Fund. FIIOC pays for typesetting, printing and mailing of shareholder reports, except proxy statements.
For the period, transfer agent fees for each class were as follows:
| | Amount | % of
Class-Level Average
Net Assets(a) |
| Class A | $23,277 | .23 |
| Class M | 5,488 | .33 |
| Class C | 15,347 | .22 |
| Total Emerging Markets | 187,352 | .29 |
| Class I | 62,510 | .18 |
| | $293,974 | |
(a) Annualized
Accounting and Security Lending Fees. Fidelity Service Company, Inc. (FSC), an affiliate of the investment adviser, maintains the Fund's accounting records. The accounting fee is based on the level of average net assets for each month. Under a separate contract, FSC administers the security lending program. The security lending fee is based on the number and duration of lending transactions.
Brokerage Commissions. The Fund placed a portion of its portfolio transactions with brokerage firms which are affiliates of the investment adviser. Brokerage commissions are included in net realized gain (loss) and change in net unrealized appreciation (depreciation) in the Statement of Operations. The commissions paid to these affiliated firms were $904 for the period.
Interfund Trades. The Fund may purchase from or sell securities to other Fidelity Funds under procedures adopted by the Board. The procedures have been designed to ensure these interfund trades are executed in accordance with Rule 17a-7 of the 1940 Act. Interfund trades are included within the respective purchases and sales amounts shown in the Purchases and Sales of Investments note.
7. Committed Line of Credit.
The Fund participates with other funds managed by the investment adviser or an affiliate in a $4.25 billion credit facility (the "line of credit") to be utilized for temporary or emergency purposes to fund shareholder redemptions or for other short-term liquidity purposes. The Fund has agreed to pay commitment fees on its pro-rata portion of the line of credit, which amounted to $332 and is reflected in Miscellaneous expenses on the Statement of Operations. During the period, the Fund did not borrow on this line of credit.
8. Security Lending.
The Fund lends portfolio securities through a lending agent from time to time in order to earn additional income. For equity securities, a lending agent is used and may loan securities to certain qualified borrowers, including Fidelity Capital Markets (FCM), a broker-dealer affiliated with the Fund. On the settlement date of the loan, the Fund receives collateral (in the form of U.S. Treasury obligations, letters of credit and/or cash) against the loaned securities and maintains collateral in an amount not less than 100% of the market value of the loaned securities during the period of the loan. The market value of the loaned securities is determined at the close of business of the Fund and any additional required collateral is delivered to the Fund on the next business day. The Fund or borrower may terminate the loan at any time, and if the borrower defaults on its obligation to return the securities loaned because of insolvency or other reasons, the Fund may apply collateral received from the borrower against the obligation. The Fund may experience delays and costs in recovering the securities loaned. Any cash collateral received is invested in the Fidelity Securities Lending Cash Central Fund. At period end, there were no security loans outstanding. Security lending income represents the income earned on investing cash collateral, less rebates paid to borrowers and any lending agent fees associated with the loan, plus any premium payments received for lending certain types of securities. Security lending income is presented in the Statement of Operations as a component of income from Fidelity Central Funds. Total security lending income during the period amounted to $310. During the period, there were no securities loaned to FCM.
9. Expense Reductions.
The investment adviser contractually agreed to reimburse each class to the extent annual operating expenses exceeded certain levels of average net assets as noted in the table below. This reimbursement will remain in place through December 2017. Some expenses, for example interest expense, including commitment fees, are excluded from this reimbursement.
The following classes were in reimbursement during the period:
| | Expense
Limitations | Reimbursement |
| Class M | 1.90% | 835 |
| Total Emerging Markets | 1.40% | 2,265 |
| | | $3,100 |
Commissions paid to certain brokers with whom the investment adviser, or its affiliates, places trades on behalf of the Fund include an amount in addition to trade execution, which may be rebated back to the Fund to offset certain expenses. This amount totaled $15,875 for the period. In addition, through arrangements with the Fund's custodian, credits realized as a result of certain uninvested cash balances were used to reduce the Fund's expenses. During the period, these credits reduced the Fund's custody by $1,831.
In addition, during the period the investment adviser reimbursed and/or waived a portion of fund-level operating expenses in the amount of $744.
10. Distributions to Shareholders.
Distributions to shareholders of each class were as follows:
| | Six months ended
April 30, 2017 | Year ended October 31, 2016 |
| From net investment income | | |
| Class A | $195,255 | $214,855 |
| Class M | 23,027 | 63,597 |
| Class C | 57,828 | 107,081 |
| Total Emerging Markets | 1,274,142 | 1,155,874 |
| Class I | 407,541 | 174,060 |
| Total | $1,957,793 | $1,715,467 |
| From net realized gain | | |
| Class A | $14,644 | $– |
| Class M | 2,410 | – |
| Class C | 9,294 | – |
| Total Emerging Markets | 84,943 | – |
| Class I | 26,773 | – |
| Total | $138,064 | $– |
11. Share Transactions.
Share transactions for each class were as follows and may contain automatic conversions between classes or exchanges between affiliated funds:
| | Shares | Shares | Dollars | Dollars |
| | Six months ended April 30, 2017 | Year ended October 31, 2016 | Six months ended April 30, 2017 | Year ended October 31, 2016 |
| Class A | | | | |
| Shares sold | 2,125,263 | 982,236 | $24,122,900 | $10,454,988 |
| Reinvestment of distributions | 19,523 | 21,375 | 207,918 | 212,465 |
| Shares redeemed | (1,535,685) | (643,855) | (17,669,486) | (6,609,703) |
| Net increase (decrease) | 609,101 | 359,756 | $6,661,332 | $4,057,750 |
| Class M | | | | |
| Shares sold | 117,904 | 99,943 | $1,354,652 | $1,053,182 |
| Reinvestment of distributions | 2,361 | 6,356 | 25,216 | 63,302 |
| Shares redeemed | (49,032) | (162,291) | (556,768) | (1,643,320) |
| Net increase (decrease) | 71,233 | (55,992) | $823,100 | $(526,836) |
| Class C | | | | |
| Shares sold | 753,843 | 381,071 | $8,593,757 | $4,073,862 |
| Reinvestment of distributions | 6,299 | 10,753 | 66,954 | 106,882 |
| Shares redeemed | (133,281) | (194,422) | (1,514,257) | (1,922,472) |
| Net increase (decrease) | 626,861 | 197,402 | $7,146,454 | $2,258,272 |
| Total Emerging Markets | | | | |
| Shares sold | 8,320,653 | 7,221,843 | $94,441,401 | $77,958,709 |
| Reinvestment of distributions | 124,771 | 112,410 | 1,328,813 | 1,116,229 |
| Shares redeemed | (2,697,559) | (1,787,997) | (29,872,845) | (18,222,997) |
| Net increase (decrease) | 5,747,865 | 5,546,256 | $65,897,369 | $60,851,941 |
| Class I | | | | |
| Shares sold | 12,464,199 | 1,936,878 | $143,914,514 | $21,178,679 |
| Reinvestment of distributions | 38,174 | 14,612 | 405,784 | 144,954 |
| Shares redeemed | (776,996) | (700,942) | (8,948,202) | (7,340,498) |
| Net increase (decrease) | 11,725,377 | 1,250,548 | $135,372,096 | $13,983,135 |
12. Other.
The Fund's organizational documents provide former and current trustees and officers with a limited indemnification against liabilities arising in connection with the performance of their duties to the Fund. In the normal course of business, the Fund may also enter into contracts that provide general indemnifications. The Fund's maximum exposure under these arrangements is unknown as this would be dependent on future claims that may be made against the Fund. The risk of material loss from such claims is considered remote.
Shareholder Expense Example
As a shareholder of the Fund, you incur two types of costs: (1) transaction costs, including sales charges (loads) on purchase payments or redemption proceeds, redemption fees and (2) ongoing costs, including management fees, distribution and/or service (12b-1) fees and other Fund expenses. This Example is intended to help you understand your ongoing costs (in dollars) of investing in the Fund and to compare these costs with the ongoing costs of investing in other mutual funds.
The Example is based on an investment of $1,000 invested at the beginning of the period and held for the entire period (November 1, 2016 to April 30, 2017).
Actual Expenses
The first line of the accompanying table for each class of the Fund provides information about actual account values and actual expenses. You may use the information in this line, together with the amount you invested, to estimate the expenses that you paid over the period. Simply divide your account value by $1,000.00 (for example, an $8,600 account value divided by $1,000.00 = 8.6), then multiply the result by the number in the first line for a class of the Fund under the heading entitled "Expenses Paid During Period" to estimate the expenses you paid on your account during this period. A small balance maintenance fee of $12.00 that is charged once a year may apply for certain accounts with a value of less than $2,000. This fee is not included in the table below. If it was, the estimate of expenses you paid during the period would be higher, and your ending account value lower, by this amount. In addition, the Fund, as a shareholder in the underlying Fidelity Central Funds, will indirectly bear its pro-rata share of the fees and expenses incurred by the underlying Fidelity Central Funds. These fees and expenses are not included in the Fund's annualized expense ratio used to calculate the expense estimate in the table below.
Hypothetical Example for Comparison Purposes
The second line of the accompanying table for each class of the Fund provides information about hypothetical account values and hypothetical expenses based on a Class' actual expense ratio and an assumed rate of return of 5% per year before expenses, which is not the Class' actual return. The hypothetical account values and expenses may not be used to estimate the actual ending account balance or expenses you paid for the period. You may use this information to compare the ongoing costs of investing in the Fund and other funds. To do so, compare this 5% hypothetical example with the 5% hypothetical examples that appear in the shareholder reports of the other funds. A small balance maintenance fee of $12.00 that is charged once a year may apply for certain accounts with a value of less than $2,000. This fee is not included in the table below. If it was, the estimate of expenses you paid during the period would be higher, and your ending account value lower, by this amount. In addition, the Fund, as a shareholder in the underlying Fidelity Central Funds, will indirectly bear its pro-rata share of the fees and expenses incurred by the underlying Fidelity Central Funds. These fees and expenses are not included in the Fund's annualized expense ratio used to calculate the expense estimate in the table below.
Please note that the expenses shown in the table are meant to highlight your ongoing costs only and do not reflect any transaction costs. Therefore, the second line of the table is useful in comparing ongoing costs only, and will not help you determine the relative total costs of owning different funds. In addition, if these transactional costs were included, your costs would have been higher.
| | Annualized Expense Ratio-A | Beginning
Account Value
November 1, 2016 | Ending
Account Value
April 30, 2017 | Expenses Paid
During Period-B
November 1, 2016
to April 30, 2017 |
| Class A | 1.60% | | | |
| Actual | | $1,000.00 | $1,080.90 | $8.26 |
| Hypothetical-C | | $1,000.00 | $1,016.86 | $8.00 |
| Class M | 1.90% | | | |
| Actual | | $1,000.00 | $1,079.20 | $9.80 |
| Hypothetical-C | | $1,000.00 | $1,015.37 | $9.49 |
| Class C | 2.34% | | | |
| Actual | | $1,000.00 | $1,076.80 | $12.05 |
| Hypothetical-C | | $1,000.00 | $1,013.19 | $11.68 |
| Total Emerging Markets | 1.40% | | | |
| Actual | | $1,000.00 | $1,082.30 | $7.23 |
| Hypothetical-C | | $1,000.00 | $1,017.85 | $7.00 |
| Class I | 1.27% | | | |
| Actual | | $1,000.00 | $1,082.60 | $6.56 |
| Hypothetical-C | | $1,000.00 | $1,018.50 | $6.36 |
A Annualized expense ratio reflects expenses net of applicable fee waivers.
B Expenses are equal to each Class' annualized expense ratio, multiplied by the average account value over the period, multiplied by 181/365 (to reflect the one-half year period).
C 5% return per year before expenses
ATEK-SANN-0617
1.931271.105
Fidelity Advisor® International Discovery Fund -
Class A, Class M (formerly Class T), Class C, Class I and Class Z
Semi-Annual Report April 30, 2017 Class A, Class M, Class C, Class I and Class Z are classes of Fidelity® International Discovery Fund |
|
Contents
To view a fund's proxy voting guidelines and proxy voting record for the 12-month period ended June 30, visit http://www.fidelity.com/proxyvotingresults or visit the Securities and Exchange Commission's (SEC) web site at http://www.sec.gov.
You may also call 1-877-208-0098 to request a free copy of the proxy voting guidelines.
Standard & Poor's, S&P and S&P 500 are registered service marks of The McGraw-Hill Companies, Inc. and have been licensed for use by Fidelity Distributors Corporation.
Other third-party marks appearing herein are the property of their respective owners.
All other marks appearing herein are registered or unregistered trademarks or service marks of FMR LLC or an affiliated company. © 2017 FMR LLC. All rights reserved.
This report and the financial statements contained herein are submitted for the general information of the shareholders of the Fund. This report is not authorized for distribution to prospective investors in the Fund unless preceded or accompanied by an effective prospectus.
A fund files its complete schedule of portfolio holdings with the SEC for the first and third quarters of each fiscal year on Form N-Q. Forms N-Q are available on the SEC’s web site at http://www.sec.gov. A fund's Forms N-Q may be reviewed and copied at the SEC’s Public Reference Room in Washington, DC. Information regarding the operation of the SEC's Public Reference Room may be obtained by calling 1-800-SEC-0330.
For a complete list of a fund's portfolio holdings, view the most recent holdings listing, semiannual report, or annual report on Fidelity's web site at http://www.fidelity.com, http://www.institutional.fidelity.com, or http://www.401k.com, as applicable.
NOT FDIC INSURED •MAY LOSE VALUE •NO BANK GUARANTEE
Neither the Fund nor Fidelity Distributors Corporation is a bank.
Investment Summary (Unaudited)
Geographic Diversification (% of fund's net assets)
| As of April 30, 2017 |
| | Japan | 17.6% |
| | United Kingdom | 15.4% |
| | France | 8.6% |
| | Switzerland | 5.8% |
| | Netherlands | 5.7% |
| | Germany | 5.7% |
| | Sweden | 4.2% |
| | Spain | 4.1% |
| | United States of America* | 3.4% |
| | Other | 29.5% |

| As of October 31, 2016 |
| | Japan | 18.7% |
| | United Kingdom | 13.2% |
| | France | 9.3% |
| | Germany | 8.2% |
| | Netherlands | 4.8% |
| | United States of America* | 4.5% |
| | Switzerland | 4.2% |
| | Hong Kong | 3.6% |
| | Sweden | 3.5% |
| | Other | 30.0% |

* Includes Short-Term investments and Net Other Assets (Liabilities).
Percentages are based on country or territory of incorporation and are adjusted for the effect of futures contracts, if applicable.
Asset Allocation as of April 30, 2017
| | % of fund's net assets | % of fund's net assets 6 months ago |
| Stocks and Equity Futures | 98.3 | 98.8 |
| Short-Term Investments and Net Other Assets (Liabilities) | 1.7 | 1.2 |
Top Ten Stocks as of April 30, 2017
| | % of fund's net assets | % of fund's net assets 6 months ago |
| Total SA (France, Oil, Gas & Consumable Fuels) | 2.1 | 2.1 |
| SAP AG (Germany, Software) | 1.7 | 1.7 |
| Micro Focus International PLC (United Kingdom, Software) | 1.4 | 1.1 |
| Statoil ASA (Norway, Oil, Gas & Consumable Fuels) | 1.3 | 1.5 |
| Unilever NV (Certificaten Van Aandelen) (Bearer) (Netherlands, Personal Products) | 1.2 | 1.6 |
| Koninklijke Philips Electronics NV (Netherlands, Industrial Conglomerates) | 1.2 | 0.6 |
| Naspers Ltd. Class N (South Africa, Media) | 1.2 | 1.2 |
| Housing Development Finance Corp. Ltd. (India, Thrifts & Mortgage Finance) | 1.2 | 1.2 |
| British American Tobacco PLC (United Kingdom, Tobacco) | 1.2 | 0.8 |
| ORIX Corp. (Japan, Diversified Financial Services) | 1.1 | 1.3 |
| | 13.6 | |
Top Market Sectors as of April 30, 2017
| | % of fund's net assets | % of fund's net assets 6 months ago |
| Financials | 20.8 | 20.8 |
| Industrials | 16.4 | 14.6 |
| Consumer Discretionary | 13.9 | 13.8 |
| Information Technology | 13.3 | 11.7 |
| Consumer Staples | 10.0 | 12.9 |
| Health Care | 7.7 | 8.2 |
| Materials | 6.2 | 5.4 |
| Energy | 4.8 | 4.7 |
| Telecommunication Services | 2.8 | 2.7 |
| Real Estate | 1.1 | 1.9 |
Investments April 30, 2017 (Unaudited)
Showing Percentage of Net Assets
| Common Stocks - 97.5% | | | |
| | | Shares | Value (000s) |
| Australia - 2.3% | | | |
| Altium Ltd. | | 1,569,213 | $9,635 |
| Australia & New Zealand Banking Group Ltd. | | 2,511,358 | 61,605 |
| Bapcor Ltd. | | 8,624,274 | 33,775 |
| Magellan Financial Group Ltd. | | 1,204,177 | 21,262 |
| Ramsay Health Care Ltd. | | 1,008,165 | 54,127 |
| Spark Infrastructure Group unit | | 19,012,123 | 35,448 |
|
| TOTAL AUSTRALIA | | | 215,852 |
|
| Austria - 1.0% | | | |
| Erste Group Bank AG | | 1,271,400 | 45,454 |
| Wienerberger AG | | 2,092,000 | 48,995 |
|
| TOTAL AUSTRIA | | | 94,449 |
|
| Bailiwick of Jersey - 1.8% | | | |
| Glencore Xstrata PLC | | 16,946,469 | 66,648 |
| IWG PLC | | 6,386,188 | 26,874 |
| Randgold Resources Ltd. sponsored ADR | | 189,614 | 16,684 |
| Shire PLC | | 552,000 | 32,545 |
| Wolseley PLC | | 503,038 | 31,972 |
|
| TOTAL BAILIWICK OF JERSEY | | | 174,723 |
|
| Belgium - 1.5% | | | |
| Anheuser-Busch InBev SA NV | | 425,227 | 47,953 |
| KBC Groep NV | | 1,303,959 | 94,144 |
|
| TOTAL BELGIUM | | | 142,097 |
|
| Canada - 2.0% | | | |
| Alimentation Couche-Tard, Inc. Class B (sub. vtg.) | | 725,100 | 33,348 |
| Cenovus Energy, Inc. | | 3,404,200 | 33,941 |
| Constellation Software, Inc. | | 95,200 | 43,541 |
| Franco-Nevada Corp. | | 227,700 | 15,511 |
| PrairieSky Royalty Ltd. (a) | | 1,810,573 | 39,460 |
| Suncor Energy, Inc. | | 676,200 | 21,192 |
|
| TOTAL CANADA | | | 186,993 |
|
| Cayman Islands - 2.2% | | | |
| Alibaba Group Holding Ltd. sponsored ADR (b) | | 417,200 | 48,187 |
| Ctrip.com International Ltd. ADR (b) | | 254,000 | 12,830 |
| JD.com, Inc. sponsored ADR (b) | | 1,261,000 | 44,223 |
| Melco Crown Entertainment Ltd. sponsored ADR | | 1,338,700 | 29,384 |
| New Oriental Education & Technology Group, Inc. sponsored ADR (b) | | 1,085,900 | 70,084 |
|
| TOTAL CAYMAN ISLANDS | | | 204,708 |
|
| China - 1.1% | | | |
| Kweichow Moutai Co. Ltd. (A Shares) | | 623,582 | 37,403 |
| Shanghai International Airport Co. Ltd. (A Shares) | | 5,861,900 | 29,125 |
| Wuliangye Yibin Co. Ltd. Class A | | 5,202,900 | 34,341 |
|
| TOTAL CHINA | | | 100,869 |
|
| Denmark - 1.0% | | | |
| Nets A/S (c) | | 1,621,800 | 29,499 |
| Novo Nordisk A/S Series B | | 991,645 | 38,612 |
| Novozymes A/S Series B | | 595,300 | 25,719 |
|
| TOTAL DENMARK | | | 93,830 |
|
| Finland - 0.5% | | | |
| Sampo Oyj (A Shares) (a) | | 934,600 | 44,784 |
| France - 8.6% | | | |
| ALTEN | | 336,259 | 28,497 |
| Altran Technologies SA | | 1,492,300 | 25,050 |
| Amundi SA | | 967,958 | 63,686 |
| Atos Origin SA | | 181,865 | 23,832 |
| AXA SA | | 1,278,800 | 34,119 |
| BNP Paribas SA | | 778,100 | 54,907 |
| Capgemini SA | | 395,600 | 39,608 |
| Cegedim SA (b) | | 536,390 | 14,923 |
| Havas SA | | 4,515,981 | 41,760 |
| Kaufman & Broad SA | | 235,300 | 9,227 |
| Maisons du Monde SA | | 1,122,200 | 38,946 |
| Rexel SA | | 1,540,100 | 27,513 |
| Rubis | | 373,700 | 37,972 |
| Societe Generale Series A | | 814,400 | 44,656 |
| Sodexo SA | | 388,500 | 49,387 |
| Total SA (a) | | 3,804,504 | 195,290 |
| VINCI SA (a) | | 961,800 | 81,982 |
|
| TOTAL FRANCE | | | 811,355 |
|
| Germany - 5.7% | | | |
| adidas AG | | 252,900 | 50,662 |
| Aumann AG | | 68,000 | 4,472 |
| Axel Springer Verlag AG | | 604,902 | 33,941 |
| Deutsche Borse AG | | 164,581 | 16,108 |
| Deutsche Post AG | | 1,743,413 | 62,665 |
| Deutsche Telekom AG | | 1,845,500 | 32,372 |
| Fresenius SE & Co. KGaA | | 440,400 | 35,697 |
| Henkel AG & Co. KGaA | | 342,700 | 39,999 |
| Nexus AG | | 614,500 | 14,793 |
| Rational AG | | 92,205 | 46,332 |
| SAP AG | | 1,627,467 | 163,017 |
| Wirecard AG (a) | | 594,600 | 35,112 |
|
| TOTAL GERMANY | | | 535,170 |
|
| Hong Kong - 1.1% | | | |
| AIA Group Ltd. | | 9,308,600 | 64,444 |
| Techtronic Industries Co. Ltd. | | 10,282,000 | 44,151 |
|
| TOTAL HONG KONG | | | 108,595 |
|
| India - 2.9% | | | |
| Avenue Supermarts Ltd. | | 595,148 | 6,818 |
| Bharti Infratel Ltd. | | 10,548,301 | 58,197 |
| HDFC Bank Ltd. | | 1,034,409 | 25,252 |
| HDFC Bank Ltd. sponsored ADR | | 965,784 | 76,886 |
| Housing Development Finance Corp. Ltd. | | 4,692,201 | 112,189 |
|
| TOTAL INDIA | | | 279,342 |
|
| Indonesia - 0.6% | | | |
| PT Bank Central Asia Tbk | | 16,688,600 | 22,224 |
| PT Bank Rakyat Indonesia Tbk | | 32,624,300 | 31,574 |
|
| TOTAL INDONESIA | | | 53,798 |
|
| Ireland - 2.7% | | | |
| Cairn Homes PLC (b) | | 17,549,270 | 29,917 |
| CRH PLC | | 2,144,300 | 78,104 |
| DCC PLC (United Kingdom) | | 244,251 | 22,556 |
| Green REIT PLC | | 9,492,200 | 14,114 |
| James Hardie Industries PLC CDI | | 1,790,532 | 30,395 |
| Kerry Group PLC Class A | | 574,300 | 46,931 |
| Ryanair Holdings PLC sponsored ADR (b) | | 319,377 | 29,360 |
|
| TOTAL IRELAND | | | 251,377 |
|
| Isle of Man - 0.7% | | | |
| Paysafe Group PLC (b) | | 10,565,025 | 62,111 |
| Israel - 0.6% | | | |
| Frutarom Industries Ltd. | | 893,500 | 52,523 |
| Italy - 0.6% | | | |
| De Longhi SpA | | 734,500 | 22,403 |
| Intesa Sanpaolo SpA | | 12,757,000 | 37,239 |
|
| TOTAL ITALY | | | 59,642 |
|
| Japan - 17.1% | | | |
| ACOM Co. Ltd. (b) | | 2,209,000 | 9,809 |
| Aozora Bank Ltd. | | 8,893,000 | 32,389 |
| Daito Trust Construction Co. Ltd. | | 246,600 | 36,279 |
| Dentsu, Inc. | | 1,086,800 | 61,225 |
| Hoya Corp. | | 1,473,700 | 70,383 |
| KDDI Corp. | | 3,926,700 | 104,113 |
| Keyence Corp. | | 197,720 | 79,460 |
| Komatsu Ltd. | | 1,614,100 | 43,131 |
| Misumi Group, Inc. | | 2,754,800 | 52,168 |
| Mitsubishi UFJ Financial Group, Inc. | | 13,391,800 | 84,858 |
| Monex Group, Inc. | | 12,015,949 | 30,074 |
| Morinaga & Co. Ltd. | | 578,200 | 27,335 |
| Nidec Corp. | | 324,300 | 29,732 |
| Nintendo Co. Ltd. | | 122,200 | 30,925 |
| Nitori Holdings Co. Ltd. | | 382,300 | 49,762 |
| Olympus Corp. | | 2,085,300 | 80,251 |
| OMRON Corp. | | 920,100 | 38,504 |
| ORIX Corp. | | 7,007,900 | 106,934 |
| Panasonic Corp. | | 4,045,000 | 48,371 |
| Recruit Holdings Co. Ltd. | | 1,435,300 | 72,489 |
| Relo Holdings Corp. | | 1,784,000 | 29,287 |
| Shionogi & Co. Ltd. | | 617,700 | 31,767 |
| SMC Corp. | | 139,300 | 39,225 |
| SMS Co., Ltd. | | 1,148,500 | 30,568 |
| SoftBank Corp. | | 820,400 | 62,230 |
| Sony Corp. | | 2,984,900 | 102,425 |
| Start Today Co. Ltd. | | 2,494,700 | 53,262 |
| Sundrug Co. Ltd. | | 1,146,800 | 40,224 |
| Tsuruha Holdings, Inc. | | 557,800 | 56,543 |
| VT Holdings Co. Ltd. | | 3,872,500 | 19,697 |
| Welcia Holdings Co. Ltd. | | 1,934,800 | 62,309 |
|
| TOTAL JAPAN | | | 1,615,729 |
|
| Luxembourg - 0.7% | | | |
| Eurofins Scientific SA | | 144,039 | 70,935 |
| Marshall Islands - 0.2% | | | |
| Hoegh LNG Partners LP | | 715,655 | 14,492 |
| Netherlands - 5.7% | | | |
| ASML Holding NV (Netherlands) | | 632,000 | 83,542 |
| Basic-Fit NV | | 579,100 | 10,125 |
| IMCD Group BV | | 1,603,400 | 86,369 |
| ING Groep NV (Certificaten Van Aandelen) | | 4,886,500 | 79,648 |
| Intertrust NV | | 1,544,800 | 30,963 |
| Koninklijke Philips Electronics NV | | 3,314,100 | 114,444 |
| Takeaway.com Holding BV (c) | | 378,700 | 12,755 |
| Unilever NV (Certificaten Van Aandelen) (Bearer) | | 2,238,000 | 117,239 |
| Van Lanschot NV (Bearer) | | 223,700 | 6,080 |
|
| TOTAL NETHERLANDS | | | 541,165 |
|
| New Zealand - 0.8% | | | |
| EBOS Group Ltd. | | 3,154,998 | 39,664 |
| Ryman Healthcare Group Ltd. | | 6,562,126 | 38,883 |
|
| TOTAL NEW ZEALAND | | | 78,547 |
|
| Norway - 1.7% | | | |
| Schibsted ASA (A Shares) | | 1,355,900 | 33,716 |
| Statoil ASA (a) | | 7,690,694 | 126,657 |
|
| TOTAL NORWAY | | | 160,373 |
|
| Philippines - 0.3% | | | |
| SM Investments Corp. | | 2,042,375 | 29,647 |
| Romania - 0.3% | | | |
| Banca Transilvania SA | | 37,524,532 | 24,852 |
| South Africa - 1.7% | | | |
| Aspen Pharmacare Holdings Ltd. | | 656,700 | 13,623 |
| EOH Holdings Ltd. | | 3,062,767 | 32,418 |
| Naspers Ltd. Class N | | 598,300 | 113,768 |
|
| TOTAL SOUTH AFRICA | | | 159,809 |
|
| Spain - 4.1% | | | |
| Amadeus IT Holding SA Class A | | 811,000 | 43,729 |
| Atresmedia Corporacion de Medios de Comunicacion SA | | 1,719,200 | 21,593 |
| CaixaBank SA | | 18,486,033 | 83,935 |
| Grifols SA ADR | | 2,404,158 | 52,194 |
| Hispania Activos Inmobiliarios SA | | 1,424,325 | 21,504 |
| Inditex SA | | 1,924,054 | 73,796 |
| Mediaset Espana Comunicacion SA | | 2,836,600 | 39,103 |
| Neinor Homes SLU | | 1,128,700 | 22,260 |
| Prosegur Cash SA | | 12,570,400 | 32,041 |
|
| TOTAL SPAIN | | | 390,155 |
|
| Sweden - 4.2% | | | |
| ASSA ABLOY AB (B Shares) (a) | | 3,095,800 | 67,073 |
| Com Hem Holding AB | | 847,200 | 10,550 |
| HEXPOL AB (B Shares) | | 1,872,700 | 20,815 |
| Indutrade AB | | 1,342,200 | 31,716 |
| Nordea Bank AB | | 4,510,400 | 55,506 |
| Saab AB (B Shares) | | 979,400 | 48,565 |
| Sandvik AB (a) | | 2,729,900 | 43,827 |
| Svenska Cellulosa AB (SCA) (B Shares) | | 2,683,200 | 88,882 |
| Svenska Handelsbanken AB (A Shares) | | 2,492,700 | 35,376 |
|
| TOTAL SWEDEN | | | 402,310 |
|
| Switzerland - 5.8% | | | |
| ABB Ltd. (Reg.) | | 3,714,650 | 91,025 |
| Credit Suisse Group AG | | 2,880,071 | 43,924 |
| Forbo Holding AG (Reg.) | | 13,976 | 22,909 |
| Julius Baer Group Ltd. | | 873,100 | 45,529 |
| Kaba Holding AG (B Shares) (Reg.) | | 41,400 | 35,471 |
| Nestle SA (Reg. S) | | 825,949 | 63,615 |
| Panalpina Welttransport Holding AG (a) | | 286,330 | 37,899 |
| Partners Group Holding AG | | 108,566 | 65,631 |
| Schindler Holding AG (participation certificate) | | 170,348 | 34,806 |
| Syngenta AG (b) | | 120,996 | 56,096 |
| UBS Group AG | | 3,195,750 | 54,601 |
|
| TOTAL SWITZERLAND | | | 551,506 |
|
| Taiwan - 0.9% | | | |
| Largan Precision Co. Ltd. | | 303,000 | 50,278 |
| Taiwan Semiconductor Manufacturing Co. Ltd. | | 5,895,000 | 37,910 |
|
| TOTAL TAIWAN | | | 88,188 |
|
| United Kingdom - 15.4% | | | |
| Aggreko PLC | | 2,825,800 | 32,482 |
| Ascential PLC | | 2,492,536 | 11,390 |
| BAE Systems PLC | | 4,026,900 | 32,706 |
| Barclays PLC | | 13,597,151 | 37,235 |
| BCA Marketplace PLC | | 7,762,300 | 19,756 |
| BHP Billiton PLC | | 4,323,364 | 65,911 |
| Booker Group PLC | | 18,014,400 | 45,265 |
| British American Tobacco PLC: | | | |
| (United Kingdom) | | 1,184,800 | 80,049 |
| sponsored ADR (a) | | 423,000 | 28,781 |
| Bunzl PLC | | 1,636,000 | 51,024 |
| Cineworld Group PLC | | 2,055,200 | 18,740 |
| CMC Markets PLC | | 12,077,600 | 19,632 |
| Compass Group PLC | | 1,891,700 | 38,195 |
| Countryside Properties PLC | | 3,312,793 | 11,576 |
| Dialog Semiconductor PLC (b) | | 585,500 | 27,393 |
| Diploma PLC | | 2,312,600 | 33,218 |
| GlaxoSmithKline PLC | | 3,518,200 | 70,814 |
| Imperial Tobacco Group PLC | | 852,167 | 41,743 |
| Jiangsu Yanghe Brewery JSC Ltd. ELS (HSBC Warrant Program) warrants 9/19/19 (b)(c) | | 2,466,200 | 28,621 |
| John Wood Group PLC | | 2,221,100 | 21,849 |
| LivaNova PLC (b) | | 607,800 | 32,031 |
| London Stock Exchange Group PLC | | 1,262,636 | 55,324 |
| Melrose Industries PLC | | 31,513,724 | 96,531 |
| Micro Focus International PLC | | 3,845,400 | 128,897 |
| Moneysupermarket.com Group PLC | | 5,210,600 | 23,344 |
| NCC Group Ltd. (a) | | 9,151,300 | 16,890 |
| Reckitt Benckiser Group PLC | | 757,300 | 69,776 |
| Rex Bionics PLC (b)(d) | | 1,297,286 | 109 |
| Rio Tinto PLC | | 1,828,100 | 72,119 |
| Senior Engineering Group PLC | | 7,132,100 | 19,805 |
| Softcat PLC | | 4,924,700 | 26,279 |
| Spirax-Sarco Engineering PLC | | 522,100 | 35,164 |
| St. James's Place Capital PLC | | 2,354,900 | 35,015 |
| Standard Chartered PLC (United Kingdom) (b) | | 9,090,621 | 84,915 |
| Zpg PLC | | 8,904,609 | 42,673 |
|
| TOTAL UNITED KINGDOM | | | 1,455,252 |
|
| United States of America - 1.7% | | | |
| Alexion Pharmaceuticals, Inc. (b) | | 280,000 | 35,778 |
| Global Payments, Inc. | | 434,200 | 35,500 |
| Monsanto Co. | | 287,400 | 33,514 |
| MSCI, Inc. | | 503,900 | 50,551 |
| Visa, Inc. Class A | | 102,100 | 9,314 |
|
| TOTAL UNITED STATES OF AMERICA | | | 164,657 |
|
| TOTAL COMMON STOCKS | | | |
| (Cost $7,564,119) | | | 9,219,835 |
|
| Convertible Preferred Stocks - 0.3% | | | |
| Cayman Islands - 0.3% | | | |
| China Internet Plus Holdings Ltd. Series A-11 (b)(e) | | | |
| (Cost $18,833) | | 5,958,244 | 28,540 |
| | | Principal Amount (000s) | Value (000s) |
|
| Government Obligations - 0.0% | | | |
| United States of America - 0.0% | | | |
| U.S. Treasury Bills, yield at date of purchase 0.67% to 0.76% 6/1/17 to 6/22/17(f) | | | |
| (Cost $1,809) | | 1,810 | 1,809 |
| | | Shares | Value (000s) |
|
| Money Market Funds - 3.4% | | | |
| Fidelity Cash Central Fund, 0.85% (g) | | 116,041,297 | 116,065 |
| Fidelity Securities Lending Cash Central Fund 0.86% (g)(h) | | 210,503,210 | 210,524 |
| TOTAL MONEY MARKET FUNDS | | | |
| (Cost $326,594) | | | 326,589 |
| TOTAL INVESTMENT PORTFOLIO - 101.2% | | | |
| (Cost $7,911,355) | | | 9,576,773 |
| NET OTHER ASSETS (LIABILITIES) - (1.2)% | | | (116,324) |
| NET ASSETS - 100% | | | $9,460,449 |
| Futures Contracts | | | |
| | Expiration Date | Underlying Face Amount at Value (000s) | Unrealized Appreciation/(Depreciation) (000s) |
| Purchased | | | |
| Equity Index Contracts | | | |
| 335 TSE TOPIX Index Contracts (Japan) | June 2017 | 45,979 | $(332) |
The face value of futures purchased as a percentage of Net Assets is .5%
Security Type Abbreviations
ELS - Equity-Linked Security –
Categorizations in the Schedule of Investments are based on country or territory of incorporation.
Legend
(a) Security or a portion of the security is on loan at period end.
(b) Non-income producing
(c) Security exempt from registration under Rule 144A of the Securities Act of 1933. These securities may be resold in transactions exempt from registration, normally to qualified institutional buyers. At the end of the period, the value of these securities amounted to $70,875,000 or 0.7% of net assets.
(d) Affiliated company
(e) Restricted securities - Investment in securities not registered under the Securities Act of 1933 (excluding 144A issues). At the end of the period, the value of restricted securities (excluding 144A issues) amounted to $28,540,000 or 0.3% of net assets.
(f) Security or a portion of the security was pledged to cover margin requirements for futures contracts. At period end, the value of securities pledged amounted to $1,809,000.
(g) Affiliated fund that is generally available only to investment companies and other accounts managed by Fidelity Investments. The rate quoted is the annualized seven-day yield of the fund at period end. A complete unaudited listing of the fund's holdings as of its most recent quarter end is available upon request. In addition, each Fidelity Central Fund's financial statements are available on the SEC's website or upon request.
(h) Investment made with cash collateral received from securities on loan.
Additional information on each restricted holding is as follows:
| Security | Acquisition Date | Acquisition Cost (000s) |
| China Internet Plus Holdings Ltd. Series A-11 | 1/26/15 | $18,833 |
Affiliated Central Funds
Information regarding fiscal year to date income earned by the Fund from investments in Fidelity Central Funds is as follows:
| Fund | Income earned |
| | (Amounts in thousands) |
| Fidelity Cash Central Fund | $474 |
| Fidelity Securities Lending Cash Central Fund | 2,019 |
| Total | $2,493 |
Other Affiliated Issuers
An affiliated company is a company in which the Fund has ownership of at least 5% of the voting securities. Fiscal year to date transactions with companies which are or were affiliates are as follows:
| Affiliate (Amounts in thousands) | Value, beginning of period | Purchases | Sales Proceeds | Dividend Income | Value, end of period |
| Hoegh LNG Partners LP | $12,739 | $-- | $-- | $590 | $-- |
| Rex Bionics PLC | 357 | -- | -- | -- | 109 |
| Total | $13,096 | $-- | $-- | $590 | $109 |
Investment Valuation
The following is a summary of the inputs used, as of April 30, 2017, involving the Fund's assets and liabilities carried at fair value. The inputs or methodology used for valuing securities may not be an indication of the risk associated with investing in those securities. For more information on valuation inputs, and their aggregation into the levels used below, please refer to the Investment Valuation section in the accompanying Notes to Financial Statements.
| | Valuation Inputs at Reporting Date: |
| Description | Total | Level 1 | Level 2 | Level 3 |
| (Amounts in thousands) | | | | |
| Investments in Securities: | | | | |
| Equities: | | | | |
| Consumer Discretionary | $1,330,472 | $999,173 | $302,759 | $28,540 |
| Consumer Staples | 961,736 | 583,104 | 378,632 | -- |
| Energy | 452,881 | 130,934 | 321,947 | -- |
| Financials | 1,953,013 | 1,407,997 | 545,016 | -- |
| Health Care | 727,129 | 585,049 | 142,080 | -- |
| Industrials | 1,552,331 | 1,094,406 | 457,925 | -- |
| Information Technology | 1,245,713 | 974,253 | 271,460 | -- |
| Materials | 583,034 | 366,900 | 216,134 | -- |
| Real Estate | 101,184 | 101,184 | -- | -- |
| Telecommunication Services | 267,462 | 68,747 | 198,715 | -- |
| Utilities | 73,420 | 73,420 | -- | -- |
| Government Obligations | 1,809 | -- | 1,809 | -- |
| Money Market Funds | 326,589 | 326,589 | -- | -- |
| Total Investments in Securities: | $9,576,773 | $6,711,756 | $2,836,477 | $28,540 |
| Derivative Instruments: | | | | |
| Liabilities | | | | |
| Futures Contracts | $(332) | $(332) | $-- | $-- |
| Total Liabilities | $(332) | $(332) | $-- | $-- |
| Total Derivative Instruments: | $(332) | $(332) | $-- | $-- |
The following is a summary of transfers between Level 1 and Level 2 for the period ended April 30, 2017. Transfers are assumed to have occurred at the beginning of the period, and are primarily attributable to the valuation techniques used for foreign equity securities, as discussed in the accompanying Notes to Financial Statements:
| Transfers | Total (000s) |
| (Amounts in thousands) | |
| Level 1 to Level 2 | $613,313 |
| Level 2 to Level 1 | $186,375 |
Value of Derivative Instruments
The following table is a summary of the Fund's value of derivative instruments by primary risk exposure as of April 30, 2017. For additional information on derivative instruments, please refer to the Derivative Instruments section in the accompanying Notes to Financial Statements.
| Primary Risk Exposure / Derivative Type | Value |
| | Asset | Liability |
| (Amounts in thousands) | | |
| Equity Risk | | |
| Futures Contracts(a) | $0 | $(332) |
| Total Equity Risk | 0 | (332) |
| Total Value of Derivatives | $0 | $(332) |
(a) Reflects gross cumulative appreciation (depreciation) on futures contracts as presented in the Schedule of Investments. In the Statement of Assets and Liabilities, the period end daily variation margin is included in receivable or payable for daily variation margin for derivative instruments, and the net cumulative appreciation (depreciation) is included in net unrealized appreciation (depreciation).
See accompanying notes which are an integral part of the financial statements.
Financial Statements
Statement of Assets and Liabilities
| Amounts in thousands (except per-share amounts) | | April 30, 2017 (Unaudited) |
| Assets | | |
Investment in securities, at value (including securities loaned of $198,644) — See accompanying schedule:
Unaffiliated issuers (cost $7,580,820) | $9,250,075 | |
| Fidelity Central Funds (cost $326,594) | 326,589 | |
| Other affiliated issuers (cost $3,941) | 109 | |
| Total Investments (cost $7,911,355) | | $9,576,773 |
| Cash | | 1,328 |
| Foreign currency held at value (cost $139) | | 138 |
| Receivable for investments sold | | 68,391 |
| Receivable for fund shares sold | | 4,781 |
| Dividends receivable | | 39,247 |
| Distributions receivable from Fidelity Central Funds | | 566 |
| Prepaid expenses | | 6 |
| Other receivables | | 4,862 |
| Total assets | | 9,696,092 |
| Liabilities | | |
| Payable for investments purchased | $10,134 | |
| Payable for fund shares redeemed | 6,723 | |
| Accrued management fee | 5,911 | |
| Distribution and service plan fees payable | 81 | |
| Payable for daily variation margin for derivative instruments | 301 | |
| Other affiliated payables | 1,304 | |
| Other payables and accrued expenses | 636 | |
| Collateral on securities loaned | 210,553 | |
| Total liabilities | | 235,643 |
| Net Assets | | $9,460,449 |
| Net Assets consist of: | | |
| Paid in capital | | $7,982,465 |
| Undistributed net investment income | | 39,560 |
| Accumulated undistributed net realized gain (loss) on investments and foreign currency transactions | | (224,753) |
| Net unrealized appreciation (depreciation) on investments and assets and liabilities in foreign currencies | | 1,663,177 |
| Net Assets | | $9,460,449 |
| Calculation of Maximum Offering Price | | |
| Class A: | | |
| Net Asset Value and redemption price per share ($231,623 ÷ 5,643.7 shares) | | $41.04 |
| Maximum offering price per share (100/94.25 of $41.04) | | $43.54 |
| Class M: | | |
| Net Asset Value and redemption price per share ($32,697 ÷ 801.0 shares) | | $40.82 |
| Maximum offering price per share (100/96.50 of $40.82) | | $42.30 |
| Class C: | | |
| Net Asset Value and offering price per share ($25,453 ÷ 627.5 shares)(a) | | $40.56 |
| International Discovery: | | |
| Net Asset Value, offering price and redemption price per share ($6,578,139 ÷ 159,270.9 shares) | | $41.30 |
| Class K: | | |
| Net Asset Value, offering price and redemption price per share ($1,916,593 ÷ 46,511.3 shares) | | $41.21 |
| Class I: | | |
| Net Asset Value, offering price and redemption price per share ($593,899 ÷ 14,413.6 shares) | | $41.20 |
| Class Z: | | |
| Net Asset Value, offering price and redemption price per share ($82,045 ÷ 1,992.4 shares) | | $41.18 |
(a) Redemption price per share is equal to net asset value less any applicable contingent deferred sales charge.
See accompanying notes which are an integral part of the financial statements.
Statement of Operations
| Amounts in thousands | | Six months ended April 30, 2017 (Unaudited) |
| Investment Income | | |
| Dividends (including $590 earned from other affiliated issuers) | | $92,257 |
| Interest | | 7 |
| Income from Fidelity Central Funds | | 2,493 |
| Income before foreign taxes withheld | | 94,757 |
| Less foreign taxes withheld | | (8,456) |
| Total income | | 86,301 |
| Expenses | | |
| Management fee | | |
| Basic fee | $30,315 | |
| Performance adjustment | 94 | |
| Transfer agent fees | 6,986 | |
| Distribution and service plan fees | 488 | |
| Accounting and security lending fees | 877 | |
| Custodian fees and expenses | 645 | |
| Independent trustees' fees and expenses | 19 | |
| Registration fees | 131 | |
| Audit | 66 | |
| Legal | 36 | |
| Miscellaneous | 36 | |
| Total expenses before reductions | 39,693 | |
| Expense reductions | (1,074) | 38,619 |
| Net investment income (loss) | | 47,682 |
| Realized and Unrealized Gain (Loss) | | |
| Net realized gain (loss) on: | | |
| Investment securities: | | |
| Unaffiliated issuers | 405,105 | |
| Fidelity Central Funds | (17) | |
| Foreign currency transactions | (3,861) | |
| Futures contracts | 13,067 | |
| Total net realized gain (loss) | | 414,294 |
Change in net unrealized appreciation (depreciation) on:
Investment securities | 480,137 | |
| Assets and liabilities in foreign currencies | 746 | |
| Futures contracts | (4,118) | |
| Total change in net unrealized appreciation (depreciation) | | 476,765 |
| Net gain (loss) | | 891,059 |
| Net increase (decrease) in net assets resulting from operations | | $938,741 |
See accompanying notes which are an integral part of the financial statements.
Statement of Changes in Net Assets
| Amounts in thousands | Six months ended April 30, 2017 (Unaudited) | Year ended October 31, 2016 |
| Increase (Decrease) in Net Assets | | |
| Operations | | |
| Net investment income (loss) | $47,682 | $162,246 |
| Net realized gain (loss) | 414,294 | (541,847) |
| Change in net unrealized appreciation (depreciation) | 476,765 | (131,024) |
| Net increase (decrease) in net assets resulting from operations | 938,741 | (510,625) |
| Distributions to shareholders from net investment income | (150,174) | (113,434) |
| Distributions to shareholders from net realized gain | (11,939) | (1,362) |
| Total distributions | (162,113) | (114,796) |
| Share transactions - net increase (decrease) | (697,736) | (960,274) |
| Redemption fees | 9 | 70 |
| Total increase (decrease) in net assets | 78,901 | (1,585,625) |
| Net Assets | | |
| Beginning of period | 9,381,548 | 10,967,173 |
| End of period | $9,460,449 | $9,381,548 |
| Other Information | | |
| Undistributed net investment income end of period | $39,560 | $142,052 |
See accompanying notes which are an integral part of the financial statements.
Financial Highlights — Fidelity International Discovery Fund Class A
| | Six months ended (Unaudited) April 30, | Years ended October 31, | | | | |
| | 2017 | 2016 | 2015 | 2014 | 2013 | 2012 |
| Selected Per–Share Data | | | | | | |
| Net asset value, beginning of period | $37.60 | $39.78 | $38.70 | $39.49 | $31.66 | $29.43 |
| Income from Investment Operations | | | | | | |
| Net investment income (loss)A | .13 | .47B | .40C | .53D | .34 | .41 |
| Net realized and unrealized gain (loss) | 3.83 | (2.38) | .79 | (.67) | 7.97 | 2.11 |
| Total from investment operations | 3.96 | (1.91) | 1.19 | (.14) | 8.31 | 2.52 |
| Distributions from net investment income | (.47) | (.27) | (.11) | (.33) | (.45) | (.29) |
| Distributions from net realized gain | (.05) | (.01) | – | (.31) | (.03) | – |
| Total distributions | (.52) | (.27)E | (.11) | (.65)F | (.48) | (.29) |
| Redemption fees added to paid in capitalA,G | – | – | – | – | – | – |
| Net asset value, end of period | $41.04 | $37.60 | $39.78 | $38.70 | $39.49 | $31.66 |
| Total ReturnH,I,J | 10.71% | (4.83)% | 3.09% | (.36)% | 26.59% | 8.70% |
| Ratios to Average Net AssetsK,L | | | | | | |
| Expenses before reductions | 1.24%M | 1.35% | 1.33% | 1.28% | 1.35% | 1.34% |
| Expenses net of fee waivers, if any | 1.24%M | 1.35% | 1.33% | 1.28% | 1.35% | 1.34% |
| Expenses net of all reductions | 1.22%M | 1.34% | 1.32% | 1.28% | 1.33% | 1.31% |
| Net investment income (loss) | .69%M | 1.26%B | 1.00%C | 1.35%D | .97% | 1.41% |
| Supplemental Data | | | | | | |
| Net assets, end of period (in millions) | $232 | $236 | $283 | $297 | $347 | $299 |
| Portfolio turnover rateN | 43%M | 50%O | 60%O | 57% | 65% | 68% |
A Calculated based on average shares outstanding during the period.
B Net Investment income per share reflects a large, non-recurring dividend which amounted to $.14 per share. Excluding this non-recurring dividend, the ratio of net investment income (loss) to average net assets would have been .88%.
C Net Investment income per share reflects a large, non-recurring dividend which amounted to $.12 per share. Excluding this non-recurring dividend, the ratio of net investment income (loss) to average net assets would have been .69%.
D Net Investment income per share reflects a large, non-recurring dividend which amounted to $.22 per share. Excluding this non-recurring dividend, the ratio of net investment income (loss) to average net assets would have been .80%.
E Total distributions of $.27 per share is comprised of distributions from net investment income of $.269 and distributions from net realized gain of $.005 per share.
F Total distributions of $.65 per share is comprised of distributions from net investment income of $.334 and distributions from net realized gain of $.311 per share.
G Amount represents less than $.005 per share.
H Total returns for periods of less than one year are not annualized.
I Total returns would have been lower if certain expenses had not been reduced during the applicable periods shown.
J Total returns do not include the effect of the sales charges.
K Fees and expenses of any underlying Fidelity Central Funds are not included in the Fund's expense ratio. The Fund indirectly bears its proportionate share of the expenses of any underlying Fidelity Central Funds.
L Expense ratios reflect operating expenses of the class. Expenses before reductions do not reflect amounts reimbursed by the investment adviser or reductions from brokerage service arrangements or reductions from other expense offset arrangements and do not represent the amount paid by the class during periods when reimbursements or reductions occur. Expenses net of fee waivers reflect expenses after reimbursement by the investment adviser but prior to reductions from brokerage service arrangements or other expense offset arrangements. Expenses net of all reductions represent the net expenses paid by the class.
M Annualized
N Amount does not include the portfolio activity of any underlying Fidelity Central Funds.
O Portfolio turnover rate excludes securities received or delivered in-kind.
See accompanying notes which are an integral part of the financial statements.
Financial Highlights — Fidelity International Discovery Fund Class M
| | Six months ended (Unaudited) April 30, | Years ended October 31, | | | | |
| | 2017 | 2016 | 2015 | 2014 | 2013 | 2012 |
| Selected Per–Share Data | | | | | | |
| Net asset value, beginning of period | $37.34 | $39.51 | $38.43 | $39.23 | $31.42 | $29.18 |
| Income from Investment Operations | | | | | | |
| Net investment income (loss)A | .09 | .38B | .30C | .44D | .26 | .34 |
| Net realized and unrealized gain (loss) | 3.81 | (2.37) | .80 | (.68) | 7.92 | 2.09 |
| Total from investment operations | 3.90 | (1.99) | 1.10 | (.24) | 8.18 | 2.43 |
| Distributions from net investment income | (.37) | (.17) | (.02) | (.25) | (.34) | (.19) |
| Distributions from net realized gain | (.05) | (.01) | – | (.31) | (.03) | – |
| Total distributions | (.42) | (.18) | (.02) | (.56) | (.37) | (.19) |
| Redemption fees added to paid in capitalA,E | – | – | – | – | – | – |
| Net asset value, end of period | $40.82 | $37.34 | $39.51 | $38.43 | $39.23 | $31.42 |
| Total ReturnF,G,H | 10.58% | (5.07)% | 2.86% | (.60)% | 26.31% | 8.41% |
| Ratios to Average Net AssetsI,J | | | | | | |
| Expenses before reductions | 1.48%K | 1.58% | 1.57% | 1.51% | 1.59% | 1.59% |
| Expenses net of fee waivers, if any | 1.48%K | 1.58% | 1.57% | 1.51% | 1.59% | 1.59% |
| Expenses net of all reductions | 1.46%K | 1.57% | 1.56% | 1.51% | 1.57% | 1.56% |
| Net investment income (loss) | .45%K | 1.02%B | .76%C | 1.11%D | .73% | 1.16% |
| Supplemental Data | | | | | | |
| Net assets, end of period (in millions) | $33 | $35 | $43 | $49 | $53 | $46 |
| Portfolio turnover rateL | 43%K | 50%M | 60%M | 57% | 65% | 68% |
A Calculated based on average shares outstanding during the period.
B Net Investment income per share reflects a large, non-recurring dividend which amounted to $.14 per share. Excluding this non-recurring dividend, the ratio of net investment income (loss) to average net assets would have been .64%.
C Net Investment income per share reflects a large, non-recurring dividend which amounted to $.12 per share. Excluding this non-recurring dividend, the ratio of net investment income (loss) to average net assets would have been .45%.
D Net Investment income per share reflects a large, non-recurring dividend which amounted to $.21 per share. Excluding this non-recurring dividend, the ratio of net investment income (loss) to average net assets would have been .56%.
E Amount represents less than $.005 per share.
F Total returns for periods of less than one year are not annualized.
G Total returns would have been lower if certain expenses had not been reduced during the applicable periods shown.
H Total returns do not include the effect of the sales charges.
I Fees and expenses of any underlying Fidelity Central Funds are not included in the Fund's expense ratio. The Fund indirectly bears its proportionate share of the expenses of any underlying Fidelity Central Funds.
J Expense ratios reflect operating expenses of the class. Expenses before reductions do not reflect amounts reimbursed by the investment adviser or reductions from brokerage service arrangements or reductions from other expense offset arrangements and do not represent the amount paid by the class during periods when reimbursements or reductions occur. Expenses net of fee waivers reflect expenses after reimbursement by the investment adviser but prior to reductions from brokerage service arrangements or other expense offset arrangements. Expenses net of all reductions represent the net expenses paid by the class.
K Annualized
L Amount does not include the portfolio activity of any underlying Fidelity Central Funds.
M Portfolio turnover rate excludes securities received or delivered in-kind.
See accompanying notes which are an integral part of the financial statements.
Financial Highlights — Fidelity International Discovery Fund Class C
| | Six months ended (Unaudited) April 30, | Years ended October 31, | | | | |
| | 2017 | 2016 | 2015 | 2014 | 2013 | 2012 |
| Selected Per–Share Data | | | | | | |
| Net asset value, beginning of period | $36.96 | $39.14 | $38.25 | $39.07 | $31.32 | $29.08 |
| Income from Investment Operations | | | | | | |
| Net investment income (loss)A | (.01) | .19B | .10C | .23D | .08 | .19 |
| Net realized and unrealized gain (loss) | 3.79 | (2.37) | .79 | (.66) | 7.90 | 2.09 |
| Total from investment operations | 3.78 | (2.18) | .89 | (.43) | 7.98 | 2.28 |
| Distributions from net investment income | (.13) | – | – | (.08) | (.20) | (.04) |
| Distributions from net realized gain | (.05) | – | – | (.31) | (.03) | – |
| Total distributions | (.18) | – | – | (.39) | (.23) | (.04) |
| Redemption fees added to paid in capitalA,E | – | – | – | – | – | – |
| Net asset value, end of period | $40.56 | $36.96 | $39.14 | $38.25 | $39.07 | $31.32 |
| Total ReturnF,G,H | 10.30% | (5.57)% | 2.33% | (1.10)% | 25.65% | 7.86% |
| Ratios to Average Net AssetsI,J | | | | | | |
| Expenses before reductions | 2.00%K | 2.10% | 2.09% | 2.03% | 2.10% | 2.09% |
| Expenses net of fee waivers, if any | 2.00%K | 2.10% | 2.09% | 2.03% | 2.09% | 2.09% |
| Expenses net of all reductions | 1.98%K | 2.09% | 2.08% | 2.02% | 2.07% | 2.06% |
| Net investment income (loss) | (.07)%K | .50%B | .24%C | .60%D | .23% | .66% |
| Supplemental Data | | | | | | |
| Net assets, end of period (in millions) | $25 | $26 | $32 | $35 | $36 | $30 |
| Portfolio turnover rateL | 43%K | 50%M | 60%M | 57% | 65% | 68% |
A Calculated based on average shares outstanding during the period.
B Net Investment income per share reflects a large, non-recurring dividend which amounted to $.14 per share. Excluding this non-recurring dividend, the ratio of net investment income (loss) to average net assets would have been .13%.
C Net Investment income per share reflects a large, non-recurring dividend which amounted to $.12 per share. Excluding this non-recurring dividend, the ratio of net investment income (loss) to average net assets would have been (.06) %.
D Net Investment income per share reflects a large, non-recurring dividend which amounted to $.21 per share. Excluding this non-recurring dividend, the ratio of net investment income (loss) to average net assets would have been .05%.
E Amount represents less than $.005 per share.
F Total returns for periods of less than one year are not annualized.
G Total returns would have been lower if certain expenses had not been reduced during the applicable periods shown.
H Total returns do not include the effect of the contingent deferred sales charge.
I Fees and expenses of any underlying Fidelity Central Funds are not included in the Fund's expense ratio. The Fund indirectly bears its proportionate share of the expenses of any underlying Fidelity Central Funds.
J Expense ratios reflect operating expenses of the class. Expenses before reductions do not reflect amounts reimbursed by the investment adviser or reductions from brokerage service arrangements or reductions from other expense offset arrangements and do not represent the amount paid by the class during periods when reimbursements or reductions occur. Expenses net of fee waivers reflect expenses after reimbursement by the investment adviser but prior to reductions from brokerage service arrangements or other expense offset arrangements. Expenses net of all reductions represent the net expenses paid by the class.
K Annualized
L Amount does not include the portfolio activity of any underlying Fidelity Central Funds.
M Portfolio turnover rate excludes securities received or delivered in-kind.
See accompanying notes which are an integral part of the financial statements.
Financial Highlights — Fidelity International Discovery Fund
| | Six months ended (Unaudited) April 30, | Years ended October 31, | | | | |
| | 2017 | 2016 | 2015 | 2014 | 2013 | 2012 |
| Selected Per–Share Data | | | | | | |
| Net asset value, beginning of period | $37.91 | $40.12 | $39.03 | $39.82 | $31.91 | $29.69 |
| Income from Investment Operations | | | | | | |
| Net investment income (loss)A | .20 | .61B | .54C | .67D | .47 | .51 |
| Net realized and unrealized gain (loss) | 3.85 | (2.41) | .81 | (.68) | 8.02 | 2.12 |
| Total from investment operations | 4.05 | (1.80) | 1.35 | (.01) | 8.49 | 2.63 |
| Distributions from net investment income | (.61) | (.41) | (.26) | (.47) | (.55) | (.41) |
| Distributions from net realized gain | (.05) | (.01) | – | (.31) | (.03) | – |
| Total distributions | (.66) | (.41)E | (.26) | (.78) | (.58) | (.41) |
| Redemption fees added to paid in capitalA,F | – | – | – | – | – | – |
| Net asset value, end of period | $41.30 | $37.91 | $40.12 | $39.03 | $39.82 | $31.91 |
| Total ReturnG,H | 10.92% | (4.53)% | 3.47% | (.01)% | 27.03% | 9.03% |
| Ratios to Average Net AssetsI,J | | | | | | |
| Expenses before reductions | .89%K | 1.00% | .99% | .93% | 1.00% | 1.01% |
| Expenses net of fee waivers, if any | .89%K | 1.00% | .99% | .93% | 1.00% | 1.01% |
| Expenses net of all reductions | .87%K | .99% | .98% | .93% | .98% | .98% |
| Net investment income (loss) | 1.04%K | 1.61%B | 1.34%C | 1.69%D | 1.32% | 1.73% |
| Supplemental Data | | | | | | |
| Net assets, end of period (in millions) | $6,578 | $6,421 | $7,209 | $7,464 | $7,800 | $5,965 |
| Portfolio turnover rateL | 43%K | 50%M | 60%M | 57% | 65% | 68% |
A Calculated based on average shares outstanding during the period.
B Net Investment income per share reflects a large, non-recurring dividend which amounted to $.14 per share. Excluding this non-recurring dividend, the ratio of net investment income (loss) to average net assets would have been 1.23%.
C Net Investment income per share reflects a large, non-recurring dividend which amounted to $.12 per share. Excluding this non-recurring dividend, the ratio of net investment income (loss) to average net assets would have been 1.03%.
D Net Investment income per share reflects a large, non-recurring dividend which amounted to $.22 per share. Excluding this non-recurring dividend, the ratio of net investment income (loss) to average net assets would have been 1.15%.
E Total distributions of $.41 per share is comprised of distributions from net investment income of $.409 and distributions from net realized gain of $.005 per share.
F Amount represents less than $.005 per share.
G Total returns for periods of less than one year are not annualized.
H Total returns would have been lower if certain expenses had not been reduced during the applicable periods shown.
I Fees and expenses of any underlying Fidelity Central Funds are not included in the Fund's expense ratio. The Fund indirectly bears its proportionate share of the expenses of any underlying Fidelity Central Funds.
J Expense ratios reflect operating expenses of the class. Expenses before reductions do not reflect amounts reimbursed by the investment adviser or reductions from brokerage service arrangements or reductions from other expense offset arrangements and do not represent the amount paid by the class during periods when reimbursements or reductions occur. Expenses net of fee waivers reflect expenses after reimbursement by the investment adviser but prior to reductions from brokerage service arrangements or other expense offset arrangements. Expenses net of all reductions represent the net expenses paid by the class.
K Annualized
L Amount does not include the portfolio activity of any underlying Fidelity Central Funds.
M Portfolio turnover rate excludes securities received or delivered in-kind.
See accompanying notes which are an integral part of the financial statements.
Financial Highlights — Fidelity International Discovery Fund Class K
| | Six months ended (Unaudited) April 30, | Years ended October 31, | | | | |
| | 2017 | 2016 | 2015 | 2014 | 2013 | 2012 |
| Selected Per–Share Data | | | | | | |
| Net asset value, beginning of period | $37.86 | $40.06 | $38.97 | $39.76 | $31.87 | $29.66 |
| Income from Investment Operations | | | | | | |
| Net investment income (loss)A | .22 | .66B | .59C | .72D | .52 | .57 |
| Net realized and unrealized gain (loss) | 3.84 | (2.39) | .81 | (.67) | 8.01 | 2.11 |
| Total from investment operations | 4.06 | (1.73) | 1.40 | .05 | 8.53 | 2.68 |
| Distributions from net investment income | (.66) | (.46) | (.31) | (.53) | (.61) | (.47) |
| Distributions from net realized gain | (.05) | (.01) | – | (.31) | (.03) | – |
| Total distributions | (.71) | (.47) | (.31) | (.84) | (.64) | (.47) |
| Redemption fees added to paid in capitalA,E | – | – | – | – | – | – |
| Net asset value, end of period | $41.21 | $37.86 | $40.06 | $38.97 | $39.76 | $31.87 |
| Total ReturnF,G | 10.98% | (4.38)% | 3.61% | .13% | 27.23% | 9.24% |
| Ratios to Average Net AssetsH,I | | | | | | |
| Expenses before reductions | .76%J | .86% | .86% | .80% | .85% | .83% |
| Expenses net of fee waivers, if any | .76%J | .86% | .86% | .80% | .85% | .83% |
| Expenses net of all reductions | .74%J | .85% | .85% | .79% | .83% | .80% |
| Net investment income (loss) | 1.17%J | 1.74%B | 1.47%C | 1.83%D | 1.47% | 1.91% |
| Supplemental Data | | | | | | |
| Net assets, end of period (in millions) | $1,917 | $1,880 | $2,308 | $2,464 | $2,576 | $1,776 |
| Portfolio turnover rateK | 43%J | 50%L | 60%L | 57% | 65% | 68% |
A Calculated based on average shares outstanding during the period.
B Net Investment income per share reflects a large, non-recurring dividend which amounted to $.14 per share. Excluding this non-recurring dividend, the ratio of net investment income (loss) to average net assets would have been 1.36%.
C Net Investment income per share reflects a large, non-recurring dividend which amounted to $.12 per share. Excluding this non-recurring dividend, the ratio of net investment income (loss) to average net assets would have been 1.16%.
D Net Investment income per share reflects a large, non-recurring dividend which amounted to $.22 per share. Excluding this non-recurring dividend, the ratio of net investment income (loss) to average net assets would have been 1.28%.
E Amount represents less than $.005 per share.
F Total returns for periods of less than one year are not annualized.
G Total returns would have been lower if certain expenses had not been reduced during the applicable periods shown.
H Fees and expenses of any underlying Fidelity Central Funds are not included in the Fund's expense ratio. The Fund indirectly bears its proportionate share of the expenses of any underlying Fidelity Central Funds.
I Expense ratios reflect operating expenses of the class. Expenses before reductions do not reflect amounts reimbursed by the investment adviser or reductions from brokerage service arrangements or reductions from other expense offset arrangements and do not represent the amount paid by the class during periods when reimbursements or reductions occur. Expenses net of fee waivers reflect expenses after reimbursement by the investment adviser but prior to reductions from brokerage service arrangements or other expense offset arrangements. Expenses net of all reductions represent the net expenses paid by the class.
J Annualized
K Amount does not include the portfolio activity of any underlying Fidelity Central Funds.
L Portfolio turnover rate excludes securities received or delivered in-kind.
See accompanying notes which are an integral part of the financial statements.
Financial Highlights — Fidelity International Discovery Fund Class I
| | Six months ended (Unaudited) April 30, | Years ended October 31, | | | | |
| | 2017 | 2016 | 2015 | 2014 | 2013 | 2012 |
| Selected Per–Share Data | | | | | | |
| Net asset value, beginning of period | $37.82 | $40.03 | $38.96 | $39.76 | $31.87 | $29.65 |
| Income from Investment Operations | | | | | | |
| Net investment income (loss)A | .20 | .61B | .53C | .67D | .47 | .52 |
| Net realized and unrealized gain (loss) | 3.84 | (2.40) | .80 | (.68) | 8.01 | 2.11 |
| Total from investment operations | 4.04 | (1.79) | 1.33 | (.01) | 8.48 | 2.63 |
| Distributions from net investment income | (.61) | (.42) | (.26) | (.48) | (.56) | (.41) |
| Distributions from net realized gain | (.05) | (.01) | – | (.31) | (.03) | – |
| Total distributions | (.66) | (.42)E | (.26) | (.79) | (.59) | (.41) |
| Redemption fees added to paid in capitalA,F | – | – | – | – | – | – |
| Net asset value, end of period | $41.20 | $37.82 | $40.03 | $38.96 | $39.76 | $31.87 |
| Total ReturnG,H | 10.90% | (4.52)% | 3.44% | (.01)% | 27.03% | 9.07% |
| Ratios to Average Net AssetsI,J | | | | | | |
| Expenses before reductions | .90%K | 1.00% | 1.00% | .93% | 1.00% | 1.00% |
| Expenses net of fee waivers, if any | .90%K | 1.00% | .99% | .93% | 1.00% | 1.00% |
| Expenses net of all reductions | .87%K | .99% | .98% | .93% | .97% | .97% |
| Net investment income (loss) | 1.03%K | 1.60%B | 1.33%C | 1.69%D | 1.33% | 1.75% |
| Supplemental Data | | | | | | |
| Net assets, end of period (in millions) | $594 | $745 | $1,061 | $650 | $476 | $294 |
| Portfolio turnover rateL | 43%K | 50%M | 60%M | 57% | 65% | 68% |
A Calculated based on average shares outstanding during the period.
B Net Investment income per share reflects a large, non-recurring dividend which amounted to $.14 per share. Excluding this non-recurring dividend, the ratio of net investment income (loss) to average net assets would have been 1.22%.
C Net Investment income per share reflects a large, non-recurring dividend which amounted to $.12 per share. Excluding this non-recurring dividend, the ratio of net investment income (loss) to average net assets would have been 1.03%.
D Net Investment income per share reflects a large, non-recurring dividend which amounted to $.22 per share. Excluding this non-recurring dividend, the ratio of net investment income (loss) to average net assets would have been 1.14%.
E Total distributions of $.42 per share is comprised of distributions from net investment income of $.418 and distributions from net realized gain of $.005 per share.
F Amount represents less than $.005 per share.
G Total returns for periods of less than one year are not annualized.
H Total returns would have been lower if certain expenses had not been reduced during the applicable periods shown.
I Fees and expenses of any underlying Fidelity Central Funds are not included in the Fund's expense ratio. The Fund indirectly bears its proportionate share of the expenses of any underlying Fidelity Central Funds.
J Expense ratios reflect operating expenses of the class. Expenses before reductions do not reflect amounts reimbursed by the investment adviser or reductions from brokerage service arrangements or reductions from other expense offset arrangements and do not represent the amount paid by the class during periods when reimbursements or reductions occur. Expenses net of fee waivers reflect expenses after reimbursement by the investment adviser but prior to reductions from brokerage service arrangements or other expense offset arrangements. Expenses net of all reductions represent the net expenses paid by the class.
K Annualized
L Amount does not include the portfolio activity of any underlying Fidelity Central Funds.
M Portfolio turnover rate excludes securities received or delivered in-kind.
See accompanying notes which are an integral part of the financial statements.
Financial Highlights — Fidelity International Discovery Fund Class Z
| | Six months ended (Unaudited) April 30, | Years ended October 31, | | | |
| | 2017 | 2016 | 2015 | 2014 | 2013 A |
| Selected Per–Share Data | | | | | |
| Net asset value, beginning of period | $37.84 | $40.03 | $38.96 | $39.77 | $37.22 |
| Income from Investment Operations | | | | | |
| Net investment income (loss)B | .22 | .66C | .59D | .72E | .07 |
| Net realized and unrealized gain (loss) | 3.84 | (2.38) | .80 | (.68) | 2.48 |
| Total from investment operations | 4.06 | (1.72) | 1.39 | .04 | 2.55 |
| Distributions from net investment income | (.67) | (.46) | (.32) | (.54) | – |
| Distributions from net realized gain | (.05) | (.01) | – | (.31) | – |
| Total distributions | (.72) | (.47) | (.32) | (.85) | – |
| Redemption fees added to paid in capitalB,F | – | – | – | – | – |
| Net asset value, end of period | $41.18 | $37.84 | $40.03 | $38.96 | $39.77 |
| Total ReturnG,H | 10.97% | (4.36)% | 3.58% | .12% | 6.85% |
| Ratios to Average Net AssetsI,J | | | | | |
| Expenses before reductions | .76%K | .86% | .86% | .80% | .85%K |
| Expenses net of fee waivers, if any | .76%K | .86% | .86% | .80% | .85%K |
| Expenses net of all reductions | .74%K | .85% | .85% | .79% | .83%K |
| Net investment income (loss) | 1.17%K | 1.74%C | 1.47%D | 1.83%E | .76%K |
| Supplemental Data | | | | | |
| Net assets, end of period (in millions) | $82 | $38 | $30 | $35 | $– |
| Portfolio turnover rateL | 43%K | 50%M | 60%M | 57% | 65% |
A For the period August 13, 2013 (commencement of sale of shares) to October 31, 2013.
B Calculated based on average shares outstanding during the period.
C Net Investment income per share reflects a large, non-recurring dividend which amounted to $.14 per share. Excluding this non-recurring dividend, the ratio of net investment income (loss) to average net assets would have been 1.36%.
D Net Investment income per share reflects a large, non-recurring dividend which amounted to $.12 per share. Excluding this non-recurring dividend, the ratio of net investment income (loss) to average net assets would have been 1.16%.
E Net Investment income per share reflects a large, non-recurring dividend which amounted to $.21 per share. Excluding this non-recurring dividend, the ratio of net investment income (loss) to average net assets would have been 1.28%.
F Amount represents less than $.005 per share.
G Total returns for periods of less than one year are not annualized.
H Total returns would have been lower if certain expenses had not been reduced during the applicable periods shown.
I Fees and expenses of any underlying Fidelity Central Funds are not included in the Fund's expense ratio. The Fund indirectly bears its proportionate share of the expenses of any underlying Fidelity Central Funds.
J Expense ratios reflect operating expenses of the class. Expenses before reductions do not reflect amounts reimbursed by the investment adviser or reductions from brokerage service arrangements or reductions from other expense offset arrangements and do not represent the amount paid by the class during periods when reimbursements or reductions occur. Expense ratios before reductions for start-up periods may not be representative of longer-term operating periods. Expenses net of fee waivers reflect expenses after reimbursement by the investment adviser but prior to reductions from brokerage service arrangements or other expense offset arrangements. Expenses net of all reductions represent the net expenses paid by the class.
K Annualized
L Amount does not include the portfolio activity of any underlying Fidelity Central Funds.
M Portfolio turnover rate excludes securities received or delivered in-kind.
See accompanying notes which are an integral part of the financial statements.
Notes to Financial Statements (Unaudited)
For the period ended April 30, 2017
(Amounts in thousands except percentages)
1. Organization.
Fidelity International Discovery Fund (the Fund) is a fund of Fidelity Investment Trust (the Trust) and is authorized to issue an unlimited number of shares. The Trust is registered under the Investment Company Act of 1940, as amended (the 1940 Act), as an open-end management investment company organized as a Massachusetts business trust. The Fund offers Class A, Class M (formerly Class T), Class C, International Discovery, Class K, Class I and Class Z shares, each of which has equal rights as to assets and voting privileges. Each class has exclusive voting rights with respect to matters that affect that class.
After the close of business on June 24, 2016, all outstanding Class B shares were converted to Class A shares. All prior fiscal period dollar and share amounts for Class B presented in the Notes to Financial Statements are for the period November 1, 2015 through June 24, 2016.
2. Investments in Fidelity Central Funds.
The Fund invests in Fidelity Central Funds, which are open-end investment companies generally available only to other investment companies and accounts managed by the investment adviser and its affiliates. The Fund's Schedule of Investments lists each of the Fidelity Central Funds held as of period end, if any, as an investment of the Fund, but does not include the underlying holdings of each Fidelity Central Fund. As an Investing Fund, the Fund indirectly bears its proportionate share of the expenses of the underlying Fidelity Central Funds.
The Money Market Central Funds seek preservation of capital and current income and are managed by Fidelity Investments Money Management, Inc. (FIMM), an affiliate of the investment adviser. Annualized expenses of the Money Market Central Funds as of their most recent shareholder report date are less than .005%.
A complete unaudited list of holdings for each Fidelity Central Fund is available upon request or at the Securities and Exchange Commission (the SEC) website at www.sec.gov. In addition, the financial statements of the Fidelity Central Funds are available on the SEC website or upon request.
3. Significant Accounting Policies.
The Fund is an investment company and applies the accounting and reporting guidance of the Financial Accounting Standards Board (FASB) Accounting Standards Codification Topic 946 Financial Services – Investments Companies. The financial statements have been prepared in conformity with accounting principles generally accepted in the United States of America (GAAP), which require management to make certain estimates and assumptions at the date of the financial statements. Actual results could differ from those estimates. Subsequent events, if any, through the date that the financial statements were issued have been evaluated in the preparation of the financial statements. The following summarizes the significant accounting policies of the Fund:
Investment Valuation. Investments are valued as of 4:00 p.m. Eastern time on the last calendar day of the period. The Board of Trustees (the Board) has delegated the day to day responsibility for the valuation of the Fund's investments to the Fair Value Committee (the Committee) established by the Fund's investment adviser. In accordance with valuation policies and procedures approved by the Board, the Fund attempts to obtain prices from one or more third party pricing vendors or brokers to value its investments. When current market prices, quotations or currency exchange rates are not readily available or reliable, investments will be fair valued in good faith by the Committee, in accordance with procedures adopted by the Board. Factors used in determining fair value vary by investment type and may include market or investment specific events, changes in interest rates and credit quality. The frequency with which these procedures are used cannot be predicted and they may be utilized to a significant extent. The Committee oversees the Fund's valuation policies and procedures and reports to the Board on the Committee's activities and fair value determinations. The Board monitors the appropriateness of the procedures used in valuing the Fund's investments and ratifies the fair value determinations of the Committee.
The Fund categorizes the inputs to valuation techniques used to value its investments into a disclosure hierarchy consisting of three levels as shown below:
- Level 1 – quoted prices in active markets for identical investments
- Level 2 – other significant observable inputs (including quoted prices for similar investments, interest rates, prepayment speeds, etc.)
- Level 3 – unobservable inputs (including the Fund's own assumptions based on the best information available)
Valuation techniques used to value the Fund's investments by major category are as follows:
Equity securities, including restricted securities, for which market quotations are readily available, are valued at the last reported sale price or official closing price as reported by a third party pricing vendor on the primary market or exchange on which they are traded and are categorized as Level 1 in the hierarchy. In the event there were no sales during the day or closing prices are not available, securities are valued at the last quoted bid price or may be valued using the last available price and are generally categorized as Level 2 in the hierarchy. For foreign equity securities, when market or security specific events arise, comparisons to the valuation of American Depositary Receipts (ADRs), futures contracts, Exchange-Traded Funds (ETFs) and certain indexes as well as quoted prices for similar securities may be used and would be categorized as Level 2 in the hierarchy. Utilizing these techniques may result in transfers between Level 1 and Level 2. For equity securities, including restricted securities, where observable inputs are limited, assumptions about market activity and risk are used and these securities may be categorized as Level 3 in the hierarchy.
Debt securities, including restricted securities, are valued based on evaluated prices received from third party pricing vendors or from brokers who make markets in such securities. U.S. government and government agency obligations are valued by pricing vendors who utilize matrix pricing which considers yield or price of bonds of comparable quality, coupon, maturity and type or by broker-supplied prices. When independent prices are unavailable or unreliable, debt securities may be valued utilizing pricing methodologies which consider similar factors that would be used by third party pricing vendors. Debt securities are generally categorized as Level 2 in the hierarchy but may be Level 3 depending on the circumstances.
Futures contracts are valued at the settlement price established each day by the board of trade or exchange on which they are traded and are categorized as Level 1 in the hierarchy. Investments in open-end mutual funds, including the Fidelity Central Funds, are valued at their closing net asset value (NAV) each business day and are categorized as Level 1 in the hierarchy.
Changes in valuation techniques may result in transfers in or out of an assigned level within the disclosure hierarchy. The aggregate value of investments by input level as of April 30, 2017, including information on transfers between Levels 1 and 2, is included at the end of the Fund's Schedule of Investments.
Foreign Currency. The Fund may use foreign currency contracts to facilitate transactions in foreign-denominated securities. Gains and losses from these transactions may arise from changes in the value of the foreign currency or if the counterparties do not perform under the contracts' terms.
Foreign-denominated assets, including investment securities, and liabilities are translated into U.S. dollars at the exchange rates at period end. Purchases and sales of investment securities, income and dividends received and expenses denominated in foreign currencies are translated into U.S. dollars at the exchange rate in effect on the transaction date.
The effects of exchange rate fluctuations on investments are included with the net realized and unrealized gain (loss) on investment securities. Other foreign currency transactions resulting in realized and unrealized gain (loss) are disclosed separately.
Investment Transactions and Income. For financial reporting purposes, the Fund's investment holdings and NAV include trades executed through the end of the last business day of the period. The NAV per share for processing shareholder transactions is calculated as of the close of business of the New York Stock Exchange (NYSE), normally 4:00 p.m. Eastern time and includes trades executed through the end of the prior business day. Gains and losses on securities sold are determined on the basis of identified cost. Dividend income is recorded on the ex-dividend date, except for certain dividends from foreign securities where the ex-dividend date may have passed, which are recorded as soon as the Fund is informed of the ex-dividend date. Non-cash dividends included in dividend income, if any, are recorded at the fair market value of the securities received. Income and capital gain distributions from Fidelity Central Funds, if any, are recorded on the ex-dividend date. Certain distributions received by the Fund represent a return of capital or capital gain. The Fund determines the components of these distributions subsequent to the ex-dividend date, based upon receipt of tax filings or other correspondence relating to the underlying investment. These distributions are recorded as a reduction of cost of investments and/or as a realized gain. Interest income is accrued as earned and includes coupon interest and amortization of premium and accretion of discount on debt securities as applicable. Investment income is recorded net of foreign taxes withheld where recovery of such taxes is uncertain.
Class Allocations and Expenses. Investment income, realized and unrealized capital gains and losses, common expenses of the Fund, and certain fund-level expense reductions, if any, are allocated daily on a pro-rata basis to each class based on the relative net assets of each class to the total net assets of the Fund. Each class differs with respect to transfer agent and distribution and service plan fees incurred. Certain expense reductions may also differ by class. For the reporting period, the allocated portion of income and expenses to each class as a percent of its average net assets may vary due to the timing of recording these transactions in relation to fluctuating net assets of the classes. Expenses directly attributable to a fund are charged to that fund. Expenses attributable to more than one fund are allocated among the respective funds on the basis of relative net assets or other appropriate methods. Expense estimates are accrued in the period to which they relate and adjustments are made when actual amounts are known.
Deferred Trustee Compensation. Under a Deferred Compensation Plan (the Plan), independent Trustees may elect to defer receipt of a portion of their annual compensation. Deferred amounts are invested in a cross-section of Fidelity funds, are marked-to-market and remain in the Fund until distributed in accordance with the Plan. The investment of deferred amounts and the offsetting payable to the Trustees are included in the accompanying Statement of Assets and Liabilities.
Income Tax Information and Distributions to Shareholders. Each year, the Fund intends to qualify as a regulated investment company under Subchapter M of the Internal Revenue Code, including distributing substantially all of its taxable income and realized gains. As a result, no provision for U.S. Federal income taxes is required. The Fund files a U.S. federal tax return, in addition to state and local tax returns as required. The Fund's federal income tax returns are subject to examination by the Internal Revenue Service (IRS) for a period of three fiscal years after they are filed. State and local tax returns may be subject to examination for an additional fiscal year depending on the jurisdiction. Foreign taxes are provided for based on the Fund's understanding of the tax rules and rates that exist in the foreign markets in which it invests.
Distributions are declared and recorded on the ex-dividend date. Income dividends and capital gain distributions are declared separately for each class. Income and capital gain distributions are determined in accordance with income tax regulations, which may differ from GAAP.
Capital accounts within the financial statements are adjusted for permanent book-tax differences. These adjustments have no impact on net assets or the results of operations. Capital accounts are not adjusted for temporary book-tax differences which will reverse in a subsequent period.
Book-tax differences are primarily due to futures contracts, foreign currency transactions, passive foreign investment companies (PFIC), market discount, certain foreign taxes, redemptions in-kind, deferred trustees compensation, capital loss carryforwards and losses deferred due to wash sales.
The federal tax cost of investment securities and unrealized appreciation (depreciation) as of period end were as follows:
| Gross unrealized appreciation | $1,829,440 |
| Gross unrealized depreciation | (167,661) |
| Net unrealized appreciation (depreciation) on securities | $1,661,779 |
| Tax cost | $7,914,994 |
Capital loss carryforwards are only available to offset future capital gains of the Fund to the extent provided by regulations and may be limited. Under the Regulated Investment Company Modernization Act of 2010 (the Act), the Fund is permitted to carry forward capital losses incurred in taxable years beginning after December 22, 2010 for an unlimited period and such capital losses are required to be used prior to any losses that expire. The capital loss carryforward information presented below, including any applicable limitation, is estimated as of prior fiscal period end and is subject to adjustment.
| Fiscal year of expiration | |
| 2017 | $(49,104) |
| No expiration | |
| Short-term | (473,137) |
| Long-term | (90,465) |
| Total no expiration | (563,602) |
| Total capital loss carryforward | $(612,706) |
Short-Term Trading (Redemption) Fees. Shares held by investors in the Fund less than 30 days may have been subject to a redemption fee equal to 1.00% of the NAV of shares redeemed. All redemption fees, which reduce the proceeds of the shareholder redemption, are retained by the Fund and accounted for as an addition to paid in capital. In November 2016, the Board of Trustees approved the removal of the redemption fees effective December 12, 2016.
Restricted Securities. The Fund may invest in securities that are subject to legal or contractual restrictions on resale. These securities generally may be resold in transactions exempt from registration or to the public if the securities are registered. Disposal of these securities may involve time-consuming negotiations and expense, and prompt sale at an acceptable price may be difficult. Information regarding restricted securities is included at the end of the Fund's Schedule of Investments.
4. Derivative Instruments.
Risk Exposures and the Use of Derivative Instruments. The Fund's investment objective allows the Fund to enter into various types of derivative contracts, including futures contracts. Derivatives are investments whose value is primarily derived from underlying assets, indices or reference rates and may be transacted on an exchange or over-the-counter (OTC). Derivatives may involve a future commitment to buy or sell a specified asset based on specified terms, to exchange future cash flows at periodic intervals based on a notional principal amount, or for one party to make one or more payments upon the occurrence of specified events in exchange for periodic payments from the other party.
The Fund used derivatives to increase returns and to manage exposure to certain risks as defined below. The success of any strategy involving derivatives depends on analysis of numerous economic factors, and if the strategies for investment do not work as intended, the Fund may not achieve its objectives.
The Fund's use of derivatives increased or decreased its exposure to the following risk:
| Equity Risk | Equity risk relates to the fluctuations in the value of financial instruments as a result of changes in market prices (other than those arising from interest rate risk or foreign exchange risk), whether caused by factors specific to an individual investment, its issuer, or all factors affecting all instruments traded in a market or market segment.
|
The Fund is also exposed to additional risks from investing in derivatives, such as liquidity risk and counterparty credit risk. Liquidity risk is the risk that the Fund will be unable to close out the derivative in the open market in a timely manner. Counterparty credit risk is the risk that the counterparty will not be able to fulfill its obligation to the Fund. Counterparty credit risk related to exchange-traded futures contracts may be mitigated by the protection provided by the exchange on which they trade.
Investing in derivatives may involve greater risks than investing in the underlying assets directly and, to varying degrees, may involve risk of loss in excess of any initial investment and collateral received and amounts recognized in the Statement of Assets and Liabilities. In addition, there may be the risk that the change in value of the derivative contract does not correspond to the change in value of the underlying instrument.
Futures Contracts. A futures contract is an agreement between two parties to buy or sell a specified underlying instrument for a fixed price at a specified future date. The Fund used futures contracts to manage its exposure to the stock market.
Upon entering into a futures contract, a fund is required to deposit either cash or securities (initial margin) with a clearing broker in an amount equal to a certain percentage of the face value of the contract. Futures contracts are marked-to-market daily and subsequent daily payments (variation margin) are made or received by a fund depending on the daily fluctuations in the value of the futures contracts and are recorded as unrealized appreciation or (depreciation). This receivable and/or payable, if any, is included in daily variation margin for derivative instruments in the Statement of Assets and Liabilities. Realized gain or (loss) is recorded upon the expiration or closing of a futures contract.
Any open futures contracts at period end are presented in the Schedule of Investments under the caption "Futures Contracts". The underlying face amount at value reflects each contract's exposure to the underlying instrument or index at period end and is representative of volume of activity during the period. Securities deposited to meet initial margin requirements are identified in the Schedule of Investments.
During the period the Fund recognized net realized gain (loss) of $13,067 a change in net unrealized appreciation (depreciation) of $(4,118) related to its investment in futures contracts. These amounts are included in the Statement of Operations.
5. Purchases and Sales of Investments.
Purchases and sales of securities, other than short-term securities, aggregated $1,918,011 and $2,727,630, respectively.
Prior Fiscal Year Redemptions In-Kind. During the prior period, 1,487 shares of the Fund held by an unaffiliated entity were redeemed for investments and cash with a value of $55,670. The Fund had a net gain of $10,064 on investments delivered through the in-kind redemptions. The amount of the redemptions is included in share transactions activity shown in the accompanying Statement of Changes in Net Assets as well as the Notes to Financial Statements. The Fund recognized no gain or loss for federal income tax purposes.
6. Fees and Other Transactions with Affiliates.
Management Fee. Fidelity Management & Research Company (the investment adviser) and its affiliates provide the Fund with investment management related services for which the Fund pays a monthly management fee. The management fee is the sum of an individual fund fee rate that is based on an annual rate of .424% of the Fund's average net assets and an annualized group fee rate that averaged .25% during the period. The group fee rate is based upon the average net assets of all the mutual funds advised by the investment adviser, including any mutual funds previously advised by the investment adviser that are currently advised by Fidelity SelectCo, LLC, an affiliate of the investment adviser. The group fee rate decreases as assets under management increase and increases as assets under management decrease. In addition, the management fee is subject to a performance adjustment (up to a maximum of +/- .20% of the Fund's average net assets over a 36 month performance period). The upward or downward adjustment to the management fee is based on the relative investment performance of International Discovery as compared to its benchmark index, the MSCI EAFE Index, over the same 36 month performance period. For the reporting period, the total annualized management fee rate, including the performance adjustment, was .67% of the Fund's average net assets. The performance adjustment included in the management fee rate may be higher or lower than the maximum performance adjustment rate due to the difference between the average net assets for the reporting and performance periods.
Distribution and Service Plan Fees. In accordance with Rule 12b-1 of the 1940 Act, the Fund has adopted separate Distribution and Service Plans for each class of shares. Certain classes pay Fidelity Distributors Corporation (FDC), an affiliate of the investment adviser, separate Distribution and Service Fees, each of which is based on an annual percentage of each class' average net assets. In addition, FDC may pay financial intermediaries for selling shares of the Fund and providing shareholder support services. For the period, the Distribution and Service Fee rates, total fees and amounts retained by FDC were as follows:
| | Distribution
Fee | Service
Fee | Total Fees | Retained
by FDC |
| Class A | -% | .25% | $283 | $3 |
| Class M | .25% | .25% | 82 | –(a) |
| Class C | .75% | .25% | 123 | 9 |
| | | | $488 | $12 |
| (a) In the amount of less than five hundred dollars. | | | | |
Sales Load. FDC may receive a front-end sales charge of up to 5.75% for selling Class A shares and 3.50% for selling Class M shares, some of which is paid to financial intermediaries for selling shares of the Fund. Depending on the holding period, FDC may receive contingent deferred sales charges levied on Class A, Class M and Class C redemptions. The deferred sales charges are 1.00% for Class C shares, 1.00% for certain purchases of Class A shares and .25% for certain purchases of Class M shares.
For the period, sales charge amounts retained by FDC were as follows:
| | Retained
by FDC |
| Class A | $20 |
| Class M | 2 |
| Class C(a) | 2 |
| | $24 |
(a) When Class C shares are initially sold, FDC pays commissions from its own resources to financial intermediaries through which the sales are made.
Transfer Agent Fees. Fidelity Investments Institutional Operations Company, Inc., (FIIOC), an affiliate of the investment adviser, is the transfer, dividend disbursing and shareholder servicing agent for each class of the Fund. FIIOC receives account fees and asset-based fees that vary according to the account size and type of account of the shareholders of the respective classes of the Fund, except for Class K and Class Z. FIIOC receives an asset-based fee of Class K's and Class Z's average net assets. FIIOC pays for typesetting, printing and mailing of shareholder reports, except proxy statements.
For the period, transfer agent fees for each class were as follows:
| | Amount | % of
Class-Level Average
Net Assets(a) |
| Class A | $316 | .28 |
| Class M | 44 | .27 |
| Class C | 36 | .29 |
| International Discovery | 5,560 | .18 |
| Class K | 425 | .05 |
| Class I | 592 | .19 |
| Class Z | 13 | .05 |
| | $6,986 | |
(a) Annualized
Accounting and Security Lending Fees. Fidelity Service Company, Inc. (FSC), an affiliate of the investment adviser, maintains the Fund's accounting records. The accounting fee is based on the level of average net assets for each month. Under a separate contract, FSC administers the security lending program. The security lending fee is based on the number and duration of lending transactions.
Brokerage Commissions. The Fund placed a portion of its portfolio transactions with brokerage firms which are affiliates of the investment adviser. Brokerage commissions are included in net realized gain (loss) and change in net unrealized appreciation (depreciation) in the Statement of Operations. The commissions paid to these affiliated firms were $6 for the period.
Interfund Trades. The Fund may purchase from or sell securities to other Fidelity Funds under procedures adopted by the Board. The procedures have been designed to ensure these interfund trades are executed in accordance with Rule 17a-7 of the 1940 Act. Interfund trades are included within the respective purchases and sales amounts shown in the Purchases and Sales of Investments note.
7. Committed Line of Credit.
The Fund participates with other funds managed by the investment adviser or an affiliate in a $4.25 billion credit facility (the "line of credit") to be utilized for temporary or emergency purposes to fund shareholder redemptions or for other short-term liquidity purposes. The Fund has agreed to pay commitment fees on its pro-rata portion of the line of credit, which amounted to $15 and is reflected in Miscellaneous expenses on the Statement of Operations. During the period, the Fund did not borrow on this line of credit.
8. Security Lending.
The Fund lends portfolio securities through a lending agent from time to time in order to earn additional income. For equity securities, a lending agent is used and may loan securities to certain qualified borrowers, including Fidelity Capital Markets (FCM), a broker-dealer affiliated with the Fund. On the settlement date of the loan, the Fund receives collateral (in the form of U.S. Treasury obligations, letters of credit and/or cash) against the loaned securities and maintains collateral in an amount not less than 100% of the market value of the loaned securities during the period of the loan. The market value of the loaned securities is determined at the close of business of the Fund and any additional required collateral is delivered to the Fund on the next business day. The Fund or borrower may terminate the loan at any time, and if the borrower defaults on its obligation to return the securities loaned because of insolvency or other reasons, the Fund may apply collateral received from the borrower against the obligation. The Fund may experience delays and costs in recovering the securities loaned. Any cash collateral received is invested in the Fidelity Securities Lending Cash Central Fund. The value of loaned securities and cash collateral at period end are disclosed on the Fund's Statement of Assets and Liabilities. Security lending income represents the income earned on investing cash collateral, less rebates paid to borrowers and any lending agent fees associated with the loan, plus any premium payments received for lending certain types of securities. Security lending income is presented in the Statement of Operations as a component of income from Fidelity Central Funds. Total security lending income during the period amounted to $2,019. During the period, there were no securities loaned to FCM.
9. Expense Reductions.
Commissions paid to certain brokers with whom the investment adviser, or its affiliates, places trades on behalf of the Fund include an amount in addition to trade execution, which may be rebated back to the Fund to offset certain expenses. This amount totaled $1,034 for the period.
In addition, during the period the investment adviser reimbursed and/or waived a portion of fund-level operating expenses in the amount of $40.
10. Distributions to Shareholders.
Distributions to shareholders of each class were as follows:
| | Six months ended
April 30, 2017 | Year ended October 31, 2016 |
| From net investment income | | |
| Class A | $2,894 | $1,912 |
| Class M | 333 | 184 |
| Class C | 92 | – |
| International Discovery | 102,284 | 73,519 |
| Class K | 32,411 | 26,239 |
| Class I | 11,493 | 11,205 |
| Class Z | 667 | 375 |
| Total | $150,174 | $113,434 |
| From net realized gain | | |
| Class A | $302 | $36 |
| Class M | 44 | 5 |
| Class C | 34 | – |
| International Discovery | 8,189 | 899 |
| Class K | 2,392 | 284 |
| Class I | 929 | 134 |
| Class Z | 49 | 4 |
| Total | $11,939 | $1,362 |
11. Share Transactions.
Share transactions for each class were as follows and may contain automatic conversions between classes or exchanges between affiliated funds:
| | Shares | Shares | Dollars | Dollars |
| | Six months ended
April 30, 2017 | Year ended October 31, 2016 | Six months ended
April 30, 2017 | Year ended October 31, 2016 |
| Class A | | | | |
| Shares sold | 364 | 885 | $13,763 | $33,250 |
| Reinvestment of distributions | 87 | 48 | 3,152 | 1,922 |
| Shares redeemed | (1,088) | (1,758) | (41,081) | (66,337) |
| Net increase (decrease) | (637) | (825) | $(24,166) | $(31,165) |
| Class M | | | | |
| Shares sold | 35 | 126 | $1,305 | $4,736 |
| Reinvestment of distributions | 10 | 5 | 365 | 183 |
| Shares redeemed | (180) | (282) | (6,755) | (10,546) |
| Net increase (decrease) | (135) | (151) | $(5,085) | $(5,627) |
| Class B | | | | |
| Shares sold | – | 1 | $– | $16 |
| Shares redeemed | – | (58) | – | (2,118) |
| Net increase (decrease) | – | (57) | $– | $(2,102) |
| Class C | | | | |
| Shares sold | 30 | 193 | $1,121 | $7,216 |
| Reinvestment of distributions | 3 | – | 116 | – |
| Shares redeemed | (111) | (298) | (4,139) | (11,125) |
| Net increase (decrease) | (78) | (105) | $(2,902) | $(3,909) |
| International Discovery | | | | |
| Shares sold | 8,884 | 18,319 | $332,954 | $696,598 |
| Reinvestment of distributions | 2,884 | 1,781 | 105,222 | 70,961 |
| Shares redeemed | (21,871) | (30,424) | (824,296) | (1,154,409) |
| Net increase (decrease) | (10,103) | (10,324) | $(386,120) | $(386,850) |
| Class K | | | | |
| Shares sold | 5,259 | 12,391 | $199,707 | $466,861 |
| Reinvestment of distributions | 957 | 667 | 34,803 | 26,523 |
| Shares redeemed | (9,366) | (21,012)(a) | (352,321) | (800,081)(a) |
| Net increase (decrease) | (3,150) | (7,954) | $(117,811) | $(306,697) |
| Class I | | | | |
| Shares sold | 1,666 | 8,874 | $62,988 | $334,588 |
| Reinvestment of distributions | 82 | 52 | 2,985 | 2,069 |
| Shares redeemed | (7,042) | (15,719) | (265,168) | (569,974) |
| Net increase (decrease) | (5,294) | (6,793) | $(199,195) | $(233,317) |
| Class Z | | | | |
| Shares sold | 1,163 | 497 | $44,254 | $18,760 |
| Reinvestment of distributions | 20 | 10 | 716 | 379 |
| Shares redeemed | (194) | (256) | (7,427) | (9,746) |
| Net increase (decrease) | 989 | 251 | $37,543 | $9,393 |
(a) Amount includes in-kind redemptions (see the prior Redemptions In-Kind note for additional details).
12. Other.
The Fund's organizational documents provide former and current trustees and officers with a limited indemnification against liabilities arising in connection with the performance of their duties to the Fund. In the normal course of business, the Fund may also enter into contracts that provide general indemnifications. The Fund's maximum exposure under these arrangements is unknown as this would be dependent on future claims that may be made against the Fund. The risk of material loss from such claims is considered remote.
At the end of the period, Strategic Advisers International Fund was the owner of record of approximately 12% of the total outstanding shares of the Fund.
Shareholder Expense Example
As a shareholder of the Fund, you incur two types of costs: (1) transaction costs, including sales charges (loads) on purchase payments or redemption proceeds, redemption fees and (2) ongoing costs, including management fees, distribution and/or service (12b-1) fees and other Fund expenses. This Example is intended to help you understand your ongoing costs (in dollars) of investing in the Fund and to compare these costs with the ongoing costs of investing in other mutual funds.
The Example is based on an investment of $1,000 invested at the beginning of the period and held for the entire period (November 1, 2016 to April 30, 2017).
Actual Expenses
The first line of the accompanying table for each class of the Fund provides information about actual account values and actual expenses. You may use the information in this line, together with the amount you invested, to estimate the expenses that you paid over the period. Simply divide your account value by $1,000.00 (for example, an $8,600 account value divided by $1,000.00 = 8.6), then multiply the result by the number in the first line for a class of the Fund under the heading entitled "Expenses Paid During Period" to estimate the expenses you paid on your account during this period. A small balance maintenance fee of $12.00 that is charged once a year may apply for certain accounts with a value of less than $2,000. This fee is not included in the table below. If it was, the estimate of expenses you paid during the period would be higher, and your ending account value lower, by this amount. In addition, the Fund, as a shareholder in the underlying Fidelity Central Funds, will indirectly bear its pro-rata share of the fees and expenses incurred by the underlying Fidelity Central Funds. These fees and expenses are not included in the Fund's annualized expense ratio used to calculate the expense estimate in the table below.
Hypothetical Example for Comparison Purposes
The second line of the accompanying table for each class of the Fund provides information about hypothetical account values and hypothetical expenses based on a Class' actual expense ratio and an assumed rate of return of 5% per year before expenses, which is not the Class' actual return. The hypothetical account values and expenses may not be used to estimate the actual ending account balance or expenses you paid for the period. You may use this information to compare the ongoing costs of investing in the Fund and other funds. To do so, compare this 5% hypothetical example with the 5% hypothetical examples that appear in the shareholder reports of the other funds. A small balance maintenance fee of $12.00 that is charged once a year may apply for certain accounts with a value of less than $2,000. This fee is not included in the table below. If it was, the estimate of expenses you paid during the period would be higher, and your ending account value lower, by this amount. In addition, the Fund, as a shareholder in the underlying Fidelity Central Funds, will indirectly bear its pro-rata share of the fees and expenses incurred by the underlying Fidelity Central Funds. These fees and expenses are not included in the Fund's annualized expense ratio used to calculate the expense estimate in the table below.
Please note that the expenses shown in the table are meant to highlight your ongoing costs only and do not reflect any transaction costs. Therefore, the second line of the table is useful in comparing ongoing costs only, and will not help you determine the relative total costs of owning different funds. In addition, if these transactional costs were included, your costs would have been higher.
| | Annualized Expense Ratio-A | Beginning
Account Value
November 1, 2016 | Ending
Account Value
April 30, 2017 | Expenses Paid
During Period-B
November 1, 2016
to April 30, 2017 |
| Class A | 1.24% | | | |
| Actual | | $1,000.00 | $1,107.10 | $6.48 |
| Hypothetical-C | | $1,000.00 | $1,018.65 | $6.21 |
| Class M | 1.48% | | | |
| Actual | | $1,000.00 | $1,105.80 | $7.73 |
| Hypothetical-C | | $1,000.00 | $1,017.46 | $7.40 |
| Class C | 2.00% | | | |
| Actual | | $1,000.00 | $1,103.00 | $10.43 |
| Hypothetical-C | | $1,000.00 | $1,014.88 | $9.99 |
| International Discovery | .89% | | | |
| Actual | | $1,000.00 | $1,109.20 | $4.65 |
| Hypothetical-C | | $1,000.00 | $1,020.38 | $4.46 |
| Class K | .76% | | | |
| Actual | | $1,000.00 | $1,109.80 | $3.98 |
| Hypothetical-C | | $1,000.00 | $1,021.03 | $3.81 |
| Class I | .90% | | | |
| Actual | | $1,000.00 | $1,109.00 | $4.71 |
| Hypothetical-C | | $1,000.00 | $1,020.33 | $4.51 |
| Class Z | .76% | | | |
| Actual | | $1,000.00 | $1,109.70 | $3.98 |
| Hypothetical-C | | $1,000.00 | $1,021.03 | $3.81 |
A Annualized expense ratio reflects expenses net of applicable fee waivers.
B Expenses are equal to each Class' annualized expense ratio, multiplied by the average account value over the period, multiplied by 181/365 (to reflect the one-half year period).
C 5% return per year before expenses
AID-SANN-0617
1.806665.112
Fidelity® International Discovery Fund
Semi-Annual Report April 30, 2017 |
|
Contents
To view a fund's proxy voting guidelines and proxy voting record for the 12-month period ended June 30, visit http://www.fidelity.com/proxyvotingresults or visit the Securities and Exchange Commission's (SEC) web site at http://www.sec.gov.
You may also call 1-800-544-8544 to request a free copy of the proxy voting guidelines.
Standard & Poor's, S&P and S&P 500 are registered service marks of The McGraw-Hill Companies, Inc. and have been licensed for use by Fidelity Distributors Corporation.
Other third-party marks appearing herein are the property of their respective owners.
All other marks appearing herein are registered or unregistered trademarks or service marks of FMR LLC or an affiliated company. © 2017 FMR LLC. All rights reserved.
This report and the financial statements contained herein are submitted for the general information of the shareholders of the Fund. This report is not authorized for distribution to prospective investors in the Fund unless preceded or accompanied by an effective prospectus.
A fund files its complete schedule of portfolio holdings with the SEC for the first and third quarters of each fiscal year on Form N-Q. Forms N-Q are available on the SEC’s web site at http://www.sec.gov. A fund's Forms N-Q may be reviewed and copied at the SEC’s Public Reference Room in Washington, DC. Information regarding the operation of the SEC's Public Reference Room may be obtained by calling 1-800-SEC-0330.
For a complete list of a fund's portfolio holdings, view the most recent holdings listing, semiannual report, or annual report on Fidelity's web site at http://www.fidelity.com, http://www.institutional.fidelity.com, or http://www.401k.com, as applicable.
NOT FDIC INSURED •MAY LOSE VALUE •NO BANK GUARANTEE
Neither the Fund nor Fidelity Distributors Corporation is a bank.
Investment Summary (Unaudited)
Geographic Diversification (% of fund's net assets)
| As of April 30, 2017 |
| | Japan | 17.6% |
| | United Kingdom | 15.4% |
| | France | 8.6% |
| | Switzerland | 5.8% |
| | Netherlands | 5.7% |
| | Germany | 5.7% |
| | Sweden | 4.2% |
| | Spain | 4.1% |
| | United States of America* | 3.4% |
| | Other | 29.5% |
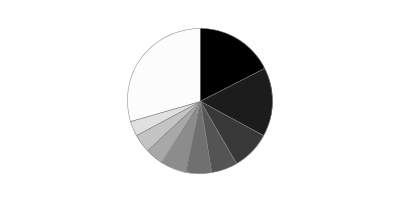
| As of October 31, 2016 |
| | Japan | 18.7% |
| | United Kingdom | 13.2% |
| | France | 9.3% |
| | Germany | 8.2% |
| | Netherlands | 4.8% |
| | United States of America* | 4.5% |
| | Switzerland | 4.2% |
| | Hong Kong | 3.6% |
| | Sweden | 3.5% |
| | Other | 30.0% |
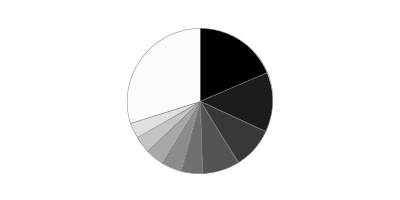
* Includes Short-Term investments and Net Other Assets (Liabilities).
Percentages are based on country or territory of incorporation and are adjusted for the effect of futures contracts, if applicable.
Asset Allocation as of April 30, 2017
| | % of fund's net assets | % of fund's net assets 6 months ago |
| Stocks and Equity Futures | 98.3 | 98.8 |
| Short-Term Investments and Net Other Assets (Liabilities) | 1.7 | 1.2 |
Top Ten Stocks as of April 30, 2017
| | % of fund's net assets | % of fund's net assets 6 months ago |
| Total SA (France, Oil, Gas & Consumable Fuels) | 2.1 | 2.1 |
| SAP AG (Germany, Software) | 1.7 | 1.7 |
| Micro Focus International PLC (United Kingdom, Software) | 1.4 | 1.1 |
| Statoil ASA (Norway, Oil, Gas & Consumable Fuels) | 1.3 | 1.5 |
| Unilever NV (Certificaten Van Aandelen) (Bearer) (Netherlands, Personal Products) | 1.2 | 1.6 |
| Koninklijke Philips Electronics NV (Netherlands, Industrial Conglomerates) | 1.2 | 0.6 |
| Naspers Ltd. Class N (South Africa, Media) | 1.2 | 1.2 |
| Housing Development Finance Corp. Ltd. (India, Thrifts & Mortgage Finance) | 1.2 | 1.2 |
| British American Tobacco PLC (United Kingdom, Tobacco) | 1.2 | 0.8 |
| ORIX Corp. (Japan, Diversified Financial Services) | 1.1 | 1.3 |
| | 13.6 | |
Top Market Sectors as of April 30, 2017
| | % of fund's net assets | % of fund's net assets 6 months ago |
| Financials | 20.8 | 20.8 |
| Industrials | 16.4 | 14.6 |
| Consumer Discretionary | 13.9 | 13.8 |
| Information Technology | 13.3 | 11.7 |
| Consumer Staples | 10.0 | 12.9 |
| Health Care | 7.7 | 8.2 |
| Materials | 6.2 | 5.4 |
| Energy | 4.8 | 4.7 |
| Telecommunication Services | 2.8 | 2.7 |
| Real Estate | 1.1 | 1.9 |
Investments April 30, 2017 (Unaudited)
Showing Percentage of Net Assets
| Common Stocks - 97.5% | | | |
| | | Shares | Value (000s) |
| Australia - 2.3% | | | |
| Altium Ltd. | | 1,569,213 | $9,635 |
| Australia & New Zealand Banking Group Ltd. | | 2,511,358 | 61,605 |
| Bapcor Ltd. | | 8,624,274 | 33,775 |
| Magellan Financial Group Ltd. | | 1,204,177 | 21,262 |
| Ramsay Health Care Ltd. | | 1,008,165 | 54,127 |
| Spark Infrastructure Group unit | | 19,012,123 | 35,448 |
|
| TOTAL AUSTRALIA | | | 215,852 |
|
| Austria - 1.0% | | | |
| Erste Group Bank AG | | 1,271,400 | 45,454 |
| Wienerberger AG | | 2,092,000 | 48,995 |
|
| TOTAL AUSTRIA | | | 94,449 |
|
| Bailiwick of Jersey - 1.8% | | | |
| Glencore Xstrata PLC | | 16,946,469 | 66,648 |
| IWG PLC | | 6,386,188 | 26,874 |
| Randgold Resources Ltd. sponsored ADR | | 189,614 | 16,684 |
| Shire PLC | | 552,000 | 32,545 |
| Wolseley PLC | | 503,038 | 31,972 |
|
| TOTAL BAILIWICK OF JERSEY | | | 174,723 |
|
| Belgium - 1.5% | | | |
| Anheuser-Busch InBev SA NV | | 425,227 | 47,953 |
| KBC Groep NV | | 1,303,959 | 94,144 |
|
| TOTAL BELGIUM | | | 142,097 |
|
| Canada - 2.0% | | | |
| Alimentation Couche-Tard, Inc. Class B (sub. vtg.) | | 725,100 | 33,348 |
| Cenovus Energy, Inc. | | 3,404,200 | 33,941 |
| Constellation Software, Inc. | | 95,200 | 43,541 |
| Franco-Nevada Corp. | | 227,700 | 15,511 |
| PrairieSky Royalty Ltd. (a) | | 1,810,573 | 39,460 |
| Suncor Energy, Inc. | | 676,200 | 21,192 |
|
| TOTAL CANADA | | | 186,993 |
|
| Cayman Islands - 2.2% | | | |
| Alibaba Group Holding Ltd. sponsored ADR (b) | | 417,200 | 48,187 |
| Ctrip.com International Ltd. ADR (b) | | 254,000 | 12,830 |
| JD.com, Inc. sponsored ADR (b) | | 1,261,000 | 44,223 |
| Melco Crown Entertainment Ltd. sponsored ADR | | 1,338,700 | 29,384 |
| New Oriental Education & Technology Group, Inc. sponsored ADR (b) | | 1,085,900 | 70,084 |
|
| TOTAL CAYMAN ISLANDS | | | 204,708 |
|
| China - 1.1% | | | |
| Kweichow Moutai Co. Ltd. (A Shares) | | 623,582 | 37,403 |
| Shanghai International Airport Co. Ltd. (A Shares) | | 5,861,900 | 29,125 |
| Wuliangye Yibin Co. Ltd. Class A | | 5,202,900 | 34,341 |
|
| TOTAL CHINA | | | 100,869 |
|
| Denmark - 1.0% | | | |
| Nets A/S (c) | | 1,621,800 | 29,499 |
| Novo Nordisk A/S Series B | | 991,645 | 38,612 |
| Novozymes A/S Series B | | 595,300 | 25,719 |
|
| TOTAL DENMARK | | | 93,830 |
|
| Finland - 0.5% | | | |
| Sampo Oyj (A Shares) (a) | | 934,600 | 44,784 |
| France - 8.6% | | | |
| ALTEN | | 336,259 | 28,497 |
| Altran Technologies SA | | 1,492,300 | 25,050 |
| Amundi SA | | 967,958 | 63,686 |
| Atos Origin SA | | 181,865 | 23,832 |
| AXA SA | | 1,278,800 | 34,119 |
| BNP Paribas SA | | 778,100 | 54,907 |
| Capgemini SA | | 395,600 | 39,608 |
| Cegedim SA (b) | | 536,390 | 14,923 |
| Havas SA | | 4,515,981 | 41,760 |
| Kaufman & Broad SA | | 235,300 | 9,227 |
| Maisons du Monde SA | | 1,122,200 | 38,946 |
| Rexel SA | | 1,540,100 | 27,513 |
| Rubis | | 373,700 | 37,972 |
| Societe Generale Series A | | 814,400 | 44,656 |
| Sodexo SA | | 388,500 | 49,387 |
| Total SA (a) | | 3,804,504 | 195,290 |
| VINCI SA (a) | | 961,800 | 81,982 |
|
| TOTAL FRANCE | | | 811,355 |
|
| Germany - 5.7% | | | |
| adidas AG | | 252,900 | 50,662 |
| Aumann AG | | 68,000 | 4,472 |
| Axel Springer Verlag AG | | 604,902 | 33,941 |
| Deutsche Borse AG | | 164,581 | 16,108 |
| Deutsche Post AG | | 1,743,413 | 62,665 |
| Deutsche Telekom AG | | 1,845,500 | 32,372 |
| Fresenius SE & Co. KGaA | | 440,400 | 35,697 |
| Henkel AG & Co. KGaA | | 342,700 | 39,999 |
| Nexus AG | | 614,500 | 14,793 |
| Rational AG | | 92,205 | 46,332 |
| SAP AG | | 1,627,467 | 163,017 |
| Wirecard AG (a) | | 594,600 | 35,112 |
|
| TOTAL GERMANY | | | 535,170 |
|
| Hong Kong - 1.1% | | | |
| AIA Group Ltd. | | 9,308,600 | 64,444 |
| Techtronic Industries Co. Ltd. | | 10,282,000 | 44,151 |
|
| TOTAL HONG KONG | | | 108,595 |
|
| India - 2.9% | | | |
| Avenue Supermarts Ltd. | | 595,148 | 6,818 |
| Bharti Infratel Ltd. | | 10,548,301 | 58,197 |
| HDFC Bank Ltd. | | 1,034,409 | 25,252 |
| HDFC Bank Ltd. sponsored ADR | | 965,784 | 76,886 |
| Housing Development Finance Corp. Ltd. | | 4,692,201 | 112,189 |
|
| TOTAL INDIA | | | 279,342 |
|
| Indonesia - 0.6% | | | |
| PT Bank Central Asia Tbk | | 16,688,600 | 22,224 |
| PT Bank Rakyat Indonesia Tbk | | 32,624,300 | 31,574 |
|
| TOTAL INDONESIA | | | 53,798 |
|
| Ireland - 2.7% | | | |
| Cairn Homes PLC (b) | | 17,549,270 | 29,917 |
| CRH PLC | | 2,144,300 | 78,104 |
| DCC PLC (United Kingdom) | | 244,251 | 22,556 |
| Green REIT PLC | | 9,492,200 | 14,114 |
| James Hardie Industries PLC CDI | | 1,790,532 | 30,395 |
| Kerry Group PLC Class A | | 574,300 | 46,931 |
| Ryanair Holdings PLC sponsored ADR (b) | | 319,377 | 29,360 |
|
| TOTAL IRELAND | | | 251,377 |
|
| Isle of Man - 0.7% | | | |
| Paysafe Group PLC (b) | | 10,565,025 | 62,111 |
| Israel - 0.6% | | | |
| Frutarom Industries Ltd. | | 893,500 | 52,523 |
| Italy - 0.6% | | | |
| De Longhi SpA | | 734,500 | 22,403 |
| Intesa Sanpaolo SpA | | 12,757,000 | 37,239 |
|
| TOTAL ITALY | | | 59,642 |
|
| Japan - 17.1% | | | |
| ACOM Co. Ltd. (b) | | 2,209,000 | 9,809 |
| Aozora Bank Ltd. | | 8,893,000 | 32,389 |
| Daito Trust Construction Co. Ltd. | | 246,600 | 36,279 |
| Dentsu, Inc. | | 1,086,800 | 61,225 |
| Hoya Corp. | | 1,473,700 | 70,383 |
| KDDI Corp. | | 3,926,700 | 104,113 |
| Keyence Corp. | | 197,720 | 79,460 |
| Komatsu Ltd. | | 1,614,100 | 43,131 |
| Misumi Group, Inc. | | 2,754,800 | 52,168 |
| Mitsubishi UFJ Financial Group, Inc. | | 13,391,800 | 84,858 |
| Monex Group, Inc. | | 12,015,949 | 30,074 |
| Morinaga & Co. Ltd. | | 578,200 | 27,335 |
| Nidec Corp. | | 324,300 | 29,732 |
| Nintendo Co. Ltd. | | 122,200 | 30,925 |
| Nitori Holdings Co. Ltd. | | 382,300 | 49,762 |
| Olympus Corp. | | 2,085,300 | 80,251 |
| OMRON Corp. | | 920,100 | 38,504 |
| ORIX Corp. | | 7,007,900 | 106,934 |
| Panasonic Corp. | | 4,045,000 | 48,371 |
| Recruit Holdings Co. Ltd. | | 1,435,300 | 72,489 |
| Relo Holdings Corp. | | 1,784,000 | 29,287 |
| Shionogi & Co. Ltd. | | 617,700 | 31,767 |
| SMC Corp. | | 139,300 | 39,225 |
| SMS Co., Ltd. | | 1,148,500 | 30,568 |
| SoftBank Corp. | | 820,400 | 62,230 |
| Sony Corp. | | 2,984,900 | 102,425 |
| Start Today Co. Ltd. | | 2,494,700 | 53,262 |
| Sundrug Co. Ltd. | | 1,146,800 | 40,224 |
| Tsuruha Holdings, Inc. | | 557,800 | 56,543 |
| VT Holdings Co. Ltd. | | 3,872,500 | 19,697 |
| Welcia Holdings Co. Ltd. | | 1,934,800 | 62,309 |
|
| TOTAL JAPAN | | | 1,615,729 |
|
| Luxembourg - 0.7% | | | |
| Eurofins Scientific SA | | 144,039 | 70,935 |
| Marshall Islands - 0.2% | | | |
| Hoegh LNG Partners LP | | 715,655 | 14,492 |
| Netherlands - 5.7% | | | |
| ASML Holding NV (Netherlands) | | 632,000 | 83,542 |
| Basic-Fit NV | | 579,100 | 10,125 |
| IMCD Group BV | | 1,603,400 | 86,369 |
| ING Groep NV (Certificaten Van Aandelen) | | 4,886,500 | 79,648 |
| Intertrust NV | | 1,544,800 | 30,963 |
| Koninklijke Philips Electronics NV | | 3,314,100 | 114,444 |
| Takeaway.com Holding BV (c) | | 378,700 | 12,755 |
| Unilever NV (Certificaten Van Aandelen) (Bearer) | | 2,238,000 | 117,239 |
| Van Lanschot NV (Bearer) | | 223,700 | 6,080 |
|
| TOTAL NETHERLANDS | | | 541,165 |
|
| New Zealand - 0.8% | | | |
| EBOS Group Ltd. | | 3,154,998 | 39,664 |
| Ryman Healthcare Group Ltd. | | 6,562,126 | 38,883 |
|
| TOTAL NEW ZEALAND | | | 78,547 |
|
| Norway - 1.7% | | | |
| Schibsted ASA (A Shares) | | 1,355,900 | 33,716 |
| Statoil ASA (a) | | 7,690,694 | 126,657 |
|
| TOTAL NORWAY | | | 160,373 |
|
| Philippines - 0.3% | | | |
| SM Investments Corp. | | 2,042,375 | 29,647 |
| Romania - 0.3% | | | |
| Banca Transilvania SA | | 37,524,532 | 24,852 |
| South Africa - 1.7% | | | |
| Aspen Pharmacare Holdings Ltd. | | 656,700 | 13,623 |
| EOH Holdings Ltd. | | 3,062,767 | 32,418 |
| Naspers Ltd. Class N | | 598,300 | 113,768 |
|
| TOTAL SOUTH AFRICA | | | 159,809 |
|
| Spain - 4.1% | | | |
| Amadeus IT Holding SA Class A | | 811,000 | 43,729 |
| Atresmedia Corporacion de Medios de Comunicacion SA | | 1,719,200 | 21,593 |
| CaixaBank SA | | 18,486,033 | 83,935 |
| Grifols SA ADR | | 2,404,158 | 52,194 |
| Hispania Activos Inmobiliarios SA | | 1,424,325 | 21,504 |
| Inditex SA | | 1,924,054 | 73,796 |
| Mediaset Espana Comunicacion SA | | 2,836,600 | 39,103 |
| Neinor Homes SLU | | 1,128,700 | 22,260 |
| Prosegur Cash SA | | 12,570,400 | 32,041 |
|
| TOTAL SPAIN | | | 390,155 |
|
| Sweden - 4.2% | | | |
| ASSA ABLOY AB (B Shares) (a) | | 3,095,800 | 67,073 |
| Com Hem Holding AB | | 847,200 | 10,550 |
| HEXPOL AB (B Shares) | | 1,872,700 | 20,815 |
| Indutrade AB | | 1,342,200 | 31,716 |
| Nordea Bank AB | | 4,510,400 | 55,506 |
| Saab AB (B Shares) | | 979,400 | 48,565 |
| Sandvik AB (a) | | 2,729,900 | 43,827 |
| Svenska Cellulosa AB (SCA) (B Shares) | | 2,683,200 | 88,882 |
| Svenska Handelsbanken AB (A Shares) | | 2,492,700 | 35,376 |
|
| TOTAL SWEDEN | | | 402,310 |
|
| Switzerland - 5.8% | | | |
| ABB Ltd. (Reg.) | | 3,714,650 | 91,025 |
| Credit Suisse Group AG | | 2,880,071 | 43,924 |
| Forbo Holding AG (Reg.) | | 13,976 | 22,909 |
| Julius Baer Group Ltd. | | 873,100 | 45,529 |
| Kaba Holding AG (B Shares) (Reg.) | | 41,400 | 35,471 |
| Nestle SA (Reg. S) | | 825,949 | 63,615 |
| Panalpina Welttransport Holding AG (a) | | 286,330 | 37,899 |
| Partners Group Holding AG | | 108,566 | 65,631 |
| Schindler Holding AG (participation certificate) | | 170,348 | 34,806 |
| Syngenta AG (b) | | 120,996 | 56,096 |
| UBS Group AG | | 3,195,750 | 54,601 |
|
| TOTAL SWITZERLAND | | | 551,506 |
|
| Taiwan - 0.9% | | | |
| Largan Precision Co. Ltd. | | 303,000 | 50,278 |
| Taiwan Semiconductor Manufacturing Co. Ltd. | | 5,895,000 | 37,910 |
|
| TOTAL TAIWAN | | | 88,188 |
|
| United Kingdom - 15.4% | | | |
| Aggreko PLC | | 2,825,800 | 32,482 |
| Ascential PLC | | 2,492,536 | 11,390 |
| BAE Systems PLC | | 4,026,900 | 32,706 |
| Barclays PLC | | 13,597,151 | 37,235 |
| BCA Marketplace PLC | | 7,762,300 | 19,756 |
| BHP Billiton PLC | | 4,323,364 | 65,911 |
| Booker Group PLC | | 18,014,400 | 45,265 |
| British American Tobacco PLC: | | | |
| (United Kingdom) | | 1,184,800 | 80,049 |
| sponsored ADR (a) | | 423,000 | 28,781 |
| Bunzl PLC | | 1,636,000 | 51,024 |
| Cineworld Group PLC | | 2,055,200 | 18,740 |
| CMC Markets PLC | | 12,077,600 | 19,632 |
| Compass Group PLC | | 1,891,700 | 38,195 |
| Countryside Properties PLC | | 3,312,793 | 11,576 |
| Dialog Semiconductor PLC (b) | | 585,500 | 27,393 |
| Diploma PLC | | 2,312,600 | 33,218 |
| GlaxoSmithKline PLC | | 3,518,200 | 70,814 |
| Imperial Tobacco Group PLC | | 852,167 | 41,743 |
| Jiangsu Yanghe Brewery JSC Ltd. ELS (HSBC Warrant Program) warrants 9/19/19 (b)(c) | | 2,466,200 | 28,621 |
| John Wood Group PLC | | 2,221,100 | 21,849 |
| LivaNova PLC (b) | | 607,800 | 32,031 |
| London Stock Exchange Group PLC | | 1,262,636 | 55,324 |
| Melrose Industries PLC | | 31,513,724 | 96,531 |
| Micro Focus International PLC | | 3,845,400 | 128,897 |
| Moneysupermarket.com Group PLC | | 5,210,600 | 23,344 |
| NCC Group Ltd. (a) | | 9,151,300 | 16,890 |
| Reckitt Benckiser Group PLC | | 757,300 | 69,776 |
| Rex Bionics PLC (b)(d) | | 1,297,286 | 109 |
| Rio Tinto PLC | | 1,828,100 | 72,119 |
| Senior Engineering Group PLC | | 7,132,100 | 19,805 |
| Softcat PLC | | 4,924,700 | 26,279 |
| Spirax-Sarco Engineering PLC | | 522,100 | 35,164 |
| St. James's Place Capital PLC | | 2,354,900 | 35,015 |
| Standard Chartered PLC (United Kingdom) (b) | | 9,090,621 | 84,915 |
| Zpg PLC | | 8,904,609 | 42,673 |
|
| TOTAL UNITED KINGDOM | | | 1,455,252 |
|
| United States of America - 1.7% | | | |
| Alexion Pharmaceuticals, Inc. (b) | | 280,000 | 35,778 |
| Global Payments, Inc. | | 434,200 | 35,500 |
| Monsanto Co. | | 287,400 | 33,514 |
| MSCI, Inc. | | 503,900 | 50,551 |
| Visa, Inc. Class A | | 102,100 | 9,314 |
|
| TOTAL UNITED STATES OF AMERICA | | | 164,657 |
|
| TOTAL COMMON STOCKS | | | |
| (Cost $7,564,119) | | | 9,219,835 |
|
| Convertible Preferred Stocks - 0.3% | | | |
| Cayman Islands - 0.3% | | | |
| China Internet Plus Holdings Ltd. Series A-11 (b)(e) | | | |
| (Cost $18,833) | | 5,958,244 | 28,540 |
| | | Principal Amount (000s) | Value (000s) |
|
| Government Obligations - 0.0% | | | |
| United States of America - 0.0% | | | |
| U.S. Treasury Bills, yield at date of purchase 0.67% to 0.76% 6/1/17 to 6/22/17(f) | | | |
| (Cost $1,809) | | 1,810 | 1,809 |
| | | Shares | Value (000s) |
|
| Money Market Funds - 3.4% | | | |
| Fidelity Cash Central Fund, 0.85% (g) | | 116,041,297 | 116,065 |
| Fidelity Securities Lending Cash Central Fund 0.86% (g)(h) | | 210,503,210 | 210,524 |
| TOTAL MONEY MARKET FUNDS | | | |
| (Cost $326,594) | | | 326,589 |
| TOTAL INVESTMENT PORTFOLIO - 101.2% | | | |
| (Cost $7,911,355) | | | 9,576,773 |
| NET OTHER ASSETS (LIABILITIES) - (1.2)% | | | (116,324) |
| NET ASSETS - 100% | | | $9,460,449 |
| Futures Contracts | | | |
| | Expiration Date | Underlying Face Amount at Value (000s) | Unrealized Appreciation/(Depreciation) (000s) |
| Purchased | | | |
| Equity Index Contracts | | | |
| 335 TSE TOPIX Index Contracts (Japan) | June 2017 | 45,979 | $(332) |
The face value of futures purchased as a percentage of Net Assets is .5%
Security Type Abbreviations
ELS - Equity-Linked Security –
Categorizations in the Schedule of Investments are based on country or territory of incorporation.
Legend
(a) Security or a portion of the security is on loan at period end.
(b) Non-income producing
(c) Security exempt from registration under Rule 144A of the Securities Act of 1933. These securities may be resold in transactions exempt from registration, normally to qualified institutional buyers. At the end of the period, the value of these securities amounted to $70,875,000 or 0.7% of net assets.
(d) Affiliated company
(e) Restricted securities - Investment in securities not registered under the Securities Act of 1933 (excluding 144A issues). At the end of the period, the value of restricted securities (excluding 144A issues) amounted to $28,540,000 or 0.3% of net assets.
(f) Security or a portion of the security was pledged to cover margin requirements for futures contracts. At period end, the value of securities pledged amounted to $1,809,000.
(g) Affiliated fund that is generally available only to investment companies and other accounts managed by Fidelity Investments. The rate quoted is the annualized seven-day yield of the fund at period end. A complete unaudited listing of the fund's holdings as of its most recent quarter end is available upon request. In addition, each Fidelity Central Fund's financial statements are available on the SEC's website or upon request.
(h) Investment made with cash collateral received from securities on loan.
Additional information on each restricted holding is as follows:
| Security | Acquisition Date | Acquisition Cost (000s) |
| China Internet Plus Holdings Ltd. Series A-11 | 1/26/15 | $18,833 |
Affiliated Central Funds
Information regarding fiscal year to date income earned by the Fund from investments in Fidelity Central Funds is as follows:
| Fund | Income earned |
| | (Amounts in thousands) |
| Fidelity Cash Central Fund | $474 |
| Fidelity Securities Lending Cash Central Fund | 2,019 |
| Total | $2,493 |
Other Affiliated Issuers
An affiliated company is a company in which the Fund has ownership of at least 5% of the voting securities. Fiscal year to date transactions with companies which are or were affiliates are as follows:
| Affiliate (Amounts in thousands) | Value, beginning of period | Purchases | Sales Proceeds | Dividend Income | Value, end of period |
| Hoegh LNG Partners LP | $12,739 | $-- | $-- | $590 | $-- |
| Rex Bionics PLC | 357 | -- | -- | -- | 109 |
| Total | $13,096 | $-- | $-- | $590 | $109 |
Investment Valuation
The following is a summary of the inputs used, as of April 30, 2017, involving the Fund's assets and liabilities carried at fair value. The inputs or methodology used for valuing securities may not be an indication of the risk associated with investing in those securities. For more information on valuation inputs, and their aggregation into the levels used below, please refer to the Investment Valuation section in the accompanying Notes to Financial Statements.
| | Valuation Inputs at Reporting Date: |
| Description | Total | Level 1 | Level 2 | Level 3 |
| (Amounts in thousands) | | | | |
| Investments in Securities: | | | | |
| Equities: | | | | |
| Consumer Discretionary | $1,330,472 | $999,173 | $302,759 | $28,540 |
| Consumer Staples | 961,736 | 583,104 | 378,632 | -- |
| Energy | 452,881 | 130,934 | 321,947 | -- |
| Financials | 1,953,013 | 1,407,997 | 545,016 | -- |
| Health Care | 727,129 | 585,049 | 142,080 | -- |
| Industrials | 1,552,331 | 1,094,406 | 457,925 | -- |
| Information Technology | 1,245,713 | 974,253 | 271,460 | -- |
| Materials | 583,034 | 366,900 | 216,134 | -- |
| Real Estate | 101,184 | 101,184 | -- | -- |
| Telecommunication Services | 267,462 | 68,747 | 198,715 | -- |
| Utilities | 73,420 | 73,420 | -- | -- |
| Government Obligations | 1,809 | -- | 1,809 | -- |
| Money Market Funds | 326,589 | 326,589 | -- | -- |
| Total Investments in Securities: | $9,576,773 | $6,711,756 | $2,836,477 | $28,540 |
| Derivative Instruments: | | | | |
| Liabilities | | | | |
| Futures Contracts | $(332) | $(332) | $-- | $-- |
| Total Liabilities | $(332) | $(332) | $-- | $-- |
| Total Derivative Instruments: | $(332) | $(332) | $-- | $-- |
The following is a summary of transfers between Level 1 and Level 2 for the period ended April 30, 2017. Transfers are assumed to have occurred at the beginning of the period, and are primarily attributable to the valuation techniques used for foreign equity securities, as discussed in the accompanying Notes to Financial Statements:
| Transfers | Total (000s) |
| (Amounts in thousands) | |
| Level 1 to Level 2 | $613,313 |
| Level 2 to Level 1 | $186,375 |
Value of Derivative Instruments
The following table is a summary of the Fund's value of derivative instruments by primary risk exposure as of April 30, 2017. For additional information on derivative instruments, please refer to the Derivative Instruments section in the accompanying Notes to Financial Statements.
| Primary Risk Exposure / Derivative Type | Value |
| | Asset | Liability |
| (Amounts in thousands) | | |
| Equity Risk | | |
| Futures Contracts(a) | $0 | $(332) |
| Total Equity Risk | 0 | (332) |
| Total Value of Derivatives | $0 | $(332) |
(a) Reflects gross cumulative appreciation (depreciation) on futures contracts as presented in the Schedule of Investments. In the Statement of Assets and Liabilities, the period end daily variation margin is included in receivable or payable for daily variation margin for derivative instruments, and the net cumulative appreciation (depreciation) is included in net unrealized appreciation (depreciation).
See accompanying notes which are an integral part of the financial statements.
Financial Statements
Statement of Assets and Liabilities
| Amounts in thousands (except per-share amounts) | | April 30, 2017 (Unaudited) |
| Assets | | |
Investment in securities, at value (including securities loaned of $198,644) — See accompanying schedule:
Unaffiliated issuers (cost $7,580,820) | $9,250,075 | |
| Fidelity Central Funds (cost $326,594) | 326,589 | |
| Other affiliated issuers (cost $3,941) | 109 | |
| Total Investments (cost $7,911,355) | | $9,576,773 |
| Cash | | 1,328 |
| Foreign currency held at value (cost $139) | | 138 |
| Receivable for investments sold | | 68,391 |
| Receivable for fund shares sold | | 4,781 |
| Dividends receivable | | 39,247 |
| Distributions receivable from Fidelity Central Funds | | 566 |
| Prepaid expenses | | 6 |
| Other receivables | | 4,862 |
| Total assets | | 9,696,092 |
| Liabilities | | |
| Payable for investments purchased | $10,134 | |
| Payable for fund shares redeemed | 6,723 | |
| Accrued management fee | 5,911 | |
| Distribution and service plan fees payable | 81 | |
| Payable for daily variation margin for derivative instruments | 301 | |
| Other affiliated payables | 1,304 | |
| Other payables and accrued expenses | 636 | |
| Collateral on securities loaned | 210,553 | |
| Total liabilities | | 235,643 |
| Net Assets | | $9,460,449 |
| Net Assets consist of: | | |
| Paid in capital | | $7,982,465 |
| Undistributed net investment income | | 39,560 |
| Accumulated undistributed net realized gain (loss) on investments and foreign currency transactions | | (224,753) |
| Net unrealized appreciation (depreciation) on investments and assets and liabilities in foreign currencies | | 1,663,177 |
| Net Assets | | $9,460,449 |
| Calculation of Maximum Offering Price | | |
| Class A: | | |
| Net Asset Value and redemption price per share ($231,623 ÷ 5,643.7 shares) | | $41.04 |
| Maximum offering price per share (100/94.25 of $41.04) | | $43.54 |
| Class M: | | |
| Net Asset Value and redemption price per share ($32,697 ÷ 801.0 shares) | | $40.82 |
| Maximum offering price per share (100/96.50 of $40.82) | | $42.30 |
| Class C: | | |
| Net Asset Value and offering price per share ($25,453 ÷ 627.5 shares)(a) | | $40.56 |
| International Discovery: | | |
| Net Asset Value, offering price and redemption price per share ($6,578,139 ÷ 159,270.9 shares) | | $41.30 |
| Class K: | | |
| Net Asset Value, offering price and redemption price per share ($1,916,593 ÷ 46,511.3 shares) | | $41.21 |
| Class I: | | |
| Net Asset Value, offering price and redemption price per share ($593,899 ÷ 14,413.6 shares) | | $41.20 |
| Class Z: | | |
| Net Asset Value, offering price and redemption price per share ($82,045 ÷ 1,992.4 shares) | | $41.18 |
(a) Redemption price per share is equal to net asset value less any applicable contingent deferred sales charge.
See accompanying notes which are an integral part of the financial statements.
Statement of Operations
| Amounts in thousands | | Six months ended April 30, 2017 (Unaudited) |
| Investment Income | | |
| Dividends (including $590 earned from other affiliated issuers) | | $92,257 |
| Interest | | 7 |
| Income from Fidelity Central Funds | | 2,493 |
| Income before foreign taxes withheld | | 94,757 |
| Less foreign taxes withheld | | (8,456) |
| Total income | | 86,301 |
| Expenses | | |
| Management fee | | |
| Basic fee | $30,315 | |
| Performance adjustment | 94 | |
| Transfer agent fees | 6,986 | |
| Distribution and service plan fees | 488 | |
| Accounting and security lending fees | 877 | |
| Custodian fees and expenses | 645 | |
| Independent trustees' fees and expenses | 19 | |
| Registration fees | 131 | |
| Audit | 66 | |
| Legal | 36 | |
| Miscellaneous | 36 | |
| Total expenses before reductions | 39,693 | |
| Expense reductions | (1,074) | 38,619 |
| Net investment income (loss) | | 47,682 |
| Realized and Unrealized Gain (Loss) | | |
| Net realized gain (loss) on: | | |
| Investment securities: | | |
| Unaffiliated issuers | 405,105 | |
| Fidelity Central Funds | (17) | |
| Foreign currency transactions | (3,861) | |
| Futures contracts | 13,067 | |
| Total net realized gain (loss) | | 414,294 |
Change in net unrealized appreciation (depreciation) on:
Investment securities | 480,137 | |
| Assets and liabilities in foreign currencies | 746 | |
| Futures contracts | (4,118) | |
| Total change in net unrealized appreciation (depreciation) | | 476,765 |
| Net gain (loss) | | 891,059 |
| Net increase (decrease) in net assets resulting from operations | | $938,741 |
See accompanying notes which are an integral part of the financial statements.
Statement of Changes in Net Assets
| Amounts in thousands | Six months ended April 30, 2017 (Unaudited) | Year ended October 31, 2016 |
| Increase (Decrease) in Net Assets | | |
| Operations | | |
| Net investment income (loss) | $47,682 | $162,246 |
| Net realized gain (loss) | 414,294 | (541,847) |
| Change in net unrealized appreciation (depreciation) | 476,765 | (131,024) |
| Net increase (decrease) in net assets resulting from operations | 938,741 | (510,625) |
| Distributions to shareholders from net investment income | (150,174) | (113,434) |
| Distributions to shareholders from net realized gain | (11,939) | (1,362) |
| Total distributions | (162,113) | (114,796) |
| Share transactions - net increase (decrease) | (697,736) | (960,274) |
| Redemption fees | 9 | 70 |
| Total increase (decrease) in net assets | 78,901 | (1,585,625) |
| Net Assets | | |
| Beginning of period | 9,381,548 | 10,967,173 |
| End of period | $9,460,449 | $9,381,548 |
| Other Information | | |
| Undistributed net investment income end of period | $39,560 | $142,052 |
See accompanying notes which are an integral part of the financial statements.
Financial Highlights — Fidelity International Discovery Fund Class A
| | Six months ended (Unaudited) April 30, | Years ended October 31, | | | | |
| | 2017 | 2016 | 2015 | 2014 | 2013 | 2012 |
| Selected Per–Share Data | | | | | | |
| Net asset value, beginning of period | $37.60 | $39.78 | $38.70 | $39.49 | $31.66 | $29.43 |
| Income from Investment Operations | | | | | | |
| Net investment income (loss)A | .13 | .47B | .40C | .53D | .34 | .41 |
| Net realized and unrealized gain (loss) | 3.83 | (2.38) | .79 | (.67) | 7.97 | 2.11 |
| Total from investment operations | 3.96 | (1.91) | 1.19 | (.14) | 8.31 | 2.52 |
| Distributions from net investment income | (.47) | (.27) | (.11) | (.33) | (.45) | (.29) |
| Distributions from net realized gain | (.05) | (.01) | – | (.31) | (.03) | – |
| Total distributions | (.52) | (.27)E | (.11) | (.65)F | (.48) | (.29) |
| Redemption fees added to paid in capitalA,G | – | – | – | – | – | – |
| Net asset value, end of period | $41.04 | $37.60 | $39.78 | $38.70 | $39.49 | $31.66 |
| Total ReturnH,I,J | 10.71% | (4.83)% | 3.09% | (.36)% | 26.59% | 8.70% |
| Ratios to Average Net AssetsK,L | | | | | | |
| Expenses before reductions | 1.24%M | 1.35% | 1.33% | 1.28% | 1.35% | 1.34% |
| Expenses net of fee waivers, if any | 1.24%M | 1.35% | 1.33% | 1.28% | 1.35% | 1.34% |
| Expenses net of all reductions | 1.22%M | 1.34% | 1.32% | 1.28% | 1.33% | 1.31% |
| Net investment income (loss) | .69%M | 1.26%B | 1.00%C | 1.35%D | .97% | 1.41% |
| Supplemental Data | | | | | | |
| Net assets, end of period (in millions) | $232 | $236 | $283 | $297 | $347 | $299 |
| Portfolio turnover rateN | 43%M | 50%O | 60%O | 57%�� | 65% | 68% |
A Calculated based on average shares outstanding during the period.
B Net Investment income per share reflects a large, non-recurring dividend which amounted to $.14 per share. Excluding this non-recurring dividend, the ratio of net investment income (loss) to average net assets would have been .88%.
C Net Investment income per share reflects a large, non-recurring dividend which amounted to $.12 per share. Excluding this non-recurring dividend, the ratio of net investment income (loss) to average net assets would have been .69%.
D Net Investment income per share reflects a large, non-recurring dividend which amounted to $.22 per share. Excluding this non-recurring dividend, the ratio of net investment income (loss) to average net assets would have been .80%.
E Total distributions of $.27 per share is comprised of distributions from net investment income of $.269 and distributions from net realized gain of $.005 per share.
F Total distributions of $.65 per share is comprised of distributions from net investment income of $.334 and distributions from net realized gain of $.311 per share.
G Amount represents less than $.005 per share.
H Total returns for periods of less than one year are not annualized.
I Total returns would have been lower if certain expenses had not been reduced during the applicable periods shown.
J Total returns do not include the effect of the sales charges.
K Fees and expenses of any underlying Fidelity Central Funds are not included in the Fund's expense ratio. The Fund indirectly bears its proportionate share of the expenses of any underlying Fidelity Central Funds.
L Expense ratios reflect operating expenses of the class. Expenses before reductions do not reflect amounts reimbursed by the investment adviser or reductions from brokerage service arrangements or reductions from other expense offset arrangements and do not represent the amount paid by the class during periods when reimbursements or reductions occur. Expenses net of fee waivers reflect expenses after reimbursement by the investment adviser but prior to reductions from brokerage service arrangements or other expense offset arrangements. Expenses net of all reductions represent the net expenses paid by the class.
M Annualized
N Amount does not include the portfolio activity of any underlying Fidelity Central Funds.
O Portfolio turnover rate excludes securities received or delivered in-kind.
See accompanying notes which are an integral part of the financial statements.
Financial Highlights — Fidelity International Discovery Fund Class M
| | Six months ended (Unaudited) April 30, | Years ended October 31, | | | | |
| | 2017 | 2016 | 2015 | 2014 | 2013 | 2012 |
| Selected Per–Share Data | | | | | | |
| Net asset value, beginning of period | $37.34 | $39.51 | $38.43 | $39.23 | $31.42 | $29.18 |
| Income from Investment Operations | | | | | | |
| Net investment income (loss)A | .09 | .38B | .30C | .44D | .26 | .34 |
| Net realized and unrealized gain (loss) | 3.81 | (2.37) | .80 | (.68) | 7.92 | 2.09 |
| Total from investment operations | 3.90 | (1.99) | 1.10 | (.24) | 8.18 | 2.43 |
| Distributions from net investment income | (.37) | (.17) | (.02) | (.25) | (.34) | (.19) |
| Distributions from net realized gain | (.05) | (.01) | – | (.31) | (.03) | – |
| Total distributions | (.42) | (.18) | (.02) | (.56) | (.37) | (.19) |
| Redemption fees added to paid in capitalA,E | – | – | – | – | – | – |
| Net asset value, end of period | $40.82 | $37.34 | $39.51 | $38.43 | $39.23 | $31.42 |
| Total ReturnF,G,H | 10.58% | (5.07)% | 2.86% | (.60)% | 26.31% | 8.41% |
| Ratios to Average Net AssetsI,J | | | | | | |
| Expenses before reductions | 1.48%K | 1.58% | 1.57% | 1.51% | 1.59% | 1.59% |
| Expenses net of fee waivers, if any | 1.48%K | 1.58% | 1.57% | 1.51% | 1.59% | 1.59% |
| Expenses net of all reductions | 1.46%K | 1.57% | 1.56% | 1.51% | 1.57% | 1.56% |
| Net investment income (loss) | .45%K | 1.02%B | .76%C | 1.11%D | .73% | 1.16% |
| Supplemental Data | | | | | | |
| Net assets, end of period (in millions) | $33 | $35 | $43 | $49 | $53 | $46 |
| Portfolio turnover rateL | 43%K | 50%M | 60%M | 57% | 65% | 68% |
A Calculated based on average shares outstanding during the period.
B Net Investment income per share reflects a large, non-recurring dividend which amounted to $.14 per share. Excluding this non-recurring dividend, the ratio of net investment income (loss) to average net assets would have been .64%.
C Net Investment income per share reflects a large, non-recurring dividend which amounted to $.12 per share. Excluding this non-recurring dividend, the ratio of net investment income (loss) to average net assets would have been .45%.
D Net Investment income per share reflects a large, non-recurring dividend which amounted to $.21 per share. Excluding this non-recurring dividend, the ratio of net investment income (loss) to average net assets would have been .56%.
E Amount represents less than $.005 per share.
F Total returns for periods of less than one year are not annualized.
G Total returns would have been lower if certain expenses had not been reduced during the applicable periods shown.
H Total returns do not include the effect of the sales charges.
I Fees and expenses of any underlying Fidelity Central Funds are not included in the Fund's expense ratio. The Fund indirectly bears its proportionate share of the expenses of any underlying Fidelity Central Funds.
J Expense ratios reflect operating expenses of the class. Expenses before reductions do not reflect amounts reimbursed by the investment adviser or reductions from brokerage service arrangements or reductions from other expense offset arrangements and do not represent the amount paid by the class during periods when reimbursements or reductions occur. Expenses net of fee waivers reflect expenses after reimbursement by the investment adviser but prior to reductions from brokerage service arrangements or other expense offset arrangements. Expenses net of all reductions represent the net expenses paid by the class.
K Annualized
L Amount does not include the portfolio activity of any underlying Fidelity Central Funds.
M Portfolio turnover rate excludes securities received or delivered in-kind.
See accompanying notes which are an integral part of the financial statements.
Financial Highlights — Fidelity International Discovery Fund Class C
| | Six months ended (Unaudited) April 30, | Years ended October 31, | | | | |
| | 2017 | 2016 | 2015 | 2014 | 2013 | 2012 |
| Selected Per–Share Data | | | | | | |
| Net asset value, beginning of period | $36.96 | $39.14 | $38.25 | $39.07 | $31.32 | $29.08 |
| Income from Investment Operations | | | | | | |
| Net investment income (loss)A | (.01) | .19B | .10C | .23D | .08 | .19 |
| Net realized and unrealized gain (loss) | 3.79 | (2.37) | .79 | (.66) | 7.90 | 2.09 |
| Total from investment operations | 3.78 | (2.18) | .89 | (.43) | 7.98 | 2.28 |
| Distributions from net investment income | (.13) | – | – | (.08) | (.20) | (.04) |
| Distributions from net realized gain | (.05) | – | – | (.31) | (.03) | – |
| Total distributions | (.18) | – | – | (.39) | (.23) | (.04) |
| Redemption fees added to paid in capitalA,E | – | – | – | – | – | – |
| Net asset value, end of period | $40.56 | $36.96 | $39.14 | $38.25 | $39.07 | $31.32 |
| Total ReturnF,G,H | 10.30% | (5.57)% | 2.33% | (1.10)% | 25.65% | 7.86% |
| Ratios to Average Net AssetsI,J | | | | | | |
| Expenses before reductions | 2.00%K | 2.10% | 2.09% | 2.03% | 2.10% | 2.09% |
| Expenses net of fee waivers, if any | 2.00%K | 2.10% | 2.09% | 2.03% | 2.09% | 2.09% |
| Expenses net of all reductions | 1.98%K | 2.09% | 2.08% | 2.02% | 2.07% | 2.06% |
| Net investment income (loss) | (.07)%K | .50%B | .24%C | .60%D | .23% | .66% |
| Supplemental Data | | | | | | |
| Net assets, end of period (in millions) | $25 | $26 | $32 | $35 | $36 | $30 |
| Portfolio turnover rateL | 43%K | 50%M | 60%M | 57% | 65% | 68% |
A Calculated based on average shares outstanding during the period.
B Net Investment income per share reflects a large, non-recurring dividend which amounted to $.14 per share. Excluding this non-recurring dividend, the ratio of net investment income (loss) to average net assets would have been .13%.
C Net Investment income per share reflects a large, non-recurring dividend which amounted to $.12 per share. Excluding this non-recurring dividend, the ratio of net investment income (loss) to average net assets would have been (.06) %.
D Net Investment income per share reflects a large, non-recurring dividend which amounted to $.21 per share. Excluding this non-recurring dividend, the ratio of net investment income (loss) to average net assets would have been .05%.
E Amount represents less than $.005 per share.
F Total returns for periods of less than one year are not annualized.
G Total returns would have been lower if certain expenses had not been reduced during the applicable periods shown.
H Total returns do not include the effect of the contingent deferred sales charge.
I Fees and expenses of any underlying Fidelity Central Funds are not included in the Fund's expense ratio. The Fund indirectly bears its proportionate share of the expenses of any underlying Fidelity Central Funds.
J Expense ratios reflect operating expenses of the class. Expenses before reductions do not reflect amounts reimbursed by the investment adviser or reductions from brokerage service arrangements or reductions from other expense offset arrangements and do not represent the amount paid by the class during periods when reimbursements or reductions occur. Expenses net of fee waivers reflect expenses after reimbursement by the investment adviser but prior to reductions from brokerage service arrangements or other expense offset arrangements. Expenses net of all reductions represent the net expenses paid by the class.
K Annualized
L Amount does not include the portfolio activity of any underlying Fidelity Central Funds.
M Portfolio turnover rate excludes securities received or delivered in-kind.
See accompanying notes which are an integral part of the financial statements.
Financial Highlights — Fidelity International Discovery Fund
| | Six months ended (Unaudited) April 30, | Years ended October 31, | | | | |
| | 2017 | 2016 | 2015 | 2014 | 2013 | 2012 |
| Selected Per–Share Data | | | | | | |
| Net asset value, beginning of period | $37.91 | $40.12 | $39.03 | $39.82 | $31.91 | $29.69 |
| Income from Investment Operations | | | | | | |
| Net investment income (loss)A | .20 | .61B | .54C | .67D | .47 | .51 |
| Net realized and unrealized gain (loss) | 3.85 | (2.41) | .81 | (.68) | 8.02 | 2.12 |
| Total from investment operations | 4.05 | (1.80) | 1.35 | (.01) | 8.49 | 2.63 |
| Distributions from net investment income | (.61) | (.41) | (.26) | (.47) | (.55) | (.41) |
| Distributions from net realized gain | (.05) | (.01) | – | (.31) | (.03) | – |
| Total distributions | (.66) | (.41)E | (.26) | (.78) | (.58) | (.41) |
| Redemption fees added to paid in capitalA,F | – | – | – | – | – | – |
| Net asset value, end of period | $41.30 | $37.91 | $40.12 | $39.03 | $39.82 | $31.91 |
| Total ReturnG,H | 10.92% | (4.53)% | 3.47% | (.01)% | 27.03% | 9.03% |
| Ratios to Average Net AssetsI,J | | | | | | |
| Expenses before reductions | .89%K | 1.00% | .99% | .93% | 1.00% | 1.01% |
| Expenses net of fee waivers, if any | .89%K | 1.00% | .99% | .93% | 1.00% | 1.01% |
| Expenses net of all reductions | .87%K | .99% | .98% | .93% | .98% | .98% |
| Net investment income (loss) | 1.04%K | 1.61%B | 1.34%C | 1.69%D | 1.32% | 1.73% |
| Supplemental Data | | | | | | |
| Net assets, end of period (in millions) | $6,578 | $6,421 | $7,209 | $7,464 | $7,800 | $5,965 |
| Portfolio turnover rateL | 43%K | 50%M | 60%M | 57% | 65% | 68% |
A Calculated based on average shares outstanding during the period.
B Net Investment income per share reflects a large, non-recurring dividend which amounted to $.14 per share. Excluding this non-recurring dividend, the ratio of net investment income (loss) to average net assets would have been 1.23%.
C Net Investment income per share reflects a large, non-recurring dividend which amounted to $.12 per share. Excluding this non-recurring dividend, the ratio of net investment income (loss) to average net assets would have been 1.03%.
D Net Investment income per share reflects a large, non-recurring dividend which amounted to $.22 per share. Excluding this non-recurring dividend, the ratio of net investment income (loss) to average net assets would have been 1.15%.
E Total distributions of $.41 per share is comprised of distributions from net investment income of $.409 and distributions from net realized gain of $.005 per share.
F Amount represents less than $.005 per share.
G Total returns for periods of less than one year are not annualized.
H Total returns would have been lower if certain expenses had not been reduced during the applicable periods shown.
I Fees and expenses of any underlying Fidelity Central Funds are not included in the Fund's expense ratio. The Fund indirectly bears its proportionate share of the expenses of any underlying Fidelity Central Funds.
J Expense ratios reflect operating expenses of the class. Expenses before reductions do not reflect amounts reimbursed by the investment adviser or reductions from brokerage service arrangements or reductions from other expense offset arrangements and do not represent the amount paid by the class during periods when reimbursements or reductions occur. Expenses net of fee waivers reflect expenses after reimbursement by the investment adviser but prior to reductions from brokerage service arrangements or other expense offset arrangements. Expenses net of all reductions represent the net expenses paid by the class.
K Annualized
L Amount does not include the portfolio activity of any underlying Fidelity Central Funds.
M Portfolio turnover rate excludes securities received or delivered in-kind.
See accompanying notes which are an integral part of the financial statements.
Financial Highlights — Fidelity International Discovery Fund Class K
| | Six months ended (Unaudited) April 30, | Years ended October 31, | | | | |
| | 2017 | 2016 | 2015 | 2014 | 2013 | 2012 |
| Selected Per–Share Data | | | | | | |
| Net asset value, beginning of period | $37.86 | $40.06 | $38.97 | $39.76 | $31.87 | $29.66 |
| Income from Investment Operations | | | | | | |
| Net investment income (loss)A | .22 | .66B | .59C | .72D | .52 | .57 |
| Net realized and unrealized gain (loss) | 3.84 | (2.39) | .81 | (.67) | 8.01 | 2.11 |
| Total from investment operations | 4.06 | (1.73) | 1.40 | .05 | 8.53 | 2.68 |
| Distributions from net investment income | (.66) | (.46) | (.31) | (.53) | (.61) | (.47) |
| Distributions from net realized gain | (.05) | (.01) | – | (.31) | (.03) | – |
| Total distributions | (.71) | (.47) | (.31) | (.84) | (.64) | (.47) |
| Redemption fees added to paid in capitalA,E | – | – | – | – | – | – |
| Net asset value, end of period | $41.21 | $37.86 | $40.06 | $38.97 | $39.76 | $31.87 |
| Total ReturnF,G | 10.98% | (4.38)% | 3.61% | .13% | 27.23% | 9.24% |
| Ratios to Average Net AssetsH,I | | | | | | |
| Expenses before reductions | .76%J | .86% | .86% | .80% | .85% | .83% |
| Expenses net of fee waivers, if any | .76%J | .86% | .86% | .80% | .85% | .83% |
| Expenses net of all reductions | .74%J | .85% | .85% | .79% | .83% | .80% |
| Net investment income (loss) | 1.17%J | 1.74%B | 1.47%C | 1.83%D | 1.47% | 1.91% |
| Supplemental Data | | | | | | |
| Net assets, end of period (in millions) | $1,917 | $1,880 | $2,308 | $2,464 | $2,576 | $1,776 |
| Portfolio turnover rateK | 43%J | 50%L | 60%L | 57% | 65% | 68% |
A Calculated based on average shares outstanding during the period.
B Net Investment income per share reflects a large, non-recurring dividend which amounted to $.14 per share. Excluding this non-recurring dividend, the ratio of net investment income (loss) to average net assets would have been 1.36%.
C Net Investment income per share reflects a large, non-recurring dividend which amounted to $.12 per share. Excluding this non-recurring dividend, the ratio of net investment income (loss) to average net assets would have been 1.16%.
D Net Investment income per share reflects a large, non-recurring dividend which amounted to $.22 per share. Excluding this non-recurring dividend, the ratio of net investment income (loss) to average net assets would have been 1.28%.
E Amount represents less than $.005 per share.
F Total returns for periods of less than one year are not annualized.
G Total returns would have been lower if certain expenses had not been reduced during the applicable periods shown.
H Fees and expenses of any underlying Fidelity Central Funds are not included in the Fund's expense ratio. The Fund indirectly bears its proportionate share of the expenses of any underlying Fidelity Central Funds.
I Expense ratios reflect operating expenses of the class. Expenses before reductions do not reflect amounts reimbursed by the investment adviser or reductions from brokerage service arrangements or reductions from other expense offset arrangements and do not represent the amount paid by the class during periods when reimbursements or reductions occur. Expenses net of fee waivers reflect expenses after reimbursement by the investment adviser but prior to reductions from brokerage service arrangements or other expense offset arrangements. Expenses net of all reductions represent the net expenses paid by the class.
J Annualized
K Amount does not include the portfolio activity of any underlying Fidelity Central Funds.
L Portfolio turnover rate excludes securities received or delivered in-kind.
See accompanying notes which are an integral part of the financial statements.
Financial Highlights — Fidelity International Discovery Fund Class I
| | Six months ended (Unaudited) April 30, | Years ended October 31, | | | | |
| | 2017 | 2016 | 2015 | 2014 | 2013 | 2012 |
| Selected Per–Share Data | | | | | | |
| Net asset value, beginning of period | $37.82 | $40.03 | $38.96 | $39.76 | $31.87 | $29.65 |
| Income from Investment Operations | | | | | | |
| Net investment income (loss)A | .20 | .61B | .53C | .67D | .47 | .52 |
| Net realized and unrealized gain (loss) | 3.84 | (2.40) | .80 | (.68) | 8.01 | 2.11 |
| Total from investment operations | 4.04 | (1.79) | 1.33 | (.01) | 8.48 | 2.63 |
| Distributions from net investment income | (.61) | (.42) | (.26) | (.48) | (.56) | (.41) |
| Distributions from net realized gain | (.05) | (.01) | – | (.31) | (.03) | – |
| Total distributions | (.66) | (.42)E | (.26) | (.79) | (.59) | (.41) |
| Redemption fees added to paid in capitalA,F | – | – | – | – | – | – |
| Net asset value, end of period | $41.20 | $37.82 | $40.03 | $38.96 | $39.76 | $31.87 |
| Total ReturnG,H | 10.90% | (4.52)% | 3.44% | (.01)% | 27.03% | 9.07% |
| Ratios to Average Net AssetsI,J | | | | | | |
| Expenses before reductions | .90%K | 1.00% | 1.00% | .93% | 1.00% | 1.00% |
| Expenses net of fee waivers, if any | .90%K | 1.00% | .99% | .93% | 1.00% | 1.00% |
| Expenses net of all reductions | .87%K | .99% | .98% | .93% | .97% | .97% |
| Net investment income (loss) | 1.03%K | 1.60%B | 1.33%C | 1.69%D | 1.33% | 1.75% |
| Supplemental Data | | | | | | |
| Net assets, end of period (in millions) | $594 | $745 | $1,061 | $650 | $476 | $294 |
| Portfolio turnover rateL | 43%K | 50%M | 60%M | 57% | 65% | 68% |
A Calculated based on average shares outstanding during the period.
B Net Investment income per share reflects a large, non-recurring dividend which amounted to $.14 per share. Excluding this non-recurring dividend, the ratio of net investment income (loss) to average net assets would have been 1.22%.
C Net Investment income per share reflects a large, non-recurring dividend which amounted to $.12 per share. Excluding this non-recurring dividend, the ratio of net investment income (loss) to average net assets would have been 1.03%.
D Net Investment income per share reflects a large, non-recurring dividend which amounted to $.22 per share. Excluding this non-recurring dividend, the ratio of net investment income (loss) to average net assets would have been 1.14%.
E Total distributions of $.42 per share is comprised of distributions from net investment income of $.418 and distributions from net realized gain of $.005 per share.
F Amount represents less than $.005 per share.
G Total returns for periods of less than one year are not annualized.
H Total returns would have been lower if certain expenses had not been reduced during the applicable periods shown.
I Fees and expenses of any underlying Fidelity Central Funds are not included in the Fund's expense ratio. The Fund indirectly bears its proportionate share of the expenses of any underlying Fidelity Central Funds.
J Expense ratios reflect operating expenses of the class. Expenses before reductions do not reflect amounts reimbursed by the investment adviser or reductions from brokerage service arrangements or reductions from other expense offset arrangements and do not represent the amount paid by the class during periods when reimbursements or reductions occur. Expenses net of fee waivers reflect expenses after reimbursement by the investment adviser but prior to reductions from brokerage service arrangements or other expense offset arrangements. Expenses net of all reductions represent the net expenses paid by the class.
K Annualized
L Amount does not include the portfolio activity of any underlying Fidelity Central Funds.
M Portfolio turnover rate excludes securities received or delivered in-kind.
See accompanying notes which are an integral part of the financial statements.
Financial Highlights — Fidelity International Discovery Fund Class Z
| | Six months ended (Unaudited) April 30, | Years ended October 31, | | | |
| | 2017 | 2016 | 2015 | 2014 | 2013 A |
| Selected Per–Share Data | | | | | |
| Net asset value, beginning of period | $37.84 | $40.03 | $38.96 | $39.77 | $37.22 |
| Income from Investment Operations | | | | | |
| Net investment income (loss)B | .22 | .66C | .59D | .72E | .07 |
| Net realized and unrealized gain (loss) | 3.84 | (2.38) | .80 | (.68) | 2.48 |
| Total from investment operations | 4.06 | (1.72) | 1.39 | .04 | 2.55 |
| Distributions from net investment income | (.67) | (.46) | (.32) | (.54) | – |
| Distributions from net realized gain | (.05) | (.01) | – | (.31) | – |
| Total distributions | (.72) | (.47) | (.32) | (.85) | – |
| Redemption fees added to paid in capitalB,F | – | – | – | – | – |
| Net asset value, end of period | $41.18 | $37.84 | $40.03 | $38.96 | $39.77 |
| Total ReturnG,H | 10.97% | (4.36)% | 3.58% | .12% | 6.85% |
| Ratios to Average Net AssetsI,J | | | | | |
| Expenses before reductions | .76%K | .86% | .86% | .80% | .85%K |
| Expenses net of fee waivers, if any | .76%K | .86% | .86% | .80% | .85%K |
| Expenses net of all reductions | .74%K | .85% | .85% | .79% | .83%K |
| Net investment income (loss) | 1.17%K | 1.74%C | 1.47%D | 1.83%E | .76%K |
| Supplemental Data | | | | | |
| Net assets, end of period (in millions) | $82 | $38 | $30 | $35 | $– |
| Portfolio turnover rateL | 43%K | 50%M | 60%M | 57% | 65% |
A For the period August 13, 2013 (commencement of sale of shares) to October 31, 2013.
B Calculated based on average shares outstanding during the period.
C Net Investment income per share reflects a large, non-recurring dividend which amounted to $.14 per share. Excluding this non-recurring dividend, the ratio of net investment income (loss) to average net assets would have been 1.36%.
D Net Investment income per share reflects a large, non-recurring dividend which amounted to $.12 per share. Excluding this non-recurring dividend, the ratio of net investment income (loss) to average net assets would have been 1.16%.
E Net Investment income per share reflects a large, non-recurring dividend which amounted to $.21 per share. Excluding this non-recurring dividend, the ratio of net investment income (loss) to average net assets would have been 1.28%.
F Amount represents less than $.005 per share.
G Total returns for periods of less than one year are not annualized.
H Total returns would have been lower if certain expenses had not been reduced during the applicable periods shown.
I Fees and expenses of any underlying Fidelity Central Funds are not included in the Fund's expense ratio. The Fund indirectly bears its proportionate share of the expenses of any underlying Fidelity Central Funds.
J Expense ratios reflect operating expenses of the class. Expenses before reductions do not reflect amounts reimbursed by the investment adviser or reductions from brokerage service arrangements or reductions from other expense offset arrangements and do not represent the amount paid by the class during periods when reimbursements or reductions occur. Expense ratios before reductions for start-up periods may not be representative of longer-term operating periods. Expenses net of fee waivers reflect expenses after reimbursement by the investment adviser but prior to reductions from brokerage service arrangements or other expense offset arrangements. Expenses net of all reductions represent the net expenses paid by the class.
K Annualized
L Amount does not include the portfolio activity of any underlying Fidelity Central Funds.
M Portfolio turnover rate excludes securities received or delivered in-kind.
See accompanying notes which are an integral part of the financial statements.
Notes to Financial Statements (Unaudited)
For the period ended April 30, 2017
(Amounts in thousands except percentages)
1. Organization.
Fidelity International Discovery Fund (the Fund) is a fund of Fidelity Investment Trust (the Trust) and is authorized to issue an unlimited number of shares. The Trust is registered under the Investment Company Act of 1940, as amended (the 1940 Act), as an open-end management investment company organized as a Massachusetts business trust. The Fund offers Class A, Class M (formerly Class T), Class C, International Discovery, Class K, Class I and Class Z shares, each of which has equal rights as to assets and voting privileges. Each class has exclusive voting rights with respect to matters that affect that class.
After the close of business on June 24, 2016, all outstanding Class B shares were converted to Class A shares. All prior fiscal period dollar and share amounts for Class B presented in the Notes to Financial Statements are for the period November 1, 2015 through June 24, 2016.
2. Investments in Fidelity Central Funds.
The Fund invests in Fidelity Central Funds, which are open-end investment companies generally available only to other investment companies and accounts managed by the investment adviser and its affiliates. The Fund's Schedule of Investments lists each of the Fidelity Central Funds held as of period end, if any, as an investment of the Fund, but does not include the underlying holdings of each Fidelity Central Fund. As an Investing Fund, the Fund indirectly bears its proportionate share of the expenses of the underlying Fidelity Central Funds.
The Money Market Central Funds seek preservation of capital and current income and are managed by Fidelity Investments Money Management, Inc. (FIMM), an affiliate of the investment adviser. Annualized expenses of the Money Market Central Funds as of their most recent shareholder report date are less than .005%.
A complete unaudited list of holdings for each Fidelity Central Fund is available upon request or at the Securities and Exchange Commission (the SEC) website at www.sec.gov. In addition, the financial statements of the Fidelity Central Funds are available on the SEC website or upon request.
3. Significant Accounting Policies.
The Fund is an investment company and applies the accounting and reporting guidance of the Financial Accounting Standards Board (FASB) Accounting Standards Codification Topic 946 Financial Services – Investments Companies. The financial statements have been prepared in conformity with accounting principles generally accepted in the United States of America (GAAP), which require management to make certain estimates and assumptions at the date of the financial statements. Actual results could differ from those estimates. Subsequent events, if any, through the date that the financial statements were issued have been evaluated in the preparation of the financial statements. The following summarizes the significant accounting policies of the Fund:
Investment Valuation. Investments are valued as of 4:00 p.m. Eastern time on the last calendar day of the period. The Board of Trustees (the Board) has delegated the day to day responsibility for the valuation of the Fund's investments to the Fair Value Committee (the Committee) established by the Fund's investment adviser. In accordance with valuation policies and procedures approved by the Board, the Fund attempts to obtain prices from one or more third party pricing vendors or brokers to value its investments. When current market prices, quotations or currency exchange rates are not readily available or reliable, investments will be fair valued in good faith by the Committee, in accordance with procedures adopted by the Board. Factors used in determining fair value vary by investment type and may include market or investment specific events, changes in interest rates and credit quality. The frequency with which these procedures are used cannot be predicted and they may be utilized to a significant extent. The Committee oversees the Fund's valuation policies and procedures and reports to the Board on the Committee's activities and fair value determinations. The Board monitors the appropriateness of the procedures used in valuing the Fund's investments and ratifies the fair value determinations of the Committee.
The Fund categorizes the inputs to valuation techniques used to value its investments into a disclosure hierarchy consisting of three levels as shown below:
- Level 1 – quoted prices in active markets for identical investments
- Level 2 – other significant observable inputs (including quoted prices for similar investments, interest rates, prepayment speeds, etc.)
- Level 3 – unobservable inputs (including the Fund's own assumptions based on the best information available)
Valuation techniques used to value the Fund's investments by major category are as follows:
Equity securities, including restricted securities, for which market quotations are readily available, are valued at the last reported sale price or official closing price as reported by a third party pricing vendor on the primary market or exchange on which they are traded and are categorized as Level 1 in the hierarchy. In the event there were no sales during the day or closing prices are not available, securities are valued at the last quoted bid price or may be valued using the last available price and are generally categorized as Level 2 in the hierarchy. For foreign equity securities, when market or security specific events arise, comparisons to the valuation of American Depositary Receipts (ADRs), futures contracts, Exchange-Traded Funds (ETFs) and certain indexes as well as quoted prices for similar securities may be used and would be categorized as Level 2 in the hierarchy. Utilizing these techniques may result in transfers between Level 1 and Level 2. For equity securities, including restricted securities, where observable inputs are limited, assumptions about market activity and risk are used and these securities may be categorized as Level 3 in the hierarchy.
Debt securities, including restricted securities, are valued based on evaluated prices received from third party pricing vendors or from brokers who make markets in such securities. U.S. government and government agency obligations are valued by pricing vendors who utilize matrix pricing which considers yield or price of bonds of comparable quality, coupon, maturity and type or by broker-supplied prices. When independent prices are unavailable or unreliable, debt securities may be valued utilizing pricing methodologies which consider similar factors that would be used by third party pricing vendors. Debt securities are generally categorized as Level 2 in the hierarchy but may be Level 3 depending on the circumstances.
Futures contracts are valued at the settlement price established each day by the board of trade or exchange on which they are traded and are categorized as Level 1 in the hierarchy. Investments in open-end mutual funds, including the Fidelity Central Funds, are valued at their closing net asset value (NAV) each business day and are categorized as Level 1 in the hierarchy.
Changes in valuation techniques may result in transfers in or out of an assigned level within the disclosure hierarchy. The aggregate value of investments by input level as of April 30, 2017, including information on transfers between Levels 1 and 2, is included at the end of the Fund's Schedule of Investments.
Foreign Currency. The Fund may use foreign currency contracts to facilitate transactions in foreign-denominated securities. Gains and losses from these transactions may arise from changes in the value of the foreign currency or if the counterparties do not perform under the contracts' terms.
Foreign-denominated assets, including investment securities, and liabilities are translated into U.S. dollars at the exchange rates at period end. Purchases and sales of investment securities, income and dividends received and expenses denominated in foreign currencies are translated into U.S. dollars at the exchange rate in effect on the transaction date.
The effects of exchange rate fluctuations on investments are included with the net realized and unrealized gain (loss) on investment securities. Other foreign currency transactions resulting in realized and unrealized gain (loss) are disclosed separately.
Investment Transactions and Income. For financial reporting purposes, the Fund's investment holdings and NAV include trades executed through the end of the last business day of the period. The NAV per share for processing shareholder transactions is calculated as of the close of business of the New York Stock Exchange (NYSE), normally 4:00 p.m. Eastern time and includes trades executed through the end of the prior business day. Gains and losses on securities sold are determined on the basis of identified cost. Dividend income is recorded on the ex-dividend date, except for certain dividends from foreign securities where the ex-dividend date may have passed, which are recorded as soon as the Fund is informed of the ex-dividend date. Non-cash dividends included in dividend income, if any, are recorded at the fair market value of the securities received. Income and capital gain distributions from Fidelity Central Funds, if any, are recorded on the ex-dividend date. Certain distributions received by the Fund represent a return of capital or capital gain. The Fund determines the components of these distributions subsequent to the ex-dividend date, based upon receipt of tax filings or other correspondence relating to the underlying investment. These distributions are recorded as a reduction of cost of investments and/or as a realized gain. Interest income is accrued as earned and includes coupon interest and amortization of premium and accretion of discount on debt securities as applicable. Investment income is recorded net of foreign taxes withheld where recovery of such taxes is uncertain.
Class Allocations and Expenses. Investment income, realized and unrealized capital gains and losses, common expenses of the Fund, and certain fund-level expense reductions, if any, are allocated daily on a pro-rata basis to each class based on the relative net assets of each class to the total net assets of the Fund. Each class differs with respect to transfer agent and distribution and service plan fees incurred. Certain expense reductions may also differ by class. For the reporting period, the allocated portion of income and expenses to each class as a percent of its average net assets may vary due to the timing of recording these transactions in relation to fluctuating net assets of the classes. Expenses directly attributable to a fund are charged to that fund. Expenses attributable to more than one fund are allocated among the respective funds on the basis of relative net assets or other appropriate methods. Expense estimates are accrued in the period to which they relate and adjustments are made when actual amounts are known.
Deferred Trustee Compensation. Under a Deferred Compensation Plan (the Plan), independent Trustees may elect to defer receipt of a portion of their annual compensation. Deferred amounts are invested in a cross-section of Fidelity funds, are marked-to-market and remain in the Fund until distributed in accordance with the Plan. The investment of deferred amounts and the offsetting payable to the Trustees are included in the accompanying Statement of Assets and Liabilities.
Income Tax Information and Distributions to Shareholders. Each year, the Fund intends to qualify as a regulated investment company under Subchapter M of the Internal Revenue Code, including distributing substantially all of its taxable income and realized gains. As a result, no provision for U.S. Federal income taxes is required. The Fund files a U.S. federal tax return, in addition to state and local tax returns as required. The Fund's federal income tax returns are subject to examination by the Internal Revenue Service (IRS) for a period of three fiscal years after they are filed. State and local tax returns may be subject to examination for an additional fiscal year depending on the jurisdiction. Foreign taxes are provided for based on the Fund's understanding of the tax rules and rates that exist in the foreign markets in which it invests.
Distributions are declared and recorded on the ex-dividend date. Income dividends and capital gain distributions are declared separately for each class. Income and capital gain distributions are determined in accordance with income tax regulations, which may differ from GAAP.
Capital accounts within the financial statements are adjusted for permanent book-tax differences. These adjustments have no impact on net assets or the results of operations. Capital accounts are not adjusted for temporary book-tax differences which will reverse in a subsequent period.
Book-tax differences are primarily due to futures contracts, foreign currency transactions, passive foreign investment companies (PFIC), market discount, certain foreign taxes, redemptions in-kind, deferred trustees compensation, capital loss carryforwards and losses deferred due to wash sales.
The federal tax cost of investment securities and unrealized appreciation (depreciation) as of period end were as follows:
| Gross unrealized appreciation | $1,829,440 |
| Gross unrealized depreciation | (167,661) |
| Net unrealized appreciation (depreciation) on securities | $1,661,779 |
| Tax cost | $7,914,994 |
Capital loss carryforwards are only available to offset future capital gains of the Fund to the extent provided by regulations and may be limited. Under the Regulated Investment Company Modernization Act of 2010 (the Act), the Fund is permitted to carry forward capital losses incurred in taxable years beginning after December 22, 2010 for an unlimited period and such capital losses are required to be used prior to any losses that expire. The capital loss carryforward information presented below, including any applicable limitation, is estimated as of prior fiscal period end and is subject to adjustment.
| Fiscal year of expiration | |
| 2017 | $(49,104) |
| No expiration | |
| Short-term | (473,137) |
| Long-term | (90,465) |
| Total no expiration | (563,602) |
| Total capital loss carryforward | $(612,706) |
Short-Term Trading (Redemption) Fees. Shares held by investors in the Fund less than 30 days may have been subject to a redemption fee equal to 1.00% of the NAV of shares redeemed. All redemption fees, which reduce the proceeds of the shareholder redemption, are retained by the Fund and accounted for as an addition to paid in capital. In November 2016, the Board of Trustees approved the removal of the redemption fees effective December 12, 2016.
Restricted Securities. The Fund may invest in securities that are subject to legal or contractual restrictions on resale. These securities generally may be resold in transactions exempt from registration or to the public if the securities are registered. Disposal of these securities may involve time-consuming negotiations and expense, and prompt sale at an acceptable price may be difficult. Information regarding restricted securities is included at the end of the Fund's Schedule of Investments.
4. Derivative Instruments.
Risk Exposures and the Use of Derivative Instruments. The Fund's investment objective allows the Fund to enter into various types of derivative contracts, including futures contracts. Derivatives are investments whose value is primarily derived from underlying assets, indices or reference rates and may be transacted on an exchange or over-the-counter (OTC). Derivatives may involve a future commitment to buy or sell a specified asset based on specified terms, to exchange future cash flows at periodic intervals based on a notional principal amount, or for one party to make one or more payments upon the occurrence of specified events in exchange for periodic payments from the other party.
The Fund used derivatives to increase returns and to manage exposure to certain risks as defined below. The success of any strategy involving derivatives depends on analysis of numerous economic factors, and if the strategies for investment do not work as intended, the Fund may not achieve its objectives.
The Fund's use of derivatives increased or decreased its exposure to the following risk:
| Equity Risk | Equity risk relates to the fluctuations in the value of financial instruments as a result of changes in market prices (other than those arising from interest rate risk or foreign exchange risk), whether caused by factors specific to an individual investment, its issuer, or all factors affecting all instruments traded in a market or market segment.
|
The Fund is also exposed to additional risks from investing in derivatives, such as liquidity risk and counterparty credit risk. Liquidity risk is the risk that the Fund will be unable to close out the derivative in the open market in a timely manner. Counterparty credit risk is the risk that the counterparty will not be able to fulfill its obligation to the Fund. Counterparty credit risk related to exchange-traded futures contracts may be mitigated by the protection provided by the exchange on which they trade.
Investing in derivatives may involve greater risks than investing in the underlying assets directly and, to varying degrees, may involve risk of loss in excess of any initial investment and collateral received and amounts recognized in the Statement of Assets and Liabilities. In addition, there may be the risk that the change in value of the derivative contract does not correspond to the change in value of the underlying instrument.
Futures Contracts. A futures contract is an agreement between two parties to buy or sell a specified underlying instrument for a fixed price at a specified future date. The Fund used futures contracts to manage its exposure to the stock market.
Upon entering into a futures contract, a fund is required to deposit either cash or securities (initial margin) with a clearing broker in an amount equal to a certain percentage of the face value of the contract. Futures contracts are marked-to-market daily and subsequent daily payments (variation margin) are made or received by a fund depending on the daily fluctuations in the value of the futures contracts and are recorded as unrealized appreciation or (depreciation). This receivable and/or payable, if any, is included in daily variation margin for derivative instruments in the Statement of Assets and Liabilities. Realized gain or (loss) is recorded upon the expiration or closing of a futures contract.
Any open futures contracts at period end are presented in the Schedule of Investments under the caption "Futures Contracts". The underlying face amount at value reflects each contract's exposure to the underlying instrument or index at period end and is representative of volume of activity during the period. Securities deposited to meet initial margin requirements are identified in the Schedule of Investments.
During the period the Fund recognized net realized gain (loss) of $13,067 a change in net unrealized appreciation (depreciation) of $(4,118) related to its investment in futures contracts. These amounts are included in the Statement of Operations.
5. Purchases and Sales of Investments.
Purchases and sales of securities, other than short-term securities, aggregated $1,918,011 and $2,727,630, respectively.
Prior Fiscal Year Redemptions In-Kind. During the prior period, 1,487 shares of the Fund held by an unaffiliated entity were redeemed for investments and cash with a value of $55,670. The Fund had a net gain of $10,064 on investments delivered through the in-kind redemptions. The amount of the redemptions is included in share transactions activity shown in the accompanying Statement of Changes in Net Assets as well as the Notes to Financial Statements. The Fund recognized no gain or loss for federal income tax purposes.
6. Fees and Other Transactions with Affiliates.
Management Fee. Fidelity Management & Research Company (the investment adviser) and its affiliates provide the Fund with investment management related services for which the Fund pays a monthly management fee. The management fee is the sum of an individual fund fee rate that is based on an annual rate of .424% of the Fund's average net assets and an annualized group fee rate that averaged .25% during the period. The group fee rate is based upon the average net assets of all the mutual funds advised by the investment adviser, including any mutual funds previously advised by the investment adviser that are currently advised by Fidelity SelectCo, LLC, an affiliate of the investment adviser. The group fee rate decreases as assets under management increase and increases as assets under management decrease. In addition, the management fee is subject to a performance adjustment (up to a maximum of +/- .20% of the Fund's average net assets over a 36 month performance period). The upward or downward adjustment to the management fee is based on the relative investment performance of International Discovery as compared to its benchmark index, the MSCI EAFE Index, over the same 36 month performance period. For the reporting period, the total annualized management fee rate, including the performance adjustment, was .67% of the Fund's average net assets. The performance adjustment included in the management fee rate may be higher or lower than the maximum performance adjustment rate due to the difference between the average net assets for the reporting and performance periods.
Distribution and Service Plan Fees. In accordance with Rule 12b-1 of the 1940 Act, the Fund has adopted separate Distribution and Service Plans for each class of shares. Certain classes pay Fidelity Distributors Corporation (FDC), an affiliate of the investment adviser, separate Distribution and Service Fees, each of which is based on an annual percentage of each class' average net assets. In addition, FDC may pay financial intermediaries for selling shares of the Fund and providing shareholder support services. For the period, the Distribution and Service Fee rates, total fees and amounts retained by FDC were as follows:
| | Distribution
Fee | Service
Fee | Total Fees | Retained
by FDC |
| Class A | -% | .25% | $283 | $3 |
| Class M | .25% | .25% | 82 | –(a) |
| Class C | .75% | .25% | 123 | 9 |
| | | | $488 | $12 |
| (a) In the amount of less than five hundred dollars. | | | | |
Sales Load. FDC may receive a front-end sales charge of up to 5.75% for selling Class A shares and 3.50% for selling Class M shares, some of which is paid to financial intermediaries for selling shares of the Fund. Depending on the holding period, FDC may receive contingent deferred sales charges levied on Class A, Class M and Class C redemptions. The deferred sales charges are 1.00% for Class C shares, 1.00% for certain purchases of Class A shares and .25% for certain purchases of Class M shares.
For the period, sales charge amounts retained by FDC were as follows:
| | Retained
by FDC |
| Class A | $20 |
| Class M | 2 |
| Class C(a) | 2 |
| | $24 |
(a) When Class C shares are initially sold, FDC pays commissions from its own resources to financial intermediaries through which the sales are made.
Transfer Agent Fees. Fidelity Investments Institutional Operations Company, Inc., (FIIOC), an affiliate of the investment adviser, is the transfer, dividend disbursing and shareholder servicing agent for each class of the Fund. FIIOC receives account fees and asset-based fees that vary according to the account size and type of account of the shareholders of the respective classes of the Fund, except for Class K and Class Z. FIIOC receives an asset-based fee of Class K's and Class Z's average net assets. FIIOC pays for typesetting, printing and mailing of shareholder reports, except proxy statements.
For the period, transfer agent fees for each class were as follows:
| | Amount | % of
Class-Level Average
Net Assets(a) |
| Class A | $316 | .28 |
| Class M | 44 | .27 |
| Class C | 36 | .29 |
| International Discovery | 5,560 | .18 |
| Class K | 425 | .05 |
| Class I | 592 | .19 |
| Class Z | 13 | .05 |
| | $6,986 | |
(a) Annualized
Accounting and Security Lending Fees. Fidelity Service Company, Inc. (FSC), an affiliate of the investment adviser, maintains the Fund's accounting records. The accounting fee is based on the level of average net assets for each month. Under a separate contract, FSC administers the security lending program. The security lending fee is based on the number and duration of lending transactions.
Brokerage Commissions. The Fund placed a portion of its portfolio transactions with brokerage firms which are affiliates of the investment adviser. Brokerage commissions are included in net realized gain (loss) and change in net unrealized appreciation (depreciation) in the Statement of Operations. The commissions paid to these affiliated firms were $6 for the period.
Interfund Trades. The Fund may purchase from or sell securities to other Fidelity Funds under procedures adopted by the Board. The procedures have been designed to ensure these interfund trades are executed in accordance with Rule 17a-7 of the 1940 Act. Interfund trades are included within the respective purchases and sales amounts shown in the Purchases and Sales of Investments note.
7. Committed Line of Credit.
The Fund participates with other funds managed by the investment adviser or an affiliate in a $4.25 billion credit facility (the "line of credit") to be utilized for temporary or emergency purposes to fund shareholder redemptions or for other short-term liquidity purposes. The Fund has agreed to pay commitment fees on its pro-rata portion of the line of credit, which amounted to $15 and is reflected in Miscellaneous expenses on the Statement of Operations. During the period, the Fund did not borrow on this line of credit.
8. Security Lending.
The Fund lends portfolio securities through a lending agent from time to time in order to earn additional income. For equity securities, a lending agent is used and may loan securities to certain qualified borrowers, including Fidelity Capital Markets (FCM), a broker-dealer affiliated with the Fund. On the settlement date of the loan, the Fund receives collateral (in the form of U.S. Treasury obligations, letters of credit and/or cash) against the loaned securities and maintains collateral in an amount not less than 100% of the market value of the loaned securities during the period of the loan. The market value of the loaned securities is determined at the close of business of the Fund and any additional required collateral is delivered to the Fund on the next business day. The Fund or borrower may terminate the loan at any time, and if the borrower defaults on its obligation to return the securities loaned because of insolvency or other reasons, the Fund may apply collateral received from the borrower against the obligation. The Fund may experience delays and costs in recovering the securities loaned. Any cash collateral received is invested in the Fidelity Securities Lending Cash Central Fund. The value of loaned securities and cash collateral at period end are disclosed on the Fund's Statement of Assets and Liabilities. Security lending income represents the income earned on investing cash collateral, less rebates paid to borrowers and any lending agent fees associated with the loan, plus any premium payments received for lending certain types of securities. Security lending income is presented in the Statement of Operations as a component of income from Fidelity Central Funds. Total security lending income during the period amounted to $2,019. During the period, there were no securities loaned to FCM.
9. Expense Reductions.
Commissions paid to certain brokers with whom the investment adviser, or its affiliates, places trades on behalf of the Fund include an amount in addition to trade execution, which may be rebated back to the Fund to offset certain expenses. This amount totaled $1,034 for the period.
In addition, during the period the investment adviser reimbursed and/or waived a portion of fund-level operating expenses in the amount of $40.
10. Distributions to Shareholders.
Distributions to shareholders of each class were as follows:
| | Six months ended
April 30, 2017 | Year ended October 31, 2016 |
| From net investment income | | |
| Class A | $2,894 | $1,912 |
| Class M | 333 | 184 |
| Class C | 92 | – |
| International Discovery | 102,284 | 73,519 |
| Class K | 32,411 | 26,239 |
| Class I | 11,493 | 11,205 |
| Class Z | 667 | 375 |
| Total | $150,174 | $113,434 |
| From net realized gain | | |
| Class A | $302 | $36 |
| Class M | 44 | 5 |
| Class C | 34 | – |
| International Discovery | 8,189 | 899 |
| Class K | 2,392 | 284 |
| Class I | 929 | 134 |
| Class Z | 49 | 4 |
| Total | $11,939 | $1,362 |
11. Share Transactions.
Share transactions for each class were as follows and may contain automatic conversions between classes or exchanges between affiliated funds:
| | Shares | Shares | Dollars | Dollars |
| | Six months ended
April 30, 2017 | Year ended October 31, 2016 | Six months ended
April 30, 2017 | Year ended October 31, 2016 |
| Class A | | | | |
| Shares sold | 364 | 885 | $13,763 | $33,250 |
| Reinvestment of distributions | 87 | 48 | 3,152 | 1,922 |
| Shares redeemed | (1,088) | (1,758) | (41,081) | (66,337) |
| Net increase (decrease) | (637) | (825) | $(24,166) | $(31,165) |
| Class M | | | | |
| Shares sold | 35 | 126 | $1,305 | $4,736 |
| Reinvestment of distributions | 10 | 5 | 365 | 183 |
| Shares redeemed | (180) | (282) | (6,755) | (10,546) |
| Net increase (decrease) | (135) | (151) | $(5,085) | $(5,627) |
| Class B | | | | |
| Shares sold | – | 1 | $– | $16 |
| Shares redeemed | – | (58) | – | (2,118) |
| Net increase (decrease) | – | (57) | $– | $(2,102) |
| Class C | | | | |
| Shares sold | 30 | 193 | $1,121 | $7,216 |
| Reinvestment of distributions | 3 | – | 116 | – |
| Shares redeemed | (111) | (298) | (4,139) | (11,125) |
| Net increase (decrease) | (78) | (105) | $(2,902) | $(3,909) |
| International Discovery | | | | |
| Shares sold | 8,884 | 18,319 | $332,954 | $696,598 |
| Reinvestment of distributions | 2,884 | 1,781 | 105,222 | 70,961 |
| Shares redeemed | (21,871) | (30,424) | (824,296) | (1,154,409) |
| Net increase (decrease) | (10,103) | (10,324) | $(386,120) | $(386,850) |
| Class K | | | | |
| Shares sold | 5,259 | 12,391 | $199,707 | $466,861 |
| Reinvestment of distributions | 957 | 667 | 34,803 | 26,523 |
| Shares redeemed | (9,366) | (21,012)(a) | (352,321) | (800,081)(a) |
| Net increase (decrease) | (3,150) | (7,954) | $(117,811) | $(306,697) |
| Class I | | | | |
| Shares sold | 1,666 | 8,874 | $62,988 | $334,588 |
| Reinvestment of distributions | 82 | 52 | 2,985 | 2,069 |
| Shares redeemed | (7,042) | (15,719) | (265,168) | (569,974) |
| Net increase (decrease) | (5,294) | (6,793) | $(199,195) | $(233,317) |
| Class Z | | | | |
| Shares sold | 1,163 | 497 | $44,254 | $18,760 |
| Reinvestment of distributions | 20 | 10 | 716 | 379 |
| Shares redeemed | (194) | (256) | (7,427) | (9,746) |
| Net increase (decrease) | 989 | 251 | $37,543 | $9,393 |
(a) Amount includes in-kind redemptions (see the prior Redemptions In-Kind note for additional details).
12. Other.
The Fund's organizational documents provide former and current trustees and officers with a limited indemnification against liabilities arising in connection with the performance of their duties to the Fund. In the normal course of business, the Fund may also enter into contracts that provide general indemnifications. The Fund's maximum exposure under these arrangements is unknown as this would be dependent on future claims that may be made against the Fund. The risk of material loss from such claims is considered remote.
At the end of the period, Strategic Advisers International Fund was the owner of record of approximately 12% of the total outstanding shares of the Fund.
Shareholder Expense Example
As a shareholder of the Fund, you incur two types of costs: (1) transaction costs, including sales charges (loads) on purchase payments or redemption proceeds, redemption fees and (2) ongoing costs, including management fees, distribution and/or service (12b-1) fees and other Fund expenses. This Example is intended to help you understand your ongoing costs (in dollars) of investing in the Fund and to compare these costs with the ongoing costs of investing in other mutual funds.
The Example is based on an investment of $1,000 invested at the beginning of the period and held for the entire period (November 1, 2016 to April 30, 2017).
Actual Expenses
The first line of the accompanying table for each class of the Fund provides information about actual account values and actual expenses. You may use the information in this line, together with the amount you invested, to estimate the expenses that you paid over the period. Simply divide your account value by $1,000.00 (for example, an $8,600 account value divided by $1,000.00 = 8.6), then multiply the result by the number in the first line for a class of the Fund under the heading entitled "Expenses Paid During Period" to estimate the expenses you paid on your account during this period. A small balance maintenance fee of $12.00 that is charged once a year may apply for certain accounts with a value of less than $2,000. This fee is not included in the table below. If it was, the estimate of expenses you paid during the period would be higher, and your ending account value lower, by this amount. In addition, the Fund, as a shareholder in the underlying Fidelity Central Funds, will indirectly bear its pro-rata share of the fees and expenses incurred by the underlying Fidelity Central Funds. These fees and expenses are not included in the Fund's annualized expense ratio used to calculate the expense estimate in the table below.
Hypothetical Example for Comparison Purposes
The second line of the accompanying table for each class of the Fund provides information about hypothetical account values and hypothetical expenses based on a Class' actual expense ratio and an assumed rate of return of 5% per year before expenses, which is not the Class' actual return. The hypothetical account values and expenses may not be used to estimate the actual ending account balance or expenses you paid for the period. You may use this information to compare the ongoing costs of investing in the Fund and other funds. To do so, compare this 5% hypothetical example with the 5% hypothetical examples that appear in the shareholder reports of the other funds. A small balance maintenance fee of $12.00 that is charged once a year may apply for certain accounts with a value of less than $2,000. This fee is not included in the table below. If it was, the estimate of expenses you paid during the period would be higher, and your ending account value lower, by this amount. In addition, the Fund, as a shareholder in the underlying Fidelity Central Funds, will indirectly bear its pro-rata share of the fees and expenses incurred by the underlying Fidelity Central Funds. These fees and expenses are not included in the Fund's annualized expense ratio used to calculate the expense estimate in the table below.
Please note that the expenses shown in the table are meant to highlight your ongoing costs only and do not reflect any transaction costs. Therefore, the second line of the table is useful in comparing ongoing costs only, and will not help you determine the relative total costs of owning different funds. In addition, if these transactional costs were included, your costs would have been higher.
| | Annualized Expense Ratio-A | Beginning
Account Value
November 1, 2016 | Ending
Account Value
April 30, 2017 | Expenses Paid
During Period-B
November 1, 2016
to April 30, 2017 |
| Class A | 1.24% | | | |
| Actual | | $1,000.00 | $1,107.10 | $6.48 |
| Hypothetical-C | | $1,000.00 | $1,018.65 | $6.21 |
| Class M | 1.48% | | | |
| Actual | | $1,000.00 | $1,105.80 | $7.73 |
| Hypothetical-C | | $1,000.00 | $1,017.46 | $7.40 |
| Class C | 2.00% | | | |
| Actual | | $1,000.00 | $1,103.00 | $10.43 |
| Hypothetical-C | | $1,000.00 | $1,014.88 | $9.99 |
| International Discovery | .89% | | | |
| Actual | | $1,000.00 | $1,109.20 | $4.65 |
| Hypothetical-C | | $1,000.00 | $1,020.38 | $4.46 |
| Class K | .76% | | | |
| Actual | | $1,000.00 | $1,109.80 | $3.98 |
| Hypothetical-C | | $1,000.00 | $1,021.03 | $3.81 |
| Class I | .90% | | | |
| Actual | | $1,000.00 | $1,109.00 | $4.71 |
| Hypothetical-C | | $1,000.00 | $1,020.33 | $4.51 |
| Class Z | .76% | | | |
| Actual | | $1,000.00 | $1,109.70 | $3.98 |
| Hypothetical-C | | $1,000.00 | $1,021.03 | $3.81 |
A Annualized expense ratio reflects expenses net of applicable fee waivers.
B Expenses are equal to each Class' annualized expense ratio, multiplied by the average account value over the period, multiplied by 181/365 (to reflect the one-half year period).
C 5% return per year before expenses
Corporate Headquarters
245 Summer St.
Boston, MA 02210
www.fidelity.com
IGI-SANN-0617
1.807261.112
Item 2.
Code of Ethics
Not applicable.
Item 3.
Audit Committee Financial Expert
Not applicable.
Item 4.
Principal Accountant Fees and Services
Not applicable.
Item 5.
Audit Committee of Listed Registrants
Not applicable.
Item 6.
Investments
(a)
Not applicable.
(b)
Not applicable
Item 7.
Disclosure of Proxy Voting Policies and Procedures for Closed-End Management Investment Companies
Not applicable.
Item 8.
Portfolio Managers of Closed-End Management Investment Companies
Not applicable.
Item 9.
Purchase of Equity Securities by Closed-End Management Investment Company and Affiliated Purchasers
Not applicable.
Item 10.
Submission of Matters to a Vote of Security Holders
There were no material changes to the procedures by which shareholders may recommend nominees to the Fidelity Investment Trust’s Board of Trustees.
Item 11.
Controls and Procedures
(a)(i) The President and Treasurer and the Chief Financial Officer have concluded that the Fidelity Investment Trust’s (the “Trust”) disclosure controls and procedures (as defined in Rule 30a-3(c) under the Investment Company Act) provide reasonable
assurances that material information relating to the Trust is made known to them by the appropriate persons, based on their evaluation of these controls and procedures as of a date within 90 days of the filing date of this report.
(a)(ii) There was no change in the Trust’s internal control over financial reporting (as defined in Rule 30a-3(d) under the Investment Company Act) that occurred during the second fiscal quarter of the period covered by this report that has materially affected, or is reasonably likely to materially affect, the Trust’s internal control over financial reporting.
Item 12.
Exhibits
| | |
(a) | (1) | Not applicable. |
(a) | (2) | Certification pursuant to Rule 30a-2(a) under the Investment Company Act of 1940 (17 CFR 270.30a-2(a)) is filed and attached hereto as Exhibit 99.CERT. |
(a) | (3) | Not applicable. |
(b) |
| Certification pursuant to Rule 30a-2(b) under the Investment Company Act of 1940 (17 CFR 270.30a-2(b)) is furnished and attached hereto as Exhibit 99.906CERT. |
SIGNATURES
Pursuant to the requirements of the Securities Exchange Act of 1934 and the Investment Company Act of 1940, the registrant has duly caused this report to be signed on its behalf by the undersigned, thereunto duly authorized.
Fidelity Investment Trust
| |
By: | /s/Stacie M. Smith |
| Stacie M. Smith |
| President and Treasurer |
|
|
Date: | June 26, 2017 |
Pursuant to the requirements of the Securities Exchange Act of 1934 and the Investment Company Act of 1940, this report has been signed below by the following persons on behalf of the registrant and in the capacities and on the dates indicated.
| |
By: | /s/Stacie M. Smith |
| Stacie M. Smith |
| President and Treasurer |
|
|
Date: | June 26, 2017 |
| |
By: | /s/Howard J. Galligan III |
| Howard J. Galligan III |
| Chief Financial Officer |
|
|
Date: | June 26, 2017 |