UNITED STATES
SECURITIES AND EXCHANGE COMMISSION
Washington, D.C. 20549
FORM N-CSR
CERTIFIED SHAREHOLDER REPORT OF REGISTERED
MANAGEMENT INVESTMENT COMPANIES
Investment Company Act File Number811-04010
OCM Mutual Fund
(Exact name of registrant as specified in charter)
2600 Kitty Hawk Road
Suite 119
Livermore, CA 94551
(Address of principal executive offices) (Zip code)
Gregory M. Orrell
Orrell Capital Management, Inc
2600 Kitty Hawk Road
Suite 119
Livermore, CA 94551
(Name and address of agent for service)
Registrant's telephone number, including area code:(925) 455-0802
Date of fiscal year end:November 30
Date of reporting period:November 30, 2018
Item 1. Report to Stockholders.
| |  |
| | |
| | Annual Report |
| | |
| | November 30, 2018 |
| | |
| | Beginning on January 1, 2021, as permitted by regulations adopted by the SEC, paper copies of the Fund’s shareholder reports will no longer be sent by mail, unless you specifically request paper copies of the reports from your financial intermediary, such as a broker-dealer or bank. Instead, the reports will be made available on a website, and you will be notified by mail each time a report is posted and provided with a website link to access the report. If you already elected to receive shareholder reports electronically, you will not be affected by this change and you need not take any action. Please contact your financial intermediary to elect to receive shareholder reports and other Fund communications electronically. For direct account shareholders, please call 1-800-628-9403. You may elect to receive all future reports in paper free of charge. Please contact your financial intermediary to inform them that you wish to continue receiving paper copies of your shareholder reports and for details about whether your election to receive reports in paper will apply to all funds held with your financial intermediary. For direct account shareholders, please call 1-800-628-9403. |
OCM GOLD FUND
Shareholder Letter – November 30, 2018
(Unaudited)
Dear Fellow Shareholder:
While we believe December 2015 marked the bottom of the bear market for shares of gold mining companies as the Federal Reserve began its long-telegraphed rate hike cycle, it is our opinion 2018 will prove to be the bottom in sentiment toward shares of gold mining companies. The washout in sentiment toward gold assets was highlighted by Vanguard changing the mandate for its precious metals and mining fund to a contra cyclical fund in July of 2018. Interestingly, Vanguard rang the bell for the peak in the Nasdaq1 and the low in gold share sentiment in 2000 when it changed the mandate of its gold fund to include base metal equities.
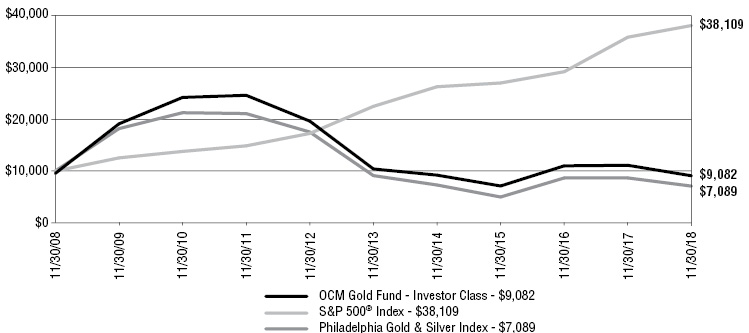
Shares of gold mining companies were under pressure most of the year as the strength in equity markets attracted capital away from the sector in the first half of the year while Vanguard liquidating the bulk of the largest precious metals mutual fund weighed on share prices of several mining companies in the second half of the year. For the fiscal year ended November 30, 2018, the OCM Gold Fund Advisor Class declined 17.81%, while the Investor Class declined 18.24% (-21.95% after maximum sales load), compared to -18.19% in the Philadelphia Gold and Silver Index (“XAU”)2 and 6.27% gain for the S&P 500 Index3. The price of gold bullion at November 30, 2018 closed at $1,218 based on the London PM fix4, down 4.84% during the same period. The OCM Gold Fund’s investment strategy is to invest across all market capitalization sectors of the gold and silver mining industry, including major, intermediate and junior producers along with exploration and development companies. This strategy has led to the Fund’s outperformance of the XAU over the past year and over longer time periods.
Market Commentary
A major cyclical turn is at hand, in our opinion, as the Federal Reserve’s rate hike cycle appears to be hitting the wall with global economic growth decelerating and equity markets and consumer confidence rolling over from cycle peaks. Gold has historically been the reciprocal of financial assets as capital gravitates toward gold assets in periods of economic uncertainty for safety of purchasing power and away from gold assets in periods of economic growth and rising consumer confidence. The list of factors and antidotal evidence pointing to a significant shift in sentiment toward gold assets may be on the horizon includes the following, in our opinion:
| | ● | The two prior times the Conference Board’s Consumer Confidence Index5 declined from the level reached in October 2018 (April 1969 and September 2000), shares of gold mining companies significantly outperformed the S&P 500 over the following ten- and eleven-year periods (see chart). |
| | ● | Despite the second longest U.S. economic expansion, total federal debt outstanding is accelerating as tax reform and rising interest expense propel the U.S. budget deficit upward and total federal debt outstanding to $22 trillion. Gold prices are highly correlated over time to total federal debt outstanding with a 90% correlation since Nixon closed the gold window in 1971 and 87% since 2000. |
– 1 –
OCM GOLD FUND Shareholder Letter – November 30, 2018 (Continued) (Unaudited) |
| | ● | Democratic party retaking the House of Representatives in November 2018 elections has increased the acrimonious political atmosphere in Washington raising the odds of Trump impeachment proceedings gaining momentum in 2019. Further, as the 2020 presidential election grows closer, markets may fear a democratic victory by a far-left leaning candidate that promises taxing the “rich” to redistribute wealth and undoing Trump’s move to relax the government regulatory environment. |
| | ● | The Fed’s current rate hike cycle at 36 months is the 2nd longest to the 39-month hike cycle from 1977 to 1980. It stands to reason with global debt levels up 60% since 2008, attempts to “normalize” rates would materially impact global liquidity and growth at much lower rate levels than previous economic cycles and lower than what the Federal Reserve may have hoped for. The prospect for the Federal Reserve to pause its rate hike cycle and eventually lower interest rates over the next two years will, in our opinion, be viewed negatively for the U.S. dollar and positively for U.S. dollar gold price. |
| | ● | Gold bull markets are characterized by gold prices rising versus all currencies. In 2018 gold was at or near all-time highs in 72 currencies which has historically been a precursor for gold prices to rise versus the U.S. dollar. |
| | ● | Record sovereign debt levels both in nominal terms and debt to Gross Domestic Product6 levels encourages currency debasement going forward to inflate debt repayments away. |
| | ● | Central bank gold purchases by Russia, China, Turkey, India, Poland, Hungary and Kazakhstan, not only reinforce gold’s monetary status, but further raise speculation a currency bloc based on gold to rival the U.S. dollar may be in the works. Both Chinese and Russian officials have been quoted as believing the U.S and U.S. dollar are vulnerable due to its extended debt position. |
| | ● | A sharp sell-off in the fourth quarter led to a 4% decline for the S&P 500 for all of 2018. With global economic activity slowing, earnings estimates for the S&P 500 are beginning to be revised down. Despite equity valuations being stretched by most valuation metrics, such as total market capitalization to GDP, the prospect of a bear market remains a distant thought for most investors and strategists on Wall Street. If the broad equity market continues down in 2019, investors may start to become disillusioned and search for returns elsewhere. In such a scenario, it is our opinion, gold assets will attract capital as they did in the 70’s and 2000’s. |
| | ● | In baseball terms, the current economic expansion fueled by the extreme monetary policies of central banks and more recently by Trump tax reforms and deregulation is considered in the eighth or ninth inning. The onset of a recession has historically driven gold prices 20% higher as the Federal Reserve moves to an accommodating monetary policy. |
– 2 –
OCM GOLD FUND Shareholder Letter – November 30, 2018 (Continued) (Unaudited) |

BGMI = Barron’s Gold Mining Index
Source: Sharelynx and Conference Board
Gold Mining Industry
The gold mining industry continued to take steps to attract more generalist investors to the sector that are looking for a sustainable business model rather than purely a call option on the price of gold. The announcement of Barrick Gold merging with one of your Fund’s largest holdings, Randgold Resources, brought together the proven disciplined management of Randgold Resources with Barrick Gold’s high-quality asset base. After the first of the year, Newmont Mining announced it had reached an agreement to acquire Goldcorp to reestablish its position as the world’s largest gold producer. We view the transactions as creating entities that should attract additional institutional interest that may lead to the gold mining sector overall recapturing some of the historic trading multiples to gold (defined by the gold price divided by the XAU) and price to net asset value (NAV)7 lost over the past ten years.
The lack of large scale discoveries over the past fifteen years, especially in favorable geopolitical jurisdictions, along with the long lead time from discovery to production, points to newly mined gold supply having reached a peak at current levels, in our opinion. Further, increased safety and environmental regulations in China has started to pressure the world’s top gold producer, where the bulk of production comes from, small to medium sized mines. Chinese production peaked in 2016 after climbing steadily, but has declined over the past two years. In our opinion,
– 3 –
OCM GOLD FUND Shareholder Letter – November 30, 2018 (Continued) (Unaudited) |
the current environment is favorable for junior gold producers and exploration/development companies to create shareholder value as mines in the 80,000 to 120,000 ounce per annum range gain appreciation and known quality deposits attract a premium.
Conclusion
Being able to recognize major market cycles is a key component in creating or preserving long-term wealth. Such a period is at hand with gold assets set to outperform most asset classes over the next ten to eleven years, in our opinion. With both consumer confidence at an extreme and equity valuations historically stretched, it is understandable sentiment toward gold assets is washed out and similar to the lows in 2000. As it becomes clear to the market that the weight of past fiscal and monetary policy decisions has left the Federal Reserve little choice but pursue a path that accelerates debasement of the U.S. dollar or risk a politically untenable deflationary meltdown, capital will flow toward gold assets seeking a safe port in a storm, in our opinion. Consequently, we believe the rationale for owning gold assets to mitigate risks against monetary policy decisions designed to promote currency debasement remains a sound investment strategy. The current environment of disinterest by most investors toward gold mining equities creates an opportunistic entry point for investors looking to establish gold exposure or rebalance their portfolios.
We appreciate your shareholding and confidence in the OCM Gold Fund, and we look forward to meeting the investment objective of preserving your purchasing power. Should you have any questions regarding the Fund or gold, please contact your financial adviser or you may contact us directly at 1-800-779-4681. For questions regarding your account, please contact Shareholder Service at 1-800-628-9403.
Sincerely,

Gregory M. Orrell
Portfolio Manager
January 22, 2019
– 4 –
OCM GOLD FUND Shareholder Letter – November 30, 2018 (Continued) (Unaudited) |
Nasdaq1 is a global electronic marketplace for buying and selling securities, as well as the benchmark index for U.S. technology stocks.
XAU2 The Philadelphia Gold and Silver Index (XAU) is an unmanaged capitalization-weighted index composed of 16 companies listed on U.S. exchanges involved in the gold and silver mining industry.
S & P 5003 is a registered trademark of McGraw-Hill Co., Inc. is a market capitalization-weighted index of 500 widely held common stocks. You cannot invest directly in an index.
London PM Fix4 A price per ounce for each of the precious metals (gold, silver, platinum and palladium) determined daily at 10:30 and 15:00 GMT by a brief conference call among the five members of the London Gold Pool (Scotia-Mocatta, Barclays Capital, Deutsche Bank, HSBC and Société Générale). The London spot fix price is the price fixed at the moment when the conference call terminates.
The Consumer Confidence Index (CCI)5 Survey is an index by The Conference Board that measures how optimistic or pessimistic consumers are with respect to the economy in the near future.
GDP6 Gross domestic product (GDP)6 is the monetary value of all the finished goods and services produced within a country’s borders in a specific time period.
NAV7 The net asset value (NAV) represents the net value of an entity and is calculated as the total value of the entity’s assets minus the total value of its liabilities.
Investors should carefully consider the investment objectives, risks, charges and expenses of the OCM Gold Fund. This and other important information about a Fund is contained in a Fund’s Prospectus, which can be obtained by calling 1-800-779-4681. The Prospectus should be read carefully before investing. Funds are distributed by Northern Lights Distributors, LLC, FINRA/SIPC. Orrell Capital Management, Inc. and Northern Lights Distributors are not affiliated.
– 5 –
OCM GOLD FUND Shareholder Letter – November 30, 2018 (Continued) (Unaudited) |
Investing in the OCM Gold Fund involves risks including the loss of principal. Many of the companies in which the Fund invests are smaller capitalization companies which may subject the fund to greater risk than securities of larger, more-established companies, as they often have limited product lines, markets or financial resources and may be subject to more-abrupt market movements. The Fund also invests in securities of gold and precious metals which may be subject to greater price fluctuations over short periods of time. The Fund is a non-diversified investment company meaning it will invest in fewer securities than diversified investment companies and its performance may be more volatile. The Fund contains international securities that may provide the opportunity for greater return but also have special risks associated with foreign investing including fluctuations in currency, government regulation, differences in accounting standards and liquidity.
Investor Class Performance as of November 30, 2018
| | OCMGX
(without load) | OCMGX
(with load) | Philadelphia
Gold and Silver
Index (XAU)1 | S&P 5002 | |
Six Months | (19.43)% | (23.03)% | (22.34)% | 3.02% | |
One Year | (18.24)% | (21.95)% | (18.19)% | 6.27% | |
3 Year Annualized | 8.49% | 6.83% | 12.48% | 12.16% | |
5 Year Annualized | (2.68)% | (3.57)% | (4.90)% | 11.12% | |
10 Year Annualized | (0.50)% | (0.96)% | (3.38)% | 14.32% | |
Advisor Class Performance as of November 30, 2018
| | OCMAX | Philadelphia
Gold and Silver
Index (XAU)1 | S&P 5002 | |
Six Months | (19.28)% | (22.34)% | 3.02% | |
One Year | (17.81)% | (18.19)% | 6.27% | |
3 Year Annualized | 9.28% | 12.48% | 12.16% | |
5 Year Annualized | (1.97)% | (4.90)% | 11.12% | |
Since Inception Annualized* | (6.78)% | (9.22)% | 12.75% | |
* | Inception: April 1, 2010 |
The performance data quoted above represents past performance. Current performance may be lower or higher than the performance data quoted above. Past performance is no guarantee of future results. The investment return and principal value of an investment will fluctuate so that investor’s shares, when redeemed, may be worth more
– 6 –
OCM GOLD FUND Shareholder Letter – November 30, 2018 (Continued) (Unaudited) |
or less than their original cost. The Fund’s Total Annual Operating Expenses for the OCM Gold Fund Investor Class and Advisor Class are 2.58% and 2.08% respectively. Please review the Fund’s prospectus for more information regarding the Fund’s fees and expenses. For performance information current to the most recent month-end, please call toll-free 800-628-9403. The returns shown include the reinvestment of all dividends but do not reflect the deduction of taxes that a shareholder would pay on Fund distributions or the redemption of Fund shares.
1 | The Philadelphia Gold and Silver Index (XAU) is an unmanaged capitalization-weighted index composed of 16 companies listed on U.S. exchanges involved in the gold and silver mining industry. The index is generally considered as representative of the gold and silver share market. You cannot invest directly in an index. |
2 | The S&P 500 Index, a registered trademark of McGraw-Hill Co., Inc. is a market capitalization-weighted index of 500 widely held common stocks. You cannot invest directly in an index. |
– 7 –
OCM GOLD FUND Schedule of Investments – November 30, 2018 |
Shares | | | |
Value
| |
COMMON STOCKS 93.7% | | | | |
Major Gold Producers 36.7% | | | | |
| | | 69,000 | | Agnico Eagle Mines Ltd. | | $ | 2,423,280 | |
| | | 110,000 | | AngloGold Ashanti Ltd. ADR | | | 1,091,200 | |
| | | 50,000 | | Kinross Gold Corp.* | | | 135,500 | |
| | | 70,000 | | Newmont Mining Corp. | | | 2,263,800 | |
| | | 35,000 | | Randgold Resources Ltd. ADR | | | 2,805,950 | |
| | | | | | | | 8,719,730 | |
Intermediate/Mid-Tier Gold Producers 11.4% |
| | | 200,000 | | Alamos Gold, Inc. | | | 644,000 | |
| | | 300,000 | | B2Gold Corp.* | | | 738,316 | |
| | | 100,000 | | Centerra Gold, Inc.* | | | 406,412 | |
| | | 75,000 | | Endeavour Mining Corp.* | | | 934,748 | |
| | | | | | | | 2,723,476 | |
Junior Gold Producers 32.1% | | | | |
| | | 400,000 | | Alacer Gold Corp.* | | | 623,165 | |
| | | 260,000 | | Argonaut Gold, Inc.* | | | 238,730 | |
| | | 450,000 | | Atlantic Gold Corp.* | | | 514,789 | |
| | | 300,000 | | Dacian Gold Ltd.* | | | 456,074 | |
| | | 250,000 | | Dundee Precious Metals, Inc.* | | | 643,486 | |
| | | 150,000 | | Fortuna Silver Mines, Inc.* | | | 482,050 | |
| | | 6,000,000 | | Jaguar Mining, Inc.* | | | 857,981 | |
| | | 1,000,000 | | Perseus Mining Ltd.* | | | 255,811 | |
| | | 550,000 | | Roxgold, Inc.* | | | 331,151 | |
| | | 325,000 | | SEMAFO, Inc.* | | | 587,040 | |
| | | 950,000 | | Wesdome Gold Mines Ltd.* | | | 2,631,143 | |
| | | | | | | | 7,621,420 | |
Exploration and Development Companies 4.9% |
| | | 2,000,000 | | Emmerson Resources Ltd.* | | | 102,324 | |
| | | 2,000,000 | | Intermin Resources Ltd.* | | | 219,266 | |
| | | 500,000 | | Oklo Resources Ltd.* | | | 96,843 | |
| | | 2,000,000 | | Royal Road Minerals Ltd.* | | | 105,366 | |
| | | 4,578,755 | | RTG Mining, Inc.* | | | 501,983 | |
| | | 200,000 | | Steppe Gold Ltd.* | | | 124,934 | |
| | | 2,553,040 | | Sutter Gold Mining, Inc.* | | | 28,822 | |
| | | | | | | | 1,179,538 | |
Royalty/Streaming Companies 8.6% | | | | |
| | | 6,500 | | Royal Gold, Inc. | | | 475,475 | |
| | | 100,000 | | Wheaton Precious Metals Corp. | | | 1,569,956 | |
| | | | | | | | 2,045,431 | |
Total Common Stocks | | | | |
| | | | | (Cost $12,790,754) | | | 22,289,595 | |
| | | | | | | | | |
EXCHANGE TRADED FUND 0.5% |
| | | 1,000 | | SPDR Gold Shares* | | | 115,540 | |
Total Exchange Traded Fund | | | | |
| | | | | (Cost $44,210) | | | 115,540 | |
| | | | | | | | | |
WARRANTS 0.0% | | | | |
Exploration and Development Companies 0.0% |
| | | 1,000,000 | | Emmerson Resources Ltd.*† Exercise Price 0.14 AUD, Exp. 9/30/2020 | | | — | |
| | | 200,000 | | Steppe Gold Ltd.*† Exercise Price 2.34 CAD, Exp. 5/22/2020 | | | — | |
| | | | | | | | — | |
Total Warrants | | | | |
| | | | | (Cost $0) | | | — | |
See notes to financial statements.
– 8 –
OCM GOLD FUND Schedule of Investments – November 30, 2018 (Continued) |
Shares | | | | | Value | |
SHORT-TERM INVESTMENT 6.1% | | | | | |
| | | 1,441,147 | | UMB Money Market Fiduciary, 0.25% | | | $ | 1,441,147 | |
Total Short-Term Investment | | | | | |
| | | | | (Cost $1,441,147) | | | | 1,441,147 | |
| | | | | | | | | | |
Total Investments | | | | | |
| | | | | (Cost $14,276,111) | 100.3% | | | 23,846,282 | |
Liabilities less Other Assets | (0.3)% | | | (76,628 | ) |
TOTAL NET ASSETS | 100.0% | | $ | 23,769,654 | |
ADR – American Depository Receipt.
AUD – Australian Dollars.
CAD – Canadian Dollars.
* | Non-income producing security. |
† | Illiquid security. The total illiquid securities represent 0.00% of net assets. |
See notes to financial statements.
– 9 –
OCM GOLD FUND Schedule of Investments – November 30, 2018 (Continued) |
SUMMARY OF INVESTMENTS BY COUNTRY
Country | | Value | | | Percent of
Investment Securities | |
Australia | | $ | 1,130,318 | | | | 4.8% | |
Canada | | | 12,980,755 | | | | 54.4 | |
Cayman Islands | | | 934,748 | | | | 3.9 | |
Jersey | | | 2,911,316 | | | | 12.2 | |
South Africa | | | 1,091,200 | | | | 4.6 | |
United States1 | | | 4,295,962 | | | | 18.0 | |
Virgin Islands (British) | | | 501,983 | | | | 2.1 | |
Total | | $ | 23,846,282 | | | | 100.0% | |
1 | Includes short-term investments. |
See notes to financial statements.
– 10 –
OCM GOLD FUND Statement of Assets and Liabilities – November 30, 2018 |
Assets: | | | | |
Investments in unaffiliated issuers, at value (cost $14,276,111) | | $ | 23,846,282 | |
Interest and dividends receivable | | | 15,318 | |
Receivable for fund shares sold | | | 6,284 | |
Prepaid expenses and other assets | | | 24,842 | |
Total assets | | | 23,892,726 | |
| | | | | |
Liabilities: | | | | |
Payable for fund shares redeemed | | | 2,050 | |
Accrued distribution fees | | | 45,072 | |
Investment adviser fees | | | 19,069 | |
Accrued audit fees | | | 15,500 | |
Accrued fund administration and accounting fees | | | 10,929 | |
Accrued transfer agent fees and expenses | | | 10,930 | |
Accrued reports to shareholders | | | 10,000 | |
Accrued Trustees' fees | | | 2,500 | |
Accrued expenses and other liabilities | | | 7,022 | |
Total liabilities | | | 123,072 | |
Net Assets | | $ | 23,769,654 | |
| | | | | |
Net Assets Consist of: | | | | |
Shares of beneficial interest, no par value: unlimited shares authorized | | $ | 9,812,343 | |
Total distributable earnings | | | 13,957,311 | |
Net Assets | | $ | 23,769,654 | |
| | | | | |
Calculation of Maximum Offering Price: | | | | |
Investor Class: | | | | |
Net asset value and redemption price per share | | $ | 7.05 | |
Maximum sales charge (4.50% of offering price) | | | 0.33 | |
Offering price to public | | $ | 7.38 | |
Shares outstanding | | | 2,433,259 | |
Advisor Class: | | | | |
Net asset value and redemption price per share | | $ | 7.58 | |
Shares outstanding | | | 873,353 | |
Total Shares Outstanding | | | 3,306,612 | |
See notes to financial statements.
– 11 –
OCM GOLD FUND Statement of Operations - Year Ended November 30, 2018 |
Investment Income | | | | |
Interest | | $ | 153 | |
Dividend (net of foreign withholding taxes of $12,978) | | | 200,691 | |
Total investment income | | | 200,844 | |
| | | | | |
Expenses | | | | |
Investment advisory fees | | | 288,485 | |
Distribution fees - Investor Class | | | 173,605 | |
Fund administration and accounting fees | | | 132,961 | |
Transfer agent fees and expenses | | | 72,927 | |
Federal and state registration fees | | | 42,368 | |
Legal fees | | | 30,261 | |
Chief Compliance Officer fees | | | 25,417 | |
Audit fees | | | 19,654 | |
Custody fees | | | 17,995 | |
Reports to shareholders | | | 16,984 | |
Trustees' fees | | | 10,000 | |
Distribution fees - Advisor Class | | | 6,112 | |
Other expenses | | | 12,998 | |
Total expenses | | | 849,767 | |
Advisory fees waived | | | (82 | ) |
Net expenses | | | 849,685 | |
Net investment loss | | | (648,841 | ) |
| | | | | |
Realized and Unrealized Gain (Loss) on Investments: | | | | |
Net realized gain on investments and foreign currency transactions | | | 5,776,178 | |
Net change in unrealized appreciation/depreciation on investments and foreign currency translations | | | (10,596,428 | ) |
Net loss on investments | | | (4,820,250 | ) |
| | | | | |
Net decrease in net assets from operations | | $ | (5,469,091 | ) |
See notes to financial statements.
– 12 –
OCM GOLD FUND Statements of Changes in Net Assets |
| | | Year Ended
November 30,
2018 | | | Year Ended
November 30,
2017 | |
Operations: | | | | | | | | |
Net investment loss | | $ | (648,841 | ) | | $ | (842,697 | ) |
Net realized gain on investments and foreign currency transactions | | | 5,776,178 | | | | 2,646,145 | |
Net change in unrealized appreciation/depreciation on investments and foreign currency translations | | | (10,596,428 | ) | | | (1,489,021 | ) |
Net increase (decrease) in net assets from operations | | | (5,469,091 | ) | | | 314,427 | |
| | | | | | | | | |
Distributions Paid to Shareholders | | | | | | | | |
Distributions1: | | | | | | | | |
Investor Class | | | (1,956,268 | ) | | | | |
Advisor Class | | | (469,844 | ) | | | | |
Total | | | (2,426,112 | ) | | | | |
| | | | | | | | | |
From net realized gain: | | | | | | | | |
Investor Class | | | | | | | (5,268,126 | ) |
Advisor Class | | | | | | | (1,310,072 | ) |
Total | | | | | | | (6,578,198 | ) |
| | | | | | | | | |
Fund Share Transactions | | | | | | | | |
Investor Class: | | | | | | | | |
Net proceeds from shares sold | | | 958,564 | | | | 564,380 | |
Distributions reinvested | | | 1,680,075 | | | | 4,632,595 | |
Payment of shares redeemed2 | | | (9,718,380 | ) | | | (3,566,159 | ) |
Net increase (decrease) in net assets from Investor Class share transactions | | | (7,079,741 | ) | | | 1,630,816 | |
| | | | | | | | | |
Advisor Class: | | | | | | | | |
Net proceeds from shares sold | | | 2,833,285 | | | | 2,387,037 | |
Distributions reinvested | | | 460,500 | | | | 1,253,971 | |
Payment of shares redeemed3 | | | (2,147,391 | ) | | | (4,717,606 | ) |
Net increase (decrease) in net assets from Advisor Class share transactions | | | 1,146,394 | | | | (1,076,598 | ) |
Net increase (decrease) in net assets from Fund share transactions | | | (5,933,347 | ) | | | 554,218 | |
| | | | | | | | | |
Total decrease in net assets | | | (13,828,550 | ) | | | (5,709,553 | ) |
| | | | | | | | | |
Net Assets, Beginning of Period | | | 37,598,204 | | | | 43,307,757 | |
Net Assets, End of Period4 | | | 23,769,654 | | | | 37,598,204 | |
See notes to financial statements.
– 13 –
OCM GOLD FUND Statements of Changes in Net Assets (Continued) |
| | | Year Ended
November 30,
2018 | | | Year Ended
November 30,
2017 | |
Transactions in shares | | | | | | | | |
Investor Class: | | | | | | | | |
Shares sold | | | 111,912 | | | | 55,899 | |
Shares issued on reinvestment of distributions | | | 188,561 | | | | 560,847 | |
Shares redeemed | | | (1,158,415 | ) | | | (369,277 | ) |
Net increase (decrease) in Investor Class shares outstanding | | | (857,942 | ) | | | 247,469 | |
| | | | | | | | | |
Advisor Class: | | | | | | | | |
Shares sold | | | 344,046 | | | | 228,945 | |
Shares issued on reinvestment of distributions | | | 48,321 | | | | 143,804 | |
Shares redeemed | | | (239,411 | ) | | | (466,159 | ) |
Net increase (decrease) in Advisor Class shares outstanding | | | 152,956 | | | | (93,410 | ) |
Net Increase (Decrease) in Fund Shares Outstanding | | | (704,986 | ) | | | 154,059 | |
1 | The SEC eliminated the requirement to disclose components of distributions paid to shareholders in September 2018. |
2 | Net of redemption fees of $3 for the year ended November 30, 2018 and $90 for the year ended November 30, 2017, respectively. |
3 | Net of redemption fees of $1,554 for the year ended November 30, 2018 and $5,069 for the year ended November 30, 2017, respectively. |
4 | End of year net assets includes accumulated undistributed net investment loss of $1,037,656 for the year ended November 30, 2017. The SEC eliminated the requirement to disclose undistributed net investment income in September 2018. |
See notes to financial statements.
– 14 –
OCM GOLD FUND Notes to Financial Statements – November 30, 2018 |
Note 1. Organization
OCM Mutual Fund (the “Trust”) is registered under the Investment Company Act of 1940, as amended, as an open-end management investment company. The Trust was organized as a Massachusetts business trust on January 6, 1984 and consists of the OCM Gold Fund (the “Fund”). The Fund is a non-diversified fund. The investment objective for the Fund is long-term growth of capital through investing primarily in equity securities of domestic and foreign companies engaged in activities related to gold and precious metals.
The Fund is an investment company and accordingly follows the investment company accounting and reporting guidance of the Financial Accounting Standards Board (“FASB”) Accounting Standard Codification Topic 946 “Financial Services—Investment Companies.”
Note 2. Significant Accounting Policies
The following is a summary of significant accounting policies followed by the Fund in the preparation of its financial statements.
Security Valuation– Portfolio securities that are listed on national securities exchanges, other than the NASDAQ Stock Market LLC, are valued at the last sale price as of the close of business of such securities exchanges, or, in the absence of recorded sales, at the average of readily available closing bid and ask prices on such exchanges. NASDAQ Global Select Market, Global Market and Capital Market securities are valued at the NASDAQ Official Closing Price (“NOCP”). If a NOCP is not issued for a given day, these securities are valued at the average of readily available closing bid and ask prices. Unlisted securities are valued at the average of the quoted bid and ask prices in the over-the-counter market. Short-term investments which mature in less than 60 days are valued at amortized cost (unless the Trust’s Board of Trustees determines that this method does not represent fair value). Short-term investments which mature after 60 days are valued at market. Securities and other assets for which market quotations are not readily available are valued at fair value as determined in good faith by the investment adviser under procedures established by and under the general supervision and responsibility of the Trust’s Board of Trustees. For each investment that is fair valued, the investment adviser considers, to the extent applicable, various factors including, but not limited to, the type of security, the financial condition of the company, comparable companies in the public market, the nature and duration of the cause for a quotation not being readily available and other relevant factors.
Fair Value Measurements and Disclosures defines fair value, establishes a framework for measuring fair value in accordance with GAAP, and expands disclosure about fair value measurements. It also provides guidance on determining when there has been a significant decrease in the volume and level of activity for an asset or a liability, when a transaction is not orderly, and how that information must be incorporated into a fair value measurement.
– 15 –
OCM GOLD FUND Notes to Financial Statements – November 30, 2018 (Continued) |
UnderFair Value Measurements and Disclosures, various inputs are used in determining the value of the Fund’s investments. These inputs are summarized into three broad levels as described below:
| | ● | Level 1 – Unadjusted quoted prices in active markets for identical assets or liabilities that the Funds have the ability to access. |
| | ● | Level 2 – Observable inputs other than quoted prices included in Level 1 that are observable for the asset or liability, either directly or indirectly. These inputs may include quoted prices for the identical instrument on an inactive market, prices for similar instruments, interest rates, prepayment speeds, credit risk, yield curves, default rates and similar data. |
| | ● | Level 3 – Unobservable inputs for the asset or liability, to the extent relevant observable inputs are not available, representing the Fund’s own assumptions about the assumptions a market participant would use in valuing the asset or liability, and would be based on the best information available. |
The availability of observable inputs can vary from security to security and is affected by a wide variety of factors, including for example, the type of security, whether the security is new and not yet established in the marketplace, the liquidity of markets, and other characteristics particular to the security. To the extent that valuation is based on models or inputs that are less observable or unobservable in the market, the determination of fair value requires more judgment. Accordingly, the degree of judgment exercised in determining fair value is greatest for instruments categorized in Level 3.
The inputs to measure fair value may fall into different Levels of the fair value hierarchy. In such cases, for disclosure purposes, the Level in the fair value hierarchy within which the fair value measurement falls in its entirety, is determined based on the lowest Level input that is significant to the fair value measurement in its entirety.
– 16 –
OCM GOLD FUND Notes to Financial Statements – November 30, 2018 (Continued) |
The inputs or methodology used for valuing securities are not an indication of the risk associated with investing in those securities. The following is a summary of the inputs used, as of November 30, 2018, in valuing the Fund’s assets carried at fair value:
Sector | | Level 1 | | | Level 2 | | | Level 3 | | | Total | |
Common Stocks | | | | | | | | | | | | | | | | |
Major Gold Producers | | $ | 8,719,730 | | | $ | — | | | $ | — | | | $ | 8,719,730 | |
Intermediate/Mid-Tier Gold Producers | | | 2,723,476 | | | | — | | | | — | | | | 2,723,476 | |
Junior Gold Producers | | | 7,621,420 | | | | — | | | | — | | | | 7,621,420 | |
Exploration and Development Companies | | | 1,179,538 | | | | — | | | | — | | | | 1,179,538 | |
Royalty/Streaming Companies | | | 2,045,431 | | | | — | | | | — | | | | 2,045,431 | |
Exchange Traded Fund | | | 115,540 | | | | — | | | | — | | | | 115,540 | |
Warrants | | | — | | | | — | | | | — | | | | — | |
Short-Term Investment | | | 1,441,147 | | | | — | | | | — | | | | 1,441,147 | |
Total | | $ | 23,846,282 | | | $ | — | | | $ | — | | | $ | 23,846,282 | |
The Fund held two Level 2 securities at November 30, 2018. Emmerson Resources Ltd. and Steppe Gold Ltd., both Warrants, are being valued at intrinsic value, in accordance with procedures established by and under the general supervision of the Trust’s Board of Trustees.
Foreign Currency – Investment securities and other assets and liabilities denominated in foreign currencies are translated into U.S. dollar amounts at the date of valuation. Purchases and sales of investment securities and income and expense items denominated in foreign currencies are translated into U.S. dollar amounts on the respective dates of such transactions. The Fund does not isolate that portion of the results of operations resulting from changes in foreign exchange rates on investments from the fluctuations arising from changes in market prices of securities held. Such fluctuations for the year ended November 30, 2018 are included within the realized and unrealized gain/loss on investments section of the Statement of Operations.
– 17 –
OCM GOLD FUND Notes to Financial Statements – November 30, 2018 (Continued) |
Reported net realized foreign exchange gains or losses arise from sales of foreign currencies, currency gains or losses realized between the trade and settlement dates on securities transactions, and the difference between the amounts of dividends, interest and foreign withholding taxes recorded on the Fund’s books and the U.S. dollar equivalent of the amounts actually received or paid. Net unrealized foreign exchange gains and losses arise from changes in the fair value of assets and liabilities, other than investments in securities at fiscal period end, resulting from changes in exchange rates. Such fluctuations for the year ended November 30, 2018 are included within the realized and unrealized gain/loss on investments section of the Statement of Operations.
Federal Income Taxes – The Fund intends to comply with the requirements of the Internal Revenue Code necessary to qualify as a regulated investment company and to make the requisite distributions of income to its shareholders to relieve it from all or substantially all federal income taxes. Withholding taxes on foreign dividends have been provided for in accordance with the Fund’s understanding on the applicable county’s tax rules and rate.
Accounting for Uncertainty in Income Taxes(“Income Tax Statement”) requires an evaluation of tax positions taken (or expected to be taken) in the course of preparing the Fund’s tax returns to determine whether these positions meet a “more-likely-than-not” standard that, based on the technical merits, have a more than fifty percent likelihood of being sustained by a taxing authority upon examination. A tax position that meets the “more-likely-than-not” recognition threshold is measured to determine the amount of benefit to recognize in the financial statements. The Fund’s policy is to classify interest and penalties associated with underpayment of federal and state income taxes, if any, as income tax expense on the Statement of Operations. As of November 30, 2018, the Fund did not have any interest or penalties associated with the underpayment of any income taxes.
The Income Tax Statement requires management of the Fund to analyze all open tax years, fiscal years 2015-2018 as defined by IRS statute of limitations for all major jurisdictions, including federal tax authorities and certain state tax authorities. As of and during the year ended November 30, 2018, the Fund did not have a liability for any unrecognized tax benefits. The Fund has no examinations in progress and is not aware of any tax positions for which it is reasonably possible that the total amounts of unrecognized tax benefits will significantly change in the next twelve months.
Share Classes – The Fund offers two classes of shares, Investor Class and Advisor Class. The outstanding shares of the Fund on April 1, 2010 were renamed “Investor Class shares.” The Advisor Class shares commenced operations on April 1, 2010. The two classes represent interests in the same portfolio of investments and have the same rights. Investor Class shares are subject to an annual 12b-1 fee of up to 0.99% of the Fund’s average daily net assets allocable to Investor Class shares, whereas Advisor Class shares are subject to an annual 12b-1 fee of up to 0.25% of the Fund’s average daily net assets allocable to Advisor Class shares. Prior to March 29, 2018, the Advisor Class shares were not subject to any 12b-1 fees under the plan. Income, expenses (other than expenses attributable to a specific class) and realized and unrealized gains and losses on investments are allocated to each class of shares in proportion to their relative shares outstanding.
– 18 –
OCM GOLD FUND Notes to Financial Statements – November 30, 2018 (Continued) |
Securities Transactions and Investment Income – Securities transactions are accounted for on a trade date basis. Realized gains and losses on sales of securities are calculated on the identified cost basis. Dividend income is recorded on the ex-dividend date and interest income is recorded on an accrual basis.
Distributions to Shareholders – The character of distributions made during the year from net investment income or net realized gains may differ from the characterization for federal income tax purposes due to differences in the recognition of income, expense or gain items for financial statement and tax purposes. To the extent that these differences are attributable to permanent book and tax accounting differences, the components of net assets have been adjusted.
Redemption Fee – A 1.50% redemption fee is retained by the Fund to offset transaction costs and other expenses associated with short-term investing. The fee is imposed on redemptions or exchanges of shares held less than three months from their purchase date. The Fund records the fee as a reduction of shares redeemed and as a credit to shares of beneficial interest. For the year ended November 30, 2018, the Investor Class and the Advisor Class received $3 and $1,554 in redemption fees, respectively.
Guarantees and Indemnifications – In the normal course of business, the Fund enters into contracts with service providers that contain general indemnification clauses. Also, under the Fund’s organizational documents, its officers and Trustees are indemnified by the Fund against certain liabilities arising out of the performance of their duties to the Fund. The Fund notes that insofar as indemnification for liabilities arising under the Securities Act of 1933 may be permitted to trustees and officers, the Fund has been advised that in the opinion of the Securities and Exchange Commission such indemnification is against public policy as expressed in that Act and is, therefore, unenforceable. The Fund’s maximum exposure under these arrangements is unknown as this would involve future claims against the Fund that have not yet occurred. Based on experience, the Fund expects the risk of loss to be remote.
Use of Estimates– The preparation of financial statements in conformity with accounting principles generally accepted in the United States of America requires management to make estimates and assumptions that affect the reported amounts of assets and liabilities and disclosure of contingent assets and liabilities at the date of the financial statements and the reported amounts of increases and decreases in net assets from operations during the reporting period. Actual results could differ from those estimates.
Derivative Instruments – Equity securities in the gold mining industry, particularly the smaller companies, may occasionally issue warrants as part of their capital structure. A warrant gives the holder the right to purchase the underlying equity at the exercise price until the expiration date of the warrant. The Fund may hold such warrants for exposure to smaller companies in the portfolio or other reasons associated with the Fund’s overall objective
– 19 –
OCM GOLD FUND Notes to Financial Statements – November 30, 2018 (Continued) |
of long-term growth, though warrants will typically not be a significant part of the Fund’s portfolio. The Fund’s maximum risk in holding warrants is the loss of the entire amount paid for the warrants. At November 30, 2018, the Fund held warrants as listed on the Schedule of Investments.
Note 3. Investment Advisory Agreement and Affiliated Parties
The Fund has an investment advisory agreement with Orrell Capital Management, Inc. (“OCM” or the “Adviser”). Under the agreement, the Fund pays OCM a fee computed daily and payable monthly, at the following annual rates based upon average daily net assets:
Assets | Fee Rate |
$0 to $250 million | 0.950% |
$250 million to $500 million | 0.800% |
$500 million to $1 billion | 0.700% |
Over $1 billion | 0.600% |
Under the investment advisory agreement, the Adviser is responsible for reimbursing the Fund to maintain a voluntary ratio of expenses to average daily net assets for the Investor Class shares at 2.99%. As of March 29, 2018, the Adviser is responsible for reimbursing the Fund to maintain a voluntary ratio of expenses to average daily net assets for the Advisor Class shares at 2.49%. Prior to March 29, 2018, the Adviser was responsible for reimbursing the Fund to maintain a voluntary ratio of expenses to average daily net assets for the Advisor Class shares at 2.14%. Expenses of the Fund above such levels are borne by the Adviser, subject to future recoupment. Expense reimbursement obligations are calculated daily and paid monthly.
For the year ended November 30, 2018, the Advisor waived advisory fees totaling $82 for the Fund. The Advisor may recover from the Fund’s fees and/or expenses previously waived and/or absorbed, if the Fund’s expense ratio, including the recovered expenses, falls below the expense limit at which they were waived. The Fund’s advisor is permitted to seek reimbursement from the Fund, subject to certain limitations, of fees waived or payments made to the Fund for a period ending three full fiscal years after the date of the waiver or payment. This reimbursement may be requested from the Fund if the reimbursement will not cause the Fund’s annual expense ratio to exceed the lesser of (a) the expense limitation amount in effect at the time such fees were waived or payments made, or (b) the expense limitation amount in effect at the time of the reimbursement. The Advisor may recapture all or a portion of this amount no later than November 30, 2021.
– 20 –
OCM GOLD FUND Notes to Financial Statements – November 30, 2018 (Continued) |
The Fund does not compensate Trustees and Officers affiliated with OCM. For the year ended November 30, 2018, the expenses accrued for Trustees who are not affiliated with OCM are reported on the Statement of Operations. The Fund pays the salary and related expenses of the Fund’s Chief Compliance Officer. The expenses incurred for the Chief Compliance Officer are reported on the Statement of Operations.
Note 4. Distribution Agreement and Plan
The Trust has adopted a Distribution Plan (the “Plan”) pursuant to Rule 12b-1 under the Investment Company Act of 1940, as amended. The Plan authorizes the Fund to reimburse the distributor for marketing expenses incurred in distributing shares of the Fund, including the cost of printing sales material and making payments to dealers of the Fund’s Investor Class and Advisor Class, in any fiscal year, subject to limits of 0.99% and 0.25%, respectively, of the average daily net assets of each respective class. Prior to March 29, 2018, the Advisor Class shares were not subject to any 12b-1 fees under the Plan. For the year ended November 30, 2018, the Investor Class and the Advisor Class incurred $173,605 and $6,112, respectively, in expenses under the Plan.
Note 5. Purchases and Sales of Securities
Purchases and sales of investment securities (excluding short-term securities and U.S. government obligations) for the year ended November 30, 2018 were $1,786,077 and $11,687,540, respectively. There were no purchases or sales of U.S. government obligations.
Note 6. Federal Income Tax Information
At November 30, 2018, gross unrealized appreciation and depreciation of investments owned by the Fund, based on cost for federal income tax purposes were as follows:
Cost of investments | | $ | 14,735,628 | |
Unrealized appreciation | | $ | 10,788,534 | |
Unrealized depreciation | | | (1,677,880 | ) |
Unrealized depreciation on foreign currency | | | (22 | ) |
Net unrealized appreciation on investments | | $ | 9,110,632 | |
The difference between cost amounts for financial statement and federal income tax purposes is due primarily to investments in passive foreign investment companies (“PFICs”).
– 21 –
OCM GOLD FUND Notes to Financial Statements – November 30, 2018 (Continued) |
GAAP requires that certain components of net assets be reclassified between financial and tax reporting. These reclassifications have no effect on net asset value per share. For the year ended November 30, 2018, permanent differences in book and tax accounting have been reclassified to paid in capital and total distributable earnings as follows:
Increase (Decrease) |
Paid in Capital | Total Distributable
Earnings |
(282,125) | 282,125 |
The tax character of distributions paid during the fiscal years ended November 30, 2018 and 2017 was as follows:
| | | 2018 | | | 2017 | |
Ordinary income | | $ | — | | | $ | — | |
Net long-term capital gains | | | 2,426,112 | | | | 6,578,198 | |
Total distributions | | $ | 2,426,112 | | | $ | 6,578,198 | |
As of November 30, 2018 the components of accumulated earnings on a tax basis were as follows:
Undistributed ordinary income | | $ | — | |
Undistributed long-term gains | | | 5,446,485 | |
Tax accumulated earnings | | | 5,446,485 | |
Accumulated capital and other losses | | | (599,806 | ) |
Unrealized appreciation on investments | | | 9,110,632 | |
Total accumulated earnings | | $ | 13,957,311 | |
The Fund has $599,806 in Qualified late-year losses, which are deferred until fiscal year 2019 for tax purposes. Net late-year ordinary losses incurred after December 31 and within the taxable year and net late-year specified losses incurred after October 31 and within the taxable year are deemed to arise on the first day of the Fund’s next taxable year.
– 22 –
OCM GOLD FUND Notes to Financial Statements – November 30, 2018 (Continued) |
Note 7. Concentration of Risk
Investing in foreign securities involves certain risks not necessarily found in U.S. markets. These include risks associated with adverse changes in economic, political, regulatory and other conditions, changes in currency exchange rates, exchange control regulations, expropriation of assets or nationalization, imposition of withholding taxes on dividend or interest payments or capital gains, and possible difficulty in obtaining and enforcing judgments against foreign entities. Further, issuers of foreign securities are subject to different, and often less comprehensive, accounting, reporting, and disclosure requirements than domestic issuers.
As the Fund concentrates its investments in the gold mining industry, a development adversely affecting the industry (for example, changes in the mining laws which increases production costs or a significant decrease in the market price of gold) would have a greater adverse effect on the Fund than it would if the Fund invested in a number of different industries.
Note 8. Illiquid Securities
The Fund may invest up to 15% of net assets in securities for which there is no readily available market (“illiquid securities”). The 15% limitation includes securities whose disposition would be subject to legal restrictions (“restricted securities”). Illiquid and restricted securities often have a market value lower than the market price of unrestricted securities of the same issuer and are not readily marketable without some delay. This could result in the Fund being unable to realize a favorable price upon disposition of such securities and in some cases might make disposition of such securities at the time desired by the Fund impossible.
Note 9. Change in Independent Registered Public Accounting Firm
The Fund’s Audit Committee determined not to retain Deloitte & Touche LLP as the Fund’s independent Registered Public Accounting Firm and appointed Tait, Weller & Baker LLP for the fiscal year ending November 30, 2018. During the two most recent fiscal years, Deloitte & Touche LLP’s audit reports contained no adverse opinion or disclaimer of opinion; nor were their reports qualified as to uncertainty, audit scope, or accounting principles. Further, there were no disagreements between the Fund and Deloitte & Touche LLP on accounting principles or practices, financial statement disclosure or audit scope or procedure, which, if not resolved to the satisfaction of Deloitte & Touche LLP, would have caused them to make reference to the disagreement in their report.
During the Fund’s two most recent fiscal years, neither the Fund nor anyone on its behalf has consulted Tait, Weller & Baker LLP on items which concerned the application of accounting principles to a specified transaction, either completed or proposed, or the type of audit opinion that might be rendered on the Fund’s financial statements or concerned the subject of a disagreement or reportable events.
– 23 –
OCM GOLD FUND Notes to Financial Statements – November 30, 2018 (Continued) |
Note 10. Subsequent Events
Management has evaluated events and transactions for potential recognition or disclosure through the date the financial statements were issued. The Fund declared the following distributions:
Record Date | Payable Date | Long Term
Capital Gain | Short Term
Capital Gain | Ordinary Income |
12/20/2018 | 12/21/2018 | $1.66482 | $0.00000 | $0.00000 |
Management has determined there are no other material events that would require disclosure in the Fund’s financial statements through this date.
– 24 –
OCM GOLD FUND Financial Highlights Investor Class
|
| | | Year
Ended
Nov. 30,
2018 | | | Year
Ended
Nov. 30,
2017 | | | Year
Ended
Nov. 30,
2016 | | | Year
Ended
Nov. 30,
2015 | | | Year
Ended
Nov. 30,
2014 | |
Per Share Operating Performance | | | | | | | | | | | | | | | | | | | | |
(For a share outstanding throughout each period) | | | | | | | | | | | | | | | | | | | | |
| | | | | | | | | | | | | | | | | | | | | |
Net asset value, beginning of period | | $ | 9.26 | | | $ | 11.12 | | | $ | 7.19 | | | $ | 9.47 | | | $ | 11.26 | |
| | | | | | | | | | | | | | | | | | | | | |
Income from Investment Operations: | | | | | | | | | | | | | | | | | | | | |
Net investment loss1 | | | (0.19 | ) | | | (0.21 | ) | | | (0.24 | ) | | | (0.14 | ) | | | (0.17 | ) |
Net realized and unrealized gain/(loss) on investments and foreign currency transactions | | | (1.36 | ) | | | 0.10 | | | | 4.17 | | | | (1.98 | ) | | | (1.17 | ) |
Total from investment operations | | | (1.55 | ) | | | (0.11 | ) | | | 3.93 | | | | (2.12 | ) | | | (1.34 | ) |
| | | | | | | | | | | | | | | | | | | | | |
Less Distributions: | | | | | | | | | | | | | | | | | | | | |
Dividends from net investment income | | | — | | | | — | | | | — | | | | — | | | | — | |
Distribution from net realized gains | | | (0.66 | ) | | | (1.75 | ) | | | — | 2 | | | (0.16 | ) | | | (0.45 | ) |
Total distributions | | | (0.66 | ) | | | (1.75 | ) | | | — | 2 | | | (0.16 | ) | | | (0.45 | ) |
| | | | | | | | | | | | | | | | | | | | | |
Redemption fee proceeds | | | — | 2 | | | — | 2 | | | — | 2 | | | — | 2 | | | — | 2 |
| | | | | | | | | | | | | | | | | | | | | |
Net asset value, end of period | | $ | 7.05 | | | $ | 9.26 | | | $ | 11.12 | | | $ | 7.19 | | | $ | 9.47 | |
| | | | | | | | | | | | | | | | | | | | | |
Total return* | | | (18.24 | )% | | | 0.94 | % | | | 54.74 | % | | | (22.76 | )% | | | (11.49 | )% |
| | | | | | | | | | | | | | | | | | | | | |
Ratios/Supplemental Data: | | | | | | | | | | | | | | | | | | | | |
Net assets, end of year (in 000's) | | $ | 17,146 | | | $ | 30,492 | | | $ | 33,841 | | | $ | 24,750 | | | $ | 38,177 | |
Ratio of expenses to average net assets | | | 2.93 | % | | | 2.78 | % | | | 2.66 | % | | | 2.59 | % | | | 2.39 | % |
Ratio of net investment loss to average net assets | | | (2.27 | )% | | | (2.17 | )% | | | (2.07 | )% | | | (1.51 | )% | | | (1.34 | )% |
Portfolio turnover rate | | | 6 | % | | | 10 | % | | | 11 | % | | | 11 | % | | | 5 | % |
1 | Based on average shares method. |
2 | Amount represents less than $0.01 per share. |
See notes to financial statements.
– 25 –
OCM GOLD FUND Financial Highlights Advisor Class
|
| | | Year
Ended
Nov. 30,
2018 | | | Year
Ended
Nov. 30,
2017 | | | Year
Ended
Nov. 30,
2016 | | | Year
Ended
Nov. 30,
2015 | | | Year
Ended
Nov. 30,
2014 | |
Per Share Operating Performance | | | | | | | | | | | | | | | | | | | | |
(For a share outstanding throughout each period) | | | | | | | | | | | | | | | | | | | | |
| | | | | | | | | | | | | | | | | | | | | |
Net asset value, beginning of period | | $ | 9.86 | | | $ | 11.63 | | | $ | 7.46 | | | $ | 9.76 | | | $ | 11.49 | |
| | | | | | | | | | | | | | | | | | | | | |
Income from Investment Operations: | | | | | | | | | | | | | | | | | | | | |
Net investment loss1 | | | (0.15 | ) | | | (0.15 | ) | | | (0.18 | ) | | | (0.09 | ) | | | (0.09 | ) |
Net realized and unrealized gain/(loss) on investments and foreign currency transactions | | | (1.47 | ) | | | 0.12 | | | | 4.31 | | | | (2.06 | ) | | | (1.20 | ) |
Total from investment operations | | | (1.62 | ) | | | (0.03 | ) | | | 4.13 | | | | (2.15 | ) | | | (1.29 | ) |
| | | | | | | | | | | | | | | | | | | | | |
Less Distributions: | | | | | | | | | | | | | | | | | | | | |
Dividends from net investment income | | | — | | | | — | | | | — | | | | — | | | | — | |
Distribution from net realized gains | | | (0.66 | ) | | | (1.75 | ) | | | — | 2 | | | (0.16 | ) | | | (0.45 | ) |
Total distributions | | | (0.66 | ) | | | (1.75 | ) | | | — | 2 | | | (0.16 | ) | | | (0.45 | ) |
| | | | | | | | | | | | | | | | | | | | | |
Redemption fee proceeds | | | — | 2 | | | 0.01 | | | | 0.04 | | | | 0.01 | | | | 0.01 | |
| | | | | | | | | | | | | | | | | | | | | |
Net asset value, end of period | | $ | 7.58 | | | $ | 9.86 | | | $ | 11.63 | | | $ | 7.46 | | | $ | 9.76 | |
| | | | | | | | | | | | | | | | | | | | | |
Total return | | | (17.81 | )%3 | | | 1.81 | % | | | 55.98 | % | | | (22.28 | )% | | | (10.74 | )% |
| | | | | | | | | | | | | | | | | | | | | |
Ratios/Supplemental Data: | | | | | | | | | | | | | | | | | | | | |
Net assets, end of year (in 000's) | | $ | 6,624 | | | $ | 7,106 | | | $ | 9,467 | | | $ | 19,040 | | | $ | 16,970 | |
Ratio of expenses to average net assets | | | 2.31 | % | | | 2.05 | % | | | 2.03 | % | | | 2.01 | % | | | 1.79 | % |
Ratio of net investment loss to average net assets | | | (1.65 | )% | | | (1.44 | )% | | | (1.44 | )% | | | (0.92 | )% | | | (0.74 | )% |
Portfolio turnover rate | | | 6 | % | | | 10 | % | | | 11 | % | | | 11 | % | | | 5 | % |
1 | Based on average shares method. |
2 | Amount represents less than $0.01 per share. |
3 | Total returns would have been lower had expenses not been waived by the Adviser. |
See notes to financial statements.
– 26 –
OCM GOLD FUND Report of Independent Registered Public Accounting Firm
|
To the Board of Trustees of OCM Mutual Fund and
Shareholders of OCM Gold Fund
Opinion on the Financial Statements
We have audited the accompanying statement of assets and liabilities of OCM Gold Fund (the “Fund”), a series of OCM Mutual Fund (the “Trust”), including the schedule of investments, as of November 30, 2018, the related statement of operations, the statement of changes in net assets and the financial highlights for the year then ended, and the related notes (collectively referred to as the “financial statements”). The statement of changes for the year ended November 30, 2017 and the financial highlights for each of the four years in the period ended November 30, 2017 have been audited by other auditors, whose report dated January 26, 2018 expressed unqualified opinions on such statement and financial highlights. In our opinion, the financial statements present fairly, in all material respects, the financial position of the Fund as of November 30, 2018, the results of its operations, the changes in its net assets and the financial highlights for the year then ended, in conformity with accounting principles generally accepted in the United States of America.
Basis for Opinion
These financial statements are the responsibility of the Fund’s management. Our responsibility is to express an opinion on the Fund’s financial statements based on our audit. We are a public accounting firm registered with the Public Company Accounting Oversight Board (United States) (“PCAOB”) and are required to be independent with respect to the Fund in accordance with the U.S. federal securities laws and the applicable rules and regulations of the Securities and Exchange Commission and the PCAOB. We have served as the auditor of the fund since 2018.
We conducted our audit in accordance with the standards of the PCAOB. Those standards require that we plan and perform the audit to obtain reasonable assurance about whether the financial statements are free of material misstatement, whether due to error or fraud. The Fund is not required to have, nor were we engaged to perform, an audit of the Fund’s internal control over financial reporting. As part of our audit we are required to obtain an understanding of internal control over financial reporting, but not for the purpose of expressing an opinion on the effectiveness of the Fund’s internal control over financial reporting. Accordingly, we express no such opinion.
Our audit included performing procedures to assess the risks of material misstatement of the financial statements, whether due to error or fraud, and performing procedures that respond to those risks. Such procedures included examining, on a test basis, evidence regarding the amounts and disclosures in the financial statements. Our audit also included evaluating the accounting principles used and significant estimates made by management, as well as
– 27 –
OCM GOLD FUND Report of Independent Registered Public Accounting Firm (Continued)
|
evaluating the overall presentation of the financial statements. Our procedures included confirmation of securities owned as of November 30, 2018 by correspondence with the custodian. We believe that our audit provides a reasonable basis for our opinion.
TAIT, WELLER & BAKER LLP
Philadelphia, Pennsylvania
January 25, 2019
– 28 –
OCM GOLD FUND Expense Example – For the Period Ended November 30, 2018 (Unaudited) |
As a shareholder of the OCM Gold Fund (the “Fund”), you incur two types of costs: (1) transaction costs, including sales charges (loads) on purchase payments and redemption fees on certain redemptions; and (2) ongoing costs, including management fees; distribution (12b-1) fees; and other Fund expenses. This Example is intended to help you understand your ongoing costs (in dollars) of investing in the Fund and to compare these costs with the ongoing costs of investing in other mutual funds.
The Example is based on an investment of $1,000 invested at the beginning of the period and held for the entire period from June 1, 2018 to November 30, 2018 (the “period”).
Actual Expenses
The row titled “Actual” in the table below provides information about actual account values and actual expenses. You may use this information, together with the amount you invested, to estimate the expenses you paid over the period. Simply divide your account value by $1,000 (for example, an $8,600 account value divided by $1,000 equals 8.6), then multiply the result by the number in the appropriate line for your share class under the heading entitled “Expenses Paid During the Period” to estimate the expenses you paid on your account during the periods.
Hypothetical Example for Comparison Purposes
The row titled “Hypothetical” in the table below provides information about hypothetical account values and hypothetical expenses based on each class’ actual expense ratio and an assumed rate of return of 5% per year before expenses, which is not each class’ actual return. The hypothetical account values and expenses may not be used to estimate the actual ending account balance or expenses you paid for the period. You may use this information to compare the ongoing costs of investing in the classes of the Fund and other funds. To do so, compare these 5% hypothetical examples with the 5% hypothetical examples that appear in the shareholder reports of other funds.
Please note that the expenses shown in the table are meant to highlight your ongoing costs only and do not reflect any transactional costs, such as sales charges (loads) and redemption fees. Therefore, the hypothetical lines of the table are useful in comparing the ongoing costs only, and will not help you determine the relative total costs of owning different funds. In addition, if these transactional costs were included, your costs would have been higher.
– 29 –
OCM GOLD FUND Expense Example – For the Period Ended November 30, 2018 (Continued) (Unaudited) |
Expenses Paid During the Period
| | Beginning
Account Value
June 1, 2018 | Ending
Account Value
November 30, 2018 | Expenses Paid
During the
Period Ended
November 30, 2018* |
Investor Class | | | |
Actual | $1,000.00 | $805.70 | $13.37 |
Hypothetical (5% return before expenses) | 1,000.00 | 1,010.19 | 14.88 |
Advisor Class | | | |
Actual | 1,000.00 | 807.20 | 11.17 |
Hypothetical (5% return before expenses) | 1,000.00 | 1,012.64 | 12.44 |
* | Expenses are equal to the Investor Class’ and Advisor Class’ annualized expense ratios of 2.95% and 2.47%, respectively, for the period, multiplied by the average account value over the period, multiplied by 183/365 (to reflect the one-half year period). |
– 30 –
OCM GOLD FUND Other Information (Unaudited) |
Investments by Sector – As ofNovember 30, 2018
As a Percentage of Total Investments

The Fund will file its complete schedule of investments with the Securities and Exchange Commission (SEC) for the first and third quarters of each fiscal year on Form N-Q. The Fund’s Forms N-Q will be available on the EDGAR database on the SEC’s website at http://www.sec.gov. These Forms may also be reviewed and copied at the SEC’s Public Reference Room in Washington, D.C. Information about the operation of the Public Reference Room may be obtained by calling 1-800-SEC-0330.
A description of the Fund’s proxy voting policies and procedures and a record of the Fund’s proxy votes for the year ended June 30, 2018 are available without charge, upon request by calling toll free 1-800-779-4681 and on the SEC’s website at http://www.sec.gov. The Fund’s proxy voting policies and procedures are also available on the Fund’s website at http://www.ocmgoldfund.com.
– 31 –
OCM GOLD FUND - INVESTOR CLASS Performance Results – Year Ended November 30, 2018 (Unaudited) |
Average Annual Total Returns
| | Investor Class | S&P 500® Index | Philadelphia
Gold & Silver Index |
1 year | (21.95%) | 6.27% | (18.19%) |
5 year | (3.57%) | 11.12% | (4.90%) |
10 year | (0.96%) | 14.32% | (3.38%) |
– 32 –
OCM GOLD FUND - ADVISOR CLASS Performance Results – Period Ended November 30, 2018 (Unaudited) |
Average Annual Total Returns
| | Advisor Class | S&P 500® Index | Philadelphia
Gold & Silver Index |
1 year | (17.81%) | 6.27% | (18.19%) |
5 year | (1.97%) | 11.12% | (4.90%) |
Since Inception on 4/1/10 | (6.78%) | 12.75% | (9.22%) |

– 33 –
OCM GOLD FUND Annual Renewal of Investment Advisory Agreement (Unaudited) |
On October 22, 2018, the Board of Trustees of OCM Mutual Fund approved the continuation of the Fund’s investment advisory agreement with Orrell Capital Management, Inc. (the “Adviser”). Prior to approving the continuation of the agreement, the Board considered:
| | ● | the nature, extent and quality of the services provided by the Adviser |
| | ● | the investment performance of the Fund |
| | ● | the costs of the services to be provided and profits to be realized by the Adviser from its relationship with the Fund |
| | ● | the extent to which economies of scale would be realized as the Fund grows and whether fee levels reflect those economies of scale |
| | ● | the expense ratio of the Fund |
All of the factors discussed by the Trustees were considered as a whole, and were considered separately by the Trustees who are not “interested persons” of the Trust (the “Independent Trustees”), meeting in executive session. The factors were viewed in their totality by the Trustees, with no single factor being the principal or determinative factor in the Trustees’ determination of whether to approve the continuation of the investment advisory agreement. The Trustees recognized that the management and fee arrangements for the Fund are the result of years of review and discussion between the Independent Trustees and the Adviser, that certain aspects of such arrangements may receive greater scrutiny in some years than in others and that the Trustees’ conclusions may be based, in part, on their consideration of these same arrangements and information received during the course of the year and in prior years.
The material considerations and determinations of the Board, including all of the Independent Trustees, are provided below.
In considering the nature, extent and quality of the services provided by the Adviser, the Board considered an oral presentation by the Adviser describing the portfolio management, shareholder communication, and regulatory compliance services provided by the Adviser to the Fund. Based on their review, the Trustees believe that the Adviser provides high quality services to the Fund, and they noted that their overall confidence in the Adviser is high. The Trustees also concluded that they were satisfied with the nature, extent and quality of the investment advisory services provided to the Fund by the Adviser, and that the nature and extent of the services provided by the Adviser are appropriate to ensure that the Fund’s operations are conducted in compliance with applicable laws, rules and regulations.
– 34 –
OCM GOLD FUND Annual Renewal of Investment Advisory Agreement (Continued) (Unaudited) |
The Trustees compared the performance of the Fund to benchmark indices over various periods of time. The Adviser provided information regarding and led discussions of factors impacting the performance of the Fund, outlining current market conditions and explaining the Adviser’s expectations and strategies for the future. A lengthy discussion ensued regarding the challenges faced by active investment managers in today’s market and the steps the Adviser is taking to overcome those challenges. Based on this information, the Trustees concluded, within the context of their full deliberations, that the investment results that the Adviser had been able to achieve for the Fund were sufficient to support renewal of the investment advisory agreement. The Trustees noted that the Fund adhered to its investment style.
In concluding that the advisory fees payable by the Fund were reasonable, the Trustees reviewed the profits realized by the Adviser, from its relationship with the Fund. They discussed in detail the profitability of the Adviser as it relates to the Fund, and they discussed the impact of the intermediary service fees on the profitability. The Trustees also considered the resources and revenues that the Adviser has put into managing and distributing the Fund, and concluded that the level of profitability realized by the Adviser from its provision of services to the Fund is reasonable, and that the overall expense ratio and investment advisory fee were fair and within the range of industry averages.
As part of its analysis the Board considered the value of the research the Adviser received from broker-dealers executing securities transactions for the Fund. The Trustees concluded that the research obtained by the Adviser is beneficial to the Fund and that the Adviser had executed the Fund’s portfolio transactions in a manner designed to obtain best execution for the Fund. The Trustees determined such research has been used for legitimate purposes relating to the Fund by providing assistance in the investment decision-making process. The Trustees concluded that the other benefits realized by the Adviser from its relationship with the Fund were reasonable.
The Trustees also reviewed reports comparing the expense ratios of each class and advisory fees paid by the Fund to those paid by other comparable mutual funds in the same category and concluded that the advisory fees paid by the Fund and the expense ratios of each class of the Fund were in the range of comparable mutual funds. In making this conclusion, the Trustees also noted the unique expertise of the Adviser and that the Adviser does not currently engage any sub-advisers for the Fund. The Trustees also discussed the advisory fees payable by the Fund in relation to other advisory clients of the Adviser.
The Trustees concluded that the Fund has the right structure in place to realize lower fees and expenses when asset levels increase. The Trustees also considered whether the investment advisory agreement fee schedule should be adjusted for an increase in assets under management. They concluded that the existing “breakpoints” embodied in the investment advisory agreement resulted in substantially lower fee rates than those of comparable mutual funds.
– 35 –
OCM GOLD FUND Annual Renewal of Investment Advisory Agreement (Continued) (Unaudited) |
After reviewing the materials provided at the meeting, management’s presentation, as well as other information regularly provided at the Board’s quarterly meetings throughout the year regarding the quality of services provided by the Adviser, the performance of the Fund, expense information, regulatory compliance issues, trading information and related matters and other factors deemed relevant by the Board, the Trustees, including all of the Independent Trustees, determined to continue the investment advisory agreement.
Long Term Capital Gains Designation
(Unaudited)
Pursuant to IRC 852(b)(3) of the Internal Revenue Code OCM Gold Fund hereby designates $2,426,112 as long-term capital gains distributed during the year ended November 30, 2018.
– 36 –
OCM GOLD FUND Trustee and Officer Information (Unaudited) |
The business and affairs of the Funds are managed under the direction of the Board of Trustees. Information pertaining to the Trustees and Officers of the Fund is set forth below. The Fund’s Statement of Additional Information includes additional information about Trustees and is available, without charge, upon request by calling 1-800-779-4681.
Independent Trustees* |
Name, Address and Age | Position(s)
Held with Fund | Term of Office
and Length
of Service | Principal Occupation(s)
During Past 5 Years | Other
Directorships
Held by
Trustee or
Nominee
for Trustee |
Doug Webenbauer
2600 Kitty Hawk Road, Suite 119 Livermore, California 94551 Age 58 | Trustee | Indefinite
Since 2005 | Controller of Comtel Systems Technology, Inc., a low voltage electrical contractor, since 2016. Prior to that, Chief Financial Officer of M.E. Fox & Company, Inc., a beer distributor (2000 to 2016). | None |
Peter Hayman
2600 Kitty Hawk Road, Suite 119 Livermore, California 94551 Age 64 | Trustee | Indefinite
Since 2018 | Managing member of Anzus Capital, LLC, a corporate investment advisory firm specializing in Australasian companies, since 2005. Prior to that, Mr. Hayman held positions in institutional equity sales with investment firms ABN, AMRO, JP Morgan and Ord Minnett, since 1978. | None |
– 37 –
OCM GOLD FUND Trustee and Officer Information (Continued) (Unaudited) |
Interested Trustees and Officers** |
Name, Address and Age | Position(s)
Held with Fund | Term of Office
and Length
of Service | Principal Occupation(s)
During Past 5 Years | Other
Directorships
Held by
Trustee or
Nominee
for Trustee |
Gregory M. Orrell
2600 Kitty Hawk Road, Suite 119 Livermore, California 94551 Age 57 | Trustee, President, Treausrer | Indefinite
Since 2004 | President of Orrell Capital Management, Inc. since 1991. | None |
Monica L. Baucke
2600 Kitty Hawk Road, Suite 119 Livermore, California 94551 Age 48 | Secretary | One year term
Since 2014 | Communications Manager of Orrell Capital Management, Inc. since 2014. Independent Communications and Marketing Consultant from 2009 to 2014. | N/A |
Emile Molineaux
2600 Kitty Hawk Road, Suite 119 Livermore, California 94551 Age 56 | Chief Compliance Officer and Anti-Money Laundering Officer | At discretion of the Board
Since 2018 | Senior Compliance Officer and CCO of various clients of Northern Lights Compliance Services, LLC (since 2011.) | N/A |
* | “Independent” trustees are trustees who are not deemed to be “interested persons” of the Fund as defined in the Investment Company Act of 1940. |
** | An “interested” trustee is a trustee who is deemed to be an “interested person” of the Fund, as defined in the Investment Company Act of 1940. Gregory M. Orrell is an interested person of the Fund because of his ownership in the Fund’s investment adviser. |
– 38 –
THIS PAGE INTENTIONALLY LEFT BLANK
THIS PAGE INTENTIONALLY LEFT BLANK
THIS PAGE INTENTIONALLY LEFT BLANK
OCM Gold Fund
Distributed by:
Northern Lights Distributors, LLC
17605 Wright Street
Omaha, NE 68130
6110-NLD-01/23/2019
Item 2. Code of Ethics.
The registrant, as of the end of the period covered by this report, has adopted a code of ethics that applies to the Registrant’s principal executive officer, principal financial officer, principal accounting officer or controller, or persons performing similar functions, regardless of whether these individuals are employed by the Registrant or a third party. A copy of this code of ethics is attached hereto as Exhibit (a)
There have been no amendments to the registrant’s Sarbanes Oxley Code of Ethics during the reporting period for this Form N-CSR. There have also been no waivers granted by the Registrant to individuals covered by the Registrant’s Code of Ethics during the reporting period for this Form N-CSR.
Item 3. Audit Committee Financial Expert.
The Registrant’s board of trustees has determined that Mr. Doug Webenbauer is an audit committee financial expert serving on its audit committee and that Mr. Webenbauer is independent.
Item 4. Principal Accountant Fees and Services
The aggregate fees billed for each of the last two fiscal years for professional services rendered by the principal accountant for the audit of the Registrant’s annual financial statements or services that are normally provided by the accountant in connection with statutory and regulatory filings or engagements are listed below.
| | Fiscal year ended
November 30, 2018 | Fiscal year ended
November 30, 2017 |
| Audit Fees | $13,000 | $33,500 |
| Audit-Related Fees | $0 | $0 |
| Tax Fees | $2,500 | $5,350 |
| All Other Fees | $5,000* | $0 |
| * | Other fees noted relate to fees charged by prior principal accountant for deconversion costs. |
The Registrant’s audit committee has adopted an Audit Committee Charter that requires that the Audit Committee review the scope and plan of the registered public accounting firm’s annual and interim examinations, approve the services (other than the annual audit) to be performed for the Registrant by the independent public accountants and approve the fees and other compensation payable to the independent accountants. During the fiscal years ended November 30, 2018 and 2017, all of the audit and non-audit services provided by the Registrant’s principal accountant were pre-approved by the audit committee.
(f) None.
(g) None.
(h) Not applicable.
Item 5. Audit Committee of Listed Registrants
Not applicable.
Item 6. Schedule of Investments
The schedules of investments in securities in unaffiliated issuers are included as part of the reports to shareholders filed under Item 1.
Item 7. Disclosure of Proxy Voting Policies and Procedures for Closed-End Management Investment Companies
Not applicable.
Item 8. Portfolio Managers of Closed-End Management Investment Companies
Not applicable.
Item 9. Purchases of Equity Securities by Closed-End Management Investment Company and Affiliated Purchasers
Not applicable.
Item 10. Submissions of Matters to a Vote of Security Holders
As of the end of the period covered by this report, the registrant had not adopted any procedures by which shareholders may recommend nominees to the registrant’s Board of Directors.
Item 11. Controls and Procedures.
(a) The registrant's certifying officer has concluded that the registrant's disclosure controls and procedures (as defined in Rule 30a-2 under the Investment Company Act of 1940 (the "Act")) are effective in design and operation and are sufficient to form the basis of the certifications required by Rule 30a-2 under the Act, based on their evaluation of these disclosure controls and procedures within 90 days of the filing date of this report on Form N-CSR.
(b) Not Applicable
Item 12. Disclosure of Securities Lending Activities for Closed-End Management Investment Companies.
Not applicable.
Item 13. Exhibits.
(a)(1) Code of Ethics – Filed as an attachment to this filing.
(a)(2) Certification for each principal executive and principal financial officer of the registrant as required by Rule 30a-2 under the Act (17 CFR 270.30a-2(a)) – Filed as an attachment to this filing.
(a)(3) Any written solicitation to purchase securities under Rule 23c-1 under the Act sent or given during the period covered by the report by or on behalf of the registrant to 10 or more persons. Not applicable to open-end investment companies.
(a)(4) Change in the registrant’s independent public accountant – Filed as an attachment to this filing.
(b) Certifications required by Rule 30a-2(b) under the Act (17 CFR 270.30a-2(b)), Rule 13a-14(b) or Rule 15d-14(b) under the Exchange Act (17 CFR 240.13a-14(b) or 240.15d-14(b)), and Section 1350 of Chapter 63 of Title 18 of the United States Code (18 U.S.C. 1350) – Filed as an attachment to this filing.
SIGNATURES
Pursuant to the requirements of the Securities Exchange Act of 1934 and the Investment Company Act of 1940, the registrant has duly caused this report to be signed on its behalf by the undersigned, thereunto duly authorized.
OCM Mutual Fund
| By: | /s/ Gregory M. Orrell | |
| | Gregory M. Orrell | |
| | President and Treasurer | |
Date: January 29, 2019
Pursuant to the requirements of the Securities Exchange Act of 1934 and the Investment Company Act of 1940, this report has been signed below by the following persons on behalf of the registrant and in the capacities and on the dates indicated.
| By: | /s/ Gregory M. Orrell | |
| | Gregory M. Orrell | |
| | President and Treasurer | |
Date: January 29, 2019