UNITED STATES
SECURITIES AND EXCHANGE COMMISSION
Washington, D.C. 20549
FORM N-CSR
CERTIFIED SHAREHOLDER REPORT OF REGISTERED MANAGEMENT INVESTMENT
COMPANIES
Investment Company Act File Number 811-04010
OCM Mutual Fund
(Exact name of registrant as specified in charter)
2600 Kitty Hawk Road
Suite 119
Livermore, CA 94551
(Address of principal executive offices) (Zip code)
Gregory M. Orrell
Orrell Capital Management, Inc
2600 Kitty Hawk Road
Suite 119
Livermore, CA 94551
(Name and address of agent for service)
Registrant's telephone number, including area code: (925) 455-0802
Date of fiscal year end: November 30
Date of reporting period: November 30, 2021
Item 1. Report to Stockholders.

Annual Report
November 30, 2021
OCM GOLD FUND Shareholder Letter – November 30, 2021
(Unaudited) |
Dear Fellow Shareholders:
After strong performance in 2020 for gold bullion prices and precious metals equities, 2021 proved to be a year of consolidation. For the fiscal year ending November 30, 2021, the OCM Gold Fund Advisor Class (OCMAX) declined 0.42%, while the Investor Class (OCMGX) declined 0.95% (-5.39% after maximum sales load). The Philadelphia Gold and Silver Index (“XAU”)1 declined 1.79% over the same period, while accommodative monetary policies continued to provide the fuel to push the S&P 500 Index2 to record levels, gaining 27.92%. Considering gold assets are historically the reciprocal of financial assets, such as bonds and broad market equities, gold prices performed reasonably well with the London PM Fix3 gold price closing the year end fiscal period at $1,804.40 per ounce, up 2.37% for the year ending November 30, 2021.
Market Commentary
A potential “Perfect Storm” awaits U.S. equity markets in 2022 with rising interest rates, contracting liquidity, escalating inflation, and historically stretched valuations, in our opinion. The Federal Reserve’s4 (the “Fed”) “transitory” narrative regarding inflation proved false as the Consumer Price Index rose at an annual rate of 7% in 2021, a 40-year high. We believe Inflation is more deeply rooted than the Fed or Wall Street cares to acknowledge. For years, the United States benefited from cheap goods exported from China and other low-cost manufacturing countries that helped mask ongoing debasement of the U.S. dollar by the Federal Reserve. We believe the benefit of cheap labor centers has been exhausted. The pandemic has exposed supply chain issues within the United States that is forcing companies to re-examine just in time inventory policies along with re-shoring manufacturing closer to end markets. Additionally, supply constraints caused by ESG pressure to lower carbon footprints without having alternative capacity available, places further upward cost pressure that goes beyond just higher energy prices. Finally, a tight labor market is giving labor the upper hand in wage negotiations for the first time since the 1970’s along with political pressure to close the wealth divide. We are not sure monetary policy of marginally higher interest rates is the answer in this new paradigm.
It has been our opinion, due to high debt levels across both private and public sectors along with political pressure to socialize economic cycles, the Fed has limited capability to raise interest rates in a rising inflationary environment. Consequently, we believe Fed policy will remain behind the inflation curve with real interest rates staying negative, a wealth destructor for savers. Further, we believe the big question is how aggressive will the Fed attack inflationary pressures and risk price discovery of financial asset prices at much lower levels after years of practicing price repression through zero interest rate policies and Quantitative Easing? In our opinion, the prospect for Fed policy error is extremely high with stagflation as a likely outcome.
Despite what we feel are obvious inflationary pressures and the prospect for policy error, consensus view on Wall Street is the Fed will be able to navigate inflationary pressures without disrupting the bull market in equities. The S&P 500 Index to Gold ratio points to a possible different outcome with a change in sentiment toward gold and gold
– 1 –
OCM GOLD FUND Shareholder Letter – November 30, 2021 (Continued)
(Unaudited) |
assets at a nascent stage of breaking trend. Demand for gold over the past year has been underpinned by central banks looking to diversify dollar hegemony along with physical demand rebounding in China, India and Germany. We believe a change in risk appetite for assets that have experienced aggressive capital flows and appreciation, such as cryptocurrencies, non-fungible tokens (NFTs), certain technology and meme stocks, green energy/electric vehicle stocks along with art and collectibles, could see investors rotate capital towards gold assets in a bid for safety as losses grow in a meaningful pullback in global liquidity.
Gold Mining Industry/Shares of Gold Mining Companies
Though the gold mining industry is experiencing cost inflation like most other industries, it has embraced technological advances, such as autonomous vehicles, to controls costs. The industry’s hard-earned lessons from the previous bull market cycle from 2001 to 2011 have positioned the industry to grow in a disciplined manner and experience expanded margins and robust cash flows in a rising gold price environment without diluting shareholders. We believe that the gold mining industry is demonstrating it is a sustainable business that can compete with other sectors to attract long-term investors rather than investors looking to “rent the space” strictly for a trade on the gold price. The companies in the NYSE Arca Gold Miners Index5 (“GDM”) over the past year have delivered superior financial metrics to the S&P 500 Index, including free cash flow yield, return on assets, total debt to assets and net debt to earnings before interest, taxes, depreciation and amortization (EBITDA).
Shares of gold mining companies tend to perform best following cyclical peaks in consumer confidence. Following the peak in consumer confidence in 1968, the 11-year period that followed saw the S&P 500 Index rise 0.57% versus the Barron’s Gold Mining Index (BGMI) appreciating 264% during that same time frame. Following the peak in consumer confidence in 2000, it was a similar performance for shares of gold mining companies versus the S&P 500 with the S&P 500 down 12% versus the BGMI rising 352% from 2000 to 2011. The last peak of Conference Board’s Consumer Confidence Index occurred in October 2018. Owning shares of gold mining companies in the decade following the most recent peak may potentially prove to be a beneficial investment strategy in the future.
– 2 –
OCM GOLD FUND Shareholder Letter – November 30, 2021 (Continued)
(Unaudited) |
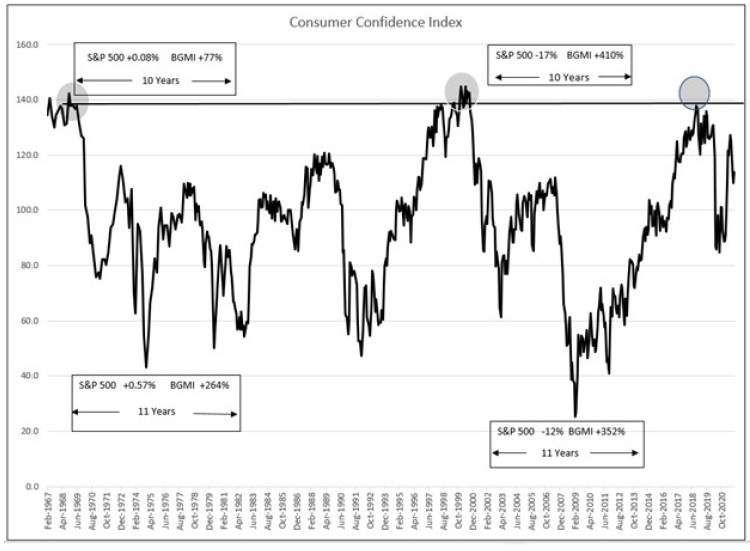
Source: OCM, Conference Board, Nick Laird
The Fund’s investment strategy remains a disciplined approach to searching out value and growth opportunities across all segments of the precious metals industry on a global basis. We believe companies that possess strong management, large reserves in the ground in stable jurisdictions, and exhibit capital discipline while holding equity dear will be the companies that outperform over time as they deliver higher levels of free cash flow to maintain a sustainable business model to create shareholder value. We are specifically targeting companies with existing production that possess large reserve expansion potential where shareholder value can potentially be created by increasing throughout on existing mill capacity. The Fund has the flexibility to maneuver within the precious metals sector to invest in opportunities that larger funds and exchange-traded funds (ETFs) cannot; from major gold
– 3 –
OCM GOLD FUND Shareholder Letter – November 30, 2021 (Continued)
(Unaudited) |
producers with over one million ounces of annual production to junior gold producers with less than 100,000 ounces of annual production to small exploration and development companies with micro capitalizations. Over the past year, we have increased the portfolio allocation to exploration and development companies as we believe the industry is starved for new gold reserves which will lead larger producers to acquire reserves in the ground of junior gold producers.
Conclusion
It is our belief the Fed’s extreme monetary policies to socialize the risk of economic downturns over the past 20 years has been the foundation of the bull market in financial assets. Up until this past year, consumer inflation has remained relatively contained. In our opinion, the Fed’s credibility is on the line as it moves to raise interest rates and shrink its balance sheet without causing significant collateral damage. We believe the prospect for policy error and erosion of confidence in central banking is high. While investors have been slow to appreciate the gold mining industry’s improved fundamentals and earnings leverage to higher gold prices, we believe it creates an opportunity for investors to position in gold assets at attractive valuations ahead of large capital flows moving into gold looking for protection against monetary debasement.
We appreciate your shareholding and confidence in the OCM Gold Fund, and we look forward to attempting to meet the investment objective of preserving your purchasing power. Should you have any questions regarding the Fund or gold, please contact your financial adviser or you may contact us directly at 1-800-779-4681. For questions regarding your account, please contact Shareholder Service at 1-800-628-9403.
Sincerely,

Gregory M. Orrell
Portfolio Manager
January 21, 2022
The Philadelphia Gold and Silver Index (XAU)1 is an unmanaged capitalization-weighted index composed of 16 companies listed on U.S. exchanges involved in the gold and silver mining industry. The index is generally considered as representative of the gold and silver share market. You cannot invest directly in an index. The index is used herein for comparative purposes in accordance with SEC regulation.
– 4 –
OCM GOLD FUND Shareholder Letter – November 30, 2021 (Continued)
(Unaudited) |
The S&P 500 Index2, a registered trademark of McGraw-Hill Co., Inc. is a market capitalization-weighted index of 500 widely held common stocks. You cannot invest directly in an index. The index is used herein for comparative purposes in accordance with SEC regulation.
London PM Fix3 is a price per ounce for each of the precious metals (gold, silver, platinum and palladium) determined daily at 10:30 and 15:00 GMT by a brief conference call among the five members of the London Gold Pool (Scotia-Mocatta, Barclays Capital, Deutsche Bank, HSBC and Société Générale). The London spot fix price is the price fixed at the moment when the conference call terminates.
Federal Reserve4 is the central bank of the United States and arguably the most powerful financial institution in the world. The Federal Reserve System was founded by the U.S. Congress in 1913 to provide the nation with a safe, flexible, and stable monetary and financial system.
NYSE Arca Gold Miners Index (GDM)5 is a modified market capitalization-weighted index comprised of publicly traded companies primarily involved in the mining of gold and silver in locations around the world. The index is used herein for comparative purposes in accordance with SEC regulation.
– 5 –
OCM GOLD FUND Shareholder Letter – November 30, 2021 (Continued)
(Unaudited) |
Investing in the Fund involves risks including the loss of principal. Many of the companies in which the Fund invests are smaller capitalization companies, which may subject the Fund to greater risk than securities of larger, more-established companies, as smaller companies often have limited product lines, markets or financial resources, and may be subject to more-abrupt market movements. The Fund also invests in securities of gold and precious metals companies which may be subject to greater price fluctuations over short periods of time. The Fund is a non-diversified investment company meaning it will invest in fewer securities than diversified investment companies and its performance may be more volatile. The Fund contains international securities that may provide the opportunity for greater return but also have special risks associated with foreign investing including fluctuations in currency, government regulation, differences in accounting standards and liquidity.
Investor Class Performance as of November 30, 2021
| | OCMGX
(without load) | OCMGX
(with load) | Philadelphia
Gold and Silver
Index (XAU)1 | S&P 5002 | |
Six Months | -16.54% | -20.29% | -19.92% | 9.38% | |
One Year | -0.95% | -5.39% | -1.79% | 27.92% | |
3 Year Annualized | 31.98% | 29.98% | 27.89% | 20.38% | |
5 Year Annualized | 13.66% | 12.63% | 11.35% | 17.90% | |
10 Year Annualized | -1.64% | -2.09% | -3.46% | 16.16% | |
Advisor Class Performance as of November 30, 2021
| | OCMAX | Philadelphia
Gold and Silver
Index (XAU)1 | S&P 5002 | |
Six Months | -16.34% | -19.92% | 9.38% | |
One Year | -0.42% | -1.79% | 27.92% | |
3 Year Annualized | 33.11% | 27.89% | 20.38% | |
5 Year Annualized | 14.57% | 11.35% | 17.90% | |
10 Year Annualized | -0.92% | -3.46% | 16.16% | |
The performance data quoted above represents past performance. Current performance may be lower or higher than the performance data quoted above. Past performance is no guarantee of future results. The investment return and principal value of an investment will fluctuate so that investor’s shares, when redeemed, may be worth more or less than their original cost. The Fund’s Total Annual Operating Expenses for the Fund’s Investor Class and Advisor
– 6 –
OCM GOLD FUND Shareholder Letter – November 30, 2021 (Continued)
(Unaudited) |
Class are 2.29% and 1.79% respectively. Please review the Fund’s prospectus for more information regarding the Fund’s fees and expenses. For performance information current to the most recent month-end, please call toll-free 800-628-9403. The returns shown include the reinvestment of all dividends but do not reflect the deduction of taxes that a shareholder would pay on Fund distributions or the redemption of Fund shares.
1 | The Philadelphia Gold and Silver Index (XAU) is an unmanaged capitalization-weighted index composed of 16 companies listed on U.S. exchanges involved in the gold and silver mining industry. The index is generally considered as representative of the gold and silver share market. You cannot invest directly in an index. The index is used herein for comparative purposes in accordance with SEC regulation. |
2 | The S&P 500 Index, a registered trademark of McGraw-Hill Co., Inc. is a market capitalization-weighted index of 500 widely held common stocks. You cannot invest directly in an index. The index is used herein for comparative purposes in accordance with SEC regulation. |
– 7 –
OCM GOLD FUND Schedule of Investments – November 30, 2021
|
| Shares | | | | | Value | |
| COMMON STOCKS 97.8% | | | |
| Major Gold Producers 23.4% | | | |
| 80,000 | | | Agnico Eagle Mines Ltd. | | $ | 3,984,000 | |
| 155,000 | | | AngloGold Ashanti Ltd. ADR | | | 3,245,700 | |
| 200,000 | | | Barrick Gold Corp. | | | 3,798,000 | |
| 75,000 | | | Kinross Gold Corp. | | | 446,250 | |
| 25,000 | | | Kirkland Lake Gold Ltd. | | | 988,750 | |
| 65,000 | | | Newmont Corp. | | | 3,569,800 | |
| | | | | | | 16,032,500 | |
| Intermediate/Mid-Tier Gold Producers 20.6% |
| 325,000 | | | Alamos Gold, Inc. | | | 2,483,000 | |
| 300,000 | | | B2Gold Corp. | | | 1,188,258 | |
| 140,000 | | | Endeavour Mining Corp. | | | 3,284,384 | |
| 50,000 | | | Northern Star Resources Ltd. | | | 336,470 | |
| 700,000 | | | OceanaGold Corp.* | | | 1,271,233 | |
| 25,000 | | | Pan American Silver Corp. | | | 638,500 | |
| 1,000,000 | | | Perseus Mining Ltd.* | | | 1,169,090 | |
| 154,840 | | | SSR Mining, Inc. | | | 2,813,443 | |
| 80,000 | | | Torex Gold Resources, Inc.* | | | 876,086 | |
| | | | | | | 14,060,464 | |
Junior Gold Producers 27.0% | | | |
| 450,000 | | | Argonaut Gold, Inc.* | | | 1,232,877 | |
| 200,000 | | | Calibre Mining Corp.* | | | 211,350 | |
| 250,000 | | | Dundee Precious Metals, Inc. | | | 1,590,998 | |
| 201,700 | | | Fiore Gold Ltd.* | | | 221,041 | |
| 305,650 | | | Fortuna Silver Mines, Inc.* | | | 1,064,691 | |
| 250,000 | | | Galiano Gold, Inc.* | | | 184,975 | |
| 1,449,950 | | | Jaguar Mining, Inc. | | | 4,937,207 | |
| 175,000 | | | K92 Mining, Inc.* | | | 1,013,699 | |
| 1,000,000 | | | Minera Alamos, Inc.* | | | 422,701 | |
| 350,000 | | | Mineros S.A.* | | | 315,068 | |
| 3,850,000 | | | Superior Gold, Inc.* | | | 2,350,685 | |
| 500,000 | | | Wesdome Gold Mines Ltd.* | | | 4,892,368 | |
| | | | | | | 18,437,660 | |
| Exploration and Development Companies 11.1% |
| 155,128 | | | Adriatic Metals PLC* | | $ | 293,049 | |
| 800,000 | | | Apollo Silver Corp.* | | | 425,832 | |
| 500,000 | | | Ascot Resources Ltd.* | | | 481,409 | |
| 1,375,000 | | | Emerald Resources N.L.* | | | 1,043,894 | |
| 700,000 | | | Euro Sun Mining, Inc.* | | | 156,164 | |
| 500,000 | | | Galway Metals, Inc.* | | | 250,489 | |
| 1,000,000 | | | GR Silver Mining Ltd.* | | | 223,092 | |
| 123,880 | | | Integra Resources Corp.* | | | 271,518 | |
| 775,000 | | | Liberty Gold Corp.* | | | 655,186 | |
| 1,000,000 | | | Maritime Resources Corp.* | | | 97,847 | |
| 616,500 | | | Montage Gold Corp.* | | | 313,679 | |
| 400,000 | | | Orca Gold, Inc.* | | | 165,949 | |
| 500,000 | | | Orezone Gold Corp.* | | | 508,806 | |
| 400,000 | | | Paramount Gold Nevada Corp.* | | | 288,000 | |
| 975,000 | | | Rio2 Ltd.* | | | 503,718 | |
| 3,000,000 | | | Royal Road Minerals Ltd.* | | | 634,051 | |
| 4,578,755 | | | RTG Mining, Inc.* | | | 326,401 | |
| 2,512,040 | | | Sutter Gold Mining, Inc.*,# | | | — | |
| 1,210,500 | | | Tajiri Resources Corp.* | | | 61,591 | |
| 1,595,000 | | | Thor Explorations Ltd.* | | | 324,619 | |
| 530,000 | | | West Vault Mining, Inc.* | | | 439,765 | |
| 450,000 | | | Westhaven Gold Corp.* | | | 151,468 | |
| | | | | | | 7,616,527 | |
Royalty/Streaming Companies 7.0% | | | |
| 50,000 | | | Osisko Gold Royalties Ltd. | | | 610,500 | |
| 100,000 | | | Wheaton Precious Metals Corp. | | | 4,181,605 | |
| | | | | | | 4,792,105 | |
See notes to financial statements.
– 8 –
OCM GOLD FUND Schedule of Investments – November 30, 2021 (Continued)
|
| Shares | | | | Value | |
| Primary Silver Producers 8.7% | | | |
| 500,000 | | Andean Precious Metals Corp.* | | $ | 575,000 | |
| 634,100 | | Aya Gold & Silver, Inc.* | | | 4,824,620 | |
| 100,000 | | Hecla Mining Co. | | | 554,000 | |
| | | | | | 5,953,620 | |
Total Common Stocks | | | |
| | | (Cost $33,409,327) | | | 66,892,876 | |
| | | | | | | |
WARRANTS 2.6% | | | |
| Exploration and Development Companies 0.0% |
| 641,000 | | Euro Sun Mining, Inc. Exercise Price 0.55 CAD, Exp. 6/5/2023* | | | — | |
| 225,000 | | Westhaven Gold Corp. Exercise Price 1.00 CAD, Exp. 3/3/2023* | | | 29,501 | |
| 400,000 | | Apollo Silver Corp. Exercise Price 1.25 CAD, Exp. 6/25/2023* | | | — | |
| | | | | | 29,501 | |
| Shares | | | | Value | |
| Primary Silver Producers 2.6% | | | |
| 350,000 | | Aya Gold & Silver, Inc. Exercise Price 3.30 CAD, Exp. 9/3/2023* | | $ | 1,758,904 | |
| | | | | | 1,758,904 | |
| Total Warrants | | | | | | |
| | | (Cost $0) | | | 1,788,405 | |
Total Investments | | | | | | | | |
| | | | | (Cost $33,409,327) | 100.4% | | | 68,681,281 | |
Liabilities less Other Assets | | | (0.4 | )% | | | (266,729 | ) |
TOTAL NET ASSETS | | | 100.0 | % | | $ | 68,414,552 | |
ADR – American Depository Receipt
PLC – Public Limited Company
CAD – Canadian Dollars
* | Non-income producing security. |
# | Level 3 security fair valued under procedures established by the Board of Trustees, represents 0.00% of Net Assets. The total value of this security is $0. |
See notes to financial statements.
– 9 –
OCM GOLD FUND Schedule of Investments – November 30, 2021 (Continued)
|
SUMMARY OF INVESTMENTS BY COUNTRY
Country | | Value | | | Percent of
Investment Securities | |
Australia | | $ | 2,549,455 | | | | 3.7% | |
Canada | | | 53,621,373 | | | | 78.1 | |
Colombia | | | 315,068 | | | | 0.5 | |
Jersey | | | 634,051 | | | | 0.9 | |
South Africa | | | 3,245,700 | | | | 4.7 | |
United Kingdom | | | 3,577,433 | | | | 5.2 | |
United States | | | 4,411,800 | | | | 6.4 | |
Virgin Islands (British) | | | 326,401 | | | | 0.5 | |
Total | | $ | 68,681,281 | | | | 100.0% | |
See notes to financial statements.
– 10 –
OCM GOLD FUND Statement of Assets and Liabilities – November 30, 2021
|
Assets: | | | | |
Investments in unaffiliated issuers, at value (cost $33,409,327) | | $ | 68,681,281 | |
Foreign currency, at value (cost $307,041) | | | 307,041 | |
Interest and dividends receivable | | | 121,421 | |
Receivable for fund shares sold | | | 5,279 | |
Prepaid expenses and other assets | | | 33,194 | |
Total assets | | | 69,148,216 | |
| | | | | |
Liabilities: | | | | |
Investment securities purchased | | | 307,041 | |
Payable for fund shares redeemed | | | 239,518 | |
Due to Custodian | | | 11,043 | |
Accrued distribution fees | | | 47,128 | |
Investment adviser fees | | | 55,770 | |
Accrued transfer agent fees and expenses | | | 16,314 | |
Accrued fund administration and accounting fees | | | 21,260 | |
Accrued Trustees’ fees | | | 3,400 | |
Accrued audit fees | | | 16,000 | |
Accrued report to shareholders | | | 11,727 | |
Accrued expenses and other liabilities | | | 4,463 | |
Total liabilities | | | 733,664 | |
Net Assets | | $ | 68,414,552 | |
| | | | | |
Net Assets Consist of: | | | | |
Shares of beneficial interest, no par value: unlimited shares authorized | | $ | 35,031,168 | |
Total distributable earnings | | | 33,383,384 | |
Net Assets | | $ | 68,414,552 | |
| | | | | |
Calculation of Maximum Offering Price: | | | | |
Investor Class: | | | | |
Net asset value and redemption price per share | | $ | 11.71 | |
Maximum sales charge (4.50% of offering price) | | | 0.55 | |
Offering price to public | | $ | 12.26 | |
Shares outstanding | | | 1,454,120 | |
Advisor Class: | | | | |
Net asset value and redemption price per share | | $ | 13.21 | |
Shares outstanding | | | 3,891,314 | |
Total Shares Outstanding | | | 5,345,434 | |
See notes to financial statements.
– 11 –
OCM GOLD FUND Statement of Operations – Year Ended November 30, 2021
|
Investment Income | | | | |
Interest | | $ | 145 | |
Dividend (net of foreign withholding taxes of $126,434) | | | 995,289 | |
Total investment income | | | 995,434 | |
| | | | | |
Expenses | | | | |
Investment advisory fees | | | 724,100 | |
Fund administration and accounting fees | | | 134,965 | |
Transfer agent fees and expenses | | | 129,098 | |
Distribution fees - Investor Class | | | 119,590 | |
Distribution fees - Advisor Class | | | 86,734 | |
Federal and state registration fees | | | 51,652 | |
Legal fees | | | 31,273 | |
Chief Compliance Officer fees | | | 25,000 | |
Custody fees | | | 24,185 | |
Reports to shareholders | | | 16,044 | |
Audit fees | | | 16,000 | |
Trustees’ fees | | | 10,000 | |
Other expenses | | | 15,087 | |
Total expenses | | | 1,383,728 | |
Net investment loss | | | (388,294 | ) |
| | | | | |
Realized and Unrealized Gain on Investments: | | | | |
Net realized gain on investments and foreign currency transactions | | | 1,149,554 | |
Net change in unrealized appreciation/depreciation on investments and foreign currency translations | | | (1,295,766 | ) |
Net loss on investments | | | (146,212 | ) |
| | | | | |
Net decrease in net assets from operations | | $ | (534,506 | ) |
See notes to financial statements.
– 12 –
OCM GOLD FUND Statements of Changes in Net Assets
|
| | | Year Ended
November 30,
2021 | | | Year Ended
November 30,
2020 | |
Operations: | | | | | | | | |
Net investment loss | | $ | (388,294 | ) | | $ | (703,102 | ) |
Net realized gain on investments and foreign currency transactions | | | 1,149,554 | | | | 317,376 | |
Net change in unrealized appreciation/depreciation on investments and foreign currency transactions | | | (1,295,766 | ) | | | 17,186,699 | |
Net increase from payment by affiliates (Note 3) | | | — | | | | 4,158 | |
Net increase (decrease) in net assets from operations | | | (534,506 | ) | | | 16,805,131 | |
| | | | | | | | | |
Distributions Paid to Shareholders | | | | | | | | |
Distributions: | | | | | | | | |
Investor Class | | | (192,546 | ) | | | (1,489,153 | ) |
Advisor Class | | | (884,171 | ) | | | (792,591 | ) |
Total | | | (1,076,717 | ) | | | (2,281,744 | ) |
| | | | | | | | | |
Fund Share Transactions | | | | | | | | |
Investor Class: | | | | | | | | |
Net proceeds from shares sold | | | 1,034,437 | | | | 1,346,996 | |
Distributions reinvested | | | 171,134 | | | | 1,410,502 | |
Payment of shares redeemed1 | | | (2,238,684 | ) | | | (13,385,671 | ) |
Net decrease in net assets from Investor Class share transactions | | | (1,033,113 | ) | | | (10,628,173 | ) |
| | | | | | | | | |
Advisor Class: | | | | | | | | |
Net proceeds from shares sold | | | 18,796,257 | | | | 56,148,361 | |
Distributions reinvested | | | 839,586 | | | | 748,817 | |
Payment of shares redeemed2 | | | (22,522,613 | ) | | | (21,820,965 | ) |
Net increase (decrease) in net assets from Advisor Class share transactions | | | (2,886,770 | ) | | | 35,076,213 | |
Net increase (decrease) in net assets from Fund share transactions | | | (3,919,883 | ) | | | 24,448,040 | |
| | | | | | | | | |
Total increase (decrease) in net assets | | | (5,531,106 | ) | | | 38,971,427 | |
| | | | | | | | | |
Net Assets, Beginning of Period | | | 73,945,658 | | | | 34,974,231 | |
Net Assets, End of Period | | $ | 68,414,552 | | | $ | 73,945,658 | |
See notes to financial statements.
– 13 –
OCM GOLD FUND Statements of Changes in Net Assets (Continued)
|
| | | Year Ended
November 30,
2021 | | | Year Ended
November 30,
2020 | |
Transactions in shares | | |
Investor Class: | | |
Shares sold | | | 83,147 | | | | 113,065 | |
Shares issued on reinvestment of distributions | | | 13,454 | | | | 171,177 | |
Shares redeemed | | | (178,692 | ) | | | (1,353,678 | ) |
Net decrease in Investor Class shares outstanding | | | (82,091 | ) | | | (1,069,436 | ) |
| | | | | | | | | |
Advisor Class: | | | | | | | | |
Shares sold | | | 1,328,775 | | | | 4,511,934 | |
Shares issued on reinvestment of distributions | | | 58,836 | | | | 81,305 | |
Shares redeemed | | | (1,628,111 | ) | | | (1,768,380 | ) |
Net increase (decrease) in Advisor Class shares outstanding | | | (240,500 | ) | | | 2,824,859 | |
Net Increase (Decrease) in Fund Shares Outstanding | | | (322,591 | ) | | | 1,755,423 | |
1 | Net of redemption fees of $2,178 for the year ended November 30, 2021 and $3,343 for the year ended November 30, 2020, respectively. |
2 | Net of redemption fees of $43,151 for the year ended November 30, 2021 and $146,148 for the year ended November 30, 2020, respectively. |
See notes to financial statements.
– 14 –
OCM GOLD FUND Notes to Financial Statements – November 30, 2021
|
Note 1. Organization
OCM Mutual Fund (the “Trust”) is registered under the Investment Company Act of 1940, as amended, as an open-end management investment company. The Trust was organized as a Massachusetts business trust on January 6, 1984 and consists of the OCM Gold Fund (the “Fund”). The Fund is a non-diversified fund. The investment objective for the Fund is long-term growth of capital through investing primarily in equity securities of domestic and foreign companies engaged in activities related to gold and precious metals.
The Fund is an investment company and accordingly follows the investment company accounting and reporting guidance of the Financial Accounting Standards Board (“FASB”) Accounting Standard Codification Topic 946 “Financial Services—Investment Companies.”
Note 2. Significant Accounting Policies
The following is a summary of significant accounting policies followed by the Fund in the preparation of its financial statements.
Security Valuation – Portfolio securities that are listed on national securities exchanges, other than the NASDAQ Stock Market LLC, are valued at the last sale price as of the close of business of such securities exchanges, or, in the absence of recorded sales, at the average of readily available closing bid and ask prices on such exchanges. NASDAQ Global Select Market, Global Market and Capital Market securities are valued at the NASDAQ Official Closing Price (“NOCP”). If a NOCP is not issued for a given day, these securities are valued at the average of readily available closing bid and ask prices. Unlisted securities are valued at the average of the quoted bid and ask prices in the over-the-counter market. Short-term investments which mature in less than 60 days are valued at amortized cost (unless the Trust’s Board of Trustees determines that this method does not represent fair value). Short-term investments which mature after 60 days are valued at market. Securities and other assets for which market quotations are not readily available are valued at fair value as determined in good faith by the investment adviser under procedures established by and under the general supervision and responsibility of the Trust’s Board of Trustees. For each investment that is fair valued, the investment adviser considers, to the extent applicable, various factors including, but not limited to, the type of security, the financial condition of the company, comparable companies in the public market, the nature and duration of the cause for a quotation not being readily available and other relevant factors.
Fair Value Measurements and Disclosures defines fair value, establishes a framework for measuring fair value in accordance with GAAP, and expands disclosure about fair value measurements. It also provides guidance on determining when there has been a significant decrease in the volume and level of activity for an asset or a liability, when a transaction is not orderly, and how that information must be incorporated into a fair value measurement.
– 15 –
OCM GOLD FUND Notes to Financial Statements – November 30, 2021 (Continued)
|
Under Fair Value Measurements and Disclosures, various inputs are used in determining the value of the Fund’s investments. These inputs are summarized into three broad levels as described below:
| | ● | Level 1 – Unadjusted quoted prices in active markets for identical assets or liabilities that the Funds have the ability to access. |
| | ● | Level 2 – Observable inputs other than quoted prices included in Level 1 that are observable for the asset or liability, either directly or indirectly. These inputs may include quoted prices for the identical instrument on an inactive market, prices for similar instruments, interest rates, prepayment speeds, credit risk, yield curves, default rates and similar data. |
| | ● | Level 3 – Unobservable inputs for the asset or liability, to the extent relevant observable inputs are not available, representing the Fund’s own assumptions about the assumptions a market participant would use in valuing the asset or liability, and would be based on the best information available. |
The availability of observable inputs can vary from security to security and is affected by a wide variety of factors, including for example, the type of security, whether the security is new and not yet established in the marketplace, the liquidity of markets, and other characteristics particular to the security. To the extent that valuation is based on models or inputs that are less observable or unobservable in the market, the determination of fair value requires more judgment. Accordingly, the degree of judgment exercised in determining fair value is greatest for instruments categorized in Level 3.
The inputs to measure fair value may fall into different Levels of the fair value hierarchy. In such cases, for disclosure purposes, the Level in the fair value hierarchy within which the fair value measurement falls in its entirety, is determined based on the lowest Level input that is significant to the fair value measurement in its entirety.
– 16 –
OCM GOLD FUND Notes to Financial Statements – November 30, 2021 (Continued)
|
The inputs or methodology used for valuing securities are not an indication of the risk associated with investing in those securities. The following is a summary of the inputs used, as of November 30, 2021, in valuing the Fund’s assets carried at fair value:
Sector | | Level 1 | | | Level 2 | | | Level 3 | | | Total | |
Common Stocks | | | | | | | | | | | | | | | | |
Major Gold Producers | | $ | 16,032,500 | | | $ | — | | | $ | — | | | $ | 16,032,500 | |
Intermediate/Mid-Tier Gold Producers | | | 14,060,464 | | | | — | | | | — | | | | 14,060,464 | |
Junior Gold Producers | | | 18,437,660 | | | | — | | | | — | | | | 18,437,600 | |
Exploration and Development Companies | | | 6,572,633 | | | | 1,043,894 | | | | — | | | | 7,616,527 | |
Royalty/Streaming Companies | | | 4,792,105 | | | | — | | | | — | | | | 4,792,105 | |
Primary Silver Producers | | | 5,953,620 | | | | — | | | | — | | | | 5,953,620 | |
Warrants | | | 29,501 | | | | 1,758,904 | | | | — | | | | 1,788,405 | |
Total | | $ | 65,878,483 | | | $ | 2,802,798 | | | $ | — | | | $ | 68,681,281 | |
The Fund held four Level 2 securities at November 30, 2021. Euro Sun Mining, Inc., Apollo Gold & Silver Corp. and Aya Gold & Silver, Inc., all Warrants, are being valued at intrinsic value, in accordance with procedures established by and under the general supervision of the Trust’s Board of Trustees. Emerald Resources N.L. (“EMR CN”) shares were halted pending the release of an announcement regarding a material acquisition. The common shares of EMR CN will be valued at the last available close price, in accordance with procedures established by and under the general supervision of the Trust’s Board of Trustees. The Fund held one Level 3 security at November 30, 2021. Sutter Gold Mining, Inc. (“SGM CN”) has ceased operations and a receiver for the company’s assets has been appointed. The common shares of SGM CN will be valued at zero, in accordance with procedures established by and under the general supervision of the Trust’s Board of Trustees, until such time as the receiver has finalized the sale of the company’s assets.
There was no Level 3 activity during the year ended November 30, 2021 and did not warrant a Level 3 rollforward disclosure.
– 17 –
OCM GOLD FUND Notes to Financial Statements – November 30, 2021 (Continued)
|
The Level 3 investments for the Fund represented 0.00% of net assets and did not warrant a disclosure of significant unobservable valuation inputs.
Foreign Currency – Investment securities and other assets and liabilities denominated in foreign currencies are translated into U.S. dollar amounts at the date of valuation. Purchases and sales of investment securities and income and expense items denominated in foreign currencies are translated into U.S. dollar amounts on the respective dates of such transactions. The Fund does not isolate that portion of the results of operations resulting from changes in foreign exchange rates on investments from the fluctuations arising from changes in market prices of securities held. Such fluctuations for the year ended November 30, 2021 are included within the realized and unrealized gain/loss on investments section of the Statement of Operations.
Reported net realized foreign exchange gains or losses arise from sales of foreign currencies, currency gains or losses realized between the trade and settlement dates on securities transactions, and the difference between the amounts of dividends, interest and foreign withholding taxes recorded on the Fund’s books and the U.S. dollar equivalent of the amounts actually received or paid. Net unrealized foreign exchange gains and losses arise from changes in the fair value of assets and liabilities, other than investments in securities at fiscal period end, resulting from changes in exchange rates. Such fluctuations for the year ended November 30, 2021 are included within the realized and unrealized gain/loss on investments section of the Statement of Operations.
Federal Income Taxes – The Fund intends to comply with the requirements of the Internal Revenue Code necessary to qualify as a regulated investment company and to make the requisite distributions of income to its shareholders to relieve it from all or substantially all federal income taxes. Withholding taxes on foreign dividends have been provided for in accordance with the Fund’s understanding on the applicable county’s tax rules and rate.
Accounting for Uncertainty in Income Taxes (“Income Tax Statement”) requires an evaluation of tax positions taken (or expected to be taken) in the course of preparing the Fund’s tax returns to determine whether these positions meet a “more-likely-than-not” standard that, based on the technical merits, have a more than fifty percent likelihood of being sustained by a taxing authority upon examination. A tax position that meets the “more-likely-than-not” recognition threshold is measured to determine the amount of benefit to recognize in the financial statements. The Fund’s policy is to classify interest and penalties associated with underpayment of federal and state income taxes, if any, as income tax expense on the Statement of Operations. As of November 30, 2021, the Fund did not have any interest or penalties associated with the underpayment of any income taxes.
The Income Tax Statement requires management of the Fund to analyze all open tax years, fiscal years 2018-2021 as defined by the Internal Revenue Service statute of limitations for all major jurisdictions, including federal tax authorities and certain state tax authorities. As of and during the year ended November 30, 2021, the Fund did not
– 18 –
OCM GOLD FUND Notes to Financial Statements – November 30, 2021 (Continued)
|
have a liability for any unrecognized tax benefits. The Fund has no examinations in progress and is not aware of any tax positions for which it is reasonably possible that the total amounts of unrecognized tax benefits will significantly change in the next twelve months.
Share Classes – The Fund offers two classes of shares, Investor Class and Advisor Class. The outstanding shares of the Fund on April 1, 2010 were renamed “Investor Class shares.” The Advisor Class shares commenced operations on April 1, 2010. The two classes represent interests in the same portfolio of investments and have the same rights. Income, expenses (other than expenses attributable to a specific class) and realized and unrealized gains and losses on investments are allocated to each class of shares in proportion to their relative net assets.
Securities Transactions and Investment Income – Securities transactions are accounted for on a trade date basis. Realized gains and losses on sales of securities are calculated on the identified cost basis. Dividend income is recorded on the ex-dividend date and interest income is recorded on an accrual basis. Withholding taxes on foreign dividends have been provided for in accordance with the Fund’s understanding of the applicable country’s tax rules and rates.
Distributions to Shareholders – The character of distributions made during the year from net investment income or net realized gains may differ from the characterization for federal income tax purposes due to differences in the recognition of income, expense or gain items for financial statement and tax purposes. To the extent that these differences are attributable to permanent book and tax accounting differences, the components of net assets have been adjusted.
Redemption Fee – A 1.50% redemption fee is retained by the Fund to offset transaction costs and other expenses associated with short-term investing. The fee is imposed on redemptions or exchanges of shares held less than three months from their purchase date. The Fund records the fee as a reduction of shares redeemed and as a credit to shares of beneficial interest. For the year ended November 30, 2021, the Investor Class and the Advisor Class received $2,178 and $43,151 in redemption fees, respectively.
Guarantees and Indemnifications – In the normal course of business, the Fund enters into contracts with service providers that contain general indemnification clauses. Also, under the Fund’s organizational documents, its officers and Trustees are indemnified by the Fund against certain liabilities arising out of the performance of their duties to the Fund. The Fund notes that insofar as indemnification for liabilities arising under the Securities Act of 1933 may be permitted to trustees and officers, the Fund has been advised that in the opinion of the Securities and Exchange Commission (the “SEC”) such indemnification is against public policy as expressed in that Act and is, therefore, unenforceable. The Fund’s maximum exposure under these arrangements is unknown as this would involve future claims against the Fund that have not yet occurred. Based on experience, the Fund expects the risk of loss to be remote.
– 19 –
OCM GOLD FUND Notes to Financial Statements – November 30, 2021 (Continued)
|
Use of Estimates – The preparation of financial statements in conformity with accounting principles generally accepted in the United States of America requires management to make estimates and assumptions that affect the reported amounts of assets and liabilities and disclosure of contingent assets and liabilities at the date of the financial statements and the reported amounts of increases and decreases in net assets from operations during the reporting period. Actual results could differ from those estimates.
Derivative Instruments – Equity securities in the gold mining industry, particularly the smaller companies, may occasionally issue warrants as part of their capital structure. A warrant gives the holder the right to purchase the underlying equity at the exercise price until the expiration date of the warrant. The Fund may hold such warrants for exposure to smaller companies in the portfolio or other reasons associated with the Fund’s overall objective of long-term growth, though warrants will typically not be a significant part of the Fund’s portfolio. The Fund’s maximum risk in holding warrants is the loss of the entire amount paid for the warrants. At November 30, 2021, the Fund held warrants as listed on the Schedule of Investments.
Note 3. Investment Advisory Agreement and Affiliated Parties
The Fund has an investment advisory agreement with Orrell Capital Management, Inc. (“OCM” or the “Adviser”). Under the agreement, the Fund pays OCM a fee computed daily and payable monthly, at the following annual rates based upon average daily net assets:
Assets | Fee Rate |
$0 to $250 million | 0.950% |
$250 million to $500 million | 0.800% |
$500 million to $1 billion | 0.700% |
Over $1 billion | 0.600% |
Under the investment advisory agreement, the Adviser is responsible for reimbursing the Fund to maintain a voluntary ratio of expenses to average daily net assets for the Investor Class shares and Advisor Class shares at 2.99% and 2.49%, respectively.
The Fund does not compensate Trustees and Officers affiliated with OCM. For the year ended November 30, 2021, the expenses accrued for Trustees who are not affiliated with OCM are reported on the Statement of Operations. The Fund pays fees and related expenses for the services of the Fund’s Chief Compliance Officer. The expenses incurred for the Chief Compliance Officer are reported on the Statement of Operations.
– 20 –
OCM GOLD FUND Notes to Financial Statements – November 30, 2021 (Continued)
|
Affiliates reimbursed the Fund $4,158 for losses on a trading error by the Adviser during the year ended November 30, 2020. This amount is reported on the Fund’s Statement of Changes in Net Assets. This reimbursement had no impact to the Fund’s net asset value per share or total return.
Note 4. Distribution Agreement and Plan
The Trust has adopted a Distribution Plan (the “Plan”) pursuant to Rule 12b-1 under the Investment Company Act of 1940, as amended. The Plan authorizes the Fund to reimburse the distributor for marketing expenses incurred in distributing shares of the Fund, including the cost of printing sales material and making payments to dealers of the Fund’s Investor Class and Advisor Class, in any fiscal year, subject to limits of 0.99% and 0.25%, respectively, of the average daily net assets of each respective class. For the year ended November 30, 2021, the Investor Class and the Advisor Class incurred $119,590 and $86,734, respectively, in expenses under the Plan.
Note 5. Purchases and Sales of Securities
Purchases and sales of investment securities (excluding short-term securities and U.S. government obligations) for the year ended November 30, 2021 were $8,092,733 and $9,829,647, respectively. There were no purchases or sales of U.S. government obligations.
Note 6. Federal Income Tax Information
At November 30, 2021, gross unrealized appreciation and depreciation of investments owned by the Fund, based on cost for federal income tax purposes were as follows:
Cost of investments | | $ | 34,793,183 | |
Unrealized appreciation on investments | | $ | 37,132,675 | |
Unrealized depreciation on investments | | | (3,244,577 | ) |
Unrealized depreciation on foreign currency | | | (558 | ) |
Net unrealized appreciation on investments | | $ | 33,887,540 | |
The difference between cost amounts for financial statement and federal income tax purposes is due primarily to investments in passive foreign investment companies (“PFICs”) and wash sales.
– 21 –
OCM GOLD FUND Notes to Financial Statements – November 30, 2021 (Continued)
|
GAAP requires that certain components of net assets be reclassified between financial and tax reporting. These reclassifications have no effect on net asset value per share. For the year ended November 30, 2021, permanent differences in book and tax accounting have been reclassified to paid in capital and total distributable earnings as follows:
Increase (Decrease) |
Paid in Capital | Total Distributable
Earnings |
$ (91,535) | $ 91,535 |
The tax character of distributions paid during the fiscal years ended November 30, 2021 and 2020 was as follows:
| | | 2021 | | | 2020 | |
Ordinary income | | $ | 216,984 | | | $ | — | |
Net long-term capital gains | | | 859,733 | | | | 2,281,744 | |
Total distributions | | $ | 1,076,717 | | | $ | 2,281,744 | |
As of November 30, 2021, the components of accumulated earnings on a tax basis were as follows:
Undistributed ordinary income | | $ | — | |
Undistributed long-term gains | | | — | |
Tax accumulated earnings | | | — | |
Accumulated capital and other losses | | | (504,156 | ) |
Unrealized appreciation on investments | | | 33,888,098 | |
Unrealized depreciation on foreign currency | | | (558 | ) |
Total accumulated earnings | | $ | 33,383,384 | |
The Fund has $504,156 in qualified late-year losses, which are deferred until fiscal year 2022 for tax purposes. Net late-year ordinary losses incurred after December 31 and within the taxable year and net late-year specified losses incurred after October 31 and within the taxable year are deemed to arise on the first day of the Fund’s next taxable year.
– 22 –
OCM GOLD FUND Notes to Financial Statements – November 30, 2021 (Continued)
|
Note 7. Concentration of Risk
Investing in foreign securities involves certain risks not necessarily found in U.S. markets. These include risks associated with adverse changes in economic, political, regulatory and other conditions, changes in currency exchange rates, exchange control regulations, expropriation of assets or nationalization, imposition of withholding taxes on dividend or interest payments or capital gains, and possible difficulty in obtaining and enforcing judgments against foreign entities. Further, issuers of foreign securities are subject to different, and often less comprehensive, accounting, reporting, and disclosure requirements than domestic issuers.
As the Fund concentrates its investments in the gold mining industry, a development adversely affecting the industry (for example, changes in the mining laws which increases production costs or a significant decrease in the market price of gold) would have a greater adverse effect on the Fund than it would if the Fund invested in a number of different industries.
Note 8. Illiquid Securities
Pursuant to Rule 22e-4 under the 1940 Act, the Fund has adopted a Liquidity Risk Management Program (“LRMP”) that requires, among other things, that the Fund limits its illiquid investments that are assets to no more than 15% of net assets. An illiquid investment is any security which may not reasonably be expected to be sold or disposed of in current market conditions in seven calendar days or less without the sale or disposition significantly changing the market value of the investment. If the Advisor, at any time, determines that the value of illiquid securities held by the Fund exceeds 15% of its net asset value, the Advisor will take such steps as it considers appropriate to reduce them as soon as reasonably practicable in accordance with the Fund’s written LRMP.
Note 9. COVID-19 Pandemic
In early 2020, an outbreak of a novel strain of coronavirus (COVID-19) emerged globally. This coronavirus has resulted in closing international borders, enhanced health screenings, healthcare service preparation and delivery, quarantines, cancellations, disruptions to supply chains and customer activity, as well as general public concern and uncertainty. The impact of this outbreak has negatively affected the worldwide economy, as well as the economies of individual countries, the financial health of individual companies and the market in general in significant and unforeseen ways. The future impact of COVID-19 is currently unknown, and it may exacerbate other risks that apply to the Fund, including political, social and economic risks. Any such impact could adversely affect the Fund’s performance, the performance of the securities in which the Fund invests and may lead to losses on your investment in the Fund. The ultimate impact of COVID-19 on the financial performance of the Fund’s investments is not reasonably estimable at this time.
– 23 –
OCM GOLD FUND Notes to Financial Statements – November 30, 2021 (Continued)
|
Note 10. New Accounting Pronouncements
In December 2020, the SEC adopted a new rule providing a framework for fund valuation practices (“Rule 2a-5”). Rule 2a-5 establishes requirements for determining fair value in good faith for purposes of the 1940 Act. Rule 2a-5 will permit fund boards to designate certain parties to perform fair value determinations, subject to board oversight and certain other conditions. Rule 2a-5 also defines when market quotations are “readily available” for purposes of the 1940 Act and the threshold for determining whether a fund must fair value a security. In connection with Rule 2a-5, the SEC also adopted related recordkeeping requirements and is rescinding previously issued guidance, including with respect to the role of a board in determining fair value and the accounting and auditing of fund investments. The Fund will be required to comply with the rules by September 8, 2022. The Fund is currently evaluating the impact, if any, of applying this provision.
Note 11. Subsequent Events
Management has evaluated events and transactions for potential recognition or disclosure through the date the financial statements were issued. The Fund declared the following distributions:
| | Record
Date | | | Payable
Date | | | Share
Class | | | Long Term
Capital Gain | | | Short Term
Capital Gain | | | Ordinary
Income | |
| | | 12/16/2021 | | | | 12/17/2021 | | | | Advisor | | | $ | 0.12411 | | | $ | 0.00000 | | | $ | 0.0000 | |
| | | 12/16/2021 | | | | 12/17/2021 | | | | Investor | | | $ | 0.12411 | | | $ | 0.00000 | | | $ | 0.0000 | |
Management has determined there are no other material events that would require disclosure in the Fund’s financial statements through this date.
– 24 –
OCM GOLD FUND Financial Highlights Investor Class
|
| | | Year
Ended
Nov. 30,
2021 | | | Year
Ended
Nov. 30,
2020 | | | Year
Ended
Nov. 30,
2019 | | | Year
Ended
Nov. 30,
2018 | | | Year
Ended
Nov. 30,
2017 | |
| | | | | | | | | | | | | | | | | | | | | |
Per Share Operating Performance | | | | | | | | | | | | | | | | | | | | |
(For a share outstanding throughout each period) | | | | | | | | | | | | | | | | | | | | |
| | | | | | | | | | | | | | | | | | | | | |
Net asset value, beginning of period | | $ | 11.94 | | | $ | 8.62 | | | $ | 7.05 | | | $ | 9.26 | | | $ | 11.12 | |
| | | | | | | | | | | | | | | | | | | | | |
Income from Investment Operations: | | | | | | | | | | | | | | | | | | | | |
Net investment loss1 | | | (0.11 | ) | | | (0.16 | ) | | | (0.14 | ) | | | (0.19 | ) | | | (0.21 | ) |
Net realized and unrealized gain (loss) on investments and foreign currency transactions | | | 0.01 | | | | 4.05 | | | | 3.37 | | | | (1.36 | ) | | | 0.10 | |
Net increase from payments by affiliates (Note 3) | | | — | | | | — | 2 | | | — | | | | — | | | | — | |
Total from investment operations | | | (0.10 | ) | | | 3.89 | | | | 3.23 | | | | (1.55 | ) | | | (0.11 | ) |
| | | | | | | | | | | | | | | | | | | | | |
Less Distributions: | | | | | | | | | | | | | | | | | | | | |
Dividends from net investment income | | | (0.08 | ) | | | — | | | | — | | | | — | | | | — | |
Distribution from net realized gains | | | (0.05 | ) | | | (0.57 | ) | | | (1.66 | ) | | | (0.66 | ) | | | (1.75 | ) |
Total distributions | | | (0.13 | ) | | | (0.57 | ) | | | (1.66 | ) | | | (0.66 | ) | | | (1.75 | ) |
| | | | | | | | | | | | | | | | | | | | | |
Redemption fee proceeds | | | — | 2 | | | — | 2 | | | — | 2 | | | — | 2 | | | — | 2 |
| | | | | | | | | | | | | | | | | | | | | |
Net asset value, end of period | | $ | 11.71 | | | $ | 11.94 | | | $ | 8.62 | | | $ | 7.05 | | | $ | 9.26 | |
| | | | | | | | | | | | | | | | | | | | | |
Total return* | | | (0.95 | )% | | | 48.15 | % | | | 56.65 | % | | | (18.24 | )% | | | 0.94 | % |
| | | | | | | | | | | | | | | | | | | | | |
Ratios/Supplemental Data: | | | | | | | | | | | | | | | | | | | | |
Net assets, end of year (in 000’s) | | $ | 17,024 | | | $ | 18,343 | | | $ | 22,467 | | | $ | 17,146 | | | $ | 30,492 | |
Ratio of expenses to average net assets | | | 2.19 | % | | | 2.29 | % | | | 2.91 | % | | | 2.93 | % | | | 2.78 | % |
Ratio of net investment loss to average net assets | | | (0.89 | )% | | | (1.53 | )% | | | (1.89 | )% | | | (2.27 | )% | | | (2.17 | )% |
Portfolio turnover rate | | | 11 | % | | | 1 | % | | | 18 | % | | | 6 | % | | | 10 | % |
1 | Based on average shares method. |
2 | Amount represents less than $0.01 per share. |
See notes to financial statements.
– 25 –
OCM GOLD FUND Financial Highlights Advisor Class
|
| | | Year
Ended
Nov. 30,
2021 | | | Year
Ended
Nov. 30,
2020 | | | Year
Ended
Nov. 30,
2019 | | | Year
Ended
Nov. 30,
2018 | | | Year
Ended
Nov. 30,
2017 | |
| | | | | | | | | | | | | | | | | | | | | |
Per Share Operating Performance | | | | | | | | | | | | | | | | | | | | |
(For a share outstanding throughout each period) | | | | | | | | | | | | | | | | | | | | |
| | | | | | | | | | | | | | | | | | | | | |
Net asset value, beginning of period | | $ | 13.46 | | | $ | 9.57 | | | $ | 7.58 | | | $ | 9.86 | | | $ | 11.63 | |
| | | | | | | | | | | | | | | | | | | | | |
Income from Investment Operations: | | | | | | | | | | | | | | | | | | | | |
Net investment loss1 | | | (0.05 | ) | | | (0.13 | ) | | | (0.11 | ) | | | (0.15 | ) | | | (0.15 | ) |
Net realized and unrealized gain (loss) on investments and foreign currency transactions | | | — | | | | 4.54 | | | | 3.71 | | | | (1.47 | ) | | | 0.12 | |
Net increase from payments by affiliates (Note 3) | | | — | | | | — | 2 | | | — | | | | — | | | | — | |
Total from investment operations | | | (0.05 | ) | | | 4.41 | | | | 3.60 | | | | (1.62 | ) | | | (0.03 | ) |
| | | | | | | | | | | | | | | | | | | | | |
Less Distributions: | | | | | | | | | | | | | | | | | | | | |
Dividends from net investment income | | | (0.16 | ) | | | — | | | | — | | | | — | | | | — | |
Distribution from net realized gains | | | (0.05 | ) | | | (0.57 | ) | | | (1.66 | ) | | | (0.66 | ) | | | (1.75 | ) |
Total distributions | | | (0.21 | ) | | | (0.57 | ) | | | (1.66 | ) | | | (0.66 | ) | | | (1.75 | ) |
| | | | | | | | | | | | | | | | | | | | | |
Redemption fee proceeds | | | 0.01 | | | | 0.05 | | | | 0.05 | | | | — | 2 | | | 0.01 | |
| | | | | | | | | | | | | | | | | | | | | |
Net asset value, end of period | | $ | 13.21 | | | $ | 13.46 | | | $ | 9.57 | | | $ | 7.58 | | | $ | 9.86 | |
| | | | | | | | | | | | | | | | | | | | | |
Total return | | | (0.42 | )% | | | 49.40 | % | | | 58.54 | %3 | | | (17.81 | )%3 | | | 1.81 | % |
| | | | | | | | | | | | | | | | | | | | | |
Ratios/Supplemental Data: | | | | | | | | | | | | | | | | | | | | |
Net assets, end of year (in 000’s) | | $ | 51,390 | | | $ | 55,603 | | | $ | 12,507 | | | $ | 6,624 | | | $ | 7,106 | |
Ratio of expenses to average net assets | | | 1.69 | % | | | 1.79 | % | | | 2.38 | % | | | 2.31 | % | | | 2.05 | % |
Ratio of net investment loss to average net assets | | | (0.39 | )% | | | (1.03 | )% | | | (1.36 | )% | | | (1.65 | )% | | | (1.44 | )% |
Portfolio turnover rate | | | 11 | % | | | 1 | % | | | 18 | % | | | 6 | % | | | 10 | % |
1 | Based on average shares method. |
2 | Amount represents less than $0.01 per share. |
3 | Total returns would have been higher/lower had expenses not been waived/recovered by the Adviser. |
See notes to financial statements.
– 26 –
OCM GOLD FUND Report of Independent Registered Public Accounting Firm
|
To the Board of Trustees of OCM Mutual Fund and
Shareholders of OCM Gold Fund
Opinion on the Financial Statements
We have audited the accompanying statement of assets and liabilities of OCM Gold Fund (the “Fund”), a series of OCM Mutual Fund (the “Trust”), including the schedule of investments, as of November 30, 2021, the related statement of operations for the year then ended, and the statements of changes in net assets for each of the two years in the period then ended, the financial highlights for each of the four years in the period then ended, and the related notes (collectively referred to as the “financial statements”). In our opinion, the financial statements present fairly, in all material respects, the financial position of the Fund as of November 30, 2021, the results of its operations for the year then ended, the changes in its net assets for each of the two years in the period then ended, and the financial highlights for each of the four years in the period then ended, in conformity with accounting principles generally accepted in the United States of America.
The financial highlights for the year ended November 30, 2017 have been audited by other auditors, whose report dated January 26, 2018 expressed unqualified opinion on such financial highlights.
Basis for Opinion
These financial statements are the responsibility of the Fund’s management. Our responsibility is to express an opinion on the Fund’s financial statements based on our audits. We are a public accounting firm registered with the Public Company Accounting Oversight Board (United States) (“PCAOB”) and are required to be independent with respect to the Fund in accordance with the U.S. federal securities laws and the applicable rules and regulations of the Securities and Exchange Commission and the PCAOB. We have served as the auditor of the fund since 2018.
We conducted our audits in accordance with the standards of the PCAOB. Those standards require that we plan and perform the audits to obtain reasonable assurance about whether the financial statements are free of material misstatement, whether due to error or fraud. The Fund is not required to have, nor were we engaged to perform, an audit of the Fund’s internal control over financial reporting. As part of our audit we are required to obtain an understanding of internal control over financial reporting, but not for the purpose of expressing an opinion on the effectiveness of the Fund’s internal control over financial reporting. Accordingly, we express no such opinion.
Our audits included performing procedures to assess the risks of material misstatement of the financial statements, whether due to error or fraud, and performing procedures that respond to those risks. Such procedures included examining, on a test basis, evidence regarding the amounts and disclosures in the financial statements. Our audits also included evaluating the accounting principles used and significant estimates made by management, as well as evaluating the overall presentation of the financial statements. Our procedures included confirmation of securities
– 27 –
OCM GOLD FUND Report of Independent Registered Public Accounting Firm (Continued)
|
owned as of November 30, 2021 by correspondence with the custodian and brokers or by other appropriate auditing procedures where replies from broker were not received. We believe that our audits provide a reasonable basis for our opinion.
| | 
TAIT, WELLER & BAKER LLP |
Philadelphia, Pennsylvania
January 25, 2022
– 28 –
OCM GOLD FUND Expense Example – For the Period Ended November 30, 2021
(Unaudited) |
As a shareholder of the OCM Gold Fund (the “Fund”), you incur two types of costs: (1) transaction costs, including sales charges (loads) on purchase payments and redemption fees on certain redemptions; and (2) ongoing costs, including management fees; distribution (12b-1) fees; and other Fund expenses. This Example is intended to help you understand your ongoing costs (in dollars) of investing in the Fund and to compare these costs with the ongoing costs of investing in other mutual funds.
The Example is based on an investment of $1,000 invested at the beginning of the period and held for the entire period from June 1, 2021 to November 30, 2021 (the “period”).
Actual Expenses
The row titled “Actual” in the table below provides information about actual account values and actual expenses. You may use this information, together with the amount you invested, to estimate the expenses you paid over the period. Simply divide your account value by $1,000 (for example, an $8,600 account value divided by $1,000 equals 8.6), then multiply the result by the number in the appropriate line for your share class under the heading entitled “Expenses Paid During the Period” to estimate the expenses you paid on your account during the periods.
Hypothetical Example for Comparison Purposes
The row titled “Hypothetical” in the table below provides information about hypothetical account values and hypothetical expenses based on each class’ actual expense ratio and an assumed rate of return of 5% per year before expenses, which is not each class’ actual return. The hypothetical account values and expenses may not be used to estimate the actual ending account balance or expenses you paid for the period. You may use this information to compare the ongoing costs of investing in the classes of the Fund and other funds. To do so, compare these 5% hypothetical examples with the 5% hypothetical examples that appear in the shareholder reports of other funds.
Please note that the expenses shown in the table are meant to highlight your ongoing costs only and do not reflect any transactional costs, such as sales charges (loads) and redemption fees. Therefore, the hypothetical lines of the table are useful in comparing the ongoing costs only, and will not help you determine the relative total costs of owning different funds. In addition, if these transactional costs were included, your costs would have been higher.
– 29 –
OCM GOLD FUND Expense Example – For the Period Ended November 30, 2021 (Continued)
(Unaudited) |
Expenses Paid During the Period
| | Beginning
Account Value
June 1, 2021 | Ending
Account Value
November 30, 2021 | Expenses Paid
During the
Period Ended
November 30, 2021* |
Investor Class | | | |
Actual | $ 1,000.00 | $ 834.60 | $ 10.16 |
Hypothetical (5% return before expenses) | 1,000.00 | 1,013.99 | 11.15 |
Advisor Class | | | |
Actual | 1,000.00 | 836.60 | 7.87 |
Hypothetical (5% return before expenses) | 1,000.00 | 1,016.50 | 8.64 |
* | Expenses are equal to the Investor Class’ and Advisor Class’ annualized expense ratios of 2.21% and 1.71%, respectively, for the period, multiplied by the average account value over the period, multiplied by 183/365 (to reflect the one-half year period). |
– 30 –
OCM GOLD FUND Other Information
(Unaudited) |
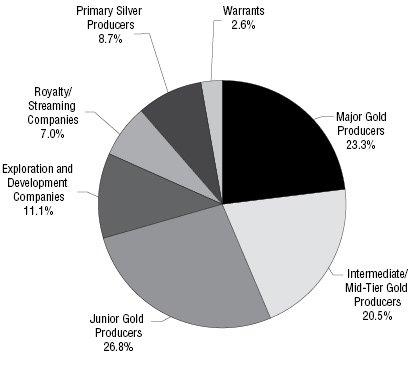
Investments by Sector – As of November 30, 2021
As a Percentage of Total Investments
The Fund files its complete schedule of portfolio holdings with the U.S. Securities and Exchange Commission (“SEC”) for the first and third quarters of each fiscal year as an exhibit to its reports on Form N-PORT. Shareholders may obtain the Fund’s Form N-PORT on the SEC’s website at http://www.sec.gov.
A description of the Fund’s proxy voting policies and procedures and a record of the Fund’s proxy votes for the year ended June 30, 2021 are available without charge, upon request by calling toll free 1-800-779-4681 and on the SEC’s website at http://www.sec.gov. The Fund’s proxy voting policies and procedures are also available on the Fund’s website at http://www.ocmgoldfund.com.
– 31 –
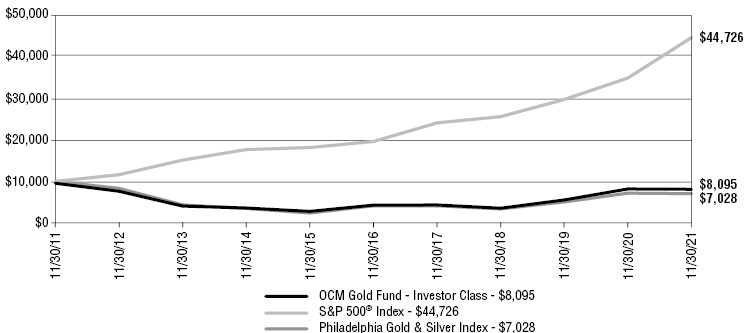
OCM GOLD FUND - INVESTOR CLASS Performance Results – Year Ended November 30, 2021
(Unaudited) |
Average Annual Total Returns
| | Investor Class | S&P 500® Index | Philadelphia
Gold & Silver Index |
1 year | -5.39% | 27.92% | -1.79% |
5 year | 12.63% | 17.90% | 11.35% |
10 year | -2.09% | 16.16% | -3.46% |
– 32 –
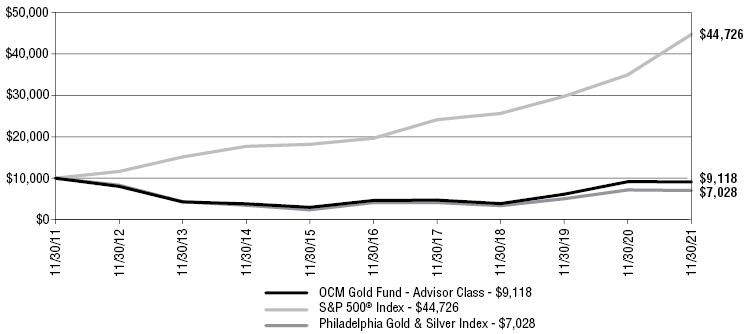
OCM GOLD FUND - ADVISOR CLASS Performance Results – Year Ended November 30, 2021
(Unaudited) |
Average Annual Total Returns
| | Advisor Class | S&P 500® Index | Philadelphia
Gold & Silver Index |
1 year | -0.42% | 27.92% | -1.79% |
5 year | 14.57% | 17.90% | 11.35% |
10 year | -0.92% | 16.16% | -3.46% |
– 33 –
OCM GOLD FUND Annual Renewal of Investment Advisory Agreement
(Unaudited) |
On October 21, 2021, the Board of Trustees of OCM Mutual Fund approved the continuation of the Fund’s investment advisory agreement with Orrell Capital Management, Inc. (the “Adviser”). Prior to approving the continuation of the agreement, the Board considered:
| | ● | the nature, extent and quality of the services provided by the Adviser |
| | ● | the investment performance of the Fund |
| | ● | the costs of the services to be provided and profits to be realized by the Adviser from its relationship with the Fund |
| | ● | the extent to which economies of scale would be realized as the Fund grows and whether fee levels reflect those economies of scale |
| | ● | the expense ratio of the Fund |
All of the factors discussed by the Trustees were considered as a whole and were considered separately by the Trustees who are not “interested persons” of the Trust (the “Independent Trustees”), meeting in executive session. The factors were viewed in their totality by the Trustees, with no single factor being the principal or determinative factor in the Trustees’ determination of whether to approve the continuation of the investment advisory agreement. The Trustees recognized that the management and fee arrangements for the Fund are the result of years of review and discussion between the Independent Trustees and the Adviser, that certain aspects of such arrangements may receive greater scrutiny in some years than in others and that the Trustees’ conclusions may be based, in part, on their consideration of these same arrangements and information received during the course of the year and in prior years.
The material considerations and determinations of the Board, including all of the Independent Trustees, are provided below.
In considering the nature, extent and quality of the services provided by the Adviser, the Board considered an oral presentation by the Adviser describing the portfolio management, shareholder communication, and regulatory compliance services provided by the Adviser to the Fund. Based on their review and discussions with management, the Trustees believe that the Adviser provides high quality services to the Fund, and they noted that their overall confidence in the Adviser is high, based on their experience interacting with the Adviser. The Trustees also concluded that they were satisfied with the nature, extent and quality of the investment advisory services provided to the Fund by the Adviser, as the Adviser has worked to obtain good performance for the Fund, and performance has remained good in the long term, and that the nature and extent of the services provided by the Adviser are appropriate to ensure that the Fund’s operations are conducted in compliance with applicable laws, rules and regulations, as there have been no material compliance violations.
– 34 –
OCM GOLD FUND Annual Renewal of Investment Advisory Agreement (Continued)
(Unaudited) |
The Trustees compared the performance of the Fund to benchmark indices over various periods of time. The Adviser provided information regarding and led discussions of factors impacting the performance of the Fund, outlining current market conditions and explaining the Adviser’s expectations and strategies for the future. Based on this information and discussions with Mr. Orrell, the Trustees concluded, within the context of their full deliberations, that the investment results that the Adviser had been able to achieve for the Fund were reasonable and support renewal of the investment advisory agreement, noting that the Adviser has historically been able to achieve positive performance for shareholders. The Trustees noted that the Fund adhered to its investment style.
In concluding that the advisory fees payable by the Fund were reasonable, the Trustees reviewed the profits realized by the Adviser, from its relationship with the Fund. They discussed in detail the profitability of the Adviser as it relates to the Fund, and they discussed the impact of the intermediary service fees on the profitability. The Trustees also considered the resources and revenues that the Adviser has put into managing and distributing the Fund and concluded that the level of profitability realized by the Adviser from its provision of services to the Fund is reasonable, and that the overall expense ratio and investment advisory fee were fair and within a reasonable range of industry averages. The Trustees determined that the Adviser has spent significant resources and time to maintain and improve the Fund, and that the Adviser has not recognized unreasonable profits.
As part of its analysis the Board considered the value of the research the Adviser received from broker-dealers executing securities transactions for the Fund. The Trustees concluded that the research obtained by the Adviser is beneficial to the Fund and that the Adviser had executed the Fund’s portfolio transactions in a manner designed to obtain best execution for the Fund. The Trustees determined such research has been used for legitimate purposes relating to the Fund by aiding in the investment decision-making process. The Trustees concluded that the other benefits realized by the Adviser from its relationship with the Fund were minimal and reasonable.
The Trustees also reviewed reports comparing the expense ratios of each class and advisory fees paid by the Fund to those paid by other comparable mutual funds in the same category and concluded that the advisory fees paid by the Fund and the expense ratios of each class of the Fund were within a reasonable range of comparable mutual funds. In making this conclusion, the Trustees also noted the unique expertise of the Adviser and that the Adviser does not currently engage any sub-advisers for the Fund. The Trustees also discussed the advisory fees payable by the Fund in relation to other advisory clients of the Adviser. The Trustees determined that they did not find anything to suggest that the fees charged to the Fund are unreasonable in comparison to other fees charged by the Adviser.
The Trustees concluded that the Fund has the right structure in place to continue to realize lower fees and expenses as asset levels continue to increase. The Trustees also considered whether the investment advisory agreement fee schedule should be adjusted for an increase in assets under management. They concluded that the existing “breakpoints” embodied in the investment advisory agreement would result in substantially lower fee rates than those of comparable mutual funds.
– 35 –
OCM GOLD FUND Annual Renewal of Investment Advisory Agreement (Continued)
(Unaudited) |
After reviewing the materials provided at the meeting, management’s presentation, as well as other information regularly provided at the Board’s quarterly meetings throughout the year regarding the quality of services provided by the Adviser, the performance of the Fund, expense information, regulatory compliance issues, trading information and related matters and other factors deemed relevant by the Board, the Trustees, including all of the Independent Trustees, determined to continue the investment advisory agreement.
– 36 –
OCM GOLD FUND Additional Fund Information
(Unaudited) |
Qualified Dividend Income
Pursuant to Section 854 of the Internal Revenue Code of 1986, OCM Gold Fund designates income dividends of 100% as qualified dividend income paid during the fiscal year ended November 30, 2021.
Long Term Capital Gains Designation
Pursuant to IRC 852(b)(3) of the Internal Revenue Code OCM Gold Fund hereby designates $859,733 as long-term capital gains distributed during the year ended November 30, 2021.
Liquidity Risk Management Program
The Fund has adopted and implemented a written liquidity risk management program as required by Rule 22e-4 (the “Liquidity Rule”) under the Investment Company Act of 1940, as amended. The program is reasonably designed to assess and manage the Fund’s liquidity risk, taking into consideration, among other factors, the Fund’s investment strategy and the liquidity of its portfolio investments during normal and reasonably foreseeable stressed conditions; its short and long-term cash flow projections; and its cash holdings and access to other funding sources. The Fund’s Board of Trustees approved the appointment of a Liquidity Program Administrator (“LPA”) comprised of the Trust’s Liquidity Risk Management Program Committee, which includes representatives from the Fund’s investment adviser, independent trustees and the Fund’s CCO. The LPA is responsible for the program’s administration and oversight and for reporting to the Board on at least an annual basis regarding the program’s operation and effectiveness. The LPA updated its assessment of the Fund’s liquidity risk profile, considering additional data gathered in the 12 months ended May 31, 2021 and the adequacy and effectiveness of the liquidity risk management program’s operations since its inception on June 1, 2020 (the “Review Period”), in order to prepare a written report for the Board of Trustees (the “Report”) for consideration at its meeting held on July 22, 2021.
During the Review Period, the Fund did not experience unusual stress or disruption to its operations related to purchase and redemption activity. Also, during the Review Period, the Fund held adequate levels of cash and highly liquid investments to meet shareholder redemption activities in accordance with applicable requirements. The Fund did not have a significant amount of illiquid investments and did not require a determination as to a highly liquid investment minimum. The Report concluded that the Fund’s liquidity risk management program is reasonably designed to prevent violations of the Liquidity Rule and has been implemented effectively.
– 37 –
OCM GOLD FUND Trustee and Officer Information
(Unaudited) |
The business and affairs of the Fund are managed under the direction of the Board of Trustees. Information pertaining to the Trustees and Officers of the Fund is set forth below. The Fund’s Statement of Additional Information includes additional information about Trustees and is available, without charge, upon request by calling 1-800-779-4681.
Independent Trustees* |
Name, Address and Age | Position(s)
Held with Fund | Term of Office
and Length
of Service | Principal Occupation(s)
During Past 5 Years | Other
Directorships
Held by
Trustee or
Nominee
for Trustee |
Doug Webenbauer
2600 Kitty Hawk Road, Suite 119 Livermore, California 94551 Age 61 | Trustee | Indefinite
Since 2005 | Controller of Comtel Systems Technology, Inc., a low voltage electrical contractor, since 2016. Prior to that, Chief Financial Officer of M.E. Fox & Company, Inc., a beer distributor (2000 to 2016). | None |
Peter Hayman
2600 Kitty Hawk Road, Suite 119 Livermore, California 94551 Age 67 | Trustee | Indefinite
Since 2018 | Managing member of Anzus Capital, LLC, a corporate investment advisory firm specializing in Australasian companies, since 2005. Prior to that, Mr. Hayman held positions in institutional equity sales with investment firms ABN, AMRO, JP Morgan and Ord Minnett, since 1978. | None |
– 38 –
OCM GOLD FUND Trustee and Officer Information (Continued)
(Unaudited) |
Interested Trustees and Officers** |
Name, Address and Age | Position(s)
Held with Fund | Term of Office
and Length
of Service | Principal Occupation(s)
During Past 5 Years | Other
Directorships
Held by
Trustee or
Nominee
for Trustee |
Gregory M. Orrell
2600 Kitty Hawk Road, Suite 119 Livermore, California 94551 Age 60 | Trustee, President, Treasurer | Indefinite
Since 2004 | President of Orrell Capital Management, Inc. since 1991. | None |
Katherine A. Orrell
2600 Kitty Hawk Road, Suite 119 Livermore, California 94551 Age 26 | Secretary | One year term
Since 2019 | Administrative Assistant of Orrell Capital Management, Inc. since 2019. Full time student from 2009 to 2018. | N/A |
Emile Molineaux
2600 Kitty Hawk Road, Suite 119 Livermore, California 94551 Age 59 | Chief Compliance Officer and Anti-Money Laundering Officer | At discretion of the Board
Since 2018 | Senior Compliance Officer and CCO of various clients of Northern Lights Compliance Services, LLC (since 2011). | N/A |
* | “Independent” trustees are trustees who are not deemed to be “interested persons” of the Fund as defined in the Investment Company Act of 1940. |
** | An “interested” trustee is a trustee who is deemed to be an “interested person” of the Fund, as defined in the Investment Company Act of 1940. Gregory M. Orrell is an interested person of the Fund because of his ownership in the Fund’s investment adviser. |
– 39 –
THIS PAGE INTENTIONALLY LEFT BLANK
THIS PAGE INTENTIONALLY LEFT BLANK
OCM Gold Fund
Distributed by:
Northern Lights Distributors, LLC
17605 Wright Street
Omaha, NE 68130
6109-NLD-1/24/2022
(b) The Registrant did not disseminate any information to shareholders specified by paragraph (c)(3) of Rule 30e-3 under the Act (17 CFR 270.30e-3).
Item 2. Code of Ethics.
The registrant, as of the end of the period covered by this report, has adopted a code of ethics that applies to the Registrant’s principal executive officer, principal financial officer, principal accounting officer or controller, and persons performing similar functions, regardless of whether these individuals are employed by the Registrant or a third party. A copy of this code of ethics is attached hereto as Exhibit (a).
There have been no amendments to the registrant’s code of ethics during the reporting period for this Form N-CSR. There have also been no waivers granted by the registrant to individuals covered by the registrant’s code of ethics during the reporting period for this Form N-CSR.
Item 3. Audit Committee Financial Expert.
The registrant’s board of trustees has determined that Mr. Doug Webenbauer is an audit committee financial expert serving on its audit committee and that Mr. Webenbauer is independent.
Item 4. Principal Accountant Fees and Services
(a) – (e)
The registrant has engaged its principal accountant to perform audit services and tax services during the past two fiscal years. "Audit services" refer to performing an audit of the registrant's annual financial statements or services that are normally provided by the accountant in connection with statutory and regulatory filings or engagements for those fiscal years. "Tax services" refer to professional services rendered by the principal accountant for tax compliance, tax advice, and tax planning. The following table details the aggregate fees billed or expected to be billed for each of the last two fiscal years for audit fees and tax fees by the principal accountant.
| | Fiscal year ended November 30, 2021 | Fiscal year ended November 30, 2020 |
| Audit Fees | $13,500 | $13,000 |
| Audit-Related Fees | $0 | $0 |
| Tax Fees | $2,500 | $2,500 |
| All Other Fees | $0 | $0 |
The registrant’s audit committee has adopted an Audit Committee Charter that requires that the Audit Committee review the scope and plan of the registered public accounting firm’s annual and interim examinations, approve the services (other than the annual audit) to be performed for the registrant by the independent public accountants and approve the fees and other compensation payable to the independent accountants. During the fiscal years ended November 30, 2021 and 2020, all of the audit and non-audit services provided by the registrant’s principal accountant were pre-approved by the audit committee.
(f) None.
(g) None.
(h) Not applicable.
Item 5. Audit Committee of Listed Registrants
Not applicable.
Item 6. Schedule of Investments
The schedules of investments in securities in unaffiliated issuers are included as part of the reports to shareholders filed under Item 1.
Item 7. Disclosure of Proxy Voting Policies and Procedures for Closed-End Management Investment Companies
Not applicable.
Item 8. Portfolio Managers of Closed-End Management Investment Companies
Not applicable.
Item 9. Purchases of Equity Securities by Closed-End Management Investment Company and Affiliated Purchasers
Not applicable.
Item 10. Submissions of Matters to a Vote of Security Holders
For the purposes of this Item, there have not been any material changes to the procedures by which shareholders may recommend nominees to the registrant’s board of trustees.
Item 11. Controls and Procedures.
(a) The registrant's certifying officer has concluded that the registrant's disclosure controls and procedures (as defined in Rule 30a-2 under the Investment Company Act of 1940 (the "Act")) are effective in design and operation and are sufficient to form the basis of the certifications required by Rule 30a-2 under the Act, based on their evaluation of these disclosure controls and procedures within 90 days of the filing date of this report on Form N-CSR.
(b) Not Applicable
Item 12. Disclosure of Securities Lending Activities for Closed-End Management Investment Companies.
Not applicable.
Item 13. Exhibits.
(a)(1) Code of Ethics – Filed as an attachment to this filing.
(a)(2) Certification for each principal executive and principal financial officer of the registrant as required by Rule 30a-2 under the Act (17 CFR 270.30a-2(a)) – Filed as an attachment to this filing.
(a)(3) Any written solicitation to purchase securities under Rule 23c-1 under the Act sent or given during the period covered by the report by or on behalf of the registrant to 10 or more persons. Not applicable to open-end investment companies.
(a)(4) Change in the registrant’s independent public accountant – Not applicable.
(b) Certifications required by Rule 30a-2(b) under the Act (17 CFR 270.30a-2(b)), Rule 13a-14(b) or Rule 15d-14(b) under the Exchange Act (17 CFR 240.13a-14(b) or 240.15d-14(b)), and Section 1350 of Chapter 63 of Title 18 of the United States Code (18 U.S.C. 1350) – Filed as an attachment to this filing.
SIGNATURES
Pursuant to the requirements of the Securities Exchange Act of 1934 and the Investment Company Act of 1940, the registrant has duly caused this report to be signed on its behalf by the undersigned, thereunto duly authorized.
OCM Mutual Fund
| By: | /s/ Gregory M. Orrell | |
| | Gregory M. Orrell | |
| | President and Treasurer | |
Date: January 28, 2022
Pursuant to the requirements of the Securities Exchange Act of 1934 and the Investment Company Act of 1940, this report has been signed below by the following persons on behalf of the registrant and in the capacities and on the dates indicated.
| By: | /s/ Gregory M. Orrell | |
| | Gregory M. Orrell | |
| | President and Treasurer | |
Date: January 28, 2022