UNITED STATES
SECURITIES AND EXCHANGE COMMISSION
Washington, D.C. 20549
FORM N-CSR
CERTIFIED SHAREHOLDER REPORT OF REGISTERED MANAGEMENT INVESTMENT COMPANIES
Investment Company Act File Number 811-04010
OCM Mutual Fund
(Exact name of registrant as specified in charter)
2600 Kitty Hawk Road
Suite 119
Livermore, CA 94551
(Address of principal executive offices) (Zip code)
Gregory M. Orrell
Orrell Capital Management, Inc
2600 Kitty Hawk Road
Suite 119
Livermore, CA 94551
(Name and address of agent for service)
Registrant's telephone number, including area code: (925) 455-0802
Date of fiscal year end: November 30
Date of reporting period: November 30, 2023
Item 1. Report to Stockholders.

Annual Report
November 30, 2023
OCM GOLD FUND Shareholder Letter – November 30, 2023
(Unaudited) |
Dear Fellow Shareholders:
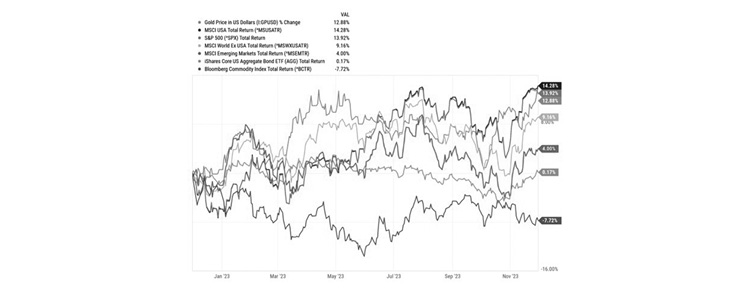
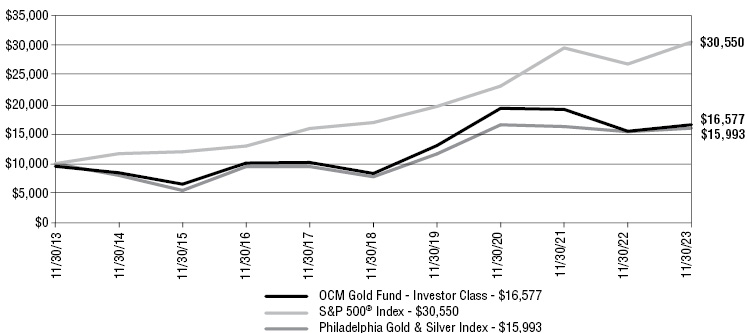
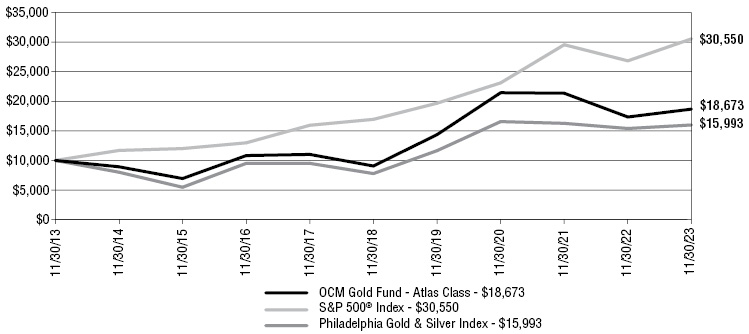
For the fiscal year ending November 30, 2023, the OCM Gold Fund’s Advisor Class increased 7.68%. Meanwhile, the OCM Gold Fund’s Investor Class returned 7.11% (2.30% after maximum sales load). The S&P 500 Index (the “S&P 500”)1 and the Philadelphia Gold and Silver Index (“XAU”)2 increased by 13.84% and 3.86%, respectively. The Fund’s outperformance versus the XAU over the past fiscal year is tied to its investment strategy of allocation across the precious metals mining industry of large-cap major gold producers to micro-cap exploration companies. The investment strategy over time has allowed the OCM Gold Fund to outperform the XAU over longer reporting periods. Gold priced in U.S. Dollars (“USD”) returned 12.88% with a price of $2,035.50 per ounce. Gold had a volatile year as it peaked at $2,044.70 per ounce on May 4, 2023, while also previously suffering its fiscal year low of $1,773.80 on December 6, 2022. Overall, gold proved to be one of the top-performing assets in 2023.
Market Commentary
There appears to be growing understanding in the market that higher interest rates are not sustainable. As Goldman Sachs released in a research note to clients on October 3, 2023, “A sharp rise in long-term interest rates combined with widening deficits and heightened fiscal discord in Congress have renewed questions about the sustainability of rising government interest costs.” Renowned investor, Stanley Druckenmiller at JP Morgan’s Robin Hood Conference stated, “When the debt rolls over, by 2033, interest expense is going to be 4.5% of Gross Domestic Product (“GDP”), if rates are where they are now,” said Druckenmiller. “By 2043, sounds like a long time, but it’s really not; 20 years, interest expense as a percent of GDP will be 7%. That is 144% of all current discretionary spending.”
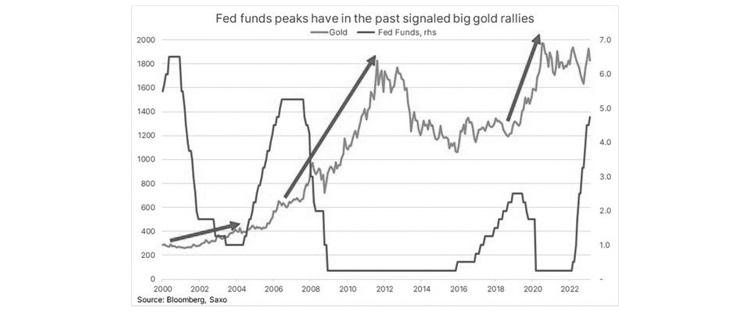
The Federal Reserve (the “Fed”)3 is clearly aware of its circumstances publishing a paper discussing fiscal dominance on its website – “Fiscal dominance refers to the possibility that the accumulation of government debt and continuing deficits can produce increases in inflation that “dominate central bank intentions to keep inflation low.” Meaning, Fed policy to fight inflation is getting boxed in due to the size of total federal debt outstanding and the cost to service that debt, in our opinion. The Fed has signaled it plans to pivot and cut rates in 2024. Whether it is motivated by election year politics is open for debate. What we do know is past peaks in Fed Funds have corresponded with rising gold prices and peaks in the S&P 500 over the last three interest cycles with precious metals equities indices delivering between 200% to 400% gains.
– 1 –
OCM GOLD FUND Shareholder Letter – November 30, 2023 (Continued)
(Unaudited) |
Our view is when the gold price breaks through new highs, it will reinforce a narrative that past fiscal and monetary policy failures have boxed the Fed into a policy that promotes inflation and monetization of U.S. debt by the Fed to meet fiscal obligations or face a deflationary credit collapse with a follow-on banking or credit crisis.
While gold prices have held firm since the height of the regional banking crisis in the spring of 2023, holdings of gold in exchange traded funds (“ETFs”) have nosedived as investors pull money from gold assets to participate in the Big Tech Artificial Intelligence (“AI”) rally and purchase treasuries. Countering negative Western sentiment toward gold has been large purchases of gold by foreign central banks. China, Russia, Czech Republic, Uzbekistan, Philippines, Singapore, and Qatar were buyers gold in 2023. China’s holdings of U.S. Treasuries are trending down, while its gold holdings are increasing, up 204 tons through November 2023. It added 23 tons in October. The National Bank of Poland (“NBP”) has stated its “dream” is to get to 20% gold holding in its central bank reserves. It added 58 tons in Q3 to the 48 tons purchased in Q2. For context, Poland currently holds 334 tons of gold or 11% of its reserves. Central banks may have different agendas in purchasing gold. For countries such as China, Russia, India and other BRICS countries, they may be setting the stage for an alternative settlement system to the U.S. dollar. For others, it may simply be the stated goal of protecting against purchasing power debasement of main fiat currencies, USD, yen and euro. Central bank buying affirms gold as a monetary asset. For the Chinese and Russians, they may be trying to follow the “Golden Rule – He who has the gold makes the rules”.
Despite gold price performing well over past year, Investor indifference toward value and “real” is punctuated by the concentration of capital into the Magnificent Seven stocks (“Mag 7”)4 representing a record 29% of the entire S&P 500 as of November 30, 2023. For context, the sum of the market cap of 15 of the largest gold producing
– 2 –
OCM GOLD FUND Shareholder Letter – November 30, 2023 (Continued)
(Unaudited) |
companies5 is glaringly only 2% of the sum of the market cap of the Mag 7. We believe this speaks to the opportunity for investors who can connect the macro dots. If just 0.5% of the market cap from the Mag 7 were to flow toward the selected basket of precious metal miners, it would represent a 16% increase in market cap for the gold miner basket.
Shares of Gold Mining Companies Commentary
The divergence between the gold price and precious metals equities over this past fiscal year was and is understandably disappointing for investors. We believe capital flows into Big Tech chasing the wave of excitement tied to AI, plus investors finding 5% treasury yields enticing after a prolonged period of near zero yields along with investors who invested in gold assets during COVID no longer feel the need for a defensive asset. It is worth noting that capital investment into the precious metals sector has historically been inversely correlated to the technology sector. When tech is booming, precious metals equities tend to be out of favor as investors chase growth versus safe haven assets. Whatever the reason, precious metals equities have been sold down to levels that represent 50% of book value on existing capacity.
When sentiment towards a sector is negative, the market will look for reasons to not buy as short sellers dominate the narrative that moves price. Margin compression has been the theme or excuse given for generalist investors holding back from looking at precious metal equities, which historically provides leverage to sustained higher gold prices. Though many gold miners did suffer through historical inflation during the Covid-19 supply squeeze, mostly with higher diesel costs, the margins have been sustained and surpassed over the past 5 years. For example, the average change in the all-in sustaining costs of the largest gold miners has increased by roughly 39%. It is important
– 3 –
OCM GOLD FUND Shareholder Letter – November 30, 2023 (Continued)
(Unaudited) |
to compare the rise in costs to margin increase, which has increased by over 68%. Mining company managements have signaled inflationary pressures have stabilized, with miners set to deliver higher margins with a sustained $2,000 plus gold price. We believe the precious metals mining sector is on the cusp of attracting significant capital flows once confidence in central banking wanes along with sentiment in the broad market rolling over.
Since the precious metals sector is a depleting resource business, gold reserves and resources must be replaced through exploration or acquisition. Two of the most successful companies replacing and adding reserves through exploration in our portfolio have been Alamos Gold, Inc. and Endeavour Mining PLC. On the Merger and Acquisitions (“M&A”) front, Newmont Corp. (“Newmont”) moved to reacquire a legacy spin off in Australian major producer Newcrest Mining Ltd., which was announced on February 5, 2023. The $16.81B deal, one of the world’s largest of the year, was finalized in late October. Under the deal, it is widely expected for Newmont to sell several of the mines with annual production under 500,000 ounces in its combined portfolio. Thus, several intermediate and junior gold producers have been circling looking to add to their production profiles. As with many industries, one way to attract capital flows is through accretive M&A activity. We see the Newmont reorganization as a possible catalyst for capital moving toward the sector.
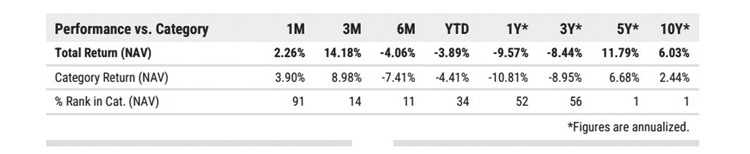
What helps separate the OCM Gold Fund from other precious metals funds is our ability to create sizeable allocations, respectively, to high quality assets that are still under invested, which can be seen in our 5- and 10- year performance compared to our peers (1st in sector)6. The pockets of relative strength in the sector over the past few years have been in a select group of junior gold producers in Canada and Australia. The lack of discovery success finding deposits with 3 million ounces or more over the past decade, signals to us that the market will gravitate more toward intermediate/mid-tier gold producers and junior gold producers going forward with projects and production in North America and Australia commanding premium valuations. Additionally, we believe those companies that hold equity dear, maintain capital discipline on new projects and understand shareholders need to participate in cash flows will outperform their peers. Your Fund is being positioned accordingly.
Conclusion
We believe the investment case for owning gold assets remains as compelling as ever for investors looking to hedge against fiscal and monetary policy failure in an increasingly volatile geopolitical environment. In our opinion, the fallout from years of extraordinary monetary policy measures going back 20 years remains uncertain, especially in light of fiscal policy backing the Fed into a corner. With total federal debt outstanding having risen from $10 trillion to $34 trillion over the past 15 years, the sustainability of the Fed fighting inflation with higher rates is becoming problematic for the fiscal position of the U.S. The increase in gold purchases by central banks over the past two years can in part be attributed to foreign central banks losing confidence in the USD as a store of value going forward. The other factor leading to increase gold purchases by central banks and selling of treasuries is the world
– 4 –
OCM GOLD FUND Shareholder Letter – November 30, 2023 (Continued)
(Unaudited) |
moving away from a uni-polar world headed by U.S. led Western influence to a multi-polar world spearheaded by China and Russia with the group of BRICS nations. The BRICS countries are looking for trade settlement away from the USD in addition to holding a neutral reserve asset immune from Western sanctions.
While the gold price has moved above $2,000 on the back of central bank purchases and strong Asian demand, Western sentiment toward gold assets is suffering a similar fate to the dotcom era, only this time it is Big Tech AI that is sucking up all the folks and capital with fear of missing out (“FOMO”). Gold assets are being liquidated from bullion ETFs to shares of gold mining companies in the West as investor exuberance on Big Tech and confidence the Fed can engineer a soft-landing shades investors’ ability to connect the macro dots. As famed Oaktree Capital founder Howard Marks said, “In the end, trees don’t grow to the sky, and few things go to zero. Rather, most phenomena turn out to be cyclical”. The period following the bursting of the dotcom bubble in 2001 ushered in a tremendous bull market in gold assets. If Western investors join Asian and central bank buying from current levels over $2,000, the prospect for outsized profits for gold mining companies and in turn appreciation of precious metals equities is high, in our opinion. For us, we believe the time to position to make the best returns in a sector is investing when capital is scarce in that sector. Capital is certainly scarce in the precious metals sector at present.
We appreciate your shareholding and confidence in the OCM Gold Fund, and we look forward to meeting the investment objective of preserving your purchasing power. Should you have any questions regarding the Fund or gold, please contact your financial adviser or you may contact us directly at 1-800-779-4681. For questions regarding your account, please contact Shareholder Service at 1-800-628-9403.
Sincerely,
Gregory M. Orrell
President/ Portfolio Manager
January 19, 2024
– 5 –
OCM GOLD FUND Shareholder Letter – November 30, 2023 (Continued)
(Unaudited) |
The S&P 500 Index1, a registered trademark of McGraw-Hill Co., Inc. is a market capitalization-weighted index of 500 widely held common stocks. You cannot invest directly in an index.
The Philadelphia Gold and Silver Index (XAU)2 is an unmanaged capitalization-weighted index composed of 16 companies listed on U.S. exchanges involved in the gold and silver mining industry. The index is generally considered as representative of the gold and silver share market. You cannot invest directly in an index.
Federal Reserve3 is the central bank of the United States and arguably the most powerful financial institution in the world. The Federal Reserve System was founded by the U.S. Congress in 1913 to provide the nation with a safe, flexible, and stable monetary and financial system.
Mag 74: Alphabet, Inc., Amazon, Inc., Apple, Inc., Meta Platforms, Inc, Netflix, Nvidia Corp. and Tesla, Inc.
5Newmont Corp., Barrick Gold Corp., Franco-Nevada Corp., Agnico Eagle Mines Ltd, Wheaton Precious Metals Corp., Northern Star Resources, G2 Goldfields, Inc., AngloGold Ashanti Ltd. ADR, Alamos Gold, Inc., Pan American Silver Corp., B2Gold Corp., Sibanye Stillwater Ltd. and Lundin Gold, Inc.
6https://ocmgoldfund.com/ocm-perspective-gold-and-debt-correlation/
Investing in the Fund involves risks including the loss of principal. Many of the companies in which the Fund invests are smaller capitalization companies, which may subject the Fund to greater risk than securities of larger, more-established companies, as smaller companies often have limited product lines, markets or financial resources, and may be subject to more-abrupt market movements. The Fund also invests in securities of gold and precious metals companies which may be subject to greater price fluctuations over short periods of time. The Fund is a non-diversified investment company meaning it will invest in fewer securities than diversified investment companies and its performance may be more volatile. The Fund contains international securities that may provide the opportunity for greater return but also have special risks associated with foreign investing including fluctuations in currency, government regulation, differences in accounting standards and liquidity.
– 6 –
OCM GOLD FUND Shareholder Letter – November 30, 2023 (Continued)
(Unaudited) |
Investor Class Performance as of November 30, 2023
| | OCMGX
(without load) | OCMGX
(with load) | Philadelphia
Gold and Silver
Index (XAU)1 | S&P 5002 | |
Six Months | 0.50% | -4.03% | 1.38% | 10.17% | |
One Year | 7.11% | 2.30% | 3.86% | 13.84% | |
3 Year Annualized | -5.02% | -6.46% | -1.16% | 9.76% | |
5 Year Annualized | 14.73% | 13.69% | 15.51% | 12.51% | |
10 Year Annualized | 5.67% | 5.18% | 4.81% | 11.82% | |
Atlas Class Performance as of November 30, 2023
| | OCMAX | Philadelphia
Gold and Silver
Index (XAU)1 | S&P 5002 | |
Six Months | 0.79% | 1.38% | 10.17% | |
One Year | 7.68% | 3.86% | 13.84% | |
3 Year Annualized | -4.51% | -1.16% | 9.76% | |
5 Year Annualized | 15.58% | 15.51% | 12.51% | |
10 Year Annualized | 6.44% | 4.81% | 11.82% | |
The performance data quoted above represents past performance. Current performance may be lower or higher than the performance data quoted above. Past performance is no guarantee of future results. The investment return and principal value of an investment will fluctuate so that investor’s shares, when redeemed, may be worth more or less than their original cost. The Fund’s Total Annual Operating Expenses for the Fund’s Investor Class and Atlas Class are 2.32% and 1.82% respectively. Please review the Fund’s prospectus for more information regarding the Fund’s fees and expenses. For performance information current to the most recent month-end, please call toll-free 800-628-9403. The returns shown include the reinvestment of all dividends but do not reflect the deduction of taxes that a shareholder would pay on Fund distributions or the redemption of Fund shares.
1 | The Philadelphia Gold and Silver Index (XAU) is an unmanaged capitalization-weighted index composed of 16 companies listed on U.S. exchanges involved in the gold and silver mining industry. The index is generally considered as representative of the gold and silver share market. You cannot invest directly in an index. The index is used herein for comparative purposes in accordance with SEC regulation. |
2 | The S&P 500 Index, a registered trademark of McGraw-Hill Co., Inc. is a market capitalization-weighted index of 500 widely held common stocks. You cannot invest directly in an index. The index is used herein for comparative purposes in accordance with SEC regulation. |
– 7 –
OCM GOLD FUND Schedule of Investments – November 30, 2023
|
Shares | | | | | |
Value
| |
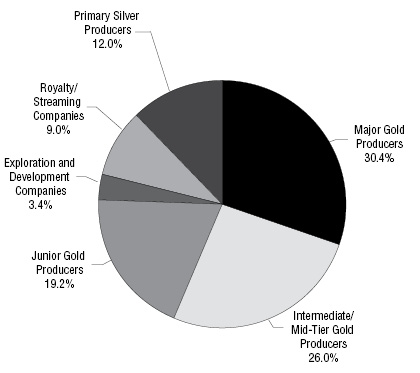
COMMON STOCKS 100.1% | | | | |
Major Gold Producers 30.5% | | | | |
65,500 | | Agnico Eagle Mines Ltd. | | $ | 3,517,350 | |
100,000 | | AngloGold Ashanti Ltd. ADR | | | 1,925,000 | |
100,000 | | B2Gold Corp. | | | 338,000 | |
300,000 | | B2Gold Corp.^ | | | 1,012,527 | |
200,000 | | Barrick Gold Corp. | | | 3,518,000 | |
118,670 | | Endeavour Mining PLC | | | 2,783,542 | |
65,000 | | Newmont Corp. | | | 2,612,350 | |
| | | | | | | | 15,706,769 | |
Intermediate/Mid-Tier Gold Producers 26.0% |
300,000 | | Alamos Gold, Inc. | | | 4,443,000 | |
250,000 | | Dundee Precious Metals, Inc. | | | 1,845,984 | |
225,000 | | Fortuna Silver Mines, Inc.* | | | 872,145 | |
130,000 | | Lundin Gold, Inc. | | | 1,561,533 | |
625,000 | | OceanaGold Corp. | | | 1,096,168 | |
70,000 | | Pan American Silver Corp. | | | 1,096,200 | |
800,000 | | Perseus Mining Ltd. | | | 1,020,219 | |
125,000 | | SSR Mining, Inc. | | | 1,475,000 | |
| | | | | | | | 13,410,249 | |
Junior Gold Producers 19.2% | | | | |
1,464,110 | | Catalyst Metals Ltd.* | | | 885,199 | |
1,000,000 | | Emerald Resources N.L.* | | | 1,883,177 | |
150,000 | | i-80 Gold Corp.* | | | 240,973 | |
1,659,900 | | Jaguar Mining, Inc.* | | | 2,238,480 | |
175,000 | | K92 Mining, Inc.* | | | 766,028 | |
1,000,000 | | Minera Alamos, Inc.* | | | 261,606 | |
450,000 | | Mineros S.A. | | | 195,652 | |
500,000 | | Orezone Gold Corp.* | | | 329,772 | |
1,000,000 | | Thor Explorations Ltd.* | | | 187,915 | |
450,000 | | Wesdome Gold Mines Ltd.* | | | 2,904,937 | |
| | | | | | | | | 9,893,739 | |
| | | | | | | | | | |
Exploration and Development Companies 3.4% |
350,000 | | Angel Wing Metals, Inc.* | | | 33,530 | |
250,000 | | G Mining Ventures Corp.* | | | 252,395 | |
250,000 | | G2 Goldfields, Inc.* | | | 145,542 | |
875,000 | | Liberty Gold Corp.* | | | 219,233 | |
616,500 | | Montage Gold Corp.* | | | 336,190 | |
5,000,000 | | Omai Gold Mines Corp.* | | | 257,922 | |
975,000 | | Rio2 Ltd.* | | | 125,737 | |
3,000,000 | | Royal Road Minerals Ltd.* | | | 210,022 | |
4,578,755 | | RTG Mining, Inc.* | | | 80,175 | |
2,512,040 | | Sutter Gold Mining, Inc.*, # | | | — | |
1,210,500 | | Tajiri Resources Corp.* | | | 20,071 | |
450,000 | | Westhaven Gold Corp.* | | | 89,536 | |
| | | | | | | | | 1,770,353 | |
Royalty/Streaming Companies 9.0% |
95,000 | | Wheaton Precious Metals Corp. | | | 4,644,989 | |
| | | | | | | | | | |
Primary Silver Producers 12.0% | | | | |
442,000 | | Andean Precious Metals Corp.* | | | 188,917 | |
815,000 | | Aya Gold & Silver, Inc.* | | | 5,987,877 | |
| | | | | | | | 6,176,794 | |
Total Common Stocks | | | | |
| | (Cost $25,268,556) | | | 51,602,893 | |
See notes to financial statements.
– 8 –
OCM GOLD FUND Schedule of Investments – November 30, 2023 (Continued) |
| Shares | | | | | | | |
Value | |
| WARRANTS 0.0% | | | | | |
| Exploration and Development Companies 0.0% |
| 175,000 | | Angel Wing Metals, Inc. Exercise Price: 0.50 CAD, Expiration Date: 4/26/2025 | | | | $ | — | |
| | | | | | | | | | — | |
| Total Warrants | | | | | | | | | | |
| | | (Cost $0) | | | | | — | |
| | | | | | | | | | | |
| Total Investments | | | | | | | |
| | | (Cost $25,268,556) | 100.1% | | | | 51,602,893 | |
| Liabilities less Other Assets | (0.1)% | | | | (48,177 | ) |
| TOTAL NET ASSETS | | 100.0% | | | $ | 51,554,716 | |
ADR – American Depository Receipt
PLC – Public Limited Company
CAD – Canadian Dollars
^ | Denoted investment is a Canadian security traded on U.S. stock exchange. |
* | Non-income producing security. |
# | Level 3 security fair valued under procedures established by the Board of Trustees, represents 0.00% of Net Assets. The total value of this security is $0. |
See notes to financial statements.
– 9 –
OCM GOLD FUND Schedule of Investments – November 30, 2023 (Continued) |
SUMMARY OF INVESTMENTS BY COUNTRY
Country | | Value | | | Percent of
Investment Securities | |
Australia | | $ | 3,788,596 | | | | 7.3 | % | |
Canada | | | 40,007,556 | | | | 77.5 | | |
Colombia | | | 195,652 | | | | 0.4 | | |
Jersey | | | 210,022 | | | | 0.4 | | |
United Kingdom | | | 4,708,542 | | | | 9.1 | | |
United States1 | | | 2,612,350 | | | | 5.1 | | |
Virgin Islands (British) | | | 80,175 | | | | 0.2 | | |
Total | | $ | 51,602,893 | | | | 100.0 | % | |
1 | Includes short-term investments. |
See notes to financial statements.
– 10 –
OCM GOLD FUND Statement of Assets and Liabilities – November 30, 2023
|
Assets: | | | | |
Investments in unaffiliated issuers, at value (cost $25,268,556) | | $ | 51,602,893 | |
Receivable for fund shares sold | | | 15 | |
Investment securities sold | | | 77,699 | |
Interest and dividends receivable | | | 91,268 | |
Reclaims receivable | | | 341 | |
Prepaid expenses and other assets | | | 34,941 | |
Total assets | | | 51,807,157 | |
| | | | | |
Liabilities: | | | | |
Payable for fund shares redeemed | | | 60,087 | |
Due to Custodian | | | 67,215 | |
Accrued distribution fees | | | 12,826 | |
Investment adviser fees | | | 36,401 | |
Accrued transfer agent fees and expenses | | | 14,617 | |
Accrued fund administration and accounting fees | | | 16,621 | |
Accrued Trustees’ fees | | | 2,500 | |
Accrued audit fees | | | 16,000 | |
Accrued report to shareholders | | | 6,624 | |
Accrued expenses and other liabilities | | | 19,550 | |
Total liabilities | | | 252,441 | |
Net Assets | | $ | 51,554,716 | |
| | | | | |
Net Assets Consist of: | | | | |
Shares of beneficial interest, no par value: unlimited shares authorized | | $ | 26,787,633 | |
Total distributable earnings | | | 24,767,083 | |
Net Assets | | $ | 51,554,716 | |
| | | | | |
Calculation of Maximum Offering Price: | | | | |
Investor Class: | | | | |
Net asset value and redemption price per share | | $ | 10.01 | |
Maximum sales charge (4.50% of offering price) | | | 0.47 | |
Offering price to public | | $ | 10.48 | |
Net assets applicable to shares outstanding | | $ | 11,283,052 | |
Shares outstanding | | | 1,127,228 | |
Atlas Class: | | | | |
Net asset value and redemption price per share | | $ | 11.43 | |
Net assets applicable to shares outstanding | | $ | 40,271,664 | |
Shares outstanding | | | 3,524,555 | |
Total Shares Outstanding | | | 4,651,783 | |
See notes to financial statements.
– 11 –
OCM GOLD FUND Statement of Operations – Year Ended November 30, 2023
|
Investment Income | | | | |
Interest | | $ | 10 | |
Dividend (net of foreign withholding taxes of $73,082) | | | 763,539 | |
Total investment income | | | 763,549 | |
| | | | | |
Expenses | | | | |
Investment advisory fees | | | 500,076 | |
Transfer agent fees and expenses | | | 116,706 | |
Fund administration and accounting fees | | | 106,825 | |
Distribution fees - Investor Class | | | 75,996 | |
Distribution fees - Atlas Class | | | 61,422 | |
Legal fees | | | 52,347 | |
Federal and state registration fees | | | 48,502 | |
Chief Compliance Officer fees | | | 29,300 | |
Custody fees | | | 24,178 | |
Reports to shareholders | | | 21,162 | |
Audit fees | | | 16,000 | |
Trustees’ fees | | | 11,591 | |
Other expenses | | | 15,930 | |
Total expenses | | | 1,080,035 | |
Net investment loss | | | (316,486 | ) |
| | | | | |
Realized and Unrealized Gain (Loss) on Investments: | | | | |
Net realized loss on investments and foreign currency transactions | | | (169,098 | ) |
Net change in unrealized appreciation/depreciation on investments and foreign currency translations | | | 4,081,314 | |
Net gain on investments | | | 3,912,216 | |
| | | | | |
Net increase in net assets from operations | | $ | 3,595,730 | |
See notes to financial statements.
– 12 –
OCM GOLD FUND Statements of Changes in Net Assets
|
| | | Year Ended
November 30,
2023 | | | Year Ended
November 30,
2022 | |
Operations: | | | | | | | | |
Net investment loss | | $ | (316,486 | ) | | $ | (254,717 | ) |
Net realized loss on investments and foreign currency transactions | | | (169,098 | ) | | | (263,176 | ) |
Net change in unrealized appreciation/depreciation on investments and foreign currency transactions | | | 4,081,314 | | | | (13,018,336 | ) |
Net increase (decrease) in net assets from operations | | | 3,595,730 | | | | (13,536,229 | ) |
| | | | | | | | | |
Distributions Paid to Shareholders | | | | | | | | |
Distributions: | | | | | | | | |
Investor Class | | | (5,934 | ) | | | (179,695 | ) |
Atlas Class | | | (18,719 | ) | | | (481,166 | ) |
Total | | | (24,653 | ) | | | (660,861 | ) |
| | | | | | | | | |
Fund Share Transactions | | | | | | | | |
Investor Class: | | | | | | | | |
Net proceeds from shares sold | | | 641,876 | | | | 594,078 | |
Distributions reinvested | | | 5,127 | | | | 155,297 | |
Payment of shares redeemed1 | | | (1,824,281 | ) | | | (2,698,963 | ) |
Net decrease in net assets from Investor Class share transactions | | | (1,177,278 | ) | | | (1,949,588 | ) |
| | | | | | | | | |
Atlas Class: | | | | | | | | |
Net proceeds from shares sold | | | 3,924,782 | | | | 16,975,338 | |
Distributions reinvested | | | 17,556 | | | | 458,060 | |
Payment of shares redeemed2 | | | (8,207,195 | ) | | | (16,275,498 | ) |
Net increase (decrease) in net assets from Atlas Class share transactions | | | (4,264,857 | ) | | | 1,157,900 | |
Net decrease in net assets from Fund share transactions | | | (5,442,135 | ) | | | (791,688 | ) |
| | | | | | | | | |
Total decrease in net assets | | | (1,871,058 | ) | | | (14,988,778 | ) |
| | | | | | | | | |
Net Assets, Beginning of Period | | | 53,425,774 | | | | 68,414,552 | |
Net Assets, End of Period | | $ | 51,554,716 | | | $ | 53,425,774 | |
See notes to financial statements.
– 13 –
OCM GOLD FUND Statements of Changes in Net Assets (Continued)
|
| | | Year Ended
November 30,
2023 | | | Year Ended
November 30,
2022 | |
Transactions in shares | | |
Investor Class: | | |
Shares sold | | | 63,579 | | | | 52,125 | |
Shares issued on reinvestment of distributions | | | 549 | | | | 14,131 | |
Shares redeemed | | | (193,272 | ) | | | (264,004 | ) |
Net decrease in Investor Class shares outstanding | | | (129,144 | ) | | | (197,748 | ) |
| | | | | | | | | |
Atlas Class: | | | | | | | | |
Shares sold | | | 352,703 | | | | 1,387,111 | |
Shares issued on reinvestment of distributions | | | 1,658 | | | | 36,911 | |
Shares redeemed | | | (755,190 | ) | | | (1,389,952 | ) |
Net increase (decrease) in Atlas Class shares outstanding | | | (400,829 | ) | | | 34,070 | |
Net Decrease in Fund Shares Outstanding | | | (529,973 | ) | | | (163,678 | ) |
1 | Net of redemption fees of $416 for the year ended November 30, 2023 and $2,776 for the year ended November 30, 2022, respectively. |
2 | Net of redemption fees of $8,124 for the year ended November 30, 2023 and $25,166 for the year ended November 30, 2022, respectively. |
See notes to financial statements.
– 14 –
OCM GOLD FUND Notes to Financial Statements – November 30, 2023 |
Note 1. Organization
OCM Mutual Fund (the “Trust”) is registered under the Investment Company Act of 1940, as amended (“1940 Act”), as an open-end management investment company. The Trust was organized as a Massachusetts business trust on January 6, 1984 and consists of the OCM Gold Fund (the “Fund”). The Fund is a non-diversified fund. The investment objective for the Fund is long-term growth of capital through investing primarily in equity securities of domestic and foreign companies engaged in activities related to gold and precious metals.
The Fund is an investment company and accordingly follows the investment company accounting and reporting guidance of the Financial Accounting Standards Board (“FASB”) Accounting Standard Codification Topic 946 “Financial Services—Investment Companies.”
Note 2. Significant Accounting Policies
The following is a summary of significant accounting policies followed by the Fund in the preparation of its financial statements.
Security Valuation – Portfolio securities that are listed on national securities exchanges, other than the NASDAQ Stock Market LLC, are valued at the last sale price as of the close of business of such securities exchanges, or, in the absence of recorded sales, at the average of readily available closing bid and ask prices on such exchanges. NASDAQ Global Select Market, Global Market and Capital Market securities are valued at the NASDAQ Official Closing Price (“NOCP”). If a NOCP is not issued for a given day, these securities are valued at the average of readily available closing bid and ask prices. Unlisted securities are valued at the average of the quoted bid and ask prices in the over-the-counter market. Short-term investments which mature in less than 60 days are valued at amortized cost (unless the Fund’s investment adviser determines that this method does not represent fair value). Short-term investments which mature after 60 days are valued at market. Securities and other assets for which market quotations are not readily available are valued at fair value as determined in good faith by the Fund’s investment adviser. In compliance with Rule 2a-5 under the 1940 Act, the Fund’s Board of Trustees has designated the investment adviser as the valuation designee, and the investment adviser performs the fair value determinations relating to Fund investments. For each investment that is fair valued, the investment adviser considers, to the extent applicable, various factors including, but not limited to, the type of security, the financial condition of the company, comparable companies in the public market, the nature and duration of the cause for a quotation not being readily available and other relevant factors.
Fair Value Measurements and Disclosures defines fair value, establishes a framework for measuring fair value in accordance with GAAP, and expands disclosure about fair value measurements. It also provides guidance on determining when there has been a significant decrease in the volume and level of activity for an asset or a liability, when a transaction is not orderly, and how that information must be incorporated into a fair value measurement.
– 15 –
OCM GOLD FUND Notes to Financial Statements – November 30, 2023 (Continued)
|
Under Fair Value Measurements and Disclosures, various inputs are used in determining the value of the Fund’s investments. These inputs are summarized into three broad levels as described below:
| | ● | Level 1 – Unadjusted quoted prices in active markets for identical assets or liabilities that the Fund has the ability to access. |
| | ● | Level 2 – Observable inputs other than quoted prices included in Level 1 that are observable for the asset or liability, either directly or indirectly. These inputs may include quoted prices for the identical instrument on an inactive market, prices for similar instruments, interest rates, prepayment speeds, credit risk, yield curves, default rates and similar data. |
| | ● | Level 3 – Unobservable inputs for the asset or liability, to the extent relevant observable inputs are not available, representing the Fund’s own assumptions about the assumptions a market participant would use in valuing the asset or liability, and would be based on the best information available. |
The availability of observable inputs can vary from security to security and is affected by a wide variety of factors, including for example, the type of security, whether the security is new and not yet established in the marketplace, the liquidity of markets, and other characteristics particular to the security. To the extent that valuation is based on models or inputs that are less observable or unobservable in the market, the determination of fair value requires more judgment. Accordingly, the degree of judgment exercised in determining fair value is greatest for instruments categorized in Level 3.
The inputs to measure fair value may fall into different Levels of the fair value hierarchy. In such cases, for disclosure purposes, the Level in the fair value hierarchy within which the fair value measurement falls in its entirety, is determined based on the lowest Level input that is significant to the fair value measurement in its entirety.
– 16 –
OCM GOLD FUND Notes to Financial Statements – November 30, 2023 (Continued)
|
The inputs or methodology used for valuing securities are not an indication of the risk associated with investing in those securities. The following is a summary of the inputs used, as of November 30, 2023, in valuing the Fund’s assets carried at fair value:
Sector | | Level 1 | | | Level 2 | | | Level 3 | | | Total | |
Common Stocks | | | | | | | | | | | | | | | | |
Major Gold Producers | | $ | 15,706,769 | | | $ | — | | | $ | — | | | $ | 15,706,769 | |
Intermediate/Mid-Tier Gold Producers | | | 13,410,249 | | | | — | | | | — | | | | 13,410,249 | |
Junior Gold Producers | | | 9,893,739 | | | | — | | | | — | | | | 9,893,739 | |
Exploration and Development Companies | | | 1,770,353 | | | | — | | | | 0 | | | | 1,770,353 | |
Royalty/Streaming Companies | | | 4,644,989 | | | | — | | | | — | | | | 4,644,989 | |
Primary Silver Producers | | | 6,176,794 | | | | — | | | | — | | | | 6,176,794 | |
Warrants | | | — | | | | 0 | | | | — | | | | 0 | |
Total | | $ | 51,602,893 | | | $ | 0 | | | $ | 0 | | | $ | 51,602,893 | |
The Fund held one Level 2 security at November 30, 2023. Angel Wing Metals, Inc., a Warrant, is being valued at intrinsic value, in accordance with the Fund’s fair value methodologies. The Fund held one Level 3 security at November 30, 2023. Sutter Gold Mining, Inc. (“SGM CN”) has ceased operations and a receiver for the company’s assets has been appointed. The common shares of SGM CN will be valued at zero, in accordance with the Fund’s fair value methodologies, until such time as the receiver has finalized the sale of the company’s assets.
There was no Level 3 activity during the year ended November 30, 2023 and did not warrant a Level 3 rollforward disclosure.
The Level 3 investments for the Fund represented 0.00% of net assets and did not warrant a disclosure of significant unobservable valuation inputs.
– 17 –
OCM GOLD FUND Notes to Financial Statements – November 30, 2023 (Continued)
|
Foreign Currency – Investment securities and other assets and liabilities denominated in foreign currencies are translated into U.S. dollar amounts at the date of valuation. Purchases and sales of investment securities and income and expense items denominated in foreign currencies are translated into U.S. dollar amounts on the respective dates of such transactions. The Fund does not isolate that portion of the results of operations resulting from changes in foreign exchange rates on investments from the fluctuations arising from changes in market prices of securities held. Such fluctuations for the year ended November 30, 2023 are included within the realized and unrealized gain/loss on investments section of the Statement of Operations.
Reported net realized foreign exchange gains or losses arise from sales of foreign currencies, currency gains or losses realized between the trade and settlement dates on securities transactions, and the difference between the amounts of dividends, interest and foreign withholding taxes recorded on the Fund’s books and the U.S. dollar equivalent of the amounts actually received or paid. Net unrealized foreign exchange gains and losses arise from changes in the fair value of assets and liabilities, other than investments in securities at fiscal period end, resulting from changes in exchange rates. Such fluctuations for the year ended November 30, 2023 are included within the realized and unrealized gain/loss on investments section of the Statement of Operations.
Federal Income Taxes – The Fund intends to comply with the requirements of the Internal Revenue Code of 1986, as amended (“Code”), necessary to qualify as a regulated investment company and to make the requisite distributions of income to its shareholders to relieve it from all or substantially all federal income taxes. Withholding taxes on foreign dividends have been provided for in accordance with the Fund’s understanding on the applicable country’s tax rules and rate.
Accounting for Uncertainty in Income Taxes (“Income Tax Statement”) requires an evaluation of tax positions taken (or expected to be taken) in the course of preparing the Fund’s tax returns to determine whether these positions meet a “more-likely-than-not” standard that, based on the technical merits, have a more than fifty percent likelihood of being sustained by a taxing authority upon examination. A tax position that meets the “more-likely-than-not” recognition threshold is measured to determine the amount of benefit to recognize in the financial statements. The Fund’s policy is to classify interest and penalties associated with underpayment of federal and state income taxes, if any, as income tax expense on the Statement of Operations. As of November 30, 2023, the Fund did not have any interest or penalties associated with the underpayment of any income taxes.
The Income Tax Statement requires management of the Fund to analyze all open tax years, fiscal years 2020-2023 as defined by the Internal Revenue Service statute of limitations for all major jurisdictions, including federal tax authorities and certain state tax authorities. As of and during the year ended November 30, 2023, the Fund did not have a liability for any unrecognized tax benefits. The Fund has no examinations in progress and is not aware of any tax positions for which it is reasonably possible that the total amounts of unrecognized tax benefits will significantly change in the next twelve months.
– 18 –
OCM GOLD FUND Notes to Financial Statements – November 30, 2023 (Continued)
|
Share Classes – The Fund offers two classes of shares, Investor Class and Atlas Class (formerly “Advisor Class”). The outstanding shares of the Fund on April 1, 2010 were renamed “Investor Class shares.” The Atlas Class shares commenced operations on April 1, 2010. The two classes represent interests in the same portfolio of investments and have the same rights. Income, expenses (other than expenses attributable to a specific class) and realized and unrealized gains and losses on investments are allocated to each class of shares in proportion to their relative net assets.
Securities Transactions and Investment Income – Securities transactions are accounted for on a trade date basis. Realized gains and losses on sales of securities are calculated on the identified cost basis. Dividend income is recorded on the ex-dividend date and interest income is recorded on an accrual basis. Withholding taxes on foreign dividends have been provided for in accordance with the Fund’s understanding of the applicable country’s tax rules and rates.
Distributions to Shareholders – The character of distributions made during the year from net investment income or net realized gains may differ from the characterization for federal income tax purposes due to differences in the recognition of income, expense or gain items for financial statement and tax purposes. To the extent that these differences are attributable to permanent book and tax accounting differences, the components of net assets have been adjusted.
Redemption Fee – A 1.50% redemption fee is retained by the Fund to offset transaction costs and other expenses associated with short-term investing. The fee is imposed on redemptions or exchanges of shares held less than three months from their purchase date. The Fund records the fee as a reduction of shares redeemed and as a credit to shares of beneficial interest. For the year ended November 30, 2023, the Investor Class and the Atlas Class received $416 and $8,124 in redemption fees, respectively.
Guarantees and Indemnifications – In the normal course of business, the Fund enters into contracts with service providers that contain general indemnification clauses. Also, under the Fund’s organizational documents, its officers and Trustees are indemnified by the Fund against certain liabilities arising out of the performance of their duties to the Fund. The Fund notes that insofar as indemnification for liabilities arising under the Securities Act of 1933 may be permitted to trustees and officers, the Fund has been advised that in the opinion of the Securities and Exchange Commission (the “SEC”) such indemnification is against public policy as expressed in that Act and is, therefore, unenforceable. The Fund’s maximum exposure under these arrangements is unknown as this would involve future claims against the Fund that have not yet occurred. Based on experience, the Fund expects the risk of loss to be remote.
– 19 –
OCM GOLD FUND Notes to Financial Statements – November 30, 2023 (Continued)
|
Use of Estimates – The preparation of financial statements in conformity with accounting principles generally accepted in the United States of America requires management to make estimates and assumptions that affect the reported amounts of assets and liabilities and disclosure of contingent assets and liabilities at the date of the financial statements and the reported amounts of increases and decreases in net assets from operations during the reporting period. Actual results could differ from those estimates.
Derivative Instruments – Equity securities in the gold mining industry, particularly the smaller companies, may occasionally issue warrants as part of their capital structure. A warrant gives the holder the right to purchase the underlying equity at the exercise price until the expiration date of the warrant. The Fund may hold such warrants for exposure to smaller companies in the portfolio or other reasons associated with the Fund’s overall objective of long-term growth, though warrants will typically not be a significant part of the Fund’s portfolio. The Fund’s maximum risk in holding warrants is the loss of the entire amount paid for the warrants. At November 30, 2023, the Fund held warrants as listed on the Schedule of Investments.
Note 3. Investment Advisory Agreement and Affiliated Parties
The Fund has an investment advisory agreement with Orrell Capital Management, Inc. (“OCM” or the “Adviser”). Under the agreement, the Fund pays OCM a fee computed daily and payable monthly, at the following annual rates based upon average daily net assets:
Assets | Fee Rate |
$0 to $250 million | 0.950% |
$250 million to $500 million | 0.800% |
$500 million to $1 billion | 0.700% |
Over $1 billion | 0.600% |
Under the investment advisory agreement, the Adviser is responsible for reimbursing the Fund to maintain a voluntary ratio of expenses to average daily net assets for the Investor Class shares and Atlas Class shares at 2.99% and 2.49%, respectively.
The Fund does not compensate Trustees and Officers affiliated with OCM. For the year ended November 30, 2023, the expenses accrued for Trustees who are not affiliated with OCM are reported on the Statement of Operations. The Fund pays fees and related expenses for the services of the Fund’s Chief Compliance Officer. The expenses incurred for the Chief Compliance Officer are reported on the Statement of Operations.
– 20 –
OCM GOLD FUND Notes to Financial Statements – November 30, 2023 (Continued)
|
Note 4. Distribution Agreement and Plan
The Trust has adopted a Distribution Plan (the “Plan”) pursuant to Rule 12b-1 under the 1940 Act. The Plan authorizes the Fund to reimburse the distributor for marketing expenses incurred in distributing shares of the Fund, including the cost of printing sales material and making payments to dealers of the Fund’s Investor Class and Atlas Class, in any fiscal year, subject to limits of 0.99% and 0.25%, respectively, of the average daily net assets of each respective class. For the year ended November 30, 2023, the Investor Class and the Atlas Class incurred $75,996 and $61,422, respectively, in expenses under the Plan.
Note 5. Purchases and Sales of Securities
Purchases and sales of investment securities (excluding short-term securities and U.S. government obligations) for the year ended November 30, 2023 were $1,474,135 and $7,055,802, respectively. There were no purchases or sales of U.S. government obligations.
Note 6. Federal Income Tax Information
At November 30, 2023, gross unrealized appreciation and depreciation of investments owned by the Fund, based on cost for federal income tax purposes were as follows:
Cost of investments | | $ | 25,734,136 | |
Unrealized appreciation on investments | | $ | 30,978,038 | |
Unrealized depreciation on investments | | | (5,109,281 | ) |
Unrealized appreciation on foreign currency | | | 36 | |
Net unrealized appreciation on investments | | $ | 25,868,793 | |
The difference between cost amounts for financial statement and federal income tax purposes is due primarily to investments in passive foreign investment companies (“PFICs”).
– 21 –
OCM GOLD FUND Notes to Financial Statements – November 30, 2023 (Continued)
|
GAAP requires that certain components of net assets be reclassified between financial and tax reporting. These reclassifications have no effect on net asset value per share. For the year ended November 30, 2023, permanent differences in book and tax accounting have been reclassified to paid in capital and total distributable earnings/(deficits) as follows:
Increase (Decrease) |
Paid in Capital | | Total Distributable
Earnings | |
$ (238,853) | | | $238,853 | |
The tax character of distributions paid during the fiscal years ended November 30, 2023 and 2022 was as follows:
| | | 2023 | | | 2022 | |
Ordinary income | | $ | — | | | $ | — | |
Net long-term capital gains | | | 24,653 | | | | 660,861 | |
Total distributions | | $ | 24,653 | | | $ | 660,861 | |
As of November 30, 2023, the components of accumulated earnings on a tax basis were as follows:
Undistributed ordinary income | | $ | — | |
Undistributed long-term gains | | | — | |
Tax accumulated earnings | | | — | |
Accumulated capital and other losses | | | (1,101,710 | ) |
Unrealized appreciation on investments. | | | 25,868,757 | |
Unrealized appreciation on foreign currency | | | 36 | |
Total accumulated earnings | | $ | 24,767,083 | |
The Fund has $194,451 in qualified late-year losses, which are deferred until fiscal year 2024 for tax purposes. Net late-year ordinary losses incurred after December 31 and within the taxable year and net late-year specified losses incurred after October 31 and within the taxable year are deemed to arise on the first day of the Fund’s next taxable year.
– 22 –
OCM GOLD FUND Notes to Financial Statements – November 30, 2023 (Continued)
|
As of November 30, 2023, the Fund had a short-term capital loss carryforward of $345,598 and a long-term capital loss carryforward of $561,661. To the extent that the fund may realize future net capital gains, those gains will be offset by any of its unused capital loss carryforward. Future capital loss carryover utilization in any given year may be subject to Internal Revenue Code limitations.
Note 7. Concentration of Risk
Investing in foreign securities involves certain risks not necessarily found in U.S. markets. These include risks associated with adverse changes in economic, political, regulatory and other conditions, changes in currency exchange rates, exchange control regulations, expropriation of assets or nationalization, imposition of withholding taxes on dividend or interest payments or capital gains, and possible difficulty in obtaining and enforcing judgments against foreign entities. Further, issuers of foreign securities are subject to different, and often less comprehensive, accounting, reporting, and disclosure requirements than domestic issuers.
As the Fund concentrates its investments in the gold mining industry, a development adversely affecting the industry (for example, changes in the mining laws which increases production costs or a significant decrease in the market price of gold) would have a greater adverse effect on the Fund than it would if the Fund invested in a number of different industries.
Note 8. Illiquid Securities
Pursuant to Rule 22e-4 under the 1940 Act, the Fund has adopted a Liquidity Risk Management Program (“LRMP”) that requires, among other things, that the Fund limits its illiquid investments that are assets to no more than 15% of net assets. An illiquid investment is any security which may not reasonably be expected to be sold or disposed of in current market conditions in seven calendar days or less without the sale or disposition significantly changing the market value of the investment. If the Adviser, at any time, determines that the value of illiquid securities held by the Fund exceeds 15% of its net asset value, the Adviser will take such steps as it considers appropriate to reduce them as soon as reasonably practicable in accordance with the Fund’s written LRMP.
Note 9. Market Disruption and Geopolitical Risks
Certain local, regional or global events such as war, acts of terrorism, the spread of infectious illnesses and/or other public health issues, or other events may have a significant impact on a security or instrument. These types of events and other like them are collectively referred to as “Market Disruptions and Geopolitical Risks” and they may have adverse impacts on the worldwide economy, as well as the economies of individual countries, the financial health of individual companies and the market in general in significant and unforeseen ways. Some of the impacts noted in recent times include but are not limited to embargos, political actions, supply chain disruptions, restrictions to investment and/or monetary movement including the forced selling of securities or the inability to participate impacted markets. The duration of these events could adversely affect
– 23 –
OCM GOLD FUND Notes to Financial Statements – November 30, 2023 (Continued)
|
the Fund’s performance, the performance of the securities in which the Fund invests and may lead to losses on your investment. The ultimate impact of “Market Disruptions and Geopolitical Risks” on the financial performance of the Fund’s investments is not reasonably estimable at this time. Management is actively monitoring these events.
Note 10. New Accounting Pronouncements
Effective January 24, 2023, the SEC adopted rule and form amendments to require mutual funds and ETFs to transmit concise and visually engaging streamlined annual and semiannual reports to shareholders that highlight key information deemed important for retail investors to assess and monitor their fund investments. Other information, including financial statements, will no longer appear in the Fund’s streamlined shareholder reports but must be available online, delivered free of charge upon request, and filed on a semiannual basis on Form N-CSR. The rule and form amendments have a compliance date of July 24, 2024. At this time, management is evaluating the impact of these rule and form amendment changes on the content of the current shareholder report and the newly created annual and semiannual streamlined shareholder reports.
Note 11. Subsequent Events
Management has evaluated events and transactions for potential recognition or disclosure through the date the financial statements were issued. Management has determined there are no material events that would require disclosure in the Fund’s financial statements through this date.
– 24 –
OCM GOLD FUND Financial Highlights Investor Class
|
| | | Year
Ended
Nov. 30,
2023 | | | Year
Ended
Nov. 30,
2022 | | | Year
Ended
Nov. 30,
2021 | | | Year
Ended
Nov. 30,
2020 | | | Year
Ended
Nov. 30,
2019 | |
| | | | | | | | | | | | | | | | | | | | | |
Per Share Operating Performance | | | | | | | | | | | | | | | | | | | | |
(For a share outstanding throughout each period) | | | | | | | | | | | | | | | | | | | | |
| | | | | | | | | | | | | | | | | | | | | |
Net asset value, beginning of period | | $ | 9.35 | | | $ | 11.71 | | | $ | 11.94 | | | $ | 8.62 | | | $ | 7.05 | |
| | | | | | | | | | | | | | | | | | | | | |
Income from Investment Operations: | | | | | | | | | | | | | | | | | | | | |
Net investment loss1 | | | (0.10 | ) | | | (0.08 | ) | | | (0.11 | ) | | | (0.16 | ) | | | (0.14 | ) |
Net realized and unrealized gain (loss) on investments and foreign currency transactions | | | 0.76 | | | | (2.16 | ) | | | 0.01 | | | | 4.05 | | | | 3.37 | |
Net increase from payments by affiliates (Note 3) | | | — | | | | — | | | | — | | | | — | 2 | | | — | |
Total from investment operations | | | 0.66 | | | | (2.24 | ) | | | (0.10 | ) | | | 3.89 | | | | 3.23 | |
| | | | | | | | | | | | | | | | | | | | | |
Less Distributions: | | | | | | | | | | | | | | | | | | | | |
Dividends from net investment income | | | — | | | | — | | | | (0.08 | ) | | | — | | | | — | |
Distribution from net realized gains | | | — | 2 | | | (0.12 | ) | | | (0.05 | ) | | | (0.57 | ) | | | (1.66 | ) |
Total distributions | | | — | 2 | | | (0.12 | ) | | | (0.13 | ) | | | (0.57 | ) | | | (1.66 | ) |
| | | | | | | | | | | | | | | | | | | | | |
Redemption fee proceeds1 | | | — | 2 | | | — | 2 | | | — | 2 | | | — | 2 | | | — | 2 |
| | | | | | | | | | | | | | | | | | | | | |
Net asset value, end of period | | $ | 10.01 | | | $ | 9.35 | | | $ | 11.71 | | | $ | 11.94 | | | $ | 8.62 | |
| | | | | | | | | | | | | | | | | | | | | |
Total return* | | | 7.11 | % | | | (19.25 | )% | | | (0.95 | )% | | | 48.15 | % | | | 56.65 | % |
| | | | | | | | | | | | | | | | | | | | | |
Ratios/Supplemental Data: | | | | | | | | | | | | | | | | | | | | |
Net assets, end of year (in 000’s) | | $ | 11,283 | | | $ | 11,747 | | | $ | 17,024 | | | $ | 18,343 | | | $ | 22,467 | |
Ratio of expenses to average net assets | | | 2.44 | % | | | 2.32 | % | | | 2.19 | % | | | 2.29 | % | | | 2.91 | % |
Ratio of net investment loss to average net assets | | | (0.99 | )% | | | (0.80 | )% | | | (0.89 | )% | | | (1.53 | )% | | | (1.89 | )% |
Portfolio turnover rate | | | 3 | % | | | 9 | % | | | 11 | % | | | 1 | % | | | 18 | % |
1 | Based on average shares method. |
2 | Amount represents less than $0.01 per share. |
See notes to financial statements.
– 25 –
OCM GOLD FUND Financial Highlights Atlas* Class
|
| | | Year
Ended
Nov. 30,
2023 | | | Year
Ended
Nov. 30,
2022 | | | Year
Ended
Nov. 30,
2021 | | | Year
Ended
Nov. 30,
2020 | | | Year
Ended
Nov. 30,
2019 | |
| | | | | | | | | | | | | | | | | | | | | |
Per Share Operating Performance | | | | | | | | | | | | | | | | | | | | |
(For a share outstanding throughout each period) | | | | | | | | | | | | | | | | | | | | |
| | | | | | | | | | | | | | | | | | | | | |
Net asset value, beginning of period | | $ | 10.62 | | | $ | 13.21 | | | $ | 13.46 | | | $ | 9.57 | | | $ | 7.58 | |
| | | | | | | | | | | | | | | | | | | | | |
Income from Investment Operations: | | | | | | | | | | | | | | | | | | | | |
Net investment loss1 | | | (0.05 | ) | | | (0.04 | ) | | | (0.05 | ) | | | (0.13 | ) | | | (0.11 | ) |
Net realized and unrealized gain (loss) on investments and foreign currency transactions | | | 0.86 | | | | (2.44 | ) | | | — | | | | 4.54 | | | | 3.71 | |
Net increase from payments by affiliates (Note 3) | | | — | | | | — | | | | — | | | | — | 2 | | | — | |
Total from investment operations | | | 0.81 | | | | (2.48 | ) | | | (0.05 | ) | | | 4.41 | | | | 3.60 | |
| | | | | | | | | | | | | | | | | | | | | |
Less Distributions: | | | | | | | | | | | | | | | | | | | | |
Dividends from net investment income | | | — | | | | — | | | | (0.16 | ) | | | — | | | | — | |
Distribution from net realized gains | | | — | 2 | | | (0.12 | ) | | | (0.05 | ) | | | (0.57 | ) | | | (1.66 | ) |
Total distributions | | | — | 2 | | | (0.12 | ) | | | (0.21 | ) | | | (0.57 | ) | | | (1.66 | ) |
| | | | | | | | | | | | | | | | | | | | | |
Redemption fee proceeds1 | | | — | 2 | | | 0.01 | | | | 0.01 | | | | 0.05 | | | | 0.05 | |
| | | | | | | | | | | | | | | | | | | | | |
Net asset value, end of period | | $ | 11.43 | | | $ | 10.62 | | | $ | 13.21 | | | $ | 13.46 | | | $ | 9.57 | |
| | | | | | | | | | | | | | | | | | | | | |
Total return | | | 7.68 | % | | | (18.80 | )% | | | (0.42 | )% | | | 49.40 | % | | | 58.54 | %3 |
| | | | | | | | | | | | | | | | | | | | | |
Ratios/Supplemental Data: | | | | | | | | | | | | | | | | | | | | |
Net assets, end of year (in 000’s) | | $ | 40,272 | | | $ | 41,679 | | | $ | 51,390 | | | $ | 55,603 | | | $ | 12,507 | |
Ratio of expenses to average net assets | | | 1.94 | % | | | 1.82 | % | | | 1.69 | % | | | 1.79 | % | | | 2.38 | % |
Ratio of net investment loss to average net assets | | | (0.49 | )% | | | (0.30 | )% | | | (0.39 | )% | | | (1.03 | )% | | | (1.36 | )% |
Portfolio turnover rate | | | 3 | % | | | 9 | % | | | 11 | % | | | 1 | % | | | 18 | % |
* | Formally known as Advisor Class. |
1 | Based on average shares method. |
2 | Amount represents less than $0.01 per share. |
3 | Total returns would have been higher/lower had expenses not been waived/recovered by the Adviser. |
See notes to financial statements.
– 26 –
OCM GOLD FUND Report of Independent Registered Public Accounting Firm
|
To the Board of Trustees of OCM Mutual Fund and
Shareholders of OCM Gold Fund
Opinion on the Financial Statements
We have audited the accompanying statement of assets and liabilities of OCM Gold Fund (the “Fund”), a series of OCM Mutual Fund (the “Trust”), including the schedule of investments, as of November 30, 2023, the related statement of operations for the year then ended, and the statements of changes in net assets for each of the two years in the period then ended, the financial highlights for each of the five years in the period then ended, and the related notes (collectively referred to as the “financial statements”). In our opinion, the financial statements present fairly, in all material respects, the financial position of the Fund as of November 30, 2023, the results of its operations for the year then ended, the changes in its net assets for each of the two years in the period then ended, and the financial highlights for each of the five years in the period then ended, in conformity with accounting principles generally accepted in the United States of America.
Basis for Opinion
These financial statements are the responsibility of the Fund’s management. Our responsibility is to express an opinion on the Fund’s financial statements based on our audits. We are a public accounting firm registered with the Public Company Accounting Oversight Board (United States) (“PCAOB”) and are required to be independent with respect to the Fund in accordance with the U.S. federal securities laws and the applicable rules and regulations of the Securities and Exchange Commission and the PCAOB. We have served as the auditor of the fund since 2018.
We conducted our audits in accordance with the standards of the PCAOB. Those standards require that we plan and perform the audits to obtain reasonable assurance about whether the financial statements are free of material misstatement, whether due to error or fraud. The Fund is not required to have, nor were we engaged to perform, an audit of the Fund’s internal control over financial reporting. As part of our audit we are required to obtain an understanding of internal control over financial reporting, but not for the purpose of expressing an opinion on the effectiveness of the Fund’s internal control over financial reporting. Accordingly, we express no such opinion.
Our audits included performing procedures to assess the risks of material misstatement of the financial statements, whether due to error or fraud, and performing procedures that respond to those risks. Such procedures included examining, on a test basis, evidence regarding the amounts and disclosures in the financial statements. Our audits also included evaluating the accounting principles used and significant estimates made by management, as well as
– 27 –
OCM GOLD FUND Report of Independent Registered Public Accounting Firm (Continued) |
evaluating the overall presentation of the financial statements. Our procedures included confirmation of securities owned as of November 30, 2023 by correspondence with the custodian. We believe that our audits provide a reasonable basis for our opinion.
| | 
TAIT, WELLER & BAKER LLP |
Philadelphia, Pennsylvania
January 26, 2024
– 28 –
OCM GOLD FUND Expense Example – For the Period Ended November 30, 2023
(Unaudited) |
As a shareholder of the OCM Gold Fund (the “Fund”), you incur two types of costs: (1) transaction costs, including sales charges (loads) on purchase payments and redemption fees on certain redemptions; and (2) ongoing costs, including management fees; distribution (12b-1) fees; and other Fund expenses. This Example is intended to help you understand your ongoing costs (in dollars) of investing in the Fund and to compare these costs with the ongoing costs of investing in other mutual funds.
The Example is based on an investment of $1,000 invested at the beginning of the period and held for the entire period from June 1, 2023 to November 30, 2023 (the “period”).
Actual Expenses
The row titled “Actual” in the table below provides information about actual account values and actual expenses. You may use this information, together with the amount you invested, to estimate the expenses you paid over the period. Simply divide your account value by $1,000 (for example, an $8,600 account value divided by $1,000 equals 8.6), then multiply the result by the number in the appropriate line for your share class under the heading entitled “Expenses Paid During the Period” to estimate the expenses you paid on your account during the periods.
Hypothetical Example for Comparison Purposes
The row titled “Hypothetical” in the table below provides information about hypothetical account values and hypothetical expenses based on each class’ actual expense ratio and an assumed rate of return of 5% per year before expenses, which is not each class’ actual return. The hypothetical account values and expenses may not be used to estimate the actual ending account balance or expenses you paid for the period. You may use this information to compare the ongoing costs of investing in the classes of the Fund and other funds. To do so, compare these 5% hypothetical examples with the 5% hypothetical examples that appear in the shareholder reports of other funds.
Please note that the expenses shown in the table are meant to highlight your ongoing costs only and do not reflect any transactional costs, such as sales charges (loads) and redemption fees. Therefore, the hypothetical lines of the table are useful in comparing the ongoing costs only, and will not help you determine the relative total costs of owning different funds. In addition, if these transactional costs were included, your costs would have been higher.
– 29 –
OCM GOLD FUND Expense Example – For the Period Ended November 30, 2023 (Continued)
(Unaudited) |
Expenses Paid During the Period
| | Beginning
Account Value
June 1, 2023 | Ending
Account Value
November 30, 2023 | Expenses Paid
During the
Period Ended
November 30, 2023* |
Investor Class | | | |
Actual | $ 1,000.00 | $ 1,005.00 | $ 12.69 |
Hypothetical (5% return before expenses) | 1,000.00 | 1,012.41 | 12.74 |
Atlas Class | | | |
Actual | 1,000.00 | 1,007.90 | 10.19 |
Hypothetical (5% return before expenses) | 1,000.00 | 1,014.92 | 10.22 |
* | Expenses are equal to the Investor Class’ and Atlas Class’ annualized expense ratios of 2.52% and 2.02%, respectively, for the period, multiplied by the average account value over the period, multiplied by 183/365 (to reflect the one-half year period). |
– 30 –
OCM GOLD FUND Other Information
(Unaudited) |
Investments by Sector – As of November 30, 2023
As a Percentage of Total Investments
The Fund files its complete schedule of portfolio holdings with the SEC for the first and third quarters of each fiscal year as an exhibit to its reports on Form N-PORT. Shareholders may obtain the Fund’s Form N-PORT on the SEC’s website at http://www.sec.gov.
A description of the Fund’s proxy voting policies and procedures and a record of the Fund’s proxy votes for the year ended June 30, 2023 are available without charge, upon request by calling toll free 1-800-779-4681 and on the SEC’s website at http://www.sec.gov. The Fund’s proxy voting policies and procedures are also available on the Fund’s website at http://www.ocmgoldfund.com.
– 31 –
OCM GOLD FUND - INVESTOR CLASS Performance Results – Year Ended November 30, 2023
(Unaudited) |
Average Annual Total Returns
| | Investor Class | S&P 500® Index | Philadelphia
Gold & Silver Index |
1 year | 7.11% | 13.84% | 3.86% |
5 year | 14.73% | 12.51% | 15.51% |
10 year | 5.67% | 11.82% | 4.81% |
– 32 –
OCM GOLD FUND - ATLAS CLASS Performance Results – Year Ended November 30, 2023
(Unaudited) |
Average Annual Total Returns
| | Atlas Class | S&P 500® Index | Philadelphia
Gold & Silver Index |
1 year | 7.68% | 13.84% | 3.86% |
5 year | 15.58% | 12.51% | 15.51% |
10 year | 6.44% | 11.82% | 4.81% |
– 33 –
OCM GOLD FUND Annual Renewal of Investment Advisory Agreement
(Unaudited) |
On October 17, 2023, the Board of Trustees of OCM Mutual Fund approved the continuation of the Fund’s investment advisory agreement with Orrell Capital Management, Inc. (the “Adviser”). Prior to approving the continuation of the agreement, the Board considered:
| | ● | the nature, extent and quality of the services provided by the Adviser |
| | ● | the investment performance of the Fund |
| | ● | the costs of the services to be provided and profits to be realized by the Adviser from its relationship with the Fund |
| | ● | the extent to which economies of scale would be realized as the Fund grows and whether fee levels reflect those economies of scale |
| | ● | the expense ratio of the Fund |
All of the factors discussed by the Trustees were considered as a whole and were considered separately by the Trustees who are not “interested persons” of the Trust (the “Independent Trustees”), meeting in executive session. The factors were viewed in their totality by the Trustees, with no single factor being the principal or determinative factor in the Trustees’ determination of whether to approve the continuation of the investment advisory agreement. The Trustees recognized that the management and fee arrangements for the Fund are the result of years of review and discussion between the Independent Trustees and the Adviser, that certain aspects of such arrangements may receive greater scrutiny in some years than in others and that the Trustees’ conclusions may be based, in part, on their consideration of these same arrangements and information received during the course of the year and in prior years.
The material considerations and determinations of the Board, including all of the Independent Trustees, are provided below.
In considering the nature, extent and quality of the services provided by the Adviser, the Board considered an oral presentation by the Adviser describing the portfolio management, shareholder communication, and regulatory compliance services provided by the Adviser to the Fund. Based on their review and discussions with management, the Trustees believe that the Adviser provides high quality services to the Fund, and they noted that their overall confidence in the Adviser is high. The Trustees also concluded that they were satisfied with the nature, extent and quality of the investment advisory services provided to the Fund by the Adviser, as the Adviser has worked to obtain good performance for the Fund, and performance has remained strong in recent periods, and that the nature and extent of the services provided by the Adviser are appropriate to ensure that the Fund’s operations are conducted in compliance with applicable laws, rules and regulations, as there have been no material compliance violations.
– 34 –
OCM GOLD FUND Annual Renewal of Investment Advisory Agreement (Continued)
(Unaudited) |
The Trustees compared the performance of the Fund to benchmark indices over various periods of time. The Adviser provided information regarding and led discussions of factors impacting the performance of the Fund, outlining current market conditions and explaining the Adviser’s expectations and strategies for the future. Based on this information and discussions with Mr. Orrell, the Fund’s portfolio manager, the Trustees concluded, within the context of their full deliberations, that the investment results that the Adviser had been able to achieve for the Fund were reasonable and support renewal of the investment advisory agreement, noting that the Adviser has historically been able to achieve positive performance for shareholders. The Trustees noted that the Fund adhered to its investment style.
In concluding that the advisory fees payable by the Fund were reasonable, the Trustees reviewed the profits realized by the Adviser, from its relationship with the Fund. They discussed in detail the profitability of the Adviser as it relates to the Fund, and they discussed the impact of the intermediary service fees on the profitability. The Trustees also considered the resources and revenues that the Adviser has put into managing and distributing the Fund and concluded that the level of profitability realized by the Adviser from its provision of services to the Fund is reasonable, and that the overall expense ratio and investment advisory fee were fair and within a reasonable range of industry averages. The Trustees determined that the Adviser has spent significant resources and time to maintain and improve the Fund, and that the Adviser has not recognized unreasonable profits.
As part of its analysis the Board considered the value of the research the Adviser received from broker-dealers executing securities transactions for the Fund. The Trustees concluded that the research obtained by the Adviser is beneficial to the Fund and that the Adviser had executed the Fund’s portfolio transactions in a manner designed to obtain best execution for the Fund. The Trustees determined such research has been used for legitimate purposes relating to the Fund by aiding in the investment decision-making process. The Trustees concluded that the other benefits realized by the Adviser from its relationship with the Fund were minimal and reasonable.
The Trustees also reviewed reports comparing the expense ratios of each class and advisory fees paid by the Fund to those paid by other comparable mutual funds in the same category and concluded that the advisory fees paid by the Fund and the expense ratios of each class of the Fund were within a reasonable range of comparable mutual funds. In making this conclusion, the Trustees also noted the unique expertise of the Adviser and that the Adviser does not currently engage any sub-advisers for the Fund. The Trustees also discussed the advisory fees payable by the Fund in relation to other advisory clients of the Adviser. The Trustees determined that they did not find anything to suggest that the fees charged to the Fund are unreasonable in comparison to other fees charged by the Adviser.
– 35 –
OCM GOLD FUND Annual Renewal of Investment Advisory Agreement (Continued)
(Unaudited) |
The Trustees concluded that the Fund has the right structure in place to continue to realize lower fees and expenses as asset levels continue to increase. The Trustees also considered whether the investment advisory agreement fee schedule should be adjusted for an increase in assets under management. They concluded that the existing “breakpoints” embodied in the investment advisory agreement would result in substantially lower fee rates than those of comparable mutual funds.
After reviewing the materials provided at the meeting, management’s presentation, as well as other information regularly provided at the Board’s quarterly meetings throughout the year regarding the quality of services provided by the Adviser, the performance of the Fund, expense information, regulatory compliance issues, trading information and related matters and other factors deemed relevant by the Board, the Trustees, including all of the Independent Trustees, determined to continue the investment advisory agreement.
– 36 –
OCM GOLD FUND Additional Fund Information
(Unaudited) |
Long Term Capital Gains Designation
Pursuant to IRC 852(b)(3) of the Code, OCM Gold Fund hereby designates $24,653 as long-term capital gains distributed during the year ended November 30, 2023.
Liquidity Risk Management Program
The Fund has adopted and implemented a written liquidity risk management program as required by Rule 22e-4 (the “Liquidity Rule”) under the 1940 Act. The program is reasonably designed to assess and manage the Fund’s liquidity risk, taking into consideration, among other factors, the Fund’s investment strategy and the liquidity of its portfolio investments during normal and reasonably foreseeable stressed conditions; its short and long-term cash flow projections; and its cash holdings and access to other funding sources. The Fund’s Board of Trustees approved the appointment of a Liquidity Program Administrator (“LPA”) comprised of the Trust’s Liquidity Risk Management Program Committee, which includes representatives from the Fund’s investment adviser, independent trustees and the Fund’s Chief Compliance Officer. The LPA is responsible for the program’s administration and oversight and for reporting to the Board on at least an annual basis regarding the program’s operation and effectiveness. The LPA updated its assessment of the Fund’s liquidity risk profile, considering additional data gathered in the 12 months ended May 31, 2023 and the adequacy and effectiveness of the liquidity risk management program’s operations since June 1, 2022 (the “Review Period”), in order to prepare a written report for the Board of Trustees (the “Report”) for consideration at its meeting held on July 25, 2023.
During the Review Period, the Fund did not experience unusual stress or disruption to its operations related to purchase and redemption activity. Also, during the Review Period, the Fund held adequate levels of cash and highly liquid investments to meet shareholder redemption activities in accordance with applicable requirements. The Fund did not have a significant amount of illiquid investments and did not require a determination as to a highly liquid investment minimum. The Report concluded that the Fund’s liquidity risk management program is reasonably designed to prevent violations of the Liquidity Rule and has been implemented effectively.
– 37 –
OCM GOLD FUND Trustee and Officer Information
(Unaudited) |
The business and affairs of the Fund are managed under the direction of the Board of Trustees. Information pertaining to the Trustees and Officers of the Fund is set forth below. The Fund’s Statement of Additional Information includes additional information about Trustees and is available, without charge, upon request by calling 1-800-779-4681.
Independent Trustees* |
Name, Address and Age | Position(s)
Held with Fund | Term of Office
and Length
of Service | Principal Occupation(s)
During Past 5 Years | Other
Directorships
Held by
Trustee or
Nominee
for Trustee |
Doug Webenbauer
2600 Kitty Hawk Road, Suite 119 Livermore, California 94551 Age 63 | Trustee | Indefinite
Since 2005 | Controller of Comtel Systems Technology, Inc., a low voltage electrical contractor, since 2016. Prior to that, Chief Financial Officer of M.E. Fox & Company, Inc., a beer distributor (2000 to 2016). | None |
Peter Hayman
2600 Kitty Hawk Road, Suite 119 Livermore, California 94551 Age 67 | Trustee | Indefinite
Since 2018 | Managing member of Anzus Capital, LLC, a corporate investment advisory firm specializing in Australasian companies, since 2005. Prior to that, Mr. Hayman held positions in institutional equity sales with investment firms ABN, AMRO, JP Morgan and Ord Minnett, since 1978. | None |
– 38 –
OCM GOLD FUND Trustee and Officer Information (Continued)
(Unaudited) |
Interested Trustees and Officers** |
Name, Address and Age | Position(s)
Held with Fund | Term of Office
and Length
of Service | Principal Occupation(s)
During Past 5 Years | Other
Directorships
Held by
Trustee or
Nominee
for Trustee |
Gregory M. Orrell
2600 Kitty Hawk Road, Suite 119 Livermore, California 94551 Age 62 | Trustee and President | Indefinite
Since 2004 | President of Orrell Capital Management, Inc. since 1991. | None |
Steven Orrell
2600 Kitty Hawk Road, Suite 119 Livermore, California 94551 Age 31 | Secretary and Treasurer | One year term
Since 2022 | Vice President of Orrell Capital Management, Inc. since 2022. Prior to that, Associate Athletics Director for Development – St Mary’s College (2022-2017) | N/A |
Emile Molineaux
2600 Kitty Hawk Road, Suite 119 Livermore, California 94551 Age 61 | Chief Compliance Officer and Anti-Money Laundering Officer | At discretion of the Board
Since 2018 | Senior Compliance Officer and CCO of various clients of Northern Lights Compliance Services, LLC (since 2011). | N/A |
* | “Independent” trustees are trustees who are not deemed to be “interested persons” of the Fund as defined in the 1940 Act. |
** | An “interested” trustee is a trustee who is deemed to be an “interested person” of the Fund, as defined in the 1940 Act. Gregory M. Orrell is an interested person of the Fund because of his ownership in the Fund’s investment adviser. |
– 39 –
THIS PAGE INTENTIONALLY LEFT BLANK
THIS PAGE INTENTIONALLY LEFT BLANK
OCM Gold Fund
Distributed by:
Northern Lights Distributors, LLC
225 Pictoria Drive, Suite 450
Cincinnati, OH 45246
3095-NLD-01/25/2024
(b) The Registrant did not disseminate any information to shareholders specified by paragraph (c)(3) of Rule 30e-3 under the Investment Company Act of 1940, as amended (the “Act”) (17 CFR 270.30e-3).
Item 2. Code of Ethics.
The registrant, as of the end of the period covered by this report, has adopted a code of ethics that applies to the Registrant’s principal executive officer, principal financial officer, principal accounting officer or controller, and persons performing similar functions, regardless of whether these individuals are employed by the Registrant or a third party. A copy of this code of ethics is attached hereto as Exhibit (a)(1).
There have been no amendments to the registrant’s code of ethics during the reporting period for this Form N-CSR. There have also been no waivers granted by the registrant to individuals covered by the registrant’s code of ethics during the reporting period for this Form N-CSR.
Item 3. Audit Committee Financial Expert.
(a)(1) The Registrant’s Board of Trustees has determined that the Registrant has at least one audit committee financial expert serving on its audit committee.
(a) (2) Mr. Doug Webenbauer is the audit committee financial expert. Mr. Webenbauer is “independent” under the applicable rules.
Item 4. Principal Accountant Fees and Services
(a) – (e)
The registrant has engaged its principal accountant to perform audit services and tax services during the past two fiscal years. "Audit services" refer to performing an audit of the registrant's annual financial statements or services that are normally provided by the accountant in connection with statutory and regulatory filings or engagements for those fiscal years. "Tax services" refer to professional services rendered by the principal accountant for tax compliance, tax advice, and tax planning. The following table details the aggregate fees billed or expected to be billed for each of the last two fiscal years for audit fees and tax fees by the principal accountant.
| | Fiscal year ended
November 30, 2023 | Fiscal year ended
November 30, 2022 |
| Audit Fees | $ 13,500 | $ 13,500 |
| Audit-Related Fees | $ 0 | $ 0 |
| Tax Fees | $ 2,500 | $ 2,500 |
| All Other Fees | $ 0 | $ 0 |
The registrant’s audit committee has adopted an Audit Committee Charter that requires that the Audit Committee review the scope and plan of the registered public accounting firm’s annual and interim examinations, approve the services (other than the annual audit) to be performed for the registrant by the independent public accountants and approve the fees and other compensation payable to the independent accountants. During the fiscal years ended November 30, 2023 and 2022, all of the audit and non-audit services provided by the registrant’s principal accountant were pre-approved by the audit committee.
(f) None.
(g) None.
(h) Not applicable.
(i) Not applicable.
(j) Not applicable.
Item 5. Audit Committee of Listed Registrants
Item 6. Schedule of Investments
| (a) | The schedules of investments in securities in unaffiliated issuers are included as part of the reports to shareholders filed under Item 1. |
Item 7. Disclosure of Proxy Voting Policies and Procedures for Closed-End Management Investment Companies
Not applicable.
Item 8. Portfolio Managers of Closed-End Management Investment Companies
Not applicable.
Item 9. Purchases of Equity Securities by Closed-End Management Investment Company and Affiliated Purchasers
Not applicable.
Item 10. Submissions of Matters to a Vote of Security Holders
Not applicable. As of the end of the period covered by this report, the registrant had not adopted any procedures by which shareholders may recommend nominees to the registrant’s Board of Directors.
Item 11. Controls and Procedures.
(a) The registrant's certifying officer has concluded that the registrant's disclosure controls and procedures (as defined in Rule 30a-2 under the Act) are effective in design and operation and are sufficient to form the basis of the certifications required by Rule 30a-2 under the Act, based on their evaluation of these disclosure controls and procedures within 90 days of the filing date of this report on Form N-CSR.
(b) There were no changes in the registrant’s internal control over financial reporting (as defined in Rule 30a-3(d) under the Act) that occurred during the period covered by this report that have materially affected, or are reasonably likely to materially affect, the registrant’s internal control over financial reporting.
Item 12. Disclosure of Securities Lending Activities for Closed-End Management Investment Companies.
Not applicable.
Item 13. Exhibits.
(a)(1) Code of Ethics – Filed herewith.
(a)(2) Certification for each principal executive and principal financial officer of the registrant as required by Rule 30a-2 under the Act (17 CFR 270.30a-2(a)) – Filed herewith.
(a)(3) Any written solicitation to purchase securities under Rule 23c-1 under the Act sent or given during the period covered by the report by or on behalf of the registrant to 10 or more persons. Not applicable to open-end investment companies.
(a)(4) Change in the registrant’s independent public accountant – Not applicable.
(b) Certifications required by Rule 30a-2(b) under the Act (17 CFR 270.30a-2(b)), Rule 13a-14(b) or Rule 15d-14(b) under the Securities Exchange Act of 1934, as amended (17 CFR 240.13a-14(b), or 240.15d-14(b)), and Section 1350 of Chapter 63 of Title 18 of the United States Code (18 U.S.C. 1350) – Furnished herewith.
SIGNATURES
Pursuant to the requirements of the Securities Exchange Act of 1934 and the Investment Company Act of 1940, the registrant has duly caused this report to be signed on its behalf by the undersigned, thereunto duly authorized.
OCM Mutual Fund
| By: | /s/ Gregory M. Orrell | |
| | Gregory M. Orrell | |
| | President | |
Date: January 31, 2024
Pursuant to the requirements of the Securities Exchange Act of 1934 and the Investment Company Act of 1940, this report has been signed below by the following persons on behalf of the registrant and in the capacities and on the dates indicated.
| By: | /s/ Steven Orrell | |
| | Steven Orrell | |
| | Secretary and Treasurer | |
Date: January 31, 2024