UNITED STATES
SECURITIES AND EXCHANGE COMMISSION
Washington, D.C. 20549
FORM N-CSR
CERTIFIED SHAREHOLDER REPORT OF REGISTERED MANAGEMENT INVESTMENT COMPANIES
Investment Company Act file number
(Exact name of registrant as specified in charter)
2600 Kitty Hawk Road
Suite 119
Livermore, CA 94551
(Address of principal executive offices) (Zip code)
Gregory M. Orrell
Orrell Capital Management, Inc
2600 Kitty Hawk Road
Suite 119
Livermore, CA 94551
(Name and address of agent for service)
Registrant's telephone number, including area code:
Date of reporting period:
Item 1. Reports to Stockholders.
OCM Gold Fund
Atlas Class/OCMAX
SEMI-ANNUAL SHAREHOLDER REPORT | May 31, 2024
This semi-annual shareholder report contains important information about the OCM Gold Fund (“Fund”) for the period of December 1, 2023 to May 31, 2024. You can find additional information about the Fund at https://ocmgoldfund.com. You can also request this information by contacting us at 1-800-628-9403.
Fund Expenses
(Based on a hypothetical $10,000 investment)
| Fund (Class) | Costs of a $10,000 investment | Costs paid as a percentage
of a $10,000 investment |
OCM Gold Fund
(Atlas Class/OCMAX) | $109 | 1.98% |
Management’s Discussion of Fund Performance
SUMMARY OF RESULTS
Over the six-month fiscal period ending May 31, 2024, the OCM Gold Fund’s Atlas Class gained 20.21%, compared to a 22.79% increase in the Philadelphia Gold and Silver Index (“XAU”) and a 16.35% gain for the S&P 500 Index. The price of gold bullion closed the six-month fiscal period at $2,345.80 based on the London PM Fix up 13.48% for the six-month fiscal period ending May 31, 2024. The OCM Gold Fund’s investment strategy is to invest across all market capitalization sectors of the gold and silver mining industry, including major, intermediate, and junior producers along with exploration and development companies. This strategy has led to the Fund’s outperformance of the XAU over longer periods but fell slightly short over the six-month fiscal period ending May 31, 2024.
TOP PERFORMANCE CONTRIBUTORS
Aya Gold & Silver, Inc. | Aya Gold & Silver, Inc.’s share price rose 50.55% during the six-month period on the back of stronger silver prices as the company’s major expansion of its silver mine in Morocco drew closer to mid-year completion. Aya Gold & Silver represented 12.53% of the Fund’s portfolio as of May 31, 2024.
Agnico Eagle Mines Ltd. | Agnico Eagle Mines Ltd.’s share price rose 27.02% over the report period. The strongest performance of the major gold producers. The company’s strong operating results and lower perceived geopolitical risk helped lead to the outperformance of its peers. Agnico Eagle Mines represented 7.71% of the Fund’s portfolio as of May 31, 2024.
Jaguar Mining, Inc. | Jaguar Mining, Inc. announced a high-grade discovery at its Pilar mine that helped lift the company’s share price from deep value levels. Jaguar’s share price rose 41.83% over the report period. Further, the first of the company’s growth projects is scheduled to come on stream in the second half of 2024. Jaguar Mining represented 5.60 % of the Fund’s portfolio as of May 31, 2024.
Alamos Gold, Inc. | Alamos Gold, Inc. has proven to be the top intermediate gold producer with a focus on growing its multi-mine portfolio in Canada. Over the report period, Alamos’ share price rose 12.83% as it announced the synergistic acquisition of Argonaut Gold Mine’s Magino gold mine located adjacent to Alamos’ Island gold mine. Alamos Gold represented 8.72% of the Fund’s portfolio as of May 31, 2024.
TOP PERFORMANCE DETRACTORS
SSR Mining, Inc. | SSR Mining, Inc. suffered a major heap leach pad failure at its Copler mine in Turkey. The SSR Mining share price collapsed 54% on the news. At the time of the share price decline, the Fund's shareholding represented 2.77% of the Fund. The Fund exited its SSR Mining position entirely during the period to hold zero shares as of May 31, 2024.
B2Gold Corp. | B2Gold Corp.’s share price suffered a 17.16% decline over the report period as Mali political uncertainty combined with capital cost escalation at its Goose Lake mine under construction weighed on investor sentiment. B2Gold represented 1.47% of the Fund as of May 31, 2024.
Endeavour Mining PLC | Endeavour Mining PLC’s share price declined 7.04% over the reporting period. The company’s CEO was dismissed at a time when investors grew cautious over West African gold producers in general. Endeavour Mining represented 4.47% of the Fund as of May 31, 2024.
Barrick Gold Corp. | Barrick Gold Corp.’s share price underperformed the gold price in the six months ending May 31, 2024 declining 2.84%. Static to declining production in the short-term weighed on the share price along with the company’s higher risk geopolitical risk profile. The Fund held a 5.92% position in Barrick Gold as a percentage of the portfolio as of May 31, 2024.
Fund Performance
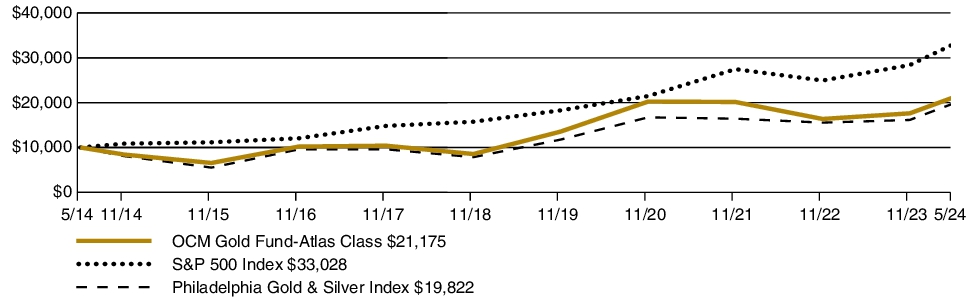
The following graph and chart compare the initial and subsequent account values at the end of each of the most recently completed 10 fiscal years of the Fund. It assumes a $10,000 initial investment at the beginning of the first fiscal year in an appropriate, broad-based securities market index for the same period.
GROWTH OF $10,000
| AVERAGE ANNUAL TOTAL RETURN | 6 Months | 1 Year | 5 Years | 10 Years |
| OCM Gold Fund (Atlas Class/OCMAX)—excluding sales load | 20.21% | 21.16% | 16.34% | 7.79% |
| S&P 500 Index | 16.35% | 28.19% | 15.80% | 12.69% |
| Philadelphia Gold & Silver Index | 22.79% | 24.48% | 18.22% | 7.08% |
Keep in mind that the Fund’s past performance is not a good predictor of how the Fund will perform in the future.
The graph and table do not reflect the deduction of taxes that a shareholder would pay on Fund distributions or redemption of Fund shares.
Visit https://ocmgoldfund.com for the most recent performance information.
Key Fund Statistics
The following table outlines key fund statistics that you should pay attention to.
| Fund net assets | $57.5M% |
| Total number of portfolio holdings | $39% |
| Total advisory fee paid | $236,897% |
| Portfolio turnover rate as of the end of the reporting period | $0% |
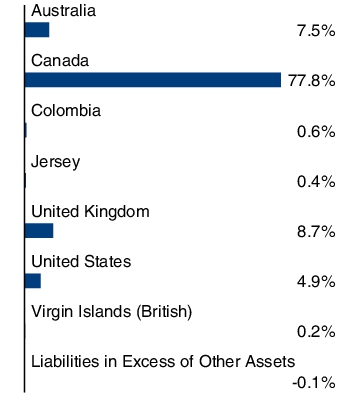
Graphical Representation of Holdings
The tables below show the investment makeup of the Fund, representing percentage of the total net assets of the Fund. The Top Ten Holdings and Industry Allocation exclude short-term holdings, if any.
| Aya Gold & Silver, Inc. | 12.6% |
| Alamos Gold, Inc. | 8.7% |
| Agnico Eagle Mines Ltd. | 7.7% |
| Wheaton Precious Metals Corp. | 7.6% |
| Barrick Gold Corp. | 6.0% |
| Wesdome Gold Mines Ltd. | 5.9% |
| Jaguar Mining, Inc. | 5.5% |
| Newmont Corp. | 4.7% |
| Endeavour Mining PLC | 4.5% |
| AngloGold Ashanti Ltd. ADR | 4.2% |
Material Fund Changes
The Fund did not have any material changes that occurred since the beginning of the reporting period.
Changes in and Disagreements with Accountants
There were no changes in or disagreements with the Fund's accountants during the reporting period.
Availability of Additional Information
You can find additional information about the Fund such as the prospectus, financial information, fund holdings and proxy voting information at https://ocmgoldfund.com. You can also request this information by contacting us at 1-800-628-9403.
Householding
In order to reduce expenses, we will deliver a single copy of prospectuses, proxies, financial reports and other communication to shareholders with the same residential address, provided they have the same last name, or we reasonably believe them to be members of the same family. Unless we are notified otherwise, we will continue to send recipients only one copy of these materials for as long as they remain a shareholder of the Fund. If you would like to receive individual mailings, please call 1-800-628-9403 and we will begin sending you separate copies of these materials within 30 days after receiving your request.
The Fund's distributor is Northern Lights Distributors, LLC.
For additional information, please scan the QR code at right to navigate to additional hosted material at https://ocmgoldfund.com.
OCM Gold Fund
Investor Class/OCMGX
SEMI-ANNUAL SHAREHOLDER REPORT | May 31, 2024
This semi-annual shareholder report contains important information about the OCM Gold Fund (“Fund”) for the period of December 1, 2023 to May 31, 2024. You can find additional information about the Fund at https://ocmgoldfund.com. You can also request this information by contacting us at 1-800-628-9403.
Fund Expenses
(Based on a hypothetical $10,000 investment)
| Fund (Class) | Costs of a $10,000 investment | Costs paid as a percentage
of a $10,000 investment |
OCM Gold Fund
(Investor Class/OCMGX) | $136 | 2.48% |
Management’s Discussion of Fund Performance
SUMMARY OF RESULTS
Over the six-month fiscal period ending May 31, 2024, the OCM Gold Fund’s Investor Class gained 19.88% (14.50% after maximum sales load) compared to a 22.79% increase in the Philadelphia Gold and Silver Index (“XAU”) and a 16.35% gain for the S&P 500 Index. The price of gold bullion closed the six-month fiscal period at $2,345.80 based on the London PM Fix up 13.48% for the six-month fiscal period ending May 31, 2024. The OCM Gold Fund’s investment strategy is to invest across all market capitalization sectors of the gold and silver mining industry, including major, intermediate, and junior producers along with exploration and development companies. This strategy has led to the Fund’s outperformance of the XAU over longer periods but fell slightly short over the six-month fiscal period ending May 31, 2024.
TOP PERFORMANCE CONTRIBUTORS
Aya Gold & Silver, Inc. | Aya Gold & Silver, Inc.’s share price rose 50.55% during the six-month period on the back of stronger silver prices as the company’s major expansion of its silver mine in Morocco drew closer to mid-year completion. Aya Gold & Silver represented 12.53% of the Fund’s portfolio as of May 31, 2024.
Agnico Eagle Mines Ltd. | Agnico Eagle Mines Ltd.’s share price rose 27.02% over the report period. The strongest performance of the major gold producers. The company’s strong operating results and lower perceived geopolitical risk helped lead to the outperformance of its peers. Agnico Eagle Mines represented 7.71% of the Fund’s portfolio as of May 31, 2024.
Jaguar Mining, Inc. | Jaguar Mining, Inc. announced a high-grade discovery at its Pilar mine that helped lift the company’s share price from deep value levels. Jaguar’s share price rose 41.83% over the report period. Further, the first of the company’s growth projects is scheduled to come on stream in the second half of 2024. Jaguar Mining represented 5.60 % of the Fund’s portfolio as of May 31, 2024.
Alamos Gold, Inc. | Alamos Gold, Inc. has proven to be the top intermediate gold producer with a focus on growing its multi-mine portfolio in Canada. Over the report period, Alamos’ share price rose 12.83% as it announced the synergistic acquisition of Argonaut Gold Mine’s Magino gold mine located adjacent to Alamos' Island gold mine. Alamos Gold represented 8.72% of the Fund’s portfolio as of May 31, 2024.
TOP PERFORMANCE DETRACTORS
SSR Mining, Inc. | SSR Mining, Inc. suffered a major heap leach pad failure at its Copler mine in Turkey. The SSR Mining share price collapsed 54% on the news. At the time of the share price decline, the Fund's shareholding represented 2.77% of the Fund. The Fund exited its SSR Mining position entirely during the period to hold zero shares as of May 31, 2024
B2Gold Corp. | B2Gold Corp.’s share price suffered a 17.16% decline over the report period as Mali political uncertainty combined with capital cost escalation at its Goose Lake mine under construction weighed on investor sentiment. B2Gold represented 1.47% of the Fund as of May 31, 2024.
Endeavour Mining PLC | Endeavour Mining PLC’s share price declined 7.04% over the reporting period. The company’s CEO was dismissed at a time when investors grew cautious over West African gold producers in general. Endeavour Mining represented 4.47% of the Fund as of May 31, 2024.
Barrick Gold Corp. | Barrick Gold Corp.’s share price underperformed the gold price in the six months ending May 31, 2024 declining 2.84%. Static to declining production in the short-term weighed on the share price along with the company’s higher risk geopolitical risk profile. The Fund held a 5.92% position in Barrick Gold as a percentage of the portfolio as of May 31, 2024.
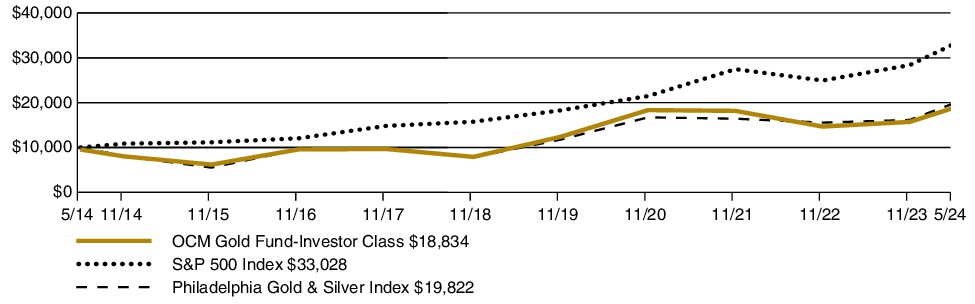
Fund Performance
The following graph and chart compare the initial and subsequent account values at the end of each of the most recently completed 10 fiscal years of the Fund. It assumes a $10,000 initial investment at the beginning of the first fiscal year in an appropriate, broad-based securities market index for the same period.
GROWTH OF $10,000
| AVERAGE ANNUAL TOTAL RETURN | 6 Months | 1 Year | 5 Years | 10 Years |
| OCM Gold Fund (Investor Class/OCMGX) | 14.50% | 15.05% | 14.51% | 6.54% |
| OCM Gold Fund (Investor Class/OCMGX)—excluding sales load | 19.88% | 20.48% | 15.58% | 7.03% |
| S&P 500 Index | 16.35% | 28.19% | 15.80% | 12.69% |
| Philadelphia Gold & Silver Index | 22.79% | 24.48% | 18.22% | 7.08% |
Keep in mind that the Fund’s past performance is not a good predictor of how the Fund will perform in the future.
The graph and table do not reflect the deduction of taxes that a shareholder would pay on Fund distributions or redemption of Fund shares.
Visit https://ocmgoldfund.com for the most recent performance information.
Key Fund Statistics
The following table outlines key fund statistics that you should pay attention to.
| Fund net assets | $57.5M% |
| Total number of portfolio holdings | $39% |
| Total advisory fee paid | $236,897% |
| Portfolio turnover rate as of the end of the reporting period | $0% |
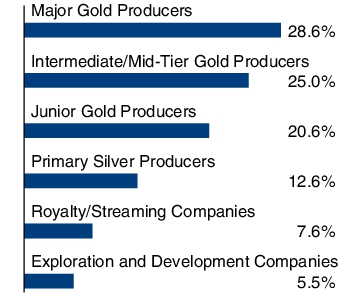
Graphical Representation of Holdings
The tables below show the investment makeup of the Fund, representing percentage of the total net assets of the Fund. The Top Ten Holdings and Industry Allocation exclude short-term holdings, if any.
| Aya Gold & Silver, Inc. | 12.6% |
| Alamos Gold, Inc. | 8.7% |
| Agnico Eagle Mines Ltd. | 7.7% |
| Wheaton Precious Metals Corp. | 7.6% |
| Barrick Gold Corp. | 6.0% |
| Wesdome Gold Mines Ltd. | 5.9% |
| Jaguar Mining, Inc. | 5.5% |
| Newmont Corp. | 4.7% |
| Endeavour Mining PLC | 4.5% |
| AngloGold Ashanti Ltd. ADR | 4.2% |
Material Fund Changes
The Fund did not have any material changes that occurred since the beginning of the reporting period.
Changes in and Disagreements with Accountants
There were no changes in or disagreements with the Fund's accountants during the reporting period.
Availability of Additional Information
You can find additional information about the Fund such as the prospectus, financial information, fund holdings and proxy voting information at https://ocmgoldfund.com. You can also request this information by contacting us at 1-800-628-9403.
Householding
In order to reduce expenses, we will deliver a single copy of prospectuses, proxies, financial reports and other communication to shareholders with the same residential address, provided they have the same last name, or we reasonably believe them to be members of the same family. Unless we are notified otherwise, we will continue to send recipients only one copy of these materials for as long as they remain a shareholder of the Fund. If you would like to receive individual mailings, please call 1-800-628-9403 and we will begin sending you separate copies of these materials within 30 days after receiving your request.
The Fund's distributor is Northern Lights Distributors, LLC.
For additional information, please scan the QR code at right to navigate to additional hosted material at https://ocmgoldfund.com.
Item 2. Code of Ethics.
Not applicable to semi-annual reports.
Item 3. Audit Committee Financial Expert.
Not applicable to semi-annual reports.
Item 4. Principal Accountant Fees and Services.
Not applicable to semi-annual reports.
Item 5. Audit Committee of Listed Registrants.
Not applicable to semi-annual reports.
Item 6. Investments.
| (a) | Investments in securities in unaffiliated issuers are included as part of the financial statements filed under Item 7. |
Item 7. Financial Statements and Financial Highlights for Open-End Management Investment Companies.

Financial Statements
May 31, 2024
(Unaudited)
OCM GOLD FUND Table of Contents – May 31, 2024
|
| Pages |
Item 7. | |
Schedule of Investments | 1-2 |
Statement of Assets and Liabilities | 3 |
Statement of Operations | 4 |
Statements of Changes in Net Assets | 5-6 |
Financial Highlights | 7-8 |
Notes to Financial Statements | 9-18 |
OCM GOLD FUND Schedule of Investments – May 31, 2024
(Unaudited) |
| | Shares | | | |
Value
| |
COMMON STOCKS 99.9% | | | | |
Major Gold Producers 28.6% | | | | |
| | | 65,000 | | Agnico Eagle Mines Ltd. | | $ | 4,433,650 | |
| | | 100,000 | | AngloGold Ashanti PLC | | | 2,419,000 | |
| | | 300,000 | | B2Gold Corp.^ | | | 845,195 | |
| | | 200,000 | | Barrick Gold Corp. | | | 3,418,000 | |
| | | 118,670 | | Endeavour Mining PLC | | | 2,576,262 | |
| | | 65,000 | | Newmont Corp. | | | 2,726,100 | |
| | | | | | | | 16,418,207 | |
Intermediate/Mid-Tier Gold Producers 25.0% |
| | | 300,000 | | Alamos Gold, Inc. | | | 5,013,000 | |
| | | 250,000 | | Dundee Precious Metals, Inc. | | | 2,063,463 | |
| | | 225,000 | | Fortuna Silver Mines, Inc.* | | | 1,409,758 | |
| | | 130,000 | | Lundin Gold, Inc. | | | 1,919,956 | |
| | | 500,000 | | OceanaGold Corp. | | | 1,148,202 | |
| | | 70,000 | | Pan American Silver Corp. | | | 1,540,000 | |
| | | 800,000 | | Perseus Mining Ltd. | | | 1,250,832 | |
| | | | | | | | 14,345,211 | |
Junior Gold Producers 20.6% | | | | |
| | | 1,464,110 | | Catalyst Metals Ltd.* | | | 1,076,408 | |
| | | 800,000 | | Emerald Resources N.L.* | | | 1,980,040 | |
| | | 150,000 | | i-80 Gold Corp.* | | | 163,976 | |
| | | 1,659,900 | | Jaguar Mining, Inc.* | | | 3,154,175 | |
| | | 175,000 | | K92 Mining, Inc.* | | | 978,357 | |
| | | 1,000,000 | | Minera Alamos, Inc.* | | | 286,134 | |
| | | 450,000 | | Mineros S.A. | | | 373,074 | |
| | | 500,000 | | Orezone Gold Corp.* | | | 264,123 | |
| | | 800,000 | | Thor Explorations Ltd.* | | | 155,539 | |
| | | 415,000 | | Wesdome Gold Mines Ltd.* | | | 3,385,767 | |
| | | | | | | | 11,817,593 | |
| | | | | | | | | |
Exploration and Development Companies 5.5% |
| | | 350,000 | | Angel Wing Metals, Inc.* | | | 32,098 | |
| | | 250,000 | | G Mining Ventures Corp.* | | | 383,346 | |
| | | 250,000 | | G2 Goldfields, Inc.* | | | 251,284 | |
| | | 875,000 | | Liberty Gold Corp.* | | | 234,318 | |
| | | 616,500 | | Montage Gold Corp.* | | | 655,851 | |
| | | 5,000,000 | | Omai Gold Mines Corp.* | | | 513,573 | |
| | | 1,758,000 | | Rio2 Ltd.* | | | 683,595 | |
| | | 3,000,000 | | Royal Road Minerals Ltd.* | | | 242,113 | |
| | | 4,578,755 | | RTG Mining, Inc.* | | | 134,042 | |
| | | 2,512,040 | | Sutter Gold Mining, Inc.* # | | | — | |
| | | 1,210,500 | | Tajiri Resources Corp.* | | | 42,185 | |
| | | 105,500 | | Westhaven Gold Corp.* | | | 17,803 | |
| | | | | | | | 3,190,208 | |
Royalty/Streaming Companies 7.6% |
| | | 80,000 | | Wheaton Precious Metals Corp. | | | 4,381,511 | |
| | | | | | | | | |
Primary Silver Producers 12.6% | | | | |
| | | 660,000 | | Aya Gold & Silver, Inc.* | | | 7,268,232 | |
| | | | | | | | | |
Total Common Stocks | | | | |
| | | | | (Cost $23,060,067) | | | 57,420,962 | |
See notes to financial statements.
– 1 –
OCM GOLD FUND Schedule of Investments – May 31, 2024 (Continued)
(Unaudited) |
| | Shares | | | |
| | |
Value
| |
WARRANTS 0.0% |
Exploration and Development Companies 0.0% |
| | | 175,000 | | Angel Wing Metals, Inc. Exercise Price: 0.50 CAD, Expiration Date: April 26, 2025* | | $ | — | |
| | | | | | | | — | |
| Total Warrants |
| | | | | (Cost $0) | | | — | |
| | | | | | | | | |
SHORT-TERM INVESTMENT 0.2% |
| | | 109,136 | | UMB Money Market Fiduciary, 0.01% | | | 109,136 | |
| Total Short-Term Investment |
| | | | | (Cost $109,136) | | | 109,136 | |
| | | | | | | | |
Total Investments |
| | | | | (Cost $23,169,203) | | | 100.1 | % | | $ | 57,530,098 | |
Liabilities less Other Assets | | | (0.1 | )% | | | (79,461 | ) |
TOTAL NET ASSETS | | | 100.0 | % | | $ | 57,450,637 | |
ADR – American Depository Receipt
PLC – Public Limited Company
CAD – Canadian Dollars
^ | Denoted investment is a Canadian security traded on U.S. stock exchange. |
* | Non-income producing security. |
# | Level 3 security fair valued under procedures established by the Board of Trustees, represents 0.00% of Net Assets. The total value of this security is $0. |
See notes to financial statements.
– 2 –
OCM GOLD FUND Statement of Assets and Liabilities – May 31, 2024
(Unaudited) |
Assets: | | | | |
Investments in unaffiliated issuers, at value (cost $23,169,203) | | $ | 57,530,098 | |
Receivable for fund shares sold | | | 1,500 | |
Interest and dividends receivable | | | 55,642 | |
Reclaims receivable | | | 341 | |
Prepaid expenses and other assets | | | 37,670 | |
Total assets | | | 57,625,251 | |
| | | | | |
Liabilities: | | | | |
Payable for fund shares redeemed | | | 20,213 | |
Investment adviser fees | | | 45,556 | |
Accrued distribution fees | | | 21,608 | |
Accrued fund administration and accounting fees | | | 18,185 | |
Accrued legal fees | | | 15,810 | |
Accrued transfer agent fees and expenses | | | 15,153 | |
Accrued Chief Compliance Officer fees | | | 11,948 | |
Accrued report to shareholders | | | 9,116 | |
Accrued audit fees | | | 8,000 | |
Accrued Trustees’ fees | | | 2,490 | |
Accrued expenses and other liabilities | | | 6,535 | |
Total liabilities | | | 174,614 | |
Net Assets | | $ | 57,450,637 | |
| | | | | |
Net Assets Consist of: | | | | |
Shares of beneficial interest, no par value: unlimited shares authorized | | $ | 23,195,676 | |
Total distributable earnings | | | 34,254,961 | |
Net Assets | | $ | 57,450,637 | |
| | | | | |
Calculation of Maximum Offering Price: | | | | |
Investor Class: | | | | |
Net asset value and redemption price per share | | $ | 12.00 | |
Maximum sales charge (4.50% of offering price) | | | 0.57 | |
Offering price to public | | $ | 12.57 | |
Net assets applicable to shares outstanding | | $ | 12,098,535 | |
Shares outstanding | | | 1,007,876 | |
Atlas Class: | | | | |
Net asset value and redemption price per share | | $ | 13.74 | |
Net assets applicable to shares outstanding | | $ | 45,352,102 | |
Shares outstanding | | | 3,300,712 | |
Total Shares Outstanding | | | 4,308,588 | |
See notes to financial statements.
– 3 –
OCM GOLD FUND Statement of Operations – Six Months Ended May 31, 2024
(Unaudited) |
Investment Income | | | | |
Interest | | $ | 4 | |
Dividend (net of foreign withholding taxes of $34,143) | | | 299,295 | |
Total investment income | | | 299,299 | |
| | | | | |
Expenses | | | | |
Investment advisory fees | | | 236,897 | |
Transfer agent fees and expenses | | | 55,612 | |
Fund administration and accounting fees | | | 54,608 | |
Distribution fees - Investor Class | | | 35,065 | |
Distribution fees - Atlas Class | | | 29,313 | |
Federal and state registration fees | | | 27,002 | |
Legal fees | | | 22,592 | |
Chief Compliance Officer fees | | | 14,031 | |
Custody fees | | | 12,261 | |
Reports to shareholders | | | 10,832 | |
Audit fees | | | 8,000 | |
Trustees’ fees | | | 6,298 | |
Other expenses | | | 8,070 | |
Total expenses | | | 520,581 | |
Net investment loss | | | (221,282 | ) |
| | | | | |
Realized and Unrealized Gain (Loss) on Investments: | | | | |
Net realized gain on investments and foreign currency transactions | | | 1,682,626 | |
Net change in unrealized appreciation/depreciation on investments and foreign currency translations | | | 8,026,534 | |
Net gain on investments | | | 9,709,160 | |
| | | | | |
Net increase in net assets from operations | | $ | 9,487,878 | |
See notes to financial statements.
– 4 –
OCM GOLD FUND Statements of Changes in Net Assets
|
| | | Six Months Ended
May 31, 2024
(Unaudited) | | | Year Ended
November 30,
2023 | |
Operations: | | | | | | | | |
Net investment loss | | $ | (221,282 | ) | | $ | (316,486 | ) |
Net realized gain (loss) on investments and foreign currency transactions | | | 1,682,626 | | | | (169,098 | ) |
Net change in unrealized appreciation/depreciation on investments and foreign currency transactions | | | 8,026,534 | | | | 4,081,314 | |
Net increase in net assets from operations | | | 9,487,878 | | | | 3,595,730 | |
| | | | | | | | | |
Distributions Paid to Shareholders | | | | | | | | |
Distributions: | | | | | | | | |
Investor Class | | | — | | | | (5,934 | ) |
Atlas Class | | | — | | | | (18,719 | ) |
Total | | | — | | | | (24,653 | ) |
| | | | | | | | | |
Fund Share Transactions | | | | | | | | |
Investor Class: | | | | | | | | |
Net proceeds from shares sold | | | 145,787 | | | | 641,876 | |
Distributions reinvested | | | — | | | | 5,127 | |
Payment of shares redeemed1 | | | (1,360,814 | ) | | | (1,824,281 | ) |
Net decrease in net assets from Investor Class share transactions | | | (1,215,027 | ) | | | (1,177,278 | ) |
| | | | | | | | | |
Atlas Class: | | | | | | | | |
Net proceeds from shares sold | | | 2,781,794 | | | | 3,924,782 | |
Distributions reinvested | | | — | | | | 17,556 | |
Payment of shares redeemed2 | | | (5,158,724 | ) | | | (8,207,195 | ) |
Net decrease in net assets from Atlas Class share transactions | | | (2,376,930 | ) | | | (4,264,857 | ) |
Net decrease in net assets from Fund share transactions | | | (3,591,957 | ) | | | (5,442,135 | ) |
| | | | | | | | | |
Total increase (decrease) in net assets | | | 5,895,921 | | | | (1,871,058 | ) |
| | | | | | | | | |
Net Assets, Beginning of Period | | | 51,554,716 | | | | 53,425,774 | |
Net Assets, End of Period | | $ | 57,450,637 | | | $ | 51,554,716 | |
See notes to financial statements.
– 5 –
OCM GOLD FUND Statements of Changes in Net Assets (Continued)
|
| | | Six Months Ended
May 31, 2024
(Unaudited) | | | Year Ended
November 30,
2023 | |
Transactions in shares | | | | | |
Investor Class: | | | | | |
Shares sold | | | 13,993 | | | | 63,579 | |
Shares issued on reinvestment of distributions | | | — | | | | 549 | |
Shares redeemed | | | (133,345 | ) | | | (193,272 | ) |
Net decrease in Investor Class shares outstanding | | | (119,352 | ) | | | (129,144 | ) |
| | | | | | | | | |
Atlas Class: | | | | | | | | |
Shares sold | | | 232,005 | | | | 352,703 | |
Shares issued on reinvestment of distributions | | | — | | | | 1,658 | |
Shares redeemed | | | (455,848 | ) | | | (755,190 | ) |
Net decrease in Atlas Class shares outstanding | | | (223,843 | ) | | | (400,829 | ) |
Net Decrease in Fund Shares Outstanding | | | (343,195 | ) | | | (529,973 | ) |
1 | Net of redemption fees of $11 for the six months ended May 31, 2024 and $416 for the year ended November 30, 2023, respectively. |
2 | Net of redemption fees of $9,711 for the six months ended May 31, 2024 and $8,124 for the year ended November 30, 2023, respectively. |
See notes to financial statements.
– 6 –
OCM GOLD FUND Financial Highlights Investor Class
|
| | | Six Months
Ended
May 31,
2024
(Unaudited) | | | Year
Ended
Nov. 30,
2023 | | | Year
Ended
Nov. 30,
2022 | | | Year
Ended
Nov. 30,
2021 | | | Year
Ended
Nov. 30,
2020 | | | Year
Ended
Nov. 30,
2019 | |
| | | | | | | | | | | | | | | | | | | | | | | | | |
Per Share Operating Performance | | | | | | | | | | | | | | | | | | | | | | | | |
(For a share outstanding throughout each period) | | | | | | | | | | | | | | | | | | | | | | | | |
| | | | | | | | | | | | | | | | | | | | | | | | | |
Net asset value, beginning of period | | $ | 10.01 | | | $ | 9.35 | | | $ | 11.71 | | | $ | 11.94 | | | $ | 8.62 | | | $ | 7.05 | |
| | | | | | | | | | | | | | | | | | | | | | | | | |
Income from Investment Operations: | | | | | | | | | | | | | | | | | | | | | | | | |
Net investment loss1 | | | (0.06 | ) | | | (0.10 | ) | | | (0.08 | ) | | | (0.11 | ) | | | (0.16 | ) | | | (0.14 | ) |
Net realized and unrealized gain (loss) on investments and foreign currency transactions | | | 2.05 | | | | 0.76 | | | | (2.16 | ) | | | 0.01 | | | | 4.05 | | | | 3.37 | |
Net increase from payments by affiliates (Note 3) | | | — | | | | — | | | | — | | | | — | | | | — | 2 | | | — | |
Total from investment operations | | | 1.99 | | | | 0.66 | | | | (2.24 | ) | | | (0.10 | ) | | | 3.89 | | | | 3.23 | |
| | | | | | | | | | | | | | | | | | | | | | | | | |
Less Distributions: | | | | | | | | | | | | | | | | | | | | | | | | |
Dividends from net investment income | | | — | | | | — | | | | — | | | | (0.08 | ) | | | — | | | | — | |
Distribution from net realized gains | | | — | | | | — | 2 | | | (0.12 | ) | | | (0.05 | ) | | | (0.57 | ) | | | (1.66 | ) |
Total distributions | | | — | | | | — | 2 | | | (0.12 | ) | | | (0.13 | ) | | | (0.57 | ) | | | (1.66 | ) |
| | | | | | | | | | | | | | | | | | | | | | | | | |
Redemption fee proceeds1 | | | — | 2 | | | — | 2 | | | — | 2 | | | — | 2 | | | — | 2 | | | — | 2 |
| | | | | | | | | | | | | | | | | | | | | | | | | |
Net asset value, end of period | | $ | 12.00 | | | $ | 10.01 | | | $ | 9.35 | | | $ | 11.71 | | | $ | 11.94 | | | $ | 8.62 | |
| | | | | | | | | | | | | | | | | | | | | | | | | |
Total return* | | | 19.88 | %3 | | | 7.11 | % | | | (19.25 | )% | | | (0.95 | )% | | | 48.15 | % | | | 56.65 | % |
| | | | | | | | | | | | | | | | | | | | | | | | | |
Ratios/Supplemental Data: | | | | | | | | | | | | | | | | | | | | | | | | |
Net assets, end of year (in 000’s) | | $ | 12,099 | | | $ | 11,283 | | | $ | 11,747 | | | $ | 17,024 | | | $ | 18,343 | | | $ | 22,467 | |
Ratio of expenses to average net assets | | | 2.48 | %4 | | | 2.44 | % | | | 2.32 | % | | | 2.19 | % | | | 2.29 | % | | | 2.91 | % |
Ratio of net investment loss to average net assets | | | (1.28 | )%4 | | | (0.99 | )% | | | (0.80 | )% | | | (0.89 | )% | | | (1.53 | )% | | | (1.89 | )% |
Portfolio turnover rate | | | — | %3 | | | 3 | % | | | 9 | % | | | 11 | % | | | 1 | % | | | 18 | % |
1 | Based on average shares method. |
2 | Amount represents less than $0.01 per share. |
See notes to financial statements.
– 7 –
OCM GOLD FUND Financial Highlights Atlas Class
|
| | | Six Months
Ended
May 31,
2024
(Unaudited) | | | Year
Ended
Nov. 30,
2023 | | | Year
Ended
Nov. 30,
2022 | | | Year
Ended
Nov. 30,
2021 | | | Year
Ended
Nov. 30,
2020 | | | Year
Ended
Nov. 30,
2019 | |
| | | | | | | | | | | | | | | | | | | | | | | | | |
Per Share Operating Performance | | | | | | | | | | | | | | | | | | | | | | | | |
(For a share outstanding throughout each period) | | | | | | | | | | | | | | | | | | | | | | | | |
| | | | | | | | | | | | | | | | | | | | | | | | | |
Net asset value, beginning of period | | $ | 11.43 | | | $ | 10.62 | | | $ | 13.21 | | | $ | 13.46 | | | $ | 9.57 | | | $ | 7.58 | |
| | | | | | | | | | | | | | | | | | | | | | | | | |
Income from Investment Operations: | | | | | | | | | | | | | | | | | | | | | | | | |
Net investment loss1 | | | (0.05 | ) | | | (0.05 | ) | | | (0.04 | ) | | | (0.05 | ) | | | (0.13 | ) | | | (0.11 | ) |
Net realized and unrealized gain (loss) on investments and foreign currency transactions | | | 2.36 | | | | 0.86 | | | | (2.44 | ) | | | — | | | | 4.54 | | | | 3.71 | |
Net increase from payments by affiliates (Note 3) | | | — | | | | — | | | | — | | | | — | | | | — | 2 | | | — | |
Total from investment operations | | | 2.31 | | | | 0.81 | | | | (2.48 | ) | | | (0.05 | ) | | | 4.41 | | | | 3.60 | |
| | | | | | | | | | | | | | | | | | | | | | | | | |
Less Distributions: | | | | | | | | | | | | | | | | | | | | | | | | |
Dividends from net investment income | | | — | | | | — | | | | — | | | | (0.16 | ) | | | — | | | | — | |
Distribution from net realized gains | | | — | | | | — | 2 | | | (0.12 | ) | | | (0.05 | ) | | | (0.57 | ) | | | (1.66 | ) |
Total distributions | | | — | | | | — | 2 | | | (0.12 | ) | | | (0.21 | ) | | | (0.57 | ) | | | (1.66 | ) |
| | | | | | | | | | | | | | | | | | | | | | | | | |
Redemption fee proceeds1 | | | — | 2 | | | — | 2 | | | 0.01 | | | | 0.01 | | | | 0.05 | | | | 0.05 | |
| | | | | | | | | | | | | | | | | | | | | | | | | |
Net asset value, end of period | | $ | 13.74 | | | $ | 11.43 | | | $ | 10.62 | | | $ | 13.21 | | | $ | 13.46 | | | $ | 9.57 | |
| | | | | | | | | | | | | | | | | | | | | | | | | |
Total return | | | 20.21 | %3 | | | 7.68 | % | | | (18.80 | )% | | | (0.42 | )% | | | 49.40 | % | | | 58.54 | %4 |
| | | | | | | | | | | | | | | | | | | | | | | | | |
Ratios/Supplemental Data: | | | | | | | | | | | | | | | | | | | | | | | | |
Net assets, end of year (in 000’s) | | $ | 45,352 | | | $ | 40,272 | | | $ | 41,679 | | | $ | 51,390 | | | $ | 55,603 | | | $ | 12,507 | |
Ratio of expenses to average net assets | | | 1.98 | %5 | | | 1.94 | % | | | 1.82 | % | | | 1.69 | % | | | 1.79 | % | | | 2.38 | % |
Ratio of net investment loss to average net assets | | | (0.78 | )%5 | | | (0.49 | )% | | | (0.30 | )% | | | (0.39 | )% | | | (1.03 | )% | | | (1.36 | )% |
Portfolio turnover rate | | | — | %3 | | | 3 | % | | | 9 | % | | | 11 | % | | | 1 | % | | | 18 | % |
1 | Based on average shares method. |
2 | Amount represents less than $0.01 per share. |
4 | Total returns would have been higher/lower had expenses not been waived/recovered by the Adviser. |
See notes to financial statements.
– 8 –
OCM GOLD FUND Notes to Financial Statements – May 31, 2024
(Unaudited) |
Note 1. Organization
OCM Mutual Fund (the “Trust”) is registered under the Investment Company Act of 1940, as amended (“1940 Act”), as an open-end management investment company. The Trust was organized as a Massachusetts business trust on January 6, 1984 and consists of the OCM Gold Fund (the “Fund”). The Fund is a non-diversified fund. The investment objective for the Fund is long-term growth of capital through investing primarily in equity securities of domestic and foreign companies engaged in activities related to gold and precious metals.
The Fund is an investment company and accordingly follows the investment company accounting and reporting guidance of the Financial Accounting Standards Board (“FASB”) Accounting Standard Codification Topic 946 “Financial Services—Investment Companies.”
Note 2. Significant Accounting Policies
The following is a summary of significant accounting policies followed by the Fund in the preparation of its financial statements.
Security Valuation – Portfolio securities that are listed on national securities exchanges, other than the NASDAQ Stock Market LLC, are valued at the last sale price as of the close of business of such securities exchanges, or, in the absence of recorded sales, at the average of readily available closing bid and ask prices on such exchanges. NASDAQ Global Select Market, Global Market and Capital Market securities are valued at the NASDAQ Official Closing Price (“NOCP”). If a NOCP is not issued for a given day, these securities are valued at the average of readily available closing bid and ask prices. Unlisted securities are valued at the average of the quoted bid and ask prices in the over-the-counter market. Short-term investments which mature in less than 60 days are valued at amortized cost (unless the Fund’s investment adviser determines that this method does not represent fair value). Short-term investments which mature after 60 days are valued at market. Securities and other assets for which market quotations are not readily available are valued at fair value as determined in good faith by the Fund’s investment adviser. In compliance with Rule 2a-5 under the 1940 Act, the Fund’s Board of Trustees has designated the investment adviser as the valuation designee, and the investment adviser performs the fair value determinations relating to Fund investments. For each investment that is fair valued, the investment adviser considers, to the extent applicable, various factors including, but not limited to, the type of security, the financial condition of the company, comparable companies in the public market, the nature and duration of the cause for a quotation not being readily available and other relevant factors.
Fair Value Measurements and Disclosures defines fair value, establishes a framework for measuring fair value in accordance with GAAP, and expands disclosure about fair value measurements. It also provides guidance on determining when there has been a significant decrease in the volume and level of activity for an asset or a liability, when a transaction is not orderly, and how that information must be incorporated into a fair value measurement.
– 9 –
OCM GOLD FUND Notes to Financial Statements – May 31, 2024 (Continued)
(Unaudited) |
Under Fair Value Measurements and Disclosures, various inputs are used in determining the value of the Fund’s investments. These inputs are summarized into three broad levels as described below:
| | ● | Level 1 – Unadjusted quoted prices in active markets for identical assets or liabilities that the Fund has the ability to access. |
| | ● | Level 2 – Observable inputs other than quoted prices included in Level 1 that are observable for the asset or liability, either directly or indirectly. These inputs may include quoted prices for the identical instrument on an inactive market, prices for similar instruments, interest rates, prepayment speeds, credit risk, yield curves, default rates and similar data. |
| | ● | Level 3 – Unobservable inputs for the asset or liability, to the extent relevant observable inputs are not available, representing the Fund’s own assumptions about the assumptions a market participant would use in valuing the asset or liability, and would be based on the best information available. |
The availability of observable inputs can vary from security to security and is affected by a wide variety of factors, including for example, the type of security, whether the security is new and not yet established in the marketplace, the liquidity of markets, and other characteristics particular to the security. To the extent that valuation is based on models or inputs that are less observable or unobservable in the market, the determination of fair value requires more judgment. Accordingly, the degree of judgment exercised in determining fair value is greatest for instruments categorized in Level 3.
The inputs to measure fair value may fall into different Levels of the fair value hierarchy. In such cases, for disclosure purposes, the Level in the fair value hierarchy within which the fair value measurement falls in its entirety, is determined based on the lowest Level input that is significant to the fair value measurement in its entirety.
– 10 –
OCM GOLD FUND Notes to Financial Statements – May 31, 2024 (Continued)
(Unaudited) |
The inputs or methodology used for valuing securities are not an indication of the risk associated with investing in those securities. The following is a summary of the inputs used, as of May 31, 2024, in valuing the Fund’s assets carried at fair value:
Sector | | Level 1 | | | Level 2 | | | Level 3 | | | Total | |
Common Stocks | | | | | | | | | | | | | | | | |
Major Gold Producers | | $ | 16,418,207 | | | $ | — | | | $ | — | | | $ | 16,418,207 | |
Intermediate/Mid-Tier Gold Producers | | | 14,345,211 | | | | — | | | | — | | | | 14,345,211 | |
Junior Gold Producers | | | 11,817,593 | | | | — | | | | — | | | | 11,817,593 | |
Exploration and Development Companies | | | 3,190,208 | | | | — | | | | 0 | | | | 3,190,208 | |
Royalty/Streaming Companies | | | 4,381,511 | | | | — | | | | — | | | | 4,381,511 | |
Primary Silver Producers | | | 7,268,232 | | | | — | | | | — | | | | 7,268,232 | |
Warrants | | | — | | | | 0 | | | | — | | | | 0 | |
Short-Term Investment | | | 109,136 | | | | — | | | | — | | | | 109,136 | |
Total | | $ | 57,530,098 | | | $ | 0 | | | $ | 0 | | | $ | 57,530,098 | |
The Fund held one Level 2 security at May 31, 2024. Angel Wing Metals, Inc., a Warrant, is being valued at intrinsic value, in accordance with the Fund’s fair value methodologies. The Fund held one Level 3 security at May 31, 2024. Sutter Gold Mining, Inc. (“SGM CN”) has ceased operations and a receiver for the company’s assets has been appointed. The common shares of SGM CN will be valued at zero, in accordance with the Fund’s fair value methodologies, until such time as the receiver has finalized the sale of the company’s assets.
There was no Level 3 activity during the six months ended May 31, 2024 and did not warrant a Level 3 rollforward disclosure.
The Level 3 investments for the Fund represented 0.00% of net assets and did not warrant a disclosure of significant unobservable valuation inputs.
– 11 –
OCM GOLD FUND Notes to Financial Statements – May 31, 2024 (Continued)
(Unaudited) |
Foreign Currency – Investment securities and other assets and liabilities denominated in foreign currencies are translated into U.S. dollar amounts at the date of valuation. Purchases and sales of investment securities and income and expense items denominated in foreign currencies are translated into U.S. dollar amounts on the respective dates of such transactions. The Fund does not isolate that portion of the results of operations resulting from changes in foreign exchange rates on investments from the fluctuations arising from changes in market prices of securities held. Such fluctuations for the six months ended May 31, 2024 are included within the realized and unrealized gain/loss on investments section of the Statement of Operations.
Reported net realized foreign exchange gains or losses arise from sales of foreign currencies, currency gains or losses realized between the trade and settlement dates on securities transactions, and the difference between the amounts of dividends, interest and foreign withholding taxes recorded on the Fund’s books and the U.S. dollar equivalent of the amounts actually received or paid. Net unrealized foreign exchange gains and losses arise from changes in the fair value of assets and liabilities, other than investments in securities at fiscal period end, resulting from changes in exchange rates. Such fluctuations for the six months ended May 31, 2024 are included within the realized and unrealized gain/loss on investments section of the Statement of Operations.
Federal Income Taxes – The Fund intends to comply with the requirements of the Internal Revenue Code of 1986, as amended (“Code”), necessary to qualify as a regulated investment company and to make the requisite distributions of income to its shareholders to relieve it from all or substantially all federal income taxes. Withholding taxes on foreign dividends have been provided for in accordance with the Fund’s understanding on the applicable country’s tax rules and rate.
Accounting for Uncertainty in Income Taxes (“Income Tax Statement”) requires an evaluation of tax positions taken (or expected to be taken) in the course of preparing the Fund’s tax returns to determine whether these positions meet a “more-likely-than-not” standard that, based on the technical merits, have a more than fifty percent likelihood of being sustained by a taxing authority upon examination. A tax position that meets the “more-likely-than-not” recognition threshold is measured to determine the amount of benefit to recognize in the financial statements. The Fund’s policy is to classify interest and penalties associated with underpayment of federal and state income taxes, if any, as income tax expense on the Statement of Operations. As of May 31, 2024, the Fund did not have any interest or penalties associated with the underpayment of any income taxes.
The Income Tax Statement requires management of the Fund to analyze all open tax years, fiscal years 2021-2023 as defined by the Internal Revenue Service statute of limitations for all major jurisdictions, including federal tax authorities and certain state tax authorities. As of and during the six months ended May 31, 2024, the Fund did not have a liability for any unrecognized tax benefits. The Fund has no examinations in progress and is not aware of any tax positions for which it is reasonably possible that the total amounts of unrecognized tax benefits will significantly change in the next twelve months.
– 12 –
OCM GOLD FUND Notes to Financial Statements – May 31, 2024 (Continued)
(Unaudited) |
Share Classes – The Fund offers two classes of shares, Investor Class and Atlas Class (formerly “Advisor Class”). The outstanding shares of the Fund on April 1, 2010 were renamed “Investor Class shares.” The Atlas Class shares commenced operations on April 1, 2010. The two classes represent interests in the same portfolio of investments and have the same rights. Income, expenses (other than expenses attributable to a specific class) and realized and unrealized gains and losses on investments are allocated to each class of shares in proportion to their relative net assets.
Securities Transactions and Investment Income – Securities transactions are accounted for on a trade date basis. Realized gains and losses on sales of securities are calculated on the identified cost basis. Dividend income is recorded on the ex-dividend date and interest income is recorded on an accrual basis. Withholding taxes on foreign dividends have been provided for in accordance with the Fund’s understanding of the applicable country’s tax rules and rates.
Distributions to Shareholders – The character of distributions made during the year from net investment income or net realized gains may differ from the characterization for federal income tax purposes due to differences in the recognition of income, expense or gain items for financial statement and tax purposes. To the extent that these differences are attributable to permanent book and tax accounting differences, the components of net assets have been adjusted.
Redemption Fee – A 1.50% redemption fee is retained by the Fund to offset transaction costs and other expenses associated with short-term investing. The fee is imposed on redemptions or exchanges of shares held less than three months from their purchase date. The Fund records the fee as a reduction of shares redeemed and as a credit to shares of beneficial interest. For the six months ended May 31, 2024, the Investor Class and the Atlas Class received $11 and $9,711 in redemption fees, respectively.
Guarantees and Indemnifications – In the normal course of business, the Fund enters into contracts with service providers that contain general indemnification clauses. Also, under the Fund’s organizational documents, its officers and Trustees are indemnified by the Fund against certain liabilities arising out of the performance of their duties to the Fund. The Fund notes that insofar as indemnification for liabilities arising under the Securities Act of 1933 may be permitted to trustees and officers, the Fund has been advised that in the opinion of the Securities and Exchange Commission (the “SEC”) such indemnification is against public policy as expressed in that Act and is, therefore, unenforceable. The Fund’s maximum exposure under these arrangements is unknown as this would involve future claims against the Fund that have not yet occurred. Based on experience, the Fund expects the risk of loss to be remote.
– 13 –
OCM GOLD FUND Notes to Financial Statements – May 31, 2024 (Continued)
(Unaudited) |
Use of Estimates – The preparation of financial statements in conformity with accounting principles generally accepted in the United States of America requires management to make estimates and assumptions that affect the reported amounts of assets and liabilities and disclosure of contingent assets and liabilities at the date of the financial statements and the reported amounts of increases and decreases in net assets from operations during the reporting period. Actual results could differ from those estimates.
Derivative Instruments – Equity securities in the gold mining industry, particularly the smaller companies, may occasionally issue warrants as part of their capital structure. A warrant gives the holder the right to purchase the underlying equity at the exercise price until the expiration date of the warrant. The Fund may hold such warrants for exposure to smaller companies in the portfolio or other reasons associated with the Fund’s overall objective of long-term growth, though warrants will typically not be a significant part of the Fund’s portfolio. The Fund’s maximum risk in holding warrants is the loss of the entire amount paid for the warrants. At May 31, 2024, the Fund held warrants as listed on the Schedule of Investments.
Note 3. Investment Advisory Agreement and Affiliated Parties
The Fund has an investment advisory agreement with Orrell Capital Management, Inc. (“OCM” or the “Adviser”). Under the agreement, the Fund pays OCM a fee computed daily and payable monthly, at the following annual rates based upon average daily net assets:
Assets | Fee Rate |
$0 to $250 million | 0.950% |
$250 million to $500 million | 0.800% |
$500 million to $1 billion | 0.700% |
Over $1 billion | 0.600% |
Under the investment advisory agreement, the Adviser is responsible for reimbursing the Fund to maintain a voluntary ratio of expenses to average daily net assets for the Investor Class shares and Atlas Class shares at 2.99% and 2.49%, respectively.
The Fund does not compensate Trustees and Officers affiliated with OCM. For the six months ended May 31, 2024, the expenses accrued for Trustees who are not affiliated with OCM are reported on the Statement of Operations. The Fund pays fees and related expenses for the services of the Fund’s Chief Compliance Officer. The expenses incurred for the Chief Compliance Officer are reported on the Statement of Operations.
– 14 –
OCM GOLD FUND Notes to Financial Statements – May 31, 2024 (Continued)
(Unaudited) |
Note 4. Distribution Agreement and Plan
The Trust has adopted a Distribution Plan (the “Plan”) pursuant to Rule 12b-1 under the 1940 Act. The Plan authorizes the Fund to reimburse the distributor for marketing expenses incurred in distributing shares of the Fund, including the cost of printing sales material and making payments to dealers of the Fund’s Investor Class and Atlas Class, in any fiscal year, subject to limits of 0.99% and 0.25%, respectively, of the average daily net assets of each respective class. For the six months ended May 31, 2024, the Investor Class and the Atlas Class incurred $35,065 and $29,313, respectively, in expenses under the Plan.
Note 5. Purchases and Sales of Securities
Purchases and sales of investment securities (excluding short-term securities and U.S. government obligations) for the six months ended May 31, 2024 were $220,994 and $4,112,629, respectively. There were no purchases or sales of U.S. government obligations.
Note 6. Federal Income Tax Information
At May 31, 2024, gross unrealized appreciation and depreciation of investments owned by the Fund, based on cost for federal income tax purposes were as follows:
Cost of investments | | $ | 24,416,008 | |
Unrealized appreciation on investments | | $ | 36,510,862 | |
Unrealized depreciation on investments | | | (3,396,772 | ) |
Net unrealized appreciation on investments | | $ | 33,114,090 | |
The difference between cost amounts for financial statement and federal income tax purposes is due primarily to investments in passive foreign investment companies (“PFICs”).
– 15 –
OCM GOLD FUND Notes to Financial Statements – May 31, 2024 (Continued)
(Unaudited) |
The tax character of distributions paid during the fiscal years ended November 30, 2023 and 2022 was as follows:
| | | 2023 | | | 2022 | |
Ordinary income | | $ | — | | | $ | — | |
Net long-term capital gains | | | 24,653 | | | | 660,861 | |
Total distributions | | $ | 24,653 | | | $ | 660,861 | |
As of November 30, 2023, the components of accumulated earnings on a tax basis were as follows:
Undistributed ordinary income | | $ | — | |
Undistributed long-term gains | | | — | |
Tax accumulated earnings | | | — | |
Accumulated capital and other losses | | | (1,101,710 | ) |
Unrealized appreciation on investments. | | | 25,868,757 | |
Unrealized appreciation on foreign currency | | | 36 | |
Total accumulated earnings | | $ | 24,767,083 | |
The Fund has $194,451 in qualified late-year losses, which are deferred until fiscal year 2024 for tax purposes. Net late-year ordinary losses incurred after December 31 and within the taxable year and net late-year specified losses incurred after October 31 and within the taxable year are deemed to arise on the first day of the Fund’s next taxable year.
As of November 30, 2023, the Fund had a short-term capital loss carryforward of $345,598 and a long-term capital loss carryforward of $561,661. To the extent that the fund may realize future net capital gains, those gains will be offset by any of its unused capital loss carryforward. Future capital loss carryover utilization in any given year may be subject to Internal Revenue Code limitations.
Note 7. Concentration of Risk
Investing in foreign securities involves certain risks not necessarily found in U.S. markets. These include risks associated with adverse changes in economic, political, regulatory and other conditions, changes in currency exchange rates, exchange control regulations, expropriation of assets or nationalization, imposition of withholding taxes on dividend
– 16 –
OCM GOLD FUND Notes to Financial Statements – May 31, 2024 (Continued)
(Unaudited) |
or interest payments or capital gains, and possible difficulty in obtaining and enforcing judgments against foreign entities. Further, issuers of foreign securities are subject to different, and often less comprehensive, accounting, reporting, and disclosure requirements than domestic issuers.
As the Fund concentrates its investments in the gold mining industry, a development adversely affecting the industry (for example, changes in the mining laws which increases production costs or a significant decrease in the market price of gold) would have a greater adverse effect on the Fund than it would if the Fund invested in a number of different industries.
Note 8. Illiquid Securities
Pursuant to Rule 22e-4 under the 1940 Act, the Fund has adopted a Liquidity Risk Management Program (“LRMP”) that requires, among other things, that the Fund limits its illiquid investments that are assets to no more than 15% of net assets. An illiquid investment is any security which may not reasonably be expected to be sold or disposed of in current market conditions in seven calendar days or less without the sale or disposition significantly changing the market value of the investment. If the Adviser, at any time, determines that the value of illiquid securities held by the Fund exceeds 15% of its net asset value, the Adviser will take such steps as it considers appropriate to reduce them as soon as reasonably practicable in accordance with the Fund’s written LRMP.
Note 9. Market Disruption and Geopolitical Risks
Certain local, regional or global events such as war, acts of terrorism, the spread of infectious illnesses and/or other public health issues, or other events may have a significant impact on a security or instrument. These types of events and other like them are collectively referred to as “Market Disruptions and Geopolitical Risks” and they may have adverse impacts on the worldwide economy, as well as the economies of individual countries, the financial health of individual companies and the market in general in significant and unforeseen ways. Some of the impacts noted in recent times include but are not limited to embargos, political actions, supply chain disruptions, restrictions to investment and/or monetary movement including the forced selling of securities or the inability to participate impacted markets. The duration of these events could adversely affect the Fund’s performance, the performance of the securities in which the Fund invests and may lead to losses on your investment. The ultimate impact of “Market Disruptions and Geopolitical Risks” on the financial performance of the Fund’s investments is not reasonably estimable at this time. Management is actively monitoring these events.
– 17 –
OCM GOLD FUND Notes to Financial Statements – May 31, 2024 (Continued)
(Unaudited) |
Note 10. New Accounting Pronouncements
Effective January 24, 2023, the SEC adopted rule and form amendments to require mutual funds and ETFs to transmit concise and visually engaging streamlined annual and semiannual reports to shareholders that highlight key information deemed important for retail investors to assess and monitor their fund investments. Other information, including financial statements, will no longer appear in the Fund’s streamlined shareholder reports but must be available online, delivered free of charge upon request, and filed on a semiannual basis on Form N-CSR. The rule and form amendments have a compliance date of July 24, 2024. The Fund has adopted procedures in accordance with the SEC’s rules and form amendments.
Note 11. Subsequent Events
Management has evaluated events and transactions for potential recognition or disclosure through the date the financial statements were issued. Management has determined there are no material events that would require disclosure in the Fund’s financial statements through this date.
– 18 –
Item 8. Changes in and Disagreements with Accountants for Open-End Management Investment Companies.
Not applicable.
Item 9. Proxy Disclosures for Open-End Management Investment Companies.
Not applicable.
Item 10. Remuneration Paid to Directors, Officers and Others of Open-End Management Investment Companies.
The remuneration paid to directors, officers and others are included as part of the report to shareholders filed under Item 7 of this Form.
Item 11. Statement Regarding Basis for Approval of Investment Advisory Contract.
Not applicable.
Item 12. Disclosure of Proxy Voting Policies and Procedures for Closed-End Management Investment Companies.
Not applicable.
Item 13. Portfolio Managers of Closed-End Management Investment Companies.
Not applicable.
Item 14. Purchases of Equity Securities by Closed-End Management Investment Company and Affiliated Purchasers.
Not applicable.
Item 15. Submission of Matters to a Vote of Security Holders.
Not applicable.
Item 16. Controls and Procedures.
| (a) | The registrant’s principal executive officer and principal financial officer have reviewed the registrant's disclosure controls and procedures (as defined in Rule 30a-3(c) under the Investment Company Act of 1940 (the “Act”)) as of a date within 90 days of the filing date of this report, as required by Rule 30a-3(b) under the Act and Rules 13a-15(b) or 15d-15(b) under the Exchange Act. Based on their review, such officers have concluded that the disclosure controls and procedures are effective in ensuring that information required to be disclosed in this report is appropriately recorded, processed, summarized, and reported and made known to them by others within the registrant and by the registrant’s service providers. |
| (b) | There were no changes in the registrant’s internal control over financial reporting (as defined in Rule 30a-3(d) under the Act) that occurred during the period covered by this report that has materially affected, or is reasonably likely to materially affect, the registrant’s internal control over financial reporting. |
Item 17. Disclosure of Securities Lending Activities for Closed-End Management Investment Companies.
Not applicable.
Item 18. Recovery of Erroneously Awarded Compensation.
Not applicable.
Item 19. Exhibits.
(a)(1) Code of ethics, or amendments thereto, that is the subject of the disclosure required by Item 2, to the extent that the registrant intends to satisfy Item 2 requirements through filing of an exhibit – Not applicable.
(a)(2) Any policy required by the listing standards adopted pursuant to Rule 10D-1 under the Exchange Act by the registered national securities exchange or registered national securities association upon which the registrant’s securities are listed – Not applicable.
(a)(3) A separate certification for each principal executive and principal financial officer of the registrant as required by Rule 30a-2(a) under the Act (17 CFR 270.30a-2(a)) – Filed herewith.
(a)(4) Any written solicitation to purchase securities under Rule 23c-1 under the Act sent or given during the period covered by the report by or on behalf of the registrant to 10 or more persons - Not applicable.
(a)(5) Change in the registrant’s independent public accountant – Not applicable.
(b) Certifications required by Rule 30a-2(b) under the Act (17 CFR 270.30a-2(b)), Rule 13a-14(b), or Rule 15d-14(b) under the Securities Exchange Act of 1934, as amended (17 CFR 240.13a-14(b) or 240.15d-14(b)), and Section 1350 of Chapter 63 of Title 18 of the United States Code (18 U.S.C. 1350) – Furnished herewith.
SIGNATURES
Pursuant to the requirements of the Securities Exchange Act of 1934 and the Investment Company Act of 1940, the registrant has duly caused this report to be signed on its behalf by the undersigned, thereunto duly authorized.
OCM Mutual Fund
| By: | /s/ Gregory M. Orrell | |
| | Gregory M. Orrell | |
| | President | |
| | | |
| Date: | August 5, 2024 | |
Pursuant to the requirements of the Securities Exchange Act of 1934 and the Investment Company Act of 1940, this report has been signed below by the following persons on behalf of the registrant and in the capacities and on the dates indicated.
| By: | /s/ Gregory M. Orrell | |
| | Gregory M. Orrell | |
| | President (Principal Executive Officer) | |
| | | |
| Date: | August 5, 2024 | |
| By: | /s/ Steven Orrell | |
| | Steven Orrell | |
| | Secretary and Treasurer (Principal Financial Officer) |
| | |
| Date: | August 5, 2024 |