UNITED STATES
SECURITIES AND EXCHANGE COMMISSION
Washington, D.C. 20549
FORM N-CSR
CERTIFIED SHAREHOLDER REPORT OF REGISTERED MANAGEMENT INVESTMENT
COMPANIES
Investment Company Act File Number 811-04010
OCM Mutual Fund
(Exact name of registrant as specified in charter)
2600 Kitty Hawk Road, Suite 119
Livermore, California 94551
(Address of principal executive offices) (Zip code)
Gregory M. Orrell
Orrell Capital Management, Inc
2600 Kitty Hawk Road, Suite 119
Livermore, California 94551
(Name and address of agent for service)
Registrant's telephone number, including area code: (925) 455-0802
Date of fiscal year end: November 30
Date of reporting period: May 31, 2022
Item 1. Report to Stockholders.

Semi-Annual Report
May 31, 2022
(Unaudited)
OCM GOLD FUND
Shareholder Letter – May 31, 2022 |
“Specie (gold and silver coin) is the most perfect medium because it will preserve its own level, because having intrinsic and universal value, it can never die in our hands, and it is the surest resource of reliance in time of war.” – Thomas Jefferson
Dear Fellow Shareholders:
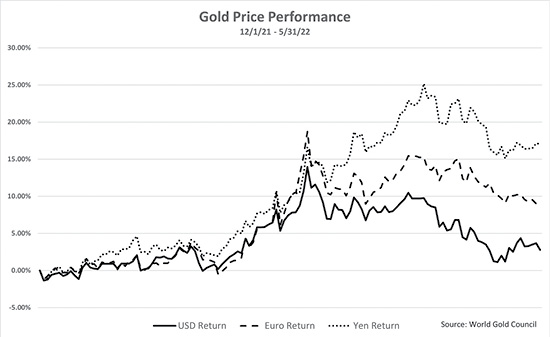
For the six-month fiscal period ending May 31, 2022, the OCM Gold Fund Advisor Class declined 5.80% while the Investor Class declined 6.04% (-10.25% after maximum sales load) compared to a -0.27% performance in the Philadelphia Gold and Silver Index (“XAU”)1 and a decline of 8.85% for the S&P 500 Index2. Financial asset prices came under pressure in the period in response to accelerating inflation pressures, made worse by Western sanctions on Russia and ongoing supply chain constraints. The London PM Fix3 gold price closed at $1,838.70 per ounce, up 1.9% for the six-month fiscal period ending May 31, 2022. Your Fund’s broader exposure to the precious metals mining industry through its ownership of junior gold producers and exploration and development companies led to an underperformance versus the major producer weighted XAU over the period. Over longer time periods as indicated in the performance chart below, your Fund’s investment strategy and active management style have proven to outperform the XAU.
Market Commentary
In what would appear to be an ideal environment for gold, with headline inflation numbers at 40-year highs, the Russia/Ukraine war geopolitical situation and financial asset markets breaking, gold priced in dollars has lagged investor expectations after reaching a high of $2,070 in March 2022. Meanwhile, Gold priced in euros and yen stood out among most asset classes as those currencies declined versus gold and the dollar. Both the Bank of Japan (the “BOJ”) and European Central Bank (the “ECB”) resisted joining the Fed in tightening monetary conditions for fear their economies were too fragile. The U.S. dollar was also helped by hawkish Federal Reserve4 (the “Fed”) commentary, which gave the market confidence that the Fed would tame inflation even if it meant putting the U.S. economy into recession. Precious metals appeared to get caught up in a broad commodity market sell-off based on recession fears and a consequent move for liquidity, especially among those with dollar denominated debts. While some investors may have some frustration with gold and gold assets, especially the share performance of the precious metal mining companies during this period, we are convinced through a process of elimination gold’s historic monetary attributes of not being someone else’s liability will come to the fore as the Fed’s past policy failures are held to account by the market. The gold story in this cycle is far from written, in our opinion.
We believe investors should keep in mind the following:
● | The Fed expressed a complete lack of understanding of the causes of inflation with its “inflation is transitory” statement when it first blamed supply chain bottle necks, then the Russia/Ukraine war, rather than admitting the monetary origins of inflation. With monthly inflation numbers hitting 40-year highs, |
– 1 –
OCM GOLD FUND
Shareholder Letter – May 31, 2022 (Continued) |
Fed Chairman Powell has had to back pedal in an effort to claw back institutional credibility through hawkish rhetoric. Proclaiming the Fed will do whatever it takes to bring down inflation. Powell went so far as to pronounce his admiration of the late Paul Volker for his policies to tame inflation in the 70’s through aggressive rate hikes. Unfortunately for Powell, total Federal Debt is now 125% of GDP versus 30% when Volker raised the Fed Funds rate to a peak of 20% in June 1981. With elevated public and private debt, the Volker playbook is widely considered to not be an option. Hawkish bravado may prove to be the Fed’s main tool to fight inflation. At some point, one would think the market will look behind the curtain and see the Fed as a toothless tiger.
● | The Fed has a history of socializing market risk through extreme monetary policy (Fed balance sheet expanded 10 times since 2008) over the last 20 years, showing it is more fearful of systemic financial risks than inflation. Consider if the economy rolls over into recession, systemic risks will become magnified. The Fed may be looking down the barrel of a gun if inflation remains stubbornly above its 2% target. Should it give up the ghost of fighting inflation or stave off systemic risks by turning the monetary spigot back on? Recent history shows the Fed will likely turn tail on inflation and aggressively go down the debasement route. It is hard for us to imagine Fed capitulation will not be a watershed event for the U.S. dollar, Treasuries and particularly gold (the process of elimination) if it were to happen. |
● | Rising interest rate environments quickly expose marginal credit risk. Credit spreads are starting to widen suggesting the Fed is on the cusp of setting off a credit crisis, starting with subprime borrowers and moving to sovereign debt. Italian rates are spreading out from Germany, suggesting the ECB may have another European debt crisis on its hands shortly. Further, a rising interest rate environment chokes of zombie companies that rely on cheap capital to remain solvent. As the cost of capital rises, capital is reallocated from low return businesses to higher return businesses leading to a slew of bankruptcies. |
● | As liquidity contracted in the first half of the year, the crypto-currencies (“crypto”) world came crashing down. Crypto assets were exposed as a risk asset class, not a store of value, highly correlated to the Nasdaq, and lacking intrinsic value. Despite flashy promotional campaigns and large brokerages getting sucked in to institutionalize crypto assets at the top, claims of crypto being the disruptor to gold proved to be nothing more than wishful thinking at this stage. |
● | The freezing of Russian central bank assets by the U.S. and Europeans has weaponized the U.S. dollar. Vladimir Putin commented on March 16, 2022, “The illegitimate freezing of some of the currency reserves of the Bank of Russia marks the end of the reliability of so-called first-class assets. In fact, the U.S. and EU have defaulted on their obligations to Russia. Now everybody knows that financial reserves can simply be stolen. And many countries in the immediate future may begin – I am sure this is what will happen – to convert their paper and digital assets into real reserves of raw materials, land, food, gold |
– 2 –
OCM GOLD FUND
Shareholder Letter – May 31, 2022 (Continued) |
and other real assets which will only result in more shortages in these markets.” With 85% of the world’s population not aligned with United States or Europe, we believe demand for gold as a neutral reserve asset may gain increasing allocation in central bank reserves assets going forward.
● | The downturn in financial assets may be much longer and deeper than the engrained “buy the dip” mentality pervasive on Wall Street. Earnings estimates are in the process of accounting for higher interest rates and have yet to factor in a recession. Hussman Strategic Advisors’ highly accurate (80%) 12-year forward forecasting model is estimating a 7.06% decline for the S&P 500 Index over the next 12 years. The bond market’s 40-year bull market trend appears to have broken with elevated inflation forcing real returns on Treasury securities deeply negative. Gold historically performs well in prolonged bear markets for financial assets as the opportunity cost of owning gold is removed. |
● | The BOJ’s decision to maintain yield control rather than join the Fed in tightening monetary conditions has forced it to print a massive amount of yen to support its 0.25% interest rate peg on 10-year Japanese Government Bond. The market response has been a 11.80% decline in the yen versus the dollar through May 29, 2022. If inflation remains stubborn, we believe other central banks may be required to practice aggressive yield curve control as well. Government bonds may find it difficult to find buyers in such a scenario. |
● | The 2-year and 10-year treasury yields recently inverted. Previous inversions over the past 30 years were followed by a recession with the Fed lowering the Fed Funds rate shortly after. |
– 3 –
OCM GOLD FUND
Shareholder Letter – May 31, 2022 (Continued) |
Precious Metals Mining Industry
After a strong start to the new year, precious metal mining indexes turned negative in May as liquidity needs dragged down most asset classes that were showing gains. Further, as announcements of capital expenditure and operating cost inflation came out, short sellers grabbed onto the cost inflation theme aggressively. Without gold prices rising to expand margins, the shorts have had little pushback in taking share prices lower. The precious metals equity investor psyche is still damaged from the take down of precious metals from the 2011 – 2015 that was rooted in investor disillusionment with poor management decisions and short sellers pressing on the opportunity. Though the industry has shown the lessons of poor capital management are in the rear-view mirror, we believe it is going to take sustained gold price appreciation to attract the capital flows necessary to recapture the valuations of the sector versus gold in 2008 as represented by the gold/XAU ratio.
We find it hard to fathom the market capitalization for gold resources in the ground of development companies and many junior gold mining companies stands below $40/oz, lower today than when gold was trading around $700 in 2007. Considering new discoveries over 5 million ounces have been hard to come by over the last ten years, the discounting of development projects represents intriguing value, in our opinion. As cost-of-living increases create social tensions in Latin America, the move to the left is showing up in political elections in Chile, Peru and Columbia. Though there are a number of promising assets in those countries, permitting in Latin America may prove to be more problematic if not time consuming going forward, reducing the market value of mining assets in those jurisdictions. Therefore, we are closely monitoring the Fund’s overall exposure to Latin American assets. As always, we weigh project prospectively versus geopolitical risk.
We continue to position the Fund’s portfolio through our long-held investment strategy of owning allocations across major, intermediate, and junior gold producers along with exploration and development companies. The Fund’s performance has historically benefitted from identifying special situations that we believe are undervalued.
The Fund’s long-held investment strategy remains a disciplined approach to searching out value and growth opportunities across all segments of the precious metals industry on a global basis. We believe companies that possess strong management, large reserves in the ground in stable jurisdictions, and exhibit capital discipline while holding equity dear will be the companies that outperform over time as they deliver higher levels of free cash flow to maintain a sustainable business model to create shareholder value. We are specifically targeting companies with existing production that possess large reserve expansion potential where shareholder value can be created through the drill bit. Your Fund has the flexibility to maneuver within the precious metals sector to invest in opportunities that larger funds and exchange traded funds cannot; from senior gold producers with over one million ounces of annual production to junior producers with less than 100,000 ounces of annual production to small exploration and development companies with micro capitalizations. The Fund’s performance has historically benefitted from identifying special situations that we believe are undervalued.
– 4 –
OCM GOLD FUND
Shareholder Letter – May 31, 2022 (Continued) |
Conclusion
For several years, we have commented in our reports the Fed’s extraordinary monetary policies would not end well. The Fed was kicking the proverbial can down the road to avoid a day of reckoning. The Fed failed to let excesses in the economy clean out for fear of setting off a cascading debt deleveraging. Instead below market interest rates fostered misallocation of capital, greater risk taking, and multiple asset bubbles leading to higher systemic risks. The Fed is now in a damned if it does and damned if it doesn’t situation when it comes to fighting inflation because of the fragility of the global economy. If the Fed were to abandon support for financial assets with austerity measures, it would not only be out of character, but it would also set off the deflation forces it fears. We believe the odds are the Fed will take its foot off the gas at the first sign of inflation easing to avoid the embarrassment of exacerbating an economic slowdown. The Fed has a two-decade legacy of monetary malpractice, so failure in staying the course until enough liquidity is drained from the system to eradicate inflation is a likely outcome, in our opinion. We believe gold prices will sniff out Fed capitulation well in advance. In our view, current valuations of precious metal mining companies may offer an exceptional entry point to establish initial positions in the fund or add to existing holdings.
We appreciate your shareholding and confidence in the OCM Gold Fund, and we look forward to meeting the investment objective of preserving your purchasing power. Should you have any questions regarding the Fund or gold, please contact your financial adviser or you may contact us directly at 1-800-779-4681. For questions regarding your account, please contact Shareholder Service at 1-800-628-9403.
Sincerely,
Gregory M. Orrell
Portfolio Manager
July 25, 2022
The Philadelphia Gold and Silver Index (XAU)1 is an unmanaged capitalization-weighted index composed of 16 companies listed on U.S. exchanges involved in the gold and silver mining industry. The index is generally considered as representative of the gold and silver share market. You cannot invest directly in an index.
– 5 –
OCM GOLD FUND
Shareholder Letter – May 31, 2022 (Continued) |
The S&P 500 Index2, a registered trademark of McGraw-Hill Co., Inc. is a market capitalization-weighted index of 500 widely held common stocks. You cannot invest directly in an index.
London PM Fix3 is a price per ounce for each of the precious metals (gold, silver, platinum and palladium) determined daily at 10:30 and 15:00 GMT by a brief conference call among the five members of the London Gold Pool (Scotia-Mocatta, Barclays Capital, Deutsche Bank, HSBC and Société Générale). The London spot fix price is the price fixed at the moment when the conference call terminates.
Federal Reserve4 is the central bank of the United States and arguably the most powerful financial institution in the world. The Federal Reserve System was founded by the U.S. Congress in 1913 to provide the nation with a safe, flexible, and stable monetary and financial system.
– 6 –
OCM GOLD FUND
Shareholder Letter – May 31, 2022 (Continued) |
Investing in the Fund involves risks including the loss of principal. Many of the companies in which the Fund invests are smaller capitalization companies, which may subject the Fund to greater risk than securities of larger, more-established companies, as smaller companies often have limited product lines, markets or financial resources, and may be subject to more-abrupt market movements. The Fund also invests in securities of gold and precious metals companies which may be subject to greater price fluctuations over short periods of time. The Fund is a non-diversified investment company meaning it will invest in fewer securities than diversified investment companies and its performance may be more volatile. The Fund contains international securities that may provide the opportunity for greater return but also have special risks associated with foreign investing including fluctuations in currency, government regulation, differences in accounting standards and liquidity.
Investor Class Performance as of May 31, 2022
OCMGX | OCMGX | Philadelphia | S&P 5002 | ||
Six Months | -6.04% | -10.25% | -0.27% | -8.85% | |
One Year | -21.58% | -25.10% | -20.14% | -0.30% | |
3 Year Annualized | 23.17% | 21.30% | 24.03% | 16.44% | |
5 Year Annualized | 11.17% | 10.16% | 10.26% | 13.38% | |
10 Year Annualized | 1.09% | 0.62% | -0.61% | 14.40% |
Advisor Class Performance as of May 31, 2022
OCMAX | Philadelphia | S&P 5002 | ||
Six Months | -5.80% | -0.27% | -8.85% | |
One Year | -21.20% | -20.14% | -0.30% | |
3 Year Annualized | 24.08% | 24.03% | 16.44% | |
5 Year Annualized | 12.01% | 10.26% | 13.38% | |
10 Year Annualized | 1.82% | -0.61% | 14.40% |
The performance data quoted above represents past performance. Current performance may be lower or higher than the performance data quoted above. Past performance is no guarantee of future results. The investment return and principal value of an investment will fluctuate so that investor’s shares, when redeemed, may be worth more or less than their original cost. The Fund’s Total Annual Operating Expenses for the Fund’s Investor Class and Advisor
– 7 –
OCM GOLD FUND
Shareholder Letter – May 31, 2022 (Continued) |
Class are 2.19% and 1.69% respectively. Please review the Fund’s prospectus for more information regarding the Fund’s fees and expenses. For performance information current to the most recent month-end, please call toll-free 800-628-9403. The returns shown include the reinvestment of all dividends but do not reflect the deduction of taxes that a shareholder would pay on Fund distributions or the redemption of Fund shares.
1 | The Philadelphia Gold and Silver Index (XAU) is an unmanaged capitalization-weighted index composed of 16 companies listed on U.S. exchanges involved in the gold and silver mining industry. The index is generally considered as representative of the gold and silver share market. You cannot invest directly in an index. The index is used herein for comparative purposes in accordance with SEC regulation. |
2 | The S&P 500 Index, a registered trademark of McGraw-Hill Co., Inc. is a market capitalization-weighted index of 500 widely held common stocks. You cannot invest directly in an index. The index is used herein for comparative purposes in accordance with SEC regulation. |
– 8 –
OCM GOLD FUND
Schedule of Investments – May 31, 2022 |
| Shares | Value | |||||||
| COMMON STOCKS 96.5% | ||||||||
Major Gold Producers 24.4% | ||||||||
| 80,000 | Agnico Eagle Mines Ltd. | $ | 4,234,400 | |||||
| 155,000 | AngloGold Ashanti Ltd. ADR | 2,662,900 | ||||||
| 200,000 | Barrick Gold Corp. | 4,098,000 | ||||||
| 65,000 | Newmont Corp. | 4,410,250 | ||||||
| 15,405,550 | ||||||||
| Intermediate/Mid-Tier Gold Producers 23.4% | ||||||||
| 325,000 | Alamos Gold, Inc. | 2,427,750 | ||||||
| 100,000 | B2Gold Corp. | 395,000 | ||||||
| 300,000 | B2Gold Corp.^ | 1,190,608 | ||||||
| 140,000 | Endeavour Mining Corp. | 3,221,915 | ||||||
| 130,000 | Lundin Gold, Inc.* | 1,015,416 | ||||||
| 700,000 | OceanaGold Corp.* | 1,627,006 | ||||||
| 25,000 | Pan American Silver Corp. | 549,250 | ||||||
| 1,000,000 | Perseus Mining Ltd. | 1,392,278 | ||||||
| 150,000 | SSR Mining, Inc. | 2,914,500 | ||||||
| 14,733,723 | ||||||||
Junior Gold Producers 27.4% | ||||||||
| 300,000 | Argonaut Gold, Inc.* | 279,864 | ||||||
| 400,489 | Calibre Mining Corp.* | 386,273 | ||||||
| 250,000 | Dundee Precious Metals, Inc. | 1,480,354 | ||||||
| 1,375,000 | Emerald Resources N.L.* | 1,218,692 | ||||||
| 225,000 | Fortuna Silver Mines, Inc.* | 741,758 | ||||||
| 150,000 | i-80 Gold Corp.* | 364,060 | ||||||
| 1,449,950 | Jaguar Mining, Inc. | 3,358,648 | ||||||
| 175,000 | K92 Mining, Inc.* | 1,211,954 | ||||||
| 1,000,000 | Minera Alamos, Inc.* | 458,534 | ||||||
| 385,000 | Mineros S.A. | 276,978 | ||||||
| 3,850,000 | Superior Gold, Inc.* | 2,556,724 | ||||||
| 1,595,000 | Thor Explorations Ltd.* | 365,681 | ||||||
| 500,000 | Wesdome Gold Mines Ltd.* | 4,597,201 | ||||||
| 17,296,721 | ||||||||
| Exploration and Development Companies 7.7% | ||||||||
| 800,000 | Apollo Silver Corp.* | 259,309 | ||||||
| 500,000 | Banyan Gold Corp.* | 197,644 | ||||||
| 400,000 | Benchmark Metals, Inc.* | 240,335 | ||||||
| 450,000 | Black Cat Syndicate Ltd.* | 145,328 | ||||||
| 250,000 | G Mining Ventures Corp.* | 136,375 | ||||||
| 500,000 | Galway Metals, Inc.* | 158,115 | ||||||
| 851,500 | GR Silver Mining Ltd.* | 127,903 | ||||||
| 123,880 | Integra Resources Corp.* | 140,049 | ||||||
| 500,000 | Lahontan Gold Corp.* | 69,176 | ||||||
| 775,000 | Liberty Gold Corp.* | 349,237 | ||||||
| 1,000,000 | Maritime Resources Corp.* | 59,293 | ||||||
| 616,500 | Montage Gold Corp.* | 341,173 | ||||||
| 500,000 | Orezone Gold Corp.* | 537,592 | ||||||
| 400,000 | Paramount Gold Nevada Corp.* | 204,000 | ||||||
| 975,000 | Rio2 Ltd.* | 431,655 | ||||||
| 3,000,000 | Royal Road Minerals Ltd.* | 521,780 | ||||||
| 4,578,755 | RTG Mining, Inc.* | 249,738 | ||||||
| 2,512,040 | Sutter Gold Mining, Inc.*,# | — | ||||||
| 1,210,500 | Tajiri Resources Corp.* | 45,457 | ||||||
| 530,000 | West Vault Mining, Inc.* | 448,336 | ||||||
| 450,000 | Westhaven Gold Corp.* | 206,341 | ||||||
| 4,868,836 | ||||||||
| Royalty/Streaming Companies 6.6% | ||||||||
| 100,000 | Wheaton Precious Metals Corp. | 4,129,971 | ||||||
Primary Silver Producers 7.0% | ||||||||
| 625,000 | Andean Precious Metals Corp.* | 632,461 | ||||||
| 600,000 | Aya Gold & Silver, Inc.* | 3,334,651 | ||||||
| 100,000 | Hecla Mining Co. | 472,000 | ||||||
| 4,439,112 | ||||||||
Total Common Stocks | ||||||||
| (Cost $31,290,249) | 60,873,913 | |||||||
See notes to financial statements.
– 9 –
OCM GOLD FUND
Schedule of Investments – May 31, 2022 (Continued) |
| Shares | Value | |||||||
| WARRANTS 1.6% | ||||||||
| Exploration and Development Companies 0.0% | ||||||||
| 641,000 | Euro Sun Mining, Inc. Exercise Price 0.55 CAD, Exp. 6/5/2023* | $ | — | |||||
| 225,000 | Westhaven Gold Corp. Exercise Price 1.00 CAD, Exp. 3/3/2023* | 25,793 | ||||||
| 400,000 | Apollo Silver Corp. Exercise Price 1.25 CAD, Exp. 6/25/2023* | — | ||||||
| 25,793 | ||||||||
| Primary Silver Producers 1.6% | ||||||||
| 350,000 | Aya Gold & Silver, Inc. Exercise Price 3.30 CAD, Exp. 9/3/2023 | 1,032,097 | ||||||
| 1,032,097 | ||||||||
Total Warrants | ||||||||
| (Cost $0) | 1,057,890 | |||||||
| SHORT-TERM INVESTMENT 2.0% | ||||||||
| 1,249,439 | UMB Money Market Fiduciary, 0.01% | 1,249,439 | ||||||
Total Short-Term Investment | ||||||||
| (Cost $1,249,439) | 1,249,439 | |||||||
Total Investments | ||||||||||||
(Cost $32,539,688) | 100.1% | 63,181,242 | ||||||||||
Liabilities less Other Assets | (0.1 | )% | (85,675 | ) | ||||||||
TOTAL NET ASSETS | 100.0 | % | $ | 63,095,567 | ||||||||
ADR – American Depository Receipt
CAD – Canadian Dollars
* | Non-income producing security. |
^ | Denoted investment is a Canadian security traded on the U.S. stock exchange. |
# | Level 3 security fair valued under procedures established by the Board of Trustees, represents 0.00% of Net Assets. The total value of this security is $0. |
See notes to financial statements.
– 10 –
OCM GOLD FUND
Schedule of Investments – May 31, 2022 (Continued) |
SUMMARY OF INVESTMENTS BY COUNTRY
Country | Value | Percent of | ||||||
Australia | $ | 2,756,298 | 4.4% | |||||
Canada | 47,155,944 | 74.6 | ||||||
Colombia | 276,978 | 0.5 | ||||||
Jersey | 521,780 | 0.8 | ||||||
South Africa | 2,662,900 | 4.2 | ||||||
United Kingdom | 3,221,915 | 5.1 | ||||||
United States1 | 6,335,689 | 10.0 | ||||||
Virgin Islands (British) | 249,738 | 0.4 | ||||||
Total | $ | 63,181,242 | 100.0% | |||||
1 | Includes short-term investments. |
See notes to financial statements.
– 11 –
OCM GOLD FUND
Statement of Assets and Liabilities – May 31, 2022 |
Assets: | ||||
Investments in unaffiliated issuers, at value (cost $32,539,688) | $ | 63,181,242 | ||
Cash | 4,297 | |||
Interest and dividends receivable | 154,363 | |||
Receivable for fund shares sold | 63,867 | |||
Prepaid expenses and other assets | 37,855 | |||
Total assets | 63,441,624 | |||
Liabilities: | ||||
Payable for fund shares redeemed | 88,151 | |||
Accrued distribution fees | 65,591 | |||
Investment securities purchased | 78,994 | |||
Investment adviser fees | 51,859 | |||
Accrued transfer agent fees and expenses | 13,463 | |||
Accrued fund administration and accounting fees | 21,250 | |||
Accrued Trustees’ fees | 2,660 | |||
Accrued audit fees | 7,978 | |||
Accrued report to shareholders | 9,708 | |||
Accrued expenses and other liabilities | 6,403 | |||
Total liabilities | 346,057 | |||
Net Assets | $ | 63,095,567 | ||
Net Assets Consist of: | ||||
Shares of beneficial interest, no par value: unlimited shares authorized | $ | 34,857,959 | ||
Total distributable earnings | 28,237,608 | |||
Net Assets | $ | 63,095,567 | ||
Calculation of Maximum Offering Price: | ||||
Investor Class: | ||||
Net asset value and redemption price per share | $ | 10.88 | ||
Maximum sales charge (4.50% of offering price) | 0.51 | |||
Offering price to public | $ | 11.39 | ||
Shares outstanding | 1,405,706 | |||
Advisor Class: | ||||
Net asset value and redemption price per share | $ | 12.32 | ||
Shares outstanding | 3,881,110 | |||
Total Shares Outstanding | 5,286,816 |
See notes to financial statements.
– 12 –
OCM GOLD FUND
Statement of Operations – Six Months Ended May 31, 2022 |
Investment Income | ||||
Interest | $ | 41 | ||
Dividend (net of foreign withholding taxes of $50,604) | 446,784 | |||
Total investment income | 446,825 | |||
Expenses | ||||
Investment advisory fees | 321,731 | |||
Fund administration and accounting fees | 62,331 | |||
Transfer agent fees and expenses | 57,457 | |||
Distribution fees - Investor Class | 55,358 | |||
Distribution fees - Advisor Class | 38,025 | |||
Federal and state registration fees | 22,013 | |||
Legal fees | 17,489 | |||
Chief Compliance Officer fees | 15,221 | |||
Custody fees | 13,033 | |||
Audit fees | 7,978 | |||
Reports to shareholders | 6,335 | |||
Trustees’ fees | 5,606 | |||
Other expenses | 7,848 | |||
Total expenses | 630,425 | |||
Net investment loss | (183,600 | ) | ||
Realized and Unrealized Gain (Loss) on Investments: | ||||
Net realized gain on investments and foreign currency transactions | 327,710 | |||
Net change in unrealized appreciation/depreciation on investments and foreign currency translations | (4,629,026 | ) | ||
Net loss on investments | (4,301,316 | ) | ||
Net decrease in net assets from operations | $ | (4,484,916 | ) |
See notes to financial statements.
– 13 –
OCM GOLD FUND
Statements of Changes in Net Assets |
Six Months Ended | Year Ended | |||||||
Operations: | ||||||||
Net investment loss | $ | (183,600 | ) | $ | (388,294 | ) | ||
Net realized gain on investments and foreign currency transactions | 327,710 | 1,149,554 | ||||||
Net change in unrealized appreciation/depreciation on investments and foreign currency transactions | (4,629,026 | ) | (1,295,766 | ) | ||||
Net decrease in net assets from operations | (4,484,916 | ) | (534,506 | ) | ||||
Distributions Paid to Shareholders | ||||||||
Distributions: | ||||||||
Investor Class | (179,695 | ) | (192,546 | ) | ||||
Advisor Class | (481,166 | ) | (884,171 | ) | ||||
Total | (660,861 | ) | (1,076,717 | ) | ||||
Fund Share Transactions | ||||||||
Investor Class: | ||||||||
Net proceeds from shares sold | 474,712 | 1,034,437 | ||||||
Distributions reinvested | 155,297 | 171,134 | ||||||
Payment of shares redeemed1 | (1,250,466 | ) | (2,238,684 | ) | ||||
Net decrease in net assets from Investor Class share transactions | (620,457 | ) | (1,033,113 | ) | ||||
Advisor Class: | ||||||||
Net proceeds from shares sold | 9,154,641 | 18,796,257 | ||||||
Distributions reinvested | 458,060 | 839,586 | ||||||
Payment of shares redeemed2 | (9,165,452 | ) | (22,522,613 | ) | ||||
Net increase (decrease) in net assets from Advisor Class share transactions | 447,249 | (2,886,770 | ) | |||||
Net decrease in net assets from Fund share transactions | (173,208 | ) | (3,919,883 | ) | ||||
Total decrease in net assets | (5,318,985 | ) | (5,531,106 | ) | ||||
Net Assets, Beginning of Period | 68,414,552 | 73,945,658 | ||||||
Net Assets, End of Period | $ | 63,095,567 | $ | 68,414,552 | ||||
See notes to financial statements.
– 14 –
OCM GOLD FUND
Statements of Changes in Net Assets (Continued) |
Six Months Ended | Year Ended | |||||||
Transactions in shares |
|
| ||||||
Investor Class: |
|
| ||||||
Shares sold | 38,853 | 83,147 | ||||||
Shares issued on reinvestment of distributions | 14,131 | 13,454 | ||||||
Shares redeemed | (101,398 | ) | (178,692 | ) | ||||
Net decrease in Investor Class shares outstanding | (48,414 | ) | (82,091 | ) | ||||
Advisor Class: | ||||||||
Shares sold | 645,243 | 1,328,775 | ||||||
Shares issued on reinvestment of distributions | 36,911 | 58,836 | ||||||
Shares redeemed | (692,358 | ) | (1,628,111 | ) | ||||
Net decrease in Advisor Class shares outstanding | (10,204 | ) | (240,500 | ) | ||||
Net Decrease in Fund Shares Outstanding | (58,618 | ) | (322,591 | ) | ||||
1 | Net of redemption fees of $1,887 for the six months ended May 31, 2022 and $2,178 for the year ended November 30, 2021, respectively. |
2 | Net of redemption fees of $14,105 for the six months ended May 31, 2022 and $43,151 for the year ended November 30, 2021, respectively. |
See notes to financial statements.
– 15 –
OCM GOLD FUND
Notes to Financial Statements – May 31, 2022 |
Note 1. Organization
OCM Mutual Fund (the “Trust”) is registered under the Investment Company Act of 1940, as amended, as an open-end management investment company. The Trust was organized as a Massachusetts business trust on January 6, 1984 and consists of the OCM Gold Fund (the “Fund”). The Fund is a non-diversified fund. The investment objective for the Fund is long-term growth of capital through investing primarily in equity securities of domestic and foreign companies engaged in activities related to gold and precious metals.
The Fund is an investment company and accordingly follows the investment company accounting and reporting guidance of the Financial Accounting Standards Board (“FASB”) Accounting Standard Codification Topic 946 “Financial Services—Investment Companies.”
Note 2. Significant Accounting Policies
The following is a summary of significant accounting policies followed by the Fund in the preparation of its financial statements.
Security Valuation – Portfolio securities that are listed on national securities exchanges, other than the NASDAQ Stock Market LLC, are valued at the last sale price as of the close of business of such securities exchanges, or, in the absence of recorded sales, at the average of readily available closing bid and ask prices on such exchanges. NASDAQ Global Select Market, Global Market and Capital Market securities are valued at the NASDAQ Official Closing Price (“NOCP”). If a NOCP is not issued for a given day, these securities are valued at the average of readily available closing bid and ask prices. Unlisted securities are valued at the average of the quoted bid and ask prices in the over-the-counter market. Short-term investments which mature in less than 60 days are valued at amortized cost (unless the Trust’s Board of Trustees determines that this method does not represent fair value). Short-term investments which mature after 60 days are valued at market. Securities and other assets for which market quotations are not readily available are valued at fair value as determined in good faith by the investment adviser under procedures established by and under the general supervision and responsibility of the Trust’s Board of Trustees. For each investment that is fair valued, the investment adviser considers, to the extent applicable, various factors including, but not limited to, the type of security, the financial condition of the company, comparable companies in the public market, the nature and duration of the cause for a quotation not being readily available and other relevant factors.
Fair Value Measurements and Disclosures defines fair value, establishes a framework for measuring fair value in accordance with GAAP, and expands disclosure about fair value measurements. It also provides guidance on determining when there has been a significant decrease in the volume and level of activity for an asset or a liability, when a transaction is not orderly, and how that information must be incorporated into a fair value measurement.
– 16 –
OCM GOLD FUND
Notes to Financial Statements – May 31, 2022 (Continued) |
Under Fair Value Measurements and Disclosures, various inputs are used in determining the value of the Fund’s investments. These inputs are summarized into three broad levels as described below:
● | Level 1 – Unadjusted quoted prices in active markets for identical assets or liabilities that the Funds have the ability to access. |
● | Level 2 – Observable inputs other than quoted prices included in Level 1 that are observable for the asset or liability, either directly or indirectly. These inputs may include quoted prices for the identical instrument on an inactive market, prices for similar instruments, interest rates, prepayment speeds, credit risk, yield curves, default rates and similar data. |
● | Level 3 – Unobservable inputs for the asset or liability, to the extent relevant observable inputs are not available, representing the Fund’s own assumptions about the assumptions a market participant would use in valuing the asset or liability, and would be based on the best information available. |
The availability of observable inputs can vary from security to security and is affected by a wide variety of factors, including for example, the type of security, whether the security is new and not yet established in the marketplace, the liquidity of markets, and other characteristics particular to the security. To the extent that valuation is based on models or inputs that are less observable or unobservable in the market, the determination of fair value requires more judgment. Accordingly, the degree of judgment exercised in determining fair value is greatest for instruments categorized in Level 3.
The inputs to measure fair value may fall into different Levels of the fair value hierarchy. In such cases, for disclosure purposes, the Level in the fair value hierarchy within which the fair value measurement falls in its entirety, is determined based on the lowest Level input that is significant to the fair value measurement in its entirety.
– 17 –
OCM GOLD FUND
Notes to Financial Statements – May 31, 2022 (Continued) |
The inputs or methodology used for valuing securities are not an indication of the risk associated with investing in those securities. The following is a summary of the inputs used, as of May 31, 2022, in valuing the Fund’s assets carried at fair value:
Sector | Level 1 | Level 2 | Level 3 | Total | ||||||||||||
Common Stocks | ||||||||||||||||
Major Gold Producers | $ | 15,405,550 | $ | — | $ | — | $ | 15,405,550 | ||||||||
Intermediate/Mid-Tier Gold Producers | 14,733,723 | — | — | 14,733,723 | ||||||||||||
Junior Gold Producers | 17,296,721 | — | — | 17,296,721 | ||||||||||||
Exploration and Development Companies | 4,868,836 | — | — | 4,868,836 | ||||||||||||
Royalty/Streaming Companies | 4,129,971 | — | — | 4,129,971 | ||||||||||||
Primary Silver Producers | 4,439,112 | — | — | 4,439,112 | ||||||||||||
Warrants | 25,793 | 1,032,097 | — | 1,057,890 | ||||||||||||
Short-Term Investment | 1,249,439 | — | — | 1,249,439 | ||||||||||||
Total | $ | 62,149,145 | $ | 1,032,097 | $ | — | $ | 63,181,242 | ||||||||
The Fund held three Level 2 securities at May 31, 2022. Euro Sun Mining, Inc., Apollo Gold & Silver Corp. and Aya Gold & Silver, Inc., all Warrants, are being valued at intrinsic value, in accordance with procedures established by and under the general supervision of the Trust’s Board of Trustees. The Fund held one Level 3 security at May 31, 2022. Sutter Gold Mining, Inc. (“SGM CN”) has ceased operations and a receiver for the company’s assets has been appointed. The common shares of SGM CN will be valued at zero, in accordance with procedures established by and under the general supervision of the Trust’s Board of Trustees, until such time as the receiver has finalized the sale of the company’s assets.
There was no Level 3 activity during the six months ended May 31, 2022 and did not warrant a Level 3 rollforward disclosure.
The Level 3 investments for the Fund represented 0.00% of net assets and did not warrant a disclosure of significant unobservable valuation inputs.
– 18 –
OCM GOLD FUND
Notes to Financial Statements – May 31, 2022 (Continued) |
Foreign Currency – Investment securities and other assets and liabilities denominated in foreign currencies are translated into U.S. dollar amounts at the date of valuation. Purchases and sales of investment securities and income and expense items denominated in foreign currencies are translated into U.S. dollar amounts on the respective dates of such transactions. The Fund does not isolate that portion of the results of operations resulting from changes in foreign exchange rates on investments from the fluctuations arising from changes in market prices of securities held. Such fluctuations for the six months ended May 31, 2022 are included within the realized and unrealized gain/loss on investments section of the Statement of Operations.
Reported net realized foreign exchange gains or losses arise from sales of foreign currencies, currency gains or losses realized between the trade and settlement dates on securities transactions, and the difference between the amounts of dividends, interest and foreign withholding taxes recorded on the Fund’s books and the U.S. dollar equivalent of the amounts actually received or paid. Net unrealized foreign exchange gains and losses arise from changes in the fair value of assets and liabilities, other than investments in securities at fiscal period end, resulting from changes in exchange rates. Such fluctuations for the six months ended May 31, 2022 are included within the realized and unrealized gain/loss on investments section of the Statement of Operations.
Federal Income Taxes – The Fund intends to comply with the requirements of the Internal Revenue Code necessary to qualify as a regulated investment company and to make the requisite distributions of income to its shareholders to relieve it from all or substantially all federal income taxes. Withholding taxes on foreign dividends have been provided for in accordance with the Fund’s understanding on the applicable county’s tax rules and rate.
Accounting for Uncertainty in Income Taxes (“Income Tax Statement”) requires an evaluation of tax positions taken (or expected to be taken) in the course of preparing the Fund’s tax returns to determine whether these positions meet a “more-likely-than-not” standard that, based on the technical merits, have a more than fifty percent likelihood of being sustained by a taxing authority upon examination. A tax position that meets the “more-likely-than-not” recognition threshold is measured to determine the amount of benefit to recognize in the financial statements. The Fund’s policy is to classify interest and penalties associated with underpayment of federal and state income taxes, if any, as income tax expense on the Statement of Operations. As of May 31, 2022, the Fund did not have any interest or penalties associated with the underpayment of any income taxes.
The Income Tax Statement requires management of the Fund to analyze all open tax years, fiscal years 2019-2021 as defined by the Internal Revenue Service statute of limitations for all major jurisdictions, including federal tax authorities and certain state tax authorities. As of and during the six months ended May 31, 2022, the Fund did not have a liability for any unrecognized tax benefits. The Fund has no examinations in progress and is not aware of any tax positions for which it is reasonably possible that the total amounts of unrecognized tax benefits will significantly change in the next twelve months.
– 19 –
OCM GOLD FUND
Notes to Financial Statements – May 31, 2022 (Continued) |
Share Classes – The Fund offers two classes of shares, Investor Class and Advisor Class. The outstanding shares of the Fund on April 1, 2010 were renamed “Investor Class shares.” The Advisor Class shares commenced operations on April 1, 2010. The two classes represent interests in the same portfolio of investments and have the same rights. Income, expenses (other than expenses attributable to a specific class) and realized and unrealized gains and losses on investments are allocated to each class of shares in proportion to their relative net assets.
Securities Transactions and Investment Income – Securities transactions are accounted for on a trade date basis. Realized gains and losses on sales of securities are calculated on the identified cost basis. Dividend income is recorded on the ex-dividend date and interest income is recorded on an accrual basis. Withholding taxes on foreign dividends have been provided for in accordance with the Fund’s understanding of the applicable country’s tax rules and rates.
Distributions to Shareholders – The character of distributions made during the year from net investment income or net realized gains may differ from the characterization for federal income tax purposes due to differences in the recognition of income, expense or gain items for financial statement and tax purposes. To the extent that these differences are attributable to permanent book and tax accounting differences, the components of net assets have been adjusted.
Redemption Fee – A 1.50% redemption fee is retained by the Fund to offset transaction costs and other expenses associated with short-term investing. The fee is imposed on redemptions or exchanges of shares held less than three months from their purchase date. The Fund records the fee as a reduction of shares redeemed and as a credit to shares of beneficial interest. For the year six months May 31, 2022, the Investor Class and the Advisor Class received $1,887 and $14,105 in redemption fees, respectively.
Guarantees and Indemnifications – In the normal course of business, the Fund enters into contracts with service providers that contain general indemnification clauses. Also, under the Fund’s organizational documents, its officers and Trustees are indemnified by the Fund against certain liabilities arising out of the performance of their duties to the Fund. The Fund notes that insofar as indemnification for liabilities arising under the Securities Act of 1933 may be permitted to trustees and officers, the Fund has been advised that in the opinion of the Securities and Exchange Commission (the “SEC”) such indemnification is against public policy as expressed in that Act and is, therefore, unenforceable. The Fund’s maximum exposure under these arrangements is unknown as this would involve future claims against the Fund that have not yet occurred. Based on experience, the Fund expects the risk of loss to be remote.
– 20 –
OCM GOLD FUND
Notes to Financial Statements – May 31, 2022 (Continued) |
Use of Estimates – The preparation of financial statements in conformity with accounting principles generally accepted in the United States of America requires management to make estimates and assumptions that affect the reported amounts of assets and liabilities and disclosure of contingent assets and liabilities at the date of the financial statements and the reported amounts of increases and decreases in net assets from operations during the reporting period. Actual results could differ from those estimates.
Derivative Instruments – Equity securities in the gold mining industry, particularly the smaller companies, may occasionally issue warrants as part of their capital structure. A warrant gives the holder the right to purchase the underlying equity at the exercise price until the expiration date of the warrant. The Fund may hold such warrants for exposure to smaller companies in the portfolio or other reasons associated with the Fund’s overall objective of long-term growth, though warrants will typically not be a significant part of the Fund’s portfolio. The Fund’s maximum risk in holding warrants is the loss of the entire amount paid for the warrants. At May 31, 2022, the Fund held warrants as listed on the Schedule of Investments.
Note 3. Investment Advisory Agreement and Affiliated Parties
The Fund has an investment advisory agreement with Orrell Capital Management, Inc. (“OCM” or the “Adviser”). Under the agreement, the Fund pays OCM a fee computed daily and payable monthly, at the following annual rates based upon average daily net assets:
Assets | Fee Rate |
$0 to $250 million | 0.950% |
$250 million to $500 million | 0.800% |
$500 million to $1 billion | 0.700% |
Over $1 billion | 0.600% |
Under the investment advisory agreement, the Adviser is responsible for reimbursing the Fund to maintain a voluntary ratio of expenses to average daily net assets for the Investor Class shares and Advisor Class shares at 2.99% and 2.49%, respectively.
The Fund does not compensate Trustees and Officers affiliated with OCM. For the six months ended May 31, 2022, the expenses accrued for Trustees who are not affiliated with OCM are reported on the Statement of Operations. The Fund pays fees and related expenses for the services of the Fund’s Chief Compliance Officer. The expenses incurred for the Chief Compliance Officer are reported on the Statement of Operations.
– 21 –
OCM GOLD FUND
Notes to Financial Statements – May 31, 2022 (Continued) |
Note 4. Distribution Agreement and Plan
The Trust has adopted a Distribution Plan (the “Plan”) pursuant to Rule 12b-1 under the Investment Company Act of 1940, as amended. The Plan authorizes the Fund to reimburse the distributor for marketing expenses incurred in distributing shares of the Fund, including the cost of printing sales material and making payments to dealers of the Fund’s Investor Class and Advisor Class, in any fiscal year, subject to limits of 0.99% and 0.25%, respectively, of the average daily net assets of each respective class. For the six months ended May 31, 2022, the Investor Class and the Advisor Class incurred $55,358 and $38,025, respectively, in expenses under the Plan.
Note 5. Purchases and Sales of Securities
Purchases and sales of investment securities (excluding short-term securities and U.S. government obligations) for the six months ended May 31, 2022 were $3,322,042 and $5,762,652, respectively. There were no purchases or sales of U.S. government obligations.
Note 6. Federal Income Tax Information
At May 31, 2022, gross unrealized appreciation and depreciation of investments owned by the Fund, based on cost for federal income tax purposes were as follows:
Cost of investments | $ | 33,143,859 | ||
Unrealized appreciation on investments | $ | 33,976,626 | ||
Unrealized depreciation on investments | (3,939,243 | ) | ||
Net unrealized appreciation on investments... | $ | 30,037,383 |
The difference between cost amounts for financial statement and federal income tax purposes is due primarily to investments in passive foreign investment companies (“PFICs”).
The tax character of distributions paid during the fiscal years ended November 30, 2021 and 2020 was as follows:
2021 | 2020 | |||||||
Ordinary income | $ | 216,984 | $ | — | ||||
Net long-term capital gains | 859,733 | 2,281,744 | ||||||
Total distributions | $ | 1,076,717 | $ | 2,281,744 | ||||
– 22 –
OCM GOLD FUND
Notes to Financial Statements – May 31, 2022 (Continued) |
As of November 30, 2021, the components of accumulated earnings on a tax basis were as follows:
Undistributed ordinary income | $ | — | ||
Undistributed long-term gains | — | |||
Tax accumulated earnings | — | |||
Accumulated capital and other losses | (504,156 | ) | ||
Unrealized appreciation on investments. | 33,888,098 | |||
Unrealized depreciation on foreign currency | (558 | ) | ||
Total accumulated earnings | $ | 33,383,384 |
The Fund has $504,156 in qualified late-year losses, which are deferred until fiscal year 2022 for tax purposes. Net late-year ordinary losses incurred after December 31 and within the taxable year and net late-year specified losses incurred after October 31 and within the taxable year are deemed to arise on the first day of the Fund’s next taxable year.
Note 7. Concentration of Risk
Investing in foreign securities involves certain risks not necessarily found in U.S. markets. These include risks associated with adverse changes in economic, political, regulatory and other conditions, changes in currency exchange rates, exchange control regulations, expropriation of assets or nationalization, imposition of withholding taxes on dividend or interest payments or capital gains, and possible difficulty in obtaining and enforcing judgments against foreign entities. Further, issuers of foreign securities are subject to different, and often less comprehensive, accounting, reporting, and disclosure requirements than domestic issuers.
As the Fund concentrates its investments in the gold mining industry, a development adversely affecting the industry (for example, changes in the mining laws which increases production costs or a significant decrease in the market price of gold) would have a greater adverse effect on the Fund than it would if the Fund invested in a number of different industries.
Note 8. Illiquid Securities
Pursuant to Rule 22e-4 under the 1940 Act, the Fund has adopted a Liquidity Risk Management Program (“LRMP”) that requires, among other things, that the Fund limits its illiquid investments that are assets to no more than 15% of net assets. An illiquid investment is any security which may not reasonably be expected to be sold or disposed of in current market conditions in seven calendar days or less without the sale or disposition significantly
– 23 –
OCM GOLD FUND
Notes to Financial Statements – May 31, 2022 (Continued) |
changing the market value of the investment. If the Advisor, at any time, determines that the value of illiquid securities held by the Fund exceeds 15% of its net asset value, the Advisor will take such steps as it considers appropriate to reduce them as soon as reasonably practicable in accordance with the Fund’s written LRMP.
Note 9. Market Disruption and Geopolitical Risks
Certain local, regional or global events such as war, acts of terrorism, the spread of infectious illness or other public health issues, or other events could have a significant impact on a security or instrument. Since 2020, the novel strain of coronavirus (COVID-19) has negatively affected the worldwide economy, as well as the economies of individual countries, the financial health of individual companies and the market in general in significant and unforeseen ways. Following Russia’s large-scale invasion of Ukraine, the President of the United States signed an Executive Order in February 2022 prohibiting U.S. persons from entering transactions with the Central Bank of Russia and Executive Orders in March 2022 prohibiting U.S. persons from importing oil and gas from Russia as well as other popular Russian exports, such as diamonds, seafood and vodka. There may also be restrictions on investments in Chinese companies. For example, the President of the United States of America signed an Executive Order in June 2021 affirming and expanding the U.S. policy prohibiting U.S. persons from purchasing or investing in publicly-traded securities of companies identified by the U.S. Government as “Chinese Military-Industrial Complex Companies.” The list of such companies can change from time to time, and as a result of forced selling or an inability to participate in an investment the Advisor otherwise believes is attractive, the Fund may incur losses. The duration of the coronavirus outbreak and the Russian-Ukraine conflict could adversely affect the Fund’s performance, the performance of the securities in which the Fund invests and may lead to losses on your investment. The ultimate impact of COVID-19 and Russia Invasion on the financial performance of the Fund’s investments is not reasonably estimable at this time. Management is actively monitoring these events.
Note 10. New Accounting Pronouncements
In October 2020, the SEC adopted new regulations governing the use of derivatives by registered investment companies (“Rule 18f-4”). Rule 18f-4 will impose limits on the amount of derivatives a Fund can enter into, eliminate the asset segregation framework currently used by funds to comply with Section 18 of the 1940 Act, and require funds whose use of derivatives is greater than a limited specified amount to establish and maintain a comprehensive derivatives risk management program and appoint a derivatives risk manager. Funds will be required to comply with Rule 18f-4 by August 19, 2022. It is not currently clear what impact, if any, Rule 18f-4 will have on the availability, liquidity or performance of derivatives. Management is currently evaluating the potential impact of Rule 18f-4 on the Fund(s). When fully implemented, Rule 18f-4 may require changes in how a Fund uses derivatives, adversely affect the Fund’s performance and increase costs related to the Fund’s use of derivatives.
– 24 –
OCM GOLD FUND
Notes to Financial Statements – May 31, 2022 (Continued) |
In December 2020, the SEC adopted a new rule providing a framework for fund valuation practices (“Rule 2a-5”). Rule 2a-5 establishes requirements for determining fair value in good faith for purposes of the 1940 Act. Rule 2a-5 will permit fund boards to designate certain parties to perform fair value determinations, subject to board oversight and certain other conditions. Rule 2a-5 also defines when market quotations are “readily available” for purposes of the 1940 Act and the threshold for determining whether a fund must fair value a security. In connection with Rule 2a-5, the SEC also adopted related recordkeeping requirements and is rescinding previously issued guidance, including with respect to the role of a board in determining fair value and the accounting and auditing of fund investments. The Fund will be required to comply with the rules by September 8, 2022. The Fund is currently evaluating the impact, if any, of applying this provision.
Note 11. Subsequent Events
Management has evaluated events and transactions for potential recognition or disclosure through the date the financial statements were issued. Management has determined there are no material events that would require disclosure in the Fund’s financial statements through this date.
– 25 –
OCM GOLD FUND
Financial Highlights Investor Class |
Six Months | Year | Year | Year | Year | Year | |||||||||||||||||||
Per Share Operating Performance | ||||||||||||||||||||||||
(For a share outstanding throughout each period) | ||||||||||||||||||||||||
Net asset value, beginning of period | $ | 11.71 | $ | 11.94 | $ | 8.62 | $ | 7.05 | $ | 9.26 | $ | 11.12 | ||||||||||||
Income from Investment Operations: | ||||||||||||||||||||||||
Net investment loss1 | (0.05 | ) | (0.11 | ) | (0.16 | ) | (0.14 | ) | (0.19 | ) | (0.21 | ) | ||||||||||||
Net realized and unrealized gain (loss) on investments and foreign currency transactions | (0.66 | ) | 0.01 | 4.05 | 3.37 | (1.36 | ) | 0.10 | ||||||||||||||||
Net increase from payments by affiliates (Note 3) | — | — | — | 2 | — | — | — | |||||||||||||||||
Total from investment operations | (0.71 | ) | (0.10 | ) | 3.89 | 3.23 | (1.55 | ) | (0.11 | ) | ||||||||||||||
Less Distributions: | ||||||||||||||||||||||||
Dividends from net investment income | — | (0.08 | ) | — | — | — | — | |||||||||||||||||
Distribution from net realized gains | (0.12 | ) | (0.05 | ) | (0.57 | ) | (1.66 | ) | (0.66 | ) | (1.75 | ) | ||||||||||||
Total distributions | (0.12 | ) | (0.13 | ) | (0.57 | ) | (1.66 | ) | (0.66 | ) | (1.75 | ) | ||||||||||||
Redemption fee proceeds | — | 2 | — | 2 | — | 2 | — | 2 | — | 2 | — | 2 | ||||||||||||
Net asset value, end of period | $ | 10.88 | $ | 11.71 | $ | 11.94 | $ | 8.62 | $ | 7.05 | $ | 9.26 | ||||||||||||
Total return* | (6.04 | )%3 | (0.95 | )% | 48.15 | % | 56.65 | % | (18.24 | )% | 0.94 | % | ||||||||||||
Ratios/Supplemental Data: | ||||||||||||||||||||||||
Net assets, end of year (in 000’s) | $ | 15,290 | $ | 17,024 | $ | 18,343 | $ | 22,467 | $ | 17,146 | $ | 30,492 | ||||||||||||
Ratio of expenses to average net assets | 2.24 | %4 | 2.19 | % | 2.29 | % | 2.91 | % | 2.93 | % | 2.78 | % | ||||||||||||
Ratio of net investment loss to average net assets | (0.92 | )%4 | (0.89 | )% | (1.53 | )% | (1.89 | )% | (2.27 | )% | (2.17 | )% | ||||||||||||
Portfolio turnover rate | 5 | %3 | 11 | % | 1 | % | 18 | % | 6 | % | 10 | % | ||||||||||||
* | Assumes no sales charge |
1 | Based on average shares method. |
2 | Amount represents less than $0.01 per share. |
3 | Not annualized. |
4 | Annualized. |
See notes to financial statements.
– 26 –
OCM GOLD FUND
Financial Highlights Advisor Class |
Six Months | Year | Year | Year | Year | Year | |||||||||||||||||||
Per Share Operating Performance | ||||||||||||||||||||||||
(For a share outstanding throughout each period) | ||||||||||||||||||||||||
Net asset value, beginning of period | $ | 13.21 | $ | 13.46 | $ | 9.57 | $ | 7.58 | $ | 9.86 | $ | 11.63 | ||||||||||||
Income from Investment Operations: | ||||||||||||||||||||||||
Net investment loss1 | (0.03 | ) | (0.05 | ) | (0.13 | ) | (0.11 | ) | (0.15 | ) | (0.15 | ) | ||||||||||||
Net realized and unrealized gain (loss) on investments and foreign currency transactions | (0.74 | ) | — | 4.54 | 3.71 | (1.47 | ) | 0.12 | ||||||||||||||||
Net increase from payments by affiliates (Note 3) | — | — | — | 2 | — | — | — | |||||||||||||||||
Total from investment operations | (0.77 | ) | (0.05 | ) | 4.41 | 3.60 | (1.62 | ) | (0.03 | ) | ||||||||||||||
Less Distributions: | ||||||||||||||||||||||||
Dividends from net investment income | — | (0.16 | ) | — | — | — | — | |||||||||||||||||
Distribution from net realized gains | (0.12 | ) | (0.05 | ) | (0.57 | ) | (1.66 | ) | (0.66 | ) | (1.75 | ) | ||||||||||||
Total distributions | (0.12 | ) | (0.21 | ) | (0.57 | ) | (1.66 | ) | (0.66 | ) | (1.75 | ) | ||||||||||||
Redemption fee proceeds | — | 2 | 0.01 | 0.05 | 0.05 | — | 2 | 0.01 | ||||||||||||||||
Net asset value, end of period | $ | 12.32 | $ | 13.21 | $ | 13.46 | $ | 9.57 | $ | 7.58 | $ | 9.86 | ||||||||||||
Total return | (5.80 | )%3 | (0.42 | )% | 49.40 | % | 58.54 | %4 | (17.81 | )%4 | 1.81 | % | ||||||||||||
Ratios/Supplemental Data: | ||||||||||||||||||||||||
Net assets, end of year (in 000’s) | $ | 47,806 | $ | 51,390 | $ | 55,603 | $ | 12,507 | $ | 6,624 | $ | 7,106 | ||||||||||||
Ratio of expenses to average net assets | 1.74 | %5 | 1.69 | % | 1.79 | % | 2.38 | % | 2.31 | % | 2.05 | % | ||||||||||||
Ratio of net investment loss to average net assets | (0.42 | )%5 | (0.39 | )% | (1.03 | )% | (1.36 | )% | (1.65 | )% | (1.44 | )% | ||||||||||||
Portfolio turnover rate | 5 | %3 | 11 | % | 1 | % | 18 | % | 6 | % | 10 | % | ||||||||||||
1 | Based on average shares method. |
2 | Amount represents less than $0.01 per share. |
3 | Not annualized. |
4 | Total returns would have been higher/lower had expenses not been waived/recovered by the Adviser. |
5 | Annualized. |
See notes to financial statements.
– 27 –
OCM GOLD FUND
Expense Example – For the Period Ended May 31, 2022 |
As a shareholder of the OCM Gold Fund (the “Fund”), you incur two types of costs: (1) transaction costs, including sales charges (loads) on purchase payments and redemption fees on certain redemptions; and (2) ongoing costs, including management fees; distribution (12b-1) fees; and other Fund expenses. This Example is intended to help you understand your ongoing costs (in dollars) of investing in the Fund and to compare these costs with the ongoing costs of investing in other mutual funds.
The Example is based on an investment of $1,000 invested at the beginning of the period and held for the entire period from December 1, 2021 to May 31, 2022 (the “period”).
Actual Expenses
The row titled “Actual” in the table below provides information about actual account values and actual expenses. You may use this information, together with the amount you invested, to estimate the expenses you paid over the period. Simply divide your account value by $1,000 (for example, an $8,600 account value divided by $1,000 equals 8.6), then multiply the result by the number in the appropriate line for your share class under the heading entitled “Expenses Paid During the Period” to estimate the expenses you paid on your account during the periods.
Hypothetical Example for Comparison Purposes
The row titled “Hypothetical” in the table below provides information about hypothetical account values and hypothetical expenses based on each class’ actual expense ratio and an assumed rate of return of 5% per year before expenses, which is not each class’ actual return. The hypothetical account values and expenses may not be used to estimate the actual ending account balance or expenses you paid for the period. You may use this information to compare the ongoing costs of investing in the classes of the Fund and other funds. To do so, compare these 5% hypothetical examples with the 5% hypothetical examples that appear in the shareholder reports of other funds.
Please note that the expenses shown in the table are meant to highlight your ongoing costs only and do not reflect any transactional costs, such as sales charges (loads) and redemption fees. Therefore, the hypothetical lines of the table are useful in comparing the ongoing costs only, and will not help you determine the relative total costs of owning different funds. In addition, if these transactional costs were included, your costs would have been higher.
– 28 –
OCM GOLD FUND
Expense Example – For the Period Ended May 31, 2022 (Continued) |
Expenses Paid During the Period
Beginning | Ending | Expenses Paid | |
Investor Class | |||
Actual | $ 1,000.00 | $ 939.60 | $ 10.81 |
Hypothetical (5% return before expenses) | 1,000.00 | 1,013.78 | 11.23 |
Advisor Class | |||
Actual | 1,000.00 | 942.00 | 8.40 |
Hypothetical (5% return before expenses) | 1,000.00 | 1,016.28 | 8.73 |
* | Expenses are equal to the Investor Class’ and Advisor Class’ annualized expense ratios of 2.24% and 1.74%, respectively, for the period, multiplied by the average account value over the period, multiplied by 182/365 (to reflect the one-half year period). |
– 29 –
OCM GOLD FUND
Other Information |
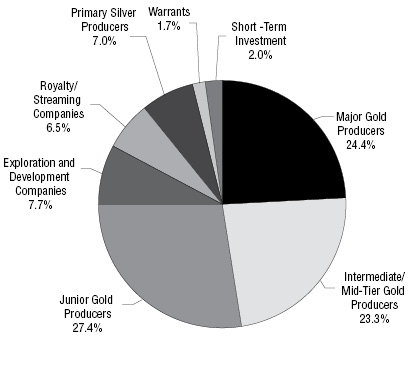
Investments by Sector – As of May 31, 2022
As a Percentage of Total Investments
The Fund files its complete schedule of portfolio holdings with the U.S. Securities and Exchange Commission (“SEC”) for the first and third quarters of each fiscal year as an exhibit to its reports on Form N-PORT. Shareholders may obtain the Fund’s Form N-PORT on the SEC’s website at http://www.sec.gov.
A description of the Fund’s proxy voting policies and procedures and a record of the Fund’s proxy votes for the year ended June 30, 2021 are available without charge, upon request by calling toll free 1-800-779-4681 and on the SEC’s website at http://www.sec.gov. The Fund’s proxy voting policies and procedures are also available on the Fund’s website at http://www.ocmgoldfund.com.
– 30 –
THIS PAGE INTENTIONALLY LEFT BLANK
THIS PAGE INTENTIONALLY LEFT BLANK
THIS PAGE INTENTIONALLY LEFT BLANK
OCM Gold Fund
Distributed by:
Northern Lights Distributors, LLC
17605 Wright Street
Omaha, NE 68130
6733-NLD-07252022
(b) The Registrant did not disseminate any information to shareholders specified by paragraph (c)(3) of Rule 30e-3 under the Act (17 CFR 270.30e-3).
Item 2. Code of Ethics.
Not applicable to semi-annual reports.
Item 3. Audit Committee Financial Expert.
Not applicable to semi-annual reports.
Item 4. Principal Accountant Fees and Services
Not applicable to semi-annual reports.
Item 5. Audit Committee of Listed Registrants
| (a) | Not applicable to semi-annual reports. |
| (b) | Not applicable. |
Item 6. Schedule of Investments
| (a) | The schedules of investments in securities in unaffiliated issuers are included as part of the reports to shareholders filed under Item 1. |
| (b) | Not applicable. |
Item 7. Disclosure of Proxy Voting Policies and Procedures for Closed-End Management Investment Companies
Not applicable.
Item 8. Portfolio Managers of Closed-End Management Investment Companies
Not applicable.
Item 9. Purchases of Equity Securities by Closed-End Management Investment Company and Affiliated Purchasers
Not applicable.
Item 10. Submissions of Matters to a Vote of Security Holders
As of the end of the period covered by this report, the registrant had not adopted any procedures by which shareholders may recommend nominees to the registrant’s Board of Directors.
Item 11. Controls and Procedures.
| (a) | The registrant's certifying officer has concluded that the registrant's disclosure controls and procedures (as defined in Rule 30a-2 under the Investment Company Act of 1940 (the "Act")) are effective in design and operation and are sufficient to form the basis of the certifications required by Rule 30a-2 under the Act, based on their evaluation of these disclosure controls and procedures within 90 days of the filing date of this report on Form N-CSR. |
| (b) | Not applicable. |
Item 12. Disclosure of Securities Lending Activities for Closed-End Management Investment Companies.
Not applicable.
Item 13. Exhibits.
(a)(1) Code of Ethics – Not applicable.
(a)(3) Any written solicitation to purchase securities under Rule 23c-1 under the Act sent or given during the period covered by the report by or on behalf of the registrant to 10 or more persons. Not applicable to open-end investment companies.
(a)(4) Change in the registrant’s independent public accountant – Not applicable.
SIGNATURES
Pursuant to the requirements of the Securities Exchange Act of 1934 and the Investment Company Act of 1940, the registrant has duly caused this report to be signed on its behalf by the undersigned, thereunto duly authorized.
OCM Mutual Fund
| By: | /s/ Gregory M. Orrell | |
| Gregory M. Orrell | ||
| President | ||
| Date: | July 29, 2022 |
Pursuant to the requirements of the Securities Exchange Act of 1934 and the Investment Company Act of 1940, this report has been signed below by the following persons on behalf of the registrant and in the capacities and on the dates indicated.
| By: | /s/ Steven Orrell | |
| Steven Orrell | ||
| Secretary and Treasurer | ||
| Date: | July 29, 2022 |