UNITED STATES
SECURITIES AND EXCHANGE COMMISSION
Washington, D.C. 20549
FORM N-CSR
CERTIFIED SHAREHOLDER REPORT OF REGISTERED MANAGEMENT INVESTMENT COMPANIES
Investment Company Act File Number811-04010
OCM Mutual Fund
(Exact name of registrant as specified in charter)
2600 Kitty Hawk Road, Suite 119
Livermore, California 94551
(Address of principal executive offices) (Zip code)
Gregory M. Orrell
Orrell Capital Management, Inc
2600 Kitty Hawk Road, Suite 119
Livermore, California 94551
(Name and address of agent for service)
Registrant's telephone number, including area code:(925) 455-0802
Date of fiscal year end:November 30
Date of reporting period:May 31, 2019
Item 1. Report to Stockholders.

Semi-Annual Report
May 31, 2019
(Unaudited)
Beginning on January 1, 2021, as permitted by regulations adopted by the Securities and Exchange Commission, paper copies of the Fund’s shareholder reports will no longer be sent by mail, unless you specifically request paper copies of the reports from your financial intermediary, such as a broker-dealer or bank. Instead, the reports will be made available on a website, and you will be notified by mail each time a report is posted and provided with a website link to access the report.
If you already elected to receive shareholder reports electronically, you will not be affected by this change and you need not take any action. Please contact your financial intermediary to elect to receive shareholder reports and other Fund communications electronically. For direct account shareholders, please call 1-800-628-9403.
You may elect to receive all future reports in paper free of charge. Please contact your financial intermediary to inform them that you wish to continue receiving paper copies of your shareholder reports and for details about whether your election to receive reports in paper will apply to all funds held with your financial intermediary. For direct account shareholders, please call 1-800-628-9403.
OCM GOLD FUND
Shareholder Letter – May 31, 2019 |
Dear Fellow Shareholder:
The prospect the Federal Reserve may pause or reverse course on its interest rate hiking cycle amidst a slowing global economy underpinned a relatively strong performance by your OCM Gold Fund (the “Fund”) over the six-month fiscal period ended May 31, 2019. The Fund’s Investor Class appreciated 15.58% (+10.41% after maximum sales load) while the Advisor Class gained 16.30% compared to 9.35% gain in the Philadelphia Gold and Silver Index1 (“XAU”) and +0.74% for the S&P 500 Index2. The price of gold bullion at May 31, 2019 closed at $1,295.55 based on the London PM fix3, up 6.41% during the six-month period. Your Fund benefited from its active management style over the period versus the passive performance of the XAU.
Market Commentary
There would appear to be a disconnect between the buoyancy of equity markets and the recessionary signal being delivered by the U.S. bond market where the yield curve has inverted. At times during the fiscal period and after, 3-month U.S. Treasury Bills were yielding more than the 10 Year U.S. Treasury Note, a phenomenon known as a “yield curve inversion.” The bond market, through yield curve inversions, has an unblemished history since Nixon closed the Gold Window in 1971 of forecasting recessions ahead of the Federal Reserve4 (the “Fed”) by approximately 18 months. Yet equity markets are ignoring the signal along with a litany of economic and geopolitical concerns.
After declining 9.03% in December last year, the S&P 500 quickly recaptured lost ground in the first quarter of 2019 on the back of comments by Fed Chairman Jerome Powell in January that the Fed “would be patient” raising rates, a reversal from the Fed’s hawkish position a few weeks earlier. Basically, Powell signaled to the market an end to the rate hike cycle, but more importantly in our opinion, reinforced belief that the Fed’s monetary policy is held hostage by financial asset prices. The Fed and world central banks have demonstrated repeatedly that it will counter serious financial asset weakness with aggressive policy measures of lowering interest rates and quantitative easing5 (“QE”) at the expense of currency debasement and uncertain outcomes. On Wall Street it is referred to as “The Fed Put.” We believe central bank actions have consequently lulled investors into a false sense that market risk has been mitigated leading to a mispricing of risk in financial assets vs. gold assets.
In our opinion, some of the factors that will lead to capital flows gravitating back toward gold assets include the following:
● | The Federal Reserve and world central banks failed to “normalize” interest rates and monetary policy ahead of the current global economic slowdown leaving little room to lower interest rates prior to resorting to extreme policy measures, such as QE, to counter recessionary forces. Historically, the Fed has needed 5% of interest rate cuts to counter recessions. It only has half that to maneuver with if a recession takes hold. Bank of Japan and the European Central Bank interest rates are already at zero. |
– 1 –
OCM GOLD FUND
Shareholder Letter – May 31, 2019 (Continued) |
● | The growth of investment grade corporate debt and government bonds carrying a negative yield has risen 50% to $12 trillion from the end of 2018, predominantly in Europe and Japan. The growth of non-incoming producing assets that are someone else’s liability will drive capital to gold, in our opinion. |
● | The rise of Democratic Socialism highlights the domestic conflict associated with the widening wealth gap between those with financial assets (capitalists) that have benefited from the $15 trillion central banks have pushed into the financial system since 2008 versus those who are in debt (student loans, etc.), working and living pay check to pay check. We believe potential Democratic Party political gains in the November 2020 election would no doubt hasten calls for wealth transfer through student debt forgiveness, higher minimum wages, universal health care, higher education subsidies and reversal of the Trump corporate tax reduction. |
● | Total U.S. Federal debt outstanding continues to outpace economic growth (5.6% vs. 2.9%) despite a ten-year economic expansion in the U.S. Total Federal Debt outstanding as of May 31, 2019 was $22 trillion or a record 106% of Gross Domestic Product6 (“GDP”). Obligations off balance sheet that are rapidly maturing due to demographics, such as pension, social security and Medicare obligations are estimated to raise total federal liabilities to $70 trillion. We believe a recession will accelerate deficit spending possibly leading to a downgrade in U.S. credit rating. Further, since 1971 gold prices are 90% correlated to total federal debt outstanding over time. |
● | Trade conflicts and the use of economic sanctions highlight geopolitical tension that is driving countries to seek alternatives to U.S. dollar hegemony along with heightening competition for greater share of the global economy. |
● | Central Bank gold purchases are at the highest level since 1967. Russia, China, India, Poland and Hungary have all added to central bank gold reserves over the first half of 2019 as central banks move to reduce reliance on dollar reserves. |
● | As of the end of March, worldwide debt totaled $246.5 trillion (320% of global GDP), according to the Institute of International Finance7. A level that has historically led to economic crises in individual countries. In our opinion, with half the debt outstanding issued by sovereign countries, the probability of direct monetization of debt in an economic downturn is likely. |
Shares of Gold Mining Companies
The need for owning gold assets as an uncorrelated hedge against financial asset risk has generally been cast aside by investors and their advisers as the bull market in equities has matured. It is our belief the low for shares of gold mining companies coincided with the Federal Reserve’s first-rate hike off zero in December 2015. Yet sentiment toward shares of gold mining companies, in our opinion, did not bottom until the fourth quarter of 2018, despite the
– 2 –
OCM GOLD FUND
Shareholder Letter – May 31, 2019 (Continued) |
XAU significantly outperforming the S&P 500 Index for the three-year period ending December 31, 2018 (returns shown are annualized, XAU +16.73% vs. S&P 500 Index +9.26%). The present washed-out investor sentiment toward the gold mining sector reminds us of 1999/2000 when the Nasdaq and consumer confidence were peaking perhaps in similar fashion as today.
In our opinion, the gold mining industry overall may be poised to deliver strong sustainable returns to shareholders in a rising gold price environment as the lessons of poor capital allocation remains fresh in the minds of both investors and management from the previous gold price cycle. Further, the industry appears to be embracing technological advances to control costs and improve operating margins, such as autonomous trucks, underground mobile miners, electric vehicles, x-ray diffraction and sensor-based ore sorting. The gold mining industry will likely continue to be challenged to find and replace depleting reserves along with navigating long lead times from discovery to production.
Your Fund’s investment strategy remains a disciplined approach to searching out value and growth opportunities across all segments of the gold and silver mining industry on a global basis. We believe companies that possess strong management, large reserves in the ground in stable jurisdictions, and exhibit capital discipline while holding equity dear may be the companies that outperform over time. We are specifically targeting companies with existing production that possess large reserve expansion potential where shareholder value can be created through the drill bit. Your Fund has the flexibility to maneuver within the precious metals sector to invest in opportunities that larger funds and exchange traded funds may not be able to; from major gold producers with over one million ounces of annual production to junior gold producers with less than 100,000 ounces of annual production to small exploration and development companies with micro capitalizations.
Conclusion
Should the inverted yield curve accurately forecast a coming recession, focus may turn to the limited fire power available to central banks to fight off recessionary forces at a time when there are calls for increased social spending. The alternative monetary policy measures beyond lowering rates, such as QE, all promise to seriously debase the value of paper currencies and carry uncertain outcomes, in our opinion. The possibility of an international reset of the global monetary system may be in the cards should world central banks run out of stimulus options that are palpable to the markets. The U.S. dollar as the world’s reserve currency could come under threat. The steady accumulation of gold by Russian and Chinese central banks along with several other central banks may be a precursor of countries looking for an alternative to U.S. dollar hegemony. We believe gold assets stand to gain as investors become less complacent about the risks at hand and once again appreciate gold’s monetary aspects.
– 3 –
OCM GOLD FUND
Shareholder Letter – May 31, 2019 (Continued) |
We appreciate your shareholding and confidence in the Fund, and we look forward to meeting the investment objective of preserving your purchasing power. Should you have any questions regarding the Fund or gold, please contact your financial adviser or you may contact us directly at 1-800-779-4681. For questions regarding your account, please contact Shareholder Service at 1-800-628-9403.
Sincerely,

Gregory M. Orrell
Portfolio Manager
July 19, 2019
XAU1, Philadelphia Gold and Silver Index, is an unmanaged capitalization-weighted index composed of 16 companies listed on U.S. exchanges involved in the gold and silver mining industry.
S&P 5002 is a registered trademark of McGraw-Hill Co., Inc. is a market capitalization-weighted index of 500 widely held common stocks. You cannot invest directly in an index.
London PM Fix3 is the price per ounce for each of the precious metals (gold, silver, platinum and palladium) determined daily at 10:30 and 15:00 GMT by a brief conference call among the five members of the London Gold Pool (Scotia-Mocatta, Barclays Capital, Deutsche Bank, HSBC and Société Générale). The London spot fix price is the price fixed at the moment when the conference call terminates.
Federal Reserve4, the central bank of the United States, and arguably the most powerful financial institution in the world. The Federal Reserve System was founded by the U.S. Congress in 1913 to provide the nation with a safe, flexible, and stable monetary and financial system.
Quantitative easing5 is an unconventional monetary policy in which a central bank purchases government securities or other securities from the market in order to increase the money supply and encourage lending and investment.
GDP6, gross domestic product, is the monetary value of all the finished goods and services produced within a country’s borders in a specific time period.
Institute of International Finance7 is the global association of the financial industry.
– 4 –
OCM GOLD FUND
Shareholder Letter – May 31, 2019 (Continued) |
Investors should carefully consider the investment objectives, risks, charges and expenses of the Fund. This and other important information about the Fund is contained in the Fund’s Prospectus, which can be obtained by calling 1-800-779-4681. The Prospectus should be read carefully before investing. Funds are distributed by Northern Lights Distributors, LLC, FINRA/SIPC. Orrell Capital Management, Inc. and Northern Lights Distributors are not affiliated.
Investing in the Fund involves risks including the loss of principal. Many of the companies in which the Fund invests are smaller capitalization companies which may subject the fund to greater risk than securities of larger, more-established companies, as they often have limited product lines, markets or financial resources and may be subject to more-abrupt market movements. The Fund also invests in securities of gold and precious metals which may be subject to greater price fluctuations over short periods of time. The Fund is a non-diversified investment company meaning it will invest in fewer securities than diversified investment companies and its performance may be more volatile. The Fund contains international securities that may provide the opportunity for greater return but also have special risks associated with foreign investing including fluctuations in currency, government regulation, differences in accounting standards and liquidity.
Investor Class Performance as of May 31, 2019
OCMGX | OCMGX | Philadelphia | S&P 5002 | ||
Six Months | 15.58% | 10.41% | 9.35% | 0.74% | |
One Year | (6.87)% | (11.04)% | (15.08)% | 3.78% | |
3 Year Annualized | (2.91)% | (4.40)% | (3.86)% | 11.72% | |
5 Year Annualized | (0.89)% | (1.80)% | (3.01)% | 9.66% | |
10 Year Annualized | (4.08)% | (4.52)% | (6.88)% | 13.95% |
– 5 –
OCM GOLD FUND
Shareholder Letter – May 31, 2019 (Continued) |
Advisor Class Performance as of May 31, 2019
OCMAX | Philadelphia | S&P 5002 | ||
Six Months | 16.30% | 9.35% | 0.74% | |
One Year | (6.12)% | (15.08)% | 3.78% | |
3 Year Annualized | (2.12)% | (3.86)% | 11.72% | |
5 Year Annualized | (0.13)% | (3.01)% | 9.66% | |
Since Inception Annualized* | (4.87)% | (7.85)% | 12.10% |
* | Inception: April 1, 2010 |
The performance data quoted above represents past performance. Current performance may be lower or higher than the performance data quoted above. Past performance is no guarantee of future results. The investment return and principal value of an investment will fluctuate so that investor’s shares, when redeemed, may be worth more or less than their original cost. The Fund’s Total Annual Operating Expenses for the Fund’s Investor Class and Advisor Class are 2.86% and 2.36% respectively. Please review the Fund’s prospectus for more information regarding the Fund’s fees and expenses. For performance information current to the most recent month-end, please call toll-free 800-628-9403. The returns shown include the reinvestment of all dividends but do not reflect the deduction of taxes that a shareholder would pay on Fund distributions or the redemption of Fund shares.
1 | The Philadelphia Gold and Silver Index (XAU) is an unmanaged capitalization-weighted index composed of 16 companies listed on U.S. exchanges involved in the gold and silver mining industry. The index is generally considered as representative of the gold and silver share market. You cannot invest directly in an index. |
2 | The S&P 500 Index, a registered trademark of McGraw-Hill Co., Inc. is a market capitalization-weighted index of 500 widely held common stocks. You cannot invest directly in an index. |
– 6 –
OCM GOLD FUND
Schedule of Investments – May 31, 2019 |
Shares |
| |||||||
COMMON STOCKS 98.3% | ||||||||
Major Gold Producers 38.2% | ||||||||
| 65,000 | Agnico Eagle Mines Ltd. | $ | 2,833,350 | |||||
| 110,000 | AngloGold Ashanti Ltd. ADR | 1,461,900 | ||||||
| 200,000 | Barrick Gold Corp. | 2,484,000 | ||||||
| 65,000 | Newmont Goldcorp Corp. | 2,150,850 | ||||||
| 8,930,100 | |||||||
Intermediate/Mid-Tier Gold Producers 12.5% | ||||||||
| 200,000 | Alamos Gold, Inc. | 974,000 | ||||||
| 300,000 | B2Gold Corp.* | 819,029 | ||||||
| 75,000 | Endeavour Mining Corp.* | 1,119,784 | ||||||
| 2,912,813 | |||||||
Junior Gold Producers 31.6% | ||||||||
| 400,000 | Alacer Gold Corp.* | 1,204,498 | ||||||
| 450,000 | Argonaut Gold, Inc.* | 556,008 | ||||||
| 250,000 | Dundee Precious Metals, Inc.* | 691,773 | ||||||
| 150,000 | Fortuna Silver Mines, Inc.* | 387,319 | ||||||
| 6,700,000 | Jaguar Mining, Inc.* | 371,782 | ||||||
| 1,000,000 | Perseus Mining Ltd. | 315,621 | ||||||
| 550,000 | Roxgold, Inc.* | 451,687 | ||||||
| 325,000 | SEMAFO, Inc.* | 973,846 | ||||||
| 700,000 | Wesdome Gold Mines Ltd.* | 2,418,615 | ||||||
| 7,371,149 | |||||||
Exploration and Development Companies 4.1% | ||||||||
| 2,000,000 | Emmerson Resources Ltd.* | 101,276 | ||||||
| 2,000,000 | Intermin Resources Ltd.* | 145,671 | ||||||
| 500,000 | Oklo Resources Ltd.* | 55,494 | ||||||
| 2,000,000 | Royal Road Minerals Ltd.* | 266,351 | ||||||
| 4,578,755 | RTG Mining, Inc.* | 285,855 | ||||||
| 200,000 | Steppe Gold Ltd.* | 93,223 | ||||||
| 2,512,040 | Sutter Gold Mining, Inc.* † # | — | ||||||
| 947,870 | |||||||
Royalty/Streaming Companies 11.9% | ||||||||
| 6,500 | Royal Gold, Inc. | 571,935 | ||||||
| 100,000 | Wheaton Precious Metals Corp. | 2,211,453 | ||||||
| 2,783,388 | |||||||
Total Common Stocks | ||||||||
(Cost $11,675,519) | 22,945,320 | |||||||
WARRANTS 0.0% | ||||||||
Exploration and Development Companies 0.0% | ||||||||
| 1,000,000 | Emmerson Resources Ltd. Exercise Price 0.14 AUD, Exp. 9/30/2020*† | — | ||||||
| 200,000 | Steppe Gold Ltd. Exercise Price 2.34 CAD, Exp. 5/22/2020*† | — | ||||||
| — | |||||||
Total Warrants | ||||||||
(Cost $0) | — | |||||||
See notes to financial statements.
– 7 –
OCM GOLD FUND
Schedule of Investments – May 31, 2019 (Continued) |
Shares |
| |||||||
SHORT-TERM INVESTMENT 1.9% | ||||||||
| 446,775 | UMB Money Market Fiduciary, 0.25% | $ | 446,775 | |||||
Total Short-Term Investment | ||||||||
(Cost $446,775) | 446,775 | |||||||
Total Investments | |||||||||
(Cost $12,122,294) | 100.2 | % | 23,392,095 | ||||||
Liabilities less Other Assets | (0.2 | )% | (41,708 | ) | |||||
TOTAL NET ASSETS | 100.0 | % | $ | 23,350,387 | |||||
ADR – American Depository Receipt
AUD – Australian Dollars
CAD – Canadian Dollars
* | Non-income producing security. |
# | Level 3 security fair valued under procedures established by the Board of Trustees, represents 0.00% of Net Assets. The total value of this security is $0. |
† | Illiquid security. The total illiquid securities represent 0.00% of net assets. |
See notes to financial statements.
– 8 –
OCM GOLD FUND
Schedule of Investments – May 31, 2019 (Continued) |
SUMMARY OF INVESTMENTS BY COUNTRY
Country | Value | Percent of | ||||||
Australia | $ | 618,063 | 2.6% | |||||
Canada | 16,470,582 | 70.4 | ||||||
Cayman Islands | 1,119,784 | 4.8 | ||||||
Jersey | 266,351 | 1.1 | ||||||
South Africa | 1,461,900 | 6.3 | ||||||
United States1 | 3,169,560 | 13.6 | ||||||
Virgin Islands (British) | 285,855 | 1.2 | ||||||
Total | $ | 23,392,095 | 100.0% | |||||
1 | Includes short-term investments. |
See notes to financial statements.
– 9 –
OCM GOLD FUND
Statement of Assets and Liabilities – May 31, 2019 |
Assets: | ||||
Investments in unaffiliated issuers, at value (cost $12,122,294) | $ | 23,392,095 | ||
Interest and dividends receivable | 21,729 | |||
Receivable for fund shares sold | 1,800 | |||
Prepaid expenses and other assets | 26,970 | |||
Total assets | 23,442,594 | |||
Liabilities: | ||||
Accrued distribution fees | 35,265 | |||
Investment adviser fees | 12,593 | |||
Accrued transfer agent fees and expenses | 12,049 | |||
Accrued fund administration and accounting fees | 11,474 | |||
Accrued Trustees’ fees | 2,487 | |||
Accrued audit fees | 2,480 | |||
Accrued report to shareholders | 11,774 | |||
Accrued expenses and other liabilities | 4,085 | |||
Total liabilities | 92,207 | |||
Net Assets | $ | 23,350,387 | ||
Net Assets Consist of: | ||||
Shares of beneficial interest, no par value: unlimited shares authorized | $ | 11,302,677 | ||
Total distributable earnings | 12,047,710 | |||
Net Assets | $ | 23,350,387 | ||
Calculation of Maximum Offering Price: | ||||
Investor Class: | ||||
Net asset value and redemption price per share | $ | 6.36 | ||
Maximum sales charge (4.50% of offering price) | 0.30 | |||
Offering price to public | $ | 6.66 | ||
Shares outstanding | 2,788,529 | |||
Advisor Class: | ||||
Net asset value and redemption price per share | $ | 7.02 | ||
Shares outstanding | 798,947 | |||
Total Shares Outstanding | 3,587,476 |
See notes to financial statements.
– 10 –
OCM GOLD FUND
Statement of Operations - Six Months Ended May 31, 2019 |
Investment Income | ||||
Interest | $ | 908 | ||
Dividend (net of foreign withholding taxes of $7,458) | 221,516 | |||
Total investment income | 222,424 | |||
Expenses | ||||
Investment advisory fees | 120,049 | |||
Fund administration and accounting fees | 67,362 | |||
Distribution fees - Investor Class | 59,244 | |||
Transfer agent fees and expenses | 35,736 | |||
Federal and state registration fees | 21,218 | |||
Legal fees | 14,795 | |||
Chief Compliance Officer fees | 13,093 | |||
Custody fees | 9,387 | |||
Reports to shareholders | 8,220 | |||
Audit fees | 8,044 | |||
Distribution fees - Advisor Class | 5,283 | |||
Trustees’ fees | 4,987 | |||
Other expenses | 5,687 | |||
Total expenses | 373,105 | |||
Advisory fees waived | (12,878 | ) | ||
Net expenses | 360,227 | |||
Net investment loss | (137,803 | ) | ||
Realized and Unrealized Gain on Investments: | ||||
Net realized gain on investments and foreign currency transactions | 1,975,088 | |||
Net change in unrealized appreciation/depreciation on investments and foreign currency translations | 1,699,602 | |||
Net gain on investments | 3,674,690 | |||
Net increase in net assets from operations | $ | 3,536,887 |
See notes to financial statements.
– 11 –
OCM GOLD FUND
Statements of Changes in Net Assets |
Six Months Ended | Year Ended | |||||||
Operations: | ||||||||
Net investment loss | $ | (137,803 | ) | $ | (648,841 | ) | ||
Net realized gain on investments and foreign currency transactions | 1,975,088 | 5,776,178 | ||||||
Net change in unrealized appreciation/depreciation on investments and foreign currency transactions | 1,699,602 | (10,596,428 | ) | |||||
Net increase (decrease) in net assets from operations | 3,536,887 | (5,469,091 | ) | |||||
Distributions Paid to Shareholders | ||||||||
Distributions: | ||||||||
Investor Class | (4,021,862 | ) | (1,956,268 | ) | ||||
Advisor Class | (1,424,626 | ) | (469,844 | ) | ||||
Total | (5,446,488 | ) | (2,426,112 | ) | ||||
Fund Share Transactions | ||||||||
Investor Class: | ||||||||
Net proceeds from shares sold | 455,751 | 958,564 | ||||||
Distributions reinvested | 3,396,889 | 1,680,075 | ||||||
Payment of shares redeemed1 | (1,833,598 | ) | (9,718,380 | ) | ||||
Net increase (decrease) in net assets from Investor Class share transactions | 2,019,042 | (7,079,741 | ) | |||||
Advisor Class: | ||||||||
Net proceeds from shares sold | 1,877,415 | 2,833,285 | ||||||
Distributions reinvested | 1,027,514 | 460,500 | ||||||
Payment of shares redeemed2 | (3,433,637 | ) | (2,147,391 | ) | ||||
Net increase (decrease) in net assets from Advisor Class share transactions | (528,708 | ) | 1,146,394 | |||||
Net increase (decrease) in net assets from Fund share transactions | 1,490,334 | (5,933,347 | ) | |||||
Total decrease in net assets | (419,267 | ) | (13,828,550 | ) | ||||
Net Assets, Beginning of Period | 23,769,654 | 37,598,204 | ||||||
Net Assets, End of Period | $ | 23,350,387 | $ | 23,769,654 | ||||
See notes to financial statements.
– 12 –
OCM GOLD FUND
Statements of Changes in Net Assets (Continued) |
Six Months Ended | Year Ended | |||||||
Transactions in shares |
|
| ||||||
Investor Class: |
|
| ||||||
Shares sold | 69,256 | 111,912 | ||||||
Shares issued on reinvestment of distributions | 573,799 | 188,561 | ||||||
Shares redeemed | (287,785 | ) | (1,158,415 | ) | ||||
Net increase (decrease) in Investor Class shares outstanding | 355,270 | (857,942 | ) | |||||
Advisor Class: | ||||||||
Shares sold | 265,357 | 344,046 | ||||||
Shares issued on reinvestment of distributions | 157,836 | 48,321 | ||||||
Shares redeemed | (497,599 | ) | (239,411 | ) | ||||
Net increase (decrease) in Advisor Class shares outstanding | (74,406 | ) | 152,956 | |||||
Net Increase (Decrease) in Fund Shares Outstanding | 280,864 | (704,986 | ) | |||||
1 | Net of redemption fees of $17 for the six months ended May 31, 2019 and $3 for the year ended November 30, 2018, respectively. |
2 | Net of redemption fees of $15,627 for the six months ended May 31, 2019 and $1,554 for the year ended November 30, 2018, respectively. |
See notes to financial statements.
– 13 –
OCM GOLD FUND
Notes to Financial Statements – May 31, 2019 |
Note 1. Organization
OCM Mutual Fund (the “Trust”) is registered under the Investment Company Act of 1940, as amended, as an open-end management investment company. The Trust was organized as a Massachusetts business trust on January 6, 1984 and consists of the OCM Gold Fund (the “Fund”). The Fund is a non-diversified fund. The investment objective for the Fund is long-term growth of capital through investing primarily in equity securities of domestic and foreign companies engaged in activities related to gold and precious metals.
The Fund is an investment company and accordingly follows the investment company accounting and reporting guidance of the Financial Accounting Standards Board (“FASB”) Accounting Standard Codification Topic 946 “Financial Services—Investment Companies.”
Note 2. Significant Accounting Policies
The following is a summary of significant accounting policies followed by the Fund in the preparation of its financial statements.
Security Valuation – Portfolio securities that are listed on national securities exchanges, other than the NASDAQ Stock Market LLC, are valued at the last sale price as of the close of business of such securities exchanges, or, in the absence of recorded sales, at the average of readily available closing bid and ask prices on such exchanges. NASDAQ Global Select Market, Global Market and Capital Market securities are valued at the NASDAQ Official Closing Price (“NOCP”). If a NOCP is not issued for a given day, these securities are valued at the average of readily available closing bid and ask prices. Unlisted securities are valued at the average of the quoted bid and ask prices in the over-the-counter market. Short-term investments which mature in less than 60 days are valued at amortized cost (unless the Trust’s Board of Trustees determines that this method does not represent fair value). Short-term investments which mature after 60 days are valued at market. Securities and other assets for which market quotations are not readily available are valued at fair value as determined in good faith by the investment adviser under procedures established by and under the general supervision and responsibility of the Trust’s Board of Trustees. For each investment that is fair valued, the investment adviser considers, to the extent applicable, various factors including, but not limited to, the type of security, the financial condition of the company, comparable companies in the public market, the nature and duration of the cause for a quotation not being readily available and other relevant factors.
Fair Value Measurements and Disclosures defines fair value, establishes a framework for measuring fair value in accordance with GAAP, and expands disclosure about fair value measurements. It also provides guidance on determining when there has been a significant decrease in the volume and level of activity for an asset or a liability, when a transaction is not orderly, and how that information must be incorporated into a fair value measurement.
Under Fair Value Measurements and Disclosures, various inputs are used in determining the value of the Fund’s investments. These inputs are summarized into three broad levels as described below:
– 14 –
OCM GOLD FUND
Notes to Financial Statements – May 31, 2019 (Continued) |
● | Level 1 – Unadjusted quoted prices in active markets for identical assets or liabilities that the Fund has the ability to access. |
● | Level 2 – Observable inputs other than quoted prices included in Level 1 that are observable for the asset or liability, either directly or indirectly. These inputs may include quoted prices for the identical instrument on an inactive market, prices for similar instruments, interest rates, prepayment speeds, credit risk, yield curves, default rates and similar data. |
● | Level 3 – Unobservable inputs for the asset or liability, to the extent relevant observable inputs are not available, representing the Fund’s own assumptions about the assumptions a market participant would use in valuing the asset or liability, and would be based on the best information available. |
The availability of observable inputs can vary from security to security and is affected by a wide variety of factors, including for example, the type of security, whether the security is new and not yet established in the marketplace, the liquidity of markets, and other characteristics particular to the security. To the extent that valuation is based on models or inputs that are less observable or unobservable in the market, the determination of fair value requires more judgment. Accordingly, the degree of judgment exercised in determining fair value is greatest for instruments categorized in Level 3.
The inputs to measure fair value may fall into different Levels of the fair value hierarchy. In such cases, for disclosure purposes, the Level in the fair value hierarchy within which the fair value measurement falls in its entirety, is determined based on the lowest Level input that is significant to the fair value measurement in its entirety.
– 15 –
OCM GOLD FUND
Notes to Financial Statements – May 31, 2019 (Continued) |
The inputs or methodology used for valuing securities are not an indication of the risk associated with investing in those securities. The following is a summary of the inputs used, as of May 31, 2019, in valuing the Fund’s assets carried at fair value:
Sector | Level 1 | Level 2 | Level 3 | Total | ||||||||||||
Common Stocks | ||||||||||||||||
Major Gold Producers | $ | 8,930,100 | $ | — | $ | — | $ | 8,930,100 | ||||||||
Intermediate/Mid-Tier Gold Producers | 2,912,813 | — | — | 2,912,813 | ||||||||||||
Junior Gold Producers | 7,371,149 | — | — | 7,371,149 | ||||||||||||
Exploration and Development Companies | 947,870 | — | — | 947,870 | ||||||||||||
Royalty/Streaming Companies | 2,783,388 | — | — | 2,783,388 | ||||||||||||
Warrants | — | — | — | — | ||||||||||||
Short-Term Investment | 446,775 | — | — | 446,775 | ||||||||||||
Total | $ | 23,392,095 | $ | — | $ | — | $ | 23,392,095 | ||||||||
The Fund held two Level 2 securities at May 31, 2019. Emmerson Resources Ltd. and Steppe Gold Ltd., both Warrants, are being valued at intrinsic value, in accordance with procedures established by and under the general supervision of the Trust’s Board of Trustees. The Fund held one Level 3 security at May 31, 2019. Sutter Gold Mining, Inc. (“SGM CN”) has ceased operations and a receiver for the company’s assets has been appointed. The common shares of SGM CN will be valued at zero, in accordance with procedures established by and under the general supervision of the Trust’s Board of Trustees, until such time as the receiver has finalized the sale of the company’s assets.
– 16 –
OCM GOLD FUND
Notes to Financial Statements – May 31, 2019 (Continued) |
The following is a reconciliation of assets in which significant unobservable inputs (Level 3) were used in determining value:
Beginning balance November 30, 2018 | $ | — | ||
Transfers into Level 3 during the period | — | |||
Transfers out of Level 3 during the period | — | |||
Total realized gain/(loss) | (2,155 | ) | ||
Total unrealized appreciation/(depreciation) | 2,611 | |||
Net purchases | — | |||
Net sales | (456 | ) | ||
Balance as of May 31, 2019 | $ | — |
The Level 3 investments for the Fund represented 0.00% of net assets and did not warrant a disclosure of significant unobservable valuation inputs.
Foreign Currency – Investment securities and other assets and liabilities denominated in foreign currencies are translated into U.S. dollar amounts at the date of valuation. Purchases and sales of investment securities and income and expense items denominated in foreign currencies are translated into U.S. dollar amounts on the respective dates of such transactions. The Fund does not isolate that portion of the results of operations resulting from changes in foreign exchange rates on investments from the fluctuations arising from changes in market prices of securities held. Such fluctuations for the six months ended May 31, 2019 are included within the realized and unrealized gain/loss on investments section of the Statement of Operations.
Reported net realized foreign exchange gains or losses arise from sales of foreign currencies, currency gains or losses realized between the trade and settlement dates on securities transactions, and the difference between the amounts of dividends, interest and foreign withholding taxes recorded on the Fund’s books and the U.S. dollar equivalent of the amounts actually received or paid. Net unrealized foreign exchange gains and losses arise from changes in the fair value of assets and liabilities, other than investments in securities at fiscal period end, resulting from changes in exchange rates. Such fluctuations for the six months ended May 31, 2019 are included within the realized and unrealized gain/loss on investments section of the Statement of Operations.
Federal Income Taxes – The Fund intends to comply with the requirements of the Internal Revenue Code necessary to qualify as a regulated investment company and to make the requisite distributions of income to its shareholders to relieve it from all or substantially all federal income taxes. Withholding taxes on foreign dividends have been provided for in accordance with the Fund’s understanding on the applicable county’s tax rules and rate.
– 17 –
OCM GOLD FUND
Notes to Financial Statements – May 31, 2019 (Continued) |
Accounting for Uncertainty in Income Taxes (“Income Tax Statement”) requires an evaluation of tax positions taken (or expected to be taken) in the course of preparing the Fund’s tax returns to determine whether these positions meet a “more-likely-than-not” standard that, based on the technical merits, have a more than fifty percent likelihood of being sustained by a taxing authority upon examination. A tax position that meets the “more-likely-than-not” recognition threshold is measured to determine the amount of benefit to recognize in the financial statements. The Fund’s policy is to classify interest and penalties associated with underpayment of federal and state income taxes, if any, as income tax expense on the Statement of Operations. As of May 31, 2019, the Fund did not have any interest or penalties associated with the underpayment of any income taxes.
The Income Tax Statement requires management of the Fund to analyze all open tax years, fiscal years 2016-2019 as defined by the Internal Revenue Service statute of limitations for all major jurisdictions, including federal tax authorities and certain state tax authorities. As of and during the six months ended May 31, 2019, the Fund did not have a liability for any unrecognized tax benefits. The Fund has no examinations in progress and is not aware of any tax positions for which it is reasonably possible that the total amounts of unrecognized tax benefits will significantly change in the next twelve months.
Share Classes – The Fund offers two classes of shares, Investor Class and Advisor Class. The outstanding shares of the Fund on April 1, 2010 were renamed “Investor Class shares.” The Advisor Class shares commenced operations on April 1, 2010. The two classes represent interests in the same portfolio of investments and have the same rights. Investor Class shares are subject to an annual 12b-1 fee of up to 0.99% of the Fund’s average daily net assets allocable to Investor Class shares, whereas Advisor Class shares are subject to an annual 12b-1 fee of up to 0.25% of the Fund’s average daily net assets allocable to Advisor Class shares. Income, expenses (other than expenses attributable to a specific class) and realized and unrealized gains and losses on investments are allocated to each class of shares in proportion to their relative shares outstanding.
Securities Transactions and Investment Income – Securities transactions are accounted for on a trade date basis. Realized gains and losses on sales of securities are calculated on the identified cost basis. Dividend income is recorded on the ex-dividend date and interest income is recorded on an accrual basis.
Distributions to Shareholders – The character of distributions made during the year from net investment income or net realized gains may differ from the characterization for federal income tax purposes due to differences in the recognition of income, expense or gain items for financial statement and tax purposes. To the extent that these differences are attributable to permanent book and tax accounting differences, the components of net assets have been adjusted.
– 18 –
OCM GOLD FUND
Notes to Financial Statements – May 31, 2019 (Continued) |
Redemption Fee – A 1.50% redemption fee is retained by the Fund to offset transaction costs and other expenses associated with short-term investing. The fee is imposed on redemptions or exchanges of shares held less than three months from their purchase date. The Fund records the fee as a reduction of shares redeemed and as a credit to shares of beneficial interest. For the six months ended May 31, 2019, the Investor Class and the Advisor Class received $17 and $15,627 in redemption fees, respectively.
Guarantees and Indemnifications – In the normal course of business, the Fund enters into contracts with service providers that contain general indemnification clauses. Also, under the Fund’s organizational documents, its officers and Trustees are indemnified by the Fund against certain liabilities arising out of the performance of their duties to the Fund. The Fund notes that insofar as indemnification for liabilities arising under the Securities Act of 1933 may be permitted to trustees and officers, the Fund has been advised that in the opinion of the Securities and Exchange Commission (the “SEC”) such indemnification is against public policy as expressed in that Act and is, therefore, unenforceable. The Fund’s maximum exposure under these arrangements is unknown as this would involve future claims against the Fund that have not yet occurred. Based on experience, the Fund expects the risk of loss to be remote.
Use of Estimates – The preparation of financial statements in conformity with accounting principles generally accepted in the United States of America requires management to make estimates and assumptions that affect the reported amounts of assets and liabilities and disclosure of contingent assets and liabilities at the date of the financial statements and the reported amounts of increases and decreases in net assets from operations during the reporting period. Actual results could differ from those estimates.
Derivative Instruments – Equity securities in the gold mining industry, particularly the smaller companies, may occasionally issue warrants as part of their capital structure. A warrant gives the holder the right to purchase the underlying equity at the exercise price until the expiration date of the warrant. The Fund may hold such warrants for exposure to smaller companies in the portfolio or other reasons associated with the Fund’s overall objective of long-term growth, though warrants will typically not be a significant part of the Fund’s portfolio. The Fund’s maximum risk in holding warrants is the loss of the entire amount paid for the warrants. At May 31, 2019, the Fund held warrants as listed on the Schedule of Investments.
– 19 –
OCM GOLD FUND
Notes to Financial Statements – May 31, 2019 (Continued) |
Note 3. Investment Advisory Agreement and Affiliated Parties
The Fund has an investment advisory agreement with Orrell Capital Management, Inc. (“OCM” or the “Adviser”). Under the agreement, the Fund pays OCM a fee computed daily and payable monthly, at the following annual rates based upon average daily net assets:
Assets | Fee Rate |
$0 to $250 million | 0.950% |
$250 million to $500 million | 0.800% |
$500 million to $1 billion | 0.700% |
Over $1 billion | 0.600% |
Under the investment advisory agreement, the Adviser is responsible for reimbursing the Fund to maintain a voluntary ratio of expenses to average daily net assets for the Investor Class shares and Advisor Class shares at 2.99% and 2.49%, respectively. Expenses of the Fund above such levels are borne by the Adviser, subject to future recoupment. Expense reimbursement obligations are calculated daily and paid monthly.
For the six months ended May 31, 2019, the Adviser waived advisory fees totaling $12,878 for the Fund. The Adviser may recover from the Fund’s fees and/or expenses previously waived and/or absorbed, if the Fund’s expense ratio, including the recovered expenses, falls below the expense limit at which they were waived. The Adviser is permitted to seek reimbursement from the Fund, subject to certain limitations, of fees waived or payments made to the Fund for a period ending three full fiscal years after the date of the waiver or payment. This reimbursement may be requested from the Fund if the reimbursement will not cause the Fund’s annual expense ratio to exceed the lesser of (a) the expense limitation amount in effect at the time such fees were waived or payments made, or (b) the expense limitation amount in effect at the time of the reimbursement. At May 31, 2019, the amount of these potentially recoverable expenses was $12,960. The Adviser may recapture all or a portion of these amounts no later than November 30, of the years stated below:
2021 | $ | 82 | ||
2022 | 12,878 | |||
Total | $ | 12,960 |
The Fund does not compensate Trustees and Officers affiliated with OCM. For the six months ended May 31, 2019, the expenses accrued for Trustees who are not affiliated with OCM are reported on the Statement of Operations. The Fund pays the salary and related expenses of the Fund’s Chief Compliance Officer. The expenses incurred for the Chief Compliance Officer are reported on the Statement of Operations.
– 20 –
OCM GOLD FUND
Notes to Financial Statements – May 31, 2019 (Continued) |
Note 4. Distribution Agreement and Plan
The Trust has adopted a Distribution Plan (the “Plan”) pursuant to Rule 12b-1 under the Investment Company Act of 1940, as amended. The Plan authorizes the Fund to reimburse the distributor for marketing expenses incurred in distributing shares of the Fund, including the cost of printing sales material and making payments to dealers of the Fund’s Investor Class and Advisor Class, in any fiscal year, subject to limits of 0.99% and 0.25%, respectively, of the average daily net assets of each respective class. For the six months ended May 31, 2019, the Investor Class and the Advisor Class incurred $59,244 and $5,283, respectively, in expenses under the Plan.
Note 5. Purchases and Sales of Securities
Purchases and sales of investment securities (excluding short-term securities and U.S. government obligations) for the six months ended May 31, 2019 were $605,392 and $3,739,909, respectively. There were no purchases or sales of U.S. government obligations.
Note 6. Federal Income Tax Information
At May 31, 2019, gross unrealized appreciation and depreciation of investments owned by the Fund, based on cost for federal income tax purposes were as follows:
Cost of investments | $ | 12,524,170 | ||
Unrealized appreciation | $ | 12,865,707 | ||
Unrealized depreciation | (1,997,782 | ) | ||
Net unrealized appreciation on investments | $ | 10,867,925 |
The difference between cost amounts for financial statement and federal income tax purposes is due primarily to investments in passive foreign investment companies (“PFICs”).
The tax character of distributions paid during the fiscal years ended November 30, 2018 and 2017 was as follows:
2018 | 2017 | |||||||
Ordinary income | $ | — | $ | — | ||||
Net long-term capital gains | 2,426,112 | 6,578,198 | ||||||
Total distributions | $ | 2,426,112 | $ | 6,578,198 | ||||
– 21 –
OCM GOLD FUND
Notes to Financial Statements – May 31, 2019 (Continued) |
As of November 30, 2018 the components of accumulated earnings on a tax basis were as follows:
Undistributed ordinary income | $ | — | ||
Undistributed long-term gains | 5,446,485 | |||
Tax accumulated earnings | 5,446,485 | |||
Accumulated capital and other losses | (599,806 | ) | ||
Unrealized appreciation on investments | 9,110,632 | |||
Total accumulated earnings | $ | 13,957,311 |
The Fund has $599,806 in qualified late-year losses, which are deferred until fiscal year 2019 for tax purposes. Net late-year ordinary losses incurred after December 31 and within the taxable year and net late-year specified losses incurred after October 31 and within the taxable year are deemed to arise on the first day of the Fund’s next taxable year.
Note 7. Concentration of Risk
Investing in foreign securities involves certain risks not necessarily found in U.S. markets. These include risks associated with adverse changes in economic, political, regulatory and other conditions, changes in currency exchange rates, exchange control regulations, expropriation of assets or nationalization, imposition of withholding taxes on dividend or interest payments or capital gains, and possible difficulty in obtaining and enforcing judgments against foreign entities. Further, issuers of foreign securities are subject to different, and often less comprehensive, accounting, reporting, and disclosure requirements than domestic issuers.
As the Fund concentrates its investments in the gold mining industry, a development adversely affecting the industry (for example, changes in the mining laws which increases production costs or a significant decrease in the market price of gold) would have a greater adverse effect on the Fund than it would if the Fund invested in a number of different industries.
Note 8. Illiquid Securities
The Fund may invest up to 15% of net assets in securities for which there is no readily available market (“illiquid securities”). The 15% limitation includes securities whose disposition would be subject to legal restrictions (“restricted securities”). Illiquid and restricted securities often have a market value lower than the market price of
– 22 –
OCM GOLD FUND
Notes to Financial Statements – May 31, 2019 (Continued) |
unrestricted securities of the same issuer and are not readily marketable without some delay. This could result in the Fund being unable to realize a favorable price upon disposition of such securities and in some cases might make disposition of such securities at the time desired by the Fund impossible.
Note 9. Subsequent Events
Management has evaluated events and transactions for potential recognition or disclosure through the date the financial statements were issued. Management has determined there are no material events that would require disclosure in the Fund’s financial statements through this date.
– 23 –
OCM GOLD FUND
Financial Highlights Investor Class |
Six Months | Year | Year | Year | Year | Year | |||||||||||||||||||
Per Share Operating Performance | ||||||||||||||||||||||||
(For a share outstanding throughout each period) | ||||||||||||||||||||||||
Net asset value, beginning of period | $ | 7.05 | $ | 9.26 | $ | 11.12 | $ | 7.19 | $ | 9.47 | $ | 11.26 | ||||||||||||
Income from Investment Operations: | ||||||||||||||||||||||||
Net investment loss1 | (0.04 | ) | (0.19 | ) | (0.21 | ) | (0.24 | ) | (0.14 | ) | (0.17 | ) | ||||||||||||
Net realized and unrealized gain (loss) on investments and foreign currency transactions | 1.01 | (1.36 | ) | 0.10 | 4.17 | (1.98 | ) | (1.17 | ) | |||||||||||||||
Total from investment operations | 0.97 | (1.55 | ) | (0.11 | ) | 3.93 | (2.12 | ) | (1.34 | ) | ||||||||||||||
Less Distributions: | ||||||||||||||||||||||||
Dividends from net investment income | — | — | — | — | — | — | ||||||||||||||||||
Distribution from net realized gains | (1.66 | ) | (0.66 | ) | (1.75 | ) | — | 2 | (0.16 | ) | (0.45 | ) | ||||||||||||
Total distributions | (1.66 | ) | (0.66 | ) | (1.75 | ) | — | 2 | (0.16 | ) | (0.45 | ) | ||||||||||||
Redemption fee proceeds | — | 2 | — | 2 | — | 2 | — | 2 | — | 2 | — | 2 | ||||||||||||
Net asset value, end of period | $ | 6.36 | $ | 7.05 | $ | 9.26 | $ | 11.12 | $ | 7.19 | $ | 9.47 | ||||||||||||
Total return* | 15.58 | %3,4 | (18.24 | )% | 0.94 | % | 54.74 | % | (22.76 | )% | (11.49 | )% | ||||||||||||
Ratios/Supplemental Data: | ||||||||||||||||||||||||
Net assets, end of year (in 000’s) | $ | 17,740 | $ | 17,146 | $ | 30,492 | $ | 33,841 | $ | 24,750 | $ | 38,177 | ||||||||||||
Ratio of expenses to average net assets: | ||||||||||||||||||||||||
Before fees waived | 3.09 | %5 | 2.93 | % | 2.78 | % | 2.66 | % | 2.59 | % | 2.39 | % | ||||||||||||
After fees waived | 2.99 | %5 | 2.93 | % | 2.78 | % | 2.66 | % | 2.59 | % | 2.39 | % | ||||||||||||
Ratio of net investment loss to average net assets: | ||||||||||||||||||||||||
Before fees waived | (1.33 | )%5 | (2.27 | )% | (2.17 | )% | (2.07 | )% | (1.51 | )% | (1.34 | )% | ||||||||||||
After fees waived | (1.23 | )%5 | (2.27 | )% | (2.17 | )% | (2.07 | )% | (1.51 | )% | (1.34 | )% | ||||||||||||
Portfolio turnover rate | 2 | %3 | 6 | % | 10 | % | 11 | % | 11 | % | 5 | % | ||||||||||||
* | Assumes no sales charge |
1 | Based on average shares method. |
2 | Amount represents less than $0.01 per share. |
3 | Not annualized. |
4 | Total returns would have been lower had expenses not been waived by the Adviser. |
5 | Annualized. |
See notes to financial statements.
– 24 –
OCM GOLD FUND
Financial Highlights Advisor Class |
Six Months | Year | Year | Year | Year | Year | |||||||||||||||||||
Per Share Operating Performance | ||||||||||||||||||||||||
(For a share outstanding throughout each period) | ||||||||||||||||||||||||
Net asset value, beginning of period | $ | 7.58 | $ | 9.86 | $ | 11.63 | $ | 7.46 | $ | 9.76 | $ | 11.49 | ||||||||||||
Income from Investment Operations: | ||||||||||||||||||||||||
Net investment loss1 | (0.03 | ) | (0.15 | ) | (0.15 | ) | (0.18 | ) | (0.09 | ) | (0.09 | ) | ||||||||||||
Net realized and unrealized gain (loss) on investments and foreign currency transactions | 1.11 | (1.47 | ) | 0.12 | 4.31 | (2.06 | ) | (1.20 | ) | |||||||||||||||
Total from investment operations | 1.08 | (1.62 | ) | (0.03 | ) | 4.13 | (2.15 | ) | (1.29 | ) | ||||||||||||||
Less Distributions: | ||||||||||||||||||||||||
Dividends from net investment income | — | — | — | — | — | — | ||||||||||||||||||
Distribution from net realized gains | (1.66 | ) | (0.66 | ) | (1.75 | ) | — | 2 | (0.16 | ) | (0.45 | ) | ||||||||||||
Total distributions | (1.66 | ) | (0.66 | ) | (1.75 | ) | — | 2 | (0.16 | ) | (0.45 | ) | ||||||||||||
Redemption fee proceeds | 0.02 | — | 2 | 0.01 | 0.04 | 0.01 | 0.01 | |||||||||||||||||
Net asset value, end of period | $ | 7.02 | $ | 7.58 | $ | 9.86 | $ | 11.63 | $ | 7.46 | $ | 9.76 | ||||||||||||
Total return | 16.30 | %3,4 | (17.81 | )%4 | 1.81 | % | 55.98 | % | (22.28 | )% | (10.74 | )% | ||||||||||||
Ratios/Supplemental Data: | ||||||||||||||||||||||||
Net assets, end of year (in 000’s) | $ | 5,611 | $ | 6,624 | $ | 7,106 | $ | 9,467 | $ | 19,040 | $ | 16,970 | ||||||||||||
Ratio of expenses to average net assets: | ||||||||||||||||||||||||
Before fees waived | 2.59 | %5 | 2.31 | % | 2.05 | % | 2.03 | % | 2.01 | % | 1.79 | % | ||||||||||||
After fees waived | 2.49 | %5 | 2.31 | % | 2.05 | % | 2.03 | % | 2.01 | % | 1.79 | % | ||||||||||||
Ratio of net investment loss to average net assets: | ||||||||||||||||||||||||
Before fees waived | (0.83 | )%5 | (1.65 | )% | (1.44 | )% | (1.44 | )% | (0.92 | )% | (0.74 | )% | ||||||||||||
After fees waived | (0.73 | )%5 | (1.65 | )% | (1.44 | )% | (1.44 | )% | (0.92 | )% | (0.74 | )% | ||||||||||||
Portfolio turnover rate | 2 | %3 | 6 | % | 10 | % | 11 | % | 11 | % | 5 | % | ||||||||||||
1 | Based on average shares method. |
2 | Amount represents less than $0.01 per share. |
3 | Not annualized. |
4 | Total returns would have been lower had expenses not been waived by the Adviser. |
5 | Annualized. |
See notes to financial statements.
– 25 –
OCM GOLD FUND
Expense Example – For the Period Ended May 31, 2019 |
As a shareholder of the OCM Gold Fund (the “Fund”), you incur two types of costs: (1) transaction costs, including sales charges (loads) on purchase payments and redemption fees on certain redemptions; and (2) ongoing costs, including management fees; distribution (12b-1) fees; and other Fund expenses. This Example is intended to help you understand your ongoing costs (in dollars) of investing in the Fund and to compare these costs with the ongoing costs of investing in other mutual funds.
The Example is based on an investment of $1,000 invested at the beginning of the period and held for the entire period from December 1, 2018 to May 31, 2019 (the “period”).
Actual Expenses
The row titled “Actual” in the table below provides information about actual account values and actual expenses. You may use this information, together with the amount you invested, to estimate the expenses you paid over the period. Simply divide your account value by $1,000 (for example, an $8,600 account value divided by $1,000 equals 8.6), then multiply the result by the number in the appropriate line for your share class under the heading entitled “Expenses Paid During the Period” to estimate the expenses you paid on your account during the periods.
Hypothetical Example for Comparison Purposes
The row titled “Hypothetical” in the table below provides information about hypothetical account values and hypothetical expenses based on each class’ actual expense ratio and an assumed rate of return of 5% per year before expenses, which is not each class’ actual return. The hypothetical account values and expenses may not be used to estimate the actual ending account balance or expenses you paid for the period. You may use this information to compare the ongoing costs of investing in the classes of the Fund and other funds. To do so, compare these 5% hypothetical examples with the 5% hypothetical examples that appear in the shareholder reports of other funds.
Please note that the expenses shown in the table are meant to highlight your ongoing costs only and do not reflect any transactional costs, such as sales charges (loads) and redemption fees. Therefore, the hypothetical lines of the table are useful in comparing the ongoing costs only, and will not help you determine the relative total costs of owning different funds. In addition, if these transactional costs were included, your costs would have been higher.
– 26 –
OCM GOLD FUND
Expense Example – For the Period Ended May 31, 2019 (Continued) |
Expenses Paid During the Period
Beginning | Ending | Expenses Paid | |
Investor Class | |||
Actual | $1,000.00 | $ 1,155.80 | $ 16.07 |
Hypothetical (5% return before expenses) | 1,000.00 | 1,010.09 | 14.98 |
Advisor Class | |||
Actual | 1,000.00 | 1,163.00 | 13.43 |
Hypothetical (5% return before expenses) | 1,000.00 | 1,012.59 | 12.49 |
* | Expenses are equal to the Investor Class’ and Advisor Class’ annualized expense ratios of 2.99% and 2.49%, respectively, for the period, multiplied by the average account value over the period, multiplied by 182/365 (to reflect the one-half year period). |
– 27 –
OCM GOLD FUND
Other Information |
Investments by Sector – As of May 31, 2019
As a Percentage of Total Investments
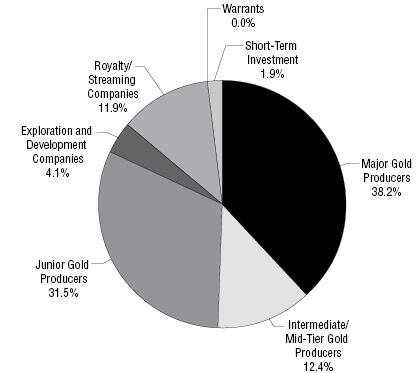
The Fund will file its complete schedule of investments with the Securities and Exchange Commission (SEC) for the first and third quarters of each fiscal year on Form N-Q. The Fund’s Forms N-Q will be available on the EDGAR database on the SEC’s website at http://www.sec.gov. These Forms may also be reviewed and copied at the SEC’s Public Reference Room in Washington, D.C. Information about the operation of the Public Reference Room may be obtained by calling 1-800-SEC-0330.
A description of the Fund’s proxy voting policies and procedures and a record of the Fund’s proxy votes for the year ended June 30, 2018 are available without charge, upon request by calling toll free 1-800-779-4681 and on the SEC’s website at http://www.sec.gov. The Fund’s proxy voting policies and procedures are also available on the Fund’s website at http://www.ocmgoldfund.com.
– 28 –
THIS PAGE INTENTIONALLY LEFT BLANK
OCM Gold Fund
Distributed by:
Northern Lights Distributors, LLC
17605 Wright Street
Omaha, NE 68130
6646-NLD-07/22/2019
Item 2. Code of Ethics.
Not applicable to semi-annual reports.
Item 3. Audit Committee Financial Expert.
Not applicable to semi-annual reports.
Item 4. Principal Accountant Fees and Services
Not applicable to semi-annual reports.
Item 5. Audit Committee of Listed Registrants
Not applicable to semi-annual reports.
Item 6. Schedule of Investments
The schedules of investments in securities in unaffiliated issuers are included as part of the reports to shareholders filed under Item 1.
Item 7. Disclosure of Proxy Voting Policies and Procedures for Closed-End Management Investment Companies
Not applicable.
Item 8. Portfolio Managers of Closed-End Management Investment Companies
Not applicable.
Item 9. Purchases of Equity Securities by Closed-End Management Investment Company and Affiliated Purchasers
Not applicable.
Item 10. Submissions of Matters to a Vote of Security Holders
As of the end of the period covered by this report, the registrant had not adopted any procedures by which shareholders may recommend nominees to the registrant’s Board of Directors.
Item 11. Controls and Procedures.
| (a) | The registrant's certifying officer has concluded that the registrant's disclosure controls and procedures (as defined in Rule 30a-2 under the Investment Company Act of 1940 (the "Act")) are effective in design and operation and are sufficient to form the basis of the certifications required by Rule 30a-2 under the Act, based on their evaluation of these disclosure controls and procedures within 90 days of the filing date of this report on Form N-CSR. |
| (b) | Not applicable. |
Item 12. Disclosure of Securities Lending Activities for Closed-End Management Investment Companies.
Not applicable.
Item 13. Exhibits.
(a)(1) Code of Ethics – Not applicable.
(a)(2) Certification for each principal executive and principal financial officer of the registrant as required by Rule 30a-2 under the Act (17 CFR 270.30a-2(a)) – Filed as an attachment to this filing.
(a)(3) Any written solicitation to purchase securities under Rule 23c-1 under the Act sent or given during the period covered by the report by or on behalf of the registrant to 10 or more persons. Not applicable to open-end investment companies.
(a)(4) Change in the registrant’s independent public accountant – Not applicable.
(b) Certifications required by Rule 30a-2(b) under the Act (17 CFR 270.30a-2(b)), Rule 13a-14(b) or Rule 15d-14(b) under the Exchange Act (17 CFR 240.13a-14(b) or 240.15d-14(b)), and Section 1350 of Chapter 63 of Title 18 of the United States Code (18 U.S.C. 1350) – Filed as an attachment to this filing.
SIGNATURES
Pursuant to the requirements of the Securities Exchange Act of 1934 and the Investment Company Act of 1940, the registrant has duly caused this report to be signed on its behalf by the undersigned, thereunto duly authorized.
OCM Mutual Fund
| By: | /s/ Gregory M. Orrell | |
| Gregory M. Orrell | ||
| President |
Date: July 24, 2019
Pursuant to the requirements of the Securities Exchange Act of 1934 and the Investment Company Act of 1940, this report has been signed below by the following persons on behalf of the registrant and in the capacities and on the dates indicated.
| By: | /s/ Gregory M. Orrell | |
| Gregory M. Orrell | ||
| President and Treasurer |
Date: July 24, 2019