UNITED STATES
SECURITIES AND EXCHANGE COMMISSION
Washington, D.C. 20549
FORM N-CSR
CERTIFIED SHAREHOLDER REPORT OF REGISTERED
MANAGEMENT INVESTMENT COMPANIES
Investment Company Act File Number 811-04010
OCM Mutual Fund
(Exact name of registrant as specified in charter)
2600 Kitty Hawk Road, Suite 119
Livermore, California 94551
(Address of principal executive offices) (Zip code)
Gregory M. Orrell
Orrell Capital Management, Inc
2600 Kitty Hawk Road, Suite 119
Livermore, California 94551
(Name and address of agent for service)
Registrant's telephone number, including area code: (925) 455-0802
Date of fiscal year end: November 30
Date of reporting period: May 31, 2020
Item 1. Report to Stockholders.

Semi-Annual Report
May 31, 2020
(Unaudited)
Beginning on January 1, 2021, as permitted by regulations adopted by the Securities and Exchange Commission, paper copies of the Fund’s shareholder reports will no longer be sent by mail, unless you specifically request paper copies of the reports from your financial intermediary, such as a broker-dealer or bank. Instead, the reports will be made available on a website, and you will be notified by mail each time a report is posted and provided with a website link to access the report.
If you already elected to receive shareholder reports electronically, you will not be affected by this change and you need not take any action. Please contact your financial intermediary to elect to receive shareholder reports and other Fund communications electronically. For direct account shareholders, please call 1-800-628-9403.
You may elect to receive all future reports in paper free of charge. Please contact your financial intermediary to inform them that you wish to continue receiving paper copies of your shareholder reports and for details about whether your election to receive reports in paper will apply to all funds held with your financial intermediary. For direct account shareholders, please call 1-800-628-9403.
OCM GOLD FUND
Shareholder Letter – May 31, 2020 |
Dear Fellow Shareholders:
In our 2019 annual report, we pointed out gold prices breaking through $1,380 in June 2019 was a significant technical event and that the narrative as to why gold prices were breaking out would follow. The Coronavirus pandemic was not on our radar. However, what was predictable, in our opinion, was the Federal Reserve’s (the “Fed”) policy response of another round of extreme monetary policy measures of zero interest rates and aggressive Fed balance sheet expansion leading to further debasement of the U.S. dollar. The Fed, in our opinion, is hostage to the financial leverage built up as a consequence of its past policy responses to 9/11 and 2008 Financial Crisis. It is our belief the Fed must maintain an ever-aggressive policy posture and meet each crisis with greater amounts of printing press money than the crisis before in order to stem the threat of a deflationary credit cycle unwinding.
The aggressive monetary policy response by the Fed, and the rapid expansion of total federal debt as result of Coronavirus stimulus checks, has led to strong relative performance by your Fund over the six-month fiscal period ended May 31, 2020. For this period, the OCM Gold Fund Advisor Class appreciated 35.97% while the Investor Class gained 35.49% (+29.34% after maximum sales load) compared to 26.27% gain in the Philadelphia Gold and Silver Index1 (“XAU”) and -2.10% for the S&P 500 Index2. The price of gold bullion at May 31, 2020 closed at $1,728.70 based on the London PM Fix, up 18.39% during the six-month period. Your Fund benefited from its active management style and investment strategy of owning a portfolio of major gold producers to exploration and development companies over the period.
The following is the investment case for gold and shares of gold mining companies as we currently see it:
OCM Investment Case for Gold:
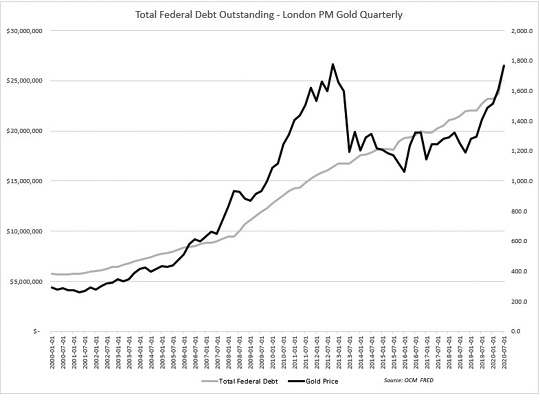
● | Gold price (US$) correlation to total federal debt outstanding since President Nixon closed the “Gold Window” in 1971 is 91%. The correlation since 2001 stands at 88% (see Chart 1). total federal debt has risen from $23.2 trillion to $25.8 trillion in the first five months of 2020 and is rising at a rate of $800 billion per month since March. In our opinion, total federal debt outstanding is on an exponential trajectory as lower tax revenues and fiscal stimulus to fight Covid-19 impacts may just be the beginning of a cycle of lower revenues and higher levels of government spending. |
– 1 –
OCM GOLD FUND
Shareholder Letter – May 31, 2020 (Continued) |
o | Chart 1 |
● | Fiscal and monetary discipline on the part of U.S. policy makers has given way, in our opinion, to the need for “free money” to assuage both leveraged financial markets and political pressure for increased spending on social agendas. In our view, it is a de facto embrace of MMT (“modern monetary theory”, or “magic money tree”) – governments cannot default so print whatever is needed to meet the needs of the people. The demise of fiat currencies historically follows a similar script at the end of a fiat currency life cycle. |
● | Negative real interest rates in the U.S., Japan, UK, and Europe removes the opportunity cost argument “gold pays no interest” and, in our opinion, enhances the attractiveness of owning gold as a hedge against ongoing currency debasement. With total global negative yielding debt standing at $13 trillion, a small allocation of capital moving away from negative yielding debt toward gold may have a meaningful positive impact on the gold market, in our opinion. |
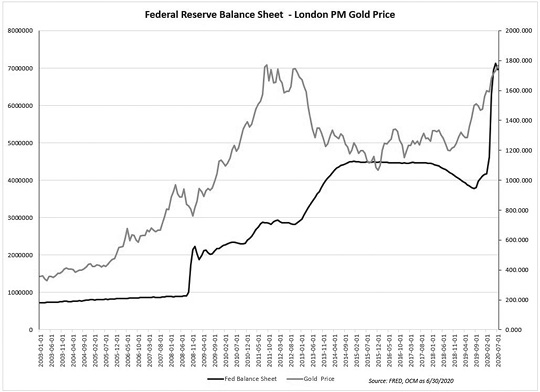
● | The latest round of extreme monetary policy responses by major central banks, in our opinion, underscores the inability of central banks to “normalize” balance sheets without setting off untenable financial asset market convulsions as global liquidity has proven fragile. As shown in Chart 2, gold prices have shown |
– 2 –
OCM GOLD FUND
Shareholder Letter – May 31, 2020 (Continued) |
positive correlation to increases in central bank balance sheets. As Jim Grant of Grant’s Interest Rate Observer once opined, “if it is so easily reproduced, what is it worth?” when referring to the U.S. dollar and the explosion of the Fed’s balance sheet at the onset of Quantitative Easing (QE) in 2009.
o | Chart 2 |
● | The debate of whether past extraordinary monetary policy measures will ultimately lead to price inflation or a credit cycle bust causing a deflationary spiral appears to be resolving in the favor of inflation, in our opinion. The most recent round of “unprecedented” monetary policy measures shows a willingness by central banks to expand asset purchases to as many asset classes as needed to maintain financial asset prices and global liquidity. Former Fed Chairman, Ben Bernanke, may have been correct when he dismissed deflation fears saying the Fed had the printing press and could drop money from helicopters if need be. Further, we believe inflationary pressures may come from increasing curtailment of open trade as production shifts back to the U.S. from low cost manufacturing centers that essentially exported deflation from the U.S. for years while money supply growth grew significantly greater than GDP. |
– 3 –
OCM GOLD FUND
Shareholder Letter – May 31, 2020 (Continued) |
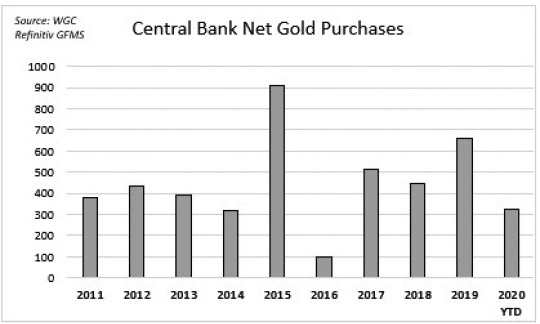
● | Increased central bank gold purchases over the past ten years (Chart 3), specifically, China, Russia, India, and Turkey, in our opinion, signals to us growing unease over U.S. dollar hegemony and escalated geopolitical tensions surrounding U.S. foreign policy. We believe central banks are not only diversifying away from U.S. dollar reserves as a hedge against the prospect of U.S. sanctions, but setting the stage for a competing currency bloc or new monetary order based on gold. |
o | Chart 3 |
● | Gold bullion exchange traded funds (ETF’s) through the first six months of 2020 set a record for inflows both in terms of tonnage and dollar value at 734 tonnes and $39.5 billion. Gold holdings in all bullion ETF’s tracked by the World Gold Council stood at 3,621 tonnes as of 6/30/20. The lack of “available” or deliverable physical gold in the London marketplace in the second quarter was highlighted by the SPDR Gold Trust ETF needing to borrow gold from the Bank of England to meet its holdings requirements. Further robust ETF demand, in our opinion, may overwhelm central bank and bullion banks’ ability to “manage” the market in an orderly fashion. |
● | Newly mined gold supply has shown to be inelastic to higher gold prices as the lead - lag time from an economic discovery to production is approximately ten years. Newly mined gold supply is further constrained by the lack of shovel ready projects needed to offset declining production of aging and depleted mines as industry exploration has been challenged to discover large deposits of 5 million ounces or more over the past 12 years. |
– 4 –
OCM GOLD FUND
Shareholder Letter – May 31, 2020 (Continued) |
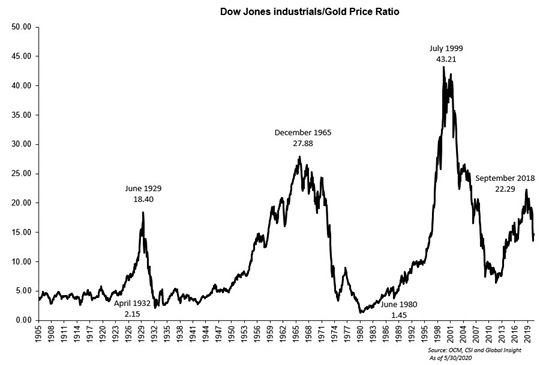
● | Gold is not only rising versus all currencies over the past two years, it is also rising versus financial assets as depicted by the Dow Jones/Gold Ratio contracting from a September 2018 high of 22.29 to 14.68 in May of this year. While not shown on the monthly chart below (chart 4), the Dow Jones/Gold Ratio in the extremist scenario has reached 1:1 twice before – 1932 and 1980. |
o | Chart 4 |
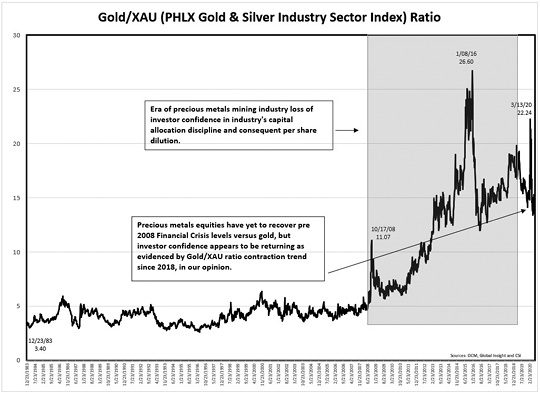
OCM Case for Shares of Gold Mining Companies
● | As prices of gold and silver rise versus all currencies, precious metals mining companies as a group are experiencing the benefit of lowering cost structures and disciplined capital allocation over the past seven years to deliver the operating leverage investors, like ourselves, expect when investing in shares of gold mining companies. Consequently, investor sentiment toward the sector appears to be turning positive as represented by the contraction in the Gold/XAU (Philadelphia Gold & Silver Industry Sector Index) ratio contracting. Prior to 2008 Financial Crisis, the Gold/XAU ratio traded in a range between 3 to 6 for 25 years (the ratio currently sits at 12.92 as of July 17, 2020, down from a high of 26.60 on January 8, 2016). Prior to 2008, investor sentiment turned negative when per share dilution, as a result of undisciplined capital allocation and equity issuance, destroyed confidence in industry management. Gold mining companies were viewed during that time as debasing shareholder value per share faster than central banks were debasing currencies. |
– 5 –
OCM GOLD FUND
Shareholder Letter – May 31, 2020 (Continued) |
o | Chart 5 |
● | Rising cash flows into the precious metals mining sector is allowing companies to return cash to shareholders through increased dividends and share buybacks while exhibiting improving balance sheets. Mining company managements are increasingly understanding that in addition to paying attention to per share metrics, shareholders must participate in the cash flow of operations to attract long-term investors into the space. |
● | The uncertainty of the ability of the LME (London Metals Exchange) and COMEX to meet physical gold delivery obligations in April and May shook investor confidence in the sanctity of paper gold contracts. Conversely, mining companies’ reserves in the ground are gaining greater appreciation as the scarcity of physical gold versus questionable paper gold contracts is becoming better understood by a wider market audience, in our opinion. |
● | The adoption of technology into the mining sector, such as autonomous vehicles (electric and diesel) and remote machinery, we believe is in its infancy and holds the promise of increased productivity for mining companies to offset natural ongoing inflationary operating cost pressures. |
– 6 –
OCM GOLD FUND
Shareholder Letter – May 31, 2020 (Continued) |
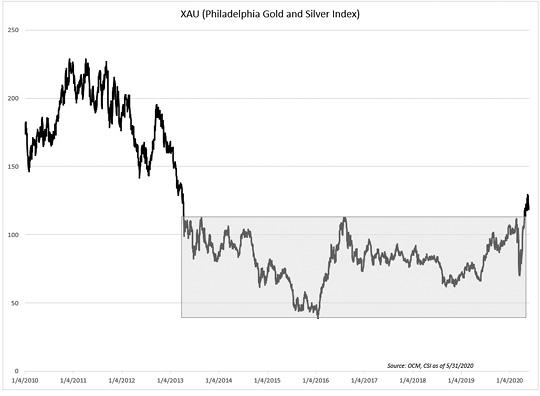
● | Gold mining share indices (XAU and HUI) appear to have broken out of seven-year base patterns as shown by the XAU chart (Chart 6) |
o | Chart 6 |
Conclusion
With any pretense of fiscal and monetary discipline cast aside, policy makers have flooded the global economy with another round of “whatever it takes” liquidity and printing press money in response to the Coronavirus. It appears to us Washington policy makers have adopted MMT without acknowledging it publicly. Consequently, we believe the next cycle of rapid currency debasement versus gold is at hand with inflationary implications that the Fed may find difficult to combat without imploding the highly leveraged global economy that has shown to be susceptible at 2% interest rates. Further, the cries of social injustice will likely grow louder in our opinion, as wealth disparity becomes further accentuated in a period of rising inflation. In our opinion, gold and shares of gold mining companies should perform well in an environment of rapid currency debasement and a subsequent loss of confidence in central banking.
– 7 –
OCM GOLD FUND
Shareholder Letter – May 31, 2020 (Continued) |
We appreciate your shareholding and confidence in the OCM Gold Fund, and we look forward to meeting the investment objective of preserving your purchasing power. Should you have any questions regarding the Fund or gold, please contact your financial adviser or you may contact us directly at 1-800-779-4681. For questions regarding your account, please contact Shareholder Service at 1-800-628-9403.
Sincerely,

Gregory M. Orrell
Portfolio Manager
July 19, 2020
The Philadelphia Gold and Silver Index (XAU)1 is an unmanaged capitalization-weighted index composed of 16 companies listed on U.S. exchanges involved in the gold and silver mining industry. The index is generally considered as representative of the gold and silver share market. You cannot invest directly in an index.
The S&P 500 Index2, a registered trademark of McGraw-Hill Co., Inc. is a market capitalization-weighted index of 500 widely held common stocks. You cannot invest directly in an index.
– 8 –
OCM GOLD FUND
Shareholder Letter – May 31, 2020 (Continued) |
Investing in the Fund involves risks including the loss of principal. Many of the companies in which the Fund invests are smaller capitalization companies which may subject the fund to greater risk than securities of larger, more-established companies, as they often have limited product lines, markets or financial resources and may be subject to more-abrupt market movements. The Fund also invests in securities of gold and precious metals which may be subject to greater price fluctuations over short periods of time. The Fund is a non-diversified investment company meaning it will invest in fewer securities than diversified investment companies and its performance may be more volatile. The Fund contains international securities that may provide the opportunity for greater return but also have special risks associated with foreign investing including fluctuations in currency, government regulation, differences in accounting standards and liquidity.
Investor Class Performance as of May 31, 2020
OCMGX | OCMGX | Philadelphia | S&P 5002 | ||
Six Months | 35.49% | 29.34% | 26.27% | (2.10)% | |
One Year | 83.64% | 75.36% | 72.96% | 12.84% | |
3 Year Annualized | 18.61% | 16.82% | 13.89% | 10.23% | |
5 Year Annualized | 14.93% | 13.87% | 12.37% | 9.86% | |
10 Year Annualized | (0.22)% | (0.67)% | (2.51)% | 13.15% |
Advisor Class Performance as of May 31, 2020
OCMAX | Philadelphia | S&P 5002 | ||
Six Months | 35.97% | 26.27% | (2.10)% | |
One Year | 85.36% | 72.96% | 12.84% | |
3 Year Annualized | 19.60% | 13.89% | 10.23% | |
5 Year Annualized | 15.85% | 12.37% | 9.86% | |
10 Year Annualized | 0.48% | (2.51)% | 13.15% |
The performance data quoted above represents past performance. Current performance may be lower or higher than the performance data quoted above. Past performance is no guarantee of future results. The investment return and principal value of an investment will fluctuate so that investor’s shares, when redeemed, may be worth more or less than their original cost. The Fund’s Total Annual Operating Expenses for the Fund’s Investor Class and Advisor
– 9 –
OCM GOLD FUND
Shareholder Letter – May 31, 2020 (Continued) |
Class are 2.46% and 1.96% respectively. Please review the Fund’s prospectus for more information regarding the Fund’s fees and expenses. For performance information current to the most recent month-end, please call toll-free 800-628-9403. The returns shown include the reinvestment of all dividends but do not reflect the deduction of taxes that a shareholder would pay on Fund distributions or the redemption of Fund shares.
1 | The Philadelphia Gold and Silver Index (XAU) is an unmanaged capitalization-weighted index composed of 16 companies listed on U.S. exchanges involved in the gold and silver mining industry. The index is generally considered as representative of the gold and silver share market. You cannot invest directly in an index. |
2 | The S&P 500 Index, a registered trademark of McGraw-Hill Co., Inc. is a market capitalization-weighted index of 500 widely held common stocks. You cannot invest directly in an index. |
– 10 –
OCM GOLD FUND
Schedule of Investments – May 31, 2020 |
Shares |
| |||||||
COMMON STOCKS 93.5% | ||||||||
Major Gold Producers 28.9% | ||||||||
| 65,000 | Agnico Eagle Mines Ltd. | $ | 4,160,000 | |||||
| 110,000 | AngloGold Ashanti Ltd. ADR | 2,701,600 | ||||||
| 200,000 | Barrick Gold Corp. | 4,800,000 | ||||||
| 65,000 | Newmont Corp. | 3,800,550 | ||||||
| 15,462,150 | ||||||||
Intermediate/Mid-Tier Gold Producers 16.5% | ||||||||
| 200,000 | Alamos Gold, Inc. | 1,620,000 | ||||||
| 300,000 | B2Gold Corp.* | 1,653,715 | ||||||
| 70,500 | Centerra Gold, Inc.* | 715,292 | ||||||
| 75,000 | Endeavour Mining Corp.* | 1,807,321 | ||||||
| 50,000 | Northern Star Resources Ltd. | 493,235 | ||||||
| 450,000 | OceanaGold Corp. | 915,099 | ||||||
| 25,000 | Pan American Silver Corp. | 732,500 | ||||||
| 25,000 | SSR Mining, Inc. | 480,750 | ||||||
| 30,000 | Torex Gold Resources, Inc. | 413,973 | ||||||
| 8,831,885 | ||||||||
Junior Gold Producers 29.5% | ||||||||
| 400,000 | Alacer Gold Corp.* | 2,492,556 | ||||||
| 450,000 | Argonaut Gold, Inc.* | 607,887 | ||||||
| 250,000 | Dundee Precious Metals, Inc.* | 1,359,939 | ||||||
| 150,000 | Fortuna Silver Mines, Inc.* | 673,251 | ||||||
| 13,843,500 | Jaguar Mining, Inc.* | 3,921,102 | ||||||
| 175,000 | K92 Mining, Inc. | 521,098 | ||||||
| 1,000,000 | Perseus Mining Ltd. | 863,161 | ||||||
| 550,000 | Roxgold, Inc.* | 507,299 | ||||||
| 200,000 | SEMAFO, Inc.* | 688,503 | ||||||
| 500,000 | Wesdome Gold Mines Ltd.* | 4,179,679 | ||||||
| 15,814,475 | ||||||||
Exploration and Development Companies 6.5% | ||||||||
| 255,128 | Adriatic Metals PLC | 238,072 | ||||||
| 1,375,000 | Emerald Resources N.L. | 417,000 | ||||||
| 750,000 | Emmerson Resources Ltd.* | 59,988 | ||||||
| 200,000 | Galway Metals, Inc. | 58,101 | ||||||
| 1,000,000 | GR Silver Mining Ltd. | 283,245 | ||||||
| 2,000,000 | Horizon Minerals Ltd. | 153,303 | ||||||
| 309,700 | Integra Resources Corp. | 308,148 | ||||||
| 650,000 | Liberty Gold Corp. | 649,103 | ||||||
| 2,000,000 | Matador Mining Ltd. | 333,267 | ||||||
| 400,000 | Orca Gold, Inc. | 107,488 | ||||||
| 2,296,000 | Royal Road Minerals Ltd.* | 416,878 | ||||||
| 4,578,755 | RTG Mining, Inc.* | 366,227 | ||||||
| 2,512,040 | Sutter Gold Mining, Inc.* # | — | ||||||
| 250,000 | Talisker Resources Ltd. | 68,088 | ||||||
| 3,458,908 | ||||||||
Royalty/Streaming Companies 12.1% | ||||||||
| 70,000 | Maverix Metals, Inc. | 325,500 | ||||||
| 35,000 | Osisko Gold Royalties Ltd. | 345,800 | ||||||
| 6,500 | Royal Gold, Inc. | 865,800 | ||||||
| 75,000 | Sandstorm Gold Ltd. | 625,500 | ||||||
| 100,000 | Wheaton Precious Metals Corp. | 4,308,229 | ||||||
| 6,470,829 | ||||||||
Total Common Stocks | ||||||||
(Cost $17,293,272) | 50,038,247 | |||||||
WARRANTS 0.0% | ||||||||
Exploration and Development Companies 0.0% | ||||||||
| 1,000,000 | Emmerson Resources Ltd. Exercise Price 0.14 AUD, Exp. 9/30/2020* | — | ||||||
| — | ||||||||
Total Warrants | ||||||||
(Cost $0) | — | |||||||
See notes to financial statements.
– 11 –
OCM GOLD FUND
Schedule of Investments – May 31, 2020 (Continued) |
Shares |
| |||||||
SHORT-TERM INVESTMENT 7.1% | ||||||||
| 3,802,640 | UMB Money Market Fiduciary, 0.01% | $ | 3,802,640 | |||||
Total Short-Term Investment | ||||||||
(Cost $3,802,640) | 3,802,640 | |||||||
Total Investments | ||||||||||||
(Cost $21,095,912) | 100.6 | % | 53,840,887 | |||||||||
Liabilities less Other Assets | (0.6 | )% | (326,757 | ) | ||||||||
TOTAL NET ASSETS | 100.0 | % | $ | 53,514,130 | ||||||||
ADR – American Depository Receipt
PLC – Public Limited Company
AUD – Australian Dollars
* | Non-income producing security. |
# | Level 3 security fair valued under procedures established by the Board of Trustees, represents 0.00% of Net Assets. The total value of this security is $0. |
See notes to financial statements.
– 12 –
OCM GOLD FUND
Schedule of Investments – May 31, 2020 (Continued) |
SUMMARY OF INVESTMENTS BY COUNTRY
Country | Value | Percent of | ||||||
Australia | $ | 2,319,953 | 4.3% | |||||
Canada | 37,521,845 | 69.7 | ||||||
Cayman Islands | 1,807,321 | 3.4 | ||||||
Jersey | 416,879 | 0.8 | ||||||
South Africa | 2,701,600 | 5.0 | ||||||
United Kingdom | 238,072 | 0.4 | ||||||
United States1 | 8,468,990 | 15.7 | ||||||
Virgin Islands (British) | 366,227 | 0.7 | ||||||
Total | $ | 53,840,887 | 100.0% | |||||
1 | Includes short-term investments. |
See notes to financial statements.
– 13 –
OCM GOLD FUND
Statement of Assets and Liabilities – May 31, 2020 |
Assets: | ||||
Investments in unaffiliated issuers, at value (cost $21,095,912) | $ | 53,840,887 | ||
Interest and dividends receivable | 36,670 | |||
Receivable for fund shares sold | 470,137 | |||
Prepaid expenses and other assets | 35,550 | |||
Total assets | 54,383,244 | |||
Liabilities: | ||||
Payable for fund shares redeemed | 430,320 | |||
Accrued distribution fees | 25,984 | |||
Investment securities purchased | 308,000 | |||
Investment adviser fees | 41,179 | |||
Accrued transfer agent fees and expenses | 9,657 | |||
Accrued fund administration and accounting fees | 8,344 | |||
Accrued Trustees’ fees | 2,299 | |||
Accrued audit fees | 7,750 | |||
Accrued report to shareholders | 12,618 | |||
Accrued expenses and other liabilities | 22,963 | |||
Total liabilities | 869,114 | |||
Net Assets | $ | 53,514,130 | ||
Net Assets Consist of: | ||||
Shares of beneficial interest, no par value: unlimited shares authorized | $ | 22,069,221 | ||
Total distributable earnings | 31,444,909 | |||
Net Assets | $ | 53,514,130 | ||
Calculation of Maximum Offering Price: | ||||
Investor Class: | ||||
Net asset value and redemption price per share | $ | 10.92 | ||
Maximum sales charge (4.50% of offering price) | 0.51 | |||
Offering price to public | $ | 11.43 | ||
Shares outsanding | 1,812,237 | |||
Advisor Class: | ||||
Net asset value and redemption price per share | $ | 12.25 | ||
Shares outsanding | 2,751,465 | |||
Total Shares Outstanding | 4,563,702 |
See notes to financial statements.
– 14 –
OCM GOLD FUND
Statement of Operations – Six Months Ended May 31, 2020 |
Investment Income | ||||
Interest | $ | 1,070 | ||
Dividend (net of foreign withholding taxes of $17,337) | 119,889 | |||
Total investment income | 120,959 | |||
Expenses | ||||
Investment advisory fees | 190,655 | |||
Distribution fees - Investor Class | 63,946 | |||
Fund administration and accounting fees | 55,160 | |||
Transfer agent fees and expenses | 37,509 | |||
Federal and state registration fees | 20,187 | |||
Distribution fees - Advisor Class | 15,347 | |||
Legal fees | 15,195 | |||
Chief Compliance Officer fees | 12,594 | |||
Reports to shareholders | 9,040 | |||
Custody fees | 8,486 | |||
Audit fees | 7,750 | |||
Trustees’ fees | 5,705 | |||
Other expenses | 6,152 | |||
Total expenses | 447,726 | |||
Net investment loss | (326,767 | ) | ||
Realized and Unrealized Gain on Investments: | ||||
Net realized gain on investments and foreign currency transactions | 309,095 | |||
Net change in unrealized appreciation/depreciation on investments and foreign currency translations | 13,364,640 | |||
Net gain on investments | 13,673,735 | |||
Net increase in net assets from operations | $ | 13,346,968 |
See notes to financial statements.
– 15 –
OCM GOLD FUND
Statements of Changes in Net Assets |
Six Months Ended | Year Ended | |||||||
Operations: | ||||||||
Net investment loss | $ | (326,767 | ) | $ | (501,263 | ) | ||
Net realized gain on investments and foreign currency transactions | 309,095 | 2,242,143 | ||||||
Net change in unrealized appreciation/depreciation on investments and foreign currency transactions | 13,364,640 | 9,810,314 | ||||||
Net increase in net assets from operations | 13,346,968 | 11,551,194 | ||||||
Distributions Paid to Shareholders | ||||||||
Distributions: | ||||||||
Investor Class | (1,489,153 | ) | (4,021,862 | ) | ||||
Advisor Class | (792,591 | ) | (1,424,626 | ) | ||||
Total | (2,281,744 | ) | (5,446,488 | ) | ||||
Fund Share Transactions | ||||||||
Investor Class: | ||||||||
Net proceeds from shares sold | 265,139 | 895,476 | ||||||
Distributions reinvested | 1,410,502 | 3,396,889 | ||||||
Payment of shares redeemed1 | (8,733,666 | ) | (3,787,200 | ) | ||||
Net increase (decrease) in net assets from Investor Class share transactions | (7,058,025 | ) | 505,165 | |||||
Advisor Class: | ||||||||
Net proceeds from shares sold | 20,047,993 | 10,602,579 | ||||||
Distributions reinvested | 748,817 | 1,027,514 | ||||||
Payment of shares redeemed2 | (6,264,110 | ) | (7,035,387 | ) | ||||
Net increase in net assets from Advisor Class share transactions | 14,532,700 | 4,594,706 | ||||||
Net increase in net assets from Fund share transactions | 7,474,675 | 5,099,871 | ||||||
Total increase in net assets | 18,539,899 | 11,204,577 | ||||||
Net Assets, Beginning of Period | 34,974,231 | 23,769,654 | ||||||
Net Assets, End of Period | $ | 53,514,130 | $ | 34,974,231 | ||||
See notes to financial statements.
– 16 –
OCM GOLD FUND
Statements of Changes in Net Assets (Continued) |
Six Months Ended | Year Ended | |||||||
Transactions in shares | ||||||||
Investor Class: | ||||||||
Shares sold | 29,522 | 121,508 | ||||||
Shares issued on reinvestment of distributions | 171,177 | 573,799 | ||||||
Shares redeemed | (994,109 | ) | (522,919 | ) | ||||
Net increase (decrease) in Investor Class shares outstanding | (793,410 | ) | 172,388 | |||||
Advisor Class: | ||||||||
Shares sold | 2,024,162 | 1,168,422 | ||||||
Shares issued on reinvestment of distributions | 81,305 | 157,836 | ||||||
Shares redeemed | (660,957 | ) | (892,656 | ) | ||||
Net increase in Advisor Class shares outstanding | 1,444,510 | 433,602 | ||||||
Net Increase in Fund Shares Outstanding | 651,100 | 605,990 | ||||||
1 | Net of redemption fees of $596 for the six months ended May 31, 2020 and $1,006 for the year ended November 30, 2019, respectively. |
2 | Net of redemption fees of $28,554 for the six months ended May 31, 2020 and $51,310 for the year ended November 30, 2019, respectively. |
See notes to financial statements.
– 17 –
OCM GOLD FUND
Notes to Financial Statements – May 31, 2020 |
Note 1. Organization
OCM Mutual Fund (the “Trust”) is registered under the Investment Company Act of 1940, as amended, as an open-end management investment company. The Trust was organized as a Massachusetts business trust on January 6, 1984 and consists of the OCM Gold Fund (the “Fund”). The Fund is a non-diversified fund. The investment objective for the Fund is long-term growth of capital through investing primarily in equity securities of domestic and foreign companies engaged in activities related to gold and precious metals.
The Fund is an investment company and accordingly follows the investment company accounting and reporting guidance of the Financial Accounting Standards Board (“FASB”) Accounting Standard Codification Topic 946 “Financial Services—Investment Companies.”
Note 2. Significant Accounting Policies
The following is a summary of significant accounting policies followed by the Fund in the preparation of its financial statements.
Security Valuation – Portfolio securities that are listed on national securities exchanges, other than the NASDAQ Stock Market LLC, are valued at the last sale price as of the close of business of such securities exchanges, or, in the absence of recorded sales, at the average of readily available closing bid and ask prices on such exchanges. NASDAQ Global Select Market, Global Market and Capital Market securities are valued at the NASDAQ Official Closing Price (“NOCP”). If a NOCP is not issued for a given day, these securities are valued at the average of readily available closing bid and ask prices. Unlisted securities are valued at the average of the quoted bid and ask prices in the over-the-counter market. Short-term investments which mature in less than 60 days are valued at amortized cost (unless the Trust’s Board of Trustees determines that this method does not represent fair value). Short-term investments which mature after 60 days are valued at market. Securities and other assets for which market quotations are not readily available are valued at fair value as determined in good faith by the investment adviser under procedures established by and under the general supervision and responsibility of the Trust’s Board of Trustees. For each investment that is fair valued, the investment adviser considers, to the extent applicable, various factors including, but not limited to, the type of security, the financial condition of the company, comparable companies in the public market, the nature and duration of the cause for a quotation not being readily available and other relevant factors.
Fair Value Measurements and Disclosures defines fair value, establishes a framework for measuring fair value in accordance with GAAP, and expands disclosure about fair value measurements. It also provides guidance on determining when there has been a significant decrease in the volume and level of activity for an asset or a liability, when a transaction is not orderly, and how that information must be incorporated into a fair value measurement.
– 18 –
OCM GOLD FUND
Notes to Financial Statements – May 31, 2020 (Continued) |
Under Fair Value Measurements and Disclosures, various inputs are used in determining the value of the Fund’s investments. These inputs are summarized into three broad levels as described below:
● | Level 1 – Unadjusted quoted prices in active markets for identical assets or liabilities that the Funds have the ability to access. |
● | Level 2 – Observable inputs other than quoted prices included in Level 1 that are observable for the asset or liability, either directly or indirectly. These inputs may include quoted prices for the identical instrument on an inactive market, prices for similar instruments, interest rates, prepayment speeds, credit risk, yield curves, default rates and similar data. |
● | Level 3 – Unobservable inputs for the asset or liability, to the extent relevant observable inputs are not available, representing the Fund’s own assumptions about the assumptions a market participant would use in valuing the asset or liability, and would be based on the best information available. |
The availability of observable inputs can vary from security to security and is affected by a wide variety of factors, including for example, the type of security, whether the security is new and not yet established in the marketplace, the liquidity of markets, and other characteristics particular to the security. To the extent that valuation is based on models or inputs that are less observable or unobservable in the market, the determination of fair value requires more judgment. Accordingly, the degree of judgment exercised in determining fair value is greatest for instruments categorized in Level 3.
The inputs to measure fair value may fall into different Levels of the fair value hierarchy. In such cases, for disclosure purposes, the Level in the fair value hierarchy within which the fair value measurement falls in its entirety, is determined based on the lowest Level input that is significant to the fair value measurement in its entirety.
– 19 –
OCM GOLD FUND
Notes to Financial Statements – May 31, 2020 (Continued) |
The inputs or methodology used for valuing securities are not an indication of the risk associated with investing in those securities. The following is a summary of the inputs used, as of May 31, 2020, in valuing the Fund’s assets carried at fair value:
Sector | Level 1 | Level 2 | Level 3 | Total | ||||||||||||
Common Stocks | ||||||||||||||||
Major Gold Producers | $ | 15,462,150 | $ | — | $ | — | $ | 15,462,150 | ||||||||
Intermediate/Mid-Tier Gold Producers | 8,831,885 | — | — | 8,831,885 | ||||||||||||
Junior Gold Producers | 15,814,475 | — | — | 15,814,475 | ||||||||||||
Exploration and Development Companies | 3,458,908 | — | — | 3,458,908 | ||||||||||||
Royalty/Streaming Companies | 6,470,829 | — | — | 6,470,829 | ||||||||||||
Warrants | — | — | — | — | ||||||||||||
Short-Term Investment | 3,802,640 | — | — | 3,802,640 | ||||||||||||
Total | $ | 53,840,887 | $ | — | $ | — | $ | 53,840,887 | ||||||||
The Fund held one Level 2 security at May 31, 2020. Emmerson Resources Ltd., a Warrant, is being valued at intrinsic value, in accordance with procedures established by and under the general supervision of the Trust’s Board of Trustees. The Fund held one Level 3 security at May 31, 2020. Sutter Gold Mining, Inc. (“SGM CN”) has ceased operations and a receiver for the company’s assets has been appointed. The common shares of SGM CN will be valued at zero, in accordance with procedures established by and under the general supervision of the Trust’s Board of Trustees, until such time as the receiver has finalized the sale of the company’s assets.
– 20 –
OCM GOLD FUND
Notes to Financial Statements – May 31, 2020 (Continued) |
The following is a reconciliation of assets in which significant unobservable inputs (Level 3) were used in determining value:
Beginning balance November 30, 2019 | $ | — | ||
Transfers into Level 3 during the period | — | |||
Transfers out of Level 3 during the period | — | |||
Total realized gain/(loss) | — | |||
Total unrealized appreciation/(depreciation) | — | |||
Net purchases | — | |||
Net sales | — | |||
Balance as of May 31, 2020 | $ | — |
The Level 3 investments for the Fund represented 0.00% of net assets and did not warrant a disclosure of significant unobservable valuation inputs.
Foreign Currency – Investment securities and other assets and liabilities denominated in foreign currencies are translated into U.S. dollar amounts at the date of valuation. Purchases and sales of investment securities and income and expense items denominated in foreign currencies are translated into U.S. dollar amounts on the respective dates of such transactions. The Fund does not isolate that portion of the results of operations resulting from changes in foreign exchange rates on investments from the fluctuations arising from changes in market prices of securities held. Such fluctuations for the six months ended May 31, 2020 are included within the realized and unrealized gain/loss on investments section of the Statement of Operations.
Reported net realized foreign exchange gains or losses arise from sales of foreign currencies, currency gains or losses realized between the trade and settlement dates on securities transactions, and the difference between the amounts of dividends, interest and foreign withholding taxes recorded on the Fund’s books and the U.S. dollar equivalent of the amounts actually received or paid. Net unrealized foreign exchange gains and losses arise from changes in the fair value of assets and liabilities, other than investments in securities at fiscal period end, resulting from changes in exchange rates. Such fluctuations for the six months ended May 31, 2020 are included within the realized and unrealized gain/loss on investments section of the Statement of Operations.
Federal Income Taxes – The Fund intends to comply with the requirements of the Internal Revenue Code necessary to qualify as a regulated investment company and to make the requisite distributions of income to its shareholders to relieve it from all or substantially all federal income taxes. Withholding taxes on foreign dividends have been provided for in accordance with the Fund’s understanding on the applicable county’s tax rules and rate.
– 21 –
OCM GOLD FUND
Notes to Financial Statements – May 31, 2020 (Continued) |
Accounting for Uncertainty in Income Taxes (“Income Tax Statement”) requires an evaluation of tax positions taken (or expected to be taken) in the course of preparing the Fund’s tax returns to determine whether these positions meet a “more-likely-than-not” standard that, based on the technical merits, have a more than fifty percent likelihood of being sustained by a taxing authority upon examination. A tax position that meets the “more-likely-than-not” recognition threshold is measured to determine the amount of benefit to recognize in the financial statements. The Fund’s policy is to classify interest and penalties associated with underpayment of federal and state income taxes, if any, as income tax expense on the Statement of Operations. As of May 31, 2020, the Fund did not have any interest or penalties associated with the underpayment of any income taxes.
The Income Tax Statement requires management of the Fund to analyze all open tax years, fiscal years 2017-2020 as defined by the Internal Revenue Service statute of limitations for all major jurisdictions, including federal tax authorities and certain state tax authorities. As of and during the six months ended May 31, 2020, the Fund did not have a liability for any unrecognized tax benefits. The Fund has no examinations in progress and is not aware of any tax positions for which it is reasonably possible that the total amounts of unrecognized tax benefits will significantly change in the next twelve months.
Share Classes – The Fund offers two classes of shares, Investor Class and Advisor Class. The outstanding shares of the Fund on April 1, 2010 were renamed “Investor Class shares.” The Advisor Class shares commenced operations on April 1, 2010. The two classes represent interests in the same portfolio of investments and have the same rights. Income, expenses (other than expenses attributable to a specific class) and realized and unrealized gains and losses on investments are allocated to each class of shares in proportion to their relative net assets.
Securities Transactions and Investment Income – Securities transactions are accounted for on a trade date basis. Realized gains and losses on sales of securities are calculated on the identified cost basis. Dividend income is recorded on the ex-dividend date and interest income is recorded on an accrual basis. Withholding taxes on foreign dividends have been provided for in accordance with the Fund’s understanding of the applicable country’s tax rules and rates.
Distributions to Shareholders – The character of distributions made during the year from net investment income or net realized gains may differ from the characterization for federal income tax purposes due to differences in the recognition of income, expense or gain items for financial statement and tax purposes. To the extent that these differences are attributable to permanent book and tax accounting differences, the components of net assets have been adjusted.
– 22 –
OCM GOLD FUND
Notes to Financial Statements – May 31, 2020 (Continued) |
Redemption Fee – A 1.50% redemption fee is retained by the Fund to offset transaction costs and other expenses associated with short-term investing. The fee is imposed on redemptions or exchanges of shares held less than three months from their purchase date. The Fund records the fee as a reduction of shares redeemed and as a credit to shares of beneficial interest. For the six months ended May 31, 2020, the Investor Class and the Advisor Class received $596 and $28,554 in redemption fees, respectively.
Guarantees and Indemnifications – In the normal course of business, the Fund enters into contracts with service providers that contain general indemnification clauses. Also, under the Fund’s organizational documents, its officers and Trustees are indemnified by the Fund against certain liabilities arising out of the performance of their duties to the Fund. The Fund notes that insofar as indemnification for liabilities arising under the Securities Act of 1933 may be permitted to trustees and officers, the Fund has been advised that in the opinion of the Securities and Exchange Commission (the “SEC”) such indemnification is against public policy as expressed in that Act and is, therefore, unenforceable. The Fund’s maximum exposure under these arrangements is unknown as this would involve future claims against the Fund that have not yet occurred. Based on experience, the Fund expects the risk of loss to be remote.
Use of Estimates – The preparation of financial statements in conformity with accounting principles generally accepted in the United States of America requires management to make estimates and assumptions that affect the reported amounts of assets and liabilities and disclosure of contingent assets and liabilities at the date of the financial statements and the reported amounts of increases and decreases in net assets from operations during the reporting period. Actual results could differ from those estimates.
Derivative Instruments – Equity securities in the gold mining industry, particularly the smaller companies, may occasionally issue warrants as part of their capital structure. A warrant gives the holder the right to purchase the underlying equity at the exercise price until the expiration date of the warrant. The Fund may hold such warrants for exposure to smaller companies in the portfolio or other reasons associated with the Fund’s overall objective of long-term growth, though warrants will typically not be a significant part of the Fund’s portfolio. The Fund’s maximum risk in holding warrants is the loss of the entire amount paid for the warrants. At May 31, 2020, the Fund held warrants as listed on the Schedule of Investments.
– 23 –
OCM GOLD FUND
Notes to Financial Statements – May 31, 2020 (Continued) |
Note 3. Investment Advisory Agreement and Affiliated Parties
The Fund has an investment advisory agreement with Orrell Capital Management, Inc. (“OCM” or the “Adviser”). Under the agreement, the Fund pays OCM a fee computed daily and payable monthly, at the following annual rates based upon average daily net assets:
Assets | Fee Rate |
$0 to $250 million | 0.950% |
$250 million to $500 million | 0.800% |
$500 million to $1 billion | 0.700% |
Over $1 billion | 0.600% |
Under the investment advisory agreement, the Adviser is responsible for reimbursing the Fund to maintain a voluntary ratio of expenses to average daily net assets for the Investor Class shares and Advisor Class shares at 2.99% and 2.49%, respectively.
The Fund does not compensate Trustees and Officers affiliated with OCM. For the six months ended May 31, 2020, the expenses accrued for Trustees who are not affiliated with OCM are reported on the Statement of Operations. The Fund pays fees and related expenses for the services of the Fund’s Chief Compliance Officer. The expenses incurred for the Chief Compliance Officer are reported on the Statement of Operations.
Note 4. Distribution Agreement and Plan
The Trust has adopted a Distribution Plan (the “Plan”) pursuant to Rule 12b-1 under the Investment Company Act of 1940, as amended. The Plan authorizes the Fund to reimburse the distributor for marketing expenses incurred in distributing shares of the Fund, including the cost of printing sales material and making payments to dealers of the Fund’s Investor Class and Advisor Class, in any fiscal year, subject to limits of 0.99% and 0.25%, respectively, of the average daily net assets of each respective class. For the six months ended May 31, 2020, the Investor Class and the Advisor Class incurred $63,946 and $15,347, respectively, in expenses under the Plan.
Note 5. Purchases and Sales of Securities
Purchases and sales of investment securities (excluding short-term securities and U.S. government obligations) for the six months ended May 31, 2020 were $2,582,870 and $483,270, respectively. There were no purchases or sales of U.S. government obligations.
– 24 –
OCM GOLD FUND
Notes to Financial Statements – May 31, 2020 (Continued) |
Note 6. Federal Income Tax Information
At May 31, 2020, gross unrealized appreciation and depreciation of investments owned by the Fund, based on cost for federal income tax purposes were as follows:
Cost of investments | $ | 22,192,374 | ||
Unrealized appreciation on investments | $ | 32,190,793 | ||
Unrealized depreciation on investments | (542,280 | ) | ||
Net unrealized appreciation on investments | $ | 31,648,513 |
The difference between cost amounts for financial statement and federal income tax purposes is due primarily to investments in passive foreign investment companies (“PFICs”).
The tax character of distributions paid during the fiscal years ended November 30, 2019 and 2018 was as follows:
2019 | 2018 | |||||||
Ordinary income | $ | — | $ | — | ||||
Net long-term capital gains | 5,446,488 | 2,426,112 | ||||||
Total distributions | $ | 5,446,488 | $ | 2,426,112 | ||||
As of November 30, 2019 the components of accumulated earnings on a tax basis were as follows:
Undistributed ordinary income | $ | — | ||
Undistributed long-term gains | 2,090,808 | |||
Tax accumulated earnings | 2,090,808 | |||
Accumulated capital and other losses | (460,450 | ) | ||
Unrealized appreciation on investments | 18,749,327 | |||
Total accumulated earnings | $ | 20,379,685 |
– 25 –
OCM GOLD FUND
Notes to Financial Statements – May 31, 2020 (Continued) |
The Fund has $460,450 in qualified late-year losses, which are deferred until fiscal year 2020 for tax purposes. Net late-year ordinary losses incurred after December 31 and within the taxable year and net late-year specified losses incurred after October 31 and within the taxable year are deemed to arise on the first day of the Fund’s next taxable year.
Note 7. Concentration of Risk
Investing in foreign securities involves certain risks not necessarily found in U.S. markets. These include risks associated with adverse changes in economic, political, regulatory and other conditions, changes in currency exchange rates, exchange control regulations, expropriation of assets or nationalization, imposition of withholding taxes on dividend or interest payments or capital gains, and possible difficulty in obtaining and enforcing judgments against foreign entities. Further, issuers of foreign securities are subject to different, and often less comprehensive, accounting, reporting, and disclosure requirements than domestic issuers.
As the Fund concentrates its investments in the gold mining industry, a development adversely affecting the industry (for example, changes in the mining laws which increases production costs or a significant decrease in the market price of gold) would have a greater adverse effect on the Fund than it would if the Fund invested in a number of different industries.
Note 8. Illiquid Securities
Pursuant to Rule 22e-4 under the 1940 Act, the Fund has adopted a Liquidity Risk Management Program (“LRMP”) that requires, among other things, that the Fund limits its illiquid investments that are assets to no more than 15% of net assets. An illiquid investment is any security which may not reasonably be expected to be sold or disposed of in current market conditions in seven calendar days or less without the sale or disposition significantly changing the market value of the investment. If the Advisor, at any time, determines that the value of illiquid securities held by the Fund exceeds 15% of its net asset value, the Advisor will take such steps as it considers appropriate to reduce them as soon as reasonably practicable in accordance with the Fund’s written LRMP.
Note 9. COVID-19 Pandemic
In early 2020, an outbreak of a novel strain of coronavirus (COVID-19) emerged globally. This coronavirus has resulted in closing international borders, enhanced health screenings, healthcare service preparation and delivery, quarantines, cancellations, disruptions to supply chains and customer activity, as well as general public concern and uncertainty. The impact of this outbreak has negatively affected the worldwide economy, as well as the economies of individual countries, the financial health of individual companies and the market in general in significant and unforeseen ways. The future impact of COVID-19 is currently unknown, and it may exacerbate other
– 26 –
OCM GOLD FUND
Notes to Financial Statements – May 31, 2020 (Continued) |
risks that apply to the Fund, including political, social and economic risks. Any such impact could adversely affect the Fund’s performance, the performance of the securities in which the Fund invests and may lead to losses on your investment in the Fund. The ultimate impact of COVID-19 on the financial performance of the Fund’s investments is not reasonably estimable at this time.
Note 10. Subsequent Events
Management has evaluated events and transactions for potential recognition or disclosure through the date the financial statements were issued. Management has determined there are no material events that would require disclosure in the Fund’s financial statements through this date.
– 27 –
OCM GOLD FUND
Financial Highlights Investor Class |
Six Months | Year | Year | Year | Year | Year | |||||||||||||||||||
Per Share Operating Performance | ||||||||||||||||||||||||
(For a share outstanding throughout each period) | ||||||||||||||||||||||||
Net asset value, beginning of period | $ | 8.62 | $ | 7.05 | $ | 9.26 | $ | 11.12 | $ | 7.19 | $ | 9.47 | ||||||||||||
Income from Investment Operations: | ||||||||||||||||||||||||
Net investment loss1 | (0.08 | ) | (0.14 | ) | (0.19 | ) | (0.21 | ) | (0.24 | ) | (0.14 | ) | ||||||||||||
Net realized and unrealized gain (loss) on investments and foreign currency transactions | 2.95 | 3.37 | (1.36 | ) | 0.10 | 4.17 | (1.98 | ) | ||||||||||||||||
Total from investment operations | 2.87 | 3.23 | (1.55 | ) | (0.11 | ) | 3.93 | (2.12 | ) | |||||||||||||||
Less Distributions: | ||||||||||||||||||||||||
Dividends from net investment income | — | — | — | — | — | — | ||||||||||||||||||
Distribution from net realized gains | (0.57 | ) | (1.66 | ) | (0.66 | ) | (1.75 | ) | — | 2 | (0.16 | ) | ||||||||||||
Total distributions | (0.57 | ) | (1.66 | ) | (0.66 | ) | (1.75 | ) | — | 2 | (0.16 | ) | ||||||||||||
Redemption fee proceeds | — | 2 | — | 2 | — | 2 | — | 2 | — | 2 | — | 2 | ||||||||||||
Net asset value, end of period | $ | 10.92 | $ | 8.62 | $ | 7.05 | $ | 9.26 | $ | 11.12 | $ | 7.19 | ||||||||||||
Total return* | 35.49 | %3 | 56.65 | % | (18.24 | )% | 0.94 | % | 54.74 | % | (22.76 | )% | ||||||||||||
Ratios/Supplemental Data: | ||||||||||||||||||||||||
Net assets, end of year (in 000’s) | $ | 19,796 | $ | 22,467 | $ | 17,146 | $ | 30,492 | $ | 33,841 | $ | 24,750 | ||||||||||||
Ratio of expenses to average net assets | 2.49 | %4 | 2.91 | % | 2.93 | % | 2.78 | % | 2.66 | % | 2.59 | % | ||||||||||||
Ratio of net investment loss to average net assets | (1.88 | )%4 | (1.89 | )% | (2.27 | )% | (2.17 | )% | (2.07 | )% | (1.51 | )% | ||||||||||||
Portfolio turnover rate | 1 | %3 | 18 | % | 6 | % | 10 | % | 11 | % | 11 | % | ||||||||||||
* | Assumes no sales charge. |
1 | Based on average shares method. |
2 | Amount represents less than $0.01 per share. |
3 | Not annualized. |
4 | Annualized. |
See notes to financial statements.
– 28 –
OCM GOLD FUND
Financial Highlights Advisor Class |
Six Months | Year | Year | Year | Year | Year | |||||||||||||||||||
Per Share Operating Performance | ||||||||||||||||||||||||
(For a share outstanding throughout each period) | ||||||||||||||||||||||||
Net asset value, beginning of period | $ | 9.57 | $ | 7.58 | $ | 9.86 | $ | 11.63 | $ | 7.46 | $ | 9.76 | ||||||||||||
Income from Investment Operations: | ||||||||||||||||||||||||
Net investment loss1 | (0.07 | ) | (0.11 | ) | (0.15 | ) | (0.15 | ) | (0.18 | ) | (0.09 | ) | ||||||||||||
Net realized and unrealized gain (loss) on investments and foreign currency transactions | 3.31 | 3.71 | (1.47 | ) | 0.12 | 4.31 | (2.06 | ) | ||||||||||||||||
Total from investment operations | 3.24 | 3.60 | (1.62 | ) | (0.03 | ) | 4.13 | (2.15 | ) | |||||||||||||||
Less Distributions: | ||||||||||||||||||||||||
Dividends from net investment income | — | — | — | — | — | — | ||||||||||||||||||
Distribution from net realized gains | (0.57 | ) | (1.66 | ) | (0.66 | ) | (1.75 | ) | — | 2 | (0.16 | ) | ||||||||||||
Total distributions | (0.57 | ) | (1.66 | ) | (0.66 | ) | (1.75 | ) | — | 2 | (0.16 | ) | ||||||||||||
Redemption fee proceeds | 0.01 | 0.05 | — | 2 | 0.01 | 0.04 | 0.01 | |||||||||||||||||
Net asset value, end of period | $ | 12.25 | $ | 9.57 | $ | 7.58 | $ | 9.86 | $ | 11.63 | $ | 7.46 | ||||||||||||
Total return | 35.97 | %3 | 58.54 | %4 | (17.81 | )%4 | 1.81 | % | 55.98 | % | (22.28 | )% | ||||||||||||
Ratios/Supplemental Data: | ||||||||||||||||||||||||
Net assets, end of year (in 000’s) | $ | 33,718 | $ | 12,507 | $ | 6,624 | $ | 7,106 | $ | 9,467 | $ | 19,040 | ||||||||||||
Ratio of expenses to average net assets | 1.99 | %5 | 2.38 | % | 2.31 | % | 2.05 | % | 2.03 | % | 2.01 | % | ||||||||||||
Ratio of net investment loss to average net assets | (1.38 | )%5 | (1.36 | )% | (1.65 | )% | (1.44 | )% | (1.44 | )% | (0.92 | )% | ||||||||||||
Portfolio turnover rate | 1 | %3 | 18 | % | 6 | % | 10 | % | 11 | % | 11 | % | ||||||||||||
1 | Based on average shares method. |
2 | Amount represents less than $0.01 per share. |
3 | Not annualized. |
4 | Total returns would have been higher/lower had expenses not been waived/recovered by the Adviser. |
5 | Annualized. |
See notes to financial statements.
– 29 –
OCM GOLD FUND
Expense Example – For the Period Ended May 31, 2020 |
As a shareholder of the OCM Gold Fund (the “Fund”), you incur two types of costs: (1) transaction costs, including sales charges (loads) on purchase payments and redemption fees on certain redemptions; and (2) ongoing costs, including management fees; distribution (12b-1) fees; and other Fund expenses. This Example is intended to help you understand your ongoing costs (in dollars) of investing in the Fund and to compare these costs with the ongoing costs of investing in other mutual funds.
The Example is based on an investment of $1,000 invested at the beginning of the period and held for the entire period from December 1, 2019 to May 31, 2020 (the “period”).
Actual Expenses
The row titled “Actual” in the table below provides information about actual account values and actual expenses. You may use this information, together with the amount you invested, to estimate the expenses you paid over the period. Simply divide your account value by $1,000 (for example, an $8,600 account value divided by $1,000 equals 8.6), then multiply the result by the number in the appropriate line for your share class under the heading entitled “Expenses Paid During the Period” to estimate the expenses you paid on your account during the periods.
Hypothetical Example for Comparison Purposes
The row titled “Hypothetical” in the table below provides information about hypothetical account values and hypothetical expenses based on each class’ actual expense ratio and an assumed rate of return of 5% per year before expenses, which is not each class’ actual return. The hypothetical account values and expenses may not be used to estimate the actual ending account balance or expenses you paid for the period. You may use this information to compare the ongoing costs of investing in the classes of the Fund and other funds. To do so, compare these 5% hypothetical examples with the 5% hypothetical examples that appear in the shareholder reports of other funds.
Please note that the expenses shown in the table are meant to highlight your ongoing costs only and do not reflect any transactional costs, such as sales charges (loads) and redemption fees. Therefore, the hypothetical lines of the table are useful in comparing the ongoing costs only, and will not help you determine the relative total costs of owning different funds. In addition, if these transactional costs were included, your costs would have been higher.
– 30 –
OCM GOLD FUND
Expense Example – For the Period Ended May 31, 2020 (Continued) |
Expenses Paid During the Period
Beginning | Ending | Expenses Paid | |
Investor Class | |||
Actual | $ 1,000.00 | $ 1,354.90 | $ 14.69 |
Hypothetical (5% return before expenses) | 1,000.00 | 1,012.58 | 12.55 |
Advisor Class | |||
Actual | 1,000.00 | 1,359.70 | 11.71 |
Hypothetical (5% return before expenses) | 1,000.00 | 1,015.07 | 10.00 |
* | Expenses are equal to the Investor Class’ and Advisor Class’ annualized expense ratios of 2.49% and 1.99%, respectively, for the period, multiplied by the average account value over the period, multiplied by 183/366 (to reflect the one-half year period). |
– 31 –
OCM GOLD FUND
Other Information |
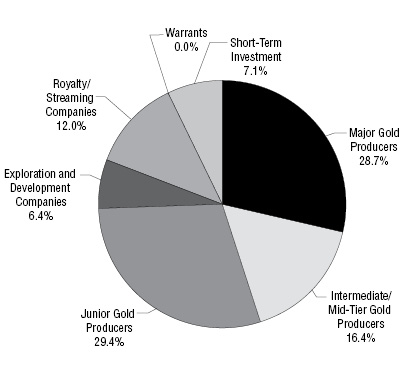
Investments by Sector – As of May 31, 2020
As a Percentage of Total Investments
The Fund files a complete schedule of their portfolio holdings with the U.S. Securities and Exchange Commission (“SEC”) for the first and third quarters of each fiscal year on Form N-PORT within 60 days of the end of such fiscal quarter. Shareholders may obtain the Fund’s Form N-PORT on the SEC’s website at www.sec.gov.
Prior to their use of Form N-PORT, the Fund filed its complete schedule of portfolio holdings with the SEC on Form N-Q, which is available online at www.sec.gov
A description of the Fund’s proxy voting policies and procedures and a record of the Fund’s proxy votes for the year ended June 30, 2019 are available without charge, upon request by calling toll free 1-800-779-4681 and on the SEC’s website at http://www.sec.gov. The Fund’s proxy voting policies and procedures are also available on the Fund’s website at http://www.ocmgoldfund.com.
– 32 –
THIS PAGE INTENTIONALLY LEFT BLANK
OCM Gold Fund
Distributed by:
Northern Lights Distributors, LLC
17605 Wright Street
Omaha, NE 68130
2269-NLD-7/20/2020
Item 2. Code of Ethics.
Not applicable to semi-annual reports.
Item 3. Audit Committee Financial Expert.
Not applicable to semi-annual reports.
Item 4. Principal Accountant Fees and Services
Not applicable to semi-annual reports.
Item 5. Audit Committee of Listed Registrants
Not applicable to semi-annual reports.
Item 6. Schedule of Investments
The schedules of investments in securities in unaffiliated issuers are included as part of the reports to shareholders filed under Item 1.
Item 7. Disclosure of Proxy Voting Policies and Procedures for Closed-End Management Investment Companies
Not applicable.
Item 8. Portfolio Managers of Closed-End Management Investment Companies
Not applicable.
Item 9. Purchases of Equity Securities by Closed-End Management Investment Company and Affiliated Purchasers
Not applicable.
Item 10. Submissions of Matters to a Vote of Security Holders
As of the end of the period covered by this report, the registrant had not adopted any procedures by which shareholders may recommend nominees to the registrant’s Board of Directors.
Item 11. Controls and Procedures.
| (a) | The registrant's certifying officer has concluded that the registrant's disclosure controls and procedures (as defined in Rule 30a-2 under the Investment Company Act of 1940 (the "Act")) are effective in design and operation and are sufficient to form the basis of the certifications required by Rule 30a-2 under the Act, based on their evaluation of these disclosure controls and procedures within 90 days of the filing date of this report on Form N-CSR. |
(b) Not applicable.
Item 12. Disclosure of Securities Lending Activities for Closed-End Management Investment Companies.
Not applicable.
Item 13. Exhibits.
(a)(1) Code of Ethics – Not applicable.
(a)(3) Any written solicitation to purchase securities under Rule 23c-1 under the Act sent or given during the period covered by the report by or on behalf of the registrant to 10 or more persons. Not applicable to open-end investment companies.
(a)(4) Change in the registrant’s independent public accountant – Not applicable.
SIGNATURES
Pursuant to the requirements of the Securities Exchange Act of 1934 and the Investment Company Act of 1940, the registrant has duly caused this report to be signed on its behalf by the undersigned, thereunto duly authorized.
OCM Mutual Fund
| By: | /s/ Gregory M. Orrell | |
| Gregory M. Orrell | ||
| President |
| Date: | July 27, 2020 |
Pursuant to the requirements of the Securities Exchange Act of 1934 and the Investment Company Act of 1940, this report has been signed below by the following persons on behalf of the registrant and in the capacities and on the dates indicated.
| By: | /s/ Gregory M. Orrell | |
| Gregory M. Orrell | ||
| President and Treasurer |
| Date: | July 27, 2020 |