
Annual Report November 30, 2006


EATON VANCE
PRIME
RATE
RESERVES
IMPORTANT NOTICES REGARDING PRIVACY,
DELIVERY OF SHAREHOLDER DOCUMENTS,
PORTFOLIO HOLDINGS AND PROXY VOTING
Privacy. The Eaton Vance organization is committed to ensuring your financial privacy. Each of the financial institutions identified below has in effect the following policy ("Privacy Policy") with respect to nonpublic personal information about its customers:
• Only such information received from you, through application forms or otherwise, and information about your Eaton Vance fund transactions will be collected. This may include information such as name, address, social security number, tax status, account balances and transactions.
• None of such information about you (or former customers) will be disclosed to anyone, except as permitted by law (which includes disclosure to employees necessary to service your account). In the normal course of servicing a customer's account, Eaton Vance may share information with unaffiliated third parties that perform various required services such as transfer agents, custodians and broker/dealers.
• Policies and procedures (including physical, electronic and procedural safeguards) are in place that are designed to protect the confidentiality of such information.
• We reserve the right to change our Privacy Policy at any time upon proper notification to you. Customers may want to review our Policy periodically for changes by accessing the link on our homepage: www.eatonvance.com.
Our pledge of privacy applies to the following entities within the Eaton Vance organization: the Eaton Vance Family of Funds, Eaton Vance Management, Eaton Vance Investment Counsel, Boston Management and Research, and Eaton Vance Distributors, Inc.
In addition, our Privacy Policy only applies to those Eaton Vance customers who are individuals and who have a direct relationship with us. If a customer's account (i.e., fund shares) is held in the name of a third-party financial adviser/
broker-dealer, it is likely that only such adviser's privacy policies apply to the customer. This notice supersedes all previously issued privacy disclosures.
For more information about Eaton Vance's Privacy Policy, please call 1-800-262-1122.
Delivery of Shareholder Documents. The Securities and Exchange Commission (the "SEC") permits funds to deliver only one copy of shareholder documents, including prospectuses, proxy statements and shareholder reports, to fund investors with multiple accounts at the same residential or post office box address. This practice is often called "householding" and it helps eliminate duplicate mailings to shareholders.
Eaton Vance, or your financial adviser, may household the mailing of your documents indefinitely unless you instruct Eaton Vance, or your financial adviser, otherwise.
If you would prefer that your Eaton Vance documents not be householded, please contact Eaton Vance at 1-800-262-1122, or contact your financial adviser.
Your instructions that householding not apply to delivery of your Eaton Vance documents will be effective within 30 days of receipt by Eaton Vance or your financial adviser.
Portfolio Holdings. Each Eaton Vance Fund and its underlying Portfolio (if applicable) will file a schedule of its portfolio holdings on Form N-Q with the SEC for the first and third quarters of each fiscal year. The Form N-Q will be available on the Eaton Vance website www.eatonvance.com, by calling Eaton Vance at 1-800-262-1122 or in the EDGAR database on the SEC's website at www.sec.gov. Form N-Q may also be reviewed and copied at the SEC's public reference room in Washington, D.C. (call 1-800-732-0330 for information on the operation of the public reference room).
Proxy Voting. From time to time, funds are required to vote proxies related to the securities held by the funds. The Eaton Vance Funds or their underlying Portfolios (if applicable) vote proxies according to a set of policies and procedures approved by the Funds' and Portfolios' Boards. You may obtain a description of these policies and procedures and information on how the Funds or Portfolios voted proxies relating to portfolio securities during the most recent 12 month period ended June 30, without charge, upon request, by calling 1-800-262-1122. This description is also available on the SEC's website at www.sec.gov.
Eaton Vance Prime Rate Reserves as of November 30, 2006
ManageMenT's dIscussIon of fund PerforMance
Performance for the Past Year
· Eaton Vance Prime Rate Reserves (the "Fund") had a total return of 6.02% during the year ended November 30, 2006.(1) This return resulted from no change in NAV of $9.39 on November 30, 2006, and on November 30, 2005, and the reinvestment of all distributions.
· The Fund distributed $0.551 in income dividends during the year ended November 30, 2006. Based on a $9.39 net asset value on November 30, 2006, the Fund had a distribution rate of 6.38%.(2) The Fund's SEC 30-day yield at November 30, 2006, was
6.48%.(3)
· For comparison, the Fund's benchmark - the S&P/ LSTA Leveraged Loan Index - an unmanaged loan market index - had a total return of 6.57% for the year ended November 30, 2006.(4)
Investment Environment
· The loan market enjoyed relatively stable fundamentals during the fiscal year, with default rates remaining low by historical standards. Technical factors came more into balance, as record new issuance from strong merger and acquisition activity met robust investor demand. Loan credit spreads stabilized during the fiscal year, after a period during which they had narrowed.
· The Federal Reserve raised its Federal Funds rate - a key short-term interest rate benchmark - by 25 basis points (0.25%) on five occasions during the fiscal year ended November 30, 2006. The London Inter-Bank Offered Rate (LIBOR) - the benchmark over which loan interest rates are typically set - rose in lockstep with those actions, increasing the Fund's total return.
The Portfolio's Investments
· Senior Debt Portfolio's investments included 485 borrowers at November 30, 2006, with an average loan size of 0.20% of total investments, and no industry constituting more than 8.0% of total investments. Chemicals/plastics, building and development (including manufacturers of building products and companies that manage/own apartments, shopping malls and commercial office buildings, among others), health care, cable/satellite television and business equipment/services and were the Portfolio's largest industry weightings.*
· Senior Debt Portfolio had an 11.5% exposure in European loans at November 30, 2006. European loan issuance has grown significantly in 2006 and now represents a significant portion of the global loan market. European loans increased the Portfolio's investment universe, presenting further opportunities for diversification. In addition, because European spreads were slightly wider than the U.S.market, European exposure provided selected opportunities for yield enhancement. All of the Portfolio's foreign loans were either dollar-denominated or hedged to help protect against foreign currency risk.
The views expressed in this report are those of the portfolio managers and are current only through the end of the period of the report as stated on the cover. These views are subject to change at any time based upon market or other conditions, and the investment adviser disclaims any responsibility to update such views. These views may not be relied on as investment advice and, because investment decisions for a fund are based on many factors, may not be relied on as an indication of trading intent on behalf of any Eaton Vance fund.
* Holdings and industry weightings are subject to change due to active management.
Past performance is no guarantee of future results. Returns are historical and are calculated by determining the percentage change in net asset value or share price (as applicable) with all distributions reinvested. Investment return and principal value will fluctuate so that shares, when redeemed, may be worth more or less than their original cost. Performance is for the stated time period only; due to market volatility, the Fund's current performance may be lower or higher than the quoted return. For performance as of the most recent month end, please refer to www.eatonvance.com.
Fund shares are not insured by the FDIC and are not deposits or other obligations of, or guaranteed by, any depository institution. Shares are subject to investment risks, including possible loss of principal invested.
(1) Total return at net asset value does not reflect applicable early withdrawal charge (EWC). If EWC was included, return would be lower. Absent a fee waiver by the investment adviser, the returns would be lower. (2) The Fund's distribution rate represents actual distributions paid to shareholders and is calculated daily by dividing the last distribution per share (annualized) by the net asset value. (3) The Fund's SEC yield is calculated by dividing the net investment income per share for the 30-day period by the net asset value at the end of the period and annualizing the result. Yield will vary. (4) It is not possible to invest directly in an Index. The Index's total return reflects changes in the value of the loans constituting the Index and accrual of interest and does not reflect the expenses that would have been incurred if an investor individually purchased or sold the loans represented in the Index.
1
Eaton Vance Prime Rate Reserves as of November 30, 2006
fund PerforMance
The line graph and table set forth below provide information about the Fund's performance. The line graph compares the performance of the Fund with that of the S&P/LSTA Leveraged Loan Index, an unmanaged loan market index. The lines on the graph represent the total returns of a hypothetical investment of $10,000 in the Fund and in the S&P/LSTA Leveraged Loan Index. The table includes the total return of the Fund at net asset value and public offering price. The performance presented below does not reflect the deduction of taxes, if any, that a shareholder would pay on distributions or the repurchase of Fund shares.
Performance(1) As of 11/30/06
Average Annual Total Returns (at net asset value) | | | |
One year | | 6.02 | % |
Five years | | 4.69 | |
Ten years | | 4.98 | |
SEC Average Annual Total Returns (including applicable EWC) | | | |
One year | | 3.02 | % |
Five years | | 4.69 | |
Ten years | | 4.98 | |
(1) Average Annual Total Returns at net asset value do not include the applicable early withdrawal charge (EWC). If the EWC was deducted, returns would be lower. SEC Average Annual Total Returns reflect applicable EWC based on the following schedule: 3% - 1st year; 2.5% - 2nd year; 2% - 3rd year; 1% - 4th year.
Past performance is no guarantee of future results. Returns are historical and are calculated by determining the percentage change in net asset value or share price (as applicable) with all distributions reinvested. Investment return and principal value will fluctuate so that shares, when redeemed, may be worth more or less than their original cost. Performance is for the stated time period only; due to market volatility, the Fund's current performance may be lower or higher than the quoted return. For performance as of the most recent month end, please refer to www.eatonvance.com.
fund Allocations(2)
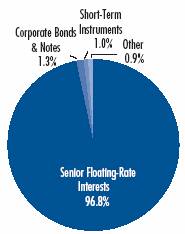
(2) Reflects the Fund's investments in Senior Debt Portfolio as of November 30, 2006. Allocations are shown as a percentage of the Portfolios total investments. Fund allocations may not be representative of current or future investments and are subject to change due to active management.
Comparison of Change in value of a $10,000 Investment in Easton Vance Prime Rate Reserves vs. the S&P/LISA Leveraged Loan Index*
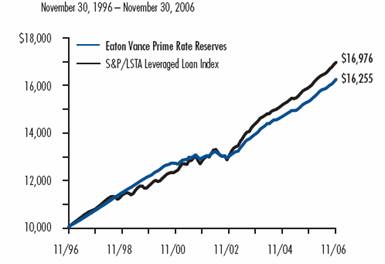
* Sources: Standard & Poor's; Thomson Financial. Fund operations commenced on 8/4/89.
It is not possible to invest directly in an Index. The Index's total returns do not reflect the expenses that would have been incurred if an investor individually purchased or sold the securities represented in the Index.
Diversification by Industries(3)
Chemicals & Plastics | | 7.5 | % |
Building & Development | | 7.1 | |
Health Care | | 5.9 | |
Cable & Satellite Television | | 5.8 | |
Business Equip. & Services | | 5.7 | |
Publishing | | 5.1 | |
Leisure Goods/Activities/Movies | | 4.8 | |
Radio & Television | | 4.3 | |
Automotive | | 4.3 | |
Lodging & Casinos | | 3.8 | |
Telecommunications | | 3.6 | |
Containers & Glass Products | | 3.5 | |
Conglomerates | | 3.0 | |
Retailers (Except Food & Drug) | | 2.9 | |
Electronics/Electrical | | 2.8 | |
Financial Intermediaries | | 2.5 | |
Oil & Gas | | 2.2 | |
Food Products | | 2.2 | |
Utilities | | 2.1 | |
Forest Products | | 2.1 | % |
Nonferrous Metals/Minerals | | 2.0 | |
Aerospace & Defense | | 1.7 | |
Food Service | | 1.7 | |
Home Furnishings | | 1.3 | |
Food/Drug Retailers | | 1.3 | |
Industrial Equipment | | 1.2 | |
Equipment Leasing | | 1.2 | |
Ecological Services & Equip. | | 1.1 | |
Air Transport | | 1.0 | |
Insurance | | 0.9 | |
Beverage & Tobacco | | 0.8 | |
Rail Industries | | 0.6 | |
Clothing/Textiles | | 0.5 | |
Surface Transport | | 0.5 | |
Drugs | | 0.5 | |
Cosmetics/Toiletries | | 0.3 | |
Farming/Agriculture | | 0.2 | |
Steel | | 0.1 | |
(3) Reflects the Fund's investments in Senior Debt Portfolio as of November 30, 2006. Industries are shown as a percentage of the Portfolio's total investments. Statistics may not be representative of current or future investments and are subject to change due to active management.
2
Eaton Vance Prime Rate Reserves as of November 30, 2006
FINANCIAL STATEMENTS
Statement of Assets and Liabilities
As of November 30, 2006
| Assets | |
Investment in Senior Debt Portfolio, at value
(identified cost, $1,250,495,267) | | $ | 1,277,230,022 | | |
| Receivable for Fund shares sold | | | 886,932 | | |
| Total assets | | $ | 1,278,116,954 | | |
| Liabilities | |
| Dividends payable | | $ | 3,153,769 | | |
| Payable to affiliate for distribution fees | | | 761,055 | | |
| Payable to affiliate for Trustees' fees | | | 580 | | |
| Payable for Fund shares redeemed | | | 9,915 | | |
| Accrued expenses | | | 325,417 | | |
| Total liabilities | | $ | 4,250,736 | | |
| Net Assets | | $ | 1,273,866,218 | | |
| Sources of Net Assets | |
| Paid-in capital | | $ | 1,584,494,373 | | |
Accumulated net realized loss from Portfolio
(computed on the basis of identified cost) | | | (338,149,044 | ) | |
| Accumulated undistributed net investment income | | | 786,134 | | |
Net unrealized appreciation from Portfolio
(computed on the basis of identified cost) | | | 26,734,755 | | |
| Total | | $ | 1,273,866,218 | | |
Net Asset Value, Offering Price and
Redemption Price Per Share | |
($1,273,866,218 ÷ 135,732,803 shares of beneficial
interest outstanding) | | $ | 9.39 | | |
Statement of Operations
For the Year Ended
November 30, 2006
| Investment Income | |
| Interest allocated from Portfolio | | $ | 98,222,226 | | |
| Expenses allocated from Portfolio | | | (7,146,065 | ) | |
| Net investment income from Portfolio | | $ | 91,076,161 | | |
| Expenses | |
| Trustees' fees and expenses | | $ | 3,408 | | |
| Distribution fees | | | 9,657,606 | | |
| Transfer and dividend disbursing agent fees | | | 1,116,099 | | |
| Printing and postage | | | 256,714 | | |
| Legal and accounting services | | | 40,933 | | |
| Registration fees | | | 36,240 | | |
| Custodian fee | | | 28,105 | | |
| Miscellaneous | | | 11,306 | | |
| Total expenses | | $ | 11,150,411 | | |
| Net investment income | | $ | 79,925,750 | | |
Realized and Unrealized
Gain (Loss) from Portfolio | |
Net realized gain (loss) -
Investment transactions (identified cost basis) | | $ | 3,029,722 | | |
| Swap contracts | | | 155,168 | | |
Foreign currency and forward foreign currency
exchange contract transactions | | | (9,171,517 | ) | |
| Net realized loss | | $ | (5,986,627 | ) | |
Change in unrealized appreciation (depreciation) -
Investments (identified cost basis) | | $ | 8,704,493 | | |
| Swap contracts | | | 238,829 | | |
| Foreign currency and forward foreign currency exchange contracts | | | (1,346,980 | ) | |
| Net change in unrealized appreciation (depreciation) | | $ | 7,596,342 | | |
| Net realized and unrealized gain | | $ | 1,609,715 | | |
| Net increase in net assets from operations | | $ | 81,535,465 | | |
See notes to financial statements
3
Eaton Vance Prime Rate Reserves as of November 30, 2006
FINANCIAL STATEMENTS CONT'D
Statements of Changes in Net Assets
Increase (Decrease)
in Net Assets | | Year Ended
November 30, 2006 | | Year Ended
November 30, 2005 | |
From operations -
Net investment income | | $ | 79,925,750 | | | $ | 65,518,404 | | |
Net realized gain (loss) from investment
transactions, swap contracts,
foreign currency, and forward
foreign currency exchange
contract transactions | | | (5,986,627 | ) | | | 849,299 | | |
Net change in unrealized appreciation
(depreciation) from investments,
swap contracts, foreign
currency, and forward foreign
currency exchange contracts | | | 7,596,342 | | | | 185,299 | | |
| Net increase in net assets from operations | | $ | 81,535,465 | | | $ | 66,553,002 | | |
Distributions to shareholders -
From net investment income | | $ | (80,790,251 | ) | | $ | (65,849,722 | ) | |
| Total distributions to shareholders | | $ | (80,790,251 | ) | | $ | (65,849,722 | ) | |
Transactions in shares of beneficial interest -
Proceeds from sale of shares | | $ | 53,849,567 | | | $ | 68,846,515 | | |
Net asset value of shares issued to
shareholders in payment of
distributions declared | | | 42,998,968 | | | | 34,492,758 | | |
| Cost of shares redeemed | | | (252,093,538 | ) | | | (312,531,946 | ) | |
Net decrease in net assets from
Fund share transactions | | $ | (155,245,003 | ) | | $ | (209,192,673 | ) | |
| Net decrease in net assets | | $ | (154,499,789 | ) | | $ | (208,489,393 | ) | |
| Net Assets | |
| At beginning of year | | $ | 1,428,366,007 | | | $ | 1,636,855,400 | | |
| At end of year | | $ | 1,273,866,218 | | | $ | 1,428,366,007 | | |
Accumulated undistributed
net investment income
included in net assets | |
| At end of year | | $ | 786,134 | | | $ | 184,800 | | |
See notes to financial statements
4
Eaton Vance Prime Rate Reserves as of November 30, 2006
FINANCIAL STATEMENTS CONT'D
Financial Highlights
| | | Year Ended November 30, | | Period Ended
November 30, | | Year Ended
December 31, | |
| | | 2006(1) | | 2005(1) | | 2004 | | 2003 | | 2002(1)(2) | | 2001 | |
| Net asset value - Beginning of year | | $ | 9.390 | | | $ | 9.380 | | | $ | 9.180 | | | $ | 8.840 | | | $ | 9.160 | | | $ | 9.500 | | |
| Income (loss) from operations | |
| Net investment income | | $ | 0.545 | | | $ | 0.393 | | | $ | 0.282 | | | $ | 0.298 | | | $ | 0.332 | | | $ | 0.590 | | |
| Net realized and unrealized gain (loss) | | | 0.006 | | | | 0.013 | | | | 0.199 | | | | 0.339 | | | | (0.319 | ) | | | (0.352 | ) | |
| Total income from operations | | $ | 0.551 | | | $ | 0.406 | | | $ | 0.481 | | | $ | 0.637 | | | $ | 0.013 | | | $ | 0.238 | | |
| Less distributions | |
| From net investment income | | $ | (0.551 | ) | | $ | (0.396 | ) | | $ | (0.281 | ) | | $ | (0.297 | ) | | $ | (0.333 | ) | | $ | (0.578 | ) | |
| Total distributions | | $ | (0.551 | ) | | $ | (0.396 | ) | | $ | (0.281 | ) | | $ | (0.297 | ) | | $ | (0.333 | ) | | $ | (0.578 | ) | |
| Net asset value - End of year | | $ | 9.390 | | | $ | 9.390 | | | $ | 9.380 | | | $ | 9.180 | | | $ | 8.840 | | | $ | 9.160 | | |
| Total Return(3) | | | 6.02 | % | | | 4.41 | % | | | 5.30 | % | | | 7.32 | % | | | 0.13 | % | | | 2.54 | % | |
| Ratios/Supplemental Data | |
| Net assets, end of year (000's omitted) | | $ | 1,273,866 | | | $ | 1,428,366 | | | $ | 1,636,855 | | | $ | 1,840,559 | | | $ | 2,206,150 | | | $ | 3,165,119 | | |
| Ratios (As a percentage of average daily net assets): | |
| Expenses before custodian fee reduction(4) | | | 1.32 | % | | | 1.33 | % | | | 1.31 | % | | | 1.31 | % | | | 1.26 | %(5) | | | 1.26 | % | |
| Expenses after custodian fee reduction(4) | | | 1.32 | % | | | 1.33 | % | | | 1.31 | % | | | 1.31 | % | | | 1.26 | %(5) | | | 1.26 | % | |
| Interest expense(4) | | | 0.01 | % | | | 0.00 | %(6) | | | 0.00 | %(6) | | | 0.01 | % | | | 0.01 | %(5) | | | 0.01 | % | |
| Net investment income | | | 5.79 | % | | | 4.18 | % | | | 3.02 | % | | | 3.34 | % | | | 4.01 | %(5) | | | 6.25 | % | |
| Portfolio Turnover of the Portfolio | | | 51 | % | | | 65 | % | | | 87 | % | | | 47 | % | | | 42 | % | | | 33 | % | |
(1) Net investment income was computed using average shares outstanding.
(2) For the eleven-month period ended November 30, 2002.
(3) Returns are historical and are calculated by determining the percentage change in net asset value with all distributions reinvested. Total return is not computed on an annualized basis.
(4) Includes the Fund's share of the Portfolio's allocated expenses.
(5) Annualized.
(6) Represents less than 0.01%.
See notes to financial statements
5
Eaton Vance Prime Rate Reserves as of November 30, 2006
NOTES TO FINANCIAL STATEMENTS
1 Significant Accounting Policies
Eaton Vance Prime Rate Reserves (the Fund) is a closed-end management investment company. The Fund is an entity of the type commonly known as a Massachusetts business trust and is registered under the Investment Company Act of 1940 (the 1940 Act), as amended. The Fund invests all of its investable assets in interests in the Senior Debt Portfolio (the Portfolio), a New York Trust, having the same investment objective as the Fund. The value of the Fund's investment in the Portfolio reflects the Fund's proportionate interest in the net assets of the Portfolio (48.3% at November 30, 2006). The performance of the Fund is directly affected by the performance of the Portfolio. The financial statements of the Portfolio, including the portfolio of investments, are included elsewhere in this report and should be read in conjunction with the Fund's financial statements.
The following is a summary of significant accounting policies of the Fund. The policies are in conformity with accounting principles generally accepted in the United States of America.
A Investment Valuation - Valuation of securities by the Portfolio is discussed in Note 1A of the Portfolio's Notes to Financial Statements, which are included elsewhere in this report.
B Income - The Fund's net investment income or loss consists of the Fund's pro rata share of the net investment income or loss of the Portfolio, less all actual and accrued expenses of the Fund.
C Federal Taxes - The Fund's policy is to comply with the provisions of the Internal Revenue Code applicable to regulated investment companies and to distribute to shareholders, each year, substantially all of its net investment income and all or substantially all of its net realized capital gains. Accordingly, no provision for federal income or excise tax is necessary. At November 30, 2006, the Fund, for federal income tax purposes had a capital loss carryover of $341,476,962 which will expire on November 30, 2007 ($5,906,636), November 30, 2008 ($44,323,516), November 30, 2009 ($118,172,997), November 30, 2010 ($85,893,275), November 30, 2011 ($86,475,719) and November 30, 2013 ($704,819). These amounts will reduce taxable income arising from future net realized gain on investments, if any, to the extent permitted by the Internal Revenue Code, and thus will reduce the amount of the distributions to shareholders which would otherwise be necessary to relieve the Fund of any liability for federal income or excise tax.
D Use of Estimates - The preparation of the financial statements in conformity with accounting principles generally accepted in the United States of America requires management to make estimates and assumptions that affect the reported amounts of assets and liabilities at the date of the financial statements and the reported amounts of income and expense during the reporting period. Actual results could differ from those estimates.
E Indemnifications - Under the Fund's organizational documents, its officers and Trustees may be indemnified against certain liabilities and expenses arising out of the performance of their duties to the Fund, and shareholders are indemnified against personal liability for the obligations of the Fund. Additionally, in the normal course of business, the Fund enters into agreements with service providers that may contain indemnification clauses. The Fund's maximum exposure under these arrangements is unknown as this would involve future claims that may be made against the Fund that have not yet occurred.
F Expense Reduction - Investors Bank & Trust Company (IBT) serves as custodian of the Fund. Pursuant to the custodian agreement, IBT receives a fee reduced by credits which are determined based on the average daily cash balance the Fund maintains with IBT. All credit balances used to reduce the Fund's custodian fees are reported as a reduction of expenses in the Statement of Operations.
G Other - Investment transactions are accounted for on the date the securities are purchased or sold. Dividends to shareholders are recorded on the ex-dividend date.
2 Distributions to Shareholders
The net investment income of the Fund is determined daily, and substantially all of the net investment income so determined is declared daily as a dividend to shareholders of record at the time of declaration. Such daily dividends will be paid monthly. Distributions of realized capital gains, if any, are made at least annually. Shareholders may reinvest capital gain distributions in additional shares of the Fund at the net asset value as of the ex-dividend date. Distributions are paid in the form of additional shares or, at the election of the shareholder, in cash. The Fund distinguishes between distributions on a tax basis and those on a financial reporting basis. Accounting principles generally accepted in the United States of America require that only distributions in excess of tax basis earnings and profits be reported in the financial statements as a return of capital. Permanent differences between book and tax
6
Eaton Vance Prime Rate Reserves as of November 30, 2006
NOTES TO FINANCIAL STATEMENTS CONT'D
accounting relating to distributions are reclassified to paid-in capital. These differences are primarily related to foreign currency transactions and tax accounting for straddles.
The tax character of the distributions declared for the years ended November 30, 2006 and November 30, 2005 was as follows:
| | | Year Ended November 30, | |
| | | 2006 | | 2005 | |
| Distributions declared from: | |
|
| Ordinary income | | $ | 80,790,251 | | | $ | 65,849,722 | | |
|
During the year ended November 30, 2006, accumulated undistributed of net investment income was increased by $1,465,835, accumulated net realized loss was decreased by $8,977,574 and paid-in-capital was decreased by $10,443,409 due to differences in book and tax accounting for mixed straddles, swap contracts and foreign currency transactions. This change had no effect on net asset or net asset value per share.
At Novemer 30, 2006, the components of distributable earnings (accumulated losses) on a tax basis were as follows:
| Undistributed ordinary income | | $ | 3,939,903 | | |
| Capital loss carryforward | | $ | (341,476,962 | ) | |
| Unrealized appreciation | | $ | 30,062,673 | | |
| Other temporary differences | | $ | (3,153,769 | ) | |
3 Shares of Beneficial Interest
The Declaration of Trust permits the Trustees to issue an unlimited number of full and fractional shares of beneficial interest (without par value). The Fund operates as an interval fund, meaning that it continuously accepts new shareholder investments but permits share repurchases (of at least 5% and up to 25% or more of its shares) at net asset value only once a quarter. It is a fundamental policy of the Fund (which may only be changed by shareholder vote) that the Fund will conduct repurchase offers ending on a date (fixed by the Trustees) in the months of February, May, August and November and the repurchase price will be determined no more than 14 days following the repurchase request deadline. Payment for all shares repurchased pursuant to these offers normally will be made no later than 7 days after the repurchase pricing date. Shareholders will be sent notification of each repurchase offer at least 21 days prior to the repurchase request deadline. An early withdrawal charge will be imposed on most shares accepted for repurchase which have been held less than four years (see Note 6). During the years ended November 30, 2006 and November 30, 2005, the Fund made four repurchase offers in each fiscal year as follows:
| | | Repurchase Offer Amount | | Amount Repurchased | |
Repurchase
Request Deadline | | Shares | | Amount | | Shares | | Amount | |
| February 22, 2006 | | | 45,000,630 | | | $ | 423,905,931 | | | | 6,869,244 | | | $ | 64,709,386 | | |
| May 22, 2006 | | | 43,661,940 | | | | 412,168,710 | | | | 6,440,150 | | | | 60,795,058 | | |
| August 22, 2006 | | | 42,520,605 | | | | 399 268,486 | | | | 6,007,804 | | | | 56,413,479 | | |
| November 22, 2006 | | | 41,414,748 | | | | 388,470,339 | | | | 7,374,652 | | | | 70,175,615 | | |
| Total | | | 172,597,923 | | | $ | 1,623,813,466 | | | | 26,691,850 | | | $ | 252,093,538 | | |
| | | Repurchase Offer Amount | | Amount Repurchased | |
Repurchase
Request Deadline | | Shares | | Amount | | Shares | | Amount | |
| Feb. 22, 2005 | | | 51,478,843 | | | $ | 484,415,915 | | | | 8,058,382 | | | $ | 75,829,995 | | |
| May 23, 2005 | | | 43,762,978 | | | | 409,183,848 | | | | 9,329,723 | | | | 87,233,771 | | |
| Aug. 22, 2005 | | | 48,113,749 | | | | 452,750,382 | | | | 7,920,576 | | | | 74,532,061 | | |
| Nov. 22, 2005 | | | 46,685,721 | | | | 438,378,922 | | | | 7,980,432 | | | | 74,936,119 | | |
| Total | | | 190,041,291 | | | $ | 1,784,729,067 | | | | 33,289,113 | | | $ | 312,531,946 | | |
All transactions in Fund shares were as follows:
| | | Year Ended November 30, | |
| | | 2006 | | 2005 | |
| Sales | | | 5,724,241 | | | | 7,326,260 | | |
Issued to shareholders electing to
receive payments of distributions
in Fund shares | | | 4,571,953 | | | | 3,671,449 | | |
| Redemptions | | | (26,691,850 | ) | | | (33,289,113 | ) | |
| Net decrease | | | (16,395,656 | ) | | | (22,291,404 | ) | |
4 Transactions with Affiliates
Eaton Vance Management (EVM) serves as the administrator of the Fund. Effective May 1, 1999, EVM has agreed to waive its administration fee as long as the distribution fee (Note 5) is being paid by the Fund. The Portfolio has engaged Boston Management and Research (BMR), a subsidiary of EVM, to render investment advisory services (see Note 2 of the Portfolio's Notes to Financial Statements which are included elsewhere in this report). Except as to Trustees of the Fund and the Portfolio who are not members of EVM's or BMR's organization, officers and Trustees receive remuneration for their services to the Fund out of such investment adviser fee. EVM serves as the sub-transfer agent of the Fund and receives from the transfer
7
Eaton Vance Prime Rate Reserves as of November 30, 2006
NOTES TO FINANCIAL STATEMENTS CONT'D
agent an aggregate fee based upon the actual expenses incurred by EVM in the performance of those services. For the year ended November 30, 2006, EVM received $72,861 in sub-transfer agent fees.
Certain officers and Trustees of the Fund and of the Portfolio are officers of the above organizations.
5 Distribution Plan
The Fund has in effect a distribution plan (the Plan) that allows the Fund to pay distribution fees for the sale and distribution of shares. The Plan requires the Fund to pay the Principal Underwriter, Eaton Vance Distributors, Inc. (EVD), a subsidiary of EVM, an amount equal to 0.70% of the Fund's average daily net assets, for providing ongoing distribution services and facilities to the Fund. For the year ended November 30, 2006 the distribution fees amounted to $9,657,606. Certain officers and Trustees of the Fund are officers or directors of EVD.
6 Early Withdrawal Charge
EVD compensates investment dealers for sales commissions at a rate of 3% of the purchase price of shares purchased through such dealers. EVD also pays additional compensation to each dealer ranging from 0.10% to 0.30% per annum of the value of Fund shares sold by such dealer that are outstanding for specified periods of time. An early withdrawal charge (EWC) to recover distribution costs will be charged to repurchasing shareholders and paid to EVD in connection with most shares held for less than four years which are accepted by the Fund for repurchase. The EWC is imposed at declining rates that begin at 3% in the case of repurchases in the first year after purchase, declining to 2.5%, 2%, 1% and 0% in the second, third and fourth year and thereafter, respectively. The EWC is based on the lower of the net asset value at the time of purchase or at the time of repurchase. Shares acquired through the reinvestment of distributions are exempt from the EWC. Redemptions are made first from shares that are not subject to an EWC. The total early withdrawal charges received by EVD for the year ended November 30, 2006 amounted to approximately $459,318.
7 Investment Transactions
Increases and decreases in the Fund's investment in the Portfolio for the year ended November 30, 2006 aggregated $54,370,831 and $299,854,583, respectively.
8 Recently Issued Accounting Pronouncements
In June 2006, the Financial Accounting Standards Board ("FASB") issued FASB Interpretation No. 48, ("FIN 48") "Accounting for Uncertainty in Income Taxes - an interpretation of FASB Statement No. 109". FIN 48 clarifies the accounting for uncertainty in income taxes recognized in accordance with FASB Statement No. 109, "Accounting for Income Taxes." This interpretation prescribes a recognition threshold and measurement attribute for the financial statement recognition and measurement of a tax position taken or expected to be taken in a tax return. It also provides guidance on de-recognition, classification, interest and penalties, accounting in interim periods, disclosure and transition. FIN 48 is effective for fiscal years beginning after December 15, 2006. Management is currently evaluating the impact of applying the various provisions of FIN 48.
In September 2006, FASB issued Statement of Financial Accounting Standards No. 157, ("FAS 157") "Fair Value Measurements". FAS 157 defines fair value, establishes a framework for measuring fair value in accordance with generally accepted accounting principles and expands disclosure about fair value measurements. FAS 157 is effective for fiscal years beginning after November 15, 2007. Management is currently evaluating the impact the adoption of FAS 157 will have on the Fund's financial statement disclosures.
8
Eaton Vance Prime Rate Reserves as of November 30, 2006
REPORT OF INDEPENDENT REGISTERED PUBLIC ACCOUNTING FIRM
To the Trustees and Shareholders
of Eaton Vance Prime Rate Reserves:
We have audited the accompanying statement of assets and liabilities of Eaton Vance Prime Rate Reserves (the "Fund") as of November 30, 2006, the related statement of operations for the year then ended, the statements of changes in net assets for each of the two years in the period then ended, and the financial highlights for each of the four years in the period then ended, the period from January 1, 2002 to November 30, 2002, and the year ended December 31, 2001. These financial statements and financial highlights are the responsibility of the Fund's management. Our responsibility is to express an opinion on these financial statements and financial highlights based on our audits.
We conducted our audits in accordance with standards of the Public Company Accounting Oversight Board (United States). Those standards require that we plan and perform the audits to obtain reasonable assurance about whether the financial statements and financial highlights are free of material misstatement. The Fund is not required to have, nor were we engaged to perform, an audit of its internal control over financial reporting. Our audits included consideration of internal control over financial reporting as a basis for designing audit procedures that are appropriate in the circumstances, but not for the purpose of expressing an opinion on the effectiveness of the Fund's internal control over financial reporting. Accordingly, we express no such opinion. An audit also includes examining, on a test basis, evidence supporting the amounts and disclosures in the financial statements, assessing the accounting principles used and significant estimates made by management, as well as evaluating the overall financial statement presentation. We believe that our audits provide a reasonable basis for our opinion.
In our opinion, the financial statements and financial highlights referred to above present fairly, in all material respects, the financial position of the Eaton Vance Prime Rate Reserves Fund as of November 30, 2006, the results of its operations for the year then ended, the changes in its net assets for each of the two years in the period then ended and its financial highlights for the respective stated periods in conformity with accounting principles generally accepted in the United States of America.
DELOITTE & TOUCHE LLP
Boston, Massachusetts
January 16, 2007
9
Eaton Vance Prime Rate Reserves as of November 30, 2006
FEDERAL TAX INFORMATION (Unaudited)
The Form 1099-DIV you receive in January 2007 will show the tax status of all distributions paid to your account in calendar 2006. Shareholders are advised to consult their own tax adviser with respect to the tax consequences of their investment in the Fund.
10
Senior Debt Portfolio as of November 30, 2006
PORTFOLIO OF INVESTMENTS
| Senior, Floating Rate Interests - 100.3%(1) | | | |
Principal
Amount | | Borrower/Tranche Description | | Value | |
| Aerospace and Defense - 1.8% | | | |
| AWAS Capital, Inc. | | | |
| $ | 8,662,812 | | | | | Term Loan, 7.19%, Maturing March 22, 2013 | | $ | 8,489,555 | | |
| Be Aerospace, Inc. | | | |
| | 1,400,000 | | | | | Term Loan, 7.15%, Maturing August 24, 2012 | | | 1,407,875 | | |
| Dresser Rand Group, Inc. | | | |
| | 1,032,477 | | | | | Term Loan, 7.46%, Maturing October 29, 2011 | | | 1,038,930 | | |
| Evergreen International Aviation | | | |
| | 3,100,000 | | | | | Term Loan, 8.82%, Maturing October 31, 2011 | | | 3,053,500 | | |
| Hexcel Corp. | | | |
| | 3,223,197 | | | | | Term Loan, 7.13%, Maturing March 1, 2012 | | | 3,231,255 | | |
| IAP Worldwide Services, Inc. | | | |
| | 3,176,000 | | | | | Term Loan, 7.25%, Maturing December 30, 2012 | | | 3,152,180 | | |
| Jet Aviation Holding, AG | | | |
| | 1,500,000 | | | | | Term Loan, 7.62%, Maturing May 15, 2013 | | | 1,496,250 | | |
| K&F Industries, Inc. | | | |
| | 2,324,865 | | | | | Term Loan, 7.32%, Maturing November 18, 2012 | | | 2,335,399 | | |
| Spirit Aerosystems, Inc. | | | |
| | 2,736,643 | | | | | Term Loan, 7.11%, Maturing December 31, 2011 | | | 2,743,911 | | |
| Standard Aero Holdings, Inc. | | | |
| | 2,399,621 | | | | | Term Loan, 7.61%, Maturing August 24, 2012 | | | 2,408,620 | | |
| Transdigm, Inc. | | | |
| | 5,000,000 | | | | | Term Loan, 7.39%, Maturing June 23, 2013 | | | 5,033,750 | | |
| Vought Aircraft Industries, Inc. | | | |
| | 2,000,000 | | | | | Revolving Loan, 7.82%,
Maturing December 22, 2009(2) | | | 1,910,000 | | |
| | 1,000,000 | | | | | Term Loan, 7.33%, Maturing December 22, 2010 | | | 1,005,313 | | |
| | 3,250,565 | | | | | Term Loan, 7.88%, Maturing December 17, 2011 | | | 3,268,849 | | |
| Wam Aquisition, S.A. | | | |
| | 2,417,800 | | | | | Term Loan, 8.12%, Maturing April 8, 2013 | | | 2,438,453 | | |
| | 2,417,800 | | | | | Term Loan, 8.62%, Maturing April 8, 2014 | | | 2,448,274 | | |
| Wyle Laboratories, Inc. | | | |
| | 972,315 | | | | | Term Loan, 8.12%, Maturing January 28, 2011 | | | 977,481 | | |
| | | $ | 46,439,595 | | |
| Air Transport - 1.0% | | | |
| Airport Development and Investment | | | |
| $ | 3,500,000 | | | GBP | | Term Loan, 9.12%, Maturing April 7, 2011 | | $ | 6,910,926 | | |
| Delta Air Lines, Inc. | | | |
| | 4,275,000 | | | | | Term Loan, 8.12%, Maturing March 16, 2008 | | | 4,313,407 | | |
| | 4,225,000 | | | | | Term Loan, 10.12%, Maturing March 16, 2008 | | | 4,303,560 | | |
| Northwest Airlines, Inc. | | | |
| | 6,450,000 | | | | | DIP Loan, 7.82%, Maturing August 21, 2008 | | | 6,492,331 | | |
Principal
Amount | | Borrower/Tranche Description | | Value | |
| Air Transport (continued) | | | |
| United Airlines, Inc. | | | |
| $ | 4,483,719 | | | | | Term Loan, 9.12%, Maturing February 1, 2012 | | $ | 4,531,358 | | |
| | 640,531 | | | | | Term Loan, 9.13%, Maturing February 1, 2012 | | | 647,337 | | |
| | | $ | 27,198,919 | | |
| Automotive - 4.6% | | | |
| AA Acquisitions Co., Ltd. | | | |
| $ | 1,000,000 | | | GBP | | Term Loan, 7.58%, Maturing June 25, 2012 | | $ | 1,996,933 | | |
| | 1,000,000 | | | GBP | | Term Loan, 8.08%, Maturing June 25, 2013 | | | 2,005,824 | | |
| Accuride Corp. | | | |
| | 7,444,820 | | | | | Term Loan, 7.44%, Maturing January 31, 2012 | | | 7,461,110 | | |
| Affina Group, Inc. | | | |
| | 3,994,314 | | | | | Term Loan, 8.38%, Maturing November 30, 2011 | | | 4,015,536 | | |
| Citation Corp. | | | |
| | 5,931,750 | | | | | Term Loan, 13.87%, Maturing May 23, 2009(4) | | | 3,737,002 | | |
| Collins & Aikman Products Co. | | | |
| | 2,318,912 | | | | | Term Loan, 11.75%, Maturing August 31, 2009(3) | | | 1,097,135 | | |
| CSA Acquisition Corp. | | | |
| | 1,358,760 | | | | | Term Loan, 7.88%, Maturing December 23, 2011 | | | 1,360,884 | | |
| | 1,308,686 | | | | | Term Loan, 7.88%, Maturing December 23, 2011 | | | 1,310,732 | | |
| Dana Corp. | | | |
| | 3,325,000 | | | | | DIP Loan, 7.65%, Maturing April 13, 2008 | | | 3,331,234 | | |
| Dayco Products, LLC | | | |
| | 5,284,250 | | | | | Term Loan, 8.02%, Maturing June 21, 2011 | | | 5,268,836 | | |
| Exide Technologies, Inc. | | | |
| | 1,764,628 | | | | | Term Loan, 11.75%, Maturing May 5, 2010 | | | 1,855,066 | | |
| | 1,786,253 | | | | | Term Loan, 11.75%, Maturing May 5, 2010 | | | 1,877,799 | | |
| Federal-Mogul Corp. | | | |
| | 6,000,000 | | | | | Term Loan, 7.82%, Maturing December 9, 2006 | | | 5,920,626 | | |
| | 11,852,057 | | | | | Revolving Loan, 9.07%,
Maturing December 9, 2006(2) | | | 11,896,502 | | |
| | 5,351,062 | | | | | Term Loan, 9.07%, Maturing December 9, 2006 | | | 5,381,161 | | |
| Goodyear Tire & Rubber Co. | | | |
| | 7,500,000 | | | | | Revolving Loan, 7.57%, Maturing April 30, 2010(2) | | | 7,469,535 | | |
| | 1,175,000 | | | | | Term Loan, 7.57%, Maturing April 30, 2010 | | | 1,178,462 | | |
| | 10,605,000 | | | | | Term Loan, 8.14%, Maturing April 30, 2010 | | | 10,723,362 | | |
| HLI Operating Co., Inc. | | | |
| | 2,719,527 | | | | | Term Loan, 8.96%, Maturing June 3, 2009 | | | 2,735,165 | | |
| Insurance Auto Auctions, Inc. | | | |
| | 2,406,522 | | | | | Term Loan, 7.89%, Maturing May 19, 2012 | | | 2,417,050 | | |
| Keystone Automotive Operations, Inc. | | | |
| | 1,714,103 | | | | | Term Loan, 7.88%, Maturing October 30, 2009 | | | 1,718,388 | | |
| Kwik Fit Group Ltd. | | | |
| | 1,250,000 | | | GBP | | Term Loan, 7.58%, Maturing August 31, 2013 | | | 2,484,554 | | |
| | 1,250,000 | | | GBP | | Term Loan, 8.08%, Maturing August 31, 2014 | | | 2,495,823 | | |
See notes to financial statements
11
Senior Debt Portfolio as of November 30, 2006
PORTFOLIO OF INVESTMENTS CONT'D
Principal
Amount | | Borrower/Tranche Description | | Value | |
| Automotive (continued) | | | |
| R.J. Tower Corp. | | | |
| $ | 7,000,000 | | | | | DIP Revolving Loan, 8.42%,
Maturing February 2, 2007(2) | | $ | 6,965,000 | | |
| Tenneco Automotive, Inc. | | | |
| | 3,600,741 | | | | | Term Loan, 7.36%, Maturing December 10, 2010 | | | 3,620,995 | | |
| | 2,383,463 | | | | | Term Loan, 7.32%, Maturing December 12, 2010 | | | 2,396,870 | | |
| Trimas Corp. | | | |
| | 375,000 | | | | | Term Loan, 8.13%, Maturing August 2, 2011 | | | 376,992 | | |
| | 1,625,000 | | | | | Term Loan, 8.13%, Maturing August 2, 2013 | | | 1,633,634 | | |
| TRW Automotive, Inc. | | | |
| | 6,032,956 | | | | | Term Loan, 7.19%, Maturing June 30, 2012 | | | 6,026,827 | | |
| United Components, Inc. | | | |
| | 4,829,458 | | | | | Term Loan, 7.63%, Maturing June 30, 2010 | | | 4,847,568 | | |
| Vanguard Car Rental USA | | | |
| | 4,675,000 | | | | | Term Loan, 8.35%, Maturing June 14, 2013 | | | 4,709,576 | | |
| | | $ | 120,316,181 | | |
| Beverage and Tobacco - 0.8% | | | |
| Alliance One International, Inc. | | | |
| $ | 2,482,550 | | | | | Term Loan, 8.82%, Maturing May 13, 2010 | | $ | 2,513,582 | | |
| Culligan International Co. | | | |
| | 2,069,165 | | | | | Term Loan, 7.07%, Maturing September 30, 2011 | | | 2,074,986 | | |
| National Dairy Holdings, L.P. | | | |
| | 4,641,537 | | | | | Term Loan, 7.32%, Maturing March 15, 2012 | | | 4,653,141 | | |
| National Distribution Co. | | | |
| | 2,420,000 | | | | | Term Loan, 11.82%, Maturing June 22, 2010 | | | 2,426,050 | | |
| Reynolds American, Inc. | | | |
| | 7,279,250 | | | | | Term Loan, 7.14%, Maturing May 31, 2012 | | | 7,337,258 | | |
| Southern Wine & Spirits of America, Inc. | | | |
| | 2,134,013 | | | | | Term Loan, 6.87%, Maturing May 31, 2012 | | | 2,141,350 | | |
| Sunny Delight Beverages Co. | | | |
| | 254,197 | | | | | Term Loan, 11.38%, Maturing August 20, 2010 | | | 249,431 | | |
| | | $ | 21,395,798 | | |
| Building and Development - 7.2% | | | |
| 401 North Wabash Venture, LLC | | | |
| $ | 5,500,000 | | | | | Term Loan, 9.07%, Maturing May 7, 2008(2) | | $ | 5,540,392 | | |
| Beacon Sales Acquisition, Inc. | | | |
| | 2,000,000 | | | | | Term Loan, 7.32%, Maturing September 30, 2013 | | | 2,005,000 | | |
| Biomed Realty, L.P. | | | |
| | 10,965,000 | | | | | Term Loan, 7.57%, Maturing May 31, 2010 | | | 10,937,587 | | |
| Capital Automotive REIT | | | |
| | 4,000,130 | | | | | Term Loan, 7.07%, Maturing December 16, 2010 | | | 4,013,567 | | |
| Empire Hawkeye Partners, L.P. | | | |
| | 6,800,000 | | | | | Term Loan, 6.97%, Maturing December 1, 2009(2) | | | 6,783,000 | | |
Principal
Amount | | Borrower/Tranche Description | | Value | |
| Building and Development (continued) | | | |
| Epco / Fantome, LLC | | | |
| $ | 5,100,000 | | | | | Term Loan, 8.37%, Maturing November 23, 2010 | | $ | 5,125,500 | | |
| Formica Corp. | | | |
| | 3,383,000 | | | | | Term Loan, 8.49%, Maturing March 15, 2013 | | | 3,381,944 | | |
| FT-FIN Acquisition, LLC | | | |
| | 4,432,587 | | | | | Term Loan, 7.13%, Maturing November 17, 2007(2) | | | 4,443,668 | | |
| Gables GP, Inc. | | | |
| | 280,724 | | | | | Term Loan, 7.07%, Maturing March 30, 2007 | | | 281,192 | | |
| Hearthstone Housing Partners II, LLC | | | |
| | 13,750,000 | | | | | Revolving Loan, 7.39%,
Maturing December 1, 2007(2) | | | 13,715,625 | | |
| Hovstone Holdings, LLC | | | |
| | 4,410,000 | | | | | Term Loan, 7.37%, Maturing February 28, 2009 | | | 4,343,850 | | |
| Landsource Communities, LLC | | | |
| | 9,721,000 | | | | | Term Loan, 7.88%, Maturing March 31, 2010 | | | 9,593,412 | | |
| Lanoga Corp. | | | |
| | 3,865,313 | | | | | Term Loan, 7.12%, Maturing June 29, 2013 | | | 3,855,649 | | |
| LNR Property Corp. | | | |
| | 7,225,000 | | | | | Term Loan, 8.12%, Maturing July 3, 2011 | | | 7,257,361 | | |
| MAAX Corp. | | | |
| | 3,077,379 | | | | | Term Loan, 8.38%, Maturing June 4, 2011 | | | 3,061,993 | | |
| Materis | | | |
| | 823,329 | | | EUR | | Term Loan, 5.93%, Maturing April 27, 2014 | | | 1,104,930 | | |
| | 876,671 | | | EUR | | Term Loan, 6.30%, Maturing April 27, 2015 | | | 1,181,601 | | |
| Mattamy Funding Partnership | | | |
| | 694,006 | | | | | Term Loan, 7.63%, Maturing April 11, 2013 | | | 689,235 | | |
| Mueller Group, Inc. | | | |
| | 6,595,611 | | | | | Term Loan, 7.40%, Maturing October 3, 2012 | | | 6,635,462 | | |
| NCI Building Systems, Inc. | | | |
| | 2,345,501 | | | | | Term Loan, 6.84%, Maturing May 3, 2010 | | | 2,346,967 | | |
| Newkirk Master, L.P. | | | |
| | 4,405,457 | | | | | Term Loan, 7.07%, Maturing August 11, 2008 | | | 4,412,343 | | |
| | 3,440,259 | | | | | Term Loan, 7.07%, Maturing August 11, 2008 | | | 3,445,636 | | |
| Nortek, Inc. | | | |
| | 6,710,538 | | | | | Term Loan, 7.36%, Maturing August 27, 2011 | | | 6,699,002 | | |
| Panolam Industries Holdings, Inc. | | | |
| | 2,404,844 | | | | | Term Loan, 8.12%, Maturing September 30, 2012 | | | 2,416,868 | | |
| Ply Gem Industries, Inc. | | | |
| | 1,000,000 | | | | | Term Loan, 8.32%, Maturing August 15, 2011 | | | 1,007,813 | | |
| | 342,031 | | | | | Term Loan, 8.32%, Maturing August 15, 2011 | | | 341,817 | | |
| | 5,130,469 | | | | | Term Loan, 8.32%, Maturing August 15, 2011 | | | 5,127,262 | | |
| Rubicon GSA II, LLC | | | |
| | 7,025,000 | | | | | Term Loan, 8.07%, Maturing July 31, 2008 | | | 7,025,000 | | |
| South Edge, LLC | | | |
| | 4,475,000 | | | | | Term Loan, 7.38%, Maturing October 31, 2009 | | | 4,388,297 | | |
See notes to financial statements
12
Senior Debt Portfolio as of November 30, 2006
PORTFOLIO OF INVESTMENTS CONT'D
Principal
Amount | | Borrower/Tranche Description | | Value | |
| Building and Development (continued) | | | |
| Stile Acquisition Corp. | | | |
| $ | 6,676,316 | | | | | Term Loan, 7.38%, Maturing April 6, 2013 | | $ | 6,550,094 | | |
| Stile U.S. Acquisition Corp. | | | |
| | 6,687,690 | | | | | Term Loan, 7.38%, Maturing April 6, 2013 | | | 6,561,252 | | |
| TE / Tousa Senior, LLC | | | |
| | 3,750,000 | | | | | Term Loan, 8.25%, Maturing August 1, 2008 | | | 3,103,125 | | |
| | 2,000,000 | | | | | Revolving Loan, 9.75%, Maturing August 1, 2008(2) | | | 1,580,000 | | |
| The Woodlands Commercial Property, Inc. | | | |
| | 2,940,000 | | | | | Term Loan, 7.35%, Maturing September 1, 2009 | | | 2,943,675 | | |
| | 735,000 | | | | | Term Loan, 7.35%, Maturing August 29, 2009 | | | 735,919 | | |
| Tousa/Kolter, LLC | | | |
| | 7,410,000 | | | | | Term Loan, 7.62%, Maturing January 7, 2008(2) | | | 7,419,262 | | |
| TRU 2005 RE Holding Co. | | | |
| | 13,750,000 | | | | | Term Loan, 8.32%, Maturing December 9, 2008 | | | 13,776,854 | | |
| Trustreet Properties, Inc. | | | |
| | 5,150,000 | | | | | Term Loan, 7.32%, Maturing April 8, 2010 | | | 5,162,875 | | |
| United Subcontractors, Inc. | | | |
| | 2,675,000 | | | | | Term Loan, 12.86%, Maturing June 27, 2013 | | | 2,594,750 | | |
| WCI Communities, Inc. | | | |
| | 8,300,000 | | | | | Term Loan, 7.32%, Maturing December 23, 2010 | | | 8,071,750 | | |
| | | $ | 189,661,529 | | |
| Business Equipment and Services - 5.9% | | | |
| Acco Brands Corp. | | | |
| $ | 1,802,350 | | | | | Term Loan, 7.11%, Maturing August 17, 2012 | | $ | 1,807,701 | | |
| Activant Solutions, Inc. | | | |
| | 2,295,692 | | | | | Term Loan, 7.38%, Maturing May 1, 2013 | | | 2,280,628 | | |
| Affiliated Computer Services | | | |
| | 2,481,250 | | | | | Term Loan, 7.39%, Maturing March 20, 2013 | | | 2,489,004 | | |
| | 6,533,625 | | | | | Term Loan, 7.40%, Maturing March 20, 2013 | | | 6,550,776 | | |
| Affinion Group, Inc. | | | |
| | 6,887,180 | | | | | Term Loan, 8.12%, Maturing October 17, 2012 | | | 6,933,455 | | |
| Allied Security Holdings, LLC | | | |
| | 3,832,500 | | | | | Term Loan, 8.37%, Maturing June 30, 2010 | | | 3,861,244 | | |
| Audatex North America, Inc. | | | |
| | 1,000,000 | | | EUR | | Term Loan, 9.13%, Maturing January 13, 2013 | | | 1,357,447 | | |
| | 997,500 | | | EUR | | Term Loan, 5.75%, Maturing April 13, 2013 | | | 1,334,357 | | |
| Buhrmann US, Inc. | | | |
| | 6,722,971 | | | | | Term Loan, 7.13%, Maturing December 31, 2010 | | | 6,735,576 | | |
| DynCorp International, LLC | | | |
| | 4,402,950 | | | | | Term Loan, 7.75%, Maturing February 11, 2011 | | | 4,429,553 | | |
| Gate Gourmet Borrower, LLC | | | |
| | 1,556,622 | | | | | Term Loan, 8.12%, Maturing March 9, 2012 | | | 1,576,080 | | |
| | 195,556 | | | | | Term Loan, 8.12%, Maturing March 9, 2012 | | | 192,622 | | |
| | 3,134,250 | | | EUR | | Term Loan, 6.13%, Maturing March 9, 2013 | | | 4,210,435 | | |
Principal
Amount | | Borrower/Tranche Description | | Value | |
| Business Equipment and Services (continued) | | | |
| Info USA, Inc. | | | |
| $ | 1,985,000 | | | | | Term Loan, 7.07%, Maturing February 14, 2012 | | $ | 1,982,519 | | |
| Iron Mountain, Inc. | | | |
| | 5,069,162 | | | | | Term Loan, 7.10%, Maturing April 2, 2011 | | | 5,083,949 | | |
| | 9,534,983 | | | | | Term Loan, 7.13%, Maturing April 2, 2011 | | | 9,558,821 | | |
| Language Line, Inc. | | | |
| | 7,860,100 | | | | | Term Loan, 8.63%, Maturing June 11, 2011 | | | 7,920,277 | | |
| Mitchell International, Inc. | | | |
| | 4,035,448 | | | | | Term Loan, 7.37%, Maturing August 15, 2011 | | | 4,050,581 | | |
| N.E.W. Holdings I, LLC | | | |
| | 2,554,413 | | | | | Term Loan, 8.12%, Maturing August 8, 2013 | | | 2,567,185 | | |
| Nielsen Finance, LLC | | | |
| | 20,850,000 | | | | | Term Loan, 8.13%, Maturing August 9, 2013 | | | 20,939,780 | | |
| Protection One, Inc. | | | |
| | 3,235,013 | | | | | Term Loan, 7.85%, Maturing March 31, 2012 | | | 3,249,166 | | |
| Quantum Corp. | | | |
| | 950,000 | | | | | Term Loan, 9.44%, Maturing August 22, 2012 | | | 951,187 | | |
| Sungard Data Systems, Inc. | | | |
| | 26,205,190 | | | | | Term Loan, 7.88%, Maturing February 11, 2013 | | | 26,430,397 | | |
| TDS Investor Corp. | | | |
| | 1,000,000 | | | EUR | | Term Loan, 6.13%, Maturing August 23, 2013 | | | 1,332,040 | | |
| | 8,197,002 | | | | | Term Loan, 8.37%, Maturing August 23, 2013 | | | 8,224,085 | | |
| | 802,998 | | | | | Term Loan, 8.37%, Maturing August 23, 2013 | | | 805,651 | | |
| Transaction Network Services, Inc. | | | |
| | 2,808,685 | | | | | Term Loan, 7.39%, Maturing May 4, 2012 | | | 2,808,685 | | |
| US Investigations Services, Inc. | | | |
| | 2,451,697 | | | | | Term Loan, 7.89%, Maturing October 14, 2012 | | | 2,463,955 | | |
| | 1,755,601 | | | | | Term Loan, 7.89%, Maturing October 14, 2012 | | | 1,763,647 | | |
| West Corp. | | | |
| | 7,200,000 | | | | | Term Loan, 8.07%, Maturing October 24, 2013 | | | 7,194,211 | | |
| Western Inventory Services | | | |
| | 749,905 | | | | | Term Loan, 7.86%, Maturing March 31, 2011 | | | 753,654 | | |
| | 854,891 | | | | | Term Loan, 7.87%, Maturing March 31, 2011 | | | 859,166 | | |
| Williams Scotsman, Inc. | | | |
| | 2,570,000 | | | | | Term Loan, 6.82%, Maturing June 27, 2010 | | | 2,566,787 | | |
| | | $ | 155,264,621 | | |
| Cable and Satellite Television - 5.7% | | | |
| Atlantic Broadband Finance, LLC | | | |
| $ | 5,825,081 | | | | | Term Loan, 8.14%, Maturing September 1, 2011 | | $ | 5,905,176 | | |
| Bragg Communications, Inc. | | | |
| | 3,333,148 | | | | | Term Loan, 7.12%, Maturing August 31, 2011 | | | 3,337,314 | | |
| Bresnan Broadband Holdings, LLC | | | |
| | 5,000,000 | | | | | Term Loan, 7.13%, Maturing March 29, 2014 | | | 4,994,375 | | |
See notes to financial statements
13
Senior Debt Portfolio as of November 30, 2006
PORTFOLIO OF INVESTMENTS CONT'D
Principal
Amount | | Borrower/Tranche Description | | Value | |
| Cable and Satellite Television (continued) | | | |
| Cablecom Luxembourg SCA | | | |
| $ | 2,000,000 | | | EUR | | Term Loan, 5.79%, Maturing September 28, 2012 | | $ | 2,668,001 | | |
| Casema | | | |
| | 658,133 | | | EUR | | Term Loan, 6.17%, Maturing November 17, 2014 | | | 880,696 | | |
| | 341,867 | | | EUR | | Term Loan, 6.17%, Maturing November 17, 2014 | | | 457,477 | | |
| | 1,000,000 | | | EUR | | Term Loan, 6.67%, Maturing November 17, 2015 | | | 1,344,951 | | |
| Charter Communications Operating, LLC | | | |
| | 25,888,627 | | | | | Term Loan, 8.01%, Maturing April 28, 2013 | | | 26,098,972 | | |
| CSC Holdings, Inc. | | | |
| | 9,552,000 | | | | | Term Loan, 7.12%, Maturing March 29, 2013 | | | 9,546,823 | | |
| Insight Midwest Holdings, LLC | | | |
| | 3,893,750 | | | | | Term Loan, 7.61%, Maturing April 6, 2014 | | | 3,918,327 | | |
| | 11,681,250 | | | | | Term Loan, 7.61%, Maturing April 6, 2014 | | | 11,754,982 | | |
| Kabel Deutschland GmbH | | | |
| | 5,400,000 | | | EUR | | Term Loan, 5.38%, Maturing March 31, 2012 | | | 7,175,478 | | |
| Kablecom | | | |
| | 1,000,000 | | | EUR | | Term Loan, 0.00%, Maturing November 17, 2014(2) | | | 1,330,583 | | |
| | 1,000,000 | | | EUR | | Term Loan, 0.00%, Maturing November 17, 2015(2) | | | 1,337,211 | | |
| Mediacom Broadband Group | | | |
| | 1,965,150 | | | | | Term Loan, 7.00%, Maturing January 31, 2015 | | | 1,958,087 | | |
| Mediacom Illinois, LLC | | | |
| | 3,000,000 | | | | | Term Loan, 6.72%, Maturing September 30, 2012 | | | 2,948,304 | | |
| | 6,023,750 | | | | | Term Loan, 7.24%, Maturing January 31, 2015 | | | 6,014,070 | | |
| NTL Investment Holdings, Ltd. | | | |
| | 4,000,000 | | | | | Term Loan, 7.36%, Maturing March 30, 2013 | | | 4,019,168 | | |
| | 1,562,881 | | | GBP | | Term Loan, 7.45%, Maturing March 30, 2012 | | | 3,073,182 | | |
| | 1,337,119 | | | GBP | | Term Loan, 7.45%, Maturing March 30, 2012 | | | 2,629,255 | | |
| | 1,000,000 | | | GBP | | Term Loan, 7.64%, Maturing March 30, 2013 | | | 2,002,703 | | |
| Persona Communications Corp. | | | |
| | 1,005,667 | | | | | Term Loan, 0.00%, Maturing October 12, 2013(2) | | | 1,011,952 | | |
| | 1,619,333 | | | | | Term Loan, 8.12%, Maturing October 12, 2013 | | | 1,629,454 | | |
| | 675,000 | | | | | Term Loan, 11.37%, Maturing April 12, 2014 | | | 679,219 | | |
| PKS Media (Netherlands) B.V. | | | |
| | 2,412,500 | | | EUR | | Term Loan, 5.24%, Maturing October 5, 2012 | | | 3,207,323 | | |
| | 1,000,000 | | | EUR | | Term Loan, 5.74%, Maturing October 5, 2013 | | | 1,341,975 | | |
| | 1,000,000 | | | EUR | | Term Loan, 6.24%, Maturing October 5, 2014 | | | 1,348,115 | | |
| San Juan Cable, LLC | | | |
| | 992,500 | | | | | Term Loan, 7.39%, Maturing October 31, 2012 | | | 994,206 | | |
| UGS Corp. | | | |
| | 7,308,413 | | | | | Term Loan, 7.13%, Maturing March 31, 2012 | | | 7,302,325 | | |
| UPC Broadband Holding B.V. | | | |
| | 3,665,833 | | | EUR | | Term Loan, 5.51%, Maturing March 31, 2013 | | | 4,877,832 | | |
| | 2,790,000 | | | | | Term Loan, 7.64%, Maturing April 1, 2013 | | | 2,794,271 | | |
| | 4,150,000 | | | EUR | | Term Loan, 5.51%, Maturing December 31, 2013 | | | 5,522,762 | | |
| | 2,790,000 | | | | | Term Loan, 7.64%, Maturing December 31, 2013 | | | 2,794,271 | | |
Principal
Amount | | Borrower/Tranche Description | | Value | |
| Cable and Satellite Television (continued) | | | |
| Ypso Holding SA | | | |
| $ | 4,961,371 | | | EUR | | Term Loan, 5.87%, Maturing July 28, 2014 | | $ | 6,489,643 | | |
| | 1,914,679 | | | EUR | | Term Loan, 5.87%, Maturing July 28, 2014 | | | 2,504,466 | | |
| | 3,123,950 | | | EUR | | Term Loan, 5.87%, Maturing July 28, 2014 | | | 4,086,233 | | |
| | | $ | 149,979,182 | | |
| Chemicals and Plastics - 7.7% | | | |
| Basell Af S.A.R.L. | | | |
| $ | 358,974 | | | EUR | | Term Loan, 5.81%, Maturing August 1, 2013 | | $ | 481,522 | | |
| | 641,026 | | | EUR | | Term Loan, 5.84%, Maturing August 1, 2013 | | | 859,861 | | |
| | 550,909 | | | | | Term Loan, 7.60%, Maturing August 1, 2013 | | | 557,623 | | |
| | 110,176 | | | | | Term Loan, 7.60%, Maturing August 1, 2013 | | | 111,519 | | |
| | 358,974 | | | EUR | | Term Loan, 6.56%, Maturing August 1, 2014 | | | 483,623 | | |
| | 641,026 | | | EUR | | Term Loan, 6.59%, Maturing August 1, 2014 | | | 863,612 | | |
| | 905,236 | | | | | Term Loan, 8.35%, Maturing August 1, 2014 | | | 916,551 | | |
| | 181,047 | | | | | Term Loan, 8.35%, Maturing August 1, 2014 | | | 183,310 | | |
| Brenntag Holding GmbH and Co. KG | | | |
| | 2,117,647 | | | EUR | | Term Loan, 6.03%, Maturing December 23, 2013 | | | 2,849,737 | | |
| | 883,636 | | | | | Term Loan, 8.08%, Maturing December 23, 2013 | | | 891,368 | | |
| | 3,616,364 | | | | | Term Loan, 8.08%, Maturing December 23, 2013 | | | 3,654,223 | | |
| | 496,877 | | | EUR | | Term Loan, 6.28%, Maturing December 23, 2014 | | | 671,161 | | |
| | 385,476 | | | EUR | | Term Loan, 6.28%, Maturing December 23, 2014 | | | 524,472 | | |
| Celanese Holdings, LLC | | | |
| | 14,058,993 | | | | | Term Loan, 7.12%, Maturing April 6, 2011 | | | 14,101,676 | | |
| Ferro Corp. | | | |
| | 9,500,000 | | | | | Term Loan, 8.57%, Maturing June 6, 2012(2) | | | 9,488,125 | | |
| Gentek, Inc. | | | |
| | 1,485,804 | | | | | Term Loan, 7.36%, Maturing February 28, 2011 | | | 1,493,698 | | |
| Georgia Gulf Corp. | | | |
| | 4,242,188 | | | | | Term Loan, 7.32%, Maturing October 3, 2013 | | | 4,266,809 | | |
| Hexion Specialty Chemicals, Inc. | | | |
| | 2,523,368 | | | | | Term Loan, 7.87%, Maturing May 5, 2013 | | | 2,519,538 | | |
| | 11,616,194 | | | | | Term Loan, 7.88%, Maturing May 5, 2013 | | | 11,598,561 | | |
| Huntsman, LLC | | | |
| | 2,280,000 | | | EUR | | Term Loan, 5.44%, Maturing August 16, 2012 | | | 3,017,533 | | |
| | 18,905,402 | | | | | Term Loan, 7.07%, Maturing August 16, 2012 | | | 18,908,030 | | |
| Ineos Group | | | |
| | 2,950,000 | | | | | Term Loan, 7.61%, Maturing December 14, 2012 | | | 2,966,225 | | |
| | 1,925,000 | | | | | Term Loan, 7.61%, Maturing December 14, 2013 | | | 1,944,117 | | |
| | 1,925,000 | | | | | Term Loan, 8.11%, Maturing December 14, 2014 | | | 1,944,117 | | |
| Innophos, Inc. | | | |
| | 1,247,310 | | | | | Term Loan, 7.57%, Maturing August 10, 2010 | | | 1,251,988 | | |
| Invista B.V. | | | |
| | 8,957,429 | | | | | Term Loan, 6.88%, Maturing April 29, 2011 | | | 8,937,839 | | |
| | 4,748,099 | | | | | Term Loan, 6.88%, Maturing April 29, 2011 | | | 4,737,715 | | |
See notes to financial statements
14
Senior Debt Portfolio as of November 30, 2006
PORTFOLIO OF INVESTMENTS CONT'D
Principal
Amount | | Borrower/Tranche Description | | Value | |
| Chemicals and Plastics (continued) | | | |
| ISP Chemo, Inc. | | | |
| $ | 7,139,125 | | | | | Term Loan, 7.41%, Maturing February 16, 2013 | | $ | 7,154,745 | | |
| Kranton Polymers, LLC | | | |
| | 5,299,138 | | | | | Term Loan, 7.38%, Maturing May 12, 2013 | | | 5,315,698 | | |
| Lucite International Group | | | |
| | 635,878 | | | | | Term Loan, 0.00%, Maturing July 7, 2013(2) | | | 640,456 | | |
| | 1,809,587 | | | | | Term Loan, 8.07%, Maturing July 7, 2013 | | | 1,822,616 | | |
| Lyondell Chemical Co. | | | |
| | 11,870,250 | | | | | Term Loan, 7.12%, Maturing August 16, 2013 | | | 11,927,749 | | |
| Mosaic Co. | | | |
| | 7,136,325 | | | | | Term Loan, 7.01%, Maturing February 21, 2012 | | | 7,138,109 | | |
| Nalco Co. | | | |
| | 15,769,086 | | | | | Term Loan, 7.16%, Maturing November 4, 2010 | | | 15,832,257 | | |
| PQ Corp. | | | |
| | 3,851,353 | | | | | Term Loan, 7.38%, Maturing February 10, 2012 | | | 3,867,402 | | |
| Professional Paint, Inc. | | | |
| | 2,319,188 | | | | | Term Loan, 7.63%, Maturing May 31, 2012 | | | 2,322,086 | | |
| Rockwood Specialties Group, Inc. | | | |
| | 9,145,228 | | | | | Term Loan, 7.38%, Maturing July 30, 2012 | | | 9,195,526 | | |
| Sigmakalon (BC) Holdco B.V. | | | |
| | 1,940,000 | | | EUR | | Term Loan, 5.49%, Maturing September 9, 2012 | | | 2,569,456 | | |
| | 92,758 | | | EUR | | Term Loan, 5.99%, Maturing September 9, 2013 | | | 124,021 | | |
| | 1,204,580 | | | EUR | | Term Loan, 5.99%, Maturing September 9, 2013 | | | 1,610,564 | | |
| | 2,202,661 | | | EUR | | Term Loan, 5.99%, Maturing September 9, 2013 | | | 2,945,031 | | |
| | 729,480 | | | EUR | | Term Loan, 6.49%, Maturing September 9, 2014 | | | 979,376 | | |
| | 181,330 | | | EUR | | Term Loan, 6.49%, Maturing September 9, 2014 | | | 242,766 | | |
| | 178,614 | | | EUR | | Term Loan, 6.49%, Maturing September 9, 2014 | | | 239,802 | | |
| | 2,135,161 | | | EUR | | Term Loan, 6.49%, Maturing September 9, 2014 | | | 2,866,597 | | |
| | 183,030 | | | GBP | | Term Loan, 8.08%, Maturing September 9, 2014 | | | 363,630 | | |
| Solo Cup Co. | | | |
| | 9,376,072 | | | | | Term Loan, 8.62%, Maturing February 27, 2011 | | | 9,417,093 | | |
| TPG Spring UK, Ltd. | | | |
| | 4,546,143 | | | EUR | | Term Loan, 6.12%, Maturing June 27, 2013 | | | 6,037,692 | | |
| | 4,546,143 | | | EUR | | Term Loan, 6.62%, Maturing June 27, 2013 | | | 6,058,784 | | |
| Wellman, Inc. | | | |
| | 5,400,000 | | | | | Term Loan, 9.37%, Maturing February 10, 2009 | | | 5,325,750 | | |
| | | $ | 204,221,759 | | |
| Clothing / Textiles - 0.6% | | | |
| Hanesbrands, Inc. | | | |
| $ | 5,225,000 | | | | | Term Loan, 7.68%, Maturing September 5, 2013 | | $ | 5,268,367 | | |
| | 2,025,000 | | | | | Term Loan, 9.19%, Maturing March 5, 2014 | | | 2,072,914 | | |
| Propex Fabrics, Inc. | | | |
| | 3,005,297 | | | | | Term Loan, 7.63%, Maturing July 31, 2012 | | | 3,007,175 | | |
Principal
Amount | | Borrower/Tranche Description | | Value | |
| Clothing / Textiles (continued) | | | |
| St. John Knits International, Inc. | | | |
| $ | 2,222,358 | | | | | Term Loan, 9.32%, Maturing March 23, 2012 | | $ | 2,211,246 | | |
| The William Carter Co. | | | |
| | 2,322,764 | | | | | Term Loan, 6.87%, Maturing July 14, 2012 | | | 2,320,949 | | |
| | | $ | 14,880,651 | | |
| Conglomerates - 3.1% | | | |
| Amsted Industries, Inc. | | | |
| $ | 5,444,779 | | | | | Term Loan, 7.37%, Maturing April 5, 2013 | | $ | 5,444,779 | | |
| Blount, Inc. | | | |
| | 1,800,896 | | | | | Term Loan, 7.10%, Maturing August 9, 2010 | | | 1,806,149 | | |
| Dundee Holdco 4 Limited | | | |
| | 728,900 | | | EUR | | Term Loan, 9.29%, Maturing August 17, 2015 | | | 978,271 | | |
| Dundee Holding, Inc. | | | |
| | 1,841,300 | | | | | Term Loan, 8.07%, Maturing February 17, 2014 | | | 1,845,903 | | |
| Education Management, LLC | | | |
| | 4,937,625 | | | | | Term Loan, 7.88%, Maturing June 1, 2013 | | | 4,972,806 | | |
| Euramax Europe B.V. | | | |
| | 1,401,756 | | | EUR | | Term Loan, 6.29%, Maturing June 29, 2012 | | | 1,851,904 | | |
| Euramax International, Inc. | | | |
| | 2,138,811 | | | | | Term Loan, 8.19%, Maturing June 29, 2012 | | | 2,146,296 | | |
| Goodman Global Holdings, Inc. | | | |
| | 3,863,786 | | | | | Term Loan, 7.19%, Maturing December 23, 2011 | | | 3,865,397 | | |
| ISS Holdings A/S | | | |
| | 2,504,202 | | | EUR | | Term Loan, 5.97%, Maturing December 31, 2013 | | | 3,372,610 | | |
| | 1,704,757 | | | GBP | | Term Loan, 7.68%, Maturing December 31, 2013 | | | 3,393,582 | | |
| Jarden Corp. | | | |
| | 1,609,959 | | | | | Term Loan, 7.12%, Maturing January 24, 2012 | | | 1,608,148 | | |
| | 10,565,577 | | | | | Term Loan, 7.37%, Maturing January 24, 2012 | | | 10,585,388 | | |
| Johnson Diversey, Inc. | | | |
| | 1,060,665 | | | | | Term Loan, 7.87%, Maturing December 16, 2010 | | | 1,067,626 | | |
| | 5,133,675 | | | | | Term Loan, 7.87%, Maturing December 16, 2011 | | | 5,181,002 | | |
| Platinum 100, Ltd. | | | |
| | 1,000,000 | | | GBP | | Term Loan, 7.81%, Maturing January 15, 2013 | | | 1,980,648 | | |
| | 1,000,000 | | | GBP | | Term Loan, 8.31%, Maturing January 15, 2014 | | | 1,988,290 | | |
| Polymer Group, Inc. | | | |
| | 2,000,000 | | | | | Revolving Loan, 0.00%,
Maturing November 22, 2010(2) | | | 1,960,000 | | |
| | 8,585,125 | | | | | Term Loan, 7.61%, Maturing November 22, 2012 | | | 8,609,275 | | |
| PP Acquisition Corp. | | | |
| | 6,651,689 | | | | | Term Loan, 8.32%, Maturing November 12, 2011 | | | 6,701,577 | | |
| RBS Global | | | |
| | 4,150,000 | | | | | Term Loan, 7.88%, Maturing July 19, 2013 | | | 4,168,165 | | |
| RGIS Holdings, LLC | | | |
| | 3,722,166 | | | | | Term Loan, 7.87%, Maturing February 15, 2013 | | | 3,721,004 | | |
See notes to financial statements
15
Senior Debt Portfolio as of November 30, 2006
PORTFOLIO OF INVESTMENTS CONT'D
Principal
Amount | | Borrower/Tranche Description | | Value | |
| Conglomerates (continued) | | | |
| Sensata Technologies Finance Co. | | | |
| $ | 2,443,875 | | | | | Term Loan, 7.13%, Maturing April 26, 2013 | | $ | 2,429,280 | | |
| Terex Corp. | | | |
| | 2,144,625 | | | | | Term Loan, 7.12%, Maturing July 13, 2013 | | | 2,152,667 | | |
| Walter Industries, Inc. | | | |
| | 1,011,196 | | | | | Term Loan, 7.12%, Maturing October 3, 2012 | | | 1,014,103 | | |
| | | $ | 82,844,870 | | |
| Containers and Glass Products - 3.6% | | | |
| Altivity Packaging LLC | | | |
| $ | 1,171,609 | | | | | Term Loan, 7.60%, Maturing June 30, 2013 | | $ | 1,183,179 | | |
| | 3,915,641 | | | | | Term Loan, 7.60%, Maturing June 30, 2013 | | | 3,954,308 | | |
| Consolidated Container Holding, LLC | | | |
| | 3,812,250 | | | | | Term Loan, 8.63%, Maturing December 15, 2008 | | | 3,831,311 | | |
| Crown Americas, Inc. | | | |
| | 990,000 | | | EUR | | Term Loan, 5.34%, Maturing November 15, 2012 | | | 1,311,474 | | |
| | 1,361,250 | | | | | Term Loan, 7.12%, Maturing November 15, 2012 | | | 1,364,865 | | |
| Graham Packaging Holdings Co. | | | |
| | 845,696 | | | | | Term Loan, 7.69%, Maturing October 7, 2011 | | | 849,925 | | |
| | 14,983,125 | | | | | Term Loan, 7.73%, Maturing October 7, 2011 | | | 15,058,041 | | |
| Graphic Packaging International, Inc. | | | |
| | 2,000,000 | | | | | Revolving Loan, 0.00%,
Maturing August 8, 2007(2) | | | 1,957,500 | | |
| | 18,513,120 | | | | | Term Loan, 7.90%, Maturing August 8, 2010 | | | 18,749,496 | | |
| IPG (US), Inc. | | | |
| | 3,459,401 | | | | | Term Loan, 7.64%, Maturing July 28, 2011 | | | 3,455,076 | | |
| JSG Acquisitions | | | |
| | 5,500,000 | | | EUR | | Term Loan, 5.86%, Maturing December 31, 2014 | | | 7,350,431 | | |
| | 5,500,000 | | | EUR | | Term Loan, 6.26%, Maturing December 31, 2014 | | | 7,383,056 | | |
| OI European Group B.V. | | | |
| | 4,000,000 | | | EUR | | Term Loan, 4.90%, Maturing June 14, 2013 | | | 5,273,202 | | |
| Owens Illinois, Inc. | | | |
| | 5,000,000 | | | | | Term Loan, 6.82%, Maturing June 14, 2013 | | | 5,008,750 | | |
| Pregis Corp. | | | |
| | 2,475,000 | | | EUR | | Term Loan, 5.88%, Maturing October 12, 2012 | | | 3,297,140 | | |
| Smurfit-Stone Container Corp. | | | |
| | 1,986,462 | | | | | Term Loan, 4.73%, Maturing November 1, 2010 | | | 2,002,038 | | |
| | 8,331,277 | | | | | Term Loan, 7.66%, Maturing November 1, 2011 | | | 8,396,602 | | |
| | 4,952,523 | | | | | Term Loan, 7.67%, Maturing November 1, 2011 | | | 4,991,355 | | |
| | | $ | 95,417,749 | | |
Principal
Amount | | Borrower/Tranche Description | | Value | |
| Cosmetics / Toiletries - 0.3% | | | |
| Prestige Brands, Inc. | | | |
| $ | 6,364,325 | | | | | Term Loan, 7.71%, Maturing April 7, 2011 | | $ | 6,400,124 | | |
| Revlon Consumer Products Corp. | | | |
| | 2,181,976 | | | | | Term Loan, 11.42%, Maturing July 9, 2010 | | | 2,240,163 | | |
| | | $ | 8,640,287 | | |
| Drugs - 0.5% | | | |
| Warner Chilcott Corp. | | | |
| $ | 2,660,623 | | | | | Term Loan, 7.62%, Maturing January 18, 2012 | | $ | 2,675,826 | | |
| | 9,690,859 | | | | | Term Loan, 7.62%, Maturing January 18, 2012 | | | 9,746,232 | | |
| | | $ | 12,422,058 | | |
| Ecological Services and Equipment - 1.1% | | | |
| Allied Waste Industries, Inc. | | | |
| $ | 3,402,869 | | | | | Term Loan, 5.33%, Maturing January 15, 2012 | | $ | 3,403,399 | | |
| | 3,671,996 | | | | | Term Loan, 7.16%, Maturing January 15, 2012 | | | 3,671,644 | | |
| Duratek, Inc. | | | |
| | 1,833,400 | | | | | Term Loan, 7.76%, Maturing June 7, 2013 | | | 1,845,433 | | |
| Energysolutions, LLC | | | |
| | 192,610 | | | | | Term Loan, 7.57%, Maturing June 7, 2013 | | | 193,874 | | |
| | 4,046,610 | | | | | Term Loan, 7.76%, Maturing June 7, 2013 | | | 4,073,168 | | |
| Environmental Systems, Inc. | | | |
| | 2,679,268 | | | | | Term Loan, 8.87%, Maturing December 12, 2008 | | | 2,696,013 | | |
| | 500,000 | | | | | Term Loan, 15.36%, Maturing December 12, 2010 | | | 512,500 | | |
| Sensus Metering Systems, Inc. | | | |
| | 3,438,775 | | | | | Term Loan, 7.44%, Maturing December 17, 2010 | | | 3,438,775 | | |
| | 456,771 | | | | | Term Loan, 7.49%, Maturing December 17, 2010 | | | 456,771 | | |
| Sulo GmbH | | | |
| | 3,750,000 | | | EUR | | Term Loan, 6.12%, Maturing January 19, 2014 | | | 5,013,005 | | |
| | 3,750,000 | | | EUR | | Term Loan, 6.62%, Maturing January 19, 2015 | | | 5,034,812 | | |
| | | $ | 30,339,394 | | |
| Electronics / Electrical - 2.8% | | | |
| Advanced Micro Devices, Inc. | | | |
| $ | 7,109,726 | | | | | Term Loan, 7.62%, Maturing December 31, 2013 | | $ | 7,145,275 | | |
| AMI Semiconductor, Inc. | | | |
| | 1,282,822 | | | | | Term Loan, 6.82%, Maturing April 1, 2012 | | | 1,278,813 | | |
| Aspect Software, Inc. | | | |
| | 6,150,000 | | | | | Term Loan, 8.44%, Maturing July 11, 2011 | | | 6,187,478 | | |
| Communications & Power, Inc. | | | |
| | 1,416,667 | | | | | Term Loan, 7.57%, Maturing July 23, 2010 | | | 1,422,865 | | |
| Enersys Capital, Inc. | | | |
| | 3,616,750 | | | | | Term Loan, 7.42%, Maturing March 17, 2011 | | | 3,639,355 | | |
See notes to financial statements
16
Senior Debt Portfolio as of November 30, 2006
PORTFOLIO OF INVESTMENTS CONT'D
Principal
Amount | | Borrower/Tranche Description | | Value | |
| Electronics / Electrical (continued) | | | |
| FCI International S.A.S. | | | |
| $ | 662,180 | | | | | Term Loan, 8.33%, Maturing November 1, 2013 | | $ | 671,285 | | |
| | 687,820 | | | | | Term Loan, 8.33%, Maturing November 1, 2013 | | | 690,185 | | |
| | 687,820 | | | | | Term Loan, 8.83%, Maturing November 1, 2013 | | | 693,624 | | |
| | 662,180 | | | | | Term Loan, 8.83%, Maturing November 1, 2013 | | | 671,285 | | |
| Ganymed 347 VV GmbH | | | |
| | 329,460 | | | EUR | | Term Loan, 5.75%, Maturing April 30, 2013 | | | 440,483 | | |
| | 670,540 | | | EUR | | Term Loan, 6.46%, Maturing April 30, 2013 | | | 896,500 | | |
| | 329,460 | | | EUR | | Term Loan, 6.25%, Maturing April 30, 2014 | | | 442,653 | | |
| | 670,540 | | | EUR | | Term Loan, 6.96%, Maturing April 30, 2014 | | | 900,748 | | |
| Infor Enterprise Solutions | | | |
| | 8,115,714 | | | | | Term Loan, 9.12%, Maturing July 28, 2012 | | | 8,213,776 | | |
| | 4,234,286 | | | | | Term Loan, 9.12%, Maturing July 28, 2012 | | | 4,289,861 | | |
| Invensys International Holding | | | |
| | 1,083,333 | | | | | Term Loan, 7.62%, Maturing December 15, 2010 | | | 1,090,781 | | |
| | 1,166,667 | | | | | Term Loan, 7.40%, Maturing January 15, 2011 | | | 1,174,687 | | |
| Network Solutions, LLC | | | |
| | 3,086,675 | | | | | Term Loan, 10.37%, Maturing January 9, 2012 | | | 3,125,258 | | |
| Open Solutions, Inc. | | | |
| | 3,495,862 | | | | | Term Loan, 7.90%, Maturing September 3, 2011 | | | 3,500,232 | | |
| Spectrum Brands Inc. | | | |
| | 10,734,734 | | | | | Term Loan, 8.38%, Maturing February 6, 2012 | | | 10,786,486 | | |
| Security Co., Inc. | | | |
| | 4,594,377 | | | | | Term Loan, 8.63%, Maturing June 28, 2010 | | | 4,617,349 | | |
| Serena Software, Inc. | | | |
| | 1,804,688 | | | | | Term Loan, 7.62%, Maturing March 10, 2013 | | | 1,806,718 | | |
| Telcordia Technologies, Inc. | | | |
| | 7,023,050 | | | | | Term Loan, 8.12%, Maturing September 15, 2012 | | | 6,861,738 | | |
| Vertafore, Inc. | | | |
| | 457,078 | | | | | Term Loan, 7.86%, Maturing January 31, 2012 | | | 459,363 | | |
| | 3,546,923 | | | | | Term Loan, 7.87%, Maturing January 31, 2012 | | | 3,564,657 | | |
| | | $ | 74,571,455 | | |
| Equipment Leasing - 1.3% | | | |
| Maxim Crane Works, L.P. | | | |
| $ | 3,475,094 | | | | | Term Loan, 7.33%, Maturing January 28, 2010 | | $ | 3,488,125 | | |
| Rental Service Corp. | | | |
| | 3,275,000 | | | | | Term Loan, 8.85%, Maturing November 30, 2013 | | | 3,301,098 | | |
| The Hertz Corp. | | | |
| | 13,750,000 | | | | | Revolving Loan, 0.00%,
Maturing December 21, 2010(2) | | | 13,727,079 | | |
| | 786,111 | | | | | Term Loan, 5.39%, Maturing December 21, 2012 | | | 792,302 | | |
| | 6,245,763 | | | | | Term Loan, 7.36%, Maturing December 21, 2012 | | | 6,294,949 | | |
Principal
Amount | | Borrower/Tranche Description | | Value | |
| Equipment Leasing (continued) | | | |
| United Rentals, Inc. | | | |
| $ | 1,726,985 | | | | | Term Loan, 6.00%, Maturing February 14, 2011 | | $ | 1,736,340 | | |
| | 4,227,977 | | | | | Term Loan, 7.32%, Maturing February 14, 2011 | | | 4,250,880 | | |
| | | $ | 33,590,773 | | |
| Farming / Agriculture - 0.2% | | | |
| Central Garden & Pet Co. | | | |
| $ | 4,746,138 | | | | | Term Loan, 6.82%, Maturing February 28, 2014 | | $ | 4,751,083 | | |
| | | $ | 4,751,083 | | |
| Financial Intermediaries - 2.3% | | | |
| AIMCO Properties, L.P. | | | |
| $ | 10,000,000 | | | | | Term Loan, 6.91%, Maturing March 23, 2011 | | $ | 10,025,000 | | |
| Ameritrade Holding Corp. | | | |
| | 7,617,028 | | | | | Term Loan, 6.82%, Maturing December 31, 2012 | | | 7,613,456 | | |
| Coinstar, Inc. | | | |
| | 1,731,473 | | | | | Term Loan, 7.37%, Maturing July 7, 2011 | | | 1,743,377 | | |
| E.A. Viner International Co. | | | |
| | 498,750 | | | | | Term Loan, 8.12%, Maturing July 31, 2013 | | | 502,491 | | |
| Fidelity National Information Solutions, Inc. | | | |
| | 19,014,250 | | | | | Term Loan, 7.07%, Maturing March 9, 2013 | | | 19,040,661 | | |
| IPayment, Inc. | | | |
| | 2,960,125 | | | | | Term Loan, 7.36%, Maturing May 10, 2013 | | | 2,958,275 | | |
| LPL Holdings, Inc. | | | |
| | 11,934,813 | | | | | Term Loan, 8.30%, Maturing June 30, 2013 | | | 12,042,978 | | |
| Oxford Acquisition III, Ltd. | | | |
| | 3,675,000 | | | | | Term loan, 7.75%, Maturing September 20, 2013 | | | 3,703,713 | | |
| The Macerich Partnership, L.P. | | | |
| | 4,310,000 | | | | | Term Loan, 6.88%, Maturing April 25, 2010 | | | 4,310,896 | | |
| | | $ | 61,940,847 | | |
| Food Products - 2.2% | | | |
| American Seafoods Group, LLC | | | |
| $ | 1,959,425 | | | | | Term Loan, 7.12%, Maturing September 28, 2012 | | $ | 1,958,814 | | |
| BL Marketing, Ltd. | | | |
| | 1,500,000 | | | GBP | | Term Loan, 7.75%, Maturing December 20, 2013 | | | 2,995,335 | | |
| | 1,500,000 | | | GBP | | Term Loan, 8.25%, Maturing December 20, 2014 | | | 3,008,188 | | |
| Black Lion Beverages III B.V. | | | |
| | 1,000,000 | | | EUR | | Term Loan, 6.06%, Maturing December 31, 2013 | | | 1,342,948 | | |
| | 1,000,000 | | | EUR | | Term Loan, 6.17%, Maturing December 31, 2014 | | | 1,348,505 | | |
| Autobar BV (A Com SBV) | | | |
| | 750,000 | | | EUR | | Term Loan, 6.06%, Maturing March 14, 2014 | | | 996,338 | | |
| | 750,000 | | | EUR | | Term Loan, 6.56%, Maturing March 14, 2015 | | | 1,000,479 | | |
See notes to financial statements
17
Senior Debt Portfolio as of November 30, 2006
PORTFOLIO OF INVESTMENTS CONT'D
Principal
Amount | | Borrower/Tranche Description | | Value | |
| Food Products (continued) | | | |
| Chiquita Brands, LLC | | | |
| $ | 3,132,231 | | | | | Term Loan, 8.38%, Maturing June 28, 2012 | | $ | 3,153,277 | | |
| Del Monte Corp. | | | |
| | 2,105,414 | | | | | Term Loan, 6.95%, Maturing February 8, 2012 | | | 2,110,300 | | |
| Dole Food Company, Inc. | | | |
| | 525,581 | | | | | Term Loan, 5.24%, Maturing April 12, 2013 | | | 521,056 | | |
| | 3,922,151 | | | | | Term Loan, 7.46%, Maturing April 12, 2013 | | | 3,888,378 | | |
| | 1,176,645 | | | | | Term Loan, 7.55%, Maturing April 12, 2013 | | | 1,166,513 | | |
| Foodvest Limited | | | |
| | 361,667 | | | EUR | | Term Loan, 6.23%, Maturing March 16, 2014 | | | 484,202 | | |
| | 250,000 | | | GBP | | Term Loan, 7.83%, Maturing March 16, 2014 | | | 495,963 | | |
| | 361,667 | | | EUR | | Term Loan, 6.73%, Maturing March 16, 2015 | | | 486,599 | | |
| | 250,000 | | | GBP | | Term Loan, 8.33%, Maturing March 16, 2015 | | | 498,422 | | |
| Michael Foods, Inc. | | | |
| | 3,909,047 | | | | | Term Loan, 7.54%, Maturing November 21, 2010 | | | 3,919,633 | | |
| Nash-Finch Co. | | | |
| | 3,759,429 | | | | | Term Loan, 6.88%, Maturing November 12, 2010 | | | 3,765,305 | | |
| Nutro Products, Inc. | | | |
| | 1,467,625 | | | | | Term Loan, 7.37%, Maturing April 26, 2013 | | | 1,470,836 | | |
| Picard Surgeles S.A. | | | |
| | 2,000,000 | | | EUR | | Term Loan, 5.44%, Maturing June 4, 2014 | | | 2,675,291 | | |
| Pinnacle Foods Holdings Corp. | | | |
| | 2,142,857 | | | | | Revolving Loan, 0.00%,
Maturing November 25, 2009(2) | | | 2,083,929 | | |
| | 8,354,102 | | | | | Term Loan, 7.37%, Maturing November 25, 2010 | | | 8,376,032 | | |
| QCE Finance, LLC | | | |
| | 2,793,000 | | | | | Term Loan, 7.63%, Maturing May 5, 2013 | | | 2,787,763 | | |
| Reddy Ice Group, Inc. | | | |
| | 6,975,000 | | | | | Term Loan, 7.12%, Maturing August 12, 2012 | | | 6,977,183 | | |
| Ruby Acquisitions, Ltd. | | | |
| | 1,000,000 | | | GBP | | Term Loan, 7.93%, Maturing January 5, 2015 | | | 1,981,803 | | |
| | | $ | 59,493,092 | | |
| Food Service - 1.7% | | | |
| AFC Enterprises, Inc. | | | |
| $ | 1,258,692 | | | | | Term Loan, 7.63%, Maturing May 11, 2011 | | $ | 1,262,625 | | |
| Buffets, Inc. | | | |
| | 2,000,000 | | | | | Term Loan, 0.00%, Maturing June 28, 2007(2) | | | 2,015,000 | | |
| | 539,583 | | | | | Term Loan, 5.27%, Maturing May 1, 2013 | | | 543,630 | | |
| | 4,085,417 | | | | | Term Loan, 8.36%, Maturing November 1, 2013 | | | 4,116,057 | | |
| Burger King Corp. | | | |
| | 3,351,204 | | | | | Term Loan, 6.88%, Maturing June 30, 2012 | | | 3,350,273 | | |
| Carrols Corp. | | | |
| | 1,674,052 | | | | | Term Loan, 7.88%, Maturing December 31, 2010 | | | 1,680,748 | | |
Principal
Amount | | Borrower/Tranche Description | | Value | |
| Food Service (continued) | | | |
| CBRL Group, Inc. | | | |
| $ | 6,240,379 | | | | | Term Loan, 7.13%, Maturing April 27, 2013 | | $ | 6,232,579 | | |
| CKE Restaurants, Inc. | | | |
| | 1,171,739 | | | | | Term Loan, 7.38%, Maturing May 1, 2010 | | | 1,174,669 | | |
| Denny's, Inc. | | | |
| | 2,509,478 | | | | | Term Loan, 8.61%, Maturing September 21, 2009 | | | 2,514,968 | | |
| Domino's, Inc. | | | |
| | 12,221,349 | | | | | Term Loan, 6.88%, Maturing June 25, 2010 | | | 12,228,987 | | |
| Jack in the Box, Inc. | | | |
| | 2,575,139 | | | | | Term Loan, 6.88%, Maturing January 8, 2011 | | | 2,585,602 | | |
| Maine Beverage Co., LLC | | | |
| | 2,477,679 | | | | | Term Loan, 7.12%, Maturing June 30, 2010 | | | 2,471,484 | | |
| NPC International, Inc. | | | |
| | 1,250,000 | | | | | Term Loan, 7.12%, Maturing May 3, 2013 | | | 1,246,875 | | |
| Sagittarius Restaurants, LLC | | | |
| | 1,268,625 | | | | | Term Loan, 7.62%, Maturing March 29, 2013 | | | 1,269,418 | | |
| Sonic Corp. | | | |
| | 1,962,000 | | | | | Term Loan, 7.32%, Maturing September 22, 2013 | | | 1,966,599 | | |
| Weightwatchers.com, Inc. | | | |
| | 1,511,650 | | | | | Term Loan, 7.61%, Maturing December 16, 2010 | | | 1,519,208 | | |
| | | $ | 46,178,722 | | |
| Food / Drug Retailers - 1.3% | | | |
| General Nutrition Centers, Inc. | | | |
| $ | 2,000,000 | | | | | Revolving Loan, 0.00%,
Maturing December 5, 2009(2) | | $ | 1,945,000 | | |
| | 1,580,318 | | | | | Term Loan, 8.07%, Maturing December 5, 2011 | | | 1,588,714 | | |
| Roundy's Supermarkets, Inc. | | | |
| | 11,264,875 | | | | | Term Loan, 8.38%, Maturing November 3, 2011 | | | 11,371,891 | | |
| Supervalu, Inc. | | | |
| | 4,651,625 | | | | | Term Loan, 7.19%, Maturing June 1, 2012 | | | 4,665,087 | | |
| The Jean Coutu Group (PJC), Inc. | | | |
| | 12,072,276 | | | | | Term Loan, 7.94%, Maturing July 30, 2011 | | | 12,110,002 | | |
| The Pantry, Inc. | | | |
| | 2,580,500 | | | | | Term Loan, 7.07%, Maturing January 2, 2012 | | | 2,588,564 | | |
| | | $ | 34,269,258 | | |
| Forest Products - 2.1% | | | |
| Appleton Papers, Inc. | | | |
| $ | 5,771,631 | | | | | Term Loan, 7.64%, Maturing June 11, 2010 | | $ | 5,796,882 | | |
| BF Bolthouse HoldCo, LLC | | | |
| | 2,034,625 | | | | | Term Loan, 7.63%, Maturing December 16, 2012 | | | 2,036,851 | | |
| Boise Cascade Holdings, LLC | | | |
| | 8,029,937 | | | | | Term Loan, 7.11%, Maturing October 28, 2011 | | | 8,071,091 | | |
See notes to financial statements
18
Senior Debt Portfolio as of November 30, 2006
PORTFOLIO OF INVESTMENTS CONT'D
Principal
Amount | | Borrower/Tranche Description | | Value | |
| Forest Products (continued) | | | |
| Buckeye Technologies, Inc. | | | |
| $ | 2,027,171 | | | | | Term Loan, 7.40%, Maturing April 15, 2010 | | $ | 2,029,284 | | |
| Georgia-Pacific Corp. | | | |
| | 20,524,850 | | | | | Term Loan, 7.39%, Maturing December 20, 2012 | | | 20,592,562 | | |
| | 8,675,000 | | | | | Term Loan, 8.39%, Maturing December 23, 2013 | | | 8,711,426 | | |
| NewPage Corp. | | | |
| | 3,928,571 | | | | | Revolving Loan, 0.00%, Maturing May 2, 2010(2) | | | 3,869,643 | | |
| | 2,341,567 | | | | | Term Loan, 8.36%, Maturing May 2, 2011 | | | 2,359,129 | | |
| Xerium Technologies, Inc. | | | |
| | 2,994,878 | | | | | Term Loan, 7.62%, Maturing May 18, 2012 | | | 2,991,135 | | |
| | | $ | 56,458,003 | | |
| Healthcare - 6.2% | | | |
| Accellent, Inc. | | | |
| $ | 1,215,813 | | | | | Term Loan, 7.37%, Maturing November 22, 2012 | | $ | 1,215,813 | | |
| Alliance Imaging, Inc. | | | |
| | 5,414,704 | | | | | Term Loan, 7.93%, Maturing December 29, 2011 | | | 5,439,070 | | |
| American Medical Systems | | | |
| | 5,150,000 | | | | | Term Loan, 7.81%, Maturing July 20, 2012 | | | 5,156,438 | | |
| AMN Healthcare, Inc. | | | |
| | 1,314,558 | | | | | Term Loan, 7.12%, Maturing November 2, 2011 | | | 1,319,077 | | |
| AMR HoldCo, Inc. | | | |
| | 1,818,248 | | | | | Term Loan, 7.38%, Maturing February 10, 2012 | | | 1,821,657 | | |
| Carl Zeiss Topco GMBH | | | |
| | 1,323,333 | | | | | Term Loan, 8.12%, Maturing February 28, 2013 | | | 1,335,202 | | |
| | 2,646,667 | | | | | Term Loan, 8.62%, Maturing February 28, 2014 | | | 2,683,638 | | |
| Community Health Systems, Inc. | | | |
| | 20,291,805 | | | | | Term Loan, 7.12%, Maturing August 19, 2011 | | | 20,320,802 | | |
| Concentra Operating Corp. | | | |
| | 7,645,814 | | | | | Term Loan, 7.62%, Maturing September 30, 2011 | | | 7,674,486 | | |
| Conmed Corp. | | | |
| | 3,204,912 | | | | | Term Loan, 7.32%, Maturing April 12, 2013 | | | 3,205,915 | | |
| CRC Health Corp. | | | |
| | 1,542,250 | | | | | Term Loan, 7.62%, Maturing February 6, 2013 | | | 1,547,070 | | |
| Davita, Inc. | | | |
| | 17,044,794 | | | | | Term Loan, 7.42%, Maturing October 5, 2012 | | | 17,132,302 | | |
| Emdeon Business Services LLC | | | |
| | 4,775,000 | | | | | Term Loan, 7.82%, Maturing November 16, 2013 | | | 4,775,000 | | |
| Encore Medical Finance, LLC | | | |
| | 2,900,000 | | | | | Term Loan, 7.87%, Maturing November 3, 2013 | | | 2,905,438 | | |
| FHC Health Systems, Inc. | | | |
| | 1,276,786 | | | | | Term Loan, 11.40%, Maturing December 18, 2009 | | | 1,315,089 | | |
| | 893,750 | | | | | Term Loan, 13.40%, Maturing December 18, 2009 | | | 920,563 | | |
Principal
Amount | | Borrower/Tranche Description | | Value | |
| Healthcare (continued) | | | |
| HealthSouth Corp. | | | |
| $ | 6,783,000 | | | | | Term Loan, 8.62%, Maturing March 10, 2013 | | $ | 6,815,972 | | |
| Iasis Healthcare, LLC | | | |
| | 488,750 | | | | | Term Loan, 7.62%, Maturing June 16, 2011 | | | 491,683 | | |
| Kinetic Concepts, Inc. | | | |
| | 3,166,983 | | | | | Term Loan, 7.12%, Maturing August 11, 2010 | | | 3,175,892 | | |
| La Petite Academy, Inc. | | | |
| | 2,150,000 | | | | | Term Loan, 8.32%, Maturing August 16, 2012 | | | 2,164,781 | | |
| Leiner Health Products, Inc. | | | |
| | 3,176,875 | | | | | Term Loan, 8.88%, Maturing May 27, 2011 | | | 3,194,084 | | |
| Lifecare Holdings, Inc. | | | |
| | 3,267,000 | | | | | Term Loan, 7.57%, Maturing August 11, 2012 | | | 3,057,366 | | |
| Lifepoint Hospitals, Inc. | | | |
| | 12,075,352 | | | | | Term Loan, 6.95%, Maturing April 15, 2012 | | | 12,022,523 | | |
| Magellan Health Services, Inc. | | | |
| | 1,749,249 | | | | | Term Loan, 5.20%, Maturing August 15, 2008 | | | 1,753,622 | | |
| | 1,530,593 | | | | | Term Loan, 7.17%, Maturing August 15, 2008 | | | 1,534,420 | | |
| Matria Healthcare, Inc. | | | |
| | 1,472,454 | | | | | Term Loan, 7.37%, Maturing January 19, 2012 | | | 1,473,375 | | |
| Medcath Holdings Corp. | | | |
| | 622,112 | | | | | Term Loan, 7.87%, Maturing June 30, 2011 | | | 622,695 | | |
| Moon Acquisition Co. AB | | | |
| | 687,209 | | | EUR | | Term Loan, 5.88%, Maturing November 4, 2013 | | | 921,126 | | |
| | 750,000 | | | EUR | | Term Loan, 6.38%, Maturing November 4, 2014 | | | 1,009,769 | | |
| Multiplan Merger Corp. | | | |
| | 1,476,794 | | | | | Term Loan, 7.82%, Maturing April 12, 2013 | | | 1,475,564 | | |
| Multiplan, Inc. | | | |
| | 1,881,528 | | | | | Term Loan, 7.82%, Maturing April 12, 2013 | | | 1,879,960 | | |
| National Mentor Holdings, Inc. | | | |
| | 190,400 | | | | | Term Loan, 5.32%, Maturing June 29, 2013 | | | 191,650 | | |
| | 3,201,576 | | | | | Term Loan, 7.87%, Maturing June 29, 2013 | | | 3,222,588 | | |
| P&F Capital S.A.R.L. | | | |
| | 313,835 | | | EUR | | Term Loan, 5.63%, Maturing February 21, 2014 | | | 422,212 | | |
| | 187,852 | | | EUR | | Term Loan, 5.63%, Maturing February 21, 2014 | | | 252,723 | | |
| | 150,740 | | | EUR | | Term Loan, 5.63%, Maturing February 21, 2014 | | | 202,796 | | |
| | 97,573 | | | EUR | | Term Loan, 6.13%, Maturing February 21, 2014 | | | 131,268 | | |
| | 141,892 | | | EUR | | Term Loan, 6.13%, Maturing February 21, 2015 | | | 191,670 | | |
| | 52,703 | | | EUR | | Term Loan, 6.13%, Maturing February 21, 2015 | | | 71,192 | | |
| | 109,459 | | | EUR | | Term Loan, 6.13%, Maturing February 21, 2015 | | | 147,860 | | |
| | 445,946 | | | EUR | | Term Loan, 6.13%, Maturing February 21, 2015 | | | 602,392 | | |
| PER-SE Technologies, Inc. | | | |
| | 3,283,563 | | | | | Term Loan, 7.57%, Maturing January 16, 2013 | | | 3,289,208 | | |
| Quintiles Transnational Corp. | | | |
| | 5,771,000 | | | | | Term Loan, 7.37%, Maturing March 31, 2013 | | | 5,771,000 | | |
See notes to financial statements
19
Senior Debt Portfolio as of November 30, 2006
PORTFOLIO OF INVESTMENTS CONT'D
Principal
Amount | | Borrower/Tranche Description | | Value | |
| Healthcare (continued) | | | |
| Radnet Management, Inc. | | | |
| $ | 1,650,000 | | | | | Term Loan, 10.25%,
Maturing November 15, 2012 | | $ | 1,650,000 | | |
| Renal Advantage, Inc. | | | |
| | 1,114,095 | | | | | Term Loan, 7.89%, Maturing October 5, 2012 | | | 1,122,451 | | |
| Select Medical Holding Corp. | | | |
| | 5,200,800 | | | | | Term Loan, 7.11%, Maturing February 24, 2012 | | | 5,108,486 | | |
| Sunrise Medical Holdings, Inc. | | | |
| | 3,859,780 | | | | | Term Loan, 8.87%, Maturing May 13, 2010 | | | 3,850,131 | | |
| Talecris Biotherapeutics, Inc. | | | |
| | 3,610,025 | | | | | Term Loan, 9.50%, Maturing March 31, 2010 | | | 3,628,075 | | |
| Vanguard Health Holding Co., LLC | | | |
| | 6,959,518 | | | | | Term Loan, 7.87%, Maturing September 23, 2011 | | | 6,974,745 | | |
| Ventiv Health, Inc. | | | |
| | 1,697,143 | | | | | Term Loan, 6.87%, Maturing October 5, 2011 | | | 1,690,779 | | |
| VWR International, Inc. | | | |
| | 4,081,749 | | | | | Term Loan, 7.63%, Maturing April 7, 2011 | | | 4,095,782 | | |
| | | $ | 162,977,400 | | |
| Home Furnishings - 1.3% | | | |
| Interline Brands, Inc. | | | |
| $ | 2,168,478 | | | | | Term Loan, 7.11%, Maturing June 23, 2013 | | $ | 2,172,544 | | |
| | 2,819,022 | | | | | Term Loan, 7.12%, Maturing June 23, 2013 | | | 2,824,307 | | |
| Knoll, Inc. | | | |
| | 5,222,076 | | | | | Term Loan, 7.12%, Maturing October 3, 2012 | | | 5,254,714 | | |
| National Bedding Co., LLC | | | |
| | 1,891,062 | | | | | Term Loan, 7.39%, Maturing August 31, 2011 | | | 1,896,736 | | |
| Oreck Corp. | | | |
| | 1,272,883 | | | | | Term Loan, 8.12%, Maturing February 2, 2012 | | | 1,269,701 | | |
| Sanitec, Ltd. Oy | | | |
| | 3,000,000 | | | EUR | | Term Loan, 5.89%, Maturing May 27, 2013 | | | 3,963,229 | | |
| | 3,000,000 | | | EUR | | Term Loan, 6.39%, Maturing May 27, 2014 | | | 3,980,925 | | |
| Sealy Mattress Co. | | | |
| | 3,799,107 | | | | | Term Loan, 7.08%, Maturing August 25, 2012 | | | 3,799,107 | | |
| Simmons Co. | | | |
| | 9,060,869 | | | | | Term Loan, 7.17%, Maturing December 19, 2011 | | | 9,128,825 | | |
| | | $ | 34,290,088 | | |
| Industrial Equipment - 1.3% | | | |
| Aearo Technologies, Inc. | | | |
| $ | 2,636,750 | | | | | Term Loan, 7.87%, Maturing March 22, 2013 | | $ | 2,660,370 | | |
| Alliance Laundry Holdings, LLC | | | |
| | 1,629,957 | | | | | Term Loan, 7.57%, Maturing January 27, 2012 | | | 1,638,617 | | |
Principal
Amount | | Borrower/Tranche Description | | Value | |
| Industrial Equipment (continued) | | | |
| Colfax Corp. | | | |
| $ | 2,841,565 | | | | | Term Loan, 7.38%, Maturing November 30, 2011 | | $ | 2,857,549 | | |
| Douglas Dynamics Holdings, Inc. | | | |
| | 1,723,221 | | | | | Term Loan, 7.12%, Maturing December 16, 2010 | | | 1,718,913 | | |
| Flowserve Corp. | | | |
| | 6,933,116 | | | | | Term Loan, 6.88%, Maturing August 10, 2012 | | | 6,933,116 | | |
| Generac Acquisition Corp. | | | |
| | 3,825,000 | | | | | Term Loan, 7.82%, Maturing November 7, 2013 | | | 3,841,734 | | |
| Gleason Corp. | | | |
| | 2,000,000 | | | | | Term Loan, 7.88%, Maturing June 30, 2013 | | | 2,013,126 | | |
| GSCP Athena (Finnish) Holdings | | | |
| | 2,576,087 | | | EUR | | Term Loan, 6.16%, Maturing July 28, 2013 | | | 3,433,728 | | |
| | 2,923,913 | | | EUR | | Term Loan, 6.66%, Maturing July 28, 2014 | | | 3,914,795 | | |
| MTD Products, Inc. | | | |
| | 2,942,275 | | | | | Term Loan, 6.88%, Maturing June 1, 2010 | | | 2,931,241 | | |
| TFS Acquisition Corp. | | | |
| | 1,975,000 | | | | | Term Loan, 8.92%, Maturing August 11, 2013 | | | 1,989,813 | | |
| | | $ | 33,933,002 | | |
| Insurance - 0.9% | | | |
| ARG Holding, Inc. | | | |
| $ | 3,647,438 | | | | | Term Loan, 8.38%, Maturing November 30, 2011 | | $ | 3,667,954 | | |
| CCC Information Services Group | | | |
| | 2,400,000 | | | | | Term Loan, 7.87%, Maturing February 10, 2013 | | | 2,412,499 | | |
| Conseco, Inc. | | | |
| | 8,125,000 | | | | | Term Loan, 7.32%, Maturing October 10, 2013 | | | 8,140,234 | | |
| Hilb, Rogal & Hobbs Co. | | | |
| | 2,910,375 | | | | | Term Loan, 6.87%, Maturing April 26, 2013 | | | 2,907,951 | | |
| U.S.I. Holdings Corp. | | | |
| | 7,010,507 | | | | | Term Loan, 7.69%, Maturing March 24, 2011 | | | 7,045,560 | | |
| | | $ | 24,174,198 | | |
| Leisure Goods / Activities / Movies - 5.0% | | | |
| 24 Hour Fitness Worldwide, Inc. | | | |
| $ | 5,850,600 | | | | | Term Loan, 7.99%, Maturing June 2, 2012 | | $ | 5,901,793 | | |
| Alliance Atlantis Communications, Inc. | | | |
| | 2,234,965 | | | | | Term Loan, 6.87%, Maturing December 31, 2011 | | | 2,234,965 | | |
| AMC Entertainment, Inc. | | | |
| | 6,103,875 | | | | | Term Loan, 7.45%, Maturing January 26, 2013 | | | 6,144,887 | | |
| AMF Bowling Worldwide, Inc. | | | |
| | 1,852,677 | | | | | Term Loan, 8.46%, Maturing August 27, 2009 | | | 1,865,414 | | |
| Bombardier Recreational Product | | | |
| | 6,200,000 | | | | | Term Loan, 8.13%, Maturing June 28, 2013 | | | 6,184,500 | | |
See notes to financial statements
20
Senior Debt Portfolio as of November 30, 2006
PORTFOLIO OF INVESTMENTS CONT'D
Principal
Amount | | Borrower/Tranche Description | | Value | |
| Leisure Goods / Activities / Movies (continued) | | | |
| Carmike Cinemas, Inc. | | | |
| $ | 2,224,085 | | | | | Term Loan, 8.63%, Maturing May 19, 2012 | | $ | 2,245,863 | | |
| | 3,007,058 | | | | | Term Loan, 8.64%, Maturing May 19, 2012 | | | 3,037,129 | | |
| Cedar Fair, L.P. | | | |
| | 9,027,375 | | | | | Term Loan, 7.87%, Maturing August 30, 2012 | | | 9,115,771 | | |
| Cinemark, Inc. | | | |
| | 10,650,000 | | | | | Term Loan, 7.38%, Maturing October 5, 2013 | | | 10,702,515 | | |
| Deluxe Entertainment Services | | | |
| | 2,634,167 | | | | | Term Loan, 8.37%, Maturing January 28, 2011 | | | 2,726,363 | | |
| Fender Musical Instruments Co. | | | |
| | 374,243 | | | | | Term Loan, 8.13%, Maturing March 30, 2012 | | | 376,582 | | |
| HEI Acquisition, LLC | | | |
| | 1,875,000 | | | | | Term Loan, 8.38%, Maturing December 31, 2011 | | | 1,873,828 | | |
| Metro-Goldwyn-Mayer Holdings, Inc. | | | |
| | 20,320,369 | | | | | Term Loan, 8.62%, Maturing April 8, 2012 | | | 20,101,742 | | |
| Regal Cinemas Corp. | | | |
| | 11,750,000 | | | | | Term Loan, 7.12%, Maturing October 27, 2013 | | | 11,709,615 | | |
| Six Flags Theme Parks, Inc. | | | |
| | 8,575,000 | | | | | Revolving Loan, 8.57%,
Maturing June 30, 2008(2) | | | 8,530,341 | | |
| | 6,800,163 | | | | | Term Loan, 8.62%, Maturing June 30, 2009 | | | 6,887,824 | | |
| Southwest Sports Group, LLC | | | |
| | 3,725,000 | | | | | Term Loan, 7.88%, Maturing December 22, 2010 | | | 3,726,166 | | |
| Universal City Development Partners, Ltd. | | | |
| | 6,256,073 | | | | | Term Loan, 7.38%, Maturing June 9, 2011 | | | 6,283,443 | | |
| WMG Acquisition Corp. | | | |
| | 2,850,000 |
| |
| | Revolving Loan, 0.00%,
Maturing February 28, 2010(2) | | |
2,773,050 | | |
| | 20,379,175 | | | | | Term Loan, 7.37%, Maturing February 28, 2011 | | | 20,473,428 | | |
| | | $ | 132,895,219 | | |
| Lodging and Casinos - 3.9% | | | |
| Ameristar Casinos, Inc. | | | |
| $ | 3,597,813 | | | | | Term Loan, 6.82%, Maturing November 10, 2012 | | $ | 3,600,511 | | |
| Bally Technologies, Inc. | | | |
| | 8,558,267 | | | | | Term Loan, 9.33%, Maturing September 4, 2009 | | | 8,579,663 | | |
| Boyd Gaming Corp. | | | |
| | 8,860,735 | | | | | Term Loan, 6.87%, Maturing June 30, 2011 | | | 8,871,669 | | |
| CCM Merger, Inc. | | | |
| | 2,873,588 | | | | | Term Loan, 7.37%, Maturing April 25, 2012 | | | 2,873,947 | | |
| Choctaw Resort Development Enterprise | | | |
| | 1,368,209 | | | | | Term Loan, 7.12%, Maturing November 4, 2011 | | | 1,369,919 | | |
| Columbia Entertainment Co. | | | |
| | 2,015,357 | | | | | Term Loan, 9.75%, Maturing October 24, 2011 | | | 2,025,434 | | |
Principal
Amount | | Borrower/Tranche Description | | Value | |
| Lodging and Casinos (continued) | | | |
| Fairmont Hotels and Resorts, Inc. | | | |
| $ | 2,454,091 | | | | | Term Loan, 8.57%, Maturing May 12, 2011 | | $ | 2,475,565 | | |
| Gala Electric Casinos, Ltd. | | | |
| | 4,750,000 | | | GBP | | Term Loan, 7.65%, Maturing December 12, 2013 | | | 9,435,409 | | |
| | 4,750,000 | | | GBP | | Term Loan, 8.15%, Maturing December 12, 2014 | | | 9,474,913 | | |
| Green Valley Ranch Gaming, LLC | | | |
| | 975,131 | | | | | Term Loan, 7.37%, Maturing December 24, 2010 | | | 974,979 | | |
| Herbst Gaming, Inc. | | | |
| | 1,344,525 | | | | | Term Loan, 7.37%, Maturing January 31, 2011 | | | 1,346,206 | | |
| Isle of Capri Casinos, Inc. | | | |
| | 7,596,875 | | | | | Term Loan, 7.18%, Maturing February 4, 2012 | | | 7,621,565 | | |
| Penn National Gaming, Inc. | | | |
| | 23,298,000 | | | | | Term Loan, 7.13%, Maturing October 3, 2012 | | | 23,433,431 | | |
| Pinnacle Entertainment, Inc. | | | |
| | 2,025,000 | | | | | Term Loan, 7.32%, Maturing December 14, 2011 | | | 2,033,606 | | |
| Trump Entertainment Resorts Holdings, L.P. | | | |
| | 2,530,469 | | | | | Term Loan, 0.00%, Maturing May 20, 2012(2) | | | 2,549,053 | | |
| | 2,530,469 | | | | | Term Loan, 8.03%, Maturing May 20, 2012 | | | 2,549,053 | | |
| Venetian Casino Resort, LLC | | | |
| | 8,053,847 | | | | | Term Loan, 7.12%, Maturing June 15, 2011 | | | 8,090,629 | | |
| | 2,691,514 | | | | | Term Loan, 7.12%, Maturing June 15, 2011 | | | 2,703,807 | | |
| VML US Finance, LLC | | | |
| | 1,400,000 | | | | | Term Loan, 0.00%, Maturing May 25, 2012(2) | | | 1,400,984 | | |
| | 2,800,000 | | | | | Term Loan, 8.12%, Maturing May 25, 2013 | | | 2,818,900 | | |
| | | $ | 104,229,243 | | |
| Nonferrous Metals / Minerals - 2.1% | | | |
| Almatis Holdings 5 BV | | | |
| $ | 1,050,000 | | | | | Term Loan, 8.12%, Maturing December 21, 2013 | | $ | 1,063,207 | | |
| | 1,050,000 | | | | | Term Loan, 8.62%, Maturing December 21, 2014 | | | 1,067,964 | | |
| Alpha Natural Resources, LLC | | | |
| | 2,903,062 | | | | | Term Loan, 7.12%, Maturing October 26, 2012 | | | 2,908,053 | | |
| Carmeuse Lime, Inc. | | | |
| | 2,058,777 | | | | | Term Loan, 7.19%, Maturing May 2, 2011 | | | 2,058,777 | | |
| CII Carbon, LLC | | | |
| | 1,802,188 | | | | | Term Loan, 7.44%, Maturing August 23, 2012 | | | 1,806,693 | | |
| Magnum Coal Co. | | | |
| | 602,273 | | | | | Term Loan, 8.57%, Maturing March 21, 2013 | | | 604,531 | | |
| | 5,992,614 | | | | | Term Loan, 8.62%, Maturing March 21, 2013 | | | 6,015,086 | | |
| Murray Energy Corp. | | | |
| | 1,552,350 | | | | | Term Loan, 8.37%, Maturing January 28, 2010 | | | 1,567,874 | | |
| Novelis, Inc. | | | |
| | 2,822,783 | | | | | Term Loan, 7.62%, Maturing January 9, 2012 | | | 2,832,928 | | |
| | 4,902,586 | | | | | Term Loan, 7.62%, Maturing January 9, 2012 | | | 4,920,206 | | |
See notes to financial statements
21
Senior Debt Portfolio as of November 30, 2006
PORTFOLIO OF INVESTMENTS CONT'D
Principal
Amount | | Borrower/Tranche Description | | Value | |
| Nonferrous Metals / Minerals (continued) | | | |
| Severstal North America, Inc. | | | |
| $ | 13,000,000 | | | | | Revolving Loan, 0.00%, Maturing April 7, 2007(2) | | $ | 12,935,000 | | |
| Stillwater Mining Co. | | | |
| | 1,320,000 | | | | | Revolving Loan, 5.32%, Maturing July 3, 2009(2) | | | 1,341,450 | | |
| | 4,382,740 | | | | | Term Loan, 7.57%, Maturing July 30, 2010 | | | 4,393,697 | | |
| Thompson Creek Metals Company | | | |
| | 3,300,000 | | | | | Term Loan, 10.13%, Maturing October 26, 2012 | | | 3,341,250 | | |
| Tube City IMS Corp. | | | |
| | 8,464,884 | | | | | Term Loan, 8.12%, Maturing December 31, 2010 | | | 8,470,174 | | |
| | | $ | 55,326,890 | | |
| Oil and Gas - 2.3% | | | |
| Cavallo Energy L.P. | | | |
| $ | 9,406,250 | | | | | Revolving Loan, 6.81%,
Maturing October 5, 2010(2) | | $ | 9,394,492 | | |
| | 895,833 | | | | | Term Loan, 8.32%, Maturing December 5, 2010 | | | 895,273 | | |
| Coffeyville Resources, LLC | | | |
| | 800,000 | | | | | Term Loan, 5.27%, Maturing July 8, 2011 | | | 804,200 | | |
| | 1,185,075 | | | | | Term Loan, 7.63%, Maturing July 8, 2012 | | | 1,191,296 | | |
| Concho Resources, Inc. | | | |
| | 6,558,563 | | | | | Term Loan, 9.37%, Maturing July 6, 2011(4) | | | 6,514,620 | | |
| El Paso Corp. | | | |
| | 4,150,000 | | | | | Term Loan, 5.33%, Maturing July 31, 2011 | | | 4,176,909 | | |
| Epco Holdings, Inc. | | | |
| | 2,333,334 | | | | | Revolving Loan, 7.07%, Maturing August 18, 2008(2) | | | 2,304,167 | | |
| | 4,042,102 | | | | | Term Loan, 7.13%, Maturing August 18, 2008 | | | 4,053,472 | | |
| | 865,950 | | | | | Term Loan, 7.37%, Maturing August 18, 2010 | | | 870,821 | | |
| Key Energy Services, Inc. | | | |
| | 4,133,762 | | | | | Term Loan, 7.84%, Maturing June 30, 2012 | | | 4,149,264 | | |
| Niska Gas Storage | | | |
| | 547,273 | | | | | Term Loan, 7.07%, Maturing May 12, 2013 | | | 547,786 | | |
| | 781,818 | | | | | Term Loan, 7.14%, Maturing May 13, 2011 | | | 782,552 | | |
| | 816,805 | | | | | Term Loan, 7.16%, Maturing May 12, 2013 | | | 816,805 | | |
| | 4,279,477 | | | | | Term Loan, 7.17%, Maturing May 12, 2013 | | | 4,279,477 | | |
| Petroleum Geo-Services ASA | | | |
| | 931,547 | | | | | Term Loan, 7.61%, Maturing December 16, 2012 | | | 937,253 | | |
| Primary Natural Resources, Inc. | | | |
| | 1,990,000 | | | | | Term Loan, 9.35%, Maturing July 28, 2010(4) | | | 1,976,667 | | |
| Targa Resources, Inc. | | | |
| | 5,700,000 | | | | | Term Loan, 7.62%, Maturing October 31, 2007 | | | 5,706,680 | | |
| | 1,225,740 | | | | | Term Loan, 7.49%, Maturing October 31, 2012 | | | 1,231,103 | | |
| | 7,570,785 | | | | | Term Loan, 7.62%, Maturing October 31, 2012 | | | 7,603,908 | | |
| W&T Offshore, Inc. | | | |
| | 1,800,000 | | | | | Term Loan, 7.57%, Maturing May 26, 2010 | | | 1,810,499 | | |
| | | $ | 60,047,244 | | |
Principal
Amount | | Borrower/Tranche Description | | Value | |
| Publishing - 5.4% | | | |
| American Media Operations, Inc. | | | |
| $ | 12,000,000 | | | | | Term Loan, 8.37%, Maturing January 31, 2013 | | $ | 12,066,252 | | |
| Black Press US Partnership | | | |
| | 668,879 | | | | | Term Loan, 7.37%, Maturing August 2, 2013 | | | 673,896 | | |
| | 1,101,683 | | | | | Term Loan, 7.37%, Maturing August 2, 2013 | | | 1,109,946 | | |
| CBD Media, LLC | | | |
| | 2,431,863 | | | | | Term Loan, 7.70%, Maturing December 31, 2009 | | | 2,451,116 | | |
| Dex Media East, LLC | | | |
| | 4,762,782 | | | | | Term Loan, 6.88%, Maturing May 8, 2009 | | | 4,754,933 | | |
| Dex Media West, LLC | | | |
| | 8,470,293 | | | | | Term Loan, 6.88%, Maturing March 9, 2010 | | | 8,450,083 | | |
| Gatehouse Media Operating, Inc. | | | |
| | 5,212,895 | | | | | Term Loan, 7.57%, Maturing June 6, 2013 | | | 5,224,843 | | |
| Hanley-Wood, LLC | | | |
| | 467,656 | | | | | Term Loan, 7.57%, Maturing August 1, 2012 | | | 468,045 | | |
| | 3,915,335 | | | | | Term Loan, 7.60%, Maturing August 1, 2012 | | | 3,918,597 | | |
| Idearc, Inc. | | | |
| | 18,875,000 | | | | | Term Loan, 7.32%, Maturing November 17, 2014 | | | 18,982,361 | | |
| Medianews Group, Inc. | | | |
| | 3,017,438 | | | | | Term Loan, 7.07%, Maturing August 2, 2013 | | | 3,021,209 | | |
| Merrill Communications, LLC | | | |
| | 5,709,920 | | | | | Term Loan, 7.59%, Maturing May 15, 2011 | | | 5,731,332 | | |
| Nebraska Book Co., Inc. | | | |
| | 4,008,858 | | | | | Term Loan, 7.88%, Maturing March 4, 2011 | | | 4,026,396 | | |
| Newspaper Holdings, Inc. | | | |
| | 7,650,000 | | | | | Term Loan, 6.94%, Maturing August 24, 2012 | | | 7,616,531 | | |
| Philadelphia Newspapers, LLC | | | |
| | 2,294,250 | | | | | Term Loan, 8.12%, Maturing June 29, 2013 | | | 2,265,572 | | |
| R.H. Donnelley Corp. | | | |
| | 248,860 | | | | | Term Loan, 6.62%, Maturing December 31, 2009 | | | 247,371 | | |
| | 10,298,393 | | | | | Term Loan, 6.88%, Maturing June 30, 2011 | | | 10,269,784 | | |
| Seat Pagine Gialle Spa | | | |
| | 6,003,010 | | | EUR | | Term Loan, 5.88%, Maturing May 25, 2012 | | | 8,032,884 | | |
| Source Media, Inc. | | | |
| | 2,251,943 | | | | | Term Loan, 7.61%, Maturing November 8, 2011 | | | 2,263,203 | | |
| SP Newsprint Co. | | | |
| | 4,511,111 | | | | | Term Loan, 5.32%, Maturing January 9, 2010 | | | 4,533,667 | | |
| | 340,278 | | | | | Term Loan, 7.92%, Maturing January 9, 2010 | | | 341,979 | | |
| Springer Science+Business Media | | | |
| | 972,973 | | | | | Term Loan, 7.99%, Maturing May 5, 2011 | | | 979,586 | | |
| | 1,054,054 | | | | | Term Loan, 8.37%, Maturing May 5, 2012 | | | 1,066,818 | | |
| | 972,973 | | | | | Term Loan, 8.37%, Maturing May 5, 2012 | | | 984,603 | | |
| Sun Media Corp. | | | |
| | 5,164,185 | | | | | Term Loan, 7.13%, Maturing February 7, 2009 | | | 5,176,021 | | |
See notes to financial statements
22
Senior Debt Portfolio as of November 30, 2006
PORTFOLIO OF INVESTMENTS CONT'D
Principal
Amount | | Borrower/Tranche Description | | Value | |
| Publishing (continued) | | | |
| World Directories ACQI Corp. | | | |
| $ | 2,000,000 | | | EUR | | Term Loan, 6.38%, Maturing November 29, 2012 | | $ | 2,677,847 | | |
| Xsys US, Inc. | | | |
| | 3,795,776 | | | | | Term Loan, 7.87%, Maturing September 27, 2013 | | | 3,820,688 | | |
| | 3,877,093 | | | | | Term Loan, 8.37%, Maturing September 27, 2014 | | | 3,921,923 | | |
| Xsys, Inc. | | | |
| | 1,546,742 | | | EUR | | Term Loan, 6.56%, Maturing September 27, 2014 | | | 2,073,991 | | |
| | 1,290,100 | | | | | Term Loan, 10.09%, Maturing September 27, 2015 | | | 1,308,645 | | |
| YBR Acquisition BV | | | |
| | 750,000 | | | EUR | | Term Loan, 5.74%, Maturing July 29, 2013 | | | 1,008,951 | | |
| | 2,500,000 | | | EUR | | Term Loan, 5.78%, Maturing July 29, 2013 | | | 3,363,169 | | |
| | 750,000 | | | EUR | | Term Loan, 6.24%, Maturing July 29, 2014 | | | 1,012,878 | | |
| | 2,500,000 | | | EUR | | Term Loan, 6.24%, Maturing July 29, 2014 | | | 3,376,259 | | |
| Yell Group, PLC | | | |
| | 3,850,000 | | | | | Term Loan, 7.32%, Maturing February 10, 2013 | | | 3,871,121 | | |
| | | $ | 141,092,500 | | |
| Radio and Television - 4.5% | | | |
| Adams Outdoor Advertising, L.P. | | | |
| $ | 1,936,980 | | | | | Term Loan, 7.13%, Maturing Novermber 18, 2012 | | $ | 1,941,521 | | |
| ALM Media Holdings, Inc. | | | |
| | 4,149,580 | | | | | Term Loan, 7.87%, Maturing March 4, 2010 | | | 4,153,473 | | |
| Block Communications | | | |
| | 1,833,634 | | | | | Term Loan, 7.37%, Maturing December 22, 2011 | | | 1,839,364 | | |
| Cequel Communications, LLC | | | |
| | 16,250,000 | | | | | Term Loan, 7.62%, Maturing November 5, 2013 | | | 16,228,420 | | |
| CMP Susquehanna Corp. | | | |
| | 4,294,714 | | | | | Term Loan, 7.43%, Maturing May 5, 2013 | | | 4,310,819 | | |
| Cumulus Media, Inc. | | | |
| | 1,995,000 | | | | | Term Loan, 7.45%, Maturing June 7, 2013 | | | 2,003,229 | | |
| DirecTV Holdings, LLC | | | |
| | 3,764,274 | | | | | Term Loan, 6.82%, Maturing April 13, 2013 | | | 3,770,797 | | |
| Emmis Operating Company | | | |
| | 2,350,000 | | | | | Term Loan, 7.32%, Maturing November 2, 2013 | | | 2,363,639 | | |
| Gray Television, Inc. | | | |
| | 3,970,000 | | | | | Term Loan, 6.88%, Maturing November 22, 2012 | | | 3,967,872 | | |
| Intelsat Subsuduary Holding Co. | | | |
| | 3,000,000 | | | | | Term Loan, 7.62%, Maturing July 3, 2013 | | | 3,024,375 | | |
| LBI Media, Inc. | | | |
| | 1,990,000 | | | | | Term Loan, 6.86%, Maturing March 31, 2012 | | | 1,970,100 | | |
| NEP Supershooters, L.P. | | | |
| | 1,689,857 | | | | | Term Loan, 8.87%, Maturing February 3, 2011 | | | 1,708,341 | | |
| | 2,833,126 | | | | | Term Loan, 9.37%, Maturing February 3, 2011 | | | 2,866,770 | | |
Principal
Amount | | Borrower/Tranche Description | | Value | |
| Radio and Television (continued) | | | |
| Nexstar Broadcasting, Inc. | | | |
| $ | 4,595,624 | | | | | Term Loan, 7.12%, Maturing October 1, 2012 | | $ | 4,587,007 | | |
| | 4,355,564 | | | | | Term Loan, 7.12%, Maturing October 1, 2012 | | | 4,347,397 | | |
| NextMedia Operating, Inc. | | | |
| | 959,548 | | | | | Term Loan, 7.32%, Maturing November 15, 2012 | | | 958,228 | | |
| | 426,462 | | | | | Term Loan, 7.32%, Maturing November 15, 2012 | | | 425,875 | | |
| P7S1 Holding II S.A.R.L. | | | |
| | 8,000,000 | | | EUR | | Term Loan, 7.38%, Maturing July 18, 2011 | | | 10,638,642 | | |
| PanAmSat Corp. | | | |
| | 7,525,000 | | | | | Term Loan, 7.87%, Maturing January 3, 2014 | | | 7,604,434 | | |
| Patriot Media and Communications CNJ, Inc. | | | |
| | 483,333 | | | | | Term Loan, 7.37%, Maturing February 6, 2013 | | | 486,656 | | |
| Paxson Communications Corp. | | | |
| | 8,300,000 | | | | | Term Loan, 8.62%, Maturing January 15, 2012 | | | 8,450,438 | | |
| Raycom TV Broadcasting, LLC | | | |
| | 9,128,346 | | | | | Term Loan, 6.88%, Maturing August 28, 2013 | | | 9,076,999 | | |
| Live Nation | | | |
| | 4,664,750 | | | | | Term Loan, 7.62%, Maturing June 21, 2013 | | | 4,666,499 | | |
| Spanish Broadcasting System | | | |
| | 6,254,750 | | | | | Term Loan, 7.12%, Maturing June 10, 2012 | | | 6,252,142 | | |
| TDF SA | | | |
| | 3,500,000 | | | EUR | | Term Loan, 5.54%, Maturing March 11, 2013 | | | 4,661,040 | | |
| | 2,500,000 | | | EUR | | Term Loan, 6.42%, Maturing March 11, 2014 | | | 3,338,918 | | |
| Young Broadcasting, Inc. | | | |
| | 3,589,563 | | | | | Term Loan, 7.94%, Maturing November 3, 2012 | | | 3,586,759 | | |
| | | $ | 119,229,754 | | |
| Rail Industries - 0.6% | | | |
| Kansas City Southern Railway Co. | | | |
| $ | 6,284,250 | | | | | Term Loan, 7.11%, Maturing April 26, 2013 | | $ | 6,294,726 | | |
| Railamerica, Inc. | | | |
| | 8,374,773 | | | | | Term Loan, 7.38%, Maturing September 29, 2011 | | | 8,400,944 | | |
| | 990,038 | | | | | Term Loan, 7.38%, Maturing September 29, 2011 | | | 993,132 | | |
| | | $ | 15,688,802 | | |
| Retailers (Except Food and Drug) - 3.0% | | | |
| Advantage Sales & Marketing, Inc. | | | |
| $ | 2,711,375 | | | | | Term Loan, 7.43%, Maturing March 29, 2013 | | $ | 2,702,338 | | |
| American Achievement Corp. | | | |
| | 1,486,937 | | | | | Term Loan, 7.68%, Maturing March 25, 2011 | | | 1,498,089 | | |
| Amscan Holdings, Inc. | | | |
| | 4,477,500 | | | | | Term Loan, 8.39%, Maturing December 23, 2012 | | | 4,514,578 | | |
| Coinmach Laundry Corp. | | | |
| | 11,564,895 | | | | | Term Loan, 7.88%, Maturing December 19, 2012 | | | 11,676,207 | | |
See notes to financial statements
23
Senior Debt Portfolio as of November 30, 2006
PORTFOLIO OF INVESTMENTS CONT'D
Principal
Amount | | Borrower/Tranche Description | | Value | |
| Retailers (Except Food and Drug) (continued) | | | |
| Cumberland Farms, Inc. | | | |
| $ | 4,250,000 | | | | | Term Loan, 7.37%, Maturing September 29, 2013 | | $ | 4,271,250 | | |
| Harbor Freight Tools USA, Inc. | | | |
| | 5,923,263 | | | | | Term Loan, 7.12%, Maturing July 15, 2010 | | | 5,921,042 | | |
| Home Interiors & Gifts, Inc. | | | |
| | 2,766,261 | | | | | Term Loan, 10.39%, Maturing March 31, 2011 | | | 1,984,792 | | |
| Vigant Corp. | | | |
| | 8,812,126 | | | | | Term Loan, 7.37%, Maturing December 21, 2011 | | | 8,862,611 | | |
| Mapco Express, Inc. | | | |
| | 1,934,852 | | | | | Term Loan, 8.07%, Maturing April 28, 2011 | | | 1,946,945 | | |
| Mauser Werke GMBH & Co. KG | | | |
| | 3,825,000 | | | | | Term Loan, 8.10%, Maturing December 3, 2011 | | | 3,848,906 | | |
| Movie Gallery, Inc. | | | |
| | 1,247,628 | | | | | Term Loan, 10.62%, Maturing April 27, 2011 | | | 1,202,098 | | |
| Neiman Marcus Group, Inc. | | | |
| | 3,109,177 | | | | | Term Loan, 7.64%, Maturing April 5, 2013 | | | 3,133,833 | | |
| Oriental Trading Co., Inc. | | | |
| | 1,000,000 | | | | | Term Loan, 11.47%, Maturing January 31, 2014 | | | 1,001,250 | | |
| | 4,887,750 | | | | | Term Loan, 8.17%, Maturing July 31, 2013 | | | 4,907,609 | | |
| Rent-A-Center, Inc. | | | |
| | 3,275,000 | | | | | Term Loan, 7.11%, Maturing June 30, 2012 | | | 3,281,652 | | |
| Savers, Inc. | | | |
| | 1,050,761 | | | | | Term Loan, 8.09%, Maturing August 11, 2012 | | | 1,057,985 | | |
| | 1,249,239 | | | | | Term Loan, 8.09%, Maturing August 11, 2012 | | | 1,257,827 | | |
| Shopko Stores, Inc. | | | |
| | 5,448,000 | | | | | Revolving Loan, 6.83%,
Maturing December 28, 2010(2) | | | 5,430,975 | | |
| Stewart Enterprises, Inc. | | | |
| | 924,549 | | | | | Term Loan, 7.23%, Maturing November 19, 2011 | | | 925,704 | | |
| Travelcenters of America, Inc. | | | |
| | 10,788,475 | | | | | Term Loan, 7.11%, Maturing December 1, 2011 | | | 10,796,901 | | |
| | | $ | 80,222,592 | | |
| Steel - 0.1% | | | |
| Gibraltar Industries, Inc. | | | |
| $ | 1,541,788 | | | | | Term Loan, 7.13%, Maturing December 8, 2010 | | $ | 1,540,824 | | |
| | | $ | 1,540,824 | | |
| Surface Transport - 0.3% | | | |
| Horizon Lines, LLC | | | |
| $ | 1,397,825 | | | | | Term Loan, 7.62%, Maturing July 7, 2011 | | $ | 1,403,504 | | |
| Ozburn-Hessey Holding Co., LLC | | | |
| | 1,318,516 | | | | | Term Loan, 8.78%, Maturing August 9, 2012 | | | 1,320,164 | | |
Principal
Amount | | Borrower/Tranche Description | | Value | |
| Surface Transport (continued) | | | |
| Sirva Worldwide, Inc. | | | |
| $ | 5,773,048 | | | | | Term Loan, 11.61%,
Maturing December 1, 2010 | | $ | 5,332,853 | | |
| | | $ | 8,056,521 | | |
| Telecommunications - 3.4% | | | |
| Alaska Communications Systems Holdings, Inc. | | | |
| $ | 6,600,000 | | | | | Term Loan, 7.12%, Maturing February 1, 2012 | | $ | 6,601,373 | | |
| Asurion Corp. | | | |
| | 2,771,463 | | | | | Term Loan, 8.32%, Maturing July 13, 2012 | | | 2,784,456 | | |
| BCM Luxembourg, Ltd. | | | |
| | 1,500,000 | | | EUR | | Term Loan, 5.93%, Maturing September 30, 2014 | | | 1,988,512 | | |
| | 1,500,000 | | | EUR | | Term Loan, 6.31%, Maturing September 30, 2015 | | | 2,005,950 | | |
| Cellular South, Inc. | | | |
| | 1,955,000 | | | | | Term Loan, 7.14%, Maturing May 4, 2011 | | | 1,956,834 | | |
| Centennial Cellular Operating Co., LLC | | | |
| | 9,175,000 | | | | | Term Loan, 7.62%, Maturing February 9, 2011 | | | 9,253,373 | | |
| Cincinnati Bell, Inc. | | | |
| | 2,202,750 | | | | | Term Loan, 6.93%, Maturing August 31, 2012 | | | 2,202,063 | | |
| Consolidated Communications, Inc. | | | |
| | 9,887,497 | | | | | Term Loan, 7.37%, Maturing July 27, 2015 | | | 9,899,856 | | |
| Fairpoint Communications, Inc. | | | |
| | 8,075,000 | | | | | Term Loan, 7.13%, Maturing February 8, 2012 | | | 8,058,600 | | |
| Hawaiian Telcom Communications, Inc. | | | |
| | 2,658,133 | | | | | Term Loan, 7.62%, Maturing October 31, 2012 | | | 2,660,717 | | |
| Iowa Telecommunications Services | | | |
| | 3,234,000 | | | | | Term Loan, 7.12%, Maturing November 23, 2011 | | | 3,239,197 | | |
| Madison River Capital, LLC | | | |
| | 1,837,333 | | | | | Term Loan, 7.62%, Maturing July 29, 2012 | | | 1,844,510 | | |
| NTelos, Inc. | | | |
| | 5,335,102 | | | | | Term Loan, 7.57%, Maturing August 24, 2011 | | | 5,355,108 | | |
| Stratos Global Corp. | | | |
| | 3,425,000 | | | | | Term Loan, 8.11%, Maturing February 13, 2012 | | | 3,430,709 | | |
| Syniverse Holdings, Inc. | | | |
| | 1,931,262 | | | | | Term Loan, 7.12%, Maturing February 15, 2012 | | | 1,936,090 | | |
| Triton PCS, Inc. | | | |
| | 5,472,525 | | | | | Term Loan, 8.57%, Maturing November 18, 2009 | | | 5,522,692 | | |
| Westcom Corp. | | | |
| | 2,557,555 | | | | | Term Loan, 8.29%, Maturing December 17, 2010 | | | 2,560,752 | | |
| Windstream Corp. | | | |
| | 13,050,000 | | | | | Term Loan, 7.12%, Maturing July 17, 2013 | | | 13,138,557 | | |
See notes to financial statements
24
Senior Debt Portfolio as of November 30, 2006
PORTFOLIO OF INVESTMENTS CONT'D
Principal
Amount | | Borrower/Tranche Description | | Value | |
| Telecommunications (continued) | | | |
| Winstar Communications, Inc. | | | |
| $ | 3,852,804 | | | EUR | | DIP Loan, 0.00%,
Maturing December 31, 2006(5) | | $ | 5,365,030 | | |
| | | $ | 89,804,379 | | |
| Utilities - 2.2% | | | |
| Astoria Generating Co. | | | |
| $ | 310,914 | | | | | Term Loan, 7.32%, Maturing February 23, 2012 | | $ | 312,987 | | |
| | 1,573,390 | | | | | Term Loan, 7.39%, Maturing February 23, 2013 | | | 1,583,880 | | |
| BRSP, LLC | | | |
| | 5,775,000 | | | | | Term Loan, 8.37%, Maturing July 13, 2009 | | | 5,803,875 | | |
| Calpine Corp. | | | |
| | 3,331,383 | | | | | DIP Revolving Loan, 0.00%,
Maturing February 27, 2008(2) | | | 3,316,808 | | |
| | 1,288,298 | | | | | DIP Loan, 7.62%, Maturing February 27, 2008 | | | 1,296,672 | | |
| | 3,271,809 | | | | | DIP Loan, 9.37%, Maturing February 27, 2008 | | | 3,331,791 | | |
| Cellnet Technology, Inc. | | | |
| | 1,989,864 | | | | | Term Loan, 8.37%, Maturing April 26, 2012 | | | 2,007,275 | | |
| Cogentrix Delaware Holdings, Inc. | | | |
| | 2,336,111 | | | | | Term Loan, 6.87%, Maturing April 14, 2012 | | | 2,340,492 | | |
| Covanta Energy Corp. | | | |
| | 3,460,163 | | | | | Term Loan, 5.37%, Maturing June 24, 2012 | | | 3,487,557 | | |
| | 2,473,359 | | | | | Term Loan, 7.62%, Maturing June 24, 2012 | | | 2,492,941 | | |
| LSP General Finance Co., LLC | | | |
| | 117,259 | | | | | Term Loan, 7.12%, Maturing May 6, 2013 | | | 117,601 | | |
| | 2,757,058 | | | | | Term Loan, 7.12%, Maturing May 6, 2013 | | | 2,765,100 | | |
| Mirant North America, LLC. | | | |
| | 3,523,375 | | | | | Term Loan, 7.07%, Maturing January 3, 2013 | | | 3,521,486 | | |
| NRG Energy, Inc. | | | |
| | 3,071,685 | | | | | Term Loan, 7.37%, Maturing February 1, 2013 | | | 3,085,602 | | |
| | 15,848,674 | | | | | Term Loan, 7.37%, Maturing February 1, 2013 | | | 15,929,439 | | |
| Pike Electric, Inc. | | | |
| | 3,237,823 | | | | | Term Loan, 6.88%, Maturing July 12, 2012 | | | 3,235,799 | | |
| Vulcan Energy Corp. | | | |
| | 4,072,323 | | | | | Term Loan, 6.87%, Maturing July 23, 2010 | | | 4,079,959 | | |
| | | $ | 58,709,264 | | |
Total Senior, Floating Rate Interests
(identified cost, $2,631,265,131) | | $ | 2,652,493,746 | | |
| Corporate Bonds & Notes - 1.3% | | | |
Principal
Amount
(000's omitted) | | Security | | Value | |
| Automotive - 0.1% | | | |
| Key Plastics, LLC | | | |
| $ | 1,691 | | | | | 7.00%, 4/26/07(4) | | $ | 1,691,136 | | |
| | 1,210 | | | | | 18.32%, 4/26/07(4) | | | 1,219,297 | | |
| | | $ | 2,910,433 | | |
| Building and Development - 0.2% | | | |
| Assemblies of God Financial Real Estate, Series 2004-1A, Class A, Variable Rate | | | |
| $ | 5,630 | | | | | 7.524%, 6/15/29(6) | | $ | 5,630,178 | | |
| | | $ | 5,630,178 | | |
| Cable and Satellite Television - 0.3% | | | |
| Iesy Hessen & ISH NRW, Variable Rate | | | |
| $ | 7,000 | | | EUR | | 6.429%, 4/15/13 | | $ | 9,197,660 | | |
| | | $ | 9,197,660 | | |
| Electronic / Electric - 0.1% | | | |
| NXP BV/ NXP Funding LLC, Variable Rate | | | |
| $ | 2,300 | | | | | 8.118%, 10/15/13(6) | | $ | 2,346,000 | | |
| | | $ | 2,346,000 | | |
| Financial Intermediaries - 0.3% | | | |
| Carlyle High Yield Partners, Series 2004-6A, Class C, Variable Rate | | | |
| $ | 1,000 | | | | | 7.826%, 8/11/16(6) | | $ | 1,016,763 | | |
| Sonata Securities S.A., Series 2006-5 | | | |
| | 3,000 | | | | | 8.75%, 6/27/07 | | | 3,021,300 | | |
| Sonata Securities S.A., Series 2006-6 | | | |
| | 3,000 | | | | | 8.75%, 6/27/07 | | | 3,020,730 | | |
| | | $ | 7,058,793 | | |
| Telecommunications - 0.3% | | | |
| Qwest Corp., Sr. Notes, Variable Rate | | | |
| $ | 3,150 | | | | | 8.64%, 6/15/13 | | $ | 3,429,563 | | |
| Rogers Wireless, Inc., Variable Rate | | | |
| | 4,150 | | | | | 8.515%, 12/15/10 | | | 4,243,375 | | |
| | | $ | 7,672,938 | | |
Total Corporate Bonds & Notes
(identified cost, $33,714,984) | | $ | 34,816,002 | | |
See notes to financial statements
25
Senior Debt Portfolio as of November 30, 2006
PORTFOLIO OF INVESTMENTS CONT'D
| Common Stocks - 1.0% | | | |
| Shares | | Security | | Value | |
| | 31,622 | | | | | Citation Corp.(4)(7)(8) | | $ | 0 | | |
| | 33,278 | | | | | Environmental Systems Products
Holdings, Inc.(4)(7)(8) | | | 696,509 | | |
| | 1,782 | | | | | Gentek, Inc.(7) | | | 58,503 | | |
| | 133,410 | | | | | Hayes Lemmerz International(7) | | | 313,513 | | |
| | 441,740 | | | | | Maxim Crane Works, L.P.(7) | | | 20,485,711 | | |
| | 12,592 | | | | | RoTech Medical Corp(4)(7)(8) | | | 31,732 | | |
| | 297,015 | | | | | Safelite Glass Corp.(4)(7)(8) | | | 3,974,061 | | |
| | 20,048 | | | | | Safelite Realty Corp.(4)(8) | | | 320,167 | | |
Total Common Stocks
(identified cost, $9,361,647) | | $ | 25,880,196 | | |
| Preferred Stocks - 0.0% | | | |
| Shares | | Security | | Value | |
| | 2,496 | | | | | Citation Corp. (PIK)(4)(8) | | $ | 0 | | |
| | 445 | | | | | Hayes Lemmerz International(4)(7)(8) | | | 4,518 | | |
| | 218 | | | | | Key Plastics, LLC, Series A(4)(7)(8) | | | 120,664 | | |
Total Preferred Stocks
(identified cost, $2,237,250) | | $ | 125,182 | | |
| Warrants - 0.0% | | | |
| Shares/Rights | | Security | | Value | |
| | 1,930 | | | | | Gentek, Inc., Class B(7)(8) | | $ | 84,920 | | |
| | 940 | | | | | Gentek, Inc., Class C(7)(8) | | | 39,198 | | |
Total Warrants
(identified cost, $0) | | $ | 124,118 | | |
| Affiliated Investments - 1.0% | | | |
| Security | | Rate | | Value | |
| Investment in Cash Management Portfolio(9) | | | 4.91 | % | | $ | 27,533,252 | | |
Total Affiliated Investments
(at amortized cost, $27,533,252) | | $ | 27,533,252 | | |
Total Investments - 103.6%
(identified cost $2,704,112,264) | | $ | 2,740,972,496 | | |
Less Unfunded Loan
Commitments - (3.3)% | | $ | (87,186,032 | ) | |
Net Investments - 100.3%
(identified cost $2,616,926,232) | | $ | 2,653,786,464 | | |
| Other Assets, Less Liabilities - (0.3)% | | $ | (7,988,094 | ) | |
| Net Assets - 100.0% | | $ | 2,645,798,370 | | |
EUR - Euro
GBP - British Pound
(1) Senior floating-rate interests often require prepayments from excess cash flows or permit the borrower to repay at its election. The degree to which borrowers repay, whether as a contractual requirement or at their election, cannot be predicted with accuracy. As a result, the actual remaining maturity may be substantially less than the stated maturities shown. However, it is anticipated that the senior floating-rate interests will have an expected average life of approximately two to three years. The stated interest rate represents the weighted average interest rate of all contracts within the senior loan facility. Senior Loans typically have rates of interest which are redetermined either daily, monthly, quarterly or semi-annually by reference to a base lending rate, plus a premium. These base lending rates are primarily the London-Interbank Offered Rate ("LIBOR"), and secondarily the prime rate offered by one or more major United States banks (the "Prime Rate") and the certificate of deposit ("CD") rate or other base lending rates used by commercial lenders.
(2) Unfunded loan commitments. See Note 1E for description.
(3) Defaulted security. Currently the issuer is in default with respect to interest payments.
(4) Security valued at fair value using methods determined in good faith by or at the direction of the Trustees.
(5) Defaulted Security. The issuer is in liquidation mode subject to litigation proceeds.
(6) Security exempt from registration under Rule 144A of the Securities Act of 1933. These securities may be sold in transactions exempt from registration, normally to qualified institutional buyers. At November 30, 2006, the aggregate value of the securities is $8,992,941 or 0.3% of the Portfolio's net assets.
(7) Non-income producing security.
(8) Restricted security.
(9) Affiliated investment that holds high quality U.S. money market instruments, and that is available to Eaton Vance Portfolios and funds. The rate shown is the annualized seven-day yield as of November 30, 2006.
See notes to financial statements
26
Senior Debt Portfolio as of November 30, 2006
FINANCIAL STATEMENTS
Statement of Assets and Liabilities
As of November 30, 2006
| Assets | |
| Unaffiliated Investments, at value (identified cost, $2,589,392,980) | | $ | 2,626,253,212 | | |
| Affiliated Investments, at value (amortized cost, $27,533,252) | | | 27,533,252 | | |
| Cash | | | 5,678,184 | | |
| Foreign currency, at value (identified cost, $136,866) | | | 141,761 | | |
| Interest receivable | | | 24,183,491 | | |
| Receivable for open swap contracts | | | 464,402 | | |
| Prepaid expenses | | | 270,202 | | |
| Total assets | | $ | 2,684,524,504 | | |
| Liabilities | |
| Demand note payable | | $ | 35,000,000 | | |
| Payable for open forward foreign currency contracts | | | 2,366,480 | | |
| Payable to affiliate for investment advisory fees | | | 998,048 | | |
| Payable to affiliate for Trustees' fees | | | 5,123 | | |
| Accrued expenses | | | 356,483 | | |
| Total liabilities | | $ | 38,726,134 | | |
| Net Assets applicable to investors' interest in Portfolio | | $ | 2,645,798,370 | | |
| Sources of Net Assets | |
| Net proceeds from capital contributions and withdrawals | | $ | 2,610,716,142 | | |
| Net unrealized appreciation (computed on the basis of identified cost) | | | 35,082,228 | | |
| Total | | $ | 2,645,798,370 | | |
Statement of Operations
For the Year Ended
November 30, 2006
| Investment Income | |
| Interest | | $ | 204,096,418 | | |
| Interest income allocated from affiliated investment | | | 126,896 | | |
| Expenses allocated from affiliated investment | | | (11,145 | ) | |
| Total investment income | | $ | 204,212,169 | | |
| Expenses | |
| Investment adviser fee | | $ | 13,019,584 | | |
| Trustees' fees and expenses | | | 30,607 | | |
| Custodian fee | | | 861,582 | | |
| Legal and accounting services | | | 689,615 | | |
| Interest expense | | | 185,522 | | |
| Miscellaneous | | | 138,824 | | |
| Total expenses | | $ | 14,925,734 | | |
Deduct -
Reduction of custodian fee | | $ | 73,293 | | |
| Total expense reductions | | $ | 73,293 | | |
| Net expenses | | $ | 14,852,441 | | |
| Net investment income | | $ | 189,359,728 | | |
| Realized and Unrealized Gain (Loss) | |
Net realized gain (loss) -
Investment transactions (identified cost basis) | | $ | 6,414,298 | | |
| Swap contracts | | | 323,348 | | |
| Foreign currency and forward foreign currency exchange contract transactions | | | (19,015,173 | ) | |
| Net realized loss | | $ | (12,277,527 | ) | |
Change in unrealized appreciation (depreciation) -
Investments (identified cost basis) | | $ | 15,491,405 | | |
| Swap contracts | | | 491,264 | | |
| Foreign currency and forward foreign currency exchange contracts | | | (2,454,058 | ) | |
| Net change in unrealized appreciation (depreciation) | | $ | 13,528,611 | | |
| Net realized and unrealized gain | | $ | 1,251,084 | | |
| Net increase in net assets from operations | | $ | 190,610,812 | | |
See notes to financial statements
27
Senior Debt Portfolio as of November 30, 2006
FINANCIAL STATEMENTS CONT'D
Statements of Changes in Net Assets
Increase (Decrease)
in Net Assets | | Year Ended
November 30, 2006 | | Year Ended
November 30, 2005 | |
From operations -
Net investment income | | $ | 189,359,728 | | | $ | 162,991,740 | | |
Net realized gain (loss)
from investment transactions,
swap contracts, and foreign
currency and forward foreign currency
exchange contract transactions | | | (12,277,527 | ) | | | 1,600,761 | | |
Net change in unrealized
appreciation (depreciation)
from investments, swap contracts,
and foreign currency and forward
foreign currency exchange contracts | | | 13,528,611 | | | | 211,340 | | |
| Net increase in net assets from operations | | $ | 190,610,812 | | | $ | 164,803,841 | | |
Capital transactions -
Contributions | | $ | (794,697,437 | ) | | $ | 409,703,712 | | |
| Withdrawals | | | 195,494,844 | | | | (860,269,748 | ) | |
Net decrease in net assets from
capital transactions | | $ | (599,202,593 | ) | | $ | (450,566,036 | ) | |
| Net decrease in net assets | | $ | (408,591,781 | ) | | $ | (285,762,195 | ) | |
| Net Assets | |
| At beginning of year | | $ | 3,054,390,151 | | | $ | 3,340,152,346 | | |
| At end of year | | $ | 2,645,798,370 | | | $ | 3,054,390,151 | | |
See notes to financial statements
28
Senior Debt Portfolio as of November 30, 2006
FINANCIAL STATEMENTS CONT'D
Supplementary Data
| | | Year Ended November 30, | | Period Ended | | Year Ended | |
| | | 2006 | | 2005 | | 2004 | | 2003 | | November 30, 2002(1) | | December 31, 2001 | |
| Ratios/Supplemental Data | |
| Ratios (As a percentage of average daily net assets): | |
| Expenses before custodian fee reduction | | | 0.51 | % | | | 0.50 | % | | | 0.51 | % | | | 0.50 | % | | | 0.47 | %(2) | | | 0.47 | % | |
| Expenses after custodian fee reduction | | | 0.51 | % | | | 0.50 | % | | | 0.51 | % | | | 0.50 | % | | | 0.47 | %(2) | | | 0.47 | % | |
| Interest expense | | | 0.01 | % | | | 0.00 | %(3) | | | 0.00 | %(3) | | | 0.01 | % | | | 0.01 | %(2) | | | 0.01 | % | |
| Net investment income | | | 6.57 | % | | | 5.00 | % | | | 3.82 | % | | | 4.14 | % | | | 4.77 | %(2) | | | 7.04 | % | |
| Portfolio Turnover | | | 51 | % | | | 65 | % | | | 87 | % | | | 47 | % | | | 42 | % | | | 33 | % | |
| Total Return | | | 6.88 | % | | | 5.27 | % | | | 6.15 | % | | | 8.19 | % | | | 0.85 | % | | | 3.35 | % | |
| Net assets, end of period (000's omitted) | | $ | 2,645,798 | | | $ | 3,054,390 | | | $ | 3,340,152 | | | $ | 3,384,305 | | | $ | 4,084,930 | | | $ | 5,730,074 | | |
(1) For the eleven-month period ended November 30, 2002.
(2) Annualized.
(3) Rounds to less than 0.01%.
See notes to financial statements
29
Senior Debt Portfolio as of November 30, 2006
NOTES TO FINANCIAL STATEMENTS
1 Significant Accounting Policies
Senior Debt Portfolio (the Portfolio) is registered under the Investment Company Act of 1940 (the 1940 Act) as a closed-end investment company which was organized as a trust under the laws of the State of New York on May 1, 1992. The Declaration of Trust permits the Trustees to issue interests in the Portfolio. At November 30, 2006, the Eaton Vance Prime Rate Reserves, Eaton Vance Advisers Senior Floating-Rate Fund, EV Classic Senior Floating-Rate Fund, Eaton Vance Medallion Senior Floating-Rate Fund, and Eaton Vance Institutional Senior Floating-Rate Fund (collectively, the Funds) held approximate 48.3%, 2.4%, 40.4%, 6.8% and 2.1% interests in the Portfolio, respectively.
The following is a summary of significant accounting policies of the Portfolio. The policies are in conformity with accounting principles generally accepted in the United States of America.
A Investment Valuation - The Portfolio's valuation policies are as follows: Certain Senior Loans are deemed to be liquid because reliable market quotations are readily available for them. Liquid Senior Loans are valued on the basis of prices furnished by a pricing service. Other Senior Loans are valued at fair value by the Portfolio's investment adviser, Boston Management and Research (BMR), under procedures approved by the Trustees. In connection with determining the fair value of a Senior Loan, the investment adviser makes an assessment of the likelihood that the borrower will make a full repayment of the Senior Loan. The primary factors considered by the investment adviser when making this assessment are (i) the creditworthiness of the borrower, (ii) the value of the collateral backing the Senior Loan, and (iii) the priority of the Senior Loan versus other creditors of the borrower. If, based on its assessment, the investment adviser believes there is a reasonable likelihood that the borrower will make a full repayment of the Senior Loan, the investment adviser will determine the fair value of the Senior Loan using a matrix pricing approach that considers the yield on the Senior Loan relative to yields on other loan interests issued by companies of comparable credit quality. If, based on its assessment, the investment adviser believes there is not a reasonable likelihood that the borrower will make a full repayment of the Senior Loan, the investment adviser will determine the fair value of the Senior Loan using analyses that include, but are not limited to (i) a comparison of the value of the borrower's outstanding equity and debt to that of comparable public companies; (ii) a discounted cash flow analysis; or (iii) when the investment adviser believes it is likely that a borrower will be liquidated or sold, an analysis of the terms of such liquidation or sale. In certain cases, the investment adviser will use a combination of analytical methods to determine fair value, such as when only a portion of a borrower's assets is likely to be sold. In conducting its assessment and analyses for purposes of determining fair value of a Senior Loan, the investment adviser will use its discretion and judgment in considering and appraising such factors, data and information and the relative weight to be given thereto as it deems relevant, including without limitation, some or all of the following: (i) the fundamental characteristics of and fundamental analytical data relating to the Senior Loan, including the cost, size, current interest rate, maturity and base lending rate of the Senior Loan, the terms and conditions of the Senior Loan and any related agreements, and the position of the Senior Loan in the borrower's debt structure; (ii) the nature, adequacy and value of the collateral securing the Senior Loan, including the Portfolio's rights, remedies and interests with respect to the collateral; (iii) the creditworthiness of the borrower, based on an evaluation of, among other things, its financial condition, financial statements and information about the borrower's business, cash flows, capital structure and future prospects; (iv) information relating to the market for the Senior Loan, including price quotations for and trading in the Senior Loan and interests in similar Senior Loans and the market environment and investor attitudes towards the Senior Loan and interests in similar Senior Loans; (v) the experience, reputation, stability and financial condition of the agent and any intermediate participants in the Senior Loan; and (vi) general economic and market conditions affecting the fair value of the Senior Loan. Fair value determinations are made by the portfolio managers of a Portfolio based on information available to such managers. The portfolio managers of other funds managed by Eaton Vance that invest in Senior Loans may not possess the same information about a Senior Loan borrower as the portfolio managers of Senior Debt Portfolio. At times, the fair value of a Senior Loan determined by the portfolio managers of other funds managed by Eaton Vance that invest in Senior Loans may vary from the fair value of the same Senior Loan determined by the portfolio managers of Senior Debt Portfolio. The fair value of each Senior Loan is periodically reviewed and approved by the investment adviser's Valuation Committee and by the Portfolio's Trustees based upon procedures approved by the Trustees. Junior Loans are valued in the same manner as Senior Loans.
Debt obligations (other than short-term obligations maturing in sixty days or less), including listed securities and securities for which price quotations are available and forward contracts, will normally be valued on the basis of market valuations furnished by dealers or pricing services. Financial futures contracts listed on commodity exchanges and exchange-traded options thereon are valued at closing settlement prices. Over-the-counter options are valued at
30
Senior Debt Portfolio as of November 30, 2006
NOTES TO FINANCIAL STATEMENTS CONT'D
the mean between the bid and asked prices provided by dealers. Marketable securities listed on the NASDAQ National Market System are valued at the NASDAQ official closing price. The value of interest rate swaps will be based upon a dealer quotation. Short-term obligations and money market securities maturing in sixty days or less are valued at amortized cost which approximates value. If short-term debt securities are acquired with a remaining maturity of more than sixty days, they will be valued by a pricing service. Investments for which reliable market quotations are unavailable, and investments for which the price of the security is not believed to represent its fair market value, are valued at fair value using methods determined in good faith by or at the direction of the Trustees of the Portfolio. Occasionally, events affecting the value of foreign securities may occur between the time trading is completed abroad and the close of the Exchange which will not be reflected in the computation of the Portfolio's net asset value (unless the Portfolio deems that such event would materially affect its net asset value in which case an adjustment would be made and reflected in such computation). The Portfolio may rely on an independent fair valuation service in making any such adjustments to the value of a foreign equity security.
The Cash Management Portfolio's valuation policy is as follows: The Portfolio values investment securities utilizing the amortized cost valuation technique permitted by Rule 2a-7 of the 1940 Act. This technique involves initially valuing a portfolio's security at its cost and thereafter assuming a constant amortization to maturity of any discounts or premiums.
B Income - Interest income is recorded on the basis of interest accrued, adjusted for amortization of premium or accretion of discount. Fees associated with loan amendments are recognized immediately.
C Federal Taxes - The Portfolio has elected to be treated as a partnership for federal tax purposes. No provision is made by the Portfolio for federal or state taxes on any taxable income of the Portfolio because each investor in the Portfolio is ultimately responsible for the payment of any taxes on its share of taxable income. Since at least one of the Portfolio's investors is a regulated investment company that invests all or substantially all of its assets in the Portfolio, the Portfolio normally must satisfy the applicable source of income and diversification requirements (under the Internal Revenue Code) in order for its investors to satisfy them. The Portfolio will allocate, at least annually among its investors, each investor's distributive share of the Portfolio's net investment income, net realized capital gains, and any other items of income, gain, loss, deduction or credit.
D Interest Rate Swaps - The Portfolio may enter into interest rate swap agreements for risk management purposes and not as a speculative investment. Pursuant to these agreements the Portfolio receives quarterly payments at a rate equal to a predetermined three-month London Interbank Offering Rate (LIBOR). In exchange, the Portfolio makes semi-annual payments at a predetermined fixed rate of interest. During the term of the outstanding swap agreement, changes in the underlying value of the swap are recorded as unrealized gains and losses. The value of the swap is determined by changes in the relationship between two rates of interest. The Portfolio is exposed to credit loss in the event of non-performance by the swap counterparty. The Portfolio does not anticipate non-performance by the counterparty. Risk may also arise from the unanticipated movements in value of interest rates.
E Unfunded Loan Commitments - The Portfolio may enter into certain credit agreements all or a portion of which may be unfunded. The Portfolio is obligated to fund these commitments at the borrower's discretion. These commitments are disclosed in the accompanying Portfolio of Investments.
F Credit Default Swaps - The Portfolio may enter into credit default swap contracts for risk management purposes, including diversification. When the Portfolio is a buyer of a credit default swap contract, the Portfolio is entitled to receive the par (or other agreed-upon) value of a referenced debt obligation from the counterparty to the contract in the event of a default by a third party, such as a U.S. or foreign corporate issuer, on the debt obligation. In return, the Portfolio would pay the counterparty a periodic stream of payments over the term of the contract provided that no event of default has occurred. If no default occurs, the Portfolio would have spent the stream of payments and received no benefit from the contract. When the Portfolio is the seller of a credit default swap contract, it receives the stream of payments, but is obligated to pay upon default of the referenced debt obligations. As the seller, the Portfolio would effectively add leverage to its portfolio because, in addition to its total net assets, the Portfolio would be subject to investment exposure on the notional amount of the swap. The Portfolio will segregate assets in the form of cash and cash equivalents in an amount equal to the aggregate market value of the credit default swap of which it is the seller, marked to market on a daily basis. These transactions involve certain risks, including the risk that the seller may be unable to fulfill the transaction.
G Foreign Currency Translation - Investment valuations, other assets, and liabilities initially expressed in foreign currencies are converted each business day into
31
Senior Debt Portfolio as of November 30, 2006
NOTES TO FINANCIAL STATEMENTS CONT'D
U.S. dollars based upon current exchange rates. Purchases and sales of foreign investment securities and income and expenses are converted into U.S. dollars based upon currency exchange rates prevailing on the respective dates of such transactions. Recognized gains or losses on investment transactions attributable to changes in foreign currency exchange rates are recorded for financial statement purposes as net realized gains and losses on investments. That portion of unrealized gains and losses on investments that results from fluctuations in foreign currency exchange rates is not separately disclosed.
H Forward Foreign Currency Exchange Contracts - The Portfolio may enter into forward foreign currency exchange contracts for the purchase or sale of a specific foreign currency at a fixed price on a future date. Risks may arise upon entering these contracts from the potential inability of counterparties to meet the terms of their contracts and from movements in the value of a foreign currency relative to the U.S. dollar. The Portfolio will enter into forward contracts for hedging purposes as well as non-hedging purposes. The forward foreign currency exchange contracts are adjusted by the daily exchange rate of the underlying currency and any gains or losses are recorded for financial statement purposes as unrealized until such time as the contracts have been closed.
I Indemnifications - Under the Portfolio's organizational documents, its officers and Trustees may be indemnified against certain liabilities and expenses arising out of the performance of their duties to the Portfolio. Interestholders in the Portfolio are jointly and severally liable for the liabilities and obligations of the Portfolio in the event that the Portfolio fails to satisfy such liabilities and obligations; provided, however, that, to the extent assets are available in the Portfolio, the Portfolio may, under certain circumstances, indemnify interestholders from and against any claim or liability to which such holder may become subject by reason of being or having been an interestholder in the Portfolio. Additionally, in the normal course of business, the Portfolio enters into agreements with service providers that may contain indemnification clauses. The Portfolio's maximum exposure under these arrangements is unknown as this would involve future claims that may be made against the Portfolio that have not yet occurred.
J Use of Estimates - The preparation of the financial statements in conformity with accounting principles generally accepted in the United States of America requires management to make estimates and assumptions that affect the reported amounts of assets and liabilities at the date of the financial statements and the reported amounts of income and expense during the reporting period. Actual results could differ from those estimates.
K Expense Reduction - Investors Bank & Trust Company (IBT) serves as custodian to the Portfolio. Pursuant to the custodian agreement, IBT receives a fee reduced by credits which are determined based on the average daily cash balance the Portfolio maintains with IBT. All credit balances, used to reduce the Portfolio's custodian fees are reported as a reduction of expenses in the Statement of Operations.
L Other - Investment transactions are accounted for on the date the securities are purchased or sold. Realized gains and losses on securities sold are determined on the basis of identified cost.
2 Investment Advisory Fee and Other Transactions with Affiliates
The investment advisory fee is paid to BMR as compensation for investment advisory services rendered to the Portfolio. The fee is computed at a monthly rate of 19/240 of 1% (0.95% annually) of the Portfolio's average daily gross assets. The Trustees of the Portfolio have accepted a contractual waiver of a portion of BMR's compensation so that the aggregate advisory fees paid by the Portfolio under the advisory agreement during any fiscal year will not exceed, on an annual basis, 0.50% of average daily gross assets of the Portfolio up to and including $1 billion and at reduced rates as daily gross assets exceed that level. The advisory fee paid by the Portfolio is reduced by the Portfolio's allocable portion of the advisory fees paid by Cash Management Portfolio (CMP), an affiliated investment company managed by BMR. For the year ended November 30, 2006, the Portfolio's allocated portion of the advisory fee paid by CMP totaled $11,100. The advisory fee paid directly by the Portfolio amounted to $13,019,584. For the year ended November 30, 2006, the effective annual rate of investment advisory fees paid on a direct and an indirect basis by the Portfolio, based on average daily gross assets, was 0.45%. Except as to Trustees of the Portfolio who are not members of BMR's organization, officers and Trustees receive remuneration for their services to the Portfolio out of such investment adviser fee.
Certain officers and Trustees of the Portfolio are officers of BMR. Trustees of the Portfolio that are not affiliated with the Investment Adviser may elect to defer receipt of all or a percentage of their annual fees in accordance with the terms of the Trustees Deferred Compensation Plan. For the year ended November 30, 2006, no significant amounts have been deferred.
3 Investments
The Portfolio invests primarily in Senior Loans. The ability of the issuers of the Senior Loans to meet their obligations may be affected by economic developments in a specific industry. The cost of purchases and the proceeds from principal repayments and sales of Senior Loans for the year
32
Senior Debt Portfolio as of November 30, 2006
NOTES TO FINANCIAL STATEMENTS CONT'D
ended November 30, 2006 aggregated $1,485,809,416, $597,416,509 and $1,260,832,305, respectively.
4 Short-Term Debt and Credit Agreements
The Portfolio participates with other portfolios managed by BMR in a $500 million unsecured line of credit agreement with a group of banks to permit the Portfolio to invest in accordance with its investment practices. Interest is charged under the credit agreement at the bank's base rate or at an amount above LIBOR. Interest expense includes a commitment fee of $128,163 for the year ended November 30, 2006, which is computed at the annual rate of 0.08% of the credit agreement. The average daily loan balance for the year ended November 30, 2006, was $1,000,000 and the average interest rate was 5.74%.
5 Financial Instruments
The Portfolio may trade in financial instruments with off-balance sheet risk in the normal course of its investing activities and to assist in managing exposure to various market risks. These financial instruments include written options, financial futures contracts, forward foreign currency exchange contracts, interest rate swaps and credit
default swaps and may involve, to a varying degree, elements of risk in excess of the amounts recognized for financial statement purposes. The notional or contractual amounts of these instruments represent the investment the Portfolio has in particular classes of financial instruments and does not necessarily represent the amounts potentially subject to risk. The measurement of the risks associated with these instruments is meaningful only when all related and offsetting transactions are considered. A summary of obligations under these financial instruments at November 30, 2006 is as follows:
Forward Foreign Currency Exchange Contracts
| Sales | |
Settlement
Date | | Deliver | | In Exchange For | | Net Unrealized
Depreciation | |
| 12/29/06 | | British Pound
30,105,699 | | United States Dollar
58,656,739 | | $ | (571,173 | ) | |
| 12/29/06 | | Euro
160,710,346 | | United States Dollar
211,490,906 | | | (1,795,307 | ) | |
| | | | | $ | (2,366,480 | ) | |
The Portfolio had the following swap agreements outstanding at November 30, 2006:
Credit Default Swaps
Notional
Amount | | Expiration
Date | | Description | | Net Unrealized
Appreciation
(Depreciation) | |
2,000,000 USD
| | 3/20/2011
| | Agreement with Lehman Brothers dated 3/2/2005 whereby the Portfolio will receive 1.85% per year times the notional
amount. The Portfolio makes a payment of the notional amount only upon a default event on the reference entity, a Revolving
Credit Agreement issued by Syniverse Technologies, Inc. | | $ | 15,990 | | |
3,000,000 USD
| | 3/20/2010
| | Agreement with Lehman Brothers dated 3/15/2005 whereby the Portfolio will receive 2.20% per year times the notional
amount. The Portfolio makes a payment of the notional amount only upon a default event on the reference entity, a Revolving
Credit Agreement issued by Inergy, L.P. | | | 100,657 | | |
2,000,000 USD
| | 6/20/2010
| | Agreement with Lehman Brothers dated 5/18/2005 whereby the Portfolio will receive 3.25% per year times the notional
amount. The Portfolio makes a payment of the notional amount only upon a default event on the reference entity, a Revolving
Credit Agreement issued by Rural Cellular Corp. | | | 123,692 | | |
3,000,000 USD
| | 9/21/2009
| | Agreement with Lehman Brothers dated 7/8/2005 whereby the Portfolio will receive 2.15% per year times the notional
amount. The Portfolio makes a payment of the notional amount only upon a default event on the reference entity, a Revolving
Credit Agreement issued by CSG Systems, Inc. | | | 49,401 | | |
4,000,000 USD
| | 3/20/2012
| | Agreement with Lehman Brothers dated 2/8/2006 whereby the Portfolio will receive 2.40% per year times the notional
amount. The Portfolio makes a payment of the notional amount only upon a default event on the reference entity, a Revolving
Credit Agreement issued by Avago Technologies, Inc. | | | 174,662 | | |
33
Senior Debt Portfolio as of November 30, 2006
NOTES TO FINANCIAL STATEMENTS CONT'D
At November 30, 2006 the Portfolio had sufficient cash and/or securities segregated to cover potential obligations arising from forward foreign currency exchange contracts and open swap contracts.
6 Federal Income Tax Basis of Unrealized Appreciation (Depreciation)
The cost and unrealized appreciation (depreciation) in the value of the investments owned at November 30, 2006, as determined on a federal income tax basis, were as follows:
| Aggregate cost | | $ | 2,616,935,277 | | |
| Gross unrealized appreciation | | $ | 50,078,123 | | |
| Gross unrealized depreciation | | | (13,226,936 | ) | |
| Net unrealized appreciation | | $ | 36,851,187 | | |
The unrealized depreciation on foreign currency, swaps and forward contracts at November 30, 2006 on a federal income tax basis was $(1,778,004).
7 Restricted Securities
At November 30, 2006, the Portfolio owned the following securities (representing 0.2% of net assets) which were restricted as to public resale and not registered under the Securities Act of 1933 (excluding Rule 144A securities). The Portfolio has various registration rights (exercisable under a variety of circumstances) with respect to these securities. The fair value of these securities is determined based on valuations provided by brokers when available, or if not available, they are valued at fair value using methods determined in good faith by or at the direction of the Trustees.
| Description | | Date of
Acquisition | | Shares/Face | | Cost | | Fair Value | |
| Common Stocks | |
| Citation Corp. | | 5/24/05 | | | 31,622 | | | $ | 0 | | | $ | 0 | | |
Environmental Systems
Products Holdings, Inc. | | 10/24/00 | | | 33,278 | | | | 0 | | | | 696,509 | | |
| RoTech Medical Corp | | 6/12/02 | | | 12,592 | | | | 332,429 | | | | 31,732 | | |
| Safelite Glass Corp. | | 9/29/00 -
11/10/00 | | |
297,015 | | | |
0 | | | |
3,974,061 | | |
| Safelite Realty Corp. | | 9/29/00 -
11/10/00 | | |
20,048 | | | |
0 | | | |
320,167 | | |
| | | $ | 332,429 | | | $ | 5,022,469 | | |
| Description | | Date of
Acquisition | | Shares/Face | | Cost | | Fair Value | |
| Preferred Stocks | |
| Citation Corp. (PIK) | | 5/24/05 | | | 2,496 | | | $ | 1,996,800 | | | $ | 0 | | |
Hayes Lemmerz
International | | 6/04/03 | | | 445 | | | | 22,250 | | | | 4,518 | | |
Key Plastics, LLC,
Series A | | 4/26/01 | | | 218 | | | | 218,200 | | | | 120,664 | | |
| | | $ | 2,237,250 | | | $ | 125,182 | | |
| Warrants | |
| Gentek, Inc., Class B | | 11/11/03 | | | 1,930 | | | $ | 0 | | | $ | 84,920 | | |
| Gentek, Inc., Class C | | 11/11/03 | | | 940 | | | | 0 | | | | 39,198 | | |
| | | $ | - | | | $ | 124,118 | | |
8 Risks Associated with Foreign Investments
Investing in securities issued by companies whose principal business activities are outside the United States may involve significant risks not present in domestic investments. For example, there is generally less publicly available information about foreign companies, particularly those not subject to the disclosure and reporting requirements of the U.S. securities laws. Foreign issuers are generally not bound by uniform accounting, auditing, and financial reporting requirements and standards of practice comparable to those applicable to domestic issuers. Investments in foreign securities also involve the risk of possible adverse changes in investment or exchange control regulations, expropriation or confiscatory taxation, limitation on the removal of funds or other assets of the Fund, political or financial instability or diplomatic and other developments which could affect such investments. Foreign stock markets, while growing in volume and sophistication, are generally not as developed as those in the United States, and securities of some foreign issuers (particularly those located in developing countries) may be less liquid and more volatile than securities of comparable U.S. companies. In general, there is less overall governmental supervision and regulation of foreign securities markets, broker-dealers and issuers than in the United States.
9 Recently Issued Accounting Pronouncements
In June 2006, the Financial Accounting Standards Board ("FASB") issued FASB Interpretation No. 48, ("FIN 48") "Accounting for Uncertainty in Income Taxes - an interpretation of FASB Statement No. 109". FIN 48 clarifies the accounting for uncertainty in income taxes recognized
34
Senior Debt Portfolio as of November 30, 2006
NOTES TO FINANCIAL STATEMENTS CONT'D
in accordance with FASB Statement No. 109, "Accounting for Income Taxes." This interpretation prescribes a recognition threshold and measurement attribute for the financial statement recognition and measurement of a tax position taken or expected to be taken in a tax return. It also provides guidance on de-recognition, classification, interest and penalties, accounting in interim periods, disclosure and transition. FIN 48 is effective for fiscal years beginning after December 15, 2006. Management is currently evaluating the impact of applying the various provisions of FIN 48.
In September 2006, FASB issued Statement of Financial Accounting Standards No. 157, ("FAS 157") "Fair Value Measurements". FAS 157 defines fair value, establishes a framework for measuring fair value in accordance with generally accepted accounting principles and expands disclosure about fair value measurements. FAS 157 is effective for fiscal years beginning after November 15, 2007. Management is currently evaluating the impact the adoption of FAS 157 will have on the Portfolio's financial statement disclosures.
35
Senior Debt Portfolio as of November 30, 2006
REPORT OF INDEPENDENT REGISTERED PUBLIC ACCOUNTING FIRM
To the Trustees and Investors
of Senior Debt Portfolio:
We have audited the accompanying statement of assets and liabilities of Senior Debt Portfolio (the "Portfolio"), including the portfolio of investments as of November 30, 2006, the related statement of operations for the year then ended, the statements of changes in net assets for each of the two years in the period then ended, and the supplementary data for each of the four years in the period then ended and the period from January 1, 2002 to November 30, 2002, and the year ended December 31, 2001. These financial statements and supplementary data are the responsibility of the Portfolio's management. Our responsibility is to express an opinion on these financial statements and supplementary data based on our audits.
We conducted our audits in accordance with standards of the Public Company Accounting Oversight Board (United States). Those standards require that we plan and perform the audits to obtain reasonable assurance about whether the financial statements and supplementary data are free of material misstatement. The Portfolio is not required to have, nor were we engaged to perform, an audit of its internal control over financial reporting. Our audits included consideration of internal control over financial reporting as a basis for designing audit procedures that are appropriate in the circumstances, but not for the purpose of expressing an opinion on the effectiveness of the Portfolio's internal control over financial reporting. Accordingly, we express no such opinion. An audit also includes examining, on a test basis, evidence supporting the amounts and disclosures in the financial statements, assessing the accounting principles used and significant estimates made by management, as well as evaluating the overall financial statement presentation. Our procedures included confirmation of securities and Senior Loans held as of November 30, 2006 by correspondence with the custodian and selling or agent banks; where replies were not received from selling or agent banks, we performed other auditing procedures. We believe that our audits provide a reasonable basis for our opinion.
In our opinion, the financial statements and supplementary data referred to above present fairly, in all material respects, the financial position of Senior Debt Portfolio as of November 30, 2006, the results of its operations for the year then ended, the changes in its net assets and its supplemental data for the respective stated periods, in conformity with accounting principles generally accepted in the United States of America.
DELOITTE & TOUCHE LLP
Boston, Massachusetts
January 16, 2007
36
Eaton Vance Prime Rate Reserves
BOARD OF TRUSTEES' ANNUAL APPROVAL OF THE INVESTMENT ADVISORY AGREEMENT
Overview of the Contract Review Process
The Investment Company Act of 1940, as amended (the "1940 Act"), provides, in substance, that each investment advisory agreement between a fund and its investment adviser will continue in effect from year to year only if its continuance is approved at least annually by the fund's board of trustees, including by a vote of a majority of the trustees who are not "interested persons" of the fund ("Independent Trustees") cast in person at a meeting called for the purpose of considering such approval.
At a meeting of the Boards of Trustees (each a "Board") of the Eaton Vance group of mutual funds (the "Eaton Vance Funds") held on March 27, 2006, the Board, including a majority of the Independent Trustees, voted to approve continuation of existing advisory and sub-advisory agreements for the Eaton Vance Funds for an additional one-year period. In voting its approval, the Board relied upon the affirmative recommendation of the Special Committee of the Board, which is a committee comprised exclusively of Independent Trustees. Prior to making its recommendation, the Special Committee reviewed information furnished for a series of meetings of the Special Committee held in February and March 2006. Such information included, among other things, the following:
Information about Fees, Performance and Expenses
• An independent report comparing the advisory and related fees paid by each fund with fees paid by comparable funds;
• An independent report comparing each fund's total expense ratio and its components to comparable funds;
• An independent report comparing the investment performance of each fund to the investment performance of comparable funds over various time periods;
• Data regarding investment performance in comparison to relevant peer groups of funds and appropriate indices;
• Comparative information concerning fees charged by each adviser for managing other mutual funds and institutional accounts using investment strategies and techniques similar to those used in managing the fund;
• Profitability analyses for each adviser with respect to each fund managed by it;
Information about Portfolio Management
• Descriptions of the investment management services provided to each fund, including the investment strategies and processes employed;
• Information concerning the allocation of brokerage and the benefits received by each adviser as a result of brokerage allocation, including information concerning the acquisition of research through "soft dollar" benefits received in connection with the funds' brokerage, and the implementation of a soft dollar reimbursement program established with respect to the funds;
• Data relating to portfolio turnover rates of each fund;
• The procedures and processes used to determine the fair value of fund assets and actions taken to monitor and test the effectiveness of such procedures and processes;
Information about each Adviser
• Reports detailing the financial results and condition of each adviser;
• Descriptions of the qualifications, education and experience of the individual investment professionals whose responsibilities include portfolio management and investment research for the funds, and information relating to their compensation and responsibilities with respect to managing other mutual funds and investment accounts;
• Copies of the Codes of Ethics of each adviser and its affiliates, together with information relating to compliance with and the administration of such codes;
• Information concerning the resources devoted to compliance efforts undertaken by each adviser and its affiliates on behalf of the funds (including descriptions of various compliance programs) and their record of compliance with investment policies and restrictions, including policies with respect to market-timing, late trading and selective portfolio disclosure, and with policies on personal securities transactions;
• Descriptions of the business continuity and disaster recovery plans of each adviser and its affiliates;
Other Relevant Information
• Information concerning the nature, cost and character of the administrative and other non-investment management services provided by Eaton Vance Management and its affiliates;
• Information concerning management of the relationship with the custodian, subcustodians and fund accountants by each adviser or the funds' administrator; and
• The terms of each advisory agreement.
In addition to the information identified above, the Special Committee considered information provided from time to time by each adviser throughout the year at meetings of the Board and its committees. Over the course of the twelve month period ended March 31, 2006, the Board met nine times and the Special Committee, the Audit Committee and the Governance Committee, each of which is a
37
Eaton Vance Prime Rate Reserves
BOARD OF TRUSTEES' ANNUAL APPROVAL OF THE INVESTMENT ADVISORY AGREEMENT CONT'D
Committee comprised solely of Independent Trustees, met eight, twelve and five times, respectively. At such meetings, the Trustees received, among other things, presentations by the portfolio managers and other investment professionals of each adviser relating to the investment performance of each fund and the investment strategies used in pursuing the fund's investment objective.
For funds that invest through one or more underlying portfolios, the Board considered similar information about the portfolio(s) when considering the approval of advisory agreements. In addition, in cases where the fund's investment adviser has engaged a sub-adviser, the Board considered similar information about the sub-adviser when considering the approval of any sub-advisory agreement.
The Special Committee was assisted throughout the contract review process by Goodwin Procter LLP, legal counsel for the Independent Trustees. The members of the Special Committee relied upon the advice of such counsel and their own business judgment in determining the material factors to be considered in evaluating each advisory and sub-advisory agreement and the weight to be given to each such factor. The conclusions reached with respect to each advisory and sub-advisory agreement were based on a comprehensive evaluation of all the information provided and not any single factor. Moreover, each member of the Special Committee may have placed varying emphasis on particular factors in reaching conclusions with respect to each advisory and sub-advisory agreement.
Results of the Process
Based on its consideration of the foregoing, and such other information as it deemed relevant, including the factors and conclusions described below, the Special Committee concluded that the continuance of the investment advisory agreement of the Senior Debt Portfolio (the "Portfolio"), the portfolio in which Eaton Vance Prime Rate Reserves (the "Fund") invests, with Boston Management and Research (the "Adviser"), including the fee structure, is in the interests of shareholders and, therefore, the Special Committee recommended to the Board approval of the agreement. The Board accepted the recommendation of the Special Committee as well as the factors considered and conclusions reached by the Special Committee with respect to the agreement. Accordingly, the Board, including a majority of the Independent Trustees, voted to approve continuation of the investment advisory agreement for the Portfolio.
Nature, Extent and Quality of Services
In considering whether to approve the investment advisory agreement of the Portfolio, the Board evaluated the nature, extent and quality of services provided to the Portfolio by the Adviser.
The Board considered the Adviser's management capabilities and investment process with respect to the types of investments held by the Portfolio, including the education, experience and number of its investment professionals and other personnel who provide portfolio management, investment research, and similar services to the Portfolio. In particular, the Board evaluated the abilities and experience of such investment personnel in analyzing special considerations relevant to investing in senior floating rate loans. The Board noted the experience of the Adviser's 29 bank loan investment professionals and other personnel who provide services to the Portfolio, including four portfolio managers and 15 analysts. The Board also took into account the resources dedicated to portfolio management and other services, including the compensation paid to recruit and retain investment personnel, and the time and attention devoted to the Portfolio by senior management.
The Board reviewed the compliance programs of the Adviser and relevant affiliates thereof. Among other matters, the Board considered compliance and reporting matters relating to personal trading by investment personnel, selective disclosure of portfolio holdings, late trading, frequent trading, portfolio valuation, business continuity and the allocation of investment opportunities. The Board also evaluated the responses of the Adviser and its affiliates to requests from regulatory authorities such as the Securities and Exchange Commission and the National Association of Securities Dealers.
The Board considered shareholder and other administrative services provided or managed by Eaton Vance Management and its affiliates, including transfer agency and accounting services. The Board evaluated the benefits to shareholders of investing in a fund that is a part of a large family of funds, including the ability, in many cases, to exchange an investment among different funds without incurring additional sales charges.
After consideration of the foregoing factors, among others, the Board concluded that the nature, extent and quality of services provided by the Adviser, taken as a whole, are appropriate and consistent with the terms of the investment advisory agreement.
Fund Performance
The Board compared the Fund's investment performance to a relevant universe of similarly managed funds identified by an independent data provider and appropriate benchmark indices. The Board reviewed comparative performance data for the one-, three-, five- and ten-year periods ended September 30, 2005 for the Fund. The Board noted that the Fund's performance relative to its peers is affected by management's focus on preserving capital. The Board concluded that the performance of the Fund is satisfactory.
38
Eaton Vance Prime Rate Reserves
BOARD OF TRUSTEES' ANNUAL APPROVAL OF THE INVESTMENT ADVISORY AGREEMENT CONT'D
Management Fees and Expenses
The Board reviewed contractual investment advisory fee rates payable by the Portfolio and the Fund (referred to as "management fees"). As part of its review, the Board considered the management fees and the Fund's total expense ratio for the one-year period ended September 30, 2005, as compared to a group of similarly managed funds selected by an independent data provider.
After reviewing the foregoing information, and in light of the nature, extent and quality of the services provided by the Adviser, the Board concluded that the management fees charged for advisory and related services and the Fund's total expense ratio are reasonable.
Profitability
The Board reviewed the level of profits realized by the Adviser and relevant affiliates thereof in providing investment advisory and administrative services to the Fund, the Portfolio and to all Eaton Vance Funds as a group. The Board considered the level of profits realized without regard to revenue sharing or other payments by the Adviser and its affiliates to third parties in respect of distribution services. The Board also considered other direct or indirect benefits received by the Adviser and its affiliates in connection with its relationship with the Fund and the Portfolio.
The Board concluded that, in light of the foregoing factors and the nature, extent and quality of the services rendered, the profits realized by the Adviser and its affiliates are reasonable.
Economies of Scale
In reviewing management fees and profitability, the Board also considered the extent to which the Adviser and its affiliates, on the one hand, and the Fund, on the other hand, can expect to realize benefits from economies of scale as the assets of the Fund and Portfolio increase. The Board acknowledged the difficulty in accurately measuring the benefits resulting from the economies of scale with respect to the management of any specific fund or group of funds. The Board reviewed data summarizing the increases and decreases in the assets of the Fund and of all Eaton Vance Funds as a group over various time periods, and evaluated the extent to which the total expense ratio of the Fund and the profitability of the Adviser and its affiliates may have been affected by such increases or decreases. Based upon the foregoing, the Board concluded that the benefits from economies of scale are currently being shared equitably by the Adviser and its affiliates and the Fund. The Board also concluded that, assuming reasonably foreseeable increases in the assets of the Portfolio, the structure of the advisory fee, which includes breakpoints at several asset levels, can be expected to cause the Adviser and its affiliates and the Fund to continue to share such benefits equitably.
39
Eaton Vance Prime Rate Reserves
MANAGEMENT AND ORGANIZATION
Fund Management. The Trustees of Eaton Vance Prime Rate Reserves (the Fund) and Senior Debt Portfolio (the Portfolio) are responsible for the overall management and supervision of the Fund's and Portfolio's affairs. The Trustees and officers of the Fund and the Portfolio are listed below. Except as indicated, each individual has held the office shown or other offices in the same company for the last five years. Trustees and officers of the Fund and the Portfolio hold indefinite terms of office. The "noninterested Trustees" consist of those Trustees who are not "interested persons" of the Fund and the Portfolio, as that term is defined under the 1940 Act. The business address of each Trustee and officer is The Eaton Vance Building, 255 State Street, Boston, Massachusetts 02109. As used below, "EVC" refers to Eaton Vance Corp., "EV" refers to Eaton Vance, Inc., "EVM" refers to Eaton Vance Management, "BMR" refers to Boston Management and Research and "EVD" refers to Eaton Vance Distributors, Inc. EVC and EV are the corporate parent and trustee, respectively, of EVM and BMR. EVD is the Fund's principal underwriter, the Portfolio's placement agent and a wholly-owned subsidiary of EVM. Each officer affiliated with Eaton Vance may hold a position with other Eaton Vance affiliates that is comparable to his or her position with EVM listed below.
Name and
Date of Birth | | Position(s)
with the
Trust and the
Portfolio | | Term of
Office and
Length of
Service | |
Principal Occupation(s)
During Past Five Years | | Number of Portfolios
in Fund Complex
Overseen By
Trustee(1) | |
Other Directorships Held | |
| Interested Trustee | | | | | | | | | | | | | |
|
| James B. Hawkes 11/9/41 | | Trustee | | Trustee of the Trust since 1989 and of the Portfolio since 1992 | | Chairman and Chief Executive Officer of EVC, BMR, EVM and EV; Director of EV; Vice President and Director of EVD. Trustee and/or officer of 170 registered investment companies in the Eaton Vance Fund Complex. Mr. Hawkes is an interested person because of his positions with BMR, EVM, EVC and EV, which are affiliates of the Trust and the Portfolio. | | | 170 | | | Director of EVC | |
|
| Noninterested Trustee(s) | | | | | | | | | | | | | |
|
| Benjamin C. Esty 1/2/63 | | Trustee | | Since 2005 | | Roy and Elizabeth Simmons Professor of Business Administration, Harvard University Graduate School of Business Administration (since 2003). Formerly, Associate Professor, Harvard University Graduate School of Business Administration (2000-2003). | | | 170 | | | None | |
|
| Samuel L. Hayes, III 2/23/35 | | Trustee and Chairman of the Board | | Trustee of the Trust since 1989; of the Portfolio since 1994 and Chairman of the Board since 2005. | | Jacob H. Schiff Professor of Investment Banking Emeritus, Harvard University Graduate School of Business Administration. Director of Yakima Products, Inc. (manufacturer of automotive accessories) (since 2001) and Director of Telect, Inc. (telecommunications services company). | | | 170 | | | Director of Tiffany & Co. (specialty retailer) | |
|
| William H. Park 9/19/47 | | Trustee | | Since 2003 | | Vice Chairman, Commercial Industrial Finance Corp. (specialty finance company) (since 2006). Formerly, President and Chief Executive Officer, Prizm Capital Management, LLC (investment management firm) (2002-2005). Formerly, Executive Vice President and Chief Financial Officer, United Asset Management Corporation (a holding company owning institutional investment management firms) (1982-2001). | | | 170 | | | None | |
|
| Ronald A. Pearlman 7/10/40 | | Trustee | | Since 2003 | | Professor of Law, Georgetown University Law Center. | | | 170 | | | None | |
|
| Norton H. Reamer 9/21/35 | | Trustee | | Trustee of the Trust since 1989 and of the Portfolio since 1994 | | President, Chief Executive Officer and a Director of Asset Management Finance Corp. (a specialty finance company serving the investment management industry) (since October 2003). President, Unicorn Corporation (an investment and financial advisory services company) (since September 2000). Formerly, Chairman and Chief Operating Officer, Hellman, Jordan Management Co., Inc. (an investment management company) (2000-2003). Formerly, Advisory Director of Berkshire Capital Corporation (investment banking firm) (2002-2003). | | | 170 | | | None | |
|
40
Eaton Vance Prime Rate Reserves
MANAGEMENT AND ORGANIZATION CONT'D
Name and
Date of Birth | | Position(s)
with the
Trust and the
Portfolio | | Term of
Office and
Length of
Service | |
Principal Occupation(s)
During Past Five Years | | Number of Portfolios
in Fund Complex
Overseen By
Trustee(1) | |
Other Directorships Held | |
| Noninterested Trustee(s) (continued) | | | | | | | | | | | |
|
| Lynn A. Stout 9/14/57 | | Trustee | | Since 1998 | | Professor of Law, University of California at Los Angeles School of Law. | | | 170 | | | None | |
|
| Ralph F. Verni 1/26/43 | | Trustee | | Since 2005 | | Consultant and private investor. | | | 170 | | | None | |
|
| Principal Officers who are not Trustees | | | | | | | | | | | |
|
Name and
Date of Birth | | Position(s)
with the
Trust and the
Portfolio | | Term of
Office and
Length of
Service | | Principal Occupation(s)
During Past Five Years | |
Scott H. Page
11/30/59 | | President | | Since 2002(2) | | Vice President of EVM and BMR. Officer of 15 registered investment companies managed by EVM or BMR. | |
|
| Payson F. Swaffield 8/13/56 | | Vice President | | Vice President of the Trust since 1998 and of the Portfolio since 1996 | | Vice President of EVM and BMR. Officer of 15 registered investment companies managed by EVM or BMR. | |
|
| Alan R. Dynner 10/10/40 | | Secretary | | Since 1997 | | Vice President, Secretary and Chief Legal Officer of BMR, EVM, EVD, EV and EVC. Officer of 170 registered investment companies managed by EVM or BMR. | |
|
| Dan A. Maalouly 3/25/62 | | Treasurer | | Since 2005 | | Vice President of EVM and BMR. Previously, Senior Manager of PricewaterhouseCoopers LLP (1997-2005). Officer of 71 registered investment companies managed by EVM or BMR. | |
|
| Paul M. O'Neil 7/11/53 | | Chief
Compliance Officer | | Since 2004 | | Vice President of EVM and BMR. Officer of 170 registered investment companies managed by EVM or BMR. | |
|
(1) Includes both master and feeder funds in a master-feeder structure.
(2) Prior to 2002, Mr. Page served as Vice President of the Trust since 1998 and of the Portfolio since 1996.
The SAI for the Fund includes additional information about the Trustees and officers of the Fund and the Portfolio and can be obtained without charge by calling 1-800-225-6265.
41
This Page Intentionally Left Blank
This Page Intentionally Left Blank
This Page Intentionally Left Blank
Investment Adviser of Senior Debt Portfolio
Boston Management and Research
The Eaton Vance Building
255 State Street
Boston, MA 02109
Administrator of Eaton Vance Prime Rate Reserves
Eaton Vance Management
The Eaton Vance Building
255 State Street
Boston, MA 02109
Principal Underwriter
Eaton Vance Distributors, Inc.
The Eaton Vance Building
255 State Street
Boston, MA 02109
(617) 482-8260
Custodian
Investors Bank & Trust Company
200 Clarendon Street
Boston, MA 02116
Transfer Agent
PFPC Inc.
Attn: Eaton Vance Funds
P.O. Box 9653
Providence, RI 02940-9653
(800) 262-1122
Independent Registered Public Accounting Firm
Deloitte & Touche LLP
200 Berkeley Street
Boston, MA 02116-5022
Eaton Vance Prime Rate Reserves
The Eaton Vance Building
255 State Street
Boston, MA 02109
This report must be preceded or accompanied by a current prospectus. Before investing, investors should consider carefully the Fund's investment objective(s), risks, and charges and expenses. The Fund's current prospectus contains this and other information about the Fund and is available through your financial advisor. Please read the prospectus carefully before you invest or send money. For further information please call 1-800-225-6265.
165-1/07 PRSRC