UNITED STATES
SECURITIES AND EXCHANGE COMMISSION
Washington, D.C. 20549
FORM N-CSR
CERTIFIED SHAREHOLDER REPORT OF REGISTERED
MANAGEMENT INVESTMENT COMPANIES
Investment Company Act file number | 811-04015 |
|
Eaton Vance Mutual Funds Trust |
(Exact name of registrant as specified in charter) |
|
The Eaton Vance Building, 255 State Street, Boston, Massachusetts | | 02109 |
(Address of principal executive offices) | | (Zip code) |
|
Maureen A. Gemma
The Eaton Vance Building, 255 State Street, Boston, Massachusetts 02109 |
(Name and address of agent for service) |
|
Registrant’s telephone number, including area code: | (617) 482-8260 | |
|
Date of fiscal year end: | October 31 | |
|
Date of reporting period: | October 31, 2008 | |
| | | | | | | | |
Item 1. Reports to Stockholders

Annual Report October 31, 2008


EATON VANCE
COMBINED
MONEY
MARKET
FUNDS
Cash Management Fund
Money Market Fund
IMPORTANT NOTICES REGARDING PRIVACY,
DELIVERY OF SHAREHOLDER DOCUMENTS,
PORTFOLIO HOLDINGS, AND PROXY VOTING
Privacy. The Eaton Vance organization is committed to ensuring your financial privacy. Each of the financial institutions identified below has in effect the following policy ("Privacy Policy") with respect to nonpublic personal information about its customers:
• Only such information received from you, through application forms or otherwise, and information about your Eaton Vance fund transactions will be collected. This may include information such as name, address, social security number, tax status, account balances and transactions.
• None of such information about you (or former customers) will be disclosed to anyone, except as permitted by law (which includes disclosure to employees necessary to service your account). In the normal course of servicing a customer's account, Eaton Vance may share information with unaffiliated third parties that perform various required services such as transfer agents, custodians and broker/dealers.
• Policies and procedures (including physical, electronic and procedural safeguards) are in place that are designed to protect the confidentiality of such information.
• We reserve the right to change our Privacy Policy at any time upon proper notification to you. Customers may want to review our Policy periodically for changes by accessing the link on our homepage: www.eatonvance.com.
Our pledge of privacy applies to the following entities within the Eaton Vance organization: the Eaton Vance Family of Funds, Eaton Vance Management, Eaton Vance Investment Counsel, Boston Management and Research, and Eaton Vance Distributors, Inc.
In addition, our Privacy Policy only applies to those Eaton Vance customers who are individuals and who have a direct relationship with us. If a customer's account (i.e., fund shares) is held in the name of a third-party financial adviser/broker-dealer, it is likely that only such adviser's privacy policies apply to the customer. This notice supersedes all previously issued privacy disclosures.
For more information about Eaton Vance's Privacy Policy, please call 1-800-262-1122.
Delivery of Shareholder Documents. The Securities and Exchange Commission (the "SEC") permits funds to deliver only one copy of shareholder documents, including prospectuses, proxy statements and shareholder reports, to fund investors with multiple accounts at the same residential or post office box address. This practice is often called "householding" and it helps eliminate duplicate mailings to shareholders.
Eaton Vance, or your financial adviser, may household the mailing of your documents indefinitely unless you instruct Eaton Vance, or your financial adviser, otherwise.
If you would prefer that your Eaton Vance documents not be householded, please contact Eaton Vance at 1-800-262-1122, or contact your financial adviser.
Your instructions that householding not apply to delivery of your Eaton Vance documents will be effective within 30 days of receipt by Eaton Vance or your financial adviser.
Portfolio Holdings. Each Eaton Vance Fund and its underlying Portfolio (if applicable) will file a schedule of its portfolio holdings on Form N-Q with the SEC for the first and third quarters of each fiscal year. The Form N-Q will be available on the Eaton Vance website www.eatonvance.com, by calling Eaton Vance at 1-800-262-1122 or in the EDGAR database on the SEC's website at www.sec.gov. Form N-Q may also be reviewed and copied at the SEC's public reference room in Washington, D.C. (call 1-800-732-0330 for information on the operation of the public reference room).
Proxy Voting. From time to time, funds are required to vote proxies related to the securities held by the funds. The Eaton Vance Funds or their underlying Portfolios (if applicable) vote proxies according to a set of policies and procedures approved by the Funds' and Portfolios' Boards. You may obtain a description of these policies and procedures and information on how the Funds or Portfolios voted proxies relating to portfolio securities during the most recent 12 month period ended June 30, without charge, upon request, by calling 1-800-262-1122. This description is also available on the SEC's website at www.sec.gov.
Eaton Vance Money Market Funds as of October 31, 2008
MANAGEMENT’S DISCUSSION OF FUND PERFORMANCE

Duke E. Laflamme, CFA
Portfolio Manager
Economic and Market Conditions
· During the year ended October 31, 2008, the U.S. economy began to slow as the credit crunch that had evolved from the subprime mortgage crisis of 2007 affected nearly every business sector. Economic growth in the third quarter of 2008 retracted 0.3%, down from a positive second quarter growth rate of 2.8%, according to preliminary data released by the U.S. Department of Commerce. Unemployment jumped to 6.5% in October 2008, up from 5.0% in April 2008 and 4.8% in October 2007.
· During the second week of September 2008, the federal government took control of federally-chartered mortgage giants Fannie Mae and Freddie Mac. The following week, Lehman Brothers filed for bankruptcy protection and Merrill Lynch was acquired by Bank of America. Later in the month, Goldman Sachs and Morgan Stanley petitioned the Federal Reserve (the “Fed”) to become bank holding companies. These actions, in conjunction with Bear Stearns’ acquisition by JP Morgan in March, drastically redefined the Wall Street landscape. The Fed lowered the Federal Funds rate to 1.00% in the month of October 2008, after leaving the rate unchanged at its June, August and September meetings.
Management Discussion
· At October 31, 2008, Cash Management Portfolio — in which the Funds invest their assets — had 75.8% of its net assets invested in high-quality commercial paper and high-quality U.S. Government Agency bonds. The Portfolio also invests in other high-quality short-term investments.
· During the year ended October 31, 2008, shareholders of Eaton Vance Cash Management Fund and Eaton Vance Money Market Fund received $0.030 and $0.020 per share, respectively, in income dividends. An investment in each of the money market funds is neither insured nor guaranteed by the Federal Deposit Insurance Corporation or any other government agency. However, each Fund is a participant in the U.S. Treasury Department’s Temporary Money Market Guaranty Program (the “Program”). Under the Program, amounts of Fund shares owned by shareholders as of the close of business on September 19, 2008 are guaranteed by the U.S. Treasury against loss, subject to certain conditions. The Program expires on April 30, 2009 unless further extended by the U.S. Treasury; however, the Program may not be extended beyond September 18, 2009. Although the Funds seek to maintain a stable net asset value of $1.00 per share, it is possible to lose money by investing in a Fund.
· In addition to the Program announced by the U.S. Treasury Department on September 19, 2008, the Fed announced a number of programs to provide liquidity to the short-term credit markets.
· During the year, unprecedented market volatility gave the Fed ample reason to continue its target rate cutting policy. In light of increased risk in the market, management moved the portfolio towards higher quality, shorter maturity holdings.
· Effective May 1, 2008, Elizabeth S. Kenyon was replaced as Portfolio Manager of the Portfolio by Duke Laflamme, CFA. Mr. Laflamme joined Eaton Vance in 1998, having been with Norwest Investment Management previously. He is a member and former Director of the Fixed Income Management Society of Boston and a member of the Boston Security Analysts Society. Mr. Laflamme earned Bachelor of Arts and Bachelor of Science degrees from Colorado State University.
The views expressed throughout this report are those of the portfolio manager and are current only through the end of the period of the report as stated on the cover. These views are subject to change at any time based upon market or other conditions, and the investment adviser disclaims any responsibility to update such views. These views may not be relied on as investment advice and, because investment decisions for a fund are based on many factors, may not be relied on as an indication of trading intent on behalf of any Eaton Vance fund. Portfolio information provided in the report may not be representative of the Portfolio’s current or future investments and may change due to active management.
Fund shares are not insured by the FDIC and are not deposits or other obligations of, or guaranteed by, any depository institution. Shares are subject to investment risks, including possible loss of principal invested.
1
Eaton Vance Money Market Funds as of October 31, 2008
FUND PERFORMANCE
Performance
Eaton Vance Cash Management Fund(1)
Symbol | | EHCXX | |
| | | |
SEC Average Annual Total Returns | | | |
One Year | | 3.02 | % |
Five Years | | 2.91 | |
Ten Years | | 3.02 | |
Life of Fund† | | 5.97 | |
The Fund has no sales charge.
†Inception date: 1/27/75
Eaton Vance Money Market Fund(1)
Symbol | | EVMXX | |
| | | |
Average Annual Total Returns | | | |
One Year | | 2.04 | % |
Five Years | | 2.00 | |
Ten Years | | 2.16 | |
Life of Fund† | | 2.61 | |
| | | |
SEC Average Annual Total Returns | | | |
One Year | | -2.96 | % |
Five Years | | 1.62 | |
Ten Years | | 2.16 | |
Life of Fund† | | 2.61 | |
† Inception date: 4/5/95 |
| |
(1) | Average Annual Total Returns do not include the applicable contingent deferred sales charge (CDSC). If the sales charge were deducted, performance would be lower. SEC Average Annual Total Returns reflect applicable CDSC based on the following schedule: 5% - 1st and 2nd years; 4% - 3rd year; 3% - 4th year; 2% - 5th year; 1% - 6th year. |
Total Annual operating Expenses(2)
Eaton Vance Cash Management Fund Expense Ratio | | 0.62 | % |
Eaton Vance Money Market Fund Expense Ratio | | 1.66 | % |
(2) Source: Prospectus dated 3/1/08. |
CURRENT SEC Yield (annualized) For the 7-Day Period Ended 10/31/08(3)
Eaton Vance Cash Management Fund | | 1.88 | % |
Eaton Vance Money Market Fund | | 0.96 | |
(3) | Past performance is no guarantee of future results. Performance is for the stated time period only; each Fund’s current yield may be lower or higher than the quoted yield. Yield quotation more closely reflects current earnings than quotations of total return. For current yield information, please call 1-800-262-1122. |
Portfolio Composition
Asset Allocation
By net assets
Past performance is no guarantee of future results. Returns are historical and are calculated by determining the percentage change in net asset value (if any) with all distributions reinvested. Performance is for the stated time period only; current performance may be lower or higher than the quoted return. For performance as of the most recent month end, please refer to www.eatonvance.com.
2
Eaton Vance Money Market Funds as of October 31, 2008
FUND EXPENSES
Example: As a shareholder of a Fund, you incur two types of costs: (1) transaction costs, including sales charges (loads) on purchases and redemption fees (if applicable); and (2) ongoing costs, including management fees; distribution or service fees; and other Fund expenses. This Example is intended to help you understand your ongoing costs (in dollars) of investing in a Fund and to compare these costs with the ongoing costs of investing in other mutual funds. The Example is based on an investment of $1,000 invested at the beginning of the period and held for the entire period (May 1, 2008 – October 31, 2008).
Actual Expenses: The first section of each table below provides information about actual account values and actual expenses. You may use the information in this section, together with the amount you invested, to estimate the expenses that you paid over the period. Simply divide your account value by $1,000 (for example, an $8,600 account value divided by $1,000 = 8.6), then multiply the result by the number in the first section under the heading entitled "Expenses Paid During Period" to estimate the expenses you paid on your account during this period.
Hypothetical Example for Comparison Purposes: The second section of each table below provides information about hypothetical account values and hypothetical expenses based on the actual Fund expense ratio and an assumed rate of return of 5% per year (before expenses), which is not the actual return of a Fund. The hypothetical account values and expenses may not be used to estimate the actual ending account balance or expenses you paid for the period. You may use this information to compare the ongoing costs of investing in your Fund and other funds. To do so, compare this 5% hypothetical example with the 5% hypothetical examples that appear in the shareholder reports of the other funds.
Please note that the expenses shown in the tables are meant to highlight your ongoing costs only and do not reflect any transactional costs, such as sales charges (loads) or redemption fees (if applicable). Therefore, the second section of each table is useful in comparing ongoing costs only, and will not help you determine the relative total costs of owning different funds. In addition, if these transactional costs were included, your costs would have been higher.
Eaton Vance Cash Management Fund
| | | Beginning Account Value
(5/1/08) | | Ending Account Value
(10/31/08) | | Expenses Paid During Period*
(5/1/08 – 10/31/08) | |
| Actual | | $ | 1,000.00 | | | $ | 1,011.00 | | | $ | 2.93 | | |
| Hypothetical | |
| (5% return per year before expenses) | | $ | 1,000.00 | | | $ | 1,022.20 | | | $ | 2.95 | | |
* Expenses are equal to the Fund's annualized expense ratio of 0.58% multiplied by the average account value over the period, multiplied by 184/366 (to reflect the one-half year period). The Example assumes that the $1,000 was invested at the net asset value per share determined at the close of business on April 30, 2008. The Example reflects the expenses of both the Fund and the Portfolio.
Eaton Vance Money Market Fund
| | | Beginning Account Value
(5/1/08) | | Ending Account Value
(10/31/08) | | Expenses Paid During Period*
(5/1/08 – 10/31/08) | |
| Actual | | $ | 1,000.00 | | | $ | 1,006.20 | | | $ | 7.82 | | |
| Hypothetical | |
| (5% return per year before expenses) | | $ | 1,000.00 | | | $ | 1,017.30 | | | $ | 7.86 | | |
* Expenses are equal to the Fund's annualized expense ratio of 1.55% multiplied by the average account value over the period, multiplied by 184/366 (to reflect the one-half year period). The Example assumes that the $1,000 was invested at the net asset value per share determined at the close of business on April 30, 2008. The Example reflects the expenses of both the Fund and the Portfolio.
3
Eaton Vance Money Market Funds as of October 31, 2008
FINANCIAL STATEMENTS
Statements of Assets and Liabilities
As of October 31, 2008
| | | Cash
Management Fund | | Money
Market Fund | |
| Assets | |
| Investment in Cash Management Portfolio, at value | | $ | 342,863,492 | | | $ | 151,675,935 | | |
| Receivable for Fund shares sold | | | 817,819 | | | | 354,904 | | |
| Other assets | | | 54,581 | | | | 12,327 | | |
| Total assets | | $ | 343,735,892 | | | $ | 152,043,166 | | |
| Liabilities | |
| Payable for Fund shares redeemed | | $ | 846,891 | | | $ | 1,069,453 | | |
| Dividends payable | | | 320,535 | | | | 16,187 | | |
| Payable to affiliate for distribution and service fees | | | — | | | | 133,570 | | |
| Accrued expenses | | | 50,985 | | | | 30,001 | | |
| Total liabilities | | $ | 1,218,411 | | | $ | 1,249,211 | | |
| Net Assets | | $ | 342,517,481 | | | $ | 150,793,955 | | |
| Sources of Net Assets | |
| Paid-in capital | | $ | 343,090,132 | | | $ | 150,887,858 | | |
| Accumulated net realized loss (computed on the basis of identified cost) | | | (544,365 | ) | | | (84,294 | ) | |
| Accumulated distributions in excess of net investment income | | | (28,286 | ) | | | (9,609 | ) | |
| Total | | $ | 342,517,481 | | | $ | 150,793,955 | | |
| Shares of Beneficial Interest Outstanding | |
| | | | 343,094,788 | | | | 150,887,844 | | |
Net Asset Value, Offering Price and
Redemption Price Per Share | |
| (Net assets ÷ shares of beneficial interest outstanding) | | $ | 1.00 | | | $ | 1.00 | | |
See notes to financial statements
4
Eaton Vance Money Market Funds as of October 31, 2008
FINANCIAL STATEMENTS CONT'D
Statements of Operations
For the Year Ended October 31, 2008
| | | Cash
Management Fund | | Money
Market Fund | |
| Investment Income | |
| Interest allocated from Portfolio | | $ | 12,667,694 | | | $ | 3,633,088 | | |
| Expenses allocated from Portfolio | | | (1,836,197 | ) | | | (534,464 | ) | |
| Total investment income from Portfolio | | $ | 10,831,497 | | | $ | 3,098,624 | | |
| Expenses | |
| Trustees' fees and expenses | | $ | 1,902 | | | $ | 1,161 | | |
| Distribution and service fees | | | — | | | | 902,564 | | |
| Legal and accounting services | | | 26,506 | | | | 23,544 | | |
| Printing and postage | | | 17,049 | | | | 15,409 | | |
| Custodian fee | | | 48,192 | | | | 16,342 | | |
| Insurance fee | | | 28,046 | | | | 5,806 | | |
| Transfer and dividend disbursing agent fees | | | 100,219 | | | | 87,665 | | |
| Registration fees | | | 56,794 | | | | 34,631 | | |
| Miscellaneous | | | 7,634 | | | | 7,152 | | |
| Total expenses | | $ | 286,342 | | | $ | 1,094,274 | | |
| Net investment income | | $ | 10,545,155 | | | $ | 2,004,350 | | |
| Realized and Unrealized Gain (Loss) from Portfolio | |
| Net realized loss — | |
| Investment transactions (identified cost basis) | | $ | (544,003 | ) | | $ | (84,104 | ) | |
| Net realized loss | | $ | (544,003 | ) | | $ | (84,104 | ) | |
| Net increase in net assets from operations | | $ | 10,001,152 | | | $ | 1,920,246 | | |
See notes to financial statements
5
Eaton Vance Money Market Funds as of October 31, 2008
FINANCIAL STATEMENTS CONT'D
Statements of Changes in Net Assets
For the Year Ended October 31, 2008
| Increase (Decrease) in Net Assets | | Cash
Management Fund | | Money
Market Fund | |
| From operations — | |
| Net investment income | | $ | 10,545,155 | | | $ | 2,004,350 | | |
| Net realized loss from investment transactions | | | (544,003 | ) | | | (84,104 | ) | |
| Net increase in net assets from operations | | $ | 10,001,152 | | | $ | 1,920,246 | | |
| Distributions to shareholders — | |
| From net investment income | | $ | (10,578,260 | ) | | $ | (2,014,042 | ) | |
| Total distributions to shareholders | | $ | (10,578,260 | ) | | $ | (2,014,042 | ) | |
| Transactions in shares of beneficial interest at Net Asset Value of $1.00 per share — | |
| Proceeds from sale of shares | | $ | 1,875,012,386 | | | $ | 210,603,145 | | |
| Net asset value of shares issued to shareholders in payment of distributions declared | | | 5,748,699 | | | | 1,660,521 | | |
| Cost of shares redeemed | | | (1,711,788,876 | ) | | | (127,882,867 | ) | |
| Net increase in net assets from Fund share transactions | | $ | 168,972,209 | | | $ | 84,380,799 | | |
| Net increase in net assets | | $ | 168,395,101 | | | $ | 84,287,003 | | |
| Net Assets | |
| At beginning of year | | $ | 174,122,380 | | | $ | 66,506,952 | | |
| At end of year | | $ | 342,517,481 | | | $ | 150,793,955 | | |
Accumulated distributions
in excess of net investment
income included in net assets | |
| At end of year | | $ | (28,286 | ) | | $ | (9,609 | ) | |
See notes to financial statements
6
Eaton Vance Money Market Funds as of October 31, 2008
FINANCIAL STATEMENTS CONT'D
Statements of Changes in Net Assets
For the Period Ended October 31, 2007(1)
| Increase (Decrease) in Net Assets | | Cash
Management Fund | | Money
Market Fund | |
| From operations — | |
| Net investment income | | $ | 5,654,800 | | | $ | 1,607,282 | | |
| Net realized loss from investment transactions | | | (55 | ) | | | (9 | ) | |
| Net increase in net assets from operations | | $ | 5,654,745 | | | $ | 1,607,273 | | |
| Distributions to shareholders — | |
| From net investment income | | $ | (5,654,800 | ) | | $ | (1,607,282 | ) | |
| Total distributions to shareholders | | $ | (5,654,800 | ) | | $ | (1,607,282 | ) | |
| Transactions in shares of beneficial interest at Net Asset Value of $1.00 per share — | |
| Proceeds from sale of shares | | $ | 626,885,761 | | | $ | 82,204,969 | | |
| Net asset value of shares issued to shareholders in payment of distributions declared | | | 3,184,751 | | | | 1,269,302 | | |
| Cost of shares redeemed | | | (575,931,031 | ) | | | (59,064,924 | ) | |
| Net increase in net assets from Fund share transactions | | $ | 54,139,481 | | | $ | 24,409,347 | | |
| Net increase in net assets | | $ | 54,139,426 | | | $ | 24,409,338 | | |
| Net Assets | |
| At beginning of period | | $ | 119,982,954 | | | $ | 42,097,614 | | |
| At end of period | | $ | 174,122,380 | | | $ | 66,506,952 | | |
Accumulated undistributed
net investment income
included in net assets | |
| At end of period | | $ | 4,819 | | | $ | 83 | | |
(1) For the ten months ended October 31, 2007.
See notes to financial statements
7
Eaton Vance Money Market Funds as of October 31, 2008
FINANCIAL STATEMENTS CONT'D
Statements of Changes in Net Assets
For the Year Ended December 31, 2006
| Increase (Decrease) in Net Assets | | Cash
Management Fund | | Money
Market Fund | |
| From operations — | |
| Net investment income | | $ | 3,724,757 | | | $ | 1,517,337 | | |
Net realized loss from investment transactions, payments by affiliate and
the disposal of investments which did not meet the Portfolio's investment guidelines | | | (197 | ) | | | (113 | ) | |
| Net increase in net assets from operations | | $ | 3,724,560 | | | $ | 1,517,224 | | |
| Distributions to shareholders — | |
| From net investment income | | $ | (3,724,704 | ) | | $ | (1,517,308 | ) | |
| Total distributions to shareholders | | $ | (3,724,704 | ) | | $ | (1,517,308 | ) | |
| Transactions in shares of beneficial interest at Net Asset Value of $1.00 per share — | |
| Proceeds from sale of shares | | $ | 164,749,685 | | | $ | 41,881,817 | | |
| Net asset value of shares issued to shareholders in payment of distributions declared | | | 2,345,894 | | | | 1,198,865 | | |
| Cost of shares redeemed | | | (142,081,892 | ) | | | (49,322,436 | ) | |
| Net increase (decrease) in net assets from Fund share transactions | | $ | 25,013,687 | | | $ | (6,241,754 | ) | |
| Net increase (decrease) in net assets | | $ | 25,013,543 | | | $ | (6,241,838 | ) | |
| Net Assets | |
| At beginning of year | | $ | 94,969,411 | | | $ | 48,339,452 | | |
| At end of year | | $ | 119,982,954 | | | $ | 42,097,614 | | |
Accumulated undistributed
net investment income
included in net assets | |
| At end of year | | $ | 4,819 | | | $ | 83 | | |
See notes to financial statements
8
Eaton Vance Money Market Funds as of October 31, 2008
FINANCIAL STATEMENTS CONT'D
Financial Highlights
| | | Cash Management Fund | |
| | | Year Ended | | Period Ended | | Year Ended December 31, | |
| | | October 31, 2008 | | October 31, 2007(1) | | 2006 | | 2005 | | 2004 | | 2003 | |
| Net asset value — Beginning of period | | $ | 1.000 | | | $ | 1.000 | | | $ | 1.000 | | | $ | 1.000 | | | $ | 1.000 | | | $ | 1.000 | | |
| Income (loss) from operations | |
| Net investment income | | $ | 0.030 | | | $ | 0.040 | | | $ | 0.043 | | | $ | 0.024 | | | $ | 0.006 | | | $ | 0.005 | | |
| Less distributions | |
| From net investment income | | $ | (0.030 | ) | | $ | (0.040 | ) | | $ | (0.043 | ) | | $ | (0.024 | ) | | $ | (0.006 | ) | | $ | (0.005 | ) | |
| Total distributions | | $ | (0.030 | ) | | $ | (0.040 | ) | | $ | (0.043 | ) | | $ | (0.024 | ) | | $ | (0.006 | ) | | $ | (0.005 | ) | |
| Net asset value — End of period | | $ | 1.000 | | | $ | 1.000 | | | $ | 1.000 | | | $ | 1.000 | | | $ | 1.000 | | | $ | 1.000 | | |
| Total Return(2) | | | 3.02 | % | | | 4.04 | %(7) | | | 4.40 | %(3) | | | 2.48 | %(3) | | | 0.60 | % | | | 0.48 | % | |
| Ratios/Supplemental Data | |
| Net assets, end of period (000's omitted) | | $ | 342,517 | | | $ | 174,122 | | | $ | 119,983 | | | $ | 94,969 | | | $ | 98,165 | | | $ | 101,364 | | |
| Ratios (As a percentage of average daily net assets): | |
| Expenses before custodian fee reduction(4)(5) | | | 0.58 | % | | | 0.62 | %(6) | | | 0.75 | % | | | 0.80 | % | | | 0.79 | % | | | 0.68 | % | |
| Net investment income | | | 2.90 | % | | | 4.82 | %(6) | | | 4.32 | % | | | 2.46 | % | | | 0.60 | % | | | 0.47 | % | |
(1) For the ten months ended October 31, 2007. The Fund changed its fiscal year-end from December 31 to October 31.
(2) Returns are historical and are calculated by determining the percentage change in net asset value with all distributions reinvested.
(3) During the years ended December 31, 2006 and December 31, 2005, the investment adviser reimbursed the Fund, through its investment in the Portfolio, for net losses realized on the disposal of investments which did not meet the Portfolio's investment guidelines. The reimbursement was less than $0.01 per share and had no effect on total return for the years ended December 31, 2006 and December 31, 2005.
(4) Includes the Fund's share of the Portfolio's allocated expenses.
(5) Excludes the effect of custody fee credits, if any, of less than 0.005%.
(6) Annualized.
(7) Not annualized.
See notes to financial statements
9
Eaton Vance Money Market Funds as of October 31, 2008
FINANCIAL STATEMENTS CONT'D
Financial Highlights
| | | Money Market Fund | |
| | | Year Ended | | Period Ended | | Year Ended December 31, | |
| | | October 31, 2008 | | October 31, 2007(1) | | 2006 | | 2005 | | 2004 | | 2003 | |
| Net asset value — Beginning of period | | $ | 1.000 | | | $ | 1.000 | | | $ | 1.000 | | | $ | 1.000 | | | $ | 1.000 | | | $ | 1.000 | | |
| Income (loss) from operations | |
| Net investment income | | $ | 0.020 | | | $ | 0.031 | | | $ | 0.033 | | | $ | 0.014 | | | $ | 0.001 | | | $ | — | | |
| Less distributions | |
| From net investment income | | $ | (0.020 | ) | | $ | (0.031 | ) | | $ | (0.033 | ) | | $ | (0.014 | ) | | $ | (0.001 | ) | | $ | — | | |
| Total distributions | | $ | (0.020 | ) | | $ | (0.031 | ) | | $ | (0.033 | ) | | $ | (0.014 | ) | | $ | (0.001 | ) | | $ | — | | |
| Net asset value — End of period | | $ | 1.000 | | | $ | 1.000 | | | $ | 1.000 | | | $ | 1.000 | | | $ | 1.000 | | | $ | 1.000 | | |
| Total Return(2) | | | 2.04 | % | | | 3.16 | %(8) | | | 3.32 | %(3) | | | 1.45 | %(3) | | | 0.05 | % | | | 0.00 | % | |
| Ratios/Supplemental Data | |
| Net assets, end of period (000's omitted) | | $ | 150,794 | | | $ | 66,507 | | | $ | 42,098 | | | $ | 48,339 | | | $ | 67,885 | | | $ | 100,241 | | |
| Ratios (As a percentage of average daily net assets): | |
| Expenses before custodian fee reduction(4)(5) | | | 1.54 | % | | | 1.66 | %(6) | | | 1.80 | % | | | 1.82 | % | | | 1.31 | %(7) | | | 1.17 | %(7) | |
| Net investment income | | | 1.90 | % | | | 3.78 | %(6) | | | 3.30 | % | | | 1.40 | % | | | 0.04 | % | | | 0.00 | % | |
(1) For the ten months ended October 31, 2007. The Fund changed its fiscal year-end from December 31 to October 31.
(2) Returns are historical and are calculated by determining the percentage change in net asset value with all distributions reinvested.
(3) During the years ended December 31, 2006 and December 31, 2005, the investment adviser reimbursed the Fund, through its investment in the Portfolio, for net losses realized on the disposal of investments which did not meet the Portfolio's investment guidelines. The reimbursement was less than $0.01 per share and had no effect on total return for the years ended December 31, 2006 and December 31, 2005.
(4) Includes the Fund's share of the Portfolio's allocated expenses.
(5) Excludes the effect of custody fee credits, if any, of less than 0.005%.
(6) Annualized.
(7) The principal underwriter voluntarily waived a portion of its distribution fee and the administrator subsidized certain operating expenses (equal to 0.40% and 0.49% of average daily net assets for the years ended December 31, 2004 and 2003, respectively). Absent this waiver and allocation, total return would have been lower.
(8) Not annualized.
See notes to financial statements
10
Eaton Vance Money Market Funds as of October 31, 2008
NOTES TO FINANCIAL STATEMENTS
1 Significant Accounting Policies
Eaton Vance Cash Management Fund (Cash Management Fund) and Eaton Vance Money Market Fund (Money Market Fund) (individually, the Fund and collectively, the Funds) are each diversified series of Eaton Vance Mutual Funds Trust (the Trust). The Trust is a Massachusetts business trust registered under the Investment Company Act of 1940, as amended (the 1940 Act), as an open-end management investment company. The Funds invest all of their investable assets in interests in Cash Management Portfolio (the Portfolio), a New York trust, having the same investment objective and policies as the Funds. The value of each Fund's investment in the Portfolio reflects each Fund's proportionate interest in the net assets of the Portfolio (14.9% for Cash Management Fund and 6.6% for Money Market Fund at October 31, 2008). The performance of each Fund is directly affected by the performance of the Portfolio. The financial statements of the Portfolio , including the portfolio of investments, are included elsewhere in this report and should be read in conjunction with each Fund's financial statements.
The following is a summary of significant accounting policies of the Funds. The policies are in conformity with accounting principles generally accepted in the United States of America.
A Investment Valuation — Valuation of securities by the Portfolio is discussed in Note 1A of the Portfolio's Notes to Financial Statements, which are included elsewhere in this report.
B Income — Each Fund's net investment income or loss consists of the Fund's pro-rata share of the net investment income or loss of the Portfolio, less all actual and accrued expenses of the Fund.
C Federal Taxes — Each Fund's policy is to comply with the provisions of the Internal Revenue Code applicable to regulated investment companies and to distribute to shareholders each year substantially all of its net investment income, and all or substantially all of its net realized capital gains. Accordingly, no provision for federal income or excise tax is necessary. At October 31, 2008, the Funds, for federal income tax purposes, had capital loss carryforwards which will reduce each Fund's taxable income arising from future net realized gains on investment transactions, if any, to the extent permitted by the Internal Revenue Code, and thus will reduce the amount of distributions to shareholders which would otherwise be necessary to relieve the Funds of any liability f or federal income or excise tax. The amounts and expiration dates of the capital loss carryforwards are as follows:
| Fund | | Amount | | Expiration Date | |
| Cash Management | | $ | 5 | | | October 31, 2010 | |
|
| | | | 20 | | | October 31, 2011 | |
|
| | | | 85 | | | October 31, 2013 | |
|
| | | | 197 | | | October 31, 2014 | |
|
| | | | 55 | | | October 31, 2015 | |
|
| | | | 544,003 | | | October 31, 2016 | |
|
| Money Market | | | 10 | | | October 31, 2010 | |
|
| | | | 5 | | | October 31, 2011 | |
|
| | | | 53 | | | October 31, 2013 | |
|
| | | | 113 | | | October 31, 2014 | |
|
| | | | 9 | | | October 31, 2015 | |
|
| | | | 84,104 | | | October 31, 2016 | |
|
As of October 31, 2008, the Funds had no uncertain tax positions that would require financial statement recognition, de-recognition, or disclosure. Each of the Fund's federal tax returns filed in the 3 year period ended October 31, 2008 remains subject to examination by the Internal Revenue Service.
D Expenses — The majority of expenses of the Trust are directly identifiable to an individual fund. Expenses which are not readily identifiable to a specific fund are allocated taking into consideration, among other things, the nature and type of expense and the relative size of the funds.
E Expense Reduction — State Street Bank and Trust Company (SSBT) serves as custodian of the Funds. Pursuant to the respective custodian agreements, SSBT receives a fee reduced by credits, which are determined based on the average daily cash balance each Fund maintains with SSBT. All credit balances, if any, used to reduce each Fund's custodian fees are reported as a reduction of expenses in the Statements of Operations.
F Use of Estimates — The preparation of the financial statements in conformity with accounting principles generally accepted in the United States of America requires management to make estimates and assumptions that affect the reported amounts of assets and liabilities at the date of the financial statements and the reported amounts of income and expense during the reporting period. Actual results could differ from those estimates.
11
Eaton Vance Money Market Funds as of October 31, 2008
NOTES TO FINANCIAL STATEMENTS CONT'D
G Indemnifications — Under the Trust's organizational documents, its officers and Trustees may be indemnified against certain liabilities and expenses arising out of the performance of their duties to the Funds, and shareholders are indemnified against personal liability for the obligations of the Trust. Additionally, in the normal course of business, each Fund enters into agreements with service providers that may contain indemnification clauses. Each Fund's maximum exposure under these arrangements is unknown as this would involve future claims that may be made against each Fund that have not yet occurred.
H Other — Investment transactions are accounted for on a trade date basis. Dividends to shareholders are recorded on the ex-dividend date.
2 Distributions to Shareholders
The net investment income of each Fund is determined daily, and substantially all of the net investment income so determined is declared daily as a dividend to shareholders of record at the time of declaration. Distributions are generally paid monthly. Distributions of realized capital gains (reduced by available capital loss carryforwards from prior years, if any) are made at least annually. Shareholders may reinvest income and capital gain distributions in additional shares of the Fund at the net asset value as of the reinvestment date or, at the election of the shareholder, receive distributions in cash. The Funds distinguish between distributions on a tax basis and a financial reporting basis. Accounting principles generally accepted in the United States of America require that only distributions in excess of tax basis earnings and profits be reported in the financial statements as a return of capital. Permanent differences between book and tax accounting relating to distributions are reclassified to paid-in capital.
The tax character of distributions declared for the year ended October 31, 2008, the period ended October 31, 2007 and the year ended December 31, 2006 was as follows:
| Year Ended October 31, 2008 | | Cash
Management Fund | | Money
Market Fund | |
| Distributions declared from: | |
| Ordinary income | | $ | 10,578,260 | | | $ | 2,014,042 | | |
| Period Ended October 31, 2007 | | Cash
Management Fund | | Money
Market Fund | |
| Distributions declared from: | |
| Ordinary income | | $ | 5,654,800 | | | $ | 1,607,282 | | |
| Year Ended December 31, 2006 | | Cash
Management Fund | | Money
Market Fund | |
| Distributions declared from: | |
| Ordinary income | | $ | 3,724,704 | | | $ | 1,517,308 | | |
As of October 31, 2008, the components of distributable earnings (accumulated losses) on a tax basis were as follows:
| Cash | | Money
Management Fund | |
Market Fund | |
| Undistributed ordinary income | | $ | 292,249 | | | $ | 6,578 | | |
| Capital loss carryforward | | $ | (544,365 | ) | | $ | (84,294 | ) | |
| Other temporary differences | | $ | (320,535 | ) | | $ | (16,187 | ) | |
The differences between components of distributable earnings (accumulated losses) on a tax basis and the amounts reflected in the Statements of Assets and Liabilities are primarily due to the timing of recognizing distributions to shareholders.
3 Transactions with Affiliates
Eaton Vance Management (EVM) serves as the administrator of the Funds, but receives no compensation. The Portfolio has engaged Boston Management and Research (BMR), a subsidiary of EVM, to render investment advisory services. See Note 2 of the Portfolio's Notes to Financial Statements which are included elsewhere in this report. EVM serves as the sub-transfer agent of the Funds and receives from the transfer agent an aggregate fee based upon the actual expenses incurred by EVM in the performance of these services. For the year ended October 31, 2008, EVM earned $6,254 and $5,389 from Cash Management Fund and Money Market Fund, respectively, in sub-transfer agent fees. Eaton Vance Distributors, Inc. (EVD), an affiliate of EVM and the Funds' principal underwriter, also received distribution and service fees from the Money Market Fund (see Note 4) and contingent deferred sales charges (see Note 5) from the Funds.
Except for Trustees of the Funds and the Portfolio who are not members of EVM's or BMR's organizations, officers and Trustees receive remuneration for their services to the Funds out of the investment adviser fee. Certain officers and Trustees of the Funds and the Portfolio are officers of the above organizations.
12
Eaton Vance Money Market Funds as of October 31, 2008
NOTES TO FINANCIAL STATEMENTS CONT'D
4 Distribution Plan
The Money Market Fund (the Fund) has in effect a distribution plan (the Plan) pursuant to Rule 12b-1 under the 1940 Act. The Plan provides that the Fund will pay EVD distribution fees of 0.75% per annum of its average daily net assets for providing ongoing distribution services and facilities to the Fund. The Fund will automatically discontinue payments to EVD during any period in which there are no outstanding Uncovered Distribution Charges, which are equivalent to the sum of (i) 6.25% of the aggregate amount received by the Fund for shares sold plus (ii) interest calculated by applying the rate of 1% over the prevailing prime rate to the outstanding balance of Uncovered Distribution Charges of EVD, reduced by the aggregate amount of contingent deferred sales charges (Note 5) and amounts theretofore paid or payable to EVD. For the year ended October 31, 2008, the Fund paid or accrued to EVD $792,915, representing 0.75% of its a verage daily net assets. At October 31, 2008, the amount of Uncovered Distribution Charges of EVD calculated under the Plan was approximately $14,564,900.
The Plan also authorizes the Fund to make payments of service fees to EVD, investment dealers and other persons in amounts not exceeding 0.25% per annum of its average daily net assets. The Trustees approved service fee payments equal to 0.15% per annum of the Fund's average daily net assets of shares outstanding for one year or more. Service fees paid or accrued are for personal services and/or the maintenance of shareholder accounts. They are separate and distinct from sales commissions and distribution fees payable to EVD and, as such, are not subject to automatic discontinuance when there are no outstanding Uncovered Distribution Charges of EVD. Service fees paid or accrued for the year ended October 31, 2008 amounted to $109,649, representing 0.10% of its average daily net assets.
5 Contingent Deferred Sales Charges
A contingent deferred sales charge (CDSC) generally is imposed on redemption of shares of the Money Market Fund (other than those acquired as the result of an exchange from another Eaton Vance Fund) made within six years of purchase. Generally, the CDSC is based upon the lower of the net asset value at date of redemption or date of purchase. No charge is levied on shares acquired by reinvestment of dividends or capital gain distributions. The CDSC is imposed at declining rates that begin at 5% in the case of redemptions in the first and second year after purchase, declining one percentage point each subsequent year. Shares of Money Market Fund and Cash Management Fund acquired as a result of an exchange from shares of another Eaton Vance Fund are subject to the original CDSC rate, if any, from the date of original purchase. No CDSC is levied on shares which have been sold to EVM or its affiliates or to their respective employees or clients and may be waived under certain other limited conditions. CDSCs received on redemptions of Money Market Fund shares are paid to EVD to reduce the amount of Uncovered Distribution Charges calculated under the Fund's Distribution Plan. CDSCs received on redemptions of Money Market Fund shares when no Uncovered Distribution Charges exist are credited to the Fund. For the year ended October 31, 2008, the Funds were informed that EVD received approximately $0 and $385,900 of CDSCs paid by shareholders of the Cash Management Fund and Money Market Fund, respectively.
6 Investment Transactions
For the year ended October 31, 2008, increases and decreases in each Fund's investment in the Portfolio were as follows:
| Cash Management Fund | | | |
| Increases | | $ | 1,875,841,168 | | |
| Decreases | | | 1,722,010,837 | | |
| Money Market Fund | | | |
| Increases | | $ | 210,425,115 | | |
| Decreases | | | 129,278,387 | | |
7 Shares of Beneficial Interest
The Funds' Declaration of Trust permits the Trustees to issue an unlimited number of full and fractional shares of beneficial interest (without par value). At October 31, 2008, EVM owned approximately 18% of the outstanding shares of the Cash Management Fund.
8 Temporary Guarantee Program
Each of the Funds participates in the U.S. Treasury Department's Temporary Guarantee Program for Money Market Funds (the Guarantee Program). Under the Guarantee Program, amounts of Fund shares owned by shareholders as of the close of business on September 19, 2008 are guaranteed by the U.S. Treasury against loss in the event (i) the Fund's market-based net asset value falls below $0.995 per share (i.e., rounds to less than $1.00 per share) and (ii) the Fund subsequently liquidates (the "guarantee event"). Upon such event, Fund shareholders who have continuously maintained a Fund account from
13
Eaton Vance Money Market Funds as of October 31, 2008
NOTES TO FINANCIAL STATEMENTS CONT'D
September 19, 2008 until the guarantee event would be eligible to receive from the U.S. Treasury the difference between $1.00 per share and the Fund's net proceeds per share upon liquidation applied to the lesser of shares held by such shareholders on September 19, 2008 or on the date of the guarantee event. Investors who became Fund shareholders after September 19, 2008, or who owned an account in a Fund on September 19, 2008 but subsequently closed their account, would not receive a payment under the Guarantee Program. To participate in the Guarantee Program, each Fund paid a fee equal to .015% of the value of its shares outstanding as of September 19, 2008 at $1 per share. Such fee is being amortized to expense over the Guarantee Program's initial three-month period. Guarantee payments under the Guarantee Program are subject to an overall limit of approximately $50 billion for all eligible money market funds participating in the Guarantee Program. The Guarantee Program expires on December 18, 2008 unless extended by the U.S. Treasury; however, the Guarantee Program may not be extended beyond September 18, 2009. On November 24, 2008, the U.S. Treasury announced the extension of the Guarantee Program to April 30, 2009. Continued participation in the Guarantee Program by the Funds, which requires the payment of an additional fee, was approved by the Funds' Trustees on December 3, 2008.
9 Recently Issued Accounting Pronouncement
In September 2006, the Financial Accounting Standards Board issued Statement of Financial Accounting Standards No. 157 (FAS 157), "Fair Value Measurements". FAS 157 defines fair value, establishes a framework for measuring fair value in accordance with generally accepted accounting principles and expands disclosure about fair value measurements. FAS 157 is effective for fiscal years beginning after November 15, 2007. As of October 31, 2008, management does not believe the adoption of FAS 157 will impact the amounts reported in the financial statements; however, additional disclosures may be required about the inputs used to develop the measurements of fair value and the effect of certain of the measurements on changes in net assets for the period.
14
Eaton Vance Money Market Funds as of October 31, 2008
REPORT OF INDEPENDENT REGISTERED PUBLIC ACCOUNTING FIRM
To the Trustees of Eaton Vance Mutual
Funds Trust and Shareholders of
Eaton Vance Cash Management
Fund and Eaton Vance Money Market Fund:
We have audited the accompanying statements of assets and liabilities of Eaton Vance Cash Management Fund and Eaton Vance Money Market Fund (the "Funds") (each a series of Eaton Vance Mutual Funds Trust) as of October 31, 2008, and the related statements of operations for the year then ended, the statements of changes in net assets and the financial highlights for the year then ended and for the period from January 1, 2007 to October 31, 2007. These financial statements and financial highlights are the responsibility of the Fund's management. Our responsibility is to express an opinion on these financial statements and financial highlights based on our audits. The statements of changes in net assets for the year ended December 31, 2006, and the financial highlights for the year ended December 31, 2006 and all prior periods presented were audited by other auditors. Those auditors expressed an unqualified opinion on those financia l statements and financial highlights in their report dated February 21, 2007.
We conducted our audits in accordance with the standards of the Public Company Accounting Oversight Board (United States). Those standards require that we plan and perform the audit to obtain reasonable assurance about whether the financial statements and financial highlights are free of material misstatement. The Funds are not required to have, nor were we engaged to perform, an audit of its internal control over financial reporting. Our audits included consideration of internal control over financial reporting as a basis for designing audit procedures that are appropriate in the circumstances, but not for the purpose of expressing an opinion on the effectiveness of the Funds' internal control over financial reporting. Accordingly, we express no such opinion. An audit also includes examining, on a test basis, evidence supporting the amounts and disclosures in the financial statements, assessing the accounting principles used an d significant estimates made by management, as well as evaluating the overall financial statement presentation. We believe that our audits provide a reasonable basis for our opinion.
In our opinion, the financial statements and financial highlights referred to above present fairly, in all material respects, the financial positions of Eaton Vance Cash Management Fund and Eaton Vance Money Market Fund as of October 31, 2008, the results of their operations for the year then ended, and the changes in their net assets and the financial highlights for the year then ended and for the period from January 1, 2007 to October 31, 2007, in conformity with accounting principles generally accepted in the United States of America.
DELOITTE & TOUCHE LLP
Boston, Massachusetts
December 15, 2008
15
Eaton Vance Money Market Funds as of October 31, 2008
FEDERAL TAX INFORMATION (Unaudited)
The Form 1099-DIV you receive in January 2009 will show the tax status of all distributions paid to your account in calendar 2008. Shareholders are advised to consult their own tax adviser with respect to the tax consequences of their investment in the Funds.
16
Cash Management Portfolio as of October 31, 2008
PORTFOLIO OF INVESTMENTS
Asset Backed Securities — 1.4% | | | |
Principal Amount
(000's omitted) | |
Security | |
Value | |
| $ | 3,732 | | | AMCAR, Series 2008-AF, Class A1, 2.694%, 6/12/09 | | $ | 3,731,866 | | |
| | 969 | | | CNH Equipment Trust, Series 2008-A, Class A1,
2.753%, 5/11/09 | | | 969,342 | | |
| | 5,974 | | | CNH Equipment Trust, Series 2008-B, Class A1,
2.917%, 6/12/09 | | | 5,973,914 | | |
| | 2,880 | | | FORDO, Series 2008-B, Class A1, 2.766%, 5/15/09 | | | 2,879,647 | | |
| | 8,323 | | | HAROT, Series 2008-1, Class A1, 2.916%, 7/20/09 | | | 8,322,585 | | |
| | 7,537 | | | HART, Series 2008-A, Class A1, 2.849%, 7/15/09 | | | 7,537,367 | | |
| | 2,579 | | | JDOT, Series 2008-A, Class A1, 2.741%, 5/8/09 | | | 2,578,550 | | |
Total Asset Backed Securities
(identified cost $31,993,271) | | $ | 31,993,271 | | |
| Certificates of Deposit — 3.1% | | | |
Principal Amount
(000's omitted) | |
Security | |
Value | |
| $ | 10,000 | | | Abbey National Treasury Services PLC,
4.828%, 2/13/09(1) | | $ | 10,000,000 | | |
| | 21,000 | | | Bank of Ireland, CT, 4.353%, 3/3/09(1) | | | 21,000,000 | | |
| | 17,000 | | | Barclays Bank PLC, NY, 5.038%, 3/12/09(1) | | | 17,000,000 | | |
| | 19,384 | | | Royal Bank of Canada, NY, 4.605%, 4/16/09(1) | | | 19,371,647 | | |
| | 5,000 | | | Royal Bank of Canada, NY, 5.29%, 2/2/09(1) | | | 5,027,978 | | |
Total Certificates of Deposit
(amortized cost $72,399,625) | | $ | 72,399,625 | | |
| Commercial Paper — 14.1% | | | |
Principal Amount
(000's omitted) | |
Security | |
Value | |
| Banks and Money Services — 12.8% | | | |
| $ | 18,500 | | | Abbey National, LLC, 2.735%, 12/4/08 | | $ | 18,453,619 | | |
| | 15,000 | | | American Express Credit Corp., 2.78%, 12/12/08 | | | 14,952,508 | | |
| | 18,000 | | | American Express Credit Corp., 2.87%, 11/6/08 | | | 17,992,825 | | |
| | 20,000 | | | Australia and New Zealand Banking Group, Ltd.,
2.214%, 10/2/09(1)(2) | | | 20,000,000 | | |
| | 10,000 | | | Bank of America Corp., 2.82%, 1/7/09 | | | 9,947,516 | | |
| | 8,629 | | | BNP Paribas Finance, Inc., 2.84%, 11/10/08 | | | 8,622,873 | | |
| | 25,000 | | | BNP Paribas Finance, Inc., 2.851%, 12/29/08 | | | 24,885,168 | | |
| | 10,000 | | | CBA (DE) Finance, Inc., 2.72%, 11/21/08 | | | 9,984,889 | | |
| | 15,000 | | | CBA (DE) Finance, Inc., 2.73%, 12/4/08 | | | 14,962,463 | | |
| | 20,000 | | | HSBC Finance Corp., 2.75%, 12/1/08 | | | 19,954,167 | | |
| | 9,530 | | | ING (US) Funding, LLC, 2.73%, 11/17/08 | | | 9,518,437 | | |
| | 20,000 | | | JPMorgan Chase & Co., 2.80%, 1/9/09 | | | 19,892,667 | | |
Principal Amount
(000's omitted) | |
Security | |
Value | |
| Banks and Money Services (continued) | | | |
| $ | 17,000 | | | Macquarie Bank Ltd., 2.905%, 12/9/08(2) | | $ | 16,947,871 | | |
| | 17,000 | | | Macquarie Bank Ltd., 4.869%, 4/21/09(1)(2) | | | 17,000,000 | | |
| | 14,000 | | | Morgan Stanley, 2.83%, 11/14/08 | | | 13,985,692 | | |
| | 14,500 | | | Societe Generale North America, Inc., 2.80%, 11/19/08 | | | 14,479,700 | | |
| | 16,000 | | | UBS Finance Delaware, LLC, 2.80%, 11/10/08 | | | 15,988,800 | | |
| | 15,000 | | | UBS Finance Delaware, LLC, 2.84%, 12/5/08 | | | 14,959,766 | | |
| | 12,500 | | | UBS Finance Delaware, LLC, 2.95%, 11/10/08 | | | 12,490,782 | | |
| | | | | | | $ | 295,019,743 | | |
| Insurance — 1.3% | | | |
| $ | 15,000 | | | Prudential Financial, Inc., 2.85%, 11/13/08(2) | | $ | 14,985,750 | | |
| | 15,000 | | | Prudential Financial, Inc., 2.97%, 12/1/08(2) | | | 14,962,875 | | |
| | | | | | | $ | 29,948,625 | | |
Total Commercial Paper
(identified cost $324,968,368) | | $ | 324,968,368 | | |
| Corporate Bonds & Notes — 19.6% | | | |
Principal Amount
(000's omitted) | |
Security | | Value | |
| Automotive — 0.9% | | | |
| $ | 20,000 | | | Toyota Motor Credit Corp., MTN, 4.57%, 1/15/09(1) | | $ | 20,000,000 | | |
| | | | | | | $ | 20,000,000 | | |
| Banks and Money Services — 15.6% | | | |
| $ | 12,000 | | | American Honda Finance Corp., MTN,
2.924%, 5/5/09(1)(3) | | $ | 12,000,000 | | |
| | 21,000 | | | American Honda Finance Corp., MTN,
3.006%, 3/18/09(1)(3) | | | 21,000,000 | | |
| | 7,250 | | | Australia and New Zealand Banking Group, Ltd.,
3.021%, 10/2/09(1)(3) | | | 7,250,000 | | |
| | 3,800 | | | Bank of America Corp., 2.819%, 6/12/09(1) | | | 3,795,487 | | |
| | 17,250 | | | Bank of America Corp., 4.35%, 10/3/09(1) | | | 17,250,000 | | |
| | 25,000 | | | Citigroup Funding, Inc., MTN, 3.678%, 5/8/09(1) | | | 24,998,087 | | |
| | 7,400 | | | Commonwealth Bank of Australia, 4.35%, 10/2/09(1)(3) | | | 7,400,000 | | |
| | 23,000 | | | Fortis Bank, NY, 4.493%, 11/19/08(1)(3) | | | 23,000,000 | | |
| | 9,500 | | | Goldman Sachs Group, Inc., 6.65%, 5/15/09 | | | 9,660,424 | | |
| | 8,317 | | | HSBC Finance Corp., 4.125%, 12/15/08 | | | 8,306,791 | | |
| | 2,720 | | | HSBC Finance Corp., 4.75%, 5/15/09 | | | 2,732,444 | | |
| | 6,527 | | | HSBC Finance Corp., 5.875%, 2/1/09 | | | 6,561,624 | | |
| | 10,000 | | | IBM International Group Capital, 3.031%, 9/25/09(1)(3) | | | 10,000,000 | | |
| | 18,500 | | | ING Bank NV, 3.726%, 7/24/09(1)(3) | | | 18,500,000 | | |
See notes to financial statements
17
Cash Management Portfolio as of October 31, 2008
PORTFOLIO OF INVESTMENTS CONT'D
Principal Amount
(000's omitted) | |
Security | |
Value | |
| Banks and Money Services (continued) | | | |
| $ | 25,000 | | | Merrill Lynch & Co., 4.438%, 1/16/09(1) | | $ | 25,000,000 | | |
| | 13,500 | | | Merrill Lynch & Co., MTN, 4.61%, 5/20/09(1) | | | 13,481,729 | | |
| | 14,100 | | | Morgan Stanley, 3.875%, 1/15/09 | | | 14,106,179 | | |
| | 20,000 | | | National Australia Bank Ltd., 2.858%, 9/11/09(1)(3) | | | 19,958,366 | | |
| | 15,000 | | | National Australia Bank Ltd., 3.025%, 10/6/09(1)(3) | | | 15,000,000 | | |
| | 25,000 | | | Rabobank Nederland, 2.993%, 10/9/09(1)(3) | | | 25,000,000 | | |
| | 6,600 | | | Rabobank Nederland, 4.773%, 1/15/09(1)(3) | | | 6,599,745 | | |
| | 20,000 | | | Societe Generale North America, Inc.,
3.285%, 9/4/09(1)(3) | | | 20,000,000 | | |
| | 20,000 | | | Totta Ireland PLC, 4.12%, 11/6/08(1)(3) | | | 20,000,000 | | |
| | 14,800 | | | Unilever Capital Corp., 4.578%, 12/11/08(1)(3) | | | 14,800,000 | | |
| | 15,000 | | | Wells Fargo & Co., 2.919%, 9/15/09(1) | | | 14,998,735 | | |
| | | | | | | $ | 361,399,611 | | |
| Beverages — 0.7% | | | |
| $ | 16,000 | | | Pepsi Bottling Holdings Inc., 5.625%, 2/17/09(3) | | $ | 16,125,928 | | |
| | | | | | | $ | 16,125,928 | | |
| Electrical and Electronic Equipment — 0.9% | | | |
| $ | 14,500 | | | General Electric Capital Corp., MTN, 2.91%, 8/31/09(1) | | $ | 14,501,162 | | |
| | 6,300 | | | General Electric Capital Corp., MTN, 4.248%, 1/5/09(1) | | | 6,300,067 | | |
| | | | | | | $ | 20,801,229 | | |
| Household Products — 0.6% | | | |
| $ | 5,000 | | | Procter & Gamble Co., MTN, 2.844%, 9/9/09(1) | | $ | 5,000,000 | | |
| | 8,600 | | | Proctor & Gamble International Co., 2.879%, 2/19/09(1) | | | 8,600,000 | | |
| | | | | | | $ | 13,600,000 | | |
| Insurance — 0.9% | | | |
| $ | 21,350 | | | MetLife Global Funding I, 4.57%, 11/9/09(1)(3) | | $ | 21,350,000 | | |
| | | | | | | $ | 21,350,000 | | |
Total Corporate Bonds & Notes
(identified cost $453,276,768) | | $ | 453,276,768 | | |
| U.S. Government Agency Obligations — 61.7% | | | |
Principal Amount
(000's omitted) | |
Security | |
Value | |
| | | | | Federal Home Loan Bank: | | | | | |
| $ | 11,000 | | | 0.82%, 2/18/09 | | $ | 11,000,000 | | |
| | 15,000 | | | 2.817%, 9/10/09 | | | 15,000,000 | | |
| | 43,950 | | | Discount Note, 0.03%, 11/4/08 | | | 43,949,890 | | |
Principal Amount
(000's omitted) | |
Security | |
Value | |
| $ | 4,468 | | | Discount Note, 0.05%, 11/4/08 | | $ | 4,467,981 | | |
| | 50,000 | | | Discount Note, 1.10%, 11/6/08 | | | 49,992,361 | | |
| | 65,000 | | | Discount Note, 1.00%, 11/13/08 | | | 64,978,333 | | |
| | 50,000 | | | Discount Note, 1.00%, 11/14/08 | | | 49,981,944 | | |
| | 10,219 | | | Discount Note, 1.00%, 11/18/08 | | | 10,214,174 | | |
| | 50,000 | | | Discount Note, 1.25%, 11/18/08 | | | 49,970,486 | | |
| | 16,914 | | | Discount Note, 1.25%, 11/20/08 | | | 16,902,841 | | |
| | 25,000 | | | Discount Note, 0.15%, 11/21/08 | | | 24,997,917 | | |
| | 22,472 | | | Discount Note, 1.20%, 11/21/08 | | | 22,457,019 | | |
| | 42,107 | | | Discount Note, 0.253%, 11/24/08 | | | 42,100,194 | | |
| | 15,000 | | | Discount Note, 1.087%, 11/24/08 | | | 14,989,583 | | |
| | 50,000 | | | Discount Note, 1.25%, 11/25/08 | | | 49,970,486 | | |
| | 30,000 | | | Discount Note, 1.00%, 11/26/08 | | | 29,979,167 | | |
| | 50,000 | | | Discount Note, 1.00%, 11/28/08 | | | 49,962,500 | | |
| | 75,000 | | | Discount Note, 1.20%, 11/28/08 | | | 74,932,500 | | |
| | 15,399 | | | Discount Note, 1.00%, 12/1/08 | | | 15,386,167 | | |
| | 25,000 | | | Discount Note, 1.75%, 1/27/09 | | | 24,894,271 | | |
| | 20,000 | | | Discount Note, 2.827%, 3/4/09 | | | 19,806,822 | | |
| | 12,300 | | | Discount Note, 2.841%, 3/17/09 | | | 12,167,988 | | |
| | 25,000 | | | Discount Note, 2.34%, 4/9/09 | | | 24,741,625 | | |
| | | | | | | $ | 722,844,249 | | |
| | | | | Federal Home Loan Mortgage Corp.: | | | | | |
| $ | 8,600 | | | 2.80%, 6/29/09 | | $ | 8,600,000 | | |
| | 25,000 | | | Discount Note, 1.10%, 11/5/08 | | | 24,996,944 | | |
| | 10,000 | | | Discount Note, 2.53%, 11/10/08 | | | 9,993,675 | | |
| | 19,677 | | | Discount Note, 1.00%, 11/26/08 | | | 19,663,335 | | |
| | 50,000 | | | Discount Note, 1.62%, 2/2/09 | | | 49,790,750 | | |
| | 5,000 | | | Discount Note, 2.65%, 2/2/09 | | | 4,965,771 | | |
| | 30,000 | | | Discount Note, 2.60%, 2/10/09 | | | 29,781,167 | | |
| | 24,000 | | | Discount Note, 2.60%, 2/18/09 | | | 23,811,067 | | |
| | 25,000 | | | Discount Note, 2.15%, 2/26/09 | | | 24,825,313 | | |
| | 50,000 | | | Discount Note, 2.15%, 2/27/09 | | | 49,647,639 | | |
| | 50,000 | | | Discount Note, 2.175%, 3/30/09 | | | 49,549,896 | | |
| | 15,090 | | | Discount Note, 2.20%, 3/31/09 | | | 14,951,675 | | |
| | | | | | | $ | 310,577,232 | | |
| | | | | Federal National Mortgage Association: | | | | | |
| $ | 5,994 | | | Discount Note, 1.00%, 11/10/08 | | $ | 5,992,502 | | |
| | 20,000 | | | Discount Note, 2.38%, 11/14/08 | | | 19,982,811 | | |
| | 11,535 | | | Discount Note, 0.20%, 11/17/08 | | | 11,533,975 | | |
| | 11,135 | | | Discount Note, 0.15%, 11/19/08 | | | 11,134,165 | | |
| | 22,345 | | | Discount Note, 1.00%, 11/24/08 | | | 22,330,724 | | |
| | 16,790 | | | Discount Note, 1.72%, 1/12/09 | | | 16,732,242 | | |
| | 17,468 | | | Discount Note, 1.80%, 1/28/09 | | | 17,391,141 | | |
| | 25,000 | | | Discount Note, 2.15%, 2/9/09 | | | 24,850,695 | | |
| | 25,000 | | | Discount Note, 2.60%, 2/9/09 | | | 24,819,444 | | |
See notes to financial statements
18
Cash Management Portfolio as of October 31, 2008
PORTFOLIO OF INVESTMENTS CONT'D
Principal Amount
(000's omitted) | |
Security | |
Value | |
| $ | 25,000 | | | Discount Note, 2.60%, 2/17/09 | | $ | 24,805,000 | | |
| | 25,000 | | | Discount Note, 2.60%, 2/20/09 | | | 24,799,583 | | |
| | 50,000 | | | Discount Note, 1.77%, 2/23/09 | | | 49,719,750 | | |
| | 25,000 | | | Discount Note, 1.80%, 2/24/09 | | | 24,856,250 | | |
| | 13,063 | | | Discount Note, 2.10%, 2/27/09 | | | 12,973,083 | | |
| | 50,000 | | | Discount Note, 1.70%, 3/11/09 | | | 49,693,056 | | |
| | 15,000 | | | Discount Note, 2.68%, 3/18/09 | | | 14,847,017 | | |
| | 15,000 | | | Discount Note, 2.75%, 3/19/09 | | | 14,841,875 | | |
| | 17,705 | | | Discount Note, 1.75%, 3/25/09 | | | 17,581,065 | | |
| | | | | | | $ | 388,884,378 | | |
Total U.S. Government Agency Obligations
(identified cost $1,422,305,859) | | $ | 1,422,305,859 | | |
Total Investments — 99.9%
(identified cost $2,304,943,891)(4) | | $ | 2,304,943,891 | | |
| Other Assets, Less Liabilities — 0.1% | | $ | 2,032,591 | | |
| Net Assets — 100.0% | | $ | 2,306,976,482 | | |
AMCAR - AmeriCredit Automobile Receivables Trust
FHLB - Federal Home Loan Bank
FHLMC - Federal Home Loan Mortgage Corporation (Freddie Mac)
FNMA - Federal National Mortgage Association (Fannie Mae)
FORDO - Ford Credit Auto Owner Trust
HAROT - Honda Auto Receivables Owner Trust
HART - Hyundai Auto Receivables Trust
JDOT - John Deere Owner Trust
MTN - Medium-Term Note
(1) Variable rate obligation. The stated interest rate represents the rate in effect at October 31, 2008.
(2) A security which has been issued under section 4(2) of the Securities Act of 1933 and is generally regarded as restricted and illiquid. This security may be resold in transactions exempt from registration or to the public if the security is registered. All such securities held are deemed liquid based on criteria and procedures authorized by the Trustees.
(3) Security exempt from registration under Rule 144A of the Securities Act of 1933. These securities may be sold in transactions exempt from registration, normally to qualified institutional buyers. At October 31, 2008, the aggregate value of the securities is $257,984,039 or 11.2% of the Portfolio's net assets.
(4) Cost for federal income taxes is the same.
See notes to financial statements
19
Cash Management Portfolio as of October 31, 2008
FINANCIAL STATEMENTS
Statement of Assets and Liabilities
As of October 31, 2008
| Assets | |
| Investments, at amortized cost | | $ | 2,304,943,891 | | |
| Cash | | | 133 | | |
| Interest receivable | | | 3,259,101 | | |
| Total assets | | $ | 2,308,203,125 | | |
| Liabilities | |
| Payable to affiliate for investment adviser fee | | $ | 1,078,560 | | |
| Payable to affiliate for Trustees' fees | | | 5,499 | | |
| Accrued expenses | | | 142,584 | | |
| Total liabilities | | $ | 1,226,643 | | |
| Net Assets applicable to investors' interest in Portfolio | | $ | 2,306,976,482 | | |
| Sources of Net Assets | |
| Net proceeds from capital contributions and withdrawals | | $ | 2,306,976,482 | | |
| Total | | $ | 2,306,976,482 | | |
Statement of Operations
For the Year Ended
October 31, 2008
| Investment Income | |
| Interest | | $ | 82,019,897 | | |
| Total investment income | | $ | 82,019,897 | | |
| Expenses | |
| Investment adviser fee | | $ | 11,223,304 | | |
| Trustees' fees and expenses | | | 52,371 | | |
| Custodian fee | | | 295,976 | | |
| Legal and accounting services | | | 84,441 | | |
| Miscellaneous | | | 72,286 | | |
| Total expenses | | $ | 11,728,378 | | |
Deduct —
Reduction of custodian fee | | $ | 169 | | |
| Total expense reductions | | $ | 169 | | |
| Net expenses | | $ | 11,728,209 | | |
| Net investment income | | $ | 70,291,688 | | |
| Realized Gain (Loss) | |
Net realized gain (loss) —
Investment transactions (identified cost basis) | | $ | (2,656,769 | ) | |
| Net realized loss | | $ | (2,656,769 | ) | |
| Net increase in net assets from operations | | $ | 67,634,919 | | |
See notes to financial statements
20
Cash Management Portfolio as of October 31, 2008
FINANCIAL STATEMENTS CONT'D
Statements of Changes in Net Assets
| Increase (Decrease) in Net Assets | | Year Ended
October 31, 2008 | | Period Ended
October 31, 2007(1) | | Year Ended
December 31, 2006 | |
From operations —
Net investment income | | $ | 70,291,688 | | | $ | 86,990,719 | | | $ | 12,890,290 | | |
Net realized loss from investment transactions, payments by affiliate and the disposal of investments
which did not meet the Portfolio's investment guidelines | | | (2,656,769 | ) | | | (196 | ) | | | (2,730 | ) | |
| Net increase in net assets from operations | | $ | 67,634,919 | | | $ | 86,990,523 | | | $ | 12,887,560 | | |
Capital transactions —
Contributions | | $ | 28,466,153,328 | | | $ | 24,122,874,395 | | | $ | 3,903,906,779 | | |
| Withdrawals | | | (27,928,406,024 | ) | | | (23,798,494,086 | ) | | | (2,773,384,656 | ) | |
| Net increase in net assets from capital transactions | | $ | 537,747,304 | | | $ | 324,380,309 | | | $ | 1,130,522,123 | | |
| Net increase in net assets | | $ | 605,382,223 | | | $ | 411,370,832 | | | $ | 1,143,409,683 | | |
| Net Assets | |
| At beginning of period | | $ | 1,701,594,259 | | | $ | 1,290,223,427 | | | $ | 146,813,744 | | |
| At end of period | | $ | 2,306,976,482 | | | $ | 1,701,594,259 | | | $ | 1,290,223,427 | | |
(1) For the ten months ended October 31, 2007.
See notes to financial statements
21
Cash Management Portfolio as of October 31, 2008
FINANCIAL STATEMENTS CONT'D
Supplementary Data
| | | Year Ended | | Period Ended | | Year Ended December 31, | |
| | | October 31, 2008 | | October 31, 2007(1) | | 2006 | | 2005 | | 2004 | | 2003 | |
| Ratios/Supplemental Data | |
| Ratios (As a percentage of average daily net assets): | |
| Expenses before custodian fee reduction(2) | | | 0.50 | % | | | 0.51 | %(3) | | | 0.54 | % | | | 0.60 | % | | | 0.59 | % | | | 0.57 | % | |
| Net investment income | | | 3.02 | % | | | 4.88 | %(3) | | | 4.67 | % | | | 2.63 | % | | | 0.78 | % | | | 0.59 | % | |
| Total Return | | | 3.10 | % | | | 4.14 | %(5) | | | 4.60 | %(4) | | | 2.67 | %(4) | | | 0.78 | % | | | 0.60 | % | |
(1) For the ten months ended October 31, 2007. The Portfolio changed its fiscal year-end from December 31 to October 31.
(2) Excludes the effect of custody fee credits, if any, of less than 0.005%.
(3) Annualized.
(4) During the years ended December 31, 2006 and December 31, 2005, the investment adviser reimbursed the Portfolio for net losses realized on the disposal of investments which did not meet the Portfolio's investment guidelines. The reimbursement had no effect on total return for the years ended December 31, 2006 and December 31, 2005.
(5) Not annualized.
See notes to financial statements
22
Cash Management Portfolio as of October 31, 2008
NOTES TO FINANCIAL STATEMENTS
1 Significant Accounting Policies
Cash Management Portfolio (the Portfolio) is a New York trust registered under the Investment Company Act of 1940, as amended (the 1940 Act), as a diversified, open-end management investment company. The Portfolio's investment objective is to provide as high a rate of income as may be consistent with preservation of capital and maintenance of liquidity. The Declaration of Trust permits the Trustees to issue interests in the Portfolio. At October 31, 2008, Eaton Vance Cash Management Fund and Eaton Vance Money Market Fund held an interest of 14.9% and 6.6%, respectively, in the Portfolio. The Portfolio is also available to other portfolios and funds managed by Boston Management and Research (BMR) and Eaton Vance Management (EVM) and its affiliates for short-term investment purposes. At October 31, 2008, other portfolios and funds managed by BMR and EVM and its affiliates held interests totaling 78.5% of the Portfolio's net assets , of which Large-Cap Value Portfolio held a greater than 10% interest (19.9%).
The following is a summary of significant accounting policies of the Portfolio. The policies are in conformity with accounting principles generally accepted in the United States of America.
A Investment Valuation — The Portfolio values its investment securities utilizing the amortized cost valuation technique permitted by Rule 2a-7 of the 1940 Act, pursuant to which the Portfolio must comply with certain conditions. This technique involves initially valuing a portfolio security at its cost and thereafter assuming a constant amortization to maturity of any discount or premium. If amortized cost is determined not to approximate fair value, the Portfolio may value its investment securities based on available market quotations provided by a pricing service.
B Investment Transactions — Investment transactions for financial statement purposes are accounted for on a trade date basis. Realized gains and losses on investments sold are determined on the basis of identified cost.
C Income — Interest income is recorded on the basis of interest accrued, adjusted for amortization of premium or accretion of discount.
D Federal Taxes — The Portfolio has elected to be treated as a partnership for federal tax purposes. No provision is made by the Portfolio for federal or state taxes on any taxable income of the Portfolio because each investor in the Portfolio is ultimately responsible for the payment of any taxes on its share of taxable income. Since at least one of the Portfolio's investors is a regulated investment company that invests all or substantially all of its assets in the Portfolio, the Portfolio normally must satisfy the applicable source of income and diversification requirements (under the Internal Revenue Code) in order for its investors to satisfy them. The Portfolio will allocate, at least annually a mong its investors, each investor's distributive share of the Portfolio's net investment income, net realized capital gains and any other items of income, gain, loss, deduction or credit.
As of October 31, 2008, the Portfolio had no uncertain tax positions that would require financial statement recognition, de-recognition, or disclosure. Each of the Portfolio's federal tax returns filed in the 3-year period ended October 31, 2008 remains subject to examination by the Internal Revenue Service.
E Expense Reduction — State Street Bank and Trust Company (SSBT) serves as custodian of the Portfolio. Pursuant to the custodian agreement, SSBT receives a fee reduced by credits, which are determined based on the average daily cash balance the Portfolio maintains with SSBT. All credit balances, if any, used to reduce the Portfolio's custodian fees are reported as a reduction of expenses in the Statement of Operations.
F Use of Estimates — The preparation of the financial statements in conformity with accounting principles generally accepted in the United States of America requires management to make estimates and assumptions that affect the reported amounts of assets and liabilities at the date of the financial statements and the reported amounts of income and expense during the reporting period. Actual results could differ from those estimates.
G Indemnifications — Under the Portfolio's organizational documents, its officers and Trustees may be indemnified against certain liabilities and expenses arising out of the performance of their duties to the Portfolio. Interestholders in the Portfolio are jointly and severally liable for the liabilities and obligations of the Portfolio in the event that the Portfolio fails to satisfy such liabilities and obligations; provided, however, that, to the extent assets are available in the Portfolio, the Portfolio may, under certain circumstances, indemnify interestholders from and against any claim or liability to which such holder may become subject by reason of being or having been an interestholder in the Portfolio. Additionally, in the normal course of business, the Portfo lio enters into agreements with service providers that may contain indemnification clauses. The
23
Cash Management Portfolio as of October 31, 2008
NOTES TO FINANCIAL STATEMENTS CONT'D
Portfolio's maximum exposure under these arrangements is unknown as this would involve future claims that may be made against the Portfolio that have not yet occurred.
2 Investment Adviser Fee and Other Transactions with Affiliates
The investment adviser fee is earned by BMR, a subsidiary of EVM, as compensation for investment advisory services rendered to the Portfolio. Pursuant to the investment advisory agreement and subsequent fee reduction agreement between the Portfolio and BMR, the fee is computed at an annual rate 0.50% of the Portfolio's average daily net assets up to $1 billion, 0.475% from $1 billion up to $2 billion, 0.450% from $2 billion up to $5 billion, and at reduced rates as net assets exceed that level, and is payable monthly. The fee reduction cannot be terminated without the consent of the Trustees and shareholders. For the year ended October 31, 2008, the adviser fee was 0.48% of the Portfolio's average daily net assets and amounted to $11,223,304.
Except for Trustees of the Portfolio who are not members of EVM's or BMR's organizations, officers and Trustees receive remuneration for their services to the Portfolio out of the investment adviser fee. Certain officers and Trustees of the Portfolio are officers of the above organizations.
3 Purchases and Sales of Investments
Purchases and sales of investments, including maturities and paydowns, for the year ended October 31, 2008 were as follows:
| Purchases | |
| Investments (non-U.S. Government) | | $ | 51,467,141,602 | | |
| U.S. Government and Agency Securities | | | 3,283,706,468 | | |
| | | $ | 54,750,848,070 | | |
| Sales | |
| Investments (non-U.S. Government) | | $ | 1,647,616,225 | | |
| U.S. Government and Agency Securities | | | 1,500,894,558 | | |
| | | $ | 3,148,510,783 | | |
4 Line of Credit
The Portfolio participates with other portfolios and funds managed by EVM and its affiliates in a $450 million unsecured line of credit agreement with a group of banks. Borrowings are made by the Portfolio solely to facilitate the handling of unusual and/or unanticipated short-term cash requirements. Interest is charged to the Portfolio based on its borrowings at an amount above either the Eurodollar rate or Federal Funds rate. In addition, a fee computed at an annual rate of 0.10% on the daily unused portion of the line of credit is allocated among the participating portfolios and funds at the end of each quarter. The Portfolio did not have any significant borrowings or allocated fees during the year ended October 31, 2008.
5 Recently Issued Accounting Pronouncement
In September 2006, the Financial Accounting Standards Board issued Statement of Financial Accounting Standards No. 157 (FAS 157), "Fair Value Measurements". FAS 157 defines fair value, establishes a framework for measuring fair value in accordance with accounting principals generally accepted in the United States of America and expands disclosure about fair value measurements. FAS 157 is effective for fiscal years beginning after November 15, 2007. As of October 31, 2008, management does not believe the adoption of FAS 157 will impact the amounts reported in the financial statements; however, additional disclosures may be required about the inputs used to develop the measurements of fair value and the effect of certain of the measurements on changes in net assets for the period.
24
Eaton Vance Cash Management Portfolio as of October 31, 2008
REPORT OF INDEPENDENT REGISTERED PUBLIC ACCOUNTING FIRM
To the Trustees and Investors of Cash Management Portfolio:
We have audited the accompanying statement of assets and liabilities of Cash Management Portfolio (the "Portfolio"), including the portfolio of investments, as of October 31, 2008, and the related statement of operations for the year then ended, and the statement of changes in net assets and the supplementary data for the year then ended and for the period from January 1, 2007 to October 31, 2007. These financial statements and supplementary data are the responsibility of the Portfolio's management. Our responsibility is to express an opinion on these financial statements and supplementary data based on our audits. The statement of changes in net assets for the year ended December 31, 2006, and the supplementary data for the year ended December 31, 2006 and all prior periods presented were audited by other auditors. Those auditors expressed an unqualified opinion on those financial statements and supplementary data in their repo rt dated February 21, 2007.
We conducted our audits in accordance with the standards of the Public Company Accounting Oversight Board (United States). Those standards require that we plan and perform the audit to obtain reasonable assurance about whether the financial statements and supplementary data are free of material misstatement. The Portfolio is not required to have, nor were we engaged to perform, an audit of its internal control over financial reporting. Our audit included consideration of internal control over financial reporting as a basis for designing audit procedures that are appropriate in the circumstances, but not for the purpose of expressing an opinion on the effectiveness of the Portfolio's internal control over financial reporting. Accordingly, we express no such opinion. An audit also includes examining, on a test basis, evidence supporting the amounts and disclosures in the financial statements, assessing the accounting principles us ed and significant estimates made by management, as well as evaluating the overall financial statement presentation. Our procedures included confirmation of securities owned as of October 31, 2007, by correspondence with the custodian and brokers; where replies were not received from brokers, we performed other auditing procedures. We believe that our audits provide a reasonable basis for our opinion.
In our opinion, the financial statements and supplementary data referred to above present fairly, in all material respects, the financial position of Cash Management Portfolio as of October 31, 2008, the results of its operations for the year then ended, and the changes in its net assets and the supplementary data for the year then ended and for the period from January 1, 2007 to October 31, 2007, in conformity with accounting principles generally accepted in the United States of America.
DELOITTE & TOUCHE LLP
Boston, Massachusetts
December 15, 2008
25
Eaton Vance Money Market Funds
Cash Management Portfolio
SPECIAL MEETING OF SHAREHOLDERS (Unaudited)
Eaton Vance Cash Management Fund
The Fund held a Special Meeting of Shareholders on November 14, 2008 to elect Trustees. The results of the vote were as follows:
| | | Number of Shares | |
| Nominee for Trustee | | For | | Withheld | |
| Benjamin C. Esty | | | 413,408,961 | | | | 3,955,337 | | |
| Thomas E. Faust Jr. | | | 413,395,858 | | | | 3,968,440 | | |
| Allen R. Freedman | | | 413,391,534 | | | | 3,972,763 | | |
| William H. Park | | | 413,395,858 | | | | 3,968,440 | | |
| Ronald A. Pearlman | | | 413,391,534 | | | | 3,972,763 | | |
| Helen Frame Peters | | | 413,395,858 | | | | 3,968,440 | | |
| Heidi L. Steiger | | | 413,395,858 | | | | 3,968,440 | | |
| Lynn A. Stout | | | 413,395,858 | | | | 3,968,440 | | |
| Ralph F. Verni | | | 413,378,431 | | | | 3,985,866 | | |
Each nominee was also elected a Trustee of the Cash Management Portfolio.
Eaton Vance Money Market Fund
The Fund held a Special Meeting of Shareholders on November 14, 2008 to elect Trustees. The results of the vote were as follows:
| | | Number of Shares | |
| Nominee for Trustee | | For | | Withheld | |
| Benjamin C. Esty | | | 79,954,436 | | | | 866,348 | | |
| Thomas E. Faust Jr. | | | 79,911,472 | | | | 909,313 | | |
| Allen R. Freedman | | | 79,904,356 | | | | 916,428 | | |
| William H. Park | | | 79,961,552 | | | | 859,233 | | |
| Ronald A. Pearlman | | | 79,913,229 | | | | 907,556 | | |
| Helen Frame Peters | | | 79,950,772 | | | | 870,013 | | |
| Heidi L. Steiger | | | 79,989,029 | | | | 831,755 | | |
| Lynn A. Stout | | | 80,000,852 | | | | 819,933 | | |
| Ralph F. Verni | | | 79,944,082 | | | | 876,703 | | |
Each nominee was also elected a Trustee of the Cash Management Portfolio.
Cash Management Portfolio
The Cash Management Portfolio held a Special Meeting of Interestholders on November 14, 2008 to elect Trustees. The results of the vote were as follows:
| | | Interest in the Portfolio | |
| Nominee for Trustee | | For | | Withheld | |
| Benjamin C. Esty | | | 99 | % | | | 1 | % | |
| Thomas E. Faust Jr. | | | 99 | % | | | 1 | % | |
| Allen R. Freedman | | | 99 | % | | | 1 | % | |
| William H. Park | | | 99 | % | | | 1 | % | |
| Ronald A. Pearlman | | | 99 | % | | | 1 | % | |
| Helen Frame Peters | | | 99 | % | | | 1 | % | |
| Heidi L. Steiger | | | 99 | % | | | 1 | % | |
| Lynn A. Stout | | | 99 | % | | | 1 | % | |
| Ralph F. Verni | | | 99 | % | | | 1 | % | |
Results are rounded to the nearest whole number.
26
Eaton Vance Money Market Funds
BOARD OF TRUSTEES' ANNUAL APPROVAL OF THE INVESTMENT ADVISORY AGREEMENT
Overview of the Contract Review Process
The Investment Company Act of 1940, as amended (the "1940 Act"), provides, in substance, that each investment advisory agreement between a fund and its investment adviser will continue in effect from year to year only if its continuance is approved at least annually by the fund's board of trustees, including by a vote of a majority of the trustees who are not "interested persons" of the fund ("Independent Trustees"), cast in person at a meeting called for the purpose of considering such approval.
At a meeting of the Boards of Trustees (each a "Board") of the Eaton Vance group of mutual funds (the "Eaton Vance Funds") held on April 21, 2008, the Board, including a majority of the Independent Trustees, voted to approve continuation of existing advisory and sub-advisory agreements for the Eaton Vance Funds for an additional one-year period. In voting its approval, the Board relied upon the affirmative recommendation of the Contract Review Committee of the Board (formerly the Special Committee), which is a committee comprised exclusively of Independent Trustees. Prior to making its recommendation, the Contract Review Committee reviewed information furnished for a series of meetings of the Contract Review Committee held in February, March and April 2008. Such information included, among other things, the following:
Information about Fees, Performance and Expenses
• An independent report comparing the advisory and related fees paid by each fund with fees paid by comparable funds;
• An independent report comparing each fund's total expense ratio and its components to comparable funds;
• An independent report comparing the investment performance of each fund to the investment performance of comparable funds over various time periods;
• Data regarding investment performance in comparison to relevant peer groups of funds and appropriate indices;
• Comparative information concerning fees charged by each adviser for managing other mutual funds and institutional accounts using investment strategies and techniques similar to those used in managing the fund;
• Profitability analyses for each adviser with respect to each fund;
Information about Portfolio Management
• Descriptions of the investment management services provided to each fund, including the investment strategies and processes employed, and any changes in portfolio management processes and personnel;
• Information concerning the allocation of brokerage and the benefits received by each adviser as a result of brokerage allocation, including information concerning the acquisition of research through "soft dollar" benefits received in connection with the funds' brokerage, and the implementation of a soft dollar reimbursement program established with respect to the funds;
• Data relating to portfolio turnover rates of each fund;
• The procedures and processes used to determine the fair value of fund assets and actions taken to monitor and test the effectiveness of such procedures and processes;
Information about each Adviser
• Reports detailing the financial results and condition of each adviser;
• Descriptions of the qualifications, education and experience of the individual investment professionals whose responsibilities include portfolio management and investment research for the funds, and information relating to their compensation and responsibilities with respect to managing other mutual funds and investment accounts;
• Copies of the Codes of Ethics of each adviser and its affiliates, together with information relating to compliance with and the administration of such codes;
• Copies of or descriptions of each adviser's proxy voting policies and procedures;
• Information concerning the resources devoted to compliance efforts undertaken by each adviser and its affiliates on behalf of the funds (including descriptions of various compliance programs) and their record of compliance with investment policies and restrictions, including policies with respect to market-timing, late trading and selective portfolio disclosure, and with policies on personal securities transactions;
• Descriptions of the business continuity and disaster recovery plans of each adviser and its affiliates;
Other Relevant Information
• Information concerning the nature, cost and character of the administrative and other non-investment management services provided by Eaton Vance Management and its affiliates;
• Information concerning management of the relationship with the custodian, subcustodians and fund accountants by each adviser or the funds' administrator; and
• The terms of each advisory agreement.
27
Eaton Vance Money Market Funds
BOARD OF TRUSTEES' ANNUAL APPROVAL OF THE INVESTMENT ADVISORY AGREEMENT CONT'D
In addition to the information identified above, the Contract Review Committee considered information provided from time to time by each adviser throughout the year at meetings of the Board and its committees. Over the course of the twelve-month period ended April 30, 2008, the Board met eleven times and the Contract Review Committee, the Audit Committee and the Governance Committee, each of which is a Committee comprised solely of Independent Trustees, met twelve, seven and five times, respectively. At such meetings, the Trustees received, among other things, presentations by the portfolio managers and other investment professionals of each adviser relating to the investment performance of each fund and the investment strategies used in pursuing the fund's investment objective. The Portfolio Management Committee and the Compliance Reports and Regulatory Matters Committee are newly established and did not meet during the twelve- month period ended April 30, 2008.
For funds that invest through one or more underlying portfolios, the Board considered similar information about the portfolio(s) when considering the approval of advisory agreements. In addition, in cases where the fund's investment adviser has engaged a sub-adviser, the Board considered similar information about the sub-adviser when considering the approval of any sub-advisory agreement.
The Contract Review Committee was assisted throughout the contract review process by Goodwin Procter LLP, legal counsel for the Independent Trustees. The members of the Contract Review Committee relied upon the advice of such counsel and their own business judgment in determining the material factors to be considered in evaluating each advisory and sub-advisory agreement and the weight to be given to each such factor. The conclusions reached with respect to each advisory and sub-advisory agreement were based on a comprehensive evaluation of all the information provided and not any single factor. Moreover, each member of the Contract Review Committee may have placed varying emphasis on particular factors in reaching conclusions with respect to each advisory and sub-advisory agreement.
Results of the Process
Based on its consideration of the foregoing, and such other information as it deemed relevant, including the factors and conclusions described below, the Contract Review Committee concluded that the continuance of the investment advisory agreement of the Cash Management Portfolio (the "Portfolio"), the portfolio in which the Eaton Vance Cash Management Fund and the Eaton Vance Money Market Fund (the "Funds") invest, with Boston Management and Research (the "Adviser"), including its fee structure, is in the interests of shareholders and, therefore, the Contract Review Committee recommended to the Board approval of the agreement. The Board accepted the recommendation of the Contract Review Committee as well as the factors considered and conclusions reached by the Contract Review Committee with respect to the agreement. Accordingly, the Board, including a majority of the Independent Trustees, voted to approve continuation of the in vestment advisory agreement for the Portfolio.
Nature, Extent and Quality of Services
In considering whether to approve the investment advisory agreement of the Portfolio, the Board evaluated the nature, extent and quality of services provided to the Portfolio by the Adviser.
The Board also considered the Adviser's management capabilities and investment process with respect to the types of investments held by the Portfolio, including the education, experience and number of its investment professionals and other personnel who provide portfolio management, investment research, and similar services to the Portfolio. The Board specifically noted the Adviser's experience in managing portfolios consisting of high quality money market instruments and short-term obligations. The Board also took into account the resources dedicated to portfolio management and other services, including the compensation paid to recruit and retain investment personnel, and the time and attention devoted to the Portfolio by senior management.
The Board reviewed the compliance programs of the Adviser and relevant affiliates thereof. Among other matters, the Board considered compliance and reporting matters relating to personal trading by investment personnel, selective disclosure of portfolio holdings, late trading, frequent trading, portfolio valuation, business continuity and the allocation of investment opportunities. The Board also evaluated the responses of the Adviser and its affiliates to requests from regulatory authorities such as the Securities and Exchange Commission.
The Board considered shareholder and other administrative services provided or managed by Eaton Vance Management and its affiliates, including transfer agency and accounting services. The Board evaluated the benefits to shareholders of investing in a fund that is a part of a large family of funds, including the ability, in many cases, to exchange an investment among different funds without incurring additional sales charges. Each Fund is maintained by the Adviser primarily as an administrative convenience for shareholders of other Eaton Vance Funds and is not actively marketed to the public as a stand-alone investment product.
After consideration of the foregoing factors, among others, the Board concluded that the nature, extent and quality of services provided by the Adviser, taken as a whole, are appropriate and consistent with the terms of the investment advisory agreement.
28
Eaton Vance Money Market Funds
BOARD OF TRUSTEES' ANNUAL APPROVAL OF THE INVESTMENT ADVISORY AGREEMENT CONT'D
Fund Performance
The Board compared each Fund's investment performance to a relevant universe of similarly managed funds identified by an independent data provider and appropriate benchmark indices. The Board reviewed comparative performance data for the one-, three-, five- and ten-year periods ended September 30, 2007 for each Fund. The Board concluded that the performance of each Fund was satisfactory.
Management Fees and Expenses
The Board reviewed contractual investment advisory fee rates, including any administrative fee rates, payable by the Portfolio and each Fund (referred to collectively as "management fees"). As part of its review, the Board considered the management fees and each Fund's total expense ratio for the year ended September 30, 2007, as compared to a group of similarly managed funds selected by an independent data provider. The Board considered that the Adviser had waived fees and/or paid expenses for the Fund.
After reviewing the foregoing information, and in light of the nature, extent and quality of the services provided by the Adviser, the Board concluded that the management fees charged for advisory and related services and each Fund's total expense ratio are reasonable.
Profitability
The Board reviewed the level of profits realized by the Adviser and relevant affiliates thereof in providing investment advisory and administrative services to the Portfolio, each Fund and to all Eaton Vance Funds as a group. The Board considered the level of profits realized without regard to revenue sharing or other payments by the Adviser and its affiliates to third parties in respect of distribution services. The Board also considered other direct or indirect benefits received by the Adviser and its affiliates in connection with its relationship with the Portfolio and the Fund, including the benefits of research services that may be available to the Adviser as a result of securities transactions effected for the Portfolio and other advisory clients.
The Board concluded that, in light of the foregoing factors and the nature, extent and quality of the services rendered, the profits realized by the Adviser and its affiliates are reasonable.
Economies of Scale
In reviewing management fees and profitability, the Board also considered the extent to which the Adviser and its affiliates, on the one hand, and the Funds, on the other hand, can expect to realize benefits from economies of scale as the assets of the Funds and the Portfolio increase. The Board acknowledged the difficulty in accurately measuring the benefits resulting from the economies of scale with respect to the management of any specific fund or group of funds. The Board reviewed data summarizing the increases and decreases in the assets of the Funds and of all Eaton Vance Funds as a group over various time periods, and evaluated the extent to which the total expense ratio of each Fund and the profitability of the Adviser and its affiliates may have been affected by such increases or decreases. Based upon the foregoing, the Board concluded that the benefits from economies of scale are currently being shared equitably by the Adviser and its affiliates and each Fund. The Board also concluded that, assuming reasonably foreseeable increases in the assets of the Portfolio, the structure of the advisory fee, which includes breakpoints at several asset levels, can be expected to cause the Adviser and its affiliates and the Funds to continue to share such benefits equitably.
29
Eaton Vance Money Market Funds
MANAGEMENT AND ORGANIZATION
Fund Management. The Trustees of Eaton Vance Mutual Funds Trust (the Trust) and Cash Management Portfolio (the Portfolio) are responsible for the overall management and supervision of the Trust's and Portfolio's affairs. The Trustees and officers of the Trust and the Portfolio are listed below. Except as indicated, each individual has held the office shown or other offices in the same company for the last five years. Trustees and officers of the Trust and the Portfolio hold indefinite terms of office. The "noninterested Trustees" consist of those Trustees who are not "interested persons" of the Trust and the Portfolio, as that term is defined under the 1940 Act. The business address of each Trustee and officer is The Eaton Vance Building, 255 State Street, Boston, Massachusetts 02109. As used below, "EVC" refers to Eaton Vance Corp., "EV" refers to Eaton Van ce, Inc., "EVM" refers to Eaton Vance Management, "BMR" refers to Boston Management and Research, "EVD" refers to Eaton Vance Distributors, Inc. and "Parametric" refers to Parametric Portfolio Associates. EVC and EV are the corporate parent and trustee, respectively, of EVM and BMR. EVD is the Funds' principal underwriter, the Portfolio's placement agent and a wholly-owned subsidiary of EVC. Each officer affiliated with Eaton Vance may hold a position with other Eaton Vance affiliates that is comparable to his or her position with EVM listed below.
Name and
Date of Birth | | Position(s)
with the
Trust and
the Portfolio | | Term of
Office and
Length of
Service | |
Principal Occupation(s)
During Past Five Years | | Number of Portfolios
in Fund Complex
Overseen By
Trustee(1) | |
Other Directorships Held | |
| Interested Trustee | | | | | | | | | | | | | |
|
| Thomas E. Faust Jr. 5/31/58 | | Trustee and President of the Trust | | Trustee since 2007 and President of the Trust since 2002 | | Chairman, Chief Executive Officer and President of EVC, Director and President of EV, Chief Executive Officer and President of EVM and BMR, and Director of EVD. Trustee and/or Officer of 173 registered investment companies and 4 private companies managed by EVM or BMR. Mr. Faust is an interested person because of his positions with EVM, BMR, EVD, EVC and EV, which are affiliates of the Trust and Portfolio. | | | 173 | | | Director of EVC | |
|
| Noninterested Trustees | | | | | | | | | | | | | |
|
| Benjamin C. Esty 1/2/63 | | Trustee | | Since 2005 | | Roy and Elizabeth Simmons Professor of Business Administration, Harvard University Graduate School of Business Administration. | | | 173 | | | None | |
|
| Allen R. Freedman 4/3/40 | | Trustee | | Since 2007 | | Former Chairman (2002-2004) and a Director (1983-2004) of Systems & Computer Technology Corp. (provider of software to higher education). Formerly, a Director of Loring Ward International (fund distributor) (2005-2007). Formerly, Chairman and a Director of Indus International, Inc. (provider of enterprise management software to the power generating industry) (2005-2007). | | | 173 | | | Director of Assurant, Inc. and Stonemor Partners L.P. (owner and operator of cemeteries) | |
|
| William H. Park 9/19/47 | | Trustee | | Since 2003 | | Vice Chairman, Commercial Industrial Finance Corp. (specialty finance company) (since 2006). Formerly, President and Chief Executive Officer, Prizm Capital Management, LLC (investment management firm) (2002-2005). | | | 173 | | | None | |
|
| Ronald A. Pearlman 7/10/40 | | Trustee | | Since 2003 | | Professor of Law, Georgetown University Law Center. | | | 173 | | | None | |
|
| Helen Frame Peters 3/22/48 | | Trustee | | Since 2008 | | Professor of Finance, Carroll School of Management, Boston College (since 2003). Adjunct Professor of Finance, Peking University, Beijing, China (since 2005). Formerly, Dean, Carroll School of Management, Boston College (2000-2003). | | | 173 | | | Director of Federal Home Loan Bank of Boston (a bank for banks) and BJ's Wholesale Clubs (wholesale club retailer); Trustee of SPDR Index Shares Funds and SPDR Series Trust (exchange traded funds) | |
|
30
Eaton Vance Money Market Funds
MANAGEMENT AND ORGANIZATION CONT'D
Name and
Date of Birth | | Position(s)
with the
Trust and
the Portfolio | | Term of
Office and
Length of
Service | |
Principal Occupation(s)
During Past Five Years | | Number of Portfolios
in Fund Complex
Overseen By
Trustee(1) | |
Other Directorships Held | |
| Noninterested Trustees (continued) | | | | | | | | | | | | | |
|
| Heidi L. Steiger 7/8/53 | | Trustee | | Since 2007 | | Managing Partner, Topridge Associates LLC (global wealth management firm) (since 2008); Senior Advisor (since 2008), President (2005-2008), Lowenhaupt Global Advisors, LLC (global wealth management firm). Formerly, President and Contributing Editor, Worth Magazine (2004-2005). Formerly, Executive Vice President and Global Head of Private Asset Management (and various other positions), Neuberger Berman (investment firm) (1986-2004). | | | 173 | | | Director of Nuclear Electric Insurance Ltd. (nuclear insurance provider) and Aviva USA (insurance provider) | |
|
| Lynn A. Stout 9/14/57 | | Trustee | | Since 1998 | | Paul Hastings Professor of Corporate and Securities Law (since 2006) and Professor of Law (2001-2006), University of California at Los Angeles School of Law. | | | 173 | | | None | |
|
| Ralph F. Verni 1/26/43 | | Chairman of the Board and Trustee | | Chairman of the Board since 2007 and Trustee since 2005 | | Consultant and private investor. | | | 173 | | | None | |
|
| Principal Officers who are not Trustees | | | | | | | |
|
Name and
Date of Birth | | Position(s)
with the
Trust and
the Portfolio | | Term of
Office and
Length of
Service | | Principal Occupation(s)
During Past Five Years | |
| William H. Ahern, Jr. 7/28/59 | | Vice President of the Trust | | Since 1995 | | Vice President of EVM and BMR. Officer of 75 registered investment companies managed by EVM or BMR. | |
|
John R. Baur
2/10/70 | | Vice President of the Trust | | Since 2007 | | Vice President of EVM and BMR. Previously, attended Johnson Graduate School of Management, Cornell University (2002-2005), and prior thereto he was an Account Team Representative in Singapore for Applied Materials Inc. Officer of 33 registered investment companies managed by EVM or BMR. | |
|
Michael A. Cirami
12/24/75 | | Vice President of the Trust | | Since 2007 | | Vice President of EVM and BMR. Previously, attended the University of Rochester William E. Simon Graduate School of Business Administration (2001-2003), and prior thereto he was a Team Leader for the Institutional Services Group for State Street Bank in Luxembourg. Officer of 33 registered investment companies managed by EVM or BMR. | |
|
Cynthia J. Clemson
3/2/63 | | Vice President of the Trust | | Since 2005 | | Vice President of EVM and BMR. Officer of 90 registered investment companies managed by EVM or BMR. | |
|
Charles B. Gaffney
12/4/72 | | Vice President of the Trust | | Since 2007 | | Vice President of EVM and BMR. Previously, Sector Portfolio Manager and Senior Equity Analyst of Brown Brothers Harriman (1997-2003). Officer of 30 registered investment companies managed by EVM or BMR. | |
|
Christine M. Johnston
11/9/72 | | Vice President of the Trust | | Since 2007 | | Vice President of EVM and BMR. Officer of 35 registered investment companies managed by EVM or BMR. | |
|
Aamer Khan
6/7/60 | | Vice President of the Trust | | Since 2005 | | Vice President of EVM and BMR. Officer of 33 registered investment companies managed by EVM or BMR. | |
|
Duke E. Laflamme
7/8/69 | | President of the Portfolio | | Since 2008 | | Vice President of EVM and BMR. Officer of 19 registered investment companies managed by EVM or BMR. | |
|
Thomas H. Luster
4/8/62 | | Vice President | | Of the Trust since 2006 and of the Portfolio since 2002 | | Vice President of EVM and BMR. Officer of 51 registered investment companies managed by EVM or BMR. | |
|
Robert B. MacIntosh
1/22/57 | | Vice President of the Trust | | Since 1998 | | Vice President of EVM and BMR. Officer of 90 registered investment companies managed by EVM or BMR. | |
|
31
Eaton Vance Money Market Funds
MANAGEMENT AND ORGANIZATION CONT'D
Name and
Date of Birth | | Position(s)
with the
Trust and
the Portfolio | | Term of
Office and
Length of
Service | | Principal Occupation(s)
During Past Five Years | |
| Principal Officers who are not Trustees (continued) | | | | | | | |
|
Duncan W. Richardson
10/26/57 | | Vice President of the Trust | | Since 2001 | | Executive Vice President and Chief Equity Investment Officer of EVC, EVM and BMR. Officer of 81 registered investment companies managed by EVM or BMR. | |
|
Judith A. Saryan
8/21/54 | | Vice President of the Trust | | Since 2003 | | Vice President of EVM and BMR. Officer of 55 registered investment companies managed by EVM or BMR. | |
|
Susan Schiff
3/13/61 | | Vice President of the Trust | | Since 2002 | | Vice President of EVM and BMR. Officer of 36 registered investment companies managed by EVM or BMR. | |
|
Thomas Seto
9/27/62 | | Vice President of the Trust | | Since 2007 | | Vice President and Director of Portfolio Management of Parametric. Officer of 31 registered investment companies managed by EVM or BMR. | |
|
David M. Stein
5/4/51 | | Vice President of the Trust | | Since 2007 | | Managing Director and Chief Investment Officer of Parametric. Officer of 31 registered investment companies managed by EVM or BMR. | |
|
Mark S. Venezia
5/23/49 | | Vice President of the Trust | | Since 2007 | | Vice President of EVM and BMR. Officer of 36 registered investment companies managed by EVM or BMR. | |
|
Adam A. Weigold
3/22/75 | | Vice President of the Trust | | Since 2007 | | Vice President of EVM and BMR. Officer of 71 registered investment companies managed by EVM or BMR. | |
|
Barbara E. Campbell
6/19/57 | | Treasurer | | Of the Trust since 2005 and of the Portfolio since 2008(2) | | Vice President of EVM and BMR. Officer of 173 registered investment companies managed by EVM or BMR. | |
|
| Maureen A. Gemma 5/24/60 | | Secretary and Chief Legal Officer | | Secretary since 2007 and Chief Legal Officer since 2008 | | Vice President of EVM and BMR. Officer of 173 registered investment companies managed by EVM or BMR. | |
|
| Paul M. O'Neil 7/11/53 | | Chief Compliance Officer | | Since 2004 | | Vice President of EVM and BMR. Officer of 173 registered investment companies managed by EVM or BMR. | |
|
(1) Includes both master and feeder funds in a master-feeder structure.
(2) Prior to 2008, Ms. Campbell served as Assistant Treasurer of the Portfolio since 1998.
The SAI for the Funds includes additional information about the Trustees and officers of the Funds and the Portfolio and can be obtained without charge on Eaton Vance's website at www.eatonvance.com or by calling 1-800-262-1122.
32
Investment Adviser of Cash Management Portfolio
Boston Management and Research
The Eaton Vance Building
255 State Street
Boston, MA 02109
Fund Administrator
Eaton Vance Management
The Eaton Vance Building
255 State Street
Boston, MA 02109
Principal Underwriter
Eaton Vance Distributors, Inc.
The Eaton Vance Building
255 State Street
Boston, MA 02109
(617) 482-8260
Custodian
State Street Bank and Trust Company
200 Clarendon Street
Boston, MA 02116
Transfer Agent
PNC Global Investment Servicing
Attn: Eaton Vance Funds
P.O. Box 9653
Providence, RI 02940-9653
(800) 262-1122
Independent Registered Public Accounting Firm
Deloitte & Touche LLP
200 Berkeley Street
Boston, MA 02116-5022
Eaton Vance Mutual Funds Trust
The Eaton Vance Building
255 State Street
Boston, MA 02109
This report must be preceded or accompanied by a current prospectus. Before investing, investors should consider carefully a Fund's investment objective(s), risks, and charges and expenses. The Funds' current prospectus contains this and other information about the Funds and is available through your financial advisor. Please read the prospectus carefully before you invest or send money. For further information please call 1-800-262-1122.
131-12/08 MMSRC

Annual Report October 31, 2008


EATON VANCE
TAX-MANAGED
EQUITY ASSET
ALLOCATION
FUND
IMPORTANT NOTICES REGARDING PRIVACY,
DELIVERY OF SHAREHOLDER DOCUMENTS,
PORTFOLIO HOLDINGS AND PROXY VOTING
Privacy. The Eaton Vance organization is committed to ensuring your financial privacy. Each of the financial institutions identified below has in effect the following policy ("Privacy Policy") with respect to nonpublic personal information about its customers:
• Only such information received from you, through application forms or otherwise, and information about your Eaton Vance fund transactions will be collected. This may include information such as name, address, social security number, tax status, account balances and transactions.
• None of such information about you (or former customers) will be disclosed to anyone, except as permitted by law (which includes disclosure to employees necessary to service your account). In the normal course of servicing a customer's account, Eaton Vance may share information with unaffiliated third parties that perform various required services such as transfer agents, custodians and broker/dealers.
• Policies and procedures (including physical, electronic and procedural safeguards) are in place that are designed to protect the confidentiality of such information.
• We reserve the right to change our Privacy Policy at any time upon proper notification to you. Customers may want to review our Policy periodically for changes by accessing the link on our homepage: www.eatonvance.com.
Our pledge of privacy applies to the following entities within the Eaton Vance organization: the Eaton Vance Family of Funds, Eaton Vance Management, Eaton Vance Investment Counsel, Boston Management and Research, and Eaton Vance Distributors, Inc.
In addition, our Privacy Policy only applies to those Eaton Vance customers who are individuals and who have a direct relationship with us. If a customer's account (i.e., fund shares) is held in the name of a third-party financial adviser/ broker-dealer, it is likely that only such adviser's privacy policies apply to the customer. This notice supersedes all previously issued privacy disclosures.
For more information about Eaton Vance's Privacy Policy, please call 1-800-262-1122.
Delivery of Shareholder Documents. The Securities and Exchange Commission (the "SEC") permits funds to deliver only one copy of shareholder documents, including prospectuses, proxy statements and shareholder reports, to fund investors with multiple accounts at the same residential or post office box address. This practice is often called "householding" and it helps eliminate duplicate mailings to shareholders.
Eaton Vance, or your financial adviser, may household the mailing of your documents indefinitely unless you instruct Eaton Vance, or your financial adviser, otherwise.
If you would prefer that your Eaton Vance documents not be householded, please contact Eaton Vance at 1-800-262-1122, or contact your financial adviser.
Your instructions that householding not apply to delivery of your Eaton Vance documents will be effective within 30 days of receipt by Eaton Vance or your financial adviser.
Portfolio Holdings. Each Eaton Vance Fund and its underlying Portfolio (if applicable) will file a schedule of its portfolio holdings on Form N-Q with the SEC for the first and third quarters of each fiscal year. The Form N-Q will be available on the Eaton Vance website www.eatonvance.com, by calling Eaton Vance at 1-800-262-1122 or in the EDGAR database on the SEC's website at www.sec.gov. Form N-Q may also be reviewed and copied at the SEC's public reference room in Washington, D.C. (call 1-800-732-0330 for information on the operation of the public reference room).
Proxy Voting. From time to time, funds are required to vote proxies related to the securities held by the funds. The Eaton Vance Funds or their underlying Portfolios (if applicable) vote proxies according to a set of policies and procedures approved by the Funds' and Portfolios' Boards. You may obtain a description of these policies and procedures and information on how the Funds or Portfolios voted proxies relating to portfolio securities during the most recent 12 month period ended June 30, without charge, upon request, by calling 1-800-262-1122. This description is also available on the SEC's website at www.sec.gov.
Eaton Vance Tax-Managed Equity Asset Allocation Fund as of October 31, 2008
MANAGEMENT’S DISCUSSION OF FUND PERFORMANCE

| |
Duncan W. Richardson, CFA
Portfolio Manager | |
Economic and Market Conditions
· Major equity indices moved dramatically lower during the year that ended October 31, 2008. After reaching record highs in October 2007, financial markets were beset by the growing credit and housing crisis and evidence of a global economic slowdown. By the summer of 2008, the magnitude of the damage caused by the subprime mortgage situation became increasingly apparent, as investors witnessed bank failures, bankruptcies and multi-billion dollar government bailouts. Governments and central banks across the globe took unprecedented measures to restore investor confidence and liquidity, instituting interest rate cuts and injecting billions of dollars into the financial system.
· Dampened economic and earnings expectations led to one positive outcome: dissipating concern about inflation, as commodity prices corrected from the historic highs reached in mid-summer. The commodity price retrenchment was also positive for the U.S. dollar, which strengthened relative to other major currencies.
· Against this backdrop, all 10 economic sectors of the Russell 3000 Index (the Index) posted negative returns for the year.(1) Traditionally defensive sectors, such as the health care and consumer staples sectors, were the best relative performers of the Index, while the telecommunications, financials and information technology sectors were the worst.
Management Discussion
· Amid this highly volatile environment, the Fund’s(2) returns slightly trailed those of the Index, while outperforming the average return of the Lipper Multi-Cap Core Funds peer group for the year ended October 31, 2008.(1) The Fund’s returns reflect the performance of the seven underlying Portfolios in which it invests, as well as its allocation among these Portfolios.
· During the period, management made two allocation changes. Collectively, the new allocation targets decreased the Fund’s overall mid-cap exposure in favor of large-cap and small-cap investments and international exposure in favor of domestic. Relative to the Fund’s allocation at October 31, 2007, the new targets reflected an increase of approximately 1% to Tax-Managed Small-Cap Portfolio, 1.5% to Tax-Managed Small-Cap Value Portfolio, 0.5% to Tax-Managed Value Portfolio and a decrease of approximately 1% from Tax-Managed Multi-Cap Growth Portfolio, 1% from Tax-Managed Mid-Cap Core Portfolio and 1% from Tax-Managed International Equity Portfolio.
· The decision to decrease international and domestic mid-cap investments was directionally correct, as international investments (characterized by the MSCI EAFE Index) and domestic mid-cap stocks (characterized by the Russell Mid-Cap Index) on average underperformed domestic and small-cap investments (as measured by the S&P 500 Index and Russell 2000 Index, respectively) from the time of the allocation change through October 31, 2008.(1)
Eaton Vance Tax-Managed Equity Asset Allocation Fund
Total Return Performance 10/31/07 – 10/31/08
Class A(3) | | -37.07 | % |
Class B(3) | | -37.56 | |
Class C(3) | | -37.60 | |
Russell 3000 Index(1) | | -36.60 | |
Lipper Multi-Cap Core Funds Average(1) | | -38.42 | |
See pages 3 and 4 for more performance information, including after-tax returns.
(1) | It is not possible to invest directly in an Index or a Lipper Classification. The Index’s total return does not reflect commissions or expenses that would have been incurred if an investor individually purchased or sold the securities represented in the Index. The Lipper total return is the average total return, at net asset value, of the funds that are in the same Lipper Classification as the Fund. |
(2) | The Fund currently invests all of its investable assets in seven equity portfolios managed by Eaton Vance Management or its affiliates. |
(3) | These returns do not include the 5.75% maximum sales charge for Class A shares or the applicable contingent deferred sales charge (CDSC) for Class B or Class C shares. If sales charges were deducted, the returns would be lower. |
Past performance is no guarantee of future results. Returns are historical and are calculated by determining the percentage change in net asset value or offering price (as applicable) with all distributions reinvested. Investment return and principal value will fluctuate so that shares, when redeemed, may be worth more or less than their original cost. Performance is for the stated time period only; due to market volatility, the Fund’s current performance may be lower or higher than the quoted return. For performance as of the most recent month end, please refer to www.eatonvance.com.
Fund shares are not insured by the FDIC and are not deposits or other obligations of, or guaranteed by, any depository institution. Shares are subject to investment risks, including possible loss of principal invested.
1
· Despite a slight reduction in the Fund’s exposure to international securities, returns were negatively impacted by a drastic turnaround in the performance of international markets, which fell sharply towards the end of the fiscal year after several years of outperforming domestic securities. The Fund’s investments in the underlying multi-cap and small-cap portfolios also detracted from Fund returns.
· The Fund benefited from its continued emphasis of small-cap value and mid-cap investments. The Fund also retained its emphasis of growth stocks over value stocks by emphasizing growth Portfolios. Making positive contributions to Fund relative returns were the underlying small-cap growth, mid-cap core, large-cap growth and large-cap value portfolios.
· Given investors’ concerns about the credit crunch and increased financial and economic pressures on consumers, continued market volatility is likely. We believe that the Fund’s multi-cap and multi-style asset exposure provides for generally better diversification, and the potential for lower volatility, in such market conditions. In allocating the Fund’s assets among the Portfolios, management seeks to maintain broad diversification and emphasize market sectors it believes offer relatively attractive risk-adjusted return prospects based on its assessment of current and future market trends and conditions.
· In closing, I would like to thank my fellow shareholders for their continued confidence and participation in the Eaton Vance Tax-Managed Equity Asset Allocation Fund.
Lipper Quintile Rankings(1)
By total return at 10/31/08
EATON VANCE TAX-MANAGED EQUITY ASSET ALLOCATION FUND CLASS A
LIPPER MULTI-CAP CORE FUNDS CLASSIFICATION
Period | | Quintile | | Ranking |
1 Year | | 2nd | | 264 of 791 funds |
3 Years | | 1st | | 32 of 635 funds |
5 Years | | 1st | | 40 of 448 funds |
(1) | Source: Lipper Inc. Rankings are based on percentage change in net asset value with all distributions reinvested and do not take sales charges into consideration. Past performance is no guarantee of future results. It is not possible to invest in a Lipper Classification. |
Fund Composition
Current Allocations(2)
By net assets
*As of 09/01/08, the Portfolio name changed from Tax-Managed Small-Cap Growth Portfolio.
(2) | As a percentage of the Fund’s net assets as of 10/31/08. You may obtain free copies of each of the Portfolios’ most recent financial statements by contacting Eaton Vance Distributors, Inc. at 1-800-225-6265 or from the EDGAR database on the Securities and Exchange Commission’s website (www.sec.gov). |
The views expressed throughout this report are those of the portfolio manager and are current only through the end of the period of the report as stated on the cover. These views are subject to change at any time based upon market or other conditions, and the investment adviser disclaims any responsibility to update such views. These views may not be relied on as investment advice and, because investment decisions for a fund are based on many factors, may not be relied on as an indication of trading intent on behalf of any Eaton Vance fund. Information provided in the report may not be representative of the Fund’s current or future investments and may change due to active management.
2
Eaton Vance Tax-Managed Equity Asset Allocation Fund as of October 31, 2008
FUND PERFORMANCE
The line graph and table set forth below provide information about the Fund’s performance. The line graph compares the performance of Class A of the Fund with that of the Russell 3000 Index, a broad-based, unmanaged market index of 3,000 U.S. stocks. The lines on the graph represent the total returns of a hypothetical investment of $10,000 in each of Class A and the Russell 3000 Index. Class A total returns are presented at net asset value and maximum public offering price. The table includes the total returns of each Class of the Fund at net asset value and maximum public offering price. The performance presented below does not reflect the deduction of taxes, if any, that a shareholder would pay on distributions or redemption of Fund shares.
* Source: Lipper Inc. Class A of the Fund commenced investment operations on 3/4/02.
A $10,000 hypothetical investment at net asset value in Class B shares and Class C shares on 3/4/02 (commencement of operations) would have been valued at $10,682 and $10,657, respectively, on 10/31/08. It is not possible to invest directly in an Index. The Index’s total return does not reflect commissions or expenses that would have been incurred if an investor individually purchased or sold the securities represented in the Index.
Performance(1)
Share Class Symbol | | Class A
EAEAX | | Class B
EBEAX | | Class C
ECEAX | |
Average Annual Total Returns (at net asset value) | | | | | | | |
One Year | | -37.07 | % | -37.56 | % | -37.60 | % |
Five Years | | 2.44 | | 1.67 | | 1.67 | |
Life of Fund† | | 1.72 | | 0.99 | | 0.96 | |
| | | | | | | |
SEC Average Annual Total Returns (including sales charge or applicable CDSC) | | | | | | | |
One Year | | -40.69 | % | -40.51 | % | -38.18 | % |
Five Years | | 1.23 | | 1.31 | | 1.67 | |
Life of Fund† | | 0.82 | | 0.99 | | 0.96 | |
†Inception Dates – Class A: 3/4/02; Class B: 3/4/02; Class C: 3/4/02
(1) | Average Annual Total Returns do not include the 5.75% maximum sales charge for Class A shares or the applicable contingent deferred sales charge (CDSC) for Class B and Class C shares. If sales charges were deducted, the returns would be lower. SEC Average Annual Total Returns for Class A reflect the maximum 5.75% sales charge. SEC returns for Class B shares reflect the applicable CDSC based on the following schedule: 5% - 1st and 2nd years; 4% - 3rd year; 3% - 4th year; 2% - 5th year; 1% - 6th year. SEC returns for Class C reflect a 1% CDSC for the first year. |
Total Annual
Operating Expenses(2)
| | Class A | | Class B | | Class C | |
Expense Ratio | | 1.35 | % | 2.10 | % | 2.10 | % |
(2) | Source: Prospectus dated 3/1/08. |
Past performance is no guarantee of future results. Returns are historical and are calculated by determining the percentage change in net asset value or offering price (as applicable) with all distributions reinvested. Investment return and principal value will fluctuate so that shares, when redeemed, may be worth more or less than their original cost. Performance is for stated time period only; due to market volatility, the Fund’s current performance may be lower or higher than the quoted return. For performance as of the most recent month end, please refer to www.eatonvance.com.
3
“Return Before Taxes” does not take into consideration shareholder taxes. It is most relevant to tax-free or tax-deferred shareholder accounts. “Return After Taxes on Distributions” reflects the impact of federal income taxes due on Fund distributions of dividends and capital gains. It is most relevant to taxpaying shareholders who continue to hold their shares. “Return After Taxes on Distributions and Sale of Fund Shares” also reflects the impact of taxes on capital gain or loss realized upon a sale of shares. It is most relevant to taxpaying shareholders who sell their shares.
Average Annual Total Returns
(For the periods ended October 31, 2008)
Returns at Net Asset Value (NAV) (Class A)
| | One Year | | Five Years | | Life of Fund | |
Return Before Taxes | | -37.07 | % | 2.44 | % | 1.72 | % |
Return After Taxes on Distributions | | -37.64 | | 2.10 | | 1.47 | |
Return After Taxes on Distributions and Sale of Fund Shares | | -22.73 | | 2.32 | | 1.65 | |
Returns at Public Offering Price (POP) (Class A)
| | One Year | | Five Years | | Life of Fund | |
Return Before Taxes | | -40.69 | % | 1.23 | % | 0.82 | % |
Return After Taxes on Distributions | | -41.22 | | 0.89 | | 0.57 | |
Return After Taxes on Distributions and Sale of Fund Shares | | -25.16 | | 1.28 | | 0.87 | |
Average Annual Total Returns
(For the periods ended October 31, 2008)
Returns at Net Asset Value (NAV) (Class B)
| | One Year | | Five Years | | Life of Fund | |
Return Before Taxes | | -37.56 | % | 1.67 | % | 0.99 | % |
Return After Taxes on Distributions | | -38.07 | | 1.35 | | 0.75 | |
Return After Taxes on Distributions and Sale of Fund Shares | | -23.17 | | 1.65 | | 1.01 | |
Returns at Public Offering Price (POP) (Class B)
| | One Year | | Five Years | | Life of Fund | |
Return Before Taxes | | -40.51 | % | 1.31 | % | 0.99 | % |
Return After Taxes on Distributions | | -41.02 | | 0.97 | | 0.75 | |
Return After Taxes on Distributions and Sale of Fund Shares | | -25.08 | | 1.34 | | 1.01 | |
Average Annual Total Returns
(For the periods ended October 31, 2008)
Returns at Net Asset Value (NAV) (Class C)
| | One Year | | Five Years | | Life of Fund | |
Return Before Taxes | | -37.60 | % | 1.67 | % | 0.96 | % |
Return After Taxes on Distributions | | -38.12 | | 1.33 | | 0.71 | |
Return After Taxes on Distributions and Sale of Fund Shares | | -23.15 | | 1.65 | | 0.99 | |
Returns at Public Offering Price (POP) (Class C)
| | One Year | | Five Years | | Life of Fund | |
Return Before Taxes | | -38.18 | % | 1.67 | % | 0.96 | % |
Return After Taxes on Distributions | | -38.71 | | 1.33 | | 0.71 | |
Return After Taxes on Distributions and Sale of Fund Shares | | -23.53 | | 1.65 | | 0.99 | |
Class A, Class B and Class C of the Fund commenced investment operations on 3/4/02. Returns at Public Offering Price (POP) reflect the deduction of the maximum initial sales charge and applicable CDSC, while Returns at Net Asset Value (NAV) do not.
After-tax returns are calculated using certain assumptions. After-tax returns are calculated using the highest historical individual federal income tax rates and do not reflect the impact of state and local taxes. Actual after-tax returns depend on a shareholder’s tax situation and the actual characterization of distributions and may differ from those shown. After-tax returns are not relevant to shareholders who hold shares in tax-deferred accounts or to shares held by non-taxable entities. Return After Taxes on Distributions for a period may be the same as Return Before Taxes for the same period because no taxable distributions were made during that period. Return After Taxes on Distributions and Sale of Fund Shares for a period may be greater than or equal to Return After Taxes on Distributions for the same period because of losses realized on the sale of Fund shares.
Past performance is no guarantee of future results. Returns are historical and are calculated by determining the percentage change in net asset value or offering price (as applicable) with all distributions reinvested. Investment return and principal value will fluctuate so that shares, when redeemed, may be worth more or less than their original cost. Performance is for the stated time period only; due to market volatility, the Fund’s current performance may be lower or higher than the quoted return. For performance as of the most recent month-end, please refer to www.eatonvance.com.
4
Eaton Vance Tax-Managed Equity Asset Allocation Fund as of October 31, 2008
FUND EXPENSES
Example: As a shareholder of the Fund, you incur two types of costs: (1) transaction costs, including sales charges (loads) on purchases and redemption fees (if applicable); and (2) ongoing costs, including management fees; distribution or service fees; and other Fund expenses. This Example is intended to help you understand your ongoing costs (in dollars) of investing in the Fund and to compare these costs with the ongoing costs of investing in other mutual funds. The Example is based on an investment of $1,000 invested at the beginning of the period and held for the entire period (May 1, 2008 – October 31, 2008).
Actual Expenses: The first section of the table below provides information about actual account values and actual expenses. You may use the information in this section, together with the amount you invested, to estimate the expenses that you paid over the period. Simply divide your account value by $1,000 (for example, an $8,600 account value divided by $1,000 = 8.6), then multiply the result by the number in the first section under the heading entitled "Expenses Paid During Period" to estimate the expenses you paid on your account during this period.
Hypothetical Example for Comparison Purposes: The second section of the table below provides information about hypothetical account values and hypothetical expenses based on the actual Fund expense ratio and an assumed rate of return of 5% per year (before expenses), which is not the actual return of the Fund. The hypothetical account values and expenses may not be used to estimate the actual ending account balance or expenses you paid for the period. You may use this information to compare the ongoing costs of investing in your Fund and other funds. To do so, compare this 5% hypothetical example with the 5% hypothetical examples that appear in the shareholder reports of the other funds.
Please note that the expenses shown in the table are meant to highlight your ongoing costs only and do not reflect any transactional costs, such as sales charges (loads) or redemption fees (if applicable). Therefore, the second section of the table is useful in comparing ongoing costs only, and will not help you determine the relative total costs of owning different funds. In addition, if these transactional costs were included, your costs would have been higher.
Eaton Vance Tax-Managed Equity Asset Allocation Fund
| | | Beginning Account Value
(5/1/08) | | Ending Account Value
(10/31/08) | | Expenses Paid During Period*
(5/1/08 – 10/31/08) | |
| Actual | |
| Class A | | $ | 1,000.00 | | | $ | 678.90 | | | $ | 5.78 | | |
| Class B | | $ | 1,000.00 | | | $ | 676.30 | | | $ | 8.93 | | |
| Class C | | $ | 1,000.00 | | | $ | 675.90 | | | $ | 8.93 | | |
| Hypothetical | |
| (5% return per year before expenses) | |
| Class A | | $ | 1,000.00 | | | $ | 1,018.20 | | | $ | 6.95 | | |
| Class B | | $ | 1,000.00 | | | $ | 1,014.50 | | | $ | 10.74 | | |
| Class C | | $ | 1,000.00 | | | $ | 1,014.50 | | | $ | 10.74 | | |
* Expenses are equal to the Fund's annualized expense ratio of 1.37% for Class A shares, 2.12% for Class B shares and 2.12% for Class C shares, multiplied by the average account value over the period, multiplied by 184/366 (to reflect the one-half year period). The Example assumes that the $1,000 was invested at the net asset value per share determined at the close of business on April 30, 2008. The Example reflects the expenses of both the Fund and the Portfolios.
5
Eaton Vance Tax-Managed Equity Asset Allocation Fund as of October 31, 2008
FINANCIAL STATEMENTS
Statement of Assets and Liabilities
As of October 31, 2008
| Assets | |
Investment in Tax-Managed Growth Portfolio, at value
(identified cost, $179,400,990) | | $ | 131,132,220 | | |
Investment in Tax-Managed Value Portfolio, at value
(identified cost, $112,377,590) | | | 130,126,245 | | |
Investment in Tax-Managed International Equity Portfolio, at value
(identified cost, $105,959,852) | | | 94,817,861 | | |
Investment in Tax-Managed Multi-Cap Growth Portfolio, at value
(identified cost, $58,192,286) | | | 55,458,572 | | |
Investment in Tax-Managed Mid-Cap Core Portfolio, at value
(identified cost, $44,507,877) | | | 44,669,470 | | |
Investment in Tax-Managed Small-Cap Portfolio, at value
(identified cost, $52,532,081) | | | 42,125,990 | | |
Investment in Tax-Managed Small-Cap Value Portfolio, at value
(identified cost, $34,225,874) | | | 35,260,876 | | |
| Receivable for Fund shares sold | | | 867,442 | | |
| Total assets | | $ | 534,458,676 | | |
| Liabilities | |
| Payable for Fund shares redeemed | | $ | 1,842,514 | | |
| Payable to affiliate for distribution and service fees | | | 295,459 | | |
| Payable to affiliate for administration fee | | | 69,388 | | |
| Payable to affiliate for investment adviser fee | | | 54,289 | | |
| Payable to affiliate for Trustees' fees | | | 42 | | |
| Accrued expenses | | | 193,859 | | |
| Total liabilities | | $ | 2,455,551 | | |
| Net Assets | | $ | 532,003,125 | | |
| Sources of Net Assets | |
| Paid-in capital | | $ | 607,548,747 | | |
Accumulated net realized loss from Portfolios (computed on the basis of
identified cost) | | | (23,068,625 | ) | |
| Accumulated undistributed net investment income | | | 1,128,319 | | |
Net unrealized depreciation from Portfolios (computed on the basis of
identified cost) | | | (53,605,316 | ) | |
| Total | | $ | 532,003,125 | | |
| Class A Shares | |
| Net Assets | | $ | 258,038,763 | | |
| Shares Outstanding | | | 25,814,621 | | |
Net Asset Value and Redemption Price Per Share
(net assets ÷ shares of beneficial interest outstanding) | | $ | 10.00 | | |
Maximum Offering Price Per Share
(100 ÷ 94.25 of $10.00) | | $ | 10.61 | | |
| Class B Shares | |
| Net Assets | | $ | 78,617,599 | | |
| Shares Outstanding | | | 8,218,278 | | |
Net Asset Value and Offering Price Per Share*
(net assets ÷ shares of beneficial interest outstanding) | | $ | 9.57 | | |
| Class C Shares | |
| Net Assets | | $ | 195,346,763 | | |
| Shares Outstanding | | | 20,494,577 | | |
Net Asset Value and Offering Price Per Share*
(net assets ÷ shares of beneficial interest outstanding) | | $ | 9.53 | | |
| On sales of $50,000 or more, the offering price of Class A shares is reduced. | |
* Redemption price per share is equal to the net asset value less any applicable contingent deferred sales charge.
Statement of Operations
For the Year Ended
October 31, 2008
| Investment Income | |
| Dividends allocated from Portfolios (net of foreign taxes, $593,451) | | $ | 14,775,821 | | |
| Interest allocated from Portfolios | | | 660,702 | | |
| Securities lending income allocated from Portfolios, net | | | 410,566 | | |
| Expenses allocated from Portfolios | | | (5,749,932 | ) | |
| Net investment income from Portfolios | | $ | 10,097,157 | | |
| Expenses | |
| Investment adviser fee | | $ | 717,599 | | |
| Administration fee | | | 1,144,608 | | |
| Trustees' fees and expenses | | | 1,869 | | |
Distribution and service fees
Class A | | | 885,391 | | |
| Class B | | | 1,261,588 | | |
| Class C | | | 2,827,568 | | |
| Transfer and dividend disbursing agent fees | | | 515,272 | | |
| Printing and postage | | | 79,542 | | |
| Custodian fee | | | 79,062 | | |
| Legal and accounting services | | | 73,783 | | |
| Registration fees | | | 54,749 | | |
| Miscellaneous | | | 15,530 | | |
| Total expenses | | $ | 7,656,561 | | |
| Net investment income | | $ | 2,440,596 | | |
Realized and Unrealized
Gain (Loss) from Portfolios | |
Net realized loss —
Investment transactions (identified cost basis) | | $ | (39,274,527 | ) | |
| Foreign currency transactions | | | (431,118 | ) | |
| Net realized loss | | $ | (39,705,645 | ) | |
Change in unrealized appreciation (depreciation) —
Investments (identified cost basis) | | $ | (289,728,102 | ) | |
| Foreign currency | | | (26,139 | ) | |
| Net change in unrealized appreciation (depreciation) | | $ | (289,754,241 | ) | |
| Net realized and unrealized loss | | $ | (329,459,886 | ) | |
| Net decrease in net assets from operations | | $ | (327,019,290 | ) | |
See notes to financial statements
6
Eaton Vance Tax-Managed Equity Asset Allocation Fund as of October 31, 2008
FINANCIAL STATEMENTS CONT'D
Statements of Changes in Net Assets
Increase (Decrease)
in Net Assets | | Year Ended
October 31, 2008 | | Year Ended
October 31, 2007 | |
From operations —
Net investment income | | $ | 2,440,596 | | | $ | 3,738,133 | | |
Net realized gain (loss) from investment
and foreign currency transactions | | | (39,705,645 | ) | | | 57,813,108 | | |
Net change in unrealized
appreciation (depreciation)
of investments and foreign currency | | | (289,754,241 | ) | | | 87,548,714 | | |
Net increase (decrease) in net assets
from operations | | $ | (327,019,290 | ) | | $ | 149,099,955 | | |
Distributions to shareholders —
From net investment income | |
| Class A | | $ | (3,525,890 | ) | | $ | — | | |
| Class B | | | (307,373 | ) | | | — | | |
| Class C | | | (1,116,756 | ) | | | — | | |
| From net realized gain | |
| Class A | | | (18,733,835 | ) | | | (7,086,640 | ) | |
| Class B | | | (7,733,495 | ) | | | (4,036,376 | ) | |
| Class C | | | (16,106,159 | ) | | | (6,336,074 | ) | |
| Total distributions to shareholders | | $ | (47,523,508 | ) | | $ | (17,459,090 | ) | |
Transactions in shares of beneficial interest —
Proceeds from sale of shares | |
| Class A | | $ | 108,627,108 | | | $ | 95,276,815 | | |
| Class B | | | 10,055,682 | | | | 12,224,925 | | |
| Class C | | | 66,054,098 | | | | 70,320,557 | | |
Net asset value of shares issued to
shareholders in payment of
distributions declared
Class A | | | 19,167,382 | | | | 6,172,624 | | |
| Class B | | | 7,018,431 | | | | 3,493,464 | | |
| Class C | | | 13,632,905 | | | | 4,981,960 | | |
Cost of shares redeemed
Class A | | | (81,113,575 | ) | | | (42,028,282 | ) | |
| Class B | | | (21,139,440 | ) | | | (17,824,069 | ) | |
| Class C | | | (54,699,083 | ) | | | (26,620,838 | ) | |
Net asset value of shares exchanged
Class A | | | 11,264,640 | | | | 9,473,074 | | |
| Class B | | | (11,264,640 | ) | | | (9,473,074 | ) | |
Net increase in net assets from Fund
share transactions | | $ | 67,603,508 | | | $ | 105,997,156 | | |
| Net increase (decrease) in net assets | | $ | (306,939,290 | ) | | $ | 237,638,021 | | |
| Net Assets | |
| At beginning of year | | $ | 838,942,415 | | | $ | 601,304,394 | | |
| At end of year | | $ | 532,003,125 | | | $ | 838,942,415 | | |
Accumulated undistributed net
investment income included in net assets | |
| At end of year | | $ | 1,128,319 | | | $ | 2,772,539 | | |
See notes to financial statements
7
Eaton Vance Tax-Managed Equity Asset Allocation Fund as of October 31, 2008
FINANCIAL STATEMENTS CONT'D
Financial Highlights
| | | Class A | |
| | | Year Ended October 31, | |
| | | 2008 | | 2007 | | 2006 | | 2005 | | 2004 | |
| Net asset value — Beginning of year | | $ | 16.900 | | | $ | 14.040 | | | $ | 12.100 | | | $ | 10.790 | | | $ | 9.930 | | |
| Income (loss) from operations | |
| Net investment income(1) | | $ | 0.102 | | | $ | 0.146 | (2) | | $ | 0.053 | | | $ | 0.018 | | | $ | 0.002 | | |
| Net realized and unrealized gain (loss) | | | (6.018 | ) | | | 3.110 | | | | 2.201 | | | | 1.292 | | | | 0.858 | | |
| Total income (loss) from operations | | $ | (5.916 | ) | | $ | 3.256 | | | $ | 2.254 | | | $ | 1.310 | | | $ | 0.860 | | |
| Less distributions | |
| From net investment income | | $ | (0.156 | ) | | $ | — | | | $ | — | | | $ | — | | | $ | — | | |
| From net realized gain | | | (0.828 | ) | | | (0.396 | ) | | | (0.314 | ) | | | — | | | | — | | |
| Total distributions | | $ | (0.984 | ) | | $ | (0.396 | ) | | $ | (0.314 | ) | | $ | — | | | $ | — | | |
| Net asset value — End of year | | $ | 10.000 | | | $ | 16.900 | | | $ | 14.040 | | | $ | 12.100 | | | $ | 10.790 | | |
| Total Return(3) | | | (37.07 | )% | | | 23.71 | % | | | 18.96 | % | | | 12.14 | % | | | 8.66 | %(4) | |
| Ratios/Supplemental Data | |
| Net assets, end of year (000's omitted) | | $ | 258,039 | | | $ | 374,979 | | | $ | 247,710 | | | $ | 169,704 | | | $ | 134,070 | | |
| Ratios (As a percentage of average daily net assets): | |
| Expenses before custodian fee reduction(5)(7) | | | 1.36 | % | | | 1.35 | % | | | 1.40 | % | | | 1.43 | %(6) | | | 1.46 | %(6) | |
| Net investment income | | | 0.72 | % | | | 0.96 | % | | | 0.41 | % | | | 0.15 | % | | | 0.02 | % | |
| Portfolio Turnover of Tax-Managed Growth Portfolio | | | 1 | % | | | 2 | % | | | 1 | % | | | 1 | % | | | 4 | % | |
| Portfolio Turnover of Tax-Managed Value Portfolio | | | 84 | % | | | 14 | % | | | 26 | % | | | 40 | % | | | 44 | % | |
| Portfolio Turnover of Tax-Managed International Equity Portfolio | | | 34 | % | | | 23 | % | | | 25 | % | | | 39 | % | | | 62 | % | |
| Portfolio Turnover of Tax-Managed Multi-Cap Growth Portfolio | | | 283 | % | | | 157 | % | | | 181 | % | | | 217 | % | | | 239 | % | |
| Portfolio Turnover of Tax-Managed Mid-Cap Core Portfolio | | | 40 | % | | | 38 | % | | | 55 | % | | | 53 | % | | | 42 | % | |
| Portfolio Turnover of Tax-Managed Small-Cap Portfolio | | | 93 | % | | | 78 | % | | | 99 | % | | | 223 | % | | | 282 | % | |
| Portfolio Turnover of Tax-Managed Small-Cap Value Portfolio | | | 103 | % | | | 80 | % | | | 49 | % | | | 24 | % | | | 12 | % | |
(1) Net investment income per share was compared using average shares outstanding.
(2) Net investment income per share reflects a dividend resulting from a corporate action allocated from Tax-Managed International Equity Portfolio which amounted to $0.029 per share. Excluding this dividend, the ratio of net investment income to average daily net assets would have been 0.77%.
(3) Returns are historical and are calculated by determining the percentage change in net asset value with all distributions reinvested.
(4) The effect of the net increase from payments by affiliate and net gains (losses) realized through the Fund's investment in Tax-Managed Small-Cap Portfolio (the Portfolio) on the disposal of investments purchased which did not meet the Portfolio's investment guidelines amounted to less than $0.01 per share and had no effect on total return for the year ended October 31, 2004.
(5) Includes the Fund's share of the Portfolios' allocated expenses.
(6) The investment adviser waived a portion of its investment adviser fee and/or the administrator subsidized certain operating expenses (equal to 0.01% of average daily net assets for the years ended October 31, 2005 and 2004).
(7) Excludes the effect of custody fee credits, if any, of less than 0.005%.
See notes to financial statements
8
Eaton Vance Tax-Managed Equity Asset Allocation Fund as of October 31, 2008
FINANCIAL STATEMENTS CONT'D
Financial Highlights
| | | Class B | |
| | | Year Ended October 31, | |
| | | 2008 | | 2007 | | 2006 | | 2005 | | 2004 | |
| Net asset value — Beginning of year | | $ | 16.210 | | | $ | 13.570 | | | $ | 11.800 | | | $ | 10.600 | | | $ | 9.830 | | |
| Income (loss) from operations | |
| Net investment income (loss)(1) | | $ | (0.004 | ) | | $ | 0.029 | (2) | | $ | (0.042 | ) | | $ | (0.068 | ) | | $ | (0.076 | ) | |
| Net realized and unrealized gain (loss) | | | (5.775 | ) | | | 3.007 | | | | 2.126 | | | | 1.268 | | | | 0.846 | | |
| Total income (loss) from operations | | $ | (5.779 | ) | | $ | 3.036 | | | $ | 2.084 | | | $ | 1.200 | | | $ | 0.770 | | |
| Less distributions | |
| From net investment income | | $ | (0.033 | ) | | $ | — | | | $ | — | | | $ | — | | | $ | — | | |
| From net realized gain | | | (0.828 | ) | | | (0.396 | ) | | | (0.314 | ) | | | — | | | | — | | |
| Total distributions | | $ | (0.861 | ) | | $ | (0.396 | ) | | $ | (0.314 | ) | | $ | — | | | $ | — | | |
| Net asset value — End of year | | $ | 9.570 | | | $ | 16.210 | | | $ | 13.570 | | | $ | 11.800 | | | $ | 10.600 | | |
| Total Return(3) | | | (37.56 | )% | | | 22.89 | % | | | 17.98 | % | | | 11.32 | % | | | 7.83 | %(4) | |
| Ratios/Supplemental Data | |
| Net assets, end of year (000's omitted) | | $ | 78,618 | | | $ | 154,094 | | | $ | 139,586 | | | $ | 123,431 | | | $ | 109,471 | | |
| Ratios (As a percentage of average daily net assets): | |
| Expenses before custodian fee reduction(5)(7) | | | 2.11 | % | | | 2.10 | % | | | 2.15 | % | | | 2.18 | %(6) | | | 2.21 | %(6) | |
| Net investment income (loss) | | | (0.03 | )% | | | 0.20 | % | | | (0.33 | )% | | | (0.59 | )% | | | (0.73 | )% | |
| Portfolio Turnover of Tax-Managed Growth Portfolio | | | 1 | % | | | 2 | % | | | 1 | % | | | 1 | % | | | 4 | % | |
| Portfolio Turnover of Tax-Managed Value Portfolio | | | 84 | % | | | 14 | % | | | 26 | % | | | 40 | % | | | 44 | % | |
| Portfolio Turnover of Tax-Managed International Equity Portfolio | | | 34 | % | | | 23 | % | | | 25 | % | | | 39 | % | | | 62 | % | |
| Portfolio Turnover of Tax-Managed Multi-Cap Growth Portfolio | | | 283 | % | | | 157 | % | | | 181 | % | | | 217 | % | | | 239 | % | |
| Portfolio Turnover of Tax-Managed Mid-Cap Core Portfolio | | | 40 | % | | | 38 | % | | | 55 | % | | | 53 | % | | | 42 | % | |
| Portfolio Turnover of Tax-Managed Small-Cap Portfolio | | | 93 | % | | | 78 | % | | | 99 | % | | | 223 | % | | | 282 | % | |
| Portfolio Turnover of Tax-Managed Small-Cap Value Portfolio | | | 103 | % | | | 80 | % | | | 49 | % | | | 24 | % | | | 12 | % | |
(1) Net investment income (loss) per share was computed using average shares outstanding.
(2) Net investment income per share reflects a dividend resulting from a corporate action allocated from Tax-Managed International Equity Portfolio which amounted to $0.028 per share. Excluding this dividend, the ratio of net investment income to average daily net assets would have been 0.01%.
(3) Returns are historical and are calculated by determining the percentage change in net asset value with all distributions reinvested.
(4) The effect of the net increase from payments by affiliate and net gains (losses) realized through the Fund's investment in Tax-Managed Small-Cap Portfolio (the Portfolio) on the disposal of investments purchased which did not meet the Portfolio's investment guidelines amounted to less than $0.01 per share and had no effect on total return for the year ended October 31, 2004.
(5) Includes the Fund's share of the Portfolios' allocated expenses.
(6) The investment adviser waived a portion of its investment adviser fee and/or the administrator subsidized certain operating expenses (equal to 0.01% of average daily net assets for the years ended October 31, 2005 and 2004).
(7) Excludes the effect of custody fee credits, if any, of less than 0.005%.
See notes to financial statements
9
Eaton Vance Tax-Managed Equity Asset Allocation Fund as of October 31, 2008
FINANCIAL STATEMENTS CONT'D
Financial Highlights
| | | Class C | |
| | | Year Ended October 31, | |
| | | 2008 | | 2007 | | 2006 | | 2005 | | 2004 | |
| Net asset value — Beginning of year | | $ | 16.180 | | | $ | 13.550 | | | $ | 11.780 | | | $ | 10.580 | | | $ | 9.810 | | |
| Income (loss) from operations | |
| Net investment income (loss)(1) | | $ | (0.004 | ) | | $ | 0.031 | (2) | | $ | (0.043 | ) | | $ | (0.068 | ) | | $ | (0.076 | ) | |
| Net realized and unrealized gain (loss) | | | (5.761 | ) | | | 2.995 | | | | 2.127 | | | | 1.268 | | | | 0.846 | | |
| Total income (loss) from operations | | $ | (5.765 | ) | | $ | 3.026 | | | $ | 2.084 | | | $ | 1.200 | | | $ | 0.770 | | |
| Less distributions | |
| From net investment income | | $ | (0.057 | ) | | $ | — | | | $ | — | | | $ | — | | | $ | — | | |
| From net realized gain | | | (0.828 | ) | | | (0.396 | ) | | | (0.314 | ) | | | — | | | | — | | |
| Total distributions | | $ | (0.885 | ) | | $ | (0.396 | ) | | $ | (0.314 | ) | | $ | — | | | $ | — | | |
| Net asset value — End of year | | $ | 9.530 | | | $ | 16.180 | | | $ | 13.550 | | | $ | 11.780 | | | $ | 10.580 | | |
| Total Return(3) | | | (37.60 | )% | | | 22.85 | % | | | 18.01 | % | | | 11.34 | % | | | 7.85 | %(4) | |
| Ratios/Supplemental Data | |
| Net assets, end of year (000's omitted) | | $ | 195,347 | | | $ | 309,869 | | | $ | 214,009 | | | $ | 158,138 | | | $ | 124,779 | | |
| Ratios (As a percentage of average daily net assets): | |
| Expenses before custodian fee reduction(5)(7) | | | 2.11 | % | | | 2.10 | % | | | 2.15 | % | | | 2.18 | %(6) | | | 2.21 | %(6) | |
| Net investment income (loss) | | | (0.03 | )% | | | 0.21 | % | | | (0.34 | )% | | | (0.59 | )% | | | (0.73 | )% | |
| Portfolio Turnover of Tax-Managed Growth Portfolio | | | 1 | % | | | 2 | % | | | 1 | % | | | 1 | % | | | 4 | % | |
| Portfolio Turnover of Tax-Managed Value Portfolio | | | 84 | % | | | 14 | % | | | 26 | % | | | 40 | % | | | 44 | % | |
| Portfolio Turnover of Tax-Managed International Equity Portfolio | | | 34 | % | | | 23 | % | | | 25 | % | | | 39 | % | | | 62 | % | |
| Portfolio Turnover of Tax-Managed Multi-Cap Growth Portfolio | | | 283 | % | | | 157 | % | | | 181 | % | | | 217 | % | | | 239 | % | |
| Portfolio Turnover of Tax-Managed Mid-Cap Core Portfolio | | | 40 | % | | | 38 | % | | | 55 | % | | | 53 | % | | | 42 | % | |
| Portfolio Turnover of Tax-Managed Small-Cap Portfolio | | | 93 | % | | | 78 | % | | | 99 | % | | | 223 | % | | | 282 | % | |
| Portfolio Turnover of Tax-Managed Small-Cap Value Portfolio | | | 103 | % | | | 80 | % | | | 49 | % | | | 24 | % | | | 12 | % | |
(1) Net investment income (loss) per share was computed using average shares outstanding.
(2) Net investment income per share reflects a dividend resulting from a corporate action allocated from Tax-Managed International Equity Portfolio which amounted to $0.028 per share. Excluding this dividend, the ratio of net investment income to average daily net assets would have been 0.02%.
(3) Returns are historical and are calculated by determining the percentage change in net asset value with all distributions reinvested.
(4) The effect of the net increase from payments by affiliate and net gains (losses) realized through the Fund's investment in Tax-Managed Small-Cap Portfolio (the Portfolio) on the disposal of investments purchased which did not meet the Portfolio's investment guidelines amounted to less than $0.01 per share and had no effect on total return for the year ended October 31, 2004.
(5) Includes the Fund's share of the Portfolios' allocated expenses.
(6) The investment adviser waived a portion of its investment adviser fee and/or the administrator subsidized certain operating expenses (equal to 0.01% of average daily net assets for the years ended October 31, 2005 and 2004).
(7) Excludes the effect of custody fee credits, if any, of less than 0.005%.
See notes to financial statements
10
Eaton Vance Tax-Managed Equity Asset Allocation Fund as of October 31, 2008
NOTES TO FINANCIAL STATEMENTS
1 Significant Accounting Policies
Eaton Vance Tax-Managed Equity Asset Allocation Fund (the Fund) is a diversified series of Eaton Vance Mutual Funds Trust (the Trust). The Trust is a Massachusetts business trust registered under the Investment Company Act of 1940, as amended (the 1940 Act), as an open-end management investment company. The Fund offers three classes of shares. Class A shares are generally sold subject to a sales charge imposed at time of purchase. Class B and Class C shares are sold at net asset value and are generally subject to a contingent deferred sales charge (see Note 5). Class B shares automatically convert to Class A shares eight years after their purchase as described in the Fund's prospectus. Each class represents a pro-rata interest in the Fund, but votes separately on class-specific matters and (as noted below) is subject to different expenses. Realized and unrealized gains and losses and net investment income and losses, other than class-specific expenses, are allocated daily to each class of shares based on the relative net assets of each class to the total net assets of the Fund. Each class of shares differs in its distribution plan and certain other class-specific expenses. The Fund's investment objective is to acheive long-term, after tax returns. The Fund currently pursues its objective by investing all of its investable assets in interests in the following seven tax-managed equity portfolios managed by Eaton Vance Management (EVM) or its affiliates: Tax-Managed Growth Portfolio, Tax-Managed Value Portfolio, Tax-Managed International Equity Portfolio, Tax-Managed Multi-Cap Growth Portfolio, Tax-Managed Mid-Cap Core Portfolio, Tax-Managed Small-Cap Portfolio (formerly, Tax-Managed Small-Cap Growth Portfolio) and Tax-Managed Small-Cap Value Portfolio (the Portfolios), which are New York trusts. The value of the Fund's investment in the Portfolios reflects the Fund's proportionate interest in the net assets of the Tax-Managed Growth Portfolio, Tax-Managed Value Portfolio, Tax-Managed International Equity Portfolio, Tax-Managed Multi-Cap Growth Portfolio, Tax-Managed Mid-Cap Core Portfolio, Tax-Managed Small-Cap Portfolio and Tax-Managed Small-Cap Value Portfolio, (1.1%, 9.6%, 41.8%, 39.5%, 64.4%, 26.8% and 57.1%, respectively, at October 31, 2008). The performance of the Fund is directly affected by the performance of the Portfolios. A copy of each Portfolio's financial statements is available on the EDGAR Database on the Securities and Exchange Commission's website (www.sec.gov), at the Commission's public reference room in Washington, DC or upon request from the Fund's principal underwriter, Eaton Vance Distributors, Inc. (EVD), by calling 1-800-225-6265.
The following is a summary of significant accounting policies of the Fund. The policies are in conformity with accounting principles generally accepted in the United States of America.
A Investment Valuation — The valuation policy of each Portfolio is as follows: Equity securities listed on a U.S. securities exchange generally are valued at the last sale price on the day of valuation or, if no sales took place on such date, at the mean between the closing bid and asked prices therefore on the exchange where such securities are principally traded. Equity securities listed on the NASDAQ Global or Global Select Market generally are valued at the NASDAQ official closing price. Unlisted or listed securities for which closing sales prices or closing quotations are not available are valued at the mean between the latest available bid and asked prices or, in the case of preferred equity securities that are not listed or traded in the over-the-counter market, by an independent pricing service. Short-term debt securities with a remaining maturity of sixty days or less are valued at amortized cost, which approximates market value. If short-term debt securities are acquired with a remaining maturity of more than sixty days, they will be valued by a pricing service. Foreign securities and currencies are valued in U.S. dollars, based on foreign currency exchange rate quotations supplied by an independent quotation service. The independent service uses a proprietary model to determine the exchange rate. Inputs to the model include reported trades and implied bid/ask spreads. The daily valuation of exchange-traded foreign securities generally is determined as of the close of trading on the principal exchange on which such securities trade. Events occurring after the close of trading on foreign exchanges may result in adjustments to the valuation of foreign securities to more accurately reflect their fair value as of the close of regular trading on the New York Stock Excha nge. When valuing foreign equity securities that meet certain criteria, the Trustees have approved the use of a fair value service that values such securities to reflect market trading that occurs after the close of the applicable foreign markets of comparable securities or other instruments that have a strong correlation to the fair-valued securities. Investments for which valuations or market quotations are not readily available are valued at fair value using methods determined in good faith by or at the direction of the Trustees of the Portfolios considering relevant factors, data and information including the market value of freely tradable securities of the same class in the principal market on which such securities are normally traded.
The Portfolios may invest in Cash Management Portfolio (Cash Management) and Eaton Vance Cash Collateral Fund, LLC (Cash Collateral Fund), affiliated investment companies managed by Boston Management and Research and EVM, respectively. Cash Management and Cash Collateral Fund normally value their investment securities utilizing the amortized cost valuation technique in
11
Eaton Vance Tax-Managed Equity Asset Allocation Fund as of October 31, 2008
NOTES TO FINANCIAL STATEMENTS CONT'D
accordance with Rule 2a-7 of the 1940 Act. This technique involves initially valuing a portfolio security at its cost and thereafter assuming a constant amortization to maturity of any discount or premium. If amortized cost is determined not to approximate fair value, Cash Management and Cash Collateral Fund may value their investment securities based on available market quotations provided by a pricing service. At October 31, 2008, Cash Collateral Fund valued its investments based on available market quotations.
B Income — The Fund's net investment income or loss consists of the Fund's pro-rata share of the net investment income or loss of the Portfolios, less all actual and accrued expenses of the Fund.
C Federal Taxes — The Fund's policy is to comply with the provisions of the Internal Revenue Code applicable to regulated investment companies and to distribute to shareholders each year substantially all of its net investment income, and all or substantially all of its net realized capital gains. Accordingly, no provision for federal income or excise tax is necessary.
At October 31, 2008, the Fund, for federal income tax purposes, had a capital loss carryforward of $30,008,471 which will reduce its taxable income arising from future net realized gains on investment transactions, if any, to the extent permitted by the Internal Revenue Code, and thus will reduce the amount of distributions to shareholders, which would otherwise be necessary to relieve the Fund of any liability for federal income or excise tax. Such capital loss carryforward will expire on October 31, 2016.
As of October 31, 2008, the Fund had no uncertain tax positions that would require financial statement recognition, de-recognition, or disclosure. Each of the Fund's federal tax returns filed in the 3-year period ended October 31, 2008 remains subject to examination by the Internal Revenue Service.
D Expenses — The majority of expenses of the Trust are directly identifiable to an individual fund. Expenses which are not readily identifiable to a specific fund are allocated taking into consideration, among other things, the nature and type of expense and the relative size of the funds.
E Expense Reduction — State Street Bank and Trust Company (SSBT) serves as custodian of the Fund. Pursuant to the custodian agreement, SSBT receives a fee reduced by credits, which are determined based on the average daily cash balance the Fund maintains with SSBT. All credit balances, if any, used to reduce the Fund's custodian fees are reported as a reduction of expenses in the Statement of Operations.
F Use of Estimates — The preparation of the financial statements in conformity with accounting principles generally accepted in the United States of America requires management to make estimates and assumptions that affect the reported amounts of assets and liabilities at the date of the financial statements and the reported amounts of income and expense during the reporting period. Actual results could differ from those estimates.
G Indemnifications — Under the Trust's organizational documents, its officers and Trustees may be indemnified against certain liabilities and expenses arising out of the performance of their duties to the Fund, and shareholders are indemnified against personal liability for the obligations of the Trust. Additionally, in the normal course of business, the Fund enters into agreements with service providers that may contain indemnification clauses. The Fund's maximum exposure under these arrangements is unknown as this would involve future claims that may be made against the Fund that have not yet occurred.
H Other — Investment transactions are accounted for on a trade date basis. Dividends to shareholders are recorded on the ex-dividend date.
2 Distributions to Shareholders
It is the present policy of the Fund to make at least one distribution annually (normally in December) of all or substantially all of its net investment income and to distribute annually all or substantially all of its net realized capital gains (reduced by available capital loss carryforwards from prior years, if any). Distributions are declared separately for each class of shares. Shareholders may reinvest income and capital gain distributions in additional shares of the same class of the Fund at the net asset value as of the ex-dividend date or, at the election of the shareholder, receive distributions in cash. The Fund distinguishes between distributions on a tax basis and a financial reporting basis. Accounting principles generally accepted in the United States of America require that only distributions in excess of tax basis earnings and profits be reported in the financial statements as a return of capital. Permanent diff erences between book and tax accounting relating to distributions are reclassified to paid-in capital. For tax purposes, distributions from short-term capital gains are considered to be from ordinary income.
12
Eaton Vance Tax-Managed Equity Asset Allocation Fund as of October 31, 2008
NOTES TO FINANCIAL STATEMENTS CONT'D
The tax character of distributions declared for the years ended October 31, 2008 and October 31, 2007 was as follows:
| | | Year Ended October 31, | |
| | | 2008 | | 2007 | |
| Distributions declared from: | |
| Ordinary income | | $ | 10,144,465 | | | $ | — | | |
| Long-term capital gains | | $ | 37,379,043 | | | $ | 17,459,090 | | |
During the year ended October 31, 2008, accumulated net realized loss was decreased by $2,854,854, accumulated undistributed net investment income was increased by $865,203 and paid-in capital was decreased by $3,720,057 due to differences between book and tax accounting, primarily for net operating losses, distributions from real estate investment trusts (REITs), investments in passive foreign investment companies (PFICs), foreign currency gain (loss) and return of capital distributions from securities. These reclassifications had no effect on the net assets or net asset value per share of the Fund.
As of October 31, 2008, the components of distributable earnings (accumulated losses) and unrealized appreciation (depreciation) on a tax basis were as follows:
| Capital loss carryforward | | $ | (30,008,471 | ) | |
| Net unrealized depreciation | | $ | (45,537,151 | ) | |
The differences between components of distributable earnings (accumulated losses) on a tax basis and the amounts reflected in the Statement of Assets and Liabilities are primarily due to wash sales, distributions from REITs, investments in PFICs, partnership allocations and investments in partnerships.
3 Investment Adviser Fee and Other Transactions with Affiliates
The investment adviser fee is earned by EVM as compensation for management and investment advisory services rendered to the Fund. The fee is computed at an annual rate of 0.80% of the Fund's average daily net assets up to $500 million, 0.75% from $500 million up to $1 billion and at reduced rates as daily net assets exceed that level, and is payable monthly. The investment adviser fee payable by the Fund is reduced by the Fund's allocable portion of the adviser fees paid by the Portfolios in which it invests. For the year ended October 31, 2008, the Fund's investment adviser fee totaled $5,972,908, of which $5,255,309 was allocated from the Portfolios and $717,599 was paid or accrued directly by the Fund. For the year ended October 31, 2008, the Fund's investment adviser fee, including the fees allocated from the Portfolios, was 0.78% of the Fund's average d aily net assets. The administration fee is earned by EVM as compensation for administering the business affairs of the Fund and is computed at an annual rate of 0.15% of the Fund's average daily net assets. For the year ended October 31, 2008, the administration fee amounted to $1,144,608. EVM serves as the sub-transfer agent of the Fund and receives from the transfer agent an aggregate fee based upon the actual expenses incurred by EVM in the performance of these services. For the year ended October 31, 2008, EVM earned $33,456 in sub-transfer agent fees. The Fund was informed that EVD, an affiliate of EVM, received $231,361 as its portion of the sales charge on sales of Class A shares for the year ended October 31, 2008. EVD also received distribution and service fees from Class A, Class B and Class C shares (see Note 4) and contingent deferred sales charges (see Note 5).
Except for Trustees of the Fund and the Portfolios who are not members of EVM's organization, officers and Trustees receive remuneration for their services to the Fund out of the investment adviser fee. Certain officers and Trustees of the Fund and the Portfolios are officers of EVM.
4 Distribution Plans
The Fund has in effect a distribution plan for Class A shares (Class A Plan) pursuant to Rule 12b-1 under the 1940 Act. The Class A Plan provides that the Fund will pay EVD a distribution and service fee of 0.25% per annum of its average daily net assets attributable to Class A shares for distribution services and facilities provided to the Fund by EVD, as well as for personal services and/or the maintenance of shareholder accounts. Distribution and service fees paid or accrued to EVD for the year ended October 31, 2008 amounted to $885,391 for Class A shares. The Fund also has in effect distribution plans for Class B shares (Class B Plan) and Class C shares (Class C Plan) pursuant to Rule 12b-1 under the 1940 Act. The Class B and Class C Plans require the Fund to pay EVD amounts equal to 0.75% per annum of its average daily net assets attributable to Class B and Class C shares for providing ongoing distribution services and fac ilities to the Fund. The Fund will automatically discontinue payments to EVD during any period in which there are no outstanding Uncovered Distribution Charges, which are equivalent to the sum of (i) 6.25% of the aggregate amount received by the Fund for Class B and Class C shares sold, plus (ii) interest calculated by applying the rate of 1% over the prevailing prime rate to the outstanding balance of Uncovered Distribution Charges of EVD of each respective class, reduced by the aggregate amount of contingent deferred sales charges (see Note 5) and amounts theretofore paid or payable to EVD by each respective class. For the year ended October 31, 2008, the Fund paid or accrued to EVD
13
Eaton Vance Tax-Managed Equity Asset Allocation Fund as of October 31, 2008
NOTES TO FINANCIAL STATEMENTS CONT'D
$946,191 and $2,120,676 for Class B and Class C shares, respectively, representing 0.75% of the average daily net assets of Class B and Class C shares. At October 31, 2008, the amounts of Uncovered Distribution Charges of EVD calculated under the Class B and Class C Plans were approximately $2,372,000 and $12,360,000, respectively.
The Class B and Class C Plans also authorize the Fund to make payments of service fees to EVD, investment dealers and other persons in amounts not exceeding 0.25% per annum of its average daily net assets attributable to that class. Service fees paid or accrued are for personal services and/or the maintenance of shareholder accounts. They are separate and distinct from the sales commissions and distribution fees and, as such, are not subject to automatic discontinuance when there are no outstanding Uncovered Distribution Charges of EVD. Service fees paid or accrued for the year ended October 31, 2008 amounted to $315,397 and $706,892 for Class B and Class C shares, respectively.
5 Contingent Deferred Sales Charges
A contingent deferred sales charge (CDSC) generally is imposed on redemptions of Class B shares made within six years of purchase and on redemptions of Class C shares made within one year of purchase. Class A shares may be subject to a CDSC up to 1% if redeemed within two years of purchase (depending on the circumstances of purchase). Generally, the CDSC is based upon the lower of the net asset value at date of redemption or date of purchase. No charge is levied on shares acquired by reinvestment of dividends or capital gain distributions. The CDSC for Class B shares is imposed at declining rates that begin at 5% in the case of redemptions in the first and second year after purchase, declining one percentage point each subsequent year. Class C shares are subject to a 1% CDSC if redeemed within one year of purchase. No CDSC is levied on shares which have been sold to EVM or its affiliates or to their respective employees or clien ts and may be waived under certain other limited conditions. CDSCs received on Class B and Class C redemptions are paid to EVD to reduce the amount of Uncovered Distribution Charges calculated under the Fund's Class B and Class C Plans. CDSCs received on Class B and Class C redemptions when no Uncovered Distribution Charges exist are credited to the Fund. For the year ended October 31, 2008, the Fund was informed that EVD received approximately $25,000, $187,000 and $38,000 of CDSCs paid by Class A, Class B and Class C shareholders, respectively.
6 Investment Transactions
For the year ended October 31, 2008, increases and decreases in the Fund's investment in the Portfolios were as follows:
| Portfolio | | Contributions | | Withdrawals | |
| Tax-Managed Growth Portfolio | | $ | 33,752,376 | | | $ | 29,808,940 | | |
| Tax-Managed Value Portfolio | | | 10,873,834 | | | | 2,714,294 | | |
| Tax-Managed International Equity Portfolio | | | 2,127,111 | | | | — | | |
| Tax-Managed Multi-Cap Growth Portfolio | | | — | | | | 19,815,281 | | |
| Tax-Managed Mid-Cap Core Portfolio | | | — | | | | 6,513,472 | | |
| Tax-Managed Small-Cap Portfolio | | | 8,749,829 | | | | — | | |
| Tax-Managed Small-Cap Value Portfolio | | | 17,214,110 | | | | — | | |
7 Shares of Beneficial Interest
The Fund's Declaration of Trust permits the Trustees to issue an unlimited number of full and fractional shares of beneficial interest (without par value). Such shares may be issued in a number of different series (such as the Fund) and classes. Transactions in Fund shares were as follows:
| | | Year Ended October 31, | |
| Class A | | 2008 | | 2007 | |
| Sales | | | 7,819,508 | | | | 6,263,745 | | |
Issued to shareholders electing to
receive payments of distributions
in Fund shares | | | 1,236,605 | | | | 432,864 | | |
| Redemptions | | | (6,240,374 | ) | | | (2,780,265 | ) | |
| Exchange from Class B shares | | | 812,485 | | | | 621,246 | | |
| Net increase | | | 3,628,224 | | | | 4,537,590 | | |
| | | Year Ended October 31, | |
| Class B | | 2008 | | 2007 | |
| Sales | | | 731,197 | | | | 835,141 | | |
Issued to shareholders electing to
receive payments of distributions
in Fund shares | | | 470,089 | | | | 253,884 | | |
| Redemptions | | | (1,643,773 | ) | | | (1,218,791 | ) | |
| Exchange to Class A shares | | | (846,624 | ) | | | (645,484 | ) | |
| Net decrease | | | (1,289,111 | ) | | | (775,250 | ) | |
14
Eaton Vance Tax-Managed Equity Asset Allocation Fund as of October 31, 2008
NOTES TO FINANCIAL STATEMENTS CONT'D
| | | Year Ended October 31, | |
| Class C | | 2008 | | 2007 | |
| Sales | | | 4,869,453 | | | | 4,816,611 | | |
Issued to shareholders electing to
receive payments of distributions
in Fund shares | | | 916,190 | | | | 362,588 | | |
| Redemptions | | | (4,445,059 | ) | | | (1,819,644 | ) | |
| Net increase | | | 1,340,584 | | | | 3,359,555 | | |
8 Recently Issued Accounting Pronouncement
In September 2006, the Financial Accounting Standards Board issued Statement of Financial Accounting Standards No. 157 (FAS 157), "Fair Value Measurements". FAS 157 defines fair value, establishes a framework for measuring fair value in accordance with accounting principles generally accepted in the United States of America and expands disclosure about fair value measurements. FAS 157 is effective for fiscal years beginning after November 15, 2007. As of October 31, 2008, management does not believe the adoption of FAS 157 will impact the amounts reported in the financial statements; however, additional disclosures may be required about the inputs used to develop the measurements of fair value and the effect of certain of the measurements on changes in net assets for the period.
15
Eaton Vance Tax-Managed Equity Asset Allocation Fund as of October 31, 2008
REPORT OF INDEPENDENT REGISTERED PUBLIC ACCOUNTING FIRM
To the Trustees of Eaton Vance Mutual Funds Trust and Shareholders of Eaton Vance
Tax-Managed Equity Asset Allocation Fund:
We have audited the accompanying statement of assets and liabilities of Eaton Vance Tax-Managed Equity Asset Allocation Fund (the "Fund") (one of the series of Eaton Vance Mutual Funds Trust) as of October 31, 2008, and the related statement of operations for the year then ended, the statements of changes in net assets for each of the two years in the period then ended, and the financial highlights for each of the five years in the period then ended. These financial statements and financial highlights are the responsibility of the Fund's management. Our responsibility is to express an opinion on these financial statements and financial highlights based on our audits.
We conducted our audits in accordance with standards of the Public Company Accounting Oversight Board (United States). Those standards require that we plan and perform the audit to obtain reasonable assurance about whether the financial statements and financial highlights are free of material misstatement. The Fund is not required to have, nor were we engaged to perform, an audit of its internal control over financial reporting. Our audits included consideration of internal control over financial reporting as a basis for designing audit procedures that are appropriate in the circumstances, but not for the purpose of expressing an opinion of the Fund's internal control over financial reporting. Accordingly, we express no such opinion. An audit also includes examining, on a test basis, evidence supporting the amounts and disclosures in the financial statements, assessing the accounting principles used and significant estimates mad e by management, as well as evaluating the overall financial statement presentation. We believe that our audits provide a reasonable basis for our opinion.
In our opinion, the financial statements and financial highlights referred to above present fairly, in all material respects, the financial position of Eaton Vance Tax-Managed Equity Asset Allocation Fund as of October 31, 2008, the results of its operations for the year then ended, the changes in its net assets for each of the two years in the period then ended, and the financial highlights for each of the five years in the period then ended, in conformity with accounting principles generally accepted in the United States of America.
DELOITTE & TOUCHE LLP
Boston, Massachusetts
December 15, 2008
16
Eaton Vance Tax-Managed Equity Asset Allocation Fund as of October 31, 2008
FEDERAL TAX INFORMATION (Unaudited)
The Form 1099-DIV you receive in January 2009 will show the tax status of all distributions paid to your account in calendar 2008. Shareholders are advised to consult their own tax adviser with respect to the tax consequences of their investment in the Fund. As required by the Internal Revenue Code regulations, shareholders must be notified within 60 days of the Fund's fiscal year end regarding the status of qualified dividend income for individuals and capital gain dividends.
Qualified Dividend Income. The Fund designates $14,716,329, or up to the maximum amount of such dividends allowable pursuant to the Internal Revenue Code, as qualified dividend income eligible for the reduced tax rate of 15%.
Capital Gain Dividends. The Fund designates $37,379,043 as a capital gain dividend.
17
Eaton Vance Tax-Managed Equity Asset Allocation Fund
SPECIAL MEETING OF SHAREHOLDERS (Unaudited)
Eaton Vance Tax-Managed Equity Asset Allocation Fund
The Fund held a Special Meeting of Shareholders on November 14, 2008 to elect Trustees. The results of the vote were as follows:
| | | Number of Shares | |
| Nominee for Trustee | | For | | Withheld | |
| Benjamin C. Esty | | | 45,005,755 | | | | 293,531 | | |
| Thomas E. Faust Jr. | | | 45,011,030 | | | | 288,256 | | |
| Allen R. Freedman | | | 45,009,165 | | | | 290,121 | | |
| William H. Park | | | 45,012,132 | | | | 287,154 | | |
| Ronald A. Pearlman | | | 45,012,406 | | | | 286,880 | | |
| Helen Frame Peters | | | 44,993,169 | | | | 306,117 | | |
| Heidi L. Steiger | | | 45,008,184 | | | | 291,102 | | |
| Lynn A. Stout | | | 45,006,635 | | | | 292,651 | | |
| Ralph F. Verni | | | 45,009,892 | | | | 289,394 | | |
Each nominee was also elected a Trustee of the following Portfolios in which the Fund invests: Tax-Managed Growth Portfolio, Tax-Managed Value Portfolio, Tax-Managed International Equity Portfolio, Tax-Managed Multi-Cap Growth Portfolio, Tax-Managed Mid-Cap Core Portfolio, Tax-Managed Small-Cap Portfolio and Tax-Managed Small-Cap Value Portfolio.
18
Eaton Vance Tax-Managed Equity Asset Allocation Fund
BOARD OF TRUSTEES' ANNUAL APPROVAL OF THE INVESTMENT ADVISORY AGREEMENT
Overview of the Contract Review Process
The Investment Company Act of 1940, as amended (the "1940 Act"), provides, in substance, that each investment advisory agreement between a fund and its investment adviser will continue in effect from year to year only if its continuance is approved at least annually by the fund's board of trustees, including by a vote of a majority of the trustees who are not "interested persons" of the fund ("Independent Trustees"), cast in person at a meeting called for the purpose of considering such approval.
At a meeting of the Boards of Trustees (each a "Board") of the Eaton Vance group of mutual funds (the "Eaton Vance Funds") held on April 21, 2008, the Board, including a majority of the Independent Trustees, voted to approve continuation of existing advisory and sub-advisory agreements for the Eaton Vance Funds for an additional one-year period. In voting its approval, the Board relied upon the affirmative recommendation of the Contract Review Committee of the Board (formerly the Special Committee), which is a committee comprised exclusively of Independent Trustees. Prior to making its recommendation, the Contract Review Committee reviewed information furnished for a series of meetings of the Contract Review Committee held in February, March and April 2008. Such information included, among other things, the following:
Information about Fees, Performance and Expenses
• An independent report comparing the advisory and related fees paid by each fund with fees paid by comparable funds;
• An independent report comparing each fund's total expense ratio and its components to comparable funds;
• An independent report comparing the investment performance of each fund to the investment performance of comparable funds over various time periods;
• Data regarding investment performance in comparison to relevant peer groups of funds and appropriate indices;
• Comparative information concerning fees charged by each adviser for managing other mutual funds and institutional accounts using investment strategies and techniques similar to those used in managing the fund;
• Profitability analyses for each adviser with respect to each fund;
Information about Portfolio Management
• Descriptions of the investment management services provided to each fund, including the investment strategies and processes employed, and any changes in portfolio management processes and personnel;
• Information concerning the allocation of brokerage and the benefits received by each adviser as a result of brokerage allocation, including information concerning the acquisition of research through "soft dollar" benefits received in connection with the funds' brokerage, and the implementation of a soft dollar reimbursement program established with respect to the funds;
• Data relating to portfolio turnover rates of each fund;
• The procedures and processes used to determine the fair value of fund assets and actions taken to monitor and test the effectiveness of such procedures and processes;
Information about each Adviser
• Reports detailing the financial results and condition of each adviser;
• Descriptions of the qualifications, education and experience of the individual investment professionals whose responsibilities include portfolio management and investment research for the funds, and information relating to their compensation and responsibilities with respect to managing other mutual funds and investment accounts;
• Copies of the Codes of Ethics of each adviser and its affiliates, together with information relating to compliance with and the administration of such codes;
• Copies of or descriptions of each adviser's proxy voting policies and procedures;
• Information concerning the resources devoted to compliance efforts undertaken by each adviser and its affiliates on behalf of the funds (including descriptions of various compliance programs) and their record of compliance with investment policies and restrictions, including policies with respect to market-timing, late trading and selective portfolio disclosure, and with policies on personal securities transactions;
• Descriptions of the business continuity and disaster recovery plans of each adviser and its affiliates;
Other Relevant Information
• Information concerning the nature, cost and character of the administrative and other non-investment management services provided by Eaton Vance Management and its affiliates;
• Information concerning management of the relationship with the custodian, subcustodians and fund accountants by each adviser or the funds' administrator; and
• The terms of each advisory agreement.
19
Eaton Vance Tax-Managed Equity Asset Allocation Fund
BOARD OF TRUSTEES' ANNUAL APPROVAL OF THE INVESTMENT ADVISORY AGREEMENT CONT'D
In addition to the information identified above, the Contract Review Committee considered information provided from time to time by each adviser throughout the year at meetings of the Board and its committees. Over the course of the twelve-month period ended April 30, 2008, the Board met eleven times and the Contract Review Committee, the Audit Committee and the Governance Committee, each of which is a Committee comprised solely of Independent Trustees, met twelve, seven and five times, respectively. At such meetings, the Trustees received, among other things, presentations by the portfolio managers and other investment professionals of each adviser relating to the investment performance of each fund and the investment strategies used in pursuing the fund's investment objective. The Portfolio Management Committee and the Compliance Reports and Regulatory Matters Committee are newly established and did not meet during the twelve- month period ended April 30, 2008.
For funds that invest through one or more underlying portfolios, the Board considered similar information about the portfolio(s) when considering the approval of advisory agreements. In addition, in cases where the fund's investment adviser has engaged a sub-adviser, the Board considered similar information about the sub-adviser when considering the approval of any sub-advisory agreement.
The Contract Review Committee was assisted throughout the contract review process by Goodwin Procter LLP, legal counsel for the Independent Trustees. The members of the Contract Review Committee relied upon the advice of such counsel and their own business judgment in determining the material factors to be considered in evaluating each advisory and sub-advisory agreement and the weight to be given to each such factor. The conclusions reached with respect to each advisory and sub-advisory agreement were based on a comprehensive evaluation of all the information provided and not any single factor. Moreover, each member of the Contract Review Committee may have placed varying emphasis on particular factors in reaching conclusions with respect to each advisory and sub-advisory agreement.
Results of the Process
Based on its consideration of the foregoing, and such other information as it deemed relevant, including the factors and conclusions described below, the Contract Review Committee concluded that the continuance of the investment advisory agreement of the Eaton Vance Tax-Managed Equity Asset Allocation Fund (the "Fund") with Eaton Vance Management ("EVM"), as well as the investment advisory agreements of the Tax-Managed Growth Portfolio, the Tax-Managed Mid-Cap Core Portfolio, the Tax-Managed International Equity Portfolio, Tax-Managed Multi-Cap Growth Portfolio, Tax-Managed Small-Cap Portfolio (formerly, Tax-Managed Small-Cap Growth Portfolio), Tax-Managed Small-Cap Value Portfolio and the Tax-Managed Value Portfolio (the "Portfolios"), the portfolios in which the Fund invests, each with Boston Management and Research ("BMR"), including their fee structures, is in the interests of shareholders and, therefore, the Contract Review Committee recommended to the Board approval of each agreement. In addition, the Contract Review Committee concluded that each of the investment sub-advisory agreements between BMR and Atlanta Capital Management Company, LLC ("Atlanta Capital"), with respect to the Tax-Managed Mid-Cap Core Portfolio, between BMR and Eagle Global Advisors, L.L.C. ("Eagle"), with respect to the Tax-Managed International Equity Portfolio, and between BMR and Fox Asset Management LLC ("Fox"), with respect to the Tax-Managed Small-Cap Value Portfolio, including their fee structures, is in the interests of shareholders and, therefore, the Contract Review Committee recommended to the Board approval of each agreement. The Board accepted the recommendation of the Contract Review Committee as well as the factors considered and conclusions reached by the Contract Review Committee with respect to each agreement. Accordingly, the Board, including a majority of the Independent Trustees, voted to approve continuation of the investment advi sory and sub-advisory agreements for the Fund and the Portfolios. EVM and BMR are each referred to as an "Adviser" herein; EVM with respect to the Fund and BMR with respect to the Portfolios. EVM and BMR are affiliates. Eagle, Fox and Atlanta Capital are referred to herein as the "Sub-advisers." Fox and Atlanta Capital are affiliates of EVM and BMR.
Nature, Extent and Quality of Services
In considering whether to approve the investment advisory agreement of the Fund and each Portfolio and the sub-advisory agreements of the relevant Portfolio, the Board evaluated the nature, extent and quality of services provided to each Portfolio by BMR and to the relevant Portfolio by the Sub-adviser and to the Fund by EVM. BMR manages the Portfolios, while EVM allocates the assets of the Fund among the Portfolios.
The Board considered BMR's and the Sub-advisers' management capabilities and investment process with respect to the types of investments held by the Portfolios, including the education, experience and number of its investment professionals and other personnel who provide portfolio management, investment research, and similar services to the Portfolios. The Board specifically noted BMR's in-house equity research capabilities and experience in managing funds that seek to maximize after-tax returns. For all the Portfolios, the Board also took into account the resources dedicated to portfolio management and other services, including the compensation paid to recruit and retain investment personnel, and the time and attention devoted to the Fund and each Portfolio by senior management. The Board also considered the capabilities of each Sub-adviser.
20
Eaton Vance Tax-Managed Equity Asset Allocation Fund
BOARD OF TRUSTEES' ANNUAL APPROVAL OF THE INVESTMENT ADVISORY AGREEMENT CONT'D
The Board also reviewed the compliance programs of the Adviser and relevant affiliates thereof. Among other matters, the Board considered compliance and reporting matters relating to personal trading by investment personnel, selective disclosure of portfolio holdings, late trading, frequent trading, portfolio valuation, business continuity and the allocation of investment opportunities. The Board also evaluated the responses of the Adviser and its affiliates to requests from regulatory authorities such as the Securities and Exchange Commission.
The Board considered shareholder and other administrative services provided or managed by Eaton Vance Management and its affiliates, including transfer agency and accounting services. The Board evaluated the benefits to shareholders of investing in a fund that is a part of a large family of funds, including the ability, in many cases, to exchange an investment among different funds without incurring additional sales charges.
After consideration of the foregoing factors, among others, the Board concluded that the nature, extent and quality of services provided by the Adviser and Sub-advisers, taken as a whole, are appropriate and consistent with the terms of the investment advisory and sub-advisory agreements.
Fund Performance
The Board compared the Fund's investment performance to a relevant universe of similarly managed funds identified by an independent data provider and appropriate benchmark indices for the one-, three- and five-year periods ended September 30, 2007 for the Fund. The Board also considered the performance of the underlying Portfolios. The Board concluded that the Fund's performance was satisfactory.
Management Fees and Expenses
The Board reviewed contractual investment advisory fee rates, including any administrative fee rates, payable by the Portfolios and the Fund (referred to collectively as "management fees"). As part of its review, the Board considered the management fees, including administrative fees, and the Fund's total expense ratio for the year ended September 30, 2007, as compared to a group of similarly managed funds selected by an independent data provider. The Board considered the fact that with respect to two of the underlying Portfolios, the Adviser had agreed to waive fees and/or pay expenses of the Portfolios in an additional amount.
After reviewing the foregoing information, and in light of the nature, extent and quality of the services provided by the Adviser, the Board concluded that the management fees charged for advisory and related services and the Fund's total expense ratio are reasonable.
Profitability
The Board reviewed the level of profits realized by the Adviser and relevant affiliates thereof in providing investment advisory and administrative services to the Fund, the Portfolios and all Eaton Vance Funds as a group. The Board considered the level of profits realized without regard to revenue sharing or other payments by the Adviser and its affiliates to third parties in respect of distribution services. The Board also considered other direct or indirect benefits received by the Adviser and its affiliates in connection with its relationship with the Fund and the Portfolios, including the benefits of research services that may be available to BMR or the Sub-advisers as a result of securities transactions effected for the Portfolios and other investment advisory clients. The Board also concluded that, in light of its role as a sub-adviser not affiliated with the Adviser, Eagle's profitability in managing the Tax-Managed Inte rnational Equity Portfolio was not a material factor.
The Board concluded that, in light of the foregoing factors and the nature, extent and quality of the services rendered, the profits realized by the Adviser and its affiliates are reasonable.
Economies of Scale
In reviewing management fees and profitability, the Board also considered the extent to which the Adviser and its affiliates, on the one hand, and the Fund, on the other hand, can expect to realize benefits from economies of scale as the assets of the Fund and the Portfolios increase. The Board acknowledged the difficulty in accurately measuring the benefits resulting from the economies of scale with respect to the management of any specific fund or group of funds. The Board reviewed data summarizing the increases and decreases in the assets of the Portfolios and of all Eaton Vance Funds as a group over various time periods, and evaluated the extent to which the total expense ratio of the Fund and the profitability of the Adviser and its affiliates may have been affected by such increases or decreases. Based upon the foregoing, the Board concluded that the benefits from economies of scale are currently being shared equitably by the Adviser and its affiliates and the Fund. The Board also concluded that, assuming reasonably foreseeable increases in the assets of the Portfolios, the structure of the advisory fees, which include breakpoints at several asset levels, can be expected to cause the Adviser and its affiliates and the Fund to continue to share such benefits equitably.
21
Eaton Vance Tax-Managed Equity Asset Allocation Fund
MANAGEMENT AND ORGANIZATION
Fund Management. The Trustees of Eaton Vance Mutual Funds Trust (the Trust) are responsible for the overall management and supervision of the Trust's affairs. The Trustees and officers of the Trust are listed below. Except as indicated, each individual has held the office shown or other offices in the same company for the last five years. Trustees and officers of the Trust hold indefinite terms of office. The "noninterested Trustees" consist of those Trustees who are not "interested persons" of the Trust, as that term is defined under the 1940 Act. The business address of each Trustee and officer is The Eaton Vance Building, 255 State Street, Boston, Massachusetts 02109. As used below, "EVC" refers to Eaton Vance Corp., "EV" refers to Eaton Vance, Inc., "EVM" refers to Eaton Vance Management, "BMR" refers to Boston Management and Research, "Parametric" refer s to Parametric Portfolio Associates and "EVD" refers to Eaton Vance Distributors, Inc. EVC and EV are the corporate parent and trustee, respectively, of EVM and BMR. EVD is the Fund's principal underwriter and a wholly-owned subsidiary of EVC. Each officer affiliated with Eaton Vance may hold a position with other Eaton Vance affiliates that is comparable to his or her position with EVM listed below.
Name and
Date of Birth | | Position(s)
with the
Trust | | Term of
Office and
Length of
Service | | Principal Occupation(s)
During Past Five Years | | Number of Portfolios
in Fund Complex
Overseen By
Trustee(1) | | Other Directorships Held | |
| Interested Trustee | | | | | | | | | | | | | |
|
Thomas E. Faust Jr.
5/31/58 | | Trustee and President | | Trustee since 2007 and President since 2002 | | Chairman, Chief Executive Officer and President of EVC, Director and President of EV, Chief Executive Officer and President of EVM and BMR, and Director of EVD. Trustee and/or Officer of 173 registered investment companies and 4 private companies managed by EVM or BMR. Mr. Faust is an interested person because of his positions with EVM, BMR, EVD, EVC and EV, which are affiliates of the Trust. | | | 173 | | | Director of EVC | |
|
| NonInterested Trustees | | | | | | | | | | | | | |
|
Benjamin C. Esty
1/2/63 | | Trustee | | Since 2005 | | Roy and Elizabeth Simmons Professor of Business Administration, Harvard University Graduate School of Business Administration. | | | 173 | | | None | |
|
Allen R. Freedman
4/3/40 | | Trustee | | Since 2007 | | Former Chairman (2002-2004) and a Director (1983-2004) of Systems & Computer Technology Corp. (provider of software to higher education). Formerly, a Director of Loring Ward International (fund distributor) (2005-2007). Formerly, Chairman and a Director of Indus International Inc. (provider of enterprise management software to the power generating industry) (2005-2007). | | | 173 | | | Director of Assurant, Inc. and Stonemor Partners L.P. (owner and operator of cemeteries) | |
|
William H. Park
9/19/47 | | Trustee | | Since 2003 | | Vice Chairman, Commercial Industrial Finance Corp. (specialty finance company) (since 2006). Formerly, President and Chief Executive Officer, Prizm Capital Management, LLC (investment management firm) (2002-2005). | | | 173 | | | None | |
|
Ronald A. Pearlman
7/10/40 | | Trustee | | Since 2003 | | Professor of Law, Georgetown University Law Center. | | | 173 | | | None | |
|
Helen Frame Peters
3/22/48 | | Trustee | | Since 2008 | | Professor of Finance, Carroll School of Management, Boston College (since 2003). Adjunct Professor of Finance, Peking University, Beijing, China (since 2005). Formerly, Dean, Carroll School of Management, Boston College (2000-2003). | | | 173 | | | Director of Federal Home Loan Bank of Boston (a bank for banks) and BJ's Wholesale Clubs (wholesale club retailer); Trustee of SPDR Index Shares Funds and SPDR Series Trust (exchange traded funds) | |
|
Heidi L. Steiger
7/8/53 | | Trustee | | Since 2007 | | Managing Partner, Topridge Associates LLC (global wealth management firm) (since 2008); Senior Advisor (since 2008), President (2005-2008), Lowenhaupt Global Advisors, LLC (global wealth management firm). Formerly, President and Contributing Editor, Worth Magazine (2004-2005). Formerly, Executive Vice President and Global Head of Private Asset Management (and various other positions), Neuberger Berman (investment firm) (1986-2004). | | | 173 | | | Director of Nuclear Electric Insurance Ltd. (nuclear insurance provider) and Aviva USA (insurance provider) | |
|
22
Eaton Vance Tax-Managed Equity Asset Allocation Fund
MANAGEMENT AND ORGANIZATION CONT'D
Name and
Date of Birth | | Position(s)
with the
Trust | | Term of
Office and
Length of
Service | | Principal Occupation(s)
During Past Five Years | | Number of Portfolios
in Fund Complex
Overseen By
Trustee(1) | | Other Directorships Held | |
| Noninterested Trustees (continued) | | | | | | | | | | | |
|
Lynn A. Stout
9/14/57 | | Trustee | | Since 1998 | | Paul Hastings Professor of Corporate and Securities Law (since 2006) and Professor of Law (2001-2006), University of California at Los Angeles School of Law. | | | 173 | | | None | |
|
Ralph F. Verni
1/26/43 | | Chairman of the Board and Trustee | | Chairman of the Board since 2007 and Trustee since 2005 | | Consultant and private investor. | | | 173 | | | None | |
|
| Principal Officers who are not Trustees | | | | | | | | | | | |
|
Name and
Date of Birth | | Position(s)
with the
Trust | | Term of
Office and
Length of
Service | | Principal Occupation(s)
During Past Five Years | |
William H. Ahern, Jr.
7/28/59 | | Vice President | | Since 1995 | | Vice President of EVM and BMR. Officer of 75 registered investment companies managed by EVM or BMR. | |
|
John R. Baur
2/10/70 | | Vice President | | Since 2007 | | Vice President of EVM and BMR. Previously, attended Johnson Graduate School of Management, Cornell University (2002-2005), and prior thereto he was an Account Team Representative in Singapore for Applied Materials Inc. Officer of 33 registered investment companies managed by EVM or BMR. | |
|
Michael A. Cirami
12/24/75 | | Vice President | | Since 2007 | | Vice President of EVM and BMR. Previously, attended the University of Rochester William E. Simon Graduate School of Business Administration (2001-2003), and prior thereto he was a Team Leader for the Institutional Services Group for State Street Bank in Luxembourg. Officer of 33 registered investment companies managed by EVM or BMR. | |
|
Cynthia J. Clemson
3/2/63 | | Vice President | | Since 2005 | | Vice President of EVM and BMR. Officer of 90 registered investment companies managed by EVM or BMR. | |
|
Charles B. Gaffney
12/4/72 | | Vice President | | Since 2007 | | Vice President of EVM and BMR. Previously, Sector Portfolio Manager and Senior Equity Analyst of Brown Brothers Harriman (1997-2003). Officer of 30 registered investment companies managed by EVM or BMR. | |
|
Christine M. Johnston
11/9/72 | | Vice President | | Since 2007 | | Vice President of EVM and BMR. Officer of 35 registered investment companies managed by EVM or BMR. | |
|
Aamer Khan
6/7/60 | | Vice President | | Since 2005 | | Vice President of EVM and BMR. Officer of 33 registered investment companies managed by EVM or BMR. | |
|
Thomas H. Luster
4/8/62 | | Vice President | | Since 2006 | | Vice President of EVM and BMR. Officer of 51 registered investment companies managed by EVM or BMR. | |
|
Robert B. MacIntosh
1/22/57 | | Vice President | | Since 1998 | | Vice President of EVM and BMR. Officer of 90 registered investment companies managed by EVM or BMR. | |
|
Duncan W. Richardson
10/26/57 | | Vice President | | Since 2001 | | Executive Vice President and Chief Equity Investment Officer of EVC, EVM and BMR. Officer 81 registered investment companies managed by EVM or BMR. | |
|
Judith A. Saryan
8/21/54 | | Vice President | | Since 2003 | | Vice President of EVM and BMR. Officer of 55 registered investment companies managed by EVM or BMR. | |
|
Susan Schiff
3/13/61 | | Vice President | | Since 2002 | | Vice President of EVM and BMR. Officer of 36 registered investment companies managed by EVM or BMR. | |
|
Thomas Seto
9/27/62 | | Vice President | | Since 2007 | | Vice President and Director of Portfolio Management of Parametric. Officer of 31 registered investment companies managed by EVM or BMR. | |
|
23
Eaton Vance Tax-Managed Equity Asset Allocation Fund
MANAGEMENT AND ORGANIZATION CONT'D
Name and
Date of Birth | | Position(s)
with the
Trust | | Term of
Office and
Length of
Service | | Principal Occupation(s)
During Past Five Years | |
| Principal Officers who are not Trustees (continued) | | | | | | | |
|
| David M. Stein 5/4/51 | | Vice President | | Since 2007 | | Managing Director and Chief Investment Officer of Parametric. Officer of 31 registered investment companies managed by EVM or BMR. | |
|
| Mark S. Venezia 5/23/49 | | Vice President | | Since 2007 | | Vice President of EVM and BMR. Officer of 36 registered investment companies managed by EVM or BMR. | |
|
| Adam A. Weigold 3/22/75 | | Vice President | | Since 2007 | | Vice President of EVM and BMR. Officer of 71 registered investment companies managed by EVM or BMR. | |
|
| Barbara E. Campbell 6/19/57 | | Treasurer | | Since 2005 | | Vice President of EVM and BMR. Officer of 173 registered investment companies managed by EVM or BMR. | |
|
| Maureen A. Gemma 5/24/60 | | Secretary and Chief Legal Officer | | Secretary since 2007 and Chief Legal Officer since 2008 | | Vice President of EVM and BMR. Officer of 173 registered investment companies managed by EVM or BMR. | |
|
| Paul M. O'Neil 7/11/53 | | Chief Compliance Officer | | Since 2004 | | Vice President of EVM and BMR. Officer of 173 registered investment companies managed by EVM or BMR. | |
|
(1) Includes both master and feeder funds in a master-feeder structure.
The SAI for the Fund includes additional information about the Trustees and officers of the Fund and can be obtained without charge on Eaton Vance's website at www.eatonvance.com or by calling 1-800-262-1122.
24
Investment Adviser and Administrator of Eaton Vance Tax-Managed Equity Asset Allocation Fund
Eaton Vance Management
The Eaton Vance Building
255 State Street
Boston, MA 02109
Principal Underwriter
Eaton Vance Distributors, Inc.
The Eaton Vance Building
255 State Street
Boston, MA 02109
(617) 482-8260
Custodian
State Street Bank and Trust Company
200 Clarendon Street
Boston, MA 02116
Transfer Agent
PNC Global Investment Servicing
Attn: Eaton Vance Funds
P.O. Box 9653
Providence, RI 02940-9653
(800) 262-1122
Independent Registered Public Accounting Firm
Deloitte & Touche LLP
200 Berkeley Street
Boston, MA 02116-5022
Eaton Vance Tax-Managed Equity Asset Allocation Fund
The Eaton Vance Building
255 State Street
Boston, MA 02109
This report must be preceded or accompanied by a current prospectus. Before investing, investors should consider carefully the Fund's investment objective, risks, and charges and expenses. The Fund's current prospectus contains this and other information about the Fund and is available through your financial advisor. Please read the prospectus carefully before you invest or send money. For further information please call 1-800-262-1122.
1299-12/08 TMEAASRC

Annual Report October 31, 2008


EATON VANCE
DIVERSIFIED
INCOME
FUND
IMPORTANT NOTICES REGARDING PRIVACY,
DELIVERY OF SHAREHOLDER DOCUMENTS,
PORTFOLIO HOLDINGS AND PROXY VOTING
Privacy. The Eaton Vance organization is committed to ensuring your financial privacy. Each of the financial institutions identified below has in effect the following policy ("Privacy Policy") with respect to nonpublic personal information about its customers:
• Only such information received from you, through application forms or otherwise, and information about your Eaton Vance fund transactions will be collected. This may include information such as name, address, social security number, tax status, account balances and transactions.
• None of such information about you (or former customers) will be disclosed to anyone, except as permitted by law (which includes disclosure to employees necessary to service your account). In the normal course of servicing a customer's account, Eaton Vance may share information with unaffiliated third parties that perform various required services such as transfer agents, custodians and broker/dealers.
• Policies and procedures (including physical, electronic and procedural safeguards) are in place that are designed to protect the confidentiality of such information.
• We reserve the right to change our Privacy Policy at any time upon proper notification to you. Customers may want to review our Policy periodically for changes by accessing the link on our homepage: www.eatonvance.com.
Our pledge of privacy applies to the following entities within the Eaton Vance organization: the Eaton Vance Family of Funds, Eaton Vance Management, Eaton Vance Investment Counsel, Boston Management and Research, and Eaton Vance Distributors, Inc.
In addition, our Privacy Policy only applies to those Eaton Vance customers who are individuals and who have a direct relationship with us. If a customer's account (i.e., fund shares) is held in the name of a third-party financial adviser/ broker-dealer, it is likely that only such adviser's privacy policies apply to the customer. This notice supersedes all previously issued privacy disclosures.
For more information about Eaton Vance's Privacy Policy, please call 1-800-262-1122.
Delivery of Shareholder Documents. The Securities and Exchange Commission (the "SEC") permits funds to deliver only one copy of shareholder documents, including prospectuses, proxy statements and shareholder reports, to fund investors with multiple accounts at the same residential or post office box address. This practice is often called "householding" and it helps eliminate duplicate mailings to shareholders.
Eaton Vance, or your financial adviser, may household the mailing of your documents indefinitely unless you instruct Eaton Vance, or your financial adviser, otherwise.
If you would prefer that your Eaton Vance documents not be householded, please contact Eaton Vance at 1-800-262-1122, or contact your financial adviser.
Your instructions that householding not apply to delivery of your Eaton Vance documents will be effective within 30 days of receipt by Eaton Vance or your financial adviser.
Portfolio Holdings. Each Eaton Vance Fund and its underlying Portfolio (if applicable) will file a schedule of its portfolio holdings on Form N-Q with the SEC for the first and third quarters of each fiscal year. The Form N-Q will be available on the Eaton Vance website www.eatonvance.com, by calling Eaton Vance at 1-800-262-1122 or in the EDGAR database on the SEC's website at www.sec.gov. Form N-Q may also be reviewed and copied at the SEC's public reference room in Washington, D.C. (call 1-800-732-0330 for information on the operation of the public reference room).
Proxy Voting. From time to time, funds are required to vote proxies related to the securities held by the funds. The Eaton Vance Funds or their underlying Portfolios (if applicable) vote proxies according to a set of policies and procedures approved by the Funds' and Portfolios' Boards. You may obtain a description of these policies and procedures and information on how the Funds or Portfolios voted proxies relating to portfolio securities during the most recent 12 month period ended June 30, without charge, upon request, by calling 1-800-262-1122. This description is also available on the SEC's website at www.sec.gov.
Eaton Vance Diversified Income Fund as of October 31, 2008
MANAGEMENT’S DISCUSSION OF FUND PERFORMANCE

Payson Swaffield, CFA
Chief Income
Investment Officer

Mark Venezia, CFA
Investment Team Member

Christine Johnston, CFA
Investment Team Member
Economic and Market Conditions
· The credit crisis that began in mid-2007 resulted in unprecedented events in the U.S. financial markets in 2008. Within a two-week period in September 2008, investors saw the U.S. government’s bailout of the two largest government sponsored enterprises, Fannie Mae and Freddie Mac, the bankruptcy of Lehman Brothers Holding, Inc., and the subsequent bailout of one of the world’s largest insurers, amidst other government intervention and uncertainty surrounding the future of many of the largest U.S. financial institutions. As the crisis intensified in the last two months of the Fund’s fiscal year, the markets reacted with a flight to quality. The U.S. dollar strengthened against the Euro, and U.S. interest rates fell as foreign investors headed for the relative safety of U.S. Treasury bonds. For the year ended October 31, 2008, two-year U.S. Treasury yields fell 240 basis points (2.40%). The Federal Funds rate started the year at 4.50% on October 31, 2007 and was reduced to 1.00% by October 31, 2008.
· Within U.S. credit markets, yield spread widening left no market unscathed. A wave of deleveraging and forced selling by hedge funds and structured investment vehicles exerted downward pressure on the U.S. credit markets. The yield spread of seasoned U.S. government agency mortgage-backed securities (MBS) widened by about 200 basis points (2.00%) to finish the fiscal year valued at approximately 300 basis points (3.00%) over U.S. Treasuries. Below investment grade corporate debt yield spreads widened by approximately 900 basis points (9.00%) to finish the year at more than 1,500 basis points (15.00%) over U.S. Treasuries. Similarly, senior, secured loan spreads over the London Interbank Offered Rate (LIBOR) widened by approximately 1,050 basis points (10.50%), with the S&P/LSTA Leveraged Loan Index First Lien Loans valued at approximately 1,695 basis points (16.95%) over LIBOR on October 31, 2008.
Management Discussion
· The Fund’s(1) primary investment objective is to provide a high level of current income. The Fund may, as a secondary objective, also seek capital appreciation to the extent consistent with its primary objective of high current income.
Eaton Vance Diversified Income Fund
Total Return Performance 10/31/07 – 10/31/08
Fund - Class A(2) | | -15.48 | % |
Fund - Class B(2) | | -16.13 | |
Fund - Class C(2) | | -16.13 | |
Merrill Lynch U.S. High Yield Index(3) | | -26.52 | |
S&P/LSTA Leveraged Loan Index(3) | | -21.02 | |
Barclays Capital Intermediate Government Bond Index(3) | | 7.26 | |
Please refer to page 3 for additional performance information.
(1) | The Fund is structured as a “fund-of-funds” and, accordingly, currently pursues its objectives by investing its assets in three registered investment companies (each a “Portfolio”) that are managed by Eaton Vance Management or its affiliates: Boston Income Portfolio, which normally invests primarily in high-yield, high-risk corporate bonds; Floating Rate Portfolio, which normally invests primarily in senior floating-rate corporate loans; and Government Obligations Portfolio, which primarily invests in MBS issued by the U.S. Government or one of its agencies or instrumentalities. References to investments are to the Portfolios’ holdings. |
| |
(2) | These returns do not include the 4.75% maximum sales charge for the Fund’s Class A shares or the applicable contingent deferred sales charges (CDSC) for Class B shares and Class C shares. If sales charges were deducted, the returns would be lower. |
| |
(3) | It is not possible to invest directly in an Index. The Indices’ total returns do not reflect the expenses that would have been incurred if an investor individually purchased or sold the securities represented in the Indices. |
Past performance is no guarantee of future results. Returns are historical and are calculated by determining the percentage change in net asset value or offering price (as applicable) with all distributions reinvested. Investment return and principal value will fluctuate so that shares, when redeemed, may be worth more or less than their original cost. Performance is for the stated time period only; due to market volatility, the Fund’s current performance may be lower or higher than the quoted return. For performance as of the most recent month end, please refer to www.eatonvance.com.
Fund shares are not insured by the FDIC and are not deposits or other obligations of, or guaranteed by, any depository institution. Shares are subject to investment risks, including possible loss of principal invested.
The views expressed throughout this report are those of the portfolio managers and are current only through the end of the period of the report as stated on the cover. These views are subject to change at any time based upon market or other conditions, and the investment adviser disclaims any responsibility to update such views. These views may not be relied on as investment advice and, because investment decisions for a fund are based on many factors, may not be relied on as an indication of trading intent on behalf of any Eaton Vance fund. Portfolio information provided in the report may not be representative of the Portfolios’ current or future investments and may change due to active management.
1

Michael Weilheimer, CFA
Investment Team Member
High Yield Bonds

Scott Page, CFA
Investment Team Member
Floating Rate Loans

Sue Schiff, CFA
Investment Team Member
Mortgage-Backed Securities

Craig Russ
Investment Team Member
Floating Rate Loans
· | The high-yield bond market suffered large losses during the year, reflecting the continued breakdown of the credit markets. As the dimensions of the global credit crisis became increasingly apparent during the period, the market suffered a dramatic sell-off. Forced liquidation of bank loans by hedge funds and structured investment vehicles accelerated the process of deleveraging across the credit markets. The selling pressure was such that liquidity was sharply lower for higher-quality bonds, and all but disappeared for lower- quality bonds. The market decline was most severe in October 2008, declining 16.3% in that month alone, the worst month in the history of the high-yield market. High-yield spreads at October 31, 2008 were around 1,600 basis points (16.00%) – 50% higher than the peak spreads in the previous two recessions. The performance of the Boston Income Portfolio’s holdings was negatively affected by its lower allocation to BB-rated bonds relative to the Index, as BB-rated issues outperformed in the difficult market environment. Consumer discretionary holdings, such as gaming bonds, also detracted, as did cyclical bonds in the paper, energy and metals & mining industries. The consumer staples sector, which is characteristically less vulnerable to the vagaries of the economy, featured some of the Portfolio’s better performers. Securities selection in the food and beverages, health care and utilities industries helped performance, as these bonds suffered less dramatic losses than more economically-sensitive areas. |
| |
· | In Floating Rate Portfolio, the year ended October 31, 2008 was one of the toughest periods ever for the loan market and for the Portfolio. After a fragile, but not hopeless spring and summer of 2008, the loan markets were rattled by the events in September and October 2008. In the final three months of the Fund’s fiscal year, the S&P/LSTA Leveraged Loan Index declined 18.66%, by far its worst quarterly showing ever. The average loan price in the Portfolio was 70.3% of par at October 31, 2008. Although statistics vary with respect to recovery rates of loans in default, the historical rate has been approximately 70% of par. As such, bank loan prices at October 31, 2008 were approaching levels that implied near universal default. At period-end, 2.3% of the Portfolio’s bank loan investments were in default versus 2.0% for the Index. Floating Rate Portfolio’s loans were primarily senior, secured loans to companies with average revenues exceeding $1 billion. Publishing, health care, business equipment and services, cable and satellite television, and chemicals and plastics were the top industry weightings. The Portfolio had a 14% exposure in European bank loans at October 31, 2008. While the Portfolio’s involvement in the European leveraged loan market represented further opportunity for diversification, this market has been affected slightly more than the U.S. market by the recent credit market turmoil. |
| |
· | The Fund benefited from the performance of its MBS investments in Government Obligations Portfolio. In this Portfolio, the focus remained on seasoned, fixed rate, U.S. government agency MBS. The underlying mortgages to the Fund’s seasoned MBS investments were typically originated in the 1980s or 1990s; therefore, the homeowners have typically built up considerable equity in their homes over time. As a result, these mortgages have a relatively low loan-to-value ratio and more predictable cash flows than generic MBS. In addition, the loans are guaranteed by the U.S. government agencies. Similar to other U.S. credit markets, yield spreads over U.S. Treasuries for seasoned U.S. agency MBS widened over the year ended October 31, 2008. The widening of approximately 200 basis points (2.00%), however, during the year was the primary reason for the Portfolio’s underperformance of the Barclays Capital Intermediate Government Bond Index, which is more heavily weighted toward Treasury securities. Nonetheless, management continued to believe that agency securities represented an attractive asset class for the Fund, particularly the seasoned MBS on which the Fund focused. |
2
Eaton Vance Diversified Income Fund as of October 31, 2008
FUND PERFORMANCE
The line graph and table set forth below provide information about the Fund’s performance. The line graph compares the performance of Class A of the Fund with that of the Merrill Lynch U.S. High Yield Index, an unmanaged index of below investment grade U.S. dollar-denominated corporate bonds publicly issued in the U.S. domestic market; the S&P/LSTA Leveraged Loan Index, an unmanaged index of U.S. dollar-denominated leveraged loans; and the Barclays Capital Intermediate Government Bond Index, an unmanaged index of U.S. government bonds with maturities between one and ten years. The lines on the graph represent the total returns of a hypothetical investment of $10,000 in each of Class A and the Merrill Lynch U.S. High Yield Index, the S&P/LSTA Leveraged Loan Index and the Barclays Capital Intermediate Government Bond Index. Class A total returns are presented at net asset value and maximum public offering price (POP). The table includes the total returns of each Class of the Fund at net asset value and public offering price. The performance presented below does not reflect the deduction of taxes, if any, that a shareholder would pay on distributions or redemptions of Fund shares.
Performance(1)
| | Class A | | Class B | | Class C | |
Share Class Symbol | | EADDX | | EBDDX | | ECDDX | |
Average Annual Total Returns (at net asset value) | | | | | | | |
One Year | | -15.48 | % | -16.13 | % | -16.13 | % |
Life of Fund† | | -0.48 | | -1.25 | | -1.25 | |
| | | | | | | |
SEC Average Annual Total Returns (including sales charge or applicable CDSC) | | | | | | | |
One Year | | -19.50 | % | -20.08 | % | -16.92 | % |
Life of Fund† | | -1.72 | | -1.86 | | -1.25 | |
† Inception dates: Class A: 12/7/04; Class B: 12/7/04; Class C: 12/7/04 |
| |
(1) | Average Annual Total Returns do not include the 4.75% maximum sales charge for Class A shares or the applicable contingent deferred sales charges (CDSC) for Class B or Class C shares. If sales charges were deducted, the returns would be lower. SEC returns for Class A reflect the maximum 4.75% sales charge. SEC returns for Class B reflect applicable CDSC based on the following schedule: 5% - 1st and 2nd years; 4% - 3rd year; 3% - 4th year; 2% - 5th year; 1% - 6th year. SEC 1-year return for Class C reflects a 1% CDSC. |
Total Annual
Operating Expenses(2)
| | Class A | | Class B | | Class C | |
Expense Ratio | | 1.10 | % | 1.85 | % | 1.85 | % |
(2) | Source: Prospectus dated 3/1/08, as supplemented. |
Comparison of Change in Value of a $10,000 Investment in Eaton Vance Diversified Income Fund, Class A shares vs. the Merrill Lynch U.S. High Yield Index, the S&P/LSTA Leveraged Loan Index and the Barclays Capital Intermediate Government Bond Index*
December 31, 2004 – October 31, 2008
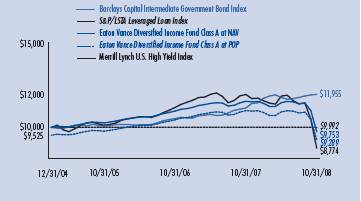
* Source: Lipper, Inc. Class A of the Fund commenced operations on 12/7/04.
A $10,000 hypothetical investment on 12/7/04 at NAV in Class B shares and Class C shares, respectively, would have been valued at $9,520 ($9,293 after deduction of the applicable CDSC) and $9,520, respectively, on 10/31/08. It is not possible to invest directly in an Index. The Indices’ total returns do not reflect expenses that would have been incurred if an investor individually purchased or sold the securities represented in the Indices. Index returns are available as of month-end only.
Portfolio Composition
Diversification by Sectors(3)
By total investments
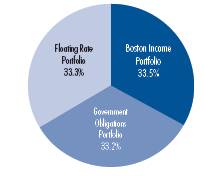
(3) | As of 10/31/08. Sectors are shown as a percentage of the Fund’s total investments. The Fund expects to allocate its assets approximately equally among Boston Income Portfolio, Government Obligations Portfolio and Floating Rate Portfolio. The Fund’s investment adviser will monitor the Fund’s allocations to the underlying Portfolios and will rebalance whenever actual allocations exceed plus or minus 3% of the Fund’s pre-determined fixed allocation percentages. |
Past performance is no guarantee of future results. Returns are historical and are calculated by determining the percentage change in net asset value or offering price (as applicable) with all distributions reinvested. Investment return and principal value will fluctuate so that shares, when redeemed, may be worth more or less than their original cost. Performance is for the stated time period only; due to market volatility, the Fund’s current performance may be lower or higher than the quoted return. For performance as of the most recent month end, please refer to www.eatonvance.com.
3
Eaton Vance Diversified Income Fund as of October 31, 2008
FUND EXPENSES
Example: As a shareholder of the Fund, you incur two types of costs: (1) transaction costs, including sales charges (loads) on purchases and redemption fees (if applicable); and (2) ongoing costs, including management fees; distribution or service fees; and other Fund expenses. This Example is intended to help you understand your ongoing costs (in dollars) of investing in the Fund and to compare these costs with the ongoing costs of investing in other mutual funds. The Example is based on an investment of $1,000 invested at the beginning of the period and held for the entire period (May 1, 2008 – October 31, 2008).
Actual Expenses: The first section of the table below provides information about actual account values and actual expenses. You may use the information in this section, together with the amount you invested, to estimate the expenses that you paid over the period. Simply divide your account value by $1,000 (for example, an $8,600 account value divided by $1,000 = 8.6), then multiply the result by the number in the first section under the heading entitled "Expenses Paid During Period" to estimate the expenses you paid on your account during this period.
Hypothetical Example for Comparison Purposes: The second section of the table below provides information about hypothetical account values and hypothetical expenses based on the actual Fund expense ratio and an assumed rate of return of 5% per year (before expenses), which is not the actual return of the Fund. The hypothetical account values and expenses may not be used to estimate the actual ending account balance or expenses you paid for the period. You may use this information to compare the ongoing costs of investing in your Fund and other funds. To do so, compare this 5% hypothetical example with the 5% hypothetical examples that appear in the shareholder reports of the other funds.
Please note that the expenses shown in the table are meant to highlight your ongoing costs only and do not reflect any transactional costs, such as sales charges (loads) or redemption fees (if applicable). Therefore, the second section of the table is useful in comparing ongoing costs only, and will not help you determine the relative total costs of owning different funds. In addition, if these transactional costs were included, your costs would have been higher.
Eaton Vance Diversified Income Fund
| | | Beginning Account Value
(5/1/08) | | Ending Account Value
(10/31/08) | | Expenses Paid During Period*
(5/1/08 – 10/31/08) | |
| Actual | |
| Class A | | $ | 1,000.00 | | | $ | 851.20 | | | $ | 5.35 | | |
| Class B | | $ | 1,000.00 | | | $ | 847.80 | | | $ | 8.83 | | |
| Class C | | $ | 1,000.00 | | | $ | 847.80 | | | $ | 8.83 | | |
| Hypothetical | |
| (5% return per year before expenses) | |
| Class A | | $ | 1,000.00 | | | $ | 1,019.40 | | | $ | 5.84 | | |
| Class B | | $ | 1,000.00 | | | $ | 1,015.60 | | | $ | 9.63 | | |
| Class C | | $ | 1,000.00 | | | $ | 1,015.60 | | | $ | 9.63 | | |
*Expenses are equal to the Fund's annualized expense ratio of 1.15% for Class A shares, 1.90% for Class B shares and 1.90% for Class C shares, multiplied by the average account value over the period, multiplied by 184/366 (to reflect the one-half year period). The Example assumes that the $1,000 was invested at the net asset value per share determined at the close of business on April 30, 2008. The Example reflects the expenses of the Fund and the Portfolios.
4
Eaton Vance Diversified Income Fund as of October 31, 2008
FINANCIAL STATEMENTS
Statement of Assets and Liabilities
As of October 31, 2008
| Assets | |
Investment in Boston Income Portfolio, at value
(identified cost, $133,182,770) | | $ | 93,550,094 | | |
Investment in Floating Rate Portfolio, at value
(identified cost, $130,044,229) | | | 93,012,386 | | |
Investment in Government Obligations Portfolio, at value
(identified cost, $91,388,433) | | | 92,261,793 | | |
| Receivable for Fund shares sold | | | 291,181 | | |
| Total assets | | $ | 279,115,454 | | |
| Liabilities | |
| Payable for Fund shares redeemed | | $ | 962,576 | | |
| Dividends payable | | | 546,825 | | |
| Payable to affiliate for distribution and service fees | | | 164,597 | | |
| Payable to affiliate for Trustees' fees | | | 41 | | |
| Accrued expenses | | | 140,733 | | |
| Total liabilities | | $ | 1,814,772 | | |
| Net Assets | | $ | 277,300,682 | | |
| Sources of Net Assets | |
| Paid-in capital | | $ | 372,342,893 | | |
Accumulated net realized loss from Portfolios (computed on
the basis of identified cost) | | | (19,326,045 | ) | |
| Accumulated undistributed net investment income | | | 74,993 | | |
Net unrealized depreciation from Portfolios (computed on the basis of
identified cost) | | | (75,791,159 | ) | |
| Total | | $ | 277,300,682 | | |
| Class A Shares | |
| Net Assets | | $ | 128,030,403 | | |
| Shares Outstanding | | | 16,850,537 | | |
Net Asset Value and Redemption Price Per Share
(net assets ÷ shares of beneficial interest outstanding) | | $ | 7.60 | | |
Maximum Offering Price Per Share
(100 ÷ 95.25 of $7.60) | | $ | 7.98 | | |
| Class B Shares | |
| Net Assets | | $ | 28,616,278 | | |
| Shares Outstanding | | | 3,769,319 | | |
Net Asset Value and Offering Price Per Share*
(net assets ÷ shares of beneficial interest outstanding) | | $ | 7.59 | | |
| Class C Shares | |
| Net Assets | | $ | 120,654,001 | | |
| Shares Outstanding | | | 15,891,567 | | |
Net Asset Value and Offering Price Per Share*
(net assets ÷ shares of beneficial interest outstanding) | | $ | 7.59 | | |
| On sales of $25,000 or more, the offering price of Class A shares is reduced. | |
* Redemption price per share is equal to the net asset value less any applicable contingent deferred sales charge.
Statement of Operations
For the Year Ended
October 31, 2008
| Investment Income | |
| Interest and other income allocated from Portfolios | | $ | 27,841,834 | | |
| Dividend income allocated from Portfolios | | | 55,007 | | |
| Securities lending income allocated from Portfolio | | | 63,811 | | |
| Expenses allocated from Portfolios | | | (2,737,275 | ) | |
| Net investment income from Portfolios | | $ | 25,223,377 | | |
| Expenses | |
| Trustees' fees and expenses | | $ | 1,735 | | |
Distribution and service fees
Class A | | | 454,278 | | |
| Class B | | | 366,571 | | |
| Class C | | | 1,621,823 | | |
| Transfer and dividend disbursing agent fees | | | 253,441 | | |
| Registration fees | | | 62,080 | | |
| Legal and accounting services | | | 37,588 | | |
| Printing and postage | | | 45,918 | | |
| Custodian fee | | | 195,205 | | |
| Miscellaneous | | | 13,251 | | |
| Total expenses | | $ | 3,051,890 | | |
| Net investment income | | $ | 22,171,487 | | |
Realized and Unrealized
Gain (Loss) from Portfolios | |
Net realized gain (loss) —
Investment transactions (identified cost basis) | | $ | (10,119,454 | ) | |
| Financial futures contracts | | | 1,678,853 | | |
| Swap contracts | | | 266,112 | | |
Foreign currency and forward foreign currency exchange
contract transactions | | | 1,740,834 | | |
| Net realized loss | | $ | (6,433,655 | ) | |
Change in unrealized appreciation (depreciation) —
Investments (identified cost basis) | | $ | (70,461,285 | ) | |
| Financial futures contracts | | | (468,229 | ) | |
| Swap contracts | | | (714,898 | ) | |
| Foreign currency and forward foreign currency exchange contracts | | | 211,878 | | |
| Net change in unrealized appreciation (depreciation) | | $ | (71,432,534 | ) | |
| Net realized and unrealized loss | | $ | (77,866,189 | ) | |
| Net decrease in net assets from operations | | $ | (55,694,702 | ) | |
See notes to financial statements
5
Eaton Vance Diversified Income Fund as of October 31, 2008
FINANCIAL STATEMENTS CONT'D
Statements of Changes in Net Assets
Increase (Decrease)
in Net Assets | | Year Ended
October 31, 2008 | | Year Ended
October 31, 2007 | |
From operations —
Net investment income | | $ | 22,171,487 | | | $ | 21,567,802 | | |
Net realized gain (loss) from investment
transactions, financial futures
contracts, swap contracts, and
foreign currency and forward foreign
currency exchange contract transactions | | | (6,433,655 | ) | | | 198,627 | | |
Net change in unrealized
appreciation (depreciation) from
investments, financial futures contracts,
swap contracts, and foreign currency
and forward foreign currency
exchange contracts | | | (71,432,534 | ) | | | (4,927,897 | ) | |
Net increase (decrease) in net assets
from operations | | $ | (55,694,702 | ) | | $ | 16,838,532 | | |
Distributions to shareholders —
From net investment income
Class A | | $ | (11,703,356 | ) | | $ | (11,639,357 | ) | |
| Class B | | | (2,104,477 | ) | | | (2,100,586 | ) | |
| Class C | | | (9,312,164 | ) | | | (9,527,571 | ) | |
Tax return of capital
Class A | | $ | (655,719 | ) | | | — | | |
| Class B | | | (117,910 | ) | | | — | | |
| Class C | | | (521,744 | ) | | | — | | |
| Total distributions to shareholders | | $ | (24,415,370 | ) | | $ | (23,267,514 | ) | |
Transactions in shares of beneficial interest —
Proceeds from sale of shares
Class A | | $ | 41,804,108 | | | $ | 103,643,666 | | |
| Class B | | | 5,591,106 | | | | 11,774,288 | | |
| Class C | | | 22,114,622 | | | | 72,555,582 | | |
Net asset value of shares issued to
shareholders in payment of
distributions declared
Class A | | | 8,684,367 | | | | 8,124,353 | | |
| Class B | | | 1,470,718 | | | | 1,367,260 | | |
| Class C | | | 6,916,474 | | | | 6,588,347 | | |
Cost of shares redeemed
Class A | | | (85,120,914 | ) | | | (53,332,480 | ) | |
| Class B | | | (9,470,658 | ) | | | (5,406,383 | ) | |
| Class C | | | (55,925,060 | ) | | | (30,076,238 | ) | |
Net increase (decrease) in net assets from
Fund share transactions | | $ | (63,935,237 | ) | | $ | 115,238,395 | | |
| Net increase (decrease) in net assets | | $ | (144,045,309 | ) | | $ | 108,809,413 | | |
| Net Assets | | Year Ended
October 31, 2008 | | Year Ended
October 31, 2007 | |
| At beginning of year | | $ | 421,345,991 | | | $ | 312,536,578 | | |
| At end of year | | $ | 277,300,682 | | | $ | 421,345,991 | | |
Accumulated undistributed
net investment income
included in net assets | |
| At end of year | | $ | 74,993 | | | $ | 169,793 | | |
See notes to financial statements
6
Eaton Vance Diversified Income Fund as of October 31, 2008
FINANCIAL STATEMENTS CONT'D
Financial Highlights
| | | Class A | |
| | | Year Ended October 31, | | Period Ended | |
| | | 2008 | | 2007 | | 2006 | | October 31, 2005(1) | |
| Net asset value — Beginning of period | | $ | 9.630 | | | $ | 9.770 | | | $ | 9.760 | | | $ | 10.000 | | |
| Income (loss) from operations | |
| Net investment income(2) | | $ | 0.568 | | | $ | 0.593 | | | $ | 0.561 | | | $ | 0.430 | | |
| Net realized and unrealized gain (loss) | | | (1.977 | ) | | | (0.095 | ) | | | 0.086 | | | | (0.108 | ) | |
| Total income (loss) from operations | | $ | (1.409 | ) | | $ | 0.498 | | | $ | 0.647 | | | $ | 0.322 | | |
| Less distributions | |
| From net investment income | | $ | (0.588 | ) | | $ | (0.638 | ) | | $ | (0.637 | ) | | $ | (0.562 | ) | |
| Tax return of capital | | | (0.033 | ) | | | — | | | | — | | | | — | | |
| Total distributions | | $ | (0.621 | ) | | $ | (0.638 | ) | | $ | (0.637 | ) | | $ | (0.562 | ) | |
| Net asset value — End of period | | $ | 7.600 | | | $ | 9.630 | | | $ | 9.770 | | | $ | 9.760 | | |
| Total Return(3) | | | (15.48 | )% | | | 5.22 | % | | | 6.84 | % | | | 3.29 | %(9) | |
| Ratios/Supplemental Data | |
| Net assets, end of period (000's omitted) | | $ | 128,030 | | | $ | 200,163 | | | $ | 144,830 | | | $ | 86,858 | | |
| Ratios (As a percentage of average daily net assets): | | | | | | | |
| Expenses before custodian fee reduction(4)(5) | | | 1.14 | % | | | 1.10 | % | | | 1.09 | % | | | 1.17 | %(6)(7) | |
| Net investment income | | | 6.22 | % | | | 6.08 | % | | | 5.75 | % | | �� | 4.84 | %(6) | |
| Portfolio Turnover of Boston Income Portfolio | | | 54 | % | | | 84 | % | | | 68 | % | | | 71 | %(8) | |
| Portfolio Turnover of Floating Rate Portfolio | | | 7 | % | | | 61 | % | | | 50 | % | | | 57 | %(8) | |
| Portfolio Turnover of Government Obligations Portfolio | | | 19 | % | | | 23 | % | | | 2 | % | | | 30 | %(8) | |
(1) For the period from the start of business, December 7, 2004, to October 31, 2005.
(2) Computed using average shares outstanding.
(3) Returns are historical and are calculated by determining the percentage change in net asset value with all distributions reinvested.
(4) Includes the Fund's share of the Portfolios' allocated expenses.
(5) Excludes the effect of custody fee credits, if any, of less than 0.005%.
(6) Annualized.
(7) The investment adviser waived a portion of its adviser fee and the administrator subsidized certain operating expenses (equal to 0.03%).
(8) For the Portfolio's fiscal year ended October 31, 2005.
(9) Not annualized.
See notes to financial statements
7
Eaton Vance Diversified Income Fund as of October 31, 2008
FINANCIAL STATEMENTS CONT'D
Financial Highlights
| | | Class B | |
| | | Year Ended October 31, | | Period Ended | |
| | | 2008 | | 2007 | | 2006 | | October 31, 2005(1) | |
| Net asset value — Beginning of period | | $ | 9.620 | | | $ | 9.760 | | | $ | 9.750 | | | $ | 10.000 | | |
| Income (loss) from operations | |
| Net investment income(2) | | $ | 0.500 | | | $ | 0.520 | | | $ | 0.488 | | | $ | 0.365 | | |
| Net realized and unrealized gain (loss) | | | (1.977 | ) | | | (0.095 | ) | | | 0.085 | | | | (0.120 | ) | |
| Total income (loss) from operations | | $ | (1.477 | ) | | $ | 0.425 | | | $ | 0.573 | | | $ | 0.245 | | |
| Less distributions | |
| From net investment income | | $ | (0.524 | ) | | $ | (0.565 | ) | | $ | (0.563 | ) | | $ | (0.495 | ) | |
| Tax return of capital | | | (0.029 | ) | | | — | | | | — | | | | — | | |
| Total distributions | | $ | (0.553 | ) | | $ | (0.565 | ) | | $ | (0.563 | ) | | $ | (0.495 | ) | |
| Net asset value — End of period | | $ | 7.590 | | | $ | 9.620 | | | $ | 9.760 | | | $ | 9.750 | | |
| Total Return(3) | | | (16.13 | )% | | | 4.44 | % | | | 6.05 | % | | | 2.49 | %(9) | |
| Ratios/Supplemental Data | |
| Net assets, end of period (000's omitted) | | $ | 28,616 | | | $ | 38,986 | | | $ | 31,827 | | | $ | 21,926 | | |
| Ratios (As a percentage of average daily net assets): | |
| Expenses before custodian fee reduction(4)(5) | | | 1.88 | % | | | 1.85 | % | | | 1.84 | % | | | 1.92 | %(6)(7) | |
| Net investment income | | | 5.48 | % | | | 5.35 | % | | | 5.01 | % | | | 4.11 | %(6) | |
| Portfolio Turnover of Boston Income Portfolio | | | 54 | % | | | 84 | % | | | 68 | % | | | 71 | %(8) | |
| Portfolio Turnover of Floating Rate Portfolio | | | 7 | % | | | 61 | % | | | 50 | % | | | 57 | %(8) | |
| Portfolio Turnover of Government Obligations Portfolio | | | 19 | % | | | 23 | % | | | 2 | % | | | 30 | %(8) | |
(1) For the period from the start of business, December 7, 2004, to October 31, 2005.
(2) Computed using average shares outstanding.
(3) Returns are historical and are calculated by determining the percentage change in net asset value with all distributions reinvested.
(4) Includes the Fund's share of the Portfolios' allocated expenses.
(5) Excludes the effect of custody fee credits, if any, of less than 0.005%.
(6) Annualized.
(7) The investment adviser waived a portion of its adviser fee and the administrator subsidized certain operating expenses (equal to 0.03%).
(8) For the Portfolio's fiscal year ended October 31, 2005.
(9) Not annualized.
See notes to financial statements
8
Eaton Vance Diversified Income Fund as of October 31, 2008
FINANCIAL STATEMENTS CONT'D
Financial Highlights
| | | Class C | |
| | | Year Ended October 31, | | Period Ended | |
| | | 2008 | | 2007 | | 2006 | | October 31, 2005(1) | |
| Net asset value — Beginning of period | | $ | 9.620 | | | $ | 9.770 | | | $ | 9.750 | | | $ | 10.000 | | |
| Income (loss) from operations | |
| Net investment income(2) | | $ | 0.500 | | | $ | 0.520 | | | $ | 0.489 | | | $ | 0.362 | | |
| Net realized and unrealized gain (loss) | | | (1.978 | ) | | | (0.105 | ) | | | 0.095 | | | | (0.117 | ) | |
| Total income (loss) from operations | | $ | (1.478 | ) | | $ | 0.415 | | | $ | 0.584 | | | $ | 0.245 | | |
| Less distributions | |
| From net investment income | | $ | (0.523 | ) | | $ | (0.565 | ) | | $ | (0.564 | ) | | $ | (0.495 | ) | |
| Tax return of capital | | | (0.029 | ) | | | — | | | | — | | | | — | | |
| Total distributions | | $ | (0.552 | ) | | $ | (0.565 | ) | | $ | (0.564 | ) | | $ | (0.495 | ) | |
| Net asset value — End of period | | $ | 7.590 | | | $ | 9.620 | | | $ | 9.770 | | | $ | 9.750 | | |
| Total Return(3) | | | (16.13 | )% | | | 4.33 | % | | | 6.16 | % | | | 2.49 | %(9) | |
| Ratios/Supplemental Data | |
| Net assets, end of period (000's omitted) | | $ | 120,654 | | | $ | 182,197 | | | $ | 135,880 | | | $ | 89,806 | | |
| Ratios (As a percentage of average daily net assets): | |
| Expenses before custodian fee reduction(4)(5) | | | 1.88 | % | | | 1.85 | % | | | 1.84 | % | | | 1.92 | %(6)(7) | |
| Net investment income | | | 5.48 | % | | | 5.34 | % | | | 5.02 | % | | | 4.08 | %(6) | |
| Portfolio Turnover of Boston Income Portfolio | | | 54 | % | | | 84 | % | | | 68 | % | | | 71 | %(8) | |
| Portfolio Turnover of Floating Rate Portfolio | | | 7 | % | | | 61 | % | | | 50 | % | | | 57 | %(8) | |
| Portfolio Turnover of Government Obligations Portfolio | | | 19 | % | | | 23 | % | | | 2 | % | | | 30 | %(8) | |
(1) For the period from the start of business, December 7, 2004, to October 31, 2005.
(2) Computed using average shares outstanding.
(3) Returns are historical and are calculated by determining the percentage change in net asset value with all distributions reinvested.
(4) Includes the Fund's share of the Portfolios' allocated expenses.
(5) Excludes the effect of custody fee credits, if any, of less than 0.005%.
(6) Annualized.
(7) The investment adviser waived a portion of its adviser fee and the administrator subsidized certain operating expenses (equal to 0.03%).
(8) For the Portfolio's fiscal year ended October 31, 2005.
(9) Not annualized.
See notes to financial statements
9
Eaton Vance Diversified Income Fund as of October 31, 2008
NOTES TO FINANCIAL STATEMENTS
1 Significant Accounting Policies
Eaton Vance Diversified Income Fund (the Fund) is a diversified series of Eaton Vance Mutual Funds Trust (the Trust). The Trust is a Massachusetts business trust registered under the Investment Company Act of 1940, as amended (the 1940 Act), as an open-end management investment company. The Fund offers three classes of shares. Class A shares are generally sold subject to a sales charge imposed at time of purchase. Class B and Class C shares are sold at net asset value and are generally subject to a contingent deferred sales charge (see Note 5). Class B shares automatically convert to Class A shares eight years after their purchase as described in the Fund's prospectus. Each class represents a pro-rata interest in the Fund, but votes separately on class-specific matters and (as noted below) is subject to different expenses. Realized and unrealized gains and losses are allocated daily to each class of shares based on the relative net assets of each class to the total net assets of the Fund. Net investment income, other than class-specific expenses, is allocated daily to each class of shares based upon the ratio of the value of each class's paid shares to the total value of all paid shares. Each class of shares differs in its distribution plan and certain other class-specific expenses. The Fund's investment objective is to provide a high level of current income. The Fund may, as a secondary objective, also seek capital appreciation to the extent consistent with its primary objective of high current income. The Fund currently pursues its objective by investing all of its investable assets in interests in the following three portfolios managed by Eaton Vance Management (EVM) or its affiliates: Boston Income Portfolio, Floating Rate Portfolio, and Government Obligations Portfolio (the Portfolios), which are New York trusts. The value of the Fund's investment in the Portfolios reflects the Fund's proportionate interest in the net assets o f the Boston Income Portfolio, Floating Rate Portfolio, and Government Obligations Portfolio (6.1%, 3.0%, and 11.4%, respectively, at October 31, 2008). The performance of the Fund is directly affected by the performance of the Portfolios. A copy of each Portfolio's financial statements is available on the EDGAR Database on the Securities and Exchange Commission's website (www.sec.gov), at the Commission's public reference room in Washington, DC or upon request from the Fund's principal underwriter, Eaton Vance Distributors, Inc. (EVD), by calling 1-800-262-1122.
The following is a summary of significant accounting policies of the Fund. The policies are in conformity with accounting principles generally accepted in the United States of America.
A Investment Valuation — The valuation policies common to the Portfolios are as follows: Debt obligations, including listed securities and securities for which quotations are available, will normally be valued on the basis of market quotations provided by independent pricing services. The pricing services consider various factors relating to bonds and/or market transactions to determine market value. Most seasoned, fixed rate 30-year mortgage-backed securities are valued by Government Obligations Portfolio through the use of the investment adviser's matrix pricing system, which takes into account bond prices, yield differentials, anticipated prepayments and interest rates provided by dealers. Short-te rm debt securities with a remaining maturity of sixty days or less are valued at amortized cost, which approximates market value. If short-term debt securities are acquired with a remaining maturity of more than sixty days, they will be valued by a pricing service. Foreign securities and currencies are valued in U.S. dollars, based on foreign currency exchange rate quotations supplied by an independent quotation service. The independent service uses a proprietary model to determine the exchange rate. Inputs to the model include reported trades and implied bid/ask spreads.
Equity securities listed on a U.S. securities exchange generally are valued at the last sale price on the day of valuation or, if no sales took place on such date, at the mean between the closing bid and asked prices therefore on the exchange where such securities are principally traded. Equity securities listed on the NASDAQ Global or Global Select Market generally are valued at the NASDAQ official closing price. Unlisted or listed securities for which closing sales prices or closing quotations are not available are valued at the mean between the latest available bid and asked prices or, in the case of preferred equity securities that are not listed or traded in the over-the-counter market, by an independent pricing service. Financial futures contracts listed on commodity exchanges are valued based on the closing price on the primary exchange on which such contracts trade. Credit default swaps are valued by a broker-dealer (usu ally the counterparty to the agreement). Forward foreign currency exchange contracts are generally valued using prices supplied by a pricing vendor or dealers. Investments for which valuations or market quotations are not readily available are valued at fair value using methods determined in good faith by or at the direction of the Trustees of the Portfolios considering relevant factors, data and information including the market value of freely tradable securities of the same class in the principal market on which such securities are normally traded.
Additional valuation policies for Boston Income Portfolio and Floating Rate Portfolio are as follows: Interests in senior floating-rate loans (Senior Loans) for which reliable market quotations are readily available are valued generally at the average mean of bid and ask quotations
10
Eaton Vance Diversified Income Fund as of October 31, 2008
NOTES TO FINANCIAL STATEMENTS CONT'D
obtained from an independent pricing service. Other Senior Loans are valued at fair value by the investment adviser under procedures approved by the Trustees. In fair valuing a Senior Loan, the investment adviser utilizes one or more of the following valuation techniques: (i) a matrix pricing approach that considers the yield on the Senior Loan relative to yields on other loan interests issued by companies of comparable credit quality; (ii) a comparison of the value of the borrower's outstanding equity and debt to that of comparable public companies; (iii) a discounted cash flow analysis; or (iv) when the investment adviser believes it is likely that a borrower will be liquidated or sold, an analysis of the terms of such liquidation or sale. In certain cases, the investment adviser will use a combination of analytical methods to determine fair value, such as when only a portion of a borrower's assets are likely to be sold. In co nducting its assessment and analyses for purposes of determining fair value of a Senior Loan, the investment adviser will use its discretion and judgment in considering and appraising relevant factors. Fair value determinations are made by the portfolio managers of the Portfolios based on information available to such managers. The portfolio managers of other funds managed by the investment adviser that invest in Senior Loans may not possess the same information about a Senior Loan borrower as the portfolio managers of the Portfolio. At times, the fair value of a Senior Loan determined by the portfolio managers of other funds managed by the investment adviser that invest in Senior Loans may vary from the fair value of the same Senior Loan determined by the portfolio managers of the Portfolios. The fair value of each Senior Loan is periodically reviewed and approved by the investment adviser's Valuation Committee and by the Trustees based upon procedures approved by the Trustees. Junior Loans are valued in th e same manner as Senior Loans.
The Portfolios may invest in Cash Management Portfolio (Cash Management), an affiliated investment company managed by Boston Management and Research (BMR), a subsidiary of EVM. Cash Management values its investment securities utilizing the amortized cost valuation technique permitted by Rule 2a-7 of the 1940 Act, pursuant to which Cash Management must comply with certain conditions. This technique involves initially valuing a portfolio security at its cost and thereafter assuming a constant amortization to maturity of any discount or premium. If amortized cost is determined not to approximate fair value, Cash Management may value its investment securities based on available market quotations provided by a pricing service.
B Income — The Fund's net investment income or loss consists of the Fund's pro-rata share of the net investment income or loss of the Portfolios, less all actual and accrued expenses of the Fund.
C Federal Taxes — The Fund's policy is to comply with the provisions of the Internal Revenue Code applicable to regulated investment companies and to distribute to shareholders each year substantially all of its net investment income, and all or substantially all of its net realized capital gains. Accordingly, no provision for federal income or excise tax is necessary.
At October 31, 2008, the Fund, for federal income tax purposes, had a capital loss carryforward of $18,887,915 which will reduce its taxable income arising from future net realized gains on investment transactions, if any, to the extent permitted by the Internal Revenue Code, and thus will reduce the amount of distributions to shareholders, which would otherwise be necessary to relieve the Fund of any liability for federal income or excise tax. Such capital loss carryforward will expire on October 31, 2013 ($1,151,435), October 31, 2014 ($1,054,697), October 31, 2015 ($1,377,385) and October 31, 2016 ($15,304,398).
As of October 31, 2008, the Fund had no uncertain tax positions that would require financial statement recognition, de-recognition, or disclosure. Each of the Fund's federal tax returns filed in the 3-year period ended October 31, 2008 remains subject to examination by the Internal Revenue Service.
D Expenses — The majority of expenses of the Trust are directly identifiable to an individual fund. Expenses which are not readily identifiable to a specific fund are allocated taking into consideration, among other things, the nature and type of expense and the relative size of the funds.
E Expense Reduction — State Street Bank and Trust Company (SSBT) serves as custodian of the Fund. Pursuant to the custodian agreement, SSBT receives a fee reduced by credits, which are determined based on the average daily cash balance the Fund maintains with SSBT. All credit balances, if any, used to reduce the Fund's custodian fees are reported as a reduction of expenses in the Statement of Operations.
F Use of Estimates — The preparation of the financial statements in conformity with accounting principles generally accepted in the United States of America requires management to make estimates and assumptions that affect the reported amounts of assets and liabilities at the date of the financial statements and the reported amounts of income and expense during the reporting period. Actual results could differ from those estimates.
G Indemnifications — Under the Trust's organizational documents, its officers and Trustees may be
11
Eaton Vance Diversified Income Fund as of October 31, 2008
NOTES TO FINANCIAL STATEMENTS CONT'D
indemnified against certain liabilities and expenses arising out of the performance of their duties to the Fund, and shareholders are indemnified against personal liability for the obligations of the Trust. Additionally, in the normal course of business, the Fund enters into agreements with service providers that may contain indemnification clauses. The Fund's maximum exposure under these arrangements is unknown as this would involve future claims that may be made against the Fund that have not yet occurred.
H Other — Investment transactions are accounted for on a trade date basis. Dividends to shareholders are recorded on the ex-dividend date.
2 Distributions to Shareholders
The Fund declares dividends daily to shareholders of record at the time of declaration. Distributions are generally paid monthly. Distributions of realized capital gains (reduced by available capital loss carryforwards from prior years, if any) are made at least annually. Distributions are declared separately for each class of shares. Shareholders may reinvest income and capital gain distributions in additional shares of the same class of the Fund at the net asset value as of the reinvestment date or, at the election of the shareholder, receive distributions in cash. The Fund distinguishes between distributions on a tax basis and a financial reporting basis. Accounting principles generally accepted in the United States of America require that only distributions in excess of tax basis earnings and profits be reported in the financial statements as a return of capital. Permanent differences between book and tax accounting relatin g to distributions are reclassified to paid-in capital.
The tax character of distributions declared for the years ended October 31, 2008 and October 31, 2007 was as follows:
| | | Year Ended October 31, | |
| | | 2008 | | 2007 | |
| Distributions declared from: | |
| Ordinary income | | $ | 23,119,997 | | | $ | 23,267,514 | | |
| Tax return of capital | | $ | 1,295,373 | | | | — | | |
During the year ended October 31, 2008, accumulated net realized loss was increased by $8,903,970, accumulated distributions in excess of net investment income was decreased by $853,710 and paid-in capital was increased by $8,050,260 due to differences between book and tax accounting, primarily for foreign currency gain (loss), premium amortization, swap contracts, paydown gain (loss) and mixed straddles. These reclassifications had no effect on the net assets or net asset value per share of the Fund.
As of October 31, 2008, the components of distributable earnings (accumulated losses) and unrealized appreciation (depreciation) on a tax basis were as follows:
| Capital loss carryforward | | $ | (18,887,915 | ) | |
| Net unrealized depreciation | | $ | (75,065,009 | ) | |
| Other temporary differences | | $ | (546,825 | ) | |
The differences between components of distributable earnings (accumulated losses) on a tax basis and the amounts reflected in the Statement of Assets and Liabilities are primarily due to wash sales, the timing of recognizing distributions to shareholders, swap contracts, partnership allocations and future contracts.
3 Transactions with Affiliates
EVM serves as the investment adviser and administrator of the Fund, providing advisory services (relating to the investment of the Fund's assets in the Portfolios) and administering the business affairs of the Fund. EVM does not receive a fee for serving as the Fund's investment adviser and administrator. The Portfolios have engaged BMR to render investment advisory services. For the year ended October 31, 2008, the Fund's allocated portion of the adviser fees paid by the Portfolios was 0.63% of the Fund's average daily net assets and amounted to $2,381,966.
EVM serves as the sub-transfer agent of the Fund and receives from the transfer agent an aggregate fee based upon the actual expenses incurred by EVM in the performance of these services. For the year ended October 31, 2008, EVM earned $14,495 in sub-transfer agent fees. The Fund was informed that EVD, an affiliate of EVM, received $40,002 as its portion of the sales charge on sales of Class A shares for the year ended October 31, 2008. EVD also received distribution and service fees from Class A, Class B and Class C shares (see Note 4) and contingent deferred sales charges (see Note 5).
Except for Trustees of the Fund and the Portfolios who are not members of EVM's and BMR's organizations, officers and Trustees receive remuneration for their services to the Fund out of the investment adviser fee. Certain officers and Trustees of the Fund and the Portfolios are officers of the above organizations.
4 Distribution Plans
The Fund has in effect a distribution plan for Class A shares (Class A Plan) pursuant to Rule 12b-1 under the 1940 Act. The Class A Plan provides that the Fund will pay EVD a distribution and service fee of 0.25% per annum of its average daily net assets attributable to Class A shares for
12
Eaton Vance Diversified Income Fund as of October 31, 2008
NOTES TO FINANCIAL STATEMENTS CONT'D
distribution services and facilities provided to the Fund by EVD, as well as for personal services and/or the maintenance of shareholder accounts. Distribution and service fees paid or accrued to EVD for the year ended October 31, 2008 amounted to $454,278 for Class A shares.
The Fund also has in effect distribution plans for Class B shares (Class B Plan) and Class C shares (Class C Plan) pursuant to Rule 12b-1 under the 1940 Act. The Class B and Class C Plans require the Fund to pay EVD amounts equal to 0.75% per annum of its average daily net assets attributable to Class B and Class C shares for providing ongoing distribution services and facilities to the Fund. The Fund will automatically discontinue payments to EVD during any period in which there are no outstanding Uncovered Distribution Charges, which are equivalent to the sum of (i) 6.25% of the aggregate amount received by the Fund for Class B and Class C shares sold, plus (ii) interest calculated by applying the rate of 1% over the prevailing prime rate to the outstanding balance of Uncovered Distribution Charges of EVD of each respective class, reduced by the aggregate amount of contingent deferred sales charges (see Note 5) and amounts the retofore paid or payable to EVD by each respective class. For the year ended October 31, 2008, the Fund paid or accrued to EVD $274,928 and $1,216,367 for Class B and Class C shares, respectively, representing 0.75% of the average daily net assets of Class B and Class C shares. At October 31, 2008, the amounts of Uncovered Distribution Charges of EVD calculated under the Class B and Class C Plans were approximately $1,548,000 and $11,882,000 respectively.
The Class B and Class C Plans also authorize the Fund to make payments of service fees to EVD, investment dealers and other persons in amounts not exceeding 0.25% per annum of its average daily net assets attributable to that class. Service fees paid or accrued are for personal services and/or the maintenance of shareholder accounts. They are separate and distinct from the sales commissions and distribution fees payable to EVD and, as such, are not subject to automatic discontinuance when there are no outstanding Uncovered Distribution Charges of EVD. Service fees paid or accrued for the year ended October 31, 2008 amounted to $91,643 and $405,456 for Class B and Class C shares, respectively.
5 Contingent Deferred Sales Charges
A contingent deferred sales charge (CDSC) generally is imposed on redemptions of Class B shares made within six years of purchase and on redemptions of Class C shares made within one year of purchase. Class A shares may be subject to a 1% CDSC if redeemed within 18 months of purchase (depending on the circumstances of purchase). Generally, the CDSC is based upon the lower of the net asset value at date of redemption or date of purchase. No charge is levied on shares acquired by reinvestment of dividends or capital gain distributions. The CDSC for Class B shares is imposed at declining rates that begin at 5% in the case of redemptions in the first and second year after purchase, declining one percentage point each subsequent year. Class C shares are subject to a 1% CDSC if redeemed within one year of purchase. No CDSC is levied on shares which have been sold to EVM or its affiliates or to their respective employees or clients and may be waived under certain other limited conditions. CDSCs received on Class B and Class C redemptions are paid to EVD to reduce the amount of Uncovered Distribution Charges calculated under the Fund's Class B and Class C Plans. CDSCs received on Class B and Class C redemptions when no Uncovered Distribution Charges exist are credited to the Fund. For the year ended October 31, 2008, the Fund was informed that EVD received approximately $169,000 and $36,000 of CDSCs paid by Class B and Class C shareholders, respectively.
6 Investment Transactions
For the year ended October 31, 2008, increases and decreases in the Fund's investment in the Portfolios were as follows:
| Portfolio | | Contributions | | Withdrawals | |
| Boston Income Portfolio | | $ | 31,654,677 | | | $ | 45,094,879 | | |
| Floating Rate Portfolio | | | 23,230,774 | | | | 41,958,184 | | |
| Government Obligations Portfolio | | | 17,406,318 | | | | 71,081,190 | | |
7 Shares of Beneficial Interest
The Fund's Declaration of Trust permits the Trustees to issue an unlimited number of full and fractional shares of beneficial interest (without par value). Such shares may be issued in a number of different series (such as the Fund) and classes. Transactions in Fund shares were as follows:
| | | Year Ended October 31, | |
| Class A | | 2008 | | 2007 | |
| Sales | | | 4,532,622 | | | | 10,613,050 | | |
Issued to shareholders electing to
receive payments of distributions
in Fund shares | | | 958,445 | | | | 835,241 | | |
| Redemptions | | | (9,423,479 | ) | | | (5,485,351 | ) | |
| Net increase (decrease) | | | (3,932,412 | ) | | | 5,962,940 | | |
13
Eaton Vance Diversified Income Fund as of October 31, 2008
NOTES TO FINANCIAL STATEMENTS CONT'D
| | | Year Ended October 31, | |
| Class B | | 2008 | | 2007 | |
| Sales | | | 611,246 | | | | 1,206,837 | | |
Issued to shareholders electing to
receive payments of distributions
in Fund shares | | | 162,815 | | | | 140,653 | | |
| Redemptions | | | (1,056,020 | ) | | | (555,949 | ) | |
| Net increase (decrease) | | | (281,959 | ) | | | 791,541 | | |
| | | Year Ended October 31, | |
| Class C | | 2008 | | 2007 | |
| Sales | | | 2,398,942 | | | | 7,435,545 | | |
Issued to shareholders electing to
receive payments of distributions
in Fund shares | | | 764,924 | | | | 677,831 | | |
| Redemptions | | | (6,204,529 | ) | | | (3,095,981 | ) | |
| Net increase (decrease) | | | (3,040,663 | ) | | | 5,017,395 | | |
8 Recently Issued Accounting Pronouncement
In September 2006, the Financial Accounting Standards Board issued Statement of Financial Accounting Standards No. 157 (FAS 157), "Fair Value Measurements". FAS 157 defines fair value, establishes a framework for measuring fair value in accordance with accounting principles generally accepted in the United States of America and expands disclosure about fair value measurements. FAS 157 is effective for fiscal years beginning after November 15, 2007. As of October 31, 2008, management does not believe the adoption of FAS 157 will impact the amounts reported in the financial statements; however, additional disclosures may be required about the input s used to develop the measurements of fair value and the effect of certain of the measurements on changes in net assets for the period.
14
Eaton Vance Diversified Income Fund as of October 31, 2008
REPORT OF INDEPENDENT REGISTERED PUBLIC ACCOUNTING FIRM
To the Trustees of Eaton Vance Mutual
Funds Trust and Shareholders of
Eaton Vance Diversified Income Fund:
We have audited the accompanying statement of assets and liabilities of Eaton Vance Diversified Income Fund (the "Fund") (one of the series of Eaton Vance Mutual Funds Trust) as of October 31, 2008, the related statement of operations for the year then ended, and the statements of changes in net assets and the financial highlights for each of the two years in the period then ended. These financial statements and financial highlights are the responsibility of the Fund's management. Our responsibility is to express an opinion on these financial statements and financial highlights based on our audits. The financial highlights for the year ended October 31, 2006 and for the period from the start of business, December 7, 2004, to October 31, 2005, were audited by other auditors. Those auditors expressed an unqualified opinion on those financial highlights in their report dated December 27, 2006.
We conducted our audits in accordance with the standards of the Public Company Accounting Oversight Board (United States). Those standards require that we plan and perform the audit to obtain reasonable assurance about whether the financial statements and financial highlights are free of material misstatement. The Fund is not required to have, nor were we engaged to perform, an audit of its internal control over financial reporting. Our audits included consideration of internal control over financial reporting as a basis for designing audit procedures that are appropriate in the circumstances, but not for the purpose of expressing an opinion on the effectiveness of the Fund's internal control over financial reporting. Accordingly, we express no such opinion. An audit also includes examining, on a test basis, evidence supporting the amounts and disclosures in the financial statements, assessing the accounting principles used and significant estimates made by management, as well as evaluating the overall financial statement presentation. We believe that our audits provide a reasonable basis for our opinion.
In our opinion, the financial statements and financial highlights referred to above present fairly, in all material respects, the financial position of Eaton Vance Diversified Income Fund as of October 31, 2008, the results of its operations for the year then ended, and the changes in its net assets and the financial highlights for each of the two years in the period then ended, in conformity with accounting principles generally accepted in the United States of America.
DELOITTE & TOUCHE LLP
Boston, Massachusetts
December 18, 2008
15
Eaton Vance Diversified Income Fund as of October 31, 2008
FEDERAL TAX INFORMATION (Unaudited)
The Form 1099-DIV you receive in January 2009 will show the tax status of all distributions paid to your account in calendar 2008. Shareholders are advised to consult their own tax adviser with respect to the tax consequences of their investment in the Fund.
Qualified Dividend Income. The Fund designates $54,784, or up to the maximum amount of such dividends allowable pursuant to the Internal Revenue Code, as qualified dividend income eligible for the reduced tax rate of 15%.
16
Eaton Vance Diversified Income Fund
SPECIAL MEETING OF SHAREHOLDERS (Unaudited)
Eaton Vance Diversified Income Fund
The Fund held a Special Meeting of Shareholders on November 14, 2008 to elect Trustees. The results of the vote were as follows:
| | | Number of Shares | |
| Nominee for Trustee | | For | | Withheld | |
| Benjamin C. Esty | | | 34,593,918 | | | | 144,962 | | |
| Thomas E. Faust Jr. | | | 34,593,996 | | | | 144,884 | | |
| Allen R. Freedman | | | 34,591,910 | | | | 146,970 | | |
| William H. Park | | | 34,594,553 | | | | 144,327 | | |
| Ronald A. Pearlman | | | 34,595,305 | | | | 143,575 | | |
| Helen Frame Peters | | | 34,587,473 | | | | 151,408 | | |
| Heidi L. Steiger | | | 34,587,543 | | | | 151,338 | | |
| Lynn A. Stout | | | 34,596,350 | | | | 142,531 | | |
| Ralph F. Verni | | | 34,593,918 | | | | 144,962 | | |
Each nominee was also elected a Trustee of the following Portfolios: Boston Income Portfolio, Floating Rate Portfolio and Government Obligations Portfolio.
17
Eaton Vance Diversified Income Fund
BOARD OF TRUSTEES' ANNUAL APPROVAL OF THE INVESTMENT ADVISORY AGREEMENTS
Overview of the Contract Review Process
The Investment Company Act of 1940, as amended (the "1940 Act"), provides, in substance, that each investment advisory agreement between a fund and its investment adviser will continue in effect from year to year only if its continuance is approved at least annually by the fund's board of trustees, including by a vote of a majority of the trustees who are not "interested persons" of the fund ("Independent Trustees"), cast in person at a meeting called for the purpose of considering such approval.
At a meeting of the Boards of Trustees (each a "Board") of the Eaton Vance group of mutual funds (the "Eaton Vance Funds") held on April 21, 2008, the Board, including a majority of the Independent Trustees, voted to approve continuation of existing advisory and sub-advisory agreements for the Eaton Vance Funds for an additional one-year period. In voting its approval, the Board relied upon the affirmative recommendation of the Contract Review Committee of the Board (formerly the Special Committee), which is a committee comprised exclusively of Independent Trustees. Prior to making its recommendation, the Contract Review Committee reviewed information furnished for a series of meetings of the Contract Review Committee held in February, March and April 2008. Such information included, among other things, the following:
Information about Fees, Performance and Expenses
• An independent report comparing the advisory and related fees paid by each fund with fees paid by comparable funds;
• An independent report comparing each fund's total expense ratio and its components to comparable funds;
• An independent report comparing the investment performance of each fund to the investment performance of comparable funds over various time periods;
• Data regarding investment performance in comparison to relevant peer groups of funds and appropriate indices;
• Comparative information concerning fees charged by each adviser for managing other mutual funds and institutional accounts using investment strategies and techniques similar to those used in managing the fund;
• Profitability analyses for each adviser with respect to each fund;
Information about Portfolio Management
• Descriptions of the investment management services provided to each fund, including the investment strategies and processes employed, and any changes in portfolio management processes and personnel;
• Information concerning the allocation of brokerage and the benefits received by each adviser as a result of brokerage allocation, including information concerning the acquisition of research through "soft dollar" benefits received in connection with the funds' brokerage, and the implementation of a soft dollar reimbursement program established with respect to the funds;
• Data relating to portfolio turnover rates of each fund;
• The procedures and processes used to determine the fair value of fund assets and actions taken to monitor and test the effectiveness of such procedures and processes;
Information about each Adviser
• Reports detailing the financial results and condition of each adviser;
• Descriptions of the qualifications, education and experience of the individual investment professionals whose responsibilities include portfolio management and investment research for the funds, and information relating to their compensation and responsibilities with respect to managing other mutual funds and investment accounts;
• Copies of the Codes of Ethics of each adviser and its affiliates, together with information relating to compliance with and the administration of such codes;
• Copies of or descriptions of each adviser's proxy voting policies and procedures;
• Information concerning the resources devoted to compliance efforts undertaken by each adviser and its affiliates on behalf of the funds (including descriptions of various compliance programs) and their record of compliance with investment policies and restrictions, including policies with respect to market-timing, late trading and selective portfolio disclosure, and with policies on personal securities transactions;
• Descriptions of the business continuity and disaster recovery plans of each adviser and its affiliates;
Other Relevant Information
• Information concerning the nature, cost and character of the administrative and other non-investment management services provided by Eaton Vance Management and its affiliates;
• Information concerning management of the relationship with the custodian, subcustodians and fund accountants by each adviser or the funds' administrator; and
• The terms of each advisory agreement.
18
Eaton Vance Diversified Income Fund
BOARD OF TRUSTEES' ANNUAL APPROVAL OF THE INVESTMENT ADVISORY AGREEMENTS CONT'D
In addition to the information identified above, the Contract Review Committee considered information provided from time to time by each adviser throughout the year at meetings of the Board and its committees. Over the course of the twelve-month period ended April 30, 2008, the Board met eleven times and the Contract Review Committee, the Audit Committee and the Governance Committee, each of which is a Committee comprised solely of Independent Trustees, met twelve, seven and five times, respectively. At such meetings, the Trustees received, among other things, presentations by the portfolio managers and other investment professionals of each adviser relating to the investment performance of each fund and the investment strategies used in pursuing the fund's investment objective. The Portfolio Management Committee and the Compliance Reports and Regulatory Matters Committee are newly established and did not meet during the twelve- month period ended April 30, 2008.
For funds that invest through one or more underlying portfolios, the Board considered similar information about the portfolio(s) when considering the approval of advisory agreements. In addition, in cases where the fund's investment adviser has engaged a sub-adviser, the Board considered similar information about the sub-adviser when considering the approval of any sub-advisory agreement.
The Contract Review Committee was assisted throughout the contract review process by Goodwin Procter LLP, legal counsel for the Independent Trustees. The members of the Contract Review Committee relied upon the advice of such counsel and their own business judgment in determining the material factors to be considered in evaluating each advisory and sub-advisory agreement and the weight to be given to each such factor. The conclusions reached with respect to each advisory and sub-advisory agreement were based on a comprehensive evaluation of all the information provided and not any single factor. Moreover, each member of the Contract Review Committee may have placed varying emphasis on particular factors in reaching conclusions with respect to each advisory and sub-advisory agreement.
Results of the Process
Based on its consideration of the foregoing, and such other information as it deemed relevant, including the factors and conclusions described below, the Contract Review Committee concluded that the continuance of the investment advisory agreement of the Eaton Vance Diversified Income Fund (the "Fund") with Eaton Vance Management ("EVM"), as well as the investment advisory agreements of the Boston Income Portfolio, the Floating Rate Portfolio and the Government Obligations Portfolio, the portfolios in which the Fund invests (the "Portfolios"), each with Boston Management and Research ("BMR"), including their fee structures, is in the interests of shareholders and, therefore, the Contract Review Committee recommended to the Board approval of each agreement. The Board accepted the recommen dation of the Contract Review Committee as well as the factors considered and conclusions reached by the Contract Review Committee with respect to each agreement. Accordingly, the Board, including a majority of the Independent Trustees, voted to approve continuation of the investment advisory agreements for the Fund and the Portfolios. EVM and BMR are each referred to as an "Adviser" herein; EVM with respect to the Fund and BMR with respect to the Portfolios. EVM and BMR are affiliates.
Nature, Extent and Quality of Services
In considering whether to approve the investment advisory agreement of the Fund and the Portfolios, the Board evaluated the nature, extent and quality of services provided to the Portfolios by BMR and to the Fund by EVM. BMR manages the Portfolios, while EVM allocates the assets of the Fund among the Portfolios.
The Board considered BMR's management capabilities and investment process with respect to the types of investments held by the Portfolios, including the education, experience and number of its investment professionals and other personnel who provide portfolio management, investment research, and similar services to the Portfolios. In particular, the Board evaluated the abilities and experience of such investment personnel in analyzing special considerations relevant to investing in senior secured floating-rate loans, high-yield debt, and other investments. With respect to the Floating Rate Portfolio, the Board noted the experience of BMR's large group of bank loan investment professionals and other personnel who provide services to the Portfolios, including portfolio managers and analysts. With respect to the Boston Income Portfolio, the Board evaluated the abilities and experience of such investment personnel in analyzing speci al considerations relevant to investing in high-yield debt. With respect to the Government Obligations Portfolio, the Board noted the Adviser's experience in investing in mortgage-backed securities, including seasoned mortgage-backed securities. For all the Portfolios, the Board also took into account the resources dedicated to portfolio management and other services, including the compensation paid to recruit and retain investment personnel, and the time and attention devoted to the Fund and each Portfolio by senior management.
The Board also reviewed the compliance programs of the Adviser and relevant affiliates thereof. Among other matters, the Board considered compliance and reporting matters relating to personal trading by investment personnel, selective disclosure of portfolio holdings, late trading, frequent trading, portfolio valuation, business continuity and the allocation of investment opportunities.
19
Eaton Vance Diversified Income Fund
BOARD OF TRUSTEES' ANNUAL APPROVAL OF THE INVESTMENT ADVISORY AGREEMENTS CONT'D
The Board also evaluated the responses of the Adviser and its affiliates to requests from regulatory authorities such as the Securities and Exchange Commission.
The Board considered shareholder and other administrative services provided or managed by EVM and its affiliates, including transfer agency and accounting services. The Board evaluated the benefits to shareholders of investing in a fund that is a part of a large family of funds, including the ability, in many cases, to exchange an investment among different funds without incurring additional sales charges.
After consideration of the foregoing factors, among others, the Board concluded that the nature, extent and quality of services provided by the Adviser, taken as a whole, are appropriate and consistent with the terms of the investment advisory agreement.
Fund Performance
The Board compared the Fund's investment performance to a relevant universe of similarly managed funds identified by an independent data provider and appropriate benchmark indices. The Board reviewed comparative performance data for the one-year period ended September 30, 2007 for the Fund. The Board also considered the performance of the underlying Portfolios. The Board concluded that the Fund's performance was satisfactory.
Management Fees and Expenses
The Board reviewed contractual investment advisory fee rates, including any administrative fee rates, payable by the Fund directly or indirectly through its pro rata share of the expenses of each Portfolio (referred to collectively as "management fees"). As part of its review, the Board considered the Fund's management fees, including administrative fees, and total expense ratio for the year ended September 30, 2007, as compared to a group of similarly managed funds selected by an independent data provider.
After reviewing the foregoing information, and in light of the nature, extent and quality of the services provided by the Adviser, the Board concluded that the management fees charged for advisory and related services and the Fund's total expense ratio are reasonable.
Profitability
The Board reviewed the level of profits realized by the Adviser and relevant affiliates thereof in providing investment advisory and administrative services to the Fund, the Portfolios and all Eaton Vance Funds as a group. The Board considered the level of profits realized without regard to revenue sharing or other payments by the Adviser and its affiliates to third parties in respect of distribution services. The Board also considered other direct or indirect benefits received by the Adviser and its affiliates in connection with its relationship with the Fund and the Portfolios.
The Board concluded that, in light of the foregoing factors and the nature, extent and quality of the services rendered, the profits realized by the Adviser and its affiliates are reasonable.
Economies of Scale
In reviewing management fees and profitability, the Board also considered the extent to which the Adviser and its affiliates, on the one hand, and the Fund, on the other hand, can expect to realize benefits from economies of scale as the assets of the Fund and the Portfolios increase. The Board acknowledged the difficulty in accurately measuring the benefits resulting from the economies of scale with respect to the management of any specific fund or group of funds. The Board reviewed data summarizing the increases and decreases in the assets of the Portfolios and of all Eaton Vance Funds as a group over various time periods, and evaluated the extent to which the total expense ratio of the Fund and the profitability of the Adviser and its affiliates may have been affected by such increases or decreases. Based upon the foregoing, the Board concluded that the benefits from economies of scale are currently being shared equitably by the Adviser and its affiliates and the Fund and the Portfolios. The Board also concluded that, assuming reasonably foreseeable increases in the assets of the Fund and the Portfolios, the structure of the Portfolio advisory fees, which include breakpoints at several asset levels, can be expected to cause the Adviser and its affiliates and the Fund and the Portfolios to continue to share such benefits equitably.
20
Eaton Vance Diversified Income Fund
MANAGEMENT AND ORGANIZATION
Fund Management. The Trustees of Eaton Vance Mutual Funds Trust (the Trust), Boston Income Portfolio (BIP), Floating Rate Portfolio (FRP) and Government Obligations Portfolio (GOP) (collectively, the Portfolios) are responsible for the overall management and supervision of the Trust's and Portfolios' affairs. The Trustees and officers of the Trust and the Portfolios are listed below. Except as indicated, each individual has held the office shown or other offices in the same company for the last five years. Trustees and officers of the Trust and the Portfolios hold indefinite terms of office. The "noninterested Trustees" consist of those Trustees who are not "interested persons" of the Trust and the Portfolios, as that term is defined under the 1940 Act. The business address of each Trustee and officer is The Eaton Vance Building, 255 State Street, Boston, Ma ssachusetts 02109. As used below, "EVC" refers to Eaton Vance Corp., "EV" refers to Eaton Vance, Inc., "EVM" refers to Eaton Vance Management, "BMR" refers to Boston Management and Research, "Parametric" refers to Parametric Portfolio Associates and "EVD" refers to Eaton Vance Distributors, Inc. EVC and EV are the corporate parent and trustee, respectively, of EVM and BMR. EVD is the Fund's principal underwriter, the Portfolios' placement agent and a wholly-owned subsidiary of EVC. Each officer affiliated with Eaton Vance may hold a position with other Eaton Vance affiliates that is comparable to his or her position with EVM listed below.
Name and
Date of Birth | | Position(s)
with the
Trust and
the Portfolio | | Term of
Office and
Length of
Service | | Principal Occupation(s)
During Past Five Years | | Number of Portfolios
in Fund Complex
Overseen By
Trustee(1) | | Other Directorships Held | |
| Interested Trustee | | | | | | | | | | | | | |
|
Thomas E. Faust Jr.
5/31/58 | | Trustee and President of
the Trust | | Trustee since 2007 and President of the Trust since 2002 | | Chairman, Chief Executive Officer and President of EVC, Director and President of EV, Chief Executive Officer and President of EVM and BMR, and Director of EVD. Trustee and/or Officer of 173 registered investment companies and 4 private companies managed by EVM or BMR. Mr. Faust is an interested person because of his positions with EVM, BMR, EVD, EVC and EV, which are affiliates of the Trust and Portfolios. | | | 173 | | | Director of EVC | |
|
| Noninterested Trustees | | | | | | | | | | | | | |
|
Benjamin C. Esty
1/2/63 | | Trustee | | Since 2005 | | Roy and Elizabeth Simmons Professor of Business Administration, Harvard University Graduate School of Business Administration. | | | 173 | | | None | |
|
Allen R. Freedman
4/3/40 | | Trustee | | Since 2007 | | Former Chairman (2002-2004) and a Director (1983-2004) of Systems & Computer Technology Corp. (provider of software to higher education). Formerly, a Director of Loring Ward International (fund distributor) (2005-2007). Formerly, Chairman and a Director of Indus International, Inc. (provider of enterprise management software to the power generating industry) (2005-2007). | | | 173 | | | Director of Assurant, Inc. and Stonemor Partners L.P. (owner and operator of cemeteries) | |
|
| William H. Park 9/19/47 | | Trustee | | Since 2003 | | Vice Chairman, Commercial Industrial Finance Corp. (specialty finance company) (since 2006). Formerly, President and Chief Executive Officer, Prizm Capital Management, LLC (investment management firm) (2002-2005). | | | 173 | | | None | |
|
| Ronald A. Pearlman 7/10/40 | | Trustee | | Since 2003 | | Professor of Law, Georgetown University Law Center. | | | 173 | | | None | |
|
| Helen Frame Peters 3/22/48 | | Trustee | | Since 2008 | | Professor of Finance, Carroll School of Management, Boston College (since 2003). Adjunct Professor of Finance, Peking University, Beijing, China (since 2005). Formerly, Dean, Carroll School of Management, Boston College (2000-2003). | | | 173 | | | Director of Federal Home Loan Bank of Boston (a bank for banks) and BJ's Wholesale Clubs (wholesale club retailer); Trustee of SPDR Index Shares Funds and SPDR Series Trust (exchange traded funds) | |
|
21
Eaton Vance Diversified Income Fund
MANAGEMENT AND ORGANIZATION CONT'D
Name and
Date of Birth | | Position(s)
with the
Trust and
the Portfolio | | Term of
Office and
Length of
Service | | Principal Occupation(s)
During Past Five Years | | Number of Portfolios
in Fund Complex
Overseen By
Trustee(1) | | Other Directorships Held | |
| Noninterested Trustees (continued) | | | | | | | | | | | | | |
|
| Heidi L. Steiger 7/8/53 | | Trustee | | Since 2007 | | Managing Partner, Topridge Associates LLC (global wealth management firm) (since 2008); Senior Advisor (since 2008), President (2005-2008), Lowenhaupt Global Advisors, LLC (global wealth management firm). Formerly, President and Contributing Editor, Worth Magazine (2004-2005). Formerly, Executive Vice President and Global Head of Private Asset Management (and various other positions), Neuberger Berman (investment firm) (1986-2004). | | | 173 | | | Director of Nuclear Electric Insurance Ltd. (nuclear insurance provider) and Aviva USA (insurance provider) | |
|
| Lynn A. Stout 9/14/57 | | Trustee | | Of the Trust and GOP since 1998; of FRP since 2000 and of BIP since 2001 | | Paul Hastings Professor of Corporate and Securities Law (since 2006) and Professor of Law (2001-2006), University of California at Los Angeles School of Law. | | | 173 | | | None | |
|
| Ralph F. Verni 1/26/43 | | Chairman of
the Board
and Trustee | | Chairman of the Board since 2007 and Trustee since 2005 | | Consultant and private investor. | | | 173 | | | None | |
|
| Principal Officers who are not Trustees | | | | | | | | | | | | | |
|
Name and
Date of Birth | | Position(s)
with the
Trust and
the Portfolios | | Term of
Office and
Length of
Service | | Principal Occupation(s)
During Past Five Years | |
| William H. Ahern, Jr. 7/28/59 | | Vice President of
the Trust | | Since 1995 | | Vice President of EVM and BMR. Officer of 75 registered investment companies managed by EVM or BMR. | |
|
John R. Baur
2/10/70 | | Vice President of
the Trust | | Since 2007 | | Vice President of EVM and BMR. Previously, attended Johnson Graduate School of Management, Cornell University (2002-2005), and prior thereto he was an Account Team Representative in Singapore for Applied Materials Inc. Officer of 33 registered investment companies managed by EVM or BMR. | |
|
| Michael A. Cirami 12/24/75 | | Vice President of
the Trust | | Since 2007 | | Vice President of EVM and BMR. Previously, attended the University of Rochester William E. Simon Graduate School of Business Administration (2001-2003), and prior thereto he was a Team Leader for the Institutional Services Group for State Street Bank in Luxemburg. Officer of 33 registered investment companies managed by EVM or BMR. | |
|
| Cynthia J. Clemson 3/2/63 | | Vice President of
the Trust | | Since 2005 | | Vice President of EVM and BMR. Officer of 90 registered investment companies managed by EVM or BMR. | |
|
| Charles B. Gaffney 12/4/72 | | Vice President of
the Trust | | Since 2007 | | Vice President of EVM and BMR. Previously, Sector Portfolio Manager and Senior Equity Analyst of Brown Brothers Harriman (1997-2003). Officer of 30 registered investment companies managed by EVM or BMR. | |
|
| Thomas P. Huggins 3/7/66 | | Vice President of BIP | | Since 2001 | | Vice President of EVM and BMR. Officer of 4 registered investment companies managed by EVM or BMR. | |
|
| Christine M. Johnston 11/9/72 | | Vice President of the Trust and of GOP | | Of the Trust since 2007 and of GOP since 2006 | | Vice President of EVM and BMR. Officer of 35 registered investment companies managed by EVM or BMR. | |
|
| Aamer Khan 6/7/60 | | Vice President of
the Trust | | Since 2005 | | Vice President of EVM and BMR. Officer of 33 registered investment companies managed by EVM or BMR. | |
|
| Thomas H. Luster 4/8/62 | | Vice President of
the Trust | | Since 2006 | | Vice President of EVM and BMR. Officer of 51 registered investment companies managed by EVM or BMR. | |
|
Robert B. MacIntosh
1/22/57 | | Vice President of
the Trust | | Since 1998 | | Vice President of EVM and BMR. Officer of 90 registered investment companies managed by EVM or BMR. | |
|
22
Eaton Vance Diversified Income Fund
MANAGEMENT AND ORGANIZATION CONT'D
Name and
Date of Birth | | Position(s)
with the
Trust and
the Portfolios | | Term of
Office and
Length of
Service | | Principal Occupation(s)
During Past Five Years | |
| Principal Officers who are not Trustees (continued) | | | | | | | |
|
Scott H. Page
11/30/59 | | President of FRP | | Since 2007 | | Vice President of EVM and BMR. Officer of 11 registered investment companies managed by EVM or BMR. | |
|
| Duncan W. Richardson 10/26/57 | | Vice President of
the Trust | | Since 2001 | | Executive Vice President and Chief Equity Investment Officer of EVC, EVM and BMR. Officer of 81 registered investment companies managed by EVM or BMR. | |
|
| Craig P. Russ 10/30/63 | | Vice President of FRP | | Since 2007 | | Vice President of EVM and BMR. Officer of 6 registered investment companies managed by EVM or BMR. | |
|
| Judith A. Saryan 8/21/54 | | Vice President of
the Trust | | Since 2003 | | Vice President of EVM and BMR. Officer of 55 registered investment companies managed by EVM or BMR. | |
|
| Susan Schiff 3/13/61 | | Vice President of the Trust and of GOP | | Of the Trust since 2002 and of GOP since 1993 | | Vice President of EVM and BMR. Officer of 36 registered investment companies managed by EVM or BMR. | |
|
| Thomas Seto 9/27/62 | | Vice President of
the Trust | | Since 2007 | | Vice President and Director of Portfolio Management of Parametric. Officer of 31 registered investment companies managed by EVM or BMR. | |
|
| David M. Stein 5/4/51 | | Vice President of
the Trust | | Since 2007 | | Managing Director and Chief Investment Officer of Parametric. Officer of 31 registered investment companies managed by EVM or BMR. | |
|
| Mark S. Venezia 5/23/49 | | Vice President of the Trust and President of the GOP | | Vice President of the Trust since 2007 and President of GOP since 2002 | | Vice President of EVM and BMR. Officer of 36 registered investment companies managed by EVM or BMR. | |
|
| Adam A. Weigold 3/22/75 | | Vice President of
the Trust | | Since 2007 | | Vice President of EVM and BMR. Officer of 71 registered investment companies managed by EVM or BMR. | |
|
| Michael W. Weilheimer 2/11/61 | | President of BIP | | Since 2002 | | Vice President of EVM and BMR. Officer of 26 registered investment companies managed by EVM or BMR. | |
|
| Barbara E. Campbell 6/19/57 | | Treasurer | | Of the Trust since 2005 and of the Portfolios since 2008(2) | | Vice President of EVM and BMR. Officer of 173 registered investment companies managed by EVM or BMR. | |
|
| Maureen A. Gemma 5/24/60 | | Secretary and Chief Legal Officer | | Secretary since 2007 and Chief Legal Officer since 2008 | | Vice President of EVM and BMR. Officer of 173 registered investment companies managed by EVM or BMR. | |
|
| Paul M. O'Neil 7/11/53 | | Chief
Compliance Officer | | Since 2004 | | Vice President of EVM and BMR. Officer of 173 registered investment companies managed by EVM or BMR. | |
|
(1) Includes both master and feeder funds in a master-feeder structure.
(2) Prior to 2008, Ms. Campbell served as Assistant Treasurer of GOP since 1998, of FRP since 2000 and of BIP since 2001.
The SAI for the Fund includes additional information about the Trustees and officers of the Fund and the Portfolios and can be obtained without charge on Eaton Vance's website at www.eatonvance.com or by calling 1-800-262-1122.
23
This Page Intentionally Left Blank
Investment Adviser and Administrator of Eaton Vance Diversified Income Fund
Eaton Vance Management
The Eaton Vance Building
255 State Street
Boston, MA 02109
Principal Underwriter
Eaton Vance Distributors, Inc.
The Eaton Vance Building
255 State Street
Boston, MA 02109
(617) 482-8260
Custodian
State Street Bank and Trust Company
200 Clarendon Street
Boston, MA 02116
Transfer Agent
PNC Global Investment Servicing
Attn: Eaton Vance Funds
P.O. Box 9653
Providence, RI 02940-9653
(800) 262-1122
Independent Registered Public Accounting Firm
Deloitte & Touche LLP
200 Berkeley Street
Boston, MA 02116-5022
Eaton Vance Diversified Income Fund
The Eaton Vance Building
255 State Street
Boston, MA 02109
This report must be preceded or accompanied by a current prospectus. Before investing, investors should consider carefully the Fund's investment objective(s), risks, and charges and expenses. The Fund's current prospectus contains this and other information about the Fund and is available through your financial advisor. Please read the prospectus carefully before you invest or send money. For further information please call 1-800-262-1122.
2320-12/08 DISRC

Annual Report October 31, 2008


EATON VANCE
DIVIDEND
INCOME
FUND
IMPORTANT NOTICES REGARDING PRIVACY,
DELIVERY OF SHAREHOLDER DOCUMENTS,
PORTFOLIO HOLDINGS AND PROXY VOTING
Privacy. The Eaton Vance organization is committed to ensuring your financial privacy. Each of the financial institutions identified below has in effect the following policy ("Privacy Policy") with respect to nonpublic personal information about its customers:
• Only such information received from you, through application forms or otherwise, and information about your Eaton Vance fund transactions will be collected. This may include information such as name, address, social security number, tax status, account balances and transactions.
• None of such information about you (or former customers) will be disclosed to anyone, except as permitted by law (which includes disclosure to employees necessary to service your account). In the normal course of servicing a customer's account, Eaton Vance may share information with unaffiliated third parties that perform various required services such as transfer agents, custodians and broker/dealers.
• Policies and procedures (including physical, electronic and procedural safeguards) are in place that are designed to protect the confidentiality of such information.
• We reserve the right to change our Privacy Policy at any time upon proper notification to you. Customers may want to review our Policy periodically for changes by accessing the link on our homepage: www.eatonvance.com.
Our pledge of privacy applies to the following entities within the Eaton Vance organization: the Eaton Vance Family of Funds, Eaton Vance Management, Eaton Vance Investment Counsel, Boston Management and Research, and Eaton Vance Distributors, Inc.
In addition, our Privacy Policy only applies to those Eaton Vance customers who are individuals and who have a direct relationship with us. If a customer's account (i.e., fund shares) is held in the name of a third-party financial adviser/ broker-dealer, it is likely that only such adviser's privacy policies apply to the customer. This notice supersedes all previously issued privacy disclosures.
For more information about Eaton Vance's Privacy Policy, please call 1-800-262-1122.
Delivery of Shareholder Documents. The Securities and Exchange Commission (the "SEC") permits funds to deliver only one copy of shareholder documents, including prospectuses, proxy statements and shareholder reports, to fund investors with multiple accounts at the same residential or post office box address. This practice is often called "householding" and it helps eliminate duplicate mailings to shareholders.
Eaton Vance, or your financial adviser, may household the mailing of your documents indefinitely unless you instruct Eaton Vance, or your financial adviser, otherwise.
If you would prefer that your Eaton Vance documents not be householded, please contact Eaton Vance at 1-800-262-1122, or contact your financial adviser.
Your instructions that householding not apply to delivery of your Eaton Vance documents will be effective within 30 days of receipt by Eaton Vance or your financial adviser.
Portfolio Holdings. Each Eaton Vance Fund and its underlying Portfolio (if applicable) will file a schedule of its portfolio holdings on Form N-Q with the SEC for the first and third quarters of each fiscal year. The Form N-Q will be available on the Eaton Vance website www.eatonvance.com, by calling Eaton Vance at 1-800-262-1122 or in the EDGAR database on the SEC's website at www.sec.gov. Form N-Q may also be reviewed and copied at the SEC's public reference room in Washington, D.C. (call 1-800-732-0330 for information on the operation of the public reference room).
Proxy Voting. From time to time, funds are required to vote proxies related to the securities held by the funds. The Eaton Vance Funds or their underlying Portfolios (if applicable) vote proxies according to a set of policies and procedures approved by the Funds' and Portfolios' Boards. You may obtain a description of these policies and procedures and information on how the Funds or Portfolios voted proxies relating to portfolio securities during the most recent 12 month period ended June 30, without charge, upon request, by calling 1-800-262-1122. This description is also available on the SEC's website at www.sec.gov.
Eaton Vance Dividend Income Fund as of October 31, 2008
MANAGEMENT’S DISCUSSION OF FUND PERFORMANCE

Aamer Khan, CFA
Co-Portfolio Manager

Judith A. Saryan, CFA
Co-Portfolio Manager
Economic and Market Conditions
· The stock market moved dramatically lower during the year that ended October 31, 2008. After reaching record highs in October 2007, the major market indices began to decline at the end of 2007, as investors realized that the difficulties in subprime lending and the troubled housing market were likely to slow the economy significantly. By the summer of 2008, the magnitude of the damage became increasingly apparent. Many banks were faced with enormous write- offs from bad real estate loans, losses that severely impaired their overall lending capacity. As the market declined further, investor and consumer sentiment worsened. That trend was accelerated by soaring energy prices as oil hit $145 per barrel in July and pinched consumers even more.
· The failure of Lehman Brothers in September and the tenuous condition of other capital-starved banks and financial institutions sparked fears of a global financial collapse. In late September, in an effort to jump- start lending, the U.S. Treasury department unveiled a controversial proposal to purchase troubled loans from banks and financial institutions. Congress’ initial rejection of the plan sent the market into a near-freefall. A revised version of the measure was subsequently approved by Congress and was followed by coordinated activity by the world’s central banks to inject liquidity into the global banking system. While those actions reassured many investors, volatility remained high as the one-year period drew to a close.
· For the year ended October 31, 2008, all ten sectors within the Russell 1000 Value Index(1) (the Index) registered negative returns. The consumer staples sector was the best performing sector, posting the smallest sector loss in the Index. All of the other sectors had declines exceeding 20%, with the most severe occurring in the information technology, financials and materials sectors. Market-leading industries during the year included biotechnology, tobacco and road & rail, which were among a handful of industries to post positive returns. In contrast, thrifts and mortgage finance, automobiles, internet & catalog retail and communications equipment were among the worst performing industries.
Management Discussion
· In a year in which all market sectors experienced losses, the Fund(2) posted negative returns during the year ended October 31, 2008. Nevertheless, the Fund outperformed the Index for the year ended October 31, 2008.(1) Stock selection was the primary driver of the Fund’s outperformance of the Index. The largest contribution to the Fund’s relative returns came
Eaton Vance Dividend income Fund
Total Return performance 10/31/07 – 10/31/08
Fund - Class A(3) | | -34.35 | % |
Fund - Class C(3) | | -34.86 | |
Fund - Class I(3) | | -34.28 | |
Fund - Class R(3) | | -34.63 | |
Russell 1000 Value Index(1) | | -36.80 | |
Lipper Equity Income Funds Average(1) | | -33.80 | |
Please refer to page 3 for additional performance information.
(1) | It is not possible to invest directly in an Index or a Lipper Classification. The Index’s total return does not reflect commissions or expenses that would have been incurred if an investor individually purchased or sold the securities represented in the Index. The Lipper total return is the average total return, at net asset value, of the funds that are in the same Lipper Classification as the Fund. |
(2) | The Fund currently invests in a separate registered investment company, Dividend Income Portfolio, with the same objective and policies as the Fund. References to investments are to the Portfolio’s holdings. |
(3) | These returns do not include the 5.7 5% maximum sales charge for Class A shares or the applicable contingent deferred sales charge (CDSC) for Class C shares. If sales charges were deducted, the returns would be lower. Class I and Class R shares are offered to certain investors at net asset value. |
Past performance is no guarantee of future results. Returns are historical and are calculated by determining the percentage change in net asset value or offering price (as applicable) with all distributions reinvested. Investment return and principal value will fluctuate so that shares, when redeemed, may be worth more or less than their original cost. Performance is for stated time period only; due to market volatility, the Fund’s current performance may be lower or higher than the quoted return. For performance as of the most recent month end, please refer to www.eatonvance.com.
Fund shares are not insured by the FDIC and are not deposits or other obligations of, or guaranteed by, any depository institution. Shares are subject to investment risks, including possible loss of principal invested.
The views expressed throughout this report are those of the portfolio managers and are current only through the end of the period of the report as stated on the cover. These views are subject to change at any time based upon market or other conditions, and the investment adviser disclaims any responsibility to update such views. These views may not be relied on as investment advice and, because investment decisions for a fund are based on many factors, may not be relied on as an indication of trading intent on behalf of any Eaton Vance fund. Portfolio information provided in the report may not be representative of the Portfolio’s current or future investments and may change due to active management.
1
from the financials sector, both because the Fund was underweight in this sector, relative to the Index, and also because management’s selections outperformed those in the Index. The second largest contribution came from the information technology sector, where the Fund’s holdings in the communications equipment and computer industries outperformed. The Fund’s investments in the consumer discretionary sector contributed positively due to selection and an underweighted position in this sector relative to the Index. Finally, Fund holdings in the industrials sector contributed positively to relative returns.
· Limiting returns relative to the Index were holdings in the materials sector, where selections in the metals and mining industry underperformed similar stocks in the Index. Energy stocks also underperformed, with oil and gas holdings lagging those in the Index. In the utilities sector, electric utilities underperformed. Fund holdings in the telecommunication services sector also detracted from relative returns.
Portfolio Composition
Top Ten Holdings(1)
By net assets
France Telecom SA | | 3.1 | % |
Wal-Mart Stores, Inc. | | 2.9 | |
McDonald’s Corp. | | 2.7 | |
Nestle SA | | 2.7 | |
Exxon Mobil Corp. | | 2.6 | |
PNC Financial Services Group, Inc. | | 2.6 | |
Johnson & Johnson | | 2.5 | |
Travelers Companies, Inc. (The) | | 2.4 | |
Philip Morris International, Inc. | | 2.4 | |
Merck & Co., Inc. | | 2.4 | |
(1)Top Ten Holdings represented 2 6.4% of the Portfolio’s net assets as of 10/31/08. Excludes cash equivalents.
Sector Weightings(2)
By net assets

(2) As a percentage of the Portfolio’s net assets as of 10/31/08. Excludes cash equivalents.
2
Eaton Vance Dividend Income Fund as of October 31, 2008
FUND PERFORMANCE
The line graph and table set forth below provide information about the Fund’s performance. The line graph compares the performance of Class A of the Fund with that of the Russell 1000 Value Index, a broad-based, unmanaged index of value stocks. The lines on the graph represent the total returns of a hypothetical investment of $10,000 in each of Class A and the Russell 1000 Value Index. Class A total returns are presented at net asset value and maximum public offering price. The table includes the total returns of each Class of the Fund at net asset value and maximum public offering price. The performance presented below does not reflect the deduction of taxes, if any, that a shareholder would pay on distributions or redemptions of Fund shares.
Performance(1) | | Class A | | Class C | | Class I | | Class R | |
Share Class Symbol | | EDIAX | | EDICX | | EDIIX | | EDIRX | |
| | | | | | | | | |
Average Annual Total Returns (at net asset value) | | | | | | | | | |
One Year | | -34.35 | % | -34.86 | % | -34.28 | % | -34.63 | % |
Life of Fund† | | -2.63 | | -3.41 | | -4.67 | | -5.09 | |
| | | | | | | | | |
SEC Average Annual Total Returns (including sales charge or applicable CDSC) | | | | | | | | | |
One Year | | -38.12 | % | -35.47 | % | -34.28 | % | -34.63 | % |
Life of Fund† | | -4.58 | | -3.41 | | -4.67 | | -5.09 | |
†Inception Dates — Class A: 11/30/05; Class C: 11/30/05; Class I: 1/31/06; Class R: 1/31/06
(1) | Average Annual Total Returns do not include the 5.75% maximum sales charge for Class A or the applicable contingent deferred sales charge (CDSC) for Class C shares. If sales charges were deducted, returns would be lower. SEC Average Annual Total Returns for Class A reflect the maximum 5.75% sales charge. SEC returns for Class C reflect a 1% CDSC for the first year. Class I and Class R shares are offered to certain investors at net asset value. |
Total Annual | | | | | | | | | |
Operating Expenses(2) | | Class A | | Class C | | Class I | | Class R | |
Expense Ratio | | 1.36 | % | 2.11 | % | 1.11 | % | 1.61 | % |
(2) Source: Prospectus dated 3/1/08.
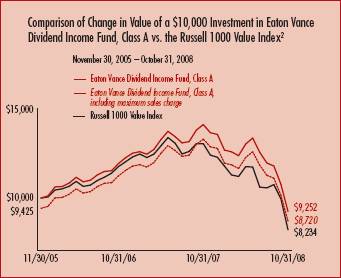
(2) Source: Thomson Financial. Class A of the Fund commenced investment operations on 11/30/05.
A $10,000 hypothetical investment at net asset value in Class C shares on 11/30/05 (inception date), Class I shares on 1/31/06 (inception date) and Class R shares on 1/31/06 (inception date) would have been valued at $9,037, $8,767 and $8,662, respectively, on 10/31/08. It is not possible to invest directly in an Index. The Index’s total returns do not reflect commissions or expenses that would have been incurred if an investor individually purchased or sold the securities represented in the Index.
Past performance is no guarantee of future results. Returns are historical and are calculated by determining the percentage change in net asset value or offering price (as applicable) with all distributions reinvested. Investment return and principal value will fluctuate so that shares, when redeemed, may be worth more or less than their original cost. Performance is for the stated time period only; due to market volatility, the Fund’s current performance may be lower or higher than the quoted return. For performance as of the most recent month end, please refer to www.eatonvance.com.
3
Eaton Vance Dividend Income Fund as of October 31, 2008
FUND EXPENSES
Example: As a shareholder of the Fund, you incur two types of costs: (1) transaction costs, including sales charges (loads) on purchases and redemption fees (if applicable); and (2) ongoing costs, including management fees; distribution or service fees; and other Fund expenses. This Example is intended to help you understand your ongoing costs (in dollars) of investing in the Fund and to compare these costs with the ongoing costs of investing in other mutual funds. The Example is based on an investment of $1,000 invested at the beginning of the period and held for the entire period (May 1, 2008 – October 31, 2008).
Actual Expenses: The first section of the table below provides information about actual account values and actual expenses. You may use the information in this section, together with the amount you invested, to estimate the expenses that you paid over the period. Simply divide your account value by $1,000 (for example, an $8,600 account value divided by $1,000 = 8.6), then multiply the result by the number in the first section under the heading entitled "Expenses Paid During Period" to estimate the expenses you paid on your account during this period.
Hypothetical Example for Comparison Purposes: The second section of the table below provides information about hypothetical account values and hypothetical expenses based on the actual Fund expense ratio and an assumed rate of return of 5% per year (before expenses), which is not the actual return of the Fund. The hypothetical account values and expenses may not be used to estimate the actual ending account balance or expenses you paid for the period. You may use this information to compare the ongoing costs of investing in your Fund and other funds. To do so, compare this 5% hypothetical example with the 5% hypothetical examples that appear in the shareholder reports of the other funds.
Please note that the expenses shown in the table are meant to highlight your ongoing costs only and do not reflect any transactional costs, such as sales charges (loads) or redemption fees (if applicable). Therefore, the second section of the table is useful in comparing ongoing costs only, and will not help you determine the relative total costs of owning different funds. In addition, if these transactional costs were included, your costs would have been higher.
Eaton Vance Dividend Income Fund
| | | Beginning Account Value
(5/1/08) | | Ending Account Value
(10/31/08) | | Expenses Paid During Period*
(5/1/08 – 10/31/08) | |
| Actual | |
| Class A | | $ | 1,000.00 | | | $ | 711.30 | | | $ | 5.64 | | |
| Class C | | $ | 1,000.00 | | | $ | 708.10 | | | $ | 8.84 | | |
| Class I | | $ | 1,000.00 | | | $ | 711.20 | | | $ | 4.52 | | |
| Class R | | $ | 1,000.00 | | | $ | 709.10 | | | $ | 6.70 | | |
| Hypothetical | |
| (5% return per year before expenses) | |
| Class A | | $ | 1,000.00 | | | $ | 1,018.60 | | | $ | 6.65 | | |
| Class C | | $ | 1,000.00 | | | $ | 1,014.80 | | | $ | 10.43 | | |
| Class I | | $ | 1,000.00 | | | $ | 1,019.90 | | | $ | 5.33 | | |
| Class R | | $ | 1,000.00 | | | $ | 1,017.30 | | | $ | 7.91 | | |
* Expenses are equal to the Fund's annualized expense ratio of 1.31% for Class A shares, 2.06% for Class C shares, 1.05% for Class I shares, and 1.56% for Class R shares, multiplied by the average account value over the period, multiplied by 184/366 (to reflect the one-half year period). The Example assumes that the $1,000 was invested at the net asset value per share determined at the close of business on April 30, 2008. The Example reflects the expenses of both the Fund and the Portfolio.
4
Eaton Vance Dividend Income Fund as of October 31, 2008
FINANCIAL STATEMENTS
Statement of Assets and Liabilities
As of October 31, 2008
| Assets | |
Investment in Dividend Income Portfolio, at value
(identified cost, $304,483,009) | | $ | 270,549,603 | | |
| Receivable for Fund shares sold | | | 3,056,876 | | |
| Total assets | | $ | 273,606,479 | | |
| Liabilities | |
| Payable for Fund shares redeemed | | $ | 774,324 | | |
| Payable to affiliate for distribution and service fees | | | 120,152 | | |
| Payable to affiliate for administration fees | | | 32,823 | | |
| Payable to affiliate for Trustees' fees | | | 71 | | |
| Accrued expenses | | | 96,458 | | |
| Total liabilities | | $ | 1,023,828 | | |
| Net Assets | | $ | 272,582,651 | | |
| Sources of Net Assets | |
| Paid-in capital | | $ | 404,985,001 | | |
Accumulated net realized loss from Portfolio (computed on
the basis of identified cost) | | | (103,112,710 | ) | |
| Accumulated undistributed net investment income | | | 4,643,766 | | |
Net unrealized depreciation from Portfolio (computed on the basis of
identified cost) | | | (33,933,406 | ) | |
| Total | | $ | 272,582,651 | | |
| Class A Shares | |
| Net Assets | | $ | 161,743,541 | | |
| Shares Outstanding | | | 20,963,762 | | |
Net Asset Value and Redemption Price Per Share
(net assets ÷ shares of beneficial interest outstanding) | | $ | 7.72 | | |
Maximum Offering Price Per Share
(100 ÷ 94.25 of $7.72) | | $ | 8.19 | | |
| Class C Shares | |
| Net Assets | | $ | 108,613,349 | | |
| Shares Outstanding | | | 14,150,632 | | |
Net Asset Value and Offering Price Per Share*
(net assets ÷ shares of beneficial interest outstanding) | | $ | 7.68 | | |
| Class I Shares | |
| Net Assets | | $ | 2,155,103 | | |
| Shares Outstanding | | | 279,363 | | |
Net Asset Value, Offering Price and Redemption Price Per Share
(net assets ÷ shares of beneficial interest outstanding) | | $ | 7.71 | | |
| Class R Shares | |
| Net Assets | | $ | 70,658 | | |
| Shares Outstanding | | | 9,149 | | |
Net Asset Value, Offering Price and Redemption Price Per Share
(net assets ÷ shares of beneficial interest outstanding) | | $ | 7.72 | | |
| On sales of $50,000 or more, the offering price of Class A shares is reduced. | |
* Redemption price per share is equal to the net asset value less any applicable contingent deferred sales charge.
Statement of Operations
For the Year Ended
October 31, 2008
| Investment Income | |
| Dividends allocated from Portfolio (net of foreign taxes, $2,508,728) | | $ | 30,879,038 | | |
| Interest allocated from Portfolio | | | 180,660 | | |
| Expenses allocated from Portfolio | | | (2,309,435 | ) | |
| Net investment income from Portfolio | | $ | 28,750,263 | | |
| Expenses | |
| Administration fee | | $ | 465,330 | | |
| Trustees' fees and expenses | | | 1,764 | | |
Distribution and service fees
Class A | | | 450,962 | | |
| Class C | | | 1,269,784 | | |
| Class R | | | 390 | | |
| Transfer and dividend disbursing agent fees | | | 300,823 | | |
| Registration fees | | | 60,930 | | |
| Printing and postage | | | 59,205 | | |
| Custodian fee | | | 39,649 | | |
| Legal and accounting services | | | 24,888 | | |
| Miscellaneous | | | 13,059 | | |
| Total expenses | | $ | 2,686,784 | | |
| Net investment income | | $ | 26,063,479 | | |
Realized and Unrealized
Gain (Loss) from Portfolio | |
Net realized gain (loss) —
Investment transactions (identified cost basis) | | $ | (93,334,194 | ) | |
| Foreign currency transactions | | | (306,066 | ) | |
| Net realized loss | | $ | (93,640,260 | ) | |
Change in unrealized appreciation (depreciation) —
Investments (identified cost basis) | | $ | (60,820,458 | ) | |
| Foreign currency | | | (174,557 | ) | |
| Net change in unrealized appreciation (depreciation) | | $ | (60,995,015 | ) | |
| Net realized and unrealized loss | | $ | (154,635,275 | ) | |
| Net decrease in net assets from operations | | $ | (128,571,796 | ) | |
See notes to financial statements
5
Eaton Vance Dividend Income Fund as of October 31, 2008
FINANCIAL STATEMENTS CONT'D
Statements of Changes in Net Assets
Increase (Decrease)
in Net Assets | | Year Ended
October 31, 2008 | | Year Ended
October 31, 2007 | |
From operations —
Net investment income | | $ | 26,063,479 | | | $ | 9,215,172 | | |
Net realized loss from investment
and foreign currency transactions | | | (93,640,260 | ) | | | (8,713,916 | ) | |
Net change in unrealized appreciation
(depreciation) from investments
and foreign currency | | | (60,995,015 | ) | | | 24,478,904 | | |
Net increase (decrease) in net assets
from operations | | $ | (128,571,796 | ) | | $ | 24,980,160 | | |
Distributions to shareholders —
From net investment income
Class A | | $ | (12,900,418 | ) | | $ | (5,859,850 | ) | |
| Class C | | | (8,161,326 | ) | | | (3,828,527 | ) | |
| Class I | | | (206,228 | ) | | | (111,236 | ) | |
| Class R | | | (5,417 | ) | | | (4,211 | ) | |
| Total distributions to shareholders | | $ | (21,273,389 | ) | | $ | (9,803,824 | ) | |
Transactions in shares of beneficial interest —
Proceeds from sale of shares | |
| Class A | | $ | 131,458,191 | | | $ | 140,876,450 | | |
| Class C | | | 72,364,440 | | | | 93,500,708 | | |
| Class I | | | 3,192,722 | | | | 2,069,784 | | |
| Class R | | | 62,242 | | | | 59,316 | | |
Net asset value of shares issued to
shareholders in payment of
distributions declared
Class A | | | 8,901,288 | | | | 4,069,253 | | |
| Class C | | | 4,545,425 | | | | 2,022,070 | | |
| Class I | | | 158,831 | | | | 84,895 | | |
| Class R | | | 3,862 | | | | 3,331 | | |
Cost of shares redeemed
Class A | | | (57,747,660 | ) | | | (16,583,175 | ) | |
| Class C | | | (26,066,612 | ) | | | (6,119,474 | ) | |
| Class I | | | (2,258,800 | ) | | | (1,111,732 | ) | |
| Class R | | | (34,227 | ) | | | (16,445 | ) | |
Net increase in net assets from
Fund share transactions | | $ | 134,579,702 | | | $ | 218,854,981 | | |
| Net increase (decrease) in net assets | | $ | (15,265,483 | ) | | $ | 234,031,317 | | |
| Net Assets | | Year Ended
October 31, 2008 | | Year Ended
October 31, 2007 | |
| At beginning of year | | $ | 287,848,134 | | | $ | 53,816,817 | | |
| At end of year | | $ | 272,582,651 | | | $ | 287,848,134 | | |
Accumulated undistributed
net investment income
included in net assets | |
| At end of year | | $ | 4,643,766 | | | $ | 428,617 | | |
See notes to financial statements
6
Eaton Vance Dividend Income Fund as of October 31, 2008
FINANCIAL STATEMENTS CONT'D
Financial Highlights
| | | Class A | |
| | | Year Ended October 31, | | Period Ended | |
| | | 2008 | | 2007 | | October 31, 2006(1) | |
| Net asset value — Beginning of period | | $ | 12.640 | | | $ | 11.410 | | | $ | 10.000 | | |
| Income (loss) from operations | |
| Net investment income(2) | | $ | 0.923 | | | $ | 0.729 | | | $ | 1.401 | | |
| Net realized and unrealized gain (loss) | | | (5.087 | ) | | | 1.282 | | | | 0.487 | | |
| Total income (loss) from operations | | $ | (4.164 | ) | | $ | 2.011 | | | $ | 1.888 | | |
| Less distributions | |
| From net investment income | | $ | (0.756 | ) | | $ | (0.781 | ) | | $ | (0.478 | ) | |
| Total distributions | | $ | (0.756 | ) | | $ | (0.781 | ) | | $ | (0.478 | ) | |
| Net asset value — End of period | | $ | 7.720 | | | $ | 12.640 | | | $ | 11.410 | | |
| Total Return(3) | | | (34.35 | )% | | | 18.18 | % | | | 19.26 | %(9) | |
| Ratios/Supplemental Data | |
| Net assets, end of period (000's omitted) | | $ | 161,744 | | | $ | 166,609 | | | $ | 29,586 | | |
| Ratios (As a percentage of average daily net assets): | |
| Expenses before custodian fee reduction(4) | | | 1.31 | % | | | 1.36 | % | | | 1.41 | %(5)(6) | |
| Expenses after custodian fee reduction(4) | | | 1.31 | % | | | 1.36 | % | | | 1.40 | %(5)(6) | |
| Net investment income(4) | | | 8.72 | % | | | 6.00 | % | | | 14.04 | %(5)(6) | |
| Portfolio Turnover of the Fund | | | — | | | | — | | | | 35 | %(7) | |
| Portfolio Turnover of the Portfolio | | | 256 | % | | | 87 | % | | | 170 | %(8) | |
(1) For the period from the start of business, November 30, 2005, to October 31, 2006.
(2) Computed using average shares outstanding.
(3) Returns are historical and are calculated by determining the percentage change in net asset value with all distributions reinvested.
(4) Includes the Fund's share of the Portfolio's allocated expenses.
(5) Annualized.
(6) The administrator subsidized certain operating expenses (equal to 1.21% of average daily net assets for the period from the start of business, November 30, 2005, to October 31, 2006).
(7) Represents the rate of portfolio activity for the period during which the Fund was making investments directly in securities.
(8) For the period from the Portfolio's start of business, March 24, 2006, to October 31, 2006.
(9) Not annualized.
See notes to financial statements
7
Eaton Vance Dividend Income Fund as of October 31, 2008
FINANCIAL STATEMENTS CONT'D
Financial Highlights
| | | Class C | |
| | | Year Ended October 31, | | Period Ended | |
| | | 2008 | | 2007 | | October 31, 2006(1) | |
| Net asset value — Beginning of period | | $ | 12.580 | | | $ | 11.360 | | | $ | 10.000 | | |
| Income (loss) from operations | |
| Net investment income(2) | | $ | 0.837 | | | $ | 0.644 | | | $ | 1.322 | | |
| Net realized and unrealized gain (loss) | | | (5.061 | ) | | | 1.270 | | | | 0.470 | | |
| Total income (loss) from operations | | $ | (4.224 | ) | | $ | 1.914 | | | $ | 1.792 | | |
| Less distributions | |
| From net investment income | | $ | (0.676 | ) | | $ | (0.694 | ) | | $ | (0.432 | ) | |
| Total distributions | | $ | (0.676 | ) | | $ | (0.694 | ) | | $ | (0.432 | ) | |
| Net asset value — End of period | | $ | 7.680 | | | $ | 12.580 | | | $ | 11.360 | | |
| Total Return(3) | | | (34.86 | )% | | | 17.31 | % | | | 18.25 | %(9) | |
| Ratios/Supplemental Data | |
| Net assets, end of period (000's omitted) | | $ | 108,613 | | | $ | 118,841 | | | $ | 23,105 | | |
| Ratios (As a percentage of average daily net assets): | |
| Expenses before custodian fee reduction(4) | | | 2.06 | % | | | 2.11 | % | | | 2.16 | %(5)(6) | |
| Expenses after custodian fee reduction(4) | | | 2.06 | % | | | 2.11 | % | | | 2.15 | %(5)(6) | |
| Net investment income(4) | | | 7.94 | % | | | 5.33 | % | | | 13.27 | %(5)(6) | |
| Portfolio Turnover of the Fund | | | — | | | | — | | | | 35 | %(7) | |
| Portfolio Turnover of the Portfolio | | | 256 | % | | | 87 | % | | | 170 | %(8) | |
(1) For the period from the start of business, November 30, 2005, to October 31, 2006.
(2) Computed using average shares outstanding.
(3) Returns are historical and are calculated by determining the percentage change in net asset value with all distributions reinvested.
(4) Includes the Fund's share of the Portfolio's allocated expenses.
(5) Annualized.
(6) The administrator subsidized certain operating expenses (equal to 1.21% of average daily net assets for the period from the start of business, November 30, 2005, to October 31, 2006).
(7) Represents the rate of portfolio activity for the period during which the Fund was making investments directly in securities.
(8) For the period from the Portfolio's start of business, March 24, 2006, to October 31, 2006.
(9) Not annualized.
See notes to financial statements
8
Eaton Vance Dividend Income Fund as of October 31, 2008
FINANCIAL STATEMENTS CONT'D
Financial Highlights
| | | Class I | |
| | | Year Ended October 31, | | Period Ended | |
| | | 2008 | | 2007 | | October 31, 2006(1) | |
| Net asset value — Beginning of period | | $ | 12.640 | | | $ | 11.410 | | | $ | 10.610 | | |
| Income (loss) from operations | |
| Net investment income(2) | | $ | 0.977 | | | $ | 0.831 | | | $ | 1.912 | | |
| Net realized and unrealized gain (loss) | | | (5.125 | ) | | | 1.209 | | | | (0.614 | )(3) | |
| Total income (loss) from operations | | $ | (4.148 | ) | | $ | 2.040 | | | $ | 1.298 | | |
| Less distributions | |
| From net investment income | | $ | (0.782 | ) | | $ | (0.810 | ) | | $ | (0.498 | ) | |
| Total distributions | | $ | (0.782 | ) | | $ | (0.810 | ) | | $ | (0.498 | ) | |
| Net asset value — End of period | | $ | 7.710 | | | $ | 12.640 | | | $ | 11.410 | | |
| Total Return(4) | | | (34.28 | )% | | | 18.45 | % | | | 12.62 | %(10) | |
| Ratios/Supplemental Data | |
| Net assets, end of period (000's omitted) | | $ | 2,155 | | | $ | 2,317 | | | $ | 1,098 | | |
| Ratios (As a percentage of average daily net assets): | |
| Expenses before custodian fee reduction(5) | | | 1.06 | % | | | 1.11 | % | | | 1.16 | %(6)(7) | |
| Expenses after custodian fee reduction(5) | | | 1.06 | % | | | 1.11 | % | | | 1.15 | %(6)(7) | |
| Net investment income(5) | | | 9.20 | % | | | 6.87 | % | | | 25.28 | %(6)(7) | |
| Portfolio Turnover of the Fund | | | — | | | | — | | | | 35 | %(8) | |
| Portfolio Turnover of the Portfolio | | | 256 | % | | | 87 | % | | | 170 | %(9) | |
(1) For the period from the initial issuance of Class I shares, January 31, 2006, to October 31, 2006.
(2) Computed using average shares outstanding.
(3) The per share amount is not in accord with the net realized and unrealized gain (loss) for the period because of the timing of sales of the Fund shares and the amount of the per share realized and unrealized gains and losses at such time.
(4) Returns are historical and are calculated by determining the percentage change in net asset value with all distributions reinvested.
(5) Includes the Fund's share of the Portfolio's allocated expenses.
(6) Annualized.
(7) The administrator subsidized certain operating expenses (equal to 1.21% of average daily net assets for the period from the initial issuance of shares, January 31, 2006, to October 31, 2006).
(8) Represents the rate of portfolio activity for the period during which the Fund was making investments directly in securities.
(9) For the period from the Portfolio's start of business, March 24, 2006, to October 31, 2006.
(10) Not annualized.
See notes to financial statements
9
Eaton Vance Dividend Income Fund as of October 31, 2008
FINANCIAL STATEMENTS CONT'D
Financial Highlights
| | | Class R | |
| | | Year Ended October 31, | | Period Ended | |
| | | 2008 | | 2007 | | October 31, 2006(1) | |
| Net asset value — Beginning of period | | $ | 12.660 | | | $ | 11.400 | | | $ | 10.610 | | |
| Income (loss) from operations | |
| Net investment income(2) | | $ | 0.847 | | | $ | 0.788 | | | $ | 1.162 | | |
| Net realized and unrealized gain (loss) | | | (5.057 | ) | | | 1.222 | | | | 0.090 | | |
| Total income (loss) from operations | | $ | (4.210 | ) | | $ | 2.010 | | | $ | 1.252 | | |
| Less distributions | |
| From net investment income | | $ | (0.730 | ) | | $ | (0.750 | ) | | $ | (0.462 | ) | |
| Total distributions | | $ | (0.730 | ) | | $ | (0.750 | ) | | $ | (0.462 | ) | |
| Net asset value — End of period | | $ | 7.720 | | | $ | 12.660 | | | $ | 11.400 | | |
| Total Return(3) | | | (34.63 | )% | | | 18.15 | % | | | 12.15 | %(9) | |
| Ratios/Supplemental Data | |
| Net assets, end of period (000's omitted) | | $ | 71 | | | $ | 81 | | | $ | 28 | | |
| Ratios (As a percentage of average daily net assets): | |
| Expenses before custodian fee reduction(4) | | | 1.56 | % | | | 1.61 | % | | | 1.66 | %(5)(6) | |
| Expenses after custodian fee reduction(4) | | | 1.56 | % | | | 1.61 | % | | | 1.65 | %(5)(6) | |
| Net investment income(4) | | | 8.05 | % | | | 6.51 | % | | | 14.30 | %(5)(6) | |
| Portfolio Turnover of the Fund | | | — | | | | — | | | | 35 | %(7) | |
| Portfolio Turnover of the Portfolio | | | 256 | % | | | 87 | % | | | 170 | %(8) | |
(1) For the period from the initial issuance of Class R shares, January 31, 2006, to October 31, 2006.
(2) Computed using average shares outstanding.
(3) Returns are historical and are calculated by determining the percentage change in net asset value with all distributions reinvested.
(4) Includes the Fund's share of the Portfolio's allocated expenses.
(5) Annualized.
(6) The administrator subsidized certain operating expenses (equal to 1.21% of average daily net assets for the period from the initial issuance of shares, January 31, 2006, to October 31, 2006).
(7) Represents the rate of portfolio activity for the period during which the Fund was making investments directly in securities.
(8) For the period from the Portfolio's start of business, March 24, 2006, to October 31, 2006.
(9) Not annualized.
See notes to financial statements
10
Eaton Vance Dividend Income Fund as of October 31, 2008
NOTES TO FINANCIAL STATEMENTS
1 Significant Accounting Policies
Eaton Vance Dividend Income Fund (the Fund) is a diversified series of Eaton Vance Mutual Funds Trust (the Trust). The Trust is a Massachusetts business trust registered under the Investment Company Act of 1940, as amended (the 1940 Act), as an open-end management investment company. The Fund offers four classes of shares. Class A shares are generally sold subject to a sales charge imposed at time of purchase. Class C shares are sold at net asset value and are generally subject to a contingent deferred sales charge (see Note 5). Class I and Class R shares are sold at net asset value and are not subject to a sales charge. Each class represents a pro-rata interest in the Fund, but votes separately on class-specific matters and (as noted below) is subject to different expenses. Realized and unrealized gains and losses and net investment income and losses, other than class-specific expenses, are allocated daily to each class of shar es based on the relative net assets of each class to the total net assets of the Fund. Each class of shares differs in its distribution plan and certain other class-specific expenses. The Fund invests all of its investable assets in interests of the Dividend Income Portfolio (the Portfolio), a New York trust, having the same investment objective and policies as the Fund. The value of the Fund's investment in the Portfolio reflects the Fund's proportionate interest in the net assets of the Portfolio (93.4% at October 31, 2008). The performance of the Fund is directly affected by the performance of the Portfolio. The financial statements of the Portfolio, including the portfolio of investments, are included elsewhere in this report and should be read in conjunction with the Fund's financial statements.
The following is a summary of significant accounting policies of the Fund. The policies are in conformity with accounting principles generally accepted in the United States of America.
A Investment Valuation — Valuation of securities by the Portfolio is discussed in Note 1A of the Portfolio's Notes to Financial Statements, which are included elsewhere in this report.
B Income — The Fund's net investment income or loss consists of the Fund's pro-rata share of the net investment income or loss of the Portfolio, less all actual and accrued expenses of the Fund.
C Federal Taxes — The Fund's policy is to comply with the provisions of the Internal Revenue Code applicable to regulated investment companies and to distribute to shareholders each year substantially all of its net investment income, and all or substantially all of its net realized capital gains. Accordingly, no provision for federal income or excise tax is necessary.
At October 31, 2008, the Fund, for federal income tax purposes, had a capital loss carryforward of $99,401,974 which will reduce its taxable income arising from future net realized gains on investment transactions, if any, to the extent permitted by the Internal Revenue Code, and thus will reduce the amount of distributions to shareholders which would otherwise be necessary to relieve the Fund of any liability for federal income or excise tax. Such capital loss carryforward will expire on October 31, 2014 ($1,311,256) October 31, 2015 ($8,547,018), and October 31, 2016 ($89,543,700).
As of October 31, 2008, the Fund had no uncertain tax positions that would require financial statement recognition, de-recognition, or disclosure. Each of the Fund's federal tax returns filed in the 3-year period ended October 31, 2008 remains subject to examination by the Internal Revenue Service.
D Expenses — The majority of expenses of the Trust are directly identifiable to an individual fund. Expenses which are not readily identifiable to a specific fund are allocated taking into consideration, among other things, the nature and type of expense and the relative size of the funds.
E Expense Reduction — State Street Bank and Trust Company (SSBT) serves as custodian of the Fund. Pursuant to the custodian agreement, SSBT receives a fee reduced by credits, which are determined based on the average daily cash balance the Fund maintains with SSBT. All credit balances, if any, used to reduce the Fund's custodian fees are reported as a reduction of expenses in the Statement of Operations.
F Use of Estimates — The preparation of the financial statements in conformity with accounting principles generally accepted in the United States of America requires management to make estimates and assumptions that affect the reported amounts of assets and liabilities at the date of the financial statements and the reported amounts of income and expense during the reporting period. Actual results could differ from those estimates.
G Indemnifications — Under the Trust's organizational documents, its officers and Trustees may be indemnified against certain liabilities and expenses arising out of the performance of their duties to the Fund, and shareholders are indemnified against personal liability for the obligations of the Trust. Additionally, in the normal course of business, the Fund enters into agreements with service providers that may contain indemnification clauses. The Fund's maximum exposure under these arrangements is unknown as this would involve future claims that may be made against the Fund that have not yet occurred.
11
Eaton Vance Dividend Income Fund as of October 31, 2008
NOTES TO FINANCIAL STATEMENTS CONT'D
H Other — Investment transactions are accounted for on a trade date basis. Dividends to shareholders are recorded on the ex-dividend date.
2 Distributions to Shareholders
It is the present policy of the Fund to make monthly distributions of all or substantially all of its net investment income and to distribute annually all or substantially all of its net realized capital gains (reduced by available capital loss carryforwards from prior years, if any). Distributions are declared separately for each class of shares. Shareholders may reinvest income and capital gain distributions in additional shares of the same class of the Fund at the net asset value as of the ex-dividend date or, at the election of the shareholder, receive distributions in cash. The Fund distinguishes between distributions on a tax basis and a financial reporting basis. Accounting principles generally accepted in the United States of America require that only distributions in excess of tax basis earnings and profits be reported in the financial statements as a return of capital. Permanent differences between book and tax account ing relating to distributions are reclassified to paid-in capital.
The tax character of distributions declared for the years ended October 31, 2008 and October 31, 2007 was as follows:
| | | Year Ended October 31, | |
| | | 2008 | | 2007 | |
| Distributions declared from: | |
| Ordinary income | | $ | 21,273,389 | | | $ | 9,803,824 | | |
During the year ended October 31, 2008, accumulated net realized loss was decreased by $574,943, accumulated undistributed net investment income was decreased by 574,941, and paid-in capital was decreased by $2 due to differences between book and tax accounting, primarily for foreign currency loss and distributions from real estate investment trusts. These reclassifications had no effect on the net assets or net asset value per share of the Fund.
As of October 31, 2008, the components of distributable earnings (accumulated losses) and unrealized appreciation (depreciation) on a tax basis were as follows:
| Undistributed ordinary income | | $ | 4,643,766 | | |
| Capital loss carryforward | | $ | (99,401,974 | ) | |
| Net unrealized depreciation | | $ | (37,644,142 | ) | |
The differences between components of distributable earnings (accumulated losses) on a tax basis and the amounts reflected in the Statement of Assets and Liabilities are primarily due to wash sales and partnership allocations.
3 Transactions with Affiliates
The administration fee is earned by Eaton Vance Management (EVM) as compensation for administrative services rendered to the Fund. The fee is computed at an annual rate of 0.15% of the Fund's average daily net assets. For the year ended October 31, 2008, the administration fee amounted to $465,330. The Portfolio has engaged Boston Management and Research (BMR), a subsidiary of EVM, to render investment advisory services. See Note 2 of the Portfolio's Notes to Financial Statements which are included elsewhere in this report.
EVM serves as the sub-transfer agent of the Fund and receives from the transfer agent an aggregate fee based upon the actual expenses incurred by EVM in the performance of these services. For the year ended October 31, 2008, EVM earned $16,252 in sub-transfer agent fees. The Fund was informed that Eaton Vance Distributors, Inc. (EVD), an affiliate of EVM and the Fund's principal underwriter, received $225,133 as its portion of the sales charge on sales of Class A shares for the year ended October 31, 2008. EVD also received distribution and service fees from Class A, Class C and Class R shares (see Note 4) and contingent deferred sales charges (see Note 5).
Except for Trustees of the Fund and the Portfolio who are not members of EVM's or BMR's organizations, officers and Trustees receive remuneration for their services to the Fund out of the investment adviser fee. Certain officers and Trustees of the Fund and the Portfolio are officers of the above organizations.
4 Distribution Plans
The Fund has in effect a distribution plan for Class A shares (Class A Plan) pursuant to Rule 12b-1 under the 1940 Act. The Class A Plan provides that the Fund will pay EVD a distribution and service fee of 0.25% per annum of its average daily net assets attributable to Class A shares for distribution services and facilities provided to the Fund by EVD, as well as for personal services and/or the maintenance of shareholder accounts. Distribution and service fees paid or accrued to EVD for the year ended October 31, 2008 amounted to $450,962 for Class A shares. The Fund also has in effect distribution plans for Class C shares (Class C Plan) and Class R shares (Class R Plan) pursuant to Rule 12b-1 under the 1940 Act. The Class C Plan requires the Fund to pay EVD amounts equal to 0.75% per annum of its average daily net assets attributable to Class C shares for providing ongoing
12
Eaton Vance Dividend Income Fund as of October 31, 2008
NOTES TO FINANCIAL STATEMENTS CONT'D
distribution services and facilities to the Fund. The Fund will automatically discontinue payments to EVD during any period in which there are no outstanding Uncovered Distribution Charges, which are equivalent to the sum of (i) 6.25% of the aggregate amount received by the Fund for Class C shares sold, plus (ii) interest calculated by applying the rate of 1% over the prevailing prime rate to the outstanding balance of Uncovered Distribution Charges of EVD of Class C, reduced by the aggregate amount of contingent deferred sales charges (see Note 5) and amounts theretofore paid or payable to EVD. For the year ended October 31, 2008, the Fund paid or accrued to EVD $952,338 for Class C shares, representing 0.75% (annualized) of the average daily net assets of Class C shares. At October 31, 2008, the amounts of Uncovered Distribution Charges of EVD calculated under the Class C Plan was approximately $9,310,000 for Class C shares. T he Class R Plan requires the Fund to pay EVD an amount equal to 0.50% per annum of its average daily net assets attributable to Class R shares for providing ongoing distribution services and facilities to the Fund. The Trustees of the Trust have currently limited Class R distribution payments to 0.25% per annum of average daily net assets attributable to Class R shares. For the year ended October 31, 2008, the Fund paid or accrued to EVD $195, representing 0.25% (annualized) of the average daily net assets of Class R shares. The Class C and Class R Plans also authorize the Fund to make payments of service fees to EVD, investment dealers and other persons in amounts not exceeding 0.25% per annum of its average daily net assets attributable to that class. Service fees paid or accrued are for personal services and/or the maintenance of shareholder accounts. They are separate and distinct from the sales commissions and distribution fees and, as such, are not subject to automatic discontinuance when there are no outstanding Uncovered Distribution Charges of EVD. Service fees paid or accrued for the year ended October 31, 2008 amounted to $317,446 and $195 for Class C and Class R shares, respectively.
5 Contingent Deferred Sales Charges
A contingent deferred sales charge (CDSC) of 1% generally is imposed on redemptions of Class C shares made within one year of purchase. Class A shares may be subject to a 1% CDSC if redeemed within 18 months of purchase (depending on the circumstances of purchase). Generally, the CDSC is based upon the lower of the net asset value at date of redemption or date of purchase. No charge is levied on shares acquired by reinvestment of dividends or capital gain distributions. No CDSC is levied on shares which have been sold to EVM or its affiliates or to their respective employees or clients and may be waived under certain other limited conditions. CDSCs received on Class C redemptions are paid to EVD to reduce the amount of Uncovered Distribution Charges calculated under the Fund's Class C Plan. CDSCs received on Class C redemptions when no Uncovered Distribution Charges exist are credited to the Fund. For the year ended October 31, 2008, the Fund was informed that EVD received approximately $6,000 and $40,000 of CDSCs paid by Class A and Class C shareholders, respectively.
6 Investment Transactions
For the year ended October 31, 2008, increases and decreases in the Fund's investment in the Portfolio aggregated $205,759,347 and $96,393,078, respectively.
7 Shares of Beneficial Interest
The Fund's Declaration of Trust permits the Trustees to issue an unlimited number of full and fractional shares of beneficial interest (without par value). Such shares may be issued in a number of different series (such as the Fund) and classes. Transactions in Fund shares were as follows:
| | | Year Ended October 31, | |
| Class A | | 2008 | | 2007 | |
| Sales | | | 12,654,295 | | | | 11,623,281 | | |
Issued to shareholders electing to
receive payments of distributions
in Fund shares | | | 861,638 | | | | 334,945 | | |
| Redemptions | | | (5,731,544 | ) | | | (1,372,583 | ) | |
| Net increase | | | 7,784,389 | | | | 10,585,643 | | |
| | | Year Ended October 31, | |
| Class C | | 2008 | | 2007 | |
| Sales | | | 6,923,696 | | | | 7,754,795 | | |
Issued to shareholders electing to
receive payments of distributions
in Fund shares | | | 442,114 | | | | 167,204 | | |
| Redemptions | | | (2,661,168 | ) | | | (510,023 | ) | |
| Net increase | | | 4,704,642 | | | | 7,411,976 | | |
| | | Year Ended October 31, | |
| Class I | | 2008 | | 2007 | |
| Sales | | | 294,565 | | | | 170,313 | | |
Issued to shareholders electing to
receive payments of distributions
in Fund shares | | | 15,405 | | | | 7,024 | | |
| Redemptions | | | (213,957 | ) | | | (90,233 | ) | |
| Net increase | | | 96,013 | | | | 87,104 | | |
13
Eaton Vance Dividend Income Fund as of October 31, 2008
NOTES TO FINANCIAL STATEMENTS CONT'D
| | | Year Ended October 31, | |
| Class R | | 2008 | | 2007 | |
| Sales | | | 6,028 | | | | 4,961 | | |
Issued to shareholders electing to
receive payments of distributions
in Fund shares | | | 377 | | | | 275 | | |
| Redemptions | | | (3,636 | ) | | | (1,328 | ) | |
| Net increase | | | 2,769 | | | | 3,908 | | |
8 Recently Issued Accounting Pronouncement
In September 2006, the Financial Accounting Standards Board (FASB) issued Statement of Financial Accounting Standards No. 157 (FAS 157), "Fair Value Measurements". FAS 157 defines fair value, establishes a framework for measuring fair value in accordance with accounting principles generally accepted in the United States of America and expands disclosure about fair value measurements. FAS 157 is effective for fiscal years beginning after November 15, 2007. As of October 31, 2008, management does not believe the adoption of FAS 157 will impact the amounts reported in the financial statements; however, additional disclosures may be required about the inputs used to develop the measurements of fair value and the effect of certain of the measurements on changes in net assets for the period.
14
Eaton Vance Dividend Income Fund as of October 31, 2008
REPORT OF INDEPENDENT REGISTERED PUBLIC ACCOUNTING FIRM
To the Trustees of Eaton Vance Mutual Funds Trust and Shareholders of Eaton Vance Dividend
Income Fund:
We have audited the accompanying statement of assets and liabilities of Eaton Vance Dividend Income Fund (the "Fund") (one of the series of Eaton Vance Mutual Funds Trust) as of October 31, 2008, and the related statement of operations for the year then ended, the statements of changes in net assets for each of the two years in the period then ended, and the financial highlights for each of the two years in the period then ended and the period from the start of business, November 30, 2005 to October 31, 2006. These financial statements and financial highlights are the responsibility of the Fund's management. Our responsibility is to express an opinion on these financial statements and financial highlights based on our audits.
We conducted our audits in accordance with the standards of the Public Company Accounting Oversight Board (United States). Those standards require that we plan and perform the audit to obtain reasonable assurance about whether the financial statements and financial highlights are free of material misstatement. The Fund is not required to have, nor were we engaged to perform, an audit of its internal control over financial reporting. Our audits included consideration of internal control over financial reporting as a basis for designing audit procedures that are appropriate in the circumstances, but not for the purpose of expressing an opinion on the effectiveness of the Fund's internal control over financial reporting. Accordingly, we express no such opinion. An audit also includes examining, on a test basis, evidence supporting the amounts and disclosures in the financial statements, assessing the accounting principles used and significant estimates made by management, as well as evaluating the overall financial statement presentation. We believe that our audits provide a reasonable basis for our opinion.
In our opinion, the financial statements and financial highlights referred to above present fairly, in all material respects, the financial position of Eaton Vance Dividend Income Fund as of October 31, 2008, the results of its operations for the year then ended, the changes in its net assets for each of the two years in the period then ended, and the financial highlights for each of the two years in the period then ended and the period from the start of business, November 30, 2005 to October 31, 2006, in conformity with accounting principles generally accepted in the United States of America.
DELOITTE & TOUCHE LLP
Boston, Massachusetts
December 15, 2008
15
Eaton Vance Dividend Income Fund as of October 31, 2008
FEDERAL TAX INFORMATION (Unaudited)
The Form 1099-DIV you receive in January 2009 will show the tax status of all distributions paid to your account in calendar 2007. Shareholders are advised to consult their own tax adviser with respect to the tax consequences of their investment in the Fund. As required by the Internal Revenue Code regulations, shareholders must be notified within 60 days of the Fund's fiscal year end regarding the status of qualified dividend income for individuals and the foreign tax credit.
Qualified Dividend Income. The Fund designates approximately $13,754,403, or up to the maximum amount of such dividends allowable pursuant to the Internal Revenue Code, as qualified dividend income eligible for the reduced tax rate of 15%.
Dividends Received Deduction. Corporate shareholders are generally entitled to take the dividends received deduction on the portion of the Fund's dividend distribution that qualifies under tax law. For the Fund's fiscal 2008 ordinary income dividends, 11.4% qualifies for the corporate dividends received deduction.
16
Dividend Income Portfolio as of October 31, 2008
PORTFOLIO OF INVESTMENTS
| Common Stocks — 95.6% | |
| Security | | Shares | | Value | |
| Aerospace & Defense — 6.7% | |
| General Dynamics Corp. | | | 87,300 | | | $ | 5,265,936 | | |
| Lockheed Martin Corp. | | | 77,800 | | | | 6,616,890 | | |
| Raytheon Co. | | | 120,170 | | | | 6,141,889 | | |
| United Technologies Corp. | | | 25,828 | | | | 1,419,507 | | |
| | | $ | 19,444,222 | | |
| Capital Markets — 5.8% | |
| Bank of New York Mellon Corp. (The) | | | 207,000 | | | $ | 6,748,200 | | |
| Franklin Resources, Inc. | | | 70,977 | | | | 4,826,436 | | |
| State Street Corp. | | | 121,799 | | | | 5,279,987 | | |
| | | $ | 16,854,623 | | |
| Chemicals — 0.6% | |
| Potash Corp. of Saskatchewan, Inc. | | | 20,000 | | | $ | 1,705,200 | | |
| | | $ | 1,705,200 | | |
| Commercial Banks — 4.0% | |
| PNC Financial Services Group, Inc. | | | 112,552 | | | $ | 7,503,842 | | |
| Wells Fargo & Co. | | | 116,501 | | | | 3,966,859 | | |
| | | $ | 11,470,701 | | |
| Commercial Services & Supplies — 2.2% | |
| Waste Management, Inc. | | | 200,000 | | | $ | 6,246,000 | | |
| | | $ | 6,246,000 | | |
| Computers & Peripherals — 3.0% | |
| Hewlett-Packard Co. | | | 60,000 | | | $ | 2,296,800 | | |
| International Business Machines Corp. | | | 69,781 | | | | 6,487,540 | | |
| | | $ | 8,784,340 | | |
| Diversified Financial Services — 2.7% | |
| Citigroup, Inc. | | | 167,966 | | | $ | 2,292,736 | | |
| JPMorgan Chase & Co. | | | 135,000 | | | | 5,568,750 | | |
| | | $ | 7,861,486 | | |
| Diversified Telecommunication Services — 8.7% | |
| AT&T, Inc. | | | 126,880 | | | $ | 3,396,578 | | |
| France Telecom SA | | | 360,000 | | | | 9,077,607 | | |
| Security | | Shares | | Value | |
| Diversified Telecommunication Services (continued) | |
| Koninklijke KPN NV | | | 400,000 | | | $ | 5,633,276 | | |
| Telefonos de Mexico SA de CV ADR | | | 62,130 | | | | 1,113,370 | | |
| Verizon Communications, Inc. | | | 201,109 | | | | 5,966,904 | | |
| | | $ | 25,187,735 | | |
| Electric Utilities — 5.3% | |
| E.ON AG | | | 41,018 | | | $ | 1,537,143 | | |
| E.ON AG ADR | | | 2 | | | | 76 | | |
| FirstEnergy Corp. | | | 72,500 | | | | 3,781,600 | | |
| Fortum Oyj | | | 182,592 | | | | 4,487,389 | | |
| FPL Group, Inc. | | | 120,000 | | | | 5,668,800 | | |
| | | $ | 15,475,008 | | |
| Energy Equipment & Services — 4.7% | |
| Diamond Offshore Drilling, Inc. | | | 72,688 | | | $ | 6,454,694 | | |
| Schlumberger, Ltd. | �� | | 85,959 | | | | 4,439,782 | | |
| Transocean, Inc.(1) | | | 31,831 | | | | 2,620,646 | | |
| | | $ | 13,515,122 | | |
| Food & Staples Retailing — 2.9% | |
| Wal-Mart Stores, Inc. | | | 152,800 | | | $ | 8,527,768 | | |
| | | $ | 8,527,768 | | |
| Food Products — 3.5% | |
| Cadbury Schweppes PLC ADR | | | 62,524 | | | $ | 2,312,137 | | |
| Nestle SA | | | 201,587 | | | | 7,839,112 | | |
| | | $ | 10,151,249 | | |
| Health Care Equipment & Supplies — 2.3% | |
| Covidien, Ltd. | | | 152,400 | | | $ | 6,749,796 | | |
| | | $ | 6,749,796 | | |
| Hotels, Restaurants & Leisure — 2.7% | |
| McDonald's Corp. | | | 136,400 | | | $ | 7,901,652 | | |
| | | $ | 7,901,652 | | |
| Household Products — 0.4% | |
| Kimberly-Clark de Mexico SA de CV | | | 362,500 | | | $ | 1,191,665 | | |
| | | $ | 1,191,665 | | |
See notes to financial statements
17
Dividend Income Portfolio as of October 31, 2008
PORTFOLIO OF INVESTMENTS CONT'D
| Security | | Shares | | Value | |
| Insurance — 5.5% | |
| Chubb Corp. | | | 38,000 | | | $ | 1,969,160 | | |
| MetLife, Inc. | | | 205,000 | | | | 6,810,100 | | |
| Travelers Companies, Inc. (The) | | | 166,692 | | | | 7,092,745 | | |
| | | $ | 15,872,005 | | |
| Leisure Equipment & Products — 1.0% | |
| Mattel, Inc. | | | 200,000 | | | $ | 3,004,000 | | |
| | | $ | 3,004,000 | | |
| Media — 1.5% | |
| Comcast Corp., Class A | | | 272,080 | | | $ | 4,287,981 | | |
| | | $ | 4,287,981 | | |
| Metals & Mining — 2.6% | |
| BHP Billiton, Ltd. ADR | | | 135,000 | | | $ | 5,248,800 | | |
| Compass Minerals International, Inc. | | | 38,900 | | | | 2,136,777 | | |
| | | $ | 7,385,577 | | |
| Multiline Retail — 1.4% | |
| Target Corp. | | | 103,817 | | | $ | 4,165,138 | | |
| | | $ | 4,165,138 | | |
| Oil, Gas & Consumable Fuels — 10.6% | |
| BP PLC ADR | | | 130,000 | | | $ | 6,461,000 | | |
| Chevron Corp. | | | 88,400 | | | | 6,594,640 | | |
| Exxon Mobil Corp. | | | 103,529 | | | | 7,673,569 | | |
| Occidental Petroleum Corp. | | | 106,160 | | | | 5,896,126 | | |
| Total SA ADR | | | 72,260 | | | | 4,006,094 | | |
| | | $ | 30,631,429 | | |
| Pharmaceuticals — 10.6% | |
| Johnson & Johnson | | | 116,785 | | | $ | 7,163,592 | | |
| Merck & Co., Inc. | | | 226,967 | | | | 7,024,629 | | |
| Novartis AG ADR | | | 105,000 | | | | 5,353,950 | | |
| Pfizer, Inc. | | | 300,000 | | | | 5,313,000 | | |
| Schering-Plough Corp. | | | 406,720 | | | | 5,893,373 | | |
| | | $ | 30,748,544 | | |
| Security | | Shares | | Value | |
| Real Estate Investment Trusts (REITs) — 3.4% | |
| Boston Properties, Inc. | | | 61,100 | | | $ | 4,330,768 | | |
| Simon Property Group, Inc. | | | 80,690 | | | | 5,408,651 | | |
| | | $ | 9,739,419 | | |
| Road & Rail — 1.1% | |
| Canadian Pacific Railway, Ltd. | | | 70,000 | | | $ | 3,150,000 | | |
| | | $ | 3,150,000 | | |
| Tobacco — 2.4% | |
| Philip Morris International, Inc. | | | 161,845 | | | $ | 7,035,402 | | |
| | | $ | 7,035,402 | | |
Total Common Stocks
(identified cost $311,961,736) | | $ | 277,086,062 | | |
| Short-Term Investments — 6.2% | |
| Description | | Interest
(000's omitted) | | Value | |
| Cash Management Portfolio, 1.90%(2) | | $ | 17,811 | | | $ | 17,810,796 | | |
Total Short-Term Investments
(identified cost $17,810,796) | | $ | 17,810,796 | | |
Total Investments — 101.8%
(identified cost $329,772,532) | | | | | | $ | 294,896,858 | | |
| Other Assets, Less Liabilities — (1.8)% | | | | | | $ | (5,093,816 | ) | |
| Net Assets — 100.0% | | | | | | $ | 289,803,042 | | |
ADR - American Depository Receipt
(1) Non-income producing security.
(2) Affiliated investment company available to Eaton Vance portfolios and funds which invests in high quality, U.S. dollar denominated money market instruments. The rate shown is the annualized seven-day yield as of October 31, 2008.
See notes to financial statements
18
Dividend Income Portfolio as of October 31, 2008
PORTFOLIO OF INVESTMENTS CONT'D
| Country Concentration of Portfolio | |
| Country | | Percentage
of Net Assets | | Value | |
| United States | | | 80.5 | % | | $ | 233,159,393 | | |
| France | | | 6.7 | | | | 19,445,871 | | |
| Switzerland | | | 4.6 | | | | 13,193,062 | | |
| United Kingdom | | | 3.0 | | | | 8,773,137 | | |
| Netherlands | | | 1.9 | | | | 5,633,276 | | |
| Canada | | | 1.7 | | | | 4,855,200 | | |
| Finland | | | 1.6 | | | | 4,487,389 | | |
| Cayman Islands | | | 0.9 | | | | 2,620,646 | | |
| Germany | | | 0.5 | | | | 1,537,219 | | |
| Mexico | | | 0.4 | | | | 1,191,665 | | |
| | | | 101.8 | % | | $ | 294,896,858 | | |
See notes to financial statements
19
Dividend Income Portfolio as of October 31, 2008
FINANCIAL STATEMENTS
Statement of Assets and Liabilities
As of October 31, 2008
| Assets | |
| Unaffiliated investments, at value (identified cost, $311,961,736) | | $ | 277,086,062 | | |
| Affiliated investment, at value (identified cost, $17,810,796) | | | 17,810,796 | | |
| Receivable for investments sold | | | 5,172,444 | | |
| Dividends receivable | | | 1,424,578 | | |
| Interest receivable from affiliated investment | | | 27,122 | | |
| Tax reclaims receivable | | | 815,993 | | |
| Total assets | | $ | 302,336,995 | | |
| Liabilities | |
| Payable for investments purchased | | $ | 12,273,826 | | |
| Payable to affiliate for investment adviser fee | | | 145,626 | | |
| Payable to affiliate for Trustees' fees | | | 898 | | |
| Accrued expenses | | | 113,603 | | |
| Total liabilities | | $ | 12,533,953 | | |
| Net Assets applicable to investors' interest in Portfolio | | $ | 289,803,042 | | |
| Sources of Net Assets | |
| Net proceeds from capital contributions and withdrawals | | $ | 324,857,049 | | |
| Net unrealized depreciation (computed on the basis of identified cost) | | | (35,054,007 | ) | |
| Total | | $ | 289,803,042 | | |
Statement of Operations
For the Year Ended
October 31, 2008
| Investment Income | |
| Dividends (net of foreign taxes, $2,712,765) | | $ | 33,402,763 | | |
| Interest | | | 184 | | |
| Interest income allocated from affiliated investment | | | 195,457 | | |
| Expenses allocated from affiliated investment | | | (29,705 | ) | |
| Total investment income | | $ | 33,568,699 | | |
| Expenses | |
| Investment adviser fee | | $ | 2,152,193 | | |
| Trustees' fees and expenses | | | 13,301 | | |
| Custodian fee | | | 263,481 | | |
| Legal and accounting services | | | 36,347 | | |
| Miscellaneous | | | 7,577 | | |
| Total expenses | | $ | 2,472,899 | | |
| Net investment income | | $ | 31,095,800 | | |
| Realized and Unrealized Gain (Loss) | |
Net realized gain (loss) —
Investment transactions (identified cost basis) | | $ | (99,658,877 | ) | |
| Foreign currency transactions | | | (329,191 | ) | |
| Net realized loss | | $ | (99,988,068 | ) | |
Change in unrealized appreciation (depreciation) —
Investments (identified cost basis) | | $ | (66,815,214 | ) | |
| Foreign currency | | | (187,458 | ) | |
| Net change in unrealized appreciation (depreciation) | | $ | (67,002,672 | ) | |
| Net realized and unrealized loss | | $ | (166,990,740 | ) | |
| Net decrease in net assets from operations | | $ | (135,894,940 | ) | |
See notes to financial statements
20
Dividend Income Portfolio as of October 31, 2008
FINANCIAL STATEMENTS CONT'D
Statements of Changes in Net Assets
Increase (Decrease)
in Net Assets | | Year Ended
October 31, 2008 | | Year Ended
October 31, 2007 | |
From operations —
Net investment income | | $ | 31,095,800 | | | $ | 12,650,275 | | |
Net realized loss from investment
and foreign currency transactions | | | (99,988,068 | ) | | | (9,095,700 | ) | |
Net change in unrealized appreciation
(depreciation) from investments and
foreign currency | | | (67,002,672 | ) | | | 27,518,346 | | |
Net increase (decrease) in net assets
from operations | | $ | (135,894,940 | ) | | $ | 31,072,921 | | |
Capital transactions —
Contributions | | $ | 210,949,684 | | | $ | 242,628,525 | | |
| Withdrawals | | | (101,490,492 | ) | | | (32,100,952 | ) | |
Net increase in net assets from
capital transactions | | $ | 109,459,192 | | | $ | 210,527,573 | | |
| Net increase (decrease) in net assets | | $ | (26,435,748 | ) | | $ | 241,600,494 | | |
| Net Assets | |
| At beginning of year | | $ | 316,238,790 | | | $ | 74,638,296 | | |
| At end of year | | $ | 289,803,042 | | | $ | 316,238,790 | | |
See notes to financial statements
21
Dividend Income Portfolio as of October 31, 2008
FINANCIAL STATEMENTS CONT'D
Supplementary Data
| | | Year Ended October 31, | | Period Ended | |
| | | 2008 | | 2007 | | October 31, 2006(1) | |
| Ratios/Supplemental Data | |
| Ratios (As a percentage of average daily net assets): | |
| Expenses before custodian fee reduction(2) | | | 0.75 | % | | | 0.76 | % | | | 0.88 | %(3) | |
| Net investment income | | | 9.27 | % | | | 6.77 | % | | | 15.44 | %(3) | |
| Portfolio Turnover | | | 256 | % | | | 87 | % | | | 170 | % | |
| Total Return | | | (33.97 | )% | | | 18.88 | % | | | 10.33 | %(4) | |
| Net assets, end of period (000's omitted) | | $ | 289,803 | | | $ | 316,239 | | | $ | 74,638 | | |
(1) For the period from the start of business, March 24, 2006, to October 31, 2006.
(2) Excludes the effect of custody fee credits, if any, of less than 0.005%.
(3) Annualized.
(4) Not annualized.
See notes to financial statements
22
Dividend Income Portfolio as of October 31, 2008
NOTES TO FINANCIAL STATEMENTS
1 Significant Accounting Policies
Dividend Income Portfolio (the Portfolio) is a New York trust registered under the Investment Company Act of 1940, as amended (the 1940 Act), as a diversified, open-end management investment company. The Portfolio's investment objective is to achieve total return by investing primarily in a diversified portfolio of equity securities that pay dividends. The Declaration of Trust permits the Trustees to issue interests in the Portfolio. At October 31, 2008, Eaton Vance Dividend Income Fund held a 93.4% interest in the Portfolio.
The following is a summary of significant accounting policies of the Portfolio. The policies are in conformity with accounting principles generally accepted in the United States of America.
A Investment Valuation — Equity securities listed on a U.S. securities exchange generally are valued at the last sale price on the day of valuation or, if no sales took place on such date, at the mean between the closing bid and asked prices therefore on the exchange where such securities are principally traded. Equity securities listed on the NASDAQ Global or Global Select Market generally are valued at the NASDAQ official closing price. Unlisted or listed securities for which closing sales prices or closing quotations are not available are valued at the mean between the latest available bid and asked prices or, in the case of preferred equity securities that are not listed or traded in the over-the- counter market, by an independent pricing service. Short-term debt securities with a remaining maturity of sixty days or less are valued at amortized cost, which approximates market value. If short-term debt securities are acquired with a remaining maturity of more than sixty days, they will be valued by a pricing service. The daily valuation of exchange-traded foreign securities generally is determined as of the close of trading on the principal exchange on which such securities trade. Events occurring after the close of trading on foreign exchanges may result in adjustments to the valuation of foreign securities to more accurately reflect their fair value as of the close of regular trading on the New York Stock Exchange. When valuing foreign equity securities that meet certain criteria, the Trustees have approved the use of a fair value service that values such securities to reflect market trading that occurs after the close of the applicable foreign markets of comparable securities or other instruments th at have a strong correlation to the fair-valued securities. Foreign securities and currencies are valued in U.S. dollars, based on foreign currency exchange rate quotations supplied by an independent quotation service. The independent service uses a proprietary model to determine the exchange rate. Inputs to the model include reported trades and implied bid/ask spreads. Investments for which valuations or market quotations are not readily available are valued at fair value using methods determined in good faith by or at the direction of the Trustees of the Portfolio considering relevant factors, data and information including the market value of freely tradable securities of the same class in the principal market on which such securities are normally traded.
The Portfolio may invest in Cash Management Portfolio (Cash Management), an affiliated investment company managed by Boston Management and Research (BMR), a subsidiary of Eaton Vance Management (EVM). Cash Management values its investment securities utilizing the amortized cost valuation technique permitted by Rule 2a-7 of the 1940 Act, pursuant to which Cash Management must comply with certain conditions. This technique involves initially valuing a portfolio security at its cost and thereafter assuming a constant amortization to maturity of any discount or premium. If amortized cost is determined not to approximate fair value, Cash Management may value its investment securities based on available market quotations provided by a pricing service .
B Investment Transactions — Investment transactions for financial statement purposes are accounted for on a trade date basis. Realized gains and losses on investments sold are determined on the basis of identified cost.
C Income — Dividend income is recorded on the ex-dividend date for dividends received in cash and/or securities. However, if the ex-dividend date has passed, certain dividends from foreign securities are recorded as the Portfolio is informed of the ex-dividend date. Withholding taxes on foreign dividends and capital gains have been provided for in accordance with the Portfolio's understanding of the applicable countries' tax rules and rates.
D Federal Taxes — The Portfolio has elected to be treated as a partnership for federal tax purposes. No provision is made by the Portfolio for federal or state taxes on any taxable income of the Portfolio because each investor in the Portfolio is ultimately responsible for the payment of any taxes on its share of taxable income. Since at least one of the Portfolio's investors is a regulated investment company that invests all or substantially all of its assets in the Portfolio, the Portfolio normally must satisfy the applicable source of income and diversification
23
Dividend Income Portfolio as of October 31, 2008
NOTES TO FINANCIAL STATEMENTS CONT'D
requirements (under the Internal Revenue Code) in order for its investors to satisfy them. The Portfolio will allocate, at least annually among its investors, each investor's distributive share of the Portfolio's net investment income, net realized capital gains and any other items of income, gain, loss, deduction or credit.
As of October 31, 2008, the Portfolio has no uncertain tax positions that would require financial statement recognition, de-recognition, or disclosure. Each of the Portfolio's federal tax returns filed in the 3-year period ended October 31, 2008 remains subject to examination by the Internal Revenue Service.
E Expense Reduction — State Street Bank and Trust Company (SSBT) serves as custodian of the Portfolio. Pursuant to the custodian agreement, SSBT receives a fee reduced by credits, which are determined based on the average daily cash balance the Portfolio maintains with SSBT. All credit balances, if any, used to reduce the Portfolio's custodian fees are reported as a reduction of expenses in the Statement of Operations.
F Foreign Currency Translation — Investment valuations, other assets, and liabilities initially expressed in foreign currencies are translated each business day into U.S. dollars based upon current exchange rates. Purchases and sales of foreign investment securities and income and expenses denominated in foreign currencies are translated into U.S. dollars based upon currency exchange rates in effect on the respective dates of such transactions. Recognized gains or losses on investment transactions attributable to changes in foreign currency exchange rates are recorded for financial statement purposes as net realized gains and losses on investments. That portion of unrealized gains and losses on invest ments that results from fluctuations in foreign currency exchange rates is not separately disclosed.
G Use of Estimates — The preparation of the financial statements in conformity with accounting principles generally accepted in the United States of America requires management to make estimates and assumptions that affect the reported amounts of assets and liabilities at the date of the financial statements and the reported amounts of income and expense during the reporting period. Actual results could differ from those estimates.
H Indemnifications — Under the Portfolio's organizational documents, its officers and Trustees may be indemnified against certain liabilities and expenses arising out of the performance of their duties to the Portfolio. Interestholders in the Portfolio are jointly and severally liable for the liabilities and obligations of the Portfolio in the event that the Portfolio fails to satisfy such liabilities and obligations; provided, however, that, to the extent assets are available in the Portfolio, the Portfolio may, under certain circumstances, indemnify interestholders from and against any claim or liability to which such holder may become subject by reason of being or having been an interestholder in the Portfolio. Additionally, in the normal course of business, the Portfolio enters into agreements with service providers that may contain indemnification clauses. The Portfolio's maximum exposure under these arrangements is unknown as this would involve future claims that may be made against the Portfolio that have not yet occurred.
2 Investment Adviser Fee and Other Transactions with Affiliates
The investment adviser fee is earned by BMR, a subsidiary of EVM, as compensation for investment advisory services rendered to the Portfolio. The fee is computed at an annual rate of 0.65% of the Portfolio's average daily net assets up to $500 million and at reduced rates as daily net assets exceed that level, and is payable monthly. The portion of the adviser fee payable by Cash Management on the Portfolio's investment of cash therein is credited against the Portfolio's adviser fee. For the year ended October 31, 2008, the Portfolio's adviser fee totaled $2,180,994 of which $28,801 was allocated from Cash Management and $2,152,193 was paid or accrued directly by the Portfolio. For the year ended October 31, 2008, the Portfolio's adviser fee, including the portion allocated from Cash Management, was 0.65% (annualized) of the Portfolio's average daily net assets.
Except for Trustees of the Portfolio who are not members of EVM's or BMR's organizations, officers and Trustees receive remuneration for their services to the Portfolio out of the investment adviser fee. Trustees of the Portfolio who are not affiliated with the investment adviser may elect to defer receipt of all or a percentage of their annual fees in accordance with the terms of the Trustees Deferred Compensation Plan. For the year ended October 31, 2008, no significant amounts have been deferred. Certain officers and Trustees of the Portfolio are officers of the above organizations.
3 Purchases and Sales of Investments
Purchases and sales of investments, other than short-term obligations, aggregated $972,068,255 and $843,489,091, respectively, for the year ended October 31, 2008.
24
Dividend Income Portfolio as of October 31, 2008
NOTES TO FINANCIAL STATEMENTS CONT'D
4 Federal Income Tax Basis of Investments
The cost and unrealized appreciation (depreciation) of investments of the Portfolio at October 31, 2008, as determined on a federal income tax basis, were as follows:
| Aggregate cost | | $ | 333,180,966 | | |
| Gross unrealized appreciation | | $ | 46,481 | | |
| Gross unrealized depreciation | | | (38,330,589 | ) | |
| Net unrealized depreciation | | $ | (38,284,108 | ) | |
5 Line of Credit
The Portfolio participates with other portfolios and funds managed by EVM and its affiliates in a $450 million unsecured line of credit agreement with a group of banks. Borrowings are made by the Portfolio solely to facilitate the handling of unusual and/or unanticipated short-term cash requirements. Interest is charged to the Portfolio based on its borrowings at an amount above either the Eurodollar rate or Federal Funds rate. In addition, a fee computed at an annual rate of 0.10% on the daily unused portion of the line of credit is allocated among the participating portfolios and funds at the end of each quarter. The Portfolio did not have any significant borrowings or allocated fees during the year ended October 31, 2008.
6 Risks Associated with Foreign Investments
Investing in securities issued by companies whose principal business activities are outside the United States may involve significant risks not present in domestic investments. For example, there is generally less publicly available information about foreign companies, particularly those not subject to the disclosure and reporting requirements of the U.S. securities laws. Certain foreign issuers are generally not bound by uniform accounting, auditing, and financial reporting requirements and standards of practice comparable to those applicable to domestic issuers. Investments in foreign securities also involve the risk of possible adverse changes in investment or exchange control regulations, expropriation or confiscatory taxation, limitation on the removal of funds or other assets of the Portfolio, political or financial instability or diplomatic and other developments which could affect such investments. Foreign securities mar kets, while growing in volume and sophistication, are generally not as developed as those in the United States, and securities of some foreign issuers (particularly those located in developing countries) may be less liquid and more volatile than securities of comparable U.S. companies. In general, there is less overall governmental supervision and regulation of foreign securities markets, broker-dealers and issuers than in the United States.
7 Recently Issued Accounting Pronouncement
In September 2006, the Financial Accounting Standards Board (FASB) issued Statement of Financial Accounting Standards No. 157 (FAS 157), "Fair Value Measurements". FAS 157 defines fair value, establishes a framework for measuring fair value in accordance with accounting principles generally accepted in the United States of America and expands disclosure about fair value measurements. FAS 157 is effective for fiscal years beginning after November 15, 2007. As of October 31, 2008, management does not believe the adoption of FAS 157 will impact the amounts reported in the financial statements; however, additional disclosures may be required about the inputs used to develop the measurements of fair value and the effect of certain of the measurements on changes in net assets for the period.
25
Dividend Income Portfolio as of October 31, 2008
REPORT OF INDEPENDENT REGISTERED PUBLIC ACCOUNTING FIRM
To the Trustees and the Investors
of Dividend Income Portfolio:
We have audited the accompanying statement of assets and liabilities of Dividend Income Portfolio (the "Portfolio"), including the portfolio of investments, as of October 31, 2008, and the related statement of operations for the year then ended, the statements of changes in net assets for each of the two years in the period then ended, and the supplementary data for each of the two years in the period then ended and the period from the start of business, March 24, 2006 to October 31, 2006. These financial statements and supplementary data are the responsibility of the Portfolio's management. Our responsibility is to express an opinion on these financial statements and supplementary data based on our audits.
We conducted our audits in accordance with the standards of the Public Company Accounting Oversight Board (United States). Those standards require that we plan and perform the audit to obtain reasonable assurance about whether the financial statements and supplementary data are free of material misstatement. The Portfolio is not required to have, nor were we engaged to perform, an audit of its internal control over financial reporting. Our audits included consideration of internal control over financial reporting as a basis for designing audit procedures that are appropriate in the circumstances, but not for the purpose of expressing an opinion on the effectiveness of the Portfolio's internal control over financial reporting. Accordingly, we express no such opinion. An audit also includes examining, on a test basis, evidence supporting the amounts and disclosures in the financial statements, assessing the accounting principles u sed and significant estimates made by management, as well as evaluating the overall financial statement presentation. Our procedures included confirmation of securities owned as of October 31, 2008, by correspondence with the custodian and brokers; where replies were not received from brokers, we performed other auditing procedures. We believe that our audits provide a reasonable basis for our opinion.
In our opinion, the financial statements and supplementary data referred to above present fairly, in all material respects, the financial position of Dividend Income Portfolio as of October 31, 2008, the results of its operations for the year then ended, the changes in its net assets for each of the two years in the period then ended, and the supplementary data for each of the two years in the period then ended and the period from the start of business, March 24, 2006 to October 31, 2006, in conformity with accounting principles generally accepted in the United States of America.
DELOITTE & TOUCHE LLP
Boston, Massachusetts
December 15, 2008
26
Eaton Vance Dividend Income Fund
Dividend Income Portfolio
SPECIAL MEETING OF SHAREHOLDERS (Unaudited)
Eaton Vance Dividend Income Fund
The Fund held a Special Meeting of Shareholders on November 14, 2008 to elect Trustees. The results of the vote were as follows:
| | | Number of Shares | |
| Nominee for Trustee | | For | | Withheld | |
| Benjamin C. Esty | | | 31,891,426 | | | | 273,494 | | |
| Thomas E. Faust Jr. | | | 31,877,723 | | | | 287,197 | | |
| Allen R. Freedman | | | 31,886,016 | | | | 278,904 | | |
| William H. Park | | | 31,890,980 | | | | 273,940 | | |
| Ronald A. Pearlman | | | 31,883,382 | | | | 281,538 | | |
| Helen Frame Peters | | | 31,875,646 | | | | 289,274 | | |
| Heidi L. Steiger | | | 31,889,941 | | | | 274,979 | | |
| Lynn A. Stout | | | 31,887,979 | | | | 276,941 | | |
| Ralph F. Verni | | | 31,891,740 | | | | 273,180 | | |
Each nominee was also elected a Trustee of the Portfolio.
Dividend Income Portfolio
The Portfolio held a Special Meeting of Interestholders on November 14, 2008 to elect Trustees. The results of the vote were as follows:
| | | Interest in the Portfolio | |
| Nominee for Trustee | | For | | Withheld | |
| Benjamin C. Esty | | | 92 | % | | | 1 | % | |
| Thomas E. Faust Jr. | | | 92 | % | | | 1 | % | |
| Allen R. Freedman | | | 92 | % | | | 1 | % | |
| William H. Park | | | 92 | % | | | 1 | % | |
| Ronald A. Pearlman | | | 92 | % | | | 1 | % | |
| Helen Frame Peters | | | 92 | % | | | 1 | % | |
| Heidi L. Steiger | | | 92 | % | | | 1 | % | |
| Lynn A. Stout | | | 92 | % | | | 1 | % | |
| Ralph F. Verni | | | 92 | % | | | 1 | % | |
Results are rounded to the nearest whole number.
27
Eaton Vance Dividend Income Fund
BOARD OF TRUSTEES' ANNUAL APPROVAL OF THE INVESTMENT ADVISORY AGREEMENT
Overview of the Contract Review Process
The Investment Company Act of 1940, as amended (the "1940 Act"), provides, in substance, that each investment advisory agreement between a fund and its investment adviser will continue in effect from year to year only if its continuance is approved at least annually by the fund's board of trustees, including by a vote of a majority of the trustees who are not "interested persons" of the fund ("Independent Trustees"), cast in person at a meeting called for the purpose of considering such approval.
At a meeting of the Boards of Trustees (each a "Board") of the Eaton Vance group of mutual funds (the "Eaton Vance Funds") held on April 21, 2008, the Board, including a majority of the Independent Trustees, voted to approve continuation of existing advisory and sub-advisory agreements for the Eaton Vance Funds for an additional one-year period. In voting its approval, the Board relied upon the affirmative recommendation of the Contract Review Committee of the Board (formerly the Special Committee), which is a committee comprised exclusively of Independent Trustees. Prior to making its recommendation, the Contract Review Committee reviewed information furnished for a series of meetings of the Contract Review Committee held in February, March and April 2008. Such information included, among other things, the following:
Information about Fees, Performance and Expenses
• An independent report comparing the advisory and related fees paid by each fund with fees paid by comparable funds;
• An independent report comparing each fund's total expense ratio and its components to comparable funds;
• An independent report comparing the investment performance of each fund to the investment performance of comparable funds over various time periods;
• Data regarding investment performance in comparison to relevant peer groups of funds and appropriate indices;
• Comparative information concerning fees charged by each adviser for managing other mutual funds and institutional accounts using investment strategies and techniques similar to those used in managing the fund;
• Profitability analyses for each adviser with respect to each fund;
Information about Portfolio Management
• Descriptions of the investment management services provided to each fund, including the investment strategies and processes employed, and any changes in portfolio management processes and personnel;
• Information concerning the allocation of brokerage and the benefits received by each adviser as a result of brokerage allocation, including information concerning the acquisition of research through "soft dollar" benefits received in connection with the funds' brokerage, and the implementation of a soft dollar reimbursement program established with respect to the funds;
• Data relating to portfolio turnover rates of each fund;
• The procedures and processes used to determine the fair value of fund assets and actions taken to monitor and test the effectiveness of such procedures and processes;
Information about each Adviser
• Reports detailing the financial results and condition of each adviser;
• Descriptions of the qualifications, education and experience of the individual investment professionals whose responsibilities include portfolio management and investment research for the funds, and information relating to their compensation and responsibilities with respect to managing other mutual funds and investment accounts;
• Copies of the Codes of Ethics of each adviser and its affiliates, together with information relating to compliance with and the administration of such codes;
• Copies of or descriptions of each adviser's proxy voting policies and procedures;
• Information concerning the resources devoted to compliance efforts undertaken by each adviser and its affiliates on behalf of the funds (including descriptions of various compliance programs) and their record of compliance with investment policies and restrictions, including policies with respect to market-timing, late trading and selective portfolio disclosure, and with policies on personal securities transactions;
• Descriptions of the business continuity and disaster recovery plans of each adviser and its affiliates;
Other Relevant Information
• Information concerning the nature, cost and character of the administrative and other non-investment management services provided by Eaton Vance Management and its affiliates;
• Information concerning management of the relationship with the custodian, subcustodians and fund accountants by each adviser or the funds' administrator; and
• The terms of each advisory agreement.
28
Eaton Vance Dividend Income Fund
BOARD OF TRUSTEES' ANNUAL APPROVAL OF THE INVESTMENT ADVISORY AGREEMENT CONT'D
In addition to the information identified above, the Contract Review Committee considered information provided from time to time by each adviser throughout the year at meetings of the Board and its committees. Over the course of the twelve-month period ended April 30, 2008, the Board met eleven times and the Contract Review Committee, the Audit Committee and the Governance Committee, each of which is a Committee comprised solely of Independent Trustees, met twelve, seven and five times, respectively. At such meetings, the Trustees received, among other things, presentations by the portfolio managers and other investment professionals of each adviser relating to the investment performance of each fund and the investment strategies used in pursuing the fund's investment objective. The Portfolio Management Committee and the Compliance Reports and Regulatory Matters Committee are newly established and did not meet during the twelve- month period ended April 30, 2008.
For funds that invest through one or more underlying portfolios, the Board considered similar information about the portfolio(s) when considering the approval of advisory agreements. In addition, in cases where the fund's investment adviser has engaged a sub-adviser, the Board considered similar information about the sub-adviser when considering the approval of any sub-advisory agreement.
The Contract Review Committee was assisted throughout the contract review process by Goodwin Procter LLP, legal counsel for the Independent Trustees. The members of the Contract Review Committee relied upon the advice of such counsel and their own business judgment in determining the material factors to be considered in evaluating each advisory and sub-advisory agreement and the weight to be given to each such factor. The conclusions reached with respect to each advisory and sub-advisory agreement were based on a comprehensive evaluation of all the information provided and not any single factor. Moreover, each member of the Contract Review Committee may have placed varying emphasis on particular factors in reaching conclusions with respect to each advisory and sub-advisory agreement.
Results of the Process
Based on its consideration of the foregoing, and such other information as it deemed relevant, including the factors and conclusions described below, the Contract Review Committee concluded that the continuance of the investment advisory agreement of Dividend Income Portfolio (the "Portfolio"), the underlying Portfolio in which Eaton Vance Dividend Income Fund (the "Fund") invests, with Boston Management and Research (the "Adviser"), including the fee structure, is in the interests of shareholders and, therefore, the Contract Review Committee recommended to the Board approval of the agreement. The Board accepted the recommendation of the Contract Review Committee as well as the factors considered and conclusions reached by the Contract Review Committee with respect to the agreement. Accordingly, the Board, including a majority of the Independent Trustees, voted to approve continuation of the investment advisory agreement for the Portfolio.
Nature, Extent and Quality of Services
In considering whether to approve the investment advisory agreement of the Portfolio, the Board evaluated the nature, extent and quality of services provided to the Portfolio by the Adviser.
The Board also considered the Adviser's management capabilities and investment process with respect to the types of investments held by the Portfolio, including the education, experience and number of its investment professionals and other personnel who provide portfolio management, investment research, and similar services to the Portfolio. The Board also took into account the resources dedicated to portfolio management and other services, including the compensation paid to recruit and retain investment personnel, and the time and attention devoted to the Portfolio by senior management. The Board reviewed the compliance programs of the Adviser and its affiliates. Among other matters, the Board considered compliance and reporting matters relating to personal trading by investment personnel, selective disclosure of portfolio holdings, late trading, frequent trading, portfolio valuation, business continuity and the allocation of i nvestment opportunities. The Board also evaluated the responses of the Adviser and its affiliates to requests from regulatory authorities such as the Securities and Exchange Commission.
The Board considered shareholder and other administrative services provided or managed by Eaton Vance Management and its affiliates, including transfer agency and accounting services. The Board evaluated the benefits to shareholders of investing in a fund that is a part of a large family of funds, including the ability, in many cases, to exchange an investment among different funds without incurring additional sales charges.
After consideration of the foregoing factors, among others, the Board concluded that the nature, extent and quality of services provided by the Adviser, taken as a whole, are appropriate and consistent with the terms of the investment advisory agreement.
29
Eaton Vance Dividend Income Fund
BOARD OF TRUSTEES' ANNUAL APPROVAL OF THE INVESTMENT ADVISORY AGREEMENT CONT'D
Fund Performance
The Board compared the Fund's investment performance to a relevant universe of similarly managed funds identified by an independent data provider and appropriate benchmark indices. The Board reviewed comparative performance data for the one-year period ended September 30, 2007 for the Fund. The Board concluded that the Fund's performance was satisfactory.
Management Fees and Expenses
The Board reviewed contractual investment advisory fee rates, including any administrative fee rates, payable by the Portfolio and by the Fund (referred to collectively as "management fees"). As part of its review, the Board considered the Portfolio's management fees, including administrative fees, and the Fund's total expense ratio for the year ended September 30, 2007, as compared to a group of similarly managed funds selected by an independent data provider. The Board considered the fact that the Adviser had waived fees and/or paid expenses of the Fund.
After reviewing the foregoing information, and in light of the nature, extent and quality of the services provided by the Adviser, the Board concluded that the management fees charged for advisory and related services and the Fund's total expense ratio are reasonable.
Profitability
The Board reviewed the level of profits realized by the Adviser and its affiliates in providing investment advisory and administrative services to the Fund and the Portfolio and all Eaton Vance Funds as a group. The Board considered the level of profits realized without regard to revenue sharing or other payments by the Adviser and its affiliates to third parties in respect of distribution services. The Board also considered other direct or indirect benefits received by the Adviser and its affiliates in connection with its relationship with the Portfolio, including the benefits of research services that may be available to the Adviser as a result of securities transactions effected for the Portfolio and other investment advisory clients.
The Board concluded that, in light of the foregoing factors and the nature, extent and quality of the services rendered, the profits realized by the Adviser and its affiliates are reasonable.
Economies of Scale
In reviewing management fees and profitability, the Board also considered the extent to which the Adviser and its affiliates, on the one hand, and the Fund, on the other hand, can expect to realize benefits from economies of scale as the assets of the Fund increase. The Board acknowledged the difficulty in accurately measuring the benefits resulting from the economies of scale with respect to the management of any specific fund or group of funds. The Board reviewed data summarizing the increases and decreases in the assets of the Fund and of all Eaton Vance Funds as a group over various time periods, and evaluated the extent to which the total expense ratio of the Fund and the profitability of the Adviser and its affiliates may have been affected by such increases or decreases. Based upon the foregoing, the Board concluded that the benefits from economies of scale are currently being shared equitably by the Adviser and its affil iates and the Fund. The Board also concluded that, assuming reasonably foreseeable increases in the assets of the Fund, the structure of the Portfolio advisory fee, which include breakpoints at several asset levels, can be expected to cause the Adviser and its affiliates and the Fund to continue to share such benefits equitably.
30
Eaton Vance Dividend Income Fund
MANAGEMENT AND ORGANIZATION
Fund Management. The Trustees of Eaton Vance Mutual Funds Trust (the Trust) and Dividend Income Portfolio (the Portfolio) are responsible for the overall management and supervision of the Trust's and Portfolio's affairs. The Trustees and officers of the Trust and the Portfolio are listed below. Except as indicated, each individual has held the office shown or other offices in the same company for the last five years. Trustees and officers of the Trust and the Portfolio hold indefinite terms of office. The "noninterested Trustees" consist of those Trustees who are not "interested persons" of the Trust and the Portfolio, as that term is defined under the 1940 Act. The business address of each Trustee and officer is The Eaton Vance Building, 255 State Street, Boston, Massachusetts 02109. As used below, "EVC" refers to Eaton Vance Corp., "EV" refers to Eaton Van ce, Inc., "EVM" refers to Eaton Vance Management, "BMR" refers to Boston Management and Research, "Parametric" refers to Parametric Portfolio Associates and "EVD" refers to Eaton Vance Distributors, Inc. EVC and EV are the corporate parent and trustee, respectively, of EVM and BMR. EVD is the Fund's principal underwriter, the Portfolio's placement agent and a wholly-owned subsidiary of EVC. Each officer affiliated with Eaton Vance may hold a position with other Eaton Vance affiliates that is comparable to his or her position with EVM listed below.
Name and
Date of Birth | | Position(s)
with the
Trust and
the Portfolio | | Term of
Office and
Length of
Service | | Principal Occupation(s)
During Past Five Years | | Number of Portfolios
in Fund Complex
Overseen By
Trustee(1) | | Other Directorships Held | |
| Interested Trustee | | | | | | | | | | | | | |
|
| Thomas E. Faust Jr. 5/31/58 | | Trustee and President of the Trust | | Trustee since 2007 and President of the Trust since 2002 | | Chairman, Chief Executive Officer and President of EVC, Director and President of EV, Chief Executive Officer and President of EVM and BMR, and Director of EVD. Trustee and/or Officer of 173 registered investment companies and 4 private companies managed by EVM or BMR. Mr. Faust is an interested person because of his positions with EVM, BMR, EVD, EVC and EV, which are affiliates of the Trust and Portfolio. | | | 173 | | | Director of EVC | |
|
| Noninterested Trustees | | | | | | | | | | | | | |
|
| Benjamin C. Esty 1/2/63 | | Trustee | | Of the Trust since 2005 and of the Portfolio since 2006 | | Roy and Elizabeth Simmons Professor of Business Administration, Harvard University Graduate School of Business Administration. | | | 173 | | | None | |
|
| Allen R. Freedman 4/3/40 | | Trustee | | Since 2007 | | Former Chairman (2002-2004) and a Director (1983-2004) of Systems & Computer Technology Corp. (provider of software to higher education). Formerly, a Director of Loring Ward International (fund distributor) (2005-2007). Formerly, Chairman and a Director of Indus International Inc. (provider of enterprise management software to the power generating industry) (2005-2007). | | | 173 | | | Director of Assurant, Inc. and Stonemor Partners L.P. (owner and operator of cemeteries) | |
|
| William H. Park 9/19/47 | | Trustee | | Of the Trust since 2003 and of the Portfolio since 2006 | | Vice Chairman, Commercial Industrial Finance Corp. (specialty finance company) (since 2006). Formerly, President and Chief Executive Officer, Prizm Capital Management, LLC (investment management firm) (2002-2005). | | | 173 | | | None | |
|
| Ronald A. Pearlman 7/10/40 | | Trustee | | Of the Trust since 2003 and of the Portfolio since 2006 | | Professor of Law, Georgetown University Law Center. | | | 173 | | | None | |
|
| Helen Frame Peters 3/22/48 | | Trustee | | Since 2008 | | Professor of Finance, Carroll School of Management, Boston College (since 2003). Adjunct Professor of Finance, Peking University, Beijing, China (since 2005). Formerly, Dean, Carroll School of Management Boston College (2000-2003). | | | 173 | | | Director of Federal Home Loan Bank of Boston (a bank for banks) and BJ's Wholesale clubs (wholesale club retailer); Trustee of SPDR Index Shares Funds and SPDR Series Trust (exchange traded funds) | |
|
31
Eaton Vance Dividend Income Fund
MANAGEMENT AND ORGANIZATION CONT'D
Name and
Date of Birth | | Position(s)
with the
Trust and
the Portfolio | | Term of
Office and
Length of
Service | | Principal Occupation(s)
During Past Five Years | | Number of Portfolios
in Fund Complex
Overseen By
Trustee(1) | | Other Directorships Held | |
| Noninterested Trustees (continued) | | | | | | | | | | | | | |
|
| Heidi L. Steiger 7/8/53 | | Trustee | | Since 2007 | | Managing Partner, Topridge Associates LLC (global wealth management firm) (since 2008); Senior Advisor (since 2008), President (2005-2008), Lowenhaupt Global Advisors, LLC (global wealth management firm). Formerly, President and Contributing Editor, Worth Magazine (2004-2005). Formerly, Executive Vice President and Global Head of Private Asset Management (and various other positions), Neuberger Berman (investment firm) (1986-2004). | | | 173 | | | Director of Nuclear Electric Insurance Ltd. (nuclear insurance provider) and Aviva USA (insurance provider) | |
|
| Lynn A. Stout 9/14/57 | | Trustee | | Of the Trust since 1998 and of the Portfolio since 2006 | | Paul Hastings Professor of Corporate and Securities Law (since 2006) and Professor of Law (2001-2006), University of California at Los Angeles School of Law. | | | 173 | | | None | |
|
| Ralph F. Verni 1/26/43 | | Chairman of the Board and Trustee | | Chairman of the Board since 2007; Trustee of the Trust since 2005 and of the Portfolio since 2006 | | Consultant and private investor. | | | 173 | | | None | |
|
| Principal Officers who are not Trustees | | | | | | | | | | | | | |
|
Name and
Date of Birth | | Position(s)
with the
Trust and
the Portfolio | | Term of
Office and
Length of
Service | | Principal Occupation(s)
During Past Five Years | |
| William H. Ahern, Jr. 7/28/59 | | Vice President of the Trust | | Since 1995 | | Vice President of EVM and BMR. Officer of 75 registered investment companies managed by EVM or BMR. | |
|
| John R. Baur 2/10/70 | | Vice President of the Trust | | Since 2007 | | Vice President of EVM and BMR. Previously, attended Johnson Graduate School of Management, Cornell University (2002-2005), and prior thereto he was an Account Team Representative in Singapore for Applied Materials Inc. Officer of 33 registered investment companies managed by EVM or BMR. | |
|
| Michael A. Cirami 12/24/75 | | Vice President of the Trust | | Since 2007 | | Vice President of EVM and BMR. Previously, attended the University of Rochester William E. Simon Graduate School of Business Administration (2001-2003), and prior thereto he was a Team Leader for the Institutional Services Group for State Street Bank in Luxembourg. Officer of 33 registered investment companies managed by EVM or BMR. | |
|
| Cynthia J. Clemson 3/2/63 | | Vice President of the Trust | | Since 2005 | | Vice President of EVM and BMR. Officer of 90 registered investment companies managed by EVM or BMR. | |
|
| Charles B. Gaffney 12/4/72 | | Vice President of the Trust | | Since 2007 | | Vice President of EVM and BMR. Previously, Sector Portfolio Manager and Senior Equity Analyst of Brown Brothers Harriman (1997-2003). Officer of 30 registered investment companies managed by EVM or BMR. | |
|
| Christine M. Johnston 11/9/72 | | Vice President of the Trust | | Since 2007 | | Vice President of EVM and BMR. Officer of 35 registered investment companies managed by EVM or BMR. | |
|
| Aamer Khan 6/7/60 | | Vice President | | Vice President of the Trust since 2005 and of the Portfolio since 2006 | | Vice President of EVM and BMR. Officer of 33 registered investment companies managed by EVM or BMR. | |
|
| Thomas H. Luster 4/8/62 | | Vice President of the Trust | | Since 2006 | | Vice President of EVM and BMR. Officer of 51 registered investment companies managed by EVM or BMR. | |
|
32
Eaton Vance Dividend Income Fund
MANAGEMENT AND ORGANIZATION CONT'D
Name and
Date of Birth | | Position(s)
with the
Trust and
the Portfolio | | Term of
Office and
Length of
Service | | Principal Occupation(s)
During Past Five Years | |
| Principal Officers who are not Trustees (continued) | | | | | | | |
|
| Robert B. MacIntosh 1/22/57 | | Vice President of the Trust | | Since 1998 | | Vice President of EVM and BMR. Officer of 90 registered investment companies managed by EVM or BMR. | |
|
| Duncan W. Richardson 10/26/57 | | Vice President of the Trust and President of the Portfolio | | Vice President of the Trust since 2001 and President of the Portfolio since 2006 | | Executive Vice President and Chief Equity Investment Officer of EVC, EVM and BMR. Officer 81 registered investment companies managed by EVM or BMR. | |
|
| Judith A. Saryan 8/21/54 | | Vice President | | Vice President of the Trust since 2003 and of the Portfolio since 2006 | | Vice President of EVM and BMR. Officer of 55 registered investment companies managed by EVM or BMR. | |
|
| Susan Schiff 3/13/61 | | Vice President of the Trust | | Since 2002 | | Vice President of EVM and BMR. Officer of 36 registered investment companies managed by EVM or BMR. | |
|
| Thomas Seto 9/27/62 | | Vice President of the Trust | | Since 2007 | | Vice President and Director of Portfolio Management of Parametric. Officer of 31 registered investment companies managed by EVM or BMR. | |
|
| David M. Stein 5/4/51 | | Vice President of the Trust | | Since 2007 | | Managing Director and Chief Investment Officer of Parametric. Officer of 31 registered investment companies managed by EVM or BMR. | |
|
| Mark S. Venezia 5/23/49 | | Vice President of the Trust | | Since 2007 | | Vice President of EVM and BMR. Officer of 36 registered investment companies managed by EVM or BMR. | |
|
| Adam A. Weigold 3/22/75 | | Vice President of the Trust | | Since 2007 | | Vice President of EVM and BMR. Officer of 71 registered investment companies managed by EVM or BMR. | |
|
| Barbara E. Campbell 6/19/57 | | Treasurer | | Of the Trust since 2005 and of the Portfolio since 2008(2) | | Vice President of EVM and BMR. Officer of 173 registered investment companies managed by EVM or BMR. | |
|
| Maureen A. Gemma 5/24/60 | | Secretary and Chief Legal Officer | | Secretary since 2007 and Chief Legal Officer
since 2008 | | Vice President of EVM and BMR. Officer of 173 registered investment companies managed by EVM or BMR. | |
|
| Paul M. O'Neil 7/11/53 | | Chief
Compliance Officer | | Of the Trust since 2004 and of the Portfolio since 2006 | | Vice President of EVM and BMR. Officer of 173 registered investment companies managed by EVM or BMR. | |
|
(1) Includes both master and feeder funds in a master-feeder structure.
(2) Prior to 2008, Ms. Campbell served as Assistant Treasurer of the Portfolio since 2006.
The SAI for the Fund includes additional information about the Trustees and officers of the Fund and the Portfolio and can be obtained without charge on Eaton Vance's website at www.eatonvance.com or by calling 1-800-262-1122.
33
This Page Intentionally Left Blank
This Page Intentionally Left Blank
This Page Intentionally Left Blank
Investment Adviser of Dividend Income Portfolio
Boston Management and Research
The Eaton Vance Building
255 State Street
Boston, MA 02109
Administrator of Eaton Vance Dividend Income Fund
Eaton Vance Management
The Eaton Vance Building
255 State Street
Boston, MA 02109
Principal Underwriter
Eaton Vance Distributors, Inc.
The Eaton Vance Building
255 State Street
Boston, MA 02109
(617) 482-8260
Custodian
State Street Bank and Trust Company
200 Clarendon Street
Boston, MA 02116
Transfer Agent
PNC Global Investing Services
Attn: Eaton Vance Funds
P.O. Box 9653
Providence, RI 02940-9653
(800) 262-1122
Independent Registered Public Accounting Firm
Deloitte & Touche LLP
200 Berkeley Street
Boston, MA 02116-5022
Eaton Vance Dividend Income Fund
The Eaton Vance Building
255 State Street
Boston, MA 02109
This report must be preceded or accompanied by a current prospectus. Before investing, investors should consider carefully the Fund's investment objective(s), risks, and charges and expenses. The Fund's current prospectus contains this and other information about the Fund and is available through your financial advisor. Please read the prospectus carefully before you invest or send money. For further information please call 1-800-262-1122.
2634-12/08 DIVISRC

Annual Report October 31, 2008


EATON VANCE EMERGING
MARKETS
LOCAL
INCOME
FUND
IMPORTANT NOTICES REGARDING PRIVACY,
DELIVERY OF SHAREHOLDER DOCUMENTS,
PORTFOLIO HOLDINGS, AND PROXY VOTING
Privacy. The Eaton Vance organization is committed to ensuring your financial privacy. Each of the financial institutions identified below has in effect the following policy ("Privacy Policy") with respect to nonpublic personal information about its customers:
• Only such information received from you, through application forms or otherwise, and information about your Eaton Vance fund transactions will be collected. This may include information such as name, address, social security number, tax status, account balances and transactions.
• None of such information about you (or former customers) will be disclosed to anyone, except as permitted by law (which includes disclosure to employees necessary to service your account). In the normal course of servicing a customer's account, Eaton Vance may share information with unaffiliated third parties that perform various required services such as transfer agents, custodians and broker/dealers.
• Policies and procedures (including physical, electronic and procedural safeguards) are in place that are designed to protect the confidentiality of such information.
• We reserve the right to change our Privacy Policy at any time upon proper notification to you. Customers may want to review our Policy periodically for changes by accessing the link on our homepage: www.eatonvance.com.
Our pledge of privacy applies to the following entities within the Eaton Vance organization: the Eaton Vance Family of Funds, Eaton Vance Management, Eaton Vance Investment Counsel, Boston Management and Research, and Eaton Vance Distributors, Inc.
In addition, our Privacy Policy only applies to those Eaton Vance customers who are individuals and who have a direct relationship with us. If a customer's account (i.e., fund shares) is held in the name of a third-party financial adviser/broker-dealer, it is likely that only such adviser's privacy policies apply to the customer. This notice supersedes all previously issued privacy disclosures.
For more information about Eaton Vance's Privacy Policy, please call 1-800-262-1122.
Delivery of Shareholder Documents. The Securities and Exchange Commission (the "SEC") permits funds to deliver only one copy of shareholder documents, including prospectuses, proxy statements and shareholder reports, to fund investors with multiple accounts at the same residential or post office box address. This practice is often called "householding" and it helps eliminate duplicate mailings to shareholders.
Eaton Vance, or your financial adviser, may household the mailing of your documents indefinitely unless you instruct Eaton Vance, or your financial adviser, otherwise.
If you would prefer that your Eaton Vance documents not be householded, please contact Eaton Vance at 1-800-262-1122, or contact your financial adviser.
Your instructions that householding not apply to delivery of your Eaton Vance documents will be effective within 30 days of receipt by Eaton Vance or your financial adviser.
Portfolio Holdings. Each Eaton Vance Fund and its underlying Portfolio (if applicable) will file a schedule of its portfolio holdings on Form N-Q with the SEC for the first and third quarters of each fiscal year. The Form N-Q will be available on the Eaton Vance website www.eatonvance.com, by calling Eaton Vance at 1-800-262-1122 or in the EDGAR database on the SEC's website at www.sec.gov. Form N-Q may also be reviewed and copied at the SEC's public reference room in Washington, D.C. (call 1-800-732-0330 for information on the operation of the public reference room).
Proxy Voting. From time to time, funds are required to vote proxies related to the securities held by the funds. The Eaton Vance Funds or their underlying Portfolios (if applicable) vote proxies according to a set of policies and procedures approved by the Funds' and Portfolios' Boards. You may obtain a description of these policies and procedures and information on how the Funds or Portfolios voted proxies relating to portfolio securities during the most recent 12 month period ended June 30, without charge, upon request, by calling 1-800-262-1122. This description is also available on the SEC's website at www.sec.gov.
Eaton Vance Emerging Markets Local Income Fund as of October 31, 2008
MANAGEMENT’S DISCUSSION OF FUND PERFORMANCE

Mark S. Venezia, CFA
Co-Portfolio Manager

John R. Baur
Co-Portfolio Manager

Michael A. Cirami, CFA
Co-Portfolio Manager
Economic and Market Conditions
· The credit crisis that began in mid-2007 resulted in unprecedented events in the U.S. financial markets in 2008. Within a two-week period in September 2008, investors saw the U.S. government’s bailout of the two largest government sponsored enterprises, Fannie Mae and Freddie Mac, the bankruptcy of Lehman Brothers Holding, Inc., and the subsequent bailout of one of the world’s largest insurers, amidst other government intervention and uncertainty surrounding the future of many of the largest U.S. financial institutions. As the crisis intensified in the last two months of the Fund’s fiscal year, the global fixed income and currency markets reacted with a flight to quality. The U.S. dollar strengthened against the Euro and many emerging market currencies, and U.S. interest rates fell as foreign investors headed for the relative safety of U.S. Treasury bonds. For the year ended October 31, 2008, 2-year and 5-year U.S. Treasury yields fell 240 (2.40%) and 134 basis points (1.34%), respectively. The Federal Funds rate started the year at 4.5% on October 31, 2007 and was cut to 1.0% by October 31, 2008. Many foreign central banks also cut their benchmark short-term interest rates in response to the global financial crisis, including the European Central Bank (ECB), Bank of Japan, Bank of England, and those of certain emerging market countries.
Management Discussion
· The Fund(1) seeks to provide total return by primarily investing in securities denominated in currencies of emerging market countries, fixed-income instruments issued by emerging market entities or sovereigns and/or derivative instruments denominated in or based on the currencies, interest rates or issues of, emerging market countries.
· The Fund outperformed its benchmark, the JP Morgan Government Bond Index — Emerging Market Global Diversified (Unhedged), during the period.(3) The Fund’s relative outperformance was primarily driven by its performance in South Africa, the Asian region, and Eastern European positions in Hungary and Turkey. The Fund’s performance was negatively impacted by performance of positions in Iceland and Latin America.
· In South Africa, the Fund’s underweight currency position outperformed the benchmark’s exposure to sovereign bonds. Similarly, the Fund’s combination of derivatives positions and sovereign bond exposures outperformed the benchmark’s sovereign bond exposure in Hungary and Turkey as well.
· In Asia, the Fund outperformed its benchmark in Indonesia, South Korea, Malaysia, and Thailand. A non-benchmark position in the Philippines was also positive for performance. In Indonesia, the Fund’s slight underweight position was positive for performance as the Indonesian currency depreciated in response to government-introduced restrictions on foreign exchange purchases. The Fund’s outperformance of the benchmark in Malaysia and Thailand was the result of an underweight position in sovereign bonds, in favor of currency exposure. The Fund also benefited from long currency exposure in the Philippines and short currency exposure in South Korea. The Philippine Peso appreciated amid remittances from foreign workers and increasing foreign
Eaton Vance Emerging Markets Local income Fund
Total Return Performance 10/31/07 — 10/31/08
Class A(2) | | -13.38 | % |
JP Morgan Government Bond Index – Emerging Market Global Diversified (Unhedged) (3) | | -15.16 | % |
Please refer to page 3 for additional performance information.
(1) The Fund currently invests in a separate registered investment company, Emerging Markets Local Income Portfolio (the Portfolio), with the same objective and policies as the Fund. References to investments are to the Portfolio’s holdings. (2) These returns do not include the 4.75% maximum sales charge for the Fund’s Class A shares. If sales charges were deducted, the returns would be lower. (3) It is not possible to invest directly in an Index. The Index’s total return does not reflect the commissions or expenses that would have been incurred if an investor individually purchased or sold the securities represented in the Index.
Past performance is no guarantee of future results. Returns are historical and are calculated by determining the percentage change in net asset value or offering price (as applicable) with all distributions reinvested. Investment return and principal value will fluctuate so that shares, when redeemed, may be worth more or less than their original cost. Performance is for the stated time period only; due to market volatility, the Fund’s current performance may be lower or higher than the quoted return. Absent an allocation of expenses to the administrator, the returns would be lower. For performance as of the most recent month end, please refer to www.eatonvance.com.
Fund shares are not insured by the FDIC and are not deposits or other obligations of, or guaranteed by, any depository institution. Shares are subject to investment risks, including possible loss of principal invested.
1
portfolio investment in Philippine equities. In South Korea, the Won depreciated sharply amid government missteps on the economy, a widening current account deficit, and repatriation of dividends by foreign investors.
· The performance of the Fund’s positions in Brazil and Mexico detracted slightly from the outperformance as the currencies of both countries depreciated mainly in response to the global financial crisis. In Iceland, the government seized the nation’s banks in October, as the banks collapsed under the weight of a falling currency and large debts abroad. The Fund’s Icelandic positions also detracted from the Fund’s outperformance of its benchmark.
· The Fund’s duration increased during the year, to 4.25 years at October 31, 2008 from 2.0 years at October 31, 2007. Duration is a measure of the sensitivity of a fund or a fixed-income security to changes in interest rates. A shorter duration instrument normally has less exposure to interest rate risk than longer duration instruments.
Portfolio Composition
Securities Holdings (excludes derivatives)(1)
By total net assets
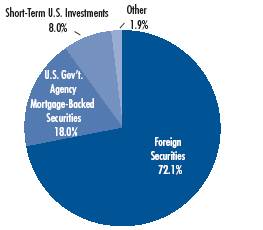
(1) Securities Holdings reflect the Portfolio’s securities positions as of 10/31/08. Securities Holdings do not reflect derivatives positions. For International and Emerging Market exposures, please refer to the Regional Currency Exposure table.
Regional Currency Exposures (including derivatives)(2),(3)
By total net assets / Exceeds 100% due to use of derivatives
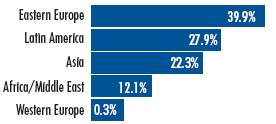
(2) Regional Currency Exposures reflect the Portfolio’s investments as of 10/31/08. Total exposures may exceed 100% due to implicit leverage created by derivatives.
Currency Positions(3)
By total net assets
Mexico | | 11.9 | % |
Poland | | 11.5 | |
Hungary | | 10.5 | |
Brazil | | 10.1 | |
Malaysia | | 9.2 | |
Turkey | | 9.0 | |
South Africa | | 8.5 | |
Thailand | | 6.8 | |
Indonesia | | 6.3 | |
Czech Republic | | 5.5 | |
Peru | | 2.3 | |
Chile | | 1.6 | |
Slovakia | | 1.6 | |
Russia | | 1.5 | % |
Nigeria | | 1.4 | |
Colombia | | 1.2 | |
Ghana | | 0.6 | |
Mauritius | | 0.6 | |
Uruguay | | 0.6 | |
Uganda | | 0.4 | |
Egypt | | 0.4 | |
Georgia | | 0.4 | |
United Arab Emirates | | 0.3 | |
Iceland | | 0.3 | |
Costa Rica | | 0.1 | |
(3) Currency Positions reflect the Portfolio’s investments as of 10/31/08. Currency exposures include all long foreign exchange denominated assets and all long currency derivatives. Net short positions and other foreign derivatives are excluded. Short Currency Exposures are 4.6%. Foreign Long derivatives are 54.1%. Other Foreign Short Derivatives are 2.9%. All numbers are a percentage of total net assets. Total exposures may exceed 100% due to implicit leverage created by derivatives.
The views expressed throughout this report are those of the portfolio managers and are current only through the end of the period of the report as stated on the cover. These views are subject to change at any time based upon market or other conditions, and the investment adviser disclaims any responsibility to update such views. These views may not be relied on as investment advice and, because investment decisions for a fund are based on many factors, may not be relied on as an indication of trading intent on behalf of any Eaton Vance fund. Portfolio information provided in the report may not be representative of the Portfolio’s current or future investments and may change due to active management.
2
Eaton Vance Emerging Markets Local Income Fund as of October 31, 2008
FUND PERFORMANCE
The line graph and table set forth below provide information about the Fund’s performance. The line graph compares the performance of Class A of the Fund with that of the JP Morgan Government Bond Index - Emerging Market Global Diversified (Unhedged), an unmanaged broad-based index that currently comprises the local currency, fixed rate coupon issues of 13 markets greater than 1-year in maturity. The lines on the graph represent the total returns of a hypothetical investment of $10,000 in Class A of the Fund and in the JP Morgan Government Bond Index - Emerging Market Global Diversified (Unhedged). The table includes the total returns of Class A of the Fund at net asset value and maximum public offering price. The performance presented below does not reflect the deduction of taxes, if any, that a shareholder would pay on Fund distributions or the redemption of Fund shares.
Fund Performance(1)
Share Class Symbol | | Class A
EEIAX | |
| | | |
Average Annual Total Returns (at net asset value) | | | |
One Year | | -13.38 | % |
Life of Fund† | | -3.23 | |
SEC Average Annual Total Returns (including sales charge or applicable CDSC) | | | |
One year | | -17.51 | % |
Life of Fund† | | -6.67 | |
† Inception Date — Class A: 6/27/07.
(1) Average Annual Total Returns do not include the 4.75% maximum sales charge for Class A shares. If sales charges were deducted, the returns would be lower. SEC Average Annual Total Returns for Class A reflect the maximum 4.75% sales charge.
Total Annual
Operating Expenses(2) | | Class A | |
| | | |
Gross Expense Ratio | | 1.39 | % |
Net Expense Ratio | | 1.25 | % |
(2) From the Fund’s prospectus dated 3/1/08, as supplemented. The Net Expense Ratio reflects a contractual expense limitation that continues through February 28, 2009. Thereafter, the expense limitation may be changed or terminated at any time. Without this expense limitation, performance would have been lower.
Comparison of Change in Value of a $10,000 Investment in Eaton Vance Emerging Markets Local Income Fund, Class A vs. the JP Morgan Government Bond Index – Emerging Market Global Diversified (Unhedged) (JP Morgan Index)*
June 30, 2007 — October 31, 2008
* | Source: Lipper Inc. Class A of the Fund commenced operations on 6/27/07. Index data is available as of month end only. |
| |
| It is not possible to invest directly in an Index. The Index’s total return does not reflect the expenses that would have been incurred if an investor individualy purchased or sold the securities represented in the Index. |
Past performance is no guarantee of future results. Returns are historical and are calculated by determining the percentage change in net asset value or offering price (as applicable) with all distributions reinvested. Investment return and principal value will fluctuate so that shares, when redeemed, may be worth more or less than their original cost. Performance is for the stated time period only; due to market volatility, the Fund’s current performance may be lower or higher than the quoted return. Absent an allocation of expenses to the administrator, the returns would be lower. For performance as of the most recent month end, please refer to www.eatonvance.com.
3
Eaton Vance Emerging Markets Local Income Fund as of October 31, 2008
FUND EXPENSES
Example: As a shareholder of the Fund, you incur two types of costs: (1) transaction costs, including sales charges (loads) on purchases and redemption fees (if applicable); and (2) ongoing costs, including management fees; distribution or service fees; and other Fund expenses. This Example is intended to help you understand your ongoing costs (in dollars) of investing in the Fund and to compare these costs with the ongoing costs of investing in other mutual funds. The Example is based on an investment of $1,000 invested at the beginning of the period and held for the entire period (May 1, 2008 – October 31, 2008).
Actual Expenses: The first section of the table below provides information about actual account values and actual expenses. You may use the information in this section, together with the amount you invested, to estimate the expenses that you paid over the period. Simply divide your account value by $1,000 (for example, an $8,600 account value divided by $1,000 = 8.6), then multiply the result by the number in the first section under the heading entitled "Expenses Paid During Period" to estimate the expenses you paid on your account during this period.
Hypothetical Example for Comparison Purposes: The second section of the table below provides information about hypothetical account values and hypothetical expenses based on the actual Fund expense ratio and an assumed rate of return of 5% per year (before expenses), which is not the actual return of the Fund. The hypothetical account values and expenses may not be used to estimate the actual ending account balance or expenses you paid for the period. You may use this information to compare the ongoing costs of investing in your Fund and other funds. To do so, compare this 5% hypothetical example with the 5% hypothetical examples that appear in the shareholder reports of the other funds.
Please note that the expenses shown in the table are meant to highlight your ongoing costs only and do not reflect any transactional costs, such as sales charges (loads) or redemption fees (if applicable). Therefore, the second section of the table is useful in comparing ongoing costs only, and will not help you determine the relative total costs of owning different funds. In addition, if these transactional costs were included, your costs would have been higher.
Eaton Vance Emerging Markets Local Income Fund
| | | Beginning Account Value
(5/1/08) | | Ending Account Value
(10/31/08) | | Expenses Paid During Period*
(5/1/08 – 10/31/08) | |
| Actual | |
| Class A | | $ | 1,000.00 | | | $ | 827.70 | | | $ | 5.74 | ** | |
| Hypothetical | |
| (5% return per year before expenses) | |
| Class A | | $ | 1,000.00 | | | $ | 1,018.90 | | | $ | 6.34 | ** | |
* Expenses are equal to the Fund's annualized expense ratio of 1.25% for Class A shares, multiplied by the average account value over the period, multiplied by 184/366 (to reflect the one-half year period). The Example assumes that the $1,000 was invested at the net asset value per share determined at the close of business on April 30, 2008. The Example reflects the expenses of both the Fund and the Portfolio.
** Absent an allocation of expenses to the administrator, the expenses would have been higher.
4
Eaton Vance Emerging Markets Local Income Fund as of October 31, 2008
FINANCIAL STATEMENTS
Statement of Assets and Liabilities
As of October 31, 2008
| Assets | |
Investment in Emerging Markets Local Income Portfolio, at value
(identified cost, $2,264,611) | | $ | 1,592,139 | | |
| Receivable for Fund shares sold | | | 244 | | |
| Receivable from the administrator | | | 7,893 | | |
| Other assets | | | 101 | | |
| Total assets | | $ | 1,600,377 | | |
| Liabilities | |
| Payable for Fund shares redeemed | | $ | 22,416 | | |
| Dividends payable | | | 15,710 | | |
| Payable to affiliate for distribution and service fees | | | 810 | | |
| Accrued expenses | | | 32,634 | | |
| Total liabilities | | $ | 71,570 | | |
| Net Assets | | $ | 1,528,807 | | |
| Sources of Net Assets | |
| Paid-in capital | | $ | 2,589,768 | | |
Accumulated net realized loss from Portfolio (computed on the basis of
identified cost) | | | (380,406 | ) | |
| Accumulated distributions in excess of net investment income | | | (8,083 | ) | |
Net unrealized depreciation from Portfolio (computed on the basis of
identified cost) | | | (672,472 | ) | |
| Total | | $ | 1,528,807 | | |
| Class A Shares | |
| Net Assets | | $ | 1,528,807 | | |
| Shares Outstanding | | | 184,687 | | |
Net Asset Value and Redemption Price Per Share
(net assets ÷ shares of beneficial interest outstanding) | | $ | 8.28 | | |
Maximum Offering Price Per Share
(100 ÷ 95.25 of $8.28) | | $ | 8.69 | | |
| On sales of $25,000 or more, the offering price of Class A shares is reduced. | |
Statement of Operations
For the Year Ended
October 31, 2008
| Investment Income | |
| Interest allocated from Portfolio (net of foreign taxes, $1,843) | | $ | 96,204 | | |
| Expenses allocated from Portfolio | | | (15,368 | ) | |
| Net investment income from Portfolio | | $ | 80,836 | | |
| Expenses | |
| Trustees' fees and expenses | | $ | 290 | | |
| Distribution and service fees | | | 4,807 | | |
| Registration fees | | | 25,604 | | |
| Legal and accounting services | | | 20,789 | | |
| Printing and postage | | | 12,824 | | |
| Custodian fee | | | 9,420 | | |
| Transfer and dividend disbursing agent fees | | | 967 | | |
| Miscellaneous | | | 4,550 | | |
| Total expenses | | $ | 79,251 | | |
Deduct —
Allocation of expenses to the administrator | | $ | 74,465 | | |
| Total expense reductions | | $ | 74,465 | | |
| Net expenses | | $ | 4,786 | | |
| Net investment income | | $ | 76,050 | | |
Realized and Unrealized
Gain (Loss) from Portfolio | |
Net realized gain (loss) —
Investment transactions (identified cost basis) | | $ | (111,792 | ) | |
| Financial futures contracts | | | 5,461 | | |
| Swap contracts | | | (25,970 | ) | |
| Foreign currency and forward foreign currency exchange contract transactions | | | (223,052 | ) | |
| Net realized loss | | $ | (355,353 | ) | |
Change in unrealized appreciation (depreciation) —
Investments (identified cost basis) | | $ | (539,346 | ) | |
| Financial futures contracts | | | (1,504 | ) | |
| Swap contracts | | | (24,867 | ) | |
| Foreign currency and forward foreign currency exchange contracts | | | (107,154 | ) | |
| Net change in unrealized appreciation (depreciation) | | $ | (672,871 | ) | |
| Net realized and unrealized loss | | $ | (1,028,224 | ) | |
| Net decrease in net assets from operations | | $ | (952,174 | ) | |
See notes to financial statements
5
Eaton Vance Emerging Markets Local Income Fund as of October 31, 2008
FINANCIAL STATEMENTS CONT'D
Statements of Changes in Net Assets
Increase (Decrease)
in Net Assets | | Year Ended
October 31, 2008 | | Period Ended
October 31, 2007(1) | |
From operations —
Net investment income | | $ | 76,050 | | | $ | 165 | | |
Net realized gain (loss) from investment
transactions, financial futures contracts,
swap contracts, and foreign currency
and forward foreign currency exchange
contract transactions | | | (355,353 | ) | | | 326 | | |
Net change in unrealized appreciation
(depreciation) of investments, financial
futures contracts, swap contracts, and
foreign currency and forward foreign
currency exchange contracts | | | (672,871 | ) | | | 399 | | |
Net increase (decrease) in net assets
from operations | | $ | (952,174 | ) | | $ | 890 | | |
Distributions to shareholders —
From net investment income | | $ | (109,042 | ) | | $ | (252 | ) | |
| From net realized gain | | | (384 | ) | | | — | | |
| Tax return of capital | | | (36,996 | ) | | | — | | |
| Total distributions to shareholders | | $ | (146,422 | ) | | $ | (252 | ) | |
Transactions in shares of beneficial interest —
Proceeds from sale of shares | | $ | 9,023,270 | | | $ | 10,100 | | |
Net asset value of shares issued to
shareholders in payment of
distributions declared | | | 60,153 | | | | — | | |
| Cost of shares redeemed | | | (6,466,890 | ) | | | — | | |
| Capital contribution from administrator | | | — | | | | 132 | | |
Net increase in net assets from Fund
share transactions | | $ | 2,616,533 | | | $ | 10,232 | | |
| Net increase in net assets | | $ | 1,517,937 | | | $ | 10,870 | | |
| Net Assets | |
| At beginning of period | | $ | 10,870 | | | $ | — | | |
| At end of period | | $ | 1,528,807 | | | $ | 10,870 | | |
Accumulated distributions
in excess of net investment
income included in net assets | |
| At end of period | | $ | (8,083 | ) | | $ | (62 | ) | |
(1) For the period from the start of business, June 27, 2007, to October 31, 2007.
See notes to financial statements
6
Eaton Vance Emerging Markets Local Income Fund as of October 31, 2008
FINANCIAL STATEMENTS CONT'D
Financial Highlights
| | | Class A | |
| | | Year Ended
October 31, 2008 | | Period Ended
October 31, 2007(1) | |
| Net asset value — Beginning of period | | $ | 10.770 | | | $ | 10.000 | | |
| Income (loss) from operations | |
| Net investment income(2) | | $ | 0.475 | | | $ | 0.165 | | |
| Net realized and unrealized gain (loss) | | | (1.727 | ) | | | 0.732 | | |
| Total income (loss) from operations | | $ | (1.252 | ) | | $ | 0.897 | | |
| Less distributions | |
| From net investment income | | $ | (0.640 | ) | | $ | (0.259 | ) | |
| From net realized gain | | | (0.381 | ) | | | — | | |
| Tax return of capital | | | (0.217 | ) | | | — | | |
| Total distributions | | $ | (1.238 | ) | | $ | (0.259 | ) | |
| Capital contribution from administrator(2) | | $ | — | | | $ | 0.132 | | |
| Net asset value — End of period | | $ | 8.280 | | | $ | 10.770 | | |
| Total Return(3) | | | (13.38 | )% | | | 10.44 | %(8)(9) | |
| Ratios/Supplemental Data | |
| Net assets, end of period (000's omitted) | | $ | 1,529 | | | $ | 11 | | |
| Ratios (As a percentage of average daily net assets): | | | | | | | | | |
| Expenses before custodian fee reduction(4)(5)(7) | | | 1.25 | % | | | 1.25 | %(6) | |
| Net investment income(7) | | | 4.73 | % | | | 4.67 | %(6) | |
| Portfolio Turnover of the Portfolio | | | 38 | % | | | 2 | %(9) | |
(1) For the period from the start of business, June 27, 2007, to October 31, 2007.
(2) Computed using average shares outstanding.
(3) Returns are historical and are calculated by determining the percentage change in net asset value with all distributions reinvested.
(4) Includes the Fund's share of the Portfolio's allocated expenses.
(5) Excludes the effect of custody fee credits, if any, of less than 0.005%.
(6) Annualized.
(7) The administrator subsidized certain operating expenses (equal to 4.63% and 287.76% of average daily net assets for the year ended October 31, 2008 and the period from the start of business, June 27, 2007, to October 31, 2007, respectively).
(8) Absent a capital contribution by the administrator in the period from the start of business, June 27, 2007, to October 31, 2007, total return would have been 9.12%.
(9) Not annualized.
See notes to financial statements
7
Eaton Vance Emerging Markets Local Income Fund as of October 31, 2008
NOTES TO FINANCIAL STATEMENTS
1 Significant Accounting Policies
Eaton Vance Emerging Markets Local Income Fund (the Fund) is a non-diversified series of Eaton Vance Mutual Funds Trust (the Trust). The Trust is a Massachusetts business trust registered under the Investment Company Act of 1940, as amended (the 1940 Act), as an open-end management investment company. The Fund offers Class A shares, which are generally sold subject to a sales charge imposed at time of purchase. The Fund invests all of its investable assets in interests in Emerging Markets Local Income Portfolio (the Portfolio), a New York trust, having the same investment objective and policies as the Fund. The value of the Fund's investment in the Portfolio reflects the Fund's proportionate interest in the net assets of the Portfolio (2.6% at October 31, 2008). The performance of the Fund is directly affected by the performance of the Portfolio. The financial statements of the Portfolio, including the portfolio of investments, are included elsewhere in this report and should be read in conjunction with the Fund's financial statements.
The following is a summary of significant accounting policies of the Fund. The policies are in conformity with accounting principles generally accepted in the United States of America.
A Investment Valuation — Valuation of securities by the Portfolio is discussed in Note 1A of the Portfolio's Notes to Financial Statements, which are included elsewhere in this report.
B Income — The Fund's net investment income or loss consists of the Fund's pro-rata share of the net investment income or loss of the Portfolio, less all actual and accrued expenses of the Fund.
C Federal Taxes — The Fund's policy is to comply with the provisions of the Internal Revenue Code applicable to regulated investment companies and to distribute to shareholders each year substantially all of its net investment income, and all or substantially all of its net realized capital gains. Accordingly, no provision for federal income or excise tax is necessary.
At October 31, 2008, the Fund, for federal income tax purposes, had a capital loss carryforward of $353,896 which will reduce its taxable income arising from future net realized gains on investment transactions, if any, to the extent permitted by the Internal Revenue Code, and thus will reduce the amount of distributions to shareholders, which would otherwise be necessary to relieve the Fund of any liability for federal income or excise tax. Such capital loss carryforward will expire on October 31, 2016.
As of October 31, 2008, the Fund had no uncertain tax positions that would require financial statement recognition, de-recognition, or disclosure. Each of the Fund's federal tax returns filed since the start of business on June 27, 2007 to October 31, 2008 remains subject to examination by the Internal Revenue Service.
D Expenses — The majority of expenses of the Trust are directly identifiable to an individual fund. Expenses which are not readily identifiable to a specific fund are allocated taking into consideration, among other things, the nature and type of expense and the relative size of the funds.
E Expense Reduction — State Street Bank and Trust Company (SSBT) serves as custodian of the Fund. Pursuant to the custodian agreement, SSBT receives a fee reduced by credits, which are determined based on the average daily cash balance the Fund maintains with SSBT. All credit balances, if any, used to reduce the Fund's custodian fees are reported as a reduction of expenses in the Statement of Operations.
F Use of Estimates — The preparation of the financial statements in conformity with accounting principles generally accepted in the United States of America requires management to make estimates and assumptions that affect the reported amounts of assets and liabilities at the date of the financial statements and the reported amounts of income and expense during the reporting period. Actual results could differ from those estimates.
G Indemnifications — Under the Trust's organizational documents, its officers and Trustees may be indemnified against certain liabilities and expenses arising out of the performance of their duties to the Fund, and shareholders are indemnified against personal liability for the obligations of the Trust. Additionally, in the normal course of business, the Fund enters into agreements with service providers that may contain indemnification clauses. The Fund's maximum exposure under these arrangements is unknown as this would involve future claims that may be made against the Fund that have not yet occurred.
H Other — Investment transactions are accounted for on a trade date basis. Dividends to shareholders are recorded on the ex-dividend date.
2 Distributions to Shareholders
The Fund declares dividends daily to shareholders of record at the time of declaration. Distributions are generally paid monthly. Distributions of realized capital gains (reduced by available capital loss carryforwards from prior years, if any) are made at least annually. Shareholders may reinvest income and capital gain distributions in additional shares of
8
Eaton Vance Emerging Markets Local Income Fund as of October 31, 2008
NOTES TO FINANCIAL STATEMENTS CONT'D
the Fund at the net asset value as of the reinvestment date or, at the election of the shareholder, receive distributions in cash. The Fund distinguishes between distributions on a tax basis and a financial reporting basis. Accounting principles generally accepted in the United States of America require that only distributions in excess of tax basis earnings and profits be reported in the financial statements as a return of capital. Permanent differences between book and tax accounting relating to distributions are reclassified to paid-in capital. For tax purposes, distributions from short-term capital gains are considered to be from ordinary income.
The tax character of distributions declared for the year ended October 31, 2008 and the period from the start of business, June 27, 2007, to October 31, 2007 was as follows:
| | | Year ended
October 31, 2008 | | Period ended
October 31, 2007 | |
| Distributions declared from: | |
| Ordinary income | | $ | 109,272 | | | $ | 252 | | |
| Long-term capital gains | | $ | 154 | | | $ | — | | |
| Tax return of capital | | $ | 36,996 | | | $ | — | | |
During the year ended October 31, 2008, accumulated net realized loss was increased by $24,971 and accumulated distributions in excess of net investment income was decreased by $24,971 due to differences between book and tax accounting, primarily for foreign currency gain (loss), swap contracts, premium amortization and paydown gain (loss). These reclassifications had no effect on the net assets or net asset value per share of the Fund.
As of October 31, 2008, the components of distributable earnings (accumulated losses) and unrealized appreciation (depreciation) on a tax basis were as follows:
| Capital loss carryforward | | $ | (353,896 | ) | |
| Net unrealized depreciation | | $ | (691,355 | ) | |
| Other temporary differences | | $ | (15,710 | ) | |
The differences between components of distributable earnings (accumulated losses) on a tax basis and the amounts reflected in the Statement of Assets and Liabilities are primarily due to the timing of recognizing distributions to shareholders, swap contracts, foreign currency transactions, wash sales, partnership allocations and premium amortization.
3 Investment Adviser Fee and Other Transactions with Affiliates
The investment adviser fee is earned by Eaton Vance Management (EVM) as compensation for investment advisory services rendered to the Fund. The fee is computed at an annual rate of 0.65% of the Fund's average daily net assets that are not invested in other investment companies for which EVM or its affiliates serve as investment adviser or administrator ("Investable Assets") up to $1 billion and is payable monthly. On net assets of $1 billion and over that are invested in Investable Assets, the annual fee is reduced. For the year ended October 31, 2008, the Fund incurred no adviser fee on Investable Assets. To the extent the Fund's assets are invested in the Portfolio, the Fund is allocated its share of the Portfolio's adviser fee. The Portfolio has engaged Boston Management and Research (BMR), a subsidiary of EVM, to render investment advisory services. See Note 2 of the Portfolio's Notes to Financial Statements which are includ ed elsewhere in this report. EVM also serves as the administrator to the Fund, but receives no compensation. EVM has agreed to reimburse the Fund's operating expenses to the extent that they exceed 1.25% annually of the Fund's average daily net assets for Class A. This agreement may be changed or terminated after February 28, 2009. Pursuant to this agreement, EVM was allocated $74,465 of the Fund's operating expenses for the year ended October 31, 2008.
EVM serves as the sub-transfer agent of the Fund and receives from the transfer agent an aggregate fee based upon the actual expenses incurred by EVM in the performance of these services. For the year ended October 31, 2008, EVM earned $81 in sub-transfer agent fees. The Fund was informed that Eaton Vance Distributors, Inc. (EVD), an affiliate of EVM and the Fund's principal underwriter, received $1,593 as its portion of the sales charge on sales of Class A shares for the year ended October 31, 2008. EVD also received distribution and service fees from Class A shares (see Note 4).
Except for Trustees of the Fund and the Portfolio who are not members of EVM's or BMR's organizations, officers and Trustees receive remuneration for their services to the Fund out of the investment adviser fee. Certain officers and Trustees of the Fund and the Portfolio are officers of the above organizations.
4 Distribution Plan
The Fund has in effect a distribution plan for Class A shares (Class A Plan) pursuant to Rule 12b-1 under the 1940 Act. The Class A Plan provides that the Fund will pay EVD a
9
Eaton Vance Emerging Markets Local Income Fund as of October 31, 2008
NOTES TO FINANCIAL STATEMENTS CONT'D
distribution and service fee of 0.30% per annum of its average daily net assets attributable to Class A shares for distribution services and facilities provided to the Fund by EVD, as well as for personal services and/or the maintenance of shareholder accounts. Distribution and service fees paid or accrued to EVD for the year ended October 31, 2008, amounted to $4,807 for Class A shares.
5 Contingent Deferred Sales Charges
Class A shares may be subject to a 1% contingent deferred sales charge (CDSC) if redeemed within 18 months of purchase (depending on the circumstances of purchase). Generally, the CDSC is based upon the lower of the net asset value at date of redemption or date of purchase. No charge is levied on shares acquired by reinvestment of dividends or capital gain distributions. No CDSC is levied on shares which have been sold to EVM or its affiliates or to their respective employees or clients and may be waived under certain other limited conditions. For the year ended October 31, 2008 the Fund was informed that EVD received no CDSCs paid by Class A shareholders.
6 Investment Transactions
For the year ended October 31, 2008, increases and decreases in the Fund's investment in the Portfolio aggregated $9,023,026 and $6,491,530, respectively.
7 Shares of Beneficial Interest
The Fund's Declaration of Trust permits the Trustees to issue an unlimited number of full and fractional shares of beneficial interest (without par value). Transactions in Fund shares were as follows:
| | | Year Ended
October 31, 2008 | | Period Ended
October 31, 2007(1) | |
| Sales | | | 893,652 | | | | 1,010 | | |
Issued to shareholders electing to
receive payments of distributions
in Fund shares | | | 6,209 | | | | — | | |
| Redemptions | | | (716,184 | ) | | | — | | |
| Net increase | | | 183,677 | | | | 1,010 | | |
(1) For the period from the start of business, June 27, 2007, to October 31, 2007.
At October 31, 2008, EVM owned 53.1% of the outstanding shares of the Fund.
8 Recently Issued Accounting Pronouncements
In September 2006, the Financial Accounting Standards Board (FASB) issued Statement of Financial Accounting Standards No. 157 (FAS 157), "Fair Value Measurements". FAS 157 defines fair value, establishes a framework for measuring fair value in accordance with accounting principles generally accepted in the United States of America and expands disclosure about fair value measurements. FAS 157 is effective for fiscal years beginning after November 15, 2007. As of October 31, 2008, management does not believe the adoption of FAS 157 will impact the amounts reported in the financial statements; however, additional disclosures may be required about the inputs used to develop the measurements of fair value and the effect of certain of the measurements on changes in net assets for the period.
In March 2008, the FASB issued Statement of Financial Accounting Standards No. 161 (FAS 161), "Disclosures about Derivative Instruments and Hedging Activities". FAS 161 requires enhanced disclosures about an entity's derivative and hedging activities, including qualitative disclosures about the objectives and strategies for using derivatives, quantitative disclosures about fair value amounts of and gains and losses on derivative instruments, and disclosures about credit-risk related contingent features in derivative instruments. FAS 161 is effective for fiscal years and interim periods beginning after November 15, 2008. Management is currently evaluating the impact the adoption of FAS 161 will have on the Fund's financial statement disclosures.
10
Eaton Vance Emerging Markets Local Income Fund as of October 31, 2008
REPORT OF INDEPENDENT REGISTERED PUBLIC ACCOUNTING FIRM
To the Trustees of Eaton Vance Mutual Funds Trust and Shareholders of Eaton Vance Emerging Markets Local Income Fund (formerly Eaton Vance Emerging Markets Income Fund):
We have audited the accompanying statement of assets and liabilities of Eaton Vance Emerging Markets Local Income Fund (the "Fund") (formerly Eaton Vance Emerging Markets Income Fund) (one of the series of Eaton Vance Mutual Funds Trust) as of October 31, 2008, the related statement of operations for the year then ended and the statements of changes in net assets and the financial highlights for the year then ended and for the period from the start of business, June 27, 2007, to October 31, 2007. These financial statements and financial highlights are the responsibility of the Fund's management. Our responsibility is to express an opinion on these financial statements and financial highlights based on our audits.
We conducted our audits in accordance with the standards of the Public Company Accounting Oversight Board (United States). Those standards require that we plan and perform the audit to obtain reasonable assurance about whether the financial statements and financial highlights are free of material misstatement. The Fund is not required to have, nor were we engaged to perform, an audit of its internal control over financial reporting. Our audits included consideration of internal control over financial reporting as a basis for designing audit procedures that are appropriate in the circumstances, but not for the purpose of expressing an opinion on the effectiveness of the Fund's internal control over financial reporting. Accordingly, we express no such opinion. An audit also includes examining, on a test basis, evidence supporting the amounts and disclosures in the financial statements, assessing the accounting principles used and significant estimates made by management, as well as evaluating the overall financial statement presentation. We believe that our audits provide a reasonable basis for our opinion.
In our opinion, the financial statements and financial highlights referred to above present fairly, in all material respects, the financial position of Eaton Vance Emerging Markets Local Income Fund as of October 31, 2008, the results of its operations for the year then ended and the changes in its net assets and the financial highlights for the year then ended and for the period from the start of business, June 27, 2007, to October 31, 2007, in conformity with accounting principles generally accepted in the United States of America.
DELOITTE & TOUCHE LLP
Boston, Massachusetts
December 18, 2008
11
Eaton Vance Emerging Markets Local Income Fund as of October 31, 2008
FEDERAL TAX INFORMATION (Unaudited)
The Form 1099-DIV you receive in January 2009 will show the tax status of all distributions paid to your account in calendar 2008. Shareholders are advised to consult their own tax adviser with respect to the tax consequences of their investment in the Fund.
Capital Gain Dividends — The Fund designates $154 as a long-term capital gain dividend.
12
Emerging Markets Local Income Portfolio as of October 31, 2008
PORTFOLIO OF INVESTMENTS
| Foreign Government Bonds — 66.2% | |
| Security | | Principal | | U.S. $ Value | |
| Brazil — 7.4% | |
| Nota Do Tesouro Nacional, 6.00%, 5/15/15(1) | | BRL | 381,944 | | | $ | 145,364 | | |
| Nota Do Tesouro Nacional, 10.00%, 1/1/10 | | BRL | 3,775,000 | | | | 1,643,463 | | |
| Nota Do Tesouro Nacional, 10.00%, 1/1/12 | | BRL | 3,259,000 | | | | 1,251,548 | | |
| Nota Do Tesouro Nacional, 10.00%, 1/1/14 | | BRL | 4,310,000 | | | | 1,485,439 | | |
| Total Brazil (identified cost $6,049,678) | | | | | | $ | 4,525,814 | | |
| Costa Rica — 0.2% | |
| Titulo Propiedad Ud, 1.00%, 1/12/22(2) | | CRC | 84,032,550 | | | $ | 78,193 | | |
| Titulo Propiedad Ud, 1.63%, 7/13/16(3) | | CRC | 9,921,690 | | | | 9,276 | | |
| Total Costa Rica (identified cost $99,180) | | | | | | $ | 87,469 | | |
| Czech Republic — 4.0% | |
| Czech Republic, 3.55%, 10/18/12 | | CZK | 12,300,000 | | | $ | 632,351 | | |
| Czech Republic, 3.80%, 4/11/15 | | CZK | 12,370,000 | | | | 621,855 | | |
| Czech Republic, 4.00%, 4/11/17 | | CZK | 23,720,000 | | | | 1,185,721 | | |
| Total Czech Republic (identified cost $2,327,677) | | | | | | $ | 2,439,927 | | |
| Ecuador — 0.0% | |
| Republic of Ecuador, 10.00%, 8/15/30 | | USD | 25,000 | | | $ | 7,375 | | |
| Total Ecuador (identified cost $7,875) | | | | | | $ | 7,375 | | |
| Egypt — 0.4% | |
| Arab Republic of Egypt, 8.75%, 7/18/12(4) | | EGP | 1,690,000 | | | $ | 214,978 | | |
| Total Egypt (identified cost $295,638) | | | | | | $ | 214,978 | | |
| Georgia — 0.9% | |
| Republic of Georgia, 7.50%, 4/15/13 | | USD | 735,000 | | | $ | 529,200 | | |
| Total Georgia (identified cost $572,057) | | | | | | $ | 529,200 | | |
| Ghana — 0.6% | |
| Ghanaian Government Bond, 13.00%, 8/2/10(7) | | GHS | 470,000 | | | $ | 356,884 | | |
| Total Ghana (identified cost $503,347) | | | | | | $ | 356,884 | | |
| Security | | Principal | | U.S. $ Value | |
| Hungary — 8.4% | |
| Hungary Government Bond, 6.50%, 8/12/09 | | HUF | 433,000,000 | | | $ | 2,029,600 | | |
| Hungary Government Bond, 6.75%, 2/24/17 | | HUF | 303,100,000 | | | | 1,183,580 | | |
| Hungary Government Bond, 6.75%, 11/24/17 | | HUF | 148,000,000 | | | | 576,088 | | |
| Hungary Government Bond, 7.25%, 6/12/12 | | HUF | 322,000,000 | | | | 1,342,570 | | |
| Total Hungary (identified cost $6,673,508) | | | | | | $ | 5,131,838 | | |
| Indonesia — 3.9% | |
| Indonesia Government, 9.00%, 9/15/18 | | IDR | 7,400,000,000 | | | $ | 414,638 | | |
| Indonesia Government, 9.75%, 5/15/37 | | IDR | 12,436,000,000 | | | | 653,175 | | |
| Indonesia Government, 11.00%, 11/15/20 | | IDR | 7,910,000,000 | | | | 493,650 | | |
| Indonesia Government, 12.50%, 3/15/13 | | IDR | 9,245,000,000 | | | | 729,422 | | |
| Republic of Indonesia, 6.875%, 1/17/18 | | USD | 100,000 | | | | 68,500 | | |
| Total Indonesia (identified cost $3,928,807) | | | | | | $ | 2,359,385 | | |
| Ivory Coast — 0.0% | |
| Ivory Coast, 4.00%, 3/31/28 | | USD | 75,000 | | | $ | 25,001 | | |
| Total Ivory Coast (identified cost $26,258) | | | | | | $ | 25,001 | | |
| Malaysia — 11.4% | |
| Malaysian Government, 3.756%, 4/28/11 | | MYR | 10,900,000 | | | $ | 3,057,584 | | |
| Malaysian Government, 4.24%, 2/7/18 | | MYR | 13,900,000 | | | | 3,876,566 | | |
| Total Malaysia (identified cost $7,233,313) | | | | | | $ | 6,934,150 | | |
| Mexico — 2.5% | |
| Mexican Fixed Rate Bonds, 10.00%, 12/5/24 | | MXN | 17,910,000 | | | $ | 1,539,557 | | |
| Total Mexico (identified cost $1,984,623) | | | | | | $ | 1,539,557 | | |
| Nigeria — 0.9% | |
| Nigerian Treasury Bond, 12.00%, 4/28/09 | | NGN | 27,583,000 | | | $ | 237,420 | | |
| Nigerian Treasury Bond, 17.00%, 12/16/08 | | NGN | 36,700,000 | | | | 314,831 | | |
| Total Nigeria (identified cost $527,716) | | | | | | $ | 552,251 | | |
See notes to financial statements
13
Emerging Markets Local Income Portfolio as of October 31, 2008
PORTFOLIO OF INVESTMENTS CONT'D
| Security | | Principal | | U.S. $ Value | |
| Peru — 2.8% | |
| Peru Certificates of Deposit, 0.00%, 2/9/09 | | PEN | 1,100,000 | | | $ | 350,991 | | |
| Republic of Peru, 6.90%, 8/12/37(4) | | PEN | 2,367,000 | | | | 540,132 | | |
| Republic of Peru, 8.60%, 8/12/17 | | PEN | 1,075,000 | | | | 328,297 | | |
| Republic of Peru, 12.25%, 8/10/11 | | PEN | 1,320,000 | | | | 461,137 | | |
| Total Peru (identified cost $2,060,895) | | | | | | $ | 1,680,557 | | |
| Poland — 7.8% | |
| Poland Government Bond, 4.75%, 4/25/12 | | PLN | 2,010,000 | | | $ | 680,748 | | |
| Poland Government Bond, 5.25%, 10/25/17 | | PLN | 3,575,000 | | | | 1,175,345 | | |
| Poland Government Bond, 5.75%, 9/23/22 | | PLN | 3,420,000 | | | | 1,159,477 | | |
| Poland Government Bond, 6.00%, 5/24/09 | | PLN | 2,350,000 | | | | 843,340 | | |
| Poland Government Bond, 6.25%, 10/24/15 | | PLN | 2,560,000 | | | | 898,253 | | |
| Total Poland (identified cost $5,501,789) | | | | | | $ | 4,757,163 | | |
| Slovakia — 3.2% | |
| Slovak Republic, 4.90%, 2/5/10 | | SKK | 29,100,000 | | | $ | 1,227,752 | | |
| Slovak Republic, 5.30%, 5/12/19 | | SKK | 16,900,000 | | | | 734,246 | | |
| Total Slovakia (identified cost $1,982,687) | | | | | | $ | 1,961,998 | | |
| Thailand — 7.3% | |
| Bank of Thailand, 3.625%, 5/2/11 | | THB | 22,000,000 | | | $ | 632,665 | | |
| Kingdom of Thailand, 5.125%, 3/13/18 | | THB | 121,500,000 | | | | 3,817,388 | | |
| Total Thailand (identified cost $4,534,067) | | | | | | $ | 4,450,053 | | |
| Turkey — 3.9% | |
| Republic of Turkey, 6.875%, 3/17/36 | | USD | 25,000 | | | $ | 17,125 | | |
| Turkey Government Bond, 0.00%, 2/4/09 | | TRY | 3,800,000 | | | | 2,341,719 | | |
| Total Turkey (identified cost $2,892,886) | | | | | | $ | 2,358,844 | | |
| Uruguay — 0.6% | |
| Republic of Uruguay, 5.00%, 9/14/18(5) | | UYU | 12,337,642 | | | $ | 348,902 | | |
| Republic of Uruguay, 7.875%, 1/15/33 | | USD | 25,000 | | | | 15,756 | | |
| Total Uruguay (identified cost $550,483) | | | | | | $ | 364,658 | | |
Total Foreign Government Bonds
(identified cost $47,752,484) | | | | | | $ | 40,277,102 | | |
| Foreign Corporate Bonds — 0.2% | |
| Security | | Principal | | U.S. $ Value | |
| Kazakhstan — 0.2% | |
| Kazkommerts International, 7.875%, 4/7/14 | | EUR | 300,000 | | | $ | 137,673 | | |
| Total Kazakhstan (identified cost $241,223) | | | | | | $ | 137,673 | | |
Total Foreign Corporate Bonds
(identified cost $241,223) | | | | | | $ | 137,673 | | |
| Mortgage-Backed Securities — 18.1% | |
| Security | | Principal | | U.S. $ Value | |
| Mortgage Pass-Throughs — 18.1% | |
| Federal Home Loan Mortgage Corp.: | |
| 6.50% with maturity at 2024(6) | | $ | 7,171,300 | | | $ | 7,382,100 | | |
| | | $ | 7,382,100 | | |
| Federal National Mortgage Association: | �� |
| 5.50% with maturity at 2017 | | $ | 1,651,772 | | | $ | 1,679,051 | | |
| 6.50% with various maturities to 2017 | | | 1,900,741 | | | | 1,940,772 | | |
| | | $ | 3,619,823 | | |
Total Mortgage Pass-Throughs
(identified cost $11,198,211) | | | | | | $ | 11,001,923 | | |
Total Mortgage-Backed Securities
(identified cost $11,198,211) | | | | | | $ | 11,001,923 | | |
| Short-Term Investments — 13.2% | |
| Foreign Government Securities — 5.2% | |
| Security | | Principal
Amount | | U.S. $ Value | |
| Brazil — 2.2% | |
| Letra Tesouro Nacional, 0.00%, 1/1/09 | | BRL | 2,882,000 | | | $ | 1,301,715 | | |
| Total Brazil (identified cost $1,703,734) | | | | | | $ | 1,301,715 | | |
| Georgia — 0.3% | |
| Bank of Georgia Group, 8.75%, 12/26/08(7) | | GEL | 300,984 | | | $ | 203,327 | | |
| Total Georgia (identified cost $212,417) | | | | | | $ | 203,327 | | |
See notes to financial statements
14
Emerging Markets Local Income Portfolio as of October 31, 2008
PORTFOLIO OF INVESTMENTS CONT'D
| Security | | Principal
Amount | | U.S. $ Value | |
| Iceland — 1.1% | |
| Republic of Iceland, 8.50%, 12/12/08 | | ISK | 103,035,000 | | | $ | 674,341 | | |
| Total Iceland (identified cost $1,354,130) | | | | | | $ | 674,341 | | |
| Nigeria — 0.4% | |
| Nigerian Treasury Bill, 0.00%, 7/2/09 | | NGN | 5,850,000 | | | $ | 46,779 | | |
| Nigerian Treasury Bill, 0.00%, 9/3/09 | | NGN | 27,403,000 | | | | 215,594 | | |
| Total Nigeria (identified cost $261,659) | | | | | | $ | 262,373 | | |
| Peru — 1.1% | |
| Peru Certificates of Deposit, 0.00%, 11/6/08 | | PEN | 1,200,000 | | | $ | 389,832 | | |
| Peru Certificates of Deposit, 0.00%, 12/9/08 | | PEN | 600,000 | | | | 193,755 | | |
| Peru Certificates of Deposit, 0.00%, 1/5/09 | | PEN | 200,000 | | | | 64,257 | | |
| Total Peru (identified cost $674,258) | | | | | | $ | 647,844 | | |
| Sri Lanka — 0.1% | |
| Republic of Sri Lanka, 11.50%, 11/1/08 | | LKR | 8,000,000 | | | $ | 72,598 | | |
| Total Sri Lanka (identified cost $74,160) | | | | | | $ | 72,598 | | |
Total Foreign Government Securities
(identified cost $4,280,358) | | | | | | $ | 3,162,198 | | |
| Other Securities — 8.0% | |
| Description | | Interest
(000's omitted) | | U.S. $ Value | |
| Cash Managment Portfolio, 1.90%(8) | | $ | 4,848 | | | $ | 4,848,227 | | |
Total Other Securities
(identified cost $4,848,227) | | | | | | $ | 4,848,227 | | |
Total Short-Term Investments
(identified cost $9,128,585) | | | | | | $ | 8,010,425 | | |
Total Investments — 97.7%
(identified cost $68,320,503) | | | | | | $ | 59,427,123 | | |
| Other Assets, Less Liabilities — 2.3% | | | | | | $ | 1,409,744 | | |
| Net Assets — 100.0% | | $ | 60,836,867 | | |
BRL - Brazilian Real
CRC - Costa Rican Colon
CZK - Czech Republic Koruna
EGP - Egyptian Pound
GEL - Georgian Lari
GHS - Ghanaian Cedi
HUF - Hungarian Forint
IDR - Indonesian Rupiah
ISK - Icelandic Krona
LKR - Sri Lanka Rupee
MXN - Mexican Peso
MYR - Malaysian Ringgit
NGN - Nigerian Naira
PEN - Peruvian New Sol
PLN - Polish Zloty
SKK - Slovak Koruna
THB - Thai Baht
TRY - New Turkish Lira
USD - United States Dollar
UYU - Uruguayan Peso
(1) Bond pays a 6.00% coupon on the face at the end of the payment period. Principal is adjusted daily based on the ICPA (Amplified Consumer Price Index) as determined by the Brazilian Institute of Geography and Statistics. The original face is BRL 218,000 and the current face is BRL 381,944.
(2) Bond pays a 1.00% coupon on the face at the end of the payment period. Principal is adjusted daily based on Development Units (Unidades de Desarrollo) as calculated by the General Superintendent of Values. The original face is CRC 72,100,000 and the current face is CRC 84,032,550.
(3) Bond pays a 1.63% coupon on the face at the end of the payment period. Principal is adjusted daily based on Development Units (Unidades de Desarrollo) as calculated by the General Superintendent of Values. The original face is CRC 8,100,000 and the current face is CRC 9,921,690.
(4) Security exempt from registration under Rule 144A of the Securities Act of 1933. These securities may be sold in transactions exempt from registration, normally to qualified institutional buyers. At October 31, 2008, the aggregate value of the securities is $755,110 or 1.2% of the Portfolio's net assets.
(5) Bond pays a coupon of 5.00% on the face at the end of the payment period. Principal is adjusted with the Uruguayan inflation rate. Original face of the bond is UYU 10,440,000 and the current face is UYU 12,337,642.
(6) Security (or a portion thereof) has been segregated to cover margin requirements on open financial futures contracts.
(7) Security valued at fair value using methods determined in good faith by or at the direction of the Trustees.
(8) Affiliated investment company available to Eaton Vance portfolios and funds which invests in high quality, U.S. dollar denominated money market instruments. The rate shown is the annualized seven-day yield as of October 31, 2008.
See notes to financial statements
15
Emerging Markets Local Income Portfolio as of October 31, 2008
FINANCIAL STATEMENTS
Statement of Assets and Liabilities
As of October 31, 2008
| Assets | |
| Unaffiliated investments, at value (identified cost, $63,472,276) | | $ | 54,578,896 | | |
| Affiliated investment, at value (identified cost, $4,848,227) | | | 4,848,227 | | |
| Foreign currency, at value (identified cost, $33,237) | | | 40,866 | | |
| Interest receivable | | | 971,441 | | |
| Interest receivable from affiliated investment | | | 9,067 | | |
| Receivable for daily variation margin on open financial futures contracts | | | 2,997 | | |
| Receivable for open forward foreign currency contracts | | | 1,550,052 | | |
| Receivable for open swap contracts | | | 183,178 | | |
| Receivable for closed swap contracts | | | 12,232 | | |
| Receivable for closed forward foreign currency contracts | | | 209,802 | | |
| Receivable for closed options | | | 21,679 | | |
| Total assets | | $ | 62,428,437 | | |
| Liabilities | |
| Payable for open swap contracts | | $ | 598,876 | | |
| Payable for open forward foreign currency contracts | | | 482,303 | | |
| Payable for closed forward foreign currency contracts | | | 194,333 | | |
| Payable for investments purchased | | | 95,070 | | |
| Payable to affiliate for investment adviser fee | | | 33,490 | | |
| Payable to affiliate for Trustees' fees | | | 183 | | |
| Accrued expenses and other liabilities | | | 187,315 | | |
| Total liabilities | | $ | 1,591,570 | | |
| Net Assets applicable to investors' interest in Portfolio | | $ | 60,836,867 | | |
| Sources of Net Assets | |
| Net proceeds from capital contributions and withdrawals | | $ | 69,227,057 | | |
| Net unrealized depreciation (computed on the basis of identified cost) | | | (8,390,190 | ) | |
| Total | | $ | 60,836,867 | | |
Statement of Operations
For the Year Ended
October 31, 2008
| Investment Income | |
| Interest (net of foreign taxes, $79,421) | | $ | 3,894,289 | | |
| Interest income allocated from affiliated investment | | | 441,172 | | |
| Expenses allocated from affiliated investment | | | (54,668 | ) | |
| Total investment income | | $ | 4,280,793 | | |
| Expenses | |
| Investment adviser fee | | $ | 383,989 | | |
| Trustees' fees and expenses | | | 4,836 | | |
| Custodian fee | | | 155,009 | | |
| Legal and accounting services | | | 44,706 | | |
| Miscellaneous | | | 2,160 | | |
| Total expenses | | $ | 590,700 | | |
Deduct —
Reduction of custodian fee | | $ | 16 | | |
| Total expense reductions | | $ | 16 | | |
| Net expenses | | $ | 590,684 | | |
| Net investment income | | $ | 3,690,109 | | |
| Realized and Unrealized Gain (Loss) | |
Net realized gain (loss) —
Investment transactions (identified cost basis) | | $ | 54,656 | | |
| Financial futures contracts | | | 50,228 | | |
| Swap contracts | | | (157,712 | ) | |
Foreign currency and forward foreign currency exchange
contract transactions | | | (3,099,249 | ) | |
| Net realized loss | | $ | (3,152,077 | ) | |
Change in unrealized appreciation (depreciation) —
Investments (identified cost basis) | | $ | (10,540,986 | ) | |
| Financial futures contracts | | | 30,172 | | |
| Swap contracts | | | (527,704 | ) | |
| Foreign currency and forward foreign currency exchange contracts | | | 82,901 | | |
| Net change in unrealized appreciation (depreciation) | | $ | (10,955,617 | ) | |
| Net realized and unrealized loss | | $ | (14,107,694 | ) | |
| Net decrease in net assets from operations | | $ | (10,417,585 | ) | |
See notes to financial statements
16
Emerging Markets Local Income Portfolio as of October 31, 2008
FINANCIAL STATEMENTS CONT'D
Statements of Changes in Net Assets
Increase (Decrease)
in Net Assets | | Year Ended
October 31, 2008 | | Period Ended
October 31, 2007(1) | |
From operations —
Net investment income | | $ | 3,690,109 | | | $ | 936,237 | | |
Net realized gain (loss) from investment
transactions, finacial futures contracts,
swap contracts, and foreign currency
and forward foreign currency exchange
contract transactions | | | (3,152,077 | ) | | | 1,814,216 | | |
Net change in unrealized appreciation
(depreciation) of investments,
financial futures contracts,
swap contracts, and foreign currency
and forward foreign currency
exchange contracts | | | (10,955,617 | ) | | | 2,565,427 | | |
Net increase (decrease) in net assets
from operations | | $ | (10,417,585 | ) | | $ | 5,315,880 | | |
Capital transactions —
Contributions | | $ | 26,776,677 | | | $ | 58,250,069 | | |
| Withdrawals | | | (11,334,998 | ) | | | (7,868,186 | ) | |
Net increase in net assets from
capital transactions | | $ | 15,441,679 | | | $ | 50,381,883 | | |
| Net increase in net assets | | $ | 5,024,094 | | | $ | 55,697,763 | | |
| Net Assets | |
| At beginning of period | | $ | 55,812,773 | | | $ | 115,010 | | |
| At end of period | | $ | 60,836,867 | | | $ | 55,812,773 | | |
(1) For the period from the start of business, June 27, 2007, to October 31, 2007.
See notes to financial statements
17
Emerging Markets Local Income Portfolio as of October 31, 2008
FINANCIAL STATEMENTS CONT'D
Supplementary Data
| | | Year Ended
October 31, 2008 | | Period Ended
October 31, 2007(1) | |
| Ratios/Supplemental Data | |
| Ratios (As a percentage of average daily net assets): | |
| Expenses before custodian fee reduction(2) | | | 0.96 | % | | | 1.13 | %(3) | |
| Net investment income | | | 5.51 | % | | | 5.25 | %(3) | |
| Portfolio Turnover | | | 38 | % | | | 2 | % | |
| Total Return | | | (13.13 | )% | | | 10.48 | %(4) | |
| Net assets, end of period (000's omitted) | | $ | 60,837 | | | $ | 55,813 | | |
(1) For the period from the start of business, June 27, 2007, to October 31, 2007.
(2) Excludes the effect of custody fee credits, if any, of less than 0.005%.
(3) Annualized.
(4) Not annualized.
See notes to financial statements
18
Emerging Markets Local Income Portfolio as of October 31, 2008
NOTES TO FINANCIAL STATEMENTS
1 Significant Accounting Policies
Emerging Markets Local Income Portfolio (the Portfolio) is a New York trust registered under the Investment Company Act of 1940, as amended (the 1940 Act), as a non-diversified, open-end management investment company. The Portfolio's investment objective is to seek total return. The Declaration of Trust permits the Trustees to issue interests in the Portfolio. At October 31, 2008, Eaton Vance Emerging Markets Local Income Fund, Eaton Vance Strategic Income Fund and Eaton Vance Medallion Strategic Income Fund held an interest of 2.6%, 86.6% and 10.6%, respectively, in the Portfolio.
The following is a summary of significant accounting policies of the Portfolio. The policies are in conformity with accounting principles generally accepted in the United States of America.
A Investment Valuation — Debt obligations, including listed securities and securities for which quotations are available, will normally be valued on the basis of market quotations provided by independent pricing services. The pricing services consider various factors relating to bonds and/or market transactions to determine market value. Most seasoned, fixed rate 30-year mortgage-backed securities are valued through the use of the investment adviser's matrix pricing system, which takes into account bond prices, yield differentials, anticipated prepayments and interest rates provided by dealers. Short-term debt securities with a remaining maturity of sixty days or less (excluding those that are non-U.S. dollar denominated, which typically are valued by a pricing service or dealer quotes) are valued at amortized cost, which approximates market value. If short-term debt securities are acquired with a remaining maturity of more than sixty days, they will be valued by a pricing service. Financial futures contracts and options on financial futures contracts listed on commodity exchanges are valued based on the closing price on the primary exchange on which such contracts trade. Forward foreign currency exchange contracts are generally valued using prices supplied by a pricing vendor or dealers. Interest rate swaps are normally valued using valuations provided by a pricing vendor. Such vendor valuations are based on the present value of fixed and projected floating rate cash flows over the term of the swap contract. Future cash flows are discounted to their present value using swap curves provided by electronic data services or by broker/dealers. Credit default swaps are valued by a broker-dealer (usually the counterparty to the agreement). Sovereign credit default swaps, foreign i nterest rate swaps and over-the-counter currency options are valued by a pricing service. Foreign securities and currencies are valued in U.S. dollars, based on foreign currency exchange rate quotations supplied by an independent quotation service. The independent service uses a propriety model to determine the exchange rate. Inputs to the model include reported trades and implied bid/ask spreads. Investments for which valuations or market quotations are not readily available are valued at fair value using methods determined in good faith by or at the direction of the Trustees of the Portfolio considering relevant factors, data and information including the market value of freely tradable securities of the same class in the principal market on which such securities are normally traded.
The Portfolio may invest in Cash Management Portfolio (Cash Management), an affiliated investment company managed by Boston Management and Research (BMR), a subsidiary of Eaton Vance Management (EVM). Cash Management values its investment securities utilizing the amortized cost valuation technique permitted by Rule 2a-7 of the 1940 Act, pursuant to which Cash Management must comply with certain conditions. This technique involves initially valuing a portfolio security at its cost and thereafter assuming a constant amortization to maturity of any discount or premium. If amortized cost is determined not to approximate fair value, Cash Management may value its investment securities based on available market quotations provided by a pricing service.
B Investment Transactions — Investment transactions for financial statement purposes are accounted for on a trade date basis. Realized gains and losses on investments sold are determined on the basis of identified cost.
C Income — Interest income is recorded on the basis of interest accrued, adjusted for amortization of premium or accretion of discount.
D Federal Taxes — The Portfolio has elected to be treated as a partnership for federal tax purposes. No provision is made by the Portfolio for federal or state taxes on any taxable income of the Portfolio because each investor in the Portfolio is ultimately responsible for the payment of any taxes on its share of taxable income. Since at least one of the Portfolio's investors is a regulated investment company that invests all or substantially all of its assets in the Portfolio, the Portfolio normally must satisfy the applicable source of income and diversification requirements (under the Internal Revenue Code) in order for its investors to satisfy them. The Portfolio will allocate, at least annually among its investors, each investor's
19
Emerging Markets Local Income Portfolio as of October 31, 2008
NOTES TO FINANCIAL STATEMENTS CONT'D
distributive share of the Portfolio's net investment income, net realized capital gains and any other items of income, gain, loss, deduction or credit.
As of October 31, 2008, the Portfolio had no uncertain tax positions that would require financial statement recognition, de-recognition, or disclosure. Each of the Portfolio's federal tax returns filed since the start of business on June 27, 2007 to October 31, 2008 remains subject to examination by the Internal Revenue Service.
E Expense Reduction — State Street Bank and Trust Company (SSBT) serves as custodian of the Portfolio. Pursuant to the custodian agreement, SSBT receives a fee reduced by credits, which are determined based on the average daily cash balance the Portfolio maintains with SSBT. All credit balances, if any, used to reduce the Portfolio's custodian fees are reported as a reduction of expenses in the Statement of Operations.
F Foreign Currency Translation — Investment valuations, other assets, and liabilities initially expressed in foreign currencies are translated each business day into U.S. dollars based upon current exchange rates. Purchases and sales of foreign investment securities and income and expenses denominated in foreign currencies are translated into U.S. dollars based upon currency exchange rates in effect on the respective dates of such transactions. Recognized gains or losses on investment transactions attributable to changes in foreign currency exchange rates are recorded for financial statement purposes as net realized gains and losses on investments. That portion of unrealized gains and losses on investments that results from fluctuations in foreign currency exchange rates is not separately disclosed.
G Use of Estimates — The preparation of the financial statements in conformity with accounting principles generally accepted in the United States of America requires management to make estimates and assumptions that affect the reported amounts of assets and liabilities at the date of the financial statements and the reported amounts of income and expense during the reporting period. Actual results could differ from those estimates.
H Indemnifications — Under the Portfolio's organizational documents, its officers and Trustees may be indemnified against certain liabilities and expenses arising out of the performance of their duties to the Portfolio. Interestholders in the Portfolio are jointly and severally liable for the liabilities and obligations of the Portfolio in the event that the Portfolio fails to satisfy such liabilities and obligations; provided, however, that, to the extent assets are available in the Portfolio, the Portfolio may, under certain circumstances, indemnify interestholders from and against any claim or liability to which such holder may become subject by reason of being or having been an interestholder in the Portfolio. Additionally, in the normal course of business, the Portfolio enters into agreements with service providers that may contain indemnification clauses. The Portfolio's maximum exposure under these arrangements is unknown as this would involve future claims that may be made against the Portfolio that have not yet occurred.
I Financial Futures Contracts — The Portfolio may enter into financial futures contracts. The Portfolio's investment in financial futures contracts is designed for hedging against changes in interest rates or as a substitute for the purchase of securities. Upon entering into a financial futures contract, the Portfolio is required to deposit with the broker, either in cash or securities an amount equal to a certain percentage of the purchase price (initial margin). Subsequent payments, known as variation margin, are made or received by the Portfolio each business day, depending on the daily fluctuations in the value of the underlying security, and are recorded as unrealized gains or losses by the Portf olio. Gains (losses) are realized upon the expiration or closing of the financial futures contracts. Should market conditions change unexpectedly, the Portfolio may not achieve the anticipated benefits of the financial futures contracts and may realize a loss. In entering such contracts, the Portfolio bears the risk if the counterparties do not perform under the contracts' terms.
J Forward Foreign Currency Exchange Contracts — The Portfolio may enter into forward foreign currency exchange contracts for the purchase or sale of a specific foreign currency at a fixed price on a future date. The Portfolio enters into forward contracts for hedging purposes as well as non-hedging purposes. The forward foreign currency exchange contract is adjusted by the daily exchange rate of the underlying currency and any gains or losses are recorded as unrealized until such time as the contract has been closed or offset by another contract with the same broker for the same settlement date and currency. Risks may arise upon entering these contracts from the potential inability of counterparties t o meet the terms of their contracts and from movements in the value of a foreign currency relative to the U.S. dollar.
K Interest Rate Swaps — The Portfolio may enter into interest rate swap agreements to enhance return, to hedge against fluctuations in securities prices or interest
20
Emerging Markets Local Income Portfolio as of October 31, 2008
NOTES TO FINANCIAL STATEMENTS CONT'D
rates, or as substitution for the purchase or sale of securities. Pursuant to these agreements, the Portfolio makes periodic payments at a fixed interest rate and, in exchange, receives payments based on the interest rate of a benchmark industry index. Payments received or made are recorded as realized gains or losses. During the term of the outstanding swap agreement, changes in the underlying value of the swap are recorded as unrealized gains or losses. The value of the swap is determined by changes in the relationship between two rates of interest. The Portfolio is exposed to credit loss in the event of non-performance by the swap counterparty. Risk may also arise from movements in interest rates.
L Credit Default Swaps — The Portfolio may enter into credit default swap contracts to buy or sell protection against default on an individual issuer or a basket of issuers of bonds. When the Portfolio is the buyer of a credit default swap contract, the Portfolio is entitled to receive the par (or other agreed-upon) value of a referenced debt obligation (or basket of debt obligations) from the counterparty to the contract in the event of default by a third party, such as a U.S. or foreign corporate issuer, on the debt obligation. In return, the Portfolio pays the counterparty a periodic stream of payments over the term of the contract provided that no event of default has occurred. If no default occur s, the Portfolio would have spent the stream of payments and received no benefits from the contract. When the Portfolio is the seller of a credit default swap contract, it receives the stream of payments, but is obligated to pay upon default of the referenced debt obligation. As the seller, the Portfolio effectively adds leverage to its portfolio because, in addition to its total net assets, the Portfolio is subject to investment exposure on the notional amount of the swap. The interest fee paid or received on the swap contract, which is based on a specified interest rate on a fixed notional amount, is accrued daily as a component of unrealized appreciation (depreciation) and is recorded as realized gain upon receipt or realized loss upon payment. The Portfolio also records an increase or decrease to unrealized appreciation (depreciation) in an amount equal to the daily valuation. Up-front payments or receipts, if any, are recorded as other assets or other liabilities, respectively, and amortized over the li fe of the swap contract as realized gains or losses. The Portfolio segregates assets in the form of cash and cash equivalents in an amount equal to the aggregate market value of the credit default swaps of which it is the seller, marked to market on a daily basis. These transactions involve certain risks, including the risk that the seller may be unable to fulfill the transaction.
M Total Return Swaps — The Portfolio may enter into swap agreements to enhance return, to hedge against fluctuations in securities prices or interest rates or as substitution for the purchase or sale of securities. In a total return swap, the Portfolio makes payments at a rate equal to a predetermined spread to the one or three-month LIBOR. In exchange, the Portfolio receives payments based on the rate of return of a benchmark industry index or basket of securities. During the term of the outstanding swap agreement, changes in the underlying value of the swap are recorded as unrealized gains and losses. Periodic payments received or made are recorded as realized gains or losses. The value of the swap is determined by changes in the relationship between the rate of interest and the benchmark industry index or basket of securities. The Portfolio is exposed to credit loss in the event of nonperformance by the swap counterparty. Risk may also arise from the unanticipated movements in value of interest rates, securities, or the index.
2 Investment Adviser Fee and Other Transactions with Affiliates
The investment adviser fee is earned by BMR as compensation for investment advisory services rendered to the Portfolio. The fee is computed at an annual rate of 0.65% of the Portfolio's average daily net assets up to $1 billion and at reduced rates as daily net assets exceed that level, and is payable monthly. The portion of the adviser fee payable by Cash Management on the Portfolio's investment of cash therein is credited against the Portfolio's adviser fee. For the year ended October 31, 2008, the Portfolio's adviser fee totaled $435,344 of which $51,355 was allocated from Cash Management and $383,989 was paid or accrued directly by the Portfolio. For the year ended October 31, 2008, the Portfolio's adviser fee, including the portion allocated from Cash Management, was 0.65% of the Portfolio's average daily net assets.
Except for Trustees of the Portfolio who are not members of EVM's or BMR's organizations, officers and Trustees receive remuneration for their services to the Portfolio out of the investment adviser fee. Trustees of the Portfolio who are not affiliated with the investment adviser may elect to defer receipt of all or a percentage of their annual fees in accordance with the terms of the Trustees Deferred Compensation Plan. For the year ended October 31, 2008, no significant amounts have been deferred. Certain officers and Trustees of the Portfolio are officers of the above organizations.
21
Emerging Markets Local Income Portfolio as of October 31, 2008
NOTES TO FINANCIAL STATEMENTS CONT'D
3 Purchases and Sales of Investments
Purchases and sales of investments, other than short-term obligations and including maturities and paydowns, for the year ended October 31, 2008 were as follows:
| Purchases | |
| Investments (non-U.S. Government) | | $ | 27,779,784 | | |
| U.S. Government and Agency Securities | | | 18,193,904 | | |
| | | $ | 45,973,688 | | |
| Sales | |
| Investments (non-U.S. Government) | | $ | 12,139,286 | | |
| U.S. Government and Agency Securities | | | 6,852,813 | | |
| | | $ | 18,992,099 | | |
4 Federal Income Tax Basis of Investments
The cost and unrealized appreciation (depreciation) of investments of the Portfolio at October 31, 2008, as determined on a federal income tax basis, were as follows:
| Aggregate cost | | $ | 68,835,448 | | |
| Gross unrealized appreciation | | $ | 312,583 | | |
| Gross unrealized depreciation | | | (9,720,908 | ) | |
| Net unrealized depreciation | | $ | (9,408,325 | ) | |
The net unrealized appreciation on foreign currency, forward foreign currency exchange contracts and swap contracts at October 31, 2008 on a federal income tax basis was $69,892.
5 Financial Instruments
The Portfolio may trade in financial instruments with off-balance sheet risk in the normal course of its investing activities. These financial instruments may include forward foreign currency exchange contracts, financial futures contracts, interest rate swaps, credit default swaps and total return swaps, and may involve, to a varying degree, elements of risk in excess of the amounts recognized for financial statement purposes. The notional or contractual amounts of these instruments represent the investment the Portfolio has in particular classes of financial instruments and does not necessarily represent the amounts potentially subject to risk. The measurement of the risks associated with these instruments is meaningful only when all related and offsetting transactions are considered.
A summary of obligations under these financial instruments at October 31, 2008 is as follows:
Forward Foreign Currency Exchange Contracts
Sales
| Settlement Date | | Deliver | | In Exchange For | | Net Unrealized
Appreciation
(Depreciation) | |
| 12/22/08 | | Croatia Kuna
837,000 | | Euro
115,289 | | $ | (491 | ) | |
| 1/26/09 | | Croatia Kuna
444,900 | | Euro
60,837 | | | (405 | ) | |
| 11/04/08 | | Euro
920,000 | | United States Dollar
1,169,320 | | | (3,266 | ) | |
| 11/04/08 | | Euro
1,510,000 | | USD
1,922,985 | | | (1,588 | ) | |
| 11/06/08 | | Euro
219,337 | | United States Dollar
301,589 | | | 22,054 | | |
| 11/28/08 | | Euro
643,000 | | United States Dollar
830,467 | | | 11,693 | | |
| 12/12/08 | | Icelandic Krona
85,697,184 | | United States Dollar
1,096,269 | | | 530,292 | | |
| 11/24/08 | | Indonesian Rupiah
3,064,843,750 | | United States Dollar
239,441 | | | (28,621 | ) | |
| 11/06/08 | | Israeli Shekel
570,000 | | United States Dollar
151,911 | | | (1,506 | ) | |
| 11/10/08 | | Malaysian Ringgit
1,248,000 | | United States Dollar
356,215 | | | 4,806 | | |
| 11/24/08 | | Malaysian Ringgit
2,727,000 | | United States Dollar
774,716 | | | 7,066 | | |
| 11/28/08 | | Malaysian Ringgit
1,077,000 | | United States Dollar
300,754 | | | (2,397 | ) | |
| 11/03/08 | | Mauritian Rupee
8,925,000 | | United States Dollar
283,333 | | | 5,728 | | |
| 11/28/08 | | New Zealand Dollar
260,000 | | United States Dollar
151,450 | | | 510 | | |
| 11/06/08 | | Peruvian New Sol
600,000 | | United States Dollar
203,804 | | | 8,742 | | |
| 11/10/08 | | Peruvian New Sol
600,000 | | United States Dollar
203,701 | | | 8,758 | | |
| 12/11/08 | | Peruvian New Sol
600,000 | | United States Dollar
203,804 | | | 9,740 | | |
| 2/09/09 | | Peruvian New Sol
1,100,000 | | United States Dollar
372,376 | | | 19,391 | | |
| 11/10/08 | | Philippine Peso
16,900,000 | | United States Dollar
350,332 | | | 6,431 | | |
| 11/03/08 | | Polish Zloty
1,020,837 | | United States Dollar
366,285 | | | (2,688) | | |
22
Emerging Markets Local Income Portfolio as of October 31, 2008
NOTES TO FINANCIAL STATEMENTS CONT'D
| Settlement Date | | Deliver | | In Exchange For | | Net Unrealized
Appreciation
(Depreciation) | |
| 11/05/08 | | Slovakia Koruna
25,504,918 | | United States Dollar
1,093,974 | | $ | 26,588 | | |
| 11/05/08 | | South African Rand
4,040,000 | | United States Dollar
403,751 | | | (9,433 | ) | |
| 11/03/08 | | Sri Lanka Rupee
8,460,000 | | United States Dollar
75,482 | | | (1,305 | ) | |
| 11/28/08 | | Taiwan Dollar
11,340,000 | | United States Dollar
341,217 | | | (3,731 | ) | |
| 12/26/08 | | Taiwan Dollar
12,960,000 | | United States Dollar
387,548 | | | (7,230 | ) | |
| 1/21/09 | | Taiwan Dollar
4,200,000 | | United States Dollar
129,191 | | | 1,142 | | |
| 11/28/08 | | Thai Baht
13,000,000 | | United States Dollar
372,173 | | | 2,540 | | |
| 11/04/08 | | Zambian Kwacha
310,000,000 | | United States Dollar
65,197 | | | (4,154 | ) | |
| 11/07/08 | | Zambian Kwacha
310,000,000 | | United States Dollar
65,803 | | | (3,490 | ) | |
| 1/15/09 | | Zambian Kwacha
327,000,000 | | United States Dollar
79,756 | | | 7,912 | | |
| | | | | | | $ | 603,088 | | |
Purchases
| Settlement Date | | In Exchange For | | Deliver | | Net Unrealized
Appreciation
(Depreciation) | |
| 12/02/08 | | Brazilian Real
570,000 | | United States Dollar
265,487 | | $ | (5,382 | ) | |
| 11/10/08 | | Chilean Peso
664,750,000 | | United States Dollar
1,076,518 | | | (86,219 | ) | |
| 11/07/08 | | Colombian Peso
858,751,275 | | United States Dollar
395,556 | | | (35,634 | ) | |
| 11/28/08 | | Colombian Peso
935,300,000 | | United States Dollar
394,475 | | | (4,085 | ) | |
| 11/05/08 | | Czech Republic Koruna
15,900,434 | | United States Dollar
798,616 | | | 46,632 | | |
| 11/04/08 | | Euro
79,143 | | United States Dollar
100,576 | | | 295 | | |
| 11/04/08 | | Euro
2,430,000 | | USD
3,107,970 | | | (10,813 | ) | |
| 11/12/08 | | Euro
1,510,000 | | United States Dollar
1,921,898 | | | 2,077 | | |
| Settlement Date | | In Exchange For | | Deliver | | Net Unrealized
Appreciation
(Depreciation) | |
| 11/05/08 | | Hungarian Forint
213,256,974 | | Euro
776,044 | | $ | 58,184 | | |
| 11/24/08 | | Indonesian Rupiah
3,923,000,000 | | United States Dollar
388,416 | | | (45,296 | ) | |
| 11/24/08 | | Indonesian Rupiah
14,640,000,000 | | USD
1,431,085 | | | (150,619 | ) | |
| 11/03/08 | | Mauritian Rupee
8,925,000 | | United States Dollar
317,729 | | | (40,124 | ) | |
| 11/07/08 | | Mauritian Rupee
8,925,000 | | United States Dollar
283,132 | | | (5,613 | ) | |
| 11/17/08 | | Mauritian Rupee
2,794,244 | | United States Dollar
93,142 | | | (6,346 | ) | |
| 11/06/08 | | Mexican Peso
490,000 | | United States Dollar
37,262 | | | 795 | | |
| 11/07/08 | | Mexican Peso
3,870,000 | | United States Dollar
284,454 | | | 16,032 | | |
| 11/28/08 | | Mexican Peso
68,259,552 | | United States Dollar
4,964,331 | | | 302,325 | | |
| 11/04/08 | | New Turkish Lira
4,827,560 | | United States Dollar
3,154,650 | | | 432 | | |
| 11/03/08 | | Polish Zloty
833,150 | | United States Dollar
308,860 | | | (7,725 | ) | |
| 11/05/08 | | Polish Zloty
1,020,837 | | United States Dollar
366,249 | | | 2,691 | | |
| 11/14/08 | | Polish Zloty
4,288,000 | | Euro
1,114,345 | | | 128,748 | | |
| 11/10/08 | | Polish Zloty
480,000 | | Euro
135,130 | | | 1,210 | | |
| 11/07/08 | | Russian Rouble
24,965,000 | | United States Dollar
932,835 | | | (13,871 | ) | |
| 11/05/08 | | South African Rand
10,671,800 | | United States Dollar
963,985 | | | 127,454 | | |
| 11/07/08 | | South African Rand
43,476,294 | | United States Dollar
4,257,582 | | | 186,390 | | |
| 11/05/08 | | Ugandan Shilling
439,470,000 | | United States Dollar
231,513 | | | (271 | ) | |
| 11/04/08 | | Zambian Kwacha
310,000,000 | | United States Dollar
65,957 | | | 3,394 | | |
| | | | | | | $ | 464,661 | | |
At October 31, 2008, closed forward foreign currency purchases and sales contracts excluded above amounted to a receivable of $209,802 and a payable of $194,333.
23
Emerging Markets Local Income Portfolio as of October 31, 2008
NOTES TO FINANCIAL STATEMENTS CONT'D
Futures Contracts
Expiration
Date | | Contracts | | Position | | Aggregate
Cost | | Value | | Net
Unrealized
Appreciation | |
| 12/08 | | 8 Mexico Bolsa Index | | Short | | $ | (131,571 | ) | | $ | (129,069 | ) | | $ | 2,502 | | |
| 12/08 | | 6 FTSE/JSE Top 40 Index | | Short | | | (146,768 | ) | | | (119,098 | ) | | | 27,670 | | |
| | | | | | | | | | | $ | 30,172 | | |
Descriptions of the underlying instruments to Futures Contracts:
• Mexico Bolsa Index: Mexico Bolsa Index is a capitalization weighted index of the leading stocks traded on the Mexican stock exchange.
• FTSE/JSE Top 40 Index: The FTSE/JSE Top 40 Index is a capitalization weighted index of the 40 largest companies by market capitalization included in the FTSE/JSE All Shares Index.
Interest Rate Swaps
| Counterparty | | Notional
Amount
(000's
omitted) | | Portfolio
Pays/
Receives
Floating
Rate | | Floating
Rate Index | | Annual
Fixed Rate | | Termination
Date | | Net
Unrealized
Depreciation | |
| Citigroup | | | | | | | | Mexican Interbank | | | | | | | | |
| | |
| Global Markets | | MXN | 50,000 | | | Pay | | Deposit Rate | | | 9.08 | % | | 8/6/13 | | $ | (18,604 | ) | |
| J.P. Morgan | | | | | | | | 3-month | | | | | | | | |
| | |
| Chase, N.A. | | ZAR | 36,500 | | | Pay | | LIBOR | | | 9.05 | | | 10/12/15 | | | (10,990 | ) | |
| J.P. Morgan | | | | | | | | Brazilian Interbank | | | | | | | | |
| | |
| Chase, N.A. | | BRL | 1,466 | | | Pay | | Deposit Rate | | | 11.34 | | | 1/2/09 | | | (6,288 | ) | |
| J.P. Morgan | | | | | | | | Brazilian Interbank | | | | | | | | |
| | |
| Chase, N.A. | | BRL | 1,272 | | | Pay | | Deposit Rate | | | 12.83 | | | 1/2/12 | | | (67,143 | ) | |
| | | $ | (103,025 | ) | |
BRL - Brazilian Real
MXN - Mexican Pesos
ZAR - South African Rand
Credit Default Swaps
| Counterparty | | Reference
Entity | | Buy/
Sell | | Notional
Amount
(000's
omitted) | | Pay/
Receive
Annual
Fixed
Rate | | Termination
Date | |
Net
Unrealized
Appreciation
(Depreciation) | |
Barclays
Capital
Services, Inc. | | Austria | | Buy | | $ | 300 | | | | 0.44 | % | | 12/20/13 | | $ | 5,063 | | |
Barclays
Capital
Services, Inc. | | Iceland
(Republic of) | | Sell | | | 200 | | | | 1.88 | % | | 03/20/18 | | | (62,408 | ) | |
Barclays
Capital
Services, Inc. | | Kazakhstan | | Sell | | | 300 | | | | 9.75 | | | 11/20/09 | | | 5,286 | | |
| Counterparty | | Reference
Entity | | Buy/
Sell | | Notional
Amount
(000s
omitted) | | Pay/
Receive
Annual
Fixed
Rate | | Termination
Date | |
Net
Unrealized
Appreciation
(Depreciation) | |
Barclays
Capital
Services, Inc. | | Kazakhstan | | Buy | | $ | 300 | | | | 2.43 | | | 09/20/13 | | $ | 55,199 | | |
Barclays
Capital
Services, Inc. | | Turkey
(Republic of) | | Buy | | | 1,190 | | | | 2.12 | | | 01/20/13 | | | 112,129 | | |
Citigroup
Global Markets | | Kazakhstan | | Sell | | | 300 | | | | 8.00 | | | 10/20/09 | | | 63 | | |
Citigroup
Global Markets | | Peru
(Republic of) | | Sell | | | 300 | | | | 2.00 | | | 09/20/11 | | | (7,568 | ) | |
Citigroup
Global Markets | | Peru
(Republic of) | | Sell | | | 100 | | | | 2.90 | | | 10/20/13 | | | (2,016 | ) | |
J.P. Morgan
Chase, N.A. | | Brazil | | Sell | | | 300 | | | | 5.25 | | | 11/20/09 | | | 5,438 | | |
J.P. Morgan
Chase, N.A. | | Iceland
(Republic of) | | Sell | | | 300 | | | | 1.70 | | | 03/20/18 | | | (96,513 | ) | |
J.P. Morgan
Chase, N.A. | | Iceland
(Republic of) | | Sell | | | 500 | | | | 1.75 | | | 03/20/18 | | | (159,512 | ) | |
J.P. Morgan
Chase, N.A. | | Iceland
(Republic of) | | Sell | | | 100 | | | | 1.90 | | | 03/20/18 | | | (31,096 | ) | |
J.P. Morgan
Chase, N.A. | | Iceland
(Republic of) | | Sell | | | 200 | | | | 2.10 | | | 03/20/23 | | | (60,097 | ) | |
J.P. Morgan
Chase, N.A. | | Iceland
(Republic of) | | Sell | | | 200 | | | | 2.45 | | | 03/20/23 | | | (55,389 | ) | |
| | | | | | | | | | | | | | | | | $ | (291,421 | ) | |
Total Return Swaps
| Counterparty | | Notional
Amount | | Expiration
Date | | Portfolio
Pays | | Portfolio
Receives | | Net
Unrealized
Depreciation | |
| | | | | | | | Total Return | |
| |
| J.P. Morgan | | | | | | 1-month USD- | | on J.P. Morgan | |
| |
| Chase Bank | | $ | 189,525 | | | 7/23/09 | | LIBOR-BBA+50bp | | Abu Dhabi Index | | $ | (21,252 | ) | |
| | | $ | (21,252 | ) | |
At October 31, 2008, the Portfolio had sufficient cash and/or securities to cover commitments under these contracts.
6 Line of Credit
The Portfolio participates with other portfolios and funds managed by EVM and its affiliates in a $450 million unsecured line of credit agreement with a group of banks. Borrowings are made by the Portfolio solely to facilitate the handling of unusual and/or unanticipated short-term cash requirements. Interest is charged to the Portfolio based on its borrowings at an amount above either the Eurodollar rate or Federal Funds rate. In addition, a fee computed at an annual rate of 0.10% on the daily unused portion of the line of credit is allocated among the participating portfolios
24
Emerging Markets Local Income Portfolio as of October 31, 2008
NOTES TO FINANCIAL STATEMENTS CONT'D
and funds at the end of each quarter. The Portfolio did not have any significant borrowings or allocated fees during the year ended October 31, 2008.
7 Risks Associated with Foreign Investments
Investing in securities issued by entities whose principal business activities are outside the United States may involve significant risks not present in domestic investments. For example, there is generally less publicly available information about foreign companies, particularly those not subject to the disclosure and reporting requirements of the U.S. securities laws. Certain foreign issuers are generally not bound by uniform accounting, auditing, and financial reporting requirements and standards of practice comparable to those applicable to domestic issuers. Investments in foreign securities also involve the risk of possible adverse changes in investment or exchange control regulations, expropriation or confiscatory taxation, limitation on the removal of funds or other assets of the Portfolio, political or financial instability or diplomatic and other developments which could affect such investments. Foreign stock markets, while growing in volume and sophistication, are generally not as developed as those in the United States, and securities of some foreign issuers (particularly those located in developing countries) may be less liquid and more volatile than securities of comparable U.S. companies. In general, there is less overall governmental supervision and regulation of foreign securities markets, broker-dealers and issuers than in the United States.
8 Recently Issued Accounting Pronouncements
In September 2006, the Financial Accounting Standards Board (FASB) issued Statement of Financial Accounting Standards No. 157 (FAS 157), "Fair Value Measurements". FAS 157 defines fair value, establishes a framework for measuring fair value in accordance with accounting principles generally accepted in the United States of America and expands disclosure about fair value measurements. FAS 157 is effective for fiscal years beginning after November 15, 2007. As of October 31, 2008, management does not believe the adoption of FAS 157 will impact the amounts reported in the financial statements; however, additional disclosures may be required about the inputs used to develop the measurements of fair value and the effect of certain of the measurements on changes in net assets for the period.
In March 2008, the FASB issued Statement of Financial Accounting Standards No. 161 (FAS 161), "Disclosures about Derivative Instruments and Hedging Activities". FAS 161 requires enhanced disclosures about an entity's derivative and hedging activities, including qualitative disclosures about the objectives and strategies for using derivatives, quantitative disclosures about fair value amounts of and gains and losses on derivative instruments, and disclosures about credit-risk related contingent features in derivative instruments. FAS 161 is effective for fiscal years and interim periods beginning after November 15, 2008. Management is currently evaluating the impact the adoption of FAS 161 will have on the Portfolio's financial statement disclosures.
25
Emerging Markets Local Income Portfolio as of October 31, 2008
REPORT OF INDEPENDENT REGISTERED PUBLIC ACCOUNTING FIRM
To the Trustees and Investors of Emerging
Markets Local Income Portfolio (formerly Emerging Markets Income Portfolio):
We have audited the accompanying statement of assets and liabilities of Emerging Markets Local Income Portfolio (the "Portfolio") (formerly Emerging Markets Income Portfolio), including the portfolio of investments, as of October 31, 2008, the related statement of operations for the year then ended and the statements of changes in net assets and the supplementary data for the year then ended and for the period from the start of business, June 27, 2007, to October 31, 2007. These financial statements and supplementary data are the responsibility of the Portfolio's management. Our responsibility is to express an opinion on these financial statements and supplementary data based on our audits.
We conducted our audits in accordance with the standards of the Public Company Accounting Oversight Board (United States). Those standards require that we plan and perform the audit to obtain reasonable assurance about whether the financial statements and supplementary data are free of material misstatement. The Portfolio is not required to have, nor were we engaged to perform, an audit of its internal control over financial reporting. Our audits included consideration of internal control over financial reporting as a basis for designing audit procedures that are appropriate in the circumstances, but not for the purpose of expressing an opinion on the effectiveness of the Portfolio's internal control over financial reporting. Accordingly, we express no such opinion. An audit also includes examining, on a test basis, evidence supporting the amounts and disclosures in the financial statements, assessing the accounting principles u sed and significant estimates made by management, as well as evaluating the overall financial statement presentation. Our procedures included confirmation of securities owned as of October 31, 2008, by correspondence with the custodian and brokers; where replies were not received from brokers, we performed other auditing procedures. We believe that our audits provide a reasonable basis for our opinion.
In our opinion, the financial statements and supplementary data referred to above present fairly, in all material respects, the financial position of Emerging Markets Local Income Portfolio as of October 31, 2008, the results of its operations for the year then ended and the changes in its net assets and the supplementary data for the year then ended and for the period from the start of business, June 27, 2007, to October 31, 2007, in conformity with accounting principles generally accepted in the United States of America.
DELOITTE & TOUCHE LLP
Boston, Massachusetts
December 18, 2008
26
Eaton Vance Emerging Markets Local Income Fund
Emerging Markets Local Income Portfolio
SPECIAL MEETING OF SHAREHOLDERS (Unaudited)
Eaton Vance Emerging Markets Local Income Fund
The Fund held a Special Meeting of Shareholders on November 14, 2008 to elect Trustees. The results of the vote were as follows:
| | | Number of Shares | |
| Nominee for Trustee | | For | | Withheld | |
| Benjamin C. Esty | | | 739,936 | | | | 1,223 | | |
| Thomas E. Faust Jr. | | | 739,936 | | | | 1,223 | | |
| Allen R. Freedman | | | 739,936 | | | | 1,223 | | |
| William H. Park | | | 739,936 | | | | 1,223 | | |
| Ronald A. Pearlman | | | 739,936 | | | | 1,223 | | |
| Helen Frame Peters | | | 741,159 | | | | 0 | | |
| Heidi L. Steiger | | | 741,159 | | | | 0 | | |
| Lynn A. Stout | | | 741,159 | | | | 0 | | |
| Ralph F. Verni | | | 739,936 | | | | 1,223 | | |
Each nominee was also elected a Trustee of the Portfolio.
Emerging Markets Local Income Portfolio
The Portfolio held a Special Meeting of Interestholders on November 14, 2008 to elect Trustees. The results of the vote were as follows:
| | | Interest in the Portfolio | |
| Nominee for Trustee | | For | | Withheld | |
| Benjamin C. Esty | | | 87 | % | | | 1 | % | |
| Thomas E. Faust Jr. | | | 87 | % | | | 1 | % | |
| Allen R. Freedman | | | 87 | % | | | 1 | % | |
| William H. Park | | | 87 | % | | | 1 | % | |
| Ronald A. Pearlman | | | 87 | % | | | 1 | % | |
| Helen Frame Peters | | | 87 | % | | | 1 | % | |
| Heidi L. Steiger | | | 87 | % | | | 1 | % | |
| Lynn A. Stout | | | 87 | % | | | 1 | % | |
| Ralph F. Verni | | | 87 | % | | | 1 | % | |
Results are rounded to the nearest whole number.
27
Eaton Vance Emerging Markets Local Income Fund
BOARD OF TRUSTEES' ANNUAL APPROVAL OF THE INVESTMENT ADVISORY AGREEMENT
Overview of the Contract Review Process
The Investment Company Act of 1940, as amended (the "1940 Act"), provides, in substance, that each investment advisory agreement between a fund and its investment adviser will continue in effect from year to year only if its continuance is approved at least annually by the fund's board of trustees, including by a vote of a majority of the trustees who are not "interested persons" of the fund ("Independent Trustees"), cast in person at a meeting called for the purpose of considering such approval.
At a meeting of the Boards of Trustees (each a "Board") of the Eaton Vance group of mutual funds (the "Eaton Vance Funds") held on April 21, 2008, the Board, including a majority of the Independent Trustees, voted to approve continuation of existing advisory and sub-advisory agreements for the Eaton Vance Funds for an additional one-year period. In voting its approval, the Board relied upon the affirmative recommendation of the Contract Review Committee of the Board (formerly the Special Committee), which is a committee comprised exclusively of Independent Trustees. Prior to making its recommendation, the Contract Review Committee reviewed information furnished for a series of meetings of the Contract Review Committee held in February, March and April 2008. Such information included, among other things, the following:
Information about Fees, Performance and Expenses
• An independent report comparing the advisory and related fees paid by each fund with fees paid by comparable funds;
• An independent report comparing each fund's total expense ratio and its components to comparable funds;
• An independent report comparing the investment performance of each fund to the investment performance of comparable funds over various time periods;
• Data regarding investment performance in comparison to relevant peer groups of funds and appropriate indices;
• Comparative information concerning fees charged by each adviser for managing other mutual funds and institutional accounts using investment strategies and techniques similar to those used in managing the fund;
• Profitability analyses for each adviser with respect to each fund;
Information about Portfolio Management
• Descriptions of the investment management services provided to each fund, including the investment strategies and processes employed, and any changes in portfolio management processes and personnel;
• Information concerning the allocation of brokerage and the benefits received by each adviser as a result of brokerage allocation, including information concerning the acquisition of research through "soft dollar" benefits received in connection with the funds' brokerage, and the implementation of a soft dollar reimbursement program established with respect to the funds;
• Data relating to portfolio turnover rates of each fund;
• The procedures and processes used to determine the fair value of fund assets and actions taken to monitor and test the effectiveness of such procedures and processes;
Information about each Adviser
• Reports detailing the financial results and condition of each adviser;
• Descriptions of the qualifications, education and experience of the individual investment professionals whose responsibilities include portfolio management and investment research for the funds, and information relating to their compensation and responsibilities with respect to managing other mutual funds and investment accounts;
• Copies of the Codes of Ethics of each adviser and its affiliates, together with information relating to compliance with and the administration of such codes;
• Copies of or descriptions of each adviser's proxy voting policies and procedures;
• Information concerning the resources devoted to compliance efforts undertaken by each adviser and its affiliates on behalf of the funds (including descriptions of various compliance programs) and their record of compliance with investment policies and restrictions, including policies with respect to market-timing, late trading and selective portfolio disclosure, and with policies on personal securities transactions;
• Descriptions of the business continuity and disaster recovery plans of each adviser and its affiliates;
Other Relevant Information
• Information concerning the nature, cost and character of the administrative and other non-investment management services provided by Eaton Vance Management and its affiliates;
• Information concerning management of the relationship with the custodian, subcustodians and fund accountants by each adviser or the funds' administrator; and
• The terms of each advisory agreement.
28
Eaton Vance Emerging Markets Local Income Fund
BOARD OF TRUSTEES' ANNUAL APPROVAL OF THE INVESTMENT ADVISORY AGREEMENT CONT'D
In addition to the information identified above, the Contract Review Committee considered information provided from time to time by each adviser throughout the year at meetings of the Board and its committees. Over the course of the twelve-month period ended April 30, 2008, the Board met eleven times and the Contract Review Committee, the Audit Committee and the Governance Committee, each of which is a Committee comprised solely of Independent Trustees, met twelve, seven and five times, respectively. At such meetings, the Trustees received, among other things, presentations by the portfolio managers and other investment professionals of each adviser relating to the investment performance of each fund and the investment strategies used in pursuing the fund's investment objective. The Portfolio Management Committee and the Compliance Reports and Regulatory Matters Committee are newly established and did not meet during the twelve- month period ended April 30, 2008.
For funds that invest through one or more underlying portfolios, the Board considered similar information about the portfolio(s) when considering the approval of advisory agreements. In addition, in cases where the fund's investment adviser has engaged a sub-adviser, the Board considered similar information about the sub-adviser when considering the approval of any sub-advisory agreement.
The Contract Review Committee was assisted throughout the contract review process by Goodwin Procter LLP, legal counsel for the Independent Trustees. The members of the Contract Review Committee relied upon the advice of such counsel and their own business judgment in determining the material factors to be considered in evaluating each advisory and sub-advisory agreement and the weight to be given to each such factor. The conclusions reached with respect to each advisory and sub-advisory agreement were based on a comprehensive evaluation of all the information provided and not any single factor. Moreover, each member of the Contract Review Committee may have placed varying emphasis on particular factors in reaching conclusions with respect to each advisory and sub-advisory agreement.
Results of the Process
Based on its consideration of the foregoing, and such other information as it deemed relevant, including the factors and conclusions described below, the Contract Review Committee concluded that the continuance of the investment advisory agreement of the Eaton Vance Emerging Markets Local Income Fund (formerly, Eaton Vance Emerging Markets Income Fund) (the "Fund") with Eaton Vance Management ("EVM"), as well as the terms of the investment advisory agreement of the Emerging Markets Local Income Portfolio (formerly, Eaton Vance Emerging Markets Income Portfolio) (the "Portfolio"), the portfolio in which the Fund will invest substantially all of its assets, with Boston Management and Research ("BMR"), an affiliate of EVM (EVM, with respect to the Fund, and BMR, with respect to the Portfolio, are each referred to herein as the "Adviser"), including the fee structure of each agreement, is in the interests of shareholders and, theref ore, the Contract Review Committee recommended to the Board approval of the agreements. The Board accepted the recommendation of the Contract Review Committee as well as the factors considered and conclusions reached by the Contract Review Committee with respect to the agreements. Accordingly, the Board, including a majority of the Independent Trustees, voted to approve the investment advisory agreements for the Fund and the Portfolio.
Nature, Extent and Quality of Services
In considering whether to approve the investment advisory agreements of the Fund and the Portfolio, the Board evaluated the nature, extent and quality of services provided to the Fund by EVM and the Portfolio by BMR. The Board considered EVM's and BMR's management capabilities and investment process with respect to the types of investments to be held by the Fund and the Portfolio, including the education, experience and number of its investment professionals and other personnel who provide portfolio management, investment research, and similar services to the Portfolio and the Fund. The Board specifically noted EVM's and BMR's expertise with respect to emerging markets and in-house research capabilities. The Board also took into account the resources dedicated to portfolio management and other services, including the compensation paid to recruit and retain investment personnel, and the time and attention devoted to the Fund and Portfolio by senior management.
The Board noted that under the terms of the investment advisory agreement of the Fund, EVM may invest assets of the Fund directly in securities, for which it may receive a fee, or in the Portfolio, for which it receives no separate fee but for which BMR receives an advisory fee from the Portfolio. The Trustees considered the potential benefits to the Fund of the ability to make direct investments, such as an improved ability to: manage the Fund's duration, or other general market exposures, using certain derivatives; add exposure to specific market sectors or asset classes without changing the Portfolio's investments, which would affect any other fund investing in the Portfolio; hedge some of the general market risks of the Portfolio while retaining the value added by the individual manager; and hedge a portion of the exposures of the Portfolio while retaining others (e.g., hedging the U.S. government exposure of the Portfolio w hile retaining its exposure to high-grade corporate bonds).
The Board also reviewed the compliance programs of the Adviser and relevant affiliates thereof. Among other matters, the Board considered compliance and reporting matters relating to personal trading by investment personnel, selective disclosure of portfolio
29
Eaton Vance Emerging Markets Local Income Fund
BOARD OF TRUSTEES' ANNUAL APPROVAL OF THE INVESTMENT ADVISORY AGREEMENT CONT'D
holdings, late trading, frequent trading, portfolio valuation, business continuity and the allocation of investment opportunities. The Board also evaluated the responses of the Adviser and its affiliates to requests from regulatory authorities such as the Securities and Exchange Commission.
The Board considered shareholder and other administrative services provided or managed by EVM and its affiliates, including transfer agency and accounting services. The Board evaluated the benefits to shareholders of investing in a fund that is a part of a large family of funds, including the ability, in many cases, to exchange an investment among different funds without incurring additional sales charges.
After consideration of the foregoing factors, among others, the Board concluded that the nature, extent and quality of services provided by the Adviser, taken as a whole, are appropriate and consistent with the terms of the investment advisory agreements.
Fund Performance
The Board compared the Fund's investment performance to a relevant universe of similarly managed funds identified by an independent data provider and appropriate benchmark indices. The Board reviewed comparative performance data for the period from inception (June 2007) through September 30, 2007 for the Fund. On the basis of the foregoing and other relevant information, the Board concluded that the performance of the Fund was satisfactory.
Management Fees and Expenses
The Board reviewed contractual investment advisory fee rates to be paid by the Fund directly or indirectly through its pro rata share of the expenses of the Portfolio (referred to as "management fees"). As part of its review, the Board considered the Fund's management fees and estimated expense ratio for the period from inception through September 30, 2007, as compared to a group of similarly managed funds selected by an independent data provider. The Board considered the fact that the Adviser had waived fees and/or paid expenses for the Fund.
After reviewing the foregoing information, and in light of the nature, extent and quality of the services provided by the Adviser, the Board concluded that the management fees proposed to be charged for advisory and related services and the Fund's total expense ratio are reasonable.
Profitability
The Board reviewed the level of profits realized by the Adviser and relevant affiliates thereof in providing investment advisory and administrative services to the Portfolio, the Fund and all Eaton Vance Funds as a group. The Board considered the level of profits realized without regard to revenue sharing or other payments by the Adviser and its affiliates to third parties in respect of distribution services. The Board also considered other direct or indirect benefits received by the Adviser in connection with its relationship with the Fund.
The Board concluded that, in light of the foregoing factors and the nature, extent and quality of the services rendered, the profits realized by the Adviser and its affiliates are reasonable.
Economies of Scale
In reviewing management fees and profitability, the Board also considered the extent to which the Adviser and its affiliates, on the one hand, and the Fund and the Portfolio, on the other hand, can expect to realize benefits from economies of scale as the assets of the Fund and the Portfolios increase. The Board noted the structure of the advisory fee, which includes breakpoints at several asset levels both at the Fund and at the Portfolio level. Based upon the foregoing, the Board concluded that the Adviser and its affiliates and the Fund and the Portfolio can be expected to share such benefits equitably.
30
Eaton Vance Emerging Markets Local Income Fund
MANAGEMENT AND ORGANIZATION
Fund Management. The Trustees of Eaton Vance Mutual Funds Trust (the Trust) and Emerging Markets Local Income Portfolio (the Portfolio) are responsible for the overall management and supervision of the Trust's and Portfolio's affairs. The Trustees and officers of the Trust and the Portfolio are listed below. Except as indicated, each individual has held the office shown or other offices in the same company for the last five years. Trustees and officers of the Trust and the Portfolio hold indefinite terms of office. The "noninterested Trustees" consist of those Trustees who are not "interested persons" of the Trust and the Portfolio, as that term is defined under the 1940 Act. The business address of each Trustee and officer is The Eaton Vance Building, 255 State Street, Boston, Massachusetts 02109. As used below, "EVC" refers to Eaton Vance Corp., "EV" refer s to Eaton Vance, Inc., "EVM" refers to Eaton Vance Management, "BMR" refers to Boston Management and Research, "Parametric" refers to Parametric Portfolio Associates and "EVD" refers to Eaton Vance Distributors, Inc. EVC and EV are the corporate parent and trustee, respectively, of EVM and BMR. EVD is the Fund's principal underwriter, the Portfolio's placement agent and a wholly-owned subsidiary of EVC. Each officer affiliated with Eaton Vance may hold a position with other Eaton Vance affiliates that is comparable to his or her position with EVM listed below.
Name and
Date of Birth | | Position(s)
with the
Trust and
the Portfolio | | Term of
Office and
Length of
Service | | Principal Occupation(s)
During Past Five Years | | Number of Portfolios
in Fund Complex
Overseen By
Trustee(1) | | Other Directorships Held | |
| Interested Trustee | | | | | | | | | | | | | |
|
Thomas E. Faust Jr.
5/31/58 | | Trustee and President of the Trust | | Trustee since 2007 and President of the Trust since 2002 | | Chairman, Chief Executive Officer and President of EVC, Director and President of EV, Chief Executive Officer and President of EVM and BMR, and Director of EVD. Trustee and/or Officer of 173 registered investment companies and 4 private companies managed by EVM or BMR. Mr. Faust is an interested person because of his positions with EVM, BMR, EVD, EVC and EV, which are affiliates of the Trust and Portfolio. | | | 173 | | | Director of EVC | |
|
| Noninterested Trustees | | | | | | | | | | | | | |
|
Benjamin C. Esty
1/2/63 | | Trustee | | Of the Trust since 2005 and of the Portfolio since 2007 | | Roy and Elizabeth Simmons Professor of Business Administration, Harvard University Graduate School of Business Administration. | | | 173 | | | None | |
|
Allen R. Freedman
4/3/40 | | Trustee | | Since 2007 | | Former Chairman (2002-2004) and a Director (1983-2004) of Systems & Computer Technology Corp. (provider of software to higher education). Formerly, a Director of Loring Ward International (fund distributor) (2005-2007). Formerly, Chairman and a Director of Indus International Inc. (provider of enterprise management software to the power generating industry) (2005-2007). | | | 173 | | | Director of Assurant, Inc. and Stonemor Partners L.P. (owner and operator of cemeteries) | |
|
William H. Park
9/19/47 | | Trustee | | Of the Trust since 2003 and of the Portfolio since 2007 | | Vice Chairman, Commercial Industrial Finance Corp. (specialty finance company) (since 2006). Formerly, President and Chief Executive Officer, Prizm Capital Management, LLC (investment management firm) (2002-2005). | | | 173 | | | None | |
|
Ronald A. Pearlman
7/10/40 | | Trustee | | Of the Trust since 2003 and of the Portfolio since 2007 | | Professor of Law, Georgetown University Law Center. | | | 173 | | | None | |
|
Helen Frame Peters
3/22/48 | | Trustee | | Since 2008 | | Professor of Finance, Carroll School of Management, Boston College (since 2003), Adjunct Professor of Finance, Peking University, Beijing, China (since 2005). Formerly, Dean, Carroll School of Management, Boston College (2000-2003). | | | 173 | | | Director of Federal Home Loan Bank of Boston (a bank for banks) and BJ's Wholesale Clubs (wholesale club retailer); Trustee of SPDR Index Shares Funds and SPDR Series Trust (exchange traded funds) | |
|
31
Eaton Vance Emerging Markets Local Income Fund
MANAGEMENT AND ORGANIZATION CONT'D
Name and
Date of Birth | | Position(s)
with the
Trust and
the Portfolio | | Term of
Office and
Length of
Service | | Principal Occupation(s)
During Past Five Years | | Number of Portfolios
in Fund Complex
Overseen By
Trustee(1) | | Other Directorships Held | |
| Noninterested Trustees (continued) | | | | | | | | | | | | | |
|
Heidi L. Steiger
7/8/53 | | Trustee | | Since 2007 | | Managing Partner, Topridge Associates LLC (global wealth management firm) (since 2008); Senior Advisor (since 2008), President (2005-2008), Lowenhaupt Global Advisors, LLC (global wealth management firm). Formerly, President and Contributing Editor, Worth Magazine (2004-2005). Formerly, Executive Vice President and Global Head of Private Asset Management (and various other positions), Neuberger Berman (investment firm) (1986-2004). | | | 173 | | | Director of Nuclear Electric Insurance Ltd. (nuclear insurance provider) and Aviva USA (insurance provider) | |
|
Lynn A. Stout
9/14/57 | | Trustee | | Of the Trust since 1998 and of the Portfolio since 2007 | | Paul Hastings Professor of Corporate and Securities Law (since 2006) and Professor of Law (2001-2006), University of California at Los Angeles School of Law. | | | 173 | | | None | |
|
Ralph F. Verni
1/26/43 | | Chairman of the Board and Trustee | | Chairman of the Board and Trustee of the Portfolio since 2007 and Trustee of the Trust since 2005 | | Consultant and private investor. | | | 173 | | | None | |
|
| Principal Officers who are not Trustees | | | | | | | | | | | | | |
|
Name and
Date of Birth | | Position(s)
with the
Trust and
the Portfolio | | Term of
Office and
Length of
Service | | Principal Occupation(s)
During Past Five Years | |
William H. Ahern, Jr.
7/28/59 | | Vice President of the Trust | | Since 1995 | | Vice President of EVM and BMR. Officer of 75 registered investment companies managed by EVM or BMR. | |
|
John R. Baur
2/10/70 | | Vice President | | Since 2007 | | Vice President of EVM and BMR. Previously, attended Johnson Graduate School of Management, Cornell University (2002-2005), and prior thereto he was an Account Team Representative in Singapore for Applied Materials Inc. Officer of 33 registered investment companies managed by EVM or BMR. | |
|
Michael A. Cirami
12/24/75 | | Vice President | | Since 2007 | | Vice President of EVM and BMR. Previously, attended the University of Rochester William E. Simon Graduate School of Business Administration (2001-2003), and prior thereto he was a Team Leader for the Institutional Services Group for State Street Bank in Luxembourg. Officer of 33 registered investment companies managed by EVM or BMR. | |
|
Cynthia J. Clemson
3/2/63 | | Vice President of the Trust | | Since 2005 | | Vice President of EVM and BMR. Officer of 90 registered investment companies managed by EVM or BMR. | |
|
Charles B. Gaffney
12/4/72 | | Vice President of the Trust | | Since 2007 | | Vice President of EVM and BMR. Previously, Sector Portfolio Manager and Senior Equity Analyst of Brown Brothers Harriman (1997-2003). Officer of 30 registered investment companies managed by EVM or BMR. | |
|
Christine M. Johnston
11/9/72 | | Vice President | | Since 2007 | | Vice President of EVM and BMR. Officer of 35 registered investment companies managed by EVM or BMR. | |
|
Aamer Khan
6/7/60 | | Vice President
of the Trust | | Since 2005 | | Vice President of EVM and BMR. Officer of 33 registered investment companies managed by EVM or BMR. | |
|
Thomas H. Luster
4/8/62 | | Vice President of the Trust | | Since 2006 | | Vice President of EVM and BMR. Officer of 51 registered investment companies managed by EVM or BMR. | |
|
Robert B. MacIntosh
1/22/57 | | Vice President of the Trust | | Since 1998 | | Vice President of EVM and BMR. Officer of 90 registered investment companies managed by EVM or BMR. | |
|
32
Eaton Vance Emerging Markets Local Income Fund
MANAGEMENT AND ORGANIZATION CONT'D
Name and
Date of Birth | | Position(s)
with the
Trust and
the Portfolio | | Term of
Office and
Length of
Service | | Principal Occupation(s)
During Past Five Years | |
| Principal Officers who are not Trustees (continued) | | | | | | | |
|
Duncan W. Richardson
10/26/57 | | Vice President of the Trust | | Since 2001 | | Executive Vice President and Chief Equity Investment Officer of EVC, EVM and BMR. Officer of 81 registered investment companies managed by EVM or BMR. | |
|
Judith A. Saryan
8/21/54 | | Vice President of the Trust | | Since 2003 | | Vice President of EVM and BMR. Officer of 55 registered investment companies managed by EVM or BMR. | |
|
Susan Schiff
3/13/61 | | Vice President | | Of the Trust since 2002 and of the Portfolio since 2007 | | Vice President of EVM and BMR. Officer of 36 registered investment companies managed by EVM or BMR. | |
|
Thomas Seto
9/27/62 | | Vice President of the Trust | | Since 2007 | | Vice President and Director of Portfolio Management of Parametric. Officer of 31 registered investment companies managed by EVM or BMR. | |
|
David M. Stein
5/4/51 | | Vice President of the Trust | | Since 2007 | | Managing Director and Chief Investment Officer of Parametric. Officer of 31 registered investment companies managed by EVM or BMR. | |
|
Mark S. Venezia
5/23/49 | | Vice President of the Trust and President of the Portfolio | | Since 2007 | | Vice President of EVM and BMR. Officer of 36 registered investment companies managed by EVM or BMR. | |
|
Adam A. Weigold
3/22/75 | | Vice President of the Trust | | Since 2007 | | Vice President of EVM and BMR. Officer of 71 registered investment companies managed by EVM or BMR. | |
|
Barbara E. Campbell
6/19/57 | | Treasurer | | Of the Trust since 2005 and of the Portfolio since 2008(2) | | Vice President of EVM and BMR. Officer of 173 registered investment companies managed by EVM or BMR. | |
|
Maureen A. Gemma
5/24/60 | | Secretary and Chief Legal Officer | | Secretary since 2007 and Chief Legal Officer since 2008 | | Vice President of EVM and BMR. Officer of 173 registered investment companies managed by EVM or BMR. | |
|
Paul M. O'Neil
7/11/53 | | Chief Compliance Officer | | Of the Trust since 2004 and of the Portfolio since 2007 | | Vice President of EVM and BMR. Officer of 173 registered investment companies managed by EVM or BMR. | |
|
(1) Includes both master and feeder funds in a master-feeder structure.
(2) Prior to 2008, Ms. Campbell served as Assistant Treasurer of the Portfolio since 2007.
The SAI for the Fund includes additional information about the Trustees and officers of the Fund and the Portfolio and can be obtained without charge on Eaton Vance's website at www.eatonvance.com or by calling 1-800-262-1122.
33
This Page Intentionally Left Blank
This Page Intentionally Left Blank
This Page Intentionally Left Blank
Investment Adviser of Emerging Markets Local Income Portfolio
Boston Management and Research
The Eaton Vance Building
255 State Street
Boston, MA 02109
Investment Adviser and Administrator of Eaton Vance Emerging Markets Local Income Fund
Eaton Vance Management
The Eaton Vance Building
255 State Street
Boston, MA 02109
Principal Underwriter
Eaton Vance Distributors, Inc.
The Eaton Vance Building
255 State Street
Boston, MA 02109
(617) 482-8260
Custodian
State Street Bank and Trust Company
200 Clarendon Street
Boston, MA 02116
Transfer Agent
PNC Global Investment Servicing
Attn: Eaton Vance Funds
P.O. Box 9653
Providence, RI 02940-9653
(800) 262-1122
Independent Registered Public Accounting Firm
Deloitte & Touche LLP
200 Berkeley Street
Boston, MA 02116-5022
Eaton Vance Emerging Markets Local Income Fund
The Eaton Vance Building
255 State Street
Boston, MA 02109
This report must be preceded or accompanied by a current prospectus. Before investing, investors should consider carefully the Fund's investment objective(s), risks, and charges and expenses. The Fund's current prospectus contains this and other information about the Fund and is available through your financial advisor. Please read the prospectus carefully before you invest or send money. For further information please call 1-800-262-1122.
3040-12/08 EMISRC

Annual Report October 31, 2008


EATON VANCE LARGE-CAP
CORE RESEARCH
FUND
IMPORTANT NOTICES REGARDING PRIVACY,
DELIVERY OF SHAREHOLDER DOCUMENTS,
PORTFOLIO HOLDINGS AND PROXY VOTING
Privacy. The Eaton Vance organization is committed to ensuring your financial privacy. Each of the financial institutions identified below has in effect the following policy ("Privacy Policy") with respect to nonpublic personal information about its customers:
• Only such information received from you, through application forms or otherwise, and information about your Eaton Vance fund transactions will be collected. This may include information such as name, address, social security number, tax status, account balances and transactions.
• None of such information about you (or former customers) will be disclosed to anyone, except as permitted by law (which includes disclosure to employees necessary to service your account). In the normal course of servicing a customer's account, Eaton Vance may share information with unaffiliated third parties that perform various required services such as transfer agents, custodians and broker/dealers.
• Policies and procedures (including physical, electronic and procedural safeguards) are in place that are designed to protect the confidentiality of such information.
• We reserve the right to change our Privacy Policy at any time upon proper notification to you. Customers may want to review our Policy periodically for changes by accessing the link on our homepage: www.eatonvance.com.
Our pledge of privacy applies to the following entities within the Eaton Vance organization: the Eaton Vance Family of Funds, Eaton Vance Management, Eaton Vance Investment Counsel, Boston Management and Research, and Eaton Vance Distributors, Inc.
In addition, our Privacy Policy only applies to those Eaton Vance customers who are individuals and who have a direct relationship with us. If a customer's account (i.e., fund shares) is held in the name of a third-party financial adviser/ broker-dealer, it is likely that only such adviser's privacy policies apply to the customer. This notice supersedes all previously issued privacy disclosures.
For more information about Eaton Vance's Privacy Policy, please call 1-800-262-1122.
Delivery of Shareholder Documents. The Securities and Exchange Commission (the "SEC") permits funds to deliver only one copy of shareholder documents, including prospectuses, proxy statements and shareholder reports, to fund investors with multiple accounts at the same residential or post office box address. This practice is often called "householding" and it helps eliminate duplicate mailings to shareholders.
Eaton Vance, or your financial adviser, may household the mailing of your documents indefinitely unless you instruct Eaton Vance, or your financial adviser, otherwise.
If you would prefer that your Eaton Vance documents not be householded, please contact Eaton Vance at 1-800-262-1122, or contact your financial adviser.
Your instructions that householding not apply to delivery of your Eaton Vance documents will be effective within 30 days of receipt by Eaton Vance or your financial adviser.
Portfolio Holdings. Each Eaton Vance Fund and its underlying Portfolio (if applicable) will file a schedule of its portfolio holdings on Form N-Q with the SEC for the first and third quarters of each fiscal year. The Form N-Q will be available on the Eaton Vance website www.eatonvance.com, by calling Eaton Vance at 1-800-262-1122 or in the EDGAR database on the SEC's website at www.sec.gov. Form N-Q may also be reviewed and copied at the SEC's public reference room in Washington, D.C. (call 1-800-732-0330 for information on the operation of the public reference room).
Proxy Voting. From time to time, funds are required to vote proxies related to the securities held by the funds. The Eaton Vance Funds or their underlying Portfolios (if applicable) vote proxies according to a set of policies and procedures approved by the Funds' and Portfolios' Boards. You may obtain a description of these policies and procedures and information on how the Funds or Portfolios voted proxies relating to portfolio securities during the most recent 12 month period ended June 30, without charge, upon request, by calling 1-800-262-1122. This description is also available on the SEC's website at www.sec.gov.
Eaton Vance Large-Cap Core Research Fund as of October 31, 2008
MANAGEMENT’S DISCUSSION OF FUND PERFORMANCE

Charles B. Gaffney
Portfolio Manager
Economic and Market Conditions
· The stock market moved dramatically lower during the fiscal year ended October 31, 2008. After reaching record highs in October 2007, the major market indices began to decline at the end of 2007, as investors realized that the difficulties in subprime lending and the troubled housing market were likely to slow the economy significantly. By the summer of 2008, the magnitude of the damage became increasingly apparent. Many banks were faced with enormous write-offs from bad real estate loans, losses that severely impaired their overall lending capacity. As the market declined further, investor and consumer sentiment worsened. That trend was accelerated by soaring energy prices, as oil hit $145 per barrel in July 2008 and pinched consumers even more.
· The failure of Lehman Brothers in September 2008 and the tenuous condition of other capital-starved banks and financial institutions sparked fears of a global financial collapse. In late September 2008, in an effort to jump-start lending, the U.S. Treasury department unveiled a controversial proposal to purchase troubled loans from banks and financial institutions. Congress’s initial rejection of the plan sent the market into a near-freefall. A revised version of the measure was subsequently approved by Congress and was followed by coordinated activity by the world’s central banks to inject liquidity into the global banking system. While those actions reassured many investors, volatility remained high as the one-year period drew to a close.
· For the year ended October 31, 2008, all ten sectors within the S&P 500 Index (the Index) registered negative returns.(2) The consumer staples sector was the best performing sector, posting the smallest loss of all the sectors for the year. All of the other sectors had losses exceeding 20%, with the most severe losses in the financials, information technology and materials sectors. Market-leading industries during the year included road & rail, biotechnology and household products. In contrast, thrifts and mortgage finance, automobiles, real estate and internet & catalog retail were among the year’s worst performing industries.
Management Discussion
· During the year ended October 31, 2008, despite showing losses, the Fund outperformed both the S&P 500 Index and the average return of its Lipper peer group, Large-Cap Core Funds.(2) The Fund’s outperformance, during a very difficult period in the equity markets, came from superior stock selections in a number of sectors. The Fund continued to benefit from its broad diversification and the stock picking expertise of the Fund’s team of supporting analysts.
· The largest contribution to the Fund’s relative outperformance during the period came from the financials sector, where Fund holdings in the insurance industry outperformed similar holdings in the S&P 500 Index. Health care was the second-largest
Eaton Vance Large-Cap Core Research Fund
Total Return Performance 10/31/07 – 10/31/08
Class A(1) | | -31.29 | % |
Class I(1) | | -21.19 | * |
S&P 500 Index(2) | | -36.08 | |
Lipper Large-Cap Core Funds Average(2) | | -36.22 | |
*Performance since share class inception on 9/3/08.
See page 3 for more performance information.
(1) | This return does not include the 5.75% maximum sales charge for Class A shares. Class I shares are not subject to a sales charge. If the sales charge was deducted, the return would be lower. Absent contractual and voluntary expense limitations by the adviser and the administrator, the returns would be lower. |
(2) | It is not possible to invest directly in an Index or a Lipper Classification. The Index’s total return does not reflect commissions or expenses that would have been incurred if an investor individually purchased or sold the securities represented in the Index. The Lipper total return is the average total return, at net asset value, of the funds that are in the same Lipper Classification as the Fund. |
Past performance is no guarantee of future results. Returns are historical and are calculated by determining the percentage change in net asset value or offering price (as applicable) with all distributions reinvested. Investment return and principal value will fluctuate so that shares, when redeemed, may be worth more or less than their original cost. Performance is for the stated time period only; due to market volatility, the Fund’s current performance may be lower or higher than the quoted return. Absent an expense limitation or waiver in effect for certain periods, performance would have been lower. For performance as of the most recent month end, please refer to www.eatonvance.com.
Fund shares are not insured by the FDIC and are not deposits or other obligations of, or guaranteed by, any depository institution. Shares are subject to investment risks, including possible loss of principal invested.
The views expressed throughout this report are those of the investment team leader and are current only through the end of the period of the report as stated on the cover. These views are subject to change at any time based upon market or other conditions, and the investment adviser disclaims any responsibility to update such views. These views may not be relied on as investment advice and, because investment decisions for a fund are based on many factors, may not be relied on as an indication of trading intent on behalf of any Eaton Vance fund. Portfolio information provided in the report may not be representative of the Fund’s current or future investments and may change due to active management.
1
Eaton Vance Large-Cap Core Research Fund as of October 31, 2008
PORTFOLIO COMPOSITION
contributing sector, with outperformance seen in the biotechnology and pharmaceutical industries. In the information technology sector, Fund holdings in the IT services and communications equipment industries outperformed.
· Limiting the Fund’s outperformance relative to the Index were holdings in the energy, utilities and consumer discretionary sectors.
· Effective August 18, 2008, the Fund changed its name from Eaton Vance Equity Research Fund to Eaton Vance Large-Cap Core Research Fund. In addition to the name change, the Fund changed its policy of investing at least 80% of net assets in a broadly diversified selection of common stocks to investing at least 80% of net assets in stocks of large-cap companies.
Top Ten Holdings(1)
By net assets
Exxon Mobil Corp. | | 3.3 | % |
Microsoft Corp. | | 2.7 | |
International Business Machines Corp. | | 2.4 | |
Hewlett-Packard Co. | | 2.3 | |
JPMorgan Chase & Co. | | 2.3 | |
Procter & Gamble Co. | | 2.2 | |
PepsiCo, Inc. | | 2.1 | |
Wal-Mart Stores, Inc. | | 1.9 | |
Chevron Corp. | | 1.8 | |
QUALCOMM, Inc. | | 1.6 | |
(1)Top Ten Holdings represented 22.6% of the Fund’s net assets as of 10/31/08. Excludes cash equivalents.
Sector Weightings(2)
By net assets

(2) As a percentage of the Fund’s net assets as of 10/31/08. Excludes cash equivalents.
2
Eaton Vance Large-Cap Core Research Fund as of October 31, 2008
FUND PERFORMANCE
The line graph and table set forth below provide information about the Fund’s performance. The line graph compares the performance of Class A of the Fund with that of the S&P 500 Index, a broad-based, unmanaged market index of common stocks commonly used as a measure of U.S. stock market performance. Prior to August 26, 2005, the Fund was not actively marketed and had few shareholders. The lines on the graph represent the total returns of a hypothetical investment of $10,000 in each of Class A and the S&P 500 Index. Class A returns are presented at net asset value and at maximum public offering price. The table includes the total returns of each class of the Fund at net asset value and maximum public offering price. The performance presented below does not reflect the deduction of taxes, if any, that a shareholder would pay on distributions or redemptions of Fund shares.
Performance(1)
Share Class Symbol | | Class A
EAERX | | Class I
EIERX | |
| | | | | |
Average Annual Total Returns (at net asset value) | | | | | |
One Year | | -31.29 | % | N.A. | |
Five Years | | 3.36 | | N.A. | |
Life of Fund† | | 2.19 | | -21.19 | %†† |
| | | | | |
SEC Average Annual Total Returns (including sales charge) | | | | | |
One Year | | -35.24 | % | N.A. | |
Five Years | | 2.15 | | N.A. | |
Life of Fund† | | 1.33 | | -21.19 | %†† |
† Inception Dates: Class A: 11/01/01; Class I: 9/3/08
†† Returns are cumulative since inception of the share class.
(1) | Average Annual Total Returns do not include the 5.75% maximum sales charge for Class A shares. If the sales charge was deducted, the returns would be lower. SEC Average Annual Total Returns for Class A shares reflect the maximum 5.75% sales charge. Class I shares are not subject to a sales charge. Absent contractual and voluntary expense limitations by the adviser and the administrator, the returns would be lower. |
Total Annual
Operating Expenses(2) | | Class A | | Class I | |
Gross Expense Ratio | | 3.36 | % | 3.10 | % |
Net Expense Ratio | | 1.25 | | 1.00 | % |
(2) | Source: Prospectus dated 3/1/08, as supplemented 6/17/08. The net expense ratio reflects a contractual expense limitation that continues through February 28, 2010. Thereafter, the expense limitation may be changed or terminated at any time. Without this expense limitation, performance would have been lower. |
* | Source: Lipper Inc. Class A of the Fund commenced investment operations on 11/1/01. A $10, 000 investment at net asset value in Class I on 9/3/08 (commencement of operations) would have been valued at $7,881 on 10/31/08. It is not possible to invest directly in an Index. The Index’s total return does not reflect commissions or expenses that would have been incurred if an investor individually purchased or sold the securities represented in the Index. Class I shares are not subject to a sales charge. |
Past performance is no guarantee of future results. Returns are historical and are calculated by determining the percentage change in net asset value or offering price (as applicable) with all distributions reinvested. Investment return and principal value will fluctuate so that shares, when redeemed, may be worth more or less than their original cost. Performance is for the stated time period only; due to market volatility, the Fund’s current performance may be lower or higher than the quoted return. Absent an expense limitation or waiver in effect for certain periods, performance would have been lower. For performance as of the most recent month end, please refer to www.eatonvance.com.
3
Eaton Vance Large-Cap Core Research Fund as of October 31, 2008
FUND EXPENSES
Example: As a shareholder of the Fund, you incur two types of costs: (1) transaction costs, including sales charges (loads) on purchases and redemption fees (if applicable); and (2) ongoing costs, including management fees; distribution or service fees; and other Fund expenses. This Example is intended to help you understand your ongoing costs (in dollars) of investing in the Fund and to compare these costs with the ongoing costs of investing in other mutual funds. The Example is based on an investment of $1,000 invested at the beginning of the period and held for the entire period (May 1, 2008 – October 31, 2008).
Actual Expenses: The first section of the table below provides information about actual account values and actual expenses. You may use the information in this section, together with the amount you invested, to estimate the expenses that you paid over the period. Simply divide your account value by $1,000 (for example, an $8,600 account value divided by $1,000 = 8.6), then multiply the result by the number in the first section under the heading entitled "Expenses Paid During Period" to estimate the expenses you paid on your account during this period.
Hypothetical Example for Comparison Purposes: The second section of the table below provides information about hypothetical account values and hypothetical expenses based on the actual Fund expense ratio and an assumed rate of return of 5% per year (before expenses), which is not the actual return of the Fund. The hypothetical account values and expenses may not be used to estimate the actual ending account balance or expenses you paid for the period. You may use this information to compare the ongoing costs of investing in your Fund and other funds. To do so, compare this 5% hypothetical example with the 5% hypothetical examples that appear in the shareholder reports of the other funds.
Please note that the expenses shown in the table are meant to highlight your ongoing costs only and do not reflect any transactional costs, such as sales charges (loads) or redemption fees (if applicable). Therefore, the second section of the table is useful in comparing ongoing costs only, and will not help you determine the relative total costs of owning different funds. In addition, if these transactional costs were included, your costs would have been higher.
Eaton Vance Large-Cap Core Research Fund
| | | Beginning Account Value
(5/1/08) | | Ending Account Value
(10/31/08) | | Expenses Paid During Period
(5/1/08 – 10/31/08) | |
| Actual* | |
| Class A | | $ | 1,000.00 | | | $ | 734.50 | | | $ | 5.45 | *** | |
| Class I | | $ | 1,000.00 | | | $ | 788.10 | | | $ | 1.45 | *** | |
| Hypothetical** | |
| (5% return per year before expenses) | |
| Class A | | $ | 1,000.00 | | | $ | 1,018.90 | | | $ | 6.34 | *** | |
| Class I | | $ | 1,000.00 | | | $ | 1,020.10 | | | $ | 5.09 | *** | |
* Class I had not commenced operations as of May 1, 2008. Actual expenses are equal to the Fund's annualized expense ratio of 1.25% for Class A shares and 1.00% for Class I shares, multiplied by the average account value over the period, multiplied by 184/366 (to reflect the one-half year period) and by 59/366 for Class I (to reflect the period from commencement of operations on September 3, 2008 to October 31, 2008). The Example assumes that the $1,000 was invested at the net asset value per share determined at the close of business on April 30, 2008 (September 2, 2008 for Class I).
** Hypothetical expenses are equal to the Fund's annualized expense ratio of 1.25% for Class A shares and 1.00% for Class I shares, multiplied by the average account value over the period, multiplied by 184/366 (to reflect the one-half year period). The Example assumes that the $1,000 was invested at the net asset value per share determined at the close of business on April 30, 2008.
*** Absent contractual and voluntary expense limitations by the adviser and the administrator, expenses would have been higher.
4
Eaton Vance Large-Cap Core Research Fund as of October 31, 2008
PORTFOLIO OF INVESTMENTS
| Common Stocks — 94.2% | |
| Security | | Shares | | Value | |
| Aerospace & Defense — 5.3% | |
| Boeing Co. (The) | | | 789 | | | $ | 41,241 | | |
| General Dynamics Corp. | | | 2,143 | | | | 129,266 | | |
| Lockheed Martin Corp. | | | 1,285 | | | | 109,289 | | |
| Raytheon Co. | | | 2,164 | | | | 110,602 | | |
| United Technologies Corp. | | | 2,282 | | | | 125,419 | | |
| | | $ | 515,817 | | |
| Auto Components — 0.4% | |
| Johnson Controls, Inc. | | | 2,090 | | | $ | 37,056 | | |
| | | $ | 37,056 | | |
| Beverages — 3.3% | |
| Anheuser-Busch Cos., Inc. | | | 848 | | | $ | 52,601 | | |
| Coca-Cola Co. (The) | | | 1,392 | | | | 61,331 | | |
| PepsiCo, Inc. | | | 3,613 | | | | 205,977 | | |
| | | $ | 319,909 | | |
| Biotechnology — 2.8% | |
| Amgen, Inc.(1) | | | 1,757 | | | $ | 105,227 | | |
| Biogen Idec, Inc.(1) | | | 1,166 | | | | 49,613 | | |
| Celgene Corp.(1) | | | 275 | | | | 17,671 | | |
| Cephalon, Inc.(1) | | | 577 | | | | 41,382 | | |
| Gilead Sciences, Inc.(1) | | | 1,265 | | | | 58,000 | | |
| | | $ | 271,893 | | |
| Capital Markets — 2.3% | |
| Affiliated Managers Group, Inc.(1) | | | 284 | | | $ | 13,172 | | |
| Bank of New York Mellon Corp. (The) | | | 1,649 | | | | 53,757 | | |
| Goldman Sachs Group, Inc. | | | 536 | | | | 49,580 | | |
| Invesco, Ltd. | | | 1,400 | | | | 20,874 | | |
| Julius Baer Holding AG | | | 400 | | | | 15,644 | | |
| State Street Corp. | | | 733 | | | | 31,776 | | |
| T. Rowe Price Group, Inc. | | | 920 | | | | 36,377 | | |
| | | $ | 221,180 | | |
| Chemicals — 1.8% | |
| E.I. Du Pont de Nemours & Co. | | | 2,150 | | | $ | 68,800 | | |
| Monsanto Co. | | | 1,240 | | | | 110,335 | | |
| | | $ | 179,135 | | |
| Security | | Shares | | Value | |
| Commercial Banks — 2.7% | |
| BB&T Corp. | | | 669 | | | $ | 23,984 | | |
| PNC Financial Services Group, Inc. | | | 412 | | | | 27,468 | | |
| Regions Financial Corp. | | | 734 | | | | 8,140 | | |
| SunTrust Banks, Inc. | | | 342 | | | | 13,728 | | |
| U.S. Bancorp | | | 2,044 | | | | 60,932 | | |
| Wells Fargo & Co. | | | 3,940 | | | | 134,157 | | |
| | | $ | 268,409 | | |
| Commercial Services & Supplies — 0.4% | |
| Waste Management, Inc. | | | 1,399 | | | $ | 43,691 | | |
| | | $ | 43,691 | | |
| Communications Equipment — 2.4% | |
| Cisco Systems, Inc.(1) | | | 2,701 | | | $ | 47,997 | | |
| QUALCOMM, Inc. | | | 4,155 | | | | 158,970 | | |
| Research In Motion, Ltd.(1) | | | 571 | | | | 28,796 | | |
| | | $ | 235,763 | | |
| Computers & Peripherals — 4.7% | |
| Hewlett-Packard Co. | | | 5,986 | | | $ | 229,144 | | |
| International Business Machines Corp. | | | 2,537 | | | | 235,865 | | |
| | | $ | 465,009 | | |
| Consumer Finance — 0.6% | |
| Capital One Financial Corp. | | | 242 | | | $ | 9,467 | | |
| Discover Financial Services | | | 3,611 | | | | 44,235 | | |
| | | $ | 53,702 | | |
| Diversified Consumer Services — 0.1% | |
| H&R Block, Inc. | | | 724 | | | $ | 14,277 | | |
| | | $ | 14,277 | | |
| Diversified Financial Services — 4.6% | |
| Bank of America Corp. | | | 6,252 | | | $ | 151,111 | | |
| Citigroup, Inc. | | | 5,334 | | | | 72,809 | | |
| JPMorgan Chase & Co. | | | 5,553 | | | | 229,061 | | |
| | | $ | 452,981 | | |
| Diversified Telecommunication Services — 2.8% | |
| AT&T, Inc. | | | 5,234 | | | $ | 140,114 | | |
| Verizon Communications, Inc. | | | 4,531 | | | | 134,435 | | |
| | | $ | 274,549 | | |
See notes to financial statements
5
Eaton Vance Large-Cap Core Research Fund as of October 31, 2008
PORTFOLIO OF INVESTMENTS CONT'D
| Security | | Shares | | Value | |
| Electric Utilities — 2.1% | |
| E.ON AG | | | 815 | | | $ | 30,542 | | |
| Edison International | | | 2,119 | | | | 75,415 | | |
| FirstEnergy Corp. | | | 1,943 | | | | 101,347 | | |
| | | $ | 207,304 | | |
| Electrical Equipment — 0.8% | |
| Emerson Electric Co. | | | 2,431 | | | $ | 79,567 | | |
| | | $ | 79,567 | | |
| Energy Equipment & Services — 3.1% | |
| Diamond Offshore Drilling, Inc. | | | 500 | | | $ | 44,400 | | |
| Halliburton Co. | | | 1,430 | | | | 28,300 | | |
| National-Oilwell Varco, Inc.(1) | | | 1,403 | | | | 41,936 | | |
| Schlumberger, Ltd. | | | 2,044 | | | | 105,573 | | |
| Transocean, Inc.(1) | | | 1,066 | | | | 87,764 | | |
| | | $ | 307,973 | | |
| Food & Staples Retailing — 3.2% | |
| CVS Caremark Corp. | | | 2,494 | | | $ | 76,441 | | |
| Kroger Co. (The) | | | 1,794 | | | | 49,263 | | |
| Wal-Mart Stores, Inc. | | | 3,311 | | | | 184,787 | | |
| | | $ | 310,491 | | |
| Food Products — 1.4% | |
| Nestle SA ADR | | | 3,679 | | | $ | 141,458 | | |
| | | $ | 141,458 | | |
| Health Care Equipment & Supplies — 2.9% | |
| Baxter International, Inc. | | | 1,411 | | | $ | 85,351 | | |
| Becton, Dickinson and Co. | | | 639 | | | | 44,347 | | |
| Boston Scientific Corp.(1) | | | 4,747 | | | | 42,865 | | |
| Covidien, Ltd. | | | 576 | | | | 25,511 | | |
| Medtronic, Inc. | | | 1,586 | | | | 63,963 | | |
| St. Jude Medical, Inc.(1) | | | 566 | | | | 21,525 | | |
| | | $ | 283,562 | | |
| Health Care Providers & Services — 1.7% | |
| Aetna, Inc. | | | 993 | | | $ | 24,696 | | |
| DaVita, Inc.(1) | | | 565 | | | | 32,064 | | |
| Fresenius Medical Care AG & Co. KGaA ADR | | | 1,287 | | | | 58,018 | | |
| UnitedHealth Group, Inc. | | | 2,342 | | | | 55,576 | | |
| | | $ | 170,354 | | |
| Security | | Shares | | Value | |
| Hotels, Restaurants & Leisure — 1.4% | |
| Marriott International, Inc., Class A | | | 1,362 | | | $ | 28,425 | | |
| McDonald's Corp. | | | 1,863 | | | | 107,924 | | |
| | | $ | 136,349 | | |
| Household Durables — 0.1% | |
| Pulte Homes, Inc. | | | 753 | | | $ | 8,388 | | |
| | | $ | 8,388 | | |
| Household Products — 3.8% | |
| Clorox Co. (The) | | | 1,148 | | | $ | 69,810 | | |
| Colgate-Palmolive Co. | | | 1,370 | | | | 85,981 | | |
| Procter & Gamble Co. | | | 3,294 | | | | 212,595 | | |
| | | $ | 368,386 | | |
Independent Power Producers &
Energy Traders — 0.4% | |
| NRG Energy, Inc.(1) | | | 1,754 | | | $ | 40,780 | | |
| | | $ | 40,780 | | |
| Industrial Conglomerates — 1.5% | |
| 3M Co. | | | 708 | | | $ | 45,524 | | |
| General Electric Co. | | | 5,418 | | | | 105,705 | | |
| | | $ | 151,229 | | |
| Insurance — 3.7% | |
| ACE, Ltd. | | | 1,058 | | | $ | 60,687 | | |
| Aflac, Inc. | | | 1,503 | | | | 66,553 | | |
| Chubb Corp. | | | 1,520 | | | | 78,766 | | |
| MetLife, Inc. | | | 2,117 | | | | 70,327 | | |
| Travelers Companies, Inc. (The) | | | 2,002 | | | | 85,185 | | |
| | | $ | 361,518 | | |
| Internet Software & Services — 1.3% | |
| Akamai Technologies, Inc.(1) | | | 876 | | | $ | 12,597 | | |
| Google, Inc., Class A(1) | | | 329 | | | | 118,229 | | |
| | | $ | 130,826 | | |
| IT Services — 1.3% | |
| Cognizant Technology Solutions Corp.(1) | | | 2,347 | | | $ | 45,062 | | |
| MasterCard, Inc., Class A | | | 360 | | | | 53,215 | | |
| Satyam Computer Services, Ltd. ADR | | | 665 | | | | 10,460 | | |
| Visa, Inc., Class A | | | 315 | | | | 17,435 | | |
| | | $ | 126,172 | | |
See notes to financial statements
6
Eaton Vance Large-Cap Core Research Fund as of October 31, 2008
PORTFOLIO OF INVESTMENTS CONT'D
| Security | | Shares | | Value | |
| Leisure Equipment & Products — 0.3% | |
| Mattel, Inc. | | | 2,226 | | | $ | 33,435 | | |
| | | $ | 33,435 | | |
| Life Sciences Tools & Services — 0.3% | |
| Thermo Fisher Scientific, Inc.(1) | | | 614 | | | $ | 24,928 | | |
| | | $ | 24,928 | | |
| Machinery — 1.7% | |
| Danaher Corp. | | | 1,498 | | | $ | 88,742 | | |
| Illinois Tool Works, Inc. | | | 2,435 | | | | 81,305 | | |
| | | $ | 170,047 | | |
| Media — 2.5% | |
| Comcast Corp., Class A | | | 5,001 | | | $ | 78,816 | | |
| Omnicom Group, Inc. | | | 826 | | | | 24,400 | | |
| Time Warner, Inc. | | | 5,072 | | | | 51,176 | | |
| Vivendi SA | | | 3,611 | | | | 94,388 | | |
| | | $ | 248,780 | | |
| Metals & Mining — 0.8% | |
| BHP Billiton, Ltd. ADR | | | 538 | | | $ | 20,917 | | |
| Cliffs Natural Resources, Inc. | | | 544 | | | | 14,683 | | |
| Freeport-McMoRan Copper & Gold, Inc., Class B | | | 385 | | | | 11,203 | | |
| Nucor Corp. | | | 756 | | | | 30,626 | | |
| | | $ | 77,429 | | |
| Multiline Retail — 0.4% | |
| Target Corp. | | | 1,013 | | | $ | 40,642 | | |
| | | $ | 40,642 | | |
| Multi-Utilities — 1.0% | |
| CMS Energy Corp. | | | 3,962 | | | $ | 40,610 | | |
| Public Service Enterprise Group, Inc. | | | 2,015 | | | | 56,722 | | |
| | | $ | 97,332 | | |
| Oil, Gas & Consumable Fuels — 8.8% | |
| Anadarko Petroleum Corp. | | | 1,740 | | | $ | 61,422 | | |
| Chevron Corp. | | | 2,357 | | | | 175,832 | | |
| ConocoPhillips | | | 1,329 | | | | 69,135 | | |
| Exxon Mobil Corp. | | | 4,393 | | | | 325,609 | | |
| Hess Corp. | | | 1,209 | | | | 72,794 | | |
| Niko Resources, Ltd. | | | 365 | | | | 15,989 | | |
| Security | | Shares | | Value | |
| Oil, Gas & Consumable Fuels (continued) | |
| Occidental Petroleum Corp. | | | 1,326 | | | $ | 73,646 | | |
| Peabody Energy Corp. | | | 1,007 | | | | 34,752 | | |
| XTO Energy, Inc. | | | 999 | | | | 35,914 | | |
| | | $ | 865,093 | | |
| Pharmaceuticals — 5.8% | |
| Abbott Laboratories | | | 2,217 | | | $ | 122,268 | | |
| Johnson & Johnson | | | 1,912 | | | | 117,282 | | |
| Merck & Co., Inc. | | | 2,190 | | | | 67,780 | | |
| Novartis AG ADR | | | 948 | | | | 48,339 | | |
| Novo Nordisk A/S ADR | | | 384 | | | | 20,548 | | |
| Pfizer, Inc. | | | 3,367 | | | | 59,630 | | |
| Roche Holding Ltd. ADR | | | 391 | | | | 29,638 | | |
| Schering-Plough Corp. | | | 2,348 | | | | 34,023 | | |
| Shire PLC ADR | | | 512 | | | | 20,198 | | |
| Teva Pharmaceutical Industries, Ltd. ADR | | | 1,076 | | | | 46,139 | | |
| | | $ | 565,845 | | |
| Real Estate Investment Trusts (REITs) — 1.0% | |
| AvalonBay Communities, Inc. | | | 391 | | | $ | 27,769 | | |
| Boston Properties, Inc. | | | 467 | | | | 33,101 | | |
| Simon Property Group, Inc. | | | 530 | | | | 35,526 | | |
| | | $ | 96,396 | | |
| Semiconductors & Semiconductor Equipment — 1.0% | |
| ASML Holding NV | | | 5,545 | | | $ | 97,315 | | |
| | | $ | 97,315 | | |
| Software — 4.2% | |
| McAfee, Inc.(1) | | | 1,285 | | | $ | 41,827 | | |
| Microsoft Corp. | | | 11,732 | | | | 261,976 | | |
| Oracle Corp.(1) | | | 6,145 | | | | 112,392 | | |
| | | $ | 416,195 | | |
| Specialty Retail — 1.5% | |
| Abercrombie & Fitch Co., Class A | | | 775 | | | $ | 22,444 | | |
| Bed Bath & Beyond, Inc.(1) | | | 472 | | | | 12,163 | | |
| Best Buy Co., Inc. | | | 792 | | | | 21,234 | | |
| Home Depot, Inc. | | | 1,720 | | | | 40,575 | | |
| Staples, Inc. | | | 1,319 | | | | 25,628 | | |
| TJX Companies, Inc. (The) | | | 973 | | | | 26,037 | | |
| | | $ | 148,081 | | |
See notes to financial statements
7
Eaton Vance Large-Cap Core Research Fund as of October 31, 2008
PORTFOLIO OF INVESTMENTS CONT'D
| Security | | Shares | | Value | |
| Textiles, Apparel & Luxury Goods — 0.2% | |
| Nike, Inc., Class B | | | 370 | | | $ | 21,323 | | |
| | | $ | 21,323 | | |
| Tobacco — 1.3% | |
| Philip Morris International, Inc. | | | 2,926 | | | $ | 127,193 | | |
| | | $ | 127,193 | | |
| Wireless Telecommunication Services — 0.5% | |
| Rogers Communications, Inc., Class B | | | 1,747 | | | $ | 50,820 | | |
| | | $ | 50,820 | | |
Total Common Stocks
(identified cost $10,992,513) | | | | | | $ | 9,258,582 | | |
| Short-Term Investments — 4.4% | |
| Description | | Interest
(000's omitted) | | Value | |
| Cash Management Portfolio, 1.90%(2) | | $ | 433 | | | $ | 432,960 | | |
Total Short-Term Investments
(identified cost $432,960) | | | | | | $ | 432,960 | | |
Total Investments — 98.6%
(identified cost $11,425,473) | | | | | | $ | 9,691,542 | | |
| Other Assets, Less Liabilities — 1.4% | | | | | | $ | 140,735 | | |
| Net Assets — 100.0% | | | | | | $ | 9,832,277 | | |
ADR - American Depository Receipt
(1) Non-income producing security.
(2) Affiliated investment company available to Eaton Vance portfolios and funds which invests in high quality, U.S. dollar denominated money market instruments. The rate shown is the annualized seven-day yield as of October 31, 2008.
See notes to financial statements
8
Eaton Vance Large-Cap Core Research Fund as of October 31, 2008
FINANCIAL STATEMENTS
Statement of Assets and Liabilities
As of October 31, 2008
| Assets | |
| Unaffiliated investments, at value (identified cost, $10,992,513) | | $ | 9,258,582 | | |
| Affiliated investment, at value (identified cost, $432,960) | | | 432,960 | | |
| Receivable for investments sold | | | 155,202 | | |
| Receivable for Fund shares sold | | | 89,166 | | |
| Receivable from the investment adviser | | | 12,742 | | |
| Dividends receivable | | | 13,544 | | |
| Interest receivable from affiliated investment | | | 1,393 | | |
| Tax reclaims receivable | | | 552 | | |
| Total assets | | $ | 9,964,141 | | |
| Liabilities | |
| Payable for investments purchased | | $ | 80,900 | | |
| Payable to affiliate for distribution and service fees | | | 1,512 | | |
| Payable to affiliate for Trustees' fees | | | 60 | | |
| Accrued expenses | | | 49,392 | | |
| Total liabilities | | $ | 131,864 | | |
| Net Assets | | $ | 9,832,277 | | |
| Sources of Net Assets | |
| Paid-in capital | | $ | 11,815,705 | | |
| Accumulated net realized loss (computed on the basis of identified cost) | | | (296,417 | ) | |
| Accumulated undistributed net investment income | | | 47,021 | | |
| Net unrealized depreciation (computed on the basis of identified cost) | | | (1,734,032 | ) | |
| Total | | $ | 9,832,277 | | |
| Class A Shares | |
| Net Assets | | $ | 8,487,105 | | |
| Shares Outstanding | | | 824,451 | | |
Net Asset Value and Redemption Price Per Share
(net assets ÷ shares of beneficial interest outstanding) | | $ | 10.29 | | |
Maximum Offering Price Per Share
(100 ÷ 94.25 of $10.29) | | $ | 10.92 | | |
| Class I Shares | |
| Net Assets | | $ | 1,345,172 | | |
| Shares Outstanding | | | 130,619 | | |
Net Asset Value, Offering Price and Redemption Price Per Share
(net assets ÷ shares of beneficial interest outstanding) | | $ | 10.30 | | |
| On sales of $50,000 or more, the offering price of Class A shares is reduced. | |
Statement of Operations
For the Year Ended
October 31, 2008
| Investment Income | |
| Dividends (net of foreign taxes, $1,637) | | $ | 127,526 | | |
| Interest income allocated from affiliated investment | | | 15,343 | | |
| Expenses allocated from affiliated investment | | | (2,501 | ) | |
| Total investment income | | $ | 140,368 | | |
| Expenses | |
| Investment adviser fee | | $ | 44,842 | | |
| Administration fee | | | 10,947 | | |
| Trustees' fees and expenses | | | 500 | | |
Distribution and service fees
Class A | | | 17,769 | | |
| Legal and accounting services | | | 40,002 | | |
| Custodian fee | | | 36,065 | | |
| Registration fees | | | 30,768 | | |
| Transfer and dividend disbursing agent fees | | | 6,478 | | |
| Printing and postage | | | 6,222 | | |
| Miscellaneous | | | 7,520 | | |
| Total expenses | | $ | 201,113 | | |
Deduct —
Waiver and reimbursement of expenses by the investment adviser
and the administrator | | $ | 112,574 | | |
| Total expense reductions | | $ | 112,574 | | |
| Net expenses | | $ | 88,539 | | |
| Net investment income | | $ | 51,829 | | |
| Realized and Unrealized Gain (Loss) | |
Net realized gain (loss) —
Investment transactions (identified cost basis) | | $ | (289,457 | ) | |
| Foreign currency transactions | | | 57 | | |
| Net realized loss | | $ | (289,400 | ) | |
Change in unrealized appreciation (depreciation) —
Investments (identified cost basis) | | $ | (2,824,187 | ) | |
| Foreign currency | | | (106 | ) | |
| Net change in unrealized appreciation (depreciation) | | $ | (2,824,293 | ) | |
| Net realized and unrealized loss | | $ | (3,113,693 | ) | |
| Net decrease in net assets from operations | | $ | (3,061,864 | ) | |
See notes to financial statements
9
Eaton Vance Large-Cap Core Research Fund as of October 31, 2008
FINANCIAL STATEMENTS CONT'D
Statements of Changes in Net Assets
Increase (Decrease)
in Net Assets | | Year Ended
October 31, 2008 | | Year Ended
October 31, 2007 | |
From operations —
Net investment income | | $ | 51,829 | | | $ | 21,966 | | |
Net realized gain (loss) from investment and
foreign currency transactions | | | (289,400 | ) | | | 168,210 | | |
Net change in unrealized appreciation
(depreciation) from investments and
foreign currency | | | (2,824,293 | ) | | | 703,554 | | |
Net increase (decrease) in net assets
from operations | | $ | (3,061,864 | ) | | $ | 893,730 | | |
Distributions to shareholders —
From net investment income
Class A | | $ | (22,284 | ) | | $ | (13,971 | ) | |
From net realized gain
Class A | | | (169,159 | ) | | | (129,316 | ) | |
| Total distributions to shareholders | | $ | (191,443 | ) | | $ | (143,287 | ) | |
Transactions in shares of beneficial interest —
Proceeds from sale of shares
Class A | | $ | 6,916,681 | | | $ | 3,016,739 | | |
| Class I | | | 1,676,440 | | | | — | | |
Net asset value of shares issued to
shareholders in payment of
distributions declared
Class A | | | 187,316 | | | | 139,304 | | |
Cost of shares redeemed
Class A | | | (1,910,825 | ) | | | (740,499 | ) | |
| Class I | | | (25,400 | ) | | | — | | |
Net increase in net assets from Fund
share transactions | | $ | 6,844,212 | | | $ | 2,415,544 | | |
| Net increase in net assets | | $ | 3,590,905 | | | $ | 3,165,987 | | |
| Net Assets | |
| At beginning of year | | $ | 6,241,372 | | | $ | 3,075,385 | | |
| At end of year | | $ | 9,832,277 | | | $ | 6,241,372 | | |
Accumulated undistributed
net investment income
included in net assets | |
| At end of year | | $ | 47,021 | | | $ | 18,292 | | |
See notes to financial statements
10
Eaton Vance Large-Cap Core Research Fund as of October 31, 2008
FINANCIAL STATEMENTS CONT'D
Financial Highlights
| | | Class A | |
| | | Year Ended October 31, | |
| | | 2008 | | 2007 | | 2006 | | 2005 | | 2004 | |
| Net asset value — Beginning of year | | $ | 15.440 | | | $ | 13.370 | | | $ | 12.150 | | | $ | 10.810 | | | $ | 9.860 | | |
| Income (loss) from operations | |
| Net investment income(1) | | $ | 0.092 | | | $ | 0.066 | | | $ | 0.064 | | | $ | 0.041 | | | $ | 0.007 | | |
| Net realized and unrealized gain (loss) | | | (4.784 | ) | | | 2.537 | | | | 1.771 | | | | 1.334 | | | | 0.952 | | |
| Total income (loss) from operations | | $ | (4.692 | ) | | $ | 2.603 | | | $ | 1.835 | | | $ | 1.375 | | | $ | 0.959 | | |
| Less distributions | |
| From net investment income | | $ | (0.053 | ) | | $ | (0.052 | ) | | $ | (0.021 | ) | | $ | (0.035 | ) | | $ | (0.009 | ) | |
| From net realized gain | | | (0.405 | ) | | | (0.481 | ) | | | (0.594 | ) | | | — | | | | — | | |
| Total distributions | | $ | (0.458 | ) | | $ | (0.533 | ) | | $ | (0.615 | ) | | $ | (0.035 | ) | | $ | (0.009 | ) | |
| Net asset value — End of year | | $ | 10.290 | | | $ | 15.440 | | | $ | 13.370 | | | $ | 12.150 | | | $ | 10.810 | | |
| Total Return(2) | | | (31.29 | )% | | | 20.12 | % | | | 15.59 | % | | | 12.74 | % | | | 9.73 | % | |
| Ratios/Supplemental Data | |
| Net assets, end of year (000's omitted) | | $ | 8,487 | | | $ | 6,241 | | | $ | 3,075 | | | $ | 1,730 | | | $ | 1,296 | | |
| Ratios (As a percentage of average daily net assets): | |
| Expenses before custodian fee reduction(3)(4) | | | 1.25 | % | | | 1.25 | % | | | 1.25 | % | | | 1.25 | % | | | 1.40 | % | |
| Net investment income | | | 0.70 | % | | | 0.47 | % | | | 0.51 | % | | | 0.35 | % | | | 0.07 | % | |
| Portfolio Turnover | | | 76 | % | | | 63 | % | | | 74 | % | | | 93 | % | | | 70 | % | |
(1) Computed using average shares outstanding.
(2) Returns are historical and are calculated by determining the percentage change in net asset value with all distributions reinvested.
(3) The investment adviser waived its adviser fee, the administrator waived its administration fee and the investment adviser subsidized certain operating expenses (equal to 1.54%, 2.10%, 3.74%, 5.70% and 4.27% of average daily net assets for the years ended October 31, 2008, 2007, 2006, 2005 and 2004, respectively). Absent the waivers and allocations, total return would be lower.
(4) Excludes the effect of custody fee credits, if any, of less than 0.005%
See notes to financial statements
11
Eaton Vance Large-Cap Core Research Fund as of October 31, 2008
FINANCIAL STATEMENTS CONT'D
Financial Highlights
| | | Class I | |
| | | Period Ended
October 31, 2008(1) | |
| Net asset value — Beginning of period | | $ | 13.070 | | |
| Income (loss) from operations | |
| Net investment income(2) | | $ | 0.018 | | |
| Net realized and unrealized loss | | | (2.788 | ) | |
| Total loss from operations | | $ | (2.770 | ) | |
| Net asset value — End of period | | $ | 10.300 | | |
| Total Return(3) | | | (21.19 | )%(7) | |
| Ratios/Supplemental Data | |
| Net assets, end of period (000's omitted) | | $ | 1,345 | | |
| Ratios (As a percentage of average daily net assets): | |
| Expenses(4) | | | 1.00 | %(5) | |
| Net investment income | | | 1.03 | %(5) | |
| Portfolio Turnover | | | 76 | %(6) | |
(1) For the period from the start of business, September 3, 2008, to October 31, 2008.
(2) Computed using average shares outstanding.
(3) Returns are historical and are calculated by determining the percentage change in net asset value with all distributions reinvested.
(4) The investment adviser waived its adviser fee, the administrator waived its administration fee and the investment adviser subsidized certain operating expenses (equal to 1.54% of average daily net assets for the period ended October 31, 2008). Absent the waivers and allocations, total return would be lower.
(5) Annualized.
(6) For the Fund's year ended October 31, 2008.
(7) Not annualized.
See notes to financial statements
12
Eaton Vance Large-Cap Core Research Fund as of October 31, 2008
NOTES TO FINANCIAL STATEMENTS
1 Significant Accounting Policies
Eaton Vance Large-Cap Core Research Fund (formerly, Eaton Vance Equity Research Fund) (the Fund) is a diversified series of Eaton Vance Mutual Funds Trust (the Trust). The Trust is a Massachusetts business trust registered under the Investment Company Act of 1940, as amended (the 1940 Act), as an open-end management investment company. The Fund's investment objective is to achieve long-term capital appreciation by investing in a diversified portfolio of equity securities. The Fund offers two classes of shares. Class A shares are generally sold subject to a sales charge imposed at time of purchase. Class I shares are sold at net assest value and are not subject to a sales charge. Each class represents a pro-rata interest in the Fund, but votes separately on class-specific matters and (as noted below) is subject to different expenses. Realized and unrealized gains and losses and net investment income and losses, other than class-s pecific expenses, are allocated daily to each class of shares based on the relative net assets of each class to the total net assets of the Fund. Each class of shares differs in its distribution plan and certain other class-specific expenses.
The following is a summary of significant accounting policies of the Fund. The policies are in conformity with accounting principles generally accepted in the United States of America.
A Investment Valuation — Equity securities listed on a U.S. securities exchange generally are valued at the last sale price on the day of valuation or, if no sales took place on such date, at the mean between the closing bid and asked prices therefore on the exchange where such securities are principally traded. Equity securities listed on the NASDAQ Global or Global Select Market generally are valued at the NASDAQ official closing price. Unlisted or listed securities for which closing sales prices or closing quotations are not available are valued at the mean between the latest available bid and asked prices or, in the case of preferred equity securities that are not listed or traded in the over-the-counter market, by an independent pricing service. The daily valuation o f exchange-traded foreign securities generally is determined as of the close of trading on the principal exchange on which such securities trade. Events occurring after the close of trading on foreign exchanges may result in adjustments to the valuation of foreign securities to more accurately reflect their fair value as of the close of regular trading on the New York Stock Exchange. When valuing foreign equity securities that meet certain criteria, the Trustees have approved the use of a fair value service that values such securities to reflect market trading that occurs after the close of the applicable foreign markets of comparable securities or other instruments that have a strong correlation to the fair-valued securities.
The Fund may invest in Cash Management Portfolio (Cash Management), an affiliated investment company managed by Boston Management and Research (BMR), a subsidiary of Eaton Vance Management (EVM). Cash Management values its investment securities utilizing the amortized cost valuation technique permitted by Rule 2a-7 of the 1940 Act, pursuant to which Cash Management must comply with certain conditions. This technique involves initially valuing a portfolio security at its cost and thereafter assuming a constant amortization to maturity of any discount or premium. If amortized cost is determined not to approximate fair value, Cash Management may value its investment securities based on available market quotations provided by a pricing service.
B Investment Transactions — Investment transactions for financial statement purposes are accounted for on a trade date basis. Realized gains and losses on investments sold are determined on the basis of identified cost.
C Income — Dividend income is recorded on the ex-dividend date for dividends received in cash and/or securities. However, if the ex-dividend date has passed, certain dividends from foreign securities are recorded as the Fund is informed of the ex-dividend date. Withholding taxes on foreign dividends and capital gains have been provided for in accordance with the Fund's understanding of the applicable countries' tax rules and rates. Interest income is recorded on the basis of interest accrued, adjusted for amortization of premium or accretion of discount.
D Federal Taxes — The Fund's policy is to comply with the provisions of the Internal Revenue Code applicable to regulated investment companies and to distribute to shareholders each year substantially all of its net investment income, and all or substantially all of its net realized capital gains. Accordingly, no provision for federal income or excise tax is necessary. At October 31, 2008, the Fund, for federal income tax purposes, had a capital loss carryforward of $209,136 which will reduce its taxable income arising from future net realized gains on investment transactions, if any, to the extent permitted by the Internal Revenue Code, and thus will reduce the amount of distributions to shareholders, which would otherwise be necessary to relieve the Fund of any liabilit y for federal income or excise tax. Such capital loss carryforward will expire on October 31, 2016.
13
Eaton Vance Large-Cap Core Research Fund as of October 31, 2008
NOTES TO FINANCIAL STATEMENTS CONT'D
As of October 31, 2008, the Fund had no uncertain tax positions that would require financial statement recognition, de-recognition, or disclosure. Each of the Fund's federal tax returns filed in the 3-year period ended October 31, 2008 remains subject to examination by the Internal Revenue Service.
E Expenses — The majority of expenses of the Trust are directly identifiable to an individual fund. Expenses which are not readily identifiable to a specific fund are allocated taking into consideration, among other things, the nature and type of expense and the relative size of the funds.
F Expense Reduction — State Street Bank and Trust Company (SSBT) serves as custodian of the Fund. Pursuant to the custodian agreement, SSBT receives a fee reduced by credits, which are determined based on the average daily cash balance the Fund maintains with SSBT. All credit balances, if any, used to reduce the Fund's custodian fees are reported as a reduction of expenses in the Statement of Operations.
G Foreign Currency Translation — Investment valuations, other assets, and liabilities initially expressed in foreign currencies are translated each business day into U.S. dollars based upon current exchange rates. Purchases and sales of foreign investment securities and income and expenses denominated in foreign currencies are translated into U.S. dollars based upon currency exchange rates in effect on the respective dates of such transactions. Recognized gains or losses on investment transactions attributable to changes in foreign currency exchange rates are recorded for financial statement purposes as net realized gains and losses on investments. That portion of unrealized gains and losses on investments that results from fluctuations in foreign currency exchange rates is not separately disclosed.
H Use of Estimates — The preparation of the financial statements in conformity with accounting principles generally accepted in the United States of America requires management to make estimates and assumptions that affect the reported amounts of assets and liabilities at the date of the financial statements and the reported amounts of income and expense during the reporting period. Actual results could differ from those estimates.
I Indemnifications — Under the Trust's organizational documents, its officers and Trustees may be indemnified against certain liabilities and expenses arising out of the performance of their duties to the Fund, and shareholders are indemnified against personal liability for the obligations of the Trust. Additionally, in the normal course of business, the Fund enters into agreements with service providers that may contain indemnification clauses. The Fund's maximum exposure under these arrangements is unknown as this would involve future claims that may be made against the Fund that have not yet occurred.
2 Distributions to Shareholders
It is the present policy of the Fund to make at least one distribution annually (normally in December) of all or substantially all of its net investment income and to distribute annually all or substantially all of its net realized capital gains (reduced by available capital loss carryforwards from prior years, if any). Distributions to shareholders are recorded on the ex-dividend date. Distributions are declared separately for each class of shares. Shareholders may reinvest income and capital gain distributions in additional shares of the same class of the Fund at the net asset value as of the ex-dividend date or, at the election of the shareholder, receive distributions in cash. The Fund distinguishes between distributions on a tax basis and a financial reporting basis. Accounting principles generally accepted in the United States of America require that only distributions in excess of tax basis earnings and profits be reporte d in the financial statements as a return of capital. Permanent differences between book and tax accounting relating to distributions are reclassified to paid-in capital. For tax purposes, distributions from short-term capital gains are considered to be from ordinary income.
The tax character of distributions declared for the years ended October 31, 2008 and October 31, 2007 was as follows:
| | | Year ended October 31, | |
| | | 2008 | | 2007 | |
| Distributions declared from: | |
| Ordinary income | | $ | 64,853 | | | $ | 28,265 | | |
| Long-term capital gains | | $ | 126,590 | | | $ | 115,022 | | |
During the year ended October 31, 2008, accumulated net realized loss was decreased by $816 and accumulated undistributed net investment income was decreased by $816 due to differences between book and tax accounting, primarily for foreign currency gain (loss) and distributions from real estate investment trusts. These reclassifications had no effect on the net assets or net asset value per share of the Fund.
14
Eaton Vance Large-Cap Core Research Fund as of October 31, 2008
NOTES TO FINANCIAL STATEMENTS CONT'D
As of October 31, 2008, the components of distributable earnings (accumulated losses) and unrealized appreciation (depreciation) on a tax basis were as follows:
| Undistributed ordinary income | | $ | 47,021 | | |
| Capital loss carryforward | | $ | (209,136 | ) | |
| Net unrealized depreciation | | $ | (1,821,313 | ) | |
The differences between components of distributable earnings (accumulated losses) on a tax basis and the amounts reflected in the Statement of Assets and Liabilities are primarily due to wash sales.
3 Investment Adviser Fee and Other Transactions with Affiliates
The investment adviser fee is earned by EVM as compensation for management and investment advisory services rendered to the Fund. The fee is computed at an annual rate of 0.65% of the Fund's average daily net assets up to $500 million and at reduced rates as daily net assets exceed that level, and is payable monthly. The portion of the adviser fee payable by Cash Management on the Fund's investment of cash therein is credited against the Fund's adviser fee. For the year ended October 31, 2008, the Fund's adviser fee totaled $47,258 of which $2,416 was allocated from Cash Management and $44,842 was paid or accrued directly by the Fund. For the year ended October 31, 2008, the Fund's adviser fee, including the portion allocated from Cash Management was 0.65% of the Fund's average daily net assets. The administration fee is earned by EVM for administering the business affairs of the Fund and is computed at an annual rate of 0.15% o f the Fund's average daily net assets. For the year ended October 31, 2008, the administration fee amounted to $10,947. EVM has agreed to waive its fees and reimburse expenses to the extent that total annual operating expenses exceed 1.25% and 1.00% of the average daily net assets of Class A and Class I, respectively, through February 28, 2010. Thereafter, the waiver and reimbursement may be changed or terminated at any time. Prior to June 17, 2008, EVM had contractually agreed to waive its fees and reimburse expenses to the extent that total annual operating expenses exceeded 1.40% of the average daily net assets of Class A and voluntarily agreed to further limit net annual Fund operating expenses to 1.25% for Class A. Pursuant to these agreements, EVM waived fees and reimbursed expenses of $112,574 for the year ended October 31, 2008. EVM serves as the sub-transfer agent of the Fund and receives from the transfer agent an aggregate fee based upon the actual expenses incurred by EVM in the performance of th ese services. For the year ended October 31, 2008, EVM earned $281 in sub-transfer agent fees. The Fund was informed that Eaton Vance Distributors, Inc. (EVD), an affiliate of EVM and the Fund's principal underwriter, received $4,402 as its portion of the sales charge on sales of Class A shares for the year ended October 31, 2008. EVD also received distribution and service fees from Class A (see Note 4).
Except for Trustees of the Fund who are not members of EVM's organization, officers and Trustees receive remuneration for their services to the Fund out of the investment adviser fee. Trustees of the Fund who are not affiliated with EVM may elect to defer receipt of all or a percentage of their annual fees in accordance with the terms of the Trustees Deferred Compensation Plan. For the year ended October 31, 2008, no significant amounts have been deferred. Certain officers and Trustees of the Fund are officers of EVM.
4 Distribution Plans
The Fund has in effect a distribution plan for Class A shares (Class A Plan) pursuant to Rule 12b-1 under the 1940 Act. The Class A Plan provides that the Fund will pay EVD a distribution and service fee of 0.25% per annum of its average daily net assets attributable to Class A shares for distribution services and facilities provided to the Fund by EVD, as well as for personal services and/or the maintenance of shareholder accounts. Distribution and service fees paid or accrued to EVD for the year ended October 31, 2008 amounted to $17,769 for Class A shares.
5 Contingent Deferred Sales Charges
Class A shares may be subject to a 1% contingent deferred sales charge (CDSC) if redeemed within 18 months of purchase (depending on the circumstances of purchase). Generally, the CDSC is based upon the lower of the net asset value at date of redemption or date of purchase. No charge is levied on shares acquired by reinvestment of dividends or capital gain distributions. No CDSC is levied on shares which have been sold to EVM or its affiliates or to their respective employees or clients and may be waived under certain other limited conditions. For the year ended October 31, 2008, the Fund was informed that EVD received no CDSCs paid by Class A shareholders.
6 Purchases and Sales of Investments
Purchases and sales of investments, other than short-term obligations, aggregated $11,507,647 and $5,283,546, respectively, for the year ended October 31, 2008.
7 Shares of Beneficial Interest
The Fund's Declaration of Trust permits the Trustees to issue an unlimited number of full and fractional shares of
15
Eaton Vance Large-Cap Core Research Fund as of October 31, 2008
NOTES TO FINANCIAL STATEMENTS CONT'D
beneficial interest (without par value). Such shares may be issued in a number of different series (such as the Fund) and classes. Transactions in Fund shares were as follows:
| | | Year Ended October 31, | |
| Class A | | 2008 | | 2007 | |
| Sales | | | 553,150 | | | | 215,880 | | |
Issued to shareholders electing to
receive payments of distributions
in Fund shares | | | 12,657 | | | | 10,482 | | |
| Redemptions | | | (145,521 | ) | | | (52,242 | ) | |
| Net increase | | | 420,286 | | | | 174,120 | | |
| Class I | | Period Ended
October 31, 2008(1) | |
| Sales | | | 133,258 | | |
| Redemptions | | | (2,639 | ) | |
| Net increase | | | 130,619 | | |
(1) Class I commenced operations on September 3, 2008.
At October 31, 2008, EVM and an EVM retirement plan owned 5% and 16%, respectively, of the value of the outstanding shares of the Fund.
8 Federal Income Tax Basis of Investments
The cost and unrealized appreciation (depreciation) of investments of the Fund at October 31, 2008, as determined on a federal income tax basis, were as follows:
| Aggregate cost | | $ | 11,512,754 | | |
| Gross unrealized appreciation | | $ | 37,705 | | |
| Gross unrealized depreciation | | | (1,858,917 | ) | |
| Net unrealized depreciation | | $ | (1,821,212 | ) | |
9 Line of Credit
The Fund participates with other portfolios and funds managed by EVM and its affiliates in a $450 million unsecured line of credit agreement with a group of banks. Borrowings are made by the Fund solely to facilitate the handling of unusual and/or unanticipated short-term cash requirements. Interest is charged to the Fund based on its borrowings at an amount above either the Eurodollar rate or Federal Funds rate. In addition, a fee computed at an annual rate of 0.10% on the daily unused portion of the line of credit is allocated among the participating portfolios and funds at the end of each quarter. The Fund did not have any significant borrowings or allocated fees during the year ended October 31, 2008.
10 Risks Associated with Foreign Investments
Investing in securities issued by companies whose principal business activities are outside the United States may involve significant risks not present in domestic investments. For example, there is generally less publicly available information about foreign companies, particularly those not subject to the disclosure and reporting requirements of the U.S. securities laws. Certain foreign issuers are generally not bound by uniform accounting, auditing, and financial reporting requirements and standards of practice comparable to those applicable to domestic issuers. Investments in foreign securities also involve the risk of possible adverse changes in investment or exchange control regulations, expropriation or confiscatory taxation, limitation on the removal of funds or other assets of the Fund, political or financial instability or diplomatic and other developments which could affect such investments. Foreign stock markets, whil e growing in volume and sophistication, are generally not as developed as those in the United States, and securities of some foreign issuers (particularly those located in developing countries) may be less liquid and more volatile than securities of comparable U.S. companies. In general, there is less overall governmental supervision and regulation of foreign securities markets, broker-dealers and issuers than in the United States.
11 Recently Issued Accounting Pronouncement
In September 2006, the Financial Accounting Standards Board issued Statement of Financial Accounting Standards No. 157 (FAS 157), "Fair Value Measurements". FAS 157 defines fair value, establishes a framework for measuring fair value in accordance with accounting principles generally accepted in the United States of America and expands disclosure about fair value measurements. FAS 157 is effective for fiscal years beginning after November 15, 2007. As of October 31, 2008, management does not believe the adoption of FAS 157 will impact the amounts reported in the financial statements; however, additional disclosures may be required about the inputs used to develop the measurements of fair value and the effect of certain of the measurements on changes in net assets for the period.
12 Name Change
Effective August 18, 2008, the name of the Eaton Vance Large-Cap Core Research Fund was changed from Eaton Vance Equity Research Fund.
16
Eaton Vance Large-Cap Core Research Fund as of October 31, 2008
REPORT OF INDEPENDENT REGISTERED PUBLIC ACCOUNTING FIRM
To the Trustees of Eaton Vance Mutual Funds Trust and Shareholders of
Eaton Vance Large-Cap Core Research Fund (formerly Eaton Vance Equity Research Fund):
We have audited the accompanying statement of assets and liabilities of Eaton Vance Large-Cap Core Research Fund (the "Fund") (formerly Eaton Vance Equity Research Fund) (one of the series of Eaton Vance Mutual Funds Trust), including the portfolio of investments, as of October 31, 2008, and the related statement of operations for the year then ended, and the statements of changes in net assets and the financial highlights for each of the two years in the period then ended. These financial statements and financial highlights are the responsibility of the Fund's management. Our responsibility is to express an opinion on these financial statements and financial highlights based on our audits. The financial highlights for the year ended October 31, 2006, and all prior periods presented were audited by other auditors. Those auditors expressed an unqualified opinion on those financial highlights in their report dated December 19, 200 6.
We conducted our audits in accordance with the standards of the Public Company Accounting Oversight Board (United States). Those standards require that we plan and perform the audit to obtain reasonable assurance about whether the financial statements and financial highlights are free of material misstatement. The Fund is not required to have, nor were we engaged to perform, an audit of its internal control over financial reporting. Our audits included consideration of internal control over financial reporting as a basis for designing audit procedures that are appropriate in the circumstances, but not for the purpose of expressing an opinion on the effectiveness of the Fund's internal control over financial reporting. Accordingly, we express no such opinion. An audit also includes examining, on a test basis, evidence supporting the amounts and disclosures in the financial statements, assessing the accounting principles used and significant estimates made by management, as well as evaluating the overall financial statement presentation. Our procedures included confirmation of securities owned as of October 31, 2008, by correspondence with the custodian and brokers; where replies were not received from brokers, we performed other auditing procedures. We believe that our audits provide a reasonable basis for our opinion.
In our opinion, the financial statements and financial highlights referred to above present fairly, in all material respects, the financial position of Eaton Vance Large-Cap Core Research Fund as of October 31, 2008, the results of its operations for the year then ended, and the changes in its net assets and the financial highlights for each of the two years in the period then ended, in conformity with accounting principles generally accepted in the United States of America.
DELOITTE & TOUCHE LLP
Boston, Massachusetts
December 15, 2008
17
Eaton Vance Large-Cap Core Research Fund as of October 31, 2008
FEDERAL TAX INFORMATION (Unaudited)
The Form 1099-DIV you receive in January 2009 will show the tax status of all distributions paid to your account in calendar 2008. Shareholders are advised to consult their own tax adviser with respect to the tax consequences of their investment in the Fund. As required by the Internal Revenue Code regulations, shareholders must be notified within 60 days of the Fund's fiscal year end regarding the status of qualified dividend income for individuals, the dividends received deduction for corporations and capital gain dividends.
Qualified Dividend Income. The Fund designates approximately $126,032, or up to the maximum amount of such dividends allowable pursuant to the Internal Revenue Code, as qualified dividend income eligible for the reduced tax rate of 15%.
Dividends Received Deduction. Corporate shareholders are generally entitled to take the dividends received deduction on the portion of the Fund's dividend distribution that qualifies under tax law. For the Fund's fiscal year 2008 ordinary income dividends, 97.05% qualifies for the corporate dividends received deduction.
Capital Gain Dividends. The Fund designates $126,765 as a capital gain dividend.
18
Eaton Vance Large-Cap Core Research Fund
SPECIAL MEETING OF SHAREHOLDERS (Unaudited)
The Fund held a Special Meeting of Shareholders on November 14, 2008 to elect Trustees. The results of the vote were as follows:
| | | Number of Shares | |
| Nominee for Trustee | | For | | Withheld | |
| Benjamin C. Esty | | | 544,006 | | | | 0 | | |
| Thomas E. Faust Jr. | | | 544,006 | | | | 0 | | |
| Allen R. Freedman | | | 544,006 | | | | 0 | | |
| William H. Park | | | 544,006 | | | | 0 | | |
| Ronald A. Pearlman | | | 544,006 | | | | 0 | | |
| Helen Frame Peters | | | 544,006 | | | | 0 | | |
| Heidi L. Steiger | | | 544,006 | | | | 0 | | |
| Lynn A. Stout | | | 544,006 | | | | 0 | | |
| Ralph F. Verni | | | 544,006 | | | | 0 | | |
19
Eaton Vance Large-Cap Core Research Fund
BOARD OF TRUSTEES' ANNUAL APPROVAL OF THE INVESTMENT ADVISORY AGREEMENT
Overview of the Contract Review Process
The Investment Company Act of 1940, as amended (the "1940 Act"), provides, in substance, that each investment advisory agreement between a fund and its investment adviser will continue in effect from year to year only if its continuance is approved at least annually by the fund's board of trustees, including by a vote of a majority of the trustees who are not "interested persons" of the fund ("Independent Trustees"), cast in person at a meeting called for the purpose of considering such approval.
At a meeting of the Boards of Trustees (each a "Board") of the Eaton Vance group of mutual funds (the "Eaton Vance Funds") held on April 21, 2008, the Board, including a majority of the Independent Trustees, voted to approve continuation of existing advisory and sub-advisory agreements for the Eaton Vance Funds for an additional one-year period. In voting its approval, the Board relied upon the affirmative recommendation of the Contract Review Committee of the Board (formerly the Special Committee), which is a committee comprised exclusively of Independent Trustees. Prior to making its recommendation, the Contract Review Committee reviewed information furnished for a series of meetings of the Contract Review Committee held in February, March and April 2008. Such information included, among other things, the following:
Information about Fees, Performance and Expenses
• An independent report comparing the advisory and related fees paid by each fund with fees paid by comparable funds;
• An independent report comparing each fund's total expense ratio and its components to comparable funds;
• An independent report comparing the investment performance of each fund to the investment performance of comparable funds over various time periods;
• Data regarding investment performance in comparison to relevant peer groups of funds and appropriate indices;
• Comparative information concerning fees charged by each adviser for managing other mutual funds and institutional accounts using investment strategies and techniques similar to those used in managing the fund;
• Profitability analyses for each adviser with respect to each fund;
Information about Portfolio Management
• Descriptions of the investment management services provided to each fund, including the investment strategies and processes employed, and any changes in portfolio management processes and personnel;
• Information concerning the allocation of brokerage and the benefits received by each adviser as a result of brokerage allocation, including information concerning the acquisition of research through "soft dollar" benefits received in connection with the funds' brokerage, and the implementation of a soft dollar reimbursement program established with respect to the funds;
• Data relating to portfolio turnover rates of each fund;
• The procedures and processes used to determine the fair value of fund assets and actions taken to monitor and test the effectiveness of such procedures and processes;
Information about each Adviser
• Reports detailing the financial results and condition of each adviser;
• Descriptions of the qualifications, education and experience of the individual investment professionals whose responsibilities include portfolio management and investment research for the funds, and information relating to their compensation and responsibilities with respect to managing other mutual funds and investment accounts;
• Copies of the Codes of Ethics of each adviser and its affiliates, together with information relating to compliance with and the administration of such codes;
• Copies of or descriptions of each adviser's proxy voting policies and procedures;
• Information concerning the resources devoted to compliance efforts undertaken by each adviser and its affiliates on behalf of the funds (including descriptions of various compliance programs) and their record of compliance with investment policies and restrictions, including policies with respect to market-timing, late trading and selective portfolio disclosure, and with policies on personal securities transactions;
• Descriptions of the business continuity and disaster recovery plans of each adviser and its affiliates;
Other Relevant Information
• Information concerning the nature, cost and character of the administrative and other non-investment management services provided by Eaton Vance Management and its affiliates;
• Information concerning management of the relationship with the custodian, subcustodians and fund accountants by each adviser or the funds' administrator; and
• The terms of each advisory agreement.
20
Eaton Vance Large-Cap Core Research Fund
BOARD OF TRUSTEES' ANNUAL APPROVAL OF THE INVESTMENT ADVISORY AGREEMENT CONT'D
In addition to the information identified above, the Contract Review Committee considered information provided from time to time by each adviser throughout the year at meetings of the Board and its committees. Over the course of the twelve-month period ended April 30, 2008, the Board met eleven times and the Contract Review Committee, the Audit Committee and the Governance Committee, each of which is a Committee comprised solely of Independent Trustees, met twelve, seven and five times, respectively. At such meetings, the Trustees received, among other things, presentations by the portfolio managers and other investment professionals of each adviser relating to the investment performance of each fund and the investment strategies used in pursuing the fund's investment objective. The Portfolio Management Committee and the Compliance Reports and Regulatory Matters Committee are newly established and did not meet during the twelve- month period ended April 30, 2008.
For funds that invest through one or more underlying portfolios, the Board considered similar information about the portfolio(s) when considering the approval of advisory agreements. In addition, in cases where the fund's investment adviser has engaged a sub-adviser, the Board considered similar information about the sub-adviser when considering the approval of any sub-advisory agreement.
The Contract Review Committee was assisted throughout the contract review process by Goodwin Procter LLP, legal counsel for the Independent Trustees. The members of the Contract Review Committee relied upon the advice of such counsel and their own business judgment in determining the material factors to be considered in evaluating each advisory and sub-advisory agreement and the weight to be given to each such factor. The conclusions reached with respect to each advisory and sub-advisory agreement were based on a comprehensive evaluation of all the information provided and not any single factor. Moreover, each member of the Contract Review Committee may have placed varying emphasis on particular factors in reaching conclusions with respect to each advisory and sub-advisory agreement.
Results of the Process
Based on its consideration of the foregoing, and such other information as it deemed relevant, including the factors and conclusions described below, the Contract Review Committee concluded that the continuance of the investment advisory agreement of the Eaton Vance Equity Research Fund (the "Fund") with Eaton Vance Management (the "Adviser"), including its fee structure, is in the interests of shareholders and, therefore, the Contract Review Committee recommended to the Board approval of the agreement. The Board accepted the recommendation of the Contract Review Committee as well as the factors considered and conclusions reached by the Contract Review Committee with respect to the agreement. Accordingly, the Board, including a majority of the Independent Trustees, voted to approve continuation of the investment advisory agreement for the Fund.
Nature, Extent and Quality of Services
In considering whether to approve the investment advisory agreement of the Fund, the Board evaluated the nature, extent and quality of services provided to the Fund by the Adviser.
The Board considered the Adviser's management capabilities and investment process with respect to the types of investments held by the Fund, including the education, experience and number of its investment professionals and other personnel who provide portfolio management, investment research, and similar services to the Fund. In particular, the Board evaluated, where relevant, the abilities and experience of such investment personnel in analyzing factors such as credit risk, tax efficiency, and special considerations relevant to investing in foreign markets. Specifically, the Board considered the Adviser's in-house equity research capabilities. The Board also took into account the resources dedicated to portfolio management and other services, including the compensation paid to recruit and retain investment personnel, and the time and attention devoted to the Fund by senior management.
The Board reviewed the compliance programs of the Adviser and relevant affiliates thereof. Among other matters, the Board considered compliance and reporting matters relating to personal trading by investment personnel, selective disclosure of portfolio holdings, late trading, frequent trading, portfolio valuation, business continuity and the allocation of investment opportunities. The Board also evaluated the responses of the Adviser and its affiliates to requests from regulatory authorities such as the Securities and Exchange Commission.
The Board also considered shareholder and other administrative services provided or managed by Eaton Vance Management and its affiliates, including transfer agency and accounting services. The Board evaluated the benefits to shareholders of investing in a fund that is a part of a large family of funds, including the ability, in many cases, to exchange an investment among different funds without incurring additional sales charges.
After consideration of the foregoing factors, among others, the Board concluded that the nature, extent and quality of services provided by the Adviser, taken as a whole, are appropriate and consistent with the terms of the investment advisory agreement.
21
Eaton Vance Large-Cap Core Research Fund
BOARD OF TRUSTEES' ANNUAL APPROVAL OF THE INVESTMENT ADVISORY AGREEMENT CONT'D
Fund Performance
The Board compared the Fund's investment performance to a relevant universe of similarly managed funds identified by an independent data provider and appropriate benchmark indices. The Board reviewed comparative performance data for the one-, three- and five-year periods ended September 30, 2007 for the Fund. On the basis of the foregoing and other relevant information, the Board concluded that the performance of the Fund was satisfactory.
Management Fees and Expenses
The Board reviewed contractual investment advisory fee rates, including administrative fee rates payable by the Fund (referred to collectively as "management fees"). As part of its review, the Board considered the Fund's management fees (including administrative fees) and total expense ratio for the year ended September 30, 2007, as compared to a group of similarly managed funds selected by an independent data provider. The Board considered the fact that the Adviser had waived fees and/or paid expenses for the Fund.
After reviewing the foregoing information, and in light of the nature, extent and quality of the services provided by the Adviser, the Board concluded that the management fees charged for advisory and related services and the Fund's total expense ratio are reasonable.
Profitability
The Board reviewed the level of profits realized by the Adviser and relevant affiliates thereof in providing investment advisory and administrative services to the Fund and to all Eaton Vance Funds as a group. The Board considered the level of profits realized without regard to revenue sharing or other payments by the Adviser and its affiliates to third parties in respect of distribution services. The Board also considered other direct or indirect benefits received by the Adviser and its affiliates in connection with its relationship with the Fund, including the benefits of research services that may be available to the Adviser as a result of securities transactions effected for the Fund and other investment advisory clients.
The Board concluded that, in light of the foregoing factors and the nature, extent and quality of the services rendered, the profits realized by the Adviser and its affiliates are reasonable.
Economies of Scale
In reviewing management fees and profitability, the Board also considered the extent to which the Adviser and its affiliates, on the one hand, and the Fund, on the other hand, can expect to realize benefits from economies of scale as the assets of the Fund increase. The Board acknowledged the difficulty in accurately measuring the benefits resulting from the economies of scale with respect to the management of any specific fund or group of funds. The Board reviewed data summarizing the increases and decreases in the assets of the Fund and of all Eaton Vance Funds as a group over various time periods, and evaluated the extent to which the total expense ratio of the Fund and the Adviser's profitability may have been affected by such increases or decreases. Based upon the foregoing, the Board concluded that the benefits from economies of scale are currently being shared equitably by the Adviser and the Fund. The Board also conclude d that the structure of the advisory fee, which includes breakpoints at several asset levels, can be expected to cause the Adviser and its affiliates and the Fund to continue to share such benefits equitably.
22
Eaton Vance Large-Cap Core Research Fund
MANAGEMENT AND ORGANIZATION
Fund Management. The Trustees of Eaton Vance Mutual Funds Trust (the Trust) are responsible for the overall management and supervision of the Trust's affairs. The Trustees and officers of the Trust are listed below. Except as indicated, each individual has held the office shown or other offices in the same company for the last five years. Trustees and officers of the Trust hold indefinite terms of office. The "noninterested Trustees" consist of those Trustees who are not "interested persons" of the Trust, as that term is defined under the 1940 Act. The business address of each Trustee and officer is The Eaton Vance Building, 255 State Street, Boston, Massachusetts 02109. As used below, "EVC" refers to Eaton Vance Corp., "EV" refers to Eaton Vance, Inc., "EVM" refers to Eaton Vance Management, "BMR" refers to Boston Management and Research, "Parametric" refer s to Parametric Portfolio Associates and "EVD" refers to Eaton Vance Distributors, Inc. EVC and EV are the corporate parent and trustee, respectively, of EVM and BMR. EVD is the Fund's principal underwriter and a wholly-owned subsidiary of EVC. Each officer affiliated with Eaton Vance may hold a position with other Eaton Vance affiliates that is comparable to his or her position with EVM listed below.
Name and
Date of Birth | | Position(s)
with the
Trust | | Term of
Office and
Length of
Service | | Principal Occupation(s)
During Past Five Years | | Number of Portfolios
in Fund Complex
Overseen By
Trustee(1) | | Other Directorships Held | |
| Interested Trustee | | | | | | | | | | | | | |
|
| Thomas E. Faust Jr. 5/31/58 | | Trustee and President | | Trustee since 2007 and President since 2002 | | Chairman, Chief Executive Officer and President of EVC, Director and President of EV, Chief Executive Officer and President of EVM and BMR, and Director of EVD. Trustee and/or Officer of 173 registered investment companies and 4 private companies managed by EVM or BMR. Mr. Faust is an interested person because of his positions with EVM, BMR, EVD, EVC and EV, which are affiliates of the Trust. | | | 173 | | | Director of EVC | |
|
| Noninterested Trustees | | | | | | | | | | | | | |
|
| Benjamin C. Esty 1/2/63 | | Trustee | | Since 2005 | | Roy and Elizabeth Simmons Professor of Business Administration, Harvard University Graduate School of Business Administration. | | | 173 | | | None | |
|
| Allen R. Freedman 4/3/40 | | Trustee | | Since 2007 | | Former Chairman (2002-2004) and a Director (1983-2004) of Systems & Computer Technology Corp. (provider of software to higher education). Formerly, a Director of Loring Ward International (fund distributor) (2005-2007). Formerly, Chairman and a Director of Indus International, Inc. (provider of enterprise management software to the power generating industry) (2005-2007). | | | 173 | | | Director of Assurant, Inc. and Stonemor Partners L.P. (owner and operator of cemeteries) | |
|
| William H. Park 9/19/47 | | Trustee | | Since 2003 | | Vice Chairman, Commercial Industrial Finance Corp. (specialty finance company) (since 2006). Formerly, President and Chief Executive Officer, Prizm Capital Management, LLC (investment management firm) (2002-2005). | | | 173 | | | None | |
|
| Ronald A. Pearlman 7/10/40 | | Trustee | | Since 2003 | | Professor of Law, Georgetown University Law Center. | | | 173 | | | None | |
|
| Helen Frame Peters 3/22/48 | | Trustee | | Since 2008 | | Professor of Finance, Carroll School of Management, Boston College (since 2003). Adjunct Professor of Finance, Peking University, Beijing, China (since 2005). Formerly, Dean, Carroll School of Management, Boston College (2000-2003). | | | 173 | | | Director of Federal Home Loan Bank of Boston (a bank for banks) and BJ's Wholesale Clubs (wholesale club retailer); Trustee of SPDR Index Shares Funds and SPDR Series Trust (exchange traded funds) | |
|
| Heidi L. Steiger 7/8/53 | | Trustee | | Since 2007 | | Managing Partner, Topridge Associates LLC (global wealth management firm) (since 2008); Senior Advisor (since 2008), President (2005-2008), Lowenhaupt Global Advisors, LLC (global wealth management firm). Formerly, President and Contributing Editor, Worth Magazine (2004-2005). Formerly, Executive Vice President and Global Head of Private Asset Management (and various other positions), Neuberger Berman (investment firm) (1986-2004). | | | 173 | | | Director of Nuclear Electric Insurance Ltd. (nuclear insurance provider) and Aviva USA (insurance provider) | |
|
23
Eaton Vance Large-Cap Core Research Fund
MANAGEMENT AND ORGANIZATION CONT'D
Name and
Date of Birth | | Position(s)
with the
Trust | | Term of
Office and
Length of
Service | | Principal Occupation(s)
During Past Five Years | | Number of Portfolios
in Fund Complex
Overseen By
Trustee(1) | | Other Directorships Held | |
| Noninterested Trustees (continued) | | | | | | | | | | | |
|
| Lynn A. Stout 9/14/57 | | Trustee | | Since 1998 | | Paul Hastings Professor of Corporate and Securities Law (since 2006) and Professor of Law (2001-2006), University of California at Los Angeles School of Law. | | | 173 | | | None | |
|
| Ralph F. Verni 1/26/43 | | Chairman of the Board and Trustee | | Chairman of the Board since 2007 and Trustee since 2005 | | Consultant and private investor. | | | 173 | | | None | |
|
| Principal Officers who are not Trustees | | | | | | | |
|
Name and
Date of Birth | | Position(s)
with the
Trust | | Term of
Office and
Length of
Service | | Principal Occupation(s)
During Past Five Years | |
| William H. Ahern, Jr. 7/28/59 | | Vice President | | Since 1995 | | Vice President of EVM and BMR. Officer of 75 registered investment companies managed by EVM or BMR. | |
|
| John R. Baur 2/10/70 | | Vice President | | Since 2007 | | Vice President of EVM and BMR. Previously, attended Johnson Graduate School of Management, Cornell University (2002-2005), and prior thereto he was an Account Team Representative in Singapore for Applied Materials Inc. Officer of 33 registered investment companies managed by EVM or BMR. | |
|
| Michael A. Cirami 12/24/75 | | Vice President | | Since 2007 | | Vice President of EVM and BMR. Previously, attended the University of Rochester William E. Simon Graduate School of Business Administration (2001-2003), and prior thereto he was a Team Leader for the Institutional Services Group for State Street Bank in Luxembourg. Officer of 33 registered investment companies managed by EVM or BMR. | |
|
| Cynthia J. Clemson 3/2/63 | | Vice President | | Since 2005 | | Vice President of EVM and BMR. Officer of 90 registered investment companies managed by EVM or BMR. | |
|
| Charles B. Gaffney 12/4/72 | | Vice President | | Since 2007 | | Vice President of EVM and BMR. Previously, Sector Portfolio Manager and Senior Equity Analyst of Brown Brothers Harriman (1997-2003). Officer of 30 registered investment companies managed by EVM or BMR. | |
|
| Christine M. Johnston 11/9/72 | | Vice President | | Since 2007 | | Vice President of EVM and BMR. Officer of 35 registered investment companies managed by EVM or BMR. | |
|
| Aamer Khan 6/7/60 | | Vice President | | Since 2005 | | Vice President of EVM and BMR. Officer of 33 registered investment companies managed by EVM or BMR. | |
|
| Thomas H. Luster 4/8/62 | | Vice President | | Since 2006 | | Vice President of EVM and BMR. Officer of 51 registered investment companies managed by EVM or BMR. | |
|
| Robert B. MacIntosh 1/22/57 | | Vice President | | Since 1998 | | Vice President of EVM and BMR. Officer of 90 registered investment companies managed by EVM or BMR. | |
|
| Duncan W. Richardson 10/26/57 | | Vice President | | Since 2001 | | Executive Vice President and Chief Equity Investment Officer of EVC, EVM and BMR. Officer 81 registered investment companies managed by EVM or BMR. | |
|
| Judith A. Saryan 8/21/54 | | Vice President | | Since 2003 | | Vice President of EVM and BMR. Officer of 55 registered investment companies managed by EVM or BMR. | |
|
| Susan Schiff 3/13/61 | | Vice President | | Since 2002 | | Vice President of EVM and BMR. Officer of 36 registered investment companies managed by EVM or BMR. | |
|
| Thomas Seto 9/27/62 | | Vice President | | Since 2007 | | Vice President and Director of Portfolio Management of Parametric. Officer of 31 registered investment companies managed by EVM or BMR. | |
|
| David M. Stein 5/4/51 | | Vice President | | Since 2007 | | Managing Director and Chief Investment Officer of Parametric. Officer of 31 registered investment companies managed by EVM or BMR. | |
|
24
Eaton Vance Large-Cap Core Research Fund
MANAGEMENT AND ORGANIZATION CONT'D
Name and
Date of Birth | | Position(s)
with the
Trust | | Term of
Office and
Length of
Service | | Principal Occupation(s)
During Past Five Years | |
| Principal Officers who are not Trustees (continued) | | | | | | | |
|
| Mark S. Venezia 5/23/49 | | Vice President | | Since 2007 | | Vice President of EVM and BMR. Officer of 36 registered investment companies managed by EVM or BMR. | |
|
| Adam A. Weigold 3/22/75 | | Vice President | | Since 2007 | | Vice President of EVM and BMR. Officer of 71 registered investment companies managed by EVM or BMR. | |
|
| Barbara E. Campbell 6/19/57 | | Treasurer | | Since 2005 | | Vice President of EVM and BMR. Officer of 173 registered investment companies managed by EVM or BMR. | |
|
| Maureen A. Gemma 5/24/60 | | Secretary and Chief Legal Officer | | Secretary since 2007 and Chief Legal Officer since 2008 | | Vice President of EVM and BMR. Officer of 173 registered investment companies managed by EVM or BMR. | |
|
| Paul M. O'Neil 7/11/53 | | Chief Compliance Officer | | Since 2004 | | Vice President of EVM and BMR. Officer of 173 registered investment companies managed by EVM or BMR. | |
|
(1) Includes both master and feeder funds in a master-feeder structure.
The SAI for the Fund includes additional information about the Trustees and officers of the Fund and can be obtained without charge on Eaton Vance's website at www.eatonvance.com or by calling 1-800-262-1122.
25
This Page Intentionally Left Blank
This Page Intentionally Left Blank
This Page Intentionally Left Blank
Investment Adviser and Administrator of
Eaton Vance Large-Cap Core Research Fund
Eaton Vance Management
The Eaton Vance Building
255 State Street
Boston, MA 02109
Principal Underwriter
Eaton Vance Distributors, Inc.
The Eaton Vance Building
255 State Street
Boston, MA 02109
Custodian
State Street Bank and Trust Company
200 Clarendon Street
Boston, MA 02116
Transfer Agent
PNC Global Investment Servicing
Attn: Eaton Vance Funds
P.O. Box 9653
Providence, RI 02940-9653
(800) 262-1122
Independent Registered Public Accounting Firm
Deloitte & Touche LLP
200 Berkeley Street
Boston, MA 02116-5022
Eaton Vance Large-Cap Core Research Fund
The Eaton Vance Building
255 State Street
Boston, MA 02109
This report must be preceded or accompanied by a current prospectus. Before investing, investors should consider carefully the Fund's investment objective(s), risks, and charges and expenses. The Fund's current prospectus contains this and other information about the Fund and is available through your financial advisor. Please read the prospectus carefully before you invest or send money. For further information please call 1-800-262-1122.
1325-12/08 ERSRC

Annual Report October 31, 2008


EATON VANCE
FLOATING-RATE
FUND
IMPORTANT NOTICES REGARDING PRIVACY,
DELIVERY OF SHAREHOLDER DOCUMENTS,
PORTFOLIO HOLDINGS, AND PROXY VOTING
Privacy. The Eaton Vance organization is committed to ensuring your financial privacy. Each of the financial institutions identified below has in effect the following policy ("Privacy Policy") with respect to nonpublic personal information about its customers:
• Only such information received from you, through application forms or otherwise, and information about your Eaton Vance fund transactions will be collected. This may include information such as name, address, social security number, tax status, account balances and transactions.
• None of such information about you (or former customers) will be disclosed to anyone, except as permitted by law (which includes disclosure to employees necessary to service your account). In the normal course of servicing a customer's account, Eaton Vance may share information with unaffiliated third parties that perform various required services such as transfer agents, custodians and broker/dealers.
• Policies and procedures (including physical, electronic and procedural safeguards) are in place that are designed to protect the confidentiality of such information.
• We reserve the right to change our Privacy Policy at any time upon proper notification to you. Customers may want to review our Policy periodically for changes by accessing the link on our homepage: www.eatonvance.com.
Our pledge of privacy applies to the following entities within the Eaton Vance organization: the Eaton Vance Family of Funds, Eaton Vance Management, Eaton Vance Investment Counsel, Boston Management and Research, and Eaton Vance Distributors, Inc.
In addition, our Privacy Policy only applies to those Eaton Vance customers who are individuals and who have a direct relationship with us. If a customer's account (i.e., fund shares) is held in the name of a third-party financial adviser/broker-dealer, it is likely that only such adviser's privacy policies apply to the customer. This notice supersedes all previously issued privacy disclosures.
For more information about Eaton Vance's Privacy Policy, please call 1-800-262-1122.
Delivery of Shareholder Documents. The Securities and Exchange Commission (the "SEC") permits funds to deliver only one copy of shareholder documents, including prospectuses, proxy statements and shareholder reports, to fund investors with multiple accounts at the same residential or post office box address. This practice is often called "householding" and it helps eliminate duplicate mailings to shareholders.
Eaton Vance, or your financial adviser, may household the mailing of your documents indefinitely unless you instruct Eaton Vance, or your financial adviser, otherwise.
If you would prefer that your Eaton Vance documents not be householded, please contact Eaton Vance at
1-800-262-1122, or contact your financial adviser.
Your instructions that householding not apply to delivery of your Eaton Vance documents will be effective within 30 days of receipt by Eaton Vance or your financial adviser.
Portfolio Holdings. Each Eaton Vance Fund and its underlying Portfolio (if applicable) will file a schedule of its portfolio holdings on Form N-Q with the SEC for the first and third quarters of each fiscal year. The Form N-Q will be available on the Eaton Vance website www.eatonvance.com, by calling Eaton Vance at 1-800-262-1122 or in the EDGAR database on the SEC's website at www.sec.gov. Form N-Q may also be reviewed and copied at the SEC's public reference room in Washington, D.C. (call 1-800-732-0330 for information on the operation of the public reference room).
Proxy Voting. From time to time, funds are required to vote proxies related to the securities held by the funds. The Eaton Vance Funds or their underlying Portfolios (if applicable) vote proxies according to a set of policies and procedures approved by the Funds' and Portfolios' Boards. You may obtain a description of these policies and procedures and information on how the Funds or Portfolios voted proxies relating to portfolio securities during the most recent 12 month period ended June 30, without charge, upon request, by calling 1-800-262-1122. This description is also available on the SEC's website at www.sec.gov.
Eaton Vance Floating-Rate Fund as of October 31, 2008
MANAGEMENT’S DISCUSSION OF FUND PERFORMANCE

Scott H. Page, CFA
Co-Portfolio Manager

Craig P. Russ
Co-Portfolio Manager
Economic and Market Conditions
· During the year ended October 31, 2008, all credit markets experienced unprecedented volatility, and the bank loan market market was no exception. The subprime crisis of 2007 expanded in 2008 to include nearly all credit instruments, which in turn, caused the world economy to slip into recession. The year was a rollercoaster for the credit markets and for the Fund. The total return for the S&P/LSTA Leveraged Loan Index through the first nine months of the Fund’s fiscal year was -2.91%, disappointing, but, given the environment, not especially bad compared to other markets. However, September brought a series of events that rattled the markets more deeply: the bailouts of Fannie Mae and Freddie Mac, the bankruptcy of Lehman Brothers, the rescue of American International Group, Inc. and a litany of unprecedented steps by the U.S. Treasury and the Federal Reserve to stabilize the credit markets. In the Fund’s fiscal fourth quarter, the Index declined - 18.66%, by far its worst quarterly showing ever. The average loan price in the Fund was 70.3% of par at October 31, 2008. Although statistics vary with respect to recovery rates of loans in default, the historical rate has been approximately 70% of par. As such, bank loan prices at year-end were approaching levels that implied near universal default. At year-end, 1.7% of the Fund was in default versus 2.0% for the Index.
· While there is little doubt that a recession would bring higher default rates, it is difficult to reconcile recent trading levels with market fundamentals. A range of credit statistics and criteria used to monitor creditworthiness suggested that overall credit quality appeared to be in line with historical patterns. Despite this, bank loans traded below historical recovery levels, thus implying a near 100% default rate. The most compelling, albeit obvious, explanation for the market’s depressed trading level was that there were more sellers of bank loans than buyers. Some selling was forced, especially by hedge funds and structured investment vehicles unable to meet margin requirements. Some selling was voluntary, as redemptions from mutual funds were significant throughout the year. In addition, many hard-pressed banks and investment banks that typically make markets in bank loans were hesitant to own loans, making trading more volatile. Later in the period, there were signs that many institutional investors were attracted to the asset class by record low loan prices. However, selling outweighed buying, pushing loan prices lower.
Management Discussion
· The Fund’s(1) investment objective is to provide a high level of current income. The Portfolio invests primarily in senior floating-rate loans. In managing the Portfolio, the investment adviser seeks to invest in a portfolio of senior loans that it believes will be less volatile over time than the general loan market.
Eaton Vance Floating-Rate Fund
Total Return Performance 10/31/07 – 10/31/08
Advisers Class(2) | | -22.55 | % |
Class A(2) | | -22.66 | % |
Class B(2) | | -23.22 | % |
Class C(2) | | -23.22 | % |
Class I(2) | | -22.36 | % |
S&P/LSTA Leveraged Loan Index(3) | | -21.02 | % |
Please refer to page 3 for additional performance information.
(1) The Fund currently invests in a separate registered investment company, Floating Rate Portfolio (the Portfolio), with the same objective and policies as the Fund. References to investments are to the Portfolio’s holdings.
(2) These returns do not include the 2.25% maximum sales charge for Class A shares or the applicable contingent deferred sales charges (CDSC) for Class B or Class C shares. If sales charges were deducted, the performance would be lower. Advisers Class and Class I shares are offered to certain investors at net asset value.
(3) It is not possible to invest directly in an Index. The Index’s total return reflects changes in value of the loans constituting the Index and accrual of interest and does not reflect the commissions or expenses that would have been incurred if an investor individually purchased or sold the loans represented in the Index.
Past performance is no guarantee of future results. Returns are historical and are calculated by determining the percentage change in net asset value or offering price (as applicable) with all distributions reinvested. Investment return and principal value will fluctuate so that shares, when redeemed, may be worth more or less than their original cost. Performance is for the stated time period only; due to market volatility, the Fund’s current performance may be lower or higher than the quoted return. For performance as of the most recent month end, please refer to www.eatonvance.com.
Fund shares are not insured by the FDIC and are not deposits or other obligations of, or guaranteed by, any depository institution. Shares are subject to investment risks, including possible loss of principal invested.
1
· | The Portfolio’s investments included 446 borrowers at October 31, 2008, with an average loan size of 0.22% of total investments, and no industry constituting more than 9% of total investments. Publishing, healthcare, business equipment and services, cable and satellite television, and chemicals and plastics were the top industry weightings. The Portfolio’s loans were primarily senior, secured loans to companies with average revenues exceeding $1 billion. |
| |
· | The Portfolio had a 14% exposure to European loans at October 31, 2008. While the Portfolio’s involvement in the European leveraged loan market represented further opportunity for diversification, this market has been affected slightly more than the U.S. market by the recent credit market turmoil. However, defaults and credit losses in the European loan market remained minimal. |
| |
· | The Fund’s relative underperformance of its benchmark during the year was due primarily to its exposure to the European leverage loan market. |
Portfolio Composition
Top Ten Holdings(1)
By total investments
Charter Communications Operating, Inc. | | 1.0 | % |
Sungard Data Systems, Inc. | | 1.0 | |
HCA, Inc. | | 1.0 | |
Univision Communications, Inc. | | 1.0 | |
Georgia-Pacific Corp. | | 0.9 | |
UPC Broadband Holding B.V. | | 0.8 | |
Graphic Packaging International, Inc. | | 0.8 | |
Nielsen Finance, LLC. | | 0.8 | |
Freescale Semiconductor, Inc. | | 0.8 | |
Reader’s Digest Association, Inc. (The) | | 0.7 | |
(1) | Represents 8.8% of the Portfolio’s total investments as of 10/31/08. Holdings are shown as a percentage of the Portfolio’s total investments. |
Top Five Industries(2)
By total investments
Publishing | | 8.3 | % |
Healthcare | | 7.6 | |
Business Equipment & Services | | 6.8 | |
Cable & Satellite Television | | 6.7 | |
Chemicals & Plastics | | 6.0 | |
(2)Reflects the Portfolio’s investments as of 10/31/08. Industries are shown as a percentage of the Portfolio’s total investments.
Credit Quality Ratings for Total Loan investments(3)
By total loan investments
Baa | | 1.7 | % |
Ba | | 44.5 | |
B | | 35.8 | |
Caa | | 2.3 | |
Non-Rated(4) | | 15.7 | |
(3) | Credit Quality ratings are those provided by Moody’s Investor Services, Inc., a nationally recognized bond rating service. Reflects the Portfolio’s total loan investments as of 10/31/08. Although the investment adviser considers ratings when making investment decisions, it performs its own credit and investment analysis and does not rely primarily on the ratings assigned by the rating services. Credit quality can change from time to time, and recently issued credit ratings may not fully reflect the actual risks posed by a particular security or the issuer’s current financial condition. |
(4) | Certain loans in which the Portfolio invests are not rated by a rating agency. In management’s opinion, such securities are comparable to securities rated by a rating agency in the categories listed above. |
The views expressed throughout this report are those of the portfolio managers and are current only through the end of the period of the report as stated on the cover. These views are subject to change at any time based upon market or other conditions, and the investment adviser disclaims any responsibility to update such views. These views may not be relied on as investment advice and, because investment decisions for a fund are based on many factors, may not be relied on as an indication of trading intent on behalf of any Eaton Vance fund. Portfolio information provided in the report may not be representative of the Portfolio’s current or future investments and may change due to active management.
2
Eaton Vance Floating-Rate Fund as of October 31, 2008
FUND PERFORMANCE
The line graph and table set forth below provide information about the Fund’s performance. The line graph compares the performance of Class B of the Fund with that of the S&P/LSTA Leveraged Loan Index, an unmanaged loan market index. The lines on the graph represent the total returns of a hypothetical investment of $10,000 in Class B of the Fund and the S&P/LSTA Leveraged Loan Index. The table includes the total returns of each Class of the Fund at net asset value and maximum public offering price. The performance presented below does not reflect the deduction of taxes, if any, that a shareholder would pay on Fund distributions or the redemption of Fund shares.
Performance(1)
Share Class Symbol | | Advisers
Class
EABLX | | Class A
EVBLX | | Class B
EBBLX | | Class C ECBLX | | Class I
EIBLX | |
Average Annual Total Returns (at net asset value) | | | | | | | | | | | |
One year | | -22.55 | % | -22.66 | % | -23.22 | % | -23.22 | % | -22.36 | % |
Five years | | -1.66 | | -1.68 | | -2.40 | | -2.40 | | -1.42 | |
Life of Fund† | | 0.27 | | -0.98 | | -0.48 | | -0.47 | | 0.55 | |
| | | | | | | | | | | |
SEC Average Annual Total Returns (including sales charge or applicable CDSC) | | | | | | | |
| | | | | | | |
One year | | -22.55 | % | -24.42 | % | -26.87 | % | -23.95 | % | -22.36 | % |
Five years | | -1.66 | | -2.11 | | -2.71 | | -2.40 | | -1.42 | |
Life of Fund† | | 0.27 | | -1.39 | | -0.48 | | -0.47 | | 0.55 | |
† | Inception Dates — Advisers Class: 2/7/01; Class A: 5/5/03; Class B: 2/5/01; Class C: 2/1/01; Class I: 1/30/01 |
| |
(1) | Average Annual Total Returns at net asset value do not include the 2.25% maximum sales charge for Class A shares or the applicable contingent deferred sales charges (CDSC) for Class B or Class C shares. If sales charges were deducted, the performance would be lower. SEC Average Annual Total Returns for Class A reflect the maximum 2.25% sales charge. Class I and Advisers Class shares are offered to certain investors at net asset value. SEC Average Annual Total Returns for Class B reflect applicable CDSC based on the following schedule: 5% - 1st and 2nd years; 4% - 3rd year; 3% - 4th year; 2% - 5th year; 1% - 6th year. 1-year SEC returns for Class C reflect 1% CDSC. Advisers Class, Class A and Class I shares are subject to a 1% redemption fee if redeemed or exchanged within 90 days of the settlement of the purchase. |
Total Annual Operating Expenses (2) | | Advisers
Class | | Class A | | Class B | | Class C | | Class I | |
| | | | | | | | | | | |
Expense Ratio | | 1.05 | % | 1.05 | % | 1.80 | % | 1.80 | % | 0.80 | % |
(2) From the Fund’s prospectus dated 3/1/08.
Comparison of Change in Value of a $10,000 Investment in Eaton Vance Floating-Rate Fund Class B vs. the S&P/LSTA Leveraged Loan Index*
February 28, 2001 — October 31, 2008
* Sources: Lipper Inc. Class B of the Fund commenced operations on 2/5/01. Index data is available as of month end only.
A $10,000 hypothetical investment at net asset value in Class A on 5/5/03, Class C on 2/1/01, Class I on 1/30/01 and Advisers Class on 2/7/01 would have been valued at $9,473 ($9,260 at the maximum offering price), $9,642, $10,431 and $10,211, respectively, on 10/31/08. It is not possible to invest directly in an Index. The Index’s total return does not reflect the expenses that would have been incurred if an investor individually purchased or sold the securities represented in the Index.
Past performance is no guarantee of future results. Returns are historical and are calculated by determining the percentage change in net asset value or offering price (as applicable) with all distributions reinvested. Investment return and principal value will fluctuate so that shares, when redeemed, may be worth more or less than their original cost. Performance is for the stated time period only; due to market volatility, the Fund’s current performance may be lower or higher than the quoted return. For performance as of the most recent month end, please refer to www.eatonvance.com.
3
Eaton Vance Floating-Rate Fund as of October 31, 2008
FUND EXPENSES
Example: As a shareholder of the Fund, you incur two types of costs: (1) transaction costs, including sales charges (loads) on purchases and redemption fees (if applicable); and (2) ongoing costs, including management fees; distribution or service fees; and other Fund expenses. This Example is intended to help you understand your ongoing costs (in dollars) of investing in the Fund and to compare these costs with the ongoing costs of investing in other mutual funds. The Example is based on an investment of $1,000 invested at the beginning of the period and held for the entire period (May 1, 2008 – October 31, 2008).
Actual Expenses: The first section of the table below provides information about actual account values and actual expenses. You may use the information in this section, together with the amount you invested, to estimate the expenses that you paid over the period. Simply divide your account value by $1,000 (for example, an $8,600 account value divided by $1,000 = 8.6), then multiply the result by the number in the first section under the heading entitled "Expenses Paid During Period" to estimate the expenses you paid on your account during this period.
Hypothetical Example for Comparison Purposes: The second section of the table below provides information about hypothetical account values and hypothetical expenses based on the actual Fund expense ratio and an assumed rate of return of 5% per year (before expenses), which is not the actual return of the Fund. The hypothetical account values and expenses may not be used to estimate the actual ending account balance or expenses you paid for the period. You may use this information to compare the ongoing costs of investing in your Fund and other funds. To do so, compare this 5% hypothetical example with the 5% hypothetical examples that appear in the shareholder reports of the other funds.
Please note that the expenses shown in the table are meant to highlight your ongoing costs only and do not reflect any transactional costs, such as sales charges (loads) or redemption fees (if applicable). Therefore, the second section of the table is useful in comparing ongoing costs only, and will not help you determine the relative total costs of owning different funds. In addition, if these transactional costs were included, your costs would have been higher.
Eaton Vance Floating-Rate Fund
| | | Beginning Account Value
(5/1/08) | | Ending Account Value
(10/31/08) | | Expenses Paid During Period*
(5/1/08 – 10/31/08) | |
| Actual | |
| Advisers Class | | $ | 1,000.00 | | | $ | 808.20 | | | $ | 4.91 | | |
| Class A | | $ | 1,000.00 | | | $ | 807.50 | | | $ | 4.91 | | |
| Class B | | $ | 1,000.00 | | | $ | 805.00 | | | $ | 8.30 | | |
| Class C | | $ | 1,000.00 | | | $ | 805.00 | | | $ | 8.30 | | |
| Class I | | $ | 1,000.00 | | | $ | 809.10 | | | $ | 3.77 | | |
| Hypothetical | |
| (5% return per year before expenses) | |
| Advisers Class | | $ | 1,000.00 | | | $ | 1,019.70 | | | $ | 5.48 | | |
| Class A | | $ | 1,000.00 | | | $ | 1,019.70 | | | $ | 5.48 | | |
| Class B | | $ | 1,000.00 | | | $ | 1,015.90 | | | $ | 9.27 | | |
| Class C | | $ | 1,000.00 | | | $ | 1,015.90 | | | $ | 9.27 | | |
| Class I | | $ | 1,000.00 | | | $ | 1,021.00 | | | $ | 4.22 | | |
* Expenses are equal to the Fund's annualized expense ratio of 1.08% for Advisers Class shares, 1.08% for Class A shares, 1.83% for Class B shares, 1.83% for Class C shares and 0.83% for Class I shares, multiplied by the average account value over the period, multiplied by 184/366 (to reflect the one-half year period). The Example assumes that the $1,000 was invested at the net asset value per share determined at the close of business on April 30, 2008. The Example reflects the expenses of both the Fund and the Portfolio.
4
Eaton Vance Floating-Rate Fund as of October 31, 2008
FINANCIAL STATEMENTS
Statement of Assets and Liabilities
As of October 31, 2008
| Assets | |
Investment in Floating Rate Portfolio, at value
(identified cost, $2,883,319,661) | | $ | 1,987,566,834 | | |
| Receivable for Fund shares sold | | | 5,723,807 | | |
| Total assets | | $ | 1,993,290,641 | | |
| Liabilities | |
| Payable for Fund shares redeemed | | $ | 14,397,681 | | |
| Dividends payable | | | 4,261,917 | | |
| Payable to affiliate for distribution and service fees | | | 799,491 | | |
| Payable to affiliate for administration fee | | | 276,681 | | |
| Payable to affiliate for Trustees' fees | | | 82 | | |
| Accrued expenses | | | 396,764 | | |
| Total liabilities | | $ | 20,132,616 | | |
| Net Assets | | $ | 1,973,158,025 | | |
| Sources of Net Assets | |
| Paid-in capital | | $ | 3,132,257,320 | | |
Accumulated net realized loss from Portfolio (computed on
the basis of identified cost) | | | (259,655,419 | ) | |
| Accumulated distributions in excess of net investment income | | | (3,691,049 | ) | |
Net unrealized depreciation from Portfolio (computed on the basis of
identified cost) | | | (895,752,827 | ) | |
| Total | | $ | 1,973,158,025 | | |
| Advisers Class Shares | |
| Net Assets | | $ | 375,801,142 | | |
| Shares Outstanding | | | 53,692,237 | | |
Net Asset Value, Offering Price and Redemption Price Per Share
(net assets ÷ shares of beneficial interest outstanding) | | $ | 7.00 | | |
| Class A Shares | |
| Net Assets | | $ | 646,321,831 | | |
| Shares Outstanding | | | 89,329,085 | | |
Net Asset Value and Redemption Price Per Share
(net assets ÷ shares of beneficial interest outstanding) | | $ | 7.24 | | |
Maximum Offering Price Per Share
(100 ÷ 97.75 of $7.24) | | $ | 7.41 | | |
| Class B Shares | |
| Net Assets | | $ | 85,385,626 | | |
| Shares Outstanding | | | 12,214,759 | | |
Net Asset Value and Offering Price Per Share*
(net assets ÷ shares of beneficial interest outstanding) | | $ | 6.99 | | |
| Class C Shares | |
| Net Assets | | $ | 512,400,010 | | |
| Shares Outstanding | | | 73,289,671 | | |
Net Asset Value and Offering Price Per Share*
(net assets ÷ shares of beneficial interest outstanding) | | $ | 6.99 | | |
| Class I Shares | |
| Net Assets | | $ | 353,249,416 | | |
| Shares Outstanding | | | 50,473,037 | | |
Net Asset Value, Offering Price and Redemption Price Per Share
(net assets ÷ shares of beneficial interest outstanding) | | $ | 7.00 | | |
| On sales of $100,000 or more, the offering price of Class A shares is reduced. | |
* Redemption price per share is equal to the net asset value less any applicable contingent deferred sales charge.
Statement of Operations
For the Year Ended
October 31, 2008
| Investment Income | |
| Interest allocated from Portfolio | | $ | 220,996,167 | | |
| Dividends allocated from Portfolio | | | 5,620 | | |
| Expenses allocated from Portfolio | | | (21,510,323 | ) | |
| Net investment income from Portfolio | | $ | 199,491,464 | | |
| Expenses | |
| Administration fee | | $ | 4,581,228 | | |
| Trustees' fees and expenses | | | 1,775 | | |
Distribution and service fees
Advisers Class | | | 1,478,760 | | |
| Class A | | | 2,621,905 | | |
| Class B | | | 1,367,185 | | |
| Class C | | | 8,246,995 | | |
| Transfer and dividend disbursing agent fees | | | 1,905,653 | | |
| Printing and postage | | | 332,619 | | |
| Registration fees | | | 115,708 | | |
| Custodian fee | | | 45,506 | | |
| Legal and accounting services | | | 38,155 | | |
| Miscellaneous | | | 41,654 | | |
| Total expenses | | $ | 20,777,143 | | |
| Net investment income | | $ | 178,714,321 | | |
Realized and Unrealized
Gain (Loss) from Portfolio | |
Net realized gain (loss) —
Investment transactions (identified cost basis) | | $ | (80,257,644 | ) | |
| Swap contracts | | | 443,433 | | |
Foreign currency and forward foreign currency exchange
contract transactions | | | 37,340,535 | | |
| Net realized loss | | $ | (42,473,676 | ) | |
Change in unrealized appreciation (depreciation) —
Investments (identified cost basis) | | $ | (827,475,407 | ) | |
| Swap contracts | | | (857,128 | ) | |
| Foreign currency and forward foreign currency exchange contracts | | | 7,719,229 | | |
| Net change in unrealized appreciation (depreciation) | | $ | (820,613,306 | ) | |
| Net realized and unrealized loss | | $ | (863,086,982 | ) | |
| Net decrease in net assets from operations | | $ | (684,372,661 | ) | |
See notes to financial statements
5
Eaton Vance Floating-Rate Fund as of October 31, 2008
FINANCIAL STATEMENTS CONT'D
Statements of Changes in Net Assets
Increase (Decrease)
in Net Assets | | Year Ended
October 31, 2008 | | Year Ended
October 31, 2007 | |
From operations —
Net investment income | | $ | 178,714,321 | | | $ | 318,521,760 | | |
Net realized loss from investment
transactions, swap contracts,
and foreign currency and forward
foreign currency exchange
contract transactions | | | (42,473,676 | ) | | | (50,226,607 | ) | |
Net change in unrealized appreciation
(depreciation) of investments,
swap contracts, and foreign
currency and forward foreign
currency exchange contracts | | | (820,613,306 | ) | | | (87,141,105 | ) | |
Net increase (decrease) in net assets
from operations | | $ | (684,372,661 | ) | | $ | 181,154,048 | | |
Distributions to shareholders —
From net investment income
Advisers Class | | $ | (29,921,675 | ) | | $ | (78,819,187 | ) | |
| Class A | | | (52,973,503 | ) | | | (124,345,531 | ) | |
| Class B | | | (6,011,875 | ) | | | (12,298,989 | ) | |
| Class C | | | (36,366,671 | ) | | | (70,005,571 | ) | |
| Class D | | | (23,289,830 | ) | | | (39,517,999 | ) | |
Tax return of capital
Advisers Class | | | (5,496,201 | ) | | | — | | |
| Class A | | | (9,730,503 | ) | | | — | | |
| Class B | | | (1,104,299 | ) | | | — | | |
| Class C | | | (6,680,058 | ) | | | — | | |
| Class D | | | (4,278,022 | ) | | | — | | |
| Total distributions to shareholders | | $ | (175,852,637 | ) | | $ | (324,987,277 | ) | |
Transactions in shares of beneficial interest —
Proceeds from sale of shares
Advisers Class | | $ | 218,816,359 | | | $ | 638,760,508 | | |
| Class A | | | 245,044,544 | | | | 973,665,214 | | |
| Class B | | | 7,328,296 | | | | 18,988,643 | | |
| Class C | | | 86,165,024 | | | | 360,669,378 | | |
| Class I | | | 348,500,453 | | | | 439,234,146 | | |
Net asset value of shares issued to
shareholders in payment of
distributions declared
Advisers Class | | | 26,376,746 | | | | 54,522,994 | | |
| Class A | | | 45,278,140 | | | | 87,133,081 | | |
| Class B | | | 4,597,147 | | | | 7,943,406 | | |
| Class C | | | 28,334,958 | | | | 45,357,185 | | |
| Class I | | | 15,299,337 | | | | 27,972,993 | | |
Cost of shares redeemed
Advisers Class | | | (673,978,196 | ) | | | (925,978,979 | ) | |
| Class A | | | (981,675,043 | ) | | | (1,240,095,133 | ) | |
| Class B | | | (58,566,757 | ) | | | (61,657,752 | ) | |
| Class C | | | (515,413,159 | ) | | | (400,928,465 | ) | |
| Class I | | | (406,647,905 | ) | | | (402,425,316 | ) | |
| | | Year Ended
October 31, 2008 | | Year Ended
October 31, 2007 | |
Net asset value of shares exchanged
Class A | | $ | 8,347,832 | | | $ | 12,993,524 | | |
| Class B | | | (8,347,832 | ) | | | (12,993,524 | ) | |
| Redemption fees | | | 211,287 | | | | 339,031 | | |
Net decrease in net assets from Fund
share transactions | | $ | (1,610,328,769 | ) | | $ | (376,499,066 | ) | |
| Net decrease in net assets | | $ | (2,470,554,067 | ) | | $ | (520,332,295 | ) | |
| Net Assets | |
| At beginning of year | | $ | 4,443,712,092 | | | $ | 4,964,044,387 | | |
| At end of year | | $ | 1,973,158,025 | | | $ | 4,443,712,092 | | |
Accumulated distributions
in excess of net investment
income included in net assets | |
| At end of year | | $ | (3,691,049 | ) | | $ | (6,130,800 | ) | |
See notes to financial statements
6
Eaton Vance Floating-Rate Fund as of October 31, 2008
FINANCIAL STATEMENTS CONT'D
Financial Highlights
| | | Advisers Class | |
| | | Year Ended October 31, | |
| | | 2008 | | 2007 | | 2006 | | 2005 | | 2004 | |
| Net asset value — Beginning of year | | $ | 9.590 | | | $ | 9.840 | | | $ | 9.880 | | | $ | 9.880 | | | $ | 9.820 | | |
| Income (loss) from operations | |
| Net investment income(1) | | $ | 0.545 | | | $ | 0.636 | | | $ | 0.589 | | | $ | 0.417 | | | $ | 0.274 | | |
| Net realized and unrealized gain (loss) | | | (2.618 | ) | | | (0.239 | ) | | | (0.037 | ) | | | (0.005 | ) | | | 0.058 | | |
| Total income (loss) from operations | | $ | (2.073 | ) | | $ | 0.397 | | | $ | 0.552 | | | $ | 0.412 | | | $ | 0.332 | | |
| Less distributions | |
| From net investment income | | $ | (0.435 | ) | | $ | (0.648 | ) | | $ | (0.592 | ) | | $ | (0.413 | ) | | $ | (0.272 | ) | |
| Tax return of capital | | | (0.083 | ) | | | — | | | | — | | | | — | | | | — | | |
| Total distributions | | $ | (0.518 | ) | | $ | (0.648 | ) | | $ | (0.592 | ) | | $ | (0.413 | ) | | $ | (0.272 | ) | |
| Redemption fees | | $ | 0.001 | | | $ | 0.001 | | | $ | 0.000 | (2) | | $ | 0.001 | | | $ | 0.000 | (2) | |
| Net asset value — End of year | | $ | 7.000 | | | $ | 9.590 | | | $ | 9.840 | | | $ | 9.880 | | | $ | 9.880 | | |
| Total Return(3) | | | (22.55 | )% | | | 4.13 | % | | | 5.74 | % | | | 4.26 | % | | | 3.43 | % | |
| Ratios/Supplemental Data | |
| Net assets, end of year (000's omitted) | | $ | 375,801 | | | $ | 972,840 | | | $ | 1,238,349 | | | $ | 1,021,526 | | | $ | 782,259 | | |
| Ratios (As a percentage of average daily net assets): | | | | | | | | | | | | | | | | | | | | | |
| Expenses before custodian fee reduction(4)(5) | | | 1.19 | % | | | 1.05 | % | | | 1.01 | % | | | 1.03 | % | | | 1.05 | % | |
| Net investment income | | | 6.11 | % | | | 6.50 | % | | | 5.97 | % | | | 4.21 | % | | | 2.78 | % | |
| Portfolio Turnover of the Portfolio | | | 7 | % | | | 61 | % | | | 50 | % | | | 57 | % | | | 67 | % | |
(1) Computed using average shares outstanding.
(2) Amount represents less than $0.0005 per share.
(3) Returns are historical and are calculated by determining the percentage change in net asset value with all distributions reinvested.
(4) Includes the Fund's share of the Portfolio's allocated expenses.
(5) Excludes the effect of custody fee credits, if any, of less than 0.005%.
See notes to financial statements
7
Eaton Vance Floating-Rate Fund as of October 31, 2008
FINANCIAL STATEMENTS CONT'D
Financial Highlights
| | | Class A | |
| | | Year Ended October 31, | |
| | | 2008 | | 2007 | | 2006 | | 2005 | | 2004 | |
| Net asset value — Beginning of year | | $ | 9.920 | | | $ | 10.180 | | | $ | 10.220 | | | $ | 10.210 | | | $ | 10.150 | | |
| Income (loss) from operations | |
| Net investment income(1) | | $ | 0.560 | | | $ | 0.657 | | | $ | 0.608 | | | $ | 0.430 | | | $ | 0.282 | | |
| Net realized and unrealized gain (loss) | | | (2.705 | ) | | | (0.248 | ) | | | (0.036 | ) | | | 0.006 | (2) | | | 0.060 | | |
| Total income (loss) from operations | | $ | (2.145 | ) | | $ | 0.409 | | | $ | 0.572 | | | $ | 0.436 | | | $ | 0.342 | | |
| Less distributions | |
| From net investment income | | $ | (0.450 | ) | | $ | (0.670 | ) | | $ | (0.612 | ) | | $ | (0.427 | ) | | $ | (0.282 | ) | |
| Tax return of capital | | | (0.086 | ) | | | — | | | | — | | | | — | | | | — | | |
| Total distributions | | $ | (0.536 | ) | | $ | (0.670 | ) | | $ | (0.612 | ) | | $ | (0.427 | ) | | $ | (0.282 | ) | |
| Redemption fees | | $ | 0.001 | | | $ | 0.001 | | | $ | 0.000 | (3) | | $ | 0.001 | | | $ | 0.000 | (3) | |
| Net asset value — End of year | | $ | 7.240 | | | $ | 9.920 | | | $ | 10.180 | | | $ | 10.220 | | | $ | 10.210 | | |
| Total Return(4) | | | (22.66 | )% | | | 4.12 | % | | | 5.75 | % | | | 4.36 | % | | | 3.40 | % | |
| Ratios/Supplemental Data | |
| Net assets, end of year (000's omitted) | | $ | 646,322 | | | $ | 1,619,235 | | | $ | 1,839,719 | | | $ | 1,521,460 | | | $ | 1,155,058 | | |
| Ratios (As a percentage of average daily net assets): | | | | | | | | | |
| Expenses before custodian fee reduction(5)(6) | | | 1.19 | % | | | 1.05 | % | | | 1.01 | % | | | 1.03 | % | | | 1.05 | % | |
| Net investment income | | | 6.08 | % | | | 6.50 | % | | | 5.96 | % | | | 4.21 | % | | | 2.76 | % | |
| Portfolio Turnover of the Portfolio | | | 7 | % | | | 61 | % | | | 50 | % | | | 57 | % | | | 67 | % | |
(1) Computed using average shares outstanding.
(2) The per share amount is not in accordance with the net realized and unrealized gain (loss) for the period because of the timing of sales of Fund shares and the amount of the per share realized and unrealized gains and losses at such time.
(3) Amount represents less than $0.0005 per share.
(4) Returns are historical and are calculated by determining the percentage change in net asset value with all distributions reinvested.
(5) Includes the Fund's share of the Portfolio's allocated expenses.
(6) Excludes the effect of custody fee credits, if any, of less than 0.005%.
See notes to financial statements
8
Eaton Vance Floating-Rate Fund as of October 31, 2008
FINANCIAL STATEMENTS CONT'D
Financial Highlights
| | | Class B | |
| | | Year Ended October 31, | |
| | | 2008 | | 2007 | | 2006 | | 2005 | | 2004 | |
| Net asset value — Beginning of year | | $ | 9.590 | | | $ | 9.840 | | | $ | 9.870 | | | $ | 9.870 | | | $ | 9.810 | | |
| Income (loss) from operations | |
| Net investment income(1) | | $ | 0.469 | | | $ | 0.563 | | | $ | 0.511 | | | $ | 0.336 | | | $ | 0.198 | | |
| Net realized and unrealized gain (loss) | | | (2.616 | ) | | | (0.240 | ) | | | (0.023 | ) | | | 0.002 | (2) | | | 0.060 | | |
| Total income (loss) from operations | | $ | (2.147 | ) | | $ | 0.323 | | | $ | 0.488 | | | $ | 0.338 | | | $ | 0.258 | | |
| Less distributions | |
| From net investment income | | $ | (0.382 | ) | | $ | (0.574 | ) | | $ | (0.518 | ) | | $ | (0.339 | ) | | $ | (0.198 | ) | |
| Tax return of capital | | | (0.072 | ) | | | — | | | | — | | | | — | | | | — | | |
| Total distributions | | $ | (0.454 | ) | | $ | (0.574 | ) | | $ | (0.518 | ) | | $ | (0.339 | ) | | $ | (0.198 | ) | |
| Redemption fees | | $ | 0.001 | | | $ | 0.001 | | | $ | 0.000 | (3) | | $ | 0.001 | | | $ | 0.000 | (3) | |
| Net asset value — End of year | | $ | 6.990 | | | $ | 9.590 | | | $ | 9.840 | | | $ | 9.870 | | | $ | 9.870 | | |
| Total Return(4) | | | (23.22 | )% | | | 3.35 | % | | | 5.06 | % | | | 3.48 | % | | | 2.65 | % | |
| Ratios/Supplemental Data | |
| Net assets, end of year (000's omitted) | | $ | 85,386 | | | $ | 177,431 | | | $ | 230,454 | | | $ | 264,403 | | | $ | 298,187 | | |
| Ratios (As a percentage of average daily net assets): | | | | | | | | | |
| Expenses before custodian fee reduction(5)(6) | | | 1.94 | % | | | 1.80 | % | | | 1.77 | % | | | 1.78 | % | | | 1.80 | % | |
| Net investment income | | | 5.29 | % | | | 5.76 | % | | | 5.18 | % | | | 3.40 | % | | | 2.01 | % | |
| Portfolio Turnover of the Portfolio | | | 7 | % | | | 61 | % | | | 50 | % | | | 57 | % | | | 67 | % | |
(1) Computed using average shares outstanding.
(2) The per share amount is not in accordance with the net realized and unrealized gain (loss) for the period because of the timing of sales of Fund shares and the amount of the per share realized and unrealized gains and losses at such time.
(3) Amount represents less than $0.0005 per share.
(4) Returns are historical and are calculated by determining the percentage change in net asset value with all distributions reinvested.
(5) Includes the Fund's share of the Portfolio's allocated expenses.
(6) Excludes the effect of custody fee credits, if any, of less than 0.005%.
See notes to financial statements
9
Eaton Vance Floating-Rate Fund as of October 31, 2008
FINANCIAL STATEMENTS CONT'D
Financial Highlights
| | | Class C | |
| | | Year Ended October 31, | |
| | | 2008 | | 2007 | | 2006 | | 2005 | | 2004 | |
| Net asset value — Beginning of year | | $ | 9.590 | | | $ | 9.840 | | | $ | 9.870 | | | $ | 9.870 | | | $ | 9.810 | | |
| Income (loss) from operations | |
| Net investment income(1) | | $ | 0.472 | | | $ | 0.562 | | | $ | 0.512 | | | $ | 0.338 | | | $ | 0.198 | | |
| Net realized and unrealized gain (loss) | | | (2.619 | ) | | | (0.239 | ) | | | (0.024 | ) | | | (0.000 | )(2) | | | 0.060 | | |
| Total income (loss) from operations | | $ | (2.147 | ) | | $ | 0.323 | | | $ | 0.488 | | | $ | 0.338 | | | $ | 0.258 | | |
| Less distributions | |
| From net investment income | | $ | (0.382 | ) | | $ | (0.574 | ) | | $ | (0.518 | ) | | $ | (0.339 | ) | | $ | (0.198 | ) | |
| Tax return of capital | | | (0.072 | ) | | | — | | | | — | | | | — | | | | — | | |
| Total distributions | | $ | (0.454 | ) | | $ | (0.574 | ) | | $ | (0.518 | ) | | $ | (0.339 | ) | | $ | (0.198 | ) | |
| Redemption fees | | $ | 0.001 | | | $ | 0.001 | | | $ | 0.000 | (3) | | $ | 0.001 | | | $ | 0.000 | (3) | |
| Net asset value — End of year | | $ | 6.990 | | | $ | 9.590 | | | $ | 9.840 | | | $ | 9.870 | | | $ | 9.870 | | |
| Total Return(4) | | | (23.22 | )% | | | 3.35 | % | | | 5.06 | % | | | 3.48 | % | | | 2.65 | % | |
| Ratios/Supplemental Data | |
| Net assets, end of year (000's omitted) | | $ | 512,400 | | | $ | 1,142,139 | | | $ | 1,170,248 | | | $ | 1,220,713 | | | $ | 1,227,737 | | |
| Ratios (As a percentage of average daily net assets): | |
| Expenses before custodian fee reduction(5)(6) | | | 1.94 | % | | | 1.80 | % | | | 1.76 | % | | | 1.78 | % | | | 1.80 | % | |
| Net investment income | | | 5.31 | % | | | 5.75 | % | | | 5.19 | % | | | 3.42 | % | | | 2.01 | % | |
| Portfolio Turnover of the Portfolio | | | 7 | % | | | 61 | % | | | 50 | % | | | 57 | % | | | 67 | % | |
(1) Computed using average shares outstanding.
(2) Amount represents less than $(0.0005) per share.
(3) Amount represents less than $0.0005 per share.
(4) Returns are historical and are calculated by determining the percentage change in net asset value with all distributions reinvested.
(5) Includes the Fund's share of the Portfolio's allocated expenses.
(6) Excludes the effect of custody fee credits, if any, of less than 0.005%.
See notes to financial statements
10
Eaton Vance Floating-Rate Fund as of October 31, 2008
FINANCIAL STATEMENTS CONT'D
Financial Highlights
| | | Class I | |
| | | Year Ended October 31, | |
| | | 2008 | | 2007 | | 2006 | | 2005 | | 2004 | |
| Net asset value — Beginning of year | | $ | 9.590 | | | $ | 9.840 | | | $ | 9.880 | | | $ | 9.880 | | | $ | 9.820 | | |
| Income (loss) from operations | |
| Net investment income(1) | | $ | 0.550 | | | $ | 0.658 | | | $ | 0.614 | | | $ | 0.440 | | | $ | 0.299 | | |
| Net realized and unrealized loss | | | (2.601 | ) | | | (0.237 | ) | | | (0.037 | ) | | | (0.003 | ) | | | 0.058 | | |
| Total income (loss) from operations | | $ | (2.051 | ) | | $ | 0.421 | | | $ | 0.577 | | | $ | 0.437 | | | $ | 0.357 | | |
| Less distributions | |
| From net investment income | | $ | (0.456 | ) | | $ | (0.672 | ) | | $ | (0.617 | ) | | $ | (0.438 | ) | | $ | (0.297 | ) | |
| Tax return of capital | | | (0.084 | ) | | | — | | | | — | | | | — | | | | — | | |
| Total distributions | | $ | (0.540 | ) | | $ | (0.672 | ) | | $ | (0.617 | ) | | $ | (0.438 | ) | | $ | (0.297 | ) | |
| Redemption fees | | $ | 0.001 | | | $ | 0.001 | | | $ | 0.000 | (2) | | $ | 0.001 | | | $ | 0.000 | (2) | |
| Net asset value — End of year | | $ | 7.000 | | | $ | 9.590 | | | $ | 9.840 | | | $ | 9.880 | | | $ | 9.880 | | |
| Total Return(3) | | | (22.36 | )% | | | 4.39 | % | | | 6.00 | % | | | 4.52 | % | | | 3.69 | % | |
| Ratios/Supplemental Data | |
| Net assets, end of year (000's omitted) | | $ | 353,249 | | | $ | 532,067 | | | $ | 485,274 | | | $ | 371,698 | | | $ | 270,774 | | |
| Ratios (As a percentage of average daily net assets): | |
| Expenses before custodian fee reduction(4)(5) | | | 0.92 | % | | | 0.80 | % | | | 0.76 | % | | | 0.78 | % | | | 0.80 | % | |
| Net investment income | | | 6.22 | % | | | 6.73 | % | | | 6.22 | % | | | 4.45 | % | | | 3.03 | % | |
| Portfolio Turnover of the Portfolio | | | 7 | % | | | 61 | % | | | 50 | % | | | 57 | % | | | 67 | % | |
(1) Computed using average shares outstanding.
(2) Amount represents less than $0.0005 per share.
(3) Returns are historical and are calculated by determining the percentage change in net asset value with all distributions reinvested.
(4) Includes the Fund's share of the Portfolio's allocated expenses.
(5) Excludes the effect of custody fee credits, if any, of less than 0.005%.
See notes to financial statements
11
Eaton Vance Floating-Rate Fund as of October 31, 2008
NOTES TO FINANCIAL STATEMENTS
1 Significant Accounting Policies
Eaton Vance Floating-Rate Fund (the Fund) is a diversified series of Eaton Vance Mutual Funds Trust (the Trust). The Trust is a Massachusetts business trust registered under the Investment Company Act of 1940, as amended (the 1940 Act), as an open-end management investment company. The Fund offers five classes of shares. Class A shares are generally sold subject to a sales charge imposed at time of purchase. Class B and Class C shares are sold at net asset value and are generally subject to a contingent deferred sales charge (see Note 5). The Advisers Class and Class I shares are sold at net asset value and are not subject to a sales charge. Clas s B shares automatically convert to Class A shares eight years after their purchase as described in the Fund's prospectus. Each class represents a pro-rata interest in the Fund, but votes separately on class-specific matters and (as noted below) is subject to different expenses. Realized and unrealized gains and losses are allocated daily to each class of shares based on the relative net assets of each class to the total net assets of the Fund. Net investment income, other than class-specific expenses, is allocated daily to each class of shares based upon the ratio of the value of each class's paid shares to the total value of all paid shares. Each class of shares differs in its distribution plan and certain other class-specific expenses. The Fund invests all of its investable assets in interests in Floating Rate Portfolio (the Portfolio), a New York trust, having th e same investment objective and policies as the Fund. The value of the Fund's investment in the Portfolio reflects the Fund's proportionate interest in the net assets of the Portfolio (65.0% at October 31, 2008). The performance of the Fund is directly affected by the performance of the Portfolio. The financial statements of the Portfolio, including the portfolio of investments, are included elsewhere in this report and should be read in conjunction with the Fund's financial statements.
The following is a summary of significant accounting policies of the Fund. The policies are in conformity with accounting principles generally accepted in the United States of America.
A Investment Valuation — Valuation of securities by the Portfolio is discussed in Note 1A of the Portfolio's Notes to Financial Statements, which are included elsewhere in this report.
B Income — The Fund's net investment income or loss consists of the Fund's pro-rata share of the net investment income or loss of the Portfolio, less all actual and accrued expenses of the Fund.
C Federal Taxes — The Fund's policy is to comply with the provisions of the Internal Revenue Code applicable to regulated investment companies and to distribute to shareholders each year substantially all of its net investment income, and all or substantially all of its net realized capital gains. Accordingly, no provision for federal income or excise tax is necessary.
At October 31, 2008, the Fund, for federal income tax purposes, had a capital loss carryforward of $259,623,229, which will reduce its taxable income arising from future net realized gains on investment transactions, if any, to the extent permitted by the Internal Revenue Code, and thus will reduce the amount of distributions to shareholders, which would otherwise be necessary to relieve the Fund of any liability for federal income or excise tax. Such capital loss carryforward will expire on October 31, 2010 ($8,217,006), October 31, 2011 ($8,406,344), October 31, 2012 ($4,215,434), October 31, 2013 ($7,255,003), October 31, 2014 ($1,123,368), October 31, 2015 ($24,641,774) and October 31, 2016 ($205,764,300).
As of October 31, 2008, the Fund had no uncertain tax positions that would require financial statement recognition, de-recognition, or disclosure. Each of the Fund's federal tax returns filed in the 3-year period ended October 31, 2008 remains subject to examination by the Internal Revenue Service.
D Expenses — The majority of expenses of the Trust are directly identifiable to an individual fund. Expenses which are not readily identifiable to a specific fund are allocated taking into consideration, among other things, the nature and type of expense and the relative size of the funds.
E Expense Reduction — State Street Bank and Trust Company (SSBT) serves as custodian of the Fund. Pursuant to the custodian agreement, SSBT receives a fee reduced by credits, which are determined based on the average daily cash balance the Fund maintains with SSBT. All credit balances, if any, used to reduce the Fund's custodian fees are reported as a reduction of expenses in the Statement of Operations.
F Use of Estimates — The preparation of the financial statements in conformity with accounting principles generally accepted in the United States of America requires management to make estimates and assumptions that affect the reported amounts of assets and liabilities at the date of the financial statements and the reported amounts of income and expense during the reporting period. Actual results could differ from those estimates.
12
Eaton Vance Floating-Rate Fund as of October 31, 2008
NOTES TO FINANCIAL STATEMENTS CONT'D
G Indemnifications — Under the Trust's organizational documents, its officers and Trustees may be indemnified against certain liabilities and expenses arising out of the performance of their duties to the Fund, and shareholders are indemnified against personal liability for the obligations of the Trust. Additionally, in the normal course of business, the Fund enters into agreements with service providers that may contain indemnification clauses. The Fund's maximum exposure under these arrangements is unknown as this would involve future claims that may be made against the Fund that have not yet occurred.
H Redemption Fee — Upon the redemption or exchange of shares by Advisers Class, Class A and Class I shareholders within 90 days of the settlement of purchase, a fee of 1% of the current net asset value of these shares will be assessed and retained by the Fund for the benefit of the remaining shareholders. The redemption fee is accounted for as an addition to paid-in capital.
I Other — Investment transactions are accounted for on a trade date basis. Dividends to shareholders are recorded on the ex-dividend date.
2 Distributions to Shareholders
The Fund declares dividends daily to shareholders of record at the time of declaration. Distributions are generally paid monthly. Distributions of realized capital gains (reduced by available capital loss carryforwards from prior years, if any) are made at least annually. Distributions are declared separately for each class of shares. Shareholders may reinvest income and capital gain distributions in additional shares of the same class of the Fund at the net asset value as of the reinvestment date or, at the election of the shareholder, receive distributions in cash. The Fund distinguishes between distributions on a tax basis and a financial reporting basis. Accounting principles generally accepted in the United States of America require that only distributions in excess of tax basis earnings and profits be reported in the financial statements as a return of capital. Permanent differences between book and tax accounting relating to distributions are reclassified to paid-in capital.
The tax character of distributions declared for the years ended October 31, 2008 and October 31, 2007 was as follows:
| | | Year ended October 31, | |
| | | 2008 | | 2007 | |
| Distributions declared from: | |
| Ordinary income | | $ | 148,563,554 | | | $ | 324,987,277 | | |
| Tax return of capital | | $ | 27,289,083 | | | $ | — | | |
During the year ended October 31, 2008, accumulated net realized loss was increased by $163,689,057, accumulated undistributed net investment income was decreased by $27,711,016, and paid-in capital was increased by $191,400,073 due to differences between book and tax accounting, primarily for foreign currency gain (loss), swap contracts and mixed straddles. These reclassifications had no effect on the net assets or net asset value per share of the Fund.
As of October 31, 2008, the components of distributable earnings (accumulated losses) and unrealized appreciation (depreciation) on a tax basis were as follows:
| Capital loss carryforward | | $ | (259,623,229 | ) | |
| Net unrealized depreciation | | $ | (883,556,518 | ) | |
| Other temporary differences | | $ | (4,261,917 | ) | |
The differences between components of distributable earnings (accumulated losses) on a tax basis and the amounts reflected in the Statement of Assets and Liabilities are primarily due to wash sales, partnership allocations and the timing of recognizing distributions to shareholders.
3 Transactions with Affiliates
The administration fee is earned by EVM as compensation for administrative services rendered to the Fund. The fee is computed at an annual rate of 0.15% of the Fund's average daily net assets. For the year ended October 31, 2008, the administration fee amounted to $4,581,228. The Portfolio has engaged Boston Management and Research (BMR), a subsidiary of EVM, to render investment advisory services. (See Note 2 of the Portfolio's Notes to Financial Statements which are included elsewhere in this report.)
EVM serves as the sub-transfer agent of the Fund and receives from the transfer agent an aggregate fee based upon the actual expenses incurred by EVM in the performance of these services. For the year ended October 31, 2008, EVM earned $67,510 in sub-transfer agent fees. The Fund was informed that Eaton Vance Distributors, Inc. (EVD), an affiliate of EVM and the Fund's principal underwriter, received $26,110 as its portion of the sales charge on sales of Class A shares for the year ended October 31, 2008. EVD also received distribution and service fees from Advisers Class, Class A, Class B and Class C shares (see Note 4) and contingent deferred sales charges (see Note 5).
Except for Trustees of the Fund and the Portfolio who are not members of EVM's or BMR's organizations, officers and
13
Eaton Vance Floating-Rate Fund as of October 31, 2008
NOTES TO FINANCIAL STATEMENTS CONT'D
Trustees receive remuneration for their services to the Fund out of the investment adviser fee. Certain officers and Trustees of the Fund and the Portfolio are officers of the above organizations.
4 Distribution Plans
The Fund has in effect distribution plans for the Advisers Class shares (Advisers Plan) and Class A shares (Class A Plan) pursuant to Rule 12b-1under the 1940 Act. The Advisers Plan and the Class A Plan provide that the Fund will pay EVD a distribution and service fee of 0.25% per annum of its average daily net assets attributable to Advisers Class shares and Class A shares for distribution services and facilities provided to the Fund by EVD, as well as for personal services and/or the maintenance of shareholder accounts. Distribution and service fees paid or accrued to EVD for the year ended October 31, 2008 for Advisers Class and Class A shares amounted to $1,478,760 and $2,621,905, respectively.
The Fund also has in effect distribution plans for Class B shares (Class B Plan) and Class C shares (Class C Plan) pursuant to Rule 12b-1 under the 1940 Act. The Class B and Class C Plans require the Fund to pay EVD amounts equal to 0.75% per annum of its average daily net assets attributable to Class B and Class C shares for providing ongoing distribution services and facilities to the Fund. The Fund will automatically discontinue payments to EVD during any period in which there are no outstanding Uncovered Distribution Charges, which are equivalent to the sum of (i) 6.25% of the aggregate amount received by the Fund for Class B and Class C shares sold, plus (ii) interest calculated by applying the rate of 1% over the prevailing prime rate to the outstanding balance of Uncovered Distribution Charges of EVD of each respective class, reduced by the aggregate amount of contingent deferred sales charges (see Note 5) and amounts the retofore paid or payable to EVD by each respective class. For the year ended October 31, 2008, the Fund paid or accrued to EVD $1,025,389 and $6,185,246 for Class B and Class C shares, respectively, representing 0.75% of the average daily net assets of Class B and Class C shares. At October 31, 2008, the amounts of Uncovered Distribution Charges of EVD calculated under the Class B and Class C Plans were approximately $10,291,000 and $159,124,400, respectively.
The Class B and Class C Plans also authorize the Fund to make payments of service fees to EVD, investment dealers and other persons in amounts not exceeding 0.25% per annum of its average daily net assets attributable to that class. Service fees paid or accrued are for personal services and/or the maintenance of shareholder accounts. They are separate and distinct from the sales commissions and distribution fees payable to EVD and, as such, are not subject to automatic discontinuance when there are no outstanding Uncovered Distribution Charges of EVD. Service fees paid or accrued for the year ended October 31, 2008 amounted to $341,796 and $2,061,749 for Class B and Class C shares, respectively.
5 Contingent Deferred Sales Charges
A contingent deferred sales charge (CDSC) generally is imposed on redemptions of Class B shares made within six years of purchase and on redemptions of Class C shares made within one year of purchase. Class A shares may be subject to a 1% CDSC if redeemed within 18 months of purchase (depending on the circumstances of purchase). Generally, the CDSC is based upon the lower of the net asset value at date of redemption or date of purchase. No charge is levied on shares acquired by reinvestment of dividends or capital gain distributions. The CDSC for Class B shares is imposed at declining rates that begin at 5% in the case of redemptions in the first and second year after purchase, declining one percentage point each subsequent year. Class C shares are subject to a 1% CDSC if redeemed within one year of purchase. No CDSC is levied on shares which have been sold to EVM or its affiliates or to their respective employees or clients and may be waived under certain other limited conditions. CDSCs received on Class B and Class C redemptions are paid to EVD to reduce the amount of Uncovered Distribution Charges calculated under the Fund's Class B and Class C Plans. CDSCs received on Class B and Class C redemptions when no Uncovered Distribution Charges exist are credited to the Fund. For the year ended October 31, 2008, the Fund was informed that EVD received approximately $581,800, $465,600, and $298,700 of CDSCs paid by Class A, Class B and Class C shareholders, respectively.
6 Investment Transactions
For the year ended October 31, 2008, increases and decreases in the Fund's investment in the Portfolio aggregated $916,663,467 and $2,724,056,149, respectively.
7 Shares of Beneficial Interest
The Fund's Declaration of Trust permits the Trustees to issue an unlimited number of full and fractional shares of beneficial interest (without par value). Such shares may be
14
Eaton Vance Floating-Rate Fund as of October 31, 2008
NOTES TO FINANCIAL STATEMENTS CONT'D
issued in a number of different series (such as the Fund) and classes. Transactions in Fund shares were as follows:
| | | Year Ended October 31, | |
| Advisers Class | | 2008 | | 2007 | |
| Sales | | | 25,031,349 | | | | 65,096,692 | | |
Issued to shareholders electing to
receive payments of distributions
in Fund shares | | | 2,990,674 | | | | 5,584,266 | | |
| Redemptions | | | (75,723,481 | ) | | | (95,074,436 | ) | |
| Net decrease | | | (47,701,458 | ) | | | (24,393,478 | ) | |
| | | Year Ended October 31, | |
| Class A | | 2008 | | 2007 | |
| Sales | | | 26,587,171 | | | | 96,135,148 | | |
Issued to shareholders electing to
receive payments of distributions
in Fund shares | | | 4,977,937 | | | | 8,633,604 | | |
| Redemptions | | | (106,370,562 | ) | | | (123,531,866 | ) | |
| Exchange from Class B shares | | | 899,904 | | | | 1,284,530 | | |
| Net decrease | | | (73,905,550 | ) | | | (17,478,584 | ) | |
| | | Year Ended October 31, | |
| Class B | | 2008 | | 2007 | |
| Sales | | | 814,509 | | | | 1,939,667 | | |
Issued to shareholders electing to
receive payments of distributions
in Fund shares | | | 524,266 | | | | 814,090 | | |
| Redemptions | | | (6,703,368 | ) | | | (6,343,329 | ) | |
| Exchange to Class A shares | | | (929,486 | ) | | | (1,326,892 | ) | |
| Net decrease | | | (6,294,079 | ) | | | (4,916,464 | ) | |
| | | Year Ended October 31, | |
| Class C | | 2008 | | 2007 | |
| Sales | | | 9,620,150 | | | | 36,772,421 | | |
Issued to shareholders electing to
receive payments of distributions
in Fund shares | | | 3,227,152 | | | | 4,652,826 | | |
| Redemptions | | | (58,681,438 | ) | | | (41,242,090 | ) | |
| Net increase (decrease) | | | (45,834,136 | ) | | | 183,157 | | |
| | | Year Ended October 31, | |
| Class I | | 2008 | | 2007 | |
| Sales | | | 39,320,396 | | | | 44,817,688 | | |
Issued to shareholders electing to
receive payments of distributions
in Fund shares | | | 1,744,790 | | | | 2,866,699 | | |
| Redemptions | | | (46,050,148 | ) | | | (41,518,916 | ) | |
| Net increase (decrease) | | | (4,984,962 | ) | | | 6,165,471 | | |
For the years ended October 31, 2008 and October 31, 2007, the Fund received $211,287 and $339,031, respectively, in redemption fees.
8 Recently Issued Accounting Pronouncement
In September 2006, the Financial Accounting Standards Board (FASB) issued Statement of Financial Accounting Standards No. 157 (FAS 157), "Fair Value Measurements". FAS 157 defines fair value, establishes a framework for measuring fair value in accordance with accounting principles generally accepted in the United States of America and expands disclosure about fair value measurements. FAS 157 is effective for fiscal years beginning after November 15, 2007. As of October 31, 2008, management does not believe the adoption of FAS 157 will impact the amounts reported in the financial statements; however, additional disclosures may be required about the inputs used to develop the measurements of fair value and the effect of certain of the measurements on changes in net assets for the period.
15
Eaton Vance Floating-Rate Fund as of October 31, 2008
REPORT OF INDEPENDENT REGISTERED PUBLIC ACCOUNTING FIRM
To the Trustees of Eaton Vance Mutual Funds Trust and Shareholders
of Eaton Vance Floating-Rate Fund:
We have audited the accompanying statement of assets and liabilities of Eaton Vance Floating-Rate Fund (the "Fund") (one of the series of Eaton Vance Mutual Funds Trust) as of October 31, 2008, and the related statement of operations for the year then ended, the statements of changes in net assets for each of the two years in the period then ended, and the financial highlights for each of the five years in the period then ended. These financial statements and financial highlights are the responsibility of the Fund's management. Our responsibility is to express an opinion on these financial statements and financial highlights based on our audits.
We conducted our audits in accordance with the standards of the Public Company Accounting Oversight Board (United States). Those standards require that we plan and perform the audit to obtain reasonable assurance about whether the financial statements and financial highlights are free of material misstatement. The Fund is not required to have, nor were we engaged to perform, an audit of its internal control over financial reporting. Our audits included consideration of internal control over financial reporting as a basis for designing audit procedures that are appropriate in the circumstances, but not for the purpose of expressing an opinion on the effectiveness of the Fund's internal control over financial reporting. Accordingly, we express no such opinion. An audit also includes examining, on a test basis, evidence supporting the amounts and disclosures in the financial statements, assessing the accounting principles used and significant estimates made by management, as well as evaluating the overall financial statement presentation. We believe that our audits provide a reasonable basis for our opinion.
In our opinion, the financial statements and financial highlights referred to above present fairly, in all material respects, the financial position of Eaton Vance Floating-Rate Fund as of October 31, 2008, the results of its operations for the year then ended, the changes in its net assets for each of the two years in the period then ended, and the financial highlights for each of the five years in the period then ended, in conformity with accounting principles generally accepted in the United States of America.
DELOITTE & TOUCHE LLP
Boston, Massachusetts
December 18, 2008
16
Eaton Vance Floating-Rate Fund as of October 31, 2008
FEDERAL TAX INFORMATION (Unaudited)
The Form 1099-DIV you receive in January 2009 will show the tax status of all distributions paid to your account in calendar 2008. Shareholders are advised to consult their own tax adviser with respect to the tax consequences of their investment in the Fund.
17
Floating Rate Portfolio as of October 31, 2008
PORTFOLIO OF INVESTMENTS
| Senior Floating-Rate Interests — 100.3%(1) | | | |
Principal
Amount* | | Borrower/Tranche Description | | Value | |
| Aerospace and Defense — 2.1% | | | |
| AWAS Capital, Inc. | | | |
| | 7,524,143 | | | Term Loan, 5.00%, Maturing March 22, 2013 | | $ | 5,379,763 | | |
| CACI International, Inc. | | | |
| | 5,021,774 | | | Term Loan, 5.18%, Maturing May 3, 2011 | | | 4,306,172 | | |
| DAE Aviation Holdings, Inc. | | | |
| | 567,742 | | | Term Loan, 7.17%, Maturing July 31, 2014 | | | 422,968 | | |
| | 574,468 | | | Term Loan, 7.37%, Maturing July 31, 2014 | | | 427,979 | | |
| Evergreen International Aviation | | | |
| | 6,545,389 | | | Term Loan, 9.00%, Maturing October 31, 2011 | | | 4,990,859 | | |
| Hawker Beechcraft Acquisition | | | |
| | 849,135 | | | Term Loan, 5.76%, Maturing March 26, 2014 | | | 551,331 | | |
| | 12,517,665 | | | Term Loan, 5.76%, Maturing March 26, 2014 | | | 8,127,544 | | |
| Hexcel Corp. | | | |
| | 6,128,722 | | | Term Loan, 5.25%, Maturing March 1, 2012 | | | 5,454,562 | | |
| IAP Worldwide Services, Inc. | | | |
| | 3,304,190 | | | Term Loan, 9.06%, Maturing December 30, 2012 | | | 2,213,807 | | |
| Jet Aviation Holding, AG | | | |
| | 2,641,059 | | | Term Loan, 3.16%, Maturing May 15, 2013 | | | 2,231,695 | | |
| PGS Solutions, Inc. | | | |
| | 1,919,717 | | | Term Loan, 4.82%, Maturing February 14, 2013 | | | 1,401,393 | | |
| Spirit AeroSystems, Inc. | | | |
| | 3,787,083 | | | Term Loan, 6.50%, Maturing December 31, 2011 | | | 3,228,488 | | |
| TransDigm, Inc. | | | |
| | 9,650,000 | | | Term Loan, 5.21%, Maturing June 23, 2013 | | | 7,394,312 | | |
| Vought Aircraft Industries, Inc. | | | |
| | 10,000,000 | | | Revolving Loan, 0.00%, Maturing December 22, 2009(2) | | | 8,850,000 | | |
| | 4,905,750 | | | Term Loan, 5.62%, Maturing December 17, 2011 | | | 3,900,071 | | |
| | 4,000,000 | | | Term Loan, 6.42%, Maturing December 17, 2011 | | | 3,000,000 | | |
| | 1,995,300 | | | Term Loan, 7.50%, Maturing December 22, 2011 | | | 1,636,146 | | |
| | | | | | | $ | 63,517,090 | | |
| Air Transport — 0.6% | | | |
| Delta Air Lines, Inc. | | | |
| | 8,514,000 | | | Term loan, 5.36%, Maturing April 30, 2012 | | $ | 6,027,912 | | |
| | 5,472,292 | | | Term Loan - Second Lien, 6.25%,
Maturing April 30, 2014 | | | 3,146,568 | | |
| Northwest Airlines, Inc. | | | |
| | 11,758,158 | | | DIP Loan, 5.00%, Maturing August 21, 2009 | | | 9,568,201 | | |
| | | | | | | $ | 18,742,681 | | |
Principal
Amount* | | Borrower/Tranche Description | | Value | |
| Automotive — 3.9% | | | |
| Accuride Corp. | | | |
| | 8,954,274 | | | Term Loan, 7.31%, Maturing January 31, 2012 | | $ | 6,782,862 | | |
| Adesa, Inc. | | | |
| | 21,183,104 | | | Term Loan, 6.02%, Maturing October 18, 2013 | | | 14,104,409 | | |
| Allison Transmission, Inc. | | | |
| | 7,767,399 | | | Term Loan, 5.67%, Maturing September 30, 2014 | | | 5,334,541 | | |
| Chrysler Financial | | | |
| | 4,488,665 | | | Term Loan, 6.82%, Maturing August 1, 2014 | | | 3,078,475 | | |
| CSA Acquisition Corp. | | | |
| | 1,916,590 | | | Term Loan, 6.31%, Maturing December 23, 2011 | | | 1,336,822 | | |
| | 2,594,944 | | | Term Loan, 6.31%, Maturing December 23, 2011 | | | 1,809,973 | | |
| | 2,322,692 | | | Term Loan, 6.31%, Maturing December 23, 2012 | | | 1,707,179 | | |
| Dayco Products, LLC | | | |
| | 8,280,322 | | | Term Loan, 8.01%, Maturing June 21, 2011 | | | 2,815,309 | | |
| Federal-Mogul Corp. | | | |
| | 10,002,591 | | | Term Loan, 5.48%, Maturing December 27, 2014 | | | 6,089,078 | | |
| | 7,914,683 | | | Term Loan, 6.12%, Maturing December 27, 2015 | | | 4,818,063 | | |
| Financiere Truck (Investissement) | | | |
| EUR | 1,110,579 | | | Term Loan, 6.97%, Maturing February 15, 2012 | | | 969,610 | | |
| Ford Motor Co. | | | |
| | 10,000,000 | | | Revolving Loan, 0.00%, Maturing December 15, 2013(2) | | | 5,033,330 | | |
| | 7,034,465 | | | Term Loan, 7.59%, Maturing December 15, 2013 | | | 3,909,151 | | |
| Fraikin, Ltd. | | | |
| GBP | 1,392,962 | | | Term Loan, 8.13%, Maturing February 15, 2012(2) | | | 1,479,564 | | |
| GBP | 1,612,016 | | | Term Loan, 8.27%, Maturing February 15, 2012(2) | | | 1,712,236 | | |
| General Motors Corp. | | | |
| | 17,380,911 | | | Term Loan, 5.80%, Maturing November 29, 2013 | | | 9,611,644 | | |
| Goodyear Tire & Rubber Co. | | | |
| | 16,755,707 | | | Term Loan - Second Lien, 4.78%, Maturing April 30, 2010 | | | 11,924,484 | | |
| HLI Operating Co., Inc. | | | |
| EUR | 425,455 | | | Term Loan, 4.87%, Maturing May 30, 2014 | | | 466,346 | | |
| EUR | 7,282,364 | | | Term Loan, 7.67%, Maturing May 30, 2014 | | | 7,239,755 | | |
| Keystone Automotive Operations, Inc. | | | |
| | 6,911,631 | | | Term Loan, 6.78%, Maturing January 12, 2012 | | | 3,974,188 | | |
| Locafroid Services S.A.S. | | | |
| EUR | 1,666,405 | | | Term Loan, 7.30%, Maturing February 15, 2012(2) | | | 1,454,883 | | |
| Speedy 1, Ltd. | | | |
| EUR | 6,457,254 | | | Term Loan, 6.76%, Maturing August 31, 2013 | | | 3,312,613 | | |
| Tenneco Automotive, Inc. | | | |
| | 5,050,000 | | | Term Loan, 5.50%, Maturing March 17, 2014 | | | 3,939,000 | | |
| TriMas Corp. | | | |
| | 893,750 | | | Term Loan, 4.88%, Maturing August 2, 2011 | | | 679,250 | | |
| | 8,042,125 | | | Term Loan, 5.63%, Maturing August 2, 2013 | | | 6,112,015 | | |
| TRW Automotive, Inc. | | | |
| | 6,638,326 | | | Term Loan, 5.21%, Maturing February 2, 2014 | | | 5,233,211 | | |
See notes to financial statements
18
Floating Rate Portfolio as of October 31, 2008
PORTFOLIO OF INVESTMENTS CONT'D
Principal
Amount* | | Borrower/Tranche Description | | Value | |
| Automotive (continued) | | | |
| United Components, Inc. | | | |
| | 7,501,299 | | | Term Loan, 4.81%, Maturing June 30, 2010 | | $ | 5,710,364 | | |
| | | | | | | $ | 120,638,355 | | |
| Beverage and Tobacco — 0.4% | | | |
| Culligan International Co. | | | |
| | 17,232,550 | | | Term Loan, 5.76%, Maturing November 24, 2014 | | $ | 10,554,937 | | |
| Van Houtte, Inc. | | | |
| | 860,266 | | | Term Loan, 6.26%, Maturing July 11, 2014 | | | 696,816 | | |
| | 117,309 | | | Term Loan, 6.26%, Maturing July 11, 2014 | | | 95,020 | | |
| | | | | | | $ | 11,346,773 | | |
| Brokers, Dealers and Investment Houses — 0.3% | | | |
| AmeriTrade Holding Corp. | | | |
| | 10,350,931 | | | Term Loan, 4.50%, Maturing December 31, 2012 | | $ | 8,655,966 | | |
| | | | | | | $ | 8,655,966 | | |
| Building and Development — 5.2% | | | |
| 401 North Wabash Venture, LLC | | | |
| | 6,495,771 | | | Term Loan, 4.95%, Maturing May 7, 2009(2) | | $ | 4,871,828 | | |
| AIMCO Properties, L.P. | | | |
| | 10,718,750 | | | Term Loan, 5.43%, Maturing March 23, 2011 | | | 9,271,719 | | |
| Banning Lewis Ranch Co., LLC | | | |
| | 13,000,000 | | | Term Loan, 4.68%, Maturing December 3, 2012(2) | | | 12,090,000 | | |
| Beacon Sales Acquisition, Inc. | | | |
| | 4,473,601 | | | Term Loan, 6.02%, Maturing September 30, 2013 | | | 3,355,201 | | |
| Brickman Group Holdings, Inc. | | | |
| | 4,927,469 | | | Term Loan, 5.12%, Maturing January 23, 2014 | | | 3,868,063 | | |
| Building Materials Corp. of America | | | |
| | 8,153,576 | | | Term Loan, 6.62%, Maturing February 22, 2014 | | | 5,691,196 | | |
| Capital Automotive (REIT) | | | |
| | 4,788,753 | | | Term Loan, 5.47%, Maturing December 16, 2010 | | | 3,050,436 | | |
| Contech Construction Products | | | |
| | 1,821,954 | | | Term Loan, 5.00%, Maturing January 13, 2013 | | | 1,216,154 | | |
| Epco/Fantome, LLC | | | |
| | 9,890,000 | | | Term Loan, 5.80%, Maturing November 23, 2010 | | | 9,296,600 | | |
| Financiere Daunou S.A. | | | |
| | 1,664,521 | | | Term Loan, 5.89%, Maturing May 31, 2015 | | | 602,002 | | |
| EUR | 1,067,260 | | | Term Loan, 7.27%, Maturing May 31, 2015 | | | 508,160 | | |
| EUR | 2,613,290 | | | Term Loan, 7.27%, Maturing May 31, 2015 | | | 1,244,279 | | |
| | 2,452,266 | | | Term Loan, 6.14%, Maturing February 28, 2016 | | | 886,904 | | |
| EUR | 1,246,799 | | | Term Loan, 7.52%, Maturing February 28, 2016 | | | 593,645 | | |
| EUR | 2,423,776 | | | Term Loan, 7.52%, Maturing February 28, 2016 | | | 1,154,044 | | |
Principal
Amount* | | Borrower/Tranche Description | | Value | |
| Building and Development (continued) | | | |
| Forestar USA Real Estate Group, Inc. | | | |
| | 10,625,000 | | | Revolving Loan, 5.97%, Maturing December 1, 2010(2) | | $ | 9,987,500 | | |
| | 5,625,000 | | | Term Loan, 7.48%, Maturing December 1, 2010 | | | 5,512,500 | | |
| General Growth Properties, Inc. | | | |
| | 3,782,895 | | | Term Loan, 5.74%, Maturing February 24, 2011 | | | 1,369,949 | | |
| Hearthstone Housing Partners II, LLC | | | |
| | 13,040,000 | | | Revolving Loan, 5.92%, Maturing December 1, 2009(2) | | | 8,083,496 | | |
| Hovstone Holdings, LLC | | | |
| | 4,260,000 | | | Term Loan, 6.25%, Maturing February 28, 2009 | | | 2,796,264 | | |
| LNR Property Corp. | | | |
| | 9,154,000 | | | Term Loan, 6.04%, Maturing July 3, 2011 | | | 5,011,815 | | |
| Mueller Water Products, Inc. | | | |
| | 8,856,431 | | | Term Loan, 5.22%, Maturing May 24, 2014 | | | 6,819,452 | | |
| NCI Building Systems, Inc. | | | |
| | 5,975,136 | | | Term Loan, 5.42%, Maturing June 18, 2010 | | | 5,078,866 | | |
| November 2005 Land Investors | | | |
| | 608,296 | | | Term Loan, 7.12%, Maturing May 9, 2011 | | | 441,015 | | |
| Panolam Industries Holdings, Inc. | | | |
| | 2,925,967 | | | Term Loan, 6.51%, Maturing September 30, 2012 | | | 2,516,332 | | |
| Realogy Corp. | | | |
| | 10,357,871 | | | Term Loan, 6.50%, Maturing September 1, 2014 | | | 6,663,560 | | |
| | 2,788,658 | | | Term Loan, 6.50%, Maturing September 1, 2014 | | | 1,794,036 | | |
| Shea Capital I, LLC | | | |
| | 293,787 | | | Term Loan, 5.25%, Maturing October 27, 2011 | | | 146,893 | | |
| South Edge, LLC | | | |
| | 8,794,643 | | | Term Loan, 6.25%, Maturing October 31, 2009(5) | | | 1,429,129 | | |
| Standard Pacific Corp. | | | |
| | 4,680,000 | | | Term Loan, 4.56%, Maturing May 5, 2013 | | | 3,096,602 | | |
| TRU 2005 RE Holding Co. | | | |
| | 19,825,000 | | | Term Loan, 6.72%, Maturing December 9, 2008 | | | 14,488,764 | | |
| United Subcontractors, Inc. | | | |
| | 5,959,915 | | | Term Loan - Second Lien, 12.42%,
Maturing June 27, 2013(3) | | | 2,264,768 | | |
| WCI Communities, Inc. | | | |
| | 18,240,601 | | | Term Loan, 8.97%, Maturing December 23, 2010 | | | 13,619,655 | | |
| Wintergames Acquisition ULC | | | |
| | 12,929,530 | | | Term Loan, 10.74%, Maturing April 24, 2009 | | | 9,566,559 | | |
| | | | | | | $ | 158,387,386 | | |
| Business Equipment and Services — 7.1% | | | |
| ACCO Brands Corp. | | | |
| | 5,207,841 | | | Term Loan, 5.21%, Maturing August 17, 2012 | | $ | 3,645,489 | | |
| Activant Solutions, Inc. | | | |
| | 5,191,577 | | | Term Loan, 6.07%, Maturing May 1, 2013 | | | 3,478,357 | | |
| Acxiom Corp. | | | |
| | 9,700,525 | | | Term Loan, 4.94%, Maturing September 15, 2012 | | | 7,081,383 | | |
See notes to financial statements
19
Floating Rate Portfolio as of October 31, 2008
PORTFOLIO OF INVESTMENTS CONT'D
Principal
Amount* | | Borrower/Tranche Description | | Value | |
| Business Equipment and Services (continued) | | | |
| Affiliated Computer Services | | | |
| | 5,932,250 | | | Term Loan, 5.26%, Maturing March 20, 2013 | | $ | 5,023,874 | | |
| | 12,794,582 | | | Term Loan, 5.81%, Maturing March 20, 2013 | | | 10,835,411 | | |
| Affinion Group, Inc. | | | |
| | 8,935,792 | | | Term Loan, 5.32%, Maturing October 17, 2012 | | | 7,126,294 | | |
| Education Management, LLC | | | |
| | 11,421,119 | | | Term Loan, 5.56%, Maturing June 1, 2013 | | | 8,051,889 | | |
| Info USA, Inc. | | | |
| | 1,965,000 | | | Term Loan, 5.77%, Maturing February 14, 2012 | | | 1,729,200 | | |
| | 4,328,404 | | | Term Loan, 5.77%, Maturing February 14, 2012 | | | 3,808,995 | | |
| Information Resources, Inc. | | | |
| | 5,571,512 | | | Term Loan, 4.56%, Maturing May 7, 2014 | | | 3,927,916 | | |
| Intergraph Corp. | | | |
| | 3,349,524 | | | Term Loan, 4.81%, Maturing May 29, 2014 | | | 2,612,629 | | |
| iPayment, Inc. | | | |
| | 11,245,967 | | | Term Loan, 5.70%, Maturing May 10, 2013 | | | 8,715,624 | | |
| ista International GmbH | | | |
| EUR | 9,635,715 | | | Term Loan, 7.12%, Maturing May 14, 2015 | | | 7,077,042 | | |
| EUR | 1,914,285 | | | Term Loan, 7.12%, Maturing May 14, 2015 | | | 1,405,964 | | |
| Kronos, Inc. | | | |
| | 8,796,248 | | | Term Loan, 6.01%, Maturing June 11, 2014 | | | 6,025,430 | | |
| Language Line, Inc. | | | |
| | 6,778,210 | | | Term Loan, 7.02%, Maturing June 11, 2011 | | | 5,727,587 | | |
| N.E.W. Holdings I, LLC | | | |
| | 9,531,466 | | | Term Loan, 5.89%, Maturing May 22, 2014 | | | 7,363,058 | | |
| Protection One, Inc. | | | |
| | 9,223,166 | | | Term Loan, 5.42%, Maturing March 31, 2012 | | | 7,470,764 | | |
| Quintiles Transnational Corp. | | | |
| | 11,133,433 | | | Term Loan, 5.77%, Maturing March 31, 2013 | | | 8,990,247 | | |
| Sabre, Inc. | | | |
| | 30,769,734 | | | Term Loan, 5.25%, Maturing September 30, 2014 | | | 17,829,338 | | |
| Safenet, Inc. | | | |
| | 3,950,000 | | | Term Loan, 7.75%, Maturing April 12, 2014 | | | 2,271,250 | | |
| Serena Software, Inc. | | | |
| | 2,592,464 | | | Term Loan, 5.50%, Maturing March 10, 2013 | | | 2,236,000 | | |
| Sitel (Client Logic) | | | |
| | 4,865,854 | | | Term Loan, 6.51%, Maturing January 29, 2014 | | | 2,919,512 | | |
| EUR | 941,032 | | | Term Loan, 7.33%, Maturing January 29, 2014 | | | 845,572 | | |
| Solera Holdings, LLC | | | |
| EUR | 2,999,467 | | | Term Loan, 6.70%, Maturing May 15, 2014 | | | 2,867,228 | | |
| Solera Nederland Holdings | | | |
| | 3,793,852 | | | Term Loan, 4.57%, Maturing May 15, 2014 | | | 2,997,143 | | |
| SunGard Data Systems, Inc. | | | |
| | 37,459,070 | | | Term Loan, 4.55%, Maturing February 11, 2013 | | | 28,870,230 | | |
| | 3,475,000 | | | Term Loan, 6.75%, Maturing February 28, 2014 | | | 2,988,500 | | |
Principal
Amount* | | Borrower/Tranche Description | | Value | |
| Business Equipment and Services (continued) | | | |
| TDS Investor Corp. | | | |
| | 10,862,500 | | | Term Loan, 5.37%, Maturing August 23, 2013 | | $ | 6,626,125 | | |
| | 13,317,413 | | | Term Loan, 6.01%, Maturing August 23, 2013 | | | 8,275,826 | | |
| | 2,672,147 | | | Term Loan, 6.01%, Maturing August 23, 2013 | | | 1,660,549 | | |
| EUR | 2,105,820 | | | Term Loan, 7.39%, Maturing August 23, 2013 | | | 1,690,903 | | |
| Transaction Network Services, Inc. | | | |
| | 4,843,693 | | | Term Loan, 4.80%, Maturing May 4, 2012 | | | 4,177,685 | | |
| Valassis Communications, Inc. | | | |
| | 743,929 | | | Term Loan, 5.52%, Maturing March 2, 2014 | | | 523,230 | | |
| | 4,409,895 | | | Term Loan, 5.52%, Maturing March 2, 2014 | | | 3,101,625 | | |
| VWR International, Inc. | | | |
| | 7,725,000 | | | Term Loan, 5.67%, Maturing June 28, 2013 | | | 5,394,622 | | |
| West Corp. | | | |
| | 17,833,643 | | | Term Loan, 5.73%, Maturing October 24, 2013 | | | 11,547,284 | | |
| | | | | | | $ | 216,919,775 | | |
| Cable and Satellite Television — 7.0% | | | |
| Atlantic Broadband Finance, LLC | | | |
| | 9,853,155 | | | Term Loan, 6.02%, Maturing February 10, 2011 | | $ | 9,015,637 | | |
| Bresnan Broadband Holdings, LLC | | | |
| | 15,551,500 | | | Term Loan, 4.86%, Maturing March 29, 2014 | | | 12,337,518 | | |
| | 1,500,000 | | | Term Loan, 6.06%, Maturing March 29, 2014 | | | 1,189,999 | | |
| Cequel Communications, LLC | | | |
| | 31,019,697 | | | Term Loan, 6.21%, Maturing November 5, 2013 | | | 23,001,974 | | |
| Charter Communications Operating, Inc. | | | |
| | 43,138,319 | | | Term Loan, 5.31%, Maturing April 28, 2013 | | | 32,481,817 | | |
| CSC Holdings, Inc. | | | |
| | 14,920,013 | | | Term Loan, 4.57%, Maturing March 29, 2013 | | | 12,969,758 | | |
| DirectTV Holdings, LLC | | | |
| | 1,995,000 | | | Term Loan, 5.31%, Maturing April 13, 2013 | | | 1,827,919 | | |
| Foxco Acquistion Sub., LLC | | | |
| | 3,075,000 | | | Term Loan, 7.25%, Maturing July 2, 2015 | | | 2,429,250 | | |
| Insight Midwest Holdings, LLC | | | |
| | 25,316,250 | | | Term Loan, 5.93%, Maturing April 6, 2014 | | | 20,042,040 | | |
| Kabel BW GmbH & Co. KG | | | |
| EUR | 1,490,959 | | | Term Loan, 6.75%, Maturing June 9, 2012 | | | 1,401,472 | | |
| MCC Iowa, LLC | | | |
| | 1,073,250 | | | Term Loan, 3.64%, Maturing March 31, 2010 | | | 931,044 | | |
| Mediacom Broadband Group | | | |
| | 7,734,489 | | | Term Loan, 3.89%, Maturing January 31, 2015 | | | 5,626,841 | | |
| | 7,860,000 | | | Term Loan, 3.89%, Maturing January 31, 2015 | | | 5,718,150 | | |
| Mediacom Illinois, LLC | | | |
| | 1,850,000 | | | Term Loan, 2.12%, Maturing September 30, 2012 | | | 1,341,250 | | |
| | 14,321,388 | | | Term Loan, 3.64%, Maturing January 31, 2015 | | | 10,299,470 | | |
See notes to financial statements
20
Floating Rate Portfolio as of October 31, 2008
PORTFOLIO OF INVESTMENTS CONT'D
Principal
Amount* | | Borrower/Tranche Description | | Value | |
| Cable and Satellite Television (continued) | | | |
| NTL Investment Holdings, Ltd. | | | |
| | 7,993,878 | | | Term Loan, 5.83%, Maturing March 30, 2012 | | $ | 5,535,761 | | |
| GBP | 2,139,186 | | | Term Loan, 8.13%, Maturing March 30, 2012 | | | 2,308,174 | | |
| GBP | 1,990,985 | | | Term Loan, 8.13%, Maturing March 30, 2012 | | | 2,148,266 | | |
| GBP | 3,637,947 | | | Term Loan, 8.15%, Maturing March 30, 2012 | | | 3,925,333 | | |
| GBP | 2,224,230 | | | Term Loan, 8.15%, Maturing March 30, 2012 | | | 2,399,937 | | |
| GBP | 3,500,000 | | | Term Loan, 8.74%, Maturing March 30, 2013 | | | 3,360,861 | | |
| ProSiebenSat.1 Media AG | | | |
| EUR | 2,019,706 | | | Term Loan, 7.53%, Maturing March 2, 2015 | | | 643,554 | | |
| EUR | 600,197 | | | Term Loan, 6.85%, Maturing June 26, 2015 | | | 416,198 | | |
| EUR | 12,586,345 | | | Term Loan, 6.85%, Maturing June 26, 2015 | | | 8,727,818 | | |
| EUR | 2,019,706 | | | Term Loan, 7.78%, Maturing March 2, 2016 | | | 643,554 | | |
| UPC Broadband Holding B.V. | | | |
| EUR | 6,617,448 | | | Term Loan, 7.01%, Maturing October 16, 2011 | | | 5,622,848 | | |
| EUR | 14,937,387 | | | Term Loan, 7.01%, Maturing October 16, 2011 | | | 12,692,304 | | |
| | 10,925,000 | | | Term Loan, 5.47%, Maturing December 31, 2014 | | | 7,838,687 | | |
| YPSO Holding SA | | | |
| EUR | 12,899,564 | | | Term Loan, 7.00%, Maturing July 28, 2014 | | | 8,117,812 | | |
| EUR | 4,978,165 | | | Term Loan, 7.00%, Maturing July 28, 2014 | | | 3,132,805 | | |
| EUR | 8,122,271 | | | Term Loan, 7.00%, Maturing July 28, 2014 | | | 5,111,419 | | |
| | | | | | | $ | 213,239,470 | | |
| Chemicals and Plastics — 6.2% | | | |
| Arizona Chemical, Inc. | | | |
| EUR | 2,842,826 | | | Term Loan, 7.21%, Maturing February 28, 2013 | | $ | 2,581,618 | | |
| Brenntag Holding GmbH and Co. KG | | | |
| | 1,963,636 | | | Term Loan, 5.07%, Maturing December 23, 2013 | | | 1,364,727 | | |
| | 8,036,364 | | | Term Loan, 5.07%, Maturing December 23, 2013 | | | 5,585,273 | | |
| EUR | 3,511,248 | | | Term Loan, 7.14%, Maturing December 23, 2013 | | | 3,442,223 | | |
| EUR | 845,455 | | | Term Loan, 7.16%, Maturing December 23, 2013 | | | 828,834 | | |
| EUR | 654,545 | | | Term Loan, 7.16%, Maturing December 23, 2013 | | | 641,678 | | |
| EUR | 525,062 | | | Term Loan, 7.39%, Maturing December 23, 2014 | | | 514,741 | | |
| EUR | 963,689 | | | Term Loan, 7.39%, Maturing December 23, 2014 | | | 944,745 | | |
| EUR | 770,053 | | | Term Loan - Second Lien, 9.42%, Maturing June 23, 2015 | | | 621,598 | | |
| EUR | 229,947 | | | Term Loan - Second Lien, 9.42%, Maturing June 23, 2015 | | | 185,616 | | |
| Celanese Holdings, LLC | | | |
| EUR | 987,500 | | | Term Loan, 6.78%, Maturing April 6, 2011 | | | 948,159 | | |
| | 7,000,000 | | | Term Loan, 4.35%, Maturing April 2, 2014 | | | 5,689,999 | | |
| | 14,488,087 | | | Term Loan, 5.55%, Maturing April 2, 2014 | | | 11,776,743 | | |
| Cognis GmbH | | | |
| EUR | 6,426,230 | | | Term Loan, 6.96%, Maturing September 15, 2013 | | | 5,168,238 | | |
| EUR | 1,573,770 | | | Term Loan, 6.96%, Maturing September 15, 2013 | | | 1,265,691 | | |
| Columbian Chemicals Acquisition | | | |
| | 4,103,418 | | | Term Loan, 7.01%, Maturing March 16, 2013 | | | 2,708,256 | | |
Principal
Amount* | | Borrower/Tranche Description | | Value | |
| Chemicals and Plastics (continued) | | | |
| Ferro Corp. | | | |
| | 13,662,500 | | | Term Loan, 5.81%, Maturing June 6, 2012 | | $ | 12,432,875 | | |
| First Chemical Holding | | | |
| EUR | 624,358 | | | Term Loan, 7.66%, Maturing December 18, 2014 | | | 560,027 | | |
| EUR | 624,358 | | | Term Loan, 8.16%, Maturing December 18, 2015 | | | 560,027 | | |
| Foamex, L.P. | | | |
| | 3,673,125 | | | Term Loan, 8.04%, Maturing February 12, 2013 | | | 1,698,820 | | |
| Georgia Gulf Corp. | | | |
| | 5,112,496 | | | Term Loan, 9.05%, Maturing October 3, 2013 | | | 4,095,109 | | |
| Hexion Specialty Chemicals, Inc. | | | |
| EUR | 1,116,324 | | | Term Loan, 7.39%, Maturing May 5, 2012 | | | 917,713 | | |
| | 9,700,000 | | | Term Loan, 4.70%, Maturing May 5, 2013 | | | 6,749,580 | | |
| | 2,507,020 | | | Term Loan, 5.06%, Maturing May 5, 2013 | | | 1,744,468 | | |
| | 3,326,375 | | | Term Loan, 6.06%, Maturing May 5, 2013 | | | 2,314,602 | | |
| | 15,315,090 | | | Term Loan, 6.19%, Maturing May 5, 2013 | | | 10,656,745 | | |
| Huntsman International, LLC | | | |
| | 5,864,329 | | | Term Loan, 4.97%, Maturing August 16, 2012 | | | 5,099,873 | | |
| INEOS Group | | | |
| EUR | 566,586 | | | Term Loan, 7.21%, Maturing December 14, 2011 | | | 389,628 | | |
| EUR | 567,621 | | | Term Loan, 8.27%, Maturing December 14, 2011 | | | 390,340 | | |
| | 4,773,072 | | | Term Loan, 5.93%, Maturing December 14, 2012 | | | 3,066,699 | | |
| | 10,070,804 | | | Term Loan, 5.95%, Maturing December 14, 2013 | | | 5,606,084 | | |
| | 10,070,804 | | | Term Loan, 6.45%, Maturing December 14, 2014 | | | 5,513,765 | | |
| Innophos, Inc. | | | |
| | 6,069,669 | | | Term Loan, 6.76%, Maturing August 10, 2010 | | | 5,219,916 | | |
| Invista B.V. | | | |
| | 1,715,856 | | | Term Loan, 5.17%, Maturing April 30, 2010 | | | 1,424,161 | | |
| | 8,136,059 | | | Term Loan, 4.92%, Maturing April 29, 2011 | | | 6,752,929 | | |
| | 2,841,598 | | | Term Loan, 4.92%, Maturing April 29, 2011 | | | 2,358,526 | | |
| ISP Chemco, Inc. | | | |
| | 8,603,065 | | | Term Loan, 5.06%, Maturing June 4, 2014 | | | 6,796,422 | | |
| Kleopatra | | | |
| | 8,876,250 | | | Term Loan, 6.82%, Maturing January 3, 2016 | | | 4,216,219 | | |
| EUR | 5,100,000 | | | Term Loan, 7.88%, Maturing January 3, 2016 | | | 3,331,355 | | |
| Kranton Polymers, LLC | | | |
| | 8,829,700 | | | Term Loan, 5.31%, Maturing May 12, 2013 | | | 6,828,298 | | |
| Lucite International Group Holdings | | | |
| | 4,777,065 | | | Term Loan, 5.37%, Maturing July 7, 2013 | | | 4,335,186 | | |
| | 1,691,565 | | | Term Loan, 5.37%, Maturing July 7, 2013 | | | 1,347,614 | | |
| MacDermid, Inc. | | | |
| | 3,410,921 | | | Term Loan, 5.76%, Maturing April 12, 2014 | | | 2,276,789 | | |
| Millenium Inorganic Chemicals | | | |
| | 7,389,138 | | | Term Loan, 6.01%, Maturing April 30, 2014 | | | 4,765,994 | | |
| Momentive Performance Material | | | |
| | 4,950,000 | | | Term Loan, 4.90%, Maturing December 4, 2013 | | | 3,856,877 | | |
See notes to financial statements
21
Floating Rate Portfolio as of October 31, 2008
PORTFOLIO OF INVESTMENTS CONT'D
Principal
Amount* | | Borrower/Tranche Description | | Value | |
| Chemicals and Plastics (continued) | | | |
| | 1,655,736 | | | Term Loan, 5.38%, Maturing December 4, 2013 | | $ | 1,290,095 | | |
| Propex Fabrics, Inc. | | | |
| | 5,737,805 | | | Term Loan, 8.00%, Maturing July 31, 2012 | | | 1,735,686 | | |
| Rockwood Specialties Group, Inc. | | | |
| EUR | 1,961,700 | | | Term Loan, 6.23%, Maturing July 30, 2011 | | | 1,981,476 | | |
| | 21,023,557 | | | Term Loan, 4.62%, Maturing December 10, 2012 | | | 17,607,229 | | |
| Solo Cup Co. | | | |
| | 2,505,636 | | | Term Loan, 6.65%, Maturing February 27, 2011 | | | 2,177,816 | | |
| TPG Spring UK, Ltd. | | | |
| EUR | 2,271,011 | | | Term Loan, 7.87%, Maturing June 27, 2013 | | | 1,727,063 | | |
| EUR | 2,271,011 | | | Term Loan, 8.37%, Maturing June 27, 2013 | | | 1,727,063 | | |
| Wellman, Inc. | | | |
| | 5,098,328 | | | Term Loan, 6.74%, Maturing February 10, 2009(5) | | | 2,416,608 | | |
| | | | | | | $ | 190,237,816 | | |
| Clothing / Textiles — 0.4% | | | |
| Hanesbrands, Inc. | | | |
| | 6,647,836 | | | Term Loan, 5.26%, Maturing September 5, 2013 | | $ | 5,681,128 | | |
| | 5,000,000 | | | Term Loan - Second Lien, 7.27%, Maturing March 5, 2014 | | | 3,916,665 | | |
| St. John Knits International, Inc. | | | |
| | 2,518,697 | | | Term Loan, 6.12%, Maturing March 23, 2012 | | | 2,103,112 | | |
| The William Carter Co. | | | |
| | 2,324,514 | | | Term Loan, 4.76%, Maturing July 14, 2012 | | | 1,958,403 | | |
| | | | | | | $ | 13,659,308 | | |
| Conglomerates — 2.6% | | | |
| Amsted Industries, Inc. | | | |
| | 9,598,050 | | | Term Loan, 6.56%, Maturing October 15, 2010 | | $ | 7,390,498 | | |
| | 6,348,120 | | | Term Loan, 4.73%, Maturing April 5, 2013 | | | 5,015,015 | | |
| Doncasters (Dunde HoldCo 4 Ltd.) | | | |
| | 3,896,883 | | | Term Loan, 4.85%, Maturing July 13, 2015 | | | 2,903,178 | | |
| | 3,896,883 | | | Term Loan, 5.35%, Maturing July 13, 2015 | | | 2,903,178 | | |
| GBP | 727,123 | | | Term Loan, 7.77%, Maturing July 13, 2015 | | | 865,944 | | |
| GBP | 727,123 | | | Term Loan, 8.27%, Maturing July 13, 2015 | | | 865,944 | | |
| Jarden Corp. | | | |
| | 11,041,998 | | | Term Loan, 5.51%, Maturing January 24, 2012 | | | 9,040,636 | | |
| | 4,539,827 | | | Term Loan, 5.51%, Maturing January 24, 2012 | | | 3,716,983 | | |
| Johnson Diversey, Inc. | | | |
| | 2,013,241 | | | Term Loan, 4.79%, Maturing December 16, 2010 | | | 1,600,527 | | |
| | 8,069,270 | | | Term Loan, 4.79%, Maturing December 16, 2011 | | | 6,415,070 | | |
| Polymer Group, Inc. | | | |
| | 1,000,000 | | | Revolving Loan, 5.00%, Maturing November 22, 2010(2) | | | 850,000 | | |
| | 16,866,627 | | | Term Loan, 5.73%, Maturing November 22, 2012 | | | 13,408,968 | | |
Principal
Amount* | | Borrower/Tranche Description | | Value | |
| Conglomerates (continued) | | | |
| RBS Global, Inc. | | | |
| | 2,259,750 | | | Term Loan, 5.76%, Maturing July 19, 2013 | | $ | 1,796,501 | | |
| | 6,185,246 | | | Term Loan, 6.37%, Maturing July 19, 2013 | | | 4,948,197 | | |
| RGIS Holdings, LLC | | | |
| | 15,181,619 | | | Term Loan, 5.46%, Maturing April 30, 2014 | | | 10,424,717 | | |
| | 759,081 | | | Term Loan, 5.62%, Maturing April 30, 2014 | | | 521,236 | | |
| The Manitowoc Company, Inc. | | | |
| | 5,200,000 | | | Term Loan, Maturing August 21, 2014(4) | | | 4,110,600 | | |
| US Investigations Services, Inc. | | | |
| | 1,969,975 | | | Term Loan, 5.95%, Maturing February 21, 2015 | | | 1,398,682 | | |
| | | | | | | $ | 78,175,874 | | |
| Containers and Glass Products — 3.5% | | | |
| Berry Plastics Corp. | | | |
| | 18,591,565 | | | Term Loan, 4.80%, Maturing April 3, 2015 | | $ | 13,688,039 | | |
| Consolidated Container Co. | | | |
| | 5,880,202 | | | Term Loan, 5.75%, Maturing March 28, 2014 | | | 3,577,121 | | |
| Crown Americas, Inc. | | | |
| | 4,751,000 | | | Term Loan, 6.34%, Maturing November 15, 2012 | | | 4,180,880 | | |
| | 1,421,000 | | | Term Loan, 6.34%, Maturing November 15, 2012 | | | 1,250,480 | | |
| EUR | 4,410,000 | | | Term Loan, 6.87%, Maturing November 15, 2012 | | | 5,564,558 | | |
| Graham Packaging Holdings Co. | | | |
| | 21,364,054 | | | Term Loan, 5.74%, Maturing October 7, 2011 | | | 17,497,160 | | |
| Graphic Packaging International, Inc. | | | |
| | 27,563,286 | | | Term Loan, 5.75%, Maturing May 16, 2014 | | | 22,601,894 | | |
| | 3,449,085 | | | Term Loan, 6.86%, Maturing May 16, 2014 | | | 2,938,189 | | |
| JSG Acquisitions | | | |
| EUR | 1,250,000 | | | Term Loan, 6.96%, Maturing December 31, 2014 | | | 1,048,090 | | |
| EUR | 1,250,000 | | | Term Loan, 7.11%, Maturing December 31, 2014 | | | 1,048,090 | | |
| OI European Group B.V. | | | |
| EUR | 12,064,500 | | | Term Loan, 6.62%, Maturing June 14, 2013 | | | 12,647,425 | | |
| Owens-Brockway Glass Container | | | |
| | 4,096,569 | | | Term Loan, 6.09%, Maturing June 14, 2013 | | | 3,487,204 | | |
| Pregis Corp. | | | |
| | 2,619,000 | | | Term Loan, 6.01%, Maturing October 12, 2011 | | | 2,357,100 | | |
| Smurfit-Stone Container Corp. | | | |
| | 8,380,393 | | | Term Loan, 4.88%, Maturing November 1, 2011 | | | 6,662,412 | | |
| | 3,523,439 | | | Term Loan, 4.90%, Maturing November 1, 2011 | | | 2,801,134 | | |
| | 3,773,295 | | | Term Loan, 5.13%, Maturing November 1, 2011 | | | 2,999,770 | | |
| | 2,817,651 | | | Term Loan, 5.93%, Maturing November 1, 2011 | | | 2,240,033 | | |
| | | | | | | $ | 106,589,579 | | |
See notes to financial statements
22
Floating Rate Portfolio as of October 31, 2008
PORTFOLIO OF INVESTMENTS CONT'D
Principal
Amount* | | Borrower/Tranche Description | | Value | |
| Cosmetics / Toiletries — 0.3% | | | |
| American Safety Razor Co. | | | |
| | 3,408,214 | | | Term Loan, 5.92%, Maturing July 31, 2013 | | $ | 2,914,023 | | |
| Prestige Brands, Inc. | | | |
| | 6,599,368 | | | Term Loan, 5.82%, Maturing April 7, 2011 | | | 5,312,491 | | |
| | | | | | | $ | 8,226,514 | | |
| Drugs — 0.9% | | | |
| Graceway Pharmaceuticals, LLC | | | |
| | 9,702,708 | | | Term Loan, 6.51%, Maturing May 3, 2012 | | $ | 6,824,235 | | |
| Pharmaceutical Holdings Corp. | | | |
| | 2,555,203 | | | Term Loan, 6.51%, Maturing January 30, 2012 | | | 2,146,371 | | |
| Stiefel Laboratories, Inc. | | | |
| | 2,824,130 | | | Term Loan, 7.00%, Maturing December 28, 2013 | | | 2,301,666 | | |
| | 6,171,198 | | | Term Loan, 7.00%, Maturing December 28, 2013 | | | 5,029,527 | | |
| Warner Chilcott Corp. | | | |
| | 2,041,411 | | | Term Loan, 5.76%, Maturing January 18, 2012 | | | 1,687,226 | | |
| | 13,303,070 | | | Term Loan, 5.76%, Maturing January 18, 2012 | | | 10,994,987 | | |
| | | | | | | $ | 28,984,012 | | |
| Ecological Services and Equipment — 0.6% | | | |
| Allied Waste Industries, Inc. | | | |
| | 934,293 | | | Term Loan, 4.90%, Maturing January 15, 2012 | | $ | 893,807 | | |
| | 860,505 | | | Term Loan, 5.44%, Maturing January 15, 2012 | | | 823,217 | | |
| Big Dumpster Merger Sub, Inc. | | | |
| | 681,934 | | | Term Loan, 6.01%, Maturing February 5, 2013 | | | 494,402 | | |
| Blue Waste B.V. (AVR Acquisition) | | | |
| EUR | 2,000,000 | | | Term Loan, 7.21%, Maturing April 1, 2015 | | | 2,020,162 | | |
| Casella Waste Systems, Inc. | | | |
| | 2,958,910 | | | Term Loan, 4.73%, Maturing April 28, 2010 | | | 2,581,649 | | |
| Environmental Systems Products Holdings, Inc. | | | |
| | 466,049 | | | Term Loan - Second Lien, 13.74%,
Maturing December 12, 2010 | | | 336,301 | | |
| IESI Corp. | | | |
| | 2,267,647 | | | Term Loan, 4.56%, Maturing January 20, 2012 | | | 1,882,147 | | |
| Sensus Metering Systems, Inc. | | | |
| | 3,000,000 | | | Revolving Loan, 5.00%, Maturing December 17, 2009(2) | | | 2,775,000 | | |
| | 5,511,285 | | | Term Loan, 4.92%, Maturing December 17, 2010 | | | 5,097,938 | | |
| Wastequip, Inc. | | | |
| | 287,130 | | | Term Loan, 6.01%, Maturing February 5, 2013 | | | 208,169 | | |
| | | | | | | $ | 17,112,792 | | |
| Electronics / Electrical — 2.9% | | | |
| Aspect Software, Inc. | | | |
| | 4,253,957 | | | Term Loan, 6.25%, Maturing July 11, 2011 | | $ | 3,445,706 | | |
Principal
Amount* | | Borrower/Tranche Description | | Value | |
| Electronics / Electrical (continued) | | | |
| Fairchild Semiconductor Corp. | | | |
| | 9,265,411 | | | Term Loan, 5.26%, Maturing June 26, 2013 | | $ | 6,717,423 | | |
| FCI International S.A.S. | | | |
| | 761,894 | | | Term Loan, 6.47%, Maturing November 1, 2013 | | | 617,134 | | |
| | 733,492 | | | Term Loan, 6.47%, Maturing November 1, 2013 | | | 594,129 | | |
| | 733,492 | | | Term Loan, 6.47%, Maturing November 1, 2013 | | | 594,129 | | |
| | 761,894 | | | Term Loan, 6.47%, Maturing November 1, 2013 | | | 617,134 | | |
| | 996,924 | | | Term Loan, 6.47%, Maturing November 1, 2013 | | | 807,509 | | |
| Freescale Semiconductor, Inc. | | | |
| | 35,403,172 | | | Term Loan, 5.47%, Maturing December 1, 2013 | | | 24,221,682 | | |
| Infor Enterprise Solutions Holdings | | | |
| | 19,522,558 | | | Term Loan, 7.52%, Maturing July 28, 2012 | | | 12,348,018 | | |
| | 7,246,846 | | | Term Loan, 7.52%, Maturing July 28, 2012 | | | 4,583,630 | | |
| EUR | 2,947,500 | | | Term Loan, 8.14%, Maturing July 28, 2012 | | | 2,338,568 | | |
| Network Solutions, LLC | | | |
| | 5,722,972 | | | Term Loan, 5.95%, Maturing March 7, 2014 | | | 3,290,709 | | |
| Open Solutions, Inc. | | | |
| | 10,236,272 | | | Term Loan, 5.96%, Maturing January 23, 2014 | | | 5,629,950 | | |
| Sensata Technologies Finance Co. | | | |
| | 10,725,635 | | | Term Loan, 5.26%, Maturing April 27, 2013 | | | 6,928,761 | | |
| Spectrum Brands, Inc. | | | |
| | 145,437 | | | Term Loan, 4.70%, Maturing March 30, 2013 | | | 99,806 | | |
| | 2,840,255 | | | Term Loan, 7.58%, Maturing March 30, 2013 | | | 1,949,125 | | |
| SS&C Technologies, Inc. | | | |
| | 3,418,928 | | | Term Loan, 5.77%, Maturing November 23, 2012 | | | 2,606,932 | | |
| Vertafore, Inc. | | | |
| | 9,905,040 | | | Term Loan, 5.31%, Maturing January 31, 2012 | | | 8,047,845 | | |
| | 1,995,000 | | | Term Loan, 7.06%, Maturing January 31, 2012 | | | 1,755,600 | | |
| | | | | | | $ | 87,193,790 | | |
| Equipment Leasing — 0.0% | | | |
| The Hertz Corp. | | | |
| | 8,000 | | | Term Loan, 4.55%, Maturing December 21, 2012 | | $ | 5,806 | | |
| | 835,057 | | | Term Loan, 4.70%, Maturing December 21, 2012 | | | 606,013 | | |
| | | | | | | $ | 611,819 | | |
| Farming / Agriculture — 0.4% | | | |
| BF Bolthouse HoldCo, LLC | | | |
| | 4,287,931 | | | Term Loan, 6.19%, Maturing December 16, 2012 | | $ | 3,591,142 | | |
| Central Garden & Pet Co. | | | |
| | 10,749,240 | | | Term Loan, 4.74%, Maturing February 28, 2014 | | | 7,228,864 | | |
| | | | | | | $ | 10,820,006 | | |
See notes to financial statements
23
Floating Rate Portfolio as of October 31, 2008
PORTFOLIO OF INVESTMENTS CONT'D
Principal
Amount* | | Borrower/Tranche Description | | Value | |
| Financial Intermediaries — 1.6% | | | |
| Asset Acceptence Capital Corp. | | | |
| | 1,478,775 | | | Term Loan, 5.30%, Maturing June 5, 2013 | | $ | 1,131,263 | | |
| Citco III, Ltd. | | | |
| | 10,355,978 | | | Term Loan, 5.13%, Maturing June 30, 2014 | | | 8,388,342 | | |
| E.A. Viner International Co. | | | |
| | 753,450 | | | Term Loan, 6.77%, Maturing July 31, 2013 | | | 708,243 | | |
| Grosvenor Capital Management | | | |
| | 4,092,491 | | | Term Loan, 5.59%, Maturing December 5, 2013 | | | 3,273,993 | | |
| INVESTools, Inc. | | | |
| | 2,304,000 | | | Term Loan, 6.25%, Maturing August 13, 2012 | | | 2,096,640 | | |
| Jupiter Asset Management Group | | | |
| GBP | 3,764,439 | | | Term Loan, 7.89%, Maturing June 30, 2015 | | | 4,574,016 | | |
| Lender Processing Services, Inc. | | | |
| | 2,011,188 | | | Term Loan, 5.62%, Maturing July 2, 2014 | | | 1,850,292 | | |
| LPL Holdings, Inc. | | | |
| | 22,306,740 | | | Term Loan, 5.51%, Maturing December 18, 2014 | | | 17,845,392 | | |
| Oxford Acquisition III, Ltd. | | | |
| | 11,105,762 | | | Term Loan, 5.58%, Maturing May 24, 2014 | | | 7,015,144 | | |
| RJO Holdings Corp. (RJ O'Brien) | | | |
| | 4,182,750 | | | Term Loan, 6.00%, Maturing July 31, 2014(3) | | | 3,011,580 | | |
| | | | | | | $ | 49,894,905 | | |
| Food Products — 3.0% | | | |
| Acosta, Inc. | | | |
| | 15,610,266 | | | Term Loan, 5.37%, Maturing July 28, 2013 | | $ | 11,512,571 | | |
| Advantage Sales & Marketing, Inc. | | | |
| | 11,325,711 | | | Term Loan, 5.20%, Maturing March 29, 2013 | | | 7,956,312 | | |
| American Seafoods Group, LLC | | | |
| | 3,950,358 | | | Term Loan, 5.51%, Maturing September 30, 2012 | | | 3,496,067 | | |
| BL Marketing, Ltd. | | | |
| GBP | 3,500,000 | | | Term Loan, 8.04%, Maturing December 31, 2013 | | | 4,140,053 | | |
| GBP | 2,500,000 | | | Term Loan - Second Lien, 10.09%,
Maturing June 30, 2015 | | | 2,595,077 | | |
| Black Lion Beverages III B.V. | | | |
| EUR | 3,000,000 | | | Term Loan - Second Lien, 9.49%,
Maturing January 24, 2016 | | | 2,326,052 | | |
| Bumble Bee Seafood, LLC | | | |
| | 3,000,000 | | | Term Loan, 5.56%, Maturing May 2, 2012 | | | 2,805,000 | | |
| Dean Foods Co. | | | |
| | 23,787,626 | | | Term Loan, 5.26%, Maturing April 2, 2014 | | | 17,922,502 | | |
| Dole Food Company, Inc. | | | |
| | 894,186 | | | Term Loan, 4.69%, Maturing April 12, 2013 | | | 655,364 | | |
| | 1,216,597 | | | Term Loan, 5.28%, Maturing April 12, 2013 | | | 891,665 | | |
| | 5,021,009 | | | Term Loan, 5.93%, Maturing April 12, 2013 | | | 3,679,983 | | |
Principal
Amount* | | Borrower/Tranche Description | | Value | |
| Food Products (continued) | | | |
| MafCo Worldwide Corp. | | | |
| | 812,696 | | | Term Loan, 5.06%, Maturing December 8, 2011 | | $ | 759,871 | | |
| Pinnacle Foods Finance, LLC | | | |
| | 4,000,000 | | | Revolving Loan, 5.27%, Maturing April 2, 2013(2) | | | 2,600,000 | | |
| | 26,731,413 | | | Term Loan, 6.76%, Maturing April 2, 2014 | | | 19,407,006 | | |
| Reddy Ice Group, Inc. | | | |
| | 12,335,000 | | | Term Loan, 6.50%, Maturing August 9, 2012 | | | 9,220,412 | | |
| Ruby Acquisitions, Ltd. | | | |
| GBP | 1,955,404 | | | Term Loan, 8.84%, Maturing January 5, 2015 | | | 2,438,870 | | |
| | | | | | | $ | 92,406,805 | | |
| Food Service — 1.9% | | | |
| AFC Enterprises, Inc. | | | |
| | 2,044,568 | | | Term Loan, 6.06%, Maturing May 23, 2009 | | $ | 1,615,208 | | |
| Aramark Corp. | | | |
| | 938,909 | | | Term Loan, 4.94%, Maturing January 26, 2014 | | | 788,449 | | |
| | 14,365,417 | | | Term Loan, 5.64%, Maturing January 26, 2014 | | | 12,063,359 | | |
| Buffets, Inc. | | | |
| | 3,811,403 | | | Term Loan, 10.42%, Maturing January 22, 2009 | | | 1,181,535 | | |
| | 442,238 | | | Term Loan, 10.42%, Maturing January 22, 2009 | | | 137,094 | | |
| | 1,372,645 | | | Term Loan, 10.97%, Maturing May 1, 2013 | | | 404,930 | | |
| | 7,868,329 | | | Term Loan, 10.42%, Maturing November 1, 2013 | | | 2,321,157 | | |
| CBRL Group, Inc. | | | |
| | 2,926,047 | | | Term Loan, 4.30%, Maturing April 27, 2013 | | | 2,248,179 | | |
| | 6,452,740 | | | Term Loan, 4.30%, Maturing April 27, 2013 | | | 4,957,853 | | |
| JRD Holdings, Inc. | | | |
| | 3,715,625 | | | Term Loan, 5.75%, Maturing June 26, 2014 | | | 2,823,875 | | |
| Maine Beverage Co., LLC | | | |
| | 2,514,286 | | | Term Loan, 5.63%, Maturing June 30, 2010 | | | 2,288,000 | | |
| OSI Restaurant Partners, LLC | | | |
| | 832,528 | | | Term Loan, 5.28%, Maturing May 9, 2013 | �� | | 437,771 | | |
| | 9,961,625 | | | Term Loan, 5.25%, Maturing May 9, 2014 | | | 5,238,151 | | |
| QCE Finance, LLC | | | |
| | 8,985,539 | | | Term Loan, 5.81%, Maturing May 5, 2013 | | | 5,930,456 | | |
| Sagittarius Restaurants, LLC | | | |
| | 4,378,629 | | | Term Loan, 9.50%, Maturing March 29, 2013 | | | 2,123,635 | | |
| Selecta | | | |
| CHF | 18,404,850 | | | Term Loan, 5.34%, Maturing June 28, 2015 | | | 10,633,137 | | |
| SSP Financing, Ltd. | | | |
| | 3,954,516 | | | Term Loan, 5.37%, Maturing June 15, 2014 | | | 2,016,803 | | |
| | 3,954,516 | | | Term Loan, 5.87%, Maturing June 15, 2015 | | | 2,016,803 | | |
| | | | | | | $ | 59,226,395 | | |
See notes to financial statements
24
Floating Rate Portfolio as of October 31, 2008
PORTFOLIO OF INVESTMENTS CONT'D
Principal
Amount* | | Borrower/Tranche Description | | Value | |
| Food / Drug Retailers — 1.6% | | | |
| General Nutrition Centers, Inc. | | | |
| | 12,588,201 | | | Term Loan, 6.14%, Maturing September 16, 2013 | | $ | 8,727,815 | | |
| Pantry, Inc. (The) | | | |
| | 7,141,634 | | | Term Loan, 4.87%, Maturing May 15, 2014 | | | 5,070,560 | | |
| | 65,717 | | | Term Loan, 4.87%, Maturing May 15, 2014 | | | 46,659 | | |
| Rite Aid Corp. | | | |
| | 24,875,000 | | | Term Loan, 5.01%, Maturing June 1, 2014 | | | 18,469,688 | | |
| | 5,050,000 | | | Term Loan, 6.00%, Maturing June 4, 2014 | | | 3,989,500 | | |
| Roundy's Supermarkets, Inc. | | | |
| | 16,125,212 | | | Term Loan, 5.38%, Maturing November 3, 2011 | | | 13,101,735 | | |
| | | | | | | $ | 49,405,957 | | |
| Forest Products — 1.4% | | | |
| Appleton Papers, Inc. | | | |
| | 10,514,400 | | | Term Loan, 5.38%, Maturing June 5, 2014 | | $ | 8,464,092 | | |
| Georgia-Pacific Corp. | | | |
| | 32,315,533 | | | Term Loan, 4.65%, Maturing December 20, 2012 | | | 26,920,648 | | |
| | 2,077,383 | | | Term Loan, 5.37%, Maturing December 20, 2012 | | | 1,730,576 | | |
| Xerium Technologies, Inc. | | | |
| | 9,099,221 | | | Term Loan, 9.26%, Maturing May 18, 2012 | | | 6,733,424 | | |
| | | | | | | $ | 43,848,740 | | |
| Healthcare — 7.9% | | | |
| Accellent, Inc. | | | |
| | 3,155,613 | | | Term Loan, 5.31%, Maturing November 22, 2012 | | $ | 2,177,373 | | |
| Advanced Medical Optics, Inc. | | | |
| | 1,955,556 | | | Term Loan, 4.76%, Maturing April 2, 2014 | | | 1,422,667 | | |
| Alliance Imaging, Inc. | | | |
| | 4,635,234 | | | Term Loan, 5.78%, Maturing December 29, 2011 | | | 4,032,654 | | |
| American Medical Systems | | | |
| | 7,055,084 | | | Term Loan, 5.44%, Maturing July 20, 2012 | | | 6,067,372 | | |
| AMN Healthcare, Inc. | | | |
| | 1,938,202 | | | Term Loan, 5.51%, Maturing November 2, 2011 | | | 1,686,236 | | |
| AMR HoldCo, Inc. | | | |
| | 5,945,458 | | | Term Loan, 4.82%, Maturing February 10, 2012 | | | 5,291,458 | | |
| Biomet, Inc. | | | |
| | 8,140,000 | | | Term Loan, 6.76%, Maturing December 26, 2014 | | | 7,104,185 | | |
| EUR | 7,939,788 | | | Term Loan, 8.14%, Maturing December 26, 2014 | | | 8,677,605 | | |
| Cardinal Health 409, Inc. | | | |
| | 14,708,800 | | | Term Loan, 6.01%, Maturing April 10, 2014 | | | 9,523,948 | | |
| Carestream Health, Inc. | | | |
| | 14,076,656 | | | Term Loan, 5.43%, Maturing April 30, 2013 | | | 9,267,127 | | |
| Carl Zeiss Vision Holding GmbH | | | |
| EUR | 6,371,053 | | | Term Loan, 7.00%, Maturing March 23, 2015 | | | 4,750,332 | | |
Principal
Amount* | | Borrower/Tranche Description | | Value | |
| Healthcare (continued) | | | |
| CB Diagnostics AB | | | |
| | 998,084 | | | Term Loan, 5.24%, Maturing January 16, 2015 | | $ | 824,667 | | |
| | 2,315,036 | | | Term Loan, 5.49%, Maturing January 16, 2016 | | | 1,912,799 | | |
| Community Health Systems, Inc. | | | |
| | 21,495,283 | | | Term Loan, 5.16%, Maturing July 25, 2014 | | | 17,279,521 | | |
| Concentra, Inc. | | | |
| | 5,925,000 | | | Term Loan, 6.02%, Maturing June 25, 2014 | | | 3,999,375 | | |
| CRC Health Corp. | | | |
| | 1,842,202 | | | Term Loan, 6.01%, Maturing February 6, 2013 | | | 1,271,119 | | |
| | 3,876,023 | | | Term Loan, 6.01%, Maturing February 6, 2013 | | | 2,674,456 | | |
| Dako Equity Project Delphi | | | |
| | 1,568,302 | | | Term Loan, 6.01%, Maturing June 12, 2016 | | | 823,358 | | |
| EUR | 3,098,534 | | | Term Loan, 7.43%, Maturing June 12, 2016 | | | 2,191,826 | | |
| DaVita, Inc. | | | |
| | 14,753,556 | | | Term Loan, 4.67%, Maturing October 5, 2012 | | | 12,856,676 | | |
| Fresenius Medical Care Holdings | | | |
| | 6,698,766 | | | Term Loan, 5.00%, Maturing March 31, 2013 | | | 5,707,349 | | |
| Gambro Holding AB | | | |
| | 1,292,918 | | | Term Loan, 5.62%, Maturing June 5, 2014 | | | 818,848 | | |
| | 1,292,918 | | | Term Loan, 6.12%, Maturing June 5, 2015 | | | 818,848 | | |
| Hanger Orthopedic Group, Inc. | | | |
| | 3,309,903 | | | Term Loan, 5.18%, Maturing May 30, 2013 | | | 2,598,274 | | |
| HCA, Inc. | | | |
| | 37,531,815 | | | Term Loan, 6.01%, Maturing November 18, 2013 | | | 31,066,960 | | |
| Health Management Association, Inc. | | | |
| | 22,826,749 | | | Term Loan, 5.51%, Maturing February 28, 2014 | | | 16,092,858 | | |
| HealthSouth Corp. | | | |
| | 6,850,671 | | | Term Loan, 5.50%, Maturing March 10, 2013 | | | 5,692,716 | | |
| Iasis Healthcare, LLC | | | |
| | 158,396 | | | Term Loan, 4.58%, Maturing March 14, 2014 | | | 128,301 | | |
| | 592,501 | | | Term Loan, 5.12%, Maturing March 14, 2014 | | | 479,925 | | |
| | 1,712,322 | | | Term Loan, 5.12%, Maturing March 14, 2014 | | | 1,386,981 | | |
| Ikaria Acquisition, Inc. | | | |
| | 1,544,830 | | | Term Loan, 5.67%, Maturing March 28, 2013 | | | 1,467,588 | | |
| IM U.S. Holdings, LLC | | | |
| | 6,586,376 | | | Term Loan, 5.16%, Maturing June 26, 2014 | | | 4,862,939 | | |
| inVentiv Health, Inc. | | | |
| | 7,983,938 | | | Term Loan, 5.52%, Maturing July 6, 2014 | | | 6,227,471 | | |
| Leiner Health Products, Inc. | | | |
| | 820,655 | | | Term Loan, 8.75%, Maturing May 27, 2011(5) | | | 779,623 | | |
| LifePoint Hospitals, Inc. | | | |
| | 11,519,064 | | | Term Loan, 4.44%, Maturing April 15, 2012 | | | 9,712,011 | | |
| MultiPlan Merger Corp. | | | |
| | 3,333,806 | | | Term Loan, 5.63%, Maturing April 12, 2013 | | | 2,625,372 | | |
| | 3,739,920 | | | Term Loan, 5.63%, Maturing April 12, 2013 | | | 2,945,187 | | |
See notes to financial statements
25
Floating Rate Portfolio as of October 31, 2008
PORTFOLIO OF INVESTMENTS CONT'D
Principal
Amount* | | Borrower/Tranche Description | | Value | |
| Healthcare (continued) | | | |
| National Mentor Holdings, Inc. | | | |
| | 484,400 | | | Term Loan, 4.94%, Maturing June 29, 2013 | | $ | 409,318 | | |
| | 7,981,874 | | | Term Loan, 5.77%, Maturing June 29, 2013 | | | 6,744,684 | | |
| Nyco Holdings | | | |
| | 2,859,137 | | | Term Loan, 6.09%, Maturing December 29, 2014 | | | 1,521,061 | | |
| EUR | 5,268,945 | | | Term Loan, 7.42%, Maturing December 29, 2014 | | | 3,672,558 | | |
| | 2,859,137 | | | Term Loan, 6.84%, Maturing December 29, 2015 | | | 1,521,061 | | |
| EUR | 5,268,945 | | | Term Loan, 8.17%, Maturing December 29, 2015 | | | 3,672,558 | | |
| Psychiatric Solutions, Inc. | | | |
| | 991,190 | | | Term Loan, 4.80%, Maturing May 31, 2014 | | | 814,015 | | |
| RadNet Management, Inc. | | | |
| | 2,446,404 | | | Term Loan, 7.06%, Maturing November 15, 2012 | | | 1,957,123 | | |
| ReAble Therapeutics Finance, LLC | | | |
| | 9,181,633 | | | Term Loan, 5.76%, Maturing November 16, 2013 | | | 6,932,133 | | |
| Select Medical Holding Corp. | | | |
| | 1,000,000 | | | Revolving Loan, 5.30%, Maturing February 24, 2010(2) | | | 815,000 | | |
| | 4,640,310 | | | Term Loan, 4.91%, Maturing February 24, 2012 | | | 3,573,039 | | |
| Sunrise Medical Holdings, Inc. | | | |
| | 4,256,450 | | | Term Loan, 7.90%, Maturing May 13, 2010 | | | 3,263,846 | | |
| Vanguard Health Holding Co., LLC | | | |
| | 10,691,766 | | | Term Loan, 5.74%, Maturing September 23, 2011 | | | 9,128,095 | | |
| Viant Holdings, Inc. | | | |
| | 1,829,176 | | | Term Loan, 6.02%, Maturing June 25, 2014 | | | 1,088,360 | | |
| | | | | | | $ | 242,358,856 | | |
| Home Furnishings — 1.6% | | | |
| Dometic Corp. | | | |
| | 2,790,150 | | | Term Loan, 6.42%, Maturing December 31, 2014 | | $ | 2,092,612 | | |
| | 1,788,692 | | | Term Loan, 6.92%, Maturing December 31, 2014 | | | 1,341,519 | | |
| | 421,159 | | | Term Loan, 6.92%, Maturing December 31, 2014 | | | 315,869 | | |
| Hunter Fan Co. | | | |
| | 3,612,211 | | | Term Loan, 5.31%, Maturing April 16, 2014 | | | 2,022,838 | | |
| Interline Brands, Inc. | | | |
| | 5,852,470 | | | Term Loan, 4.75%, Maturing June 23, 2013 | | | 4,506,402 | | |
| | 3,064,113 | | | Term Loan, 4.75%, Maturing June 23, 2013 | | | 2,359,367 | | |
| National Bedding Co., LLC | | | |
| | 10,676,721 | | | Term Loan, 5.35%, Maturing August 31, 2011 | | | 7,073,328 | | |
| | 1,500,000 | | | Term Loan - Second Lien, 8.40%,
Maturing August 31, 2012 | | | 945,000 | | |
| Oreck Corp. | | | |
| | 4,190,876 | | | Term Loan, 5.61%, Maturing February 2, 2012(3) | | | 1,638,633 | | |
| Sanitec, Ltd. Oy | | | |
| EUR | 4,394,410 | | | Term Loan, 8.38%, Maturing April 7, 2013 | | | 3,197,176 | | |
| EUR | 4,394,410 | | | Term Loan, 8.88%, Maturing April 7, 2014 | | | 3,215,849 | | |
Principal
Amount* | | Borrower/Tranche Description | | Value | |
| Home Furnishings (continued) | | | |
| Sealy Mattress Co. | | | |
| | 3,000,000 | | | Revolving Loan, 4.26%, Maturing April 6, 2012(2) | | $ | 2,670,000 | | |
| | 6,357,539 | | | Term Loan, 4.62%, Maturing August 25, 2012 | | | 4,831,729 | | |
| Simmons Co. | | | |
| | 18,290,235 | | | Term Loan, 5.44%, Maturing December 19, 2011 | | | 12,986,067 | | |
| | 2,500,000 | | | Term Loan, 8.35%, Maturing February 15, 2012 | | | 443,750 | | |
| | | | | | | $ | 49,640,139 | | |
| Industrial Equipment — 2.3% | | | |
| CEVA Group PLC U.S. | | | |
| | 333,571 | | | Term Loan, 6.75%, Maturing January 4, 2014 | | $ | 267,690 | | |
| | 39,740 | | | Term Loan, 6.76%, Maturing January 4, 2014 | | | 31,892 | | |
| EUR | 646,202 | | | Term Loan, 7.53%, Maturing January 4, 2014 | | | 660,952 | | |
| EUR | 1,097,324 | | | Term Loan, 7.53%, Maturing January 4, 2014 | | | 1,122,372 | | |
| EUR | 1,348,618 | | | Term Loan, 7.53%, Maturing January 4, 2014 | | | 1,379,402 | | |
| EUR | 1,135,787 | | | Term Loan, 8.14%, Maturing January 4, 2014 | | | 1,161,713 | | |
| EPD Holdings (Goodyear Engineering Products) | | | |
| | 350,477 | | | Term Loan, 5.50%, Maturing July 13, 2014 | | | 254,096 | | |
| | 9,377,156 | | | Term Loan, 5.50%, Maturing July 13, 2014 | | | 6,798,438 | | |
| | 2,000,000 | | | Term Loan - Second Lien, 8.75%, Maturing July 13, 2015 | | | 1,160,000 | | |
| Flowserve Corp. | | | |
| | 3,597,953 | | | Term Loan, 5.31%, Maturing August 10, 2012 | | | 3,220,168 | | |
| FR Brand Acquisition Corp. | | | |
| | 9,057,050 | | | Term Loan, 6.00%, Maturing February 7, 2014 | | | 6,883,358 | | |
| Generac Acquisition Corp. | | | |
| | 7,763,516 | | | Term Loan, 6.65%, Maturing November 7, 2013 | | | 4,903,957 | | |
| Gleason Corp. | | | |
| | 1,518,056 | | | Term Loan, 5.22%, Maturing June 30, 2013 | | | 1,297,938 | | |
| | 1,940,737 | | | Term Loan, 5.22%, Maturing June 30, 2013 | | | 1,659,330 | | |
| Heating Finance PLC (Baxi) | | | |
| EUR | 3,253,597 | | | Term Loan, 7.97%, Maturing December 27, 2010(2) | | | 2,778,404 | | |
| GBP | 2,068,692 | | | Term Loan, 8.42%, Maturing December 27, 2010 | | | 1,827,758 | | |
| Jason, Inc. | | | |
| | 1,912,045 | | | Term Loan, 5.50%, Maturing April 30, 2010 | | | 1,491,395 | | |
| John Maneely Co. | | | |
| | 13,276,263 | | | Term Loan, 7.66%, Maturing December 8, 2013 | | | 9,791,244 | | |
| KION Group GmbH | | | |
| | 2,250,000 | | | Term Loan, 5.12%, Maturing December 23, 2014 | | | 1,397,250 | | |
| | 2,250,000 | | | Term Loan, 5.62%, Maturing December 23, 2015 | | | 1,397,250 | | |
| Polypore, Inc. | | | |
| | 1,999,803 | | | Term Loan, 0.00%, Maturing July 3, 2013(2) | | | 1,459,856 | | |
| | 16,248,989 | | | Term Loan, 5.39%, Maturing July 3, 2014 | | | 12,674,211 | | |
| EUR | 1,100,565 | | | Term Loan, 6.81%, Maturing July 3, 2014 | | | 1,143,221 | | |
See notes to financial statements
26
Floating Rate Portfolio as of October 31, 2008
PORTFOLIO OF INVESTMENTS CONT'D
Principal
Amount* | | Borrower/Tranche Description | | Value | |
| Industrial Equipment (continued) | | | |
| TFS Acquisition Corp. | | | |
| | 4,400,101 | | | Term Loan, 7.26%, Maturing August 11, 2013 | | $ | 4,092,094 | | |
| | | | | | | $ | 68,853,989 | | |
| Insurance — 1.6% | | | |
| Alliant Holdings I, Inc. | | | |
| | 7,301,250 | | | Term Loan, 6.76%, Maturing August 21, 2014 | | $ | 5,037,862 | | |
| CCC Information Services Group, Inc. | | | |
| | 4,362,620 | | | Term Loan, 6.02%, Maturing February 10, 2013 | | | 3,511,909 | | |
| Conseco, Inc. | | | |
| | 23,269,691 | | | Term Loan, 5.00%, Maturing October 10, 2013 | | | 15,416,170 | | |
| Crump Group, Inc. | | | |
| | 6,248,670 | | | Term Loan, 6.71%, Maturing August 4, 2014 | | | 4,655,259 | | |
| Getty Images, Inc. | | | |
| | 9,825,000 | | | Term Loan, 8.05%, Maturing July 2, 2015 | | | 8,945,662 | | |
| Hub International Holdings, Inc. | | | |
| | 463,115 | | | Term Loan, 6.26%, Maturing June 13, 2014 | | | 319,550 | | |
| | 6,472,709 | | | Term Loan, 6.26%, Maturing June 13, 2014 | | | 4,466,170 | | |
| U.S.I. Holdings Corp. | | | |
| | 7,035,937 | | | Term Loan, 6.52%, Maturing May 4, 2014 | | | 5,118,645 | | |
| | | | | | | $ | 47,471,227 | | |
| Leisure Goods / Activities / Movies — 5.7% | | | |
| 24 Hour Fitness Worldwide, Inc. | | | |
| | 2,952,002 | | | Term Loan, 6.18%, Maturing June 8, 2012 | | $ | 2,199,241 | | |
| AMC Entertainment, Inc. | | | |
| | 15,520,225 | | | Term Loan, 5.01%, Maturing January 26, 2013 | | | 11,902,073 | | |
| AMF Bowling Worldwide, Inc. | | | |
| | 2,989,488 | | | Term Loan, 5.35%, Maturing June 8, 2013 | | | 2,316,853 | | |
| Bombardier Recreational Products | | | |
| | 13,400,000 | | | Term Loan, 6.16%, Maturing June 28, 2013 | | | 9,279,500 | | |
| Carmike Cinemas, Inc. | | | |
| | 3,251,838 | | | Term Loan, 6.31%, Maturing May 19, 2012 | | | 2,609,600 | | |
| | 5,300,251 | | | Term Loan, 6.47%, Maturing May 19, 2012 | | | 4,253,452 | | |
| Cedar Fair, L.P. | | | |
| | 4,887,501 | | | Term Loan, 5.12%, Maturing August 31, 2011 | | | 3,592,313 | | |
| | 3,958,686 | | | Term Loan, 5.12%, Maturing August 30, 2012 | | | 2,909,634 | | |
| Cinemark, Inc. | | | |
| | 25,340,700 | | | Term Loan, 4.64%, Maturing October 5, 2013 | | | 19,427,878 | | |
| Dave & Buster's, Inc. | | | |
| | 815,456 | | | Term Loan, 6.02%, Maturing March 8, 2013 | | | 668,674 | | |
| | 2,076,170 | | | Term Loan, 6.02%, Maturing March 8, 2013 | | | 1,702,460 | | |
Principal
Amount* | | Borrower/Tranche Description | | Value | |
| Leisure Goods / Activities / Movies (continued) | | | |
| Deluxe Entertainment Services | | | |
| | 5,197,190 | | | Term Loan, 5.67%, Maturing January 28, 2011 | | $ | 4,157,752 | | |
| | 271,434 | | | Term Loan, 6.01%, Maturing January 28, 2011 | | | 217,147 | | |
| | 501,257 | | | Term Loan, 6.01%, Maturing January 28, 2011 | | | 401,006 | | |
| DW Funding, LLC | | | |
| | 4,261,099 | | | Term Loan, 5.93%, Maturing April 30, 2011 | | | 3,728,461 | | |
| Easton-Bell Sports, Inc. | | | |
| | 7,399,927 | | | Term Loan, 5.29%, Maturing March 16, 2012 | | | 5,864,442 | | |
| Fender Musical Instruments Corp. | | | |
| | 4,568,800 | | | Term Loan, 5.17%, Maturing June 9, 2014 | | | 2,855,500 | | |
| | 1,310,034 | | | Term Loan, 6.02%, Maturing June 9, 2014 | | | 818,771 | | |
| Mega Blocks, Inc. | | | |
| | 1,886,143 | | | Term Loan, 8.75%, Maturing July 26, 2012 | | | 1,084,532 | | |
| Metro-Goldwyn-Mayer Holdings, Inc. | | | |
| | 44,882,903 | | | Term Loan, 7.01%, Maturing April 8, 2012 | | | 22,693,918 | | |
| National CineMedia, LLC | | | |
| | 13,250,000 | | | Term Loan, 4.57%, Maturing February 13, 2015 | | | 9,230,838 | | |
| Odeon | | | |
| EUR | 1,064,322 | | | Term Loan, 8.27%, Maturing April 2, 2015 | | | 1,017,399 | | |
| GBP | 623,547 | | | Term Loan, 8.27%, Maturing April 2, 2015 | | | 764,336 | | |
| EUR | 1,064,322 | | | Term Loan, 7.84%, Maturing April 2, 2016 | | | 1,017,399 | | |
| GBP | 623,547 | | | Term Loan, 8.65%, Maturing April 2, 2016 | | | 764,336 | | |
| Regal Cinemas Corp. | | | |
| | 23,105,314 | | | Term Loan, 5.26%, Maturing November 10, 2010 | | | 17,470,182 | | |
| Revolution Studios Distribution Co., LLC | | | |
| | 5,951,442 | | | Term Loan, 6.87%, Maturing December 21, 2014 | | | 4,939,697 | | |
| Six Flags Theme Parks, Inc. | | | |
| | 14,390,064 | | | Term Loan, 5.69%, Maturing April 30, 2015 | | | 9,425,492 | | |
| Southwest Sports Group, LLC | | | |
| | 9,500,000 | | | Term Loan, 6.31%, Maturing December 22, 2010 | | | 7,362,500 | | |
| Universal City Development Partners, Ltd. | | | |
| | 8,996,088 | | | Term Loan, 6.68%, Maturing June 9, 2011 | | | 7,736,635 | | |
| WMG Acquisition Corp. | | | |
| | 390,000 | | | Revolving Loan, 0.00%, Maturing February 28, 2010(2) | | | 328,575 | | |
| | 12,380,548 | | | Term Loan, 5.06%, Maturing February 28, 2011 | | | 10,028,244 | | |
| Zuffa, LLC | | | |
| | 2,468,750 | | | Term Loan, 5.81%, Maturing June 20, 2016 | | | 1,542,969 | | |
| | | | | | | $ | 174,311,809 | | |
| Lodging and Casinos — 2.9% | | | |
| Choctaw Resort Development Enterprise | | | |
| | 2,960,870 | | | Term Loan, 5.51%, Maturing November 4, 2011 | | $ | 2,487,130 | | |
| Dionysos Leisure Entertainment | | | |
| EUR | 1,500,000 | | | Term Loan, 7.03%, Maturing June 30, 2014 | | | 1,402,004 | | |
| EUR | 1,500,000 | | | Term Loan, 7.40%, Maturing June 30, 2015 | | | 1,402,004 | | |
See notes to financial statements
27
Floating Rate Portfolio as of October 31, 2008
PORTFOLIO OF INVESTMENTS CONT'D
Principal
Amount* | | Borrower/Tranche Description | | Value | |
| Lodging and Casinos (continued) | | | |
| Full Moon Holdco 3 Ltd. | | | |
| GBP | 1,500,000 | | | Term Loan, 8.38%, Maturing November 20, 2014 | | $ | 1,732,063 | | |
| GBP | 1,500,000 | | | Term Loan, 8.88%, Maturing November 20, 2015 | | | 1,732,063 | | |
| Gala Electric Casinos, Ltd. | | | |
| GBP | 5,000,000 | | | Term Loan, 5.98%, Maturing December 12, 2012(2) | | | 4,439,126 | | |
| GBP | 6,566,970 | | | Term Loan, 7.83%, Maturing December 12, 2013 | | | 5,793,490 | | |
| GBP | 5,690,605 | | | Term Loan, 8.33%, Maturing December 12, 2014 | | | 5,020,347 | | |
| Green Valley Ranch Gaming, LLC | | | |
| | 7,035,660 | | | Term Loan, 5.00%, Maturing February 16, 2014 | | | 3,517,830 | | |
| Harrah's Operating Co. | | | |
| | 2,985,000 | | | Term Loan, 6.45%, Maturing January 28, 2015 | | | 2,048,991 | | |
| | 2,985,000 | | | Term Loan, 6.54%, Maturing January 28, 2015 | | | 2,054,259 | | |
| Herbst Gaming, Inc. | | | |
| | 6,244,796 | | | Term Loan, 10.50%, Maturing December 2, 2011 | | | 3,465,862 | | |
| | 2,482,768 | | | Term Loan, 10.50%, Maturing December 2, 2011 | | | 1,377,936 | | |
| Isle of Capri Casinos, Inc. | | | |
| | 4,853,450 | | | Term Loan, 5.51%, Maturing November 30, 2013 | | | 3,292,255 | | |
| | 141,577 | | | Term Loan, 5.51%, Maturing November 30, 2013 | | | 96,036 | | |
| | 3,402,879 | | | Term Loan, 5.51%, Maturing November 30, 2013 | | | 2,308,285 | | |
| LodgeNet Entertainment Corp. | | | |
| | 5,753,703 | | | Term Loan, 5.77%, Maturing April 4, 2014 | | | 3,365,916 | | |
| New World Gaming Partners, Ltd. | | | |
| | 9,697,552 | | | Term Loan, 6.26%, Maturing June 30, 2014 | | | 4,848,776 | | |
| | 954,167 | | | Term Loan, 6.55%, Maturing June 30, 2014 | | | 477,083 | | |
| Penn National Gaming, Inc. | | | |
| | 13,768,775 | | | Term Loan, 5.01%, Maturing October 3, 2012 | | | 11,512,224 | | |
| Scandic Hotels | | | |
| EUR | 1,724,568 | | | Term Loan, 6.80%, Maturing April 25, 2015 | | | 1,512,989 | | |
| EUR | 1,724,568 | | | Term Loan, 7.30%, Maturing April 25, 2016 | | | 1,512,989 | | |
| Venetian Casino Resort/Las Vegas Sands Inc. | | | |
| | 23,041,667 | | | Term Loan, 5.52%, Maturing May 23, 2014 | | | 13,254,719 | | |
| | 8,984,150 | | | Term Loan, 5.52%, Maturing May 14, 2014 | | | 5,168,132 | | |
| VML US Finance, LLC | | | |
| | 3,333,333 | | | Term Loan, 6.02%, Maturing May 25, 2012 | | | 2,141,667 | | |
| | 2,000,000 | | | Term Loan, 6.02%, Maturing May 25, 2013 | | | 1,285,000 | | |
| | | | | | | $ | 87,249,176 | | |
| Nonferrous Metals / Minerals — 0.9% | | | |
| Compass Minerals Group, Inc. | | | |
| | 1,286,731 | | | Term Loan, 5.28%, Maturing December 22, 2012 | | $ | 1,169,317 | | |
| Euramax International, Inc. | | | |
| | 1,408,661 | | | Term Loan, 8.00%, Maturing June 28, 2012 | | | 727,809 | | |
| GBP | 894,902 | | | Term Loan, 10.60%, Maturing June 29, 2012 | | | 720,105 | | |
Principal
Amount* | | Borrower/Tranche Description | | Value | |
| Nonferrous Metals / Minerals (continued) | | | |
| Murray Energy Corp. | | | |
| | 7,599,536 | | | Term Loan, 6.94%, Maturing January 28, 2010 | | $ | 6,611,597 | | |
| Noranda Aluminum Acquisition | | | |
| | 1,955,586 | | | Term Loan, 4.81%, Maturing May 18, 2014 | | | 1,564,469 | | |
| Novelis, Inc. | | | |
| | 2,014,321 | | | Term Loan, 5.77%, Maturing June 28, 2014 | | | 1,438,225 | | |
| | 4,431,505 | | | Term Loan, 5.77%, Maturing June 28, 2014 | | | 3,164,095 | | |
| Oxbow Carbon and Mineral Holdings | | | |
| | 1,361,188 | | | Term Loan, 5.76%, Maturing May 8, 2014 | | | 986,861 | | |
| | 15,204,484 | | | Term Loan, 5.76%, Maturing May 8, 2014 | | | 11,023,251 | | |
| Tube City IMS Corp. | | | |
| | 1,317,770 | | | Term Loan, 5.76%, Maturing January 25, 2014 | | | 905,967 | | |
| | 162,162 | | | Term Loan, 5.76%, Maturing January 25, 2014 | | | 111,486 | | |
| | | | | | | $ | 28,423,182 | | |
| Oil and Gas — 1.5% | | | |
| Atlas Pipeline Partners, L.P. | | | |
| | 4,960,000 | | | Term Loan, 5.68%, Maturing July 20, 2014 | | $ | 4,079,600 | | |
| Citgo Petroleum Corp. | | | |
| | 4,815,195 | | | Term Loan, 3.39%, Maturing November 15, 2012 | | | 3,599,358 | | |
| Dresser, Inc. | | | |
| | 6,094,561 | | | Term Loan, 5.07%, Maturing May 4, 2014 | | | 4,435,701 | | |
| Dynegy Holdings, Inc. | | | |
| | 26,178,793 | | | Term Loan, 4.62%, Maturing April 2, 2013 | | | 19,394,113 | | |
| | 1,281,362 | | | Term Loan, 4.62%, Maturing April 2, 2013 | | | 949,275 | | |
| Enterprise GP Holdings, L.P. | | | |
| | 2,400,000 | | | Term Loan, 6.68%, Maturing October 31, 2014 | | | 2,028,000 | | |
| Hercules Offshore, Inc. | | | |
| | 3,268,551 | | | Term Loan, 5.64%, Maturing July 6, 2013 | | | 2,230,786 | | |
| Targa Resources, Inc. | | | |
| | 5,547,335 | | | Term Loan, 5.14%, Maturing October 31, 2012 | | | 4,238,164 | | |
| | 4,983,805 | | | Term Loan, 5.97%, Maturing October 31, 2012 | | | 3,807,627 | | |
| | | | | | | $ | 44,762,624 | | |
| Publishing — 8.6% | | | |
| American Media Operations, Inc. | | | |
| | 19,538,711 | | | Term Loan, 7.56%, Maturing January 31, 2013 | | $ | 13,139,783 | | |
| Aster Zweite Beteiligungs GmbH | | | |
| | 6,825,000 | | | Term Loan, 6.13%, Maturing September 27, 2013 | | | 4,282,687 | | |
| EUR | 708,499 | | | Term Loan, 7.54%, Maturing September 27, 2013 | | | 573,416 | | |
| Black Press US Partnership | | | |
| | 917,429 | | | Term Loan, 4.81%, Maturing August 2, 2013 | | | 600,916 | | |
| | 1,511,059 | | | Term Loan, 4.81%, Maturing August 2, 2013 | | | 989,744 | | |
See notes to financial statements
28
Floating Rate Portfolio as of October 31, 2008
PORTFOLIO OF INVESTMENTS CONT'D
Principal
Amount* | | Borrower/Tranche Description | | Value | |
| Publishing (continued) | | | |
| CanWest MediaWorks, Ltd. | | | |
| | 7,307,500 | | | Term Loan, 4.81%, Maturing July 10, 2014 | | $ | 5,224,862 | | |
| Dex Media West, LLC | | | |
| | 6,355,000 | | | Term Loan, 7.54%, Maturing October 24, 2014 | | | 3,539,735 | | |
| GateHouse Media Operating, Inc. | | | |
| | 13,275,000 | | | Term Loan, 4.81%, Maturing August 28, 2014 | | | 3,274,504 | | |
| | 1,825,000 | | | Term Loan, 4.98%, Maturing August 28, 2014 | | | 450,167 | | |
| | 7,750,000 | | | Term Loan, 5.07%, Maturing August 28, 2014 | | | 3,584,375 | | |
| Hanley-Wood, LLC | | | |
| | 7,443,750 | | | Term Loan, 5.28%, Maturing March 8, 2014 | | | 3,963,797 | | |
| Idearc, Inc. | | | |
| | 42,971,296 | | | Term Loan, 5.74%, Maturing November 17, 2014 | | | 18,549,291 | | |
| Josten's Corp. | | | |
| | 2,000,000 | | | Revolving Loan, 3.51%, Maturing October 4, 2009(2) | | | 1,920,000 | | |
| Local Insight Regatta Holdings, Inc. | | | |
| | 1,745,625 | | | Term Loan, 7.77%, Maturing April 23, 2015 | | | 1,443,051 | | |
| MediaNews Group, Inc. | | | |
| | 7,349,213 | | | Term Loan, 5.82%, Maturing August 25, 2010 | | | 4,042,067 | | |
| | 3,351,985 | | | Term Loan, 7.07%, Maturing August 2, 2013 | | | 1,759,792 | | |
| Mediannuaire Holding | | | |
| EUR | 7,000,000 | | | Term Loan, 6.62%, Maturing October 24, 2013 | | | 4,868,778 | | |
| EUR | 1,937,631 | | | Term Loan, 7.38%, Maturing October 10, 2014 | | | 1,101,033 | | |
| EUR | 1,937,631 | | | Term Loan, 7.88%, Maturing October 10, 2015 | | | 1,101,033 | | |
| Merrill Communications, LLC | | | |
| | 10,274,457 | | | Term Loan, 5.98%, Maturing February 9, 2009 | | | 6,678,397 | | |
| Nebraska Book Co., Inc. | | | |
| | 8,955,347 | | | Term Loan, 6.38%, Maturing March 4, 2011 | | | 6,537,403 | | |
| Nelson Education, Ltd. | | | |
| | 297,000 | | | Term Loan, 6.26%, Maturing July 5, 2014 | | | 245,025 | | |
| Newspaper Holdings, Inc. | | | |
| | 20,650,000 | | | Term Loan, 4.38%, Maturing July 24, 2014 | | | 14,455,000 | | |
| Nielsen Finance, LLC | | | |
| | 35,008,125 | | | Term Loan, 4.80%, Maturing August 9, 2013 | | | 25,520,923 | | |
| Philadelphia Newspapers, LLC | | | |
| | 5,002,642 | | | Term Loan, 7.25%, Maturing June 29, 2013 | | | 1,500,793 | | |
| R.H. Donnelley Corp. | | | |
| | 27,246,954 | | | Term Loan, 6.85%, Maturing June 30, 2010 | | | 17,307,483 | | |
| | 6,330,158 | | | Term Loan, 6.76%, Maturing June 30, 2011 | | | 4,138,341 | | |
| Reader's Digest Association, Inc. (The) | | | |
| | 8,000,000 | | | Revolving Loan, 4.50%, Maturing March 2, 2013(2) | | | 4,840,000 | | |
| | 36,412,932 | | | Term Loan, 5.23%, Maturing March 2, 2014 | | | 18,570,595 | | |
| Seat Pagine Gialle SpA | | | |
| EUR | 6,526,833 | | | Term Loan, 4.61%, Maturing May 25, 2012 | | | 5,690,043 | | |
| SGS International, Inc. | | | |
| | 980,959 | | | Term Loan, 6.27%, Maturing December 30, 2011 | | | 721,005 | | |
| | 1,108,751 | | | Term Loan, 6.27%, Maturing December 30, 2011 | | | 814,932 | | |
Principal
Amount* | | Borrower/Tranche Description | | Value | |
| Publishing (continued) | | | |
| Source Interlink Companies, Inc. | | | |
| | 4,974,811 | | | Term Loan, 6.47%, Maturing August 1, 2014 | | $ | 3,357,997 | | |
| Source Media, Inc. | | | |
| | 10,428,574 | | | Term Loan, 8.77%, Maturing November 8, 2011 | | | 7,039,287 | | |
| Springer Science+Business Media | | | |
| | 1,408,469 | | | Term Loan, 5.13%, Maturing May 5, 2010 | | | 1,197,198 | | |
| | 8,560 | | | Term Loan, 6.14%, Maturing May 5, 2011 | | | 6,013 | | |
| | 1,759,273 | | | Term Loan, 6.51%, Maturing May 5, 2012 | | | 1,235,889 | | |
| | 1,508,560 | | | Term Loan, 6.51%, Maturing May 5, 2012 | | | 1,059,763 | | |
| Star Tribune Co. (The) | | | |
| | 8,196,250 | | | Term Loan, 5.05%, Maturing March 5, 2014(5) | | | 2,602,309 | | |
| Thomas Nelson, Inc. | | | |
| | 1,595,047 | | | Term Loan, 5.75%, Maturing June 12, 2012 | | | 1,284,013 | | |
| TL Acquisitions, Inc. | | | |
| | 2,969,500 | | | Term Loan, 5.62%, Maturing July 5, 2014 | | | 2,228,776 | | |
| Trader Media Corp. | | | |
| GBP | 17,310,500 | | | Term Loan, 8.26%, Maturing March 23, 2015 | | | 14,416,853 | | |
| Tribune Co. | | | |
| | 4,790,857 | | | Term Loan, 7.08%, Maturing May 17, 2009 | | | 3,770,405 | | |
| | 14,924,623 | | | Term Loan, 6.00%, Maturing May 17, 2014 | | | 5,522,111 | | |
| | 8,553,067 | | | Term Loan, 6.00%, Maturing May 17, 2014 | | | 3,840,327 | | |
| World Directories Acquisition | | | |
| EUR | 8,776,758 | | | Term Loan, 6.72%, Maturing May 31, 2014 | | | 6,823,715 | | |
| Xsys, Inc. | | | |
| | 7,701,575 | | | Term Loan, 6.13%, Maturing September 27, 2013 | | | 4,832,738 | | |
| EUR | 2,750,000 | | | Term Loan, 7.54%, Maturing September 27, 2013 | | | 2,225,683 | | |
| EUR | 791,501 | | | Term Loan, 7.54%, Maturing September 27, 2013 | | | 640,593 | | |
| | 7,866,565 | | | Term Loan, 6.13%, Maturing September 27, 2014 | | | 4,936,269 | | |
| EUR | 2,750,000 | | | Term Loan, 7.54%, Maturing September 27, 2014 | | | 2,225,683 | | |
| EUR | 1,000,000 | | | Term Loan - Second Lien, 9.37%,
Maturing September 27, 2015 | | | 414,229 | | |
| Yell Group, PLC | | | |
| | 19,025,000 | | | Term Loan, 6.12%, Maturing February 10, 2013 | | | 13,127,250 | | |
| | | | | | | $ | 264,216,072 | | |
| Radio and Television — 5.1% | | | |
| Block Communications, Inc. | | | |
| | 6,909,637 | | | Term Loan, 5.27%, Maturing December 22, 2011 | | $ | 5,562,258 | | |
| Citadel Broadcasting Corp. | | | |
| | 32,925,000 | | | Term Loan, 5.07%, Maturing June 12, 2014 | | | 17,944,125 | | |
| CMP Susquehanna Corp. | | | |
| | 2,000,000 | | | Term Loan, 5.06%, Maturing May 5, 2011(2) | | | 1,510,000 | | |
| | 10,173,184 | | | Term Loan, 5.17%, Maturing May 5, 2013 | | | 4,577,933 | | |
| Cumulus Media, Inc. | | | |
| | 14,268,940 | | | Term Loan, 4.76%, Maturing June 11, 2014 | | | 8,311,658 | | |
See notes to financial statements
29
Floating Rate Portfolio as of October 31, 2008
PORTFOLIO OF INVESTMENTS CONT'D
Principal
Amount* | | Borrower/Tranche Description | | Value | |
| Radio and Television (continued) | | | |
| Discovery Communications, Inc. | | | |
| | 6,462,938 | | | Term Loan, 5.76%, Maturing April 30, 2014 | | $ | 5,357,776 | | |
| Emmis Operating Co. | | | |
| | 6,027,289 | | | Term Loan, 5.54%, Maturing November 2, 2013 | | | 3,465,691 | | |
| Entravision Communications Corp. | | | |
| | 897,560 | | | Term Loan, 6.38%, Maturing September 29, 2013 | | | 616,325 | | |
| Gray Television, Inc. | | | |
| | 8,700,058 | | | Term Loan, 5.04%, Maturing January 19, 2015 | | | 4,959,033 | | |
| HIT Entertainment, Inc. | | | |
| | 1,445,882 | | | Term Loan, 4.80%, Maturing March 20, 2012 | | | 903,676 | | |
| Local TV Finance, LLC | | | |
| | 1,975,000 | | | Term Loan, 4.87%, Maturing May 7, 2013 | | | 1,194,875 | | |
| NEP II, Inc. | | | |
| | 5,313,997 | | | Term Loan, 6.01%, Maturing February 16, 2014 | | | 3,905,788 | | |
| Nexstar Broadcasting, Inc. | | | |
| | 10,874,645 | | | Term Loan, 5.51%, Maturing October 1, 2012 | | | 7,557,878 | | |
| | 8,310,941 | | | Term Loan, 5.51%, Maturing October 1, 2012 | | | 5,776,104 | | |
| NextMedia Operating, Inc. | | | |
| | 690,164 | | | Term Loan, 7.26%, Maturing November 15, 2012 | | | 472,762 | | |
| | 307,803 | | | Term Loan, 8.28%, Maturing November 15, 2012 | | | 210,845 | | |
| PanAmSat Corp. | | | |
| | 6,420,136 | | | Term Loan, 6.65%, Maturing January 3, 2014 | | | 5,328,713 | | |
| | 6,418,195 | | | Term Loan, 6.65%, Maturing January 3, 2014 | | | 5,327,102 | | |
| | 6,418,195 | | | Term Loan, 6.65%, Maturing January 3, 2014 | | | 5,327,102 | | |
| Paxson Communications Corp. | | | |
| | 14,925,000 | | | Term Loan, 8.00%, Maturing January 15, 2012 | | | 8,283,375 | | |
| Raycom TV Broadcasting, LLC | | | |
| | 8,333,373 | | | Term Loan, 3.69%, Maturing June 25, 2014 | | | 6,875,032 | | |
| Spanish Broadcasting System, Inc. | | | |
| | 11,785,273 | | | Term Loan, 5.52%, Maturing June 10, 2012 | | | 5,465,420 | | |
| Tyrol Acquisition 2 SAS | | | |
| EUR | 6,300,000 | | | Term Loan, 6.50%, Maturing January 19, 2015 | | | 4,898,096 | | |
| EUR | 6,300,000 | | | Term Loan, 7.40%, Maturing January 19, 2016 | | | 4,898,096 | | |
| Univision Communications, Inc. | | | |
| | 6,219,313 | | | Term Loan - Second Lien, 5.50%,
Maturing March 29, 2009 | | | 5,457,447 | | |
| | 45,733,221 | | | Term Loan, 5.25%, Maturing September 29, 2014 | | | 24,856,006 | | |
| Young Broadcasting, Inc. | | | |
| | 8,305,988 | | | Term Loan, 6.30%, Maturing November 3, 2012 | | | 5,492,334 | | |
| | 975,000 | | | Term Loan, 6.56%, Maturing November 3, 2012 | | | 644,719 | | |
| | | | | | | $ | 155,180,169 | | |
| Rail Industries — 0.4% | | | |
| Kansas City Southern Railway Co. | | | |
| | 7,916,324 | | | Term Loan, 5.21%, Maturing April 26, 2013 | | $ | 6,847,620 | | |
| | 1,975,000 | | | Term Loan, 5.06%, Maturing April 28, 2013 | | | 1,678,750 | | |
Principal
Amount* | | Borrower/Tranche Description | | Value | |
| Rail Industries (continued) | | | |
| Rail America, Inc. | | | |
| | 243,200 | | | Term Loan, 7.88%, Maturing August 14, 2009 | | $ | 217,664 | | |
| | 3,756,800 | | | Term Loan, 7.88%, Maturing August 13, 2010 | | | 3,362,336 | | |
| | | | | | | $ | 12,106,370 | | |
| Retailers (Except Food and Drug) — 2.1% | | | |
| American Achievement Corp. | | | |
| | 4,418,922 | | | Term Loan, 5.07%, Maturing March 25, 2011 | | $ | 3,977,029 | | |
| Amscan Holdings, Inc. | | | |
| | 4,407,875 | | | Term Loan, 5.41%, Maturing May 25, 2013 | | | 3,305,906 | | |
| Claire's Stores, Inc. | | | |
| | 5,996,762 | | | Term Loan, 5.85%, Maturing May 24, 2014 | | | 2,975,893 | | |
| Cumberland Farms, Inc. | | | |
| | 2,872,976 | | | Term Loan, 5.26%, Maturing September 29, 2013 | | | 2,370,205 | | |
| Harbor Freight Tools USA, Inc. | | | |
| | 7,972,206 | | | Term Loan, 5.43%, Maturing July 15, 2010 | | | 5,739,989 | | |
| Josten's Corp. | | | |
| | 5,046,422 | | | Term Loan, 5.17%, Maturing October 4, 2011 | | | 4,207,454 | | |
| Mapco Express, Inc. | | | |
| | 3,209,939 | | | Term Loan, 5.93%, Maturing April 28, 2011 | | | 2,006,212 | | |
| Neiman Marcus Group, Inc. | | | |
| | 1,742,467 | | | Term Loan, 4.57%, Maturing April 5, 2013 | | | 1,324,820 | | |
| Orbitz Worldwide, Inc. | | | |
| | 9,657,475 | | | Term Loan, 6.39%, Maturing July 25, 2014 | | | 6,204,928 | | |
| Oriental Trading Co., Inc. | | | |
| | 2,000,000 | | | Term Loan - Second Lien, 9.12%,
Maturing January 31, 2013 | | | 833,334 | | |
| | 13,291,547 | | | Term Loan, 5.25%, Maturing July 31, 2013 | | | 8,157,687 | | |
| Rent-A-Center, Inc. | | | |
| | 5,877,295 | | | Term Loan, 4.95%, Maturing November 15, 2012 | | | 4,760,609 | | |
| Rover Acquisition Corp. | | | |
| | 1,960,050 | | | Term Loan, 5.74%, Maturing October 26, 2013 | | | 1,475,918 | | |
| Savers, Inc. | | | |
| | 2,775,838 | | | Term Loan, 5.75%, Maturing August 11, 2012 | | | 2,192,912 | | |
| | 3,036,743 | | | Term Loan, 5.75%, Maturing August 11, 2012 | | | 2,399,027 | | |
| The Yankee Candle Company, Inc. | | | |
| | 6,171,985 | | | Term Loan, 5.76%, Maturing February 6, 2014 | | | 4,166,090 | | |
| Vivarte | | | |
| EUR | 5,688,988 | | | Term Loan, 7.20%, Maturing May 29, 2015 | | | 3,159,319 | | |
| EUR | 247,396 | | | Term Loan, 7.20%, Maturing May 29, 2015 | | | 137,389 | | |
| EUR | 63,616 | | | Term Loan, 7.20%, Maturing May 29, 2015 | | | 35,329 | | |
| EUR | 5,688,988 | | | Term Loan, 7.70%, Maturing May 29, 2016 | | | 3,159,319 | | |
| EUR | 247,396 | | | Term Loan, 7.70%, Maturing May 29, 2016 | | | 137,389 | | |
| EUR | 63,616 | | | Term Loan, 7.70%, Maturing May 29, 2016 | | | 35,328 | | |
| | | | | | | $ | 62,762,086 | | |
See notes to financial statements
30
Floating Rate Portfolio as of October 31, 2008
PORTFOLIO OF INVESTMENTS CONT'D
Principal
Amount* | | Borrower/Tranche Description | | Value | |
| Steel — 0.1% | | | |
| Algoma Acquisition Corp. | | | |
| | 2,313,070 | | | Term Loan, 6.00%, Maturing June 20, 2013 | | $ | 1,873,586 | | |
| | | | | | | $ | 1,873,586 | | |
| Surface Transport — 0.4% | | | |
| Delphi Acquisition Holding, Inc. | | | |
| | 282,788 | | | Term Loan, 5.05%, Maturing April 10, 2015 | | $ | 173,915 | | |
| | 1,183,488 | | | Term Loan, 6.01%, Maturing April 10, 2015 | | | 727,845 | | |
| | 1,466,276 | | | Term Loan, 6.64%, Maturing April 10, 2016 | | | 901,760 | | |
| Ozburn-Hessey Holding Co., LLC | | | |
| | 3,877,326 | | | Term Loan, 6.61%, Maturing August 9, 2012 | | | 3,470,207 | | |
| Swift Transportation Co., Inc. | | | |
| | 6,000,000 | | | Term Loan, 4.09%, Maturing May 10, 2012 | | | 3,829,998 | | |
| | 8,084,884 | | | Term Loan, 6.06%, Maturing May 10, 2014 | | | 4,689,233 | | |
| | | | | | | $ | 13,792,958 | | |
| Telecommunications — 3.6% | | | |
| Alaska Communications Systems Holdings, Inc. | | | |
| | 2,612,663 | | | Term Loan, 5.51%, Maturing February 1, 2012 | | $ | 2,138,029 | | |
| | 8,111,697 | | | Term Loan, 5.51%, Maturing February 1, 2012 | | | 6,638,070 | | |
| Alltell Communication | | | |
| | 6,964,824 | | | Term Loan, 5.32%, Maturing May 16, 2014 | | | 6,647,925 | | |
| | 7,766,500 | | | Term Loan, 5.50%, Maturing May 16, 2015 | | | 7,434,001 | | |
| Asurion Corp. | | | |
| | 16,000,000 | | | Term Loan, 6.06%, Maturing July 13, 2012 | | | 11,973,328 | | |
| | 2,000,000 | | | Term Loan - Second Lien, 10.84%,
Maturing January 13, 2013 | | | 1,346,666 | | |
| BCM Luxembourg, Ltd. | | | |
| EUR | 2,500,000 | | | Term Loan, 6.38%, Maturing September 30, 2014 | | | 2,032,200 | | |
| EUR | 2,500,000 | | | Term Loan, 6.63%, Maturing September 30, 2015 | | | 2,032,200 | | |
| Cellular South, Inc. | | | |
| | 2,981,250 | | | Term Loan, 4.75%, Maturing May 29, 2014 | | | 2,519,156 | | |
| | 6,852,003 | | | Term Loan, 5.08%, Maturing May 29, 2014 | | | 5,789,943 | | |
| Centennial Cellular Operating Co., LLC | | | |
| | 4,500,000 | | | Revolving Loan, 0.00%, Maturing February 9, 2010(2) | | | 3,982,500 | | |
| | 9,147,788 | | | Term Loan, 5.64%, Maturing February 9, 2011 | | | 7,867,097 | | |
| CommScope, Inc. | | | |
| | 12,293,609 | | | Term Loan, 6.10%, Maturing November 19, 2014 | | | 9,466,079 | | |
| FairPoint Communications, Inc. | | | |
| | 4,100,000 | | | Term Loan, 5.75%, Maturing March 31, 2015 | | | 2,895,625 | | |
| Intelsat Subsidiary Holding Co. | | | |
| | 7,656,094 | | | Term Loan, 6.65%, Maturing July 3, 2013 | | | 6,344,988 | | |
Principal
Amount* | | Borrower/Tranche Description | | Value | |
| Telecommunications (continued) | | | |
| IPC Systems, Inc. | | | |
| | 9,134,375 | | | Term Loan, 6.01%, Maturing May 31, 2014 | | $ | 4,727,039 | | |
| GBP | 3,413,946 | | | Term Loan, 8.56%, Maturing May 31, 2014 | | | 2,747,117 | | |
| Macquarie UK Broadcast Ventures, Ltd. | | | |
| GBP | 6,867,100 | | | Term Loan, 7.67%, Maturing December 26, 2014 | | | 8,661,665 | | |
| NTelos, Inc. | | | |
| | 5,835,022 | | | Term Loan, 5.37%, Maturing August 24, 2011 | | | 5,022,980 | | |
| Palm, Inc. | | | |
| | 5,791,500 | | | Term Loan, 7.27%, Maturing April 24, 2014 | | | 3,243,240 | | |
| Telesat Canada, Inc. | | | |
| | 4,640,019 | | | Term Loan, 6.34%, Maturing October 22, 2014 | | | 3,553,480 | | |
| | 398,514 | | | Term Loan, 6.59%, Maturing October 22, 2014 | | | 305,195 | | |
| Windstream Corp. | | | |
| | 4,333,187 | | | Term Loan, 6.05%, Maturing July 17, 2013 | | | 3,787,747 | | |
| | | | | | | $ | 111,156,270 | | |
| Utilities — 1.7% | | | |
| AEI Finance Holding, LLC | | | |
| | 1,604,820 | | | Revolving Loan, 6.76%, Maturing March 30, 2012 | | $ | 1,067,205 | | |
| | 10,429,675 | | | Term Loan, 6.76%, Maturing March 30, 2014 | | | 6,935,734 | | |
| BRSP, LLC | | | |
| | 13,750,825 | | | Term Loan, 5.86%, Maturing July 13, 2009 | | | 9,823,590 | | |
| Covanta Energy Corp. | | | |
| | 2,909,601 | | | Term Loan, 3.95%, Maturing February 9, 2014 | | | 2,424,667 | | |
| | 4,831,525 | | | Term Loan, 4.63%, Maturing February 9, 2014 | | | 4,026,269 | | |
| NRG Energy, Inc. | | | |
| | 8,553,146 | | | Term Loan, 5.26%, Maturing June 1, 2014 | | | 7,448,362 | | |
| | 17,415,269 | | | Term Loan, 5.26%, Maturing June 1, 2014 | | | 15,165,791 | | |
| NSG Holdings, LLC | | | |
| | 202,483 | | | Term Loan, 4.32%, Maturing June 15, 2014 | | | 157,937 | | |
| | 1,474,705 | | | Term Loan, 4.32%, Maturing June 15, 2014 | | | 1,150,270 | | |
| TXU Texas Competitive Electric Holdings Co., LLC | | | |
| | 4,261,750 | | | Term Loan, 6.44%, Maturing October 10, 2014 | | | 3,327,361 | | |
| | 1,286,788 | | | Term Loan, 6.66%, Maturing October 10, 2014 | | | 1,009,413 | | |
| | | | | | | $ | 52,536,599 | | |
Total Senior Floating-Rate Interests
(identified cost $4,393,174,631) | | $ | 3,064,536,920 | | |
See notes to financial statements
31
Floating Rate Portfolio as of October 31, 2008
PORTFOLIO OF INVESTMENTS CONT'D
| Corporate Bonds & Notes — 0.3% | | | |
Principal
Amount
(000's omitted) | | Security | | Value | |
| Commercial Services — 0.0% | | | |
| Environmental Systems Products, Inc., Junior Notes (PIK) | | | |
| $ | 1,346 | | | 18.00%, 3/31/15(3) | | $ | 107,680 | | |
| | | | | | | $ | 107,680 | | |
| Electronics / Electrical — 0.1% | | | |
| NXP BV/NXP Funding, LLC, Variable Rate | | | |
| $ | 6,300 | | | 7.503%, 10/15/13 | | $ | 2,795,625 | | |
| | | | | | | $ | 2,795,625 | | |
| Radio and Television — 0.1% | | | |
| Paxson Communications Corp., Variable Rate | | | |
| $ | 3,000 | | | 8.003%, 1/15/12(6) | | $ | 1,665,000 | | |
| | | | | | | $ | 1,665,000 | | |
| Telecommunications — 0.1% | | | |
| Qwest Corp., Sr. Notes, Variable Rate | | | |
| $ | 5,850 | | | 6.069%, 6/15/13 | | $ | 4,270,500 | | |
| | | | | | | $ | 4,270,500 | | |
Total Corporate Bonds & Notes
(identified cost $15,169,200) | | $ | 8,838,505 | | |
| Common Stocks — 0.0% | | | |
| Shares | | Security | | Value | |
| Automotive — 0.0% | | | |
| | 105,145 | | | Hayes Lemmerz International(8) | | $ | 139,843 | | |
| | | | | | | $ | 139,843 | | |
| Commercial Services — 0.0% | | | |
| | 2,484 | | | Environmental Systems Products Holdings, Inc.(3)(8)(9) | | $ | 0 | | |
| | | | | | | $ | 0 | | |
Total Common Stocks
(identified cost $1,051,450) | | $ | 139,843 | | |
| Asset Backed Securities — 0.3% | | | |
Principal
Amount
(000's omitted) | | Security | | Value | |
| Alzette European CLO SA, Series 2004-1A, Class E2, | | | |
| $ | 955 | | | 11.86%, 12/15/20(6)(7) | | $ | 675,576 | | |
| Assemblies of God Financial Real Estate, Series 2004-1A, Class A, | | | |
| | 4,234 | | | 4.954%, 6/15/29(6)(7) | | | 3,673,526 | | |
| Avalon Capital Ltd. 3, Series 1A, Class D, | | | |
| | 1,140 | | | 4.761%, 2/24/19(6)(7) | | | 446,082 | | |
| Babson Ltd., Series 2005-1A, Class C1, | | | |
| | 1,500 | | | 6.703%, 4/15/19(6)(7) | | | 516,300 | | |
| Bryant Park CDO Ltd., Series 2005-1A, Class C, | | | |
| | 1,500 | | | 6.803%, 1/15/19(6)(7) | | | 540,300 | | |
| Carlyle High Yield Partners, Series 2004-6A, Class C, | | | |
| | 1,500 | | | 5.253%, 8/11/16(6)(7) | | | 614,400 | | |
| Centurion CDO 8 Ltd., Series 2005-8A, Class D, | | | |
| | 1,000 | | | 8.315%, 3/8/17(7) | | | 438,500 | | |
Morgan Stanley Investment Management Croton, Ltd.,
Series 2005-1A, Class D, | | | |
| | 2,000 | | | 6.769%, 1/15/18(6)(7) | | | 693,800 | | |
Total Asset Backed Securities
(identified cost $13,771,129) | | $ | 7,598,484 | | |
| Preferred Stocks — 0.0% | | | |
| Shares | | Security | | Value | |
| Automotive — 0.0% | | | |
| | 350 | | | Hayes Lemmerz International(8)(9) | | $ | 2,593 | | |
| | | | | | | $ | 2,593 | | |
| Commercial Services — 0.0% | | | |
| | 1,138 | | | Environmental Systems Products Holdings,
Series A(3)(8)(9) | | $ | 26,140 | | |
| | | | | | | $ | 26,140 | | |
Total Preferred Stocks
(identified cost $37,415) | | $ | 28,733 | | |
| Closed-End Investment Companies — 0.0% | | | |
| Shares | | Security | | Value | |
| | 4,000 | | | Pioneer Floating Rate Trust | | $ | 37,440 | | |
Total Closed-End Investment Companies
(identified cost $72,148) | | $ | 37,440 | | |
See notes to financial statements
32
Floating Rate Portfolio as of October 31, 2008
PORTFOLIO OF INVESTMENTS CONT'D
| Short-Term Investments — 2.9% | |
| Description | | Interest
(000's omitted) | | Value | |
| Cash Management Portfolio, 1.90%(10) | | $ | 89,685 | | | $ | 89,684,741 | | |
Total Short-Term Investments
(identified cost $89,684,741) | | $ | 89,684,741 | | |
Total Investments — 103.8%
(identified cost $4,512,961,904) | | $ | 3,170,864,966 | | |
Less Unfunded Loan
Commitments — (2.1)% | | $ | (64,511,676 | ) | |
Net Investments — 101.6%
(identified cost $4,448,449,038) | | $ | 3,106,353,290 | | |
| Other Assets, Less Liabilities — (1.6)% | | $ | (50,142,942 | ) | |
| Net Assets — 100.0% | | $ | 3,056,210,348 | | |
DIP - Debtor in Possession
CHF - Swiss Franc
EUR - Euro
GBP - British Pound Sterling
* In U.S. dollars unless otherwise indicated.
(1) Senior floating-rate interests (Senior Loans) often require prepayments from excess cash flows or permit the borrowers to repay at their election. The degree to which borrowers repay, whether as a contractual requirement or at their election, cannot be predicted with accuracy. As a result, the actual remaining maturity may be substantially less than the stated maturities shown. However, Senior Loans will have an expected average life of approximately two to four years. The stated interest rate represents the weighted average interest rate of all contracts within the senior loan facility. Senior Loans typically have rates of interest which are redetermined either daily, monthly, quarterly or semi-annually by reference to a base lending rate, plus a premium. These base lending rates are primarily the London-Interbank Offered Rate ("LI BOR"), and secondarily the prime rate offered by one or more major United States banks (the "Prime Rate") and the certificate of deposit ("CD") rate or other base lending rates used by commercial lenders.
(2) Unfunded or partially unfunded loan commitments. See Note 1G for description.
(3) Security valued at fair value using methods determined in good faith by or at the direction of the Trustees.
(4) This Senior Loan will settle after October 31, 2008, at which time the interest rate will be determined.
(5) Defaulted security. Currently the issuer is in default with respect to interest payments.
(6) Security exempt from registration under Rule 144A of the Securities Act of 1933. These securities may be sold in transactions exempt from registration, normally to qualified institutional buyers. At October 31, 2008, the aggregate value of the securities is $8,824,984 or 0.3% of the Portfolio's net assets.
(7) Variable rate security. The stated interest rate represents the rate in effect at October 31, 2008.
(8) Non-income producing security.
(9) Restricted security.
(10) Affiliated investment company available to Eaton Vance portfolios and funds which invests in high quality, U.S. dollar denominated money market instruments. The rate shown is the annualized seven-day yield as of October 31, 2008.
See notes to financial statements
33
Floating Rate Portfolio as of October 31, 2008
FINANCIAL STATEMENTS
Statement of Assets and Liabilities
As of October 31, 2008
| Assets | |
| Unaffiliated investments, at value (identified cost, $4,358,764,297) | | $ | 3,016,668,549 | | |
| Affiliated investment, at value (identified cost, $89,684,741) | | | 89,684,741 | | |
| Cash | | | 6,680,852 | | |
| Foreign currency, at value (identified cost, $427,630) | | | 422,266 | | |
| Receivable for investments sold | | | 12,925,104 | | |
| Dividends and interest receivable | | | 26,264,772 | | |
| Interest receivable from affiliated investment | | | 59,234 | | |
| Receivable for open forward foreign currency contracts | | | 5,655,728 | | |
| Receivable for closed swap contracts | | | 29,078 | | |
| Other assets | | | 460,063 | | |
| Total assets | | $ | 3,158,850,387 | | |
| Liabilities | |
| Demand note payable | | $ | 95,000,000 | | |
| Payable for investments purchased | | | 5,635,000 | | |
| Payable to affiliate for investment adviser fee | | | 1,486,533 | | |
| Payable to affiliate for Trustees' fees | | | 4,208 | | |
| Accrued expenses | | | 514,298 | | |
| Total liabilities | | $ | 102,640,039 | | |
| Net Assets applicable to investors' interest in Portfolio | | $ | 3,056,210,348 | | |
| Sources of Net Assets | |
| Net proceeds from capital contributions and withdrawals | | $ | 4,390,444,310 | | |
| Net unrealized depreciation (computed on the basis of identified cost) | | | (1,334,233,962 | ) | |
| Total | | $ | 3,056,210,348 | | |
Statement of Operations
For the Year Ended
October 31, 2008
| Investment Income | |
| Interest | | $ | 330,634,108 | | |
| Dividends | | | 8,326 | | |
| Interest income allocated from affiliated investment | | | 1,994,996 | | |
| Expenses allocated from affiliated investment | | | (290,973 | ) | |
| Total investment income | | $ | 332,346,457 | | |
| Expenses | |
| Investment adviser fee | | $ | 23,832,329 | | |
| Trustees' fees and expenses | | | 42,363 | | |
| Legal and accounting services | | | 855,248 | | |
| Custodian fee | | | 601,363 | | |
| Interest expense | | | 6,467,294 | | |
| Miscellaneous | | | 267,400 | | |
| Total expenses | | $ | 32,065,997 | | |
Deduct —
Reduction of custodian fee | | $ | 41,071 | | |
| Total expense reductions | | $ | 41,071 | | |
| Net expenses | | $ | 32,024,926 | | |
| Net investment income | | $ | 300,321,531 | | |
| Realized and Unrealized Gain (Loss) | |
Net realized gain (loss) —
Investment transactions (identified cost basis) | | $ | (117,374,984 | ) | |
| Swap contracts | | | 557,608 | | |
Foreign currency and forward foreign currency exchange
contract transactions | | | 56,156,256 | | |
| Net realized loss | | $ | (60,661,120 | ) | |
| Change in unrealized appreciation (depreciation) — | |
| Investments (identified cost basis) | | $ | (1,244,749,851 | ) | |
| Swap contracts | | | (1,169,695 | ) | |
| Foreign currency and forward foreign currency exchange contracts | | | 12,061,061 | | |
| Net change in unrealized appreciation (depreciation) | | $ | (1,233,858,485 | ) | |
| Net realized and unrealized loss | | $ | (1,294,519,605 | ) | |
| Net decrease in net assets from operations | | $ | (994,198,074 | ) | |
See notes to financial statements
34
Floating Rate Portfolio as of October 31, 2008
FINANCIAL STATEMENTS CONT'D
Statements of Changes in Net Assets
Increase (Decrease)
in Net Assets | | Year Ended
October 31, 2008 | | Year Ended
October 31, 2007 | |
From operations —
Net investment income | | $ | 300,321,531 | | | $ | 532,790,844 | | |
Net realized loss from investment
transactions, swap contracts,
and foreign currency and forward
foreign currency exchange
contract transactions | | | (60,661,120 | ) | | | (77,108,718 | ) | |
Net change in unrealized appreciation
(depreciation) of investments,
swap contracts, and foreign
currency and forward foreign
currency exchange contracts | | | (1,233,858,485 | ) | | | (134,160,493 | ) | |
Net increase (decrease) in net assets
from operations | | $ | (994,198,074 | ) | | $ | 321,521,633 | | |
Capital transactions —
Contributions | | $ | 1,218,146,557 | | | $ | 3,205,618,648 | | |
| Withdrawals | | | (4,019,337,678 | ) | | | (4,106,033,877 | ) | |
Net decrease in net assets from
capital transactions | | $ | (2,801,191,121 | ) | | $ | (900,415,229 | ) | |
| Net decrease in net assets | | $ | (3,795,389,195 | ) | | $ | (578,893,596 | ) | |
| Net Assets | |
| At beginning of year | | $ | 6,851,599,543 | | | $ | 7,430,493,139 | | |
| At end of year | | $ | 3,056,210,348 | | | $ | 6,851,599,543 | | |
See notes to financial statements
35
Floating Rate Portfolio as of October 31, 2008
FINANCIAL STATEMENTS CONT'D
Supplementary Data
| | | Year Ended October 31, | |
| | | 2008 | | 2007 | | 2006 | | 2005 | | 2004 | |
| Ratios/Supplemental Data | |
| Ratios (As a percentage of average daily net assets): | |
| Expenses before custodian fee reduction(1) | | | 0.70 | % | | | 0.58 | % | | | 0.54 | % | | | 0.54 | % | | | 0.56 | % | |
| Net investment income | | | 6.50 | % | | | 6.94 | % | | | 6.44 | % | | | 4.68 | % | | | 3.27 | % | |
| Portfolio Turnover | | | 7 | % | | | 61 | % | | | 50 | % | | | 57 | % | | | 67 | % | |
| Total Return | | | (22.24 | )% | | | 4.62 | % | | | 6.36 | % | | | 4.77 | % | | | 3.93 | % | |
| Net assets, end of year (000's omitted) | | $ | 3,056,210 | | | $ | 6,851,600 | | | $ | 7,430,493 | | | $ | 6,506,058 | | | $ | 5,389,638 | | |
(1) Excludes the effect of custody fee credits, if any, of less than 0.005%.
See notes to financial statements
36
Floating Rate Portfolio as of October 31, 2008
NOTES TO FINANCIAL STATEMENTS
1 Significant Accounting Policies
Floating Rate Portfolio (the Portfolio) is a New York trust registered under the Investment Company Act of 1940, as amended (the 1940 Act), as a diversified, open-end management investment company. The Portfolio's investment objective is to provide a high level of current income. The Declaration of Trust permits the Trustees to issue interests in the Portfolio. At October 31, 2008, Eaton Vance Floating-Rate Fund, Eaton Vance Floating-Rate & High Income Fund, Eaton Vance Strategic Income Fund, Eaton Vance Diversified Income Fund, and Eaton Vance Low Duration Fund held an interest of 65.0%, 16.2%, 13.0%, 3.0%, and 0.3%, respectively, in the Portfolio.
The following is a summary of significant accounting policies of the Portfolio. The policies are in conformity with accounting principles generally accepted in the United States of America.
A Investment Valuation — Interests in senior floating-rate loans (Senior Loans) for which reliable market quotations are readily available are valued generally at the average mean of bid and ask quotations obtained from an independent pricing service. Other Senior Loans are valued at fair value by the investment adviser under procedures approved by the Trustees. In fair valuing a Senior Loan, the investment adviser utilizes one or more of the following valuation techniques: (i) a matrix pricing approach that considers the yield on the Senior Loan relative to yields on other loan interests issued by companies of comparable credit quality; (ii) a comparison of the value of the borrower's outstanding equity and deb t to that of comparable public companies; (iii) a discounted cash flow analysis; or (iv) when the investment adviser believes it is likely that a borrower will be liquidated or sold, an analysis of the terms of such liquidation or sale. In certain cases, the investment adviser will use a combination of analytical methods to determine fair value, such as when only a portion of a borrower's assets are likely to be sold. In conducting its assessment and analyses for purposes of determining fair value of a Senior Loan, the investment adviser will use its discretion and judgment in considering and appraising relevant factors. Fair value determinations are made by the portfolio managers of the Portfolio based on information available to such managers. The portfolio managers of other funds managed by the investment adviser that invest in Senior Loans may not possess the same information about a Senior Loan borrower as the portfolio managers of the Portfolio. At times, the fair value of a Senior Loan determined by t he portfolio managers of other funds managed by the investment adviser that invest in Senior Loans may vary from the fair value of the same Senior Loan determined by the portfolio managers of the Portfolio. The fair value of each Senior Loan is periodically reviewed and approved by the investment adviser's Valuation Committee and by the Trustees based upon procedures approved by the Trustees. Junior Loans are valued in the same manner as Senior Loans.
Equity securities listed on a U.S. securities exchange generally are valued at the last sale price on the day of valuation or, if no sales took place on such date, at the mean between the closing bid and asked prices therefore on the exchange where such securities are principally traded. Equity securities listed on the NASDAQ Global or Global Select Market generally are valued at the NASDAQ official closing price. Unlisted or listed securities for which closing sales prices or closing quotations are not available are valued at the mean between the latest available bid and asked prices or, in the case of preferred equity securities that are not listed or traded in the over-the-counter market, by an independent pricing service. Debt obligations, including listed securities and securities for which price quotations are available, will normally be valued on the basis of market quotations provided by independent pricing services. The pricing services consider various factors relating to bonds and/or market transactions to determine market value. Short-term debt securities with a remaining maturity of sixty days or less are valued at amortized cost, which approximates market value. If short-term debt securities are acquired with a remaining maturity of more than sixty days, they will be valued by a pricing service. Credit default swaps are generally valued by a broker-dealer (usually the counterparty for the agreement). Forward foreign currency exchange contracts are generally valued using prices supplied by a pricing vendor. Foreign securities and currencies are valued in U.S. dollars, based on foreign currency exchange rate quotations supplied by an independent quotation service. The independent service uses a proprietary model to determine the exchange rate. Inputs to the model include reported trades and implied bid/ask spreads. Investments for which valuations or market quotations are not readily available are valued at fair value u sing methods determined in good faith by or at the direction of the Trustees of the Portfolio considering relevant factors, data and information including the market value of freely tradable securities of the same class in the principal market on which such securities are normally traded.
The Portfolio may invest in Cash Management Portfolio (Cash Management), an affiliated investment company managed by Boston Management and Research (BMR),
37
Floating Rate Portfolio as of October 31, 2008
NOTES TO FINANCIAL STATEMENTS CONT'D
a subsidiary of Eaton Vance Management (EVM). Cash Management values its investment securities utilizing the amortized cost valuation technique permitted by Rule 2a-7 of the 1940 Act, pursuant to which Cash Management must comply with certain conditions. This technique involves initially valuing a portfolio security at its cost and thereafter assuming a constant amortization to maturity of any discount or premium. If amortized cost is determined not to approximate fair value, Cash Management may value its investment securities based on available market quotations provided by a pricing service.
B Investment Transactions — Investment transactions for financial statement purposes are accounted for on a trade date basis. Realized gains and losses on investments sold are determined on the basis of identified cost.
C Income — Interest income is recorded on the basis of interest accrued, adjusted for amortization of premium or accretion of discount. Fees associated with loan amendments are recognized immediately. Dividend income is recorded on the ex-dividend date for dividends received in cash and/or securities.
D Federal Taxes — The Portfolio has elected to be treated as a partnership for federal tax purposes. No provision is made by the Portfolio for federal or state taxes on any taxable income of the Portfolio because each investor in the Portfolio is ultimately responsible for the payment of any taxes on its share of taxable income. Since at least one of the Portfolio's investors is a regulated investment company that invests all or substantially all of its assets in the Portfolio, the Portfolio normally must satisfy the applicable source of income and diversification requirements (under the Internal Revenue Code) in order for its investors to satisfy them. The Portfolio will allocate, at least annually a mong its investors, each investor's distributive share of the Portfolio's net investment income, net realized capital gains and any other items of income, gain, loss, deduction or credit.
As of October 31, 2008, the Portfolio had no uncertain tax positions that would require financial statement recognition, de-recognition, or disclosure. Each of the Portfolio's federal tax returns filed in the 3-year period ended October 31, 2008 remains subject to examination by the Internal Revenue Service.
E Expense Reduction — State Street Bank and Trust Company (SSBT) serves as custodian of the Portfolio. Pursuant to the custodian agreement, SSBT receives a fee reduced by credits, which are determined based on the average daily cash balance the Portfolio maintains with SSBT. All credit balances, if any, used to reduce the Portfolio's custodian fees are reported as a reduction of expenses in the Statement of Operations.
F Foreign Currency Translation — Investment valuations, other assets, and liabilities initially expressed in foreign currencies are translated each business day into U.S. dollars based upon current exchange rates. Purchases and sales of foreign investment securities and income and expenses denominated in foreign currencies are translated into U.S. dollars based upon currency exchange rates in effect on the respective dates of such transactions. Recognized gains or losses on investment transactions attributable to changes in foreign currency exchange rates are recorded for financial statement purposes as net realized gains and losses on investments. That portion of unrealized gains and losses on invest ments that results from fluctuations in foreign currency exchange rates is not separately disclosed.
G Unfunded Loan Commitments — The Portfolio may enter into certain credit agreements all or a portion of which may be unfunded. The Portfolio is obligated to fund these commitments at the borrower's discretion. The commitments are disclosed in the accompanying Portfolio of Investments.
H Use of Estimates — The preparation of the financial statements in conformity with accounting principles generally accepted in the United States of America requires management to make estimates and assumptions that affect the reported amounts of assets and liabilities at the date of the financial statements and the reported amounts of income and expense during the reporting period. Actual results could differ from those estimates.
I Indemnifications — Under the Portfolio's organizational documents, its officers and Trustees may be indemnified against certain liabilities and expenses arising out of the performance of their duties to the Portfolio. Interestholders in the Portfolio are jointly and severally liable for the liabilities and obligations of the Portfolio in the event that the Portfolio fails to satisfy such liabilities and obligations; provided, however, that, to the extent assets are available in the Portfolio, the Portfolio may, under certain circumstances, indemnify interestholders from and against any claim or liability to which such holder may become subject by reason of being or having been an interestholder in t he Portfolio. Additionally, in the normal course of business, the
38
Floating Rate Portfolio as of October 31, 2008
NOTES TO FINANCIAL STATEMENTS CONT'D
Portfolio enters into agreements with service providers that may contain indemnification clauses. The Portfolio's maximum exposure under these arrangements is unknown as this would involve future claims that may be made against the Portfolio that have not yet occurred.
J Forward Foreign Currency Exchange Contracts — The Portfolio may enter into forward foreign currency exchange contracts for the purchase or sale of a specific foreign currency at a fixed price on a future date. The Portfolio enters into forward contracts for hedging purposes as well as non-hedging purposes. The forward foreign currency exchange contract is adjusted by the daily exchange rate of the underlying currency and any gains or losses are recorded as unrealized until such time as the contract has been closed or offset by another contract with the same broker for the same settlement date and currency. Risks may arise upon entering these contracts from the potential inability of counterparties t o meet the terms of their contracts and from movements in the value of a foreign currency relative to the U.S. dollar.
K Credit Default Swaps — The Portfolio may enter into credit default swap contracts to buy or sell protection against default on an individual issuer or a basket of issuers of bonds. When the Portfolio is the buyer of a credit default swap contract, the Portfolio is entitled to receive the par (or other agreed-upon) value of a referenced debt obligation (or basket of debt obligations) from the counterparty to the contract in the event of default by a third party, such as a U.S. or foreign corporate issuer, on the debt obligation. In return, the Portfolio pays the counterparty a periodic stream of payments over the term of the contract provided that no event of default has occurred. If no default occurs, the Portfolio would have spent the stream of payments and received no benefits from the contract. When the Portfolio is the seller of a credit default swap contract, it receives the stream of payments, but is obligated to pay upon default of the referenced debt obligation. As the seller, the Portfolio effectively adds leverage to its portfolio because, in addition to its total net assets, the Portfolio is subject to investment exposure on the notional amount of the swap. The interest fee paid or received on the swap contract, which is based on a specified interest rate on a fixed notional amount, is accrued daily as a component of unrealized appreciation (depreciation) and is recorded as realized gain upon receipt or realized loss upon payment. The Portfolio also records an increase or decrease to unrealized appreciation (depreciation) in an amount equal to the daily valuation. Up-front payments or receipts, if any, are recorded as other assets or other liabilities, respectively, and amortized over the li fe of the swap contract as realized gains or losses. The Portfolio segregates assets in the form of cash and cash equivalents in an amount equal to the aggregate market value of the credit default swaps of which it is the seller, marked to market on a daily basis. These transactions involve certain risks, including the risk that the seller may be unable to fulfill the transaction.
2 Investment Adviser Fee and Other Transactions with Affiliates
The investment adviser fee is earned by BMR as compensation for investment advisory services rendered to the Portfolio. Pursuant to the investment advisory agreement and subsequent fee reduction agreement between the Portfolio and BMR, the fee is computed at an annual rate 0.575% of the Portfolio's average daily net assets up $1 billion, 0.525% from $1 billion up to $2 billion, 0.500% from $2 billion up to $5 billion, 0.480% from $5 billion up to $10 billion and 0.460% of average daily net assets of $10 billion or more, and is payable monthly. The fee reduction cannot be terminated without the consent of the Trustees and shareholders. The portion of the adviser fee payable by Cash Management on the Portfolio's investment of cash therein is credited against the Portfolio's adviser fee. For the year ended October 31, 2008, the Portfolio's adviser fee totaled $24,109,418 of which $277,089 was allocated from Cash Management and $23, 832,329 was paid or accrued directly by the Portfolio. For the year ended October 31, 2008, the Portfolio's adviser fee, including the portion allocated from Cash Management, was 0.52% of the Portfolio's average daily net assets.
Except for Trustees of the Portfolio who are not members of EVM's or BMR's organizations, officers and Trustees receive remuneration for their services to the Portfolio out of the investment adviser fee. Trustees of the Portfolio who are not affiliated with the investment adviser may elect to defer receipt of all or a percentage of their annual fees in accordance with the terms of the Trustees Deferred Compensation Plan. For the year ended October 31, 2008, no significant amounts have been deferred. Certain officers and Trustees of the Portfolio are officers of the above organizations.
3 Purchases and Sales of Investments
Purchases and sales of investments, other than short-term obligations and including maturities and principal repayments on Senior Loans, aggregated $305,846,387 and $2,799,603,561, respectively, for the year ended October 31, 2008.
39
Floating Rate Portfolio as of October 31, 2008
NOTES TO FINANCIAL STATEMENTS CONT'D
4 Federal Income Tax Basis of Investments
The cost and unrealized appreciation (depreciation) of investments of the Portfolio at October 31, 2008, as determined on a federal income tax basis, were as follows:
| Aggregate cost | | $ | 4,448,683,412 | | |
| Gross unrealized appreciation | | $ | 298,177 | | |
| Gross unrealized depreciation | | | (1,342,628,299 | ) | |
| Net unrealized depreciation | | $ | (1,342,330,122 | ) | |
The net unrealized appreciation on foreign currency and forward foreign currency exchange contracts on a federal tax basis was $2,206,058.
5 Restricted Securities
At October 31, 2008, the Portfolio owned the following securities (representing less than 0.1% of net assets) which were restricted as to public resale and not registered under the Securities Act of 1933 (excluding Rule 144A securities). The Portfolio has various registration rights (exercisable under a variety of circumstances) with respect to these securities. The value of these securities is determined based on valuations provided by brokers when available, or if not available, they are valued at fair value using methods determined in good faith by or at the direction of the Trustees.
| Description | | Date of
Acquisition | | Shares | | Cost | | Value | |
Environmental Systems
Products Holdings, Inc. | | 10/25/07 | | | 2,484 | | | $ | 0 | (1) | | $ | 0 | | |
Environmental Systems
Products Holdings
Preferred, Series A | | 10/25/07 | | | 1,138 | | | | 19,915 | | | | 26,140 | | |
Hayes Lemmerz
International | | 6/23/03 | | | 350 | | | | 17,500 | | | | 2,593 | | |
| Total Restricted Securities | | $ | 37,415 | | | $ | 28,733 | | |
(1) Less than $0.50.
6 Financial Instruments
The Portfolio may trade in financial instruments with off-balance sheet risk in the normal course of its investing activities. These financial instruments may include forward foreign currency exchange contracts and may involve, to a varying degree, elements of risk in excess of the amounts recognized for financial statement purposes. The notional or contractual amounts of these instruments represent the investment the Portfolio has in particular classes of financial instruments and does not necessarily represent the amounts potentially subject to risk. The measurement of the risks associated with these instruments is meaningful only when all related and offsetting transactions are considered.
A summary of obligations under these financial instruments at October 31, 2008 is as follows:
Forward Foreign Currency Exchange Contracts
| Sales | |
| Settlement Date | | Deliver | | In exchange for | | Net Unrealized
Appreciation | |
| 11/28/2008 | | British Pound Sterling
51,166,298 | | United States Dollar
83,747,462 | | $ | 1,525,778 | | |
| 11/28/2008 | | Euro
177,086,674 | | United States Dollar
229,348,494 | | | 3,852,330 | | |
| 11/28/2008 | | Swiss Franc
12,331,250 | | United States Dollar
10,914,059 | | | 277,620 | | |
| | | $ | 5,655,728 | | |
At October 31, 2008, the Portfolio had sufficient cash and/or securities to cover commitments under these contracts.
7 Line of Credit
The Portfolio participates with other portfolios and funds managed by EVM and its affiliates in a $1 billion ($1.5 billion prior to March 24, 2008) unsecured line of credit agreement with a group of banks. Borrowings are made by the Portfolio solely to facilitate the handling of unusual and/or unanticipated short-term cash requirements. Interest is charged to the Portfolio based on its borrowings at an amount above either the Eurodollar rate or Federal Funds rate. In addition, a fee computed at an annual rate of 0.08% (0.07% prior to March 24, 2008) on the daily unused portion of the line of credit is allocated among the participating portfolios and funds at the end of each quarter. At October 31, 2008, the Portfolio had a balance outstanding pursuant to this line of credit of $95,000,00 0 at an interest rate of 3.59%. Average borrowings and the average interest rate for the year ended October 31, 2008 were $140,669,399 and 4.16%, respectively.
40
Floating Rate Portfolio as of October 31, 2008
NOTES TO FINANCIAL STATEMENTS CONT'D
8 Risks Associated with Foreign Investments
Investing in securities issued by companies whose principal business activities are outside the United States may involve significant risks not present in domestic investments. For example, there is generally less publicly available information about foreign companies, particularly those not subject to the disclosure and reporting requirements of the U.S. securities laws. Certain foreign issuers are generally not bound by uniform accounting, auditing, and financial reporting requirements and standards of practice comparable to those applicable to domestic issuers. Investments in foreign securities also involve the risk of possible adverse changes in investment or exchange control regulations, expropriation or confiscatory taxation, limitation on the removal of funds or other assets of the Portfolio, political or financial instability or diplomatic and other developments which could affect such investments. Foreign securities mar kets, while growing in volume and sophistication, are generally not as developed as those in the United States, and securities of some foreign issuers (particularly those located in developing countries) may be less liquid and more volatile than securities of comparable U.S. companies. In general, there is less overall governmental supervision and regulation of foreign stock markets, broker-dealers and issuers than in the United States.
9 Concentration of Credit Risk
The Portfolio invests primarily in below investment grade floating-rate loans and floating-rate debt obligations, which are considered speculative because of the credit risk of their issuers. Changes in economic conditions or other circumstances are more likely to reduce the capacity of issuers of these securities to make principal and interest payments. Such companies are more likely to default on their payments of interest and principal owed than issuers of investment grade bonds. An economic downturn generally leads to a higher non-payment rate, and a loan or other debt obligation may lose significant value before a default occurs. Lower rated investments also may be subject to greater price volatility than higher rated investments. Moreover, the specific collateral used to secure a loan may decline in value or become illiquid, which would adversely affect the loan's value.
10 Recently Issued Accounting Pronouncements
In September 2006, the Financial Accounting Standards Board (FASB) issued Statement of Financial Accounting Standards No. 157 (FAS 157), "Fair Value Measurements". FAS 157 defines fair value, establishes a framework for measuring fair value in accordance with accounting principles generally accepted in the United States of America and expands disclosure about fair value measurements. FAS 157 is effective for fiscal years beginning after November 15, 2007. As of October 31, 2008, management does not believe the adoption of FAS 157 will impact the amounts reported in the financial statements; however, additional disclosures may be required about the inputs used to develop the measurements of fair value and the effect o f certain of the measurements on changes in net assets for the period.
In March 2008, the FASB issued Statement of Financial Accounting Standards No. 161 (FAS 161), "Disclosures about Derivative Instruments and Hedging Activities". FAS 161 requires enhanced disclosures about an entity's derivative and hedging activities, including qualitative disclosures about the objectives and strategies for using derivatives, quantitative disclosures about fair value amounts of and gains and losses on derivative instruments, and disclosures about credit-risk related contingent features in derivative instruments. FAS 161 is effective for fiscal years and interim periods beginning after November 15, 2008. Management is currently evaluating the impact the adoption of FAS 161 will have on the Portfolio's financial statement disclosures.
41
Floating Rate Portfolio as of October 31, 2008
REPORT OF INDEPENDENT REGISTERED PUBLIC ACCOUNTING FIRM
To the Trustees and Investors
of Floating Rate Portfolio:
We have audited the accompanying statement of assets and liabilities of Floating Rate Portfolio (the "Portfolio"), including the portfolio of investments, as of October 31, 2008, and the related statement of operations for the year then ended, the statements of changes in net assets for each of the two years in the period then ended, and the supplementary data for each of the five years in the period then ended. These financial statements and supplementary data are the responsibility of the Portfolio's management. Our responsibility is to express an opinion on these financial statements and supplementary data based on our audits.
We conducted our audits in accordance with the standards of the Public Company Accounting Oversight Board (United States). Those standards require that we plan and perform the audit to obtain reasonable assurance about whether the financial statements and supplementary data are free of material misstatement. The Portfolio is not required to have, nor were we engaged to perform, an audit of its internal control over financial reporting. Our audits included consideration of internal control over financial reporting as a basis for designing audit procedures that are appropriate in the circumstances, but not for the purpose of expressing an opinion on the effectiveness of the Portfolio's internal control over financial reporting. Accordingly, we express no such opinion. An audit also includes examining, on a test basis, evidence supporting the amounts and disclosures in the financial statements, assessing the accounting principles u sed and significant estimates made by management, as well as evaluating the overall financial statement presentation. Our procedures included confirmation of securities and senior loans owned as of October 31, 2008, by correspondence with the custodian, brokers, and selling agent banks; where replies were not received from brokers and selling agent banks, we performed other auditing procedures. We believe that our audits provide a reasonable basis for our opinion.
In our opinion, the financial statements and supplementary data referred to above present fairly, in all material respects, the financial position of Floating Rate Portfolio as of October 31, 2008, the results of its operations for the year then ended, the changes in its net assets for each of the two years in the period then ended, and the supplementary data for each of the five years in the period then ended, in conformity with accounting principles generally accepted in the United States of America.
DELOITTE & TOUCHE LLP
Boston, Massachusetts
December 18, 2008
42
Eaton Vance Floating-Rate Fund
Floating Rate Portfolio
SPECIAL MEETING OF SHAREHOLDERS (Unaudited)
Eaton Vance Floating-Rate Fund
The Fund held a Special Meeting of Shareholders on November 14, 2008 to elect Trustees. The results of the vote were as follows:
| | | Number of Shares | |
| Nominee for Trustee | | For | | Withheld | |
| Benjamin C. Esty | | | 247,222,776 | | | | 3,199,018 | | |
| Thomas E. Faust Jr. | | | 247,241,623 | | | | 3,180,172 | | |
| Allen R. Freedman | | | 247,175,395 | | | | 3,246,400 | | |
| William H. Park | | | 247,201,150 | | | | 3,220,645 | | |
| Ronald A. Pearlman | | | 247,180,461 | | | | 3,241,334 | | |
| Helen Frame Peters | | | 247,190,029 | | | | 3,231,766 | | |
| Heidi L. Steiger | | | 247,194,566 | | | | 3,227,229 | | |
| Lynn A. Stout | | | 247,209,562 | | | | 3,212,233 | | |
| Ralph F. Verni | | | 247,141,045 | | | | 3,280,750 | | |
Each nominee was also elected a Trustee of the Floating Rate Portfolio.
Floating Rate Portfolio
The Portfolio held a Special Meeting of Interestholders on November 14, 2008 to elect Trustees. The results of the vote were as follows:
| | | Interest in the Portfolio | |
| Nominee for Trustee | | For | | Withheld | |
| Benjamin C. Esty | | | 97 | % | | | 1 | % | |
| Thomas E. Faust Jr. | | | 97 | % | | | 1 | % | |
| Allen R. Freedman | | | 97 | % | | | 1 | % | |
| William H. Park | | | 97 | % | | | 1 | % | |
| Ronald A. Pearlman | | | 97 | % | | | 1 | % | |
| Helen Frame Peters | | | 97 | % | | | 1 | % | |
| Heidi L. Steiger | | | 97 | % | | | 1 | % | |
| Lynn A. Stout | | | 97 | % | | | 1 | % | |
| Ralph F. Verni | | | 97 | % | | | 1 | % | |
Results are rounded to the nearest whole number.
43
Eaton Vance Floating-Rate Fund
BOARD OF TRUSTEES' ANNUAL APPROVAL OF THE INVESTMENT ADVISORY AGREEMENT
Overview of the Contract Review Process
The Investment Company Act of 1940, as amended (the "1940 Act"), provides, in substance, that each investment advisory agreement between a fund and its investment adviser will continue in effect from year to year only if its continuance is approved at least annually by the fund's board of trustees, including by a vote of a majority of the trustees who are not "interested persons" of the fund ("Independent Trustees"), cast in person at a meeting called for the purpose of considering such approval.
At a meeting of the Boards of Trustees (each a "Board") of the Eaton Vance group of mutual funds (the "Eaton Vance Funds") held on April 21, 2008, the Board, including a majority of the Independent Trustees, voted to approve continuation of existing advisory and sub-advisory agreements for the Eaton Vance Funds for an additional one-year period. In voting its approval, the Board relied upon the affirmative recommendation of the Contract Review Committee of the Board (formerly the Special Committee), which is a committee comprised exclusively of Independent Trustees. Prior to making its recommendation, the Contract Review Committee reviewed information furnished for a series of meetings of the Contract Review Committee held in February, March and April 2008. Such information included, among other things, the following:
Information about Fees, Performance and Expenses
• An independent report comparing the advisory and related fees paid by each fund with fees paid by comparable funds;
• An independent report comparing each fund's total expense ratio and its components to comparable funds;
• An independent report comparing the investment performance of each fund to the investment performance of comparable funds over various time periods;
• Data regarding investment performance in comparison to relevant peer groups of funds and appropriate indices;
• Comparative information concerning fees charged by each adviser for managing other mutual funds and institutional accounts using investment strategies and techniques similar to those used in managing the fund;
• Profitability analyses for each adviser with respect to each fund;
Information about Portfolio Management
• Descriptions of the investment management services provided to each fund, including the investment strategies and processes employed, and any changes in portfolio management processes and personnel;
• Information concerning the allocation of brokerage and the benefits received by each adviser as a result of brokerage allocation, including information concerning the acquisition of research through "soft dollar" benefits received in connection with the funds' brokerage, and the implementation of a soft dollar reimbursement program established with respect to the funds;
• Data relating to portfolio turnover rates of each fund;
• The procedures and processes used to determine the fair value of fund assets and actions taken to monitor and test the effectiveness of such procedures and processes;
Information about each Adviser
• Reports detailing the financial results and condition of each adviser;
• Descriptions of the qualifications, education and experience of the individual investment professionals whose responsibilities include portfolio management and investment research for the funds, and information relating to their compensation and responsibilities with respect to managing other mutual funds and investment accounts;
• Copies of the Codes of Ethics of each adviser and its affiliates, together with information relating to compliance with and the administration of such codes;
• Copies of or descriptions of each adviser's proxy voting policies and procedures;
• Information concerning the resources devoted to compliance efforts undertaken by each adviser and its affiliates on behalf of the funds (including descriptions of various compliance programs) and their record of compliance with investment policies and restrictions, including policies with respect to market-timing, late trading and selective portfolio disclosure, and with policies on personal securities transactions;
• Descriptions of the business continuity and disaster recovery plans of each adviser and its affiliates;
Other Relevant Information
• Information concerning the nature, cost and character of the administrative and other non-investment management services provided by Eaton Vance Management and its affiliates;
• Information concerning management of the relationship with the custodian, subcustodians and fund accountants by each adviser or the funds' administrator; and
• The terms of each advisory agreement.
44
Eaton Vance Floating-Rate Fund
BOARD OF TRUSTEES' ANNUAL APPROVAL OF THE INVESTMENT ADVISORY AGREEMENT CONT'D
In addition to the information identified above, the Contract Review Committee considered information provided from time to time by each adviser throughout the year at meetings of the Board and its committees. Over the course of the twelve-month period ended April 30, 2008, the Board met eleven times and the Contract Review Committee, the Audit Committee and the Governance Committee, each of which is a Committee comprised solely of Independent Trustees, met twelve, seven and five times, respectively. At such meetings, the Trustees received, among other things, presentations by the portfolio managers and other investment professionals of each adviser relating to the investment performance of each fund and the investment strategies used in pursuing the fund's investment objective. The Portfolio Management Committee and the Compliance Reports and Regulatory Matters Committee are newly established and did not meet during the twelve- month period ended April 30, 2008.
For funds that invest through one or more underlying portfolios, the Board considered similar information about the portfolio(s) when considering the approval of advisory agreements. In addition, in cases where the fund's investment adviser has engaged a sub-adviser, the Board considered similar information about the sub-adviser when considering the approval of any sub-advisory agreement.
The Contract Review Committee was assisted throughout the contract review process by Goodwin Procter LLP, legal counsel for the Independent Trustees. The members of the Contract Review Committee relied upon the advice of such counsel and their own business judgment in determining the material factors to be considered in evaluating each advisory and sub-advisory agreement and the weight to be given to each such factor. The conclusions reached with respect to each advisory and sub-advisory agreement were based on a comprehensive evaluation of all the information provided and not any single factor. Moreover, each member of the Contract Review Committee may have placed varying emphasis on particular factors in reaching conclusions with respect to each advisory and sub-advisory agreement.
Results of the Process
Based on its consideration of the foregoing, and such other information as it deemed relevant, including the factors and conclusions described below, the Contract Review Committee concluded that the continuance of the investment advisory agreement of the Floating Rate Portfolio (the "Portfolio"), the portfolio in which the Eaton Vance Floating-Rate Fund (the "Fund") invests, with Boston Management and Research (the "Adviser"), including the fee structure, is in the interests of shareholders and, therefore, the Contract Review Committee recommended to the Board approval of the agreement. The Board accepted the recommendation of the Contract Review Committee as well as the factors considered and conclusions reached by the Contract Review Committee with respect to the agreement. Accordingly, the Board, including a majority of the Independent Trustees, voted to approve continuation of the investment advisory agreement for the Portfo lio.
Nature, Extent and Quality of Services
In considering whether to approve the investment advisory agreement of the Portfolio, the Board evaluated the nature, extent and quality of services provided to the Portfolio by the Adviser.
The Board considered the Adviser's management capabilities and investment process with respect to the types of investments held by the Portfolio, including the education, experience and number of its investment professionals and other personnel who provide portfolio management, investment research, and similar services to the Portfolio. In particular, the Board evaluated the experience and abilities of such personnel in analyzing factors such as the special considerations relevant to investing in senior floating-rate loans. Specifically, the Board noted the experience of the Adviser's large group of bank loan investment professionals and other personnel who provide services to the Portfolio, including portfolio managers and analysts. The Board also took into account the resources dedicated to portfolio management and other services, including the compensation paid to recruit and retain investment personnel, and the time and atte ntion devoted to the Portfolio by senior management.
The Board also reviewed the compliance programs of the Adviser and relevant affiliates thereof. Among other matters, the Board considered compliance and reporting matters relating to personal trading by investment personnel, selective disclosure of portfolio holdings, late trading, frequent trading, portfolio valuation, business continuity and the allocation of investment opportunities. The Board also evaluated the responses of the Adviser and its affiliates to requests from regulatory authorities such as the Securities and Exchange Commission.
The Board considered shareholder and other administrative services provided or managed by Eaton Vance Management and its affiliates, including transfer agency and accounting services. The Board evaluated the benefits to shareholders of investing in a fund that is a part of a large family of funds, including the ability, in many cases, to exchange an investment among different funds without incurring additional sales charges.
After consideration of the foregoing factors, among others, the Board concluded that the nature, extent and quality of services provided by the Adviser, taken as a whole, are appropriate and consistent with the terms of the investment advisory agreement.
45
Eaton Vance Floating-Rate Fund
BOARD OF TRUSTEES' ANNUAL APPROVAL OF THE INVESTMENT ADVISORY AGREEMENT CONT'D
Fund Performance
The Board compared the Fund's investment performance to a relevant universe of similarly managed funds identified by an independent data provider and appropriate benchmark indices. The Board reviewed comparative performance data for the one-, three- and five-year periods ended September 30, 2007 for the Fund. The Board concluded that the performance of the Fund was satisfactory.
Management Fees and Expenses
The Board reviewed contractual investment advisory fee rates, including any administrative fee rates, payable by the Portfolio and the Fund (referred to collectively as "management fees"). As part of its review, the Board considered the management fees and the Fund's total expense ratio for the year ended September 30, 2007, as compared to a group of similarly managed funds selected by an independent data provider.
After reviewing the foregoing information, and in light of the nature, extent and quality of the services provided by the Adviser, the Board concluded that the management fees charged for advisory and related services and the Fund's total expense ratio are reasonable.
Profitability
The Board reviewed the level of profits realized by the Adviser and relevant affiliates thereof in providing investment advisory and administrative services to the Fund, the Portfolio and to all Eaton Vance Funds as a group. The Board considered the level of profits realized without regard to revenue sharing or other payments by the Adviser and its affiliates to third parties in respect of distribution services. The Board also considered other direct or indirect benefits received by the Adviser and its affiliates in connection with its relationship with the Fund.
The Board concluded that, in light of the foregoing factors and the nature, extent and quality of the services rendered, the profits realized by the Adviser and its affiliates are reasonable.
Economies of Scale
In reviewing management fees and profitability, the Board also considered the extent to which the Adviser and its affiliates, on the one hand, and the Fund, on the other hand, can expect to realize benefits from economies of scale as the assets of the Fund and Portfolio increase. The Board acknowledged the difficulty in accurately measuring the benefits resulting from the economies of scale with respect to the management of any specific fund or group of funds. The Board reviewed data summarizing the increases and decreases in the assets of the Fund and of all Eaton Vance Funds as a group over various time periods, and evaluated the extent to which the total expense ratio of the Fund and the profitability of the Adviser and its affiliates may have been affected by such increases or decreases. Based upon the foregoing, the Board concluded that the benefits from economies of scale are currently being shared equitably by the Adviser and its affiliates and the Fund. The Board also concluded that, assuming reasonably foreseeable increases in the assets of the Portfolio, the structure of the advisory fee, which includes breakpoints at several asset levels, can be expected to cause the Adviser and its affiliates and the Fund to continue to share such benefits equitably.
46
Eaton Vance Floating-Rate Fund
MANAGEMENT AND ORGANIZATION
Fund Management. The Trustees of Eaton Vance Mutual Funds Trust (the Trust) and Floating Rate Portfolio (the Portfolio) are responsible for the overall management and supervision of the Trust's and Portfolio's affairs. The Trustees and officers of the Trust and the Portfolio are listed below. Except as indicated, each individual has held the office shown or other offices in the same company for the last five years. Trustees and officers of the Trust and the Portfolio hold indefinite terms of office. The "noninterested Trustees" consist of those Trustees who are not "interested persons" of the Trust and the Portfolio, as that term is defined under the 1940 Act. The business address of each Trustee and officer is The Eaton Vance Building, 255 State Street, Boston, Massachusetts 02109. As used below, "EVC" refers to Eaton Vance Corp., "EV" refers to Eaton Vance , Inc., "EVM" refers to Eaton Vance Management, "BMR" refers to Boston Management and Research, "Parametric" refers to Parametric Portfolio Associates and "EVD" refers to Eaton Vance Distributors, Inc. EVC and EV are the corporate parent and trustee, respectively, of EVM and BMR. EVD is the Fund's principal underwriter, the Portfolio's placement agent and a wholly-owned subsidiary of EVC. Each officer affiliated with Eaton Vance may hold a position with other Eaton Vance affiliates that is comparable to his or her position with EVM listed below.
Name and
Date of Birth | | Position(s)
with the
Trust and
the Portfolio | | Term of
Office and
Length of
Service | | Principal Occupation(s)
During Past Five Years | | Number of Portfolios
in Fund Complex
Overseen By
Trustee(1) | | Other Directorships Held | |
| Interested Trustee | | | | | | | | | | | | | |
|
| Thomas E. Faust Jr. 5/31/58 | | Trustee and President of the Trust | | Trustee since 2007 and President of the Trust since 2002 | | Chairman, Chief Executive Officer and President of EVC, Director and President of EV, Chief Executive Officer and President of EVM and BMR, and Director of EVD. Trustee and/or Officer of 173 registered investment companies and 4 private companies managed by EVM or BMR. Mr. Faust is an interested person because of his positions with EVM, BMR, EVD, EVC and EV, which are affiliates of the Trust and Portfolio. | | | 173 | | | Director of EVC | |
|
| Noninterested Trustees | | | | | | | | | | | | | |
|
| Benjamin C. Esty 1/2/63 | | Trustee | | Since 2005 | | Roy and Elizabeth Simmons Professor of Business Administration, Harvard University Graduate School of Business Administration. | | | 173 | | | None | |
|
| Allen R. Freedman 4/3/40 | | Trustee | | Since 2007 | | Former Chairman (2002-2004) and a Director (1983-2004) of Systems & Computer Technology Corp. (provider of software to higher education). Formerly, a Director of Loring Ward International (fund distributor) (2005-2007). Formerly, Chairman and a Director of Indus International, Inc. (provider of enterprise management software to the power generating industry) (2005-2007). | | | 173 | | | Director of Assurant, Inc. and Stonemor Partners L.P. (owner and operator of cemeteries) | |
|
| William H. Park 9/19/47 | | Trustee | | Since 2003 | | Vice Chairman, Commercial Industrial Finance Corp. (specialty finance company) (since 2006). Formerly, President and Chief Executive Officer, Prizm Capital Management, LLC (investment management firm) (2002-2005). | | | 173 | | | None | |
|
| Ronald A. Pearlman 7/10/40 | | Trustee | | Since 2003 | | Professor of Law, Georgetown University Law Center. | | | 173 | | | None | |
|
| Helen Frame Peters 3/22/48 | | Trustee | | Since 2008 | | Professor of Finance, Carroll School of Management, Boston College (since 2003), Adjunct Professor of Finance, Peking University, Beijing, China (since 2005). Formerly, Dean, Carroll School of Management, Boston College (2000-2003). | | | 173 | | | Director of Federal Home Loan Bank of Boston (a bank for banks) and BJ's Wholesale Clubs (wholesale club retailer); Trustee of SPDR Index Shares Funds and SPDR Series Trust (exchange traded funds) | |
|
47
Eaton Vance Floating-Rate Fund
MANAGEMENT AND ORGANIZATION CONT'D
Name and
Date of Birth | | Position(s)
with the
Trust and
the Portfolio | | Term of
Office and
Length of
Service | | Principal Occupation(s)
During Past Five Years | | Number of Portfolios
in Fund Complex
Overseen By
Trustee(1) | | Other Directorships Held | |
| Noninterested Trustees (continued) | | | | | | | | | | | | | |
|
Heidi L. Steiger
7/8/53 | | Trustee | | Since 2007 | | Managing Partner, Topridge Associates LLC (global wealth management firm) (since 2008); Senior Advisor (since 2008), President (2005-2008), Lowenhaupt Global Advisors, LLC (global wealth management firm). Formerly, President and Contributing Editor, Worth Magazine (2004-2005). Formerly, Executive Vice President and Global Head of Private Asset Management (and various other positions), Neuberger Berman (investment firm) (1986-2004). | | | 173 | | | Director of Nuclear Electric Insurance Ltd. (nuclear insurance provider) and Aviva USA (insurance provider) | |
|
Lynn A. Stout
9/14/57 | | Trustee | | Of the Trust since 1998 and of the Portfolio since 2000 | | Paul Hastings Professor of Corporate and Securities Law (since 2006) and Professor of Law (2001-2006), University of California at Los Angeles School of Law. | | | 173 | | | None | |
|
Ralph F. Verni
1/26/43 | | Chairman of the Board and Trustee | | Chairman of the Board since 2007 and Trustee since 2005 | | Consultant and private investor. | | | 173 | | | None | |
|
| Principal Officers who are not Trustees | | | | | | | |
|
Name and
Date of Birth | | Position(s)
with the
Trust and
the Portfolio | | Term of
Office and
Length of
Service | | Principal Occupation(s)
During Past Five Years | |
| William H. Ahern, Jr. 7/28/59 | | Vice President of the Trust | | Since 1995 | | Vice President of EVM and BMR. Officer of 75 registered investment companies managed by EVM or BMR. | |
|
| John R. Baur 2/10/70 | | Vice President of the Trust | | Since 2007 | | Vice President of EVM and BMR. Previously, attended Johnson Graduate School of Management, Cornell University (2002-2005), and prior thereto he was an Account Team Representative in Singapore for Applied Materials Inc. Officer of 33 registered investment companies managed by EVM or BMR. | |
|
| Michael A. Cirami 12/24/75 | | Vice President of the Trust | | Since 2007 | | Vice President of EVM and BMR. Previously, attended the University of Rochester William E. Simon Graduate School of Business Administration (2001-2003), and prior thereto he was a Team Leader for the Institutional Services Group for State Street Bank in Luxembourg. Officer of 33 registered investment companies managed by EVM or BMR. | |
|
| Cynthia J. Clemson 3/2/63 | | Vice President of the Trust | | Since 2005 | | Vice President of EVM and BMR. Officer of 90 registered investment companies managed by EVM or BMR. | |
|
| Charles B. Gaffney 12/4/72 | | Vice President of the Trust | | Since 2007 | | Vice President of EVM and BMR. Previously, Sector Portfolio Manager and Senior Equity Analyst of Brown Brothers Harriman (1997-2003). Officer of 30 registered investment companies managed by EVM or BMR. | |
|
| Christine M. Johnston 11/9/72 | | Vice President of the Trust | | Since 2007 | | Vice President of EVM and BMR. Officer of 35 registered investment companies managed by EVM or BMR. | |
|
| Aamer Khan 6/7/60 | | Vice President of the Trust | | Since 2005 | | Vice President of EVM and BMR. Officer of 33 registered investment companies managed by EVM or BMR. | |
|
| Thomas H. Luster 4/8/62 | | Vice President of the Trust | | Since 2006 | | Vice President of EVM and BMR. Officer of 51 registered investment companies managed by EVM or BMR. | |
|
| Robert B. MacIntosh 1/22/57 | | Vice President of the Trust | | Since 1998 | | Vice President of EVM and BMR. Officer of 90 registered investment companies managed by EVM or BMR. | |
|
48
Eaton Vance Floating-Rate Fund
MANAGEMENT AND ORGANIZATION CONT'D
Name and
Date of Birth | | Position(s)
with the
Trust and
the Portfolio | | Term of
Office and
Length of
Service | | Principal Occupation(s)
During Past Five Years | |
| Principal Officers who are not Trustees (continued) | | | | | | | |
|
| Scott H. Page 11/30/59 | | President of the Portfolio | | Since 2007 | | Vice President of EVM and BMR. Officer of 11 registered investment companies managed by EVM or BMR. | |
|
| Duncan W. Richardson 10/26/57 | | Vice President of the Trust | | Since 2001 | | Executive Vice President and Chief Equity Investment Officer of EVC, EVM and BMR. Officer of 81 registered investment companies managed by EVM or BMR. | |
|
Craig P. Russ
10/30/63 | | Vice President of the Portfolio | | Since 2007 | | Vice President of EVM and BMR. Officer of 6 registered investment companies managed by EMV or BMR. | |
|
| Judith A. Saryan 8/21/54 | | Vice President of the Trust | | Since 2003 | | Vice President of EVM and BMR. Officer of 55 registered investment companies managed by EVM or BMR. | |
|
| Susan Schiff 3/13/61 | | Vice President of the Trust | | Since 2002 | | Vice President of EVM and BMR. Officer of 36 registered investment companies managed by EVM or BMR. | |
|
| Thomas Seto 9/27/62 | | Vice President of the Trust | | Since 2007 | | Vice President and Director of Portfolio Management of Parametric. Officer of 31 registered investment companies managed by EVM or BMR. | |
|
| David M. Stein 5/4/51 | | Vice President of the Trust | | Since 2007 | | Managing Director and Chief Investment Officer of Parametric. Officer of 31 registered investment companies managed by EVM or BMR. | |
|
| Mark S. Venezia 5/23/49 | | Vice President of the Trust | | Since 2007 | | Vice President of EVM and BMR. Officer of 36 registered investment companies managed by EVM or BMR. | |
|
| Adam A. Weigold 3/22/75 | | Vice President of the Trust | | Since 2007 | | Vice President of EVM and BMR. Officer of 71 registered investment companies managed by EVM or BMR. | |
|
Barbara E. Campbell
6/19/57 | | Treasurer | | Of the Trust since 2005 and of the Portfolio since 2008(2) | | Vice President of EVM and BMR. Officer of 173 registered investment companies managed by EVM or BMR. | |
|
Maureen A. Gemma
5/24/60 | | Secretary and Chief Legal Officer | | Secretary since 2007 and Chief Legal Officer since 2008 | | Vice President of EVM and BMR. Officer of 173 registered investment companies managed by EVM or BMR. | |
|
Paul M. O'Neil
7/11/53 | | Chief Compliance Officer | | Since 2004 | | Vice President of EVM and BMR. Officer of 173 registered investment companies managed by EVM or BMR. | |
|
(1) Includes both master and feeder funds in a master-feeder structure.
(2) Prior to 2008, Ms. Campbell served as Assistant Treasurer of the Portfolio since 2000.
The SAI for the Fund includes additional information about the Trustees and officers of the Fund and the Portfolio and can be obtained without charge on Eaton Vance's website at www.eatonvance.com or by calling 1-800-262-1122.
49
This Page Intentionally Left Blank
This Page Intentionally Left Blank
This Page Intentionally Left Blank
Investment Adviser of Floating Rate Portfolio
Boston Management and Research
The Eaton Vance Building
255 State Street
Boston, MA 02109
Administrator of Eaton Vance Floating-Rate Fund
Eaton Vance Management
The Eaton Vance Building
255 State Street
Boston, MA 02109
Principal Underwriter
Eaton Vance Distributors, Inc.
The Eaton Vance Building
255 State Street
Boston, MA 02109
(617) 482-8260
Custodian
State Street Bank and Trust Company
200 Clarendon Street
Boston, MA 02116
Transfer Agent
PNC Global Investment Servicing
Attn: Eaton Vance Funds
P.O. Box 9653
Providence, RI 02940-9653
(800) 262-1122
Independent Registered Public Accounting Firm
Deloitte & Touche LLP
200 Berkeley Street
Boston, MA 02116-5022
Eaton Vance Floating-Rate Fund
The Eaton Vance Building
255 State Street
Boston, MA 02109
This report must be preceded or accompanied by a current prospectus. Before investing, investors should consider carefully the Fund's investment objective(s), risks, and charges and expenses. The Fund's current prospectus contains this and other information about the Fund and is available through your financial advisor. Please read the prospectus carefully before you invest or send money. For further information please call 1-800-262-1122.
1044-12/08 FRSRC

Annual Report October 31, 2008


EATON VANCE
FLOATING-RATE
& HIGH INCOME
FUND
IMPORTANT NOTICES REGARDING PRIVACY,
DELIVERY OF SHAREHOLDER DOCUMENTS,
PORTFOLIO HOLDINGS, AND PROXY VOTING
Privacy. The Eaton Vance organization is committed to ensuring your financial privacy. Each of the financial institutions identified below has in effect the following policy ("Privacy Policy") with respect to nonpublic personal information about its customers:
• Only such information received from you, through application forms or otherwise, and information about your Eaton Vance fund transactions will be collected. This may include information such as name, address, social security number, tax status, account balances and transactions.
• None of such information about you (or former customers) will be disclosed to anyone, except as permitted by law (which includes disclosure to employees necessary to service your account). In the normal course of servicing a customer's account, Eaton Vance may share information with unaffiliated third parties that perform various required services such as transfer agents, custodians and broker/dealers.
• Policies and procedures (including physical, electronic and procedural safeguards) are in place that are designed to protect the confidentiality of such information.
• We reserve the right to change our Privacy Policy at any time upon proper notification to you. Customers may want to review our Policy periodically for changes by accessing the link on our homepage: www.eatonvance.com.
Our pledge of privacy applies to the following entities within the Eaton Vance organization: the Eaton Vance Family of Funds, Eaton Vance Management, Eaton Vance Investment Counsel, Boston Management and Research, and Eaton Vance Distributors, Inc.
In addition, our Privacy Policy only applies to those Eaton Vance customers who are individuals and who have a direct relationship with us. If a customer's account (i.e., fund shares) is held in the name of a third-party financial adviser/broker-dealer, it is likely that only such adviser's privacy policies apply to the customer. This notice supersedes all previously issued privacy disclosures.
For more information about Eaton Vance's Privacy Policy, please call 1-800-262-1122.
Delivery of Shareholder Documents. The Securities and Exchange Commission (the "SEC") permits funds to deliver only one copy of shareholder documents, including prospectuses, proxy statements and shareholder reports, to fund investors with multiple accounts at the same residential or post office box address. This practice is often called "householding" and it helps eliminate duplicate mailings to shareholders.
Eaton Vance, or your financial adviser, may household the mailing of your documents indefinitely unless you instruct Eaton Vance, or your financial adviser, otherwise.
If you would prefer that your Eaton Vance documents not be householded, please contact Eaton Vance at
1-800-262-1122, or contact your financial adviser.
Your instructions that householding not apply to delivery of your Eaton Vance documents will be effective within 30 days of receipt by Eaton Vance or your financial adviser.
Portfolio Holdings. Each Eaton Vance Fund and its underlying Portfolio (if applicable) will file a schedule of its portfolio holdings on Form N-Q with the SEC for the first and third quarters of each fiscal year. The Form N-Q will be available on the Eaton Vance website www.eatonvance.com, by calling Eaton Vance at 1-800-262-1122 or in the EDGAR database on the SEC's website at www.sec.gov. Form N-Q may also be reviewed and copied at the SEC's public reference room in Washington, D.C. (call 1-800-732-0330 for information on the operation of the public reference room).
Proxy Voting. From time to time, funds are required to vote proxies related to the securities held by the funds. The Eaton Vance Funds or their underlying Portfolios (if applicable) vote proxies according to a set of policies and procedures approved by the Funds' and Portfolios' Boards. You may obtain a description of these policies and procedures and information on how the Funds or Portfolios voted proxies relating to portfolio securities during the most recent 12 month period ended June 30, without charge, upon request, by calling 1-800-262-1122. This description is also available on the SEC's website at www.sec.gov.
Eaton Vance Floating-Rate & High Income Fund as of October 31, 2008
MANAGEMENT’S DISCUSSION OF FUND PERFORMANCE

Scott H. Page, CFA
Co-Portfolio Manager

Craig P. Russ
Co-Portfolio Manager

Michael W. Weilheimer, CFA
Co-Portfolio Manager

Thomas J. Huggins, CFA
Co-Portfolio Manager
Economic and Market Conditions
· During the year ended October 31, 2008, all credit markets experienced unprecedented volatility, and the bank loan market and high-yield bond market were no exception. The subprime crisis of 2007 expanded in 2008 to include nearly all credit instruments, which in turn, caused the world economy to slip into recession. The year was a rollercoaster for the credit markets and for the Fund. The total return for the S&P/LSTA Leveraged Loan Index (the Index) through the first nine months of the Fund’s fiscal year was -2.91%, disappointing, but, given the environment, not especially bad compared to other markets. However, September brought a series of events that rattled the markets more deeply: the bailouts of Fannie Mae and Freddie Mac, the bankruptcy of Lehman Brothers, the rescue of American International Group, Inc. and a litany of unprecedented steps by the U.S. Treasury and the Federal Reserve to stabilize the credit markets. In the Fund’s fiscal fourth quarter, the Index declined -18.66%, by far its worst quarterly showing ever. The average loan price in the Fund was 70.3% of par at October 31, 2008. Although statistics vary with respect to recovery rates of loans in default, the historical rate has been approximately 70% of par. As such, bank loan prices at year-end were approaching levels that implied near universal default. At year-end, 1.7% of the Fund was in default versus 2.0% for the Index.
· While there is little doubt that a recession would bring higher default rates, it is difficult to reconcile recent trading levels with market fundamentals. A range of credit statistics and criteria used to monitor creditworthiness suggested that overall credit quality appeared to be in line with historical patterns. Despite this, bank loans traded below historical recovery levels, thus implying a near 100% default rate. The most compelling, albeit obvious, explanation for the market’s depressed trading level was that there were more sellers of bank loans than buyers. Some selling was forced, especially by hedge funds and structured investment vehicles unable to meet margin requirements. Some selling was voluntary, as redemptions from mutual funds were significant throughout the year. In addition, many hard-pressed banks and investment banks that typically make markets in bank loans were hesitant to own loans, making trading more volatile. Later in the period, there were signs that many institutional investors were attracted to the asset class by record low loan prices. However, selling outweighed buying, pushing loan prices lower.
· During the year ended October 31, 2008, the high-yield bond market suffered large losses, reflecting the breakdown of the credit markets. Toxic subprime loans, mortgage defaults, bank failures and excessive leverage in the financial system took a toll on consumer and investor confidence and dragged the economy into recession. Early in the year, the high-yield market was additionally impacted by a large inventory of unsold bondds issued to finance pending mergers and by a
Eaton Vance Floating-Rate & High Income Fund
Total Return Performance 10/31/07 - 10/31/08
Advisers Class(1) | | -23.29 | % |
Class A(1) | | -23.31 | % |
Class B(1) | | -23.84 | % |
Class C(1) | | -23.84 | % |
Class I(1) | | -23.06 | % |
S&P/LSTA Leveraged Loan Index(2) | | -21.02 | % |
Please refer to page 3 for additional performance information.
(1) | These returns do not include the 2.25% maximum sales charge for Class A shares or the applicable contingent deferred sales charges (CDSC) for Class B or Class C shares. If sales charges were deducted, the performance would be lower. Advisers Class and Class I shares are offered to certain investors at net asset value. |
| |
(2) | It is not possible to invest directly in an Index. The Index’s total return reflects changes in value of the loans constituting the Index and accrual of interest and does not reflect the commissions or expenses that would have been incurred if an investor individually purchased or sold the loans represented in the Index. |
Past performance is no guarantee of future results. Returns are historical and are calculated by determining the percentage change in net asset value or offering price (as applicable) with all distributions reinvested. Investment return and principal value will fluctuate so that shares, when redeemed, may be worth more or less than their original cost. Performance is for the stated time period only; due to market volatility, the Fund’s current performance may be lower or higher than the quoted return. For performance as of the most recent month end, please refer to www.eatonvance.com.
Fund shares are not insured by the FDIC and are not deposits or other obligations of, or guaranteed by, any depository institution. Shares are subject to investment risks, including possible loss of principal invested.
1
growing risk-aversion among fixed-income investors. The market staged a spirited-but-brief rally in March and April 2008, as the Federal Reserve injected liquidity following the Bear Stearns failure. However, as the dimensions of the global credit crisis became increasingly apparent, the market began a dramatic sell-off. Forced liquidation of bank loans by hedge funds and structured investment vehicles accelerated the process of de-leveraging across the credit markets. The selling pressure was such that liquidity was sharply lower for higher-quality bonds, and all but disappeared for lower-quality bonds. The market decline was most severe in October, declining 16.3% in that month alone, the worst month in the history of the high-yield market. High-yield spreads at October 31, 2008 were around 1,600 basis points (16.00%) – 50% higher than the peak spreads in the previous two recessions.
· A further measure of the sell-off was the high-yield bond distress ratio – the percentage of the market trading at a spread of 1,000 basis points (10.00%) or more. In October 2008, that figure rose to more than 65% of the market, significantly higher than the previous record of 40% in 2002. By October 31, the market appeared to have discounted a default rate in the mid-teens range, well above historical norms for recessions.
Management Discussion
· The Fund’s(1) investment objective is to provide a high level of current income. The Fund currently seeks its objective by investing at least 65% of its total assets in Floating Rate Portfolio and not more than 20% of its total assets in High Income Opportunities Portfolio. The Portfolios are registered investment companies managed by Eaton Vance or its affiliates. Management of Floating Rate Portfolio seeks to invest in a portfolio of senior floating-rate loans that it believes will be less volatile over time than the general loan market. At October 31, 2008, the Fund had 9.8% of its net assets in High Income Opportunities Portfolio.
· Floating Rate Portfolio’s floating-rate loan investments included 446 borrowers at October 31, 2008, with an average loan size of 0.22% of total investments, and no industry constituting more than 9% of total investments. Publishing, healthcare, business equipment and services, cable and satellite television, and chemicals and plastics were the top industry weightings. The Portfolio’s loans were primarily senior, secured loans to companies with average revenues exceeding $1 billion.
· Floating Rate Portfolio had a 14% exposure to European loans at October 31, 2008. While the Portfolio’s involvement in the European leveraged loan market represented further opportunity for diversification, this market was affected slightly more than the U.S. market by the recent credit market turmoil. However, defaults and credit losses in the European loan market remained minimal.
· The Fund’s relative underperformance of its benchmark during the year was due primarily to its modest exposure to the European leverage loan market and to high-yield bonds.
· High Income Opportunities Portfolio’s performance was negatively impacted by its lower allocation in BB-rated bonds relative to the Index, as BB-rated issues outperformed in the difficult market environment. Consumer-discretionary holdings were a drag on performance. For example, an overweighting in gaming bonds fared poorly, as investors feared the consequences of a cutback in leisure and travel spending. Cyclical areas such as paper, energy and metals and mining, detracted from performance, as the slower global economy brought lower commodity prices, and weaker demand for packaging materials.
· The consumer staples sector, which is characteristically less vulnerable to the vagaries of the economy, featured some of High Income Opportunities Portfolio’s better performers. Securities selection in the food and beverages, health care and utilities industries helped performance, as these bonds suffered less dramatic losses than more economically-sensitive areas. High Income Opportunities Portfolio was helped by underweightings in the automotive and home building areas, which were among the hardest-hit industries in the U.S. economy. High Income Opportunities Portfolio was also helped by an underweighting in the troubled financial sector. High Income Opportunities Portfolio had no exposure to commercial banks, which deteriorated amid growing loan losses.
(1) | The Fund currently invests in separate registered investment companies, Floating Rate Portfolio and High Income Opportunities Portfolio, which have the same objective and policies as the Fund. References to investments are to the Portfolios’ holdings. |
The views expressed throughout this report are those of the portfolio managers and are current only through the end of the period of the report as stated on the cover. These views are subject to change at any time based upon market or other conditions, and the investment adviser disclaims any responsibility to update such views. These views may not be relied on as investment advice and, because investment decisions for a fund are based on many factors, may not be relied on as an indication of trading intent on behalf of any Eaton Vance fund. Portfolio information provided in the report may not be representative of the Portfolio’s current or future investments and may change due to active management.
2
Eaton Vance Floating-Rate & High Income Fund as of October 31, 2008
FUND STATISTICS
Portfolio Composition
Top Ten Holdings(1)
By total investments
Charter Communications Operating, Inc. | | 1.0 | % |
SunGard Data Systems, Inc. | | 1.0 | |
HCA, Inc. | | 1.0 | |
Univision Communications, Inc. | | 1.0 | |
Georgia-Pacific Corp. | | 0.9 | |
UPC Broadband Holding B.V. | | 0.8 | |
Graphic Packaging International, Inc. | | 0.8 | |
Nielsen Finance, LLC. | | 0.8 | |
Freescale Semiconductor, Inc. | | 0.8 | |
Reader’s Digest Association, Inc. (The) | | 0.7 | |
(1) | Represents 8.8% of the Floating Rate Portfolio’s total investments as of 10/31/08. Holdings are shown as a percentage of the Portfolio’s total investments. |
Top Five Industries(2)
By total investments
Publishing | | 8.3 | % |
Healthcare | | 7.6 | |
Business Equipment & Services | | 6.8 | |
Cable & Satellite Television | | 6.7 | |
Chemicals & Plastics | | 6.0 | |
(2) | Reflects Floating Rate Portfolio’s investments as of 10/31/08. Industries are shown as a percentage of the Floating Rate Portfolio’s total investments. |
Credit Quality Ratings for
Total Loan Investments(3)
By total loan investments
Baa | | 1.7 | % |
Ba | | 44.5 | |
B | | 35.8 | |
Caa | | 2.3 | |
Non-Rated(4) | | 15.7 | |
(3) | Credit Quality ratings are those provided by Moody’s Investor Services, Inc., a nationally recognized bond rating service. Reflects Floating Rate Portfolio’s total investments as of 10/31/08. Although the investment adviser considers ratings when making investment decisions, it performs its own credit and investment analysis and does not rely primarily on the ratings assigned by the rating services. Credit quality can change from time to time, and recently issued credit ratings may not fully reflect the actual risks posed by a particular security or the issuer’s current financial condition. |
| |
(4) | Certain loans in which Floating Rate Portfolio invests are not rated by a rating agency. In management’s opinion, such securities are comparable to securities rated by a rating agency in the categories listed above. |
3
Eaton Vance Floating-Rate & High Income Fund as of October 31, 2008
FUND PERFORMANCE
The line graph and table set forth below provide information about the Fund’s performance. The line graph compares the performance of Class B of the Fund with that of the S&P/LSTA Leveraged Loan Index, an unmanaged loan market index. The lines on the graph represent the total returns of a hypothetical investment of $10,000 in Class B of the Fund and the S&P/LSTA Leveraged Loan Index. The table includes the total returns of each Class of the Fund at net asset value and maximum public offering price. The performance presented below does not reflect the deduction of taxes, if any, that a shareholder would pay on Fund distributions or the redemption of Fund shares.
Performance(1)
Share Class Symbol | | Advisers
Class
EAFHX | | Class A
EVFHX | | Class B
EBFHX | | Class C
ECFHX | | Class I
EIFHX | |
Average Annual Total Returns (at net asset value) | | | | | | | | | | | |
One year | | -23.29 | % | -23.31 | % | -23.84 | % | -23.84 | % | -23.06 | % |
Five years | | -1.40 | | -1.40 | | -2.11 | | -2.11 | | -1.12 | |
Life of Fund† | | 0.86 | | -0.53 | | 0.15 | | 0.15 | | 1.10 | |
| | | | | | | | | | | |
SEC Average Annual Total Returns (including sales charge or applicable CDSC) | | | | | | | | | | | |
One year | | -23.29 | % | -25.03 | % | -27.44 | % | -24.56 | % | -23.06 | % |
Five years | | -1.40 | | -1.86 | | -2.42 | | -2.11 | | -1.12 | |
Life of Fund† | | 0.86 | | -0.94 | | 0.15 | | 0.15 | | 1.10 | |
† Inception Dates – Advisers Class: 9/7/00; Class A: 5/7/03; Class B: 9/5/00; Class C: 9/5/00; Class I: 9/15/00 |
| |
(1) | Average Annual Total Returns at net asset value do not include the 2.25% maximum sales charge for Class A shares or the applicable contingent deferred sales charges (CDSC) for Class B or Class C shares. If sales charges were deducted, the performance would be lower. SEC Average Annual Total Returns for Class A reflect the maximum 2.25% sales charge. Class I and Advisers Class shares are offered to certain investors at net asset value. SEC Average Annual Total Returns for Class B reflect applicable CDSC based on the following schedule: 5% - 1st and 2nd years; 4% - 3rd year; 3% - 4th year; 2% - 5th year; 1% - 6th year. 1-year SEC returns for Class C reflect 1% CDSC. Class A, Advisers Class and Class I shares are subject to a 1% redemption fee if redeemed or exchanged within 90 days of the settlement of the purchase. |
Total Annual
Operating Expenses (2)
| | Advisers | | | | | | | | | |
| | Class | | Class A | | Class B | | Class C | | Class I | |
| | | | | | | | | | | |
Expense Ratio | | 1.08 | % | 1.09 | % | 1.84 | % | 1.84 | % | 0.84 | % |
(2) | From the Fund’s prospectus dated 3/1/08. |
Comparison of Change in Value of a $10,000 Investment in Eaton Vance Floating-Rate & High Income Fund Class B vs. the S&P/LSTA Leveraged Loan Index*
September 30, 2000 – October 31, 2008
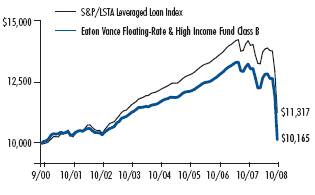
* Sources: Lipper Inc. Class B of the Fund commenced operations on 9/5/00. Index data is available as of month end only.
A $10,000 hypothetical investment at net asset value in Class A on 5/7/03, Class C on 9/5/00, Class I on 9/15/00 and Advisers Class on 9/7/00 would have been valued at $9,711 ($9,492 at the maximum offering price), $10,167, $10,927 and $10,720, respectively, on 10/31/08. It is not possible to invest directly in an Index. The Index’s total return does not reflect the expenses that would have been incurred if an investor individually purchased or sold the securities represented in the Index.
Past performance is no guarantee of future results. Returns are historical and are calculated by determining the percentage change in net asset value or offering price (as applicable) with all distributions reinvested. Investment return and principal value will fluctuate so that shares, when redeemed, may be worth more or less than their original cost. Performance is for the stated time period only; due to market volatility, the Fund’s current performance may be lower or higher than the quoted return. For performance as of the most recent month end, please refer to www.eatonvance.com.
4
Eaton Vance Floating-Rate & High Income Fund as of October 31, 2008
FUND EXPENSES
Example: As a shareholder of the Fund, you incur two types of costs: (1) transaction costs, including sales charges (loads) on purchases and redemption fees (if applicable); and (2) ongoing costs, including management fees; distribution or service fees; and other Fund expenses. This Example is intended to help you understand your ongoing costs (in dollars) of investing in the Fund and to compare these costs with the ongoing costs of investing in other mutual funds. The Example is based on an investment of $1,000 invested at the beginning of the period and held for the entire period (May 1, 2008 – October 31, 2008).
Actual Expenses: The first section of the table below provides information about actual account values and actual expenses. You may use the information in this section, together with the amount you invested, to estimate the expenses that you paid over the period. Simply divide your account value by $1,000 (for example, an $8,600 account value divided by $1,000 = 8.6), then multiply the result by the number in the first section under the heading entitled "Expenses Paid During Period" to estimate the expenses you paid on your account during this period.
Hypothetical Example for Comparison Purposes: The second section of the table below provides information about hypothetical account values and hypothetical expenses based on the actual Fund expense ratio and an assumed rate of return of 5% per year (before expenses), which is not the actual return of the Fund. The hypothetical account values and expenses may not be used to estimate the actual ending account balance or expenses you paid for the period. You may use this information to compare the ongoing costs of investing in your Fund and other funds. To do so, compare this 5% hypothetical example with the 5% hypothetical examples that appear in the shareholder reports of the other funds.
Please note that the expenses shown in the table are meant to highlight your ongoing costs only and do not reflect any transactional costs, such as sales charges (loads) or redemption fees (if applicable). Therefore, the second section of the table is useful in comparing ongoing costs only, and will not help you determine the relative total costs of owning different funds. In addition, if these transactional costs were included, your costs would have been higher.
Eaton Vance Floating-Rate & High Income Fund
| | | Beginning Account Value
(5/1/08) | | Ending Account Value
(10/31/08) | | Expenses Paid During Period*
(5/1/08 – 10/31/08) | |
| Actual | |
| Advisers Class | | $ | 1,000.00 | | | $ | 798.80 | | | $ | 4.97 | | |
| Class A | | $ | 1,000.00 | | | $ | 799.20 | | | $ | 4.93 | | |
| Class B | | $ | 1,000.00 | | | $ | 796.80 | | | $ | 8.31 | | |
| Class C | | $ | 1,000.00 | | | $ | 796.80 | | | $ | 8.31 | | |
| Class I | | $ | 1,000.00 | | | $ | 800.90 | | | $ | 3.80 | | |
| Hypothetical | |
| (5% return per year before expenses) | |
| Advisers Class | | $ | 1,000.00 | | | $ | 1,019.60 | | | $ | 5.58 | | |
| Class A | | $ | 1,000.00 | | | $ | 1,019.70 | | | $ | 5.53 | | |
| Class B | | $ | 1,000.00 | | | $ | 1,015.90 | | | $ | 9.32 | | |
| Class C | | $ | 1,000.00 | | | $ | 1,015.90 | | | $ | 9.32 | | |
| Class I | | $ | 1,000.00 | | | $ | 1,020.90 | | | $ | 4.27 | | |
* Expenses are equal to the Fund's annualized expense ratio of 1.10% for Advisers Class shares, 1.09% for Class A shares, 1.84% for Class B shares, 1.84% for Class C shares and 0.84% for Class I shares, multiplied by the average account value over the period, multiplied by 184/366 (to reflect the one-half year period). The Example assumes that the $1,000 was invested at the net asset value per share determined at the close of business on April 30, 2008. The Example reflects the expenses of both the Fund and the Portfolios.
5
Eaton Vance Floating-Rate & High Income Fund as of October 31, 2008
FINANCIAL STATEMENTS
Statement of Assets and Liabilities
As of October 31, 2008
| Assets | |
| Investment in Floating Rate Portfolio, at value (identified cost, $726,751,941) | | $ | 494,537,110 | | |
Investment in High Income Opportunities Portfolio, at value
(identified cost, $84,466,266) | | | 53,254,537 | | |
| Receivable for Fund shares sold | | | 2,313,171 | | |
| Total assets | | $ | 550,104,818 | | |
| Liabilities | |
| Payable for Fund shares redeemed | | $ | 4,880,979 | | |
| Dividends payable | | | 1,013,880 | | |
| Payable to affiliate for distribution and service fees | | | 277,883 | | |
| Payable to affiliate for administration fee | | | 76,112 | | |
| Payable to affiliate for Trustees' fees | | | 42 | | |
| Accrued expenses | | | 202,642 | | |
| Total liabilities | | $ | 6,451,538 | | |
| Net Assets | | $ | 543,653,280 | | |
| Sources of Net Assets | |
| Paid-in capital | | $ | 900,447,518 | | |
Accumulated net realized loss from Portfolios (computed on the basis of
identified cost) | | | (93,427,622 | ) | |
| Accumulated undistributed net investment income | | | 59,944 | | |
Net unrealized depreciation from Portfolios (computed on the basis of
identified cost) | | | (263,426,560 | ) | |
| Total | | $ | 543,653,280 | | |
| Advisers Class Shares | |
| Net Assets | | $ | 154,100,640 | | |
| Shares Outstanding | | | 22,618,920 | | |
Net Asset Value, Offering Price and Redemption Price Per Share
(net assets ÷ shares of beneficial interest outstanding) | | $ | 6.81 | | |
| Class A Shares | |
| Net Assets | | $ | 144,590,809 | | |
| Shares Outstanding | | | 19,963,028 | | |
Net Asset Value and Redemption Price Per Share
(net assets ÷ shares of beneficial interest outstanding) | | $ | 7.24 | | |
Maximum Offering Price Per Share
(100 ÷ 97.75 of $7.24) | | $ | 7.41 | | |
| Class B Shares | |
| Net Assets | | $ | 46,480,330 | | |
| Shares Outstanding | | | 6,828,375 | | |
Net Asset Value and Offering Price Per Share*
(net assets ÷ shares of beneficial interest outstanding) | | $ | 6.81 | | |
| Class C Shares | |
| Net Assets | | $ | 177,627,955 | | |
| Shares Outstanding | | | 26,101,094 | | |
Net Asset Value and Offering Price Per Share*
(net assets ÷ shares of beneficial interest outstanding) | | $ | 6.81 | | |
| Class I Shares | |
| Net Assets | | $ | 20,853,546 | | |
| Shares Outstanding | | | 3,059,842 | | |
Net Asset Value, Offering Price and Redemption Price Per Share
(net assets ÷ shares of beneficial interest outstanding) | | $ | 6.82 | | |
| On sales of $100,000 or more, the offering price of Class A shares is reduced. | |
* Redemption price per share is equal to the net asset value less any applicable contingent deferred sales charge.
Statement of Operations
For the Year Ended
October 31, 2008
| Investment Income | |
| Interest allocated from Portfolios | | $ | 69,314,693 | | |
| Dividends allocated from Portfolios | | | 78,815 | | |
| Expenses allocated from Portfolios | | | (6,494,536 | ) | |
| Net investment income from Portfolios | | $ | 62,898,972 | | |
| Expenses | |
| Administration fee | | $ | 1,383,555 | | |
| Trustees' fees and expenses | | | 1,735 | | |
Distribution and service fees
Advisers Class | | | 748,547 | | |
| Class A | | | 585,886 | | |
| Class B | | | 758,468 | | |
| Class C | | | 2,833,428 | | |
| Transfer and dividend disbursing agent fees | | | 739,024 | | |
| Printing and postage | | | 122,877 | | |
| Registration fees | | | 86,258 | | |
| Custodian fee | | | 51,622 | | |
| Legal and accounting services | | | 25,558 | | |
| Miscellaneous | | | 24,754 | | |
| Total expenses | | $ | 7,361,712 | | |
| Net investment income | | $ | 55,537,260 | | |
Realized and Unrealized
Gain (Loss) from Portfolios | |
Net realized gain (loss) —
Investment transactions (identified cost basis) | | $ | (27,414,690 | ) | |
| Swap contracts | | | 450,161 | | |
Foreign currency and forward foreign currency
exchange contract transactions | | | 8,942,900 | | |
| Net realized loss | | $ | (18,021,629 | ) | |
Change in unrealized appreciation (depreciation) —
Investments (identified cost basis) | | $ | (239,407,264 | ) | |
| Swap contracts | | | (1,334,717 | ) | |
| Foreign currency and forward foreign currency exchange contracts | | | 2,303,759 | | |
| Net change in unrealized appreciation (depreciation) | | $ | (238,438,222 | ) | |
| Net realized and unrealized loss | | $ | (256,459,851 | ) | |
| Net decrease in net assets from operations | | $ | (200,922,591 | ) | |
See notes to financial statements
6
Eaton Vance Floating-Rate & High Income Fund as of October 31, 2008
FINANCIAL STATEMENTS CONT'D
Statements of Changes in Net Assets
Increase (Decrease)
in Net Assets | | Year Ended
October 31, 2008 | | Year Ended
October 31, 2007 | |
From operations —
Net investment income | | $ | 55,537,260 | | | $ | 114,542,056 | | |
Net realized loss from investment
transactions, swap contracts, and
foreign currency and forward
foreign currency exchange
contract transactions | | | (18,021,629 | ) | | | (11,599,978 | ) | |
Net change in unrealized
appreciation (depreciation)
of investments, swap contracts,
and foreign currency and forward
foreign currency exchange contracts | | | (238,438,222 | ) | | | (34,029,026 | ) | |
Net increase (decrease) in net assets
from operations | | $ | (200,922,591 | ) | | $ | 68,913,052 | | |
Distributions to shareholders —
From net investment income
Advisers Class | | $ | (16,232,328 | ) | | $ | (51,900,786 | ) | |
| Class A | | | (12,836,517 | ) | | | (28,305,914 | ) | |
| Class B | | | (3,656,107 | ) | | | (7,077,272 | ) | |
| Class C | | | (13,672,901 | ) | | | (25,477,484 | ) | |
| Class I | | | (1,641,115 | ) | | | (3,400,672 | ) | |
Tax return of capital
Advisers Class | | | (2,316,847 | ) | | | — | | |
| Class A | | | (1,832,162 | ) | | | — | | |
| Class B | | | (521,838 | ) | | | — | | |
| Class C | | | (1,951,539 | ) | | | — | | |
| Class I | | | (234,237 | ) | | | — | | |
| Total distributions to shareholders | | $ | (54,895,591 | ) | | $ | (116,162,128 | ) | |
Transactions in shares of beneficial interest —
Proceeds from sale of shares
Advisers Class | | $ | 213,973,459 | | | $ | 242,057,197 | | |
| Class A | | | 48,229,120 | | | | 201,764,125 | | |
| Class B | | | 1,344,757 | | | | 6,727,378 | | |
| Class C | | | 21,330,674 | | | | 73,125,819 | | |
| Class I | | | 23,729,442 | | | | 35,055,777 | | |
Net asset value of shares issued to
shareholders in payment of
distributions declared
Advisers Class | | | 14,535,766 | | | | 35,936,405 | | |
| Class A | | | 10,824,961 | | | | 22,036,744 | | |
| Class B | | | 2,659,315 | | | | 4,566,007 | | |
| Class C | | | 10,491,392 | | | | 17,660,203 | | |
| Class I | | | 1,411,512 | | | | 2,649,298 | | |
Cost of shares redeemed
Advisers Class | | | (465,669,578 | ) | | | (629,689,973 | ) | |
| Class A | | | (215,220,489 | ) | | | (282,795,525 | ) | |
| Class B | | | (30,030,221 | ) | | | (34,340,242 | ) | |
| Class C | | | (156,998,783 | ) | | | (142,937,846 | ) | |
| Class I | | | (33,865,338 | ) | | | (50,780,490 | ) | |
Net asset value of shares exchanged
Class A | | | 5,920,180 | | | | 8,691,621 | | |
| Class B | | | (5,920,180 | ) | | | (8,691,621 | ) | |
| Redemption fees | | | 791,757 | | | | 138,956 | | |
Net decrease in net assets from Fund
share transactions | | $ | (552,462,254 | ) | | $ | (498,826,167 | ) | |
| Net decrease in net assets | | $ | (808,280,436 | ) | | $ | (546,075,243 | ) | |
| Net Assets | | Year Ended
October 31, 2008 | | Year Ended
October 31, 2007 | |
| At beginning of year | | $ | 1,351,933,716 | | | $ | 1,898,008,959 | | |
| At end of year | | $ | 543,653,280 | | | $ | 1,351,933,716 | | |
Accumulated undistributed
(distributions in excess of)
net investment income
included in net assets | |
| At end of year | | $ | 59,944 | | | $ | (964,062 | ) | |
See notes to financial statements
7
Eaton Vance Floating-Rate & High Income Fund as of October 31, 2008
FINANCIAL STATEMENTS CONT'D
Financial Highlights
| | | Advisers Class | |
| | | Year Ended October 31, | |
| | | 2008 | | 2007 | | 2006 | | 2005 | | 2004 | |
| Net asset value — Beginning of year | | $ | 9.450 | | | $ | 9.690 | | | $ | 9.680 | | | $ | 9.710 | | | $ | 9.610 | | |
| Income (loss) from operations | |
| Net investment income(1) | | $ | 0.551 | | | $ | 0.639 | | | $ | 0.597 | | | $ | 0.451 | | | $ | 0.347 | | |
| Net realized and unrealized gain (loss) | | | (2.662 | ) | | | (0.233 | ) | | | 0.014 | | | | (0.031 | ) | | | 0.103 | | |
| Total income (loss) from operations | | $ | (2.111 | ) | | $ | 0.406 | | | $ | 0.611 | | | $ | 0.420 | | | $ | 0.450 | | |
| Less distributions | |
| From net investment income | | $ | (0.469 | ) | | $ | (0.647 | ) | | $ | (0.601 | ) | | $ | (0.451 | ) | | $ | (0.350 | ) | |
| Tax return of capital | | | (0.068 | ) | | | — | | | | — | | | | — | | | | — | | |
| Total distributions | | $ | (0.537 | ) | | $ | (0.647 | ) | | $ | (0.601 | ) | | $ | (0.451 | ) | | $ | (0.350 | ) | |
| Redemption fees | | $ | 0.008 | | | $ | 0.001 | | | $ | 0.000 | (2) | | $ | 0.001 | | | $ | 0.000 | (2) | |
| Net asset value — End of year | | $ | 6.810 | | | $ | 9.450 | | | $ | 9.690 | | | $ | 9.680 | | | $ | 9.710 | | |
| Total Return(3) | | | (23.29 | )% | | | 4.29 | % | | | 6.49 | % | | | 4.42 | % | | | 4.76 | % | |
| Ratios/Supplemental Data | |
| Net assets, end of year (000's omitted) | | $ | 154,101 | | | $ | 469,777 | | | $ | 841,865 | | | $ | 710,286 | | | $ | 474,219 | | |
| Ratios (As a percentage of average daily net assets): | |
| Expenses before custodian fee reduction(4)(5) | | | 1.22 | % | | | 1.08 | % | | | 1.05 | % | | | 1.05 | % | | | 1.06 | % | |
| Net investment income | | | 6.28 | % | | | 6.63 | % | | | 6.16 | % | | | 4.65 | % | | | 3.59 | % | |
| Portfolio Turnover of Floating Rate Portfolio | | | 7 | % | | | 61 | % | | | 50 | % | | | 57 | % | | | 67 | % | |
| Portfolio Turnover of High Income Opportunities Portfolio | | | 48 | % | | | 81 | % | | | 62 | % | | | 62 | % | | | 80 | % | |
(1) Computed using average shares outstanding.
(2) Amount represents less than $0.0005 per share.
(3) Returns are historical and are calculated by determining the percentage change in net asset value with all distributions reinvested.
(4) Includes the Fund's share of the Portfolios' allocated expenses.
(5) Excludes the effect of custody fee credits, if any, of less than 0.005%.
See notes to financial statements
8
Eaton Vance Floating-Rate & High Income Fund as of October 31, 2008
FINANCIAL STATEMENTS CONT'D
Financial Highlights
| | | Class A | |
| | | Year Ended October 31, | |
| | | 2008 | | 2007 | | 2006 | | 2005 | | 2004 | |
| Net asset value — Beginning of year | | $ | 10.050 | | | $ | 10.300 | | | $ | 10.290 | | | $ | 10.320 | | | $ | 10.220 | | |
| Income (loss) from operations | |
| Net investment income(1) | | $ | 0.591 | | | $ | 0.680 | | | $ | 0.631 | | | $ | 0.475 | | | $ | 0.363 | | |
| Net realized and unrealized gain (loss) | | | (2.838 | ) | | | (0.243 | ) | | | 0.018 | | | | (0.027 | ) | | | 0.109 | | |
| Total income (loss) from operations | | $ | (2.247 | ) | | $ | 0.437 | | | $ | 0.649 | | | $ | 0.448 | | | $ | 0.472 | | |
| Less distributions | |
| From net investment income | | $ | (0.498 | ) | | $ | (0.688 | ) | | $ | (0.639 | ) | | $ | (0.479 | ) | | $ | (0.372 | ) | |
| Tax return of capital | | | (0.073 | ) | | | — | | | | — | | | | — | | | | — | | |
| Total distributions | | $ | (0.571 | ) | | $ | (0.688 | ) | | $ | (0.639 | ) | | $ | (0.479 | ) | | $ | (0.372 | ) | |
| Redemption fees | | $ | 0.008 | | | $ | 0.001 | | | $ | 0.000 | (2) | | $ | 0.001 | | | $ | 0.000 | (2) | |
| Net asset value — End of year | | $ | 7.240 | | | $ | 10.050 | | | $ | 10.300 | | | $ | 10.290 | | | $ | 10.320 | | |
| Total Return(3) | | | (23.31 | )% | | | 4.35 | % | | | 6.49 | % | | | 4.43 | % | | | 4.69 | % | |
| Ratios/Supplemental Data | |
| Net assets, end of year (000's omitted) | | $ | 144,591 | | | $ | 361,138 | | | $ | 423,214 | | | $ | 474,435 | | | $ | 431,257 | | |
| Ratios (As a percentage of average daily net assets): | |
| Expenses before custodian fee reduction(4)(5) | | | 1.22 | % | | | 1.09 | % | | | 1.05 | % | | | 1.05 | % | | | 1.07 | % | |
| Net investment income | | | 6.35 | % | | | 6.63 | % | | | 6.13 | % | | | 4.60 | % | | | 3.52 | % | |
| Portfolio Turnover of Floating Rate Portfolio | | | 7 | % | | | 61 | % | | | 50 | % | | | 57 | % | | | 67 | % | |
| Portfolio Turnover of High Income Opportunities Portfolio | | | 48 | % | | | 81 | % | | | 62 | % | | | 62 | % | | | 80 | % | |
(1) Computed using average shares outstanding.
(2) Amount represents less than $0.0005 per share.
(3) Returns are historical and are calculated by determining the percentage change in net asset value with all distributions reinvested.
(4) Includes the Fund's share of the Portfolios' allocated expenses.
(5) Excludes the effect of custody fee credits, if any, of less than 0.005%.
See notes to financial statements
9
Eaton Vance Floating-Rate & High Income Fund as of October 31, 2008
FINANCIAL STATEMENTS CONT'D
Financial Highlights
| | | Class B | |
| | | Year Ended October 31, | |
| | | 2008 | | 2007 | | 2006 | | 2005 | | 2004 | |
| Net asset value — Beginning of year | | $ | 9.450 | | | $ | 9.680 | | | $ | 9.680 | | | $ | 9.700 | | | $ | 9.600 | | |
| Income (loss) from operations | |
| Net investment income(1) | | $ | 0.487 | | | $ | 0.567 | | | $ | 0.520 | | | $ | 0.373 | | | $ | 0.275 | | |
| Net realized and unrealized gain (loss) | | | (2.661 | ) | | | (0.223 | ) | | | 0.008 | | | | (0.017 | ) | | | 0.102 | | |
| Total income (loss) from operations | | $ | (2.174 | ) | | $ | 0.344 | | | $ | 0.528 | | | $ | 0.356 | | | $ | 0.377 | | |
| Less distributions | |
| From net investment income | | $ | (0.414 | ) | | $ | (0.575 | ) | | $ | (0.528 | ) | | $ | (0.377 | ) | | $ | (0.277 | ) | |
| Tax return of capital | | | (0.060 | ) | | | — | | | | — | | | | — | | | | — | | |
| Total distributions | | $ | (0.474 | ) | | $ | (0.575 | ) | | $ | (0.528 | ) | | $ | (0.377 | ) | | $ | (0.277 | ) | |
| Redemption fees | | $ | 0.008 | | | $ | 0.001 | | | $ | 0.000 | (2) | | $ | 0.001 | | | $ | 0.000 | (2) | |
| Net asset value — End of year | | $ | 6.810 | | | $ | 9.450 | | | $ | 9.680 | | | $ | 9.680 | | | $ | 9.700 | | |
| Total Return(3) | | | (23.84 | )% | | | 3.63 | % | | | 5.60 | % | | | 3.74 | % | | | 3.98 | % | |
| Ratios/Supplemental Data | |
| Net assets, end of year (000's omitted) | | $ | 46,480 | | | $ | 99,812 | | | $ | 134,213 | | | $ | 163,795 | | | $ | 182,045 | | |
| Ratios (As a percentage of average daily net assets): | |
| Expenses before custodian fee reduction(4)(5) | | | 1.97 | % | | | 1.84 | % | | | 1.80 | % | | | 1.80 | % | | | 1.82 | % | |
| Net investment income | | | 5.58 | % | | | 5.88 | % | | | 5.37 | % | | | 3.84 | % | | | 2.84 | % | |
| Portfolio Turnover of Floating Rate Portfolio | | | 7 | % | | | 61 | % | | | 50 | % | | | 57 | % | | | 67 | % | |
| Portfolio Turnover of High Income Opportunities Portfolio | | | 48 | % | | | 81 | % | | | 62 | % | | | 62 | % | | | 80 | % | |
(1) Computed using average shares outstanding.
(2) Amount represents less than $0.0005 per share.
(3) Returns are historical and are calculated by determining the percentage change in net asset value with all distributions reinvested.
(4) Includes the Fund's share of the Portfolios' allocated expenses.
(5) Excludes the effect of custody fee credits, if any, of less than 0.005%.
See notes to financial statements
10
Eaton Vance Floating-Rate & High Income Fund as of October 31, 2008
FINANCIAL STATEMENTS CONT'D
Financial Highlights
| | | Class C | |
| | | Year Ended October 31, | |
| | | 2008 | | 2007 | | 2006 | | 2005 | | 2004 | |
| Net asset value — Beginning of year | | $ | 9.450 | | | $ | 9.680 | | | $ | 9.680 | | | $ | 9.700 | | | $ | 9.600 | | |
| Income (loss) from operations | |
| Net investment income(1) | | $ | 0.488 | | | $ | 0.566 | | | $ | 0.521 | | | $ | 0.374 | | | $ | 0.273 | | |
| Net realized and unrealized gain (loss) | | | (2.663 | ) | | | (0.222 | ) | | | 0.007 | | | | (0.018 | ) | | | 0.104 | | |
| Total income (loss) from operations | | $ | (2.175 | ) | | $ | 0.344 | | | $ | 0.528 | | | $ | 0.356 | | | $ | 0.377 | | |
| Less distributions | |
| From net investment income | | $ | (0.413 | ) | | $ | (0.575 | ) | | $ | (0.528 | ) | | $ | (0.377 | ) | | $ | (0.277 | ) | |
| Tax return of capital | | | (0.060 | ) | | | — | | | | — | | | | — | | | | — | | |
| Total distributions | | $ | (0.473 | ) | | $ | (0.575 | ) | | $ | (0.528 | ) | | $ | (0.377 | ) | | $ | (0.277 | ) | |
| Redemption fees | | $ | 0.008 | | | $ | 0.001 | | | $ | 0.000 | (2) | | $ | 0.001 | | | $ | 0.000 | (2) | |
| Net asset value — End of year | | $ | 6.810 | | | $ | 9.450 | | | $ | 9.680 | | | $ | 9.680 | | | $ | 9.700 | | |
| Total Return(3) | | | (23.84 | )% | | | 3.63 | % | | | 5.59 | % | | | 3.74 | % | | | 3.98 | % | |
| Ratios/Supplemental Data | |
| Net assets, end of year (000's omitted) | | $ | 177,628 | | | $ | 383,163 | | | $ | 445,987 | | | $ | 525,843 | | | $ | 513,459 | | |
| Ratios (As a percentage of average daily net assets): | |
| Expenses before custodian fee reduction(4)(5) | | | 1.97 | % | | | 1.84 | % | | | 1.80 | % | | | 1.80 | % | | | 1.82 | % | |
| Net investment income | | | 5.59 | % | | | 5.88 | % | | | 5.38 | % | | | 3.85 | % | | | 2.83 | % | |
| Portfolio Turnover of Floating Rate Portfolio | | | 7 | % | | | 61 | % | | | 50 | % | | | 57 | % | | | 67 | % | |
| Portfolio Turnover of High Income Opportunities Portfolio | | | 48 | % | | | 81 | % | | | 62 | % | | | 62 | % | | | 80 | % | |
(1) Computed using average shares outstanding.
(2) Amount represents less than $0.0005 per share.
(3) Returns are historical and are calculated by determining the percentage change in net asset value with all distributions reinvested.
(4) Includes the Fund's share of the Portfolios' allocated expenses.
(5) Excludes the effect of custody fee credits, if any, of less than 0.005%.
See notes to financial statements
11
Eaton Vance Floating-Rate & High Income Fund as of October 31, 2008
FINANCIAL STATEMENTS CONT'D
Financial Highlights
| | | Class I | |
| | | Year Ended October 31, | |
| | | 2008 | | 2007 | | 2006 | | 2005 | | 2004 | |
| Net asset value — Beginning of year | | $ | 9.460 | | | $ | 9.690 | | | $ | 9.690 | | | $ | 9.710 | | | $ | 9.610 | | |
| Income (loss) from operations | |
| Net investment income(1) | | $ | 0.563 | | | $ | 0.664 | | | $ | 0.623 | | | $ | 0.474 | | | $ | 0.373 | | |
| Net realized and unrealized gain (loss) | | | (2.652 | ) | | | (0.225 | ) | | | 0.003 | | | | (0.020 | ) | | | 0.102 | | |
| Total income (loss) from operations | | $ | (2.089 | ) | | $ | 0.439 | | | $ | 0.626 | | | $ | 0.454 | | | $ | 0.475 | | |
| Less distributions | |
| From net investment income | | $ | (0.490 | ) | | $ | (0.670 | ) | | $ | (0.626 | ) | | $ | (0.475 | ) | | $ | (0.375 | ) | |
| Tax return of capital | | | (0.069 | ) | | | — | | | | — | | | | — | | | | — | | |
| Total distributions | | $ | (0.559 | ) | | $ | (0.670 | ) | | $ | (0.626 | ) | | $ | (0.475 | ) | | $ | (0.375 | ) | |
| Redemption fees | | $ | 0.008 | | | $ | 0.001 | | | $ | 0.000 | (2) | | $ | 0.001 | | | $ | 0.000 | (2) | |
| Net asset value — End of year | | $ | 6.820 | | | $ | 9.460 | | | $ | 9.690 | | | $ | 9.690 | | | $ | 9.710 | | |
| Total Return(3) | | | (23.06 | )% | | | 4.65 | % | | | 6.65 | % | | | 4.78 | % | | | 5.02 | % | |
| Ratios/Supplemental Data | |
| Net assets, end of year (000's omitted) | | $ | 20,854 | | | $ | 38,044 | | | $ | 52,730 | | | $ | 37,200 | | | $ | 23,618 | | |
| Ratios (As a percentage of average daily net assets): | |
| Expenses before custodian fee reduction(4)(5) | | | 0.94 | % | | | 0.84 | % | | | 0.80 | % | | | 0.80 | % | | | 0.82 | % | |
| Net investment income | | | 6.47 | % | | | 6.88 | % | | | 6.42 | % | | | 4.88 | % | | | 3.85 | % | |
| Portfolio Turnover of Floating Rate Portfolio | | | 7 | % | | | 61 | % | | | 50 | % | | | 57 | % | | | 67 | % | |
| Portfolio Turnover of High Income Opportunities Portfolio | | | 48 | % | | | 81 | % | | | 62 | % | | | 62 | % | | | 80 | % | |
(1) Computed using average shares outstanding.
(2) Amount represents less than $0.0005 per share.
(3) Returns are historical and are calculated by determining the percentage change in net asset value with all distributions reinvested.
(4) Includes the Fund's share of the Portfolios' allocated expenses.
(5) Excludes the effect of custody fee credits, if any, of less than 0.005%.
See notes to financial statements
12
Eaton Vance Floating-Rate & High Income Fund as of October 31, 2008
NOTES TO FINANCIAL STATEMENTS
1 Significant Accounting Policies
Eaton Vance Floating-Rate & High Income Fund (the Fund) is a diversified series of Eaton Vance Mutual Funds Trust (the Trust). The Trust is a Massachusetts business trust registered under the Investment Company Act of 1940, as amended (the 1940 Act), as an open-end management investment company. The Fund offers five classes of shares. Class A shares are generally sold subject to a sales charge imposed at time of purchase. Class B and Class C shares are sold at net asset value and are generally subject to a contingent deferred sales charge (see Note 5). The Advisers Class and Class I shares are sold at net asset value and are not subject to a sales charge. Class B shares automatically convert to Class A shares eight years after their purchase as described in the Fund's prospectus. Each class represents a pro-rata interest in the Fund, but votes separately on class-specific matters and (as noted below) is subject to different expenses. Realized and unrealized gains and losses are allocated daily to each class of shares based on the relative net assets of each class to the total net assets of the Fund. Net investment income, other than class-specific expenses, is allocated daily to each class of shares based upon the ratio of the value of each class's paid shares to the total value of all paid shares. Each class of shares differs in its distribution plan and certain other class-specific expenses. The Fund's investment objective is to provide a high level of current income. The Fund currently pursues its objective by investing all of its investable assets in interests in the following two portfolios managed by Eaton Vance Management (EVM) or its affiliates: Floating Rate Portfolio and High Income Opportunities Portfolio (the Portfolios), which are New York trusts. The value of the Fund's investment in the Portfolios reflects the Fund's proportionate interest in the net assets of Floating Rate Portfolio and High Income Opportunities Portfolio (16.2% and 11.1%, respectively, at October 31, 2008). The performance of the Fund is directly affected by the performance of the Portfolios. The financial statements of the Floating Rate Portfolio, including the portfolio of investments, are included elsewhere in this report and should be read in conjunction with the Fund's financial statements. A copy of the High Income Opportunities Portfolio's financial statements is available on the EDGAR Database on the Securities and Exchange Commission's website (www.sec.gov), at the Commission's public reference room in Washington, DC or upon request from the Fund's principal underwriter, Eaton Vance Distributors, Inc. (EVD), by calling 1-800-262-1122.
The following is a summary of significant accounting policies of the Fund. The policies are in conformity with accounting principles generally accepted in the United States of America.
A Investment Valuation — Valuation of securities by Floating Rate Portfolio is discussed in Note 1A of the Portfolio's Notes to Financial Statements, which are included elsewhere in this report. Such policies are consistent with those of High Income Opportunities Portfolio.
B Income — The Fund's net investment income or loss consists of the Fund's pro-rata share of the net investment income or loss of the Portfolios, less all actual and accrued expenses of the Fund.
C Federal Taxes — The Fund's policy is to comply with the provisions of the Internal Revenue Code applicable to regulated investment companies and to distribute to shareholders each year substantially all of its net investment income, and all or substantially all of its net realized capital gains. Accordingly, no provision for federal income or excise tax is necessary.
At October 31, 2008, the Fund, for federal income tax purposes, had a capital loss carryforward of $92,476,894, which will reduce its taxable income arising from future net realized gains on investment transactions, if any, to the extent permitted by the Internal Revenue Code, and thus will reduce the amount of distributions to shareholders, which would otherwise be necessary to relieve the Fund of any liability for federal income or excise tax. Such capital loss carryforward will expire on October 31, 2009 ($4,933,389), October 31, 2010 ($16,168,986), October 31, 2011 ($2,993,864), October 31, 2012 ($2,290,023), October 31, 2013 ($2,252,412), October 31, 2015 ($3,277,415), and October 31, 2016 ($60,560,805).
As of October 31, 2008, the Fund had no uncertain tax positions that would require financial statement recognition, de-recognition, or disclosure. Each of the Fund's federal tax returns filed in the 3-year period ended October 31, 2008 remains subject to examination by the Internal Revenue Service.
D Expenses — The majority of expenses of the Trust are directly identifiable to an individual fund. Expenses which are not readily identifiable to a specific fund are allocated taking into consideration, among other things, the nature and type of expense and the relative size of the funds.
E Expense Reduction — State Street Bank and Trust Company (SSBT) serves as custodian of the Fund. Pursuant to the custodian agreement, SSBT receives a fee reduced by credits, which are determined based on the
13
Eaton Vance Floating-Rate & High Income Fund as of October 31, 2008
NOTES TO FINANCIAL STATEMENTS CONT'D
average daily cash balance the Fund maintains with SSBT. All credit balances, if any, used to reduce the Fund's custodian fees are reported as a reduction of expenses in the Statement of Operations.
F Use of Estimates — The preparation of the financial statements in conformity with accounting principles generally accepted in the United States of America requires management to make estimates and assumptions that affect the reported amounts of assets and liabilities at the date of the financial statements and the reported amounts of income and expense during the reporting period. Actual results could differ from those estimates.
G Indemnifications — Under the Trust's organizational documents, its officers and Trustees may be indemnified against certain liabilities and expenses arising out of the performance of their duties to the Fund, and shareholders are indemnified against personal liability for the obligations of the Trust. Additionally, in the normal course of business, the Fund enters into agreements with service providers that may contain indemnification clauses. The Fund's maximum exposure under these arrangements is unknown as this would involve future claims that may be made against the Fund that have not yet occurred.
H Redemption Fees — Upon the redemption or exchange of shares by Advisers Class, Class A and Class I shareholders within 90 days of the settlement of purchase, a fee of 1% of the current net asset value of these shares will be assessed and retained by the Fund for the benefit of the remaining shareholders. The redemption fee is accounted for as an addition to paid-in capital.
I Other — Investment transactions are accounted for on a trade date basis. Dividends to shareholders are recorded on the ex-dividend date.
2 Distributions to Shareholders
The Fund declares dividends daily to shareholders of record at the time of declaration. Distributions are generally paid monthly. Distributions of realized capital gains (reduced by available capital loss carryforwards from prior years, if any) are made at least annually. Distributions are declared separately for each class of shares. Shareholders may reinvest income and capital gain distributions in additional shares of the same class of the Fund at the net asset value as of the reinvestment date or, at the election of the shareholder, receive distributions in cash. The Fund distinguishes between distributions on a tax basis and a financial reporting basis. Accounting principles generally accepted in the United States of America require that only distributions in excess of tax basis earnings and profits be reported in the financial statements as a return of capital. Permanent differences between book and tax accounting relating to distributions are reclassified to paid-in capital.
The tax character of distributions declared for the years ended October 31, 2008 and October 31, 2007 was as follows:
| | | Year ended October 31, | |
| | | 2008 | | 2007 | |
| Distributions declared from: | |
| Ordinary income | | $ | 48,038,968 | | | $ | 116,162,128 | | |
| Tax return of capital | | $ | 6,856,623 | | | | — | | |
During the year ended October 31, 2008, accumulated net realized loss was increased by $42,664,764, accumulated undistributed net investment income was decreased by $6,474,286, and paid-in capital was increased by $49,139,050 due to differences between book and tax accounting, primarily for swap contracts, mixed straddles, foreign currency gain (loss) and premium amortization. These reclassifications had no effect on the net assets or net asset value per share of the Fund.
As of October 31, 2008, the components of distributable earnings (accumulated losses) and unrealized appreciation (depreciation) on a tax basis were as follows:
| Capital loss carryforward | | $ | (92,476,894 | ) | |
| Net unrealized depreciation | | $ | (260,442,103 | ) | |
| Other temporary differences | | $ | (1,013,880 | ) | |
The differences between components of distributable earnings (accumulated losses) on a tax basis and the amounts reflected in the Statement of Assets and Liabilities are primarily due to wash sales, partnership allocations, swap contracts and the timing of recognizing distributions to shareholders.
3 Transactions with Affiliates
The administration fee is earned by EVM as compensation for administrative services rendered to the Fund. The fee is computed at an annual rate of 0.15% of the Fund's average daily net assets. For the year ended October 31, 2008, the administration fee amounted to $1,383,555. The Portfolios have engaged Boston Management and Research (BMR), a subsidiary of EVM, to render investment advisory services. (See Note 2 of the Portfolios' Notes to Financial Statements).
14
Eaton Vance Floating-Rate & High Income Fund as of October 31, 2008
NOTES TO FINANCIAL STATEMENTS CONT'D
EVM serves as the sub-transfer agent of the Fund and receives from the transfer agent an aggregate fee based upon the actual expenses incurred by EVM in the performance of these services. For the year ended October 31, 2008, EVM earned $42,924 in sub-transfer agent fees. The Fund was informed that EVD, an affiliate of EVM, received $5,568 as its portion of the sales charge on sales of Class A shares for the year ended October 31, 2008. EVD also received distribution and service fees from Advisers Class, Class A, Class B and Class C shares (see Note 4) and contingent deferred sales charges (see Note 5).
Except for Trustees of the Fund and the Portfolios who are not members of EVM's or BMR's organizations, officers and Trustees receive remuneration for their services to the Fund out of the investment adviser fee. Certain officers and Trustees of the Fund and the Portfolios are officers of the above organizations.
4 Distribution Plans
The Fund has in effect distribution plans for the Advisers Class shares (Advisers Plan) and Class A shares (Class A Plan) pursuant to Rule 12b-1 under the 1940 Act. The Advisers Plan and Class A Plan provide that the Fund will pay EVD a distribution and service fee of 0.25% per annum of its average daily net assets attributable to Advisers Class shares and Class A shares for distribution services and facilities provided to the Fund by EVD, as well as for personal services and/or the maintenance of shareholder accounts. Distribution and service fees paid or accrued to EVD for the year ended October 31, 2008 amounted to $748,547 and $585,886 for Advisers Class shares and Class A shares, respectively.
The Fund also has in effect distribution plans for Class B shares (Class B Plan) and Class C shares (Class C Plan) pursuant to Rule 12b-1 under the 1940 Act. The Class B and Class C Plans require the Fund to pay EVD amounts equal to 0.75% per annum of its average daily net assets attributable to Class B and Class C shares for providing ongoing distribution services and facilities to the Fund. The Fund will automatically discontinue payments to EVD during any period in which there are no outstanding Uncovered Distribution Charges, which are equivalent to the sum of (i) 6.25% of the aggregate amount received by the Fund for Class B and Class C shares sold, plus (ii) interest calculated by applying the rate of 1% over the prevailing prime rate to the outstanding balance of Uncovered Distribution Charges of EVD of each respective class, reduced by the aggregate amount of contingent deferred sales charges (see Note 5) and amounts the retofore paid or payable to EVD by each respective class. For the year ended October 31, 2008, the Fund paid or accrued to EVD $568,851 and $2,125,071 for Class B and Class C shares, respectively, representing 0.75% of the average daily net assets of Class B and Class C shares. At October 31, 2008, the amounts of Uncovered Distribution Charges of EVD calculated under the Class B and Class C Plans were approximately $6,873,000 and $60,284,000, respectively.
The Class B and Class C Plans also authorize the Fund to make payments of service fees to EVD, investment dealers and other persons in amounts not exceeding 0.25% per annum of its average daily net assets attributable to that class. Service fees paid or accrued are for personal services and/or the maintenance of shareholder accounts. They are separate and distinct from the sales commissions and distribution fees payable to EVD and, as such, are not subject to automatic discontinuance when there are no outstanding Uncovered Distribution Charges of EVD. Service fees paid or accrued for the year ended October 31, 2008 amounted to $189,617 and $708,357 for Class B and Class C shares, respectively.
5 Contingent Deferred Sales Charges
A contingent deferred sales charge (CDSC) generally is imposed on redemptions of Class B shares made within six years of purchase and on redemptions of Class C shares made within one year of purchase. Class A shares may be subject to a 1% CDSC if redeemed within 18 months of purchase (depending on the circumstances of purchase). Generally, the CDSC is based upon the lower of the net asset value at date of redemption or date of purchase. No charge is levied on shares acquired by reinvestment of dividends or capital gain distributions. The CDSC for Class B shares is imposed at declining rates that begin at 5% in the case of redemptions in the first and second year after purchase, declining one percentage point each subsequent year. Class C shares are subject to a 1% CDSC if redeemed within one year of purchase. No CDSC is levied on shares which have been sold to EVM or its affiliates or to their respective employees or clients and may be waived under certain other limited conditions. CDSCs received on Class B and Class C redemptions are paid to EVD to reduce the amount of Uncovered Distribution Charges calculated under the Fund's Class B and Class C Plans. CDSCs received on Class B and Class C redemptions when no Uncovered Distribution Charges exist are credited to the Fund. For the year ended October 31, 2008, the Fund was informed that EVD received approximately $52,000, $179,000 and $77,000 of CDSCs paid by Class A, Class B and Class C shareholders, respectively.
15
Eaton Vance Floating-Rate & High Income Fund as of October 31, 2008
NOTES TO FINANCIAL STATEMENTS CONT'D
6 Investment Transactions
For the year ended October 31, 2008, increases and decreases in the Fund's investment in the Portfolios were as follows:
| Portfolio | | Contributions | | Withdrawals | |
| Floating Rate Portfolio | | $ | 66,305,463 | | | $ | 622,936,646 | | |
| High Income Opportunities Portfolio | | | 8,146,568 | | | | 64,892,721 | | |
7 Shares of Beneficial Interest
The Fund's Declaration of Trust permits the Trustees to issue an unlimited number of full and fractional shares of beneficial interest (without par value). Such shares may be issued in a number of different series (such as the Fund) and classes. Transactions in Fund shares were as follows:
| | | Year Ended October 31, | |
| Advisers Class | | 2008 | | 2007 | |
| Sales | | | 24,724,387 | | | | 25,043,537 | | |
Issued to shareholders electing to
receive payments of distributions
in Fund shares | | | 1,670,279 | | | | 3,732,446 | | |
| Redemptions | | | (53,470,270 | ) | | | (66,005,435 | ) | |
| Net decrease | | | (27,075,604 | ) | | | (37,229,452 | ) | |
| | | Year Ended October 31, | |
| Class A | | 2008 | | 2007 | |
| Sales | | | 5,204,117 | | | | 19,612,371 | | |
Issued to shareholders electing to
receive payments of distributions
in Fund shares | | | 1,177,545 | | | | 2,154,666 | | |
| Redemptions | | | (23,010,207 | ) | | | (27,776,573 | ) | |
| Exchange from Class B shares | | | 660,099 | | | | 846,108 | | |
| Net decrease | | | (15,968,446 | ) | | | (5,163,428 | ) | |
| | | Year Ended October 31, | |
| Class B | | 2008 | | 2007 | |
| Sales | | | 153,715 | | | | 696,021 | | |
Issued to shareholders electing to
receive payments of distributions
in Fund shares | | | 308,743 | | | | 474,554 | | |
| Redemptions | | | (3,497,541 | ) | | | (3,571,307 | ) | |
| Exchange to Class A shares | | | (701,040 | ) | | | (898,341 | ) | |
| Net decrease | | | (3,736,123 | ) | | | (3,299,073 | ) | |
| | | Year Ended October 31, | |
| Class C | | 2008 | | 2007 | |
| Sales | | | 2,434,136 | | | | 7,563,793 | | |
Issued to shareholders electing to
receive payments of distributions
in Fund shares | | | 1,217,278 | | | | 1,837,128 | | |
| Redemptions | | | (18,115,003 | ) | | | (14,914,690 | ) | |
| Net decrease | | | (14,463,589 | ) | | | (5,513,769 | ) | |
| | | Year Ended October 31, | |
| Class I | | 2008 | | 2007 | |
| Sales | | | 2,760,229 | | | | 3,613,919 | | |
Issued to shareholders electing to
receive payments of distributions
in Fund shares | | | 165,871 | | | | 274,759 | | |
| Redemptions | | | (3,889,273 | ) | | | (5,307,693 | ) | |
| Net decrease | | | (963,173 | ) | | | (1,419,015 | ) | |
For the years ended October 31, 2008 and October 31, 2007, the Fund received $791,757 and $138,956, respectively, in redemption fees.
8 Recently Issued Accounting Pronouncement
In September 2006, the Financial Accounting Standards Board (FASB) issued Statement of Financial Accounting Standards No. 157 (FAS 157), "Fair Value Measurements". FAS 157 defines fair value, establishes a framework for measuring fair value in accordance with accounting principles generally accepted in the United States of America and expands disclosure about fair value measurements. FAS 157 is effective for fiscal years beginning after November 15, 2007. As of October 31, 2008, management does not believe the adoption of FAS 157 will impact the amounts reported in the financial statements; however, additional disclosures may be required about the inputs used to develop the measurements of fair value and the effect of certain of the measurements on changes in net assets for the period.
16
Eaton Vance Floating-Rate & High Income Fund as of October 31, 2008
REPORT OF INDEPENDENT REGISTERED PUBLIC ACCOUNTING FIRM
To the Trustees of Eaton Vance Mutual Funds Trust and Shareholders of Eaton Vance Floating-Rate & High Income Fund:
We have audited the accompanying statement of assets and liabilities of Eaton Vance Floating-Rate & High Income Fund (the "Fund") (one of the series of Eaton Vance Mutual Funds Trust) as of October 31, 2008, and the related statement of operations for the year then ended, the statements of changes in net assets for each of the two years in the period then ended and the financial highlights for each of the five years in the period then ended. These financial statements and financial highlights are the responsibility of the Fund's management. Our responsibility is to express an opinion on these financial statements and financial highlights based on our audits.
We conducted our audits in accordance with the standards of the Public Company Accounting Oversight Board (United States). Those standards require that we plan and perform the audit to obtain reasonable assurance about whether the financial statements and financial highlights are free of material misstatement. The Fund is not required to have, nor were we engaged to perform, an audit of its internal control over financial reporting. Our audits included consideration of internal control over financial reporting as a basis for designing audit procedures that are appropriate in the circumstances, but not for the purpose of expressing an opinion on the effectiveness of the Fund's internal control over financial reporting. Accordingly, we express no such opinion. An audit also includes examining, on a test basis, evidence supporting the amounts and disclosures in the financial statements, assessing the accounting principles used and significant estimates made by management, as well as evaluating the overall financial statement presentation. Our procedures included confirmation of securities and senior loans owned as of October 31, 2008, by correspondence with the custodian, brokers, and selling agent banks; where replies were not received from brokers and selling agent banks, we performed other auditing procedures. We believe that our audits provide a reasonable basis for our opinion.
In our opinion, the financial statements and financial highlights referred to above present fairly, in all material respects, the financial position of Eaton Vance Floating-Rate & High Income Fund as of October 31, 2008, the results of its operations for the year then ended, the changes in its net assets for each of the two years in the period then ended, and the financial highlights for each of the five years in the period then ended, in conformity with accounting principles generally accepted in the United States of America.
DELOITTE & TOUCHE LLP
Boston, Massachusetts
December 18, 2008
17
Eaton Vance Floating-Rate & High Income Fund as of October 31, 2008
FEDERAL TAX INFORMATION (Unaudited)
The Form 1099-DIV you receive in January 2009 will show the tax status of all distributions paid to your account in calendar 2008. Shareholders are advised to consult their own tax adviser with respect to the tax consequences of their investment in the Fund.
Qualified Dividend Income. The Fund designates $77,303, or up to the maximum amount of such dividends allowable pursuant to the Internal Revenue Code, as qualified dividend income eligible for the reduced tax rate of 15%.
18
Floating Rate Portfolio as of October 31, 2008
PORTFOLIO OF INVESTMENTS
| Senior Floating-Rate Interests — 100.3%(1) | | | |
Principal
Amount* | | Borrower/Tranche Description | | Value | |
| Aerospace and Defense — 2.1% | | | |
| AWAS Capital, Inc. | | | |
| | 7,524,143 | | | Term Loan, 5.00%, Maturing March 22, 2013 | | $ | 5,379,763 | | |
| CACI International, Inc. | | | |
| | 5,021,774 | | | Term Loan, 5.18%, Maturing May 3, 2011 | | | 4,306,172 | | |
| DAE Aviation Holdings, Inc. | | | |
| | 567,742 | | | Term Loan, 7.17%, Maturing July 31, 2014 | | | 422,968 | | |
| | 574,468 | | | Term Loan, 7.37%, Maturing July 31, 2014 | | | 427,979 | | |
| Evergreen International Aviation | | | |
| | 6,545,389 | | | Term Loan, 9.00%, Maturing October 31, 2011 | | | 4,990,859 | | |
| Hawker Beechcraft Acquisition | | | |
| | 849,135 | | | Term Loan, 5.76%, Maturing March 26, 2014 | | | 551,331 | | |
| | 12,517,665 | | | Term Loan, 5.76%, Maturing March 26, 2014 | | | 8,127,544 | | |
| Hexcel Corp. | | | |
| | 6,128,722 | | | Term Loan, 5.25%, Maturing March 1, 2012 | | | 5,454,562 | | |
| IAP Worldwide Services, Inc. | | | |
| | 3,304,190 | | | Term Loan, 9.06%, Maturing December 30, 2012 | | | 2,213,807 | | |
| Jet Aviation Holding, AG | | | |
| | 2,641,059 | | | Term Loan, 3.16%, Maturing May 15, 2013 | | | 2,231,695 | | |
| PGS Solutions, Inc. | | | |
| | 1,919,717 | | | Term Loan, 4.82%, Maturing February 14, 2013 | | | 1,401,393 | | |
| Spirit AeroSystems, Inc. | | | |
| | 3,787,083 | | | Term Loan, 6.50%, Maturing December 31, 2011 | | | 3,228,488 | | |
| TransDigm, Inc. | | | |
| | 9,650,000 | | | Term Loan, 5.21%, Maturing June 23, 2013 | | | 7,394,312 | | |
| Vought Aircraft Industries, Inc. | | | |
| | 10,000,000 | | | Revolving Loan, 0.00%, Maturing December 22, 2009(2) | | | 8,850,000 | | |
| | 4,905,750 | | | Term Loan, 5.62%, Maturing December 17, 2011 | | | 3,900,071 | | |
| | 4,000,000 | | | Term Loan, 6.42%, Maturing December 17, 2011 | | | 3,000,000 | | |
| | 1,995,300 | | | Term Loan, 7.50%, Maturing December 22, 2011 | | | 1,636,146 | | |
| | | | | | | $ | 63,517,090 | | |
| Air Transport — 0.6% | | | |
| Delta Air Lines, Inc. | | | |
| | 8,514,000 | | | Term loan, 5.36%, Maturing April 30, 2012 | | $ | 6,027,912 | | |
| | 5,472,292 | | | Term Loan - Second Lien, 6.25%,
Maturing April 30, 2014 | | | 3,146,568 | | |
| Northwest Airlines, Inc. | | | |
| | 11,758,158 | | | DIP Loan, 5.00%, Maturing August 21, 2009 | | | 9,568,201 | | |
| | | | | | | $ | 18,742,681 | | |
Principal
Amount* | | Borrower/Tranche Description | | Value | |
| Automotive — 3.9% | | | |
| Accuride Corp. | | | |
| | 8,954,274 | | | Term Loan, 7.31%, Maturing January 31, 2012 | | $ | 6,782,862 | | |
| Adesa, Inc. | | | |
| | 21,183,104 | | | Term Loan, 6.02%, Maturing October 18, 2013 | | | 14,104,409 | | |
| Allison Transmission, Inc. | | | |
| | 7,767,399 | | | Term Loan, 5.67%, Maturing September 30, 2014 | | | 5,334,541 | | |
| Chrysler Financial | | | |
| | 4,488,665 | | | Term Loan, 6.82%, Maturing August 1, 2014 | | | 3,078,475 | | |
| CSA Acquisition Corp. | | | |
| | 1,916,590 | | | Term Loan, 6.31%, Maturing December 23, 2011 | | | 1,336,822 | | |
| | 2,594,944 | | | Term Loan, 6.31%, Maturing December 23, 2011 | | | 1,809,973 | | |
| | 2,322,692 | | | Term Loan, 6.31%, Maturing December 23, 2012 | | | 1,707,179 | | |
| Dayco Products, LLC | | | |
| | 8,280,322 | | | Term Loan, 8.01%, Maturing June 21, 2011 | | | 2,815,309 | | |
| Federal-Mogul Corp. | | | |
| | 10,002,591 | | | Term Loan, 5.48%, Maturing December 27, 2014 | | | 6,089,078 | | |
| | 7,914,683 | | | Term Loan, 6.12%, Maturing December 27, 2015 | | | 4,818,063 | | |
| Financiere Truck (Investissement) | | | |
| EUR | 1,110,579 | | | Term Loan, 6.97%, Maturing February 15, 2012 | | | 969,610 | | |
| Ford Motor Co. | | | |
| | 10,000,000 | | | Revolving Loan, 0.00%, Maturing December 15, 2013(2) | | | 5,033,330 | | |
| | 7,034,465 | | | Term Loan, 7.59%, Maturing December 15, 2013 | | | 3,909,151 | | |
| Fraikin, Ltd. | | | |
| GBP | 1,392,962 | | | Term Loan, 8.13%, Maturing February 15, 2012(2) | | | 1,479,564 | | |
| GBP | 1,612,016 | | | Term Loan, 8.27%, Maturing February 15, 2012(2) | | | 1,712,236 | | |
| General Motors Corp. | | | |
| | 17,380,911 | | | Term Loan, 5.80%, Maturing November 29, 2013 | | | 9,611,644 | | |
| Goodyear Tire & Rubber Co. | | | |
| | 16,755,707 | | | Term Loan - Second Lien, 4.78%, Maturing April 30, 2010 | | | 11,924,484 | | |
| HLI Operating Co., Inc. | | | |
| EUR | 425,455 | | | Term Loan, 4.87%, Maturing May 30, 2014 | | | 466,346 | | |
| EUR | 7,282,364 | | | Term Loan, 7.67%, Maturing May 30, 2014 | | | 7,239,755 | | |
| Keystone Automotive Operations, Inc. | | | |
| | 6,911,631 | | | Term Loan, 6.78%, Maturing January 12, 2012 | | | 3,974,188 | | |
| Locafroid Services S.A.S. | | | |
| EUR | 1,666,405 | | | Term Loan, 7.30%, Maturing February 15, 2012(2) | | | 1,454,883 | | |
| Speedy 1, Ltd. | | | |
| EUR | 6,457,254 | | | Term Loan, 6.76%, Maturing August 31, 2013 | | | 3,312,613 | | |
| Tenneco Automotive, Inc. | | | |
| | 5,050,000 | | | Term Loan, 5.50%, Maturing March 17, 2014 | | | 3,939,000 | | |
| TriMas Corp. | | | |
| | 893,750 | | | Term Loan, 4.88%, Maturing August 2, 2011 | | | 679,250 | | |
| | 8,042,125 | | | Term Loan, 5.63%, Maturing August 2, 2013 | | | 6,112,015 | | |
| TRW Automotive, Inc. | | | |
| | 6,638,326 | | | Term Loan, 5.21%, Maturing February 2, 2014 | | | 5,233,211 | | |
See notes to financial statements
19
Floating Rate Portfolio as of October 31, 2008
PORTFOLIO OF INVESTMENTS CONT'D
Principal
Amount* | | Borrower/Tranche Description | | Value | |
| Automotive (continued) | | | |
| United Components, Inc. | | | |
| | 7,501,299 | | | Term Loan, 4.81%, Maturing June 30, 2010 | | $ | 5,710,364 | | |
| | | | | | | $ | 120,638,355 | | |
| Beverage and Tobacco — 0.4% | | | |
| Culligan International Co. | | | |
| | 17,232,550 | | | Term Loan, 5.76%, Maturing November 24, 2014 | | $ | 10,554,937 | | |
| Van Houtte, Inc. | | | |
| | 860,266 | | | Term Loan, 6.26%, Maturing July 11, 2014 | | | 696,816 | | |
| | 117,309 | | | Term Loan, 6.26%, Maturing July 11, 2014 | | | 95,020 | | |
| | | | | | | $ | 11,346,773 | | |
| Brokers, Dealers and Investment Houses — 0.3% | | | |
| AmeriTrade Holding Corp. | | | |
| | 10,350,931 | | | Term Loan, 4.50%, Maturing December 31, 2012 | | $ | 8,655,966 | | |
| | | | | | | $ | 8,655,966 | | |
| Building and Development — 5.2% | | | |
| 401 North Wabash Venture, LLC | | | |
| | 6,495,771 | | | Term Loan, 4.95%, Maturing May 7, 2009(2) | | $ | 4,871,828 | | |
| AIMCO Properties, L.P. | | | |
| | 10,718,750 | | | Term Loan, 5.43%, Maturing March 23, 2011 | | | 9,271,719 | | |
| Banning Lewis Ranch Co., LLC | | | |
| | 13,000,000 | | | Term Loan, 4.68%, Maturing December 3, 2012(2) | | | 12,090,000 | | |
| Beacon Sales Acquisition, Inc. | | | |
| | 4,473,601 | | | Term Loan, 6.02%, Maturing September 30, 2013 | | | 3,355,201 | | |
| Brickman Group Holdings, Inc. | | | |
| | 4,927,469 | | | Term Loan, 5.12%, Maturing January 23, 2014 | | | 3,868,063 | | |
| Building Materials Corp. of America | | | |
| | 8,153,576 | | | Term Loan, 6.62%, Maturing February 22, 2014 | | | 5,691,196 | | |
| Capital Automotive (REIT) | | | |
| | 4,788,753 | | | Term Loan, 5.47%, Maturing December 16, 2010 | | | 3,050,436 | | |
| Contech Construction Products | | | |
| | 1,821,954 | | | Term Loan, 5.00%, Maturing January 13, 2013 | | | 1,216,154 | | |
| Epco/Fantome, LLC | | | |
| | 9,890,000 | | | Term Loan, 5.80%, Maturing November 23, 2010 | | | 9,296,600 | | |
| Financiere Daunou S.A. | | | |
| | 1,664,521 | | | Term Loan, 5.89%, Maturing May 31, 2015 | | | 602,002 | | |
| EUR | 1,067,260 | | | Term Loan, 7.27%, Maturing May 31, 2015 | | | 508,160 | | |
| EUR | 2,613,290 | | | Term Loan, 7.27%, Maturing May 31, 2015 | | | 1,244,279 | | |
| | 2,452,266 | | | Term Loan, 6.14%, Maturing February 28, 2016 | | | 886,904 | | |
| EUR | 1,246,799 | | | Term Loan, 7.52%, Maturing February 28, 2016 | | | 593,645 | | |
| EUR | 2,423,776 | | | Term Loan, 7.52%, Maturing February 28, 2016 | | | 1,154,044 | | |
Principal
Amount* | | Borrower/Tranche Description | | Value | |
| Building and Development (continued) | | | |
| Forestar USA Real Estate Group, Inc. | | | |
| | 10,625,000 | | | Revolving Loan, 5.97%, Maturing December 1, 2010(2) | | $ | 9,987,500 | | |
| | 5,625,000 | | | Term Loan, 7.48%, Maturing December 1, 2010 | | | 5,512,500 | | |
| General Growth Properties, Inc. | | | |
| | 3,782,895 | | | Term Loan, 5.74%, Maturing February 24, 2011 | | | 1,369,949 | | |
| Hearthstone Housing Partners II, LLC | | | |
| | 13,040,000 | | | Revolving Loan, 5.92%, Maturing December 1, 2009(2) | | | 8,083,496 | | |
| Hovstone Holdings, LLC | | | |
| | 4,260,000 | | | Term Loan, 6.25%, Maturing February 28, 2009 | | | 2,796,264 | | |
| LNR Property Corp. | | | |
| | 9,154,000 | | | Term Loan, 6.04%, Maturing July 3, 2011 | | | 5,011,815 | | |
| Mueller Water Products, Inc. | | | |
| | 8,856,431 | | | Term Loan, 5.22%, Maturing May 24, 2014 | | | 6,819,452 | | |
| NCI Building Systems, Inc. | | | |
| | 5,975,136 | | | Term Loan, 5.42%, Maturing June 18, 2010 | | | 5,078,866 | | |
| November 2005 Land Investors | | | |
| | 608,296 | | | Term Loan, 7.12%, Maturing May 9, 2011 | | | 441,015 | | |
| Panolam Industries Holdings, Inc. | | | |
| | 2,925,967 | | | Term Loan, 6.51%, Maturing September 30, 2012 | | | 2,516,332 | | |
| Realogy Corp. | | | |
| | 10,357,871 | | | Term Loan, 6.50%, Maturing September 1, 2014 | | | 6,663,560 | | |
| | 2,788,658 | | | Term Loan, 6.50%, Maturing September 1, 2014 | | | 1,794,036 | | |
| Shea Capital I, LLC | | | |
| | 293,787 | | | Term Loan, 5.25%, Maturing October 27, 2011 | | | 146,893 | | |
| South Edge, LLC | | | |
| | 8,794,643 | �� | | Term Loan, 6.25%, Maturing October 31, 2009(5) | | | 1,429,129 | | |
| Standard Pacific Corp. | | | |
| | 4,680,000 | | | Term Loan, 4.56%, Maturing May 5, 2013 | | | 3,096,602 | | |
| TRU 2005 RE Holding Co. | | | |
| | 19,825,000 | | | Term Loan, 6.72%, Maturing December 9, 2008 | | | 14,488,764 | | |
| United Subcontractors, Inc. | | | |
| | 5,959,915 | | | Term Loan - Second Lien, 12.42%,
Maturing June 27, 2013(3) | | | 2,264,768 | | |
| WCI Communities, Inc. | | | |
| | 18,240,601 | | | Term Loan, 8.97%, Maturing December 23, 2010 | | | 13,619,655 | | |
| Wintergames Acquisition ULC | | | |
| | 12,929,530 | | | Term Loan, 10.74%, Maturing April 24, 2009 | | | 9,566,559 | | |
| | | | | | | $ | 158,387,386 | | |
| Business Equipment and Services — 7.1% | | | |
| ACCO Brands Corp. | | | |
| | 5,207,841 | | | Term Loan, 5.21%, Maturing August 17, 2012 | | $ | 3,645,489 | | |
| Activant Solutions, Inc. | | | |
| | 5,191,577 | | | Term Loan, 6.07%, Maturing May 1, 2013 | | | 3,478,357 | | |
| Acxiom Corp. | | | |
| | 9,700,525 | | | Term Loan, 4.94%, Maturing September 15, 2012 | | | 7,081,383 | | |
See notes to financial statements
20
Floating Rate Portfolio as of October 31, 2008
PORTFOLIO OF INVESTMENTS CONT'D
Principal
Amount* | | Borrower/Tranche Description | | Value | |
| Business Equipment and Services (continued) | | | |
| Affiliated Computer Services | | | |
| | 5,932,250 | | | Term Loan, 5.26%, Maturing March 20, 2013 | | $ | 5,023,874 | | |
| | 12,794,582 | | | Term Loan, 5.81%, Maturing March 20, 2013 | | | 10,835,411 | | |
| Affinion Group, Inc. | | | |
| | 8,935,792 | | | Term Loan, 5.32%, Maturing October 17, 2012 | | | 7,126,294 | | |
| Education Management, LLC | | | |
| | 11,421,119 | | | Term Loan, 5.56%, Maturing June 1, 2013 | | | 8,051,889 | | |
| Info USA, Inc. | | | |
| | 1,965,000 | | | Term Loan, 5.77%, Maturing February 14, 2012 | | | 1,729,200 | | |
| | 4,328,404 | | | Term Loan, 5.77%, Maturing February 14, 2012 | | | 3,808,995 | | |
| Information Resources, Inc. | | | |
| | 5,571,512 | | | Term Loan, 4.56%, Maturing May 7, 2014 | | | 3,927,916 | | |
| Intergraph Corp. | | | |
| | 3,349,524 | | | Term Loan, 4.81%, Maturing May 29, 2014 | | | 2,612,629 | | |
| iPayment, Inc. | | | |
| | 11,245,967 | | | Term Loan, 5.70%, Maturing May 10, 2013 | | | 8,715,624 | | |
| ista International GmbH | | | |
| EUR | 9,635,715 | | | Term Loan, 7.12%, Maturing May 14, 2015 | | | 7,077,042 | | |
| EUR | 1,914,285 | | | Term Loan, 7.12%, Maturing May 14, 2015 | | | 1,405,964 | | |
| Kronos, Inc. | | | |
| | 8,796,248 | | | Term Loan, 6.01%, Maturing June 11, 2014 | | | 6,025,430 | | |
| Language Line, Inc. | | | |
| | 6,778,210 | | | Term Loan, 7.02%, Maturing June 11, 2011 | | | 5,727,587 | | |
| N.E.W. Holdings I, LLC | | | |
| | 9,531,466 | | | Term Loan, 5.89%, Maturing May 22, 2014 | | | 7,363,058 | | |
| Protection One, Inc. | | | |
| | 9,223,166 | | | Term Loan, 5.42%, Maturing March 31, 2012 | | | 7,470,764 | | |
| Quintiles Transnational Corp. | | | |
| | 11,133,433 | | | Term Loan, 5.77%, Maturing March 31, 2013 | | | 8,990,247 | | |
| Sabre, Inc. | | | |
| | 30,769,734 | | | Term Loan, 5.25%, Maturing September 30, 2014 | | | 17,829,338 | | |
| Safenet, Inc. | | | |
| | 3,950,000 | | | Term Loan, 7.75%, Maturing April 12, 2014 | | | 2,271,250 | | |
| Serena Software, Inc. | | | |
| | 2,592,464 | | | Term Loan, 5.50%, Maturing March 10, 2013 | | | 2,236,000 | | |
| Sitel (Client Logic) | | | |
| | 4,865,854 | | | Term Loan, 6.51%, Maturing January 29, 2014 | | | 2,919,512 | | |
| EUR | 941,032 | | | Term Loan, 7.33%, Maturing January 29, 2014 | | | 845,572 | | |
| Solera Holdings, LLC | | | |
| EUR | 2,999,467 | | | Term Loan, 6.70%, Maturing May 15, 2014 | | | 2,867,228 | | |
| Solera Nederland Holdings | | | |
| | 3,793,852 | | | Term Loan, 4.57%, Maturing May 15, 2014 | | | 2,997,143 | | |
| SunGard Data Systems, Inc. | | | |
| | 37,459,070 | | | Term Loan, 4.55%, Maturing February 11, 2013 | | | 28,870,230 | | |
| | 3,475,000 | | | Term Loan, 6.75%, Maturing February 28, 2014 | | | 2,988,500 | | |
Principal
Amount* | | Borrower/Tranche Description | | Value | |
| Business Equipment and Services (continued) | | | |
| TDS Investor Corp. | | | |
| | 10,862,500 | | | Term Loan, 5.37%, Maturing August 23, 2013 | | $ | 6,626,125 | | |
| | 13,317,413 | | | Term Loan, 6.01%, Maturing August 23, 2013 | | | 8,275,826 | | |
| | 2,672,147 | | | Term Loan, 6.01%, Maturing August 23, 2013 | | | 1,660,549 | | |
| EUR | 2,105,820 | | | Term Loan, 7.39%, Maturing August 23, 2013 | | | 1,690,903 | | |
| Transaction Network Services, Inc. | | | |
| | 4,843,693 | | | Term Loan, 4.80%, Maturing May 4, 2012 | | | 4,177,685 | | |
| Valassis Communications, Inc. | | | |
| | 743,929 | | | Term Loan, 5.52%, Maturing March 2, 2014 | | | 523,230 | | |
| | 4,409,895 | | | Term Loan, 5.52%, Maturing March 2, 2014 | | | 3,101,625 | | |
| VWR International, Inc. | | | |
| | 7,725,000 | | | Term Loan, 5.67%, Maturing June 28, 2013 | | | 5,394,622 | | |
| West Corp. | | | |
| | 17,833,643 | | | Term Loan, 5.73%, Maturing October 24, 2013 | | | 11,547,284 | | |
| | | | | | | $ | 216,919,775 | | |
| Cable and Satellite Television — 7.0% | | | |
| Atlantic Broadband Finance, LLC | | | |
| | 9,853,155 | | | Term Loan, 6.02%, Maturing February 10, 2011 | | $ | 9,015,637 | | |
| Bresnan Broadband Holdings, LLC | | | |
| | 15,551,500 | | | Term Loan, 4.86%, Maturing March 29, 2014 | | | 12,337,518 | | |
| | 1,500,000 | | | Term Loan, 6.06%, Maturing March 29, 2014 | | | 1,189,999 | | |
| Cequel Communications, LLC | | | |
| | 31,019,697 | | | Term Loan, 6.21%, Maturing November 5, 2013 | | | 23,001,974 | | |
| Charter Communications Operating, Inc. | | | |
| | 43,138,319 | | | Term Loan, 5.31%, Maturing April 28, 2013 | | | 32,481,817 | | |
| CSC Holdings, Inc. | | | |
| | 14,920,013 | | | Term Loan, 4.57%, Maturing March 29, 2013 | | | 12,969,758 | | |
| DirectTV Holdings, LLC | | | |
| | 1,995,000 | | | Term Loan, 5.31%, Maturing April 13, 2013 | | | 1,827,919 | | |
| Foxco Acquistion Sub., LLC | | | |
| | 3,075,000 | | | Term Loan, 7.25%, Maturing July 2, 2015 | | | 2,429,250 | | |
| Insight Midwest Holdings, LLC | | | |
| | 25,316,250 | | | Term Loan, 5.93%, Maturing April 6, 2014 | | | 20,042,040 | | |
| Kabel BW GmbH & Co. KG | | | |
| EUR | 1,490,959 | | | Term Loan, 6.75%, Maturing June 9, 2012 | | | 1,401,472 | | |
| MCC Iowa, LLC | | | |
| | 1,073,250 | | | Term Loan, 3.64%, Maturing March 31, 2010 | | | 931,044 | | |
| Mediacom Broadband Group | | | |
| | 7,734,489 | | | Term Loan, 3.89%, Maturing January 31, 2015 | | | 5,626,841 | | |
| | 7,860,000 | | | Term Loan, 3.89%, Maturing January 31, 2015 | | | 5,718,150 | | |
| Mediacom Illinois, LLC | | | |
| | 1,850,000 | | | Term Loan, 2.12%, Maturing September 30, 2012 | | | 1,341,250 | | |
| | 14,321,388 | | | Term Loan, 3.64%, Maturing January 31, 2015 | | | 10,299,470 | | |
See notes to financial statements
21
Floating Rate Portfolio as of October 31, 2008
PORTFOLIO OF INVESTMENTS CONT'D
Principal
Amount* | | Borrower/Tranche Description | | Value | |
| Cable and Satellite Television (continued) | | | |
| NTL Investment Holdings, Ltd. | | | |
| | 7,993,878 | | | Term Loan, 5.83%, Maturing March 30, 2012 | | $ | 5,535,761 | | |
| GBP | 2,139,186 | | | Term Loan, 8.13%, Maturing March 30, 2012 | | | 2,308,174 | | |
| GBP | 1,990,985 | | | Term Loan, 8.13%, Maturing March 30, 2012 | | | 2,148,266 | | |
| GBP | 3,637,947 | | | Term Loan, 8.15%, Maturing March 30, 2012 | | | 3,925,333 | | |
| GBP | 2,224,230 | | | Term Loan, 8.15%, Maturing March 30, 2012 | | | 2,399,937 | | |
| GBP | 3,500,000 | | | Term Loan, 8.74%, Maturing March 30, 2013 | | | 3,360,861 | | |
| ProSiebenSat.1 Media AG | | | |
| EUR | 2,019,706 | | | Term Loan, 7.53%, Maturing March 2, 2015 | | | 643,554 | | |
| EUR | 600,197 | | | Term Loan, 6.85%, Maturing June 26, 2015 | | | 416,198 | | |
| EUR | 12,586,345 | | | Term Loan, 6.85%, Maturing June 26, 2015 | | | 8,727,818 | | |
| EUR | 2,019,706 | | | Term Loan, 7.78%, Maturing March 2, 2016 | | | 643,554 | | |
| UPC Broadband Holding B.V. | | | |
| EUR | 6,617,448 | | | Term Loan, 7.01%, Maturing October 16, 2011 | | | 5,622,848 | | |
| EUR | 14,937,387 | | | Term Loan, 7.01%, Maturing October 16, 2011 | | | 12,692,304 | | |
| | 10,925,000 | | | Term Loan, 5.47%, Maturing December 31, 2014 | | | 7,838,687 | | |
| YPSO Holding SA | | | |
| EUR | 12,899,564 | | | Term Loan, 7.00%, Maturing July 28, 2014 | | | 8,117,812 | | |
| EUR | 4,978,165 | | | Term Loan, 7.00%, Maturing July 28, 2014 | | | 3,132,805 | | |
| EUR | 8,122,271 | | | Term Loan, 7.00%, Maturing July 28, 2014 | | | 5,111,419 | | |
| | | | | | | $ | 213,239,470 | | |
| Chemicals and Plastics — 6.2% | | | |
| Arizona Chemical, Inc. | | | |
| EUR | 2,842,826 | | | Term Loan, 7.21%, Maturing February 28, 2013 | | $ | 2,581,618 | | |
| Brenntag Holding GmbH and Co. KG | | | |
| | 1,963,636 | | | Term Loan, 5.07%, Maturing December 23, 2013 | | | 1,364,727 | | |
| | 8,036,364 | | | Term Loan, 5.07%, Maturing December 23, 2013 | | | 5,585,273 | | |
| EUR | 3,511,248 | | | Term Loan, 7.14%, Maturing December 23, 2013 | | | 3,442,223 | | |
| EUR | 845,455 | | | Term Loan, 7.16%, Maturing December 23, 2013 | | | 828,834 | | |
| EUR | 654,545 | | | Term Loan, 7.16%, Maturing December 23, 2013 | | | 641,678 | | |
| EUR | 525,062 | | | Term Loan, 7.39%, Maturing December 23, 2014 | | | 514,741 | | |
| EUR | 963,689 | | | Term Loan, 7.39%, Maturing December 23, 2014 | | | 944,745 | | |
| EUR | 770,053 | | | Term Loan - Second Lien, 9.42%, Maturing June 23, 2015 | | | 621,598 | | |
| EUR | 229,947 | | | Term Loan - Second Lien, 9.42%, Maturing June 23, 2015 | | | 185,616 | | |
| Celanese Holdings, LLC | | | |
| EUR | 987,500 | | | Term Loan, 6.78%, Maturing April 6, 2011 | | | 948,159 | | |
| | 7,000,000 | | | Term Loan, 4.35%, Maturing April 2, 2014 | | | 5,689,999 | | |
| | 14,488,087 | | | Term Loan, 5.55%, Maturing April 2, 2014 | | | 11,776,743 | | |
| Cognis GmbH | | | |
| EUR | 6,426,230 | | | Term Loan, 6.96%, Maturing September 15, 2013 | | | 5,168,238 | | |
| EUR | 1,573,770 | | | Term Loan, 6.96%, Maturing September 15, 2013 | | | 1,265,691 | | |
| Columbian Chemicals Acquisition | | | |
| | 4,103,418 | | | Term Loan, 7.01%, Maturing March 16, 2013 | | | 2,708,256 | | |
Principal
Amount* | | Borrower/Tranche Description | | Value | |
| Chemicals and Plastics (continued) | | | |
| Ferro Corp. | | | |
| | 13,662,500 | | | Term Loan, 5.81%, Maturing June 6, 2012 | | $ | 12,432,875 | | |
| First Chemical Holding | | | |
| EUR | 624,358 | | | Term Loan, 7.66%, Maturing December 18, 2014 | | | 560,027 | | |
| EUR | 624,358 | | | Term Loan, 8.16%, Maturing December 18, 2015 | | | 560,027 | | |
| Foamex, L.P. | | | |
| | 3,673,125 | | | Term Loan, 8.04%, Maturing February 12, 2013 | | | 1,698,820 | | |
| Georgia Gulf Corp. | | | |
| | 5,112,496 | | | Term Loan, 9.05%, Maturing October 3, 2013 | | | 4,095,109 | | |
| Hexion Specialty Chemicals, Inc. | | | |
| EUR | 1,116,324 | | | Term Loan, 7.39%, Maturing May 5, 2012 | | | 917,713 | | |
| | 9,700,000 | | | Term Loan, 4.70%, Maturing May 5, 2013 | | | 6,749,580 | | |
| | 2,507,020 | | | Term Loan, 5.06%, Maturing May 5, 2013 | | | 1,744,468 | | |
| | 3,326,375 | | | Term Loan, 6.06%, Maturing May 5, 2013 | | | 2,314,602 | | |
| | 15,315,090 | | | Term Loan, 6.19%, Maturing May 5, 2013 | | | 10,656,745 | | |
| Huntsman International, LLC | | | |
| | 5,864,329 | | | Term Loan, 4.97%, Maturing August 16, 2012 | | | 5,099,873 | | |
| INEOS Group | | | |
| EUR | 566,586 | | | Term Loan, 7.21%, Maturing December 14, 2011 | | | 389,628 | | |
| EUR | 567,621 | | | Term Loan, 8.27%, Maturing December 14, 2011 | | | 390,340 | | |
| | 4,773,072 | | | Term Loan, 5.93%, Maturing December 14, 2012 | | | 3,066,699 | | |
| | 10,070,804 | | | Term Loan, 5.95%, Maturing December 14, 2013 | | | 5,606,084 | | |
| | 10,070,804 | | | Term Loan, 6.45%, Maturing December 14, 2014 | | | 5,513,765 | | |
| Innophos, Inc. | | | |
| | 6,069,669 | | | Term Loan, 6.76%, Maturing August 10, 2010 | | | 5,219,916 | | |
| Invista B.V. | | | |
| | 1,715,856 | | | Term Loan, 5.17%, Maturing April 30, 2010 | | | 1,424,161 | | |
| | 8,136,059 | | | Term Loan, 4.92%, Maturing April 29, 2011 | | | 6,752,929 | | |
| | 2,841,598 | | | Term Loan, 4.92%, Maturing April 29, 2011 | | | 2,358,526 | | |
| ISP Chemco, Inc. | | | |
| | 8,603,065 | | | Term Loan, 5.06%, Maturing June 4, 2014 | | | 6,796,422 | | |
| Kleopatra | | | |
| | 8,876,250 | | | Term Loan, 6.82%, Maturing January 3, 2016 | | | 4,216,219 | | |
| EUR | 5,100,000 | | | Term Loan, 7.88%, Maturing January 3, 2016 | | | 3,331,355 | | |
| Kranton Polymers, LLC | | | |
| | 8,829,700 | | | Term Loan, 5.31%, Maturing May 12, 2013 | | | 6,828,298 | | |
| Lucite International Group Holdings | | | |
| | 4,777,065 | | | Term Loan, 5.37%, Maturing July 7, 2013 | | | 4,335,186 | | |
| | 1,691,565 | | | Term Loan, 5.37%, Maturing July 7, 2013 | | | 1,347,614 | | |
| MacDermid, Inc. | | | |
| | 3,410,921 | | | Term Loan, 5.76%, Maturing April 12, 2014 | | | 2,276,789 | | |
| Millenium Inorganic Chemicals | | | |
| | 7,389,138 | | | Term Loan, 6.01%, Maturing April 30, 2014 | | | 4,765,994 | | |
| Momentive Performance Material | | | |
| | 4,950,000 | | | Term Loan, 4.90%, Maturing December 4, 2013 | | | 3,856,877 | | |
See notes to financial statements
22
Floating Rate Portfolio as of October 31, 2008
PORTFOLIO OF INVESTMENTS CONT'D
Principal
Amount* | | Borrower/Tranche Description | | Value | |
| Chemicals and Plastics (continued) | | | |
| | 1,655,736 | | | Term Loan, 5.38%, Maturing December 4, 2013 | | $ | 1,290,095 | | |
| Propex Fabrics, Inc. | | | |
| | 5,737,805 | | | Term Loan, 8.00%, Maturing July 31, 2012 | | | 1,735,686 | | |
| Rockwood Specialties Group, Inc. | | | |
| EUR | 1,961,700 | | | Term Loan, 6.23%, Maturing July 30, 2011 | | | 1,981,476 | | |
| | 21,023,557 | | | Term Loan, 4.62%, Maturing December 10, 2012 | | | 17,607,229 | | |
| Solo Cup Co. | | | |
| | 2,505,636 | | | Term Loan, 6.65%, Maturing February 27, 2011 | | | 2,177,816 | | |
| TPG Spring UK, Ltd. | | | |
| EUR | 2,271,011 | | | Term Loan, 7.87%, Maturing June 27, 2013 | | | 1,727,063 | | |
| EUR | 2,271,011 | | | Term Loan, 8.37%, Maturing June 27, 2013 | | | 1,727,063 | | |
| Wellman, Inc. | | | |
| | 5,098,328 | | | Term Loan, 6.74%, Maturing February 10, 2009(5) | | | 2,416,608 | | |
| | | | | | | $ | 190,237,816 | | |
| Clothing / Textiles — 0.4% | | | |
| Hanesbrands, Inc. | | | |
| | 6,647,836 | | | Term Loan, 5.26%, Maturing September 5, 2013 | | $ | 5,681,128 | | |
| | 5,000,000 | | | Term Loan - Second Lien, 7.27%, Maturing March 5, 2014 | | | 3,916,665 | | |
| St. John Knits International, Inc. | | | |
| | 2,518,697 | | | Term Loan, 6.12%, Maturing March 23, 2012 | | | 2,103,112 | | |
| The William Carter Co. | | | |
| | 2,324,514 | | | Term Loan, 4.76%, Maturing July 14, 2012 | | | 1,958,403 | | |
| | | | | | | $ | 13,659,308 | | |
| Conglomerates — 2.6% | | | |
| Amsted Industries, Inc. | | | |
| | 9,598,050 | | | Term Loan, 6.56%, Maturing October 15, 2010 | | $ | 7,390,498 | | |
| | 6,348,120 | | | Term Loan, 4.73%, Maturing April 5, 2013 | | | 5,015,015 | | |
| Doncasters (Dunde HoldCo 4 Ltd.) | | | |
| | 3,896,883 | | | Term Loan, 4.85%, Maturing July 13, 2015 | | | 2,903,178 | | |
| | 3,896,883 | | | Term Loan, 5.35%, Maturing July 13, 2015 | | | 2,903,178 | | |
| GBP | 727,123 | | | Term Loan, 7.77%, Maturing July 13, 2015 | | | 865,944 | | |
| GBP | 727,123 | | | Term Loan, 8.27%, Maturing July 13, 2015 | | | 865,944 | | |
| Jarden Corp. | | | |
| | 11,041,998 | | | Term Loan, 5.51%, Maturing January 24, 2012 | | | 9,040,636 | | |
| | 4,539,827 | | | Term Loan, 5.51%, Maturing January 24, 2012 | | | 3,716,983 | | |
| Johnson Diversey, Inc. | | | |
| | 2,013,241 | | | Term Loan, 4.79%, Maturing December 16, 2010 | | | 1,600,527 | | |
| | 8,069,270 | | | Term Loan, 4.79%, Maturing December 16, 2011 | | | 6,415,070 | | |
| Polymer Group, Inc. | | | |
| | 1,000,000 | | | Revolving Loan, 5.00%, Maturing November 22, 2010(2) | | | 850,000 | | |
| | 16,866,627 | | | Term Loan, 5.73%, Maturing November 22, 2012 | | | 13,408,968 | | |
Principal
Amount* | | Borrower/Tranche Description | | Value | |
| Conglomerates (continued) | | | |
| RBS Global, Inc. | | | |
| | 2,259,750 | | | Term Loan, 5.76%, Maturing July 19, 2013 | | $ | 1,796,501 | | |
| | 6,185,246 | | | Term Loan, 6.37%, Maturing July 19, 2013 | | | 4,948,197 | | |
| RGIS Holdings, LLC | | | |
| | 15,181,619 | | | Term Loan, 5.46%, Maturing April 30, 2014 | | | 10,424,717 | | |
| | 759,081 | | | Term Loan, 5.62%, Maturing April 30, 2014 | | | 521,236 | | |
| The Manitowoc Company, Inc. | | | |
| | 5,200,000 | | | Term Loan, Maturing August 21, 2014(4) | | | 4,110,600 | | |
| US Investigations Services, Inc. | | | |
| | 1,969,975 | | | Term Loan, 5.95%, Maturing February 21, 2015 | | | 1,398,682 | | |
| | | | | | | $ | 78,175,874 | | |
| Containers and Glass Products — 3.5% | | | |
| Berry Plastics Corp. | | | |
| | 18,591,565 | | | Term Loan, 4.80%, Maturing April 3, 2015 | | $ | 13,688,039 | | |
| Consolidated Container Co. | | | |
| | 5,880,202 | | | Term Loan, 5.75%, Maturing March 28, 2014 | | | 3,577,121 | | |
| Crown Americas, Inc. | | | |
| | 4,751,000 | | | Term Loan, 6.34%, Maturing November 15, 2012 | | | 4,180,880 | | |
| | 1,421,000 | | | Term Loan, 6.34%, Maturing November 15, 2012 | | | 1,250,480 | | |
| EUR | 4,410,000 | | | Term Loan, 6.87%, Maturing November 15, 2012 | | | 5,564,558 | | |
| Graham Packaging Holdings Co. | | | |
| | 21,364,054 | | | Term Loan, 5.74%, Maturing October 7, 2011 | | | 17,497,160 | | |
| Graphic Packaging International, Inc. | | | |
| | 27,563,286 | | | Term Loan, 5.75%, Maturing May 16, 2014 | | | 22,601,894 | | |
| | 3,449,085 | | | Term Loan, 6.86%, Maturing May 16, 2014 | | | 2,938,189 | | |
| JSG Acquisitions | | | |
| EUR | 1,250,000 | | | Term Loan, 6.96%, Maturing December 31, 2014 | | | 1,048,090 | | |
| EUR | 1,250,000 | | | Term Loan, 7.11%, Maturing December 31, 2014 | | | 1,048,090 | | |
| OI European Group B.V. | | | |
| EUR | 12,064,500 | | | Term Loan, 6.62%, Maturing June 14, 2013 | | | 12,647,425 | | |
| Owens-Brockway Glass Container | | | |
| | 4,096,569 | | | Term Loan, 6.09%, Maturing June 14, 2013 | | | 3,487,204 | | |
| Pregis Corp. | | | |
| | 2,619,000 | | | Term Loan, 6.01%, Maturing October 12, 2011 | | | 2,357,100 | | |
| Smurfit-Stone Container Corp. | | | |
| | 8,380,393 | | | Term Loan, 4.88%, Maturing November 1, 2011 | | | 6,662,412 | | |
| | 3,523,439 | | | Term Loan, 4.90%, Maturing November 1, 2011 | | | 2,801,134 | | |
| | 3,773,295 | | | Term Loan, 5.13%, Maturing November 1, 2011 | | | 2,999,770 | | |
| | 2,817,651 | | | Term Loan, 5.93%, Maturing November 1, 2011 | | | 2,240,033 | | |
| | | | | | | $ | 106,589,579 | | |
See notes to financial statements
23
Floating Rate Portfolio as of October 31, 2008
PORTFOLIO OF INVESTMENTS CONT'D
Principal
Amount* | | Borrower/Tranche Description | | Value | |
| Cosmetics / Toiletries — 0.3% | | | |
| American Safety Razor Co. | | | |
| | 3,408,214 | | | Term Loan, 5.92%, Maturing July 31, 2013 | | $ | 2,914,023 | | |
| Prestige Brands, Inc. | | | |
| | 6,599,368 | | | Term Loan, 5.82%, Maturing April 7, 2011 | | | 5,312,491 | | |
| | | | | | | $ | 8,226,514 | | |
| Drugs — 0.9% | | | |
| Graceway Pharmaceuticals, LLC | | | |
| | 9,702,708 | | | Term Loan, 6.51%, Maturing May 3, 2012 | | $ | 6,824,235 | | |
| Pharmaceutical Holdings Corp. | | | |
| | 2,555,203 | | | Term Loan, 6.51%, Maturing January 30, 2012 | | | 2,146,371 | | |
| Stiefel Laboratories, Inc. | | | |
| | 2,824,130 | | | Term Loan, 7.00%, Maturing December 28, 2013 | | | 2,301,666 | | |
| | 6,171,198 | | | Term Loan, 7.00%, Maturing December 28, 2013 | | | 5,029,527 | | |
| Warner Chilcott Corp. | | | |
| | 2,041,411 | | | Term Loan, 5.76%, Maturing January 18, 2012 | | | 1,687,226 | | |
| | 13,303,070 | | | Term Loan, 5.76%, Maturing January 18, 2012 | | | 10,994,987 | | |
| | | | | | | $ | 28,984,012 | | |
| Ecological Services and Equipment — 0.6% | | | |
| Allied Waste Industries, Inc. | | | |
| | 934,293 | | | Term Loan, 4.90%, Maturing January 15, 2012 | | $ | 893,807 | | |
| | 860,505 | | | Term Loan, 5.44%, Maturing January 15, 2012 | | | 823,217 | | |
| Big Dumpster Merger Sub, Inc. | | | |
| | 681,934 | | | Term Loan, 6.01%, Maturing February 5, 2013 | | | 494,402 | | |
| Blue Waste B.V. (AVR Acquisition) | | | |
| EUR | 2,000,000 | | | Term Loan, 7.21%, Maturing April 1, 2015 | | | 2,020,162 | | |
| Casella Waste Systems, Inc. | | | |
| | 2,958,910 | | | Term Loan, 4.73%, Maturing April 28, 2010 | | | 2,581,649 | | |
| Environmental Systems Products Holdings, Inc. | | | |
| | 466,049 | | | Term Loan - Second Lien, 13.74%,
Maturing December 12, 2010 | | | 336,301 | | |
| IESI Corp. | | | |
| | 2,267,647 | | | Term Loan, 4.56%, Maturing January 20, 2012 | | | 1,882,147 | | |
| Sensus Metering Systems, Inc. | | | |
| | 3,000,000 | | | Revolving Loan, 5.00%, Maturing December 17, 2009(2) | | | 2,775,000 | | |
| | 5,511,285 | | | Term Loan, 4.92%, Maturing December 17, 2010 | | | 5,097,938 | | |
| Wastequip, Inc. | | | |
| | 287,130 | | | Term Loan, 6.01%, Maturing February 5, 2013 | | | 208,169 | | |
| | | | | | | $ | 17,112,792 | | |
| Electronics / Electrical — 2.9% | | | |
| Aspect Software, Inc. | | | |
| | 4,253,957 | | | Term Loan, 6.25%, Maturing July 11, 2011 | | $ | 3,445,706 | | |
Principal
Amount* | | Borrower/Tranche Description | | Value | |
| Electronics / Electrical (continued) | | | |
| Fairchild Semiconductor Corp. | | | |
| | 9,265,411 | | | Term Loan, 5.26%, Maturing June 26, 2013 | | $ | 6,717,423 | | |
| FCI International S.A.S. | | | |
| | 761,894 | | | Term Loan, 6.47%, Maturing November 1, 2013 | | | 617,134 | | |
| | 733,492 | | | Term Loan, 6.47%, Maturing November 1, 2013 | | | 594,129 | | |
| | 733,492 | | | Term Loan, 6.47%, Maturing November 1, 2013 | | | 594,129 | | |
| | 761,894 | | | Term Loan, 6.47%, Maturing November 1, 2013 | | | 617,134 | | |
| | 996,924 | | | Term Loan, 6.47%, Maturing November 1, 2013 | | | 807,509 | | |
| Freescale Semiconductor, Inc. | | | |
| | 35,403,172 | | | Term Loan, 5.47%, Maturing December 1, 2013 | | | 24,221,682 | | |
| Infor Enterprise Solutions Holdings | | | |
| | 19,522,558 | | | Term Loan, 7.52%, Maturing July 28, 2012 | | | 12,348,018 | | |
| | 7,246,846 | | | Term Loan, 7.52%, Maturing July 28, 2012 | | | 4,583,630 | | |
| EUR | 2,947,500 | | | Term Loan, 8.14%, Maturing July 28, 2012 | | | 2,338,568 | | |
| Network Solutions, LLC | | | |
| | 5,722,972 | | | Term Loan, 5.95%, Maturing March 7, 2014 | | | 3,290,709 | | |
| Open Solutions, Inc. | | | |
| | 10,236,272 | | | Term Loan, 5.96%, Maturing January 23, 2014 | | | 5,629,950 | | |
| Sensata Technologies Finance Co. | | | |
| | 10,725,635 | | | Term Loan, 5.26%, Maturing April 27, 2013 | | | 6,928,761 | | |
| Spectrum Brands, Inc. | | | |
| | 145,437 | | | Term Loan, 4.70%, Maturing March 30, 2013 | | | 99,806 | | |
| | 2,840,255 | | | Term Loan, 7.58%, Maturing March 30, 2013 | | | 1,949,125 | | |
| SS&C Technologies, Inc. | | | |
| | 3,418,928 | | | Term Loan, 5.77%, Maturing November 23, 2012 | | | 2,606,932 | | |
| Vertafore, Inc. | | | |
| | 9,905,040 | | | Term Loan, 5.31%, Maturing January 31, 2012 | | | 8,047,845 | | |
| | 1,995,000 | | | Term Loan, 7.06%, Maturing January 31, 2012 | | | 1,755,600 | | |
| | | | | | | $ | 87,193,790 | | |
| Equipment Leasing — 0.0% | | | |
| The Hertz Corp. | | | |
| | 8,000 | | | Term Loan, 4.55%, Maturing December 21, 2012 | | $ | 5,806 | | |
| | 835,057 | | | Term Loan, 4.70%, Maturing December 21, 2012 | | | 606,013 | | |
| | | | | | | $ | 611,819 | | |
| Farming / Agriculture — 0.4% | | | |
| BF Bolthouse HoldCo, LLC | | | |
| | 4,287,931 | | | Term Loan, 6.19%, Maturing December 16, 2012 | | $ | 3,591,142 | | |
| Central Garden & Pet Co. | | | |
| | 10,749,240 | | | Term Loan, 4.74%, Maturing February 28, 2014 | | | 7,228,864 | | |
| | | | | | | $ | 10,820,006 | | |
See notes to financial statements
24
Floating Rate Portfolio as of October 31, 2008
PORTFOLIO OF INVESTMENTS CONT'D
Principal
Amount* | | Borrower/Tranche Description | | Value | |
| Financial Intermediaries — 1.6% | | | |
| Asset Acceptence Capital Corp. | | | |
| | 1,478,775 | | | Term Loan, 5.30%, Maturing June 5, 2013 | | $ | 1,131,263 | | |
| Citco III, Ltd. | | | |
| | 10,355,978 | | | Term Loan, 5.13%, Maturing June 30, 2014 | | | 8,388,342 | | |
| E.A. Viner International Co. | | | |
| | 753,450 | | | Term Loan, 6.77%, Maturing July 31, 2013 | | | 708,243 | | |
| Grosvenor Capital Management | | | |
| | 4,092,491 | | | Term Loan, 5.59%, Maturing December 5, 2013 | | | 3,273,993 | | |
| INVESTools, Inc. | | | |
| | 2,304,000 | | | Term Loan, 6.25%, Maturing August 13, 2012 | | | 2,096,640 | | |
| Jupiter Asset Management Group | | | |
| GBP | 3,764,439 | | | Term Loan, 7.89%, Maturing June 30, 2015 | | | 4,574,016 | | |
| Lender Processing Services, Inc. | | | |
| | 2,011,188 | | | Term Loan, 5.62%, Maturing July 2, 2014 | | | 1,850,292 | | |
| LPL Holdings, Inc. | | | |
| | 22,306,740 | | | Term Loan, 5.51%, Maturing December 18, 2014 | | | 17,845,392 | | |
| Oxford Acquisition III, Ltd. | | | |
| | 11,105,762 | | | Term Loan, 5.58%, Maturing May 24, 2014 | | | 7,015,144 | | |
| RJO Holdings Corp. (RJ O'Brien) | | | |
| | 4,182,750 | | | Term Loan, 6.00%, Maturing July 31, 2014(3) | | | 3,011,580 | | |
| | | | | | | $ | 49,894,905 | | |
| Food Products — 3.0% | | | |
| Acosta, Inc. | | | |
| | 15,610,266 | | | Term Loan, 5.37%, Maturing July 28, 2013 | | $ | 11,512,571 | | |
| Advantage Sales & Marketing, Inc. | | | |
| | 11,325,711 | | | Term Loan, 5.20%, Maturing March 29, 2013 | | | 7,956,312 | | |
| American Seafoods Group, LLC | | | |
| | 3,950,358 | | | Term Loan, 5.51%, Maturing September 30, 2012 | | | 3,496,067 | | |
| BL Marketing, Ltd. | | | |
| GBP | 3,500,000 | | | Term Loan, 8.04%, Maturing December 31, 2013 | | | 4,140,053 | | |
| GBP | 2,500,000 | | | Term Loan - Second Lien, 10.09%,
Maturing June 30, 2015 | | | 2,595,077 | | |
| Black Lion Beverages III B.V. | | | |
| EUR | 3,000,000 | | | Term Loan - Second Lien, 9.49%,
Maturing January 24, 2016 | | | 2,326,052 | | |
| Bumble Bee Seafood, LLC | | | |
| | 3,000,000 | | | Term Loan, 5.56%, Maturing May 2, 2012 | | | 2,805,000 | | |
| Dean Foods Co. | | | |
| | 23,787,626 | | | Term Loan, 5.26%, Maturing April 2, 2014 | | | 17,922,502 | | |
| Dole Food Company, Inc. | | | |
| | 894,186 | | | Term Loan, 4.69%, Maturing April 12, 2013 | | | 655,364 | | |
| | 1,216,597 | | | Term Loan, 5.28%, Maturing April 12, 2013 | | | 891,665 | | |
| | 5,021,009 | | | Term Loan, 5.93%, Maturing April 12, 2013 | | | 3,679,983 | | |
Principal
Amount* | | Borrower/Tranche Description | | Value | |
| Food Products (continued) | | | |
| MafCo Worldwide Corp. | | | |
| | 812,696 | | | Term Loan, 5.06%, Maturing December 8, 2011 | | $ | 759,871 | | |
| Pinnacle Foods Finance, LLC | | | |
| | 4,000,000 | | | Revolving Loan, 5.27%, Maturing April 2, 2013(2) | | | 2,600,000 | | |
| | 26,731,413 | | | Term Loan, 6.76%, Maturing April 2, 2014 | | | 19,407,006 | | |
| Reddy Ice Group, Inc. | | | |
| | 12,335,000 | | | Term Loan, 6.50%, Maturing August 9, 2012 | | | 9,220,412 | | |
| Ruby Acquisitions, Ltd. | | | |
| GBP | 1,955,404 | | | Term Loan, 8.84%, Maturing January 5, 2015 | | | 2,438,870 | | |
| | | | | | | $ | 92,406,805 | | |
| Food Service — 1.9% | | | |
| AFC Enterprises, Inc. | | | |
| | 2,044,568 | | | Term Loan, 6.06%, Maturing May 23, 2009 | | $ | 1,615,208 | | |
| Aramark Corp. | | | |
| | 938,909 | | | Term Loan, 4.94%, Maturing January 26, 2014 | | | 788,449 | | |
| | 14,365,417 | | | Term Loan, 5.64%, Maturing January 26, 2014 | | | 12,063,359 | | |
| Buffets, Inc. | | | |
| | 3,811,403 | | | Term Loan, 10.42%, Maturing January 22, 2009 | | | 1,181,535 | | |
| | 442,238 | | | Term Loan, 10.42%, Maturing January 22, 2009 | | | 137,094 | | |
| | 1,372,645 | | | Term Loan, 10.97%, Maturing May 1, 2013 | | | 404,930 | | |
| | 7,868,329 | | | Term Loan, 10.42%, Maturing November 1, 2013 | | | 2,321,157 | | |
| CBRL Group, Inc. | | | |
| | 2,926,047 | | | Term Loan, 4.30%, Maturing April 27, 2013 | | | 2,248,179 | | |
| | 6,452,740 | | | Term Loan, 4.30%, Maturing April 27, 2013 | | | 4,957,853 | | |
| JRD Holdings, Inc. | | | |
| | 3,715,625 | | | Term Loan, 5.75%, Maturing June 26, 2014 | | | 2,823,875 | | |
| Maine Beverage Co., LLC | | | |
| | 2,514,286 | | | Term Loan, 5.63%, Maturing June 30, 2010 | | | 2,288,000 | | |
| OSI Restaurant Partners, LLC | | | |
| | 832,528 | | | Term Loan, 5.28%, Maturing May 9, 2013 | | | 437,771 | | |
| | 9,961,625 | | | Term Loan, 5.25%, Maturing May 9, 2014 | | | 5,238,151 | | |
| QCE Finance, LLC | | | |
| | 8,985,539 | | | Term Loan, 5.81%, Maturing May 5, 2013 | | | 5,930,456 | | |
| Sagittarius Restaurants, LLC | | | |
| | 4,378,629 | | | Term Loan, 9.50%, Maturing March 29, 2013 | | | 2,123,635 | | |
| Selecta | | | |
| CHF | 18,404,850 | | | Term Loan, 5.34%, Maturing June 28, 2015 | | | 10,633,137 | | |
| SSP Financing, Ltd. | | | |
| | 3,954,516 | | | Term Loan, 5.37%, Maturing June 15, 2014 | | | 2,016,803 | | |
| | 3,954,516 | | | Term Loan, 5.87%, Maturing June 15, 2015 | | | 2,016,803 | | |
| | | | | | | $ | 59,226,395 | | |
See notes to financial statements
25
Floating Rate Portfolio as of October 31, 2008
PORTFOLIO OF INVESTMENTS CONT'D
Principal
Amount* | | Borrower/Tranche Description | | Value | |
| Food / Drug Retailers — 1.6% | | | |
| General Nutrition Centers, Inc. | | | |
| | 12,588,201 | | | Term Loan, 6.14%, Maturing September 16, 2013 | | $ | 8,727,815 | | |
| Pantry, Inc. (The) | | | |
| | 7,141,634 | | | Term Loan, 4.87%, Maturing May 15, 2014 | | | 5,070,560 | | |
| | 65,717 | | | Term Loan, 4.87%, Maturing May 15, 2014 | | | 46,659 | | |
| Rite Aid Corp. | | | |
| | 24,875,000 | | | Term Loan, 5.01%, Maturing June 1, 2014 | | | 18,469,688 | | |
| | 5,050,000 | | | Term Loan, 6.00%, Maturing June 4, 2014 | | | 3,989,500 | | |
| Roundy's Supermarkets, Inc. | | | |
| | 16,125,212 | | | Term Loan, 5.38%, Maturing November 3, 2011 | | | 13,101,735 | | |
| | | | | | | $ | 49,405,957 | | |
| Forest Products — 1.4% | | | |
| Appleton Papers, Inc. | | | |
| | 10,514,400 | | | Term Loan, 5.38%, Maturing June 5, 2014 | | $ | 8,464,092 | | |
| Georgia-Pacific Corp. | | | |
| | 32,315,533 | | | Term Loan, 4.65%, Maturing December 20, 2012 | | | 26,920,648 | | |
| | 2,077,383 | | | Term Loan, 5.37%, Maturing December 20, 2012 | | | 1,730,576 | | |
| Xerium Technologies, Inc. | | | |
| | 9,099,221 | | | Term Loan, 9.26%, Maturing May 18, 2012 | | | 6,733,424 | | |
| | | | | | | $ | 43,848,740 | | |
| Healthcare — 7.9% | | | |
| Accellent, Inc. | | | |
| | 3,155,613 | | | Term Loan, 5.31%, Maturing November 22, 2012 | | $ | 2,177,373 | | |
| Advanced Medical Optics, Inc. | | | |
| | 1,955,556 | | | Term Loan, 4.76%, Maturing April 2, 2014 | | | 1,422,667 | | |
| Alliance Imaging, Inc. | | | |
| | 4,635,234 | | | Term Loan, 5.78%, Maturing December 29, 2011 | | | 4,032,654 | | |
| American Medical Systems | | | |
| | 7,055,084 | | | Term Loan, 5.44%, Maturing July 20, 2012 | | | 6,067,372 | | |
| AMN Healthcare, Inc. | | | |
| | 1,938,202 | | | Term Loan, 5.51%, Maturing November 2, 2011 | | | 1,686,236 | | |
| AMR HoldCo, Inc. | | | |
| | 5,945,458 | | | Term Loan, 4.82%, Maturing February 10, 2012 | | | 5,291,458 | | |
| Biomet, Inc. | | | |
| | 8,140,000 | | | Term Loan, 6.76%, Maturing December 26, 2014 | | | 7,104,185 | | |
| EUR | 7,939,788 | | | Term Loan, 8.14%, Maturing December 26, 2014 | | | 8,677,605 | | |
| Cardinal Health 409, Inc. | | | |
| | 14,708,800 | | | Term Loan, 6.01%, Maturing April 10, 2014 | | | 9,523,948 | | |
| Carestream Health, Inc. | | | |
| | 14,076,656 | | | Term Loan, 5.43%, Maturing April 30, 2013 | | | 9,267,127 | | |
| Carl Zeiss Vision Holding GmbH | | | |
| EUR | 6,371,053 | | | Term Loan, 7.00%, Maturing March 23, 2015 | | | 4,750,332 | | |
Principal
Amount* | | Borrower/Tranche Description | | Value | |
| Healthcare (continued) | | | |
| CB Diagnostics AB | | | |
| | 998,084 | | | Term Loan, 5.24%, Maturing January 16, 2015 | | $ | 824,667 | | |
| | 2,315,036 | | | Term Loan, 5.49%, Maturing January 16, 2016 | | | 1,912,799 | | |
| Community Health Systems, Inc. | | | |
| | 21,495,283 | | | Term Loan, 5.16%, Maturing July 25, 2014 | | | 17,279,521 | | |
| Concentra, Inc. | | | |
| | 5,925,000 | | | Term Loan, 6.02%, Maturing June 25, 2014 | | | 3,999,375 | | |
| CRC Health Corp. | | | |
| | 1,842,202 | | | Term Loan, 6.01%, Maturing February 6, 2013 | | | 1,271,119 | | |
| | 3,876,023 | | | Term Loan, 6.01%, Maturing February 6, 2013 | | | 2,674,456 | | |
| Dako Equity Project Delphi | | | |
| | 1,568,302 | | | Term Loan, 6.01%, Maturing June 12, 2016 | | | 823,358 | | |
| EUR | 3,098,534 | | | Term Loan, 7.43%, Maturing June 12, 2016 | | | 2,191,826 | | |
| DaVita, Inc. | | | |
| | 14,753,556 | | | Term Loan, 4.67%, Maturing October 5, 2012 | | | 12,856,676 | | |
| Fresenius Medical Care Holdings | | | |
| | 6,698,766 | | | Term Loan, 5.00%, Maturing March 31, 2013 | | | 5,707,349 | | |
| Gambro Holding AB | | | |
| | 1,292,918 | | | Term Loan, 5.62%, Maturing June 5, 2014 | | | 818,848 | | |
| | 1,292,918 | | | Term Loan, 6.12%, Maturing June 5, 2015 | | | 818,848 | | |
| Hanger Orthopedic Group, Inc. | | | |
| | 3,309,903 | | | Term Loan, 5.18%, Maturing May 30, 2013 | | | 2,598,274 | | |
| HCA, Inc. | | | |
| | 37,531,815 | | | Term Loan, 6.01%, Maturing November 18, 2013 | | | 31,066,960 | | |
| Health Management Association, Inc. | | | |
| | 22,826,749 | | | Term Loan, 5.51%, Maturing February 28, 2014 | | | 16,092,858 | | |
| HealthSouth Corp. | | | |
| | 6,850,671 | | | Term Loan, 5.50%, Maturing March 10, 2013 | | | 5,692,716 | | |
| Iasis Healthcare, LLC | | | |
| | 158,396 | | | Term Loan, 4.58%, Maturing March 14, 2014 | | | 128,301 | | |
| | 592,501 | | | Term Loan, 5.12%, Maturing March 14, 2014 | | | 479,925 | | |
| | 1,712,322 | | | Term Loan, 5.12%, Maturing March 14, 2014 | | | 1,386,981 | | |
| Ikaria Acquisition, Inc. | | | |
| | 1,544,830 | | | Term Loan, 5.67%, Maturing March 28, 2013 | | | 1,467,588 | | |
| IM U.S. Holdings, LLC | | | |
| | 6,586,376 | | | Term Loan, 5.16%, Maturing June 26, 2014 | | | 4,862,939 | | |
| inVentiv Health, Inc. | | | |
| | 7,983,938 | | | Term Loan, 5.52%, Maturing July 6, 2014 | | | 6,227,471 | | |
| Leiner Health Products, Inc. | | | |
| | 820,655 | | | Term Loan, 8.75%, Maturing May 27, 2011(5) | | | 779,623 | | |
| LifePoint Hospitals, Inc. | | | |
| | 11,519,064 | | | Term Loan, 4.44%, Maturing April 15, 2012 | | | 9,712,011 | | |
| MultiPlan Merger Corp. | | | |
| | 3,333,806 | | | Term Loan, 5.63%, Maturing April 12, 2013 | | | 2,625,372 | | |
| | 3,739,920 | | | Term Loan, 5.63%, Maturing April 12, 2013 | | | 2,945,187 | | |
See notes to financial statements
26
Floating Rate Portfolio as of October 31, 2008
PORTFOLIO OF INVESTMENTS CONT'D
Principal
Amount* | | Borrower/Tranche Description | | Value | |
| Healthcare (continued) | | | |
| National Mentor Holdings, Inc. | | | |
| | 484,400 | | | Term Loan, 4.94%, Maturing June 29, 2013 | | $ | 409,318 | | |
| | 7,981,874 | | | Term Loan, 5.77%, Maturing June 29, 2013 | | | 6,744,684 | | |
| Nyco Holdings | | | |
| | 2,859,137 | | | Term Loan, 6.09%, Maturing December 29, 2014 | | | 1,521,061 | | |
| EUR | 5,268,945 | | | Term Loan, 7.42%, Maturing December 29, 2014 | | | 3,672,558 | | |
| | 2,859,137 | | | Term Loan, 6.84%, Maturing December 29, 2015 | | | 1,521,061 | | |
| EUR | 5,268,945 | | | Term Loan, 8.17%, Maturing December 29, 2015 | | | 3,672,558 | | |
| Psychiatric Solutions, Inc. | | | |
| | 991,190 | | | Term Loan, 4.80%, Maturing May 31, 2014 | | | 814,015 | | |
| RadNet Management, Inc. | | | |
| | 2,446,404 | | | Term Loan, 7.06%, Maturing November 15, 2012 | | | 1,957,123 | | |
| ReAble Therapeutics Finance, LLC | | | |
| | 9,181,633 | | | Term Loan, 5.76%, Maturing November 16, 2013 | | | 6,932,133 | | |
| Select Medical Holding Corp. | | | |
| | 1,000,000 | | | Revolving Loan, 5.30%, Maturing February 24, 2010(2) | | | 815,000 | | |
| | 4,640,310 | | | Term Loan, 4.91%, Maturing February 24, 2012 | | | 3,573,039 | | |
| Sunrise Medical Holdings, Inc. | | | |
| | 4,256,450 | | | Term Loan, 7.90%, Maturing May 13, 2010 | | | 3,263,846 | | |
| Vanguard Health Holding Co., LLC | | | |
| | 10,691,766 | | | Term Loan, 5.74%, Maturing September 23, 2011 | | | 9,128,095 | | |
| Viant Holdings, Inc. | | | |
| | 1,829,176 | | | Term Loan, 6.02%, Maturing June 25, 2014 | | | 1,088,360 | | |
| | | | | | | $ | 242,358,856 | | |
| Home Furnishings — 1.6% | | | |
| Dometic Corp. | | | |
| | 2,790,150 | | | Term Loan, 6.42%, Maturing December 31, 2014 | | $ | 2,092,612 | | |
| | 1,788,692 | | | Term Loan, 6.92%, Maturing December 31, 2014 | | | 1,341,519 | | |
| | 421,159 | | | Term Loan, 6.92%, Maturing December 31, 2014 | | | 315,869 | | |
| Hunter Fan Co. | | | |
| | 3,612,211 | | | Term Loan, 5.31%, Maturing April 16, 2014 | | | 2,022,838 | | |
| Interline Brands, Inc. | | | |
| | 5,852,470 | | | Term Loan, 4.75%, Maturing June 23, 2013 | | | 4,506,402 | | |
| | 3,064,113 | | | Term Loan, 4.75%, Maturing June 23, 2013 | | | 2,359,367 | | |
| National Bedding Co., LLC | | | |
| | 10,676,721 | | | Term Loan, 5.35%, Maturing August 31, 2011 | | | 7,073,328 | | |
| | 1,500,000 | | | Term Loan - Second Lien, 8.40%,
Maturing August 31, 2012 | | | 945,000 | | |
| Oreck Corp. | | | |
| | 4,190,876 | | | Term Loan, 5.61%, Maturing February 2, 2012(3) | | | 1,638,633 | | |
| Sanitec, Ltd. Oy | | | |
| EUR | 4,394,410 | | | Term Loan, 8.38%, Maturing April 7, 2013 | | | 3,197,176 | | |
| EUR | 4,394,410 | | | Term Loan, 8.88%, Maturing April 7, 2014 | | | 3,215,849 | | |
Principal
Amount* | | Borrower/Tranche Description | | Value | |
| Home Furnishings (continued) | | | |
| Sealy Mattress Co. | | | |
| | 3,000,000 | | | Revolving Loan, 4.26%, Maturing April 6, 2012(2) | | $ | 2,670,000 | | |
| | 6,357,539 | | | Term Loan, 4.62%, Maturing August 25, 2012 | | | 4,831,729 | | |
| Simmons Co. | | | |
| | 18,290,235 | | | Term Loan, 5.44%, Maturing December 19, 2011 | | | 12,986,067 | | |
| | 2,500,000 | | | Term Loan, 8.35%, Maturing February 15, 2012 | | | 443,750 | | |
| | | | | | | $ | 49,640,139 | | |
| Industrial Equipment — 2.3% | | | |
| CEVA Group PLC U.S. | | | |
| | 333,571 | | | Term Loan, 6.75%, Maturing January 4, 2014 | | $ | 267,690 | | |
| | 39,740 | | | Term Loan, 6.76%, Maturing January 4, 2014 | | | 31,892 | | |
| EUR | 646,202 | | | Term Loan, 7.53%, Maturing January 4, 2014 | | | 660,952 | | |
| EUR | 1,097,324 | | | Term Loan, 7.53%, Maturing January 4, 2014 | | | 1,122,372 | | |
| EUR | 1,348,618 | | | Term Loan, 7.53%, Maturing January 4, 2014 | | | 1,379,402 | | |
| EUR | 1,135,787 | | | Term Loan, 8.14%, Maturing January 4, 2014 | | | 1,161,713 | | |
| EPD Holdings (Goodyear Engineering Products) | | | |
| | 350,477 | | | Term Loan, 5.50%, Maturing July 13, 2014 | | | 254,096 | | |
| | 9,377,156 | | | Term Loan, 5.50%, Maturing July 13, 2014 | | | 6,798,438 | | |
| | 2,000,000 | | | Term Loan - Second Lien, 8.75%, Maturing July 13, 2015 | | | 1,160,000 | | |
| Flowserve Corp. | | | |
| | 3,597,953 | | | Term Loan, 5.31%, Maturing August 10, 2012 | | | 3,220,168 | | |
| FR Brand Acquisition Corp. | | | |
| | 9,057,050 | | | Term Loan, 6.00%, Maturing February 7, 2014 | | | 6,883,358 | | |
| Generac Acquisition Corp. | | | |
| | 7,763,516 | | | Term Loan, 6.65%, Maturing November 7, 2013 | | | 4,903,957 | | |
| Gleason Corp. | | | |
| | 1,518,056 | | | Term Loan, 5.22%, Maturing June 30, 2013 | | | 1,297,938 | | |
| | 1,940,737 | | | Term Loan, 5.22%, Maturing June 30, 2013 | | | 1,659,330 | | |
| Heating Finance PLC (Baxi) | | | |
| EUR | 3,253,597 | | | Term Loan, 7.97%, Maturing December 27, 2010(2) | | | 2,778,404 | | |
| GBP | 2,068,692 | | | Term Loan, 8.42%, Maturing December 27, 2010 | | | 1,827,758 | | |
| Jason, Inc. | | | |
| | 1,912,045 | | | Term Loan, 5.50%, Maturing April 30, 2010 | | | 1,491,395 | | |
| John Maneely Co. | | | |
| | 13,276,263 | | | Term Loan, 7.66%, Maturing December 8, 2013 | | | 9,791,244 | | |
| KION Group GmbH | | | |
| | 2,250,000 | | | Term Loan, 5.12%, Maturing December 23, 2014 | | | 1,397,250 | | |
| | 2,250,000 | | | Term Loan, 5.62%, Maturing December 23, 2015 | | | 1,397,250 | | |
| Polypore, Inc. | | | |
| | 1,999,803 | | | Term Loan, 0.00%, Maturing July 3, 2013(2) | | | 1,459,856 | | |
| | 16,248,989 | | | Term Loan, 5.39%, Maturing July 3, 2014 | | | 12,674,211 | | |
| EUR | 1,100,565 | | | Term Loan, 6.81%, Maturing July 3, 2014 | | | 1,143,221 | | |
See notes to financial statements
27
Floating Rate Portfolio as of October 31, 2008
PORTFOLIO OF INVESTMENTS CONT'D
Principal
Amount* | | Borrower/Tranche Description | | Value | |
| Industrial Equipment (continued) | | | |
| TFS Acquisition Corp. | | | |
| | 4,400,101 | | | Term Loan, 7.26%, Maturing August 11, 2013 | | $ | 4,092,094 | | |
| | | | | | | $ | 68,853,989 | | |
| Insurance — 1.6% | | | |
| Alliant Holdings I, Inc. | | | |
| | 7,301,250 | | | Term Loan, 6.76%, Maturing August 21, 2014 | | $ | 5,037,862 | | |
| CCC Information Services Group, Inc. | | | |
| | 4,362,620 | | | Term Loan, 6.02%, Maturing February 10, 2013 | | | 3,511,909 | | |
| Conseco, Inc. | | | |
| | 23,269,691 | | | Term Loan, 5.00%, Maturing October 10, 2013 | | | 15,416,170 | | |
| Crump Group, Inc. | | | |
| | 6,248,670 | | | Term Loan, 6.71%, Maturing August 4, 2014 | | | 4,655,259 | | |
| Getty Images, Inc. | | | |
| | 9,825,000 | | | Term Loan, 8.05%, Maturing July 2, 2015 | | | 8,945,662 | | |
| Hub International Holdings, Inc. | | | |
| | 463,115 | | | Term Loan, 6.26%, Maturing June 13, 2014 | | | 319,550 | | |
| | 6,472,709 | | | Term Loan, 6.26%, Maturing June 13, 2014 | | | 4,466,170 | | |
| U.S.I. Holdings Corp. | | | |
| | 7,035,937 | | | Term Loan, 6.52%, Maturing May 4, 2014 | | | 5,118,645 | | |
| | | | | | | $ | 47,471,227 | | |
| Leisure Goods / Activities / Movies — 5.7% | | | |
| 24 Hour Fitness Worldwide, Inc. | | | |
| | 2,952,002 | | | Term Loan, 6.18%, Maturing June 8, 2012 | | $ | 2,199,241 | | |
| AMC Entertainment, Inc. | | | |
| | 15,520,225 | | | Term Loan, 5.01%, Maturing January 26, 2013 | | | 11,902,073 | | |
| AMF Bowling Worldwide, Inc. | | | |
| | 2,989,488 | | | Term Loan, 5.35%, Maturing June 8, 2013 | | | 2,316,853 | | |
| Bombardier Recreational Products | | | |
| | 13,400,000 | | | Term Loan, 6.16%, Maturing June 28, 2013 | | | 9,279,500 | | |
| Carmike Cinemas, Inc. | | | |
| | 3,251,838 | | | Term Loan, 6.31%, Maturing May 19, 2012 | | | 2,609,600 | | |
| | 5,300,251 | | | Term Loan, 6.47%, Maturing May 19, 2012 | | | 4,253,452 | | |
| Cedar Fair, L.P. | | | |
| | 4,887,501 | | | Term Loan, 5.12%, Maturing August 31, 2011 | | | 3,592,313 | | |
| | 3,958,686 | | | Term Loan, 5.12%, Maturing August 30, 2012 | | | 2,909,634 | | |
| Cinemark, Inc. | | | |
| | 25,340,700 | | | Term Loan, 4.64%, Maturing October 5, 2013 | | | 19,427,878 | | |
| Dave & Buster's, Inc. | | | |
| | 815,456 | | | Term Loan, 6.02%, Maturing March 8, 2013 | | | 668,674 | | |
| | 2,076,170 | | | Term Loan, 6.02%, Maturing March 8, 2013 | | | 1,702,460 | | |
Principal
Amount* | | Borrower/Tranche Description | | Value | |
| Leisure Goods / Activities / Movies (continued) | | | |
| Deluxe Entertainment Services | | | |
| | 5,197,190 | | | Term Loan, 5.67%, Maturing January 28, 2011 | | $ | 4,157,752 | | |
| | 271,434 | | | Term Loan, 6.01%, Maturing January 28, 2011 | | | 217,147 | | |
| | 501,257 | | | Term Loan, 6.01%, Maturing January 28, 2011 | | | 401,006 | | |
| DW Funding, LLC | | | |
| | 4,261,099 | | | Term Loan, 5.93%, Maturing April 30, 2011 | | | 3,728,461 | | |
| Easton-Bell Sports, Inc. | | | |
| | 7,399,927 | | | Term Loan, 5.29%, Maturing March 16, 2012 | | | 5,864,442 | | |
| Fender Musical Instruments Corp. | | | |
| | 4,568,800 | | | Term Loan, 5.17%, Maturing June 9, 2014 | | | 2,855,500 | | |
| | 1,310,034 | | | Term Loan, 6.02%, Maturing June 9, 2014 | | | 818,771 | | |
| Mega Blocks, Inc. | | | |
| | 1,886,143 | | | Term Loan, 8.75%, Maturing July 26, 2012 | | | 1,084,532 | | |
| Metro-Goldwyn-Mayer Holdings, Inc. | | | |
| | 44,882,903 | | | Term Loan, 7.01%, Maturing April 8, 2012 | | | 22,693,918 | | |
| National CineMedia, LLC | | | |
| | 13,250,000 | | | Term Loan, 4.57%, Maturing February 13, 2015 | | | 9,230,838 | | |
| Odeon | | | |
| EUR | 1,064,322 | | | Term Loan, 8.27%, Maturing April 2, 2015 | | | 1,017,399 | | |
| GBP | 623,547 | | | Term Loan, 8.27%, Maturing April 2, 2015 | | | 764,336 | | |
| EUR | 1,064,322 | | | Term Loan, 7.84%, Maturing April 2, 2016 | | | 1,017,399 | | |
| GBP | 623,547 | | | Term Loan, 8.65%, Maturing April 2, 2016 | | | 764,336 | | |
| Regal Cinemas Corp. | | | |
| | 23,105,314 | | | Term Loan, 5.26%, Maturing November 10, 2010 | | | 17,470,182 | | |
| Revolution Studios Distribution Co., LLC | | | |
| | 5,951,442 | | | Term Loan, 6.87%, Maturing December 21, 2014 | | | 4,939,697 | | |
| Six Flags Theme Parks, Inc. | | | |
| | 14,390,064 | | | Term Loan, 5.69%, Maturing April 30, 2015 | | | 9,425,492 | | |
| Southwest Sports Group, LLC | | | |
| | 9,500,000 | | | Term Loan, 6.31%, Maturing December 22, 2010 | | | 7,362,500 | | |
| Universal City Development Partners, Ltd. | | | |
| | 8,996,088 | | | Term Loan, 6.68%, Maturing June 9, 2011 | | | 7,736,635 | | |
| WMG Acquisition Corp. | | | |
| | 390,000 | | | Revolving Loan, 0.00%, Maturing February 28, 2010(2) | | | 328,575 | | |
| | 12,380,548 | | | Term Loan, 5.06%, Maturing February 28, 2011 | | | 10,028,244 | | |
| Zuffa, LLC | | | |
| | 2,468,750 | | | Term Loan, 5.81%, Maturing June 20, 2016 | | | 1,542,969 | | |
| | | | | | | $ | 174,311,809 | | |
| Lodging and Casinos — 2.9% | | | |
| Choctaw Resort Development Enterprise | | | |
| | 2,960,870 | | | Term Loan, 5.51%, Maturing November 4, 2011 | | $ | 2,487,130 | | |
| Dionysos Leisure Entertainment | | | |
| EUR | 1,500,000 | | | Term Loan, 7.03%, Maturing June 30, 2014 | | | 1,402,004 | | |
| EUR | 1,500,000 | | | Term Loan, 7.40%, Maturing June 30, 2015 | | | 1,402,004 | | |
See notes to financial statements
28
Floating Rate Portfolio as of October 31, 2008
PORTFOLIO OF INVESTMENTS CONT'D
Principal
Amount* | | Borrower/Tranche Description | | Value | |
| Lodging and Casinos (continued) | | | |
| Full Moon Holdco 3 Ltd. | | | |
| GBP | 1,500,000 | | | Term Loan, 8.38%, Maturing November 20, 2014 | | $ | 1,732,063 | | |
| GBP | 1,500,000 | | | Term Loan, 8.88%, Maturing November 20, 2015 | | | 1,732,063 | | |
| Gala Electric Casinos, Ltd. | | | |
| GBP | 5,000,000 | | | Term Loan, 5.98%, Maturing December 12, 2012(2) | | | 4,439,126 | | |
| GBP | 6,566,970 | | | Term Loan, 7.83%, Maturing December 12, 2013 | | | 5,793,490 | | |
| GBP | 5,690,605 | | | Term Loan, 8.33%, Maturing December 12, 2014 | | | 5,020,347 | | |
| Green Valley Ranch Gaming, LLC | | | |
| | 7,035,660 | | | Term Loan, 5.00%, Maturing February 16, 2014 | | | 3,517,830 | | |
| Harrah's Operating Co. | | | |
| | 2,985,000 | | | Term Loan, 6.45%, Maturing January 28, 2015 | | | 2,048,991 | | |
| | 2,985,000 | | | Term Loan, 6.54%, Maturing January 28, 2015 | | | 2,054,259 | | |
| Herbst Gaming, Inc. | | | |
| | 6,244,796 | | | Term Loan, 10.50%, Maturing December 2, 2011 | | | 3,465,862 | | |
| | 2,482,768 | | | Term Loan, 10.50%, Maturing December 2, 2011 | | | 1,377,936 | | |
| Isle of Capri Casinos, Inc. | | | |
| | 4,853,450 | | | Term Loan, 5.51%, Maturing November 30, 2013 | | | 3,292,255 | | |
| | 141,577 | | | Term Loan, 5.51%, Maturing November 30, 2013 | | | 96,036 | | |
| | 3,402,879 | | | Term Loan, 5.51%, Maturing November 30, 2013 | | | 2,308,285 | | |
| LodgeNet Entertainment Corp. | | | |
| | 5,753,703 | | | Term Loan, 5.77%, Maturing April 4, 2014 | | | 3,365,916 | | |
| New World Gaming Partners, Ltd. | | | |
| | 9,697,552 | | | Term Loan, 6.26%, Maturing June 30, 2014 | | | 4,848,776 | | |
| | 954,167 | | | Term Loan, 6.55%, Maturing June 30, 2014 | | | 477,083 | | |
| Penn National Gaming, Inc. | | | |
| | 13,768,775 | | | Term Loan, 5.01%, Maturing October 3, 2012 | | | 11,512,224 | | |
| Scandic Hotels | | | |
| EUR | 1,724,568 | | | Term Loan, 6.80%, Maturing April 25, 2015 | | | 1,512,989 | | |
| EUR | 1,724,568 | | | Term Loan, 7.30%, Maturing April 25, 2016 | | | 1,512,989 | | |
| Venetian Casino Resort/Las Vegas Sands Inc. | | | |
| | 23,041,667 | | | Term Loan, 5.52%, Maturing May 23, 2014 | | | 13,254,719 | | |
| | 8,984,150 | | | Term Loan, 5.52%, Maturing May 14, 2014 | | | 5,168,132 | | |
| VML US Finance, LLC | | | |
| | 3,333,333 | | | Term Loan, 6.02%, Maturing May 25, 2012 | | | 2,141,667 | | |
| | 2,000,000 | | | Term Loan, 6.02%, Maturing May 25, 2013 | | | 1,285,000 | | |
| | | | | | | $ | 87,249,176 | | |
| Nonferrous Metals / Minerals — 0.9% | | | |
| Compass Minerals Group, Inc. | | | |
| | 1,286,731 | | | Term Loan, 5.28%, Maturing December 22, 2012 | | $ | 1,169,317 | | |
| Euramax International, Inc. | | | |
| | 1,408,661 | | | Term Loan, 8.00%, Maturing June 28, 2012 | | | 727,809 | | |
| GBP | 894,902 | | | Term Loan, 10.60%, Maturing June 29, 2012 | | | 720,105 | | |
Principal
Amount* | | Borrower/Tranche Description | | Value | |
| Nonferrous Metals / Minerals (continued) | | | |
| Murray Energy Corp. | | | |
| | 7,599,536 | | | Term Loan, 6.94%, Maturing January 28, 2010 | | $ | 6,611,597 | | |
| Noranda Aluminum Acquisition | | | |
| | 1,955,586 | | | Term Loan, 4.81%, Maturing May 18, 2014 | | | 1,564,469 | | |
| Novelis, Inc. | | | |
| | 2,014,321 | | | Term Loan, 5.77%, Maturing June 28, 2014 | | | 1,438,225 | | |
| | 4,431,505 | | | Term Loan, 5.77%, Maturing June 28, 2014 | | | 3,164,095 | | |
| Oxbow Carbon and Mineral Holdings | | | |
| | 1,361,188 | | | Term Loan, 5.76%, Maturing May 8, 2014 | | | 986,861 | | |
| | 15,204,484 | | | Term Loan, 5.76%, Maturing May 8, 2014 | | | 11,023,251 | | |
| Tube City IMS Corp. | | | |
| | 1,317,770 | | | Term Loan, 5.76%, Maturing January 25, 2014 | | | 905,967 | | |
| | 162,162 | | | Term Loan, 5.76%, Maturing January 25, 2014 | | | 111,486 | | |
| | | | | | | $ | 28,423,182 | | |
| Oil and Gas — 1.5% | | | |
| Atlas Pipeline Partners, L.P. | | | |
| | 4,960,000 | | | Term Loan, 5.68%, Maturing July 20, 2014 | | $ | 4,079,600 | | |
| Citgo Petroleum Corp. | | | |
| | 4,815,195 | | | Term Loan, 3.39%, Maturing November 15, 2012 | | | 3,599,358 | | |
| Dresser, Inc. | | | |
| | 6,094,561 | | | Term Loan, 5.07%, Maturing May 4, 2014 | | | 4,435,701 | | |
| Dynegy Holdings, Inc. | | | |
| | 26,178,793 | | | Term Loan, 4.62%, Maturing April 2, 2013 | | | 19,394,113 | | |
| | 1,281,362 | | | Term Loan, 4.62%, Maturing April 2, 2013 | | | 949,275 | | |
| Enterprise GP Holdings, L.P. | | | |
| | 2,400,000 | | | Term Loan, 6.68%, Maturing October 31, 2014 | | | 2,028,000 | | |
| Hercules Offshore, Inc. | | | |
| | 3,268,551 | | | Term Loan, 5.64%, Maturing July 6, 2013 | | | 2,230,786 | | |
| Targa Resources, Inc. | | | |
| | 5,547,335 | | | Term Loan, 5.14%, Maturing October 31, 2012 | | | 4,238,164 | | |
| | 4,983,805 | | | Term Loan, 5.97%, Maturing October 31, 2012 | | | 3,807,627 | | |
| | | | | | | $ | 44,762,624 | | |
| Publishing — 8.6% | | | |
| American Media Operations, Inc. | | | |
| | 19,538,711 | | | Term Loan, 7.56%, Maturing January 31, 2013 | | $ | 13,139,783 | | |
| Aster Zweite Beteiligungs GmbH | | | |
| | 6,825,000 | | | Term Loan, 6.13%, Maturing September 27, 2013 | | | 4,282,687 | | |
| EUR | 708,499 | | | Term Loan, 7.54%, Maturing September 27, 2013 | | | 573,416 | | |
| Black Press US Partnership | | | |
| | 917,429 | | | Term Loan, 4.81%, Maturing August 2, 2013 | | | 600,916 | | |
| | 1,511,059 | | | Term Loan, 4.81%, Maturing August 2, 2013 | | | 989,744 | | |
See notes to financial statements
29
Floating Rate Portfolio as of October 31, 2008
PORTFOLIO OF INVESTMENTS CONT'D
Principal
Amount* | | Borrower/Tranche Description | | Value | |
| Publishing (continued) | | | |
| CanWest MediaWorks, Ltd. | | | |
| | 7,307,500 | | | Term Loan, 4.81%, Maturing July 10, 2014 | | $ | 5,224,862 | | |
| Dex Media West, LLC | | | |
| | 6,355,000 | | | Term Loan, 7.54%, Maturing October 24, 2014 | | | 3,539,735 | | |
| GateHouse Media Operating, Inc. | | | |
| | 13,275,000 | | | Term Loan, 4.81%, Maturing August 28, 2014 | | | 3,274,504 | | |
| | 1,825,000 | | | Term Loan, 4.98%, Maturing August 28, 2014 | | | 450,167 | | |
| | 7,750,000 | | | Term Loan, 5.07%, Maturing August 28, 2014 | | | 3,584,375 | | |
| Hanley-Wood, LLC | | | |
| | 7,443,750 | | | Term Loan, 5.28%, Maturing March 8, 2014 | | | 3,963,797 | | |
| Idearc, Inc. | | | |
| | 42,971,296 | | | Term Loan, 5.74%, Maturing November 17, 2014 | | | 18,549,291 | | |
| Josten's Corp. | | | |
| | 2,000,000 | | | Revolving Loan, 3.51%, Maturing October 4, 2009(2) | | | 1,920,000 | | |
| Local Insight Regatta Holdings, Inc. | | | |
| | 1,745,625 | | | Term Loan, 7.77%, Maturing April 23, 2015 | | | 1,443,051 | | |
| MediaNews Group, Inc. | | | |
| | 7,349,213 | | | Term Loan, 5.82%, Maturing August 25, 2010 | | | 4,042,067 | | |
| | 3,351,985 | | | Term Loan, 7.07%, Maturing August 2, 2013 | | | 1,759,792 | | |
| Mediannuaire Holding | | | |
| EUR | 7,000,000 | | | Term Loan, 6.62%, Maturing October 24, 2013 | | | 4,868,778 | | |
| EUR | 1,937,631 | | | Term Loan, 7.38%, Maturing October 10, 2014 | | | 1,101,033 | | |
| EUR | 1,937,631 | | | Term Loan, 7.88%, Maturing October 10, 2015 | | | 1,101,033 | | |
| Merrill Communications, LLC | | | |
| | 10,274,457 | | | Term Loan, 5.98%, Maturing February 9, 2009 | | | 6,678,397 | | |
| Nebraska Book Co., Inc. | | | |
| | 8,955,347 | | | Term Loan, 6.38%, Maturing March 4, 2011 | | | 6,537,403 | | |
| Nelson Education, Ltd. | | | |
| | 297,000 | | | Term Loan, 6.26%, Maturing July 5, 2014 | | | 245,025 | | |
| Newspaper Holdings, Inc. | | | |
| | 20,650,000 | | | Term Loan, 4.38%, Maturing July 24, 2014 | | | 14,455,000 | | |
| Nielsen Finance, LLC | | | |
| | 35,008,125 | | | Term Loan, 4.80%, Maturing August 9, 2013 | | | 25,520,923 | | |
| Philadelphia Newspapers, LLC | | | |
| | 5,002,642 | | | Term Loan, 7.25%, Maturing June 29, 2013 | | | 1,500,793 | | |
| R.H. Donnelley Corp. | | | |
| | 27,246,954 | | | Term Loan, 6.85%, Maturing June 30, 2010 | | | 17,307,483 | | |
| | 6,330,158 | | | Term Loan, 6.76%, Maturing June 30, 2011 | | | 4,138,341 | | |
| Reader's Digest Association, Inc. (The) | | | |
| | 8,000,000 | | | Revolving Loan, 4.50%, Maturing March 2, 2013(2) | | | 4,840,000 | | |
| | 36,412,932 | | | Term Loan, 5.23%, Maturing March 2, 2014 | | | 18,570,595 | | |
| Seat Pagine Gialle SpA | | | |
| EUR | 6,526,833 | | | Term Loan, 4.61%, Maturing May 25, 2012 | | | 5,690,043 | | |
| SGS International, Inc. | | | |
| | 980,959 | | | Term Loan, 6.27%, Maturing December 30, 2011 | | | 721,005 | | |
| | 1,108,751 | | | Term Loan, 6.27%, Maturing December 30, 2011 | | | 814,932 | | |
Principal
Amount* | | Borrower/Tranche Description | | Value | |
| Publishing (continued) | | | |
| Source Interlink Companies, Inc. | | | |
| | 4,974,811 | | | Term Loan, 6.47%, Maturing August 1, 2014 | | $ | 3,357,997 | | |
| Source Media, Inc. | | | |
| | 10,428,574 | | | Term Loan, 8.77%, Maturing November 8, 2011 | | | 7,039,287 | | |
| Springer Science+Business Media | | | |
| | 1,408,469 | | | Term Loan, 5.13%, Maturing May 5, 2010 | | | 1,197,198 | | |
| | 8,560 | | | Term Loan, 6.14%, Maturing May 5, 2011 | | | 6,013 | | |
| | 1,759,273 | | | Term Loan, 6.51%, Maturing May 5, 2012 | | | 1,235,889 | | |
| | 1,508,560 | | | Term Loan, 6.51%, Maturing May 5, 2012 | | | 1,059,763 | | |
| Star Tribune Co. (The) | | | |
| | 8,196,250 | | | Term Loan, 5.05%, Maturing March 5, 2014(5) | | | 2,602,309 | | |
| Thomas Nelson, Inc. | | | |
| | 1,595,047 | | | Term Loan, 5.75%, Maturing June 12, 2012 | | | 1,284,013 | | |
| TL Acquisitions, Inc. | | | |
| | 2,969,500 | | | Term Loan, 5.62%, Maturing July 5, 2014 | | | 2,228,776 | | |
| Trader Media Corp. | | | |
| GBP | 17,310,500 | | | Term Loan, 8.26%, Maturing March 23, 2015 | | | 14,416,853 | | |
| Tribune Co. | | | |
| | 4,790,857 | | | Term Loan, 7.08%, Maturing May 17, 2009 | | | 3,770,405 | | |
| | 14,924,623 | | | Term Loan, 6.00%, Maturing May 17, 2014 | | | 5,522,111 | | |
| | 8,553,067 | | | Term Loan, 6.00%, Maturing May 17, 2014 | | | 3,840,327 | | |
| World Directories Acquisition | | | |
| EUR | 8,776,758 | | | Term Loan, 6.72%, Maturing May 31, 2014 | | | 6,823,715 | | |
| Xsys, Inc. | | | |
| | 7,701,575 | | | Term Loan, 6.13%, Maturing September 27, 2013 | | | 4,832,738 | | |
| EUR | 2,750,000 | | | Term Loan, 7.54%, Maturing September 27, 2013 | | | 2,225,683 | | |
| EUR | 791,501 | | | Term Loan, 7.54%, Maturing September 27, 2013 | | | 640,593 | | |
| | 7,866,565 | | | Term Loan, 6.13%, Maturing September 27, 2014 | | | 4,936,269 | | |
| EUR | 2,750,000 | | | Term Loan, 7.54%, Maturing September 27, 2014 | | | 2,225,683 | | |
| EUR | 1,000,000 | | | Term Loan - Second Lien, 9.37%,
Maturing September 27, 2015 | | | 414,229 | | |
| Yell Group, PLC | | | |
| | 19,025,000 | | | Term Loan, 6.12%, Maturing February 10, 2013 | | | 13,127,250 | | |
| | | | | | | $ | 264,216,072 | | |
| Radio and Television — 5.1% | | | |
| Block Communications, Inc. | | | |
| | 6,909,637 | | | Term Loan, 5.27%, Maturing December 22, 2011 | | $ | 5,562,258 | | |
| Citadel Broadcasting Corp. | | | |
| | 32,925,000 | | | Term Loan, 5.07%, Maturing June 12, 2014 | | | 17,944,125 | | |
| CMP Susquehanna Corp. | | | |
| | 2,000,000 | | | Term Loan, 5.06%, Maturing May 5, 2011(2) | | | 1,510,000 | | |
| | 10,173,184 | | | Term Loan, 5.17%, Maturing May 5, 2013 | | | 4,577,933 | | |
| Cumulus Media, Inc. | | | |
| | 14,268,940 | | | Term Loan, 4.76%, Maturing June 11, 2014 | | | 8,311,658 | | |
See notes to financial statements
30
Floating Rate Portfolio as of October 31, 2008
PORTFOLIO OF INVESTMENTS CONT'D
Principal
Amount* | | Borrower/Tranche Description | | Value | |
| Radio and Television (continued) | | | |
| Discovery Communications, Inc. | | | |
| | 6,462,938 | | | Term Loan, 5.76%, Maturing April 30, 2014 | | $ | 5,357,776 | | |
| Emmis Operating Co. | | | |
| | 6,027,289 | | | Term Loan, 5.54%, Maturing November 2, 2013 | | | 3,465,691 | | |
| Entravision Communications Corp. | | | |
| | 897,560 | | | Term Loan, 6.38%, Maturing September 29, 2013 | | | 616,325 | | |
| Gray Television, Inc. | | | |
| | 8,700,058 | | | Term Loan, 5.04%, Maturing January 19, 2015 | | | 4,959,033 | | |
| HIT Entertainment, Inc. | | �� | |
| | 1,445,882 | | | Term Loan, 4.80%, Maturing March 20, 2012 | | | 903,676 | | |
| Local TV Finance, LLC | | | |
| | 1,975,000 | | | Term Loan, 4.87%, Maturing May 7, 2013 | | | 1,194,875 | | |
| NEP II, Inc. | | | |
| | 5,313,997 | | | Term Loan, 6.01%, Maturing February 16, 2014 | | | 3,905,788 | | |
| Nexstar Broadcasting, Inc. | | | |
| | 10,874,645 | | | Term Loan, 5.51%, Maturing October 1, 2012 | | | 7,557,878 | | |
| | 8,310,941 | | | Term Loan, 5.51%, Maturing October 1, 2012 | | | 5,776,104 | | |
| NextMedia Operating, Inc. | | | |
| | 690,164 | | | Term Loan, 7.26%, Maturing November 15, 2012 | | | 472,762 | | |
| | 307,803 | | | Term Loan, 8.28%, Maturing November 15, 2012 | | | 210,845 | | |
| PanAmSat Corp. | | | |
| | 6,420,136 | | | Term Loan, 6.65%, Maturing January 3, 2014 | | | 5,328,713 | | |
| | 6,418,195 | | | Term Loan, 6.65%, Maturing January 3, 2014 | | | 5,327,102 | | |
| | 6,418,195 | | | Term Loan, 6.65%, Maturing January 3, 2014 | | | 5,327,102 | | |
| Paxson Communications Corp. | | | |
| | 14,925,000 | | | Term Loan, 8.00%, Maturing January 15, 2012 | | | 8,283,375 | | |
| Raycom TV Broadcasting, LLC | | | |
| | 8,333,373 | | | Term Loan, 3.69%, Maturing June 25, 2014 | | | 6,875,032 | | |
| Spanish Broadcasting System, Inc. | | | |
| | 11,785,273 | | | Term Loan, 5.52%, Maturing June 10, 2012 | | | 5,465,420 | | |
| Tyrol Acquisition 2 SAS | | | |
| EUR | 6,300,000 | | | Term Loan, 6.50%, Maturing January 19, 2015 | | | 4,898,096 | | |
| EUR | 6,300,000 | | | Term Loan, 7.40%, Maturing January 19, 2016 | | | 4,898,096 | | |
| Univision Communications, Inc. | | | |
| | 6,219,313 | | | Term Loan - Second Lien, 5.50%,
Maturing March 29, 2009 | | | 5,457,447 | | |
| | 45,733,221 | | | Term Loan, 5.25%, Maturing September 29, 2014 | | | 24,856,006 | | |
| Young Broadcasting, Inc. | | | |
| | 8,305,988 | | | Term Loan, 6.30%, Maturing November 3, 2012 | | | 5,492,334 | | |
| | 975,000 | | | Term Loan, 6.56%, Maturing November 3, 2012 | | | 644,719 | | |
| | | | | | | $ | 155,180,169 | | |
| Rail Industries — 0.4% | | | |
| Kansas City Southern Railway Co. | | | |
| | 7,916,324 | | | Term Loan, 5.21%, Maturing April 26, 2013 | | $ | 6,847,620 | | |
| | 1,975,000 | | | Term Loan, 5.06%, Maturing April 28, 2013 | | | 1,678,750 | | |
Principal
Amount* | | Borrower/Tranche Description | | Value | |
| Rail Industries (continued) | | | |
| Rail America, Inc. | | | |
| | 243,200 | | | Term Loan, 7.88%, Maturing August 14, 2009 | | $ | 217,664 | | |
| | 3,756,800 | | | Term Loan, 7.88%, Maturing August 13, 2010 | | | 3,362,336 | | |
| | | | | | | $ | 12,106,370 | | |
| Retailers (Except Food and Drug) — 2.1% | | | |
| American Achievement Corp. | | | |
| | 4,418,922 | | | Term Loan, 5.07%, Maturing March 25, 2011 | | $ | 3,977,029 | | |
| Amscan Holdings, Inc. | | | |
| | 4,407,875 | | | Term Loan, 5.41%, Maturing May 25, 2013 | | | 3,305,906 | | |
| Claire's Stores, Inc. | | | |
| | 5,996,762 | | | Term Loan, 5.85%, Maturing May 24, 2014 | | | 2,975,893 | | |
| Cumberland Farms, Inc. | | | |
| | 2,872,976 | | | Term Loan, 5.26%, Maturing September 29, 2013 | | | 2,370,205 | | |
| Harbor Freight Tools USA, Inc. | | | |
| | 7,972,206 | | | Term Loan, 5.43%, Maturing July 15, 2010 | | | 5,739,989 | | |
| Josten's Corp. | | | |
| | 5,046,422 | | | Term Loan, 5.17%, Maturing October 4, 2011 | | | 4,207,454 | | |
| Mapco Express, Inc. | | | |
| | 3,209,939 | | | Term Loan, 5.93%, Maturing April 28, 2011 | | | 2,006,212 | | |
| Neiman Marcus Group, Inc. | | | |
| | 1,742,467 | | | Term Loan, 4.57%, Maturing April 5, 2013 | | | 1,324,820 | | |
| Orbitz Worldwide, Inc. | | | |
| | 9,657,475 | | | Term Loan, 6.39%, Maturing July 25, 2014 | | | 6,204,928 | | |
| Oriental Trading Co., Inc. | | | |
| | 2,000,000 | | | Term Loan - Second Lien, 9.12%,
Maturing January 31, 2013 | | | 833,334 | | |
| | 13,291,547 | | | Term Loan, 5.25%, Maturing July 31, 2013 | | | 8,157,687 | | |
| Rent-A-Center, Inc. | | | |
| | 5,877,295 | | | Term Loan, 4.95%, Maturing November 15, 2012 | | | 4,760,609 | | |
| Rover Acquisition Corp. | | | |
| | 1,960,050 | | | Term Loan, 5.74%, Maturing October 26, 2013 | | | 1,475,918 | | |
| Savers, Inc. | | | |
| | 2,775,838 | | | Term Loan, 5.75%, Maturing August 11, 2012 | | | 2,192,912 | | |
| | 3,036,743 | | | Term Loan, 5.75%, Maturing August 11, 2012 | | | 2,399,027 | | |
| The Yankee Candle Company, Inc. | | | |
| | 6,171,985 | | | Term Loan, 5.76%, Maturing February 6, 2014 | | | 4,166,090 | | |
| Vivarte | | | |
| EUR | 5,688,988 | | | Term Loan, 7.20%, Maturing May 29, 2015 | | | 3,159,319 | | |
| EUR | 247,396 | | | Term Loan, 7.20%, Maturing May 29, 2015 | | | 137,389 | | |
| EUR | 63,616 | | | Term Loan, 7.20%, Maturing May 29, 2015 | | | 35,329 | | |
| EUR | 5,688,988 | | | Term Loan, 7.70%, Maturing May 29, 2016 | | | 3,159,319 | | |
| EUR | 247,396 | | | Term Loan, 7.70%, Maturing May 29, 2016 | | | 137,389 | | |
| EUR | 63,616 | | | Term Loan, 7.70%, Maturing May 29, 2016 | | | 35,328 | | |
| | | | | | | $ | 62,762,086 | | |
See notes to financial statements
31
Floating Rate Portfolio as of October 31, 2008
PORTFOLIO OF INVESTMENTS CONT'D
Principal
Amount* | | Borrower/Tranche Description | | Value | |
| Steel — 0.1% | | | |
| Algoma Acquisition Corp. | | | |
| | 2,313,070 | | | Term Loan, 6.00%, Maturing June 20, 2013 | | $ | 1,873,586 | | |
| | | | | | | $ | 1,873,586 | | |
| Surface Transport — 0.4% | | | |
| Delphi Acquisition Holding, Inc. | | | |
| | 282,788 | | | Term Loan, 5.05%, Maturing April 10, 2015 | | $ | 173,915 | | |
| | 1,183,488 | | | Term Loan, 6.01%, Maturing April 10, 2015 | | | 727,845 | | |
| | 1,466,276 | | | Term Loan, 6.64%, Maturing April 10, 2016 | | | 901,760 | | |
| Ozburn-Hessey Holding Co., LLC | | | |
| | 3,877,326 | | | Term Loan, 6.61%, Maturing August 9, 2012 | | | 3,470,207 | | |
| Swift Transportation Co., Inc. | | | |
| | 6,000,000 | | | Term Loan, 4.09%, Maturing May 10, 2012 | | | 3,829,998 | | |
| | 8,084,884 | | | Term Loan, 6.06%, Maturing May 10, 2014 | | | 4,689,233 | | |
| | | | | | | $ | 13,792,958 | | |
| Telecommunications — 3.6% | | | |
| Alaska Communications Systems Holdings, Inc. | | | |
| | 2,612,663 | | | Term Loan, 5.51%, Maturing February 1, 2012 | | $ | 2,138,029 | | |
| | 8,111,697 | | | Term Loan, 5.51%, Maturing February 1, 2012 | | | 6,638,070 | | |
| Alltell Communication | | | |
| | 6,964,824 | | | Term Loan, 5.32%, Maturing May 16, 2014 | | | 6,647,925 | | |
| | 7,766,500 | | | Term Loan, 5.50%, Maturing May 16, 2015 | | | 7,434,001 | | |
| Asurion Corp. | | | |
| | 16,000,000 | | | Term Loan, 6.06%, Maturing July 13, 2012 | | | 11,973,328 | | |
| | 2,000,000 | | | Term Loan - Second Lien, 10.84%,
Maturing January 13, 2013 | | | 1,346,666 | | |
| BCM Luxembourg, Ltd. | | | |
| EUR | 2,500,000 | | | Term Loan, 6.38%, Maturing September 30, 2014 | | | 2,032,200 | | |
| EUR | 2,500,000 | | | Term Loan, 6.63%, Maturing September 30, 2015 | | | 2,032,200 | | |
| Cellular South, Inc. | | | |
| | 2,981,250 | | | Term Loan, 4.75%, Maturing May 29, 2014 | | | 2,519,156 | | |
| | 6,852,003 | | | Term Loan, 5.08%, Maturing May 29, 2014 | | | 5,789,943 | | |
| Centennial Cellular Operating Co., LLC | | | |
| | 4,500,000 | | | Revolving Loan, 0.00%, Maturing February 9, 2010(2) | | | 3,982,500 | | |
| | 9,147,788 | | | Term Loan, 5.64%, Maturing February 9, 2011 | | | 7,867,097 | | |
| CommScope, Inc. | | | |
| | 12,293,609 | | | Term Loan, 6.10%, Maturing November 19, 2014 | | | 9,466,079 | | |
| FairPoint Communications, Inc. | | | |
| | 4,100,000 | | | Term Loan, 5.75%, Maturing March 31, 2015 | | | 2,895,625 | | |
| Intelsat Subsidiary Holding Co. | | | |
| | 7,656,094 | | | Term Loan, 6.65%, Maturing July 3, 2013 | | | 6,344,988 | | |
Principal
Amount* | | Borrower/Tranche Description | | Value | |
| Telecommunications (continued) | | | |
| IPC Systems, Inc. | | | |
| | 9,134,375 | | | Term Loan, 6.01%, Maturing May 31, 2014 | | $ | 4,727,039 | | |
| GBP | 3,413,946 | | | Term Loan, 8.56%, Maturing May 31, 2014 | | | 2,747,117 | | |
| Macquarie UK Broadcast Ventures, Ltd. | | | |
| GBP | 6,867,100 | | | Term Loan, 7.67%, Maturing December 26, 2014 | | | 8,661,665 | | |
| NTelos, Inc. | | | |
| | 5,835,022 | | | Term Loan, 5.37%, Maturing August 24, 2011 | | | 5,022,980 | | |
| Palm, Inc. | | | |
| | 5,791,500 | | | Term Loan, 7.27%, Maturing April 24, 2014 | | | 3,243,240 | | |
| Telesat Canada, Inc. | | | |
| | 4,640,019 | | | Term Loan, 6.34%, Maturing October 22, 2014 | | | 3,553,480 | | |
| | 398,514 | | | Term Loan, 6.59%, Maturing October 22, 2014 | | | 305,195 | | |
| Windstream Corp. | | | |
| | 4,333,187 | | | Term Loan, 6.05%, Maturing July 17, 2013 | | | 3,787,747 | | |
| | | | | | | $ | 111,156,270 | | |
| Utilities — 1.7% | | | |
| AEI Finance Holding, LLC | | | |
| | 1,604,820 | | | Revolving Loan, 6.76%, Maturing March 30, 2012 | | $ | 1,067,205 | | |
| | 10,429,675 | | | Term Loan, 6.76%, Maturing March 30, 2014 | | | 6,935,734 | | |
| BRSP, LLC | | | |
| | 13,750,825 | | | Term Loan, 5.86%, Maturing July 13, 2009 | | | 9,823,590 | | |
| Covanta Energy Corp. | | | |
| | 2,909,601 | | | Term Loan, 3.95%, Maturing February 9, 2014 | | | 2,424,667 | | |
| | 4,831,525 | | | Term Loan, 4.63%, Maturing February 9, 2014 | | | 4,026,269 | | |
| NRG Energy, Inc. | | | |
| | 8,553,146 | | | Term Loan, 5.26%, Maturing June 1, 2014 | | | 7,448,362 | | |
| | 17,415,269 | | | Term Loan, 5.26%, Maturing June 1, 2014 | | | 15,165,791 | | |
| NSG Holdings, LLC | | | |
| | 202,483 | | | Term Loan, 4.32%, Maturing June 15, 2014 | | | 157,937 | | |
| | 1,474,705 | | | Term Loan, 4.32%, Maturing June 15, 2014 | | | 1,150,270 | | |
| TXU Texas Competitive Electric Holdings Co., LLC | | | |
| | 4,261,750 | | | Term Loan, 6.44%, Maturing October 10, 2014 | | | 3,327,361 | | |
| | 1,286,788 | | | Term Loan, 6.66%, Maturing October 10, 2014 | | | 1,009,413 | | |
| | | | | | | $ | 52,536,599 | | |
Total Senior Floating-Rate Interests
(identified cost $4,393,174,631) | | $ | 3,064,536,920 | | |
See notes to financial statements
32
Floating Rate Portfolio as of October 31, 2008
PORTFOLIO OF INVESTMENTS CONT'D
| Corporate Bonds & Notes — 0.3% | | | |
Principal
Amount
(000's omitted) | | Security | | Value | |
| Commercial Services — 0.0% | | | |
| Environmental Systems Products, Inc., Junior Notes (PIK) | | | |
| $ | 1,346 | | | 18.00%, 3/31/15(3) | | $ | 107,680 | | |
| | | | | | | $ | 107,680 | | |
| Electronics / Electrical — 0.1% | | | |
| NXP BV/NXP Funding, LLC, Variable Rate | | | |
| $ | 6,300 | | | 7.503%, 10/15/13 | | $ | 2,795,625 | | |
| | | | | | | $ | 2,795,625 | | |
| Radio and Television — 0.1% | | | |
| Paxson Communications Corp., Variable Rate | | | |
| $ | 3,000 | | | 8.003%, 1/15/12(6) | | $ | 1,665,000 | | |
| | | | | | | $ | 1,665,000 | | |
| Telecommunications — 0.1% | | | |
| Qwest Corp., Sr. Notes, Variable Rate | | | |
| $ | 5,850 | | | 6.069%, 6/15/13 | | $ | 4,270,500 | | |
| | | | | | | $ | 4,270,500 | | |
Total Corporate Bonds & Notes
(identified cost $15,169,200) | | $ | 8,838,505 | | |
| Common Stocks — 0.0% | | | |
| Shares | | Security | | Value | |
| Automotive — 0.0% | | | |
| | 105,145 | | | Hayes Lemmerz International(8) | | $ | 139,843 | | |
| | | | | | | $ | 139,843 | | |
| Commercial Services — 0.0% | | | |
| | 2,484 | | | Environmental Systems Products Holdings, Inc.(3)(8)(9) | | $ | 0 | | |
| | | | | | | $ | 0 | | |
Total Common Stocks
(identified cost $1,051,450) | | $ | 139,843 | | |
| Asset Backed Securities — 0.3% | | | |
Principal
Amount
(000's omitted) | | Security | | Value | |
| Alzette European CLO SA, Series 2004-1A, Class E2, | | | |
| $ | 955 | | | 11.86%, 12/15/20(6)(7) | | $ | 675,576 | | |
| Assemblies of God Financial Real Estate, Series 2004-1A, Class A, | | | |
| | 4,234 | | | 4.954%, 6/15/29(6)(7) | | | 3,673,526 | | |
| Avalon Capital Ltd. 3, Series 1A, Class D, | | | |
| | 1,140 | | | 4.761%, 2/24/19(6)(7) | | | 446,082 | | |
| Babson Ltd., Series 2005-1A, Class C1, | | | |
| | 1,500 | | | 6.703%, 4/15/19(6)(7) | | | 516,300 | | |
| Bryant Park CDO Ltd., Series 2005-1A, Class C, | | | |
| | 1,500 | | | 6.803%, 1/15/19(6)(7) | | | 540,300 | | |
| Carlyle High Yield Partners, Series 2004-6A, Class C, | | | |
| | 1,500 | | | 5.253%, 8/11/16(6)(7) | | | 614,400 | | |
| Centurion CDO 8 Ltd., Series 2005-8A, Class D, | | | |
| | 1,000 | | | 8.315%, 3/8/17(7) | | | 438,500 | | |
Morgan Stanley Investment Management Croton, Ltd.,
Series 2005-1A, Class D, | | | |
| | 2,000 | | | 6.769%, 1/15/18(6)(7) | | | 693,800 | | |
Total Asset Backed Securities
(identified cost $13,771,129) | | $ | 7,598,484 | | |
| Preferred Stocks — 0.0% | | | |
| Shares | | Security | | Value | |
| Automotive — 0.0% | | | |
| | 350 | | | Hayes Lemmerz International(8)(9) | | $ | 2,593 | | |
| | | | | | | $ | 2,593 | | |
| Commercial Services — 0.0% | | | |
| | 1,138 | | | Environmental Systems Products Holdings,
Series A(3)(8)(9) | | $ | 26,140 | | |
| | | | | | | $ | 26,140 | | |
Total Preferred Stocks
(identified cost $37,415) | | $ | 28,733 | | |
| Closed-End Investment Companies — 0.0% | | | |
| Shares | | Security | | Value | |
| | 4,000 | | | Pioneer Floating Rate Trust | | $ | 37,440 | | |
Total Closed-End Investment Companies
(identified cost $72,148) | | $ | 37,440 | | |
See notes to financial statements
33
Floating Rate Portfolio as of October 31, 2008
PORTFOLIO OF INVESTMENTS CONT'D
| Short-Term Investments — 2.9% | |
| Description | | Interest
(000's omitted) | | Value | |
| Cash Management Portfolio, 1.90%(10) | | $ | 89,685 | | | $ | 89,684,741 | | |
Total Short-Term Investments
(identified cost $89,684,741) | | $ | 89,684,741 | | |
Total Investments — 103.8%
(identified cost $4,512,961,904) | | $ | 3,170,864,966 | | |
Less Unfunded Loan
Commitments — (2.1)% | | $ | (64,511,676 | ) | |
Net Investments — 101.6%
(identified cost $4,448,449,038) | | $ | 3,106,353,290 | | |
| Other Assets, Less Liabilities — (1.6)% | | $ | (50,142,942 | ) | |
| Net Assets — 100.0% | | $ | 3,056,210,348 | | |
DIP - Debtor in Possession
CHF - Swiss Franc
EUR - Euro
GBP - British Pound Sterling
* In U.S. dollars unless otherwise indicated.
(1) Senior floating-rate interests (Senior Loans) often require prepayments from excess cash flows or permit the borrowers to repay at their election. The degree to which borrowers repay, whether as a contractual requirement or at their election, cannot be predicted with accuracy. As a result, the actual remaining maturity may be substantially less than the stated maturities shown. However, Senior Loans will have an expected average life of approximately two to four years. The stated interest rate represents the weighted average interest rate of all contracts within the senior loan facility. Senior Loans typically have rates of interest which are redetermined either daily, monthly, quarterly or semi-annually by reference to a base lending rate, plus a premium. These base lending rates are primarily the London-Interbank Offered Rate ("LI BOR"), and secondarily the prime rate offered by one or more major United States banks (the "Prime Rate") and the certificate of deposit ("CD") rate or other base lending rates used by commercial lenders.
(2) Unfunded or partially unfunded loan commitments. See Note 1G for description.
(3) Security valued at fair value using methods determined in good faith by or at the direction of the Trustees.
(4) This Senior Loan will settle after October 31, 2008, at which time the interest rate will be determined.
(5) Defaulted security. Currently the issuer is in default with respect to interest payments.
(6) Security exempt from registration under Rule 144A of the Securities Act of 1933. These securities may be sold in transactions exempt from registration, normally to qualified institutional buyers. At October 31, 2008, the aggregate value of the securities is $8,824,984 or 0.3% of the Portfolio's net assets.
(7) Variable rate security. The stated interest rate represents the rate in effect at October 31, 2008.
(8) Non-income producing security.
(9) Restricted security.
(10) Affiliated investment company available to Eaton Vance portfolios and funds which invests in high quality, U.S. dollar denominated money market instruments. The rate shown is the annualized seven-day yield as of October 31, 2008.
See notes to financial statements
34
Floating Rate Portfolio as of October 31, 2008
FINANCIAL STATEMENTS
Statement of Assets and Liabilities
As of October 31, 2008
| Assets | |
| Unaffiliated investments, at value (identified cost, $4,358,764,297) | | $ | 3,016,668,549 | | |
| Affiliated investment, at value (identified cost, $89,684,741) | | | 89,684,741 | | |
| Cash | | | 6,680,852 | | |
| Foreign currency, at value (identified cost, $427,630) | | | 422,266 | | |
| Receivable for investments sold | | | 12,925,104 | | |
| Dividends and interest receivable | | | 26,264,772 | | |
| Interest receivable from affiliated investment | | | 59,234 | | |
| Receivable for open forward foreign currency contracts | | | 5,655,728 | | |
| Receivable for closed swap contracts | | | 29,078 | | |
| Other assets | | | 460,063 | | |
| Total assets | | $ | 3,158,850,387 | | |
| Liabilities | |
| Demand note payable | | $ | 95,000,000 | | |
| Payable for investments purchased | | | 5,635,000 | | |
| Payable to affiliate for investment adviser fee | | | 1,486,533 | | |
| Payable to affiliate for Trustees' fees | | | 4,208 | | |
| Accrued expenses | | | 514,298 | | |
| Total liabilities | | $ | 102,640,039 | | |
| Net Assets applicable to investors' interest in Portfolio | | $ | 3,056,210,348 | | |
| Sources of Net Assets | |
| Net proceeds from capital contributions and withdrawals | | $ | 4,390,444,310 | | |
| Net unrealized depreciation (computed on the basis of identified cost) | | | (1,334,233,962 | ) | |
| Total | | $ | 3,056,210,348 | | |
Statement of Operations
For the Year Ended
October 31, 2008
| Investment Income | |
| Interest | | $ | 330,634,108 | | |
| Dividends | | | 8,326 | | |
| Interest income allocated from affiliated investment | | | 1,994,996 | | |
| Expenses allocated from affiliated investment | | | (290,973 | ) | |
| Total investment income | | $ | 332,346,457 | | |
| Expenses | |
| Investment adviser fee | | $ | 23,832,329 | | |
| Trustees' fees and expenses | | | 42,363 | | |
| Legal and accounting services | | | 855,248 | | |
| Custodian fee | | | 601,363 | | |
| Interest expense | | | 6,467,294 | | |
| Miscellaneous | | | 267,400 | | |
| Total expenses | | $ | 32,065,997 | | |
Deduct —
Reduction of custodian fee | | $ | 41,071 | | |
| Total expense reductions | | $ | 41,071 | | |
| Net expenses | | $ | 32,024,926 | | |
| Net investment income | | $ | 300,321,531 | | |
| Realized and Unrealized Gain (Loss) | |
Net realized gain (loss) —
Investment transactions (identified cost basis) | | $ | (117,374,984 | ) | |
| Swap contracts | | | 557,608 | | |
Foreign currency and forward foreign currency exchange
contract transactions | | | 56,156,256 | | |
| Net realized loss | | $ | (60,661,120 | ) | |
| Change in unrealized appreciation (depreciation) — | |
| Investments (identified cost basis) | | $ | (1,244,749,851 | ) | |
| Swap contracts | | | (1,169,695 | ) | |
| Foreign currency and forward foreign currency exchange contracts | | | 12,061,061 | | |
| Net change in unrealized appreciation (depreciation) | | $ | (1,233,858,485 | ) | |
| Net realized and unrealized loss | | $ | (1,294,519,605 | ) | |
| Net decrease in net assets from operations | | $ | (994,198,074 | ) | |
See notes to financial statements
35
Floating Rate Portfolio as of October 31, 2008
FINANCIAL STATEMENTS CONT'D
Statements of Changes in Net Assets
Increase (Decrease)
in Net Assets | | Year Ended
October 31, 2008 | | Year Ended
October 31, 2007 | |
From operations —
Net investment income | | $ | 300,321,531 | | | $ | 532,790,844 | | |
Net realized loss from investment
transactions, swap contracts,
and foreign currency and forward
foreign currency exchange
contract transactions | | | (60,661,120 | ) | | | (77,108,718 | ) | |
Net change in unrealized appreciation
(depreciation) of investments,
swap contracts, and foreign
currency and forward foreign
currency exchange contracts | | | (1,233,858,485 | ) | | | (134,160,493 | ) | |
Net increase (decrease) in net assets
from operations | | $ | (994,198,074 | ) | | $ | 321,521,633 | | |
Capital transactions —
Contributions | | $ | 1,218,146,557 | | | $ | 3,205,618,648 | | |
| Withdrawals | | | (4,019,337,678 | ) | | | (4,106,033,877 | ) | |
Net decrease in net assets from
capital transactions | | $ | (2,801,191,121 | ) | | $ | (900,415,229 | ) | |
| Net decrease in net assets | | $ | (3,795,389,195 | ) | | $ | (578,893,596 | ) | |
| Net Assets | |
| At beginning of year | | $ | 6,851,599,543 | | | $ | 7,430,493,139 | | |
| At end of year | | $ | 3,056,210,348 | | | $ | 6,851,599,543 | | |
See notes to financial statements
36
Floating Rate Portfolio as of October 31, 2008
FINANCIAL STATEMENTS CONT'D
Supplementary Data
| | | Year Ended October 31, | |
| | | 2008 | | 2007 | | 2006 | | 2005 | | 2004 | |
| Ratios/Supplemental Data | |
| Ratios (As a percentage of average daily net assets): | |
| Expenses before custodian fee reduction(1) | | | 0.70 | % | | | 0.58 | % | | | 0.54 | % | | | 0.54 | % | | | 0.56 | % | |
| Net investment income | | | 6.50 | % | | | 6.94 | % | | | 6.44 | % | | | 4.68 | % | | | 3.27 | % | |
| Portfolio Turnover | | | 7 | % | | | 61 | % | | | 50 | % | | | 57 | % | | | 67 | % | |
| Total Return | | | (22.24 | )% | | | 4.62 | % | | | 6.36 | % | | | 4.77 | % | | | 3.93 | % | |
| Net assets, end of year (000's omitted) | | $ | 3,056,210 | | | $ | 6,851,600 | | | $ | 7,430,493 | | | $ | 6,506,058 | | | $ | 5,389,638 | | |
(1) Excludes the effect of custody fee credits, if any, of less than 0.005%.
See notes to financial statements
37
Floating Rate Portfolio as of October 31, 2008
NOTES TO FINANCIAL STATEMENTS
1 Significant Accounting Policies
Floating Rate Portfolio (the Portfolio) is a New York trust registered under the Investment Company Act of 1940, as amended (the 1940 Act), as a diversified, open-end management investment company. The Portfolio's investment objective is to provide a high level of current income. The Declaration of Trust permits the Trustees to issue interests in the Portfolio. At October 31, 2008, Eaton Vance Floating-Rate Fund, Eaton Vance Floating-Rate & High Income Fund, Eaton Vance Strategic Income Fund, Eaton Vance Diversified Income Fund, and Eaton Vance Low Duration Fund held an interest of 65.0%, 16.2%, 13.0%, 3.0%, and 0.3%, respectively, in the Portfolio.
The following is a summary of significant accounting policies of the Portfolio. The policies are in conformity with accounting principles generally accepted in the United States of America.
A Investment Valuation — Interests in senior floating-rate loans (Senior Loans) for which reliable market quotations are readily available are valued generally at the average mean of bid and ask quotations obtained from an independent pricing service. Other Senior Loans are valued at fair value by the investment adviser under procedures approved by the Trustees. In fair valuing a Senior Loan, the investment adviser utilizes one or more of the following valuation techniques: (i) a matrix pricing approach that considers the yield on the Senior Loan relative to yields on other loan interests issued by companies of comparable credit quality; (ii) a comparison of the value of the borrower's outstanding equity and deb t to that of comparable public companies; (iii) a discounted cash flow analysis; or (iv) when the investment adviser believes it is likely that a borrower will be liquidated or sold, an analysis of the terms of such liquidation or sale. In certain cases, the investment adviser will use a combination of analytical methods to determine fair value, such as when only a portion of a borrower's assets are likely to be sold. In conducting its assessment and analyses for purposes of determining fair value of a Senior Loan, the investment adviser will use its discretion and judgment in considering and appraising relevant factors. Fair value determinations are made by the portfolio managers of the Portfolio based on information available to such managers. The portfolio managers of other funds managed by the investment adviser that invest in Senior Loans may not possess the same information about a Senior Loan borrower as the portfolio managers of the Portfolio. At times, the fair value of a Senior Loan determined by t he portfolio managers of other funds managed by the investment adviser that invest in Senior Loans may vary from the fair value of the same Senior Loan determined by the portfolio managers of the Portfolio. The fair value of each Senior Loan is periodically reviewed and approved by the investment adviser's Valuation Committee and by the Trustees based upon procedures approved by the Trustees. Junior Loans are valued in the same manner as Senior Loans.
Equity securities listed on a U.S. securities exchange generally are valued at the last sale price on the day of valuation or, if no sales took place on such date, at the mean between the closing bid and asked prices therefore on the exchange where such securities are principally traded. Equity securities listed on the NASDAQ Global or Global Select Market generally are valued at the NASDAQ official closing price. Unlisted or listed securities for which closing sales prices or closing quotations are not available are valued at the mean between the latest available bid and asked prices or, in the case of preferred equity securities that are not listed or traded in the over-the-counter market, by an independent pricing service. Debt obligation, including listed securities and securities for which price quotations are available, will normally be valued on the basis of market quotations provided by independent pricing services. The pricing services consider various factors relating to bonds and/or market transactions to determine market value. Short-term debt securities with a remaining maturity of sixty days or less are valued at amortized cost, which approximates market value. If short-term debt securities are acquired with a remaining maturity of more than sixty days, they will be valued by a pricing service. Credit default swaps are generally valued by a broker-dealer (usually the counterparty for the agreement). Forward foreign currency exchange contracts are generally valued using prices supplied by a pricing vendor. Foreign securities and currencies are valued in U.S. dollars, based on foreign currency exchange rate quotations supplied by an independent quotation service. The independent service uses a proprietary model to determine the exchange rate. Inputs to the model include reported trades and implied bid/ask spreads. Investments for which valuations or market quotations are not readily available are valued at fair value us ing methods determined in good faith by or at the direction of the Trustees of the Portfolio considering relevant factors, data and information including the market value of freely tradable securities of the same class in the principal market on which such securities are normally traded.
The Portfolio may invest in Cash Management Portfolio (Cash Management), an affiliated investment company managed by Boston Management and Research (BMR),
38
Floating Rate Portfolio as of October 31, 2008
NOTES TO FINANCIAL STATEMENTS CONT'D
a subsidiary of Eaton Vance Management (EVM). Cash Management values its investment securities utilizing the amortized cost valuation technique permitted by Rule 2a-7 of the 1940 Act, pursuant to which Cash Management must comply with certain conditions. This technique involves initially valuing a portfolio security at its cost and thereafter assuming a constant amortization to maturity of any discount or premium. If amortized cost is determined not to approximate fair value, Cash Management may value its investment securities based on available market quotations provided by a pricing service.
B Investment Transactions — Investment transactions for financial statement purposes are accounted for on a trade date basis. Realized gains and losses on investments sold are determined on the basis of identified cost.
C Income — Interest income is recorded on the basis of interest accrued, adjusted for amortization of premium or accretion of discount. Fees associated with loan amendments are recognized immediately. Dividend income is recorded on the ex-dividend date for dividends received in cash and/or securities.
D Federal Taxes — The Portfolio has elected to be treated as a partnership for federal tax purposes. No provision is made by the Portfolio for federal or state taxes on any taxable income of the Portfolio because each investor in the Portfolio is ultimately responsible for the payment of any taxes on its share of taxable income. Since at least one of the Portfolio's investors is a regulated investment company that invests all or substantially all of its assets in the Portfolio, the Portfolio normally must satisfy the applicable source of income and diversification requirements (under the Internal Revenue Code) in order for its investors to satisfy them. The Portfolio will allocate, at least annually a mong its investors, each investor's distributive share of the Portfolio's net investment income, net realized capital gains and any other items of income, gain, loss, deduction or credit.
As of October 31, 2008, the Portfolio had no uncertain tax positions that would require financial statement recognition, de-recognition, or disclosure. Each of the Portfolio's federal tax returns filed in the 3-year period ended October 31, 2008 remains subject to examination by the Internal Revenue Service.
E Expense Reduction — State Street Bank and Trust Company (SSBT) serves as custodian of the Portfolio. Pursuant to the custodian agreement, SSBT receives a fee reduced by credits, which are determined based on the average daily cash balance the Portfolio maintains with SSBT. All credit balances, if any, used to reduce the Portfolio's custodian fees are reported as a reduction of expenses in the Statement of Operations.
F Foreign Currency Translation — Investment valuations, other assets, and liabilities initially expressed in foreign currencies are translated each business day into U.S. dollars based upon current exchange rates. Purchases and sales of foreign investment securities and income and expenses denominated in foreign currencies are translated into U.S. dollars based upon currency exchange rates in effect on the respective dates of such transactions. Recognized gains or losses on investment transactions attributable to changes in foreign currency exchange rates are recorded for financial statement purposes as net realized gains and losses on investments. That portion of unrealized gains and losses on invest ments that results from fluctuations in foreign currency exchange rates is not separately disclosed.
G Unfunded Loan Commitments — The Portfolio may enter into certain credit agreements all or a portion of which may be unfunded. The Portfolio is obligated to fund these commitments at the borrower's discretion. The commitments are disclosed in the accompanying Portfolio of Investments.
H Use of Estimates — The preparation of the financial statements in conformity with accounting principles generally accepted in the United States of America requires management to make estimates and assumptions that affect the reported amounts of assets and liabilities at the date of the financial statements and the reported amounts of income and expense during the reporting period. Actual results could differ from those estimates.
I Indemnifications — Under the Portfolio's organizational documents, its officers and Trustees may be indemnified against certain liabilities and expenses arising out of the performance of their duties to the Portfolio. Interestholders in the Portfolio are jointly and severally liable for the liabilities and obligations of the Portfolio in the event that the Portfolio fails to satisfy such liabilities and obligations; provided, however, that, to the extent assets are available in the Portfolio, the Portfolio may, under certain circumstances, indemnify interestholders from and against any claim or liability to which such holder may become subject by reason of being or having been an interestholder in t he Portfolio. Additionally, in the normal course of business, the
39
Floating Rate Portfolio as of October 31, 2008
NOTES TO FINANCIAL STATEMENTS CONT'D
Portfolio enters into agreements with service providers that may contain indemnification clauses. The Portfolio's maximum exposure under these arrangements is unknown as this would involve future claims that may be made against the Portfolio that have not yet occurred.
J Forward Foreign Currency Exchange Contracts — The Portfolio may enter into forward foreign currency exchange contracts for the purchase or sale of a specific foreign currency at a fixed price on a future date. The Portfolio enters into forward contracts for hedging purposes as well as non-hedging purposes. The forward foreign currency exchange contract is adjusted by the daily exchange rate of the underlying currency and any gains or losses are recorded as unrealized until such time as the contract has been closed or offset by another contract with the same broker for the same settlement date and currency. Risks may arise upon entering these contracts from the potential inability of counterparties t o meet the terms of their contracts and from movements in the value of a foreign currency relative to the U.S. dollar.
K Credit Default Swaps — The Portfolio may enter into credit default swap contracts to buy or sell protection against default on an individual issuer or a basket of issuers of bonds. When the Portfolio is the buyer of a credit default swap contract, the Portfolio is entitled to receive the par (or other agreed-upon) value of a referenced debt obligation (or basket of debt obligations) from the counterparty to the contract in the event of default by a third party, such as a U.S. or foreign corporate issuer, on the debt obligation. In return, the Portfolio pays the counterparty a periodic stream of payments over the term of the contract provided that no event of default has occurred. If no default occurs, the Portfolio would have spent the stream of payments and received no benefits from the contract. When the Portfolio is the seller of a credit default swap contract, it receives the stream of payments, but is obligated to pay upon default of the referenced debt obligation. As the seller, the Portfolio effectively adds leverage to its portfolio because, in addition to its total net assets, the Portfolio is subject to investment exposure on the notional amount of the swap. The interest fee paid or received on the swap contract, which is based on a specified interest rate on a fixed notional amount, is accrued daily as a component of unrealized appreciation (depreciation) and is recorded as realized gain upon receipt or realized loss upon payment. The Portfolio also records an increase or decrease to unrealized appreciation (depreciation) in an amount equal to the daily valuation. Up-front payments or receipts, if any, are recorded as other assets or other liabilities, respectively, and amortized over the li fe of the swap contract as realized gains or losses. The Portfolio segregates assets in the form of cash and cash equivalents in an amount equal to the aggregate market value of the credit default swaps of which it is the seller, marked to market on a daily basis. These transactions involve certain risks, including the risk that the seller may be unable to fulfill the transaction.
2 Investment Adviser Fee and Other Transactions with Affiliates
The investment adviser fee is earned by BMR as compensation for investment advisory services rendered to the Portfolio. Pursuant to the investment advisory agreement and subsequent fee reduction agreement between the Portfolio and BMR, the fee is computed at an annual rate 0.575% of the Portfolio's average daily net assets up $1 billion, 0.525% from $1 billion up to $2 billion, 0.500% from $2 billion up to $5 billion, 0.480% from $5 billion up to $10 billion and 0.460% of average daily net assets of $10 billion or more, and is payable monthly. The fee reduction cannot be terminated without the consent of the Trustees and shareholders. The portion of the adviser fee payable by Cash Management on the Portfolio's investment of cash therein is credited against the Portfolio's adviser fee. For the year ended October 31, 2008, the Portfolio's adviser fee totaled $24,109,418 of which $277,089 was allocated from Cash Management and $23, 832,329 was paid or accrued directly by the Portfolio. For the year ended October 31, 2008, the Portfolio's adviser fee, including the portion allocated from Cash Management, was 0.52% of the Portfolio's average daily net assets.
Except for Trustees of the Portfolio who are not members of EVM's or BMR's organizations, officers and Trustees receive remuneration for their services to the Portfolio out of the investment adviser fee. Trustees of the Portfolio who are not affiliated with the investment adviser may elect to defer receipt of all or a percentage of their annual fees in accordance with the terms of the Trustees Deferred Compensation Plan. For the year ended October 31, 2008, no significant amounts have been deferred. Certain officers and Trustees of the Portfolio are officers of the above organizations.
40
Floating Rate Portfolio as of October 31, 2008
NOTES TO FINANCIAL STATEMENTS CONT'D
3 Purchases and Sales of Investments
Purchases and sales of investments, other than short-term obligations and including maturities and principal repayments on Senior Loans, aggregated $304,834,703 and $2,795,982,026, respectively, for the year ended October 31, 2008.
4 Federal Income Tax Basis of Investments
The cost and unrealized appreciation (depreciation) of investments of the Portfolio at October 31, 2008, as determined on a federal income tax basis, were as follows:
| Aggregate cost | | $ | 4,448,683,412 | | |
| Gross unrealized appreciation | | $ | 298,177 | | |
| Gross unrealized depreciation | | | (1,342,628,299 | ) | |
| Net unrealized depreciation | | $ | (1,342,330,122 | ) | |
The net unrealized appreciation on foreign currency and forward foreign currency exchange contracts on a federal tax basis was $2,206,058.
5 Restricted Securities
At October 31, 2008, the Portfolio owned the following securities (representing less than 0.1% of net assets) which were restricted as to public resale and not registered under the Securities Act of 1933 (excluding Rule 144A securities). The Portfolio has various registration rights (exercisable under a variety of circumstances) with respect to these securities. The value of these securities is determined based on valuations provided by brokers when available, or if not available, they are valued at fair value using methods determined in good faith by or at the direction of the Trustees.
| Description | | Date of
Acquisition | | Shares | | Cost | | Value | |
Environmental Systems
Products Holdings, Inc. | | 10/25/00 | | | 2,484 | | | $ | 0 | (1) | | $ | 0 | | |
Environmental Systems
Products Holdings
Preferred, Series A | | 10/25/07 | | | 1,138 | | | | 19,915 | | | | 26,140 | | |
Hayes Lemmerz
International | | 6/23/03 | | | 350 | | | | 17,500 | | | | 2,593 | | |
| Total Restricted Securities | | | | | | | | $ | 37,415 | | | $ | 28,733 | | |
(1) Less than $0.50.
6 Financial Instruments
The Portfolio may trade in financial instruments with off-balance sheet risk in the normal course of its investing activities. These financial instruments may include forward foreign currency exchange contracts and may involve, to a varying degree, elements of risk in excess of the amounts recognized for financial statement purposes. The notional or contractual amounts of these instruments represent the investment the Portfolio has in particular classes of financial instruments and does not necessarily represent the amounts potentially subject to risk. The measurement of the risks associated with these instruments is meaningful only when all related and offsetting transactions are considered.
A summary of obligations under these financial instruments at October 31, 2008 is as follows:
Forward Foreign Currency Exchange Contracts
Sales
| Settlement Date | | Deliver | | In exchange for | | Net Unrealized
Appreciation | |
| 11/28/2008 | | British Pound Sterling | | United States Dollar | | |
| | |
| | | 51,166,298 | | 83,747,462 | | $ | 1,525,778 | | |
| 11/28/2008 | | Euro
177,086,674 | | United States Dollar
229,348,494 | | | 3,852,330 | | |
| 11/28/2008 | | Swiss Franc
12,331,250 | | United States Dollar
10,914,059 | | | 277,620 | | |
| | | $ | 5,655,728 | | |
At October 31, 2008, the Portfolio had sufficient cash and/or securities to cover commitments under these contracts.
7 Line of Credit
The Portfolio participates with other portfolios and funds managed by EVM and its affiliates in a $1 billion ($1.5 billion prior to March 24, 2008) unsecured line of credit agreement with a group of banks. Borrowings are made by the Portfolio solely to facilitate the handling of unusual and/or unanticipated short-term cash requirements. Interest is charged to the Portfolio based on its borrowings at an amount above either the Eurodollar rate or Federal Funds rate. In addition, a fee computed at an annual rate of 0.08% (0.07% prior to March 24, 2008) on the daily unused portion of the line of credit is allocated among the participating portfolios and funds at the end of each quarter. At October 31,
41
Floating Rate Portfolio as of October 31, 2008
NOTES TO FINANCIAL STATEMENTS CONT'D
2008, the Portfolio had a balance outstanding pursuant to this line of credit of $95,000,000 at an interest rate of 3.59%. Average borrowings and the average interest rate for the year ended October 31, 2008 were $140,669,399 and 4.16%, respectively.
8 Risks Associated with Foreign Investments
Investing in securities issued by companies whose principal business activities are outside the United States may involve significant risks not present in domestic investments. For example, there is generally less publicly available information about foreign companies, particularly those not subject to the disclosure and reporting requirements of the U.S. securities laws. Certain foreign issuers are generally not bound by uniform accounting, auditing, and financial reporting requirements and standards of practice comparable to those applicable to domestic issuers. Investments in foreign securities also involve the risk of possible adverse changes in investment or exchange control regulations, expropriation or confiscatory taxation, limitation on the removal of funds or other assets of the Portfolio, political or financial instability or diplomatic and other developments which could affect such investments. Foreign securities mar kets, while growing in volume and sophistication, are generally not as developed as those in the United States, and securities of some foreign issuers (particularly those located in developing countries) may be less liquid and more volatile than securities of comparable U.S. companies. In general, there is less overall governmental supervision and regulation of foreign stock markets, broker-dealers and issuers than in the United States.
9 Concentration of Credit Risk
The Portfolio invests primarily in below investment grade floating-rate loans and floating-rate debt obligations, which are considered speculative because of the credit risk of their issuers. Changes in economic conditions or other circumstances are more likely to reduce the capacity of issuers of these securities to make principal and interest payments. Such companies are more likely to default on their payments of interest and principal owed than issuers of investment grade bonds. An economic downturn generally leads to a higher non-payment rate, and a loan or other debt obligation may lose significant value before a default occurs. Lower rated investments also may be subject to greater price volatility than higher rated investments. Moreover, the specific collateral used to secure a loan may decline in value or become illiquid, which would adversely affec t the loan's value.
10 Recently Issued Accounting Pronouncements
In September 2006, the Financial Accounting Standards Board (FASB) issued Statement of Financial Accounting Standards No. 157 (FAS 157), "Fair Value Measurements". FAS 157 defines fair value, establishes a framework for measuring fair value in accordance with accounting principles generally accepted in the United States of America and expands disclosure about fair value measurements. FAS 157 is effective for fiscal years beginning after November 15, 2007. As of October 31, 2008, management does not believe the adoption of FAS 157 will impact the amounts reported in the financial statements; however, additional disclosures may be required about the inputs used to develop the measurements of fair value and the effect of certain of the measurements on changes in net assets for the period.
In March 2008, the FASB issued Statement of Financial Accounting Standards No. 161 (FAS 161), "Disclosures about Derivative Instruments and Hedging Activities". FAS 161 requires enhanced disclosures about an entity's derivative and hedging activities, including qualitative disclosures about the objectives and strategies for using derivatives, quantitative disclosures about fair value amounts of and gains and losses on derivative instruments, and disclosures about credit-risk related contingent features in derivative instruments. FAS 161 is effective for fiscal years and interim periods beginning after November 15, 2008. Management is currently evaluating the impact the adoption of FAS 161 will have on the Portfolio's financial statement disclosures.
42
Floating Rate Portfolio as of October 31, 2008
REPORT OF INDEPENDENT REGISTERED PUBLIC ACCOUNTING FIRM
To the Trustees and Investors
of Floating Rate Portfolio:
We have audited the accompanying statement of assets and liabilities of Floating Rate Portfolio (the "Portfolio"), including the portfolio of investments, as of October 31, 2008, and the related statement of operations for the year then ended, the statements of changes in net assets for each of the two years in the period then ended, and the supplementary data for each of the five years in the period then ended. These financial statements and supplementary data are the responsibility of the Portfolio's management. Our responsibility is to express an opinion on these financial statements and supplementary data based on our audits.
We conducted our audits in accordance with the standards of the Public Company Accounting Oversight Board (United States). Those standards require that we plan and perform the audit to obtain reasonable assurance about whether the financial statements and supplementary data are free of material misstatement. The Portfolio is not required to have, nor were we engaged to perform, an audit of its internal control over financial reporting. Our audits included consideration of internal control over financial reporting as a basis for designing audit procedures that are appropriate in the circumstances, but not for the purpose of expressing an opinion on the effectiveness of the Portfolio's internal control over financial reporting. Accordingly, we express no such opinion. An audit also includes examining, on a test basis, evidence supporting the amounts and disclosures in the financial statements, assessing the accounting principles u sed and significant estimates made by management, as well as evaluating the overall financial statement presentation. Our procedures included confirmation of securities and senior loans owned as of October 31, 2008, by correspondence with the custodian, brokers, and selling agent banks; where replies were not received from brokers and selling agent banks, we performed other auditing procedures. We believe that our audits provide a reasonable basis for our opinion.
In our opinion, the financial statements and supplementary data referred to above present fairly, in all material respects, the financial position of Floating Rate Portfolio as of October 31, 2008, the results of its operations for the year then ended, the changes in its net assets for each of the two years in the period then ended, and the supplementary data for each of the five years in the period then ended, in conformity with accounting principles generally accepted in the United States of America.
DELOITTE & TOUCHE LLP
Boston, Massachusetts
December 18, 2008
43
Eaton Vance Floating-Rate & High Income Fund
Floating Rate Portfolio
SPECIAL MEETING OF SHAREHOLDERS (Unaudited)
Eaton Vance Floating-Rate & High Income Fund
The Fund held a Special Meeting of Shareholders on November 14, 2008 to elect Trustees. The results of the vote were as follows:
| | | Number of Shares | |
| Nominee for Trustee | | Affirmative | | Withhold | |
| Benjamin C. Esty | | | 78,203,353 | | | | 989,580 | | |
| Thomas E. Faust Jr. | | | 78,200,116 | | | | 992,817 | | |
| Allen R. Freedman | | | 78,197,439 | | | | 995,495 | | |
| William H. Park | | | 78,181,688 | | | | 1,011,245 | | |
| Ronald A. Pearlman | | | 78,190,289 | | | | 1,002,644 | | |
| Helen Frame Peters | | | 78,190,231 | | | | 1,002,702 | | |
| Heidi L. Steiger | | | 78,194,249 | | | | 998,684 | | |
| Lynn A. Stout | | | 78,178,230 | | | | 1,014,703 | | |
| Ralph F. Verni | | | 78,170,718 | | | | 1,022,216 | | |
Each nominee was also elected a Trustee of the Floating Rate Portfolio.
Floating Rate Portfolio
The Portfolio held a Special Meeting of Interestholders on November 14, 2008 to elect Trustees. The results of the vote were as follows:
| | | Interest in the Portfolio | |
| Nominee for Trustee | | Affirmative | | Withhold | |
| Benjamin C. Esty | | | 97 | % | | | 1 | % | |
| Thomas E. Faust Jr. | | | 97 | % | | | 1 | % | |
| Allen R. Freedman | | | 97 | % | | | 1 | % | |
| William H. Park | | | 97 | % | | | 1 | % | |
| Ronald A. Pearlman | | | 97 | % | | | 1 | % | |
| Helen Frame Peters | | | 97 | % | | | 1 | % | |
| Heidi L. Steiger | | | 97 | % | | | 1 | % | |
| Lynn A. Stout | | | 97 | % | | | 1 | % | |
| Ralph F. Verni | | | 97 | % | | | 1 | % | |
Results are rounded to the nearest whole number.
44
Eaton Vance Floating-Rate & High Income Fund
BOARD OF TRUSTEES' ANNUAL APPROVAL OF THE INVESTMENT ADVISORY AGREEMENT
Overview of the Contract Review Process
The Investment Company Act of 1940, as amended (the "1940 Act"), provides, in substance, that each investment advisory agreement between a fund and its investment adviser will continue in effect from year to year only if its continuance is approved at least annually by the fund's board of trustees, including by a vote of a majority of the trustees who are not "interested persons" of the fund ("Independent Trustees"), cast in person at a meeting called for the purpose of considering such approval.
At a meeting of the Boards of Trustees (each a "Board") of the Eaton Vance group of mutual funds (the "Eaton Vance Funds") held on April 21, 2008, the Board, including a majority of the Independent Trustees, voted to approve continuation of existing advisory and sub-advisory agreements for the Eaton Vance Funds for an additional one-year period. In voting its approval, the Board relied upon the affirmative recommendation of the Contract Review Committee of the Board (formerly the Special Committee), which is a committee comprised exclusively of Independent Trustees. Prior to making its recommendation, the Contract Review Committee reviewed information furnished for a series of meetings of the Contract Review Committee held in February, March and April 2008. Such information included, among other things, the following:
Information about Fees, Performance and Expenses
• An independent report comparing the advisory and related fees paid by each fund with fees paid by comparable funds;
• An independent report comparing each fund's total expense ratio and its components to comparable funds;
• An independent report comparing the investment performance of each fund to the investment performance of comparable funds over various time periods;
• Data regarding investment performance in comparison to relevant peer groups of funds and appropriate indices;
• Comparative information concerning fees charged by each adviser for managing other mutual funds and institutional accounts using investment strategies and techniques similar to those used in managing the fund;
• Profitability analyses for each adviser with respect to each fund;
Information about Portfolio Management
• Descriptions of the investment management services provided to each fund, including the investment strategies and processes employed, and any changes in portfolio management processes and personnel;
• Information concerning the allocation of brokerage and the benefits received by each adviser as a result of brokerage allocation, including information concerning the acquisition of research through "soft dollar" benefits received in connection with the funds' brokerage, and the implementation of a soft dollar reimbursement program established with respect to the funds;
• Data relating to portfolio turnover rates of each fund;
• The procedures and processes used to determine the fair value of fund assets and actions taken to monitor and test the effectiveness of such procedures and processes;
Information about each Adviser
• Reports detailing the financial results and condition of each adviser;
• Descriptions of the qualifications, education and experience of the individual investment professionals whose responsibilities include portfolio management and investment research for the funds, and information relating to their compensation and responsibilities with respect to managing other mutual funds and investment accounts;
• Copies of the Codes of Ethics of each adviser and its affiliates, together with information relating to compliance with and the administration of such codes;
• Copies of or descriptions of each adviser's proxy voting policies and procedures;
• Information concerning the resources devoted to compliance efforts undertaken by each adviser and its affiliates on behalf of the funds (including descriptions of various compliance programs) and their record of compliance with investment policies and restrictions, including policies with respect to market-timing, late trading and selective portfolio disclosure, and with policies on personal securities transactions;
• Descriptions of the business continuity and disaster recovery plans of each adviser and its affiliates;
Other Relevant Information
• Information concerning the nature, cost and character of the administrative and other non-investment management services provided by Eaton Vance Management and its affiliates;
• Information concerning management of the relationship with the custodian, subcustodians and fund accountants by each adviser or the funds' administrator; and
• The terms of each advisory agreement.
45
Eaton Vance Floating-Rate & High Income Fund
BOARD OF TRUSTEES' ANNUAL APPROVAL OF THE INVESTMENT ADVISORY AGREEMENT CONT'D
In addition to the information identified above, the Contract Review Committee considered information provided from time to time by each adviser throughout the year at meetings of the Board and its committees. Over the course of the twelve-month period ended April 30, 2008, the Board met eleven times and the Contract Review Committee, the Audit Committee and the Governance Committee, each of which is a Committee comprised solely of Independent Trustees, met twelve, seven and five times, respectively. At such meetings, the Trustees received, among other things, presentations by the portfolio managers and other investment professionals of each adviser relating to the investment performance of each fund and the investment strategies used in pursuing the fund's investment objective. The Portfolio Management Committee and the Compliance Reports and Regulatory Matters Committee are newly established and did not meet during the twelve- month period ended April 30, 2008.
For funds that invest through one or more underlying portfolios, the Board considered similar information about the portfolio(s) when considering the approval of advisory agreements. In addition, in cases where the fund's investment adviser has engaged a sub-adviser, the Board considered similar information about the sub-adviser when considering the approval of any sub-advisory agreement.
The Contract Review Committee was assisted throughout the contract review process by Goodwin Procter LLP, legal counsel for the Independent Trustees. The members of the Contract Review Committee relied upon the advice of such counsel and their own business judgment in determining the material factors to be considered in evaluating each advisory and sub-advisory agreement and the weight to be given to each such factor. The conclusions reached with respect to each advisory and sub-advisory agreement were based on a comprehensive evaluation of all the information provided and not any single factor. Moreover, each member of the Contract Review Committee may have placed varying emphasis on particular factors in reaching conclusions with respect to each advisory and sub-advisory agreement.
Results of the Process
Based on its consideration of the foregoing, and such other information as it deemed relevant, including the factors and conclusions described below, the Contract Review Committee concluded that the continuance of the investment advisory agreements of the Floating Rate Portfolio and the High Income Opportunities Portfolio (formerly, High Income Portfolio), the portfolios in which the Eaton Vance Floating-Rate & High Income Fund (the "Fund") invests (the "Portfolios"), each with Boston Management and Research (the "Adviser"), including their fee structures, is in the interests of shareholders and, therefore, the Contract Review Committee recommended to the Board approval of each agreement. The Board accepted the recommendation of the Contract Review Committee as well as the factors considered and conclusions reached by the Contract Review Committee with respect to each agreement. Accordingly, the Board, including a majority o f the Independent Trustees, voted to approve continuation of the investment advisory agreements for the Portfolios.
Nature, Extent and Quality of Services
In considering whether to approve the investment advisory agreements of the Portfolios, the Board evaluated the nature, extent and quality of services provided to the Portfolios by the Adviser.
The Board considered the Adviser's management capabilities and investment process with respect to the types of investments held by the Portfolios, including the education, experience and number of its investment professionals and other personnel who provide portfolio management, investment research, and similar services to the Portfolios. In particular, the Board evaluated the abilities and experience of such investment personnel in analyzing special considerations relevant to investing in senior secured floating rate loans. For both Portfolios, the Board noted the experience of the Adviser's large group of bank loan investment professionals and other personnel who provide services to the Portfolios, including portfolio managers and analysts. The Board also took into account the resources dedicated to portfolio management and other services, including the compensation paid to recruit and retain investment personnel, and the time and attention devoted to the Fund and each Portfolio by senior management. The Board also reviewed the compliance programs of the Adviser and relevant affiliates thereof. Among other matters, the Board considered compliance and reporting matters relating to personal trading by investment personnel, selective disclosure of portfolio holdings, late trading, frequent trading, portfolio valuation, business continuity and the allocation of investment opportunities. The Board also evaluated the responses of the Adviser and its affiliates to requests from regulatory authorities such as the Securities and Exchange Commission.
The Board considered shareholder and other administrative services provided or managed by Eaton Vance Management and its affiliates, including transfer agency and accounting services. The Board evaluated the benefits to shareholders of investing in a fund that is a part of a large family of funds, including the ability, in many cases, to exchange an investment among different funds without incurring additional sales charges.
After consideration of the foregoing factors, among others, the Board concluded that the nature, extent and quality of services provided by the Adviser, taken as a whole, are appropriate and consistent with the terms of the investment advisory agreements.
46
Eaton Vance Floating-Rate & High Income Fund
BOARD OF TRUSTEES' ANNUAL APPROVAL OF THE INVESTMENT ADVISORY AGREEMENT CONT'D
Fund Performance
The Board compared the Fund's investment performance to a relevant universe of similarly managed funds identified by an independent data provider and appropriate benchmark indices. The Board also considered the performance of the underlying Portfolios. The Board reviewed comparative performance data for the one-, three- and five-year periods ended September 30, 2007 for the Fund. The Board concluded that the Fund's performance was satisfactory.
Management Fees and Expenses
The Board reviewed contractual investment advisory fee rates, including administrative fee rates, payable by the Portfolios and the Fund (referred to collectively as "management fees"). As part of its review, the Board considered the management fees and the Fund's total expense ratio for the year ended September 30, 2007, as compared to a group of similarly managed funds selected by an independent data provider.
After reviewing the foregoing information, and in light of the nature, extent and quality of the services provided by the Adviser, the Board concluded that the management fees charged for advisory and related services and the Fund's total expense ratio are reasonable.
Profitability
The Board reviewed the level of profits realized by the Adviser and relevant affiliates thereof in providing investment advisory and administrative services to the Fund, the Portfolios and to all Eaton Vance Funds as a group. The Board considered the level of profits realized without regard to revenue sharing or other payments by the Adviser and its affiliates to third parties in respect of distribution services. The Board also considered other direct or indirect benefits received by the Adviser and its affiliates in connection with its relationship with the Fund and the Portfolios.
The Board concluded that, in light of the foregoing factors and the nature, extent and quality of the services rendered, the profits realized by the Adviser and its affiliates are reasonable.
Economies of Scale
In reviewing management fees and profitability, the Board also considered the extent to which the Adviser and its affiliates, on the one hand, and the Fund, on the other hand, can expect to realize benefits from economies of scale as the assets of the Fund and the Portfolios increase. The Board acknowledged the difficulty in accurately measuring the benefits resulting from the economies of scale with respect to the management of any specific fund or group of funds. The Board reviewed data summarizing the increases and decreases in the assets of the Fund and of all Eaton Vance Funds as a group over various time periods, and evaluated the extent to which the total expense ratio of the Fund and the profitability of the Adviser and its affiliates may have been affected by such increases or decreases. Based upon the foregoing, the Board concluded that the benefits from economies of scale are currently being shared equitably by the Ad viser and its affiliates and the Fund. The Board also concluded that, assuming reasonably foreseeable increases in the assets of the Portfolios, the structure of the advisory fees, which include breakpoints at several asset levels, can be expected to cause the Adviser and its affiliates and the Fund to continue to share such benefits equitably.
47
Eaton Vance Floating-Rate & High Income Fund
MANAGEMENT AND ORGANIZATION
Fund Management. The Trustees of Eaton Vance Mutual Funds Trust (the Trust), Floating Rate Portfolio (FRP) and High Income Opportunities Portfolio (HIOP) (collectively, the Portfolios) are responsible for the overall management and supervision of the Trust's and Portfolios' affairs. The Trustees and officers of the Trust and the Portfolios are listed below. Except as indicated, each individual has held the office shown or other offices in the same company for the last five years. Trustees and officers of the Trust and the Portfolios hold indefinite terms of office. The "noninterested Trustees" consist of those Trustees who are not "interested persons" of the Trust and the Portfolios, as that term is defined under the 1940 Act. The business address of each Trustee and officer is The Eaton Vance Building, 255 State Street, Boston, Massachusetts 02109. As used below, "EVC" refers to Eaton Vance Corp., "EV" refers to Eaton Vance, Inc., "EVM" refers to Eaton Vance Management, "BMR" refers to Boston Management and Research, "Parametric" refers to Parametric Portfolio Associates and "EVD" refers to Eaton Vance Distributors, Inc. EVC and EV are the corporate parent and trustee, respectively, of EVM and BMR. EVD is the Fund's principal underwriter, the Portfolios' placement agent and a wholly-owned subsidiary of EVC. Each officer affiliated with Eaton Vance may hold a position with other Eaton Vance affiliates that is comparable to his or her position with EVM listed below.
Name and
Date of Birth | | Position(s)
with the
Trust and
the Portfolio | | Term of
Office and
Length of
Service | | Principal Occupation(s)
During Past Five Years | | Number of Portfolios
in Fund Complex
Overseen By
Trustee(1) | | Other Directorships Held | |
| Interested Trustee | | | | | | | | | | | | | |
|
Thomas E. Faust Jr.
5/31/58 | | Trustee and President of the Trust | | Trustee since 2007 and President of the Trust since 2002 | | Chairman, Chief Executive Officer and President of EVC, Director and President of EV, Chief Executive Officer and President of EVM and BMR, and Director of EVD. Trustee and/or Officer of 173 registered investment companies and 4 private companies managed by EVM or BMR. Mr. Faust is an interested person because of his positions with EVM, BMR, EVD, EVC and EV, which are affiliates of the Trust and Portfolio. | | | 173 | | | Director of EVC | |
|
| Noninterested Trustees | | | | | | | | | | | | | |
|
Benjamin C. Esty
1/2/63 | | Trustee | | Since 2005 | | Roy and Elizabeth Simmons Professor of Business Administration, Harvard University Graduate School of Business Administration. | | | 173 | | | None | |
|
Allen R. Freedman
4/3/40 | | Trustee | | Since 2007 | | Former Chairman (2002-2004) and a Director (1983-2004) of Systems & Computer Technology Corp. (provider of software to higher education). Formerly, a Director of Loring Ward International (fund distributor) (2005-2007). Formerly, Chairman and a Director of Indus International Inc. (provider of enterprise management software to the power generating industry) (2005-2007). | | | 173 | | | Director of Assurant, Inc. and Stonemor Partners L.P. (owner and operator of cemeteries) | |
|
William H. Park
9/19/47 | | Trustee | | Since 2003 | | Vice Chairman, Commercial Industrial Finance Corp. (specialty finance company) (since 2006). Formerly, President and Chief Executive Officer, Prizm Capital Management, LLC (investment management firm) (2002-2005). | | | 173 | | | None | |
|
Ronald A. Pearlman
7/10/40 | | Trustee | | Since 2003 | | Professor of Law, Georgetown University Law Center. | | | 173 | | | None | |
|
Helen Frame Peters
3/22/48 | | Trustee | | Since 2008 | | Professor of Finance, Carroll School of Management, Boston College (since 2003). Adjunct Professor of Finance, Peking University, Beijing, China (since 2005). Formerly, Dean, Carroll School of Management, Boston College (2000-2003). | | | 173 | | | Director of Federal Home Loan Bank of Boston (a bank for banks) and BJ's Wholesale Clubs (wholesale club retailer); Trustee of SPDR Index Shares Funds and SPDR Series Trust (exchange traded funds) | |
|
48
Eaton Vance Floating-Rate & High Income Fund
MANAGEMENT AND ORGANIZATION CONT'D
Name and
Date of Birth | | Position(s)
with the
Trust and
the Portfolio | | Term of
Office and
Length of
Service | |
Principal Occupation(s)
During Past Five Years | | Number of Portfolios
in Fund Complex
Overseen By
Trustee(1) | | Other Directorships Held | |
| Noninterested Trustees (continued) | | | | | | | | | | | | | |
|
Heidi L. Steiger
7/8/53 | | Trustee | | Since 2007 | | Managing Partner, Topridge Associates LLC (global wealth management firm) (since 2008); Senior Advisor (since 2008), President (2005-2008), Lowenhaupt Global Advisors, LLC (global wealth management firm). Formerly, President and Contributing Editor, Worth Magazine (2004-2005). Formerly, Executive Vice President and Global Head of Private Asset Management (and various other positions), Neuberger Berman (investment firm) (1986-2004). | | | 173 | | | Director of Nuclear Electric Insurance Ltd. (nuclear insurance provider) and Aviva USA (insurance provider) | |
|
Lynn A. Stout
9/14/57 | | Trustee | | Of the Trust and HIOP since 1998 and of FRP since 2000 | | Paul Hastings Professor of Corporate and Securities Law (since 2006) and Professor of Law (2001-2006), University of California at Los Angeles School of Law. | | | 173 | | | None | |
|
Ralph F. Verni
1/26/43 | | Chairman of the Board and Trustee | | Chairman of the Board since 2007 and Trustee since 2005 | | Consultant and private investor. | | | 173 | | | None | |
|
| Principal Officers who are not Trustees | | | | | | | | | |
|
Name and
Date of Birth | | Position(s)
with the
Trust and
the Portfolios | | Term of
Office and
Length of
Service | | Principal Occupation(s)
During Past Five Years | |
William H. Ahern, Jr.
7/28/59 | | Vice President
of the Trust | | Since 1995 | | Vice President of EVM and BMR. Officer of 75 registered investment companies managed by EVM or BMR. | |
|
John R. Baur
2/10/70 | | Vice President
of the Trust | | Since 2007 | | Vice President of EVM and BMR. Previously, attended Johnson Graduate School of Management, Cornell University (2002-2005), and prior thereto he was an Account Team Representative in Singapore for Applied Materials Inc. Officer of 33 registered investment companies managed by EVM or BMR. | |
|
Michael A. Cirami
12/24/75 | | Vice President
of the Trust | | Since 2007 | | Vice President of EVM and BMR. Previously, attended the University of Rochester William E. Simon Graduate School of Business Administration (2001-2003), and prior thereto he was a Team Leader for the Institutional Services Group for State Street Bank in Luxembourg. Officer of 33 registered investment companies managed by EVM or BMR. | |
|
Cynthia J. Clemson
3/2/63 | | Vice President
of the Trust | | Since 2005 | | Vice President of EVM and BMR. Officer of 90 registered investment companies managed by EVM or BMR. | |
|
Charles B. Gaffney
12/4/72 | | Vice President
of the Trust | | Since 2007 | | Vice President of EVM and BMR. Previously, Sector Portfolio Manager and Senior Equity Analyst of Brown Brothers Harriman (1997-2003). Officer of 30 registered investment companies managed by EVM or BMR. | |
|
Thomas P. Huggins
3/7/66 | | Vice President
of HIOP | | Since 2000 | | Vice President of EVM and BMR. Officer of 4 registered investment companies managed by EVM or BMR. | |
|
Christine M. Johnston
11/9/72 | | Vice President
of the Trust | | Since 2007 | | Vice President of EVM and BMR. Officer of 35 registered investment companies managed by EVM or BMR. | |
|
Aamer Khan
6/7/60 | | Vice President
of the Trust | | Since 2005 | | Vice President of EVM and BMR. Officer of 33 registered investment companies managed by EVM or BMR. | |
|
| Thomas H. Luster 4/8/62 | | Vice President
of the Trust | | Since 2006 | | Vice President of EVM and BMR. Officer of 51 registered investment companies managed by EVM or BMR. | |
|
Robert B. MacIntosh
1/22/57 | | Vice President
of the Trust | | Since 1998 | | Vice President of EVM and BMR. Officer of 90 registered investment companies managed by EVM or BMR. | |
|
49
Eaton Vance Floating-Rate & High Income Fund
MANAGEMENT AND ORGANIZATION CONT'D
Name and
Date of Birth | | Position(s)
with the
Trust and
the Portfolios | | Term of
Office and
Length of
Service | | Principal Occupation(s)
During Past Five Years | |
| Principal Officers who are not Trustees (continued) | | | | | | | |
|
Scott H. Page
11/30/59 | | President of FRP | | Since 2007 | | Vice President of EVM and BMR. Officer of 11 registered investment companies managed by EVM or BMR. | |
|
Duncan W. Richardson
10/26/57 | | Vice President
of the Trust | | Since 2001 | | Executive Vice President and Chief Equity Investment Officer of EVC, EVM and BMR. Officer of 81 registered investment companies managed by EVM or BMR. | |
|
Craig P. Russ
10/30/63 | | Vice President of FRP | | Since 2007 | | Vice President of EVM and BMR. Officer of 6 registered investment companies managed by EVM or BMR. | |
|
Judith A. Saryan
8/21/54 | | Vice President
of the Trust | | Since 2003 | | Vice President of EVM and BMR. Officer of 55 registered investment companies managed by EVM or BMR. | |
|
Susan Schiff
3/13/61 | | Vice President
of the Trust | | Since 2002 | | Vice President of EVM and BMR. Officer of 36 registered investment companies managed by EVM or BMR. | |
|
Thomas Seto
9/27/62 | | Vice President
of the Trust | | Since 2007 | | Vice President and Director of Portfolio Management of Parametric. Officer of 31 registered investment companies managed by EVM or BMR. | |
|
David M. Stein
5/4/51 | | Vice President
of the Trust | | Since 2007 | | Managing Director and Chief Investment Officer of Parametric. Officer of 31 registered investment companies managed by EVM or BMR. | |
|
Mark S. Venezia
5/23/49 | | Vice President
of the Trust | | Since 2007 | | Vice President of EVM and BMR. Officer of 36 registered investment companies managed by EVM or BMR. | |
|
Adam A. Weigold
3/22/75 | | Vice President
of the Trust | | Since 2007 | | Vice President of EVM and BMR. Officer of 71 registered investment companies managed by EVM or BMR. | |
|
Michael W. Weilheimer
2/11/61 | | President of HIOP | | Since 2002 | | Vice President of EVM and BMR. Officer of 26 registered investment companies managed by EVM or BMR. | |
|
Barbara E. Campbell
6/19/57 | | Treasurer | | Of the Trust since 2005 and of the Portfolios since 2008(2) | | Vice President of EVM and BMR. Officer of 173 registered investment companies managed by EVM or BMR. | |
|
Maureen A. Gemma
5/24/60 | | Secretary and Chief Legal Officer | | Secretary since 2007 and Chief Legal Officer since 2008 | | Vice President of EVM and BMR. Officer of 173 registered investment companies managed by EVM or BMR. | |
|
Paul M. O'Neil
7/11/53 | | Chief Compliance Officer | | Since 2004 | | Vice President of EVM and BMR. Officer of 173 registered investment companies managed by EVM or BMR. | |
|
(1) Includes both master and feeder funds in a master-feeder structure.
(2) Prior to 2008, Ms. Campbell served as Assistant Treasurer of FRP since 2000 and HIOP since 1993.
The SAI for the Fund includes additional information about the Trustees and officers of the Fund and the Portfolios and can be obtained without charge on Eaton Vance's website at www.eatonvance.com or by calling 1-800-262-1122.
50
This Page Intentionally Left Blank
This Page Intentionally Left Blank
Investment Adviser of Floating Rate Portfolio
Boston Management and Research
The Eaton Vance Building
255 State Street
Boston, MA 02109
Administrator of Eaton Vance Floating-Rate & High Income Fund
Eaton Vance Management
The Eaton Vance Building
255 State Street
Boston, MA 02109
Principal Underwriter
Eaton Vance Distributors, Inc.
The Eaton Vance Building
255 State Street
Boston, MA 02109
(617) 482-8260
Custodian
State Street Bank and Trust Company
200 Clarendon Street
Boston, MA 02116
Transfer Agent
PNC Global Investment Servicing
Attn: Eaton Vance Funds
P.O. Box 9653
Providence, RI 02940-9653
(800) 262-1122
Independent Registered Public Accounting Firm
Deloitte & Touche LLP
200 Berkeley Street
Boston, MA 02116-5022
Eaton Vance Floating-Rate & High Income Fund
The Eaton Vance Building
255 State Street
Boston, MA 02109
This report must be preceded or accompanied by a current prospectus. Before investing, investors should consider carefully the Fund's investment objective(s), risks, and charges and expenses. The Fund's current prospectus contains this and other information about the Fund and is available through your financial advisor. Please read the prospectus carefully before you invest or send money. For further information please call 1-800-262-1122.
811-12/08 FRHSRC

Annual Report October 31, 2008


EATON VANCE
GOVERNMENT
OBLIGATIONS
FUND
IMPORTANT NOTICES REGARDING PRIVACY,
DELIVERY OF SHAREHOLDER DOCUMENTS,
PORTFOLIO HOLDINGS AND PROXY VOTING
Privacy. The Eaton Vance organization is committed to ensuring your financial privacy. Each of the financial institutions identified below has in effect the following policy ("Privacy Policy") with respect to nonpublic personal information about its customers:
• Only such information received from you, through application forms or otherwise, and information about your Eaton Vance fund transactions will be collected. This may include information such as name, address, social security number, tax status, account balances and transactions.
• None of such information about you (or former customers) will be disclosed to anyone, except as permitted by law (which includes disclosure to employees necessary to service your account). In the normal course of servicing a customer's account, Eaton Vance may share information with unaffiliated third parties that perform various required services such as transfer agents, custodians and broker/dealers.
• Policies and procedures (including physical, electronic and procedural safeguards) are in place that are designed to protect the confidentiality of such information.
• We reserve the right to change our Privacy Policy at any time upon proper notification to you. Customers may want to review our Policy periodically for changes by accessing the link on our homepage: www.eatonvance.com.
Our pledge of privacy applies to the following entities within the Eaton Vance organization: the Eaton Vance Family of Funds, Eaton Vance Management, Eaton Vance Investment Counsel, Boston Management and Research, and Eaton Vance Distributors, Inc.
In addition, our Privacy Policy only applies to those Eaton Vance customers who are individuals and who have a direct relationship with us. If a customer's account (i.e., fund shares) is held in the name of a third-party financial adviser/broker-dealer, it is likely that only such adviser's privacy policies apply to the customer. This notice supersedes all previously issued privacy disclosures.
For more information about Eaton Vance's Privacy Policy, please call 1-800-262-1122.
Delivery of Shareholder Documents. The Securities and Exchange Commission (the "SEC") permits funds to deliver only one copy of shareholder documents, including prospectuses, proxy statements and shareholder reports, to fund investors with multiple accounts at the same residential or post office box address. This practice is often called "householding" and it helps eliminate duplicate mailings to shareholders.
Eaton Vance, or your financial adviser, may household the mailing of your documents indefinitely unless you instruct Eaton Vance, or your financial adviser, otherwise.
If you would prefer that your Eaton Vance documents not be householded, please contact Eaton Vance at 1-800-262-1122, or contact your financial adviser.
Your instructions that householding not apply to delivery of your Eaton Vance documents will be effective within 30 days of receipt by Eaton Vance or your financial adviser.
Portfolio Holdings. Each Eaton Vance Fund and its underlying Portfolio (if applicable) will file a schedule of its portfolio holdings on Form N-Q with the SEC for the first and third quarters of each fiscal year. The Form N-Q will be available on the Eaton Vance website www.eatonvance.com, by calling Eaton Vance at 1-800-262-1122 or in the EDGAR database on the SEC's website at www.sec.gov. Form N-Q may also be reviewed and copied at the SEC's public reference room in Washington, D.C. (call 1-800-732-0330 for information on the operation of the public reference room).
Proxy Voting. From time to time, funds are required to vote proxies related to the securities held by the funds. The Eaton Vance Funds or their underlying Portfolios (if applicable) vote proxies according to a set of policies and procedures approved by the Funds' and Portfolios' Boards. You may obtain a description of these policies and procedures and information on how the Fund or Portfolio voted proxies relating to portfolio securities during the 12 month period ended June 30, without charge, upon request, by calling 1-800-262-1122. This description is also available on the SEC's website at www.sec.gov.
Eaton Vance Government Obligations Fund as of October 31, 2008
MANAGEMENT’S DISCUSSION OF FUND PERFORMANCE

Susan Schiff, CFA
Portfolio Manager
Economic and Market Conditions
· The year ended October 31, 2008 featured unusually high volatility in all fixed-income markets. What began in 2007 as a reaction to inopportune subprime lending, grew during the course of 2008 into a major economic and market dislocation. Like all fixed-income markets, the MBS market featured significant spread widening during the year. MBS spreads widened by around 200 basis points (2.00%), ending at approximately 300 basis points (3.00%) over Treasuries at October 31, 2008. That spread widening was true of generic and seasoned agency MBS alike. In a flight-to-quality, there was less buying activity within the MBS sector, as increasingly risk-averse investors favored cash and Treasury bonds. Widespread deleveraging and forced selling by hedge funds and other institutional investors exerted further pressure on the MBS market. Foreign investors, who had been prominent buyers of MBS in recent years, opted instead for Treasury bonds. To add much-needed liquidity, the Federal Reserve lowered its Federal Funds rate – a key short-term interest rate benchmark – to 1.00%, as of October 31, 2008.
· As the housing crisis deepened and foreclosures rose, Fannie Mae and Freddie Mac – government-sponsored enterprises and two of the nation’s largest guarantors of mortgage securities – suffered losses. In September 2008, the Treasury announced its intent to purchase MBS, while adding capital and a line of credit to Fannie Mae and Freddie Mac. In the wake of these actions, the MBS market stabilized.
Management Discussion
· During the year ended October 31, 2008, the Fund(1) continued to focus on seasoned, fixed-rate agency MBS. A significant portion of the Fund’s MBS are FHA- or VA-guaranteed, representing full government guarantees as to principal and interest payments. In addition, because these mortgages were typically originated in the 1980’s or 1990’s, homeowners have built considerable equity over time in their homes. As a result, these mortgages have a relatively low loan-to-value ratio and more predictable cash flows than generic MBS. In addition, the loans are guaranteed by government agencies.
· The Fund’s largest MBS weightings remained in seasoned, fixed-rated 30-year U.S. Government Agency MBS, with a smaller weighting in seasoned fixed-rate 10-, 15- and 20-year MBS. The Fund also had a modest weighting in seasoned U.S. government agency adjustable-rate mortgage-backed securities (ARMs). The spread widening that characterized the MBS market during the year was the primary reason for the Fund’s underperformance of its benchmark, which is more heavily weighted toward Treasury securities. Nonetheless, management continued to believe that agency securities represented an attractive asset class for the Fund, particularly the seasoned MBS on which the Fund focused.
· Prepayment rates for the Fund’s seasoned MBS were lower during the fiscal year, as homeowners were less motivated to refinance their mortgages. The Portfolio’s duration was 3.78 years at October 31, 2008, slightly higher than 3.41 years at October 31, 2007. Duration indicates price sensitivity to changes in interest rates of a fixed-income security or portfolio based on the timing of anticipated principal and interest payments. A shorter duration instrument normally has less exposure to interest rate risk than longer duration instruments.
Eaton Vance Government Obligations Fund
Total Return Performance 10/31/07 – 10/31/08
Class A(2) | | 4.45 | % |
Class B(2) | | 3.67 | % |
Class C(2) | | 3.67 | % |
Class R(2) | | 4.33 | % |
Barclays Capital Intermediate Government Bond Index(3)* | | 7.26 | % |
Lipper Short-Intermediate U.S. Government Funds Average(3) | | 3.35 | % |
Please refer to page 2 for additional performance information.
(1) | The Fund currently invests in a separate registered investment company, Government Obligations Portfolio (the Portfolio), with the same objective and policies as the Fund. References to investments are to the Portfolio’s holdings. |
(2) | These returns do not include the 4.75% maximum sales charge for the Fund’s Class A shares or the applicable contingent deferred sales charges (CDSC) for Class B shares and Class C shares. If sales charges were deducted, the returns would be lower. Class R shares are offered to certain investors at net asset value (NAV). |
(3) | *Formerly called Lehman Brothers Intermediate Government Bond Index. It is not possible to invest directly in an Index or Lipper Classification. The Index’s total return does not reflect expenses that would have been incurred if an investor individually purchased or sold the securities represented in the Index. The Lipper total return is the average total return, at NAV, of the funds that are in the same Lipper Classification as the Fund. |
Past performance is no guarantee of future results. Returns are historical and are calculated by determining the percentage change in net asset value or offering price (as applicable) with all distributions reinvested. Investment return and principal value will fluctuate so that shares, when redeemed, may be worth more or less than their original cost. Performance is for the stated time period only; due to market volatility, the Fund’s current performance may be lower or higher than the quoted return. For performance as of the most recent month end, please refer to www.eatonvance.com.
Fund shares are not insured by the FDIC and are not deposits or other obligations of, or guaranteed by, any depository institution. Shares are subject to investment risks, including possible loss of principal invested.
1
Eaton Vance Government Obligations Fund as of October 31, 2008
FUND PERFORMANCE
The line graph and table set forth below provide information about the Fund’s performance. The line graph compares the performance of Class A of the Fund with that of the Barclays Capital Intermediate Government Bond Index (formerly called Lehman Brothers Intermediate Government Bond Index), an unmanaged index of U.S. government bonds with maturities from one up to (but not including) 10 years. The lines on the graph represent the total returns of a hypothetical investment of $10,000 in Class A of the Fund and in the Barclays Capital Intermediate Government Bond Index. The chart also offers a comparison with the Lipper Short-Intermediate U.S. Government Funds Classification, the Fund’s peer Classification. Class A total returns are presented at net asset value and public offering price. The table includes the total returns of each Class of the Fund at net asset value and public offering price. The performance presented below does not reflect the deduction of taxes, if any, that a shareholder would pay on Fund distributions or the redemption of Fund shares.
Performance(1)
| | Class A | | Class B | | Class C | | Class R | |
Class Share Symbol | | EVGOX | | EMGOX | | ECGOX | | ERGOX | |
| | | | | | | | | |
Average Annual Total Returns (at net asset value) | | | | | | | | | |
One Year | | 4.45 | % | 3.67 | % | 3.67 | % | 4.33 | % |
Five Years | | 3.63 | | 2.86 | | 2.83 | | N.A. | |
Ten Years | | 4.44 | | 3.65 | | 3.63 | | N.A. | |
Life of Fund† | | 6.98 | | 4.10 | | 4.01 | | 3.99 | |
| | | | | | | | | |
SEC Average Annual Total Returns (including sales charge or applicable CDSC) | | | | | | | |
One Year | | -0.55 | % | -1.30 | % | 2.68 | % | 4.33 | % |
Five Years | | 2.64 | | 2.54 | | 2.83 | | N.A. | |
Ten Years | | 3.94 | | 3.65 | | 3.63 | | N.A. | |
Life of Fund† | | 6.76 | | 4.10 | | 4.01 | | 3.99 | |
† Inception Dates – Class A: 8/24/84; Class B: 11/1/93; Class C: 11/1/93; Class R: 8/12/05
(1) | Average Annual Total Returns do not include the 4.75% maximum sales charge for Class A shares or the applicable contingent deferred sales charges (CDSC) for Class B or Class C shares. If sales charges were deducted, the returns would be lower. Class R shares are offered to certain investors at net asset value. SEC Average Annual Total Returns for Class A reflect the maximum 4.75% sales charge. SEC returns for Class B reflect applicable CDSC based on the following schedule: 5% - 1st and 2nd years; 4% - 3rd year; 3% - 4th year; 2% - 5th year; 1% - 6th year. SEC returns for Class C reflect a 1% CDSC for the first year. |
Total Annual
Operating Expenses(2)
| | Class A | | Class B | | Class C | | Class R | |
| | | | | | | | | |
Expense Ratio | | 1.22 | % | 1.97 | % | 1.97 | % | 1.47 | % |
(2) From the Fund’s prospectus dated 3/1/08.
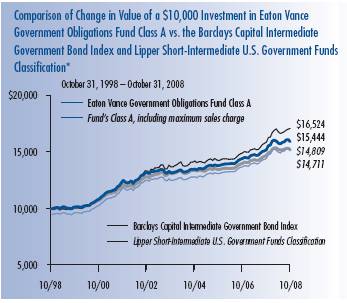
* Sources: Lipper Inc. Class A of the Fund commenced operations on 8/24/84.
A $10,000 hypothetical investment at net asset value in Class B shares on 10/31/98, Class C shares on 10/31/98 and Class R shares on 8/12/05 would have been valued at $14,319, $14,283 and $11,342, respectively, on 10/31/08. The Index’s total return does not reflect the expenses that would have been incurred if an investor individually purchased or sold the securities represented in the Index. The Lipper total return is the average total return, at NAV, of the funds that are in the same Lipper Classification as the Fund. It is not possible to invest directly in an Index or Classification.
Portfolio Composition
Diversification by Sectors(3)
By total investments
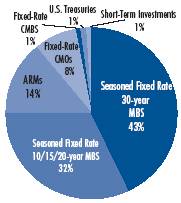
(3) As a percentage of the Portfolio’s total investments as of 10/31/08.
Past performance is no guarantee of future results. Returns are historical and are calculated by determining the percentage change in net asset value or offering price (as applicable) with all distributions reinvested. Investment return and principal value will fluctuate so that shares, when redeemed, may be worth more or less than their original cost. Performance is for the stated time period only; due to market volatility, the Fund’s current performance may be lower or higher than the quoted return. For performance as of the most recent month end, please refer to www.eatonvance.com.
The views expressed throughout this report are those of the portfolio manager and are current only through the end of the period of the report as stated on the cover. These views are subject to change at any time based upon market or other conditions, and the investment adviser disclaims any responsibility to update such views. These views may not be relied on as investment advice and, because investment decisions for a fund are based on many factors, may not be relied on as an indication of trading intent on behalf of any Eaton Vance fund. Portfolio information may not be representative of the Portfolio’s current or future investments and may change due to active management.
2
Eaton Vance Government Obligations Fund as of October 31, 2008
FUND EXPENSES
Example: As a shareholder of the Fund, you incur two types of costs: (1) transaction costs, including sales charges (loads) on purchases and redemption fees (if applicable); and (2) ongoing costs, including management fees; distribution or service fees; and other Fund expenses. This Example is intended to help you understand your ongoing costs (in dollars) of investing in the Fund and to compare these costs with the ongoing costs of investing in other mutual funds. The Example is based on an investment of $1,000 invested at the beginning of the period and held for the entire period (May 1, 2008 – October 31, 2008).
Actual Expenses: The first section of the table below provides information about actual account values and actual expenses. You may use the information in this section, together with the amount you invested, to estimate the expenses that you paid over the period. Simply divide your account value by $1,000 (for example, an $8,600 account value divided by $1,000 = 8.6), then multiply the result by the number in the first section under the heading entitled "Expenses Paid During Period" to estimate the expenses you paid on your account during this period.
Hypothetical Example for Comparison Purposes: The second section of the table below provides information about hypothetical account values and hypothetical expenses based on the actual Fund expense ratio and an assumed rate of return of 5% per year (before expenses), which is not the actual return of the Fund. The hypothetical account values and expenses may not be used to estimate the actual ending account balance or expenses you paid for the period. You may use this information to compare the ongoing costs of investing in your Fund and other funds. To do so, compare this 5% hypothetical example with the 5% hypothetical examples that appear in the shareholder reports of the other funds.
Please note that the expenses shown in the table are meant to highlight your ongoing costs only and do not reflect any transactional costs, such as sales charges (loads) or redemption fees (if applicable). Therefore, the second section of the table is useful in comparing ongoing costs only, and will not help you determine the relative total costs of owning different funds. In addition, if these transactional costs were included, your costs would have been higher.
Eaton Vance Government Obligations Fund
| | | Beginning Account Value
(5/1/08) | | Ending Account Value
(10/31/08) | | Expenses Paid During Period*
(5/1/08 – 10/31/08) | |
| Actual | |
| Class A | | $ | 1,000.00 | | | $ | 1,007.70 | | | $ | 6.11 | | |
| Class B | | $ | 1,000.00 | | | $ | 1,003.80 | | | $ | 9.87 | | |
| Class C | | $ | 1,000.00 | | | $ | 1,003.80 | | | $ | 9.87 | | |
| Class R | | $ | 1,000.00 | | | $ | 1,007.70 | | | $ | 7.32 | | |
| Hypothetical | |
| (5% return per year before expenses) | |
| Class A | | $ | 1,000.00 | | | $ | 1,019.10 | | | $ | 6.14 | | |
| Class B | | $ | 1,000.00 | | | $ | 1,015.30 | | | $ | 9.93 | | |
| Class C | | $ | 1,000.00 | | | $ | 1,015.30 | | | $ | 9.93 | | |
| Class R | | $ | 1,000.00 | | | $ | 1,017.80 | | | $ | 7.35 | | |
* Expenses are equal to the Fund's annualized expense ratio of 1.21% for Class A shares, 1.96% for Class B shares, 1.96% for Class C shares and 1.45% for Class R shares, multiplied by the average account value over the period, multiplied by 184/366 (to reflect the one-half year period). The Example assumes that the $1,000 was invested at the net asset value per share determined at the close of business on April 30, 2008. The Example reflects the expenses of both the Fund and the Portfolio.
3
Eaton Vance Government Obligations Fund as of October 31, 2008
FINANCIAL STATEMENTS
Statement of Assets and Liabilities
As of October 31, 2008
| Assets | |
Investment in Government Obligations Portfolio, at value
(identified cost, $691,071,120) | | $ | 682,391,184 | | |
| Receivable for Fund shares sold | | | 2,541,427 | | |
| Total assets | | $ | 684,932,611 | | |
| Liabilities | |
| Payable for Fund shares redeemed | | $ | 2,147,223 | | |
| Dividends payable | | | 843,803 | | |
| Payable to affiliate for distribution and service fees | | | 341,763 | | |
| Payable to affiliate for Trustees' fees | | | 1,850 | | |
| Accrued expenses | | | 170,371 | | |
| Total liabilities | | $ | 3,505,010 | | |
| Net Assets | | $ | 681,427,601 | | |
| Sources of Net Assets | |
| Paid-in capital | | $ | 907,423,686 | | |
Accumulated net realized loss from Portfolio (computed on
the basis of identified cost) | | | (216,714,653 | ) | |
| Accumulated distributions in excess of net investment income | | | (601,496 | ) | |
Net unrealized depreciation from Portfolio (computed on the basis of
identified cost) | | | (8,679,936 | ) | |
| Total | | $ | 681,427,601 | | |
| Class A Shares | |
| Net Assets | | $ | 362,311,315 | | |
| Shares Outstanding | | | 50,933,767 | | |
Net Asset Value and Redemption Price Per Share
(net assets ÷ shares of beneficial interest outstanding) | | $ | 7.11 | | |
Maximum Offering Price Per Share
(100 ÷ 95.25 of $7.11) | | $ | 7.46 | | |
| Class B Shares | |
| Net Assets | | $ | 146,986,833 | | |
| Shares Outstanding | | | 20,663,594 | | |
Net Asset Value and Offering Price Per Share*
(net assets ÷ shares of beneficial interest outstanding) | | $ | 7.11 | | |
| Class C Shares | |
| Net Assets | | $ | 171,302,264 | | |
| Shares Outstanding | | | 24,111,786 | | |
Net Asset Value and Offering Price Per Share*
(net assets ÷ shares of beneficial interest outstanding) | | $ | 7.10 | | |
| Class R Shares | |
| Net Assets | | $ | 827,189 | | |
| Shares Outstanding | | | 116,725 | | |
Net Asset Value, Offering Price and Redemption Price Per Share
(net assets ÷ shares of beneficial interest outstanding) | | $ | 7.09 | | |
| On sales of $25,000 or more, the offering price of Class A shares is reduced. | |
* Redemption price per share is equal to the net asset value less any applicable contingent deferred sales charge.
Statement of Operations
For the Year Ended
October 31, 2008
| Investment Income | |
| Interest allocated from Portfolio | | $ | 31,808,170 | | |
| Securities lending income allocated from Portfolio, net | | | 314,946 | | |
| Expenses allocated from Portfolio | | | (4,866,292 | ) | |
| Net investment income from Portfolio | | $ | 27,256,824 | | |
| Expenses | |
| Trustees' fees and expenses | | $ | 3,544 | | |
Distribution and service fees
Class A | | | 767,484 | | |
| Class B | | | 1,562,320 | | |
| Class C | | | 1,425,077 | | |
| Class R | | | 2,440 | | |
| Transfer and dividend disbursing agent fees | | | 584,144 | | |
| Printing and postage | | | 88,183 | | |
| Registration fees | | | 60,882 | | |
| Custodian fee | | | 49,799 | | |
| Legal and accounting services | | | 41,410 | | |
| Miscellaneous | | | 28,166 | | |
| Total expenses | | $ | 4,613,449 | | |
| Net investment income | | $ | 22,643,375 | | |
Realized and Unrealized
Gain (Loss) from Portfolio | |
Net realized gain (loss) —
Financial futures contracts | | $ | 6,883,425 | | |
| Net realized gain | | $ | 6,883,425 | | |
Change in unrealized appreciation (depreciation) —
Investments (identified cost basis) | | $ | (7,276,356 | ) | |
| Financial futures contracts | | | (2,657,814 | ) | |
| Net change in unrealized appreciation (depreciation) | | $ | (9,934,170 | ) | |
| Net realized and unrealized loss | | $ | (3,050,745 | ) | |
| Net increase in net assets from operations | | $ | 19,592,630 | | |
See notes to financial statements
4
Eaton Vance Government Obligations Fund as of October 31, 2008
FINANCIAL STATEMENTS CONT'D
Statements of Changes in Net Assets
Increase (Decrease)
in Net Assets | | Year Ended
October 31, 2008 | | Year Ended
October 31, 2007 | |
From operations —
Net investment income | | $ | 22,643,375 | | | $ | 20,666,810 | | |
Net realized gain from investment
transactions and financial
futures contracts | | | 6,883,425 | | | | 592,070 | | |
Net change in unrealized
appreciation (depreciation)
from investments and
financial futures contracts | | | (9,934,170 | ) | | | 2,808,558 | | |
| Net increase in net assets from operations | | $ | 19,592,630 | | | $ | 24,067,438 | | |
Distributions to shareholders —
From net investment income
Class A | | $ | (15,519,589 | ) | | $ | (13,358,253 | ) | |
| Class B | | | (6,781,462 | ) | | | (8,706,645 | ) | |
| Class C | | | (6,148,590 | ) | | | (5,508,440 | ) | |
| Class R | | | (23,112 | ) | | | (11,417 | ) | |
Tax return of capital
Class A | | | — | | | | (63,516 | ) | |
| Class B | | | — | | | | (47,861 | ) | |
| Class C | | | — | | | | (30,301 | ) | |
| Class R | | | — | | | | (57 | ) | |
| Total distributions to shareholders | | $ | (28,472,753 | ) | | $ | (27,726,490 | ) | |
Transactions in shares of beneficial interest —
Proceeds from sale of shares
Class A | | $ | 212,119,920 | | | $ | 54,748,746 | | |
| Class B | | | 34,528,345 | | | | 9,336,024 | | |
| Class C | | | 106,275,591 | | | | 23,087,184 | | |
| Class R | | | 843,401 | | | | 138,431 | | |
Net asset value of shares issued to
shareholders in payment of
distributions declared
Class A | | | 10,314,729 | | | | 7,984,409 | | |
| Class B | | | 3,996,964 | | | | 4,862,045 | | |
| Class C | | | 3,623,958 | | | | 2,865,786 | | |
| Class R | | | 19,318 | | | | 11,459 | | |
Cost of shares redeemed
Class A | | | (109,962,134 | ) | | | (77,852,552 | ) | |
| Class B | | | (43,283,489 | ) | | | (55,971,358 | ) | |
| Class C | | | (51,459,693 | ) | | | (39,660,593 | ) | |
| Class R | | | (260,466 | ) | | | (138,288 | ) | |
Net asset value of shares exchanged
Class A | | | 9,439,980 | | | | 10,603,172 | | |
| Class B | | | (9,439,980 | ) | | | (10,603,172 | ) | |
Net increase (decrease) in net assets from
Fund share transactions | | $ | 166,756,444 | | | $ | (70,588,707 | ) | |
| Net increase (decrease) in net assets | | $ | 157,876,321 | | | $ | (74,247,759 | ) | |
| Net Assets | | Year Ended
October 31, 2008 | | Year Ended
October 31, 2007 | |
| At beginning of year | | $ | 523,551,280 | | | $ | 597,799,039 | | |
| At end of year | | $ | 681,427,601 | | | $ | 523,551,280 | | |
Accumulated distributions
in excess of net investment
income included in net assets | |
| At end of year | | $ | (601,496 | ) | | $ | (851,974 | ) | |
See notes to financial statements
5
Eaton Vance Government Obligations Fund as of October 31, 2008
FINANCIAL STATEMENTS CONT'D
Financial Highlights
| | | Class A | |
| | | Year Ended October 31, | | Period Ended | | Year Ended | |
| | | 2008 | | 2007 | | 2006 | | 2005 | | October 31, 2004(1) | | December 31, 2003 | |
| Net asset value — Beginning period | | $ | 7.160 | | | $ | 7.200 | | | $ | 7.340 | | | $ | 7.740 | | | $ | 8.050 | | | $ | 8.620 | | |
| Income (loss) from operations | |
| Net investment income(2) | | $ | 0.297 | | | $ | 0.300 | | | $ | 0.266 | | | $ | 0.212 | | | $ | 0.215 | | | $ | 0.159 | | |
| Net realized and unrealized gain (loss) | | | 0.020 | | | | 0.053 | | | | 0.037 | | | | (0.090 | ) | | | (0.065 | ) | | | (0.177 | ) | |
| Total income (loss) from operations | | $ | 0.317 | | | $ | 0.353 | | | $ | 0.303 | | | $ | 0.122 | | | $ | 0.150 | | | $ | (0.018 | ) | |
| Less distributions | |
| From net investment income | | $ | (0.367 | ) | | $ | (0.391 | ) | | $ | (0.424 | ) | | $ | (0.519 | ) | | $ | (0.460 | ) | | $ | (0.548 | ) | |
| Tax return of capital | | | — | | | | (0.002 | ) | | | (0.019 | ) | | | (0.003 | ) | | | — | | | | (0.004 | ) | |
| Total distributions | | $ | (0.367 | ) | | $ | (0.393 | ) | | $ | (0.443 | ) | | $ | (0.522 | ) | | $ | (0.460 | ) | | $ | (0.552 | ) | |
| Net asset value — End of period | | $ | 7.110 | | | $ | 7.160 | | | $ | 7.200 | | | $ | 7.340 | | | $ | 7.740 | | | $ | 8.050 | | |
| Total Return(3) | | | 4.45 | % | | | 5.05 | % | | | 4.28 | % | | | 2.03 | %(4) | | | 1.91 | %(8) | | | (0.35 | )% | |
| Ratios/Supplemental Data | |
| Net assets, end of period (000's omitted) | | $ | 362,311 | | | $ | 245,687 | | | $ | 251,751 | | | $ | 291,931 | | | $ | 354,083 | | | $ | 435,022 | | |
| Ratios (As a percentage of average daily net assets): | |
| Expenses before custodian fee reduction(5)(6) | | | 1.19 | % | | | 1.22 | % | | | 1.20 | % | | | 1.18 | % | | | 1.13 | %(7) | | | 1.06 | % | |
| Net investment income | | | 4.09 | % | | | 4.19 | % | | | 3.69 | % | | | 2.82 | % | | | 3.27 | %(7) | | | 1.90 | % | |
| Portfolio Turnover of the Portfolio | | | 19 | % | | | 23 | % | | | 2 | % | | | 30 | % | | | 5 | % | | | 67 | % | |
(1) For the ten-month period ended October 31, 2004.
(2) Computed using average shares outstanding.
(3) Returns are historical and are calculated by determining the percentage change in net asset value with all distributions reinvested.
(4) Total return reflects an increase of 0.31% due to a change in the timing of the payment and reinvestment of distributions.
(5) Excludes the effect of custody fee credits, if any, of less than 0.005%.
(6) Includes the Fund's share of the Portfolio's allocated expenses.
(7) Annualized.
(8) Not annualized.
See notes to financial statements
6
Eaton Vance Government Obligations Fund as of October 31, 2008
FINANCIAL STATEMENTS CONT'D
Financial Highlights
| | | Class B | |
| | | Year Ended October 31, | | Period Ended | | Year Ended | |
| | | 2008 | | 2007 | | 2006 | | 2005 | | October 31, 2004(1) | | December 31, 2003 | |
| Net asset value — Beginning of period | | $ | 7.160 | | | $ | 7.200 | | | $ | 7.340 | | | $ | 7.740 | | | $ | 8.040 | | | $ | 8.610 | | |
| Income (loss) from operations | |
| Net investment income(2) | | $ | 0.245 | | | $ | 0.247 | | | $ | 0.213 | | | $ | 0.156 | | | $ | 0.166 | | | $ | 0.096 | | |
| Net realized and unrealized gain (loss) | | | 0.018 | | | | 0.053 | | | | 0.035 | | | | (0.094 | ) | | | (0.060 | ) | | | (0.179 | ) | |
| Total income (loss) from operations | | $ | 0.263 | | | $ | 0.300 | | | $ | 0.248 | | | $ | 0.062 | | | $ | 0.106 | | | $ | (0.083 | ) | |
| Less distributions | |
| From net investment income | | $ | (0.313 | ) | | $ | (0.338 | ) | | $ | (0.369 | ) | | $ | (0.459 | ) | | $ | (0.406 | ) | | $ | (0.483 | ) | |
| Tax return of capital | | | — | | | | (0.002 | ) | | | (0.019 | ) | | | (0.003 | ) | | | — | | | | (0.004 | ) | |
| Total distributions | | $ | (0.313 | ) | | $ | (0.340 | ) | | $ | (0.388 | ) | | $ | (0.462 | ) | | $ | (0.406 | ) | | $ | (0.487 | ) | |
| Net asset value — End of period | | $ | 7.110 | | | $ | 7.160 | | | $ | 7.200 | | | $ | 7.340 | | | $ | 7.740 | | | $ | 8.040 | | |
| Total Return(3) | | | 3.67 | % | | | 4.27 | % | | | 3.50 | % | | | 1.15 | %(4) | | | 1.35 | %(8) | | | (1.03 | )% | |
| Ratios/Supplemental Data | |
| Net assets, end of period (000's omitted) | | $ | 146,987 | | | $ | 162,159 | | | $ | 215,850 | | | $ | 291,079 | | | $ | 390,836 | | | $ | 555,947 | | |
| Ratios (As a percentage of average daily net assets): | |
| Expenses before custodian fee reduction(5)(6) | | | 1.94 | % | | | 1.97 | % | | | 1.95 | % | | | 1.93 | % | | | 1.88 | %(7) | | | 1.81 | % | |
| Net investment income | | | 3.37 | % | | | 3.45 | % | | | 2.95 | % | | | 2.07 | % | | | 2.52 | %(7) | | | 1.15 | % | |
| Portfolio Turnover of the Portfolio | | | 19 | % | | | 23 | % | | | 2 | % | | | 30 | % | | | 5 | % | | | 67 | % | |
(1) For the ten-month period ended October 31, 2004.
(2) Computed using average shares outstanding.
(3) Returns are historical and are calculated by determining the percentage change in net asset value with all distributions reinvested.
(4) Total return reflects an increase of 0.24% due to a change in the timing of the payment and reinvestment of distributions.
(5) Excludes the effect of custody fee credits, if any, of less than 0.005%.
(6) Includes the Fund's share of the Portfolio's allocated expenses.
(7) Annualized.
(8) Not annualized.
See notes to financial statements
7
Eaton Vance Government Obligations Fund as of October 31, 2008
FINANCIAL STATEMENTS CONT'D
Financial Highlights
| | | Class C | |
| | | Year Ended October 31, | | Period Ended | | Year Ended | |
| | | 2008 | | 2007 | | 2006 | | 2005 | | October 31, 2004(1) | | December 31, 2003 | |
| Net asset value — Beginning of period | | $ | 7.150 | | | $ | 7.190 | | | $ | 7.340 | | | $ | 7.730 | | | $ | 8.040 | | | $ | 8.610 | | |
| Income (loss) from operations | |
| Net investment income(2) | | $ | 0.243 | | | $ | 0.247 | | | $ | 0.157 | | | $ | 0.157 | | | $ | 0.166 | | | $ | 0.096 | | |
| Net realized and unrealized gain (loss) | | | 0.020 | | | | 0.053 | | | | (0.085 | ) | | | (0.085 | ) | | | (0.070 | ) | | | (0.179 | ) | |
| Total income (loss) from operations | | $ | 0.263 | | | $ | 0.300 | | | $ | 0.238 | | | $ | 0.072 | | | $ | 0.096 | | | $ | (0.083 | ) | |
| Less distributions | |
| From net investment income | | $ | (0.313 | ) | | $ | (0.338 | ) | | $ | (0.369 | ) | | $ | (0.459 | ) | | $ | (0.406 | ) | | $ | (0.483 | ) | |
| Tax return of capital | | | — | | | | (0.002 | ) | | | (0.019 | ) | | | (0.003 | ) | | | — | | | | (0.004 | ) | |
| Total distributions | | $ | (0.313 | ) | | $ | (0.340 | ) | | $ | (0.388 | ) | | $ | (0.462 | ) | | $ | (0.406 | ) | | $ | (0.487 | ) | |
| Net asset value — End of period | | $ | 7.100 | | | $ | 7.150 | | | $ | 7.190 | | | $ | 7.340 | | | $ | 7.730 | | | $ | 8.040 | | |
| Total Return(3) | | | 3.67 | % | | | 4.27 | % | | | 3.36 | % | | | 1.16 | %(4) | | | 1.22 | %(8) | | | (1.02 | )% | |
| Ratios/Supplemental Data | |
| Net assets, end of period (000's omitted) | | $ | 171,302 | | | $ | 115,460 | | | $ | 129,963 | | | $ | 182,214 | | | $ | 272,000 | | | $ | 436,960 | | |
| Ratios (As a percentage of average daily net assets): | |
| Expenses before custodian fee reduction(5)(6) | | | 1.94 | % | | | 1.97 | % | | | 1.95 | % | | | 1.93 | % | | | 1.88 | %(7) | | | 1.81 | % | |
| Net investment income | | | 3.35 | % | | | 3.45 | % | | | 2.95 | % | | | 2.08 | % | | | 2.52 | %(7) | | | 1.15 | % | |
| Portfolio Turnover of the Portfolio | | | 19 | % | | | 23 | % | | | 2 | % | | | 30 | % | | | 5 | % | | | 67 | % | |
(1) For the ten-month period ended October 31, 2004.
(2) Computed using average shares outstanding.
(3) Returns are historical and are calculated by determining the percentage change in net asset value with all distributions reinvested.
(4) Total return reflects an increase of 0.11% due to a change in the timing of the payment and reinvestment of distributions.
(5) Excludes the effect of custody fee credits, if any, of less than 0.005%.
(6) Includes the Fund's share of the Portfolio's allocated expenses.
(7) Annualized.
(8) Not annualized.
See notes to financial statements
8
Eaton Vance Government Obligations Fund as of October 31, 2008
FINANCIAL STATEMENTS CONT'D
Financial Highlights
| | | Class R | |
| | | Year Ended October 31, | | Period Ended | |
| | | 2008 | | 2007 | | 2006 | | October 31, 2005(1) | |
| Net asset value — Beginning of period | | $ | 7.130 | | | $ | 7.170 | | | $ | 7.320 | | | $ | 7.430 | | |
| Income (loss) from operations | |
| Net investment income(2) | | $ | 0.276 | | | $ | 0.280 | | | $ | 0.214 | | | $ | 0.083 | | |
| Net realized and unrealized gain (loss) | | | 0.032 | | | | 0.054 | | | | 0.060 | | | | (0.091 | ) | |
| Total income (loss) from operations | | $ | 0.308 | | | $ | 0.334 | | | $ | 0.274 | | | $ | (0.008 | ) | |
| Less distributions | |
| From net investment income | | $ | (0.348 | ) | | $ | (0.372 | ) | | $ | (0.405 | ) | | $ | (0.099 | ) | |
| Tax return of capital | | | — | | | | (0.002 | ) | | | (0.019 | ) | | | (0.003 | ) | |
| Total distributions | | $ | (0.348 | ) | | $ | (0.374 | ) | | $ | (0.424 | ) | | $ | (0.102 | ) | |
| Net asset value — End of period | | $ | 7.090 | | | $ | 7.130 | | | $ | 7.170 | | | $ | 7.320 | | |
| Total Return(3) | | | 4.33 | % | | | 4.79 | % | | | 3.87 | % | | | (0.12 | )%(7) | |
| Ratios/Supplemental Data | |
| Net assets, end of period (000's omitted) | | $ | 827 | | | $ | 245 | | | $ | 235 | | | $ | 2 | | |
| Ratios (As a percentage of average daily net assets): | |
| Expenses before custodian fee reduction(4)(5) | | | 1.44 | % | | | 1.47 | % | | | 1.45 | % | | | 1.43 | %(6) | |
| Net investment income | | | 3.82 | % | | | 3.93 | % | | | 3.01 | % | | | 4.57 | %(6) | |
| Portfolio Turnover of the Portfolio | | | 19 | % | | | 23 | % | | | 2 | % | | | 30 | % | |
(1) For the period from the commencement of operations, August 12, 2005, to October 31, 2005.
(2) Computed using average shares outstanding.
(3) Returns are historical and are calculated by determining the percentage change in net asset value with all distributions reinvested.
(4) Excludes the effect of custody fee credits, if any, of less than 0.005%.
(5) Includes the Fund's share of the Portfolio's allocated expenses.
(6) Annualized.
(7) Not annualized.
See notes to financial statements
9
Eaton Vance Government Obligations Fund as of October 31, 2008
NOTES TO FINANCIAL STATEMENTS
1 Significant Accounting Policies
Eaton Vance Government Obligations Fund (the Fund) is a diversified series of Eaton Vance Mutual Funds Trust (the Trust). The Trust is a Massachusetts business trust registered under the Investment Company Act of 1940, as amended (the 1940 Act), as an open-end management investment company. The Fund offers four classes of shares. Class A shares are generally sold subject to a sales charge imposed at time of purchase. Class B and Class C shares are sold at net asset value and are generally subject to a contingent deferred sales charge (see Note 5). Class R shares are sold at net asset value and are not subject to a sales charge. Class B shares automatically convert to Class A shares eight years after their purchase as described in the Fund's prospectus. Each class represents a pro-rata interest in the Fund, but votes separately on class-specific matters and (as noted below) is subject to different expenses. Realized and unrealize d gains and losses are allocated daily to each class of shares based on the relative net assets of each class to the total net assets of the Fund. Net investment income, other than class-specific expenses, is allocated daily to each class of shares based upon the ratio of the value of each class's paid shares to the total value of all paid shares. Each class of shares differs in its distribution plan and certain other class-specific expenses. The Fund invests all of its investable assets in interests in Government Obligations Portfolio (the Portfolio), a New York trust, having the same investment objective and policies as the Fund. The value of the Fund's investment in the Portfolio reflects the Fund's proportionate interest in the net assets of the Portfolio (84.2% at October 31, 2008). The performance of the Fund is directly affected by the performance of the Portfolio. The financial statements of the Portfolio, including the portfolio of investments, are included elsewhere in this report and should be rea d in conjunction with the Fund's financial statements.
The following is a summary of significant accounting policies of the Fund. The policies are in conformity with accounting principles generally accepted in the United States of America.
A Investment Valuation — Valuation of securities by the Portfolio is discussed in Note 1A of the Portfolio's Notes to Financial Statements, which are included elsewhere in this report.
B Income — The Fund's net investment income or loss consists of the Fund's pro-rata share of the net investment income or loss of the Portfolio, less all actual and accrued expenses of the Fund.
C Federal Taxes — The Fund's policy is to comply with the provisions of the Internal Revenue Code applicable to regulated investment companies and to distribute to shareholders each year substantially all of its net investment income, and all or substantially all of its net realized capital gains. Accordingly, no provision for federal income or excise tax is necessary. At October 31, 2008, the Fund, for federal income tax purposes, had a capital loss carryforward of $215,577,556 which will reduce its taxable income arising from future net realized gains on investment transactions, if any, to the extent permitted by the Internal Revenue Code, and thus will reduce the amount of distributions to shareholders, which would otherwise be necessary to relieve the Fund of any liab ility for federal income or excise tax. Such capital loss carryforward will expire on October 31, 2010 ($21,056,795), October 31, 2011 ($78,339,789), October 31, 2012 ($67,101,638), October 31, 2013 ($23,607,593), October 31, 2014 ($17,522,954), October 31, 2015 ($6,336,492) and October 31, 2016 ($1,612,295).
As of October 31, 2008, the Fund had no uncertain tax positions that would require financial statement recognition, de-recognition, or disclosure. Each of the Fund's federal tax returns filed in the 3-year period ended October 31, 2008 remains subject to examination by the Internal Revenue Service.
D Expenses — The majority of expenses of the Trust are directly identifiable to an individual fund. Expenses which are not readily identifiable to a specific fund are allocated taking into consideration, among other things, the nature and type of expense and the relative size of the funds.
E Expense Reduction — State Street Bank and Trust Company (SSBT) serves as custodian of the Fund. Pursuant to the custodian agreement, SSBT receives a fee reduced by credits, which are determined based on the average daily cash balance the Fund maintains with SSBT. All credit balances, if any, used to reduce the Fund's custodian fees are reported as a reduction of expenses in the Statement of Operations.
F Use of Estimates — The preparation of the financial statements in conformity with accounting principles generally accepted in the United States of America requires management to make estimates and assumptions that affect the reported amounts of assets and liabilities at the date of the financial statements and the reported amounts of income and expense during the reporting period. Actual results could differ from those estimates.
10
Eaton Vance Government Obligations Fund as of October 31, 2008
NOTES TO FINANCIAL STATEMENTS CONT'D
G Indemnifications — Under the Trust's organizational documents, its officers and Trustees may be indemnified against certain liabilities and expenses arising out of the performance of their duties to the Fund, and shareholders are indemnified against personal liability for the obligations of the Trust. Additionally, in the normal course of business, the Fund enters into agreements with service providers that may contain indemnification clauses. The Fund's maximum exposure under these arrangements is unknown as this would involve future claims that may be made against the Fund that have not yet occurred.
H Other — Investment transactions are accounted for on a trade date basis. Dividends to shareholders are recorded on the ex-dividend date.
2 Distributions to Shareholders
The Fund declares dividends daily to shareholders of record at the time of declaration. Distributions are generally paid monthly. Distributions of realized capital gains (reduced by available capital loss carryforwards from prior years, if any) are made at least annually. Distributions are declared separately for each class of shares. Shareholders may reinvest income and capital gain distributions in additional shares of the same class of the Fund at the net asset value as of the ex-dividend date or, at the election of the shareholder, receive distributions in cash. The Fund distinguishes between distributions on a tax basis and a financial reporting basis. Accounting principles generally accepted in the United States of America require that only distributions in excess of tax basis earnings and profits be reported in the financial statements as a return of capital. Permanent differences between book and tax accounting relating to distributions are reclassified to paid-in capital.
The tax character of distributions declared for the years ended October 31, 2008 and October 31, 2007 was as follows:
| | | Year Ended October 31, | |
| | | 2008 | | 2007 | |
| Distributions declared from: | |
| Ordinary income | | $ | 28,472,753 | | | $ | 27,584,755 | | |
| Tax return of capital | | | — | | | $ | 141,735 | | |
During the year ended October 31, 2008, accumulated net realized loss was increased by $2,007,986, accumulated distributions in excess of net investment income were decreased by $6,079,856 and paid-in capital was decreased by $4,071,870 due to differences between book and tax accounting, primarily for paydown gain (loss), premium amortization and due to expired capital loss carryforwards. These reclassifications had no effect on the net assets or net asset value per share of the Fund.
As of October 31, 2008, the components of distributable earnings (accumulated losses) and unrealized appreciation (depreciation) on a tax basis were as follows:
| Undistributed ordinary income | | $ | 242,307 | | |
| Capital loss carryforward | | $ | (215,577,556 | ) | |
| Net unrealized depreciation | | $ | (9,817,033 | ) | |
| Other temporary differences | | $ | (843,803 | ) | |
The differences between components of distributable earnings (accumulated losses) on a tax basis and the amounts reflected in the Statement of Assets and Liabilities are primarily due to wash sales, partnership allocations, futures contracts, the timing of recognizing distributions to shareholders, premium amortization and mixed straddle amounts.
3 Transactions with Affiliates
Eaton Vance Management (EVM) serves as the administrator to the Fund, but receives no compensation. The Portfolio has engaged Boston Management and Research (BMR), a subsidiary of EVM, to render investment advisory services. See Note 2 of the Portfolio's Notes to Financial Statements which are included elsewhere in this report. EVM serves as the sub-transfer agent of the Fund and receives from the transfer agent an aggregate fee based upon the actual expenses incurred by EVM in the performance of these services. For the year ended October 31, 2008, EVM earned $33,417 in sub-transfer agent fees. The Fund was informed that Eaton Vance Distributors, Inc. (EVD), an affiliate of EVM and the Fund's principal underwriter, received $49,530 as its portion of the sales charge on sales of Class A shares for the year ended October 31, 2008. EVD also received distribution and service fees from Class A, Class B, Class C and Class R shares (se e Note 4) and contingent deferred sales charges (see Note 5).
Except for Trustees of the Fund and the Portfolio who are not members of EVM's or BMR's organizations, officers and Trustees receive remuneration for their services to the Fund out of the investment adviser fee. Certain officers and Trustees of the Fund and the Portfolio are officers of the above organizations.
4 Distribution Plans
The Fund has in effect a distribution plan for Class A shares (Class A Plan) pursuant to Rule 12b-1 under the 1940 Act.
11
Eaton Vance Government Obligations Fund as of October 31, 2008
NOTES TO FINANCIAL STATEMENTS CONT'D
The Class A Plan provides that the Fund will pay EVD a distribution and service fee of 0.25% per annum of its average daily net assets attributable to Class A shares for distribution services and facilities provided to the Fund by EVD, as well as for personal services and/or the maintenance of shareholder accounts. Distribution and service fees paid or accrued to EVD for the year ended October 31, 2008 amounted to $767,484 for Class A shares. The Fund also has in effect distribution plans for Class B shares (Class B Plan), Class C shares (Class C Plan) and Class R shares (Class R Plan) pursuant to Rule 12b-1 under the 1940 Act. The Class B and Class C Plans require the Fund to pay EVD amounts equal to 0.75% per annum of its average daily net assets attributable to Class B and Class C shares for providing ongoing distribution services and facilities to the Fund. The Fund will automatically discontinue payments to EVD during any p eriod in which there are no outstanding Uncovered Distribution Charges, which are equivalent to the sum of (i) 5% and 6.25% of the aggregate amount received by the Fund for Class B and Class C shares sold, respectively, plus (ii) interest calculated by applying the rate of 1% over the prevailing prime rate to the outstanding balance of Uncovered Distribution Charges of EVD of each respective class, reduced by the aggregate amount of contingent deferred sales charges (see Note 5) and amounts theretofore paid or payable to EVD by each respective class. For the year ended October 31, 2008, the Fund paid or accrued to EVD $1,171,740 and $1,068,808 for Class B and Class C shares, respectively, representing 0.75% of the average daily net assets of Class B and Class C shares. At October 31, 2008, the amounts of Uncovered Distribution Charges of EVD calculated under the Class B and Class C Plans were approximately $13,313,000 and $70,365,000, respectively. The Class R Plan requires the Fund to pay EVD an amount equa l to 0.50% per annum of its average daily net assets attributable to Class R shares for providing ongoing distribution services and facilities to the Fund. The Trustees of the Trust have currently limited Class R distribution payments to 0.25% per annum of the average daily net assets attributable to Class R shares. For the year ended October 31, 2008, the Fund paid or accrued to EVD $1,220, representing 0.25% of the average daily net assets of Class R shares.
The Class B, Class C and Class R Plans also authorize the Fund to make payments of service fees to EVD, investment dealers and other persons in amounts not exceeding 0.25% per annum of its average daily net assets attributable to that class. Service fees paid or accrued are for personal services and/or the maintenance of shareholder accounts. They are separate and distinct from the sales commissions and distribution fees payable to EVD and, as such, are not subject to automatic discontinuance when there are no outstanding Uncovered Distribution Charges of EVD. Service fees paid or accrued for the year ended October 31, 2008 amounted to $390,580, $356,269 and $1,220 for Class B, Class C and Class R shares, respectively.
5 Contingent Deferred Sales Charges
A contingent deferred sales charge (CDSC) generally is imposed on redemptions of Class B shares made within six years of purchase and on redemptions of Class C shares made within one year of purchase. Class A shares may be subject to a 1% CDSC if redeemed within 18 months of purchase (depending on the circumstances of purchase). Generally, the CDSC is based upon the lower of the net asset value at date of redemption or date of purchase. No charge is levied on shares acquired by reinvestment of dividends or capital gain distributions. The CDSC for Class B shares is imposed at declining rates that begin at 5% in the case of redemptions in the first and second year after purchase, declining one percentage point each subsequent year. Class C shares are subject to a 1% CDSC if redeemed within one year of purchase. No CDSC is levied on shares which have been sold to EVM or its affiliates or to their respective employees or clients and may be waived under certain other limited conditions. CDSCs received on Class B and Class C redemptions are paid to EVD to reduce the amount of Uncovered Distribution Charges calculated under the Fund's Class B and Class C Plans. CDSCs received on Class B and Class C redemptions when no Uncovered Distribution Charges exist are credited to the Fund. For the year ended October 31, 2008, the Fund was informed that EVD received approximately $17,000, $314,000 and $43,000 of CDSC paid by Class A, Class B and Class C shareholders, respectively.
6 Investment Transactions
For the year ended October 31, 2008, increases and decreases in the Fund's investment in the Portfolio aggregated $351,784,436 and $219,442,542, respectively.
7 Shares of Beneficial Interest
The Fund's Declaration of Trust permits the Trustees to issue an unlimited number of full and fractional shares of
12
Eaton Vance Government Obligations Fund as of October 31, 2008
NOTES TO FINANCIAL STATEMENTS CONT'D
beneficial interest (without par value). Such shares may be issued in a number of different series (such as the Fund) and classes. Transactions in Fund shares were as follows:
| | | Year Ended October 31, | |
| Class A | | 2008 | | 2007 | |
| Sales | | | 29,072,836 | | | | 7,651,023 | | |
Issued to shareholders electing to
receive payments of distributions
in Fund shares | | | 1,422,163 | | | | 1,116,388 | | |
| Redemptions | | | (15,178,819 | ) | | | (10,890,007 | ) | |
| Exchange from Class B shares | | | 1,297,703 | | | | 1,482,111 | | |
| Net increase (decrease) | | | 16,613,883 | | | | (640,485 | ) | |
| | | Year Ended October 31, | |
| Class B | | 2008 | | 2007 | |
| Sales | | | 4,727,227 | | | | 1,303,176 | | |
Issued to shareholders electing to
receive payments of distributions
in Fund shares | | | 550,405 | | | | 679,386 | | |
| Redemptions | | | (5,966,564 | ) | | | (7,822,903 | ) | |
| Exchange to Class A shares | | | (1,296,262 | ) | | | (1,480,529 | ) | |
| Net decrease | | | (1,985,194 | ) | | | (7,320,870 | ) | |
| | | Year Ended October 31, | |
| Class C | | 2008 | | 2007 | |
| Sales | | | 14,578,230 | | | | 3,229,148 | | |
Issued to shareholders electing to
receive payments of distributions
in Fund shares | | | 500,225 | | | | 400,982 | | |
| Redemptions | | | (7,113,646 | ) | | | (5,550,095 | ) | |
| Net increase (decrease) | | | 7,964,809 | | | | (1,919,965 | ) | |
| | | Year Ended October 31, | |
| Class R | | 2008 | | 2007 | |
| Sales | | | 115,915 | | | | 19,376 | | |
Issued to shareholders electing to
receive payments of distributions
in Fund shares | | | 2,680 | | | | 1,608 | | |
| Redemptions | | | (36,200 | ) | | | (19,350 | ) | |
| Net increase | | | 82,395 | | | | 1,634 | | |
8 Recently Issued Accounting Pronouncement
In September 2006, the Financial Accounting Standards Board issued Statement of Financial Accounting Standards No. 157 (FAS 157), "Fair Value Measurements". FAS 157 defines fair value, establishes a framework for measuring fair value in accordance with accounting principles generally accepted in the United States of America and expands disclosure about fair value measurements. FAS 157 is effective for fiscal years beginning after November 15, 2007. As of October 31, 2008, management does not believe the adoption of FAS 157 will impact the amounts reported in the financial statements; however, additional disclosures may be required about the inputs used to develop the measurements of fair value and the effect of certain of the measurements on changes in net assets for the period.
13
Eaton Vance Government Obligations Fund as of October 31, 2008
REPORT OF INDEPENDENT REGISTERED PUBLIC ACCOUNTING FIRM
To the Trustees of Eaton Vance Mutual Funds Trust and Shareholders of Eaton Vance Government Obligations Fund:
We have audited the accompanying statement of assets and liabilities of Eaton Vance Government Obligations Fund (the "Fund") (one of the series of Eaton Vance Mutual Funds Trust) as of October 31, 2008, the related statement of operations for the year then ended, and the statements of changes in net assets and the financial highlights for each of the two years in the period then ended. These financial statements and financial highlights are the responsibility of the Fund's management. Our responsibility is to express an opinion on these financial statements and financial highlights based on our audits. The financial highlights for the year ended October 31, 2006, and all prior periods presented were audited by other auditors. Those auditors expressed an unqualified opinion on those finan cial highlights in their report dated December 27, 2006.
We conducted our audits in accordance with the standards of the Public Company Accounting Oversight Board (United States). Those standards require that we plan and perform the audit to obtain reasonable assurance about whether the financial statements and financial highlights are free of material misstatement. The Fund is not required to have, nor were we engaged to perform, an audit of its internal control over financial reporting. Our audits included consideration of internal control over financial reporting as a basis for designing audit procedures that are appropriate in the circumstances, but not for the purpose of expressing an opinion on the effectiveness of the Fund's internal control over financial reporting. Accordingly, we express no such opinion. An audit also includes examining, on a test basis, evidence supporting the amounts and disclosures in the financial statements, assessing the accounting principles used and significant estimates made by management, as well as evaluating the overall financial statement presentation. We believe that our audits provide a reasonable basis for our opinion.
In our opinion, the financial statements and financial highlights referred to above present fairly, in all material respects, the financial position of Eaton Vance Government Obligations Fund as of October 31, 2008, the results of its operations for the year then ended, and the changes in its net assets and the financial highlights for each of the two years in the period then ended, in conformity with accounting principles generally accepted in the United States of America.
DELOITTE & TOUCHE LLP
Boston, Massachusetts
December 15, 2008
14
Eaton Vance Government Obligations Fund as of October 31, 2008
FEDERAL TAX INFORMATION
The Form 1099-DIV you receive in January 2009 will show the tax status of all distributions paid to your account in calendar 2008. Shareholders are advised to consult their own tax adviser with respect to the tax consequences of their investment in the Fund.
15
Government Obligations Portfolio as of October 31, 2008
PORTFOLIO OF INVESTMENTS
| Mortgage-Backed Securities — 107.7% | |
| Mortgage Pass-Throughs — 97.8% | |
| Security | | Principal
Amount
(000's omitted) | | Value | |
| Federal Home Loan Mortgage Corp.: | |
| 5.00%, with maturity at 2014 | | $ | 2,680 | | | $ | 2,676,205 | | |
| 5.50%, with various maturities to 2017 | | | 12,659 | | | | 12,876,188 | | |
| 6.00%, with various maturities to 2026 | | | 13,721 | | | | 13,990,045 | | |
| 6.50%, with various maturities to 2030 | | | 37,409 | | | | 38,547,324 | | |
| 6.87%, with maturity at 2024 | | | 317 | | | | 330,355 | | |
| 7.00%, with various maturities to 2026 | | | 28,113 | | | | 29,214,862 | | |
| 7.09%, with maturity at 2023 | | | 1,199 | | | | 1,259,106 | | |
| 7.25%, with maturity at 2022 | | | 1,921 | | | | 2,025,171 | | |
| 7.31%, with maturity at 2027 | | | 520 | | | | 548,724 | | |
| 7.50%, with various maturities to 2029 | | | 20,848 | | | | 22,046,119 | | |
| 7.63%, with maturity at 2019 | | | 826 | | | | 882,385 | | |
| 7.75%, with maturity at 2018 | | | 45 | | | | 46,876 | | |
| 7.78%, with maturity at 2022 | | | 272 | | | | 290,846 | | |
| 7.85%, with maturity at 2020 | | | 612 | | | | 654,122 | | |
| 8.00%, with various maturities to 2028 | | | 19,795 | | | | 21,249,344 | | |
| 8.13%, with maturity at 2019 | | | 1,259 | | | | 1,362,954 | | |
| 8.15%, with maturity at 2021 | | | 429 | | | | 464,414 | | |
| 8.25%, with various maturities to 2017 | | | 148 | | | | 157,617 | | |
| 8.50%, with various maturities to 2027 | | | 9,123 | | | | 9,931,429 | | |
| 8.75%, with various maturities to 2016 | | | 24 | | | | 25,487 | | |
| 9.00%, with various maturities to 2027 | | | 13,509 | | | | 14,811,998 | | |
| 9.25%, with various maturities to 2017 | | | 278 | | | | 297,111 | | |
| 9.50%, with various maturities to 2026 | | | 3,976 | | | | 4,406,334 | | |
| 9.75%, with various maturities to 2018 | | | 14 | | | | 14,849 | | |
| 11.00%, with maturity at 2015 | | | 41 | | | | 46,545 | | |
| 13.50%, with maturity at 2010 | | | 6 | | | | 5,969 | | |
| 15.00%, with maturity at 2011 | | | 0 | (1) | | | 505 | | |
| | | $ | 178,162,884 | | |
| Federal National Mortgage Assn.: | |
| 0.25%, with maturity at 2014 | | $ | 1 | | | $ | 584 | | |
| 3.943%, with various maturities to 2026(2) | | | 4,690 | | | | 4,673,389 | | |
| 3.948%, with various maturities to 2035(2) | | | 42,868 | | | | 42,768,725 | | |
| 3.99%, with maturity at 2022(2) | | | 3,173 | | | | 3,162,022 | | |
| 4.00%, with maturities to 2035(2) | | | 3,770 | | | | 3,755,589 | | |
| 4.079%, with maturity at 2033(2) | | | 5,934 | | | | 5,912,729 | | |
| 4.133%, with maturity at 2036(2) | | | 2,977 | | | | 2,975,135 | | |
| 4.366%, with maturity at 2035(2) | | | 14,343 | | | | 14,293,890 | | |
| 4.407%, with maturity at 2036(2) | | | 1,119 | | | | 1,126,634 | | |
| 4.50%, with various maturities to 2018 | | | 79,226 | | | | 77,165,961 | | |
| 5.00%, with various maturities to 2027 | | | 8,019 | | | | 8,010,831 | | |
| 5.00%, TBA with maturity at 2024(8) | | | 75,000 | | | | 73,131,045 | | |
| 5.309%, with maturity at 2034(2) | | | 44,039 | | | | 44,478,129 | | |
| 5.50%, with various maturities to 2030 | | | 40,988 | | | | 41,475,487 | | |
| 6.00%, with various maturities to 2031 | | | 25,811 | | | | 26,182,390 | | |
| 6.482%, with maturity at 2025(3) | | | 495 | | | | 506,944 | | |
| 6.50%, with various maturities to 2029 | | | 84,104 | | | | 86,372,576 | | |
| Security | | Principal
Amount
(000's omitted) | | Value | |
| 7.00%, with various maturities to 2031 | | $ | 36,972 | | | $ | 38,528,247 | | |
| 7.25%, with various maturities to 2023 | | | 65 | | | | 67,305 | | |
| 7.50%, with various maturities to 2029 | | | 14,365 | | | | 15,167,725 | | |
| 7.861%, with maturity at 2030(3) | | | 57 | | | | 60,908 | | |
| 7.875%, with maturity at 2021 | | | 1,173 | | | | 1,260,136 | | |
| 8.00%, with various maturities to 2027 | | | 17,340 | | | | 18,582,587 | | |
| 8.25%, with various maturities to 2025 | | | 510 | | | | 554,408 | | |
| 8.33%, with maturity at 2020 | | | 1,232 | | | | 1,340,811 | | |
| 8.50%, with various maturities to 2027 | | | 6,344 | | | | 6,857,795 | | |
| 8.599%, with maturity at 2021(3) | | | 157 | | | | 169,303 | | |
| 8.75%, with various maturities to 2016 | | | 57 | | | | 57,815 | | |
| 9.00%, with various maturities to 2030 | | | 2,108 | | | | 2,302,247 | | |
| 9.125%, with maturity at 2011 | | | 29 | | | | 30,008 | | |
| 9.25%, with various maturities to 2016 | | | 23 | | | | 23,686 | | |
| 9.50%, with various maturities to 2030 | | | 4,151 | | | | 4,590,591 | | |
| 9.75%, with maturity at 2019 | | | 35 | | | | 38,695 | | |
| 9.967%, with maturity at 2021(3) | | | 111 | | | | 126,298 | | |
| 10.00%, with maturity at 2012 | | | 22 | | | | 23,103 | | |
| 10.026%, with maturity at 2025(3) | | | 91 | | | | 102,538 | | |
| 10.065%, with maturity at 2021(3) | | | 113 | | | | 130,148 | | |
| 10.213%, with maturity at 2021(3) | | | 176 | | | | 202,301 | | |
| 10.222%, with maturity at 2023(3) | | | 182 | | | | 210,129 | | |
| 10.258%, with maturity at 2020(3) | | | 145 | | | | 163,979 | | |
| 10.666%, with maturity at 2025(3) | | | 83 | | | | 94,644 | | |
| 11.00%, with maturity at 2010 | | | 3 | | | | 2,950 | | |
| 11.391%, with maturity at 2019(3) | | | 168 | | | | 190,052 | | |
| 11.50%, with maturity at 2012 | | | 38 | | | | 40,643 | | |
| 11.623%, with maturity at 2018(3) | | | 217 | | | | 246,090 | | |
| 11.732%, with maturity at 2025(3) | | | 59 | | | | 68,100 | | |
| 12.417%, with maturity at 2021(3) | | | 87 | | | | 98,837 | | |
| 12.673%, with maturity at 2015(3) | | | 184 | | | | 213,848 | | |
| 13.00%, with maturity at 2010 | | | 12 | | | | 12,021 | | |
| | | $ | 527,550,008 | | |
| Government National Mortgage Assn.: | |
| 5.125%, with various maturities to 2027(2) | | $ | 956 | | | $ | 943,191 | | |
| 6.50%, with maturity at 2024 | | | 97 | | | | 100,228 | | |
| 7.00%, with various maturities to 2025 | | | 30,480 | | | | 31,913,779 | | |
| 7.25%, with maturity at 2022 | | | 41 | | | | 42,543 | | |
| 7.50%, with various maturities to 2025 | | | 10,138 | | | | 10,760,967 | | |
| 8.00%, with various maturities to 2027 | | | 18,748 | | | | 20,224,762 | | |
| 8.25%, with maturity at 2019 | | | 218 | | | | 236,169 | | |
| 8.30%, with maturity at 2020 | | | 60 | | | | 65,538 | | |
| 8.50%, with various maturities to 2018 | | | 3,172 | | | | 3,442,857 | | |
| 9.00%, with various maturities to 2027 | | | 10,121 | | | | 11,249,492 | | |
| 9.50%, with various maturities to 2026 | | | 7,369 | | | | 8,271,606 | | |
| | | $ | 87,251,132 | | |
Total Mortgage Pass-Throughs
(identified cost $798,679,483) | | $ | 792,964,024 | | |
See notes to financial statements
16
Government Obligations Portfolio as of October 31, 2008
PORTFOLIO OF INVESTMENTS CONT'D
| Collateralized Mortgage Obligations — 9.2% | |
| Security | | Principal
Amount
(000's omitted) | | Value | |
| Federal Home Loan Mortgage Corp.: | |
| Series 30, Class I, 7.50%, 4/25/24 | | $ | 400 | | | $ | 416,758 | | |
| Series 1822, Class Z, 6.90%, 3/15/26 | | | 2,588 | | | | 2,661,603 | | |
| Series 1896, Class Z, 6.00%, 9/15/26 | | | 1,323 | | | | 1,328,049 | | |
| Series 2075, Class PH, 6.50%, 8/15/28 | | | 694 | | | | 691,911 | | |
| Series 2091, Class ZC, 6.00%, 11/15/28 | | | 3,205 | | | | 3,189,229 | | |
| Series 2102, Class Z, 6.00%, 12/15/28 | | | 811 | | | | 795,934 | | |
| Series 2115, Class K, 6.00%, 1/15/29 | | | 3,905 | | | | 3,956,819 | | |
| Series 2142, Class Z, 6.50%, 4/15/29 | | | 1,468 | | | | 1,464,278 | | |
| Series 2245, Class A, 8.00%, 8/15/27 | | | 14,667 | | | | 15,502,542 | | |
| | | $ | 30,007,123 | | |
| Federal National Mortgage Assn.: | |
| Series G-8, Class E, 9.00%, 4/25/21 | | $ | 543 | | | $ | 590,879 | | |
| Series G92-44, Class ZQ, 8.00%, 7/25/22 | | | 670 | | | | 712,598 | | |
| Series G93-36, Class ZQ, 6.50%, 12/25/23 | | | 20,928 | | | | 21,303,911 | | |
| Series 1993-16, Class Z, 7.50%, 2/25/23 | | | 777 | | | | 816,067 | | |
| Series 1993-39, Class Z, 7.50%, 4/25/23 | | | 1,916 | | | | 2,010,479 | | |
| Series 1993-149, Class M, 7.00%, 8/25/23 | | | 986 | | | | 1,019,892 | | |
| Series 1993-250, Class Z, 7.00%, 12/25/23 | | | 560 | | | | 579,749 | | |
| Series 1994-42, Class K, 6.50%, 4/25/24 | | | 8,701 | | | | 8,834,730 | | |
| Series 1994-82, Class Z, 8.00%, 5/25/24 | | | 3,258 | | | | 3,494,853 | | |
| Series 1997-81, Class PD, 6.35%, 12/18/27 | | | 1,188 | | | | 1,189,782 | | |
| Series 2000-49, Class A, 8.00%, 3/18/27 | | | 1,639 | | | | 1,746,481 | | |
| Series 2002-1, Class G, 7.00%, 7/25/23 | | | 1,295 | | | | 1,335,630 | | |
| | | $ | 43,635,051 | | |
| Government National Mortgage Assn., | |
| Series 1998-19, Class ZB, 6.50%, 7/20/28 | | $ | 1,002 | | | $ | 1,007,269 | | |
Total Collateralized Mortgage Obligations
(identified cost $75,438,466) | | $ | 74,649,443 | | |
Commercial Mortgage-Backed
Securities — 0.7% | |
| Security | | Principal
Amount
(000's omitted) | | Value | |
GS Mortgage Securities Corp. II,
Series 2001-Rock, Class A2FL,
4.36%, with maturity at 2018(4)(5) | | $ | 5,500 | | | $ | 5,424,466 | | |
| | | $ | 5,424,466 | | |
Total Commercial Mortgage-Backed Securities
(identified cost $5,522,500) | | $ | 5,424,466 | | |
Total Mortgage-Backed Securities
(identified cost $879,640,449) | | $ | 873,037,933 | | |
| U.S. Treasury Obligations — 0.9% | |
| Security | | Principal
Amount
(000's omitted) | | Value | |
| U.S. Treasury Bond, 7.125%, 2/15/23(6) | | $ | 6,000 | | | $ | 7,387,974 | | |
Total U.S. Treasury Obligations
(identified cost $6,234,643) | | $ | 7,387,974 | | |
| Short-Term Investments — 0.2% | |
| Description | | Interest
(000's omitted) | | Value | |
| Cash Management Portfolio, 1.90%(7) | | $ | 1,251 | | | $ | 1,250,777 | | |
Total Short-Term Investments
(identified cost $1,250,777) | | $ | 1,250,777 | | |
Total Investments — 108.8%
(identified cost $887,125,869) | | $ | 881,676,684 | | |
| Other Assets, Less Liabilities — (8.8)% | | $ | (71,049,421 | ) | |
| Net Assets — 100.0% | | | | $ | 810,627,263 | | |
(1) Less than $1,000.
(2) Adjustable rate mortgage.
(3) Weighted average fixed-rate coupon that changes/updates monthly.
(4) Security exempt from registration under Rule 144A of the Securities Act of 1933. These securities may be sold in transactions exempt from registration, normally to qualified institutional buyers. At October 31, 2008, the aggregate value of the securities is $5,424,466 or 0.7% of the Portfolio's net assets.
(5) Variable rate security. The stated interest rate represents the rate in effect at October 31, 2008.
(6) Security (or a portion thereof) has been segregated to cover margin requirements on open financial futures contracts.
(7) Affiliated investment company available to Eaton Vance portfolios and funds which invests in high quality, U.S. dollar denominated money market instruments. The rate shown is the annualized seven-day yield as of October 31, 2008.
(8) TBA (To Be Announced) securities are purchased on a forward commitment basis with an approximate principal amount and no definite maturity date. The actual principal amount and maturity date will be determined upon settlement when the specific mortgage pools are assigned.
See notes to financial statements
17
Government Obligations Portfolio as of October 31, 2008
FINANCIAL STATEMENTS
Statement of Assets and Liabilities
As of October 31, 2008
| Assets | |
| Unaffiliated investments, at value (identified cost, $885,875,092) | | $ | 880,425,907 | | |
| Affiliated investment, at value (identified cost, $1,250,777) | | | 1,250,777 | | |
| Receivable for investments sold | | | 175,743 | | |
| Interest receivable | | | 4,443,790 | | |
| Interest receivable from affiliated investment | | | 491 | | |
| Total assets | | $ | 886,296,708 | | |
| Liabilities | |
| Payable for when-issued securities | | $ | 74,527,604 | | |
| Payable to affiliate for investment adviser fee | | | 489,493 | | |
| Payable for daily variation margin on open financial futures contracts | | | 462,507 | | |
| Payable to affiliate for Trustees' fees | | | 1,850 | | |
| Accrued expenses | | | 187,991 | | |
| Total liabilities | | $ | 75,669,445 | | |
| Net Assets applicable to investors' interest in Portfolio | | $ | 810,627,263 | | |
| Sources of Net Assets | |
| Net proceeds from capital contributions and withdrawals | | $ | 818,405,943 | | |
| Net unrealized depreciation (computed on the basis of identified cost) | | | (7,778,680 | ) | |
| Total | | $ | 810,627,263 | | |
Statement of Operations
For the Year Ended
October 31, 2008
| Investment Income | |
| Interest | | $ | 39,370,277 | | |
| Securities lending income, net | | | 395,383 | | |
| Interest income allocated from affiliated investment | | | 558,308 | | |
| Expenses allocated from affiliated investment | | | (70,928 | ) | |
| Total investment income | | $ | 40,253,040 | | |
| Expenses | |
| Investment adviser fee | | $ | 5,492,431 | | |
| Trustees' fees and expenses | | | 22,104 | | |
| Custodian fee | | | 297,990 | | |
| Legal and accounting services | | | 82,083 | | |
| Interest expense | | | 121,639 | | |
| Miscellaneous | | | 17,998 | | |
| Total expenses | | $ | 6,034,245 | | |
Deduct —
Reduction of custodian fee | | $ | 19 | | |
| Total expense reductions | | $ | 19 | | |
| Net expenses | | $ | 6,034,226 | | |
| Net investment income | | $ | 34,218,814 | | |
| Realized and Unrealized Gain (Loss) | |
Net realized gain (loss) —
Financial futures contracts | | $ | 8,945,747 | | |
| Net realized gain | | $ | 8,945,747 | | |
Change in unrealized appreciation (depreciation) —
Investments (identified cost basis) | | $ | (7,108,756 | ) | |
| Financial futures contracts | | | (3,259,928 | ) | |
| Net change in unrealized appreciation (depreciation) | | $ | (10,368,684 | ) | |
| Net realized and unrealized loss | | $ | (1,422,937 | ) | |
| Net increase in net assets from operations | | $ | 32,795,877 | | |
See notes to financial statements
18
Government Obligations Portfolio as of October 31, 2008
FINANCIAL STATEMENTS CONT'D
Statements of Changes in Net Assets
Increase (Decrease)
in Net Assets | | Year Ended
October 31, 2008 | | Year Ended
October 31, 2007 | |
From operations —
Net investment income | | $ | 34,218,814 | | | $ | 32,087,648 | | |
Net realized gain from investment
transactions and financial
futures contracts | | | 8,945,747 | | | | 780,030 | | |
Net change in unrealized
appreciation (depreciation) from
investments and
financial futures contracts | | | (10,368,684 | ) | | | 3,844,239 | | |
| Net increase in net assets from operations | | $ | 32,795,877 | | | $ | 36,711,917 | | |
Capital transactions —
Contributions | | $ | 388,827,835 | | | $ | 136,530,716 | | |
| Withdrawals | | | (298,743,400 | ) | | | (213,299,802 | ) | |
Net increase (decrease) in net assets from
capital transactions | | $ | 90,084,435 | | | $ | (76,769,086 | ) | |
| Net increase (decrease) in net assets | | $ | 122,880,312 | | | $ | (40,057,169 | ) | |
| Net Assets | |
| At beginning of year | | $ | 687,746,951 | | | $ | 727,804,120 | | |
| At end of year | | $ | 810,627,263 | | | $ | 687,746,951 | | |
See notes to financial statements
19
Government Obligations Portfolio as of October 31, 2008
FINANCIAL STATEMENTS CONT'D
Supplementary Data
| | | Year Ended October 31, | | Period Ended | | Year Ended | |
| | | 2008 | | 2007 | | 2006 | | 2005 | | October 31, 2004(1) | | December 31,2003 | |
| Ratios/Supplemental Data | |
| Ratios (As a percentage of average daily net assets): | |
| Expenses before custodian fee reduction(2) | | | 0.80 | % | | | 0.80 | % | | | 0.79 | % | | | 0.77 | % | | | 0.75 | %(3) | | | 0.70 | % | |
| Net investment income | | | 4.48 | % | | | 4.60 | % | | | 4.09 | % | | | 3.21 | % | | | 3.63 | %(3) | | | 2.26 | % | |
| Portfolio Turnover | | | 19 | % | | | 23 | % | | | 2 | % | | | 30 | % | | | 5 | % | | | 67 | % | |
| Total Return | | | 4.85 | % | | | 5.49 | % | | | 4.71 | % | | | 2.46 | % | | | 2.23 | %(4) | | | 0.01 | % | |
| Net assets, end of period (000's omitted) | | $ | 810,627 | | | $ | 687,747 | | | $ | 727,804 | | | $ | 866,273 | | | $ | 1,060,801 | | | $ | 1,521,288 | | |
(1) For the ten-month period ended October 31, 2004.
(2) Excludes the effect of custody fee credits, if any, of less than 0.005%.
(3) Annualized.
(4) Not annualized.
See notes to financial statements
20
Government Obligations Portfolio as of October 31, 2008
NOTES TO FINANCIAL STATEMENTS
1 Significant Accounting Policies
Government Obligations Portfolio (the Portfolio) is a New York trust registered under the Investment Company Act of 1940, as amended (the 1940 Act), as a diversified, open-end management investment company. The Portfolio's investment objective is to provide a high current return by investing primarily in mortgage-backed securities (MBS) issued, backed or otherwise guaranteed by the U.S. Government or its agencies or instrumentalities. The Declaration of Trust permits the Trustees to issue interests in the Portfolio. At October 31, 2008, the Eaton Vance Government Obligations Fund, Eaton Vance Diversified Income Fund and Eaton Vance Low Duration Fund held an interest of 84.2%, 11.4% and 1.8%, respectively, in the Portfolio.
The following is a summary of significant accounting policies of the Portfolio. The policies are in conformity with accounting principles generally accepted in the United States of America.
A Investment Valuation — Debt obligations, including listed securities and securities for which quotations are available, will normally be valued on the basis of market quotations provided by independent pricing services. The pricing services consider various factors relating to bonds and/or market transactions to determine market value. Most seasoned, fixed rate 30-year mortgage-backed securities are valued through the use of the investment adviser's matrix pricing system, which takes into account bond prices, yield differentials, anticipated prepayments and interest rates provided by dealers. Short-term debt securities with a remaining maturity of sixty days or less are valued at amortized cost, which approximates market value. If short-term debt securities are acquired with a remaining maturity of more than sixty days, they will be valued by a pricing service. Financial futures contracts listed on commodity exchanges are valued based on the closing price on the primary exchange on which such contracts trade. Investments for which valuations or market quotations are not readily available are valued at fair value using methods determined in good faith by or at the direction of the Trustees of the Portfolio considering relevant factors, data and information including the market value of freely tradable securities of the same class in the principal market on which such securities are normally traded.
The Portfolio may invest in Cash Management Portfolio (Cash Management), an affiliated investment company managed by Boston Management and Research (BMR), a subsidiary of Eaton Vance Management (EVM). Cash Management values its investment securities utilizing the amortized cost valuation technique permitted by Rule 2a-7 of the 1940 Act, pursuant to which Cash Management must comply with certain conditions. This technique involves initially valuing a portfolio security at its cost and thereafter assuming a constant amortization to maturity of any discount or premium. If amortized cost is determined not to approximate fair value, Cash Management may value its investment securities based on available market quotations provided by a pricing service.
B Investment Transactions — Investment transactions for financial statement purposes are accounted for on a trade date basis. Realized gains and losses on investments sold are determined on the basis of identified cost.
C Income — Interest income is recorded on the basis of interest accrued, adjusted for amortization of premium or accretion of discount.
D Federal Taxes — The Portfolio has elected to be treated as a partnership for federal tax purposes. No provision is made by the Portfolio for federal or state taxes on any taxable income of the Portfolio because each investor in the Portfolio is ultimately responsible for the payment of any taxes on its share of taxable income. Since at least one of the Portfolio's investors is a regulated investment company that invests all or substantially all of its assets in the Portfolio, the Portfolio normally must satisfy the applicable source of income and diversification requirements (under the Internal Revenue Code) in order for its investors to satisfy them. The Portfolio will allocate, at least annually a mong its investors, each investor's distributive share of the Portfolio's net investment income, net realized capital gains and any other items of income, gain, loss, deduction or credit.
As of October 31, 2008, the Portfolio had no uncertain tax positions that would require financial statement recognition, de-recognition, or disclosure. Each of the Portfolio's federal tax returns filed in the 3-year period ended October 31, 2008 remains subject to examination by the Internal Revenue Service.
E Expense Reduction — State Street Bank and Trust Company (SSBT) serves as custodian of the Portfolio. Pursuant to the custodian agreement, SSBT receives a fee reduced by credits, which are determined based on the average daily cash balance the Portfolio maintains with SSBT. All credit balances, if any, used to reduce the Portfolio's custodian fees are reported as a reduction of expenses in the Statement of Operations.
21
Government Obligations Portfolio as of October 31, 2008
NOTES TO FINANCIAL STATEMENTS CONT'D
F Use of Estimates — The preparation of the financial statements in conformity with accounting principles generally accepted in the United States of America requires management to make estimates and assumptions that affect the reported amounts of assets and liabilities at the date of the financial statements and the reported amounts of income and expense during the reporting period. Actual results could differ from those estimates.
G Indemnifications — Under the Portfolio's organizational documents, its officers and Trustees may be indemnified against certain liabilities and expenses arising out of the performance of their duties to the Portfolio. Interestholders in the Portfolio are jointly and severally liable for the liabilities and obligations of the Portfolio in the event that the Portfolio fails to satisfy such liabilities and obligations; provided, however, that, to the extent assets are available in the Portfolio, the Portfolio may, under certain circumstances, indemnify interestholders from and against any claim or liability to which such holder may become subject by reason of being or having been an interestholder in the Portfolio. Additionally, in the normal course of business, the Portfo lio enters into agreements with service providers that may contain indemnification clauses. The Portfolio's maximum exposure under these arrangements is unknown as this would involve future claims that may be made against the Portfolio that have not yet occurred.
H Financial Futures Contracts — The Portfolio may enter into financial futures contracts. The Portfolio's investment in financial futures contracts is designed for hedging against changes in interest rates or as a substitute for the purchase of securities. Upon entering into a financial futures contract, the Portfolio is required to deposit with the broker, either in cash or securities an amount equal to a certain percentage of the purchase price (initial margin). Subsequent payments, known as variation margin, are made or received by the Portfolio each business day, depending on the daily fluctuations in the value of the underlying security, and are recorded as unrealized gains or losses by the Portfolio. Gains (losses) are realized upon the expiration or closing of the financial futures contracts. Should market conditions change unexpectedly, the Portfolio may not achieve the anticipated benefits of the financial futures contracts and may realize a loss. In entering such contracts, the Portfolio bears the risk if the counterparties do not perform under the contracts' terms.
I When-Issued Securities and Delayed Delivery Transactions — The Portfolio may purchase or sell securities on a delayed delivery or when-issued basis, including TBA (To Be Announced) securities. Payment and delivery may take place after the customary settlement period for that security. At the time the transaction is negotiated, the price of the security that will be delivered is fixed. The Portfolio maintains security positions for these commitments such that sufficient liquid assets will be available to make payments upon settlement. Securities purchased on a delayed delivery or when-issued basis are marked-to-market daily and begin earning interest on settlement date. Losses may arise due to change s in the market value of the underlying securities or if the counterparty does not perform under the contract.
2 Investment Adviser Fee and Other Transactions with Affiliates
The investment adviser fee is earned by BMR as compensation for investment advisory services rendered to the Portfolio. Pursuant to the investment advisory agreement and subsequent fee reduction agreement between the Portfolio and BMR, the fee is computed at an annual rate of 0.75% of the Portfolio's average daily net assets up to $500 million, 0.6875% from $500 million up to $1 billion, 0.6250% from $1 billion up to $1.5 billion, 0.5625% from $1.5 billion up to $2 billion, 0.5000% from $2 billion up to $2.5 billion and 0.4375% annually of average daily net assets of $2.5 billion or more, and is payable monthly. The fee reduction cannot be terminated without the consent of the Trustees and shareholders. The portion of the adviser fee payable by Cash Management on the Portfolio's investment of cash therein is credited against the Portfolio's adviser fee. For the year ended October 31, 2008, the Portfolio's adviser fee totaled $5, 558,448 of which $66,017 was allocated from Cash Management and $5,492,431 was paid or accrued directly by the Portfolio. For the year ended October 31, 2008, the Portfolio's adviser fee, including the portion allocated from Cash Management, was 0.73% of the Portfolio's average daily net assets.
Except for Trustees of the Portfolio who are not members of EVM's or BMR's organizations, officers and Trustees receive remuneration for their services to the Portfolio out of the investment adviser fee. Trustees of the Portfolio who are not affiliated with the investment adviser may elect to defer receipt of all or a percentage of their annual fees in accordance with the terms of the Trustees Deferred Compensation Plan. For the year ended October 31, 2008, no significant amounts have been deferred. Certain officers and Trustees of the Portfolio are officers of the above organizations.
3 Purchases and Sales of Investments
Purchases and sales of U.S. Government and agency obligations, other than short-term obligations and including maturities and paydowns, aggregated $353,177,160 and $147,272,202, respectively, for the year ended October 31, 2008.
22
Government Obligations Portfolio as of October 31, 2008
NOTES TO FINANCIAL STATEMENTS CONT'D
4 Federal Income Tax Basis of Investments
The cost and unrealized appreciation (depreciation) of investments of the Portfolio at October 31, 2008, as determined on a federal income tax basis, were as follows:
| Aggregate cost | | $ | 896,023,603 | | |
| Gross unrealized appreciation | | $ | 2,156,705 | | |
| Gross unrealized depreciation | | | (16,503,624 | ) | |
| Net unrealized depreciation | | $ | (14,346,919 | ) | |
5 Financial Instruments
The Portfolio may trade in financial instruments with off-balance sheet risk in the normal course of its investing activities. These financial instruments may include financial futures contracts, and may involve, to a varying degree, elements of risk in excess of the amounts recognized for financial statement purposes. The notional or contractual amounts of these instruments represent the investment the Portfolio has in particular classes of financial instruments and does not necessarily represent the amounts potentially subject to risk. The measurement of the risks associated with these instruments is meaningful only when all related and offsetting transactions are considered.
A summary of obligations under these financial instruments at October 31, 2008 is as follows:
Futures Contracts
Expiration
Date | | Contracts | | Position | | Aggregate
Cost | | Value | | Net Unrealized
Depreciation | |
| | 12/08 | | | 925
10 Year
U.S. Treasury Note | | Long | | $ | 106,926,761 | | | $ | 104,597,266 | | | $ | (2,329,495 | ) | |
At October 31, 2008, the Portfolio had sufficient cash and/or securities to cover commitments under these contracts.
6 Line of Credit
The Portfolio participates with other portfolios and funds managed by EVM and its affiliates in a $450 million unsecured line of credit agreement with a group of banks. Borrowings are made by the Portfolio solely to facilitate the handling of unusual and/or unanticipated short-term cash requirements. Interest is charged to the Portfolio based on its borrowings at an amount above either the Eurodollar rate or Federal Funds rate. In addition, a fee computed at an annual rate of 0.10% on the daily unused portion of the line of credit is allocated among the participating portfolios and funds at the end of each quarter. At October 31, 2008, the Portfolio did not have a balance outstanding pursuant to this line of credit. Average borrowings and the average interest rate for the year ended October 31, 2008 were $4,972,951 and 2.45%, respectively.
7 Securities Lending Agreement
The Portfolio has established a securities lending agreement in which the Portfolio lends portfolio securities to a broker in exchange for collateral consisting of either cash or U.S. government securities in an amount at least equal to the market value of the securities on loan. Under the agreement, the Portfolio continues to earn interest on the securities loaned. Collateral received is generally cash, and the Portfolio invests the cash and receives any interest on the amount invested but it must pay the broker a loan rebate fee computed as a varying percentage of the collateral received. The loan rebate fee paid by the Portfolio offsets a portion of the interest income received and amounted to $386,784 for the year ended October 31, 2008. At October 31, 2008, the Portfolio did not have any securities on loan. In the event of counterparty default, the Fund is subject to potential loss if it is delayed or prevented from exercis ing its right to dispose of the collateral. The Portfolio bears risk in the event that invested collateral is not sufficient to meet obligations due on loans. The Portfolio has the right under the lending agreement to recover the securities from the borrower on demand.
8 Recently Issued Accounting Pronouncements
In September 2006, the Financial Accounting Standards Board (FASB) issued Statement of Financial Accounting Standards No. 157 (FAS 157), "Fair Value Measurements". FAS 157 defines fair value, establishes a framework for measuring fair value in accordance with accounting principles generally accepted in the United States of America and expands disclosure about fair value measurements. FAS 157 is effective for fiscal years beginning after November 15, 2007. As of October 31, 2008, management does not believe the adoption of FAS 157 will impact the amounts reported in the financial statements; however, additional disclosures may be required about the inputs used to develop the measurements of fair value and the effect of certain of the measurements on changes in net assets for the period.
In March 2008, the FASB issued Statement of Financial Accounting Standards No. 161 (FAS 161), "Disclosures about Derivative Instruments and Hedging Activities". FAS 161 requires enhanced disclosures about an entity's derivative and hedging activities, including qualitative disclosures about the objectives and strategies for using derivatives, quantitative disclosures about fair value amounts of and gains and losses on derivative instruments, and disclosures about credit-risk related contingent features in derivative instruments. FAS 161 is effective for fiscal years and interim periods beginning after November 15, 2008. Management is currently evaluating the impact the adoption of FAS 161 will have on the Portfolio's financial statement disclosures.
23
Government Obligations Portfolio as of October 31, 2008
REPORT OF INDEPENDENT REGISTERED PUBLIC ACCOUNTING FIRM
To the Trustees and Investors of Government Obligations Portfolio:
We have audited the accompanying statement of assets and liabilities of Government Obligations Portfolio (the "Portfolio"), including the portfolio of investments, as of October 31, 2008, the related statement of operations for the year then ended, and the statements of changes in net assets and the supplementary data for each of the two years in the period then ended. These financial statements and supplementary data are the responsibility of the Portfolio's management. Our responsibility is to express an opinion on these financial statements and supplementary data based on our audits. The supplementary data for the year ended October 31, 2006, and all prior periods presented were audited by other auditors. Those auditors expressed an unqualified opinion on those supplementary data in their report dated December 27, 2006.
We conducted our audits in accordance with the standards of the Public Company Accounting Oversight Board (United States). Those standards require that we plan and perform the audit to obtain reasonable assurance about whether the financial statements and supplementary data are free of material misstatement. The Portfolio is not required to have, nor were we engaged to perform, an audit of its internal control over financial reporting. Our audits included consideration of internal control over financial reporting as a basis for designing audit procedures that are appropriate in the circumstances, but not for the purpose of expressing an opinion on the effectiveness of the Portfolio's internal control over financial reporting. Accordingly, we express no such opinion. An audit also includes examining, on a test basis, evidence supporting the amounts and disclosures in the financial statements, assessing the accounting principles u sed and significant estimates made by management, as well as evaluating the overall financial statement presentation. Our procedures included confirmation of securities owned as of October 31, 2008, by correspondence with the custodian and brokers; where replies were not received from brokers, we performed other auditing procedures. We believe that our audits provide a reasonable basis for our opinion.
In our opinion, the financial statements and supplementary data referred to above present fairly, in all material respects, the financial position of Government Obligations Portfolio as of October 31, 2008, the results of its operations for the year then ended, and the changes in its net assets and the supplementary data for each of the two years in the period then ended, in conformity with accounting principles generally accepted in the United States of America.
DELOITTE & TOUCHE LLP
Boston, Massachusetts
December 15, 2008
24
Eaton Vance Government Obligations Fund
Government Obligations Portfolio
SPECIAL MEETING OF SHAREHOLDERS (Unaudited)
Eaton Vance Government Obligations Fund
The Fund held a Special Meeting of Shareholders on November 14, 2008 to elect Trustees. The results of the vote were as follows:
| | | Number of Shares | |
| Nominee for Trustee | | For | | Withheld | |
| Benjamin C. Esty | | | 68,235,364 | | | | 721,167 | | |
| Thomas E. Faust Jr. | | | 68,233,155 | | | | 723,376 | | |
| Allen R. Freedman | | | 68,218,890 | | | | 737,640 | | |
| William H. Park | | | 68,240,269 | | | | 716,261 | | |
| Ronald A. Pearlman | | | 68,203,372 | | | | 753,159 | | |
| Helen Frame Peters | | | 68,213,217 | | | | 743,313 | | |
| Heidi L. Steiger | | | 68,214,273 | | | | 742,258 | | |
| Lynn A. Stout | | | 68,240,589 | | | | 715,942 | | |
| Ralph F. Verni | | | 68,229,376 | | | | 727,154 | | |
Each nominee was also elected a Trustee of Government Obligations Portfolio.
Government Obligations Portfolio
The Portfolio held a Special Meeting of Interestholders on November 14, 2008 to elect Trustees. The results of the vote were as follows:
| | | Interest in the Portfolio | |
| Nominee for Trustee | | For | | Withheld | |
| Benjamin C. Esty | | | 96 | % | | | 1 | % | |
| Thomas E. Faust Jr. | | | 96 | % | | | 1 | % | |
| Allen R. Freedman | | | 96 | % | | | 1 | % | |
| William H. Park | | | 96 | % | | | 1 | % | |
| Ronald A. Pearlman | | | 96 | % | | | 1 | % | |
| Helen Frame Peters | | | 96 | % | | | 1 | % | |
| Heidi L. Steiger | | | 96 | % | | | 1 | % | |
| Lynn A. Stout | | | 96 | % | | | 1 | % | |
| Ralph F. Verni | | | 96 | % | | | 1 | % | |
Results are rounded to the nearest whole number.
25
Eaton Vance Government Obligations Fund
BOARD OF TRUSTEES' ANNUAL APPROVAL OF THE INVESTMENT ADVISORY AGREEMENT
Overview of the Contract Review Process
The Investment Company Act of 1940, as amended (the "1940 Act"), provides, in substance, that each investment advisory agreement between a fund and its investment adviser will continue in effect from year to year only if its continuance is approved at least annually by the fund's board of trustees, including by a vote of a majority of the trustees who are not "interested persons" of the fund ("Independent Trustees"), cast in person at a meeting called for the purpose of considering such approval.
At a meeting of the Boards of Trustees (each a "Board") of the Eaton Vance group of mutual funds (the "Eaton Vance Funds") held on April 21, 2008, the Board, including a majority of the Independent Trustees, voted to approve continuation of existing advisory and sub-advisory agreements for the Eaton Vance Funds for an additional one-year period. In voting its approval, the Board relied upon the affirmative recommendation of the Contract Review Committee of the Board (formerly the Special Committee), which is a committee comprised exclusively of Independent Trustees. Prior to making its recommendation, the Contract Review Committee reviewed information furnished for a series of meetings of the Contract Review Committee held in February, March and April 2008. Such information included, among other things, the following:
Information about Fees, Performance and Expenses
• An independent report comparing the advisory and related fees paid by each fund with fees paid by comparable funds;
• An independent report comparing each fund's total expense ratio and its components to comparable funds;
• An independent report comparing the investment performance of each fund to the investment performance of comparable funds over various time periods;
• Data regarding investment performance in comparison to relevant peer groups of funds and appropriate indices;
• Comparative information concerning fees charged by each adviser for managing other mutual funds and institutional accounts using investment strategies and techniques similar to those used in managing the fund;
• Profitability analyses for each adviser with respect to each fund;
Information about Portfolio Management
• Descriptions of the investment management services provided to each fund, including the investment strategies and processes employed, and any changes in portfolio management processes and personnel;
• Information concerning the allocation of brokerage and the benefits received by each adviser as a result of brokerage allocation, including information concerning the acquisition of research through "soft dollar" benefits received in connection with the funds' brokerage, and the implementation of a soft dollar reimbursement program established with respect to the funds;
• Data relating to portfolio turnover rates of each fund;
• The procedures and processes used to determine the fair value of fund assets and actions taken to monitor and test the effectiveness of such procedures and processes;
Information about each Adviser
• Reports detailing the financial results and condition of each adviser;
• Descriptions of the qualifications, education and experience of the individual investment professionals whose responsibilities include portfolio management and investment research for the funds, and information relating to their compensation and responsibilities with respect to managing other mutual funds and investment accounts;
• Copies of the Codes of Ethics of each adviser and its affiliates, together with information relating to compliance with and the administration of such codes;
• Copies of or descriptions of each adviser's proxy voting policies and procedures;
• Information concerning the resources devoted to compliance efforts undertaken by each adviser and its affiliates on behalf of the funds (including descriptions of various compliance programs) and their record of compliance with investment policies and restrictions, including policies with respect to market-timing, late trading and selective portfolio disclosure, and with policies on personal securities transactions;
• Descriptions of the business continuity and disaster recovery plans of each adviser and its affiliates;
Other Relevant Information
• Information concerning the nature, cost and character of the administrative and other non-investment management services provided by Eaton Vance Management and its affiliates;
• Information concerning management of the relationship with the custodian, subcustodians and fund accountants by each adviser or the funds' administrator; and
• The terms of each advisory agreement.
26
Eaton Vance Government Obligations Fund
BOARD OF TRUSTEES' ANNUAL APPROVAL OF THE INVESTMENT ADVISORY AGREEMENT CONT'D
In addition to the information identified above, the Contract Review Committee considered information provided from time to time by each adviser throughout the year at meetings of the Board and its committees. Over the course of the twelve-month period ended April 30, 2008, the Board met eleven times and the Contract Review Committee, the Audit Committee and the Governance Committee, each of which is a Committee comprised solely of Independent Trustees, met twelve, seven and five times, respectively. At such meetings, the Trustees received, among other things, presentations by the portfolio managers and other investment professionals of each adviser relating to the investment performance of each fund and the investment strategies used in pursuing the fund's investment objective. The Portfolio Management Committee and the Compliance Reports and Regulatory Matters Committee are newly established and did not meet during the twelve- month period ended April 30, 2008.
For funds that invest through one or more underlying portfolios, the Board considered similar information about the portfolio(s) when considering the approval of advisory agreements. In addition, in cases where the fund's investment adviser has engaged a sub-adviser, the Board considered similar information about the sub-adviser when considering the approval of any sub-advisory agreement.
The Contract Review Committee was assisted throughout the contract review process by Goodwin Procter LLP, legal counsel for the Independent Trustees. The members of the Contract Review Committee relied upon the advice of such counsel and their own business judgment in determining the material factors to be considered in evaluating each advisory and sub-advisory agreement and the weight to be given to each such factor. The conclusions reached with respect to each advisory and sub-advisory agreement were based on a comprehensive evaluation of all the information provided and not any single factor. Moreover, each member of the Contract Review Committee may have placed varying emphasis on particular factors in reaching conclusions with respect to each advisory and sub-advisory agreement.
Results of the Process
Based on its consideration of the foregoing, and such other information as it deemed relevant, including the factors and conclusions described below, the Contract Review Committee concluded that the continuance of the investment advisory agreement of the Government Obligations Portfolio (the "Portfolio"), the portfolio in which the Eaton Vance Government Obligations Fund (the "Fund") invests, with Boston Management and Research (the "Adviser"), including the fee structure, is in the interests of shareholders and, therefore, the Contract Review Committee recommended to the Board approval of the agreement. The Board accepted the recommendation of the Contract Review Committee as well as the factors considered and conclusions reached by the Contract Review Committee with respect to the agreement. Accordingly, the Board, including a majority of the Independent Trustees, voted to approve continuation of the investment advisory agreem ent for the Portfolio.
Nature, Extent and Quality of Services
In considering whether to approve the investment advisory agreement of the Portfolio, the Board evaluated the nature, extent and quality of services provided to the Portfolio by the Adviser.
The Board considered the Adviser's management capabilities and investment process with respect to the types of investments held by the Portfolio, including the education, experience and number of its investment professionals and other personnel who provide portfolio management, investment research, and similar services to the Portfolio. The Board specifically noted the Adviser's experience in investing in mortgage-backed securities, including seasoned mortgage-backed securities. The Board also took into account the resources dedicated to portfolio management and other services, including the compensation paid to recruit and retain investment personnel, and the time and attention devoted to the Portfolio by senior management.
The Board reviewed the compliance programs of the Adviser and relevant affiliates thereof. Among other matters, the Board considered compliance and reporting matters relating to personal trading by investment personnel, selective disclosure of portfolio holdings, late trading, frequent trading, portfolio valuation, business continuity and the allocation of investment opportunities. The Board also evaluated the responses of the Adviser and its affiliates to requests from regulatory authorities such as the Securities and Exchange Commission.
The Board also considered shareholder and other administrative services provided or managed by Eaton Vance Management and its affiliates, including transfer agency and accounting services. The Board evaluated the benefits to shareholders of investing in a fund that is a part of a large family of funds, including the ability, in many cases, to exchange an investment among different funds without incurring additional sales charges.
After consideration of the foregoing factors, among others, the Board concluded that the nature, extent and quality of services provided by the Adviser, taken as a whole, are appropriate and consistent with the terms of the investment advisory agreement.
27
Eaton Vance Government Obligations Fund
BOARD OF TRUSTEES' ANNUAL APPROVAL OF THE INVESTMENT ADVISORY AGREEMENT CONT'D
Fund Performance
The Board compared the Fund's investment performance to a relevant universe of similarly managed funds identified by an independent data provider and appropriate benchmark indices. The Board reviewed comparative performance data for the one-, three-, five- and ten-year periods ended September 30, 2007 for the Fund. The Board concluded that the Fund's performance was satisfactory.
Management Fees and Expenses
The Board reviewed contractual investment advisory fee rates, including any administrative fee rates, payable by the Portfolio and the Fund (referred to as "management fees"). As part of its review, the Board considered the management fees and the Fund's total expense ratio for the year ended September 30, 2007, as compared to a group of similarly managed funds selected by an independent data provider.
After reviewing the foregoing information, and in light of the nature, extent and quality of the services provided by the Adviser, the Board concluded that the management fees charged for advisory and related services and the Fund's total expense ratio are reasonable.
Profitability
The Board reviewed the level of profits realized by the Adviser and relevant affiliates thereof in providing investment advisory and administrative services to the Fund, the Portfolio and to all Eaton Vance Funds as a group. The Board considered the level of profits realized without regard to revenue sharing or other payments by the Adviser and its affiliates to third parties in respect of distribution services. The Board also considered other direct or indirect benefits received by the Adviser and its affiliates in connection with its relationship with the Fund.
The Board concluded that, in light of the foregoing factors and the nature, extent and quality of the services rendered, the profits realized by the Adviser and its affiliates are reasonable.
Economies of Scale
In reviewing management fees and profitability, the Board also considered the extent to which the Adviser and its affiliates, on the one hand, and the Fund, on the other hand, can expect to realize benefits from economies of scale as the assets of the Portfolio increase. The Board acknowledged the difficulty in accurately measuring the benefits resulting from the economies of scale with respect to the management of any specific fund or group of funds. The Board reviewed data summarizing the increases and decreases in the assets of the Fund and of all Eaton Vance Funds as a group over various time periods, and evaluated the extent to which the total expense ratio of the Fund and the profitability of the Adviser and its affiliates may have been affected by such increases or decreases. Based upon the foregoing, the Board concluded that the benefits from economies of scale are currently being shared equitably by the Adviser and its affiliates and the Fund. The Board also concluded that, assuming reasonably foreseeable increases in the assets of the Portfolio, the structure of the advisory fee, which includes breakpoints at several asset levels, can be expected to cause the Adviser and its affiliates and the Fund to continue to share such benefits equitably.
28
Eaton Vance Government Obligations Fund
MANAGEMENT AND ORGANIZATION
Fund Management. The Trustees of Eaton Vance Mutual Funds Trust (the Trust) and Government Obligations Portfolio (the Portfolio) are responsible for the overall management and supervision of the Trust's and Portfolio's affairs. The Trustees and officers of the Trust and the Portfolio are listed below. Except as indicated, each individual has held the office shown or other offices in the same company for the last five years. Trustees and officers of the Trust and the Portfolio hold indefinite terms of office. The "noninterested Trustees" consist of those Trustees who are not "interested persons" of the Trust and the Portfolio, as that term is defined under the 1940 Act. The business address of each Trustee and officer is The Eaton Vance Building, 255 State Street, Boston, Massachusetts 02109. As used below, "EVC" refers to Eaton Vance Corp., "EV" refers to Ea ton Vance, Inc., "EVM" refers to Eaton Vance Management, "BMR" refers to Boston Management and Research, "Parametric" refers to Parametric Portfolio Associates and "EVD" refers to Eaton Vance Distributors, Inc. EVC and EV are the corporate parent and trustee, respectively, of EVM and BMR. EVD is the Fund's principal underwriter, the Portfolio's placement agent and a wholly-owned subsidiary of EVC. Each officer affiliated with Eaton Vance may hold a position with other Eaton Vance affiliates that is comparable to his or her position with EVM listed below.
Name and
Date of Birth | | Position(s)
with the
Trust and
the Portfolio | | Term of
Office and
Length of
Service | | Principal Occupation(s)
During Past Five Years | | Number of Portfolios
in Fund Complex
Overseen By
Trustee(1) | | Other Directorships Held | |
| Interested Trustee | | | | | | | | | | | | | |
|
Thomas E. Faust Jr.
5/31/58 | | Trustee and President of the Trust | | Trustee since 2007 and President of the Trust since 2002 | | Chairman, Chief Executive Officer and President of EVC, Director and President of EV, Chief Executive Officer and President of EVM and BMR, and Director of EVD. Trustee and/or Officer of 173 registered investment companies and 4 private companies managed by EVM or BMR. Mr. Faust is an interested person because of his positions with EVM, BMR, EVD, EVC and EV, which are affiliates of the Trust and Portfolio. | | | 173 | | | Director of EVC | |
|
| Noninterested Trustees | | | | | | | | | | | | | |
|
| Benjamin C. Esty 1/2/63 | | Trustee | | Since 2005 | | Roy and Elizabeth Simmons Professor of Business Administration, Harvard University Graduate School of Business Administration. | | | 173 | | | None | |
|
| Allen R. Freedman 4/3/40 | | Trustee | | Since 2007 | | Former Chairman (2002-2004) and a Director (1983-2004) of Systems & Computer Technology Corp. (provider of software to higher education). Formerly, a Director of Loring Ward International (fund distributor) (2005-2007). Formerly, Chairman and a Director of Indus International, Inc. (provider of enterprise management software to the power generating industry) (2005-2007). | | | 173 | | | Director of Assurant, Inc. and Stonemor Partners L.P. (owner and operator of cemeteries) | |
|
| William H. Park 9/19/47 | | Trustee | | Since 2003 | | Vice Chairman, Commercial Industrial Finance Corp. (specialty finance company) (since 2006). Formerly, President and Chief Executive Officer, Prizm Capital Management, LLC (investment management firm) (2002-2005). | | | 173 | | | None | |
|
| Ronald A. Pearlman 7/10/40 | | Trustee | | Since 2003 | | Professor of Law, Georgetown University Law Center. | | | 173 | | | None | |
|
| Helen Frame Peters 3/22/48 | | Trustee | | Since 2008 | | Professor of Finance, Carroll School of Management, Boston College (since 2003). Adjunct Professor of Finance, Peking University, Beijing, China (since 2005). Formerly, Dean, Carroll School of Management, Boston College (2000-2003). | | | 173 | | | Director of Federal Home Loan Bank of Boston (a bank for banks) and BJ's Wholesale Clubs (wholesale club retailer); Trustee of SPDR Index Shares Funds and SPDR Series Trust (exchange traded funds) | |
|
| Heidi L. Steiger 7/8/53 | | Trustee | | Since 2007 | | Managing Partner, Topridge Associates LLC (global wealth management firm) (since 2008); Senior Advisor (since 2008), President (2005-2008), Lowenhaupt Global Advisors, LLC (global wealth management firm). Formerly, President and Contributing Editor, Worth Magazine (2004-2005). Formerly, Executive Vice President and Global Head of Private Asset Management (and various other positions), Neuberger Berman (investment firm) (1986-2004). | | | 173 | | | Director of Nuclear Electric Insurance Ltd. (nuclear insurance provider) and Aviva USA (insurance provider) | |
|
29
Eaton Vance Government Obligations Fund
MANAGEMENT AND ORGANIZATION CONT'D
Name and
Date of Birth | | Position(s)
with the
Trust and
the Portfolio | | Term of
Office and
Length of
Service | | Principal Occupation(s)
During Past Five Years | | Number of Portfolios
in Fund Complex
Overseen By
Trustee(1) | | Other Directorships Held | |
| Noninterested Trustees (continued) | | | | | | | | | | | |
|
| Lynn A. Stout 9/14/57 | | Trustee | | Since 1998 | | Paul Hastings Professor of Corporate and Securities Law (since 2006) and Professor of Law (2001-2006), University of California at Los Angeles School of Law. | | | 173 | | | None | |
|
| Ralph F. Verni 1/26/43 | | Chairman of the Board and Trustee | | Chairman of the Board since 2007 and Trustee since 2005 | | Consultant and private investor. | | | 173 | | | None | |
|
| Principal Officers who are not Trustees | | | | | | | |
|
Name and
Date of Birth | | Position(s)
with the
Trust and
the Portfolio | | Term of
Office and
Length of
Service | | Principal Occupation(s)
During Past Five Years | |
| William H. Ahern, Jr. 7/28/59 | | Vice President of the Trust | | Since 1995 | | Vice President of EVM and BMR. Officer of 75 registered investment companies managed by EVM or BMR. | |
|
| John R. Baur 2/10/70 | | Vice President of the Trust | | Since 2007 | | Vice President of EVM and BMR. Previously, attended Johnson Graduate School of Management, Cornell University (2002-2005), and prior thereto he was an Account Team Representative in Singapore for Applied Materials, Inc. Officer of 33 registered investment companies managed by EVM or BMR. | |
|
| Michael A. Cirami 12/24/75 | | Vice President of the Trust | | Since 2007 | | Vice President of EVM and BMR. Previously, attended the University of Rochester William E. Simon Graduate School of Business Administration (2001-2003), and prior thereto he was a Team Leader for the Institutional Services Group for State Street Bank in Luxembourg. Officer of 33 registered investment companies managed by EVM or BMR. | |
|
| Cynthia J. Clemson 3/2/63 | | Vice President of the Trust | | Since 2005 | | Vice President of EVM and BMR. Officer of 90 registered investment companies managed by EVM or BMR. | |
|
| Charles B. Gaffney 12/4/72 | | Vice President of the Trust | | Since 2007 | | Vice President of EVM and BMR. Previously, Sector Portfolio Manager and Senior Equity Analyst of Brown Brothers Harriman (1997-2003). Officer of 30 registered investment companies managed by EVM or BMR. | |
|
| Christine M. Johnston 11/9/72 | | Vice President | | Of the Trust since 2007 and of the Portfolio since 2006 | | Vice President of EVM and BMR. Officer of 35 registered investment companies managed by EVM or BMR. | |
|
| Aamer Khan 6/7/60 | | Vice President of the Trust | | Since 2005 | | Vice President of EVM and BMR. Officer of 33 registered investment companies managed by EVM or BMR. | |
|
| Thomas H. Luster 4/8/62 | | Vice President of the Trust | | Since 2006 | | Vice President of EVM and BMR. Officer of 51 registered investment companies managed by EVM or BMR. | |
|
| Robert B. MacIntosh 1/22/57 | | Vice President of the Trust | | Since 1998 | | Vice President of EVM and BMR. Officer of 90 registered investment companies managed by EVM or BMR. | |
|
| Duncan W. Richardson 10/26/57 | | Vice President of the Trust | | Since 2001 | | Executive Vice President and Chief Equity Investment Officer of EVC, EVM and BMR. Officer of 81 registered investment companies managed by EVM or BMR. | |
|
| Judith A. Saryan 8/21/54 | | Vice President of the Trust | | Since 2003 | | Vice President of EVM and BMR. Officer of 55 registered investment companies managed by EVM or BMR. | |
|
| Susan Schiff 3/13/61 | | Vice President | | Vice President of the Trust since 2002 and of the Portfolio since 1993 | | Vice President of EVM and BMR. Officer of 36 registered investment companies managed by EVM or BMR. | |
|
| Thomas Seto 9/27/62 | | Vice President of the Trust | | Since 2007 | | Vice President and Director of Portfolio Management of Parametric. Officer of 31 registered investment companies managed by EVM or BMR. | |
|
30
Eaton Vance Government Obligations Fund
MANAGEMENT AND ORGANIZATION CONT'D
Name and
Date of Birth | | Position(s)
with the
Trust and
the Portfolio | | Term of
Office and
Length of
Service | | Principal Occupation(s)
During Past Five Years | |
| Principal Officers who are not Trustees (continued) | | | | | | | |
|
| David M. Stein 5/4/51 | | Vice President of the Trust | | Since 2007 | | Managing Director and Chief Investment Officer of Parametric. Officer of 31 registered investment companies managed by EVM or BMR. | |
|
| Mark S. Venezia 5/23/49 | | Vice President of the Trust and President of the Portfolio | | Vice President of the Trust since 2007 and President of the Portfolio since 2002 | | Vice President of EVM and BMR. Officer of 36 registered investment companies managed by EVM or BMR. | |
|
| Adam A. Weigold 3/22/75 | | Vice President of the Trust | | Since 2007 | | Vice President of EVM and BMR. Officer of 71 registered investment companies managed by EVM or BMR. | |
|
| Barbara E. Campbell 6/19/57 | | Treasurer | | Of the Trust since 2005 and of the Portfolio since 2008(2) | | Vice President of EVM and BMR. Officer of 173 registered investment companies managed by EVM or BMR. | |
|
| Maureen A. Gemma 5/24/60 | | Secretary and Chief Legal Officer | | Secretary since 2007 and Chief Legal Officer since 2008 | | Vice President of EVM and BMR. Officer of 173 registered investment companies managed by EVM or BMR. | |
|
| Paul M. O'Neil 7/11/53 | | Chief Compliance Officer | | Since 2004 | | Vice President of EVM and BMR. Officer of 173 registered investment companies managed by EVM or BMR. | |
|
(1) Includes both master and feeder funds in a master-feeder structure.
(2) Prior to 2008, Ms. Campbell served as Assistant Treasurer of the Portfolio since 1998.
The SAI for the Fund includes additional information about the Trustees and officers of the Fund and the Portfolio and can be obtained without charge on Eaton Vance's website at www.eatonvance.com or by calling 1-800-262-1122.
31
This Page Intentionally Left Blank
Investment Adviser of Government Obligations Portfolio
Boston Management and Research
The Eaton Vance Building
255 State Street
Boston, MA 02109
Administrator of Eaton Vance Government Obligations Fund
Eaton Vance Management
The Eaton Vance Building
255 State Street
Boston, MA 02109
Principal Underwriter
Eaton Vance Distributors, Inc.
The Eaton Vance Building
255 State Street
Boston, MA 02109
(617) 482-8260
Custodian
State Street Bank and Trust Company
200 Clarendon Street
Boston, MA 02116
Transfer Agent
PNC Global Investment Servicing
Attn: Eaton Vance Funds
P.O. Box 9653
Providence, RI 02940-9653
(800) 262-1122
Independent Registered Public Accounting Firm
Deloitte & Touche LLP
200 Berkeley Street
Boston, MA 02116-5022
Eaton Vance Government Obligations Fund
The Eaton Vance Building
255 State Street
Boston, MA 02109
This report must be preceded or accompanied by a current prospectus. Before investing, investors should consider carefully the Fund's investment objective, risks, and charges and expenses. The Fund's current prospectus contains this and other information about the Fund and is available through your financial advisor. Please read the prospectus carefully before you invest or send money. For further information please call 1-800-262-1122.
140-12/08 GOSRC

Annual Report October 31, 2008


EATON VANCE
HIGH
INCOME
OPPORTUNITIES
FUND
IMPORTANT NOTICES REGARDING PRIVACY,
DELIVERY OF SHAREHOLDER DOCUMENTS,
PORTFOLIO HOLDINGS AND PROXY VOTING
Privacy. The Eaton Vance organization is committed to ensuring your financial privacy. Each of the financial institutions identified below has in effect the following policy ("Privacy Policy") with respect to nonpublic personal information about its customers:
• Only such information received from you, through application forms or otherwise, and information about your Eaton Vance fund transactions will be collected. This may include information such as name, address, social security number, tax status, account balances and transactions.
• None of such information about you (or former customers) will be disclosed to anyone, except as permitted by law (which includes disclosure to employees necessary to service your account). In the normal course of servicing a customer's account, Eaton Vance may share information with unaffiliated third parties that perform various required services such as transfer agents, custodians and broker/dealers.
• Policies and procedures (including physical, electronic and procedural safeguards) are in place that are designed to protect the confidentiality of such information.
• We reserve the right to change our Privacy Policy at any time upon proper notification to you. Customers may want to review our Policy periodically for changes by accessing the link on our homepage: www.eatonvance.com.
Our pledge of privacy applies to the following entities within the Eaton Vance organization: the Eaton Vance Family of Funds, Eaton Vance Management, Eaton Vance Investment Counsel, Boston Management and Research, and Eaton Vance Distributors, Inc.
In addition, our Privacy Policy only applies to those Eaton Vance customers who are individuals and who have a direct relationship with us. If a customer's account (i.e., fund shares) is held in the name of a third-party financial adviser/broker-dealer, it is likely that only such adviser's privacy policies apply to the customer. This notice supersedes all previously issued privacy disclosures.
For more information about Eaton Vance's Privacy Policy, please call 1-800-262-1122.
Delivery of Shareholder Documents. The Securities and Exchange Commission (the "SEC") permits funds to deliver only one copy of shareholder documents, including prospectuses, proxy statements and shareholder reports, to fund investors with multiple accounts at the same residential or post office box address. This practice is often called "householding" and it helps eliminate duplicate mailings to shareholders.
Eaton Vance, or your financial adviser, may household the mailing of your documents indefinitely unless you instruct Eaton Vance, or your financial adviser, otherwise.
If you would prefer that your Eaton Vance documents not be householded, please contact Eaton Vance at 1-800-262-1122, or contact your financial adviser.
Your instructions that householding not apply to delivery of your Eaton Vance documents will be effective within 30 days of receipt by Eaton Vance or your financial adviser.
Portfolio Holdings. Each Eaton Vance Fund and Portfolio (if applicable) will file a schedule of its portfolio holdings on Form N-Q with the SEC for the first and third quarters of each fiscal year. The Form N-Q will be available on the Eaton Vance website www.eatonvance.com, by calling Eaton Vance at 1-800-262-1122 or in the EDGAR database on the SEC's website at www.sec.gov. Form N-Q may also be reviewed and copied at the SEC's public reference room in Washington, D.C. (call 1-800-732-0330 for information on the operation of the public reference room).
Proxy Voting. From time to time, funds are required to vote proxies related to the securities held by the funds. The Eaton Vance Funds or their underlying Portfolios (if applicable) vote proxies according to a set of policies and procedures approved by the Funds' and Portfolios' Boards. You may obtain a description of these policies and procedures and information on how the Funds or Portfolios voted proxies relating to portfolio securities during the most recent 12 month period ended June 30, without charge, upon request, by calling 1-800-262-1122. This description is also available on the SEC's website at www.sec.gov.
Eaton Vance High Income Opportunities Fund as of October 31, 2008
MANAGEMENT’S DISCUSSION OF FUND PERFORMANCE

| |
Michael W. Weilheimer, CFA Co-Portfolio Manager | |
| |

| |
Thomas J. Huggins, CFA Co-Portfolio Manager | |
Economic and Market Conditions
· During the year ended October 31, 2008, the high-yield bond market suffered large losses, reflecting the breakdown of the credit markets. Toxic subprime loans, mortgage defaults, bank failures and excessive leverage in the financial system took a toll on consumer and investor confidence and dragged the economy into recession. Early in the year, the high-yield market was additionally impacted by a large inventory of unsold bonds issued to finance pending mergers and by a growing risk-aversion among fixed-income investors. The market staged a spirited-but-brief rally in March and April 2008, as the Federal Reserve injected liquidity following the Bear Stearns failure. However, as the dimensions of the global credit crisis became increasingly apparent, the market began a dramatic selloff. Forced liquidation of bank loans by hedge funds and structured investment vehicles accelerated the process of de-leveraging across the credit markets. The selling pressure was such that liquidity was sharply lower for higher-quality bonds, and all but disappeared for lower-quality bonds. The market decline was most severe in October 2008, declining 16.3% in that month alone, the worst month in the history of the high-yield market. High-yield spreads at October 31, 2008 were around 1,600 basis points (16.00%) – 50% higher than the peak spreads in the previous two recessions.
· A further measure of the sell-off was the high-yield bond distress ratio – the percentage of the market trading at a spread of 1,000 basis points (10.00%) or more. In October 2008, that figure rose to more than 65% of the market, significantly higher than the previous record of 40% in 2002. By October 31, 2008, the market appeared to have discounted a default rate in the mid-teens range, well above historical norms for recessions.
Management Discussion
· The Fund(1) underperformed its benchmark, the Merrill Lynch U.S. High Yield Master II Index(3) for the year ended October 31, 2008. Broadly speaking, the Fund focused on issuers management believed better able to withstand an economic downturn. While that focus marginally helped relative performance, the breadth and severity of the market downturn negatively impacted performance.
· The Fund’s performance was negatively impacted by its lower allocation in BB-rated bonds relative to the Index, as BB-rated issues outperformed in the difficult market environment. Consumer discretionary holdings also affected performance negatively. For example, an overweighting in gaming bonds fared poorly, as investors feared the consequences of a cutback in leisure and travel spending. Cyclical areas, such as paper, energy and metals and mining, detracted from performance, as the slower global economy brought lower commodity prices, and weaker demand for packaging materials.
· The consumer staples sector, which is characteristically less vulnerable to the vagaries of the economy, featured some of the Fund’s better performers. Securities selection in the food and beverages, health care and utilities industries helped performance, as these bonds suffered less dramatic losses than more
Eaton Vance High Income Opportunities Fund
Total Return Performance 10/31/07 – 10/31/08
Class A(2) | | -29.26 | % |
Class B(2) | | -29.93 | % |
Class C(2) | | -29.79 | % |
Merrill Lynch U.S. High Yield Master II Index(3) | | -26.52 | % |
Merrill Lynch U.S. High Yield Master II Constrained Index(3) | | -26.23 | % |
Lipper High Current Yield Funds Average(3) | | -25.13 | % |
Please refer to page 3 for additional performance information. | | | |
(1) | The Fund currently invests in a separate registered investment company, High Income Opportunities Portfolio, with the same objective and policies as the Fund. References to investments are to the Portfolio’s holdings. |
(2) | These returns do not include the 4.75% maximum sales charge for the Fund’s Class A shares or the applicable contingent deferred sales charges (CDSC) for Class B shares and Class C shares. If sales charges were deducted, the returns would be lower. Class A shares are subject to a 1% redemption fee if redeemed or exchanged within 90 days of the settlement of the purchase. |
(3) | It is not possible to invest directly in an Index or Lipper Classification. The Indices’ total returns do not reflect expenses that would have been incurred if an investor individually purchased or sold the securities represented in the Indices. The Lipper average is the average total return, at net asset value, of the funds that are in the same Lipper Classification as the Fund. |
Past performance is no guarantee of future results. Returns are historical and are calculated by determining the percentage change in net asset value or offering price (as applicable) with all distributions reinvested. Investment return and principal value will fluctuate so that shares, when redeemed, may be worth more or less than their original cost. Performance is for the stated time period only; due to market volatility, the Fund’s current performance may be lower or higher than the quoted return. For performance as of the most recent month-end, please refer to www.eatonvance.com.
Fund shares are not insured by the FDIC and are not deposits or other obligations of, or guaranteed by, any depository institution. Shares are subject to investment risks, including possible loss of principal invested.
1
economically-sensitive areas. Fund performance was helped by underweightings in the automotive and homebuilding areas, which were among the hardesthit industries in the U.S. economy. The Fund’s relative performance was also positively impacted by an underweighting in the troubled financial sector. The Fund had no direct exposure to commercial banks during the period, which deteriorated amid growing loan losses.
Portfolio Composition
Portfolio Credit Quality Ratings(1)
By total investments

(1) | As a percentage of the Portfolio’s total investments as of 10/31/08. Although the investment adviser considers ratings when making investment decisions, it performs its own credit and investment analysis and does not rely primarily on the ratings assigned by the rating services. Credit quality can change from time to time, and recently issued credit ratings may not fully reflect the actual risks posed by a particular security or the issuer’s current financial condition. |
Past performance is no guarantee of future results. Returns are historical and are calculated by determining the percentage change in net asset value or offering price (as applicable) with all distributions reinvested. Investment return and principal value will fluctuate so that shares, when redeemed, may be worth more or less than their original cost. Performance is for the stated time period only; due to market volatility, the Fund’s current performance may be lower or higher than the quoted return. For performance as of the most recent month end, please refer to www.eatonvance.com.
The views expressed throughout this report are those of the portfolio managers and are current only through the end of the period of the report as stated on the cover. These views are subject to change at any time based upon market or other conditions, and the investment adviser disclaims any responsibility to update such views. These views may not be relied on as investment advice and, because investment decisions for a fund are based on many factors, may not be relied on as an indication of trading intent on behalf of any Eaton Vance fund. Portfolio information provided in the report may not be representative of the Portfolio’s current or future investments and may change due to active management.
2
Eaton Vance High Income Opportunities Fund as of October 31, 2008
FUND PERFORMANCE
The line graph and table set forth below provide information about the Fund’s performance. The line graph compares the performance of Class B of the Fund with that of the Merrill Lynch U.S. High Yield Master II Index, an unmanaged index of below investment grade U.S. dollar-denominated corporate bonds publicly issued in the U.S. domestic market and the Merrill Lynch U.S. High Yield Master II Constrained Index, whose constituents are capitalization-weighted, based on their current amount outstanding, provided the total allocation to an individual issuer does not exceed 2%. The lines on the graph represent the total returns of a hypothetical investment of $10,000 in each of Class B of the Fund, the Merrill Lynch U.S. High Yield Master II Index and the Merrill Lynch U.S. High Yield Master II Constrained Index. The table includes the total returns of each Class of the Fund at net asset value and maximum public offering price. The performance presented below does not reflect the deduction of taxes, if any, that a shareholder would pay on Fund distributions or the redemption of Fund shares.
Fund Performance(1)
| | Class A | | Class B | | Class C | |
Class Share Symbol | | ETHIX | | EVHIX | | ECHIX | |
| | | | | | | |
Average Annual Total Returns (at net asset value) | | | | | | | |
One Year | | -29.26 | % | -29.93 | % | -29.79 | % |
Five Years | | N.A. | | -0.87 | | -0.91 | |
Ten Years | | N.A. | | 1.59 | | 1.57 | |
Life of Fund† | | -1.56 | | 5.35 | | 3.41 | |
| | | | | | | |
SEC Average Annual Total Returns (including sales charge or applicable CDSC) | | | | | | | |
One Year | | -32.67 | % | -33.15 | % | -30.44 | % |
Five Years | | N.A. | | -1.14 | | -0.91 | |
Ten Years | | N.A. | | 1.59 | | 1.57 | |
Life of Fund† | | -2.58 | | 5.35 | | 3.41 | |
† Inception Dates – Class A: 3/11/04; Class B: 8/19/86; Class C: 6/8/94 |
|
(1) | Average Annual Total Returns do not include the 4.75% maximum sales charge for Class A shares or the applicable contingent deferred sales charges (CDSC) for Class B or Class C shares. If sales charges were deducted, the returns would be lower. SEC Average Annual Total Returns for Class A reflect the maximum 4.75% sales charge. SEC returns for Class B reflect applicable CDSC based on the following schedule: 5% - 1st and 2nd years; 4% - 3rd year; 3% - 4th year; 2% - 5th year; 1% - 6th year. SEC returns for Class C reflect a 1% CDSC for the first year. Class A shares are subject to a 1% redemption fee if redeemed or exchanged within 90 days of the settlement of the purchase. |
Total Annual Operating Expenses(2)
| | Class A | | Class B | | Class C | |
| | | | | | | |
Expense Ratio | | 1.04 | % | 1.78 | % | 1.79 | % |
(2) | Source: Prospectus dated 3/1/08. |
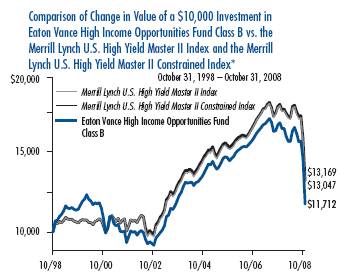
* | Sources: Lipper Inc. Class B of the Fund commenced operations on 8/19/86. |
| A $10,000 hypothetical investment at net asset value in Class A shares on 3/11/04 (commencement of operations) and Class C shares on 10/31/98 would have been valued at $9,295 ($8,854 at the maximum offering price) and $11,691, respectively, on 10/31/08. It is not possible to invest directly in an Index. The Indices’ total returns do not reflect expenses that would have been incurred if an investor individually purchased or sold the securities represented in the Indices. |
Past performance is no guarantee of future results. Returns are historical and are calculated by determining the percentage change in net asset value or offering price (as applicable) with all distributions reinvested. Investment return and principal value will fluctuate so that shares, when redeemed, may be worth more or less than their original cost. Performance is for the stated time period only; due to market volatility, the Fund’s current performance may be lower or higher than the quoted return. For performance as of the most recent month end, please refer to www.eatonvance.com.
3
Eaton Vance High Income Opportunities Fund as of October 31, 2008
FUND EXPENSES
Example: As a shareholder of the Fund, you incur two types of costs: (1) transaction costs, including sales charges (loads) on purchases and redemption fees (if applicable); and (2) ongoing costs, including management fees; distribution or service fees; and other Fund expenses. This Example is intended to help you understand your ongoing costs (in dollars) of investing in the Fund and to compare these costs with the ongoing costs of investing in other mutual funds. The Example is based on an investment of $1,000 invested at the beginning of the period and held for the entire period (May 1, 2008 – October 31, 2008).
Actual Expenses: The first section of the table below provides information about actual account values and actual expenses. You may use the information in this section, together with the amount you invested, to estimate the expenses that you paid over the period. Simply divide your account value by $1,000 (for example, an $8,600 account value divided by $1,000 = 8.6), then multiply the result by the number in the first section under the heading entitled "Expenses Paid During Period" to estimate the expenses you paid on your account during this period.
Hypothetical Example for Comparison Purposes: The second section of the table below provides information about hypothetical account values and hypothetical expenses based on the actual Fund expense ratio and an assumed rate of return of 5% per year (before expenses), which is not the actual return of the Fund. The hypothetical account values and expenses may not be used to estimate the actual ending account balance or expenses you paid for the period. You may use this information to compare the ongoing costs of investing in your Fund and other funds. To do so, compare this 5% hypothetical example with the 5% hypothetical examples that appear in the shareholder reports of the other funds.
Please note that the expenses shown in the table are meant to highlight your ongoing costs only and do not reflect any transactional costs, such as sales charges (loads) or redemption fees (if applicable). Therefore, the second section of the table is useful in comparing ongoing costs only, and will not help you determine the relative total costs of owning different funds. In addition, if these transactional costs were included, your costs would have been higher.
Eaton Vance High Income Opportunities Fund
| | | Beginning Account Value
(5/1/08) | | Ending Account Value
(10/31/08) | | Expenses Paid During Period*
(5/1/08 – 10/31/08) | |
| Actual | |
| Class A | | $ | 1,000.00 | | | $ | 726.00 | | | $ | 5.03 | | |
| Class B | | $ | 1,000.00 | | | $ | 722.20 | | | $ | 8.18 | | |
| Class C | | $ | 1,000.00 | | | $ | 722.20 | | | $ | 8.27 | | |
| Hypothetical | |
| (5% return per year before expenses) | |
| Class A | | $ | 1,000.00 | | | $ | 1,019.30 | | | $ | 5.89 | | |
| Class B | | $ | 1,000.00 | | | $ | 1,015.60 | | | $ | 9.58 | | |
| Class C | | $ | 1,000.00 | | | $ | 1,015.50 | | | $ | 9.68 | | |
* Expenses are equal to the Fund's annualized expense ratio of 1.16% for Class A shares, 1.89% for Class B shares and 1.91% for Class C shares, multiplied by the average account value over the period, multiplied by 184/366 (to reflect the one-half year period). The Example assumes that the $1,000 was invested at the net asset value per share determined at the close of business on April 30, 2008. The Example reflects the expenses of both the Fund and the Portfolio.
4
Eaton Vance High Income Opportunities Fund as of October 31, 2008
FINANCIAL STATEMENTS
Statement of Assets and Liabilities
As of October 31, 2008
| Assets | |
Investment in High Income Opportunities Portfolio, at value
(identified cost, $519,092,726) | | $ | 343,608,741 | | |
| Receivable for Fund shares sold | | | 447,054 | | |
| Total assets | | $ | 344,055,795 | | |
| Liabilities | |
| Dividends payable | | $ | 1,970,833 | | |
| Payable for Fund shares redeemed | | | 808,969 | | |
| Payable to affiliate for distribution and service fees | | | 207,157 | | |
| Payable to affiliate for Trustees' fees | | | 42 | | |
| Accrued expenses | | | 144,680 | | |
| Total liabilities | | $ | 3,131,681 | | |
| Net Assets | | $ | 340,924,114 | | |
| Sources of Net Assets | |
| Paid-in capital | | $ | 920,215,929 | | |
Accumulated net realized loss from Portfolio (computed on the basis of
identified cost) | | | (407,607,485 | ) | |
| Accumulated undistributed net investment income | | | 3,799,655 | | |
Net unrealized depreciation from Portfolio (computed on the basis of
identified cost) | | | (175,483,985 | ) | |
| Total | | $ | 340,924,114 | | |
| Class A Shares | |
| Net Assets | | $ | 161,602,503 | | |
| Shares Outstanding | | | 48,889,756 | | |
Net Asset Value and Redemption Price Per Share
(net assets ÷ shares of beneficial interest outstanding) | | $ | 3.31 | | |
Maximum Offering Price Per Share
(100 ÷ 95.25 of $3.31) | | $ | 3.48 | | |
| Class B Shares | |
| Net Assets | | $ | 89,480,337 | | |
| Shares Outstanding | | | 27,103,852 | | |
Net Asset Value and Offering Price Per Share*
(net assets ÷ shares of beneficial interest outstanding) | | $ | 3.30 | | |
| Class C Shares | |
| Net Assets | | $ | 89,841,274 | | |
| Shares Outstanding | | | 27,224,593 | | |
Net Asset Value and Offering Price Per Share*
(net assets ÷ shares of beneficial interest outstanding) | | $ | 3.30 | | |
| On sales of $25,000 or more, the offering price of Class A shares is reduced. | |
* Redemption price per share is equal to the net asset value less any applicable contingent deferred sales charge.
Statement of Operations
For the Year Ended
October 31, 2008
| Investment Income | |
| Interest and other income allocated from Portfolio | | $ | 52,837,209 | | |
| Dividends allocated from Portfolio | | | 425,559 | | |
| Expenses allocated from Portfolio | | | (3,725,329 | ) | |
| Net investment income from Portfolio | | $ | 49,537,439 | | |
| Expenses | |
| Trustees' fees and expenses | | $ | 1,735 | | |
Distribution and service fees
Class A | | | 558,781 | | |
| Class B | | | 1,663,069 | | |
| Class C | | | 1,363,377 | | |
| Transfer and dividend disbursing agent fees | | | 540,289 | | |
| Printing and postage | | | 115,056 | | |
| Registration fees | | | 54,120 | | |
| Custodian fee | | | 44,468 | | |
| Legal and accounting services | | | 24,262 | | |
| Miscellaneous | | | 17,691 | | |
| Total expenses | | $ | 4,382,848 | | |
| Net investment income | | $ | 45,154,591 | | |
Realized and Unrealized
Gain (Loss) from Portfolio | |
Net realized gain (loss) —
Investment transactions (identified cost basis) | | $ | (31,929,368 | ) | |
| Swap contracts | | | 1,691,950 | | |
Foreign currency and forward foreign
currency exchange contract transactions | | | 418,120 | | |
| Net realized loss | | $ | (29,819,298 | ) | |
Change in unrealized appreciation (depreciation) —
Investments (identified cost basis) | | $ | (164,083,438 | ) | |
| Swap contracts | | | (6,091,587 | ) | |
| Foreign currency and forward foreign currency exchange contracts | | | 34,843 | | |
| Net change in unrealized appreciation (depreciation) | | $ | (170,140,182 | ) | |
| Net realized and unrealized loss | | $ | (199,959,480 | ) | |
| Net decrease in net assets from operations | | $ | (154,804,889 | ) | |
See notes to financial statements
5
Eaton Vance High Income Opportunities Fund as of October 31, 2008
FINANCIAL STATEMENTS CONT'D
Statements of Changes in Net Assets
Increase (Decrease)
in Net Assets | | Year Ended
October 31, 2008 | | Year Ended
October 31, 2007 | |
From operations —
Net investment income | | $ | 45,154,591 | | | $ | 51,757,931 | | |
Net realized gain (loss) from
investment transactions, swap
contracts, and foreign currency
and forward foreign currency
exchange contracts transactions | | | (29,819,298 | ) | | | 17,890,050 | | |
Net change in unrealized appreciation
(depreciation) from investments,
swap contracts, foreign currency
and forward foreign currency
exchange contracts | | | (170,140,182 | ) | | | (33,668,896 | ) | |
Net increase (decrease) in net assets
from operations | | $ | (154,804,889 | ) | | $ | 35,979,085 | | |
Distributions to shareholders —
From net investment income
Class A | | $ | (20,114,244 | ) | | $ | (19,407,696 | ) | |
| Class B | | | (13,439,771 | ) | | | (19,246,612 | ) | |
| Class C | | | (11,100,265 | ) | | | (12,304,402 | ) | |
Tax return of capital
Class A | | | (21,935 | ) | | | — | | |
| Class B | | | (14,656 | ) | | | — | | |
| Class C | | | (12,105 | ) | | | — | | |
| Total distributions to shareholders | | $ | (44,702,976 | ) | | $ | (50,958,710 | ) | |
Transactions in shares of beneficial interest —
Proceeds from sale of shares
Class A | | $ | 28,348,051 | | | $ | 104,586,233 | | |
| Class B | | | 6,914,420 | | | | 13,804,283 | | |
| Class C | | | 14,908,093 | | | | 28,850,891 | | |
Net asset value of shares issued to
shareholders in payment of
distributions declared
Class A | | | 9,264,184 | | | | 8,052,036 | | |
| Class B | | | 5,751,882 | | | | 8,006,586 | | |
| Class C | | | 4,448,493 | | | | 4,923,939 | | |
Cost of shares redeemed
Class A | | | (80,617,635 | ) | | | (83,529,390 | ) | |
| Class B | | | (47,281,467 | ) | | | (68,934,760 | ) | |
| Class C | | | (39,404,168 | ) | | | (40,223,946 | ) | |
Net asset value of shares exchanged
Class A | | | 39,044,718 | | | | 32,628,687 | | |
| Class B | | | (39,044,718 | ) | | | (32,628,687 | ) | |
| Redemption fees | | | 3,495 | | | | 10,279 | | |
Net decrease in net assets from Fund
share transactions | | $ | (97,664,652 | ) | | $ | (24,453,849 | ) | |
| Net decrease in net assets | | $ | (297,172,517 | ) | | $ | (39,433,474 | ) | |
| Net Assets | | Year Ended
October 31, 2008 | | Year Ended
October 31, 2007 | |
| At beginning of year | | $ | 638,096,631 | | | $ | 677,530,105 | | |
| At end of year | | $ | 340,924,114 | | | $ | 638,096,631 | | |
Accumulated undistributed
(distributions in excess of)
net investment income
included in net assets | |
| At end of year | | $ | 3,799,655 | | | $ | (716,991 | ) | |
See notes to financial statements
6
Eaton Vance High Income Opportunities Fund as of October 31, 2008
FINANCIAL STATEMENTS CONT'D
Financial Highlights
| | | Class A | |
| | | Year Ended October 31, | | Period Ended | |
| | | 2008 | | 2007 | | 2006 | | 2005 | | October 31, 2004(1) | |
| Net asset value — Beginning of period | | $ | 5.130 | | | $ | 5.230 | | | $ | 5.100 | | | $ | 5.210 | | | $ | 5.230 | | |
| Income (loss) from operations | |
| Net investment income(2) | | $ | 0.419 | | | $ | 0.418 | | | $ | 0.401 | | | $ | 0.402 | | | $ | 0.262 | | |
| Net realized and unrealized gain (loss) | | | (1.823 | ) | | | (0.105 | ) | | | 0.142 | | | | (0.095 | ) | | | (0.001 | ) | |
| Total income (loss) from operations | | $ | (1.404 | ) | | $ | 0.313 | | | $ | 0.543 | | | $ | 0.307 | | | $ | 0.261 | | |
| Less distributions | |
| From net investment income | | $ | (0.416 | ) | | $ | (0.413 | ) | | $ | (0.413 | ) | | $ | (0.417 | ) | | $ | (0.281 | ) | |
| Tax return of capital | | | (0.000 | )(10) | | | — | | | | — | | | | — | | | | — | | |
| Total distributions | | $ | (0.416 | ) | | $ | (0.413 | ) | | $ | (0.413 | ) | | $ | (0.417 | ) | | $ | (0.281 | ) | |
| Redemption fees(2) | | $ | 0.000 | (3) | | $ | 0.000 | (3) | | $ | 0.000 | (3) | | $ | 0.000 | (3) | | $ | 0.000 | (3) | |
| Net asset value — End of period | | $ | 3.310 | | | $ | 5.130 | | | $ | 5.230 | | | $ | 5.100 | | | $ | 5.210 | | |
| Total Return(4) | | | (29.26 | )% | | | 6.11 | % | | | 11.04 | % | | | 6.01 | % | | | 5.20 | %(8) | |
| Ratios/Supplemental Data | |
| Net assets, end of period (000's omitted) | | $ | 161,603 | | | $ | 254,508 | | | $ | 199,812 | | | $ | 165,125 | | | $ | 150,042 | | |
| Ratios (As a percentage of average daily net assets): | |
| Expenses before custodian fee reduction(5)(6) | | | 1.11 | % | | | 1.04 | % | | | 0.97 | % | | | 0.97 | % | | | 0.96 | %(7) | |
| Net investment income | | | 9.06 | % | | | 7.98 | % | | | 7.77 | % | | | 7.70 | % | | | 7.98 | %(7) | |
| Portfolio Turnover of the Portfolio | | | 48 | % | | | 81 | % | | | 62 | % | | | 62 | % | | | 80 | %(9) | |
(1) For the period from the commencement of offering of Class A shares, March 11, 2004, to October 31, 2004.
(2) Computed using average shares outstanding.
(3) Amounts represent less than $0.0005.
(4) Returns are historical and are calculated by determining the percentage change in net asset value with all distributions reinvested.
(5) Includes the Fund's share of the Portfolio's allocated expenses.
(6) Excludes the effect of custody fee credits, if any, of less than 0.005%.
(7) Annualized.
(8) Not annualized.
(9) For the year ended October 31, 2004.
(10) Amount is less than $0.0005.
See notes to financial statements
7
Eaton Vance High Income Opportunities Fund as of October 31, 2008
FINANCIAL STATEMENTS CONT'D
Financial Highlights
| | | Class B | |
| | | Year Ended October 31, | |
| | | 2008 | | 2007 | | 2006 | | 2005 | | 2004 | |
| Net asset value — Beginning of year | | $ | 5.120 | | | $ | 5.220 | | | $ | 5.080 | | | $ | 5.200 | | | $ | 5.050 | | |
| Income (loss) from operations | |
| Net investment income(1) | | $ | 0.383 | | | $ | 0.379 | | | $ | 0.363 | | | $ | 0.363 | | | $ | 0.392 | | |
| Net realized and unrealized gain (loss) | | | (1.826 | ) | | | (0.107 | ) | | | 0.149 | | | | (0.106 | ) | | | 0.169 | | |
| Total income (loss) from operations | | $ | (1.443 | ) | | $ | 0.272 | | | $ | 0.512 | | | $ | 0.257 | | | $ | 0.561 | | |
| Less distributions | |
| From net investment income | | $ | (0.377 | ) | | $ | (0.372 | ) | | $ | (0.372 | ) | | $ | (0.377 | ) | | $ | (0.411 | ) | |
| Tax return of capital | | | (0.000 | )(7) | | | — | | | | — | | | | — | | | | — | | |
| Total distributions | | $ | (0.377 | ) | | $ | (0.372 | ) | | $ | (0.372 | ) | | $ | (0.377 | ) | | $ | (0.411 | ) | |
| Redemption fees(1) | | $ | 0.000 | (2) | | $ | 0.000 | (2) | | $ | 0.000 | (2) | | $ | 0.000 | (2) | | $ | 0.000 | (2) | |
| Net asset value — End of year | | $ | 3.300 | | | $ | 5.120 | | | $ | 5.220 | | | $ | 5.080 | | | $ | 5.200 | | |
| Total Return(3) | | | (29.93 | )% | | | 5.30 | % | | | 10.41 | % | | | 5.34 | %(4) | | | 11.55 | % | |
| Ratios/Supplemental Data | |
| Net assets, end of year (000's omitted) | | $ | 89,480 | | | $ | 221,436 | | | $ | 305,519 | | | $ | 370,036 | | | $ | 474,861 | | |
| Ratios (As a percentage of average daily net assets): | |
| Expenses before custodian fee reduction(5)(6) | | | 1.86 | % | | | 1.78 | % | | | 1.72 | % | | | 1.72 | % | | | 1.71 | % | |
| Net investment income | | | 8.23 | % | | | 7.23 | % | | | 7.05 | % | | | 6.95 | % | | | 7.60 | % | |
| Portfolio Turnover of the Portfolio | | | 48 | % | | | 81 | % | | | 62 | % | | | 62 | % | | | 80 | % | |
(1) Computed using average shares outstanding.
(2) Amount represent less than $0.0005.
(3) Returns are historical and are calculated by determining the percentage change in net asset value with all distributions reinvested.
(4) Total return reflects an increase of 0.33% due to a change in the timing of the payment and reinvestment of distributions.
(5) Includes the Fund's share of the Portfolio's allocated expenses.
(6) Excludes the effect of custody fee credits, if any, of less than 0.005%.
(7) Amount is less than $0.0005.
See notes to financial statements
8
Eaton Vance High Income Opportunities Fund as of October 31, 2008
FINANCIAL STATEMENTS CONT'D
Financial Highlights
| | | Class C | |
| | | Year Ended October 31, | |
| | | 2008 | | 2007 | | 2006 | | 2005 | | 2004 | |
| Net asset value — Beginning of year | | $ | 5.110 | | | $ | 5.220 | | | $ | 5.080 | | | $ | 5.200 | | | $ | 5.050 | | |
| Income (loss) from operations | |
| Net investment income(1) | | $ | 0.383 | | | $ | 0.378 | | | $ | 0.363 | | | $ | 0.363 | | | $ | 0.389 | | |
| Net realized and unrealized gain (loss) | | | (1.816 | ) | | | (0.116 | ) | | | 0.149 | | | | (0.107 | ) | | | 0.171 | | |
| Tax return of capital | | | — | | | | — | | | | — | | | | — | | | | — | | |
| Total income (loss) from operations | | $ | (1.433 | ) | | $ | 0.262 | | | $ | 0.512 | | | $ | 0.256 | | | $ | 0.560 | | |
| Less distributions | |
| From net investment income | | $ | (0.377 | ) | | $ | (0.372 | ) | | $ | (0.372 | ) | | $ | (0.376 | ) | | $ | (0.410 | ) | |
| Tax return of capital | | | (0.000 | )(7) | | | — | | | | — | | | | — | | | | — | | |
| Total distributions | | $ | (0.377 | ) | | $ | (0.372 | ) | | $ | (0.372 | ) | | $ | (0.376 | ) | | $ | (0.410 | ) | |
| Redemption fees(1) | | $ | 0.000 | (2) | | $ | 0.000 | (2) | | $ | 0.000 | (2) | | $ | 0.000 | (2) | | $ | 0.000 | (2) | |
| Net asset value — End of year | | $ | 3.300 | | | $ | 5.110 | | | $ | 5.220 | | | $ | 5.080 | | | $ | 5.200 | | |
| Total Return(3) | | | (29.79 | )% | | | 5.09 | % | | | 10.41 | % | | | 5.32 | %(4) | | | 11.38 | % | |
| Ratios/Supplemental Data | |
| Net assets, end of year (000's omitted) | | $ | 89,841 | | | $ | 162,153 | | | $ | 172,200 | | | $ | 188,454 | | | $ | 239,308 | | |
| Ratios (As a percentage of average daily net assets): | |
| Expenses before custodian fee reduction(5)(6) | | | 1.86 | % | | | 1.79 | % | | | 1.72 | % | | | 1.72 | % | | | 1.71 | % | |
| Net investment income | | | 8.28 | % | | | 7.22 | % | | | 7.05 | % | | | 6.96 | % | | | 7.56 | % | |
| Portfolio Turnover of the Portfolio | | | 48 | % | | | 81 | % | | | 62 | % | | | 62 | % | | | 80 | % | |
(1) Computed using average shares outstanding.
(2) Amounts represent less than $0.0005.
(3) Returns are historical and are calculated by determining the percentage change in net asset value with all distributions reinvested.
(4) Total return reflects an increase of 0.20% due to a change in the timing of the payment and reinvestment of distributions.
(5) Includes the Fund's share of the Portfolio's allocated expenses.
(6) Excludes the effect of custody fee credits, if any, of less than 0.005%
(7) Amount is less than $0.0005.
See notes to financial statements
9
Eaton Vance High Income Opportunities Fund as of October 31, 2008
NOTES TO FINANCIAL STATEMENTS
1 Significant Accounting Policies
Eaton Vance High Income Opportunities Fund (the Fund), is a diversified series of Eaton Vance Mutual Funds Trust (the Trust). The Trust is a Massachusetts business trust registered under the Investment Company Act of 1940, as amended (the 1940 Act), as an open-end management investment company. The Fund offers three classes of shares. Class A shares are generally sold subject to a sales charge imposed at time of purchase. Class B and Class C shares are sold at net asset value and are generally subject to a contingent deferred sales charge (see Note 5). Class B shares automatically convert to Class A shares eight years after their purchase as described in the Fund's prospectus. Each class represents a pro-rata interest in the Fund, but votes separately on class-specific matters and (as noted below) is subject to different expenses. Realized and unrealized gains and losses are allocated daily to each class of shares based on the r elative net assets of each class to the total net assets of the Fund. Net investment income, other than class-specific expenses, is allocated daily to each class of shares based upon the ratio of the value of each class's paid shares to the total value of all paid shares. Each class of shares differs in its distribution plan and certain other class-specific expenses. The Fund invests all of its investable assets in interests in High Income Opportunities Portfolio (the Portfolio), a New York trust, having the same investment objective and policies as the Fund. The value of the Fund's investment in the Portfolio reflects the Fund's proportionate interest in the net assets of the Portfolio (71.6% at October 31, 2008). The performance of the Fund is directly affected by the performance of the Portfolio. The financial statements of the Portfolio, including the portfolio of investments, are included elsewhere in this report and should be read in conjunction with the Fund's financial statements.
The following is a summary of significant accounting policies of the Fund. The policies are in conformity with accounting principles generally accepted in the United States of America.
A Investment Valuation — Valuation of securities by the Portfolio is discussed in Note 1A of the Portfolio's Notes to Financial Statements, which are included elsewhere in this report.
B Income — The Fund's net investment income or loss consists of the Fund's pro-rata share of the net investment income or loss of the Portfolio, less all actual and accrued expenses of the Fund.
C Federal Taxes — The Fund's policy is to comply with the provisions of the Internal Revenue Code applicable to regulated investment companies and to distribute to shareholders each year substantially all of its net investment income, and all or substantially all of its net realized capital gains. Accordingly, no provision for federal income or excise tax is necessary. At October 31, 2008, the Fund, for federal income tax purposes, had a capital loss carryforward of $403,896,628 which will reduce its taxable income arising from future net realized gains on investment transactions, if any, to the extent permit ted by the Internal Revenue Code, and thus will reduce the amount of distributions to shareholders which would otherwise be necessary to relieve the Fund of any liability for federal income or excise tax. Such capital loss carryforward will expire on October 31, 2009 ($227,375,994), October 31, 2010 ($143,280,458) and October 31, 2016 ($33,240,176).
As of October 31, 2008, the Fund had no uncertain tax positions that would require financial statement recognition, de-recognition, or disclosure. Each of the Fund's federal tax returns filed in the 3-year period ended October 31, 2008 remains subject to examination by the Internal Revenue Service.
D Expenses — The majority of expenses of the Trust are directly identifiable to an individual fund. Expenses which are not readily identifiable to a specific fund are allocated taking into consideration, among other things, the nature and type of expense and the relative size of the funds.
E Expense Reduction — State Street Bank and Trust Company (SSBT) serves as custodian of the Fund. Pursuant to the custodian agreement, SSBT receives a fee reduced by credits, which are determined based on the average daily cash balance the Fund maintains with SSBT. All credit balances, if any, used to reduce the Fund's custodian fees are reported as a reduction of expenses in the Statement of Operations.
F Use of Estimates — The preparation of the financial statements in conformity with accounting principles generally accepted in the United States of America requires management to make estimates and assumptions that affect the reported amounts of assets and liabilities at the date of the financial statements and the reported amounts of income and expense during the reporting period. Actual results could differ from those estimates.
10
Eaton Vance High Income Opportunities Fund as of October 31, 2008
NOTES TO FINANCIAL STATEMENTS CONT'D
G Indemnifications — Under the Trust's organizational documents, its officers and Trustees may be indemnified against certain liabilities and expenses arising out of the performance of their duties to the Fund, and shareholders are indemnified against personal liability for the obligations of the Trust. Additionally, in the normal course of business, the Fund enters into agreements with service providers that may contain indemnification clauses. The Fund's maximum exposure under these arrangements is unknown as this would involve future claims that may be made against the Fund that have not yet occurred.
H Redemption Fees — Upon the redemption or exchange of shares by Class A shareholders within 90 days of the settlement of purchase, a fee of 1% of the current net asset value of these shares will be assessed and retained by the Fund for the benefit of the remaining shareholders. The redemption fee is accounted for as an addition to paid-in capital.
I Other — Investment transactions are accounted for on a trade date basis. Dividends to shareholders are recorded on the ex-dividend date.
2 Distributions to Shareholders
The Fund declares dividends daily to shareholders of record at the time of declaration. Distributions are generally paid monthly. Distributions of realized capital gains (reduced by available capital loss carryforwards from prior years, if any) are made at least annually. Distributions are declared separately for each class of shares. Shareholders may reinvest income and capital gain distributions in additional shares of the same class of the Fund at the net asset value as of the reinvestment date or, at the election of the shareholder, receive distributions in cash. The Fund distinguishes between distributions on a tax basis and a financial reporting basis. Accounting principles generally accepted in the United States of America require that only distributions in excess of tax basis earnings and profits be reported in the financial statements as a return of capital. Permanent differences between book and tax accounting relating to distributions are reclassified to paid-in capital.
The tax character of distributions declared for the years ended October 31, 2008 and October 31, 2007 was as follows:
| | | Year ended October 31, | |
| | | 2008 | | 2007 | |
| Distributions declared from: | |
| Ordinary income | | $ | 44,654,280 | | | $ | 50,958,710 | | |
| Tax return of capital | | | 48,696 | | | | — | | |
During the year ended October 31, 2008, accumulated undistributed net investment income was increased by $4,016,335 and accumulated net realized loss was increased by $4,016,335 due to differences between book and tax accounting, primarily for premium amortization, foreign currency gain (loss) and swap contracts. These reclassifications had no effect on the net assets or net asset value per share of the Fund.
As of October 31, 2008, the components of distributable earnings (accumulated losses) and unrealized appreciation (depreciation) on a tax basis were as follows:
| Capital loss carryforward | | $ | (403,896,628 | ) | |
| Net unrealized depreciation | | $ | (173,424,354 | ) | |
| Other temporary differences | | $ | (1,970,833 | ) | |
The differences between components of distributable earnings (accumulated losses) on a tax basis and the amounts reflected in the Statement of Assets and Liabilities are primarily due to swap contracts, premium amortization, wash sales, the timing of recognizing distributions to shareholders and partnership allocations.
3 Transactions with Affiliates
Eaton Vance Management (EVM) serves as the administrator to the Fund, but receives no compensation. The Portfolio has engaged Boston Management and Research (BMR), a subsidiary of EVM, to render investment advisory services. See Note 2 of the Portfolio's Notes to Financial Statements which are included elsewhere in this report. EVM serves as the sub-transfer agent of the Fund and receives from the transfer agent an aggregate fee based upon the actual expenses incurred by EVM in the performance of these services. For the year ended October 31, 2008, EVM earned $31,356 in sub-transfer agent fees. The Fund was informed that Eaton Vance Distributors, Inc. (EVD), an affiliate of EVM and the Fund's principal underwriter, received $15,651 as its portion of the sales charge on sales of Class A shares for the year ended October 31, 2008. EVD also received distribution and service fees from Class A, Class B and Class C shares (see Note 4) and contingent deferred sales charges (see Note 5).
Except for Trustees of the Fund and the Portfolio who are not members of EVM's or BMR's organizations, officers and Trustees receive remuneration for their services to the Fund out of the investment adviser fee. Certain officers and Trustees of the Fund and the Portfolio are officers of the above organizations.
11
Eaton Vance High Income Opportunities Fund as of October 31, 2008
NOTES TO FINANCIAL STATEMENTS CONT'D
4 Distribution Plans
The Fund has in effect a distribution plan for Class A shares (Class A Plan) pursuant to Rule 12b-1 under the 1940 Act. The Class A Plan provides that the Fund will pay EVD a distribution and service fee of 0.25% per annum of its average daily net assets attributable to Class A shares for distribution services and facilities provided to the Fund by EVD, as well as for personal services and/or the maintenance of shareholder accounts. Distribution and service fees paid or accrued to EVD for the year ended October 31, 2008 amounted to $558,781 for Class A shares. The Fund also has in effect distribution plans for Class B shares (Class B Plan) and Class C shares (Class C Plan) pursuant to Rule 12b-1 under the 1940 Act. The Class B and Class C Plans require the Fund to pay EVD amounts equal to 0.75% per annum of its average daily net assets attributable to Class B and Class C shares for providing ongoing distribution services and fac ilities to the Fund. The Fund will automatically discontinue payments to EVD during any period in which there are no outstanding Uncovered Distribution Charges, which are equivalent to the sum of (i) 5% and 6.25% of the aggregate amount received by the Fund for Class B and Class C shares sold, respectively, plus (ii) interest calculated by applying the rate of 1% over the prevailing prime rate to the outstanding balance of Uncovered Distribution Charges of EVD of each respective class, reduced by the aggregate amount of contingent deferred sales charges (see Note 5) and amounts theretofore paid or payable to EVD by each respective class. For the year ended October 31, 2008, the Fund paid or accrued to EVD $1,247,302 and $1,022,533 for Class B and Class C shares, respectively, representing 0.75% of the average daily net assets of Class B and Class C shares. At October 31, 2008, the amounts of Uncovered Distribution Charges of EVD calculated under the Class B and Class C Plans were approximately $22,446,000 an d $46,405,000, respectively.
The Class B and Class C Plans also authorize the Fund to make payments of service fees to EVD, investment dealers and other persons in amounts not exceeding 0.25% per annum of its average daily net assets attributable to that class. Service fees paid or accrued are for personal services and/or the maintenance of shareholder accounts. They are separate and distinct from sales commissions and distribution fees payable to EVD and, as such, are not subject to automatic discontinuance when there are no outstanding Uncovered Distribution Charges of EVD. Service fees paid or accrued for the year ended October 31, 2008 amounted to $415,767 and $340,844 for Class B and Class C shares, respectively.
5 Contingent Deferred Sales Charges
A contingent deferred sales charge (CDSC) generally is imposed on redemptions of Class B shares made within six years of purchase and on redemptions of Class C shares made within one year of purchase. Class A shares may be subject to a 1% CDSC if redeemed within 18 months of purchase (depending on the circumstances of purchase). Generally, the CDSC is based upon the lower of the net asset value at date of redemption or date of purchase. No charge is levied on shares acquired by reinvestment of dividends or capital gain distributions. The CDSC for Class B shares is imposed at declining rates that begin at 5% in the case of redemptions in the first and second year after purchase, declining one percentage point each subsequent year. Class C shares are subject to a 1% CDSC if redeemed within one year of purchase. No CDSC is levied on shares which have been sold to EVM or its affiliates or to their respective employees or clients and may be waived under certain other limited conditions. CDSCs received on Class B and Class C redemptions are paid to EVD to reduce the amount of Uncovered Distribution Charges calculated under the Fund's Class B and Class C Plans. CDSCs received on Class B and Class C redemptions when no Uncovered Distribution Charges exist are credited to the Fund. For the year ended October 31, 2008, the Fund was informed that EVD received approximately $25,000, $256,000 and $24,000 of CDSCs paid by Class A, Class B and Class C shareholders, respectively.
6 Investment Transactions
For the year ended October 31, 2008, increases and decreases in the Fund's investment in the Portfolio aggregated $50,575,131 and $198,410,077, respectively.
7 Shares of Beneficial Interest
The Fund's Declaration of Trust permits the Trustees to issue an unlimited number of full and fractional shares of beneficial interest (without par value). Such shares may be issued in a number of different series (such as the Fund) and classes. Transactions in Fund shares were as follows:
| | | Year Ended October 31, | |
| Class A | | 2008 | | 2007 | |
| Sales | | | 6,300,125 | | | | 19,787,228 | | |
Issued to shareholders electing to
receive payments of distributions
in Fund shares | | | 2,054,963 | | | | 1,539,130 | | |
| Redemptions | | | (17,660,527 | ) | | | (16,113,233 | ) | |
| Exchange from Class B shares | | | 8,561,127 | | | | 6,230,723 | | |
| Net increase (decrease) | | | (744,312 | ) | | | 11,443,848 | | |
12
Eaton Vance High Income Opportunities Fund as of October 31, 2008
NOTES TO FINANCIAL STATEMENTS CONT'D
| | | Year Ended October 31, | |
| Class B | | 2008 | | 2007 | |
| Sales | | | 1,479,960 | | | | 2,627,637 | | |
Issued to shareholders electing to
receive payments of distributions
in Fund shares | | | 1,265,884 | | | | 1,530,122 | | |
| Redemptions | | | (10,359,876 | ) | | | (13,168,211 | ) | |
| Exchange to Class A shares | | | (8,569,154 | ) | | | (6,242,616 | ) | |
| Net decrease | | | (16,183,186 | ) | | | (15,253,068 | ) | |
| | | Year Ended October 31, | |
| Class C | | 2008 | | 2007 | |
| Sales | | | 3,207,390 | | | | 5,490,216 | | |
Issued to shareholders electing to
receive payments of distributions
in Fund shares | | | 987,741 | | | | 941,950 | | |
| Redemptions | | | (8,677,278 | ) | | | (7,727,036 | ) | |
| Net decrease | | | (4,482,147 | ) | | | (1,294,870 | ) | |
For the years ended October 31, 2008 and October 31, 2007, the Fund received $3,495 and $10,279, respectively, in redemption fees.
8 Recently Issued Accounting Pronouncement
In September 2006, the Financial Accounting Standards Board issued Statement of Financial Accounting Standards No. 157, "Fair Value Measurements". FAS 157 defines fair value, establishes a framework for measuring fair value in accordance with accounting principles generally accepted in the United States of America and expands disclosure about fair value measurements. FAS 157 is effective for fiscal years beginning after November 15, 2007. As of October 31, 2008, management does not believe the adoption of FAS 157 will impact the amounts reported in the financial statements; however, additional disclosures may be required about the inputs used to develop the measurements of fair value and the effect of certain of the measurements on changes in net assets for the period.
13
Eaton Vance High Income Opportunities Fund as of October 31, 2008
REPORT OF INDEPENDENT REGISTERED PUBLIC ACCOUNTING FIRM
To the Trustees of Eaton Vance Mutual Funds Trust and Shareholders of Eaton Vance High Income Opportunities Fund:
We have audited the accompanying statement of assets and liabilities of Eaton Vance High Income Opportunities Fund ("the Fund") (formerly Eaton Vance High Income Fund) (one of the series of Eaton Vance Mutual Funds Trust) as of October 31, 2008, and the related statement of operations for the year then ended, the statements of changes in net assets for each of the two years in the period then ended, and the financial highlights for each of the five years in the period then ended. These financial statements and financial highlights are the responsibility of the Fund's management. Our responsibility is to express an opinion on these financial statements and financial highlights based on our audits.
We conducted our audits in accordance with the standards of the Public Company Accounting Oversight Board (United States). Those standards require that we plan and perform the audit to obtain reasonable assurance about whether the financial statements and financial highlights are free of material misstatement. The Fund is not required to have, nor were we engaged to perform, an audit of its internal control over financial reporting. Our audits included consideration of internal control over financial reporting as a basis for designing audit procedures that are appropriate in the circumstances, but not for the purpose of expressing an opinion on the effectiveness of the Fund's internal control over financial reporting. Accordingly, we express no such opinion. An audit also includes examining, on a test basis, evidence supporting the amounts and disclosures in the financial statements, assessing the accounting principles used and significant estimates made by management, as well as evaluating the overall financial statement presentation. We believe that our audits provide a reasonable basis for our opinion.
In our opinion, the financial statements and financial highlights referred to above present fairly, in all material respects, the financial position of Eaton Vance High Income Opportunities Fund as of October 31, 2008, the results of its operations for the year then ended, the changes in its net assets for each of the two years in the period then ended, and the financial highlights for each of the five years in the period then ended, in conformity with accounting principles generally accepted in the United States of America.
DELOITTE & TOUCHE LLP
Boston, Massachusetts
December 18, 2008
14
Eaton Vance High Income Opportunities Fund as of October 31, 2008
FEDERAL TAX INFORMATION (Unaudited)
The Form 1099-DIV you receive in January 2009 will show the tax status of all distributions paid to your account in calendar 2008. Shareholders are advised to consult their own tax adviser with respect to the tax consequences of their investment in the Fund. As required by the Internal Revenue Code regulations, shareholders must be notified within 60 days of the Fund's fiscal year end regarding the status of qualified dividend income for individuals and the dividends received deduction for corporations.
Qualified Dividend Income. The Fund designates approximately $425,559, or up to the maximum amount of such dividends allowable pursuant to the Internal Revenue Code, as qualified dividend income eligible for the reduced tax rate of 15%.
Dividends Received Deduction. Corporate shareholders are generally entitled to take the dividends received deduction on the portion of the Fund's dividend distribution that qualifies under tax law. For the Fund's fiscal 2008 ordinary income dividends, 0.44% qualifies for the corporate dividends received deduction.
15
High Income Opportunities Portfolio as of October 31, 2008
PORTFOLIO OF INVESTMENTS
| Senior Floating-Rate Interests — 9.9%(1) | |
| Security | | Principal
Amount | | Value | |
| Automotive & Auto Parts — 0.4% | |
EPD Holdings, (Goodyear Engineering Products),
Term Loan - Second Lien, 8.75%, Maturing 7/13/15 | | $ | 2,560,000 | | | $ | 1,484,800 | | |
| Ford Motor Co., Term Loan, Maturing 12/15/13(2) | | | 990,000 | | | | 550,157 | | |
| | | $ | 2,034,957 | | |
| Broadcasting — 1.0% | |
HIT Entertainment, Inc., Term Loan - Second Lien,
8.30%, Maturing 2/5/13 | | $ | 9,180,000 | | | $ | 5,003,100 | | |
| | | $ | 5,003,100 | | |
| Building Materials — 0.5% | |
Panolam Industries Holdings, Inc., Term Loan,
6.51%, Maturing 9/30/12 | | $ | 2,540,000 | | | $ | 2,184,400 | | |
| | | $ | 2,184,400 | | |
| Capital Goods — 0.1% | |
Dresser, Inc., Term Loan - Second Lien,
8.56%, Maturing 5/4/15 | | $ | 1,080,000 | | | $ | 667,800 | | |
| | | $ | 667,800 | | |
| Consumer Products — 0.2% | |
Amscan Holdings, Inc., Term Loan,
5.06%, Maturing 5/25/13 | | $ | 1,526,750 | | | $ | 1,145,062 | | |
| | | $ | 1,145,062 | | |
| Food / Beverage / Tobacco — 0.3% | |
| Dole Food Co., Inc., Term Loan, Maturing 4/12/13(2) | | $ | 202,713 | | | $ | 148,572 | | |
| Dole Food Co., Inc., Term Loan, Maturing 4/12/13(2) | | | 359,291 | | | | 263,330 | | |
| Dole Food Co., Inc., Term Loan, Maturing 4/12/13(2) | | | 1,338,613 | | | | 981,092 | | |
| | | $ | 1,392,994 | | |
| Gaming — 1.3% | |
BLB Worldwide Holdings, Term Loan - Second Lien,
7.06%, Maturing 6/30/12(5) | | $ | 5,410,000 | | | $ | 541,000 | | |
Cannery Casino Resorts, LLC, Term Loan - Second Lien,
7.06%, Maturing 5/18/14 | | | 1,580,000 | | | | 1,327,200 | | |
Great Lakes Entertainment, Term Loan,
9.00%, Maturing 8/15/12 | | | 4,485,545 | | | | 4,261,267 | | |
| | | $ | 6,129,467 | | |
| Security | | Principal
Amount | | Value | |
| Healthcare — 0.8% | |
Advanced Medical Optics, Inc., Term Loan,
4.63%, Maturing 4/2/14 | | $ | 1,368,889 | | | $ | 995,867 | | |
Community Health Systems, Inc., Term Loan,
0.00%, Maturing 7/25/14(3) | | | 66,657 | | | | 54,384 | | |
Community Health Systems, Inc., Term Loan,
5.06%, Maturing 7/25/14 | | | 1,303,343 | | | | 1,063,365 | | |
Community Health Systems, Inc., Term Loan,
Maturing 7/25/14(2) | | | 875,237 | | | | 687,941 | | |
Community Health Systems, Inc., Term Loan,
Maturing 7/25/14(2) | | | 44,763 | | | | 35,184 | | |
| HCA, Inc., Term Loan, Maturing 11/18/13(2) | | | 1,410,000 | | | | 1,167,128 | | |
| | | $ | 4,003,869 | | |
| Homebuilders / Real Estate — 1.4% | |
Realogy Corp., Term Loan,
6.50%, Maturing 10/10/13 | | $ | 578,539 | | | $ | 265,376 | | |
| Realogy Corp., Term Loan, 6.50%, Maturing 9/1/14 | | | 1,634,652 | | | | 996,851 | | |
| Realogy Corp., Term Loan, 6.50%, Maturing 9/1/14 | | | 6,071,564 | | | | 3,702,588 | | |
| Realogy Corp., Term Loan, Maturing 10/10/13(2) | | | 580,000 | | | | 479,950 | | |
| Realogy Corp., Term Loan, Maturing 9/1/14(2) | | | 289,558 | | | | 241,057 | | |
| Realogy Corp., Term Loan, Maturing 9/1/14(2) | | | 1,075,501 | | | | 895,354 | | |
| | | $ | 6,581,176 | | |
| Leisure — 0.4% | |
HRP Myrtle Beach Operations, LLC/HRP Myrtle
Beach Capital Corp., (PIK), DIP Loan, 18.72%,
Maturing 10/31/08(5)(6) | | $ | 56,273 | | | $ | 56,273 | | |
Universal City Development Partners, Ltd., Term Loan,
Maturing 6/9/11(2) | | | 2,260,000 | | | | 1,943,600 | | |
| | | $ | 1,999,873 | | |
| Services — 1.9% | |
| Adesa, Inc., Term Loan, 6.02%, Maturing 10/18/13 | | $ | 5,187,556 | | | $ | 3,454,046 | | |
Catalina Marketing Corp., Term Loan,
9.28%, Maturing 11/1/08 | | | 2,965,000 | | | | 2,624,025 | | |
Neff Rental, Inc., Term Loan - Second Lien,
6.40%, Maturing 5/31/13 | | | 1,310,000 | | | | 532,188 | | |
Rental Service Corp., Term Loan - Second Lien,
7.71%, Maturing 11/30/13 | | | 1,854,309 | | | | 1,166,186 | | |
Rental Service Corp., Term Loan - Second Lien,
Maturing 11/30/13(2) | | | 940,000 | | | | 559,300 | | |
| West Corp., Term Loan, Maturing 10/24/13(2) | | | 960,000 | | | | 621,600 | | |
| | | $ | 8,957,345 | | |
See notes to financial statements
16
High Income Opportunities Portfolio as of October 31, 2008
PORTFOLIO OF INVESTMENTS CONT'D
| Security | | Principal
Amount | | Value | |
| Super Retail — 0.8% | |
General Nutrition Centers, Inc., Term Loan,
6.01%, Maturing 9/16/13 | | $ | 1,831,058 | | | $ | 1,353,599 | | |
General Nutrition Centers, Inc., Term Loan,
Maturing 9/16/13(2) | | | 1,940,000 | | | | 1,261,000 | | |
| Sally Holdings, LLC, Term Loan, Maturing 11/16/13(2) | | | 1,220,000 | | | | 957,264 | | |
| | | $ | 3,571,863 | | |
| Telecommunications — 0.3% | |
Level 3 Communications, Inc., Term Loan,
7.00%, Maturing 3/13/14 | | $ | 1,990,000 | | | $ | 1,487,525 | | |
| | | $ | 1,487,525 | | |
| Transportation Ex Air / Rail — 0.1% | |
| CEVA Group, PLC, Term Loan, Maturing 8/2/15(2) | | $ | 249,910 | | | $ | 161,192 | | |
| CEVA Group, PLC, Term Loan, Maturing 8/2/15(2) | | | 752,661 | | | | 485,466 | | |
| | | $ | 646,658 | | |
| Utilities — 0.4% | |
Texas Competitive Electric Holdings Co., LLC,
Term Loan, 6.30%, Maturing 10/10/14 | | $ | 2,188,945 | | | $ | 1,717,105 | | |
| | | $ | 1,717,105 | | |
Total Senior Floating-Rate Interests
(identified cost $66,867,905) | | | | | | $ | 47,523,194 | | |
| Corporate Bonds & Notes — 86.4% | |
| Security | | Principal
Amount
(000's omitted) | | Value | |
| Aerospace — 0.6% | |
Alion Science and Technologies Corp.,
10.25%, 2/1/15 | | $ | 1,625 | | | $ | 901,875 | | |
| Hawker Beechcraft Acquisition, 9.75%, 4/1/17 | | | 2,030 | | | | 1,146,950 | | |
Vought Aircraft Industries, Inc., Sr. Notes,
8.00%, 7/15/11 | | | 1,085 | | | | 819,175 | | |
| | | $ | 2,868,000 | | |
| Air Transportation — 0.2% | |
| Continental Airlines, 7.033%, 6/15/11 | | $ | 1,110 | | | $ | 754,880 | | |
| | | $ | 754,880 | | |
| Security | | Principal
Amount
(000's omitted) | | Value | |
| Automotive & Auto Parts — 3.6% | |
| Allison Transmission, Inc., 11.00%, 11/1/15(4) | | $ | 2,030 | | | $ | 1,278,900 | | |
| Altra Industrial Motion, Inc., 9.00%, 12/1/11 | | | 3,965 | | | | 3,588,325 | | |
American Axle & Manufacturing, Inc.,
7.875%, 3/1/17 | | | 1,620 | | | | 510,300 | | |
Commercial Vehicle Group, Inc., Sr. Notes,
8.00%, 7/1/13 | | | 1,230 | | | | 793,350 | | |
| Ford Motor Credit Co., Sr. Notes, 5.70%, 1/15/10 | | | 910 | | | | 675,660 | | |
| Ford Motor Credit Co., Sr. Notes, 7.80%, 6/1/12 | | | 995 | | | | 581,441 | | |
| Ford Motor Credit Co., Sr. Notes, 7.875%, 6/15/10 | | | 5,400 | | | | 3,629,351 | | |
| Ford Motor Credit Co., Sr. Notes, 9.875%, 8/10/11 | | | 190 | | | | 119,795 | | |
| Ford Motor Credit Co., Sr. Notes, 12.00%, 5/15/15 | | | 6,080 | | | | 3,865,032 | | |
General Motors Acceptance Corp., Variable Rate,
4.054%, 5/15/09 | | | 955 | | | | 832,302 | | |
| General Motors Corp., Sr. Notes, 7.20%, 1/15/11 | | | 880 | | | | 358,600 | | |
United Components, Inc., Sr. Sub. Notes,
9.375%, 6/15/13 | | | 1,670 | | | | 1,043,750 | | |
| | | $ | 17,276,806 | | |
| Broadcasting — 0.5% | |
Rainbow National Services, LLC, Sr. Sub. Debs.,
10.375%, 9/1/14(4) | | $ | 1,675 | | | $ | 1,465,625 | | |
XM Satellite Radio Holdings, Inc., Sr. Notes,
13.00%, 8/1/13(4) | | | 2,515 | | | | 968,275 | | |
| | | $ | 2,433,900 | | |
| Building Materials — 1.9% | |
| Interface, Inc., Sr. Sub. Notes, 9.50%, 2/1/14 | | $ | 745 | | | $ | 659,325 | | |
Interline Brands, Inc., Sr. Sub. Notes,
8.125%, 6/15/14 | | | 1,310 | | | | 1,015,250 | | |
| Nortek, Inc., Sr. Sub. Notes, 10.00%, 12/1/13 | | | 2,955 | | | | 2,186,700 | | |
Panolam Industries International, Sr. Sub. Notes,
10.75%, 10/1/13 | | | 5,230 | | | | 3,164,150 | | |
Ply Gem Industries, Inc., Sr. Notes,
11.75%, 6/15/13(4) | | | 3,030 | | | | 2,014,950 | | |
| | | $ | 9,040,375 | | |
| Cable / Satellite TV — 2.5% | |
Cablevision Systems Corp., Sr. Notes, Series B,
8.00%, 4/15/12 | | $ | 270 | | | $ | 228,487 | | |
| CCH I Holdings, LLC, Sr. Notes, 11.00%, 10/1/15 | | | 535 | | | | 224,700 | | |
| CCH II Holdings, LLC, Sr. Notes, 10.25%, 10/1/13 | | | 585 | | | | 368,550 | | |
| CCH II Holdings, LLC, Sr. Notes, 10.25%, 10/1/13(4) | | | 445 | | | | 271,450 | | |
CCO Holdings, LLC/CCO Capital Corp., Sr. Notes,
8.75%, 11/15/13 | | | 5,240 | | | | 3,484,600 | | |
See notes to financial statements
17
High Income Opportunities Portfolio as of October 31, 2008
PORTFOLIO OF INVESTMENTS CONT'D
| Security | | Principal
Amount
(000's omitted) | | Value | |
| Cable / Satellite TV (continued) | |
Charter Communications, Inc., Sr. Notes,
10.875%, 9/15/14(4) | | $ | 2,340 | | | $ | 1,912,950 | | |
CSC Holdings, Inc., Sr. Notes, Series B,
8.125%, 8/15/09 | | | 510 | | | | 489,600 | | |
| Kabel Deutschland GmbH, 10.625%, 7/1/14 | | | 3,065 | | | | 2,589,925 | | |
Mediacom Broadband Group, Sr. Notes,
8.50%, 10/15/15 | | | 1,070 | | | | 797,150 | | |
| National Cable PLC, 8.75%, 4/15/14 | | | 455 | | | | 320,775 | | |
| National Cable PLC, Sr. Notes, 9.125%, 8/15/16 | | | 1,865 | | | | 1,240,225 | | |
| | | $ | 11,928,412 | | |
| Capital Goods — 1.8% | |
| American Railcar Industry, Sr. Notes, 7.50%, 3/1/14 | | $ | 1,620 | | | $ | 1,287,900 | | |
Chart Industries, Inc., Sr. Sub. Notes,
9.125%, 10/15/15 | | | 2,370 | | | | 1,978,950 | | |
| ESCO Corp., Sr. Notes, 8.625%, 12/15/13(4) | | | 1,720 | | | | 1,384,600 | | |
ESCO Corp., Sr. Notes, Variable Rate,
6.694%, 12/15/13(4) | | | 1,720 | | | | 1,315,800 | | |
| RBS Global & Rexnord Corp., 9.50%, 8/1/14 | | | 2,105 | | | | 1,462,975 | | |
| RBS Global & Rexnord Corp., 11.75%, 8/1/16 | | | 1,870 | | | | 1,234,200 | | |
| | | $ | 8,664,425 | | |
| Chemicals — 2.0% | |
| CII Carbon, LLC, 11.125%, 11/15/15(4) | | $ | 1,665 | | | $ | 1,540,125 | | |
INEOS Group Holdings PLC, Sr. Notes,
8.50%, 2/15/16(4) | | | 4,115 | | | | 1,543,125 | | |
Nova Chemicals Corp., Sr. Notes, Variable Rate,
5.953%, 11/15/13 | | | 2,325 | | | | 1,569,375 | | |
Reichhold Industries, Inc., Sr. Notes,
9.00%, 8/15/14(4) | | | 5,520 | | | | 4,830,000 | | |
| | | $ | 9,482,625 | | |
| Consumer Products — 0.8% | |
| Amscan Holdings, Inc., Sr. Sub. Notes, 8.75%, 5/1/14 | | $ | 5,705 | | | $ | 3,736,775 | | |
| | | $ | 3,736,775 | | |
| Containers — 1.6% | |
Intertape Polymer US, Inc., Sr. Sub. Notes,
8.50%, 8/1/14 | | $ | 3,855 | | | $ | 3,103,275 | | |
| Pliant Corp. (PIK), 11.625%, 6/15/09 | | | 6,438 | | | | 4,510,500 | | |
| Solo Cup Co., 8.50%, 2/15/14 | | | 285 | | | | 192,375 | | |
| | | $ | 7,806,150 | | |
| Security | | Principal
Amount
(000's omitted) | | Value | |
| Diversified Financial Services — 0.4% | |
| Alliant Holdings I, Inc., 11.00%, 5/1/15(4) | | $ | 1,795 | | | $ | 1,462,925 | | |
Nuveen Investments, Inc., Sr. Notes,
10.50%, 11/15/15(4) | | | 2,090 | | | | 574,750 | | |
| | | $ | 2,037,675 | | |
| Diversified Media — 2.0% | |
| Affinion Group, Inc., 10.125%, 10/15/13 | | $ | 1,125 | | | $ | 793,125 | | |
| Affinion Group, Inc., 11.50%, 10/15/15 | | | 2,490 | | | | 1,506,450 | | |
LBI Media, Inc., Sr. Disc. Notes,
11.00%, 10/15/13 | | | 2,760 | | | | 1,531,800 | | |
| Nielsen Finance, LLC, 10.00%, 8/1/14 | | | 6,870 | | | | 5,015,100 | | |
Nielsen Finance, LLC, 12.50%,
(0% until 2011) 8/1/16 | | | 1,795 | | | | 700,050 | | |
| | | $ | 9,546,525 | | |
| Energy — 9.9% | |
| Allis-Chalmers Energy, Inc., Sr. Notes, 9.00%, 1/15/14 | | $ | 3,570 | | | $ | 2,338,350 | | |
| Cimarex Energy Co., Sr. Notes, 7.125%, 5/1/17 | | | 1,375 | | | | 1,106,875 | | |
| Clayton Williams Energy, Inc., 7.75%, 8/1/13 | | | 2,600 | | | | 1,612,000 | | |
| Compton Pet Finance Corp., 7.625%, 12/1/13 | | | 2,545 | | | | 1,488,825 | | |
| El Paso Corp., Sr. Notes, 9.625%, 5/15/12 | | | 2,880 | | | | 2,624,596 | | |
Encore Acquisition Co., Sr. Sub. Notes,
7.25%, 12/1/17 | | | 1,870 | | | | 1,238,875 | | |
| Forbes Energy Services, Sr. Notes, 11.00%, 2/15/15 | | | 4,040 | | | | 2,828,000 | | |
| OPTI Canada, Inc., 7.875%, 12/15/14 | | | 1,915 | | | | 1,158,575 | | |
| OPTI Canada, Inc., 8.25%, 12/15/14 | | | 2,135 | | | | 1,281,000 | | |
| Petrohawk Energy Corp., 9.125%, 7/15/13 | | | 7,700 | | | | 5,967,500 | | |
Petrohawk Energy Corp., Sr. Notes,
7.875%, 6/1/15(4) | | | 225 | | | | 153,562 | | |
Petroleum Development Corp., Sr. Notes,
12.00%, 2/15/18 | | | 1,570 | | | | 1,216,750 | | |
| Petroplus Finance, Ltd., 6.75%, 5/1/14(4) | | | 200 | | | | 135,000 | | |
| Petroplus Finance, Ltd., 7.00%, 5/1/17(4) | | | 4,735 | | | | 3,125,100 | | |
| Plains Exploration & Production Co., 7.00%, 3/15/17 | | | 2,050 | | | | 1,353,000 | | |
| Quicksilver Resources, Inc., 7.125%, 4/1/16 | | | 3,415 | | | | 2,202,675 | | |
| Quicksilver Resources, Inc., 8.25%, 8/1/15 | | | 290 | | | | 203,000 | | |
| SandRidge Energy, Inc., Sr. Notes, 8.00%, 6/1/18(4) | | | 3,730 | | | | 2,499,100 | | |
SandRidge Energy, Inc., Sr. Notes (PIK),
8.625%, 4/1/15 | | | 4,240 | | | | 2,819,600 | | |
| SemGroup L.P., Sr. Notes, 8.75%, 11/15/15(4)(5) | | | 6,330 | | | | 411,450 | | |
| SESI, LLC, 6.875%, 6/1/14 | | | 700 | | | | 591,500 | | |
Stewart & Stevenson, LLC, Sr. Notes,
10.00%, 7/15/14 | | | 5,410 | | | | 4,084,550 | | |
See notes to financial statements
18
High Income Opportunities Portfolio as of October 31, 2008
PORTFOLIO OF INVESTMENTS CONT'D
| Security | | Principal
Amount
(000's omitted) | | Value | |
| Energy (continued) | |
| United Refining Co., Sr. Notes, 10.50%, 8/15/12 | | $ | 9,420 | | | $ | 6,688,200 | | |
| VeraSun Energy Corp., 9.875%, 12/15/12(5) | | | 1,240 | | | | 514,600 | | |
| | | $ | 47,642,683 | | |
| Entertainment / Film — 1.5% | |
| AMC Entertainment, Inc., 11.00%, 2/1/16 | | $ | 8,890 | | | $ | 7,067,550 | | |
| | | $ | 7,067,550 | | |
| Environmental — 0.8% | |
| Waste Services, Inc., Sr. Sub. Notes, 9.50%, 4/15/14 | | $ | 4,915 | | | $ | 3,956,575 | | |
| | | $ | 3,956,575 | | |
| Food & Drug Retail — 0.8% | |
| Rite Aid Corp., 7.50%, 3/1/17 | | $ | 5,515 | | | $ | 3,502,025 | | |
| Rite Aid Corp., 10.375%, 7/15/16 | | | 530 | | | | 371,000 | | |
| | | $ | 3,873,025 | | |
| Food / Beverage / Tobacco — 2.9% | |
ASG Consolidated, LLC/ASG Finance, Inc.,
Sr. Disc. Notes, 11.50%, (0% until 2008), 11/1/11 | | $ | 6,585 | | | $ | 5,728,950 | | |
| Dole Foods Co., Sr. Notes, 8.625%, 5/1/09 | | | 9,161 | | | | 8,290,705 | | |
| | | $ | 14,019,655 | | |
| Gaming — 8.6% | |
Buffalo Thunder Development Authority,
9.375%, 12/15/14(4) | | $ | 5,755 | | | $ | 2,043,025 | | |
| CCM Merger, Inc., 8.00%, 8/1/13(4) | | | 3,635 | | | | 2,162,825 | | |
Chukchansi EDA, Sr. Notes, Variable Rate,
6.328%, 11/15/12(4) | | | 595 | | | | 318,325 | | |
| Eldorado Casino Shreveport (PIK), 10.00%, 8/1/12 | | | 705 | | | | 623,491 | | |
Fontainebleau Las Vegas Casino, LLC,
10.25%, 6/15/15(4) | | | 9,480 | | | | 1,327,200 | | |
| Galaxy Entertainment Finance, 9.875%, 12/15/12(4) | | | 1,755 | | | | 675,675 | | |
Greektown Holdings, LLC, Sr. Notes,
10.75%, 12/1/13(4)(5) | | | 1,180 | | | | 259,600 | | |
Indianapolis Downs, LLC & Capital Corp., Sr. Notes,
11.00%, 11/1/12(4) | | | 2,880 | | | | 1,454,400 | | |
Inn of the Mountain Gods, Sr. Notes,
12.00%, 11/15/10 | | | 3,615 | | | | 1,608,675 | | |
| Majestic HoldCo, LLC, 12.50%, 10/15/11(4) | | | 1,620 | | | | 10,125 | | |
| Mandalay Resort Group, 6.50%, 7/31/09 | | | 2,015 | | | | 1,843,725 | | |
| Security | | Principal
Amount
(000's omitted) | | Value | |
| Gaming (continued) | |
Mohegan Tribal Gaming Authority, Sr. Sub. Notes,
6.875%, 2/15/15 | | $ | 2,930 | | | $ | 1,714,050 | | |
Mohegan Tribal Gaming Authority, Sr. Sub. Notes,
7.125%, 8/15/14 | | | 2,760 | | | | 1,669,800 | | |
Mohegan Tribal Gaming Authority, Sr. Sub. Notes,
8.00%, 4/1/12 | | | 1,060 | | | | 784,400 | | |
| OED Corp./Diamond Jo, LLC, 8.75%, 4/15/12 | | | 5,725 | | | | 3,993,187 | | |
| Park Place Entertainment, 7.875%, 3/15/10 | | | 8,215 | | | | 4,682,550 | | |
Pinnacle Entertainment, Inc., Sr. Sub. Notes,
7.50%, 6/15/15 | | | 2,795 | | | | 1,760,850 | | |
Pinnacle Entertainment, Inc., Sr. Sub. Notes,
8.25%, 3/15/12 | | | 310 | | | | 216,225 | | |
Pokagon Gaming Authority, Sr. Notes,
10.375%, 6/15/14(4) | | | 1,184 | | | | 1,083,360 | | |
| San Pasqual Casino, 8.00%, 9/15/13(4) | | | 1,335 | | | | 1,034,625 | | |
| Scientific Games Corp., 7.875%, 6/15/16(4) | | | 725 | | | | 558,250 | | |
Seminole Hard Rock Entertainment, Variable Rate,
5.319%, 3/15/14(4) | | | 2,190 | | | | 1,456,350 | | |
| Trump Entertainment Resorts, Inc., 8.50%, 6/1/15 | | | 510 | | | | 133,875 | | |
Tunica-Biloxi Gaming Authority, Sr. Notes,
9.00%, 11/15/15(4) | | | 3,605 | | | | 3,163,387 | | |
Waterford Gaming, LLC, Sr. Notes,
8.625%, 9/15/14(4) | | | 5,530 | | | | 3,896,495 | | |
| Wynn Las Vegas, LLC, 6.625%, 12/1/14 | | | 3,725 | | | | 2,765,812 | | |
| | | $ | 41,240,282 | | |
| Healthcare — 6.0% | |
| Accellent, Inc., 10.50%, 12/1/13 | | $ | 2,465 | | | $ | 1,836,425 | | |
AMR HoldCo, Inc./EmCare HoldCo, Inc.,
Sr. Sub. Notes, 10.00%, 2/15/15 | | | 4,860 | | | | 4,689,900 | | |
| Biomet, Inc., 11.625%, 10/15/17 | | | 5,775 | | | | 5,053,125 | | |
DJO Finance, LLC/DJO Finance Corp.,
10.875%, 11/15/14 | | | 2,050 | | | | 1,660,500 | | |
| HCA, Inc., 7.875%, 2/1/11 | | | 344 | | | | 288,960 | | |
| HCA, Inc., 9.125%, 11/15/14 | | | 253 | | | | 218,213 | | |
| MultiPlan, Inc., Sr. Sub. Notes, 10.375%, 4/15/16(4) | | | 5,535 | | | | 5,119,875 | | |
| National Mentor Holdings, Inc., 11.25%, 7/1/14 | | | 3,960 | | | | 3,663,000 | | |
| Res-Care, Inc., Sr. Notes, 7.75%, 10/15/13 | | | 2,370 | | | | 2,144,850 | | |
| US Oncology, Inc., 9.00%, 8/15/12 | | | 2,665 | | | | 2,225,275 | | |
| US Oncology, Inc., 10.75%, 8/15/14 | | | 2,675 | | | | 2,099,875 | | |
| | | $ | 28,999,998 | | |
| Hotels — 0.4% | |
| Host Hotels and Resorts, LP, Sr. Notes, 6.75%, 6/1/16 | | $ | 2,390 | | | $ | 1,744,700 | | |
| | | $ | 1,744,700 | | |
See notes to financial statements
19
High Income Opportunities Portfolio as of October 31, 2008
PORTFOLIO OF INVESTMENTS CONT'D
| Security | | Principal
Amount
(000's omitted) | | Value | |
| Insurance — 0.3% | |
HUB International Holdings, Sr. Notes,
9.00%, 12/15/14(4) | | $ | 670 | | | $ | 505,850 | | |
U.S.I. Holdings Corp., Sr. Notes, Variable Rate,
6.679%, 11/15/14(4) | | | 1,200 | | | | 763,500 | | |
| | | $ | 1,269,350 | | |
| Leisure — 1.9% | |
HRP Myrtle Beach Capital Corp., Sr. Notes, (PIK),
14.50%, 4/1/14(4)(5) | | $ | 3,274 | | | $ | 24,551 | | |
HRP Myrtle Beach Operations, LLC/HRP Myrtle Beach
Capital Corp., 12.50%, 4/1/13(4)(5) | | | 2,315 | | | | 463,000 | | |
HRP Myrtle Beach Operations, LLC/HRP Myrtle Beach
Capital Corp., Variable Rate, 0.00%, 4/1/12(4)(5) | | | 3,985 | | | | 1,803,213 | | |
| Royal Caribbean Cruises, Sr. Notes, 6.875%, 12/1/13 | | | 198 | | | | 133,313 | | |
| Royal Caribbean Cruises, Sr. Notes, 7.00%, 6/15/13 | | | 1,090 | | | | 763,000 | | |
| Royal Caribbean Cruises, Sr. Notes, 7.25%, 6/15/16 | | | 280 | | | | 180,600 | | |
| Royal Caribbean Cruises, Sr. Notes, 7.25%, 3/15/18 | | | 560 | | | | 361,200 | | |
Universal City Florida Holding, Sr. Notes,
8.375%, 5/1/10 | | | 210 | | | | 156,450 | | |
Universal City Florida Holdings, Sr. Notes,
Variable Rate, 7.551%, 5/1/10 | | | 7,080 | | | | 5,274,600 | | |
| | | $ | 9,159,927 | | |
| Metals / Mining — 1.5% | |
| Aleris International, Inc., Sr. Notes, 9.00%, 12/15/14 | | $ | 5,270 | | | $ | 1,844,500 | | |
| FMG Finance PTY, Ltd., 10.625%, 9/1/16(4) | | | 5,820 | | | | 4,015,800 | | |
Freeport-McMoran Copper & Gold, Sr. Notes,
8.375%, 4/1/17 | | | 1,450 | | | | 1,139,825 | | |
| | | $ | 7,000,125 | | |
| Paper — 2.4% | |
| Jefferson Smurfit Corp., Sr. Notes, 7.50%, 6/1/13 | | $ | 887 | | | $ | 447,935 | | |
| Jefferson Smurfit Corp., Sr. Notes, 8.25%, 10/1/12 | | | 2,710 | | | | 1,395,650 | | |
| NewPage Corp., 10.00%, 5/1/12 | | | 3,140 | | | | 2,150,900 | | |
| NewPage Corp., 12.00%, 5/1/13 | | | 4,130 | | | | 2,457,350 | | |
| NewPage Corp., Variable Rate, 9.051%, 5/1/12 | | | 1,655 | | | | 1,166,775 | | |
Smurfit-Stone Container Enterprises, Inc., Sr. Notes,
8.00%, 3/15/17 | | | 5,170 | | | | 2,559,150 | | |
| Stone Container Corp., Sr. Notes, 8.375%, 7/1/12 | | | 1,105 | | | | 569,075 | | |
Verso Paper Holdings, LLC/Verso Paper, Inc.,
11.375%, 8/1/16 | | | 2,170 | | | | 878,850 | | |
| | | $ | 11,625,685 | | |
| Security | | Principal
Amount
(000's omitted) | | Value | |
| Publishing / Printing — 0.7% | |
Dex Media West/Finance, Series B,
9.875%, 8/15/13 | | $ | 1,835 | | | $ | 692,713 | | |
| Harland Clarke Holdings, 9.50%, 5/15/15 | | | 975 | | | | 472,875 | | |
Reader's Digest Association, Inc. (The), Sr. Sub. Notes,
9.00%, 2/15/17 | | | 7,230 | | | | 2,078,625 | | |
Windstream Regatta Holdings, Inc., Sr. Sub. Notes,
11.00%, 12/1/17(4) | | | 695 | | | | 330,125 | | |
| | | $ | 3,574,338 | | |
| Railroad — 0.7% | |
Kansas City Southern Mexico, Sr. Notes,
7.375%, 6/1/14 | | $ | 1,150 | | | $ | 905,625 | | |
Kansas City Southern Mexico, Sr. Notes,
7.625%, 12/1/13 | | | 650 | | | | 511,875 | | |
Kansas City Southern Mexico, Sr. Notes,
8.00%, 6/1/15 | | | 2,390 | | | | 1,977,725 | | |
| | | $ | 3,395,225 | | |
| Restaurants — 1.3% | |
| El Pollo Loco, Inc., 11.75%, 11/15/13 | | $ | 4,315 | | | $ | 3,559,875 | | |
| NPC International, Inc., 9.50%, 5/1/14 | | | 4,665 | | | | 2,915,625 | | |
| | | $ | 6,475,500 | | |
| Services — 7.5% | |
| Aramark Services, Inc., 8.50%, 2/1/15 | | $ | 1,425 | | | $ | 1,225,500 | | |
Education Management, LLC, Sr. Notes,
8.75%, 6/1/14 | | | 4,175 | | | | 3,068,625 | | |
Education Management, LLC, Sr. Sub. Notes,
10.25%, 6/1/16 | | | 6,650 | | | | 4,621,750 | | |
| Hertz Corp., 8.875%, 1/1/14 | | | 295 | | | | 216,825 | | |
| Hertz Corp., 10.50%, 1/1/16 | | | 3,655 | | | | 2,275,238 | | |
| Laureate Education, Inc., 10.00%, 8/15/15(4) | | | 4,915 | | | | 3,563,375 | | |
| Laureate Education, Inc., 11.75%, 8/15/17(4) | | | 3,930 | | | | 2,613,450 | | |
| Laureate Education, Inc. (PIK), 10.25%, 8/15/15(4) | | | 6,981 | | | | 4,757,256 | | |
MediMedia USA, Inc., Sr. Sub. Notes,
11.375%, 11/15/14(4) | | | 2,575 | | | | 2,072,875 | | |
Muzak, LLC/Muzak Finance, Sr. Notes,
10.00%, 2/15/09 | | | 2,640 | | | | 1,953,600 | | |
| Rental Service Corp., 9.50%, 12/1/14 | | | 4,970 | | | | 3,006,850 | | |
| Ticketmaster, Sr. Notes, 10.75%, 8/1/16(4) | | | 2,340 | | | | 1,977,300 | | |
| Travelport, LLC, 9.875%, 9/1/14 | | | 4,355 | | | | 2,090,400 | | |
| Travelport, LLC, 11.875%, 9/1/16 | | | 537 | | | | 217,485 | | |
| West Corp., 9.50%, 10/15/14 | | | 4,480 | | | | 2,464,000 | | |
| | | $ | 36,124,529 | | |
See notes to financial statements
20
High Income Opportunities Portfolio as of October 31, 2008
PORTFOLIO OF INVESTMENTS CONT'D
| Security | | Principal
Amount
(000's omitted) | | Value | |
| Steel — 0.7% | |
| RathGibson, Inc., 11.25%, 2/15/14 | | $ | 5,225 | | | $ | 3,553,000 | | |
| | | $ | 3,553,000 | | |
| Super Retail — 5.3% | |
General Nutrition Center, Sr. Notes, Variable Rate (PIK),
7.584%, 3/15/14 | | $ | 5,590 | | | $ | 3,493,750 | | |
General Nutrition Center, Sr. Sub. Notes,
10.75%, 3/15/15 | | | 4,220 | | | | 2,637,500 | | |
| Neiman Marcus Group, Inc., 9.00%, 10/15/15 | | | 4,915 | | | | 3,391,350 | | |
| Neiman Marcus Group, Inc., 10.375%, 10/15/15 | | | 11,040 | | | | 7,396,800 | | |
| Sally Holdings, LLC, 9.25%, 11/15/14 | | | 1,130 | | | | 909,650 | | |
| Sally Holdings, LLC, Sr. Notes, 10.50%, 11/15/16 | | | 3,235 | | | | 2,377,725 | | |
| Toys "R" Us, 7.375%, 10/15/18 | | | 1,525 | | | | 800,625 | | |
| Yankee Acquisition Corp., Series B, 8.50%, 2/15/15 | | | 7,386 | | | | 4,210,020 | | |
| | | $ | 25,217,420 | | |
| Technology — 3.9% | |
| Amkor Technologies, Inc., Sr. Notes, 7.125%, 3/15/11 | | $ | 475 | | | $ | 350,906 | | |
| Amkor Technologies, Inc., Sr. Notes, 7.75%, 5/15/13 | | | 475 | | | | 296,281 | | |
| Amkor Technologies, Inc., Sr. Notes, 9.25%, 6/1/16 | | | 2,455 | | | | 1,473,000 | | |
| Avago Technologies Finance, 10.125%, 12/1/13 | | | 1,480 | | | | 1,250,600 | | |
| Avago Technologies Finance, 11.875%, 12/1/15 | | | 2,860 | | | | 2,330,900 | | |
| Ceridian Corp., Sr. Notes, 11.25%, 11/15/15(4) | | | 4,830 | | | | 3,018,750 | | |
| First Data Corp., 9.875%, 9/24/15 | | | 2,370 | | | | 1,528,650 | | |
| Nortel Networks, Ltd., 10.75%, 7/15/16(4) | | | 5,490 | | | | 2,923,425 | | |
SunGard Data Systems, Inc., Sr. Notes,
10.625%, 5/15/15(4) | | | 6,375 | | | | 5,418,750 | | |
| | | $ | 18,591,262 | | |
| Telecommunications — 6.8% | |
| Digicel Group, Ltd., Sr. Notes, 8.875%, 1/15/15(4) | | $ | 600 | | | $ | 339,000 | | |
| Digicel Group, Ltd., Sr. Notes, 9.125%, 1/15/15(4) | | | 9,212 | | | | 5,204,780 | | |
| Digicel Group, Ltd., Sr. Notes, 9.25%, 9/1/12(4) | | | 3,795 | | | | 2,979,075 | | |
| Intelsat Bermuda, Ltd., 11.25%, 6/15/16 | | | 6,370 | | | | 5,478,200 | | |
| Intelsat Corp., 9.25%, 8/15/14(4) | | | 3,750 | | | | 3,243,750 | | |
| Intelsat Jackson Holdings, Ltd., 9.50%, 6/15/16(4) | | | 4,003 | | | | 3,372,528 | | |
Intelsat Subsidiary Holdings Co., Ltd.,
8.50%, 1/15/13(4) | | | 4,020 | | | | 3,517,500 | | |
| Sprint Capital Corp., 6.875%, 11/15/28 | | | 855 | | | | 501,181 | | |
Telesat Canada/Telesat LLC, Sr. Notes,
11.00%, 11/1/15(4) | | | 9,090 | | | | 5,499,450 | | |
Telesat Canada/Telesat LLC, Sr. Notes,
12.50%, 11/1/17(4) | | | 4,060 | | | | 2,537,500 | | |
| | | $ | 32,672,964 | | |
| Security | | Principal
Amount
(000's omitted) | | Value | |
| Textiles / Apparel — 3.0% | |
| Levi Strauss & Co., Sr. Notes, 8.875%, 4/1/16 | | $ | 145 | | | $ | 95,700 | | |
| Levi Strauss & Co., Sr. Notes, 9.75%, 1/15/15 | | | 1,335 | | | | 941,175 | | |
| Oxford Industries, Inc., Sr. Notes, 8.875%, 6/1/11 | | | 9,300 | | | | 7,672,500 | | |
Perry Ellis International, Inc., Sr. Sub. Notes,
8.875%, 9/15/13 | | | 5,710 | | | | 4,425,250 | | |
| Quiksilver, Inc., 6.875%, 4/15/15 | | | 2,700 | | | | 1,309,500 | | |
| | | $ | 14,444,125 | | |
| Transportation Ex Air / Rail — 0.6% | |
| CEVA Group, PLC, Sr. Notes, 10.00%, 9/1/14(4) | | $ | 3,825 | | | $ | 2,773,125 | | |
| | | $ | 2,773,125 | | |
| Utilities — 1.0% | |
| AES Eastern Energy, Series 99-A, 9.00%, 1/2/17 | | $ | 2,223 | | | $ | 2,000,369 | | |
| Dynegy Holdings, Inc., Sr. Notes, 7.75%, 6/1/19 | | | 570 | | | | 384,750 | | |
| Edison Mission Energy, Sr. Notes, 7.50%, 6/15/13 | | | 75 | | | | 63,563 | | |
| NGC Corp., 7.625%, 10/15/26 | | | 3,205 | | | | 1,458,275 | | |
| NRG Energy, Inc., 7.25%, 2/1/14 | | | 430 | | | | 377,325 | | |
| Reliant Energy, Inc., Sr. Notes, 7.625%, 6/15/14 | | | 370 | | | | 286,750 | | |
| | | $ | 4,571,032 | | |
Total Corporate Bonds & Notes
(identified cost $611,763,354) | | | | | | $ | 414,568,623 | | |
| Common Stocks — 1.4% | |
| Security | | Shares | | Value | |
| Chemicals — 0.0% | |
| Texas Petrochemicals, Inc.(7) | | | 7,851 | | | $ | 113,840 | | |
| | | $ | 113,840 | | |
| Energy — 0.6% | |
| Petroplus Holdings AG(7) | | | 100,000 | | | $ | 2,647,236 | | |
| | | $ | 2,647,236 | | |
| Gaming — 0.3% | |
| Fontainebleau Equity Holdings, Class A(6)(8) | | | 148,726 | | | $ | 1,264,171 | | |
| Shreveport Gaming Holdings, Inc.(6)(7) | | | 4,858 | | | | 79,671 | | |
| | | $ | 1,343,842 | | |
See notes to financial statements
21
High Income Opportunities Portfolio as of October 31, 2008
PORTFOLIO OF INVESTMENTS CONT'D
| Security | | Shares | | Value | |
| Leisure — 0.0% | |
| HRP, Class B(4)(6)(7) | | | 2,375 | | | $ | 0 | | |
| | | $ | 0 | | |
| Super Retail — 0.5% | |
| GameStop Corp., Class A(7) | | | 76,467 | | | $ | 2,094,431 | | |
| GNC Acquisition Holdings, Class A(6)(8) | | | 108,818 | | | | 462,477 | | |
| | | $ | 2,556,908 | | |
Total Common Stocks
(identified cost $12,276,591) | | | | | | $ | 6,661,826 | | |
| Convertible Preferred Stocks — 0.8% | |
| Security | | Shares | | Value | |
| Energy — 0.8% | |
| Chesapeake Energy Corp., 4.50% | | | 53,543 | | | $ | 3,319,130 | | |
| Chesapeake Energy Corp., 5.00%(4) | | | 6,292 | | | | 427,856 | | |
| | | $ | 3,746,986 | | |
Total Convertible Preferred Stocks
(identified cost $5,951,414) | | | | | | $ | 3,746,986 | | |
| Preferred Stocks — 0.2% | |
| Security | | Shares/Units | | Value | |
| Gaming — 0.2% | |
| Fontainebleau Resorts LLC (PIK)(6)(8) | | | 4,018 | | | $ | 1,076,952 | | |
| | | $ | 1,076,952 | | |
| Super Retail — 0.0% | |
| GNC Acquisition Holdings(6)(8) | | | 37,182 | | | $ | 97,789 | | |
| | | $ | 97,789 | | |
Total Preferred Stocks
(identified cost $4,204,390) | | | | | | $ | 1,174,741 | | |
| Miscellaneous — 0.1% | |
| Security | | Shares | | Value | |
| Cable / Satellite TV — 0.1% | |
| Adelphia, Inc., Escrow Certificate(7) | | | 7,585,000 | | | $ | 227,550 | | |
| Adelphia, Inc., Escrow Certificate(7) | | | 3,555,000 | | | | 106,650 | | |
| Adelphia Recovery Trust(7) | | | 10,758,837 | | | | 215,177 | | |
| | | $ | 549,377 | | |
| Utilities — 0.0% | |
| Mirant Corp., Escrow Certificate(6)(7)(8) | | | 1,440,000 | | | $ | 144 | | |
| Mirant Corp., Escrow Certificate(6)(7)(8) | | | 3,200,000 | | | | 320 | | |
| | | $ | 464 | | |
Total Miscellaneous
(identified cost $9,898,658) | | | | | | $ | 549,841 | | |
| Warrants — 0.5% | |
| Security | | Shares | | Value | |
| Consumer Products — 0.0% | |
| HF Holdings, Inc., Exp. 9/27/09(6)(7) | | | 13,600 | | | $ | 0 | | |
| | | $ | 0 | | |
| Gaming — 0.5% | |
Peninsula Gaming LLC, Convertible Preferred
Membership Interests, Exp. 9/27/09(6)(7)(8) | | | 25,351 | | | $ | 2,466,672 | | |
| | | $ | 2,466,672 | | |
Total Warrants
(identified cost $730,314) | | | | | | $ | 2,466,672 | | |
See notes to financial statements
22
High Income Opportunities Portfolio as of October 31, 2008
PORTFOLIO OF INVESTMENTS CONT'D
| Short-Term Investments — 0.0% | |
| Description | | Interest
(000's omitted) | | Value | |
| Cash Management Portfolio, 1.90%(9) | | $ | 2 | | | $ | 2,143 | | |
Total Short-Term Investments
(identified cost $2,143) | | | | $ | 2,143 | | |
Total Investments — 99.3%
(identified cost $711,694,769) | | | | $ | 476,694,026 | | |
Less Unfunded Loan
Commitments — (0.0)% | | | | $ | (66,657 | ) | |
Net Investments — 99.3%
(identified cost $711,628,112) | | | | $ | 476,627,369 | | |
| Other Assets, Less Liabilities — 0.7% | | | | $ | 3,433,712 | | |
| Net Assets — 100.0% | | | | $ | 480,061,081 | | |
DIP - Debtor in Possession
PIK - Payment In Kind.
(1) Senior floating-rate interests (Senior Loans) often require prepayments from excess cash flows or permit the borrowers to repay at their election. The degree to which borrowers repay, whether as a contractual requirement or at their election, cannot be predicted with accuracy. As a result, the actual remaining maturity may be substantially less than the stated maturities shown. However, Senior Loans will have an expected average life of approximately two to four years. The stated interest rate represents the weighted average interest rate of all contracts within the senior loan facility. Senior Loans typically have rates of interest which are redetermined either daily, monthly, quarterly or semi-annually by reference to a base lending rate, plus a premium. These base rates are primarily the London-Interbank Offered Rate ("LIBOR"), and secondarily the prime rate offered by one or more major United States banks (the "Prime Rate") and the certificate of deposit ("CD") rate or other base lending rates used by commercial lenders.
(2) This Senior Loan will settle after October 31, 2008, at which time the interest rate will be determined.
(3) Unfunded or partially unfunded loan commitments. See Note 1G for description.
(4) Security exempt from registration under Rule 144A of the Securities Act of 1933. These securities may be sold in transactions exempt from registration, normally to qualified institutional buyers. At October 31, 2008, the aggregate value of the securities is $115,596,988 or 24.1% of the Portfolio's net assets.
(5) Defaulted security.
(6) Security valued at fair value using methods determined in good faith by or at the direction of the Trustees.
(7) Non-income producing security.
(8) Restricted security.
(9) Affiliated investment company available to Eaton Vance portfolios and funds which invests in high quality, U.S. dollar denominated money market instruments. The rate shown is the annualized seven-day yield as of October 31, 2008.
See notes to financial statements
23
High Income Opportunities Portfolio as of October 31, 2008
FINANCIAL STATEMENTS
Statement of Assets and Liabilities
As of October 31, 2008
| Assets | |
| Unaffiliated investments, at value (identified cost, $711,625,969) | | $ | 476,625,226 | | |
| Affiliated investment, at value (identified cost, $2,143) | | | 2,143 | | |
| Cash | | | 560 | | |
| Restricted cash* | | | 11,484,000 | | |
| Receivable for investments sold | | | 1,904,263 | | |
| Dividends and interest receivable | | | 16,958,667 | | |
| Interest receivable from affiliated investment | | | 934 | | |
| Receivable for open forward foreign currency contracts | | | 41,814 | | |
| Receivable for open swap contracts | | | 6,714 | | |
| Total assets | | $ | 507,024,321 | | |
| Liabilities | |
| Payable for investments purchased | | $ | 14,430,770 | | |
| Payable for open swap contracts | | | 7,488,965 | | |
| Premium received on swap contracts | | | 2,126,991 | | |
| Payable for closed swap contracts, net | | | 1,507,805 | | |
| Demand note payable | | | 900,000 | | |
| Payable to affiliate for investment adviser fee | | | 320,381 | | |
| Payable to affiliate for Trustees' fees | | | 1,683 | | |
| Accrued expenses | | | 186,645 | | |
| Total liabilities | | $ | 26,963,240 | | |
| Net Assets applicable to investors' interest in Portfolio | | $ | 480,061,081 | | |
| Sources of Net Assets | |
| Net proceeds from capital contributions and withdrawals | | $ | 722,502,261 | | |
| Net unrealized depreciation (computed on the basis of identified cost) | | | (242,441,180 | ) | |
| Total | | $ | 480,061,081 | | |
* Represents restricted cash on deposit at the custodian as collateral for open swap contracts.
Statement of Operations
For the Year Ended
October 31, 2008
| Investment Income | |
| Interest and other income | | $ | 71,238,932 | | |
| Dividends | | | 573,840 | | |
| Interest income allocated from affiliated investment | | | 113,216 | | |
| Expenses allocated from affiliated investment | | | (15,084 | ) | |
| Total investment income | | $ | 71,910,904 | | |
| Expenses | |
| Investment adviser fee | | $ | 4,374,158 | | |
| Trustees' fees and expenses | | | 21,577 | | |
| Custodian fee | | | 270,190 | | |
| Legal and accounting services | | | 118,348 | | |
| Interest expense | | | 209,300 | | |
| Miscellaneous | | | 21,388 | | |
| Total expenses | | $ | 5,014,961 | | |
Deduct —
Reduction of custodian fee | | $ | 27 | | |
| Total expense reductions | | $ | 27 | | |
| Net expenses | | $ | 5,014,934 | | |
| Net investment income | | $ | 66,895,970 | | |
| Realized and Unrealized Gain (Loss) | |
Net realized gain (loss) —
Investment transactions (identified cost basis) | | $ | (42,151,839 | ) | |
| Swap contracts | | | 2,266,535 | | |
Foreign currency and forward foreign currency exchange
contract transactions | | | 571,244 | | |
| Net realized loss | | $ | (39,314,060 | ) | |
Change in unrealized appreciation (depreciation) —
Investments (identified cost basis) | | $ | (225,576,418 | ) | |
| Swap contracts | | | (8,234,185 | ) | |
| Foreign currency and forward foreign currency exchange contracts | | | 41,814 | | |
| Net change in unrealized appreciation (depreciation) | | $ | (233,768,789 | ) | |
| Net realized and unrealized loss | | $ | (273,082,849 | ) | |
| Net decrease in net assets from operations | | $ | (206,186,879 | ) | |
See notes to financial statements
24
High Income Opportunities Portfolio as of October 31, 2008
FINANCIAL STATEMENTS CONT'D
Statements of Changes in Net Assets
Increase (Decrease)
in Net Assets | | Year Ended
October 31, 2008 | | Year Ended
October 31, 2007 | |
From operations —
Net investment income | | $ | 66,895,970 | | | $ | 85,423,789 | | |
Net realized gain (loss) from investment
transactions, swap contracts, and
foreign currency and forward foreign
currency exchange contract transactions | | | (39,314,060 | ) | | | 24,546,753 | | |
Net change in unrealized appreciation
(depreciation) from investments, swap
contracts, foreign currency and forward
foreign currency exchange contracts | | | (233,768,789 | ) | | | (43,770,374 | ) | |
Net increase (decrease) in net assets
from operations | | $ | (206,186,879 | ) | | $ | 66,200,168 | | |
Capital transactions —
Contributions | | $ | 93,764,788 | | | $ | 171,543,814 | | |
| Withdrawals | | | (279,784,438 | ) | | | (452,800,848 | ) | |
Net decrease in net assets from
capital transactions | | $ | (186,019,650 | ) | | $ | (281,257,034 | ) | |
| Net decrease in net assets | | $ | (392,206,529 | ) | | $ | (215,056,866 | ) | |
| Net Assets | |
| At beginning of year | | $ | 872,267,610 | | | $ | 1,087,324,476 | | |
| At end of year | | $ | 480,061,081 | | | $ | 872,267,610 | | |
See notes to financial statements
25
High Income Opportunities Portfolio as of October 31, 2008
FINANCIAL STATEMENTS CONT'D
Supplementary Data
| | | Year Ended October 31, | |
| | | 2008 | | 2007 | | 2006 | | 2005 | | 2004 | |
| Ratios/Supplemental Data | |
| Ratios (As a percentage of average daily net assets): | |
| Expenses before custodian fee reduction(1) | | | 0.70 | % | | | 0.63 | % | | | 0.59 | % | | | 0.58 | % | | | 0.59 | % | |
| Net investment income | | | 9.38 | % | | | 8.33 | % | | | 8.13 | % | | | 8.06 | % | | | 8.61 | % | |
| Portfolio Turnover | | | 48 | % | | | 81 | % | | | 62 | % | | | 62 | % | | | 80 | % | |
| Total Return | | | (29.08 | )% | | | 6.54 | % | | | 11.66 | % | | | 6.54 | % | | | 12.79 | % | |
| Net assets, end of year (000's omitted) | | $ | 480,061 | | | $ | 872,268 | | | $ | 1,087,324 | | | $ | 1,110,139 | | | $ | 1,291,973 | | |
(1) Excludes the effect of custody fee credits, if any, of less than 0.005%.
See notes to financial statements
26
High Income Opportunities Portfolio as of October 31, 2008
NOTES TO FINANCIAL STATEMENTS
1 Significant Accounting Policies
High Income Opportunities Portfolio (the Portfolio) is a New York trust registered under the Investment Company Act of 1940, as amended (the 1940 Act), as a diversified, open-end management investment company. The Portfolio's investment objective is to provide a high level of current income. The Declaration of Trust permits the Trustees to issue interests in the Portfolio. At October 31, 2008, Eaton Vance High Income Opportunities Fund, Eaton Vance Floating-Rate & High Income Fund, Eaton Vance Strategic Income Fund and Eaton Vance Medallion Strategic Income Fund held an interest of 71.6%, 11.1%, 5.2% and 0.1%, respectively, in the Portfolio.
The following is a summary of significant accounting policies of the Portfolio. The policies are in conformity with accounting principles generally accepted in the United States of America.
A Investment Valuation — Debt obligations, including listed securities and securities for which quotations are available, will normally be valued on the basis of market quotations provided by independent pricing services. The pricing services consider various factors relating to bonds and/or market transactions to determine market value. Short-term debt securities with a remaining maturity of sixty days or less are valued at amortized cost, which approximates market value. If short-term debt securities are acquired with a remaining maturity of more than sixty days, they will be valued by a pricing service. Equity securities listed on a U.S. securities exchange generally are valued at the last sale price on the day of valuation or, if no sales took place on such date, at t he mean between the closing bid and asked prices therefore on the exchange where such securities are principally traded. Equity securities listed on the NASDAQ Global or Global Select Market generally are valued at the NASDAQ official closing price. Unlisted or listed securities for which closing sales prices or closing quotations are not available are valued at the mean between the latest available bid and asked prices or, in the case of preferred equity securities that are not listed or traded in the over-the-counter market, by an independent pricing service. Credit default swaps are valued by a broker-dealer (usually the counterparty to the agreement). Forward foreign currency exchange contracts are generally valued using prices supplied by a pricing vendor or dealers. Interests in senior floating-rate loans (Senior Loans) for which reliable market quotations are readily available are valued generally at the average mean of bid and ask quotations obtained from an independent pricing service. Other Senior Loans are valued at fair value by the investment adviser under procedures established by the Trustees. In fair valuing a Senior Loan, the investment adviser utilizes one or more of the following valuation techniques: (i) a matrix pricing approach that considers the yield on the Senior Loan relative to yields on the other loan interests issued by companies of comparable credit quality; (ii) a comparison of the value of the borrower's outstanding equity and debt to that of comparable public companies; (iii) a discounted cash flow analysis; or (iv) when the investment adviser believes it is likely that a borrower will be liquidated or sold, an analysis of the terms of such liquidation or sale. In certain cases, the investment adviser will use a combination of analytical methods to determine fair value, such as when only a portion of a borrower's assets are likely to be sold. In conducting its assessment and analyses for purposes of determin ing fair value of a Senior Loan, the investment adviser will use its discretion and judgment in considering and appraising relevant factors. Fair value determinations are made by the portfolio managers of the Portfolio based on information available to such managers. The portfolio managers of other funds managed by the investment adviser that invest in Senior Loans may not possess the same information about a Senior Loan borrower as the portfolio managers of the Portfolio. At times, the fair value of a Senior Loan determined by the portfolio managers of other funds managed by the investment adviser that invest in Senior Loans may vary from the fair value of the same Senior Loan determined by the portfolio managers of the Portfolio. The fair value of each Senior Loan is periodically reviewed and approved by the investment adviser's Valuation Committee and by the Trustees based upon procedures approved by the Trustees. Junior Loans are valued in the same manner as Senior Loans. Foreign securities and currencie s are valued in U.S. dollars, based on foreign currency exchange rate quotations supplied by an independent quotation service. The independent service uses a proprietary model to determine the exchange rate. Inputs to the model include reported trades and implied bid/ask spreads. Investments for which valuations or market quotations are not readily available are valued at fair value using methods determined in good faith by or at the direction of the Trustees of the Portfolio considering relevant factors, data and information including the market value of freely tradable securities of the same class in the principal market on which such securities are normally traded.
The Portfolio may invest in Cash Management Portfolio (Cash Management), an affiliated investment company managed by Boston Management and Research (BMR),
27
High Income Opportunities Portfolio as of October 31, 2008
NOTES TO FINANCIAL STATEMENTS CONT'D
a subsidiary of Eaton Vance Management (EVM). Cash Management values its investment securities utilizing the amortized cost valuation technique permitted by Rule 2a-7 of the 1940 Act, pursuant to which Cash Management must comply with certain conditions. This technique involves initially valuing a portfolio security at its cost and thereafter assuming a constant amortization to maturity of any discount or premium. If amortized cost is determined not to approximate fair value, Cash Management may value its investment securities based on available market quotations provided by a pricing service.
B Investment Transactions — Investment transactions for financial statement purposes are accounted for on a trade date basis. Realized gains and losses on investments sold are determined on the basis of identified cost.
C Income — Interest income is recorded on the basis of interest accrued, adjusted for amortization of premium or accretion of discount. Fees associated with loan amendments are recognized immediately. Dividend income is recorded on the ex-dividend date for dividends received in cash and/or securities.
D Federal Taxes — The Portfolio has elected to be treated as a partnership for federal tax purposes. No provision is made by the Portfolio for federal or state taxes on any taxable income of the Portfolio because each investor in the Portfolio is ultimately responsible for the payment of any taxes on its share of taxable income. Since at least one of the Portfolio's investors is a regulated investment company that invests all or substantially all of its assets in the Portfolio, the Portfolio normally must satisfy the applicable source of income and diversification requirements (under the Internal Revenue Code) in order for its investors to satisfy them. The Portfolio will allocate, at least annually a mong its investors, each investor's distributive share of the Portfolio's net investment income, net realized capital gains and any other items of income, gain, loss, deduction or credit.
As of October 31, 2008, the Portfolio had no uncertain tax positions that would require financial statement recognition, de-recognition, or disclosure. Each of the Portfolio's federal tax returns filed in the 3-year period ended October 31, 2008 remains subject to examination by the Internal Revenue Service.
E Expense Reduction — State Street Bank and Trust Company (SSBT) serves as custodian of the Portfolio. Pursuant to the custodian agreement, SSBT receives a fee reduced by credits, which are determined based on the average daily cash balance the Portfolio maintains with SSBT. All credit balances, if any, used to reduce the Portfolio's custodian fees are reported as a reduction of expenses in the Statement of Operations.
F Foreign Currency Translation — Investment valuations, other assets, and liabilities initially expressed in foreign currencies are translated each business day into U.S. dollars based upon current exchange rates. Purchases and sales of foreign investment securities and income and expenses denominated in foreign currencies are translated into U.S. dollars based upon currency exchange rates in effect on the respective dates of such transactions. Recognized gains or losses on investment transactions attributable to changes in foreign currency exchange rates are recorded for financial statement purposes as net realized gains and losses on investments. That portion of unrealized gains and losses on invest ments that results from fluctuations in foreign currency exchange rates is not separately disclosed.
G Unfunded Loan Commitments — The Portfolio may enter into certain credit agreements all or a portion of which may be unfunded. The Portfolio is obligated to fund these commitments at the borrower's discretion. The commitments are disclosed in the accompanying Portfolio of Investments.
H Use of Estimates — The preparation of the financial statements in conformity with accounting principles generally accepted in the United States of America requires management to make estimates and assumptions that affect the reported amounts of assets and liabilities at the date of the financial statements and the reported amounts of income and expense during the reporting period. Actual results could differ from those estimates.
I Indemnifications — Under the Portfolio's organizational documents, its officers and Trustees may be indemnified against certain liabilities and expenses arising out of the performance of their duties to the Portfolio. Interestholders in the Portfolio are jointly and severally liable for the liabilities and obligations of the Portfolio in the event that the Portfolio fails to satisfy such liabilities and obligations; provided, however, that, to the extent assets are available in the Portfolio, the Portfolio may,
28
High Income Opportunities Portfolio as of October 31, 2008
NOTES TO FINANCIAL STATEMENTS CONT'D
under certain circumstances, indemnify interestholders from and against any claim or liability to which such holder may become subject by reason of being or having been an interestholder in the Portfolio. Additionally, in the normal course of business, the Portfolio enters into agreements with service providers that may contain indemnification clauses. The Portfolio's maximum exposure under these arrangements is unknown as this would involve future claims that may be made against the Portfolio that have not yet occurred.
J Forward Foreign Currency Exchange Contracts — The Portfolio may enter into forward foreign currency exchange contracts for the purchase or sale of a specific foreign currency at a fixed price on a future date. The Portfolio enters into forward contracts for hedging purposes as well as non-hedging purposes. The forward foreign currency exchange contract is adjusted by the daily exchange rate of the underlying currency and any gains or losses are recorded as unrealized until such time as the contract has been closed or offset by another contract with the same broker for the same settlement date and currency. Risks may arise upon entering these contracts from the potential inability of counterparties t o meet the terms of their contracts and from movements in the value of a foreign currency relative to the U.S. dollar.
K Credit Default Swaps — The Portfolio may enter into credit default swap contracts to buy or sell protection against default on an individual issuer or a basket of issuers of bonds. When the Portfolio is the buyer of a credit default swap contract, the Portfolio is entitled to receive the par (or other agreed-upon) value of a referenced debt obligation (or basket of debt obligations) from the counterparty to the contract in the event of default by a third party, such as a U.S. or foreign corporate issuer, on the debt obligation. In return, the Portfolio pays the counterparty a periodic stream of payments over the term of the contract provided that no event of default has occurred. If no default occur s, the Portfolio would have spent the stream of payments and received no benefits from the contract. When the Portfolio is the seller of a credit default swap contract, it receives the stream of payments, but is obligated to pay upon default of the referenced debt obligation. As the seller, the Portfolio effectively adds leverage to its portfolio because, in addition to its total net assets, the Portfolio is subject to investment exposure on the notional amount of the swap. The interest fee paid or received on the swap contract, which is based on a specified interest rate on a fixed notional amount, is accrued daily as a component of unrealized appreciation (depreciation) and is recorded as realized gain upon receipt or realized loss upon payment. The Portfolio also records an increase or decrease to unrealized appreciation (depreciation) in an amount equal to the daily valuation. Up-front payments or receipts, if any, are recorded as ot her assets or other liabilities, respectively, and amortized over the life of the swap contract as realized gains or losses. The Portfolio segregates assets in the form of cash and cash equivalents in an amount equal to the aggregate market value of the credit default swaps of which it is the seller, marked to market on a daily basis. These transactions involve certain risks, including the risk that the seller may be unable to fulfill the transaction.
2 Investment Adviser Fee and Other Transactions with Affiliates
The investment adviser fee is earned by BMR as compensation for investment advisory services rendered to the Portfolio. The fee is computed at an annual rate of 0.30% of the Portfolio's average daily net assets up to $500 million, 0.275% from $500 million up to $1 billion and at reduced rates as daily net assets exceed that level; plus 3.00% of the Portfolio's daily gross income (i.e., income other than gains from the sale of securities) when daily net assets are less than $500 million, 2.75% when daily net assets are $500 million but less than $1 billion, and at reduced rates as daily net assets exceed that level, and is payable monthly. The portion of the adviser fee payable by Cash Management on the Portfolio's investment of cash therein is credited against the Portfolio's adviser fee. For the year ended October 31, 2008, the Portfolio's adviser fee totaled $4,388,188 of which $14,030 was allocated from Cash Management and $4 ,374,158 was paid or accrued directly by the Portfolio. For the year ended October 31, 2008, the Portfolio's adviser fee, including the portion allocated from Cash Management, was 0.61% of the Portfolio's average daily net assets.
Except for Trustees of the Portfolio who are not members of EVM's or BMR's organizations, officers and Trustees receive remuneration for their services to the Portfolio out of the investment adviser fee. Trustees of the Portfolio who are not affiliated with the investment adviser may elect to defer receipt of all or a percentage of their annual fees in accordance with the terms of the Trustees Deferred Compensation Plan. For the year ended October 31, 2008, no significant amounts have been deferred. Certain officers and Trustees of the Portfolio are officers of the above organizations.
3 Purchases and Sales of Investments
Purchases and sales of investments, other than short-term obligations and including maturities and principal repayments on senior loans, aggregated $341,339,105 and $463,469,819, respectively, for the year ended October 31, 2008.
29
High Income Opportunities Portfolio as of October 31, 2008
NOTES TO FINANCIAL STATEMENTS CONT'D
4 Federal Income Tax Basis of Investments
The cost and unrealized appreciation (depreciation) of investments of the Portfolio at October 31, 2008, as determined on a federal income tax basis, were as follows:
| Aggregate cost | | $ | 714,123,940 | | |
| Gross unrealized appreciation | | $ | 2,574,399 | | |
| Gross unrealized depreciation | | | (240,070,970 | ) | |
| Net unrealized depreciation | | $ | (237,496,571 | ) | |
5 Restricted Securities
At October 31, 2008, the Portfolio owned the following securities (representing 1.1% of net assets) which were restricted as to public resale and not registered under the Securities Act of 1933 (excluding Rule 144A securities). The Portfolio has various registration rights (exercisable under a variety of circumstances) with respect to these securities. The value of these securities is determined based on valuations provided by brokers when available, or if not available, they are valued at fair value using methods determined in good faith by or at the direction of the Trustees.
| Description | | Date of
Acquisition | | Shares/Units | | Cost | | Value | |
| Stocks, Miscellaneous, and Warrants | |
GNC Acquisition
Holdings, Class A | | 3/15/07 | | | 108,818 | | | $ | 544,090 | | | $ | 462,477 | | |
GNC Acquisition
Holdings, Preferred | | 3/15/07 | | | 37,182 | | | | 185,910 | | | | 97,789 | | |
Fontainebleau Equity
Holdings, Class A | | 6/1/07 | | | 148,726 | | | | 1,784,712 | | | | 1,264,171 | | |
Fontainebleau Resorts
LLC (PIK), Preferred | | 6/1/07 | | | 4,018 | | | | 4,018,480 | | | | 1,076,952 | | |
Mirant Corp.,
Escrow Certificate | | 1/5/06 | | | 1,440,000 | | | | 0 | (1) | | | 144 | | |
Mirant Corp.,
Escrow Certificate | | 1/5/06 | | | 3,200,000 | | | | 0 | (1) | | | 320 | | |
Peninsula Gaming LLC,
Convertible Preferred
Membership Interests,
Exp. 9/27/09 | | 7/8/99 | | | 25,351 | | | | 0 | (1) | | | 2,466,672 | | |
| Total Restricted Securities | | | | | | | | $ | 6,533,192 | | | $ | 5,368,525 | | |
(1) Less than $0.50.
6 Financial Instruments
The Portfolio may trade in financial instruments with off-balance sheet risk in the normal course of its investing activities. These financial instruments may include forward foreign currency exchange contracts and swap contracts and may involve, to a varying degree, elements of risk in excess of the amounts recognized for financial statement purposes. The notional or contractual amounts of these instruments represent the investment the Portfolio has in particular classes of financial instruments and does not necessarily represent the amounts potentially subject to risk. The measurement of the risks associated with these instruments is meaningful only when all related and offsetting transactions are considered. A summary of obligations under these financial instruments at October 31, 2008 is as follows:
Forward Foreign Currency Exchange Contracts
Sales
| Settlement Date | | Deliver | | In exchange for | | Net Unrealized
Appreciation | |
| | 11/28/08
| | | Swiss Franc
3,018,000 | | United States Dollar
$2,645,019 | | | $41,814 | | |
Credit Default Swaps
Counterparty | | Reference
Entity | | Buy/
Sell | | Notional
Amount
(000s
omitted) | | Pay/
Receive
Annual
Fixed
Rate | | Termination
Date | | Net
Unrealized
Depreciation | |
Bank of America
| | First Data
Corp. | | Sell | | | $1,525 | | | | 3.20% | | | 12/20/09 | | | $(52,111) | | |
| Citigroup, Inc. | | AMD, Inc. | | Sell | | | 7,000 | | | | 6.40 | | | 12/20/12 | | | (2,667,400 | ) | |
| | | First Data Corp. | | Sell | | | 3,050 | | | | 3.20 | | | 12/20/09 | | | (104,221 | ) | |
| | | First Data Corp. | | Sell | | | 3,050 | | | | 3.55 | | | 12/21/09 | | | (91,567 | ) | |
General
| | Motors Corp. | | Sell | | | 4,000 | | | | 5.00 | | | 9/20/09 | | | (1,053,233 | ) | |
Nortel
| | Networks Corp. | | Sell | | | 5,000 | | | | 5.00 | | | 12/20/09 | | | (246,505 | ) | |
| | Nortel
Networks Corp. | | Sell | | | 10,000 | | | | 5.00 | | | 12/20/10 | | | (604,115 | ) | |
Goldman Sachs
Capital Markets L.P. | | General
Motors Corp. | | Sell | | | 1,600 | | | | 7.25 | | | 9/20/10 | | | (650,626 | ) | |
30
High Income Opportunities Portfolio as of October 31, 2008
NOTES TO FINANCIAL STATEMENTS CONT'D
Counterparty | | Reference
Entity | | Buy/
Sell | | Notional
Amount
(000s
omitted) | | Pay/
Receive
Annual
Fixed
Rate | | Termination
Date | | Net
Unrealized
Depreciation | |
| JPMorgan | | | | | | | | | | | | | | | | |
| | |
| Chase Bank | | AMD, Inc. | | Sell | | $ | 1,500 | | | | 6.50 | % | | 12/20/12 | | $ | (568,813 | ) | |
| | | AMD, Inc. | | Sell | | | 1,500 | | | | 6.40 | | | 12/20/12 | | | (571,585 | ) | |
| | | Ford Motor Corp. | | Sell | | | 3,200 | | | | 8.50 | | | 3/20/10 | | | (570,295 | ) | |
Morgan Stanley
Capital Services, Inc. | | Intelsat Ltd. | | Sell | | | 2,940 | | | | 3.75 | | | 12/20/08 | | | 6,714 | | |
| RBS | | | |
| |
| Greenwich Capital | | First Data Corp. | | Sell | | | 3,040 | | | | 3.95 | | | 12/20/10 | | | (204,664 | ) | |
| | | First Data Corp. | | Sell | | | 1,520 | | | | 3.90 | | | 12/20/10 | | | (103,830 | ) | |
| | | | | | | | | | | | | | | | $ | (7,482,251 | ) | |
At October 31, 2008, the Portfolio had sufficient cash and/or securities to cover commitments under these contracts.
7 Line of Credit
The Portfolio participates with other portfolios and funds managed by EVM and its affiliates in a $450 million unsecured line of credit agreement with a group of banks. Borrowings are made by the Portfolio solely to facilitate the handling of unusual and/or unanticipated short-term cash requirements. Interest is charged to the Portfolio based on its borrowings at an amount above either the Eurodollar rate or Federal Funds rate. In addition, a fee computed at an annual rate of 0.10% on the daily unused portion of the line of credit is allocated among the participating portfolios and funds at the end of each quarter. At October 31, 2008, the Portfolio had a balance outstanding pursuant to this line of credit of $900,000 at an interest rate of 0.925%. Average borrowings and the average interest rate for the year ended October 31, 2008 were $7,024,044 and 3.0%, respectively.
8 Concentration of Portfolio Credit Risk
The Portfolio regularly invests in lower rated and comparable quality unrated high yield securities. These investments have different risks than investments in debt securities rated investment grade and held by the Portfolio. Risk of loss upon default by the borrower is significantly greater with respect to such debt than with other debt securities because these securities are generally unsecured and are more sensitive to adverse economic conditions, such as recession or increasing interest rates, than are investment grade issuers.
9 Recently Issued Accounting Pronouncements
In September 2006, the Financial Accounting Standards Board (FASB) issued Statement of Financial Accounting Standards No. 157 (FAS 157), "Fair Value Measurements". FAS 157 defines fair value, establishes a framework for measuring fair value in accordance with accounting principles generally accepted in the United States of America and expands disclosure about fair value measurements. FAS 157 is effective for fiscal years beginning after November 15, 2007. As of October 31, 2008, management does not believe the adoption of FAS 157 will impact the amounts reported in the financial statements; however, additional disclosures may be required about the inputs used to develop the measurements of fair value and the effect of certain of the measurements on changes in net assets for the period.
In March 2008, the FASB issued Statement of Financial Accounting Standards No. 161 (FAS 161), "Disclosures about Derivative Instruments and Hedging Activities". FAS 161 requires enhanced disclosures about an entity's derivative and hedging activities, including qualitative disclosures about the objectives and strategies for using derivatives, quantitative disclosures about fair value amounts of and gains and losses on derivative instruments, and disclosures about credit-risk related contingent features in derivative instruments. FAS 161 is effective for fiscal years and interim periods beginning after November 15, 2008. Management is currently evaluating the impact the adoption of FAS 161 will have on the Portfolio's financial statement disclosures.
31
High Income Opportunities Portfolio as of October 31, 2008
REPORT OF INDEPENDENT REGISTERED PUBLIC ACCOUNTING FIRM
To the Trustees and Investors
of High Income Opportunities Portfolio:
We have audited the accompanying statement of assets and liabilities of High Income Opportunities Portfolio ("the Portfolio") (formerly High Income Portfolio), including the portfolio of investments, as of October 31, 2008, and the related statement of operations for the year then ended, the statements of changes in net assets for each of the two years in the period then ended, and the supplementary data for each of the five years in the period then ended. These financial statements and supplementary data are the responsibility of the Portfolio's management. Our responsibility is to express an opinion on these financial statements and supplementary data based on our audits.
We conducted our audits in accordance with the standards of the Public Company Accounting Oversight Board (United States). Those standards require that we plan and perform the audit to obtain reasonable assurance about whether the financial statements and supplementary data are free of material misstatement. The Portfolio is not required to have, nor were we engaged to perform, an audit of its internal control over financial reporting. Our audits included consideration of internal control over financial reporting as a basis for designing audit procedures that are appropriate in the circumstances, but not for the purpose of expressing an opinion on the effectiveness of the Portfolio's internal control over financial reporting. Accordingly, we express no such opinion. An audit also includes examining, on a test basis, evidence supporting the amounts and disclosures in the financial statements, assessing the accounting principles u sed and significant estimates made by management, as well as evaluating the overall financial statement presentation. Our procedures included confirmation of securities and senior loans owned as of October 31, 2008, by correspondence with the custodian, brokers, and selling agent banks; where replies were not received from brokers and selling agent banks, we performed other auditing procedures. We believe that our audits provide a reasonable basis for our opinion.
In our opinion, the financial statements and supplementary data referred to above present fairly, in all material respects, the financial position of High Income Opportunities Portfolio as of October 31, 2008, the results of its operations for the year then ended, the changes in its net assets for each of the two years in the period then ended, and the supplementary data for each of the five years in the period then ended, in conformity with accounting principles generally accepted in the United States of America.
DELOITTE & TOUCHE LLP
Boston, Massachusetts
December 18, 2008
32
Eaton Vance High Income Opportunities Fund
High Income Opportunities Portfolio
SPECIAL MEETING OF SHAREHOLDERS (Unaudited)
Eaton Vance High Income Opportunities Fund
The Fund held a Special Meeting of Shareholders on November 14, 2008 to elect Trustees. The results of the vote were as follows:
| | | Number of Shares | |
| Nominee for Trustee | | For | | Withheld | |
| Benjamin C. Esty | | | 87,211,567 | | | | 2,412,744 | | |
| Thomas E. Faust Jr. | | | 87,212,063 | | | | 2,412,249 | | |
| Allen R. Freedman | | | 87,205,061 | | | | 2,419,251 | | |
| William H. Park | | | 87,248,038 | | | | 2,376,274 | | |
| Ronald A. Pearlman | | | 87,195,595 | | | | 2,428,717 | | |
| Helen Frame Peters | | | 87,249,995 | | | | 2,374,316 | | |
| Heidi L. Steiger | | | 87,242,196 | | | | 2,382,116 | | |
| Lynn A. Stout | | | 87,238,622 | | | | 2,385,690 | | |
| Ralph F. Verni | | | 87,214,982 | | | | 2,409,329 | | |
Each nominee was also elected a Trustee of High Income Opportunities Portfolio.
High Income Opportunities Portfolio
The Portfolio held a Special Meeting of Interestholders on November 14, 2008 to elect Trustees. The results of the vote were as follows:
| | | Interest in the Portfolio | |
| Nominee for Trustee | | For | | Withheld | |
| Benjamin C. Esty | | | 86 | % | | | 2 | % | |
| Thomas E. Faust Jr. | | | 86 | % | | | 2 | % | |
| Allen R. Freedman | | | 86 | % | | | 2 | % | |
| William H. Park | | | 86 | % | | | 2 | % | |
| Ronald A. Pearlman | | | 86 | % | | | 2 | % | |
| Helen Frame Peters | | | 86 | % | | | 2 | % | |
| Heidi L. Steiger | | | 86 | % | | | 2 | % | |
| Lynn A. Stout | | | 86 | % | | | 2 | % | |
| Ralph F. Verni | | | 86 | % | | | 2 | % | |
Results are rounded to the nearest whole number.
33
Eaton Vance High Income Opportunities Fund
BOARD OF TRUSTEES' ANNUAL APPROVAL OF THE INVESTMENT ADVISORY AGREEMENT
Overview of the Contract Review Process
The Investment Company Act of 1940, as amended (the "1940 Act"), provides, in substance, that each investment advisory agreement between a fund and its investment adviser will continue in effect from year to year only if its continuance is approved at least annually by the fund's board of trustees, including by a vote of a majority of the trustees who are not "interested persons" of the fund ("Independent Trustees"), cast in person at a meeting called for the purpose of considering such approval.
At a meeting of the Boards of Trustees (each a "Board") of the Eaton Vance group of mutual funds (the "Eaton Vance Funds") held on April 21, 2008, the Board, including a majority of the Independent Trustees, voted to approve continuation of existing advisory and sub-advisory agreements for the Eaton Vance Funds for an additional one-year period. In voting its approval, the Board relied upon the affirmative recommendation of the Contract Review Committee of the Board (formerly the Special Committee), which is a committee comprised exclusively of Independent Trustees. Prior to making its recommendation, the Contract Review Committee reviewed information furnished for a series of meetings of the Contract Review Committee held in February, March and April 2008. Such information included, among other things, the following:
Information about Fees, Performance and Expenses
• An independent report comparing the advisory and related fees paid by each fund with fees paid by comparable funds;
• An independent report comparing each fund's total expense ratio and its components to comparable funds;
• An independent report comparing the investment performance of each fund to the investment performance of comparable funds over various time periods;
• Data regarding investment performance in comparison to relevant peer groups of funds and appropriate indices;
• Comparative information concerning fees charged by each adviser for managing other mutual funds and institutional accounts using investment strategies and techniques similar to those used in managing the fund;
• Profitability analyses for each adviser with respect to each fund;
Information about Portfolio Management
• Descriptions of the investment management services provided to each fund, including the investment strategies and processes employed, and any changes in portfolio management processes and personnel;
• Information concerning the allocation of brokerage and the benefits received by each adviser as a result of brokerage allocation, including information concerning the acquisition of research through "soft dollar" benefits received in connection with the funds' brokerage, and the implementation of a soft dollar reimbursement program established with respect to the funds;
• Data relating to portfolio turnover rates of each fund;
• The procedures and processes used to determine the fair value of fund assets and actions taken to monitor and test the effectiveness of such procedures and processes;
Information about each Adviser
• Reports detailing the financial results and condition of each adviser;
• Descriptions of the qualifications, education and experience of the individual investment professionals whose responsibilities include portfolio management and investment research for the funds, and information relating to their compensation and responsibilities with respect to managing other mutual funds and investment accounts;
• Copies of the Codes of Ethics of each adviser and its affiliates, together with information relating to compliance with and the administration of such codes;
• Copies of or descriptions of each adviser's proxy voting policies and procedures;
• Information concerning the resources devoted to compliance efforts undertaken by each adviser and its affiliates on behalf of the funds (including descriptions of various compliance programs) and their record of compliance with investment policies and restrictions, including policies with respect to market-timing, late trading and selective portfolio disclosure, and with policies on personal securities transactions;
• Descriptions of the business continuity and disaster recovery plans of each adviser and its affiliates;
Other Relevant Information
• Information concerning the nature, cost and character of the administrative and other non-investment management services provided by Eaton Vance Management and its affiliates;
• Information concerning management of the relationship with the custodian, subcustodians and fund accountants by each adviser or the funds' administrator; and
• The terms of each advisory agreement.
34
Eaton Vance High Income Opportunities Fund
BOARD OF TRUSTEES' ANNUAL APPROVAL OF THE INVESTMENT ADVISORY AGREEMENT CONT'D
In addition to the information identified above, the Contract Review Committee considered information provided from time to time by each adviser throughout the year at meetings of the Board and its committees. Over the course of the twelve-month period ended April 30, 2008, the Board met eleven times and the Contract Review Committee, the Audit Committee and the Governance Committee, each of which is a Committee comprised solely of Independent Trustees, met twelve, seven and five times, respectively. At such meetings, the Trustees received, among other things, presentations by the portfolio managers and other investment professionals of each adviser relating to the investment performance of each fund and the investment strategies used in pursuing the fund's investment objective. The Portfolio Management Committee and the Compliance Reports and Regulatory Matters Committee are newly established and did not meet during the twelve- month period ended April 30, 2008.
For funds that invest through one or more underlying portfolios, the Board considered similar information about the portfolio(s) when considering the approval of advisory agreements. In addition, in cases where the fund's investment adviser has engaged a sub-adviser, the Board considered similar information about the sub-adviser when considering the approval of any sub-advisory agreement.
The Contract Review Committee was assisted throughout the contract review process by Goodwin Procter LLP, legal counsel for the Independent Trustees. The members of the Contract Review Committee relied upon the advice of such counsel and their own business judgment in determining the material factors to be considered in evaluating each advisory and sub-advisory agreement and the weight to be given to each such factor. The conclusions reached with respect to each advisory and sub-advisory agreement were based on a comprehensive evaluation of all the information provided and not any single factor. Moreover, each member of the Contract Review Committee may have placed varying emphasis on particular factors in reaching conclusions with respect to each advisory and sub-advisory agreement.
Results of the Process
Based on its consideration of the foregoing, and such other information as it deemed relevant, including the factors and conclusions described below, the Contract Review Committee concluded that the continuance of the investment advisory agreement of the High Income Opportunities Portfolio (formerly, High Income Portfolio) (the "Portfolio"), the portfolio in which the Eaton Vance High Income Opportunities Fund (formerly, Eaton Vance High Income Fund) (the "Fund") invests, with Boston Management and Research (the "Adviser"), including the fee structure, is in the interests of shareholders and, therefore, the Contract Review Committee recommended to the Board approval of the agreement. The Board accepted the recommendation of the Contract Review Committee as well as the factors considered and conclusions reached by the Contract Review Committee with respect to the agreement. Accordingly, the Board, including a majority of the Inde pendent Trustees, voted to approve continuation of the investment advisory agreement for the Portfolio.
Nature, Extent and Quality of Services
In considering whether to approve the investment advisory agreement of the Portfolio, the Board evaluated the nature, extent and quality of services provided to the Portfolio by the Adviser.
The Board considered the Adviser's management capabilities and investment process with respect to the types of investments held by the Portfolio, including the education, experience and number of its investment professionals and other personnel who provide portfolio management, investment research, and similar services to the Portfolio. In particular, the Board evaluated the abilities and experience of such investment personnel in analyzing special considerations relevant to investing in high-yield debt. The Board also took into account the resources dedicated to portfolio management and other services, including the compensation paid to recruit and retain investment personnel, and the time and attention devoted to the Portfolio by senior management.
The Board also reviewed the compliance programs of the Adviser and relevant affiliates thereof. Among other matters, the Board considered compliance and reporting matters relating to personal trading by investment personnel, selective disclosure of portfolio holdings, late trading, frequent trading, portfolio valuation, business continuity and the allocation of investment opportunities. The Board also evaluated the responses of the Adviser and its affiliates to requests from regulatory authorities such as the Securities and Exchange Commission.
The Board considered shareholder and other administrative services provided or managed by Eaton Vance Management and its affiliates, including transfer agency and accounting services. The Board evaluated the benefits to shareholders of investing in a fund that is a part of a large family of funds, including the ability, in many cases, to exchange an investment among different funds without incurring additional sales charges.
After consideration of the foregoing factors, among others, the Board concluded that the nature, extent and quality of services provided by the Adviser, taken as a whole, are appropriate and consistent with the terms of the investment advisory agreement.
35
Eaton Vance High Income Opportunities Fund
BOARD OF TRUSTEES' ANNUAL APPROVAL OF THE INVESTMENT ADVISORY AGREEMENT CONT'D
Fund Performance
The Board compared the Fund's investment performance to a relevant universe of similarly managed funds identified by an independent data provider and appropriate benchmark indices. The Board reviewed comparative performance data for the one- and three-year periods ended September 30, 2007 for the Fund. The Board concluded that the performance of the Fund was satisfactory.
Management Fees and Expenses
The Board reviewed contractual investment advisory fee rates, including any administrative fee rates, payable by the Fund (referred to as "management fees"). As part of its review, the Board considered the management fees and the Fund's total expense ratio for the year ended September 30, 2007, as compared to a group of similarly managed funds selected by an independent data provider.
After reviewing the foregoing information, and in light of the nature, extent and quality of the services provided by the Adviser, the Board concluded that the management fees charged for advisory and related services and the Fund's total expense ratio are reasonable.
Profitability
The Board reviewed the level of profits realized by the Adviser and its affiliates in providing investment advisory and administrative services to the Fund, the Portfolio and all Eaton Vance Funds as a group. The Board considered the level of profits realized without regard to revenue sharing or other payments by the Adviser and its affiliates to third parties in respect of distribution services. The Board also considered other direct or indirect benefits received by the Adviser and its affiliates in connection with its relationship with the Fund and the Portfolio.
The Board concluded that, in light of the foregoing factors and the nature, extent and quality of the services rendered, the profits realized by the Adviser and its affiliates are reasonable.
Economies of Scale
In reviewing management fees and profitability, the Board also considered the extent to which the Adviser and its affiliates, on the one hand, and the Fund, on the other hand, can expect to realize benefits from economies of scale as the assets of the Fund and the Portfolio increase. The Board acknowledged the difficulty in accurately measuring the benefits resulting from the economies of scale with respect to the management of any specific fund or group of funds. The Board reviewed data summarizing the increases and decreases in the assets of the Fund and of all Eaton Vance Funds as a group over various time periods, and evaluated the extent to which the total expense ratio of the Fund and the profitability of the Adviser and its affiliates may have been affected by such increases or decreases. Based upon the foregoing, the Board concluded that the benefits from economies of scale are currently being shared equitably by the Adv iser and its affiliates and the Fund. The Board also concluded that, assuming reasonably foreseeable increases in the assets of the Portfolio, the structure of the advisory fee, which includes breakpoints at several asset levels, can be expected to cause the Adviser and its affiliates and the Fund to continue to share such benefits equitably.
36
Eaton Vance High Income Opportunities Fund
MANAGEMENT AND ORGANIZATION
Fund Management. The Trustees of Eaton Vance Mutual Funds Trust (the Trust) and High Income Opportunities Portfolio (the Portfolio) are responsible for the overall management and supervision of the Trust's and Portfolio's affairs. The Trustees and officers of the Trust and the Portfolio are listed below. Except as indicated, each individual has held the office shown or other offices in the same company for the last five years. Trustees and officers of the Trust and the Portfolio hold indefinite terms of office. The "noninterested Trustees" consist of those Trustees who are not "interested persons" of the Trust and the Portfolio, as that term is defined under the 1940 Act. The business address of each Trustee and officer is The Eaton Vance Building, 255 State Street, Boston, Massachusetts 02109. As used below, "EVC" refers to Eaton Vance Corp., "EV" refers to Eaton Vance, Inc., "EVM" refers to Eaton Vance Management, "BMR" refers to Boston Management and Research, "Parametric" refers to Parametric Portfolio Associates and "EVD" refers to Eaton Vance Distributors, Inc. EVC and EV are the corporate parent and trustee, respectively, of EVM and BMR. EVD is the Fund's principal underwriter, the Portfolio's placement agent and a wholly-owned subsidiary of EVC. Each officer affiliated with Eaton Vance may hold a position with other Eaton Vance affiliates that is comparable to his or her position with EVM listed below.
Name and
Date of Birth | | Position(s)
with the
Trust and
the Portfolio | | Term of
Office and
Length of
Service | | Principal Occupation(s)
During Past Five Years | | Number of Portfolios
in Fund Complex
Overseen By
Trustee(1) | | Other Directorships Held | |
| Interested Trustee | | | | | | | | | | | | | |
|
Thomas E. Faust Jr.
5/31/58 | | Trustee and President of the Trust | | Trustee since 2007 and President of the Trust since 2002 | | Chairman, Chief Executive Officer and President of EVC, Director and President of EV, Chief Executive Officer and President of EVM and BMR, and Director of EVD. Trustee and/or Officer of 173 registered investment companies and 4 private companies managed by EVM or BMR. Mr. Faust is an interested person because of his positions with EVM, BMR, EVD, EVC and EV, which are affiliates of the Trust and Portfolio. | | | 173 | | | Director of EVC | |
|
| Noninterested Trustees | | | | | | | | | | | | | |
|
Benjamin C. Esty
1/2/63 | | Trustee | | Since 2005 | | Roy and Elizabeth Simmons Professor of Business Administration, Harvard University Graduate School of Business Administration. | | | 173 | | | None | |
|
Allen R. Freedman
4/3/40 | | Trustee | | Since 2007 | | Former Chairman (2002-2004) and a Director (1983-2004) of Systems & Computer Technology Corp. (provider of software to higher education). Formerly, a Director of Loring Ward International (fund distributor) (2005-2007). Formerly, Chairman and a Director of Indus International Inc. (provider of enterprise management software to the power generating industry) (2005-2007). | | | 173 | | | Director of Assurant, Inc. and Stonemor Partners L.P. (owner and operator of cemeteries) | |
|
William H. Park
9/19/47 | | Trustee | | Since 2003 | | Vice Chairman, Commercial Industrial Finance Corp. (specialty finance company) (since 2006). Formerly, President and Chief Executive Officer, Prizm Capital Management, LLC (investment management firm) (2002-2005). | | | 173 | | | None | |
|
Ronald A. Pearlman
7/10/40 | | Trustee | | Since 2003 | | Professor of Law, Georgetown University Law Center. | | | 173 | | | None | |
|
| Helen Frame Peters 3/22/48 | | Trustee | | Since 2008 | | Professor of Finance, Carroll School of Management, Boston College (since 2003). Adjunct Professor of Finance, Peking University, Beijing, China (since 2005). Formerly, Dean, Carroll School of Management, Boston College (2000-2003). | | | 173 | | | Director of Federal Home Loan Bank of Boston (a bank for banks) and BJ's Wholesale Clubs (wholesale club retailer); Trustee of SPDR Index Shares Funds and SPDR Series Trust (exchange traded funds) | |
|
37
Eaton Vance High Income Opportunities Fund
MANAGEMENT AND ORGANIZATION CONT'D
Name and
Date of Birth | | Position(s)
with the
Trust and
the Portfolio | | Term of
Office and
Length of
Service | | Principal Occupation(s)
During Past Five Years | | Number of Portfolios
in Fund Complex
Overseen By
Trustee(1) | | Other Directorships Held | |
| Noninterested Trustees (continued) | | | | | | | | | | | | | |
|
| Heidi L. Steiger 7/8/53 | | Trustee | | Since 2007 | | Managing Partner, Topridge Associates LLC (global wealth management firm) (since 2008); Senior Advisor (since 2008), President (2005-2008), Lowenhaupt Global Advisors, LLC (global wealth management firm). Formerly, President and Contributing Editor, Worth Magazine (2004-2005). Formerly, Executive Vice President and Global Head of Private Asset Management (and various other positions), Neuberger Berman (investment firm) (1986-2004). | | | 173 | | | Director of Nuclear Electric Insurance Ltd. (nuclear insurance provider) and Aviva USA (insurance provider) | |
|
| Lynn A. Stout 9/14/57 | | Trustee | | Since 1998 | | Paul Hastings Professor of Corporate and Securities Law (since 2006) and Professor of Law (2001-2006), University of California at Los Angeles School of Law. | | | 173 | | | None | |
|
| Ralph F. Verni 1/26/43 | | Chairman of the Board and Trustee | | Chairman of the Board since 2007 and Trustee since 2005 | | Consultant and private investor. | | | 173 | | | None | |
|
| Principal Officers who are not Trustees | | | | | | | |
|
Name and
Date of Birth | | Position(s)
with the
Trust and
the Portfolio | | Term of
Office and
Length of
Service | | Principal Occupation(s)
During Past Five Years | |
| William H. Ahern, Jr. 7/28/59 | | Vice President of the Trust | | Since 1995 | | Vice President of EVM and BMR. Officer of 75 registered investment companies managed by EVM or BMR. | |
|
| John R. Baur 2/10/70 | | Vice President of the Trust | | Since 2007 | | Vice President of EVM and BMR. Previously, attended Johnson Graduate School of Management, Cornell University (2002-2005), and prior thereto he was an Account Team Representative in Singapore for Applied Materials Inc. Officer of 33 registered investment companies managed by EVM or BMR. | |
|
| Michael A. Cirami 12/24/75 | | Vice President of the Trust | | Since 2007 | | Vice President of EVM and BMR. Previously, attended the University of Rochester William E. Simon Graduate School of Business Administration (2001-2003), and prior thereto he was a Team Leader for the Institutional Services Group for State Street Bank in Luxembourg. Officer of 33 registered investment companies managed by EVM or BMR. | |
|
| Cynthia J. Clemson 3/2/63 | | Vice President of the Trust | | Since 2005 | | Vice President of EVM and BMR. Officer of 90 registered investment companies managed by EVM or BMR. | |
|
| Charles B. Gaffney 12/4/72 | | Vice President of the Trust | | Since 2007 | | Vice President of EVM and BMR. Previously, Sector Portfolio Manager and Senior Equity Analyst of Brown Brothers Harriman (1997-2003). Officer of 30 registered investment companies managed by EVM or BMR. | |
|
| Thomas P. Huggins 3/7/66 | | Vice President of the Portfolio | | Since 2000 | | Vice President of EVM and BMR. Officer of 4 registered investment companies managed by EVM or BMR. | |
|
| Christine M. Johnston 11/9/72 | | Vice President of the Trust | | Since 2007 | | Vice President of EVM and BMR. Officer of 35 registered investment companies managed by EVM or BMR. | |
|
| Aamer Khan 6/7/60 | | Vice President of the Trust | | Since 2005 | | Vice President of EVM and BMR. Officer of 33 registered investment companies managed by EVM or BMR. | |
|
| Thomas H. Luster 4/8/62 | | Vice President of the Trust | | Since 2006 | | Vice President of EVM and BMR. Officer of 51 registered investment companies managed by EVM or BMR. | |
|
38
Eaton Vance High Income Opportunities Fund
MANAGEMENT AND ORGANIZATION CONT'D
Name and
Date of Birth | | Position(s)
with the
Trust and
the Portfolio | | Term of
Office and
Length of
Service | | Principal Occupation(s)
During Past Five Years | |
| Principal Officers who are not Trustees (continued) | | | | | | | |
|
| Robert B. MacIntosh 1/22/57 | | Vice President of the Trust | | Since 1998 | | Vice President of EVM and BMR. Officer of 90 registered investment companies managed by EVM or BMR. | |
|
| Duncan W. Richardson 10/26/57 | | Vice President of the Trust | | Since 2001 | | Executive Vice President and Chief Equity Investment Officer of EVC, EVM and BMR. Officer 81 registered investment companies managed by EVM or BMR. | |
|
| Judith A. Saryan 8/21/54 | | Vice President of the Trust | | Since 2003 | | Vice President of EVM and BMR. Officer of 55 registered investment companies managed by EVM or BMR. | |
|
| Susan Schiff 3/13/61 | | Vice President of the Trust | | Since 2002 | | Vice President of EVM and BMR. Officer of 36 registered investment companies managed by EVM or BMR. | |
|
| Thomas Seto 9/27/62 | | Vice President of the Trust | | Since 2007 | | Vice President and Director of Portfolio Management of Parametric. Officer of 31 registered investment companies managed by EVM or BMR. | |
|
| David M. Stein 5/4/51 | | Vice President of the Trust | | Since 2007 | | Managing Director and Chief Investment Officer of Parametric. Officer of 31 registered investment companies managed by EVM or BMR. | |
|
| Mark S. Venezia 5/23/49 | | Vice President of the Trust | | Since 2007 | | Vice President of EVM and BMR. Officer of 36 registered investment companies managed by EVM or BMR. | |
|
| Adam A. Weigold 3/22/75 | | Vice President of the Trust | | Since 2007 | | Vice President of EVM and BMR. Officer of 71 registered investment companies managed by EVM or BMR. | |
|
| Michael W. Weilheimer 2/11/61 | | President of the Portfolio | | Since 2002 | | Vice President of EVM and BMR. Officer of 26 registered investment companies managed by EVM or BMR. | |
|
| Barbara E. Campbell 6/19/57 | | Treasurer | | Of the Trust since 2005 and of the Portfolio since 2008(2) | | Vice President of EVM and BMR. Officer of 173 registered investment companies managed by EVM or BMR. | |
|
| Maureen A. Gemma 5/24/60 | | Secretary and Chief Legal Officer | | Secretary since 2007 and Chief Legal Officer since 2008 | | Vice President of EVM and BMR. Officer of 173 registered investment companies managed by EVM or BMR. | |
|
| Paul M. O'Neil 7/11/53 | | Chief Compliance Officer | | Since 2004 | | Vice President of EVM and BMR. Officer of 173 registered investment companies managed by EVM or BMR. | |
|
(1) Includes both master and feeder funds in a master-feeder structure.
(2) Prior to 2008, Ms. Campbell served as Assistant Treasurer of the Portfolio since 1993.
The SAI for the Fund includes additional information about the Trustees and officers of the Fund and the Portfolio and can be obtained without charge on Eaton Vance's website at www.eatonvance.com or by calling 1-800-262-1122.
39
This Page Intentionally Left Blank
Investment Adviser of High Income Opportunities Portfolio
Boston Management and Research
The Eaton Vance Building
255 State Street
Boston, MA 02109
Administrator of Eaton Vance High Income Opportunities Fund
Eaton Vance Management
The Eaton Vance Building
255 State Street
Boston, MA 02109
Principal Underwriter
Eaton Vance Distributors, Inc.
The Eaton Vance Building
255 State Street
Boston, MA 02109
(617) 482-8260
Custodian
State Street Bank and Trust Company
200 Clarendon Street
Boston, MA 02116
Transfer Agent
PNC Global Investment Servicing
Attn: Eaton Vance Funds
P.O. Box 9653
Providence, RI 02940-9653
(800) 262-1122
Independent Registered Public Accounting Firm
Deloitte & Touche LLP
200 Berkeley Street
Boston, MA 02116-5022
Eaton Vance High Income Opportunities Fund
The Eaton Vance Building
255 State Street
Boston, MA 02109
This report must be preceded or accompanied by a current prospectus. Before investing, investors should consider carefully the Fund's investment objective(s), risks, and charges and expenses. The Fund's current prospectus contains this and other information about the Fund and is available through your financial advisor. Please read the prospectus carefully before you invest or send money. For further information please call 1-800-262-1122.
446-12/08 HISRC

Annual Report October 31, 2008


EATON VANCE
INTERNATIONAL
EQUITY
FUND
IMPORTANT NOTICES REGARDING PRIVACY,
DELIVERY OF SHAREHOLDER DOCUMENTS,
PORTFOLIO HOLDINGS AND PROXY VOTING
Privacy. The Eaton Vance organization is committed to ensuring your financial privacy. Each of the financial institutions identified below has in effect the following policy ("Privacy Policy") with respect to nonpublic personal information about its customers:
• Only such information received from you, through application forms or otherwise, and information about your Eaton Vance fund transactions will be collected. This may include information such as name, address, social security number, tax status, account balances and transactions.
• None of such information about you (or former customers) will be disclosed to anyone, except as permitted by law (which includes disclosure to employees necessary to service your account). In the normal course of servicing a customer's account, Eaton Vance may share information with unaffiliated third parties that perform various required services such as transfer agents, custodians and broker/dealers.
• Policies and procedures (including physical, electronic and procedural safeguards) are in place that are designed to protect the confidentiality of such information.
• We reserve the right to change our Privacy Policy at any time upon proper notification to you. Customers may want to review our Policy periodically for changes by accessing the link on our homepage: www.eatonvance.com.
Our pledge of privacy applies to the following entities within the Eaton Vance organization: the Eaton Vance Family of Funds, Eaton Vance Management, Eaton Vance Investment Counsel, Boston Management and Research, and Eaton Vance Distributors, Inc.
In addition, our Privacy Policy only applies to those Eaton Vance customers who are individuals and who have a direct relationship with us. If a customer's account (i.e. fund shares) is held in the name of a third-party financial adviser/ broker-dealer, it is likely that only such adviser's privacy policies apply to the customer. This notice supersedes all previously issued privacy disclosures.
For more information about Eaton Vance's Privacy Policy, please call 1-800-262-1122.
Delivery of Shareholder Documents. The Securities and Exchange Commission (the "SEC") permits funds to deliver only one copy of shareholder documents, including prospectuses, proxy statements and shareholder reports, to fund investors with multiple accounts at the same residential or post office box address. This practice is often called "householding" and it helps eliminate duplicate mailings to shareholders.
Eaton Vance, or your financial adviser, may household the mailing of your documents indefinitely unless you instruct Eaton Vance, or your financial adviser, otherwise.
If you would prefer that your Eaton Vance documents not be householded, please contact Eaton Vance at 1-800-262-1122, or contact your financial adviser.
Your instructions that householding not apply to delivery of your Eaton Vance documents will be effective within 30 days of receipt by Eaton Vance or your financial adviser.
Portfolio Holdings. Each Eaton Vance Fund and its underlying Portfolio (if applicable) will file a schedule of its portfolio holdings on Form N-Q with the SEC for the first and third quarters of each fiscal year. The Form N-Q will be available on the Eaton Vance website www.eatonvance.com, by calling Eaton Vance at 1-800-262-1122 or in the EDGAR database on the SEC's website at www.sec.gov. Form N-Q may also be reviewed and copied at the SEC's public reference room in Washington, D.C. (call 1-800-732-0330 for information on the operation of the public reference room).
Proxy Voting. From time to time, funds are required to vote proxies related to the securities held by the funds. The Eaton Vance Funds or their underlying Portfolios (if applicable) vote proxies according to a set of policies and procedures approved by the Funds' and Portfolios' Boards. You may obtain a description of these policies and procedures and information on how the Funds or Portfolios voted proxies relating to portfolio securities during the most recent 12 month period ended June 30, without charge, upon request, by calling 1-800-262-1122. This description is also available on the SEC's website at www.sec.gov.
Eaton Vance International Equity Fund as of October 31, 2008
MANAGEMENT’S DISCUSSION OF FUND PERFORMANCE

Edward R. Allen, III, CFA
Eagle Global Advisors
Co-Portfolio Manager

Thomas N. Hunt, III, CFA
Eagle Global Advisors
Co-Portfolio Manager
Economic and Market Conditions
· Global economic fundamentals deteriorated markedly during the Fund’s fiscal year ended October 31, 2008, as the severe credit crunch caused by the worldwide financial crisis reverberated across the world’s major economies. In the first half of the period, stock markets globally began to experience dramatic sell-offs, several banks had to be rescued, and central banks moved quickly to cut rates. European governments pledged over $2 trillion to shore up their financial sector, while the U.S. also unveiled its own comprehensive rescue plan to expand depositor protection, recapitalize some financial institutions, and provide a temporary guarantee of bank borrowing. Europe struggled with high inflation and a slowing economy; however, unlike in the U.S. where the Federal Reserve had been gradually reducing interest rates, the European Central Bank had maintained its relatively high rate policy until recently. As a result, economic activity in many European countries, including France, Italy, Spain, Ireland, and Sweden, turned down swiftly, while the Euro and British pound depreciated versus the U.S. dollar. By the end of the period, the Eurozone had officially declared a recession.
· Elsewhere, Japan showed signs of economic slowdown, and is now officially in a recession. China, which had been the bright spot among the emerging markets, experienced slower-than-expected economic growth and announced a stimulus package of its own. Russian economic growth came to a halt, India appeared headed for an outright slowdown, and although Brazil remained fundamentally healthy, risk appetite for investing there had dwindled by the end of the Fund’s fiscal year on October 31, 2008.
Management Discussion
· By the end of the fiscal year ended October 31, 2008, there was a marked transformation in the performance of global equities, as they moved from a position of relative strength to one of underperformance. Against this backdrop, the Fund’s benchmark, the MSCI Europe, Australasia, Far East Index (the MSCI EAFE Index), posted double-digit losses in each of its 10 economic sectors. The Fund(1) also posted a negative return, trailing that of the MSCI EAFE Index and outperforming that of its Lipper peer group for the year ended October 31, 2008.(2)
· Markets worldwide also saw a reshuffling of sector leadership in reaction to the dramatic downshift in economic activity. As oil prices and commodities fell drastically in the third and fourth quarters, the economically sensitive energy and materials sectors were hardest hit. Management shifted the Fund’s positions, reducing exposure to these sectors, while selectively adding to health care and consumer staples holdings, which historically have been more defensive investments. However, although the Fund’s sector allocations were generally additive to performance, momentum changed so rapidly that the Fund’s stock selection in some of these areas underperformed the MSCI EAFE Index.(2)
Eaton Vance International Equity Fund
Total Return Performance 10/31/07 — 10/31/08
Class A(3) | | -47.91 | % |
Class C(3) | | -48.33 | |
Class I(3) | | -47.79 | |
MSCI EAFE Index(2) | | -46.62 | |
Lipper International Multi-Cap Growth Funds Average(2) | | -49.95 | |
See page 3 for more performance information.
(1) | The Fund currently invests in a separate registered investment company, International Equity Portfolio, with the same objective and policies as the Fund. References to investments are to the Portfolio’s holdings. |
| |
(2) | It is not possible to invest directly in an Index or a Lipper Classification. The Index’s total return does not reflect commissions or expenses that would have been incurred if an investor individually purchased or sold the securities represented in the Index. The Lipper total return is the average total return, at net asset value, of the funds that are in the same Lipper Classification as the Fund. |
| |
(3) | These returns do not include the 5.75% maximum sales charge for Class A shares or the applicable contingent deferred sales charge (CDSC) for Class C shares. If sales charges were deducted, the returns would be lower. Class I shares are offered to certain investors at net asset value. Class A and Class I shares are subject to a 1.00% redemption fee if redeemed or exchanged within 90 days of settlement of purchase. Absent an allocation of certain expenses to the adviser and sub-adviser of the Portfolio and the administrator of the Fund, the returns would have been lower. |
Past performance is no guarantee of future results. Returns are historical and are calculated by determining the percentage change in net asset value or offering price (as applicable) with all distributions reinvested. Investment return and principal value will fluctuate so that shares, when redeemed, may be worth more or less than their original cost. Performance is for the stated time period only; due to market volatility, the Fund’s current performance may be lower or higher than the quoted return. Absent an expense limitation or waiver in effect for certain periods, performance would have been lower. For performance as of the most recent month end, please refer to www.eatonvance.com.
Fund shares are not insured by the FDIC and are not deposits or other obligations of, or guaranteed by, any depository institution. Shares are subject to investment risks, including possible loss of principal invested.
1
· Specifically, energy was the biggest detractor from relative performance on a sector level, as Fund holdings among oil, gas, and consumables names underperformed their Index counterparts. With the cyclical sectors — materials, industrials, and utilities — falling out of favor during the period, stock selection in those groups also made negative contributions to returns.
· The Fund’s exposure to the underperforming emerging markets also proved to be a drag on performance. Management reduced the exposure during the period, as the once-outperforming group began to show signs it was not immune to the global economic downturn.
· Conversely, the Fund’s best relative performance came from stock selection in the health care sector, particularly among pharmaceutical stocks. The Fund’s increased weighting in this group was focused on two Swiss and U.K. names, which were among the Fund’s top performers for the period. An overweight and stock selection in telecommunication services and an overweight in consumer staples were also additive to relative returns.
· At the end of the period, the Fund was more defensively positioned, as management concentrated increasingly on those sectors that historically have better weathered recessionary conditions, while reducing exposure to more sensitive sectors. The Fund remained focused on investing in companies across the globe that management believes, through sound balance sheets, strong management, and dominant market position, can weather today’s volatility over time.
Portfolio Composition
Global Allocation*
By net assets
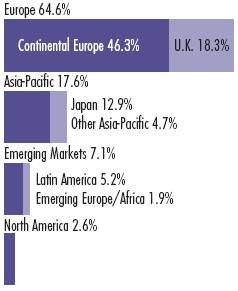
* | As a percentage of the Portfolio’s net assets as of 10/31/08. Excludes cash equivalents. |
Top Ten Holdings**
By net assets
Novartis AG ADR | | 4.5 | % |
Nestle SA ADR | | 4.2 | |
Diageo PLC ADR | | 4.0 | |
Nintendo Co., Ltd. | | 3.4 | |
France Telecom SA ADR | | 3.3 | |
Total SA ADR | | 3.2 | |
British American Tobacco PLC ADR | | 2.8 | |
Koninklijke KPN NV | | 2.7 | |
Rio Tinto PLC ADR | | 2.6 | |
Banco Santander Central Hispanico SA ADR | | 2.5 | |
** | Top Ten Holdings represented 33.2% of the Portfolio’s net assets as of 10/31/08. Excludes cash equivalents. |
The views expressed throughout this report are those of the portfolio managers and are current only through the end of the period of the report as stated on the cover. These views are subject to change at any time based upon market or other conditions, and the investment adviser disclaims any responsibility to update such views. These views may not be relied on as investment advice and, because investment decisions for a fund are based on many factors, may not be relied on as an indication of trading intent on behalf of any Eaton Vance fund. Portfolio information provided in the report may not be representative of the Portfolio’s current or future investments and may change due to active management.
2
Eaton Vance International Equity Fund as of October 31, 2008
FUND PERFORMANCE
The line graph and table set forth below provide information about the Fund’s performance. The line graph compares the performance of Class A of the Fund with that of the MSCI EAFE Index, a broad-based, unmanaged market index of international stocks. The lines on the graph represent the total returns of a hypothetical investment of $10,000 in each of Class A and the Index. Class A total returns are presented at net asset value and maximum public offering price. The table includes the total returns of each Class of the Fund at net asset value and maximum public offering price. The performance presented below does not reflect the deduction of taxes, if any, that a shareholder would pay on distributions or redemptions of Fund shares.
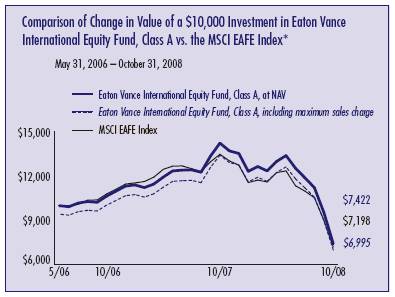
* Source: Lipper Inc. Class A of the Fund commenced investment operations on 5/31/06.
A $10,000 hypothetical investment at net asset value in Class C and Class I shares on 5/31/06 (commencement of operations) would have been valued at $7,287 and $7,464, respectively, on 10/31/08. It is not possible to invest directly in an Index. The Index’s total return does not reflect commissions or expenses that would have been incurred if an investor individually purchased or sold the securities represented in the Index.
Performance(1)
Share Class Symbol | | Class A
EAIEX | | Class C
ECIEX | | Class I
EIIEX | |
Average Annual Total Returns (at net asset value) | | | | | | | |
One Year | | -47.91 | % | -48.33 | % | -47.79 | % |
Life of Fund† | | -11.58 | | -12.25 | | -11.38 | |
| | | | | | | |
SEC Average Annual Total Returns (including sales charge or applicable CDSC) | | | | | | | |
One Year | | -50.92 | % | -48.84 | % | -47.79 | % |
Life of Fund† | | -13.72 | | -12.25 | | -11.38 | |
† | Inception Dates — Class A, Class C, and Class I: 5/31/06 |
| |
(1) | Average annual total returns do not include the 5.75% maximum sales charge for Class A shares or the applicable contingent deferred sales charge (CDSC) for Class C shares. If sales charges were deducted, the returns would be lower. Class A and Class I shares are subject to a 1.00% redemption fee if redeemed or exchanged within 90 days of settlement of purchase. SEC average annual total returns for Class A reflect the maximum 5.75% sales charge. SEC returns for Class C reflect a 1% CDSC for the first year. Class I shares are offered to certain investors at net asset value. Absent an allocation of certain expenses to the adviser and sub- adviser of the Portfolio and the administrator of the Fund, the returns would have been lower. |
Total Annual | | | | | | | |
Operating Expenses(2) | | Class A | | Class C | | Class I | |
Gross Expense Ratio | | 2.70 | % | 3.45 | % | 2.45 | % |
Net Expense Ratio | | 1.51 | | 2.26 | | 1.26 | |
(2) | Source: Prospectus dated 3/1/08. The net expense ratio reflects a contractual expense limitation that continues through February 28, 2009. Thereafter, the expense limitation may be changed or terminated at any time. Without this expense limitation, performance would have been lower. |
Past performance is no guarantee of future results. Returns are historical and are calculated by determining the percentage change in net asset value or offering price (as applicable) with all distributions reinvested. Investment return and principal value will fluctuate so that shares, when redeemed, may be worth more or less than their original cost. Performance is for the stated time period only; due to market volatility, the Fund’s current performance may be lower or higher than the quoted return. Absent an expense limitation or waiver in effect for certain periods, performance would have been lower. For performance as of the most recent month end, please refer to www.eatonvance.com.
3
Eaton Vance International Equity Fund as of October 31, 2008
FUND EXPENSES
Example: As a shareholder of the Fund, you incur two types of costs: (1) transaction costs, including sales charges (loads) on purchases and redemption fees (if applicable); and (2) ongoing costs, including management fees; distribution or service fees; and other Fund expenses. This Example is intended to help you understand your ongoing costs (in dollars) of investing in the Fund and to compare these costs with the ongoing costs of investing in other mutual funds. The Example is based on an investment of $1,000 invested at the beginning of the period and held for the entire period (May 1, 2008 – October 31, 2008).
Actual Expenses: The first section of the table below provides information about actual account values and actual expenses. You may use the information in this section, together with the amount you invested, to estimate the expenses that you paid over the period. Simply divide your account value by $1,000 (for example, an $8,600 account value divided by $1,000 = 8.6), then multiply the result by the number in the first section under the heading entitled "Expenses Paid During Period" to estimate the expenses you paid on your account during this period.
Hypothetical Example for Comparison Purposes: The second section of the table below provides information about hypothetical account values and hypothetical expenses based on the actual Fund expense ratio and an assumed rate of return of 5% per year (before expenses), which is not the actual return of the Fund. The hypothetical account values and expenses may not be used to estimate the actual ending account balance or expenses you paid for the period. You may use this information to compare the ongoing costs of investing in your Fund and other funds. To do so, compare this 5% hypothetical example with the 5% hypothetical examples that appear in the shareholder reports of the other funds.
Please note that the expenses shown in the table are meant to highlight your ongoing costs only and do not reflect any transactional costs, such as sales charges (loads) or redemption fees (if applicable). Therefore, the second section of the table is useful in comparing ongoing costs only, and will not help you determine the relative total costs of owning different funds. In addition, if these transactional costs were included, your costs would have been higher.
Eaton Vance International Equity Fund
| | | Beginning Account Value
(5/1/08) | | Ending Account Value
(10/31/08) | | Expenses Paid During Period*
(5/1/08 – 10/31/08) | |
| Actual | |
| Class A | | $ | 1,000.00 | | | $ | 570.80 | | | $ | 5.92 | ** | |
| Class C | | $ | 1,000.00 | | | $ | 568.70 | | | $ | 8.70 | ** | |
| Class I | | $ | 1,000.00 | | | $ | 571.80 | | | $ | 4.94 | ** | |
| Hypothetical | |
| (5% return per year before expenses) | |
| Class A | | $ | 1,000.00 | | | $ | 1,017.60 | | | $ | 7.61 | ** | |
| Class C | | $ | 1,000.00 | | | $ | 1,013.80 | | | $ | 11.39 | ** | |
| Class I | | $ | 1,000.00 | | | $ | 1,018.90 | | | $ | 6.34 | ** | |
* Expenses are equal to the Fund's annualized expense ratio of 1.50% for Class A shares, 2.25% for Class C shares and 1.25% for Class I shares, multiplied by the average account value over the period, multiplied by 184/366 (to reflect the one-half year period). The Example assumes that the $1,000 was invested at the net asset value per share determined at the close of business on April 30, 2008. The Example reflects the expenses of both the Fund and the Portfolio.
** Absent an allocation of certain expenses to the adviser and sub-adviser of the Portfolio and the administrator of the Fund, expenses would be higher.
4
Eaton Vance International Equity Fund as of October 31, 2008
FINANCIAL STATEMENTS
Statement of Assets and Liabilities
As of October 31, 2008
| Assets | |
Investment in International Equity Portfolio, at value
(identified cost, $24,817,277) | | $ | 16,581,370 | | |
| Receivable for Fund shares sold | | | 57,132 | | |
| Total assets | | $ | 16,638,502 | | |
| Liabilities | |
| Payable for Fund shares redeemed | | $ | 39,938 | | |
| Payable to affiliate for distribution and service fees | | | 2,231 | | |
| Payable to affiliate for Trustees' fees | | | 42 | | |
| Payable to the administrator of the Fund and the sub-adviser of the Portfolio | | | 8,058 | | |
| Accrued expenses | | | 33,892 | | |
| Total liabilities | | $ | 84,161 | | |
| Net Assets | | $ | 16,554,341 | | |
| Sources of Net Assets | |
| Paid-in capital | | $ | 27,594,385 | | |
Accumulated net realized loss from Portfolio (computed on the basis of
identified cost) | | | (3,123,812 | ) | |
| Accumulated undistributed net investment income | | | 319,675 | | |
Net unrealized depreciation from Portfolio (computed on the basis of
identified cost) | | | (8,235,907 | ) | |
| Total | | $ | 16,554,341 | | |
| Class A Shares | |
| Net Assets | | $ | 5,083,998 | | |
| Shares Outstanding | | | 700,188 | | |
Net Asset Value and Redemption Price Per Share
(net assets ÷ shares of beneficial interest outstanding) | | $ | 7.26 | | |
Maximum Offering Price Per Share
(100 ÷ 94.25 of $7.26) | | $ | 7.70 | | |
| Class C Shares | |
| Net Assets | | $ | 1,350,087 | | |
| Shares Outstanding | | | 188,622 | | |
Net Asset Value and Offering Price Per Share*
(net assets ÷ shares of beneficial interest outstanding) | | $ | 7.16 | | |
| Class I Shares | |
| Net Assets | | $ | 10,120,256 | | |
| Shares Outstanding | | | 1,389,189 | | |
Net Asset Value, Offering Price and Redemption Price Per Share
(net assets ÷ shares of beneficial interest outstanding) | | $ | 7.29 | | |
| On sales of $50,000 or more, the offering price of Class A shares is reduced. | |
* Redemption price per share is equal to the net asset value less any applicable contingent deferred sales charge.
Statement of Operations
For the Year Ended
October 31, 2008
| Investment Income | |
| Dividends allocated from Portfolio (net of foreign taxes, $48,017) | | $ | 676,778 | | |
| Interest allocated from Portfolio | | | 35,994 | | |
| Expenses allocated from Portfolio | | | (266,076 | ) | |
| Net investment income from Portfolio | | $ | 446,696 | | |
| Expenses | |
| Trustees' fees and expenses | | $ | 364 | | |
Distribution and service fees
Class A | | | 16,175 | | |
| Class C | | | 18,945 | | |
| Registration fees | | | 38,561 | | |
| Legal and accounting services | | | 22,279 | | |
| Custodian fee | | | 19,419 | | |
| Transfer and dividend disbursing agent fees | | | 18,856 | | |
| Printing and postage | | | 7,610 | | |
| Miscellaneous | | | 11,616 | | |
| Total expenses | | $ | 153,825 | | |
Deduct —
Allocation of expenses to the administrator of the Fund and the
sub-adviser of the Portfolio | | $ | 118,248 | | |
| Total expense reductions | | $ | 118,248 | | |
| Net expenses | | $ | 35,577 | | |
| Net investment income | | $ | 411,119 | | |
Realized and Unrealized
Gain (Loss) from Portfolio | |
Net realized gain (loss) —
Investment transactions (identified cost basis),
net of foreign taxes of $636 | | $ | (3,043,588 | ) | |
| Foreign currency transactions | | | (42,472 | ) | |
| Net realized loss | | $ | (3,086,060 | ) | |
Change in unrealized appreciation (depreciation) —
Investments (identified cost basis), | | $ | (11,094,108 | ) | |
| Foreign currency | | | (2,310 | ) | |
| Net change in unrealized appreciation (depreciation) | | $ | (11,096,418 | ) | |
| Net realized and unrealized loss | | $ | (14,182,478 | ) | |
| Net decrease in net assets from operations | | $ | (13,771,359 | ) | |
See notes to financial statements
5
Eaton Vance International Equity Fund as of October 31, 2008
FINANCIAL STATEMENTS CONT'D
Statements of Changes in Net Assets
Increase (Decrease)
in Net Assets | | Year Ended
October 31, 2008 | | Year Ended
October 31, 2007 | |
From operations —
Net investment income | | $ | 411,119 | | | $ | 302,578 | | |
Net realized loss from investment
and foreign currency transactions | | | (3,086,060 | ) | | | (80,283 | ) | |
Net change in unrealized appreciation
(depreciation) from investments and
foreign currency | | | (11,096,418 | ) | | | 2,707,034 | | |
Net increase (decrease) in net assets
from operations | | $ | (13,771,359 | ) | | $ | 2,929,329 | | |
Distributions to shareholders —
From net investment income
Class A | | $ | (109,757 | ) | | $ | (3,071 | ) | |
| Class C | | | (27,887 | ) | | | (771 | ) | |
| Class I | | | (190,286 | ) | | | (15,417 | ) | |
| Total distributions to shareholders | | $ | (327,930 | ) | | $ | (19,259 | ) | |
Transactions in shares of beneficial interest —
Proceeds from sale of shares
Class A | | $ | 8,307,641 | | | $ | 3,159,566 | | |
| Class C | | | 2,065,863 | | | | 1,104,672 | | |
| Class I | | | 11,776,779 | | | | 5,282,824 | | |
Net asset value of shares issued to
shareholders in payment of
distributions declared
Class A | | | 88,207 | | | | 1,735 | | |
| Class C | | | 18,103 | | | | 636 | | |
| Class I | | | 141,231 | | | | 13,413 | | |
Cost of shares redeemed
Class A | | | (3,189,006 | ) | | | (130,804 | ) | |
| Class C | | | (807,346 | ) | | | (269,863 | ) | |
| Class I | | | (2,861,556 | ) | | | (288,484 | ) | |
| Redemption fees | | | 2,522 | | | | 487 | | |
Net increase in net assets from
Fund share transactions | | $ | 15,542,438 | | | $ | 8,874,182 | | |
| Net increase in net assets | | $ | 1,443,149 | | | $ | 11,784,252 | | |
| Net Assets | |
| At beginning of year | | $ | 15,111,192 | | | $ | 3,326,940 | | |
| At end of year | | $ | 16,554,341 | | | $ | 15,111,192 | | |
Accumulated undistributed
net investment income
included in net assets | |
| At end of year | | $ | 319,675 | | | $ | 279,594 | | |
See notes to financial statements
6
Eaton Vance International Equity Fund as of October 31, 2008
FINANCIAL STATEMENTS CONT'D
Financial Highlights
| | | Class A | |
| | | Year Ended October 31, | | Period Ended | |
| | | 2008(2) | | 2007(2) | | October 31, 2006(1)(2) | |
| Net asset value — Beginning of period | | $ | 14.200 | | | $ | 10.650 | | | $ | 10.000 | | |
| Income (loss) from operations | |
| Net investment income (loss) | | $ | 0.209 | | | $ | 0.468 | (7) | | $ | (0.003 | ) | |
| Net realized and unrealized gain (loss) | | | (6.901 | ) | | | 3.119 | | | | 0.653 | | |
| Total income (loss) from operations | | $ | (6.692 | ) | | $ | 3.587 | | | $ | 0.650 | | |
| Less distributions | |
| From net investment income | | $ | (0.249 | ) | | $ | (0.038 | ) | | $ | — | | |
| Total distributions | | $ | (0.249 | ) | | $ | (0.038 | ) | | $ | — | | |
| Redemption fees | | $ | 0.001 | | | $ | 0.001 | | | $ | 0.000 | (3) | |
| Net asset value — End of period | | $ | 7.260 | | | $ | 14.200 | | | $ | 10.650 | | |
| Total Return(4) | | | (47.91 | )% | | | 33.78 | % | | | 6.50 | %(9) | |
| Ratios/Supplemental Data | |
| Net assets, end of period (000's omitted) | | $ | 5,084 | | | $ | 4,124 | | | $ | 430 | | |
| Ratios (As a percentage of average daily net assets): | | | | | | | | | | | | | |
| Expenses before custodian fee reduction(5)(6) | | | 1.50 | % | | | 1.50 | % | | | 1.51 | %(8) | |
| Expenses after custodian fee reduction(5)(6) | | | 1.50 | % | | | 1.50 | % | | | 1.50 | %(8) | |
| Net investment income (loss) | | | 1.80 | % | | | 3.82 | %(7) | | | (0.08 | )%(8) | |
| Portfolio Turnover of the Portfolio | | | 35 | % | | | 21 | % | | | 1 | % | |
(1) For the period from the start of business, May 31, 2006, to October 31, 2006.
(2) Net investment income (loss) and redemption fees per share were computed using average shares outstanding.
(3) Amount represents less than $0.0005 per share.
(4) Returns are historical and are calculated by determining the percentage change in net asset value with all distributions reinvested.
(5) Includes the Fund's share of the Portfolio's allocated expenses.
(6) The investment adviser waived all or a portion of its investment adviser fee and the investment adviser and administrator subsidized certain operating expenses (equal to 0.56%, 1.17% and 19.97% of average daily net assets for the years ended October 31, 2008 and 2007, and the period ended October 31, 2006, respectively). A portion of the waiver and subsidy was borne by the sub-adviser of the Portfolio. Absent the waiver and subsidy, total return would be lower.
(7) Net investment income per share reflects a dividend resulting from a corporate action allocated from the Portfolio which amounted to $0.342 per share. Excluding this dividend, the ratio of net investment income to average daily net assets would have been 1.02%.
(8) Annualized.
(9) Not annualized.
See notes to financial statements
7
Eaton Vance International Equity Fund as of October 31, 2008
FINANCIAL STATEMENTS CONT'D
Financial Highlights
| | | Class C | |
| | | Year Ended October 31, | | Period Ended | |
| | | 2008(2) | | 2007(2) | | October 31, 2006(1)(2) | |
| Net asset value — Beginning of period | | $ | 14.060 | | | $ | 10.620 | | | $ | 10.000 | | |
| Income (loss) from operations | |
| Net investment income (loss) | | $ | 0.130 | | | $ | 0.338 | (7) | | $ | (0.037 | ) | |
| Net realized and unrealized gain (loss) | | | (6.829 | ) | | | 3.127 | | | | 0.657 | | |
| Total income (loss) from operations | | $ | (6.699 | ) | | $ | 3.465 | | | $ | 0.620 | | |
| Less distributions | |
| From net investment income | | $ | (0.202 | ) | | $ | (0.026 | ) | | $ | — | | |
| Total distributions | | $ | (0.202 | ) | | $ | (0.026 | ) | | $ | — | | |
| Redemption fees | | $ | 0.001 | | | $ | 0.001 | | | $ | 0.000 | (3) | |
| Net asset value — End of period | | $ | 7.160 | | | $ | 14.060 | | | $ | 10.620 | | |
| Total Return(4) | | | (48.33 | )% | | | 32.79 | % | | | 6.20 | %(9) | |
| Ratios/Supplemental Data | |
| Net assets, end of period (000's omitted) | | $ | 1,350 | | | $ | 1,200 | | | $ | 170 | | |
| Ratios (As a percentage of average daily net assets): | |
| Expenses before custodian fee reduction(5)(6) | | | 2.25 | % | | | 2.25 | % | | | 2.26 | %(8) | |
| Expenses after custodian fee reduction(5)(6) | | | 2.25 | % | | | 2.25 | % | | | 2.25 | %(8) | |
| Net investment income (loss) | | | 1.12 | % | | | 2.78 | %(7) | | | (0.87 | )%(8) | |
| Portfolio Turnover of the Portfolio | | | 35 | % | | | 21 | % | | | 1 | % | |
(1) For the period from the start of business, May 31, 2006, to October 31, 2006.
(2) Net investment income (loss) and redemption fees per share were computed using average shares outstanding.
(3) Amount represents less than $0.0005 per share.
(4) Returns are historical and are calculated by determining the percentage change in net asset value with all distributions reinvested.
(5) Includes the Fund's share of the Portfolio's allocated expenses.
(6) The investment adviser waived all or a portion of its investment adviser fee and the investment adviser and administrator subsidized certain operating expenses (equal to 0.56%, 1.17% and 19.97% of average daily net assets for the years ended October 31, 2008 and 2007, and the period ended October 31, 2006, respectively). A portion of the waiver and subsidy was borne by the sub-adviser of the Portfolio. Absent the waiver and subsidy, total return would be lower.
(7) Net investment income per share reflects a dividend resulting from a corporate action allocated from the Portfolio which amounted to $0.290 per share. Excluding this dividend, the ratio of net investment income to average daily net assets would have been 0.39%.
(8) Annualized.
(9) Not annualized.
See notes to financial statements
8
Eaton Vance International Equity Fund as of October 31, 2008
FINANCIAL STATEMENTS CONT'D
Financial Highlights
| | | Class I | |
| | | Year Ended October 31, | | Period Ended | |
| | | 2008(2) | | 2007(2) | | October 31, 2006(1)(2) | |
| Net asset value — Beginning of period | | $ | 14.240 | | | $ | 10.660 | | | $ | 10.000 | | |
| Income (loss) from operations | |
| Net investment income | | $ | 0.246 | | | $ | 0.416 | (7) | | $ | 0.037 | | |
| Net realized and unrealized gain (loss) | | | (6.934 | ) | | | 3.206 | | | | 0.623 | | |
| Total income (loss) from operations | | $ | (6.688 | ) | | $ | 3.622 | | | $ | 0.660 | | |
| Less distributions | |
| From net investment income | | $ | (0.263 | ) | | $ | (0.043 | ) | | $ | — | | |
| Total distributions | | $ | (0.263 | ) | | $ | (0.043 | ) | | $ | — | | |
| Redemption fees | | $ | 0.001 | | | $ | 0.001 | | | $ | 0.000 | (3) | |
| Net asset value — End of period | | $ | 7.290 | | | $ | 14.240 | | | $ | 10.660 | | |
| Total Return(4) | | | (47.79 | )% | | | 34.09 | % | | | 6.60 | %(9) | |
| Ratios/Supplemental Data | |
| Net assets, end of period (000's omitted) | | $ | 10,120 | | | $ | 9,787 | | | $ | 2,726 | | |
| Ratios (As a percentage of average daily net assets): | |
| Expenses before custodian fee reduction(5)(6) | | | 1.25 | % | | | 1.25 | % | | | 1.26 | %(8) | |
| Expenses after custodian fee reduction(5)(6) | | | 1.25 | % | | | 1.25 | % | | | 1.25 | %(8) | |
| Net investment income | | | 2.12 | % | | | 3.43 | %(7) | | | 0.87 | %(8) | |
| Portfolio Turnover of the Portfolio | | | 35 | % | | | 21 | % | | | 1 | % | |
(1) For the period from the start of business, May 31, 2006, to October 31, 2006.
(2) Net investment income and redemption fees per share were computed using average shares outstanding.
(3) Amount represents less than $0.0005 per share.
(4) Returns are historical and are calculated by determining the percentage change in net asset value with all distributions reinvested.
(5) Includes the Fund's share of the Portfolio's allocated expenses.
(6) The investment adviser waived all or a portion of its investment adviser fee and the investment adviser and administrator subsidized certain operating expenses (equal to 0.56%, 1.17% and 19.97% of average daily net assets for the years ended October 31, 2008 and 2007, and the period ended October 31, 2006, respectively). A portion of the waiver and subsidy was borne by the sub-adviser of the Portfolio. Absent the waiver and subsidy, total return would be lower.
(7) Net investment income per share reflects a dividend resulting from a corporate action allocated from the Portfolio which amounted to $0.241 per share. Excluding this dividend, the ratio of net investment income to average daily net assets would have been 1.44%.
(8) Annualized.
(9) Not annualized.
See notes to financial statements
9
Eaton Vance International Equity Fund as of October 31, 2008
NOTES TO FINANCIAL STATEMENTS
1 Significant Accounting Policies
Eaton Vance International Equity Fund (the Fund) is a diversified series of Eaton Vance Mutual Funds Trust (the Trust). The Trust is a Massachusetts business trust registered under the Investment Company Act of 1940, as amended (the 1940 Act), as an open-end management investment company. The Fund offers three classes of shares. Class A shares are generally sold subject to a sales charge imposed at time of purchase. Class C shares are sold at net asset value and are generally subject to a contingent deferred sales charge (see Note 5). Class I shares are sold at net asset value and are not subject to a sales charge. Each class represents a pro-rata interest in the Fund, but votes separately on class-specific matters and (as noted below) is subject to different expenses. Realized and unrealized gains and losses and net investment income and losses, other than class-specific expenses, are allocated daily to each class of shares bas ed on the relative net assets of each class to the total net assets of the Fund. Each class of shares differs in its distribution plan and certain other class-specific expenses. The Fund invests all of its investable assets in interests in the International Equity Portfolio (the Portfolio), a New York trust, having the same investment objective and policies as the Fund. The value of the Fund's investment in the Portfolio reflects the Fund's proportionate interest in the net assets of the Portfolio (65.0% at October 31, 2008). The performance of the Fund is directly affected by the performance of the Portfolio. The financial statements of the Portfolio, including the portfolio of investments, are included elsewhere in this report and should be read in conjunction with the Fund's financial statements.
The following is a summary of significant accounting policies of the Fund. The policies are in conformity with accounting principles generally accepted in the United States of America.
A Investment Valuation — Valuation of securities by the Portfolio is discussed in Note 1A of the Portfolio's Notes to Financial Statements, which are included elsewhere in this report.
B Income — The Fund's net investment income or loss consists of the Fund's pro-rata share of the net investment income or loss of the Portfolio, less all actual and accrued expenses of the Fund.
C Federal Taxes — The Fund's policy is to comply with the provisions of the Internal Revenue Code applicable to regulated investment companies and to distribute to shareholders each year substantially all of its net investment income, and all or substantially all of its net realized capital gains. Accordingly, no provision for federal income or excise tax is necessary. At October 31, 2008, the Fund, for federal income tax purposes, had a capital loss carryforward of $3,051,690 which will reduce its taxable income arising from future net realized gains on investment transactions, if any, to the extent permitted by the Internal Reve nue Code, and thus will reduce the amount of distributions to shareholders which would otherwise be necessary to relieve the Fund of any liability for federal income or excise tax. Such capital loss carryforward will expire on October 31, 2014 ($7,211), October 31, 2015 ($65,592) and October 31, 2016 ($2,978,887).
In addition to the requirements of the Internal Revenue Code, the Fund may also be required to recognize its pro-rata share of the capital gains taxes incurred by the Portfolio. In doing so, the daily net asset value would reflect the Fund's pro-rata share of the estimated reserve for such taxes incurred by the Portfolio.
As of October 31, 2008, the Fund had no uncertain tax positions that would require financial statement recognition, de-recognition, or disclosure. Each of the Fund's federal tax returns filed since the start of business on May 31, 2006 to October 31, 2008 remains subject to examination by the Internal Revenue Service.
D Expenses — The majority of expenses of the Trust are directly identifiable to an individual fund. Expenses which are not readily identifiable to a specific fund are allocated taking into consideration, among other things, the nature and type of expense and the relative size of the funds.
E Expense Reduction — State Street Bank and Trust Company (SSBT) serves as custodian of the Fund. Pursuant to the custodian agreement, SSBT receives a fee reduced by credits, which are determined based on the average daily cash balance the Fund maintains with SSBT. All credit balances, if any, used to reduce the Fund's custodian fees are reported as a reduction of expenses in the Statement of Operations.
F Use of Estimates — The preparation of the financial statements in conformity with accounting principles generally accepted in the United States of America requires management to make estimates and assumptions that affect the reported amounts of assets and liabilities at the date of the financial statements and the reported amounts of income and expense during the reporting period. Actual results could differ from those estimates.
10
Eaton Vance International Equity Fund as of October 31, 2008
NOTES TO FINANCIAL STATEMENTS CONT'D
G Indemnifications — Under the Trust's organizational documents, its officers and Trustees may be indemnified against certain liabilities and expenses arising out of the performance of their duties to the Fund, and shareholders are indemnified against personal liability for the obligations of the Trust. Additionally, in the normal course of business, the Fund enters into agreements with service providers that may contain indemnification clauses. The Fund's maximum exposure under these arrangements is unknown as this would involve future claims that may be made against the Fund that have not yet occurred.
H Redemption Fees — Upon the redemption or exchange of shares by Class A and Class I shareholders within 90 days of the settlement of purchase, a fee of 1% of the current net asset value of these shares will be assessed and retained by the Fund for the benefit of the remaining shareholders. The redemption fee is accounted for as an addition to paid-in capital.
I Other — Investment transactions are accounted for on a trade date basis. Dividends to shareholders are recorded on the ex-dividend date.
2 Distributions to Shareholders
It is the present policy of the Fund to make at least one distribution annually (normally in December) of all or substantially all of its net investment income and to distribute annually all or substantially all of its net realized capital gains (reduced by available capital loss carryforwards from prior years, if any). Distributions are declared separately for each class of shares. Shareholders may reinvest income and capital gain distributions in additional shares of the same class of the Fund at the net asset value as of the ex-dividend date or, at the election of the shareholder, receive distributions in cash. The Fund distinguishes between distributions on a tax basis and a financial reporting basis. Accounting principles generally accepted in the United States of America require that only distributions in excess of tax basis earnings and profits be reported in the financial statements as a return of capital. Permanent diff erences between book and tax accounting relating to distributions are reclassified to paid-in capital.
The tax character of distributions declared for the years ended October 31, 2008 and October 31, 2007 was as follows:
| | | Year Ended October 31, | |
| | | 2008 | | 2007 | |
| Distributions declared from: | |
| Ordinary income | | $ | 327,930 | | | $ | 19,259 | | |
During the year ended October 31, 2008, accumulated net realized loss was decreased by $43,094, accumulated undistributed net investment income was decreased by $43,108, and paid-in capital was increased by $14 due to differences between book and tax accounting, primarily for foreign currency gain (loss) and foreign capital gains taxes. These reclassifications had no effect on the net assets or net asset value per share of the Fund.
As of October 31, 2008, the components of distributable earnings (accumulated losses) and unrealized appreciation (depreciation) on a tax basis were as follows:
| Undistributed ordinary income | | $ | 312,241 | | |
| Capital loss carryforward | | $ | (3,051,690 | ) | |
| Net unrealized depreciation | | $ | (8,300,595 | ) | |
The differences between components of distributable earnings (accumulated losses) on a tax basis and the amounts reflected in the Statement of Assets and Liabilities are primarily due to partnership allocations, wash sales and foreign currency transactions.
3 Transactions with Affiliates
Eaton Vance Management (EVM) serves as the administrator to the Fund, but receives no compensation. EVM and the sub-adviser of the Portfolio, Eagle Global Advisors, L.L.C. (Eagle), have agreed to reimburse the Fund's operating expenses to the extent that they exceed 1.50%, 2.25% and 1.25% annually of the Fund's average daily net assets for Class A, Class C and Class I, respectively. This agreement may be changed or terminated after February 28, 2009. Pursuant to this agreement, EVM and Eagle were allocated $59,124 and $59,124, respectively, of the Fund's operating expenses for the year ended October 31, 2008. The Portfolio has engaged Boston Management and Research (BMR), a subsidiary of EVM, to render investment advisory services. See Note 2 of the Portfolio's Notes to Financial Statements which are included elsewhere in this report. EVM serves as the sub-transfer agent of the Fund and receives from the transfer agent an aggreg ate fee based upon the actual expenses incurred by EVM in the performance of these services. For the year ended October 31, 2008, EVM earned $943 in sub-transfer agent fees. The Fund was informed that Eaton Vance Distributors, Inc. (EVD), an affiliate of EVM and the Fund's principal underwriter, received $14,247 as its portion of the sales charge on sales of Class A shares for the year ended October 31, 2008. EVD also received distribution and service fees from Class A and Class C shares (see Note 4) and contingent deferred sales charges (see Note 5).
11
Eaton Vance International Equity Fund as of October 31, 2008
NOTES TO FINANCIAL STATEMENTS CONT'D
Except for Trustees of the Fund and the Portfolio who are not members of EVM's or BMR's organizations, officers and Trustees receive remuneration for their services to the Fund out of the investment adviser fee. Certain officers and Trustees of the Fund and the Portfolio are officers of the above organizations.
4 Distribution Plans
The Fund has in effect a distribution plan for Class A shares (Class A Plan) pursuant to Rule 12b-1 under the 1940 Act. The Class A Plan provides that the Fund will pay EVD a distribution and service fee of 0.25% per annum of its average daily net assets attributable to Class A shares for distribution services and facilities provided to the Fund by EVD, as well as for personal services and/or the maintenance of shareholder accounts. Distribution and service fees paid or accrued to EVD for the year ended October 31, 2008 amounted to $16,175 for Class A shares. The Fund also has in effect a distribution plan for Class C shares (Class C Plan) pursuant to Rule 12b-1 under the 1940 Act. The Class C Plan requires the Fund to pay EVD amounts equal to 0.75% per annum of its average daily net assets attributable to Class C shares for providing ongoing distribution services and facilities to the Fund. The Fund will automatically discontin ue payments to EVD during any period in which there are no outstanding Uncovered Distribution Charges, which are equivalent to the sum of (i) 6.25% of the aggregate amount received by the Fund for Class C shares sold, plus (ii) interest calculated by applying the rate of 1% over the prevailing prime rate to the outstanding balance of Uncovered Distribution Charges of EVD of Class C, reduced by the aggregate amount of contingent deferred sales charges (see Note 5) and amounts theretofore paid or payable to EVD. For the year ended October 31, 2008, the Fund paid or accrued to EVD $14,209 for Class C shares, representing 0.75% of the average daily net assets of Class C shares. At October 31, 2008, the amount of Uncovered Distribution Charges of EVD calculated under the Class C Plan was approximately $91,000. The Class C Plan also authorizes the Fund to make payments of service fees to EVD, investment dealers, and other persons in amounts not exceeding 0.25% per annum of its average daily net assets attributable to that class. Service fees paid or accrued are for personal services and/or the maintenance of shareholder accounts. They are separate and distinct from the sales commissions and distribution fees payable to EVD and, as such, are not subject to automatic discontinuance when there are no outstanding Uncovered Distribution Charges of EVD. Service fees paid or accrued for the year ended October 31, 2008 amounted to $4,736 for Class C shares.
5 Contingent Deferred Sales Charges
A contingent deferred sales charge (CDSC) generally is imposed on redemptions of Class C shares made within one year of purchase. Class A shares may be subject to a 1% CDSC if redeemed within 18 months of purchase (depending on the circumstances of purchase). Generally, the CDSC is based upon the lower of the net asset value at date of redemption or date of purchase. No charge is levied on shares acquired by reinvestment of dividends or capital gain distributions. Class C shares are subject to a 1% CDSC if redeemed within one year of purchase. No CDSC is levied on shares which have been sold to EVM or its affiliates or to their respective employees or clients and may be waived under certain other limited conditions. CDSCs received on Class C redemptions are paid to EVD to reduce the amount of Uncovered Distribution Charges calculated under the Fund's Class C Plan. CDSCs received on Class C redemptions when no Uncovered Distribut ion Charges exist are credited to the Fund. For the year ended October 31, 2008, the Fund was informed that EVD received approximately $1,000 of CDSCs paid by Class C shareholders, and no CDSCs paid by Class A shareholders.
6 Investment Transactions
For the year ended October 31, 2008, increases and decreases in the Fund's investment in the Portfolio aggregated $22,145,609 and $6,873,159, respectively.
7 Shares of Beneficial Interest
The Fund's Declaration of Trust permits the Trustees to issue an unlimited number of full and fractional shares of beneficial interest (without par value). Such shares may be issued in a number of different series (such as the Fund) and classes. Transactions in Fund shares were as follows:
| | | Year Ended October 31, | |
| Class A | | 2008 | | 2007 | |
| Sales | | | 695,292 | | | | 260,692 | | |
Issued to shareholders electing to
receive payments of distributions
in Fund shares | | | 6,687 | | | | 154 | | |
| Redemptions | | | (292,160 | ) | | | (10,867 | ) | |
| Net increase | | | 409,819 | | | | 249,979 | | |
12
Eaton Vance International Equity Fund as of October 31, 2008
NOTES TO FINANCIAL STATEMENTS CONT'D
| | | Year Ended October 31, | |
| Class C | | 2008 | | 2007 | |
| Sales | | | 179,367 | | | | 91,800 | | |
Issued to shareholders electing to
receive payments of distributions
in Fund shares | | | 1,384 | | | | 56 | | |
| Redemptions | | | (77,476 | ) | | | (22,528 | ) | |
| Net increase | | | 103,275 | | | | 69,328 | | |
| | | Year Ended October 31, | |
| Class I | | 2008 | | 2007 | |
| Sales | | | 971,438 | | | | 453,017 | | |
Issued to shareholders electing to
receive payments of distributions
in Fund shares | | | 10,691 | | | | 1,186 | | |
| Redemptions | | | (280,327 | ) | | | (22,537 | ) | |
| Net increase | | | 701,802 | | | | 431,666 | | |
For the years ended October 31, 2008 and October 31, 2007, the Fund received $2,522 and $487, respectively, in redemption fees.
8 Recently Issued Accounting Pronouncement
In September 2006, the Financial Accounting Standards Board issued Statement of Financial Accounting Standards No. 157 (FAS 157), "Fair Value Measurements". FAS 157 defines fair value, establishes a framework for measuring fair value in accordance with accounting principles generally accepted in the United States of America and expands disclosure about fair value measurements. FAS 157 is effective for fiscal years beginning after November 15, 2007. As of October 31, 2008, management does not believe the adoption of FAS 157 will impact the amounts reported in the financial statements; however, additional disclosures may be required about the inputs used to develop the measurements of fair value and the effect of certain of the measurements on changes in net assets for the period.
13
Eaton Vance International Equity Fund as of October 31, 2008
REPORT OF INDEPENDENT REGISTERED PUBLIC ACCOUNTING FIRM
To the Trustees of Eaton Vance Mutual Funds Trust and the Shareholders
of Eaton Vance International Equity Fund:
We have audited the accompanying statement of assets and liabilities of Eaton Vance International Equity Fund (the "Fund") (one of the series of Eaton Vance Mutual Funds Trust), as of October 31, 2008, and the related statement of operations for the year then ended, the statements of changes in net assets for each of the two years in the period then ended, and the financial highlights for each of the two years in the period then ended and the period from the start of business, May 31, 2006, to October 31, 2006. These financial statements and financial highlights are the responsibility of the Fund's management. Our responsibility is to express an opinion on these financial statements and financial highlights based on our audits.
We conducted our audits in accordance with the standards of the Public Company Accounting Oversight Board (United States). Those standards require that we plan and perform the audit to obtain reasonable assurance about whether the financial statements and financial highlights are free of material misstatement. The Fund is not required to have, nor were we engaged to perform, an audit of its internal control over financial reporting. Our audits included consideration of internal control over financial reporting as a basis for designing audit procedures that are appropriate in the circumstances, but not for the purpose of expressing an opinion on the effectiveness of the Fund's internal control over financial reporting. Accordingly, we express no such opinion. An audit also includes examining, on a test basis, evidence supporting the amounts and disclosures in the financial statements, assessing the accounting principles used and significant estimates made by management, as well as evaluating the overall financial statement presentation. We believe that our audits provide a reasonable basis for our opinion.
In our opinion, the financial statements and financial highlights referred to above present fairly, in all material respects, the financial position of Eaton Vance International Equity Fund as of October 31, 2008, the results of its operations for the year then ended, the changes in its net assets for each of the two years in the period then ended, and the financial highlights for each of the two years in the period then ended and the period from the start of business, May 31, 2006, to October 31, 2006, in conformity with accounting principles generally accepted in the United States of America.
DELOITTE & TOUCHE LLP
Boston, Massachusetts
December 15, 2008
14
Eaton Vance International Equity Fund as of October 31, 2008
FEDERAL TAX INFORMATION (Unaudited)
The Form 1099-DIV you receive in January 2009 will show the tax status of all distributions paid to your account in calendar 2008. Shareholders are advised to consult their own tax adviser with respect to the tax consequences of their investment in the Fund. As required by the Internal Revenue Code regulations, shareholders must be notified within 60 days of the Fund's fiscal year end regarding the status of the qualified dividend income for individuals and the foreign tax credit.
Qualified Dividend Income. The Fund designates approximately $723,300, or up to the maximum amount of such dividends allowable pursuant to the Internal Revenue Code, as qualified dividend income eligible for the reduced tax rate of 15%.
Foreign Tax Credit. The Fund designates a foreign tax credit of $48,017 and recognizes foreign source income of $697,088.
15
International Equity Portfolio as of October 31, 2008
PORTFOLIO OF INVESTMENTS
| Common Stocks — 91.9% | |
| Security | | Shares | | Value | |
| Automobiles — 2.6% | |
| Honda Motor Co., Ltd. ADR | | | 13,100 | | | $ | 324,487 | | |
| Toyota Motor Corp. ADR | | | 4,500 | | | | 342,405 | | |
| | | $ | 666,892 | | |
| Beverages — 7.8% | |
| Diageo PLC ADR | | | 16,300 | | | $ | 1,013,697 | | |
| Fomento Economico Mexicano SA de C.V. ADR | | | 19,200 | | | | 485,568 | | |
| Foster's Group, Ltd. | | | 78,100 | | | | 298,560 | | |
| Heineken Holding N.V. | | | 6,000 | | | | 182,151 | | |
| | | $ | 1,979,976 | | |
| Capital Markets — 0.5% | |
| Invesco, Ltd. | | | 9,000 | | | $ | 134,190 | | |
| | | $ | 134,190 | | |
| Chemicals — 1.6% | |
| Agrium, Inc. | | | 8,100 | | | $ | 307,638 | | |
| BASF SE ADR | | | 3,000 | | | | 99,870 | | |
| | | $ | 407,508 | | |
| Commercial Banks — 8.4% | |
| Banco Bilbao Vizcaya Argentaria SA ADR | | | 8,000 | | | $ | 92,800 | | |
| Banco Santander Central Hispano SA ADR | | | 60,500 | | | | 649,770 | | |
| Barclays PLC ADR | | | 9,500 | | | | 102,315 | | |
| BNP Paribas SA | | | 1,200 | | | | 86,641 | | |
| BOC Hong Kong Holdings, Ltd. | | | 168,000 | | | | 192,348 | | |
| DBS Group Holdings, Ltd. ADR | | | 11,600 | | | | 350,320 | | |
| Grupo Financiero Banorte SAB de C.V. | | | 66,000 | | | | 120,895 | | |
| Mitsubishi UFJ Financial Group, Inc. | | | 86,000 | | | | 540,439 | | |
| | | $ | 2,135,528 | | |
| Communications Equipment — 0.8% | |
| Nokia Oyj ADR | | | 13,000 | | | $ | 197,340 | | |
| | | $ | 197,340 | | |
| Construction & Engineering — 0.9% | |
| Bouygues SA | | | 2,200 | | | $ | 93,677 | | |
| Vinci SA | | | 3,800 | | | | 136,752 | | |
| | | $ | 230,429 | | |
| Security | | Shares | | Value | |
| Diversified Financial Services — 1.2% | |
| ING Groep N.V. ADR | | | 33,900 | | | $ | 315,609 | | |
| | | $ | 315,609 | | |
| Diversified Telecommunication Services — 8.7% | |
| Deutsche Telekom AG | | | 21,500 | | | $ | 315,428 | | |
| France Telecom SA ADR | | | 33,300 | | | | 843,156 | | |
| Koninklijke KPN NV | | | 48,800 | | | | 687,260 | | |
| Telefonica SA | | | 20,800 | | | | 385,111 | | |
| | | $ | 2,230,955 | | |
| Electric Utilities — 2.9% | |
| E.ON AG ADR | | | 12,000 | | | $ | 456,000 | | |
| Scottish and Southern Energy PLC | | | 14,500 | | | | 284,225 | | |
| | | $ | 740,225 | | |
| Electrical Equipment — 1.5% | |
| ABB, Ltd. ADR | | | 28,600 | | | $ | 376,090 | | |
| | | $ | 376,090 | | |
| Energy Equipment & Services — 1.9% | |
| Acergy SA ADR | | | 30,800 | | | $ | 215,600 | | |
| Fred Olsen Energy ASA | | | 8,000 | | | | 264,486 | | |
| | | $ | 480,086 | | |
| Food Products — 5.4% | |
| Nestle SA ADR | | | 28,000 | | | $ | 1,076,600 | | |
| Unilever PLC | | | 13,000 | | | | 292,056 | | |
| | | $ | 1,368,656 | | |
| Health Care Providers & Services — 1.0% | |
| Fresenius Medical Care AG & Co. | | | 5,700 | | | $ | 252,525 | | |
| | | $ | 252,525 | | |
| Industrial Conglomerates — 1.3% | |
| Keppel Corp., Ltd. ADR | | | 53,000 | | | $ | 331,250 | | |
| | | $ | 331,250 | | |
| Insurance — 4.1% | |
| Aviva PLC | | | 14,000 | | | $ | 83,510 | | |
| AXA SA ADR | | | 18,900 | | | | 353,619 | | |
See notes to financial statements
16
International Equity Portfolio as of October 31, 2008
PORTFOLIO OF INVESTMENTS CONT'D
| Security | | Shares | | Value | |
| Insurance (continued) | |
| Muenchener Rueckversicherungs-Gesellschaft AG | | | 2,800 | | | $ | 363,495 | | |
| Tokio Marine Holdings, Inc. | | | 8,200 | | | | 252,936 | | |
| | | $ | 1,053,560 | | |
| Machinery — 1.9% | |
| Atlas Copco AB, Class B | | | 32,000 | | | $ | 239,563 | | |
| Komatsu, Ltd. ADR | | | 4,200 | | | | 182,280 | | |
| Vallourec SA | | | 700 | | | | 78,301 | | |
| | | $ | 500,144 | | |
| Metals & Mining — 5.1% | |
| Anglo American PLC ADR | | | 15,263 | | | $ | 191,551 | | |
| Companhia Vale do Rio Doce ADR | | | 23,900 | | | | 279,869 | | |
| Rio Tinto PLC ADR | | | 3,600 | | | | 669,132 | | |
| Silver Wheaton Corp.(1) | | | 44,000 | | | | 158,400 | | |
| | | $ | 1,298,952 | | |
| Multi-Utilities — 4.8% | |
| National Grid PLC | | | 47,000 | | | $ | 529,461 | | |
| RWE AG ADR | | | 6,500 | | | | 535,470 | | |
| Veolia Environnement | | | 6,900 | | | | 170,993 | | |
| | | $ | 1,235,924 | | |
| Oil, Gas & Consumable Fuels — 6.5% | |
| Addax Petroleum Corp. | | | 4,900 | | | $ | 73,177 | | |
| ENI SpA ADR | | | 2,300 | | | | 110,515 | | |
| Petroleo Brasileiro SA ADR | | | 20,200 | | | | 445,814 | | |
| StatoilHydro ASA ADR | | | 11,191 | | | | 224,939 | | |
| Total SA ADR | | | 14,700 | | | | 814,968 | | |
| | | $ | 1,669,413 | | |
| Pharmaceuticals — 11.8% | |
| AstraZeneca PLC ADR | | | 14,500 | | | $ | 615,670 | | |
| Novartis AG ADR | | | 22,400 | | | | 1,142,176 | | |
| Roche Holdings Ltd., ADR | | | 5,700 | | | | 432,060 | | |
| Sanofi-Aventis | | | 9,600 | | | | 613,275 | | |
| Shionogi & Co., Ltd. | | | 12,000 | | | | 204,236 | | |
| | | $ | 3,007,417 | | |
| Software — 3.4% | |
| Nintendo Co., Ltd. | | | 2,700 | | | $ | 867,532 | | |
| | | $ | 867,532 | | |
| Security | | Shares | | Value | |
| Tobacco — 2.8% | |
| British American Tobacco PLC ADR | | | 13,000 | | | $ | 706,680 | | |
| | | $ | 706,680 | | |
| Trading Companies & Distributors — 2.3% | |
| Mitsubishi Corp. ADR | | | 17,300 | | | $ | 583,702 | | |
| | | $ | 583,702 | | |
| Wireless Telecommunication Services — 2.7% | |
| Turkcell Iletisim Hizmetleri AS ADR | | | 40,400 | | | $ | 495,708 | | |
| Vodafone Group PLC ADR | | | 9,500 | | | | 183,065 | | |
| | | $ | 678,773 | | |
Total Common Stocks
(identified cost $34,943,011) | | $ | 23,449,356 | | |
| Short-Term Investments — 10.0% | |
| Description | | Interest
(000's omitted) | | Value | |
| Cash Management Portfolio, 1.90%(2) | | $ | 2,561 | | | $ | 2,561,345 | | |
Total Short-Term Investments
(identified cost $2,561,345) | | $ | 2,561,345 | | |
Total Investments — 101.9%
(identified cost $37,504,356) | | $ | 26,010,701 | | |
| Other Assets, Less Liabilities — (1.9)% | | $ | (505,637 | ) | |
| Net Assets — 100.0% | | $ | 25,505,064 | | |
ADR - American Depository Receipt
(1) Non-income producing security.
(2) Affiliated investment company available to Eaton Vance portfolios and funds which invests in high quality, U.S. dollar denominated money market instruments. The rate shown is the annualized seven-day yield as of October 31, 2008.
See notes to financial statements
17
International Equity Portfolio as of October 31, 2008
PORTFOLIO OF INVESTMENTS CONT'D
| Country Concentration of Portfolio | |
| Country | | Percentage
of Net Assets | | Value | |
| United Kingdom | | | 18.3 | % | | $ | 4,671,362 | | |
| Japan | | | 12.9 | | | | 3,298,017 | | |
| France | | | 12.5 | | | | 3,191,382 | | |
| Switzerland | | | 11.9 | | | | 3,026,926 | | |
| United States | | | 10.0 | | | | 2,561,345 | | |
| Germany | | | 7.9 | | | | 2,022,788 | | |
| Netherlands | | | 4.7 | | | | 1,185,020 | | |
| Spain | | | 4.4 | | | | 1,127,681 | | |
| Brazil | | | 2.8 | | | | 725,683 | | |
| Norway | | | 2.8 | | | | 705,025 | | |
| Singapore | | | 2.7 | | | | 681,570 | | |
| Mexico | | | 2.4 | | | | 606,463 | | |
| Canada | | | 2.1 | | | | 539,215 | | |
| Turkey | | | 1.9 | | | | 495,708 | | |
| Australia | | | 1.2 | | | | 298,560 | | |
| Sweden | | | 0.9 | | | | 239,563 | | |
| Finland | | | 0.8 | | | | 197,340 | | |
| Hong Kong | | | 0.8 | | | | 192,348 | | |
| Bermuda | | | 0.5 | | | | 134,190 | | |
| Italy | | | 0.4 | | | | 110,515 | | |
| Total investments | | | 101.9 | % | | $ | 26,010,701 | | |
See notes to financial statements
18
International Equity Portfolio as of October 31, 2008
FINANCIAL STATEMENTS
Statement of Assets and Liabilities
As of October 31, 2008
| Assets | |
| Unaffiliated investments, at value (identified cost, $34,943,011) | | $ | 23,449,356 | | |
| Affiliated investment, at value (identified cost, $2,561,345) | | | 2,561,345 | | |
| Receivable for investments sold | | | 75,560 | | |
| Receivable from the investment adviser and the sub-adviser | | | 2,722 | | |
| Dividends receivable | | | 50,095 | | |
| Interest receivable from affiliated investment | | | 2,839 | | |
| Tax reclaims receivable | | | 26,669 | | |
| Total assets | | $ | 26,168,586 | | |
| Liabilities | |
| Payable for investments purchased | | $ | 585,787 | | |
| Payable to affiliate for investment adviser fee | | | 21,293 | | |
| Payable to affiliate for Trustees' fees | | | 134 | | |
| Accrued expenses | | | 56,308 | | |
| Total liabilities | | $ | 663,522 | | |
| Net Assets applicable to investors' interest in Portfolio | | $ | 25,505,064 | | |
| Sources of Net Assets | |
| Net proceeds from capital contributions and withdrawals | | $ | 37,002,119 | | |
| Net unrealized depreciation (computed on the basis of identified cost) | | | (11,497,055 | ) | |
| Total | | $ | 25,505,064 | | |
Statement of Operations
For the Year Ended
October 31, 2008
| Investment Income | |
| Dividends (net of foreign taxes, $77,652) | | $ | 1,082,905 | | |
| Interest | | | 12 | | |
| Interest income allocated from affiliated investment | | | 58,502 | | |
| Expenses allocated from affiliated investment | | | (8,495 | ) | |
| Total investment income | | $ | 1,132,924 | | |
| Expenses | |
| Investment adviser fee | | $ | 332,079 | | |
| Trustees' fees and expenses | | | 1,812 | | |
| Custodian fee | | | 50,914 | | |
| Legal and accounting services | | | 38,374 | | |
| Miscellaneous | | | 1,884 | | |
| Total expenses | | $ | 425,063 | | |
Deduct —
Allocation of expenses to the investment adviser and the sub-adviser | | $ | 6,582 | | |
| Total expense reductions | | $ | 6,582 | | |
| Net expenses | | $ | 418,481 | | |
| Net investment income | | $ | 714,443 | | |
| Realized and Unrealized Gain (Loss) | |
Net realized gain (loss) —
Investment transactions (identified cost basis),
net of foreign taxes of $1,040 | | $ | (4,547,618 | ) | |
| Foreign currency transactions | | | (67,822 | ) | |
| Net realized loss | | $ | (4,615,440 | ) | |
Change in unrealized appreciation (depreciation) —
Investments (identified cost basis) | | $ | (17,354,530 | ) | |
| Foreign currency | | | (3,740 | ) | |
| Net change in unrealized appreciation (depreciation) | | $ | (17,358,270 | ) | |
| Net realized and unrealized loss | | $ | (21,973,710 | ) | |
| Net decrease in net assets from operations | | $ | (21,259,267 | ) | |
See notes to financial statements
19
International Equity Portfolio as of October 31, 2008
FINANCIAL STATEMENTS CONT'D
Statements of Changes in Net Assets
Increase (Decrease)
in Net Assets | | Year Ended
October 31, 2008 | | Year Ended
October 31, 2007 | |
From operations —
Net investment income | | $ | 714,443 | | | $ | 696,630 | | |
Net realized loss from investment and
foreign currency transactions | | | (4,615,440 | ) | | | (131,084 | ) | |
Net change in unrealized appreciation
(depreciation) from investments and
foreign currency | | | (17,358,270 | ) | | | 5,594,712 | | |
Net increase (decrease) in net assets
from operations | | $ | (21,259,267 | ) | | $ | 6,160,258 | | |
Capital transactions —
Contributions | | $ | 28,239,659 | | | $ | 13,297,044 | | |
| Withdrawals | | | (9,747,273 | ) | | | (2,058,858 | ) | |
Net increase in net assets from
capital transactions | | $ | 18,492,386 | | | $ | 11,238,186 | | |
| Net increase (decrease) in net assets | | $ | (2,766,881 | ) | | $ | 17,398,444 | | |
| Net Assets | |
| At beginning of year | | $ | 28,271,945 | | | $ | 10,873,501 | | |
| At end of year | | $ | 25,505,064 | | | $ | 28,271,945 | | |
See notes to financial statements
20
International Equity Portfolio as of October 31, 2008
FINANCIAL STATEMENTS CONT'D
Supplementary Data
| | | Year Ended October 31, | | Period Ended | |
| | | 2008 | | 2007 | | October 31, 2006(1) | |
| Ratios/Supplemental Data | |
| Ratios (As a percentage of average daily net assets): | |
| Expenses before custodian fee reduction(2) | | | 1.25 | % | | | 0.87 | % | | | 1.26 | %(4) | |
| Expenses after custodian fee reduction(2) | | | 1.25 | % | | | 0.87 | % | | | 1.25 | %(4) | |
| Net investment income | | | 2.10 | % | | | 3.72 | %(3) | | | 0.92 | %(4) | |
| Portfolio Turnover | | | 35 | % | | | 21 | % | | | 1 | % | |
| Total Return | | | (47.77 | )% | | | 34.59 | % | | | 6.60 | %(5) | |
| Net assets, end of year (000's omitted) | | $ | 25,505 | | | $ | 28,272 | | | $ | 10,874 | | |
(1) For the period from the commencement of investment operations, May 31, 2006, to October 31, 2006.
(2) The investment adviser waived all or a portion of its investment adviser fee and/or subsidized certain operating expenses (equal to 0.02%, 0.55% and 5.21% of average daily net assets for the years ended October 31, 2008 and 2007, and the period ended October 31, 2006, respectively). A portion of the waiver and subsidy was borne by the sub-adviser. Absent this waiver and/or subsidy, total return would be lower.
(3) Includes a dividend resulting from a corporate action equal to 1.93% of average daily net assets.
(4) Annualized.
(5) Not annualized.
See notes to financial statements
21
International Equity Portfolio as of October 31, 2008
NOTES TO FINANCIAL STATEMENTS
1 Significant Accounting Policies
International Equity Portfolio (the Portfolio) is a New York trust registered under the Investment Company Act of 1940, as amended (the 1940 Act), as a diversified, open-end management investment company. The Portfolio's investment objective is to achieve total return by investing in a diversified portfolio of foreign equity securities. The Declaration of Trust permits the Trustees to issue interests in the Portfolio. At October 31, 2008, the Eaton Vance International Equity Fund and Eaton Vance Equity Asset Allocation Fund held an interest of 65.0% and 10.9%, respectively, in the Portfolio.
The following is a summary of significant accounting policies of the Portfolio. The policies are in conformity with accounting principles generally accepted in the United States of America.
A Investment Valuation — Equity securities listed on a U.S. securities exchange generally are valued at the last sale price on the day of valuation or, if no sales took place on such date, at the mean between the closing bid and asked prices therefore on the exchange where such securities are principally traded. Equity securities listed on the NASDAQ Global or Global Select Market generally are valued at the NASDAQ official closing price. Unlisted or listed securities for which closing sales prices or closing quotations are not available are valued at the mean between the latest available bid and asked prices or, in the case of preferred equity securities that are not listed or traded in the over-the- counter market, by an independent pricing service. Short-term debt securities with a remaining maturity of sixty days or less are valued at amortized cost, which approximates market value. If short-term debt securities are acquired with a remaining maturity of more than sixty days, they will be valued by a pricing service. Foreign securities and currencies are valued in U.S. dollars, based on foreign currency exchange rate quotations supplied by an independent quotation service. The independent service uses a proprietary model to determine the exchange rate. Inputs to the model include reported trades and implied bid/ask spreads. The daily valuation of exchange-traded foreign securities generally is determined as of the close of trading on the principal exchange on which such securities trade. Events occurring after the close of trading on foreign exchanges may result in adjustments to the valuation of foreign securities to more accurately reflect their fair value as of the close of regular trading on the Ne w York Stock Exchange. When valuing foreign equity securities that meet certain criteria, the Trustees have approved the use of a fair value service that values such securities to reflect market trading that occurs after the close of the applicable foreign markets of comparable securities or other instruments that have a strong correlation to the fair-valued securities. Investments for which valuations or market quotations are not readily available are valued at fair value using methods determined in good faith by or at the direction of the Trustees of the Portfolio considering relevant factors, data and information including the market value of freely tradable securities of the same class in the principal market on which such securities are normally traded.
The Portfolio may invest in Cash Management Portfolio (Cash Management), an affiliated investment company managed by Boston Management and Research (BMR), a subsidiary of Eaton Vance Management (EVM). Cash Management values its investment securities utilizing the amortized cost valuation technique permitted by Rule 2a-7 of the 1940 Act, pursuant to which Cash Management must comply with certain conditions. This technique involves initially valuing a portfolio security at its cost and thereafter assuming a constant amortization to maturity of any discount or premium. If amortized cost is determined not to approximate fair value, Cash Management may value its investment securities based on available market quotations provided by a pricing service.
B Investment Transactions — Investment transactions for financial statement purposes are accounted for on a trade date basis. Realized gains and losses on investments sold are determined on the basis of identified cost.
C Income — Dividend income is recorded on the ex-dividend date for dividends received in cash and/or securities. However, if the ex-dividend date has passed, certain dividends from foreign securities are recorded as the Portfolio is informed of the ex-dividend date. Withholding taxes on foreign dividends and capital gains have been provided for in accordance with the Portfolio's understanding of the applicable countries' tax rules and rates. Interest income is recorded on the basis of interest accrued, adjusted for amortization of premium or accretion of discount.
D Federal Taxes — The Portfolio has elected to be treated as a partnership for federal tax purposes. No provision is made by the Portfolio for federal or state taxes on any taxable income of the Portfolio because each investor in the Portfolio is ultimately responsible for the payment of any taxes on its share of taxable income. Since at least one of the Portfolio's investors is a regulated
22
International Equity Portfolio as of October 31, 2008
NOTES TO FINANCIAL STATEMENTS CONT'D
investment company that invests all or substantially all of its assets in the Portfolio, the Portfolio normally must satisfy the applicable source of income and diversification requirements (under the Internal Revenue Code) in order for its investors to satisfy them. The Portfolio will allocate, at least annually among its investors, each investor's distributive share of the Portfolio's net investment income, net realized capital gains and any other items of income, gain, loss, deduction or credit.
In addition to the requirements of the Internal Revenue Code, the Portfolio may also be subject to local taxes on the recognition of capital gains in certain countries. In determining the daily net asset value, the Portfolio estimates the accrual for such taxes, if any, based on the unrealized appreciation on certain portfolio securities and the related tax rates. Tax expense attributable to unrealized appreciation is included in the change in unrealized appreciation (depreciation) on investments. Capital gains taxes on securities sold are included in net realized gain (loss) on investments.
As of October 31, 2008, the Portfolio had no uncertain tax positions that would require financial statement recognition, de-recognition, or disclosure. Each of the Portfolio's federal tax returns filed since the start of business on May 31, 2006 to October 31, 2008 remains subject to examination by the Internal Revenue Service.
E Expense Reduction — State Street Bank and Trust Company (SSBT) serves as custodian of the Portfolio. Pursuant to the custodian agreement, SSBT receives a fee reduced by credits, which are determined based on the average daily cash balance the Portfolio maintains with SSBT. All credit balances, if any, used to reduce the Portfolio's custodian fees are reported as a reduction of expenses in the Statement of Operations.
F Foreign Currency Translation — Investment valuations, other assets, and liabilities initially expressed in foreign currencies are translated each business day into U.S. dollars based upon current exchange rates. Purchases and sales of foreign investment securities and income and expenses denominated in foreign currencies are translated into U.S. dollars based upon currency exchange rates in effect on the respective dates of such transactions. Recognized gains or losses on investment transactions attributable to changes in foreign currency exchange rates are recorded for financial statement purposes as net realized gains and losses on investments. That portion of unrealized gains and losses on invest ments that results from fluctuations in foreign currency exchange rates is not separately disclosed.
G Use of Estimates — The preparation of the financial statements in conformity with accounting principles generally accepted in the United States of America requires management to make estimates and assumptions that affect the reported amounts of assets and liabilities at the date of the financial statements and the reported amounts of income and expense during the reporting period. Actual results could differ from those estimates.
H Indemnifications — Under the Portfolio's organizational documents, its officers and Trustees may be indemnified against certain liabilities and expenses arising out of the performance of their duties to the Portfolio. Interestholders in the Portfolio are jointly and severally liable for the liabilities and obligations of the Portfolio in the event that the Portfolio fails to satisfy such liabilities and obligations; provided, however, that, to the extent assets are available in the Portfolio, the Portfolio may, under certain circumstances, indemnify interestholders from and against any claim or liability to which such holder may become subject by reason of being or having been an interestholder in t he Portfolio. Additionally, in the normal course of business, the Portfolio enters into agreements with service providers that may contain indemnification clauses. The Portfolio's maximum exposure under these arrangements is unknown as this would involve future claims that may be made against the Portfolio that have not yet occurred.
2 Investment Adviser Fee and Other Transactions with Affiliates
The investment adviser fee is earned by BMR as compensation for investment advisory services rendered to the Portfolio. The fee is computed at an annual rate of 1.00% of the Portfolio's average daily net assets up to $500 million and at reduced rates as daily net assets exceed that level, and is payable monthly. Pursuant to a sub-advisory agreement, BMR pays Eagle Global Advisors, L.L.C. (Eagle), a portion of its adviser fee for sub-advisory services provided to the Portfolio. The portion of the adviser fee payable by Cash Management on the Portfolio's investment of cash therein is credited against the Portfolio's adviser fee. For the year ended October 31, 2008, the Portfolio's adviser fee totaled $340,261 of which $8,182 was allocated from Cash Management and $332,079 was paid or accrued directly by the Portfolio. For the year ended October 31, 2008, the Portfolio's adviser fee, including the portion allocated from Cash Manage ment, was 1.00% of the Portfolio's average daily net assets. Pursuant to a voluntary expense reimbursement, BMR and Eagle were allocated $3,291 and $3,291, respectively, of the Portfolio's operating expenses, for the year ended October 31, 2008.
23
International Equity Portfolio as of October 31, 2008
NOTES TO FINANCIAL STATEMENTS CONT'D
Except for Trustees of the Portfolio who are not members of EVM's or BMR's organizations, officers and Trustees receive remuneration for their services to the Portfolio out of the investment adviser fee. Trustees of the Portfolio who are not affiliated with the investment adviser may elect to defer receipt of all or a percentage of their annual fees in accordance with the terms of the Trustees Deferred Compensation Plan. For the year ended October 31, 2008, no significant amounts have been deferred. Certain officers and Trustees of the Portfolio are officers of the above organizations.
3 Purchases and Sales of Investments
Purchases and sales of investments, other than short-term obligations, aggregated $28,906,748 and $11,344,743, respectively, for the year ended October 31, 2008.
4 Federal Income Tax Basis of Investments
The cost and unrealized appreciation (depreciation) of investments of the Portfolio at October 31, 2008, as determined on a federal income tax basis, were as follows:
| Aggregate cost | | $ | 37,506,926 | | |
| Gross unrealized appreciation | | $ | 11,795 | | |
| Gross unrealized depreciation | | | (11,508,020 | ) | |
| Net unrealized depreciation | | $ | (11,496,225 | ) | |
The net unrealized depreciation on foreign currency at October 31, 2008 on a federal income tax basis was $3,400.
5 Line of Credit
The Portfolio participates with other portfolios and funds managed by EVM and its affiliates in a $450 million unsecured line of credit agreement with a group of banks. Borrowings are made by the Portfolio solely to facilitate the handling of unusual and/or unanticipated short-term cash requirements. Interest is charged to the Portfolio based on its borrowings at an amount above either the Eurodollar rate or Federal Funds rate. In addition, a fee computed at an annual rate of 0.10% on the daily unused portion of the line of credit is allocated among the participating portfolios and funds at the end of each quarter. The Portfolio did not have any significant borrowings or allocated fees during the year ended October 31, 2008.
6 Risks Associated with Foreign Investments
Investing in securities issued by companies whose principal business activities are outside the United States may involve significant risks not present in domestic investments. For example, there is generally less publicly available information about foreign companies, particularly those not subject to the disclosure and reporting requirements of the U.S. securities laws. Certain foreign issuers are generally not bound by uniform accounting, auditing, and financial reporting requirements and standards of practice comparable to those applicable to domestic issuers. Investments in foreign securities also involve the risk of possible adverse changes in investment or exchange control regulations, expropriation or confiscatory taxation, limitation on the removal of funds or other assets of the Portfolio, political or financial instability or diplomatic and other developments which could affect such investments. Foreign securities markets, while growing in volume and sophistication, are generally not as developed as those in the United States, and securities of some foreign issuers (particularly those located in developing countries) may be less liquid and more volatile than securities of comparable U.S. companies. In general, there is less overall governmental supervision and regulation of foreign securities markets, broker-dealers and issuers than in the United States.
7 Recently Issued Accounting Pronouncements
In September 2006, the Financial Accounting Standards Board issued Statement of Financial Accounting Standards No. 157 (FAS 157), "Fair Value Measurements". FAS 157 defines fair value, establishes a framework for measuring fair value in accordance with accounting principles generally accepted in the United States of America and expands disclosure about fair value measurements. FAS 157 is effective for fiscal years beginning after November 15, 2007. As of October 31, 2008, management does not believe the adoption of FAS 157 will impact the amounts reported in the financial statements; however, additional disclosures may be required about the input s used to develop the measurements of fair value and the effect of certain of the measurements on changes in net assets for the period.
24
International Equity Portfolio as of October 31, 2008
REPORT OF INDEPENDENT REGISTERED PUBLIC ACCOUNTING FIRM
To the Trustees and Investors
of International Equity Portfolio:
We have audited the accompanying statement of assets and liabilities of International Equity Portfolio (the "Portfolio"), including the portfolio of investments, as of October 31, 2008, and the related statement of operations for the year then ended, the statements of changes in net assets for each of the two years in the period then ended, and the supplementary data for each of the two years in the period then ended and the period from the start of business, May 31, 2006, to October 31, 2006. These financial statements and supplementary data are the responsibility of the Portfolio's management. Our responsibility is to express an opinion on these financial statements and supplementary data based on our audits.
We conducted our audits in accordance with the standards of the Public Company Accounting Oversight Board (United States). Those standards require that we plan and perform the audit to obtain reasonable assurance about whether the financial statements and supplementary data are free of material misstatement. The Portfolio is not required to have, nor were we engaged to perform, an audit of its internal control over financial reporting. Our audits included consideration of internal control over financial reporting as a basis for designing audit procedures that are appropriate in the circumstances, but not for the purpose of expressing an opinion on the effectiveness of the Portfolio's internal control over financial reporting. Accordingly, we express no such opinion. An audit also includes examining, on a test basis, evidence supporting the amounts and disclosures in the financial statements, assessing the accounting principles u sed and significant estimates made by management, as well as evaluating the overall financial statement presentation. Our procedures included confirmation of securities owned as of October 31, 2008, by correspondence with the custodian and brokers; where replies were not received from brokers, we performed other auditing procedures. We believe that our audits provide a reasonable basis for our opinion.
In our opinion, the financial statements and supplementary data referred to above present fairly, in all material respects, the financial position of International Equity Portfolio as of October 31, 2008, the results of its operations for the year then ended, the changes in its net assets for each of the two years in the period then ended, and the supplementary data for each of the two years in the period then ended and the period from the start of business, May 31, 2006, to October 31, 2006, in conformity with accounting principles generally accepted in the United States of America.
DELOITTE & TOUCHE LLP
Boston, Massachusetts
December 15, 2008
25
Eaton Vance International Equity Fund
International Equity Portfolio
SPECIAL MEETING OF SHAREHOLDERS (Unaudited)
Eaton Vance International Equity Fund
The Fund held a Special Meeting of Shareholders on November 14, 2008 to elect Trustees. The results of the vote were as follows:
| | | Number of Shares | |
| Nominee for Trustee | | For | | Withheld | |
| Benjamin C. Esty | | | 1,917,227 | | | | 1,096 | | |
| Thomas E. Faust Jr. | | | 1,917,227 | | | | 1,096 | | |
| Allen R. Freedman | | | 1,917,227 | | | | 1,096 | | |
| William H. Park | | | 1,917,227 | | | | 1,096 | | |
| Ronald A. Pearlman | | | 1,917,227 | | | | 1,096 | | |
| Helen Frame Peters | | | 1,918,323 | | | | 0 | | |
| Heidi L. Steiger | | | 1,918,323 | | | | 0 | | |
| Lynn A. Stout | | | 1,918,323 | | | | 0 | | |
| Ralph F. Verni | | | 1,917,227 | | | | 1,096 | | |
Each nominee was also elected a Trustee of International Equity Portfolio.
International Equity Portfolio
The Portfolio held a Special Meeting of Interestholders on November 14, 2008 to elect Trustees. The results of the vote were as follows:
| | | Interest in the Portfolio | |
| Nominee for Trustee | | For | | Withheld | |
| Benjamin C. Esty | | | 76 | % | | | 0 | % | |
| Thomas E. Faust Jr. | | | 76 | % | | | 0 | % | |
| Allen R. Freedman | | | 76 | % | | | 0 | % | |
| William H. Park | | | 76 | % | | | 0 | % | |
| Ronald A. Pearlman | | | 76 | % | | | 0 | % | |
| Helen Frame Peters | | | 76 | % | | | 0 | % | |
| Heidi L. Steiger | | | 76 | % | | | 0 | % | |
| Lynn A. Stout | | | 76 | % | | | 0 | % | |
| Ralph F. Verni | | | 76 | % | | | 0 | % | |
Results are rounded to the nearest whole number.
26
Eaton Vance International Equity Fund
BOARD OF TRUSTEES' ANNUAL APPROVAL OF THE INVESTMENT ADVISORY AGREEMENT
Overview of the Contract Review Process
The Investment Company Act of 1940, as amended (the "1940 Act"), provides, in substance, that each investment advisory agreement between a fund and its investment adviser will continue in effect from year to year only if its continuance is approved at least annually by the fund's board of trustees, including by a vote of a majority of the trustees who are not "interested persons" of the fund ("Independent Trustees"), cast in person at a meeting called for the purpose of considering such approval.
At a meeting of the Boards of Trustees (each a "Board") of the Eaton Vance group of mutual funds (the "Eaton Vance Funds") held on April 21, 2008, the Board, including a majority of the Independent Trustees, voted to approve continuation of existing advisory and sub-advisory agreements for the Eaton Vance Funds for an additional one-year period. In voting its approval, the Board relied upon the affirmative recommendation of the Contract Review Committee of the Board (formerly the Special Committee), which is a committee comprised exclusively of Independent Trustees. Prior to making its recommendation, the Contract Review Committee reviewed information furnished for a series of meetings of the Contract Review Committee held in February, March and April 2008. Such information included, among other things, the following:
Information about Fees, Performance and Expenses
• An independent report comparing the advisory and related fees paid by each fund with fees paid by comparable funds;
• An independent report comparing each fund's total expense ratio and its components to comparable funds;
• An independent report comparing the investment performance of each fund to the investment performance of comparable funds over various time periods;
• Data regarding investment performance in comparison to relevant peer groups of funds and appropriate indices;
• Comparative information concerning fees charged by each adviser for managing other mutual funds and institutional accounts using investment strategies and techniques similar to those used in managing the fund;
• Profitability analyses for each adviser with respect to each fund;
Information about Portfolio Management
• Descriptions of the investment management services provided to each fund, including the investment strategies and processes employed, and any changes in portfolio management processes and personnel;
• Information concerning the allocation of brokerage and the benefits received by each adviser as a result of brokerage allocation, including information concerning the acquisition of research through "soft dollar" benefits received in connection with the funds' brokerage, and the implementation of a soft dollar reimbursement program established with respect to the funds;
• Data relating to portfolio turnover rates of each fund;
• The procedures and processes used to determine the fair value of fund assets and actions taken to monitor and test the effectiveness of such procedures and processes;
Information about each Adviser
• Reports detailing the financial results and condition of each adviser;
• Descriptions of the qualifications, education and experience of the individual investment professionals whose responsibilities include portfolio management and investment research for the funds, and information relating to their compensation and responsibilities with respect to managing other mutual funds and investment accounts;
• Copies of the Codes of Ethics of each adviser and its affiliates, together with information relating to compliance with and the administration of such codes;
• Copies of or descriptions of each adviser's proxy voting policies and procedures;
• Information concerning the resources devoted to compliance efforts undertaken by each adviser and its affiliates on behalf of the funds (including descriptions of various compliance programs) and their record of compliance with investment policies and restrictions, including policies with respect to market-timing, late trading and selective portfolio disclosure, and with policies on personal securities transactions;
• Descriptions of the business continuity and disaster recovery plans of each adviser and its affiliates;
Other Relevant Information
• Information concerning the nature, cost and character of the administrative and other non-investment management services provided by Eaton Vance Management and its affiliates;
• Information concerning management of the relationship with the custodian, subcustodians and fund accountants by each adviser or the funds' administrator; and
• The terms of each advisory agreement.
27
Eaton Vance International Equity Fund
BOARD OF TRUSTEES' ANNUAL APPROVAL OF THE INVESTMENT ADVISORY AGREEMENT CONT'D
In addition to the information identified above, the Contract Review Committee considered information provided from time to time by each adviser throughout the year at meetings of the Board and its committees. Over the course of the twelve-month period ended April 30, 2008, the Board met eleven times and the Contract Review Committee, the Audit Committee and the Governance Committee, each of which is a Committee comprised solely of Independent Trustees, met twelve, seven and five times, respectively. At such meetings, the Trustees received, among other things, presentations by the portfolio managers and other investment professionals of each adviser relating to the investment performance of each fund and the investment strategies used in pursuing the fund's investment objective. The Portfolio Management Committee and the Compliance Reports and Regulatory Matters Committee are newly established and did not meet during the twelve- month period ended April 30, 2008.
For funds that invest through one or more underlying portfolios, the Board considered similar information about the portfolio(s) when considering the approval of advisory agreements. In addition, in cases where the fund's investment adviser has engaged a sub-adviser, the Board considered similar information about the sub-adviser when considering the approval of any sub-advisory agreement.
The Contract Review Committee was assisted throughout the contract review process by Goodwin Procter LLP, legal counsel for the Independent Trustees. The members of the Contract Review Committee relied upon the advice of such counsel and their own business judgment in determining the material factors to be considered in evaluating each advisory and sub-advisory agreement and the weight to be given to each such factor. The conclusions reached with respect to each advisory and sub-advisory agreement were based on a comprehensive evaluation of all the information provided and not any single factor. Moreover, each member of the Contract Review Committee may have placed varying emphasis on particular factors in reaching conclusions with respect to each advisory and sub-advisory agreement.
Results of the Process
Based on its consideration of the foregoing, and such other information as it deemed relevant, including the factors and conclusions described below, the Contract Review Committee concluded that the continuance of the investment advisory agreement between the International Equity Portfolio (the "Portfolio"), and Boston Management and Research ("BMR" or the "Adviser") and the sub-advisory agreement with Eagle Global Advisors, L.L.C. ("Eagle" or the "Sub-adviser"), including their fee structures, is in the interests of shareholders and, therefore, the Contract Review Committee recommended to the Board approval of each agreement. The Board accepted the recommendation of the Contract Review Committee as well as the factors considered and conclusions reached by the Contract Review Committee with respect to each agreement. Accordingly, the Board, including a majority of the Independent Trustees, voted to approve continuation of the in vestment advisory and sub-advisory agreements for the Portfolio.
Nature, Extent and Quality of Services
In considering whether to approve the investment advisory agreement with BMR and sub-advisory agreement with Eagle for the Portfolio, the Board evaluated the nature, extent and quality of services provided to the Portfolio by BMR and by Eagle.
The Board considered BMR's and Eagle's management capabilities and investment process with respect to the types of investments held by the Portfolio, including the education, experience and number of its investment professionals and other personnel who provide portfolio management, investment research, and similar services to the Portfolio and who also supervise Eagle's management of the Portfolio. The Board specifically noted BMR's in-house equity research capabilities. The Board also took into account the resources dedicated to portfolio management and other services, including the compensation paid to recruit and retain investment personnel, and the time and attention devoted to the Portfolio by senior management.
The Board also reviewed the compliance programs of BMR, relevant affiliates thereof, and Eagle. Among other matters, the Board considered compliance and reporting matters relating to personal trading by investment personnel, selective disclosure of portfolio holdings, late trading, frequent trading, portfolio valuation, business continuity and the allocation of investment opportunities. The Board also evaluated the responses of BMR and its affiliates to requests from regulatory authorities such as the Securities and Exchange Commission.
The Board considered shareholder and other administrative services provided or managed by BMR and its affiliates, including transfer agency and accounting services. The Board evaluated the benefits to shareholders of investing in a fund that is a part of a large family of funds, including the ability, in many cases, to exchange an investment among different funds without incurring additional sales charges.
After consideration of the foregoing factors, among others, the Board concluded that the nature, extent and quality of services provided by BMR and Eagle, taken as a whole, are appropriate and consistent with the terms of the investment advisory agreement with respect to BMR, and consistent with the investment sub-advisory agreement with respect to Eagle.
28
Eaton Vance International Equity Fund
BOARD OF TRUSTEES' ANNUAL APPROVAL OF THE INVESTMENT ADVISORY AGREEMENT CONT'D
Fund Performance
The Board compared the Fund's investment performance to a relevant universe of similarly managed funds identified by an independent data provider and appropriate benchmark indices. The Board reviewed comparative performance data for the one-year period ended September 30, 2007. The Board concluded that the performance of the Fund was satisfactory.
Management Fees and Expenses
The Board reviewed contractual investment advisory fee rates, including any administrative fee rates, payable by the Portfolio and the Fund (referred to collectively as "management fees"). As part of its review, the Board considered the Fund's management fees and total expense ratio for the year ended September 30, 2007. The Board considered the fact that the Adviser and Sub-Adviser had waived fees and/or paid expenses for the Fund.
After reviewing the foregoing information, and in light of the nature, extent and quality of the services provided by BMR, the Board concluded that the management fees charged for advisory and related services and the Fund's total expense ratio are reasonable.
Profitability
The Board reviewed the level of profits realized by BMR and relevant affiliates thereof in providing investment advisory and administrative services to the Fund, the Portfolio and all Eaton Vance Funds as a group. The Board considered the level of profits realized without regard to revenue sharing or other payments by BMR and its affiliates to third parties in respect of distribution services. The Board also considered other direct or indirect benefits received by BMR and its affiliates in connection with its relationship with the Fund and the Portfolio, including the benefits of research services that may be available to BMR as a result of securities transactions effected for the Portfolio and other advisory clients. The Board also concluded that, in light of its role as a sub-adviser not affiliated with the Adviser, the Sub-adviser's profitability in managing the Portfolio was not a material factor.
The Board concluded that, in light of the foregoing factors and the nature, extent and quality of the services rendered, the profits realized by BMR and its affiliates are reasonable.
Economies of Scale
In reviewing management fees and profitability, the Board also considered the extent to which BMR and its affiliates, on the one hand, and the Fund, on the other hand, can expect to realize benefits from economies of scale as the assets of the Fund and the Portfolio increase. The Board acknowledged the difficulty in accurately measuring the benefits resulting from the economies of scale with respect to the management of any specific fund or group of funds. The Board reviewed data summarizing the increases and decreases in the assets of the Fund and of all Eaton Vance Funds as a group over various time periods, and evaluated the extent to which the total expense ratio of the Fund and the profitability of BMR and its affiliates may have been affected by such increases or decreases. Based upon the foregoing, the Board concluded that the benefits from economies of scale are currently being shared equitably by BMR and its affiliates and the Fund. The Board also concluded that, assuming reasonably foreseeable increases in the assets of the Portfolio, the structure of the Portfolio advisory fee, which includes breakpoints at several asset levels, can be expected to cause BMR and its affiliates, Eagle, and the Fund and the Portfolio to continue to share such benefits equitably.
29
Eaton Vance International Equity Fund
MANAGEMENT AND ORGANIZATION
Fund Management. The Trustees of Eaton Vance Mutual Funds Trust (the Trust) and International Equity Portfolio (the Portfolio) are responsible for the overall management and supervision of the Trust's and Portfolio's affairs. The Trustees and officers of the Trust and the Portfolio are listed below. Except as indicated, each individual has held the office shown or other offices in the same company for the last five years. Trustees and officers of the Trust and the Portfolio hold indefinite terms of office. The "noninterested Trustees" consist of those Trustees who are not "interested persons" of the Trust and the Portfolio, as that term is defined under the 1940 Act. The business address of each Trustee and officer is The Eaton Vance Building, 255 State Street, Boston, Massachusetts 02109. As used below, "EVC" refers to Eaton Vance Corp., "EV" refers to Eato n Vance, Inc., "EVM" refers to Eaton Vance Management, "BMR" refers to Boston Management and Research, "Eagle" refers to Eagle Global Advisors, L.L.C., "Parametric" refers to Parametric Portfolio Associates and "EVD" refers to Eaton Vance Distributors, Inc. EVC and EV are the corporate parent and trustee, respectively, of EVM and BMR. EVD is the Fund's principal underwriter, the Portfolio's placement agent and a wholly-owned subsidiary of EVC. Each officer affiliated with Eaton Vance may hold a position with other Eaton Vance affiliates that is comparable to his or her position with EVM listed below.
Name and
Date of Birth | | Position(s)
with the
Trust and
the Portfolio | | Term of
Office and
Length of
Service | | Principal Occupation(s)
During Past Five Years | | Number of Portfolios
in Fund Complex
Overseen By
Trustee(1) | | Other Directorships Held | |
| Interested Trustee | | | | | | | | | | | | | |
|
Thomas E. Faust Jr.
5/31/58 | | Trustee and President of the Trust | | Trustee since 2007 and President of the Trust since 2002 | | Chairman, Chief Executive Officer and President of EVC, Director and President of EV, Chief Executive Officer and President of EVM and BMR, and Director of EVD. Trustee and/or Officer of 173 registered investment companies and 4 private companies managed by EVM or BMR. Mr. Faust is an interested person because of his positions with EVM, BMR, EVD, EVC and EV, which are affiliates of the Trust and Portfolio. | | | 173 | | | Director of EVC | |
|
| Noninterested Trustees | | | | | | | | | | | | | |
|
Benjamin C. Esty
1/2/63 | | Trustee | | Trustee of the Trust since 2005 and of the Portfolio since 2006 | | Roy and Elizabeth Simmons Professor of Business Administration, Harvard University Graduate School of Business Administration. | | | 173 | | | None | |
|
Allen R. Freedman
4/3/40 | | Trustee | | Since 2007 | | Former Chairman (2002-2004) and a Director (1983-2004) of Systems & Computer Technology Corp. (provider of software to higher education). Formerly, a Director of Loring Ward International (fund distributor) (2005-2007). Formerly, Chairman and a Director of Indus International, Inc. (provider of enterprise management software to the power generating industry) (2005-2007). | | | 173 | | | Director of Assurant, Inc. and Stonemor Partners L.P. (owner and operator of cemeteries) | |
|
William H. Park
9/19/47 | | Trustee | | Trustee of the Trust since 2003 and of the Portfolio since 2006 | | Vice Chairman, Commercial Industrial Finance Corp. (specialty finance company) (since 2006). Formerly, President and Chief Executive Officer, Prizm Capital Management, LLC (investment management firm) (2002-2005). | | | 173 | | | None | |
|
Ronald A. Pearlman
7/10/40 | | Trustee | | Trustee of the Trust since 2003 and of the Portfolio since 2006 | | Professor of Law, Georgetown University Law Center. | | | 173 | | | None | |
|
Helen Frame Peters
3/22/48 | | Trustee | | Since 2008 | | Professor of Finance, Carroll School of Management, Boston College (since 2003). Adjunct Professor of Finance, Peking University, Beijing, China (since 2005). Formerly, Dean, Carroll School of Management, Boston College (2000-2003). | | | 173 | | | Director of Federal Home Loan Bank of Boston (a bank for banks) and BJ's Wholesale Clubs (wholesale club retailer); Trustee of SPDR Index Shares Funds and SPDR Series Trust (exchange traded funds) | |
|
30
Eaton Vance International Equity Fund
MANAGEMENT AND ORGANIZATION CONT'D
Name and
Date of Birth | | Position(s)
with the
Trust and
the Portfolio | | Term of
Office and
Length of
Service | | Principal Occupation(s)
During Past Five Years | | Number of Portfolios
in Fund Complex
Overseen By
Trustee(1) | | Other Directorships Held | |
| Noninterested Trustees (continued) | | | | | | | | | | | | | |
|
Heidi L. Steiger
7/8/53 | | Trustee | | Since 2007 | | Managing Partner, Topridge Associates LLC (global wealth management firm) (since 2008); Senior Advisor (since 2008), President (2005-2008), Lowenhaupt Global Advisors, LLC (global wealth management firm). Formerly, President and Contributing Editor, Worth Magazine (2004-2005). Formerly, Executive Vice President and Global Head of Private Asset Management (and various other positions), Neuberger Berman (investment firm) (1986-2004). | | | 173 | | | Director of Nuclear Electric Insurance Ltd. (nuclear insurance provider) and Aviva USA (insurance provider) | |
|
Lynn A. Stout
9/14/57 | | Trustee | | Trustee of the Trust since 1998 and of the Portfolio since 2006 | | Paul Hastings Professor of Corporate and Securities Law (since 2006) and Professor of Law (2001-2006), University of California at Los Angeles School of Law. | | | 173 | | | None | |
|
Ralph F. Verni
1/26/43 | | Chairman of the Board and Trustee | | Chairman of the Board since 2007, Trustee of the Trust since 2005 and of the Portfolio since 2006 | | Consultant and private investor. | | | 173 | | | None | |
|
Principal Officers who are not Trustees
Name and
Date of Birth | | Position(s)
with the
Trust and
the Portfolio | | Term of
Office and
Length of
Service | | Principal Occupation(s)
During Past Five Years | |
William H. Ahern, Jr.
7/28/59 | | Vice President of the Trust | | Since 1995 | | Vice President of EVM and BMR. Officer of 75 registered investment companies managed by EVM or BMR. | |
|
Edward R. Allen, III
7/5/60 | | Vice President of the Portfolio | | Since 2006 | | Senior Partner of Eagle. Officer of 3 registered investment companies managed by EVM or BMR. | |
|
John R. Baur
2/10/70 | | Vice President of the Trust | | Since 2007 | | Vice President of EVM and BMR. Previously, attended Johnson Graduate School of Management, Cornell University (2002-2005), and prior thereto he was an Account Team Representative in Singapore for Applied Materials Inc. Officer of 33 registered investment companies managed by EVM or BMR. | |
|
Michael A. Cirami
12/24/75 | | Vice President of the Trust | | Since 2007 | | Vice President of EVM and BMR. Previously, attended the University of Rochester William E. Simon Graduate School of Business Administration (2001-2003), and prior thereto he was a Team Leader for the Institutional Services Group for State Street Bank in Luxembourg. Officer of 33 registered investment companies managed by EVM or BMR. | |
|
Cynthia J. Clemson
3/2/63 | | Vice President of the Trust | | Since 2005 | | Vice President of EVM and BMR. Officer of 90 registered investment companies managed by EVM or BMR. | |
|
Charles B. Gaffney
12/4/72 | | Vice President of the Trust | | Since 2007 | | Vice President of EVM and BMR. Previously, Sector Portfolio Manager and Senior Equity Analyst of Brown Brothers Harriman (1997-2003). Officer of 30 registered investment companies managed by EVM or BMR. | |
|
Thomas N. Hunt, III
11/6/64 | | Vice President of the Portfolio | | Since 2006 | | Senior Partner of Eagle. Officer of 3 registered investment companies managed by EVM or BMR. | |
|
Christine M. Johnston
11/9/72 | | Vice President of the Trust | | Since 2007 | | Vice President of EVM and BMR. Officer of 35 registered investment companies managed by EVM or BMR. | |
|
Aamer Khan
6/7/60 | | Vice President of the Trust | | Since 2005 | | Vice President of EVM and BMR. Officer of 33 registered investment companies managed by EVM or BMR. | |
|
Thomas H. Luster
4/8/62 | | Vice President of the Trust | | Since 2006 | | Vice President of EVM and BMR. Officer of 51 registered investment companies managed by EVM or BMR. | |
|
31
Eaton Vance International Equity Fund
MANAGEMENT AND ORGANIZATION CONT'D
Name and
Date of Birth | | Position(s)
with the
Trust and
the Portfolio | | Term of
Office and
Length of
Service | | Principal Occupation(s)
During Past Five Years | |
| Principal Officers who are not Trustees (continued) | | | | | | | |
|
Robert B. MacIntosh
1/22/57 | | Vice President of the Trust | | Since 1998 | | Vice President of EVM and BMR. Officer of 90 registered investment companies managed by EVM or BMR. | |
|
Duncan W. Richardson
10/26/57 | | Vice President of the Trust and President of the Portfolio | | Vice President of the Trust since 2001 and President of the Portfolio since 2006 | | Executive Vice President and Chief Equity Investment Officer of EVC, EVM and BMR. Officer 81 registered investment companies managed by EVM or BMR. | |
|
Judith A. Saryan
8/21/54 | | Vice President of the Trust | | Since 2003 | | Vice President of EVM and BMR. Officer of 55 registered investment companies managed by EVM or BMR. | |
|
Susan Schiff
3/13/61 | | Vice President of the Trust | | Since 2002 | | Vice President of EVM and BMR. Officer of 36 registered investment companies managed by EVM or BMR. | |
|
Thomas Seto
9/27/62 | | Vice President of the Trust | | Since 2007 | | Vice President and Director of Portfolio Management of Parametric. Officer of 31 registered investment companies managed by EVM or BMR. | |
|
David M. Stein
5/4/51 | | Vice President of the Trust | | Since 2007 | | Managing Director and Chief Investment Officer of Parametric. Officer of 31 registered investment companies managed by EVM or BMR. | |
|
Mark S. Venezia
5/23/49 | | Vice President of the Trust | | Since 2007 | | Vice President of EVM and BMR. Officer of 36 registered investment companies managed by EVM or BMR. | |
|
Adam A. Weigold
3/22/75 | | Vice President of the Trust | | Since 2007 | | Vice President of EVM and BMR. Officer of 71 registered investment companies managed by EVM or BMR. | |
|
Barbara E. Campbell
6/19/57 | | Treasurer | | Of the Trust since 2005 and of the Portfolio since 2008(2) | | Vice President of EVM and BMR. Officer of 173 registered investment companies managed by EVM or BMR. | |
|
Maureen A. Gemma
5/24/60 | | Secretary and Chief Legal Officer | | Secretary since 2007 and Chief Legal Officer since 2008 | | Vice President of EVM and BMR. Officer of 173 registered investment companies managed by EVM or BMR. | |
|
Paul M. O'Neil
7/11/53 | | Chief Compliance Officer | | Of the Trust since 2004 and of the Portfolio since 2006 | | Vice President of EVM and BMR. Officer of 173 registered investment companies managed by EVM or BMR. | |
|
(1) Includes both master and feeder funds in a master-feeder structure.
(2) Prior to 2008, Ms. Campbell served as Assistant Treasurer of the Portfolio since 2006.
The SAI for the Fund includes additional information about the Trustees and officers of the Fund and the Portfolio and can be obtained without charge on Eaton Vance's website at www.eatonvance.com or by calling 1-800-262-1122.
32
Investment Adviser of International Equity Portfolio
Boston Management and Research
The Eaton Vance Building
255 State Street
Boston, MA 02109
Sub-Adviser of International Equity Portfolio
Eagle Global Advisors, L.L.C.
5847 San Felipe, Suite 930
Houston, TX 77057
Administrator of Eaton Vance International Equity Fund
Eaton Vance Management
The Eaton Vance Building
255 State Street
Boston, MA 02109
Principal Underwriter
Eaton Vance Distributors, Inc.
The Eaton Vance Building
255 State Street
Boston, MA 02109
(617) 482-8260
Custodian
State Street Bank and Trust Company
200 Clarendon Street
Boston, MA 02116
Transfer Agent
PNC Global Investment Servicing
Attn: Eaton Vance Funds
P.O. Box 9653
Providence, RI 02940-9653
(800) 262-1122
Independent Registered Public Accounting Firm
Deloitte & Touche LLP
200 Berkeley Street
Boston, MA 02116-5022
Eaton Vance International Equity Fund
The Eaton Vance Building
255 State Street
Boston, MA 02109
This report must be preceded or accompanied by a current prospectus. Before investing, investors should consider carefully the Fund's investment objective(s), risks, and charges and expenses. The Fund's current prospectus contains this and other information about the Fund and is available through your financial advisor. Please read the prospectus carefully before you invest or send money. For further information please call 1-800-262-1122.
2773-12/08 IEFSRC

Annual Report October 31, 2008


EATON VANCE
INTERNATIONAL INCOME
FUND
IMPORTANT NOTICES REGARDING PRIVACY,
DELIVERY OF SHAREHOLDER DOCUMENTS,
PORTFOLIO HOLDINGS AND PROXY VOTING
Privacy. The Eaton Vance organization is committed to ensuring your financial privacy. Each of the financial institutions identified below has in effect the following policy ("Privacy Policy") with respect to nonpublic personal information about its customers:
• Only such information received from you, through application forms or otherwise, and information about your Eaton Vance fund transactions will be collected. This may include information such as name, address, social security number, tax status, account balances and transactions.
• None of such information about you (or former customers) will be disclosed to anyone, except as permitted by law (which includes disclosure to employees necessary to service your account). In the normal course of servicing a customer's account, Eaton Vance may share information with unaffiliated third parties that perform various required services such as transfer agents, custodians and broker/dealers.
• Policies and procedures (including physical, electronic and procedural safeguards) are in place that are designed to protect the confidentiality of such information.
• We reserve the right to change our Privacy Policy at any time upon proper notification to you. Customers may want to review our Policy periodically for changes by accessing the link on our homepage: www.eatonvance.com.
Our pledge of privacy applies to the following entities within the Eaton Vance organization: the Eaton Vance Family of Funds, Eaton Vance Management, Eaton Vance Investment Counsel, Boston Management and Research, and Eaton Vance Distributors, Inc.
In addition, our Privacy Policy only applies to those Eaton Vance customers who are individuals and who have a direct relationship with us. If a customer's account (i.e., fund shares) is held in the name of a third-party financial adviser/broker-dealer, it is likely that only such adviser's privacy policies apply to the customer. This notice supersedes all previously issued privacy disclosures.
For more information about Eaton Vance's Privacy Policy, please call 1-800-262-1122.
Delivery of Shareholder Documents. The Securities and Exchange Commission (the "SEC") permits funds to deliver only one copy of shareholder documents, including prospectuses, proxy statements and shareholder reports, to fund investors with multiple accounts at the same residential or post office box address. This practice is often called "householding" and it helps eliminate duplicate mailings to shareholders.
Eaton Vance, or your financial adviser, may household the mailing of your documents indefinitely unless you instruct Eaton Vance, or your financial adviser, otherwise.
If you would prefer that your Eaton Vance documents not be householded, please contact Eaton Vance at 1-800-262-1122, or contact your financial adviser.
Your instructions that householding not apply to delivery of your Eaton Vance documents will be effective within 30 days of receipt by Eaton Vance or your financial adviser.
Portfolio Holdings. Each Eaton Vance Fund and its underlying Portfolio (if applicable) will file a schedule of its portfolio holdings on Form N-Q with the SEC for the first and third quarters of each fiscal year. The Form N-Q will be available on the Eaton Vance website www.eatonvance.com, by calling Eaton Vance at 1-800-262-1122 or in the EDGAR database on the SEC's website at www.sec.gov. Form N-Q may also be reviewed and copied at the SEC's public reference room in Washington, D.C. (call 1-800-732-0330 for information on the operation of the public reference room).
Proxy Voting. From time to time, funds are required to vote proxies related to the securities held by the funds. The Eaton Vance Funds or their underlying Portfolios (if applicable) vote proxies according to a set of policies and procedures approved by the Funds' and Portfolios' Boards. You may obtain a description of these policies and procedures and information on how the Funds or Portfolios voted proxies relating to portfolio securities during the most recent 12 month period ended June 30, without charge, upon request, by calling 1-800-262-1122. This description is also available on the SEC's website at www.sec.gov.
Eaton Vance International Income Fund as of October 31, 2008
MANAGEMENT’S DISCUSSION OF FUND PERFORMANCE

Mark S. Venezia, CFA
Co-Portfolio Manager

John R. Baur
Co-Portfolio Manager

Michael A. Cirami, CFA
Co-Portfolio Manager
Economic and Market Conditions
· The credit crisis that began in mid-2007 resulted in unprecedented events in the U.S. financial markets in 2008. Within a two week period in September, investors saw the U.S. government’s bailout of the two largest government sponsored enterprises – Fannie Mae and Freddie Mac, the bankruptcy of Lehman Brothers Holding, Inc., and the subsequent bailout of one of the world’s largest insurers amidst other government intervention and uncertainty surrounding the future of many of the largest U.S. financial institutions. As the crisis intensified in the last two months of the Fund’s fiscal year, the global fixed income and currency markets reacted with a flight to quality. The U.S. dollar strengthened against the Euro and many emerging market currencies, and U.S. interest rates fell as foreign investors headed for the relative safety of U.S. Treasury bonds. For the year ended October 31, 2008, 2-year and 5-year U.S. Treasury yields fell 240 (2.40%) and 134 basis points (1.34%), respectively. The Federal Funds rate started the year at 4.5% on October 31, 2007 and was cut to 1.0% by October 31, 2008. Many foreign central banks also cut their benchmark short-term interest rates in response to the global financial crisis, including the European Central Bank (ECB), Bank of Japan, Bank of England, and those of certain emerging market countries.
Management Discussion
· The Fund(1) seeks to provide total return by investing principally in a portfolio of securities denominated in foreign currencies, fixed-income securities issued by foreign entities or sovereigns and/or derivative instruments denominated in or based on the currencies, interest rates or issues of, foreign countries.
· The Fund slightly underperformed its benchmark, the JP Morgan Government Bond Index – Global, ex U.S., during the period.(3) The primary driver of the Fund’s underperformance was an underweighting of Japan versus the benchmark. Japan’s bonds and currency benefited from a flight to quality admist a worsening of the global financial crisis. Although the underweighting of Japan dominated performance, a weaker Euro and a position in Iceland also negatively impacted the Fund’s performance.
· Elsewhere in Western Europe, the Fund benefited from greater exposure to German sovereign bonds in lieu of positions in Spain and Italy where spreads to German government bonds widened dramatically, associated with a flight to quality by investors. Additionally, the Fund’s performance benefited significantly from a short position in Greece.
· The Fund’s positions in Eastern Europe did not fare as well as Western Europe. Specifically, the Fund’s positions in off-benchmark sovereign bonds of the Czech Republic were only partially offset by positive performance of other positions in Poland and Turkey.
· Finally, the Fund benefited from its performance in non-benchmark positions in Egypt, South Africa, and U.S. agency mortgage-backed securities (MBS). The Fund’s long position in Egyptian T-Bills and short position in the South African Rand were both additive to performance. In addition, although spreads to U.S. Treasuries of seasoned U.S. agency MBS widened by approximately 200 basis points during the year, the widening was more than offset by a decline in
Eaton Vance International Income Fund
Total Return Performance 10/31/07 – 10/31/08
Class A(2) | | -0.73 | % |
JP Morgan Government Bond Index – Global, ex U.S.(3) | | 1.74 | % |
Please refer to page 3 for additional performance information.
(1) | The Fund currently invests in a separate registered investment company, International Income Portfolio (the Portfolio), with the same objective and policies as the Fund. References to investments are to the Portfolio’s holdings. |
(2) | These returns do not include the 4.75% maximum sales charge for the Fund’s Class A shares. If sales charges were deducted, the returns would be lower. |
(3) | It is not possible to invest directly in an Index. The Index’s total return does not reflect the commissions or expenses that would have been incurred if an investor individually purchased or sold the securities represented in the Index. |
Past performance is no guarantee of future results. Returns are historical and are calculated by determining the percentage change in net asset value or offering price (as applicable) with all distributions reinvested. Investment return and principal value will fluctuate so that shares, when redeemed, may be worth more or less than their original cost. Performance is for the stated time period only; due to market volatility, the Fund’s current performance may be lower or higher than the quoted return. Absent an allocation of expenses to the administrator, the returns would be lower. For performance as of the most recent month end, please refer to www.eatonvance.com.
Fund shares are not insured by the FDIC and are not deposits or other obligations of, or guaranteed by, any depository institution. Shares are subject to investment risks, including possible loss of principal invested.
1
two-year bond yields, producing positive performance from the Fund’s holdings in these securities.
· The Fund’s duration at October 31, 2008 was 4.39 years, slightly lower than 4.43 years in October 31, 2007. Duration is a measure of the sensitivity of a fund or a fixed-income security to changes in interest rates. A shorter duration instrument normally has less exposure to interest rate risk than longer duration instruments.
Portfolio Composition
Securities Holdings (excludes derivatives)(1)
By total net assets
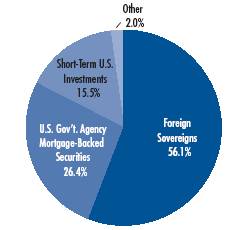
(1) | Securities Holdings reflect the Portfolio’s securities positions as of 10/31/08. Securities Holdings do not reflect derivatives positions. For International and Emerging Market exposures, please refer to the Regional Currency Exposure table. |
Regional Currency Exposures (including derivatives)(2),(3)
By total net assets / Exceeds 100% due to use of derivatives
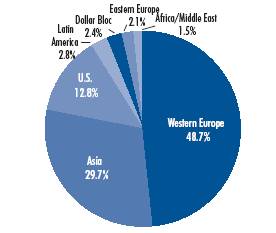
(2) | Regional Currency Exposures reflect the Portfolio’s investments as of 10/31/08. Total exposures may exceed 100% due to implicit leverage created by derivatives. |
Currency Positions(3)
By total net assets
Euro | | 39.2 | % |
Japan | | 29.7 | |
United Kingdom | | 6.6 | |
Canada | | 2.2 | |
Denmark | | 1.9 | |
Poland | | 1.8 | |
Mexico | | 1.5 | |
Sweden | | 0.9 | |
Mauritius | | 0.6 | |
Peru | | 0.5 | |
Brazil | | 0.4 | % |
Colombia | | 0.3 | |
Ghana | | 0.3 | |
Nigeria | | 0.3 | |
Georgia | | 0.3 | |
United Arab Emirates | | 0.3 | |
Australia | | 0.2 | |
Costa Rica | | 0.1 | |
Iceland | | 0.1 | |
(3) | Currency Positions reflect the Portfolio’s investments as of 10/31/08. Currency exposures include all long foreign exchange denominated assets and all long currency derivatives. Net short positions and other foreign derivatives are excluded. Short Currency Exposures are 6.5%. Foreign Long derivatives are 91.5%. Other Foreign Short Derivatives are 14.6%. All numbers are a percentage of total net assets. Total exposures may exceed 100% due to implicit leverage created by derivatives. |
The views expressed throughout this report are those of the portfolio managers and are current only through the end of the period of the report as stated on the cover. These views are subject to change at any time based upon market or other conditions, and the investment adviser disclaims any responsibility to update such views. These views may not be relied on as investment advice and, because investment decisions for a fund are based on many factors, may not be relied on as an indication of trading intent on behalf of any Eaton Vance fund. Portfolio information provided in the report may not be representative of the Portfolio’s current or future investments and may change due to active management.
2
Eaton Vance International Income Fund as of October 31, 2008
FUND PERFORMANCE
The line graph and table set forth below provide information about the Fund’s performance. The line graph compares the performance of Class A of the Fund with that of the JP Morgan Government Bond Index - Global, ex U.S., an unmanaged, broad-based market index consisting entirely of foreign denominated securities. The lines on the graph represent the total returns of a hypothetical investment of $10,000 in Class A of the Fund and in the JP Morgan Government Bond Index - Global, ex U.S. The table includes the total returns of Class A of the Fund at net asset value and maximum public offering price. The performance presented below does not reflect the deduction of taxes, if any, that a shareholder would pay on Fund distributions or the redemption of Fund shares.
Fund Performance(1)
| | Class A | |
Share Class Symbol | | EAIIX | |
| | | |
Average Annual Total Returns (at net asset value) | | | |
One Year | | -0.73 | % |
Life of Fund† | | 6.78 | |
| | | |
SEC Average Annual Total Returns (including sales charge or applicable CDSC) | | | |
One Year | | -5.44 | % |
Life of Fund† | | 2.99 | |
† Inception Date – Class A: 6/27/07.
(1) | Average Annual Total Returns do not include the 4.75% maximum sales charge for Class A shares. If sales charges were deducted, the returns would be lower. SEC Average Annual Total Returns for Class A reflect the maximum 4.75% sales charge. |
Total Annual Operating Expenses(2)
| | Class A | |
| | | |
Gross Expense Ratio | | 1.15 | % |
Net Expense Ratio | | 1.10 | % |
(2) | From the Fund’s prospectus dated 3/1/08, as supplemented. The Net Expense Ratio reflects a contractual expense limitation that continues through February 28, 2009. Thereafter, the expense limitation may be changed or terminated at any time. Without this expense limitation, performance would have been lower. |
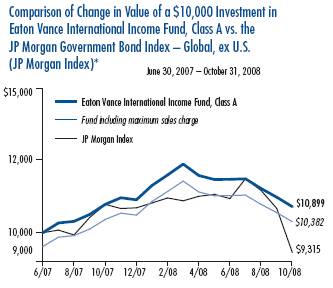
* Sources: Lipper Inc. Class A of the Fund commenced operations on 6/27/07. Index data is available as of month-end only.
It is not possible to invest directly in an Index. The Index’s total return does not reflect the expenses that would have been incurred if an investor individually purchased or sold the securities represented in the Index.
Past performance is no guarantee of future results. Returns are historical and are calculated by determining the percentage change in net asset value or offering price (as applicable) with all distributions reinvested. Investment return and principal value will fluctuate so that shares, when redeemed, may be worth more or less than their original cost. Performance is for the stated time period only; due to market volatility, the Fund’s current performance may be lower or higher than the quoted return. Absent an allocation of expenses to the administrator, the returns would be lower. For performance as of the most recent month end, please refer to www.eatonvance.com.
3
Eaton Vance International Income Fund as of October 31, 2008
FUND EXPENSES
Example: As a shareholder of the Fund, you incur two types of costs: (1) transaction costs, including sales charges (loads) on purchases and redemption fees (if applicable); and (2) ongoing costs, including management fees; distribution or service fees; and other Fund expenses. This Example is intended to help you understand your ongoing costs (in dollars) of investing in the Fund and to compare these costs with the ongoing costs of investing in other mutual funds. The Example is based on an investment of $1,000 invested at the beginning of the period and held for the entire period (May 1, 2008 – October 31, 2008).
Actual Expenses: The first section of the table below provides information about actual account values and actual expenses. You may use the information in this section, together with the amount you invested, to estimate the expenses that you paid over the period. Simply divide your account value by $1,000 (for example, an $8,600 account value divided by $1,000 = 8.6), then multiply the result by the number in the first section under the heading entitled "Expenses Paid During Period" to estimate the expenses you paid on your account during this period.
Hypothetical Example for Comparison Purposes: The second section of the table below provides information about hypothetical account values and hypothetical expenses based on the actual Fund expense ratio and an assumed rate of return of 5% per year (before expenses), which is not the actual return of the Fund. The hypothetical account values and expenses may not be used to estimate the actual ending account balance or expenses you paid for the period. You may use this information to compare the ongoing costs of investing in your Fund and other funds. To do so, compare this 5% hypothetical example with the 5% hypothetical examples that appear in the shareholder reports of the other funds.
Please note that the expenses shown in the table are meant to highlight your ongoing costs only and do not reflect any transactional costs, such as sales charges (loads) or redemption fees (if applicable). Therefore, the second section of the table is useful in comparing ongoing costs only, and will not help you determine the relative total costs of owning different funds. In addition, if these transactional costs were included, your costs would have been higher.
Eaton Vance International Income Fund
| | | Beginning Account Value
(5/1/08) | | Ending Account Value
(10/31/08) | | Expenses Paid During Period*
(5/1/08 – 10/31/08) | |
| Actual | |
| Class A | | $ | 1,000.00 | | | $ | 910.00 | | | $ | 5.28 | ** | |
| Hypothetical | |
| (5% return per year before expenses) | |
| Class A | | $ | 1,000.00 | | | $ | 1,019.60 | | | $ | 5.58 | ** | |
* Expenses are equal to the Fund's annualized expense ratio of 1.10% for Class A shares, multiplied by the average account value over the period, multiplied by 184/366 (to reflect the one-half year period). The Example assumes that the $1,000 was invested at the net asset value per share determined at the close of business on April 30, 2008. The Example reflects the expenses of both the Fund and the Portfolio.
** Absent an allocation of expenses to the administrator, the expenses would have been higher.
4
Eaton Vance International Income Fund as of October 31, 2008
FINANCIAL STATEMENTS
Statement of Assets and Liabilities
As of October 31, 2008
| Assets | |
Investment in International Income Portfolio, at value
(identified cost, $6,288,184) | | $ | 5,538,613 | | |
| Receivable for Fund shares sold | | | 353 | | |
| Receivable from the administrator | | | 18,080 | | |
| Total assets | | $ | 5,557,046 | | |
| Liabilities | |
| Payable for Fund shares redeemed | | $ | 59 | | |
| Dividends payable | | | 7,664 | | |
| Payable to affiliate for distribution and service fees | | | 1,459 | | |
| Accrued expenses | | | 30,533 | | |
| Total liabilities | | $ | 39,715 | | |
| Net Assets | | $ | 5,517,331 | | |
| Sources of Net Assets | |
| Paid-in capital | | $ | 6,126,288 | | |
Accumulated net realized gain from Portfolio (computed on
the basis of identified cost) | | | 149,003 | | |
| Accumulated distributions in excess of net investment income | | | (8,389 | ) | |
Net unrealized depreciation from Portfolio (computed on the basis of
identified cost) | | | (749,571 | ) | |
| Total | | $ | 5,517,331 | | |
| Class A Shares | |
| Net Assets | | $ | 5,517,331 | | |
| Shares Outstanding | | | 532,936 | | |
Net Asset Value and Redemption Price Per Share
(net assets ÷ shares of beneficial interest outstanding) | | $ | 10.35 | | |
Maximum Offering Price Per Share
(100 ÷ 95.25 of $10.35) | | $ | 10.87 | | |
| On sales of $25,000 or more, the offering price of Class A shares is reduced. | |
Statement of Operations
For the Year Ended
October 31, 2008
| Investment Income | |
| Interest allocated from Portfolio (net of foreign taxes, $13) | | $ | 223,306 | | |
| Expenses allocated from Portfolio | | | (43,862 | ) | |
| Net investment income from Portfolio | | $ | 179,444 | | |
| Expenses | |
| Trustees' fees and expenses | | $ | 292 | | |
| Distribution and service fees | | | 13,460 | | |
| Custodian fee | | | 23,949 | | |
| Registration fees | | | 22,101 | | |
| Legal and accounting services | | | 20,431 | | |
| Printing and postage | | | 5,072 | | |
| Transfer and dividend disbursing agent fees | | | 4,106 | | |
| Miscellaneous | | | 5,649 | | |
| Total expenses | | $ | 95,060 | | |
Deduct —
Allocation of expenses to the administrator | | $ | 89,382 | | |
| Total expense reductions | | $ | 89,382 | | |
| Net expenses | | $ | 5,678 | | |
| Net investment income | | $ | 173,766 | | |
Realized and Unrealized
Gain (Loss) from Portfolio | |
Net realized gain (loss) —
Investment transactions (identified cost basis) | | $ | (146,672 | ) | |
| Financial futures contracts | | | 9,316 | | |
| Swap contracts | | | (4,342 | ) | |
Foreign currency and forward foreign currency exchange
contract transactions | | | 281,456 | | |
| Net realized gain | | $ | 139,758 | | |
Change in unrealized appreciation (depreciation) —
Investments (identified cost basis) | | $ | (703,731 | ) | |
| Financial futures contracts | | | (7,669 | ) | |
| Written options | | | (12,564 | ) | |
| Swap contracts | | | 9,442 | | |
| Foreign currency and forward foreign currency exchange contracts | | | (40,358 | ) | |
| Net change in unrealized appreciation (depreciation) | | $ | (754,880 | ) | |
| Net realized and unrealized loss | | $ | (615,122 | ) | |
| Net decrease in net assets from operations | | $ | (441,356 | ) | |
See notes to financial statements
5
Eaton Vance International Income Fund as of October 31, 2008
FINANCIAL STATEMENTS CONT'D
Statements of Changes in Net Assets
Increase (Decrease)
in Net Assets | | Year Ended
October 31, 2008 | | Period Ended
October 31, 2007(1) | |
From operations —
Net investment income | | $ | 173,766 | | | $ | 625 | | |
Net realized gain from investment
transactions, financial futures
contracts, swap contracts, and
foreign currency and forward
foreign currency exchange
contract transactions | | | 139,758 | | | | 1,164 | | |
Net change in unrealized appreciation
(depreciation) of investments,
financial futures contracts, swap contracts,
written options, and foreign currency
and forward foreign currency exchange
contracts | | | (754,880 | ) | | | 5,309 | | |
Net increase (decrease) in net assets
from operations | | $ | (441,356 | ) | | $ | 7,098 | | |
Distributions to shareholders —
From net investment income | | $ | (171,993 | ) | | $ | (60 | ) | |
| From net realized gain | | | (2,041 | ) | | | (597 | ) | |
| Total distributions to shareholders | | $ | (174,034 | ) | | $ | (657 | ) | |
Transactions in shares of beneficial interest —
Proceeds from sale of shares | | $ | 10,296,758 | | | $ | 437,846 | | |
Net asset value of shares issued to
shareholders in payment of
distributions declared | | | 110,087 | | | | 484 | | |
| Cost of shares redeemed | | | (4,520,243 | ) | | | (201,599 | ) | |
| Capital contribution from administrator | | | 898 | | | | 2,049 | | |
Net increase in net assets from
Fund share transactions | | $ | 5,887,500 | | | $ | 238,780 | | |
| Net increase in net assets | | $ | 5,272,110 | | | $ | 245,221 | | |
| Net Assets | |
| At beginning of period | | $ | 245,221 | | | $ | — | | |
| At end of period | | $ | 5,517,331 | | | $ | 245,221 | | |
Accumulated distributions
in excess of net investment
income included in net assets | |
| At end of period | | $ | (8,389 | ) | | $ | (77 | ) | |
(1) For the period from the start of business, June 27, 2007, to October 31, 2007.
See notes to financial statements
6
Eaton Vance International Income Fund as of October 31, 2008
FINANCIAL STATEMENTS CONT'D
Financial Highlights
| | | Class A | |
| | | Year Ended
October 31, 2008 | | Period Ended
October 31, 2007(1) | |
| Net asset value — Beginning of period | | $ | 10.850 | | | $ | 10.000 | | |
| Income (loss) from operations | |
| Net investment income(2) | | $ | 0.435 | | | $ | 0.124 | | |
| Net realized and unrealized gain (loss) | | | (0.490 | ) | | | 0.468 | | |
| Total income (loss) from operations | | $ | (0.055 | ) | | $ | 0.592 | | |
| Less distributions | |
| From net investment income | | $ | (0.434 | ) | | $ | (0.014 | ) | |
| From net realized gain | | | (0.013 | ) | | | (0.135 | ) | |
| Total distributions | | $ | (0.447 | ) | | $ | (0.149 | ) | |
| Capital contribution from administrator(2) | | $ | 0.002 | | | $ | 0.407 | | |
| Net asset value — End of period | | $ | 10.350 | | | $ | 10.850 | | |
| Total Return(3) | | | (0.73 | )%(8) | | | 10.05 | %(8)(9) | |
| Ratios/Supplemental Data | |
| Net assets, end of period (000's omitted) | | $ | 5,517 | | | $ | 245 | | |
| Ratios (As a percentage of average daily net assets): | |
| Expenses before custodian fee reduction(4)(5) | | | 1.10 | %(6) | | | 1.25 | %(6)(7) | |
| Net investment income(5) | | | 3.86 | % | | | 3.38 | %(7) | |
| Portfolio Turnover of the Portfolio | | | 14 | % | | | 2 | %(9) | |
(1) For the period from the start of business, June 27, 2007, to October 31, 2007.
(2) Computed using average shares outstanding.
(3) Returns are historical and are calculated by determining the percentage change in net asset value with all distributions reinvested.
(4) Excludes the effect of custody fee credits, if any, of less than 0.005%.
(5) Includes the Fund's share of the Portfolio's allocated expenses.
(6) The administrator subsidized certain operating expenses (equal to 1.99% and 301.15% of average daily net assets for the year ended October 31, 2008 and the period from the start of business, June 27, 2007, to October 31, 2007, respectively).
(7) Annualized.
(8) The impact of the capital contribution by the administrator on total return for the year ended October 31, 2008 was less then 0.005%. Absent a capital contribution by the administrator in the period from the start of business, June 27, 2007, to October 31, 2007, total return would have been 9.14%.
(9) Not annualized.
See notes to financial statements
7
Eaton Vance International Income Fund as of October 31, 2008
NOTES TO FINANCIAL STATEMENTS
1 Significant Accounting Policies
Eaton Vance International Income Fund (the Fund) is a non-diversified series of Eaton Vance Mutual Funds Trust (the Trust). The Trust is a Massachusetts business trust registered under the Investment Company Act of 1940, as amended (the 1940 Act), as an open-end management investment company. The Fund offers Class A shares, which are generally sold subject to a sales charge imposed at time of purchase. The Fund invests all of its investable assets in interests in International Income Portfolio (the Portfolio), a New York trust, having the same investment objective and policies as the Fund. The value of the Fund's investment in the Portfolio reflects the Fund's proportionate interest in the net assets of the Portfolio (16.4% at October 31, 2008). The performance of the Fund is directly affected by the performance of the Portfolio. The financial statements of the Portfolio, including the portfolio of investments, are included else where in this report and should be read in conjunction with the Fund's financial statements.
The following is a summary of significant accounting policies of the Fund. The policies are in conformity with accounting principles generally accepted in the United States of America.
A Investment Valuation — Valuation of securities by the Portfolio is discussed in Note 1A of the Portfolio's Notes to Financial Statements, which are included elsewhere in this report.
B Income — The Fund's net investment income or loss consists of the Fund's pro-rata share of the net investment income or loss of the Portfolio, less all actual and accrued expenses of the Fund.
C Federal Taxes — The Fund's policy is to comply with the provisions of the Internal Revenue Code applicable to regulated investment companies and to distribute to shareholders each year substantially all of its net investment income, and all or substantially all of its net realized capital gains. Accordingly, no provision for federal income or excise tax is necessary.
As of October 31, 2008, the Fund had no uncertain tax positions that would require financial statement recognition, de-recognition, or disclosure. Each of the Fund's federal tax returns filed since the start of business on June 27, 2007 to October 31, 2008 remains subject to examination by the Internal Revenue Service.
D Expenses — The majority of expenses of the Trust are directly identifiable to an individual fund. Expenses which are not readily identifiable to a specific fund are allocated taking into consideration, among other things, the nature and type of expense and the relative size of the funds.
E Expense Reduction — State Street Bank and Trust Company (SSBT) serves as custodian of the Fund. Pursuant to the custodian agreement, SSBT receives a fee reduced by credits, which are determined based on the average daily cash balance the Fund maintains with SSBT. All credit balances, if any, used to reduce the Fund's custodian fees are reported as a reduction of expenses in the Statement of Operations.
F Use of Estimates — The preparation of the financial statements in conformity with accounting principles generally accepted in the United States of America requires management to make estimates and assumptions that affect the reported amounts of assets and liabilities at the date of the financial statements and the reported amounts of income and expense during the reporting period. Actual results could differ from those estimates.
G Indemnifications — Under the Trust's organizational documents, its officers and Trustees may be indemnified against certain liabilities and expenses arising out of the performance of their duties to the Fund, and shareholders are indemnified against personal liability for the obligations of the Trust. Additionally, in the normal course of business, the Fund enters into agreements with service providers that may contain indemnification clauses. The Fund's maximum exposure under these arrangements is unknown as this would involve future claims that may be made against the Fund that have not yet occurred.
H Other — Investment transactions are accounted for on a trade date basis. Dividends to shareholders are recorded on the ex-dividend date.
2 Distributions to Shareholders
The Fund declares dividends daily to shareholders of record at the time of declaration. Distributions are generally paid monthly. Distributions of realized capital gains (reduced by available capital loss carryforwards from prior years, if any) are made at least annually. Shareholders may reinvest income and capital gain distributions in additional shares of the Fund at the net asset value as of the reinvestment date or, at the election of the shareholder, receive distributions in cash. The Fund distinguishes between distributions on a tax basis and a financial reporting basis. Accounting principles generally accepted in the United States of
8
Eaton Vance International Income Fund as of October 31, 2008
NOTES TO FINANCIAL STATEMENTS CONT'D
America require that only distributions in excess of tax basis earnings and profits be reported in the financial statements as a return of capital. Permanent differences between book and tax accounting relating to distributions are reclassified to paid-in capital.
The tax character of distributions declared for the year ended October 31, 2008 and the period from the start of business, June 27, 2007, to October 31, 2007 was as follows:
| | | Year Ended
October 31, 2008 | | Period Ended
October 31, 2007 | |
| Distributions declared from: | |
| Ordinary income | | $ | 171,993 | | | $ | 87 | | |
| Long-term capital gains | | $ | 2,041 | | | $ | 570 | | |
During the year ended October 31, 2008, accumulated net realized gain was increased by $10,078, accumulated undistributed net investment income was decreased by $10,085, and paid-in capital was increased by $7 due to differences between book and tax accounting, primarily for foreign currency gain (loss), paydown gain (loss), premium amortization and swap contracts. These reclassifications had no effect on the net assets or net asset value per share of the Fund.
At October 31, 2008, the components of distributable earnings (accumulated losses) and unrealized appreciation (depreciation) on a tax basis were as follows:
| Undistributed ordinary income | | $ | 34,142 | | |
| Undistributed long-term capital gains | | $ | 123,388 | | |
| Net unrealized depreciation | | $ | (758,823 | ) | |
| Other temporary differences | | $ | (7,664 | ) | |
The differences between components of distributable earnings (accumulated losses) on a tax basis and the amounts reflected in the Statement of Assets and Liabilities are primarily due to futures and swap contracts, premium amortization, partnership allocations and the timing of recognizing distributions to shareholders.
3 Investment Adviser Fee and Other Transactions with Affiliates
The investment adviser fee is earned by Eaton Vance Management (EVM) as compensation for investment advisory services rendered to the Fund. The fee is computed at an annual rate of 0.625% of the Fund's average daily net assets that are not invested in other investment companies for which EVM or its affiliates serve as investment adviser or administrator ("Investable Assets") up to $1 billion and is payable monthly. On net assets of $1 billion and over that are invested in Investable Assets, the annual fee is reduced. For the year ended October 31, 2008, the Fund incurred no adviser fee on Investible Assets. To the extent the Fund's assets are invested in the Portfolio, the Fund is allocated its share of the Portfolio's adviser fee. The Portfolio has engaged Boston Management and Research (BMR), a subsidiary of EVM, to render investment advisory services. See Note 2 of the Portfolio's Notes to Financial Statements which are included elsewhere in this report. EVM also serves as the administrator to the Fund, but receives no compensation. EVM has agreed to reimburse the Fund's operating expenses to the extent that they exceed 1.10% annually of the Fund's average daily net assets for Class A. This agreement may be changed or terminated after February 28, 2009. Pursuant to this agreement, EVM was allocated $89,382 of the Fund's operating expenses for the year ended October 31, 2008.
EVM serves as the sub-transfer agent of the Fund and receives from the transfer agent an aggregate fee based upon the actual expenses incurred by EVM in the performance of these services. For the year ended October 31, 2008, EVM earned $283 in sub-transfer agent fees. The Fund was informed that Eaton Vance Distributors, Inc. (EVD), an affiliate EVM and the Fund's principal underwriter, received $5,027 as its portion of the sales charge on sales of Class A shares for the year ended October 31, 2008. EVD also received distribution and service fees from Class A shares (see Note 4).
Except for Trustees of the Fund and the Portfolio who are not members of EVM's or BMR's organizations, officers and Trustees receive remuneration for their services to the Fund out of the investment adviser fee. Certain officers and Trustees of the Fund and the Portfolio are officers of the above organizations.
4 Distribution Plan
The Fund has in effect a distribution plan for Class A shares (Class A Plan) pursuant to Rule 12b-1 under the 1940 Act. The Class A Plan provides that the Fund will pay EVD a distribution and service fee of 0.30% per annum of its average daily net assets attributable to Class A shares for distribution services and facilities provided to the Fund by EVD, as well as for personal services and/or the maintenance of shareholder accounts. Distribution and service fees paid or accrued to EVD for the year ended October 31, 2008 amounted to $13,460 for Class A shares.
9
Eaton Vance International Income Fund as of October 31, 2008
NOTES TO FINANCIAL STATEMENTS CONT'D
5 Contingent Deferred Sales Charges
Class A shares may be subject to a 1% contingent deferred sales charge (CDSC) if redeemed within 18 months of purchase (depending on the circumstances of purchase). Generally, the CDSC is based upon the lower of the net asset value at date of redemption or date of purchase. No charge is levied on shares acquired by reinvestment of dividends or capital gain distributions. No CDSC is levied on shares which have been sold to EVM or its affiliates or to their respective employees or clients and may be waived under certain other limited conditions. For the year ended October 31, 2008, the Fund was informed that EVD received approximately $11,000 of CDSCs paid by Class A shareholders.
6 Investment Transactions
For the year ended October 31, 2008, increases and decreases in the Fund's investment in the Portfolio aggregated $10,348,381 and $4,561,323, respectively.
7 Shares of Beneficial Interest
The Fund's Declaration of Trust permits the Trustees to issue an unlimited number of full and fractional shares of beneficial interest (without par value). Transactions in Fund shares were as follows:
| Class A | | Year Ended
October 31, 2008 | | Period Ended
October 31, 2007(1) | |
| Sales | | | 902,331 | | | | 41,679 | | |
Issued to shareholders electing to
receive payments of distributions
in Fund shares | | | 9,789 | | | | 45 | | |
| Redemptions | | | (401,781 | ) | | | (19,127 | ) | |
| Net Increase | | | 510,339 | | | | 22,597 | | |
(1) For the period from the start of business, June 27, 2007, to October 31, 2007.
8 Recently Issued Accounting Pronouncements
In September 2006, the Financial Accounting Standards Board (FASB) issued Statement of Financial Accounting Standards No. 157 (FAS 157), "Fair Value Measurements". FAS 157 defines fair value, establishes a framework for measuring fair value in accordance with accounting principles generally accepted in the United States of America and expands disclosure about fair value measurements. FAS 157 is effective for fiscal years beginning after November 15, 2007. As of October 31, 2008, management does not believe the adoption of FAS 157 will impact the amounts reported in the financial statements; however, additional disclosures may be required about the inputs used to develop the measurements of fair value and the effect o f certain of the measurements on changes in net assets for the period.
In March 2008, the FASB issued Statement of Financial Accounting Standards No. 161 (FAS 161), "Disclosures about Derivative Instruments and Hedging Activities". FAS 161 requires enhanced disclosures about an entity's derivative and hedging activities, including qualitative disclosures about the objectives and strategies for using derivatives, quantitative disclosures about fair value amounts of and gains and losses on derivative instruments, and disclosures about credit-risk related contingent features in derivative instruments. FAS 161 is effective for fiscal years and interim periods beginning after November 15, 2008. Management is currently evaluating the impact the adoption of FAS 161 will have on the Fund's financial statement disclosures.
10
Eaton Vance International Income Fund as of October 31, 2008
REPORT OF INDEPENDENT REGISTERED PUBLIC ACCOUNTING FIRM
To the Trustees of Eaton Vance Mutual Funds Trust and Shareholders of Eaton Vance International Income Fund:
We have audited the accompanying statement of assets and liabilities of Eaton Vance International Income Fund (the "Fund") (one of the series of Eaton Vance Mutual Funds Trust) as of October 31, 2008, the related statement of operations for the year then ended, and the statements of changes in net assets and the financial highlights for the year then ended and the period from the start of business, June 27, 2007, to October 31, 2007. These financial statements and financial highlights are the responsibility of the Fund's management. Our responsibility is to express an opinion on these financial statements and financial highlights based on our audits.
We conducted our audits in accordance with the standards of the Public Company Accounting Oversight Board (United States). Those standards require that we plan and perform the audit to obtain reasonable assurance about whether the financial statements and financial highlights are free of material misstatement. The Fund is not required to have, nor were we engaged to perform, an audit of its internal control over financial reporting. Our audits included consideration of internal control over financial reporting as a basis for designing audit procedures that are appropriate in the circumstances, but not for the purpose of expressing an opinion on the effectiveness of the Fund's internal control over financial reporting. Accordingly, we express no such opinion. An audit also includes examining, on a test basis, evidence supporting the amounts and disclosures in the financial statements, assessing the accounting principles used and significant estimates made by management, as well as evaluating the overall financial statement presentation. We believe that our audits provide a reasonable basis for our opinion.
In our opinion, the financial statements and financial highlights referred to above present fairly, in all material respects, the financial position of Eaton Vance International Income Fund as of October 31, 2008, the results of its operations for the year then ended, and the changes in its net assets and the financial highlights for the year then ended and the period from the start of business, June 27, 2007, to October 31, 2007, in conformity with accounting principles generally accepted in the United States of America.
DELOITTE & TOUCHE LLP
Boston, Massachusetts
December 18, 2008
11
Eaton Vance International Income Fund as of October 31, 2008
FEDERAL TAX INFORMATION (Unaudited)
The Form 1099-DIV you receive in January 2009 will show the tax status of all distributions paid to your account in calendar 2008. Shareholders are advised to consult their own tax adviser with respect to the tax consequences of their investment in the Fund.
Capital Gain Dividends — The Fund designates $2,041 as a long-term capital gain dividend.
12
International Income Portfolio as of October 31, 2008
PORTFOLIO OF INVESTMENTS
| Foreign Government Bonds — 52.5% | |
| Security | | Principal
Amount | | U.S. $ Value | |
| Australia — 0.2% | |
| Commonwealth of Australia, 6.50%, 5/15/13 | | AUD | 105,000 | | | $ | 74,799 | | |
| Total Australia (identified cost $94,639) | | | | | | $ | 74,799 | | |
| Belgium — 3.8% | |
| Kingdom of Belgium, 3.75%, 3/28/09 | | EUR | 274,000 | | | $ | 350,139 | | |
| Kingdom of Belgium, 4.00%, 3/28/13 | | EUR | 211,000 | | | | 271,587 | | |
| Kingdom of Belgium, 5.50%, 9/28/17 | | EUR | 195,000 | | | | 265,981 | | |
| Kingdom of Belgium, 5.50%, 3/28/28 | | EUR | 288,000 | | | | 390,512 | | |
| Total Belgium (identified cost $1,419,108) | | | | | | $ | 1,278,219 | | |
| Brazil — 0.3% | |
| Nota Do Tesouro Nacional, 6.00%, 5/15/15(1) | | BRL | 243,533 | | | $ | 92,687 | | |
| Total Brazil (identified cost $123,565) | | | | | | $ | 92,687 | | |
| Canada — 2.2% | |
| Canada Government, 3.60%, 6/15/13 | | CAD | 881,000 | | | $ | 736,347 | | |
| Total Canada (identified cost $877,023) | | | | | | $ | 736,347 | | |
| Costa Rica — 0.1% | |
| Titulo Propiedad Ud, 1.00%, 1/12/22(2) | | CRC | 39,277,999 | | | $ | 36,548 | | |
| Titulo Propiedad Ud, 1.63%, 7/13/16(3) | | CRC | 4,532,256 | | | | 4,237 | | |
| Total Costa Rica (identified cost $46,248) | | | | | | $ | 40,785 | | |
| Czech Republic — 3.3% | |
| Czech Republic, 4.125%, 3/18/20 | | EUR | 1,010,000 | | | $ | 1,125,121 | | |
Total Czech Republic
(identified cost $1,510,545) | | | | | | $ | 1,125,121 | | |
| Denmark — 1.9% | |
| Kingdom of Denmark, 4.00%, 11/15/15 | | DKK | 215,000 | | | $ | 35,743 | | |
| Kingdom of Denmark, 4.00%, 11/15/17 | | DKK | 1,008,000 | | | | 166,805 | | |
| Kingdom of Denmark, 5.00%, 11/15/13 | | DKK | 938,000 | | | | 165,476 | | |
| Kingdom of Denmark, 6.00%, 11/15/09 | | DKK | 1,470,000 | | | | 254,838 | | |
| Total Denmark (identified cost $665,949) | | | | | | $ | 622,862 | | |
| Security | | Principal
Amount | | U.S. $ Value | |
| Ecuador — 0.0% | |
| Republic of Ecuador, 10.00%, 8/15/30 | | USD | 15,000 | | | $ | 4,425 | | |
| Total Ecuador (identified cost $4,725) | | | | | | $ | 4,425 | | |
| France — 14.3% | |
| Government of France, 3.75%, 4/25/17 | | EUR | 420,000 | | | $ | 517,883 | | |
| Government of France, 4.00%, 4/25/09 | | EUR | 1,055,000 | | | | 1,351,876 | | |
| Government of France, 4.00%, 10/25/13 | | EUR | 905,000 | | | | 1,175,311 | | |
| Government of France, 4.00%, 4/25/14 | | EUR | 570,000 | | | | 737,773 | | |
| Government of France, 5.50%, 4/25/29 | | EUR | 745,000 | | | | 1,036,977 | | |
| Total France (identified cost $5,248,819) | | | | | | $ | 4,819,820 | | |
| Georgia — 0.9% | |
| Republic of Georgia, 7.50%, 4/15/13 | | USD | 400,000 | | | $ | 288,000 | | |
| Total Georgia (identified cost $310,355) | | | | | | $ | 288,000 | | |
| Germany — 12.4% | |
| Bundesrepub Deutschland, 3.75%, 7/4/13 | | EUR | 1,096,000 | | | $ | 1,430,847 | | |
| Bundesrepub Deutschland, 6.25%, 1/4/30 | | EUR | 732,000 | | | | 1,128,152 | | |
| Bundesschatzanweisungen, 3.75%, 3/13/09 | | EUR | 1,280,000 | | | | 1,637,963 | | |
| Total Germany (identified cost $4,339,101) | | | | | | $ | 4,196,962 | | |
| Ghana — 0.3% | |
| Ghanaian Government Bond, 13.69%, 3/15/10(5) | | GHS | 140,000 | | | $ | 110,275.00 | | |
| Total Ghana (identified cost $145,506) | | | | | | $ | 110,275 | | |
| Ivory Coast — 0.0% | |
| Ivory Coast, 4.00%, 3/31/28 | | USD | 45,000 | | | $ | 15,001 | | |
| Total Ivory Coast (identified cost $15,750) | | | | | | $ | 15,001 | | |
| Netherlands — 3.8% | |
| Government of Netherlands, 3.75%, 7/15/09 | | EUR | 234,000 | | | $ | 299,543 | | |
| Government of Netherlands, 3.75%, 1/15/23 | | EUR | 368,000 | | | | 427,560 | | |
| Government of Netherlands, 4.50%, 7/15/17 | | EUR | 206,000 | | | | 264,851 | | |
| Government of Netherlands, 5.00%, 7/15/12 | | EUR | 212,000 | | | | 283,952 | | |
| Total Netherlands (identified cost $1,406,784) | | | | | | $ | 1,275,906 | | |
See notes to financial statements
13
International Income Portfolio as of October 31, 2008
PORTFOLIO OF INVESTMENTS CONT'D
| Security | | Principal
Amount | | U.S. $ Value | |
| Nigeria — 0.2% | |
| Nigerian Treasury Bond, 12.00%, 4/28/09 | | NGN | 6,343,000 | | | $ | 54,597 | | |
| Total Nigeria (identified cost $53,194) | | | | | | $ | 54,597 | | |
| Peru — 0.3% | |
| Republic of Peru, 12.25%, 8/10/11 | | PEN | 255,000 | | | $ | 89,083 | | |
| Total Peru (identified cost $109,425) | | | | | | $ | 89,083 | | |
| Sweden — 2.5% | |
| Swedish Government, 3.75%, 8/12/17 | | SEK | 5,510,000 | | | $ | 723,367 | | |
| Swedish Government, 5.00%, 1/28/09 | | SEK | 470,000 | | | | 60,797 | | |
| Swedish Government, 6.75%, 5/5/14 | | SEK | 395,000 | | | | 59,927 | | |
| Total Sweden (identified cost $934,556) | | | | | | $ | 844,091 | | |
| Turkey — 0.0% | |
| Republic of Turkey, 6.875%, 3/17/36 | | USD | 15,000 | | | $ | 10,275 | | |
| Total Turkey (identified cost $9,150) | | | | | | $ | 10,275 | | |
| United Kingdom — 6.0% | |
| United Kingdom Treasury Bond, 4.75%, 6/7/10 | | GBP | 342,000 | | | $ | 565,951 | | |
| United Kingdom Treasury Bond, 4.75%, 3/7/20 | | GBP | 285,000 | | | | 459,408 | | |
| United Kingdom Treasury Bond, 5.00%, 3/7/12 | | GBP | 321,000 | | | | 538,996 | | |
| United Kingdom Treasury Bond, 5.00%, 9/7/14 | | GBP | 266,000 | | | | 448,819 | | |
Total United Kingdom
(identified cost $2,464,786) | | | | | | $ | 2,013,174 | | |
| Uruguay — 0.0% | |
| Republic of Uruguay, 7.875%, 1/15/33 | | USD | 15,000 | | | $ | 9,454 | | |
| Total Uruguay (identified cost $9,150) | | | | | | $ | 9,454 | | |
Total Foreign Government Bonds
(identified cost $19,788,378) | | | | | | $ | 17,701,883 | | |
| Security | | Principal
Amount | | U.S. $ Value | |
| Foreign Corporate Bonds — 0.3% | |
| Kazakhstan — 0.3% | |
| Kazkommerts International, 7.875%, 4/7/14 | | USD | 200,000 | | | $ | 91,782 | | |
| Total Kazakhstan (identified cost $160,100) | | | | | | $ | 91,782 | | |
Total Foreign Corporate Bonds
(identified cost $160,100) | | | | | | $ | 91,782 | | |
| Mortgage-Backed Securities — 26.4% | |
| Security | | Principal
Amount | | U.S. $ Value | |
| Collateralized Mortgage Obligations — 5.6% | |
Federal Home Loan Mortgage Corp.,
Series 2127, Class PG, 6.25%, 2/15/29 | | $ | 859,319 | | | $ | 862,246 | | |
Federal National Mortgage Association,
Series 1991-139, Class PN, 7.50%, 10/25/21 | | | 979,819 | | | | 1,030,069 | | |
Total Collateralized Mortgage Obligations
(identified cost $1,919,562) | | | | | | $ | 1,892,315 | | |
| Mortgage Pass-Throughs — 20.8% | |
| Federal National Mortgage Association : | | | | | | | | | |
| 6.00% with maturity at 2019 | | $ | 442,258 | | | $ | 452,565 | | |
| 6.50% with maturity at 2017 | | | 1,042,626 | | | | 1,064,585 | | |
| | | $ | 1,517,150 | | |
| Government National Mortgage Association : | | | | | | | | | |
| 7.00% with maturity at 2026 | | | 1,171,910 | | | | 1,226,353 | | |
| 8.00% with maturity at 2016 | | | 1,887,233 | | | | 2,007,702 | | |
| 9.00% with various maturities to 2024(4) | | | 2,034,483 | | | | 2,257,708 | | |
| | | $ | 5,491,763 | | |
Total Mortgage Pass-Throughs
(identified cost $6,988,656) | | | | | | $ | 7,008,913 | | |
Total Mortgage-Backed Securities
(identified cost $8,908,218) | | | | | | $ | 8,901,228 | | |
See notes to financial statements
14
International Income Portfolio as of October 31, 2008
PORTFOLIO OF INVESTMENTS CONT'D
| Currency Options Purchased — 0.4% | |
| Description | | Principal Amount
of Contracts
(000's omitted) | |
Strike Price | |
Expiration
Date | |
U.S. $ Value | |
Japanese Yen
Put Option | | JPY | 1,058,706 | | | | 106.94 | | | 4/3/09 | | $ | 131,121 | | |
Total Currency Options Purchased
(identified cost $148,995) | | | | $ | 131,121 | | |
| Short-Term Investments — 18.8% | |
| Foreign Government Securities — 3.4% | |
| Security | | Principal
Amount | | U.S. $ Value | |
| Brazil — 0.6% | |
| Letra Tesouro Nacional, 0.00%, 1/1/09 | | BRL | 460,000 | | | $ | 207,769 | | |
| Total Brazil (identified cost $270,718) | | | | | | $ | 270,769 | | |
| Georgia — 0.3% | |
| Bank of Georgia Group, 8.75%, 12/26/08(5) | | GEL | 150,000 | | | $ | 101,663 | | |
| Total Georgia (identified cost $106,209) | | | | | | $ | 101,663 | | |
| Iceland — 0.6% | |
| Republic of Iceland, 8.50%, 12/12/08 | | ISK | 31,712,000 | | | $ | 207,548 | | |
| Total Iceland (identified cost $416,292) | | | | | | $ | 207,548 | | |
| Nigeria — 0.2% | |
| Nigeria Treasury Bill, 0.00%, 7/2/09 | | NGN | 650,000 | | | $ | 5,198 | | |
| Nigeria Treasury Bill, 0.00%, 9/3/09 | | NGN | 6,201,000 | | | | 48,786 | | |
| Total Nigeria (identified cost $53,834) | | | | | | $ | 53,984 | | |
| Peru — 1.6% | |
| Peru Certificates of Deposit, 0.00%, 11/6/08 | | PEN | 600,000 | | | $ | 194,916 | | |
| Peru Certificates of Deposit, 0.00%, 12/9/08 | | PEN | 300,000 | | | | 96,878 | | |
| Peru Certificates of Deposit, 0.00%, 1/5/09 | | PEN | 200,000 | | | | 64,257 | | |
| Peru Certificates of Deposit, 0.00%, 2/9/09 | | PEN | 600,000 | | | | 191,450 | | |
| Total Peru (identified cost $570,255) | | | | | | $ | 547,501 | | |
| Security | | Principal
Amount | | U.S. $ Value | |
| Sri Lanka — 0.1% | |
| Republic of Sri Lanka, 11.50%, 11/1/08 | | LKR | 4,100,000 | | | $ | 37,207 | | |
| Total Sri Lanka (identified cost $38,007) | | | | $ | 37,207 | | |
Total Foreign Government Securities
(identified cost $1,455,315) | | | | $ | 1,155,672 | | |
| Other Securities — 15.4% | |
| Description | | Interest
(000's omitted) | | U.S. $ Value | |
Cash Management Portfolio,
1.90%(6) | | $ | 5,218 | | | $ | 5,218,098 | | |
Total Other Securities
(identified cost $5,218,098) | | | | $ | 5,218,098 | | |
Total Short-Term Investments
(identified cost $6,673,413) | | | | $ | 6,373,770 | | |
Total Investments
(identified cost $35,679,105) | | | | $ | 33,199,784 | | |
| Currency Options Written — (0.6)% | |
| Description | | Principal Amount
of Contracts
(000's omitted) | |
Strike Price | |
Expiration
Date | |
U.S. $ Value | |
Japanese Yen
Call Option | | JPY | 1,099,073 | | | | 79.07 | | | 4/3/09 | | $ | (189,227 | ) | |
Total Currency Options Written
(Premium received $117,803) | | | | $ | (189,227 | ) | |
| Other Assets, Less Liabilities — 2.2% | | | | $ | 744,122 | | |
| Net Assets — 100.0% | | | | $ | 33,754,679 | | |
AUD - Australian Dollar
BRL - Brazilian Real
CAD - Canadian Dollar
CRC - Costa Rican Colon
DKK - Danish Krone
See notes to financial statements
15
International Income Portfolio as of October 31, 2008
PORTFOLIO OF INVESTMENTS CONT'D
EUR - Euro
GBP - British Pound Sterling
GEL - Georgian Lari
GHS - Ghanaian Cedi
ISK - Icelandic Krona
JPY - Japanese Yen
LKR - Sri Lanka Rupee
NGN - Nigerian Naira
PEN - Peruvian New Sol
SEK - Swedish Krona
USD - United States Dollar
(1) Bond pays a 6.00% coupon on the face at the end of the payment period. Principal is adjusted daily based on the ICPA (Amplified Consumer Price Index) as determined by the Brazilian Institute of Geography and Statistics. The original face is BRL 139,000 and the current face is BRL 243,533.
(2) Bond pays a 1.00% coupon on the face at the end of the payment period. Principal is adjusted daily based on Development Units (Unidades de Desarrollo) as calculated by the General Superintendent of Values. The original face is CRC 33,700,000 and the current face is CRC 39,277,999.
(3) Bond pays a 1.63% coupon on the face at the end of the payment period. Principal is adjusted daily based on Development Units (Unidades de Desarrollo) as calculated by the General Superintendent of Values. The original face is CRC 3,700,000 and the current face is CRC 4,532,256.
(4) Security (or a portion thereof) has been segregated to cover margin requirements on open financial futures contracts.
(5) Security valued at fair value using methods determined in good faith by or at the direction of the Trustees.
(6) Affiliated investment company available to Eaton Vance portfolios and funds which invests in high quality, U.S. dollar denominated money market instruments. The rate shown is the annualized seven-day yield as of October 31, 2008.
See notes to financial statements
16
International Income Portfolio as of October 31, 2008
FINANCIAL STATEMENTS
Statement of Assets and Liabilities
As of October 31, 2008
| Assets | |
| Unaffiliated investments, at value (identified cost, $30,461,007) | | $ | 27,981,686 | | |
| Affiliated investment, at value (identified cost, $5,218,098) | | | 5,218,098 | | |
| Foreign currency, at value (identified cost, $50,632) | | | 44,817 | | |
| Interest receivable | | | 432,962 | | |
| Interest receivable from affiliated investment | | | 7,493 | | |
| Receivable for open forward foreign currency contracts | | | 341,588 | | |
| Receivable for closed forward foreign currency contracts | | | 286,309 | | |
| Receivable for open swap contracts | | | 463,853 | | |
| Receivable for closed swap contracts | | | 7,982 | | |
| Receivable for closed options | | | 10,839 | | |
| Total assets | | $ | 34,795,627 | | |
| Liabilities | |
| Written options outstanding, at value (premiums received, $117,803) | | $ | 189,227 | | |
| Payable for open swap contracts | | | 268,977 | | |
| Payable for daily variation margin on open financial futures contracts | | | 17,030 | | |
| Payable to affiliate for investment adviser fee | | | 16,823 | | |
| Payable for investments purchased | | | 14,554 | | |
| Payable to affiliate for Trustees' fees | | | 122 | | |
| Payable for open forward foreign currency contracts | | | 440,023 | | |
| Payable for closed forward foreign currency contracts | | | 18,978 | | |
| Accrued expenses | | | 75,214 | | |
| Total liabilities | | $ | 1,040,948 | | |
| Net Assets applicable to investors' interest in Portfolio | | $ | 33,754,679 | | |
| Sources of Net Assets | |
| Net proceeds from capital contributions and withdrawals | | $ | 36,274,203 | | |
| Net unrealized depreciation (computed on the basis of identified cost) | | | (2,519,524 | ) | |
| Total | | $ | 33,754,679 | | |
Statement of Operations
For the Year Ended
October 31, 2008
| Investment Income | |
| Interest (net of foreign taxes, $333) | | $ | 1,576,883 | | |
| Interest income allocated from affiliated investment | | | 80,736 | | |
| Expenses allocated from affiliated investment | | | (11,392 | ) | |
| Total investment income | | $ | 1,646,227 | | |
| Expenses | |
| Investment adviser fee | | $ | 195,649 | | |
| Trustees' fees and expenses | | | 942 | | |
| Custodian fee | | | 64,121 | | |
| Legal and accounting services | | | 58,414 | | |
| Miscellaneous | | | 2,360 | | |
| Total expenses | | $ | 321,486 | | |
Deduct —
Reduction of custodian fee | | $ | 27 | | |
| Total expense reductions | | $ | 27 | | |
| Net expenses | | $ | 321,459 | | |
| Net investment income | | $ | 1,324,768 | | |
| Realized and Unrealized Gain (Loss) | |
Net realized gain (loss) —
Investment transactions (identified cost basis) | | $ | (124,899 | ) | |
| Financial futures contracts | | | 64,402 | | |
| Swap contracts | | | (33,016 | ) | |
Foreign currency and forward foreign currency exchange
contract transactions | | | 2,071,201 | | |
| Net realized gain | | $ | 1,977,688 | | |
Change in unrealized appreciation (depreciation) —
Investments (identified cost basis) | | $ | (3,835,041 | ) | |
| Financial futures contracts | | | (2,149 | ) | |
| Written options | | | (71,424 | ) | |
| Swap contracts | | | 192,932 | | |
| Foreign currency and forward foreign currency exchange contracts | | | (282,668 | ) | |
| Net change in unrealized appreciation (depreciation) | | $ | (3,998,350 | ) | |
| Net realized and unrealized loss | | $ | (2,020,662 | ) | |
| Net decrease in net assets from operations | | $ | (695,894 | ) | |
See notes to financial statements
17
International Income Portfolio as of October 31, 2008
FINANCIAL STATEMENTS CONT'D
Statements of Changes in Net Assets
Increase (Decrease)
in Net Assets | | Year Ended
October 31, 2008 | | Period Ended
October 31, 2007(1) | |
From operations —
Net investment income | | $ | 1,324,768 | | | $ | 274,606 | | |
Net realized gain from investment
transactions, financial futures
contracts, swap contracts, and
foreign currency and forward
foreign currency exchange
contract transactions | | | 1,977,688 | | | | 356,685 | | |
Net change in unrealized appreciation
(depreciation) of investments,
financial futures contracts,
swap contracts, written
options, and foreign currency
and forward foreign currency
exchange contracts | | | (3,998,350 | ) | | | 1,478,826 | | |
Net increase (decrease) in net assets
from operations | | $ | (695,894 | ) | | $ | 2,110,117 | | |
Capital transactions —
Contributions | | $ | 17,567,573 | | | $ | 24,936,962 | | |
| Withdrawals | | | (6,696,831 | ) | | | (3,467,248 | ) | |
Net increase in net assets from
capital transactions | | $ | 10,870,742 | | | $ | 21,469,714 | | |
| Net increase in net assets | | $ | 10,174,848 | | | $ | 23,579,831 | | |
| Net Assets | |
| At beginning of period | | $ | 23,579,831 | | | $ | — | | |
| At end of period | | $ | 33,754,679 | | | $ | 23,579,831 | | |
(1) For the period from the start of business, June 27, 2007, to October 31, 2007.
See notes to financial statements
18
International Income Portfolio as of October 31, 2008
FINANCIAL STATEMENTS CONT'D
Supplementary Data
| | | Year Ended
October 31, 2008 | | Period Ended
October 31, 2007(1) | |
| Ratios/Supplemental Data | |
| Ratios (As a percentage of average daily net assets): | |
| Expenses before custodian fee reduction(2) | | | 1.01 | % | | | 1.35 | %(3) | |
| Net investment income | | | 4.01 | % | | | 3.75 | %(3) | |
| Portfolio Turnover | | | 14 | % | | | 2 | % | |
| Total Return | | | (0.64 | )% | | | 10.05 | %(4) | |
| Net assets, end of period (000's omitted) | | $ | 33,755 | | | $ | 23,580 | | |
(1) For the period from the start of business, June 27, 2007, to October 31, 2007.
(2) Excludes the effect of custody fee credits, if any, of less than 0.005%.
(3) Annualized.
(4) Not annualized.
See notes to financial statements
19
International Income Portfolio as of October 31, 2008
NOTES TO FINANCIAL STATEMENTS
1 Significant Accounting Policies
International Income Portfolio (the Portfolio) is a New York trust registered under the Investment Company Act of 1940, as amended (the 1940 Act), as a non-diversified, open-end management investment company. The Portfolio's investment objective is to seek total return. The Declaration of Trust permits the Trustees to issue interests in the Portfolio. At October 31, 2008, Eaton Vance International Income Fund, Eaton Vance Medallion Strategic Income Fund and Eaton Vance Strategic Income Fund held an interest of 16.4%, 9.4% and 73.8%, respectively, in the Portfolio.
The following is a summary of significant accounting policies of the Portfolio. The policies are in conformity with accounting principles generally accepted in the United States of America.
A Investment Valuation — Debt obligations, including listed securities and securities for which quotations are available, will normally be valued on the basis of market quotations provided by independent pricing services. The pricing services consider various factors relating to bonds and/or market transactions to determine market value. Most seasoned, fixed rate 30-year mortgage-backed securities are valued through the use of the investment adviser's matrix pricing system, which takes into account bond prices, yield differentials, anticipated prepayments and interest rates provided by dealers. Short-term debt securities with a remaining maturity of sixty days or less (excluding those that are non-U.S. dollar denominated, which typically are valued by a pricing service or dealer quotes) are valued at amortized cost, which approximates market value. If short-term debt securities are acquired with a remaining maturity of more than sixty days, they will be valued by a pricing service. Financial futures contracts and options on financial futures contracts listed on commodity exchanges are valued based on the closing price on the primary exchange on which such contracts trade. Forward foreign currency exchange contracts are generally valued using prices supplied by a pricing vendor or dealers. Interest rate swaps are normally valued using valuations provided by a pricing vendor. Such vendor valuations are based on the present value of fixed and projected floating rate cash flows over the term of the swap contract. Future cash flows are discounted to their present value using swap curves provided by electronic data services or by broker/dealers. Credit default swaps are valued by a broker-dealer (usually the counterparty to the agreement). Sovereign credit default swaps, foreign i nterest rate swaps and over-the-counter currency options are valued by a pricing service. Foreign securities and currencies are valued in U.S. dollars, based on foreign currency exchange rate quotations supplied by an independent quotation service. The independent service uses a proprietary model to determine the exchange rate. Inputs to the model include reported trades and implied bid/ask spreads. Investments for which valuations or market quotations are not readily available are valued at fair value using methods determined in good faith by or at the direction of the Trustees of the Portfolio considering relevant factors, data and information including the market value of freely tradable securities of the same class in the principal market on which such securities are normally traded.
The Portfolio may invest in Cash Management Portfolio (Cash Management), an affiliated investment company managed by Boston Management and Research (BMR), a subsidiary of Eaton Vance Management (EVM). Cash Management values its investment securities utilizing the amortized cost valuation technique permitted by Rule 2a-7 of the 1940 Act, pursuant to which Cash Management must comply with certain conditions. This technique involves initially valuing a portfolio security at its cost and thereafter assuming a constant amortization to maturity of any discount or premium. If amortized cost is determined not to approximate fair value, Cash Management may value its investment securities based on available market quotations provided by a pricing service.
B Investment Transactions — Investment transactions for financial statement purposes are accounted for on a trade date basis. Realized gains and losses on investments sold are determined on the basis of identified cost.
C Income — Interest income is recorded on the basis of interest accrued, adjusted for amortization of premium or accretion of discount.
D Federal Taxes — The Portfolio has elected to be treated as a partnership for federal tax purposes. No provision is made by the Portfolio for federal or state taxes on any taxable income of the Portfolio because each investor in the Portfolio is ultimately responsible for the payment of any taxes on its share of taxable income. Since at least one of the Portfolio's investors is a regulated investment company that invests all or substantially all of its assets in the Portfolio, the Portfolio normally must satisfy the applicable source of income and diversification requirements (under the Internal Revenue Code) in order for its investors to satisfy them. The Portfolio will allocate,
20
International Income Portfolio as of October 31, 2008
NOTES TO FINANCIAL STATEMENTS CONT'D
at least annually among its investors, each investor's distributive share of the Portfolio's net investment income, net realized capital gains and any other items of income, gain, loss, deduction or credit.
As of October 31, 2008, the Portfolio had no uncertain tax positions that would require financial statement recognition, de-recognition, or disclosure. Each of the Portfolio's federal tax returns filed since the start of business on June 27, 2007, to October 31, 2008 remains subject to examination by the Internal Revenue Service.
E Expense Reduction — State Street Bank and Trust Company (SSBT) serves as custodian of the Portfolio. Pursuant to the custodian agreement, SSBT receives a fee reduced by credits, which are determined based on the average daily cash balance the Portfolio maintains with SSBT. All credit balances, if any, used to reduce the Portfolio's custodian fees are reported as a reduction of expenses in the Statement of Operations.
F Foreign Currency Translation — Investment valuations, other assets, and liabilities initially expressed in foreign currencies are translated each business day into U.S. dollars based upon current exchange rates. Purchases and sales of foreign investment securities and income and expenses denominated in foreign currencies are translated into U.S. dollars based upon currency exchange rates in effect on the respective dates of such transactions. Recognized gains or losses on investment transactions attributable to changes in foreign currency exchange rates are recorded for financial statement purposes as net realized gains and losses on investments. That portion of unrealized gains and losses on investments that results from fluctuations in foreign currency exchange rates is not separately disclosed.
G Use of Estimates — The preparation of the financial statements in conformity with accounting principles generally accepted in the United States of America requires management to make estimates and assumptions that affect the reported amounts of assets and liabilities at the date of the financial statements and the reported amounts of income and expense during the reporting period. Actual results could differ from those estimates.
H Indemnifications — Under the Portfolio's organizational documents, its officers and Trustees may be indemnified against certain liabilities and expenses arising out of the performance of their duties to the Portfolio. Interestholders in the Portfolio are jointly and severally liable for the liabilities and obligations of the Portfolio in the event that the Portfolio fails to satisfy such liabilities and obligations; provided, however, that, to the extent assets are available in the Portfolio, the Portfolio may, under certain circumstances, indemnify interestholders from and against any claim or liability to which such holder may become subject by reason of being or having been an interestholder in t he Portfolio. Additionally, in the normal course of business, the Portfolio enters into agreements with service providers that may contain indemnification clauses. The Portfolio's maximum exposure under these arrangements is unknown as this would involve future claims that may be made against the Portfolio that have not yet occurred.
I Financial Futures Contracts — The Portfolio may enter into financial futures contracts. The Portfolio's investment in financial futures contracts is designed for hedging against changes in interest rates or as substitute for the purchase of securities. Upon entering into a financial futures contract, the Portfolio is required to deposit with the broker, either in cash or securities an amount equal to a certain percentage of the purchase price (initial margin). Subsequent payments, known as variation margin, are made or received by the Portfolio each business day, depending on the daily fluctuations in the value of the underlying security, and are recorded as unrealized gains or losses by the Portfolio. Gains (losses) are realized upon the expiration or closing of the fi nancial futures contracts. Should market conditions change unexpectedly, the Portfolio may not achieve the anticipated benefits of the financial futures contracts and may realize a loss. In entering such contracts, the Portfolio bears the risk if the counterparties do not perform under the contracts' terms.
J Forward Foreign Currency Exchange Contracts — The Portfolio may enter into forward foreign currency exchange contracts for the purchase or sale of a specific foreign currency at a fixed price on a future date. The Portfolio enters into forward contracts for hedging purposes as well as non-hedging purposes. The forward foreign currency exchange contract is adjusted by the daily exchange rate of the underlying currency and any gains or losses are recorded as unrealized until such time as the contract has been closed or offset by another contract with the same broker for the same settlement date and currency. Risks may arise upon entering these contracts from the potential inability of counterparties to meet the terms of their contracts and from movements in the value of a foreign currency relative to the U.S. dollar.
K Written Options — Upon the writing of a call or a put option, the premium received by the Portfolio is
21
International Income Portfolio as of October 31, 2008
NOTES TO FINANCIAL STATEMENTS CONT'D
included in the Statement of Assets and Liabilities as a liability. The amount of the liability is subsequently marked-to-market to reflect the current market value of the option written, in accordance with the Portfolio's policies on investment valuations discussed above. Premiums received from writing options which expire are treated as realized gains. Premiums received from writing options which are exercised or are closed are added to or offset against the proceeds or amount paid on the transaction to determine the realized gain or loss. If a put option is exercised, the premium reduces the cost basis of the securities purchased by the Portfolio. The Portfolio, as a writer of an option, may have no control over whether the underlying securities or other assets may be sold (call) or purchased (put) and, as a result, bears the market risk of an unfavorable change in the price of the securities or other assets underlying the wr itten option. The Portfolio may also bear the risk of not being able to enter into a closing transaction if a liquid secondary market does not exist.
L Purchased Options — Upon the purchase of a call or put option, the premium paid by the Portfolio is included in the Statement of Assets and Liabilities as an investment. The amount of the investment is subsequently marked-to-market to reflect the current market value of the option purchased, in accordance with the Portfolio's policies on investment valuations discussed above. If an option which the Portfolio has purchased expires on the stipulated expiration date, the Portfolio will realize a loss in the amount of the cost of the option. If the Portfolio enters into a closing sale transaction, the Portfolio will realize a gain or loss, depending on whether the sales proceeds from the closing sale transaction are greater or less than the cost of the option. If the Portfo lio exercises a put option, it will realize a gain or loss from the sale of the underlying security, and the proceeds from such sale will be decreased by the premium originally paid. If the Portfolio exercises a call option, the cost of the security which the Portfolio purchases upon exercise will be increased by the premium originally paid.
M Interest Rate Swaps — The Portfolio may enter into interest rate swap agreements to enhance return, to hedge against fluctuations in securities prices or interest rates, or as substitution for the purchase or sale of securities. Pursuant to these agreements, the Portfolio makes periodic payments at a fixed interest rate and, in exchange, receives payments based on the interest rate of a benchmark industry index. Payments received or made are recorded as realized gains or losses. During the term of the outstanding swap agreement, changes in the underlying value of the swap are recorded as unrealized gains or losses. The value of the swap is determined by changes in the relationship between two rates of interest. The Portfolio is exposed to credit loss in the event of non-performance by the swap counterparty. Risk may also arise from movements in interest rates.
N Credit Default Swaps — The Portfolio may enter into credit default swap contracts to buy or sell protection against default on an individual issuer or a basket of issuers of bonds. When the Portfolio is the buyer of a credit default swap contract, the Portfolio is entitled to receive the par (or other agreed-upon) value of a referenced debt obligation (or basket of debt obligations) from the counterparty to the contract in the event of default by a third party, such as a U.S. or foreign corporate issuer, on the debt obligation. In return, the Portfolio pays the counterparty a periodic stream of payments over the term of the contract provided that no event of default has occurred. If no default occurs, the Portfolio would have spent the stream of payments and received no benefits from the contract. When the Portfolio is the seller of a credit default swap contract, it receives the stream of payments, but is obligated to pay upon default of the referenced debt obligation. As the seller, the Portfolio effectively adds leverage to its portfolio because, in addition to its total net assets, the Portfolio is subject to investment exposure on the notional amount of the swap. The interest fee paid or received on the swap contract, which is based on a specified interest rate on a fixed notional amount, is accrued daily as a component of unrealized appreciation (depreciation) and is recorded as realized gain upon receipt or realized loss upon payment. The Portfolio also records an increase or decrease to unrealized appreciation (depreciation) in an amount equal to the daily valuation. Up-front payments or receipts, if any, are recorded as other assets or other liabilities, respectively, and amortized over the life of the swap contract as realized gains or losses. The Portfolio segre gates assets in the form of cash and cash equivalents in an amount equal to the aggregate market value of the credit default swaps of which it is the seller, marked to market on a daily basis. These transactions involve certain risks, including the risk that the seller may be unable to fulfill the transaction.
O Total Return Swaps — The Portfolio may enter into swap agreements to enhance return, to hedge against fluctuations in securities prices or interest rates or as substitution for the purchase or sale of securities. In a total return swap, the Portfolio makes payments at a rate equal to a predetermined spread to the one or three-month LIBOR. In exchange, the Portfolio receives payments based on the rate of return of a benchmark industry index or basket of securities. During the term of the outstanding swap agreement, changes in the underlying value of the swap are recorded as unrealized gains and losses. Periodic payments received or made are recorded as realized gains or losses. The value of the swap is determined by changes in the relationship between the rate of interes t and the
22
International Income Portfolio as of October 31, 2008
NOTES TO FINANCIAL STATEMENTS CONT'D
benchmark industry index or basket of securities. The Portfolio is exposed to credit loss in the event of nonperformance by the swap counterparty. Risk may also arise from the unanticipated movements in value of interest rates, securities, or the index.
2 Investment Adviser Fee and Other Transactions with Affiliates
The investment adviser fee is earned by BMR as compensation for management and investment advisory services rendered to the Portfolio. The fee is computed at an annual rate of 0.625% of the Portfolio's average daily net assets up to $1 billion and at reduced rates as daily net assets exceed that level, and is payable monthly. The portion of the adviser fee payable by Cash Management on the Portfolio's investment of cash therein is credited against the Portfolio's adviser fee. For the year ended October 31, 2008, the Portfolio's adviser fee totaled $206,482 of which $10,833 was allocated from Cash Management and $195,649 was paid or accrued directly by the Portfolio. For the year ended October 31, 2008, the Portfolio's adviser fee, including the portion allocated from Cash Management, was 0.625% of the Portfolio's average daily net assets.
Except for Trustees of the Portfolio who are not members of EVM's or BMR's organizations, officers and Trustees receive remuneration for their services to the Portfolio out of the investment adviser fee. Trustees of the Portfolio who are not affiliated with the investment adviser may elect to defer receipt of all or a percentage of their annual fees in accordance with the terms of the Trustees Deferred Compensation Plan. For the year ended October 31, 2008, no significant amounts have been deferred. Certain officers and Trustees of the Portfolio are officers of the above organizations.
3 Purchases and Sales of Investments
Purchases and sales of investments, other than short-term obligations and including maturities and paydowns, for the year ended October 31, 2008 were as follows:
| Purchases | |
| Investments (non-U.S. Government) | | $ | 8,825,697 | | |
| U.S. Government and Agency Securities | | | 4,153,115 | | |
| | | $ | 12,978,812 | | |
| Sales | |
| Investments (non-U.S. Government) | | $ | 1,900,082 | | |
| U.S. Government and Agency Securities | | | 1,977,973 | | |
| | | $ | 3,878,055 | | |
4 Federal Income Tax Basis of Investments
The cost and unrealized appreciation (depreciation) of investments of the Portfolio at October 31, 2008, as determined on a federal income tax basis, were as follows:
| Aggregate cost | | $ | 35,743,042 | | |
| Gross unrealized appreciation | | $ | 64,199 | | |
| Gross unrealized depreciation | | | (2,607,457 | ) | |
| Net unrealized depreciation | | $ | (2,543,258 | ) | |
The net unrealized depreciation on swaps, written options, foreign currency and forward foreign currency contracts at October 31, 2008 on a federal income tax basis was $27,776.
5 Financial Instruments
The Portfolio may trade in financial instruments with off-balance sheet risk in the normal course of its investing activities. These financial instruments may include forward foreign currency exchange contracts, financial futures contracts, interest rate swaps, credit default swaps, total return swaps and written options and may involve, to a varying degree, elements of risk in excess of the amounts recognized for financial statement purposes. The notional or contractual amounts of these instruments represent the investment the Portfolio has in particular classes of financial instruments and does not necessarily represent the amounts potentially subject to risk. The measurement of the risks associated with these instruments is meaningful only when all related and offsetting transactions are considered.
A summary of obligations under these financial instruments at October 31, 2008 is as follows:
| Forward Foreign Currency Exchange Contracts | |
| Sales | |
| Settlement Date | | Deliver | | In Exchange For | | Net Unrealized
Appreciation
(Depreciation) | |
| 1/05/09 | | Brazilian Real
681,169 | | United States Dollar
364,652 | | $55,893 | |
23
International Income Portfolio as of October 31, 2008
NOTES TO FINANCIAL STATEMENTS CONT'D
| Settlement Date(s) | | Deliver | | In Exchange For | | Net Unrealized
Appreciation
(Depreciation) | |
| 12/22/08 | | Croatia Kuna
469,000 | | Euro
64,601 | | $ | (274 | ) | |
| 1/26/09 | | Croatia Kuna
249,600 | | Euro
34,131 | | | (226 | ) | |
| 11/04/08 | | Euro
970,000 | | United States Dollar
1,233,822 | | | (3,444 | ) | |
| 11/06/08 | | Euro
50,149 | | United States Dollar
68,956 | | | 5,043 | | |
| 11/12/08 | | Euro
330,000 | | United States Dollar
420,017 | | | (454 | ) | |
| 12/12/08 | | Icelandic Krona
27,995,543 | | United States Dollar
358,192 | | | 173,299 | | |
| 11/24/08 | | Indonesian Rupiah
1,698,000,000 | | United States Dollar
132,656 | | | (15,857 | ) | |
| 11/06/08 | | Israeli Shekel
320,000 | | United States Dollar
85,283 | | | (846 | ) | |
| 11/10/08 | | Malaysian Ringgit
640,000 | | United States Dollar
182,675 | | | 2,465 | | |
| 11/28/08 | | Malaysian Ringgit
604,000 | | United States Dollar
168,668 | | | (1,345 | ) | |
| 11/03/08 | | Mauritian Rupee
5,225,000 | | United States Dollar
165,873 | | | 3,353 | | |
| 11/04/08 | | New Turkish Lira
132,510 | | United States Dollar
78,641 | | | (7,174 | ) | |
| 11/28/08 | | New Zealand Dollar
135,000 | | United States Dollar
78,638 | | | 266 | | |
| 11/06/08 | | Peruvian New Sol
300,000 | | United States Dollar
101,902 | | | 4,371 | | |
| 11/10/08 | | Peruvian New Sol
300,000 | | United States Dollar
101,850 | | | 4,378 | | |
| 12/11/08 | | Peruvian New Sol
300,000 | | United States Dollar
101,902 | | | 4,870 | | |
| 2/09/09 | | Peruvian New Sol
600,000 | | United States Dollar
203,114 | | | 10,577 | | |
| 11/10/08 | | Philippine Peso
8,700,000 | | United States Dollar
180,348 | | | 3,310 | | |
| 11/05/08 | | South African Rand
943,400 | | United States Dollar
85,218 | | | (11,267 | ) | |
| 11/07/08 | | South African Rand
2,762,582 | | United States Dollar
270,536 | | | (11,844 | ) | |
| 11/03/08 | | Sri Lanka Rupee
4,335,750 | | United States Dollar
38,684 | | | (669 | ) | |
| 11/20/08 | | Swedish Krona
4,371,469 | | Euro
437,475 | | | (5,813 | ) | |
| Settlement Date(s) | | Deliver | | In Exchange For | | Net Unrealized
Appreciation
(Depreciation) | |
| 11/28/08 | | Taiwan Dollar
6,000,000 | | United States Dollar
180,538 | | $ | (1,974 | ) | |
| 12/26/08 | | Taiwan Dollar
6,010,000 | | United States Dollar
179,720 | | | (3,352 | ) | |
| 1/21/09 | | Taiwan Dollar
4,800,000 | | United States Dollar
147,647 | | | 1,305 | | |
| 11/28/08 | | Thai Baht
12,000,000 | | United States Dollar
343,544 | | | 2,344 | | |
| 11/04/08 | | Zambian Kwacha
160,000,000 | | United States Dollar
33,650 | | | (2,144 | ) | |
| 11/07/08 | | Zambian Kwacha
160,000,000 | | United States Dollar
33,963 | | | (1,801 | ) | |
| 1/15/09 | | Zambian Kwacha
160,000,000 | | United States Dollar
39,024 | | | 3,871 | | |
| | | $ | 206,861 | | |
| Purchases | |
| Settlement Date | | In Exchange For | | Deliver | | Net Unrealized
Appreciation
(Depreciation) | |
| 12/02/08 | | Brazilian Real
360,000 | | United States Dollar
167,676 | | $ | (3,399 | ) | |
| 11/28/08 | | British Pound Sterling
102,339 | | United States Dollar
167,968 | | | (3,515 | ) | |
| 11/07/08 | | Colombian Peso
273,125,859 | | United States Dollar
125,806 | | | (11,333 | ) | |
| 11/04/08 | | Euro
970,000 | | United States Dollar
1,238,815 | | | (2,501 | ) | |
| 11/28/08 | | Euro
469,311 | | United States Dollar
606,139 | | | (8,534 | ) | |
| 11/24/08 | | Indonesian Rupiah
1,698,000,000 | | United States Dollar
168,119 | | | (19,606 | ) | |
| 11/12/08 | | Japanese Yen
545,658,000 | | United States Dollar
5,818,180 | | | (277,685 | ) | |
| 11/19/08 | | Japanese Yen
830,114,260 | | United States Dollar
8,447,281 | | | (16,373 | ) | |
| 11/03/08 | | Mauritian Rupee
5,225,000 | | United States Dollar
186,009 | | | (23,490 | ) | |
| 11/07/08 | | Mauritian Rupee
5,225,000 | | United States Dollar
165,755 | | | (3,286 | ) | |
| 11/17/08 | | Mauritian Rupee
800,000 | | United States Dollar
26,667 | | | (1,817 | ) | |
| 11/06/08 | | Mexican Peso
4,360,000 | | United States Dollar
331,559 | | | 7,075 | | |
24
International Income Portfolio as of October 31, 2008
NOTES TO FINANCIAL STATEMENTS CONT'D
| Settlement Date | | In Exchange For | | Deliver | | Net Unrealized
Appreciation
(Depreciation) | |
| 11/07/08 | | Mexican Peso
1,980,000 | | United States Dollar
145,535 | | $ | 8,202 | | |
| 11/14/08 | | Polish Zloty
1,639,130 | | Euro
425,969 | | | 49,215 | | |
| 11/04/08 | | Zambian Kwacha
160,000,000 | | United States Dollar
34,043 | | | 1,751 | | |
| | | $ | (305,296 | ) | |
At October 31, 2008, closed forward foreign currency purchases and sales contracts excluded above amounted to a receivable of $286,309 and a payable of $18,978.
Futures Contracts
Expiration
Date | | Contracts | | Position | | Aggregate
Cost | | Value | | Net
Unrealized
Appreciation
(Depreciation) | |
| 12/08 | | 4
Euro-Bund | | Long | | $ | 588,908 | | | $ | 591,034 | | | $ | 2,126 | | |
| 12/08 | | 12
U.K. Gilt | | Long | | $ | 2,163,005 | | | $ | 2,149,255 | | | $ | (13,750 | ) | |
| 12/08 | | 3
Canadian 10 Year Treasury Bond | | Long | | $ | 297,310 | | | $ | 291,687 | | | $ | (5,623 | ) | |
| 12/08 | | 4
Mexico Bolsa Index | | Short | | $ | (65,798 | ) | | $ | (64,535 | ) | | $ | 1,263 | | |
| 12/08 | | 3
FTSE/JSE Top 40 Index | | Short | | $ | (73,384 | ) | | $ | (59,549 | ) | | $ | 13,835 | | |
| | | | | | | | | | | | | | | $ | (2,149 | ) | |
Descriptions of the underlying instruments to Futures Contracts:
• Canadian 10 Year Treasury Bond: Canadian Government Bonds (CGB) having a maximum original maturity of 10 3/4 years and having a remaining maturity between 8 – 10.5 years as of the first day of the delivery month.
• Euro-Bund: Long-term notional debt securities issued by the German Federal Government with a term of 8.5 – 10.5 years.
• U.K. Gilt: Gilt issues having a maturity of 8 3/4 to 13 years from the calendar day of the delivery month.
• FTSE/JSE Top 40 Index: The FTSE/JSE Top 40 Index is a capitalization weighted index of the 40 largest companies by market capitalization included in the FTSE/JSE All Shares Index.
• Mexico Bolsa Index: Mexico Bolsa Index is a capitalization weighted index of the leading stocks traded on the Mexican stock exchange.
Interest Rate Swaps
| Counterparty | | Notional
Amount
(000's
omitted) | | Portfolio
Pays/
Receives
Floating
Rate | | Floating
Rate Index | | Annual
Fixed Rate | | Termination
Date | | Net
Unrealized
Depreciation | |
J.P. Morgan
Chase, N.A | | BRL | 1,207 | | | | |
Pay | | Brazilian
Interbank
Deposit Rate | | | 11.34 | % | | | 1/2/09 | | | $ | (5,178 | ) | |
| | | $ | (5,178 | ) | |
BRL — Brazilian Real
Credit Default Swaps
| Counterparty | | Reference
Entity | | Buy/
Sell | | Notional
Amount
(000's
omitted) | | Pay/
Receive
Annual
Fixed
Rate | | Termination
Date | | Net
Unrealized
Appreciation
(Depreciation) | |
Barclays Capital
Services, Inc | | Austria | | Buy | | $ | 200 | | | | .44 | % | | 12/20/13 | | $ | 3,340 | | |
Barclays Capital
Services, Inc. | | Iceland
(Republic of) | | Sell | | | 100 | | | | 1.88 | | | 3/20/18 | | | (30,995 | ) | |
Barclays Capital
Services, Inc | | Kazakhstan
(Republic of) | | Sell | | | 200 | | | | 9.75 | | | 11/20/09 | | | 4,012 | | |
Barclays Capital
Services, Inc | | Kazakhstan
(Republic of) | | Buy | | | 200 | | | | 2.43 | | | 9/20/13 | | | 36,083 | | |
Barclays Capital
Services, Inc. | | Turkey
(Republic of) | | Buy | | | 540 | | | | 2.12 | | | 1/20/13 | | | 47,607 | | |
CitiGlobal
Market, Inc. | | Kazakhstan
(Republic of) | | Sell | | | 100 | | | | 8.00 | | | 10/20/09 | | | 377 | | |
CitiGlobal
Market, Inc. | | Peru
(Republic of) | | Sell | | | 200 | | | | 2.00 | | | 9/20/11 | | | (4,556 | ) | |
CitiGlobal
Market, Inc. | | Peru
(Republic of) | | Sell | | | 100 | | | | 2.90 | | | 10/20/13 | | | (1,839 | ) | |
J.P. Morgan
Chase, N.A. | | Brazil
(Republic of) | | Sell | | | 200 | | | | 5.25 | | | 11/20/09 | | | 3,742 | | |
J.P. Morgan
Chase, N.A. | | Greece | | Buy | | | 4,000 | | | | 0.13 | | | 9/20/17 | | | 368,692 | | |
JP Morgan
Chase, N.A. | | Iceland
(Republic of) | | Sell | | | 100 | | | | 1.70 | | | 3/20/18 | | | (31,982 | ) | |
JP Morgan
Chase, N.A | | Iceland
(Republic of) | | Sell | | | 300 | | | | 1.75 | | | 3/20/18 | | | (95,124 | ) | |
JP Morgan
Chase, N.A | | Iceland
(Republic of) | | Sell | | | 100 | | | | 1.90 | | | 3/20/18 | | | (30,885 | ) | |
JP Morgan
Chase, N.A | | Iceland
(Republic of) | | Sell | | | 100 | | | | 2.10 | | | 3/20/23 | | | (29,815 | ) | |
JP Morgan
Chase, N.A | | Iceland
(Republic of) | | Sell | | | 100 | | | | 2.45 | | | 3/20/23 | | | (27,424 | ) | |
| | | $ | 211,233 | | |
25
International Income Portfolio as of October 31, 2008
NOTES TO FINANCIAL STATEMENTS CONT'D
Total Return Swaps
| Counterparty | | Notional
Amount | | Expiration
Date | | Portfolio
Pays | | Portfolio
Receives | | Net
Unrealized
Depreciation | |
J.P. Morgan
Chase Bank | |
$96,268 | |
7/23/09 | | 1-month USD-
LIBOR-BBA+50bp | | Total Return
on J.P. Morgan
Abu Dhabi Index | | $ | (11,179 | ) | |
| | | $ | (11,179 | ) | |
Written call option activity for the year ended October 31, 2008 was as follows:
| | | Principals
Amount of
Contracts
(000's omitted) | | Premiums
Received | |
| Outstanding, beginning of year | | | — | | | $ | — | | |
| Options written | | JPY | 1,099,073 | | | | 117,803 | | |
| Outstanding, end of year | | JPY | 1,099,073 | | | $ | 117,803 | | |
At October 31, 2008, the Portfolio had sufficient cash and/or securities to cover commitments under these contracts.
6 Line of Credit
The Portfolio participates with other portfolios and funds managed by EVM and its affiliates in a $450 million unsecured line of credit agreement with a group of banks. Borrowings are made by the Portfolio solely to facilitate the handling of unusual and/or unanticipated short-term cash requirements. Interest is charged to the Portfolio based on its borrowings at an amount above either the Eurodollar rate or Federal Funds rate. In addition, a fee computed at an annual rate of 0.10% on the daily unused portion of the line of credit is allocated among the participating portfolios and funds at the end of each quarter. The Portfolio did not have any significant borrowings or allocated fees during the year ended October 31, 2008.
7 Risks Associated with Foreign Investments
Investing in securities issued by entities whose principal business activities are outside the United States may involve significant risks not present in domestic investments. For example, there is generally less publicly available information about foreign companies, particularly those not subject to the disclosure and reporting requirements of the U.S. securities laws. Certain foreign issuers are generally not bound by uniform accounting, auditing, and financial reporting requirements and standards of practice comparable to those applicable to domestic issuers. Investments in foreign securities also involve the risk of possible adverse changes in investment or exchange control regulations, expropriation or confiscatory taxation, limitation on the removal of funds or other assets of the Portfolio, political or financial instability or diplomatic and other d evelopments which could affect such investments. Foreign stock markets, while growing in volume and sophistication, are generally not as developed as those in the United States, and securities of some foreign issuers (particularly those located in developing countries) may be less liquid and more volatile than securities of comparable U.S. companies. In general, there is less overall governmental supervision and regulation of foreign securities markets, broker-dealers and issuers than in the United States.
8 Recently Issued Accounting Pronouncements
In September 2006, the Financial Accounting Standards Board (FASB) issued Statement of Financial Accounting Standards No. 157 (FAS 157), "Fair Value Measurements". FAS 157 defines fair value, establishes a framework for measuring fair value in accordance with accounting principles generally accepted in the United States of America and expands disclosure about fair value measurements. FAS 157 is effective for fiscal years beginning after November 15, 2007. As of October 31, 2008, management does not believe the adoption of FAS 157 will impact the amounts reported in the financial statements; however, additional disclosures may be required about the inputs used to develop the measurements of fair value and the effect of certain of the measurements on changes in net assets for the period.
In March 2008, the FASB issued Statement of Financial Accounting Standards No. 161 (FAS 161), "Disclosures about Derivative Instruments and Hedging Activities". FAS 161 requires enhanced disclosures about an entity's derivative and hedging activities, including qualitative disclosures about the objectives and strategies for using derivatives, quantitative disclosures about fair value amounts of and gains and losses on derivative instruments, and disclosures about credit-risk related contingent features in derivative instruments. FAS 161 is effective for fiscal years and interim periods beginning after November 15, 2008. Management is currently evaluating the impact the adoption of FAS 161 will have on the Portfolio's financial statement disclosures.
26
International Income Portfolio as of October 31, 2008
REPORT OF INDEPENDENT REGISTERED PUBLIC ACCOUNTING FIRM
To the Trustees and Investors of International Income Portfolio:
We have audited the accompanying statement of assets and liabilities of International Income Portfolio (the "Portfolio"), including the portfolio of investments, as of October 31, 2008, the related statement of operations for the year then ended, and the statements of changes in net assets and the supplementary data for the year then ended and for the period from the start of business, June 27, 2007, to October 31, 2007. These financial statements and supplementary data are the responsibility of the Portfolio's management. Our responsibility is to express an opinion on these financial statements and supplementary data based on our audits.
We conducted our audits in accordance with the standards of the Public Company Accounting Oversight Board (United States). Those standards require that we plan and perform the audit to obtain reasonable assurance about whether the financial statements and supplementary data are free of material misstatement. The Portfolio is not required to have, nor were we engaged to perform, an audit of its internal control over financial reporting. Our audits included consideration of internal control over financial reporting as a basis for designing audit procedures that are appropriate in the circumstances, but not for the purpose of expressing an opinion on the effectiveness of the Portfolio's internal control over financial reporting. Accordingly, we express no such opinion. An audit also includes examining, on a test basis, evidence supporting the amounts and disclosures in the financial statements, assessing the accounting principles u sed and significant estimates made by management, as well as evaluating the overall financial statement presentation. Our procedures included confirmation of securities owned as of October 31, 2008, by correspondence with the custodian and brokers; where replies were not received from brokers, we performed other auditing procedures. We believe that our audits provide a reasonable basis for our opinion.
In our opinion, the financial statements and supplementary data referred to above present fairly, in all material respects, the financial position of International Income Portfolio as of October 31, 2008, the results of its operations for the year then ended, and the changes in its net assets and the supplementary data for the year then ended and the period from the start of business, June 27, 2007, to October 31, 2007, in conformity with accounting principles generally accepted in the United States of America.
DELOITTE & TOUCHE LLP
Boston, Massachusetts
December 18, 2008
27
Eaton Vance International Income Fund
International Income Portfolio
SPECIAL MEETING OF SHAREHOLDERS (Unaudited)
Eaton Vance International Income Fund
The Fund held a Special Meeting of Shareholders on November 14, 2008 to elect Trustees. The results of the vote were as follows:
| | | Number of Shares | |
| Nominee for Trustee | | For | | Withheld | |
| Benjamin C. Esty | | | 421,197 | | | | 183 | | |
| Thomas E. Faust Jr. | | | 421,197 | | | | 183 | | |
| Allen R. Freedman | | | 421,197 | | | | 183 | | |
| William H. Park | | | 421,197 | | | | 183 | | |
| Ronald A. Pearlman | | | 421,197 | | | | 183 | | |
| Helen Frame Peters | | | 421,197 | | | | 183 | | |
| Heidi L. Steiger | | | 421,197 | | | | 183 | | |
| Lynn A. Stout | | | 421,197 | | | | 183 | | |
| Ralph F. Verni | | | 421,197 | | | | 183 | | |
Each nominee was also elected a Trustee of the International Income Portfolio.
International Income Portfolio
The Portfolio held a Special Meeting of Interestholders on November 14, 2008 to elect Trustees. The results of the vote were as follows:
| | | Interest in the Portfolio | |
| Nominee for Trustee | | For | | Withheld | |
| Benjamin C. Esty | | | 88 | % | | | 1 | % | |
| Thomas E. Faust Jr. | | | 88 | % | | | 1 | % | |
| Allen R. Freedman | | | 88 | % | | | 1 | % | |
| William H. Park | | | 88 | % | | | 1 | % | |
| Ronald A. Pearlman | | | 88 | % | | | 1 | % | |
| Helen Frame Peters | | | 88 | % | | | 1 | % | |
| Heidi L. Steiger | | | 88 | % | | | 1 | % | |
| Lynn A. Stout | | | 88 | % | | | 1 | % | |
| Ralph F. Verni | | | 88 | % | | | 1 | % | |
Results are rounded to the nearest whole number.
28
Eaton Vance International Income Fund
BOARD OF TRUSTEES' ANNUAL APPROVAL OF THE INVESTMENT ADVISORY AGREEMENT
Overview of the Contract Review Process
The Investment Company Act of 1940, as amended (the "1940 Act"), provides, in substance, that each investment advisory agreement between a fund and its investment adviser will continue in effect from year to year only if its continuance is approved at least annually by the fund's board of trustees, including by a vote of a majority of the trustees who are not "interested persons" of the fund ("Independent Trustees"), cast in person at a meeting called for the purpose of considering such approval.
At a meeting of the Boards of Trustees (each a "Board") of the Eaton Vance group of mutual funds (the "Eaton Vance Funds") held on April 21, 2008, the Board, including a majority of the Independent Trustees, voted to approve continuation of existing advisory and sub-advisory agreements for the Eaton Vance Funds for an additional one-year period. In voting its approval, the Board relied upon the affirmative recommendation of the Contract Review Committee of the Board (formerly the Special Committee), which is a committee comprised exclusively of Independent Trustees. Prior to making its recommendation, the Contract Review Committee reviewed information furnished for a series of meetings of the Contract Review Committee held in February, March and April 2008. Such information included, among other things, the following:
Information about Fees, Performance and Expenses
• An independent report comparing the advisory and related fees paid by each fund with fees paid by comparable funds;
• An independent report comparing each fund's total expense ratio and its components to comparable funds;
• An independent report comparing the investment performance of each fund to the investment performance of comparable funds over various time periods;
• Data regarding investment performance in comparison to relevant peer groups of funds and appropriate indices;
• Comparative information concerning fees charged by each adviser for managing other mutual funds and institutional accounts using investment strategies and techniques similar to those used in managing the fund;
• Profitability analyses for each adviser with respect to each fund;
Information about Portfolio Management
• Descriptions of the investment management services provided to each fund, including the investment strategies and processes employed, and any changes in portfolio management processes and personnel;
• Information concerning the allocation of brokerage and the benefits received by each adviser as a result of brokerage allocation, including information concerning the acquisition of research through "soft dollar" benefits received in connection with the funds' brokerage, and the implementation of a soft dollar reimbursement program established with respect to the funds;
• Data relating to portfolio turnover rates of each fund;
• The procedures and processes used to determine the fair value of fund assets and actions taken to monitor and test the effectiveness of such procedures and processes;
Information about each Adviser
• Reports detailing the financial results and condition of each adviser;
• Descriptions of the qualifications, education and experience of the individual investment professionals whose responsibilities include portfolio management and investment research for the funds, and information relating to their compensation and responsibilities with respect to managing other mutual funds and investment accounts;
• Copies of the Codes of Ethics of each adviser and its affiliates, together with information relating to compliance with and the administration of such codes;
• Copies of or descriptions of each adviser's proxy voting policies and procedures;
• Information concerning the resources devoted to compliance efforts undertaken by each adviser and its affiliates on behalf of the funds (including descriptions of various compliance programs) and their record of compliance with investment policies and restrictions, including policies with respect to market-timing, late trading and selective portfolio disclosure, and with policies on personal securities transactions;
• Descriptions of the business continuity and disaster recovery plans of each adviser and its affiliates;
Other Relevant Information
• Information concerning the nature, cost and character of the administrative and other non-investment management services provided by Eaton Vance Management and its affiliates;
• Information concerning management of the relationship with the custodian, subcustodians and fund accountants by each adviser or the funds' administrator; and
• The terms of each advisory agreement.
29
Eaton Vance International Income Fund
BOARD OF TRUSTEES' ANNUAL APPROVAL OF THE INVESTMENT ADVISORY AGREEMENT CONT'D
In addition to the information identified above, the Contract Review Committee considered information provided from time to time by each adviser throughout the year at meetings of the Board and its committees. Over the course of the twelve-month period ended April 30, 2008, the Board met eleven times and the Contract Review Committee, the Audit Committee and the Governance Committee, each of which is a Committee comprised solely of Independent Trustees, met twelve, seven and five times, respectively. At such meetings, the Trustees received, among other things, presentations by the portfolio managers and other investment professionals of each adviser relating to the investment performance of each fund and the investment strategies used in pursuing the fund's investment objective. The Portfolio Management Committee and the Compliance Reports and Regulatory Matters Committee are newly established and did not meet during the twelve- month period ended April 30, 2008.
For funds that invest through one or more underlying portfolios, the Board considered similar information about the portfolio(s) when considering the approval of advisory agreements. In addition, in cases where the fund's investment adviser has engaged a sub-adviser, the Board considered similar information about the sub-adviser when considering the approval of any sub-advisory agreement.
The Contract Review Committee was assisted throughout the contract review process by Goodwin Procter LLP, legal counsel for the Independent Trustees. The members of the Contract Review Committee relied upon the advice of such counsel and their own business judgment in determining the material factors to be considered in evaluating each advisory and sub-advisory agreement and the weight to be given to each such factor. The conclusions reached with respect to each advisory and sub-advisory agreement were based on a comprehensive evaluation of all the information provided and not any single factor. Moreover, each member of the Contract Review Committee may have placed varying emphasis on particular factors in reaching conclusions with respect to each advisory and sub-advisory agreement.
Results of the Process
Based on its consideration of the foregoing, and such other information as it deemed relevant, including the factors and conclusions described below, the Contract Review Committee concluded that the continuance of the investment advisory agreement of the Eaton Vance International Income Fund (the "Fund") with Eaton Vance Management ("EVM"), as well as the terms of the investment advisory agreement of the International Income Portfolio (the "Portfolio"), the portfolio in which the Fund will invest substantially all of its assets, with Boston Management and Research ("BMR"), an affiliate of EVM (EVM, with respect to the Fund, and BMR, with respect to the Portfolio, are each referred to herein as the "Adviser"), including the fee structure of each agreement, is in the interests of shareholders and, therefore, the Contract Review Committee recommended to the Board approval of the agreements. The Board accepted the recommendation of the Contract Review Committee as well as the factors considered and conclusions reached by the Contract Review Committee with respect to the agreements. Accordingly, the Board, including a majority of the Independent Trustees, voted to approve the investment advisory agreements for the Fund and the Portfolio.
Nature, Extent and Quality of Services
In considering whether to approve the investment advisory agreements of the Fund and the Portfolio, the Board evaluated the nature, extent and quality of services to be provided to the Fund by EVM and the Portfolio by BMR.
The Board considered EVM's and BMR's management capabilities and investment process with respect to the types of investments to be held by the Fund and the Portfolio, including the education, experience and number of its investment professionals and other personnel who provide portfolio management, investment research, and similar services to the Portfolio and the Fund. The Board specifically noted EVM's and BMR's expertise with respect to global markets and in-house research capabilities. The Board also took into account the resources dedicated to portfolio management and other services, including the compensation paid to recruit and retain investment personnel, and the time and attention devoted to the Fund and Portfolio in the complex by senior management.
The Board noted that under the terms of the investment advisory agreement of the Fund, EVM may invest assets of the Fund directly in securities, for which it may receive a fee, or in the Portfolio, for which it receives no separate fee but for which BMR receives an advisory fee from the Portfolio. The Trustees considered the potential benefits to the Fund of the ability to make direct investments, such as an improved ability to: manage the Fund's duration, or other general market exposures, using certain derivatives; add exposure to specific market sectors or asset classes without changing the Portfolio's investments, which would affect any other fund investing in the Portfolio; hedge some of the general market risks of the Portfolio while retaining the value added by the individual manager; and hedge a portion of the exposures of the Portfolio while retaining others (e.g., hedging the U.S. government exposure of the Portfolio while retaining its exposure to high-grade corporate bonds).
The Board also reviewed the compliance programs of the Adviser and relevant affiliates thereof. Among other matters, the Board considered compliance and reporting matters relating to personal trading by investment personnel, selective disclosure of portfolio holdings, late trading, frequent trading, portfolio valuation, business continuity and the allocation of investment opportunities. The
30
Eaton Vance International Income Fund
BOARD OF TRUSTEES' ANNUAL APPROVAL OF THE INVESTMENT ADVISORY AGREEMENT CONT'D
Board also evaluated the responses of the Adviser and its affiliates to requests from regulatory authorities such as the Securities and Exchange Commission.
The Board considered shareholder and other administrative services provided or managed by EVM and its affiliates, including transfer agency and accounting services. The Board evaluated the benefits to shareholders of investing in a fund that is a part of a large family of funds, including the ability, in many cases, to exchange an investment among different funds without incurring additional sales charges.
After consideration of the foregoing factors, among others, the Board concluded that the nature, extent and quality of services provided by the Adviser, taken as a whole, are appropriate and consistent with the terms of the investment advisory agreements.
Fund Performance
The Board compared the Fund's investment performance to a relevant universe of similarly managed funds identified by an independent data provider and appropriate benchmark indices. The Board reviewed comparative performance data for the period from inception (June 27, 2007) through September 30, 2007 for the Fund. In light of the Fund's relatively brief operating history, the Board concluded that additional time was required to evaluate Fund performance.
Management Fees and Expenses
The Board reviewed contractual investment advisory fee rates to be paid by the Fund directly or indirectly through its pro rata share of the expenses of the Portfolio (referred to as "management fees"). As part of its review, the Board considered the Fund's management fees and estimated expense ratio for the period from inception through September 30, 2007, as compared to a group of similarly managed funds selected by an independent data provider. The Board considered the fact that the Adviser had waived fees and/or paid expenses for the Fund.
After reviewing the foregoing information, and in light of the nature, extent and quality of the services provided by the Adviser, the Board concluded that the management fees proposed to be charged for advisory and related services and the Fund's total expense ratio are reasonable.
Profitability
The Board reviewed the level of profits realized by the Adviser and relevant affiliates thereof in providing investment advisory and administrative services to the Portfolio, the Fund and all Eaton Vance Funds as a group. The Board considered the level of profits realized without regard to revenue sharing or other payments by the Adviser and its affiliates to third parties in respect of distribution services. The Board also considered other direct or indirect benefits received by the Adviser and its affiliates in connection with its relationship with the Portfolio and the Fund.
The Board concluded that, in light of the foregoing factors and the nature, extent and quality of the services rendered, the profits realized by the Adviser and its affiliates are reasonable.
Economies of Scale
In reviewing management fees and profitability, the Board also considered the extent to which the Adviser and its affiliates, on the one hand, and the Fund and the Portfolio, on the other hand, can expect to realize benefits from economies of scale as the assets of the Fund and the Portfolios increase. The Board noted the structure of the advisory fee, which includes breakpoints at several asset levels both at the Fund and at the Portfolio level. Based upon the foregoing, the Board concluded that the Adviser and its affiliates and the Fund and the Portfolio can be expected to share such benefits equitably.
31
Eaton Vance International Income Fund
MANAGEMENT AND ORGANIZATION
Fund Management. The Trustees of Eaton Vance Mutual Funds Trust (the Trust) and International Income Portfolio (the Portfolio) are responsible for the overall management and supervision of the Trust's and Portfolio's affairs. The Trustees and officers of the Trust and the Portfolio are listed below. Except as indicated, each individual has held the office shown or other offices in the same company for the last five years. Trustees and officers of the Trust and the Portfolio hold indefinite terms of office. The "noninterested Trustees" consist of those Trustees who are not "interested persons" of the Trust and the Portfolio, as that term is defined under the 1940 Act. The business address of each Trustee and officer is The Eaton Vance Building, 255 State Street, Boston, Massachusetts 02109. As used below, "EVC" refers to Eaton Vance Corp., "EV" refers to Eato n Vance, Inc., "EVM" refers to Eaton Vance Management, "BMR" refers to Boston Management and Research, "Parametric" refers to Parametric Portfolio Associates and "EVD" refers to Eaton Vance Distributors, Inc. EVC and EV are the corporate parent and trustee, respectively, of EVM and BMR. EVD is the Fund's principal underwriter, the Portfolio's placement agent and a wholly-owned subsidiary of EVC. Each officer affiliated with Eaton Vance may hold a position with other Eaton Vance affiliates that is comparable to his or her position with EVM listed below.
Name and
Date of Birth | | Position(s)
with the
Trust and
the Portfolio | | Term of
Office and
Length of
Service | | Principal Occupation(s)
During Past Five Years | | Number of Portfolios
in Fund Complex
Overseen By
Trustee(1) | | Other Directorships Held | |
| Interested Trustee | | | | | | | | | | | | | |
|
| Thomas E. Faust Jr. 5/31/58 | | Trustee and President of the Trust | | Trustee since 2007 and President of the Trust since 2002 | | Chairman, Chief Executive Officer and President of EVC, Director and President of EV, Chief Executive Officer and President of EVM and BMR, and Director of EVD. Trustee and/or Officer of 173 registered investment companies and 4 private companies managed by EVM or BMR. Mr. Faust is an interested person because of his positions with EVM, BMR, EVD, EVC and EV, which are affiliates of the Trust and Portfolio. | | | 173 | | | Director of EVC | |
|
| Noninterested Trustees | | | | | | | | | | | | | |
|
| Benjamin C. Esty 1/2/63 | | Trustee | | Of the Trust since 2005 and of the Portfolio since 2007 | | Roy and Elizabeth Simmons Professor of Business Administration, Harvard University Graduate School of Business Administration. | | | 173 | | | None | |
|
| Allen R. Freedman 4/3/40 | | Trustee | | Since 2007 | | Former Chairman (2002-2004) and a Director (1983-2004) of Systems & Computer Technology Corp. (provider of software to higher education). Formerly, a Director of Loring Ward International (fund distributor) (2005-2007). Formerly, Chairman and a Director of Indus International Inc. (provider of enterprise management software to the power generating industry) (2005-2007). | | | 173 | | | Director of Assurant, Inc. and Stonemor Partners L.P. (owner and operator of cemeteries) | |
|
| William H. Park 9/19/47 | | Trustee | | Of the Trust since 2003 and of the Portfolio since 2007 | | Vice Chairman, Commercial Industrial Finance Corp. (specialty finance company) (since 2006). Formerly, President and Chief Executive Officer, Prizm Capital Management, LLC (investment management firm) (2002-2005). | | | 173 | | | None | |
|
| Ronald A. Pearlman 7/10/40 | | Trustee | | Of the Trust since 2003 and of the Portfolio since 2007 | | Professor of Law, Georgetown University Law Center. | | | 173 | | | None | |
|
| Helen Frame Peters 3/22/48 | | Trustee | | Since 2008 | | Professor of Finance, Carroll School of Management, Boston College (since 2003). Adjunct Professor of Finance, Peking University, Beijing, China (since 2005). Formerly, Dean, Carroll School of Management, Boston College (2000-2003). | | | 173 | | | Director of Federal Home Loan Bank of Boston (a bank for banks) and BJ's Wholesale Clubs (wholesale club retailer); Trustee of SPDR Index Shares Funds and SPDR Series Trust (exchange traded funds) | |
|
32
Eaton Vance International Income Fund
MANAGEMENT AND ORGANIZATION CONT'D
Name and
Date of Birth | | Position(s)
with the
Trust and
the Portfolio | | Term of
Office and
Length of
Service | | Principal Occupation(s)
During Past Five Years | | Number of Portfolios
in Fund Complex
Overseen By
Trustee(1) | | Other Directorships Held | |
| Noninterested Trustees (continued) | | | | | | | | | | | | | |
|
| Heidi L. Steiger 7/8/53 | | Trustee | | Since 2007 | | Managing Partner, Topridge Associates LLC (global wealth management firm) (since 2008); Senior Advisor (since 2008), President (2005-2008), Lowenhaupt Global Advisors, LLC (global wealth management firm). Formerly, President and Contributing Editor, Worth Magazine (2004-2005). Formerly, Executive Vice President and Global Head of Private Asset Management (and various other positions), Neuberger Berman (investment firm) (1986-2004). | | | 173 | | | Director of Nuclear Electric Insurance Ltd. (nuclear insurance provider) and Aviva USA (insurance provider) | |
|
| Lynn A. Stout 9/14/57 | | Trustee | | Of the Trust since 1998 and of the Portfolio since 2007 | | Paul Hastings Professor of Corporate and Securities Law (since 2006) and Professor of Law (2001-2006), University of California at Los Angeles School of Law. | | | 173 | | | None | |
|
| Ralph F. Verni 1/26/43 | | Chairman of the Board and Trustee | | Chairman of the Board and Trustee of the Portfolio since 2007 and Trustee of the Trust since 2005 | | Consultant and private investor. | | | 173 | | | None | |
|
| Principal Officers who are not Trustees | | | | | | | |
|
Name and
Date of Birth | | Position(s)
with the
Trust and
the Portfolio | | Term of
Office and
Length of
Service | | Principal Occupation(s)
During Past Five Years | |
| William H. Ahern, Jr. 7/28/59 | | Vice President of the Trust | | Since 1995 | | Vice President of EVM and BMR. Officer of 75 registered investment companies managed by EVM or BMR. | |
|
| John R. Baur 2/10/70 | | Vice President | | Since 2007 | | Vice President of EVM and BMR. Previously, attended Johnson Graduate School of Management, Cornell University (2002-2005), and prior thereto he was an Account Team Representative in Singapore for Applied Materials Inc. Officer of 33 registered investment companies managed by EVM or BMR. | |
|
| Michael A. Cirami 12/24/75 | | Vice President | | Since 2007 | | Vice President of EVM and BMR. Previously, attended the University of Rochester William E. Simon Graduate School of Business Administration (2001-2003), and prior thereto he was a Team Leader for the Institutional Services Group for State Street Bank in Luxembourg. Officer of 33 registered investment companies managed by EVM or BMR. | |
|
| Cynthia J. Clemson 3/2/63 | | Vice President of the Trust | | Since 2005 | | Vice President of EVM and BMR. Officer of 90 registered investment companies managed by EVM or BMR. | |
|
| Charles B. Gaffney 12/4/72 | | Vice President of the Trust | | Since 2007 | | Vice President of EVM and BMR. Previously, Sector Portfolio Manager and Senior Equity Analyst of Brown Brothers Harriman (1997-2003). Officer of 30 registered investment companies managed by EVM or BMR. | |
|
| Christine M. Johnston 11/9/72 | | Vice President | | Since 2007 | | Vice President of EVM and BMR. Officer of 35 registered investment companies managed by EVM or BMR. | |
|
| Aamer Khan 6/7/60 | | Vice President of the Trust | | Since 2005 | | Vice President of EVM and BMR. Officer of 33 registered investment companies managed by EVM or BMR. | |
|
| Thomas H. Luster 4/8/62 | | Vice President of the Trust | | Since 2006 | | Vice President of EVM and BMR. Officer of 51 registered investment companies managed by EVM or BMR. | |
|
| Robert B. MacIntosh 1/22/57 | | Vice President of the Trust | | Since 1998 | | Vice President of EVM and BMR. Officer of 90 registered investment companies managed by EVM or BMR. | |
|
33
Eaton Vance International Income Fund
MANAGEMENT AND ORGANIZATION CONT'D
Name and
Date of Birth | | Position(s)
with the
Trust and
the Portfolio | | Term of
Office and
Length of
Service | | Principal Occupation(s)
During Past Five Years | |
| Principal Officers who are not Trustees (continued) | | | | | | | |
|
| Duncan W. Richardson 10/26/57 | | Vice President of the Trust | | Since 2001 | | Executive Vice President and Chief Equity Investment Officer of EVC, EVM and BMR. Officer of 81 registered investment companies managed by EVM or BMR. | |
|
| Judith A. Saryan 8/21/54 | | Vice President of the Trust | | Since 2003 | | Vice President of EVM and BMR. Officer of 55 registered investment companies managed by EVM or BMR. | |
|
| Susan Schiff 3/13/61 | | Vice President | | Of the Trust since 2002 and of the Portfolio since 2007 | | Vice President of EVM and BMR. Officer of 36 registered investment companies managed by EVM or BMR. | |
|
| Thomas Seto 9/27/62 | | Vice President of the Trust | | Since 2007 | | Vice President and Director of Portfolio Management of Parametric. Officer of 31 registered investment companies managed by EVM or BMR. | |
|
| David M. Stein 5/4/51 | | Vice President of the Trust | | Since 2007 | | Managing Director and Chief Investment Officer of Parametric. Officer of 31 registered investment companies managed by EVM or BMR. | |
|
| Mark S. Venezia 5/23/49 | | Vice President of the Trust and President of the Portfolio | | Since 2007 | | Vice President of EVM and BMR. Officer of 36 registered investment companies managed by EVM or BMR. | |
|
| Adam A. Weigold 3/22/75 | | Vice President of the Trust | | Since 2007 | | Vice President of EVM and BMR. Officer of 71 registered investment companies managed by EVM or BMR. | |
|
| Barbara E. Campbell 6/19/57 | | Treasurer | | Of the Trust since 2005 and of the Portfolio since 2008(2) | | Vice President of EVM and BMR. Officer of 173 registered investment companies managed by EVM or BMR. | |
|
| Maureen A. Gemma 5/24/60 | | Secretary and Chief Legal Officer | | Secretary since 2007 and Chief Legal Officer since 2008 | | Vice President of EVM and BMR. Officer of 173 registered investment companies managed by EVM or BMR. | |
|
| Paul M. O'Neil 7/11/53 | | Chief Compliance Officer | | Of the Trust since 2004 and of the Portfolio since 2007 | | Vice President of EVM and BMR. Officer of 173 registered investment companies managed by EVM or BMR. | |
|
(1) Includes both master and feeder funds in a master-feeder structure.
(2) Prior to 2008, Ms. Campbell served as Assistant Treasurer of the Portfolio since 2007.
The SAI for the Fund includes additional information about the Trustees and officers of the Fund and the Portfolio and can be obtained without charge on Eaton Vance's website at www.eatonvance.com or by calling 1-800-262-1122.
34
This Page Intentionally Left Blank
This Page Intentionally Left Blank
Investment Adviser of International Income Portfolio
Boston Management and Research
The Eaton Vance Building
255 State Street
Boston, MA 02109
Administrator of Eaton Vance International Income Fund
Eaton Vance Management
The Eaton Vance Building
255 State Street
Boston, MA 02109
Principal Underwriter
Eaton Vance Distributors, Inc.
The Eaton Vance Building
255 State Street
Boston, MA 02109
(617) 482-8260
Custodian
State Street Bank and Trust Company
200 Clarendon Street
Boston, MA 02116
Transfer Agent
PNC Global Investment Servicing
Attn: Eaton Vance Funds
P.O. Box 9653
Providence, RI 02940-9653
(800) 262-1122
Independent Registered Public Accounting Firm
Deloitte & Touche LLP
200 Berkeley Street
Boston, MA 02116-5022
Eaton Vance International Income Fund
The Eaton Vance Building
255 State Street
Boston, MA 02109
This report must be preceded or accompanied by a current prospectus. Before investing, investors should consider carefully the Fund's investment objective(s), risks, and charges and expenses. The Fund's current prospectus contains this and other information about the Fund and is available through your financial advisor. Please read the prospectus carefully before you invest or send money. For further information please call 1-800-262-1122.
3042-12/08 INTLISRC

Annual Report October 31, 2008
EATON VANCE
LOW
DURATION
FUND


IMPORTANT NOTICES REGARDING PRIVACY,
DELIVERY OF SHAREHOLDER DOCUMENTS,
PORTFOLIO HOLDINGS AND PROXY VOTING
Privacy. The Eaton Vance organization is committed to ensuring your financial privacy. Each of the financial institutions identified below has in effect the following policy ("Privacy Policy") with respect to nonpublic personal information about its customers:
• Only such information received from you, through application forms or otherwise, and information about your Eaton Vance fund transactions will be collected. This may include information such as name, address, social security number, tax status, account balances and transactions.
• None of such information about you (or former customers) will be disclosed to anyone, except as permitted by law (which includes disclosure to employees necessary to service your account). In the normal course of servicing a customer's account, Eaton Vance may share information with unaffiliated third parties that perform various required services such as transfer agents, custodians and broker/dealers.
• Policies and procedures (including physical, electronic and procedural safeguards) are in place that are designed to protect the confidentiality of such information.
• We reserve the right to change our Privacy Policy at any time upon proper notification to you. Customers may want to review our Policy periodically for changes by accessing the link on our homepage: www.eatonvance.com.
Our pledge of privacy applies to the following entities within the Eaton Vance organization: the Eaton Vance Family of Funds, Eaton Vance Management, Eaton Vance Investment Counsel, Boston Management and Research, and Eaton Vance Distributors, Inc.
In addition, our Privacy Policy only applies to those Eaton Vance customers who are individuals and who have a direct relationship with us. If a customer's account (i.e., fund shares) is held in the name of a third-party financial adviser/broker-dealer, it is likely that only such adviser's privacy policies apply to the customer. This notice supersedes all previously issued privacy disclosures.
For more information about Eaton Vance's Privacy Policy, please call 1-800-262-1122.
Delivery of Shareholder Documents. The Securities and Exchange Commission ("the SEC") permits funds to deliver only one copy of shareholder documents, including prospectuses, proxy statements and shareholder reports, to fund investors with multiple accounts at the same residential or post office box address. This practice is often called "householding" and it helps eliminate duplicate mailings to shareholders.
Eaton Vance, or your financial adviser, may household the mailing of your documents indefinitely unless you instruct Eaton Vance, or your financial adviser, otherwise.
If you would prefer that your Eaton Vance documents not be householded, please contact Eaton Vance at 1-800-262-1122, or contact your financial adviser.
Your instructions that householding not apply to delivery of your Eaton Vance documents will be effective within 30 days of receipt by Eaton Vance or your financial adviser.
Portfolio Holdings. Each Eaton Vance Fund and its underlying Portfolio (if applicable) will file a schedule of its portfolio holdings on Form N-Q with the SEC for the first and third quarters of each fiscal year. The Form N-Q will be available on the Eaton Vance website www.eatonvance.com, by calling Eaton Vance at 1-800-262-1122 or in the EDGAR database on the SEC's website at www.sec.gov. Form N-Q may also be reviewed and copied at the SEC's public reference room in Washington, D.C. (call 1-800-732-0330 for information on the operation of the public reference room).
Proxy Voting. From time to time, funds are required to vote proxies related to the securities held by the funds. The Eaton Vance Funds or their underlying Portfolios (if applicable) vote proxies according to a set of policies and procedures approved by the Funds' and Portfolios' Boards. You may obtain a description of these policies and procedures and information on how the Funds or Portfolios voted proxies relating to portfolio securities during the most recent 12 month period ended June 30, without charge, upon request, by calling 1-800-262-1122. This description is also available on the SEC's website at www.sec.gov.
Eaton Vance Low Duration Fund as of October 31, 2008
MANAGEMENT’S DISCUSSION OF FUND PERFORMANCE

Susan Schiff, CFA
Portfolio Manager
Economic and Market Conditions
· The year ended October 31, 2008 featured unusually high volatility in all fixed-income markets. What began in 2007 as a reaction to inopportune subprime lending, grew during the course of 2008 into a major economic and market dislocation. Like all fixed-income markets, the mortgage-backed securities (MBS) market featured significant spread widening during the year. MBS spreads widened by around 200 basis points (2.00%), ending at approximately 300 basis points (3.00%) over Treasuries at October 31, 2008. That spread widening was true of generic and seasoned agency MBS alike. In a flight-to-quality, there was less buying activity within the MBS sector, as increasingly risk-averse investors favored cash and Treasury bonds. Widespread deleveraging and forced selling by hedge funds and other institutional investors exerted further pressure on the MBS market. Foreign investors, who had been prominent buyers of MBS in recent years, opted instead for Treasury bonds. To add much-needed liquidity, the Federal Reserve lowered its Federal Funds rate – a key short-term interest rate benchmark – to 1.00%, as of October 31, 2008.
· As the housing crisis deepened and foreclosures rose, Fannie Mae and Freddie Mac – government-sponsored enterprises and two of the nation’s largest guarantors of mortgage securities – suffered losses. In September 2008, the Treasury announced its intent to purchase MBS, while adding capital and a line of credit to Fannie Mae and Freddie Mac. In the wake of these actions, the MBS market stabilized.
· During the year ended October 31, 2008, all credit markets experienced unprecedented volatility, and the bank loan market market was no exception. The subprime crisis of 2007 expanded in 2008 to include nearly all credit instruments, which in turn, caused the world economy to slip into recession. The year was a rollercoaster for the credit markets. However, September 2008 brought a series of events that rattled the markets more deeply: the bailouts of Fannie Mae and Freddie Mac, the bankruptcy of Lehman Brothers Holdings, Inc., the rescue of American International Group, Inc. and a litany of unprecedented steps by the U.S. Treasury and the Federal Reserve to stabilize the credit markets. In the Fund’s(1) fiscal fourth quarter, the S&P/LSTA Leveraged Loan Index (the Index) declined -18.66%, by far its worst quarterly showing ever. The average loan price in Floating Rate Portfolio was 70.3% of par at October 31, 2008. Although statistics vary with respect to recovery rates of loans in default, the historical rate has been approximately 70% of par. As such, bank loan prices at year-end were approaching levels that implied near universal default. At year-end, 2.3% of the loans in Floating Rate Portfolio were in default versus 2.0% for the Index. However, the Fund’s allocation to this asset class was only 7%.
· While there is little doubt that a recession would-bring higher default rates, it is difficult to reconcile recent trading levels with market fundamentals. A range of credit statistics and criteria used to monitor creditworthiness suggested that overall credit quality appeared to be in line with historical patterns. Despite this, bank loans traded below historical recovery levels, thus implying a near 100% default rate. A possible explanation for the market’s depressed trading level was that there were more sellers of bank loans than buyers. Some selling was forced, especially by hedge funds and structured investment vehicles unable to meet margin requirements. Some selling was voluntary, as redemptions from mutual funds were significant throughout the year. In addition, many hard-pressed banks and investment banks that
Eaton Vance Low Duration Fund
Total Return Performance 10/31/07 – 10/31/08
Class A(2) | | 1.65 | % |
Class B(2) | | 0.85 | % |
Class C(2) | | 1.02 | % |
Merrill Lynch 1-3 Year Treasury Index(3) | | 6.85 | % |
Lipper Short U.S. Government Funds Average(3) | | 3.35 | % |
Please refer to page 3 for additional performance information.
(1) The Fund currently invests in Investment Portfolio, Floating Rate Portfolio and Government Obligations Portfolio (collectively, the Portfolios). References to investments are to the Portfolios’ holdings.
(2) These returns do not include the 2.25% maximum sales charge for the Fund’s Class A shares or the applicable contingent deferred sales charges (CDSC) for Class B shares and Class C shares. If sales charges were deducted, the returns would be lower. Absent a fee waiver and expense reimbursement by the investment adviser and the administrator, the returns would be lower.
(3) It is not possible to invest directly in an Index or Lipper Classification. The Index’s total return does not reflect expenses that would have been incurred if an investor individually purchased or sold the securities represented in the Index. The Lipper average is the average total return, at net asset value, of the funds that are in the same Lipper Classification as the Fund.
Past performance is no guarantee of future results. Returns are historical and are calculated by determining the percentage change in net asset value or offering price (as applicable) with all distributions reinvested. Investment return and principal value will fluctuate so that shares, when redeemed, may be worth more or less than their original cost. Performance is for the stated time period only; due to market volatility, the Fund’s current performance may be lower or higher than the quoted return. Absent an expense limitation or waiver in effect for certain periods, perforrmance would have been lower. For performance as of the most recent month end, please refer to www.eatonvance.com.
Fund shares are not insured by the FDIC and are not deposits or other obligations of, or guaranteed by, any depository institution. Shares are subject to investment risks, including possible loss of principal invested.
1
typically make markets in bank loans were hesitant to own loans, making trading more volatile. Later in the period, there were signs that many institutional investors were attracted to the asset class by record low loan prices. However, selling outweighed buying, pushing loan prices lower.
Management Discussion
· Low Duration Fund(1) seeks total return, an objective it pursues primarily through investments in securities issued by the U.S. government (or its agencies and instrumentalities) and at least 90% of the Fund’s net assets is invested in investment grade securities. The Fund pursues its objective by investing in one or more registered investment companies that are managed by Eaton Vance Management or its affiliates.
· During the year ended October 31, 2008, the Fund continued to focus on seasoned, fixed-rate agency MBS through its investment in Investment Portfolio and Government Obligations Portfolio. A significant portion of Investment Portfolio’s and Government Obligations Portfolio’s MBS are FHA- or VA-guaranteed, representing full government guarantees as to principal and interest payments. In addition, because these mortgages were typically originated in the 1980’s or 1990’s, homeowners have built considerable equity over time in their homes. As a result, these mortgages have a relatively low loan-to-value ratio and more predictable cash flows than generic MBS. In addition, the loans are guaranteed by government agencies.
· Investment Portfolio’s and Government Obligations Portfolio’s (the Portfolios) largest MBS weightings remained in 10-, 15- and 30-year seasoned, fixed-rate U.S. government agency MBS, with a smaller weighting in seasoned adjustable-rate U.S. government agency MBS (ARMs). Management continued to believe that agency securities represented an attractive asset class for the Portfolios, particularly the seasoned MBS on which the Portfolios focused.
· Low Duration’s duration was 1.91 years at October 31, 2008. Duration indicates price sensitivity to changes in interest rates of a fixed-income security or portfolio based on the timing of anticipated principal and interest payments. A shorter duration instrument normally has less exposure to interest rate risk than longer duration instruments.
· While the Fund retained only a 7% weighting in floating-rate loans at October 31, 2008, through its investment in Floating Rate Portfolio, that weighting hurt its performance and was the primary reason for the Fund’s underperformance of its benchmark. Floating Rate Portfolio’s investments included 446 borrowers at October 31, 2008, with an average loan size of 0.22% of total investments, and no industry constituting more than 9% of total investments. Publishing, health care, business equipment and services, cable and satellite television, and chemicals and plastics were the top industry weightings. Floating Rate Portfolio’s loans were primarily senior, secured loans to companies with average revenues exceeding $1 billion.
· Floating Rate Portfolio had a 14% exposure to European loans at October 31, 2008. While Floating Rate Portfolio’s involvement in the European leveraged loan market represented further opportunity for diversification, this market has been affected slightly more than the U.S. market by the recent credit market turmoil. The Portfolio’s relative underperformance of its benchmark during the year was due primarily to its exposure to the European leverage loan market. However, defaults and credit losses in the European market remained minimal.
Portfolio Composition
Diversification by Sectors(2)
By total investments
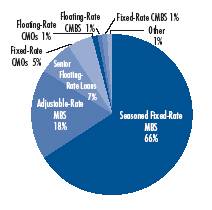
(1) The Fund currently invests in Investment Portfolio, Floating Rate Portfolio and Government Obligations Portfolio (collectively, the Portfolios). References to investments are to the Portfolios’ holdings.
(2) The Diversification by Sectors breakdown reflects the Fund’s investments in Investment Portfolio, Government Obligations Portfolio and Floating Rate Portfolio as of 10/31/08. Sectors are shown as a percentage of the Fund’s total investments in the Portfolios.
The views expressed throughout this report are those of the portfolio manager and are current only through the end of the period of the report as stated on the cover. These views are subject to change at any time based upon market or other conditions, and the investment adviser disclaims any responsibility to update such views. These views may not be relied on as investment advice and, because investment decisions for a fund are based on many factors, may not be relied on as an indication of trading intent on behalf of any Eaton Vance fund. Portfolio information may not be representative of the Portfolios’ current or future investments and may change due to active management.
2
Eaton Vance Low Duration Fund as of October 31, 2008
FUND PERFORMANCE
The line graph and table set forth below provide information about the Fund’s performance. The line graph compares the performance of Class A of the Fund with that of the Merrill Lynch 1-3 Year Treasury Index, an unmanaged market index of short-term U.S. Treasury securities and the Lipper Short U.S. Government Funds Classification. The lines on the graph represent the total returns of a hypothetical investment of $10,000 in each of Class A, the Merrill Lynch 1-3 Year Treasury Index and the Lipper Short U.S. Government Funds Classification. Class A total returns are presented at net asset value and maximum public offering price. The table includes the total returns of each Class of the Fund at net asset value and maximum public offering price. The performance presented below does not reflect the deduction of taxes, if any, that a shareholder would pay on Fund distributions or the redemption of Fund shares.
Performance(1)
| | Class A | | Class B | | Class C | |
Class Share Symbol | | EALDX | | EBLDX | | ECLDX | |
| | | | | | | |
Average Annual Total Returns (at net asset value) | | | | | | | |
One year | | 1.65 | % | 0.85 | % | 1.02 | % |
Five years | | 2.75 | | 1.99 | | 2.15 | |
Life of Fund† | | 2.32 | | 1.56 | | 1.72 | |
| | | | | | | |
SEC Average Annual Total Returns (including sales charge or applicable CDSC) | | | | | | | |
One year | | -0.67 | % | -2.06 | % | 0.05 | % |
Five years | | 2.29 | | 1.99 | | 2.15 | |
Life of Fund† | | 1.94 | | 1.56 | | 1.72 | |
†Inception Dates – Class A: 9/30/02; Class B: 9/30/02; Class C: 9/30/02
(1) Average Annual Total Returns do not include the 2.25% maximum sales charge for Class A shares or the applicable contingent deferred sales charge (CDSC) for Class B and Class C shares. If sales charges were deducted, the returns would be lower. Absent a fee waiver and expense reimbursement by the investment adviser and administrator, the returns would be lower. SEC Average Annual Total Returns for Class A reflect the maximum 2.25% sales charge. SEC returns for Class B reflect applicable CDSC based on the following schedule: 3% - 1st year; 2.5% - 2nd year; 2.0% - 3rd year; 1% - - 4th year. SEC returns for Class C reflect a 1% CDSC for the first year.
Total Annual Operating Expenses(2)
| | | | | | | |
| | Class A | | Class B | | Class C | |
| | | | | | | |
Gross Expense Ratio | | 1.41 | % | 2.16 | % | 2.01 | % |
Net Expense Ratio | | 1.00 | | 1.75 | | 1.60 | |
(2) From the Fund’s prospectus dated 3/1/08. The net expense ratio reflects a contractual expense reimbursement that continues through 4/30/10. Thereafter, the expense reimbursement may be changed or terminated at any time. Without this expense reimbursement, performance would have been lower.
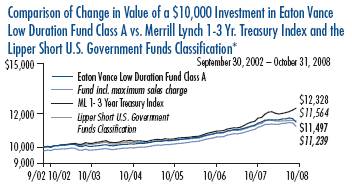
* Sources: Lipper Inc. Class A, Class B and Class C of the Fund commenced operations on 9/30/02.
A $10,000 hypothetical investment at net asset value in Class B shares and Class C shares on 9/30/02 would have been valued at $10,988 and $11,092, respectively, on 10/31/08. The Index’s total return does not reflect the expenses that would have been incurred if an investor individually purchased or sold the securities represented in the Index. The Lipper total return is the average total return, at NAV, of the funds that are in the same Lipper Classification as the Fund. It is not possible to invest directly in an Index or Classification.
Past performance is no guarantee of future results. Returns are historical and are calculated by determining the percentage change in net asset value or offering price (as applicable) with all distributions reinvested. Investment return and principal value will fluctuate so that shares, when redeemed, may be worth more or less than their original cost. Performance is for the stated time period only; due to market volatility, the Fund’s current performance may be lower or higher than the quoted return. Absent an expense limitation or waiver in effect for certain periods, performance would have been lower. For performance as of the most recent month end, please refer to www.eatonvance.com.
3
Eaton Vance Low Duration Fund as of October 31, 2008
FUND EXPENSES
Example: As a shareholder of the Fund, you incur two types of costs: (1) transaction costs, including sales charges (loads) on purchases and redemption fees (if applicable); and (2) ongoing costs, including management fees; distribution or service fees; and other Fund expenses. This Example is intended to help you understand your ongoing costs (in dollars) of investing in the Fund and to compare these costs with the ongoing costs of investing in other mutual funds. The Example is based on an investment of $1,000 invested at the beginning of the period and held for the entire period (May 1, 2008 – October 31, 2008).
Actual Expenses: The first section of the table below provides information about actual account values and actual expenses. You may use the information in this section, together with the amount you invested, to estimate the expenses that you paid over the period. Simply divide your account value by $1,000 (for example, an $8,600 account value divided by $1,000 = 8.6), then multiply the result by the number in the first section under the heading entitled "Expenses Paid During Period" to estimate the expenses you paid on your account during this period.
Hypothetical Example for Comparison Purposes: The second section of the table below provides information about hypothetical account values and hypothetical expenses based on the actual Fund expense ratio and an assumed rate of return of 5% per year (before expenses), which is not the actual return of the Fund. The hypothetical account values and expenses may not be used to estimate the actual ending account balance or expenses you paid for the period. You may use this information to compare the ongoing costs of investing in your Fund and other funds. To do so, compare this 5% hypothetical example with the 5% hypothetical examples that appear in the shareholder reports of the other funds.
Please note that the expenses shown in the table are meant to highlight your ongoing costs only and do not reflect any transactional costs, such as sales charges (loads) or redemption fees (if applicable). Therefore, the second section of the table is useful in comparing ongoing costs only, and will not help you determine the relative total costs of owning different funds. In addition, if these transactional costs were included, your costs would have been higher.
Eaton Vance Low Duration Fund
| | | Beginning Account Value
(5/1/08) | | Ending Account Value
(10/31/08) | | Expenses Paid During Period*
(5/1/08 – 10/31/08) | |
| Actual | |
| Class A | | $ | 1,000.00 | | | $ | 989.10 | | | $ | 5.00 | ** | |
| Class B | | $ | 1,000.00 | | | $ | 986.10 | | | $ | 8.74 | ** | |
| Class C | | $ | 1,000.00 | | | $ | 987.00 | | | $ | 7.99 | ** | |
| Hypothetical | |
| (5% return per year before expenses) | |
| Class A | | $ | 1,000.00 | | | $ | 1,020.10 | | | $ | 5.08 | ** | |
| Class B | | $ | 1,000.00 | | | $ | 1,016.30 | | | $ | 8.87 | ** | |
| Class C | | $ | 1,000.00 | | | $ | 1,017.10 | | | $ | 8.11 | ** | |
* Expenses are equal to the Fund's annualized expense ratio of 1.00% for Class A shares, 1.75% for Class B shares and 1.60% for Class C shares, multiplied by the average account value over the period, multiplied by 184/366 (to reflect the one-half year period). The Example assumes that the $1,000 was invested at the net asset value per share determined at the close of business on April 30, 2008. The Example reflects the expenses of both the Fund and the Portfolios.
** Absent a fee waiver and expense reimbursement by the investment adviser and administrator, the expenses would be higher.
4
Eaton Vance Low Duration Fund as of October 31, 2008
FINANCIAL STATEMENTS
Statement of Assets and Liabilities
As of October 31, 2008
| Assets | |
| Investment in Investment Portfolio, at value (identified cost, $91,891,376) | | $ | 90,852,199 | | |
| Investment in Floating Rate Portfolio, at value (identified cost, $11,086,919) | | | 8,653,718 | | |
Investment in Government Obligations Portfolio, at value
(identified cost, $14,315,768) | | | 14,202,795 | | |
| Receivable for Fund shares sold | | | 645,832 | | |
| Receivable from the investment adviser and the administrator | | | 15,552 | | |
| Total assets | | $ | 114,370,096 | | |
| Liabilities | |
| Payable for Fund shares redeemed | | $ | 1,073,000 | | |
| Dividends payable | | | 171,315 | | |
| Payable to affiliate for distribution and service fees | | | 44,773 | | |
| Payable to affiliate for Trustees' fees | | | 40 | | |
| Accrued expenses | | | 60,518 | | |
| Total liabilities | | $ | 1,349,646 | | |
| Net Assets | | $ | 113,020,450 | | |
| Sources of Net Assets | |
| Paid-in capital | | $ | 127,278,294 | | |
Accumulated net realized loss from Portfolios (computed on
the basis of identified cost) | | | (10,508,653 | ) | |
| Accumulated distributions in excess of net investment income | | | (163,840 | ) | |
Net unrealized depreciation from Portfolios (computed on the basis
of identified cost) | | | (3,585,351 | ) | |
| Total | | $ | 113,020,450 | | |
| Class A Shares | |
| Net Assets | | $ | 71,283,798 | | |
| Shares Outstanding | | | 8,175,849 | | |
Net Asset Value and Redemption Price Per Share
(net assets ÷ shares of beneficial interest outstanding) | | $ | 8.72 | | |
Maximum Offering Price Per Share
(100 ÷ 97.75 of $8.72) | | $ | 8.92 | | |
| Class B Shares | |
| Net Assets | | $ | 7,289,709 | | |
| Shares Outstanding | | | 835,485 | | |
Net Asset Value and Offering Price Per Share*
(net assets ÷ shares of beneficial interest outstanding) | | $ | 8.73 | | |
| Class C Shares | |
| Net Assets | | $ | 34,446,943 | | |
| Shares Outstanding | | | 3,948,040 | | |
Net Asset Value and Offering Price Per Share*
(net assets ÷ shares of beneficial interest outstanding) | | $ | 8.73 | | |
| On sales of $100,000 or more, the offering price of Class A shares is reduced. | |
* Redemption price per share is equal to the net asset value less any applicable contingent deferred sales charge.
Statement of Operations
For the Year Ended
October 31, 2008
| Investment Income | |
| Interest and dividends allocated from Portfolios | | $ | 3,848,050 | | |
| Securities lending income allocated from Portfolios | | | 2,549 | | |
| Expenses allocated from Portfolios | | | (508,610 | ) | |
| Net investment income from Portfolios | | $ | 3,341,989 | | |
| Expenses | |
| Investment adviser and administration fees | | $ | 118,167 | | |
| Trustees' fees and expenses | | | 362 | | |
Distribution and service fees
Class A | | | 118,379 | | |
| Class B | | | 45,351 | | |
| Class C | | | 229,547 | | |
| Transfer and dividend disbursing agent fees | | | 65,479 | | |
| Legal and accounting services | | | 40,180 | | |
| Registration fees | | | 37,742 | | |
| Custodian fee | | | 35,212 | | |
| Printing and postage | | | 13,366 | | |
| Miscellaneous | | | 11,351 | | |
| Total expenses | | $ | 715,136 | | |
Deduct —
Reduction of investment adviser fee and administration fee | | $ | 118,167 | | |
| Allocation of expenses to the investment adviser and the administrator | | | 119,148 | | |
| Total expense reductions | | $ | 237,315 | | |
| Net expenses | | $ | 477,821 | | |
| Net investment income | | $ | 2,864,168 | | |
Realized and Unrealized
Gain (Loss) from Portfolios | |
Net realized gain (loss) —
Investment transactions (identified cost basis) | | $ | (77,437 | ) | |
| Financial futures contracts | | | 301,504 | | |
| Swap contracts | | | 993 | | |
| Foreign currency transactions | | | 166,572 | | |
| Net realized gain | | $ | 391,632 | | |
Change in unrealized appreciation (depreciation) —
Investments (identified cost basis) | | $ | (3,576,273 | ) | |
| Financial futures contracts | | | (37,750 | ) | |
| Swap contracts | | | (1,447 | ) | |
| Foreign currency | | | 12,185 | | |
| Net change in unrealized appreciation (depreciation) | | $ | (3,603,285 | ) | |
| Net realized and unrealized loss | | $ | (3,211,653 | ) | |
| Net decrease in net assets from operations | | $ | (347,485 | ) | |
See notes to financial statements
5
Eaton Vance Low Duration Fund as of October 31, 2008
FINANCIAL STATEMENTS CONT'D
Statements of Changes in Net Assets
Increase (Decrease)
in Net Assets | | Year Ended
October 31, 2008 | | Year Ended
October 31, 2007 | |
From operations —
Net investment income | | $ | 2,864,168 | | | $ | 1,561,983 | | |
Net realized gain (loss) from investment
transactions, financial futures contracts,
swap contracts and foreign currency
transactions | | | 391,632 | | | | (14,209 | ) | |
Net change in unrealized appreciation
(depreciation) from investments, financial
futures contracts, swap contracts and
foreign currency | | | (3,603,285 | ) | | | 185,528 | | |
Net increase (decrease) in net assets
from operations | | $ | (347,485 | ) | | $ | 1,733,302 | | |
Distributions to shareholders —
From net investment income
Class A | | $ | (2,147,624 | ) | | $ | (1,030,092 | ) | |
| Class B | | | (175,922 | ) | | | (201,516 | ) | |
| Class C | | | (1,078,108 | ) | | | (697,083 | ) | |
Tax return of capital
Class A | | | — | | | | (27,746 | ) | |
| Class B | | | — | | | | (6,347 | ) | |
| Class C | | | — | | | | (21,243 | ) | |
| Total distributions to shareholders | | $ | (3,401,654 | ) | | $ | (1,984,027 | ) | |
Transactions in shares of beneficial interest —
Proceeds from sale of shares
Class A | | $ | 71,624,537 | | | $ | 13,252,931 | | |
| Class B | | | 8,918,235 | | | | 2,107,781 | | |
| Class C | | | 31,558,084 | | | | 7,275,909 | | |
Net asset value of shares issued to
shareholders in payment of
distributions declared
Class A | | | 1,062,849 | | | | 625,845 | | |
| Class B | | | 99,581 | | | | 128,682 | | |
| Class C | | | 729,640 | | | | 467,001 | | |
Cost of shares redeemed
Class A | | | (22,652,104 | ) | | | (17,468,719 | ) | |
| Class B | | | (2,254,370 | ) | | | (1,769,335 | ) | |
| Class C | | | (12,979,859 | ) | | | (6,291,399 | ) | |
Net asset value of shares exchanged
Class A | | | 2,621,839 | | | | 3,558,902 | | |
| Class B | | | (2,621,839 | ) | | | (3,558,902 | ) | |
Net increase (decrease) in net assets from
Fund share transactions | | $ | 76,106,593 | | | $ | (1,671,304 | ) | |
| Net increase (decrease) in net assets | | $ | 72,357,454 | | | $ | (1,922,029 | ) | |
| Net Assets | | Year Ended
October 31, 2008 | | Year Ended
October 31, 2007 | |
| At beginning of year | | $ | 40,662,996 | | | $ | 42,585,025 | | |
| At end of year | | $ | 113,020,450 | | | $ | 40,662,996 | | |
Accumulated distributions
in excess of net investment
income included in net assets | |
| At end of year | | $ | (163,840 | ) | | $ | (55,459 | ) | |
See notes to financial statements
6
Eaton Vance Low Duration Fund as of October 31, 2008
FINANCIAL STATEMENTS CONT'D
Financial Highlights
| | | Class A | |
| | | Year Ended October 31, | | Period Ended | | Year Ended | |
| | | 2008 | | 2007 | | 2006 | | 2005 | | October 31, 2004(1) | | December 31, 2003 | |
| Net asset value — Beginning of period | | $ | 8.990 | | | $ | 9.060 | | | $ | 9.220 | | | $ | 9.420 | | | $ | 9.590 | | | $ | 9.990 | | |
| Income (loss) from operations | |
| Net investment income(2) | | $ | 0.344 | | | $ | 0.397 | | | $ | 0.333 | | | $ | 0.224 | | | $ | 0.142 | | | $ | 0.098 | | |
| Net realized and unrealized gain (loss) | | | (0.191 | ) | | | 0.028 | | | | 0.002 | | | | (0.033 | ) | | | (0.027 | ) | | | (0.120 | ) | |
| Total income (loss) from operations | | $ | 0.153 | | | $ | 0.425 | | | $ | 0.335 | | | $ | 0.191 | | | $ | 0.115 | | | $ | (0.022 | ) | |
| Less distributions | |
| From net investment income | | $ | (0.423 | ) | | $ | (0.482 | ) | | $ | (0.495 | ) | | $ | (0.391 | ) | | $ | (0.285 | ) | | $ | (0.378 | ) | |
| Tax return of capital | | | — | | | | (0.013 | ) | | | — | | | | — | | | | — | | | | — | | |
| Total distributions | | $ | (0.423 | ) | | $ | (0.495 | ) | | $ | (0.495 | ) | | $ | (0.391 | ) | | $ | (0.285 | ) | | $ | (0.378 | ) | |
| Net asset value — End of period | | $ | 8.720 | | | $ | 8.990 | | | $ | 9.060 | | | $ | 9.220 | | | $ | 9.420 | | | $ | 9.590 | | |
| Total Return(3) | | | 1.65 | % | | | 4.82 | % | | | 3.74 | % | | | 2.06 | % | | | 1.22 | %(8) | | | (0.23 | )% | |
| Ratios/Supplemental Data | |
| Net assets, end of period (000's omitted) | | $ | 71,284 | | | $ | 20,998 | | | $ | 21,157 | | | $ | 23,876 | | | $ | 38,147 | | | $ | 63,709 | | |
| Ratios (As a percentage of average daily net assets): | |
| Expenses before custodian fee reduction(4)(5)(6) | | | 1.00 | % | | | 1.17 | % | | | 1.29 | % | | | 1.24 | % | | | 1.20 | %(7) | | | 1.21 | % | |
| Net investment income | | | 3.83 | % | | | 4.40 | % | | | 3.65 | % | | | 2.41 | % | | | 1.80 | %(7) | | | 1.00 | % | |
| Portfolio Turnover of Investment Portfolio | | | 24 | % | | | 35 | % | | | 46 | % | | | 67 | % | | | 92 | % | | | 43 | % | |
| Portfolio Turnover of Floating Rate Portfolio | | | 7 | % | | | 61 | % | | | 50 | % | | | 57 | % | | | 67 | % | | | n/a | | |
| Portfolio Turnover of Government Obligations Portfolio | | | 19 | % | | | n/a | | | | 2 | % | | | 30 | % | | | 5 | % | | | 67 | % | |
(1) For the ten-month period ended October 31, 2004.
(2) Computed using average shares outstanding.
(3) Returns are historical and are calculated by determining the percentage change in net asset value with all distributions reinvested.
(4) Includes the Fund's share of the Portfolios' allocated expenses.
(5) The investment adviser waived all or a portion of its investment adviser and administration fees and/or the administrator reimbursed expenses (equal to 0.30%, 0.39%, 0.15%, 0.15%, 0.11% and 0.02% of average daily net assets for the years ended October 31, 2008, 2007, 2006 and 2005, the period ended October 31, 2004 and the year ended December 31, 2003, respectively).
(6) Excludes the effect of custody fee credits, if any, of less than 0.005%.
(7) Annualized.
(8) Not annualized.
See notes to financial statements
7
Eaton Vance Low Duration Fund as of October 31, 2008
FINANCIAL STATEMENTS CONT'D
Financial Highlights
| | | Class B | |
| | | Year Ended October 31, | | Period Ended | | Year Ended | |
| | | 2008 | | 2007 | | 2006 | | 2005 | | October 31, 2004(1) | | December 31, 2003 | |
| Net asset value — Beginning of period | | $ | 9.000 | | | $ | 9.060 | | | $ | 9.210 | | | $ | 9.420 | | | $ | 9.590 | | | $ | 9.990 | | |
| Income (loss) from operations | |
| Net investment income(2) | | $ | 0.290 | | | $ | 0.330 | | | $ | 0.266 | | | $ | 0.153 | | | $ | 0.083 | | | $ | 0.024 | | |
| Net realized and unrealized gain (loss) | | | (0.208 | ) | | | 0.036 | | | | 0.010 | | | | (0.043 | ) | | | (0.028 | ) | | | (0.121 | ) | |
| Total income (loss) from operations | | $ | 0.082 | | | $ | 0.366 | | | $ | 0.276 | | | $ | 0.110 | | | $ | 0.055 | | | $ | (0.097 | ) | |
| Less distributions | |
| From net investment income | | $ | (0.352 | ) | | $ | (0.413 | ) | | $ | (0.426 | ) | | $ | (0.320 | ) | | $ | (0.225 | ) | | $ | (0.303 | ) | |
| Tax return of capital | | | — | | | | (0.013 | ) | | | — | | | | — | | | | — | | | | — | | |
| Total distributions | | $ | (0.352 | ) | | $ | (0.426 | ) | | $ | (0.426 | ) | | $ | (0.320 | ) | | $ | (0.225 | ) | | $ | (0.303 | ) | |
| Net asset value — End of period | | $ | 8.730 | | | $ | 9.000 | | | $ | 9.060 | | | $ | 9.210 | | | $ | 9.420 | | | $ | 9.590 | | |
| Total Return(3) | | | 0.85 | % | | | 4.14 | % | | | 3.07 | % | | | 1.18 | % | | | 0.58 | %(8) | | | (0.98 | )% | |
| Ratios/Supplemental Data | |
| Net assets, end of period (000's omitted) | | $ | 7,290 | | | $ | 3,367 | | | $ | 6,491 | | | $ | 9,704 | | | $ | 14,022 | | | $ | 17,547 | | |
| Ratios (As a percentage of average daily net assets): | |
| Expenses before custodian fee reduction(4)(5)(6) | | | 1.75 | % | | | 1.92 | % | | | 2.04 | % | | | 1.99 | % | | | 1.95 | %(7) | | | 1.96 | % | |
| Net investment income | | | 3.22 | % | | | 3.66 | % | | | 2.91 | % | | | 1.64 | % | | | 1.05 | %(7) | | | 0.25 | % | |
| Portfolio Turnover of Investment Portfolio | | | 24 | % | | | 35 | % | | | 46 | % | | | 67 | % | | | 92 | % | | | 43 | % | |
| Portfolio Turnover of Floating Rate Portfolio | | | 7 | % | | | 61 | % | | | 50 | % | | | 57 | % | | | 67 | % | | | n/a | | |
| Portfolio Turnover of Government Obligations Portfolio | | | 19 | % | | | n/a | | | | 2 | % | | | 30 | % | | | 5 | % | | | 67 | % | |
(1) For the ten-month period ended October 31, 2004.
(2) Computed using average shares outstanding.
(3) Returns are historical and are calculated by determining the percentage change in net asset value with all distributions reinvested.
(4) Includes the Fund's share of the Portfolios' allocated expenses.
(5) The investment adviser waived all or a portion of its investment adviser and administration fees and/or the administrator reimbursed expenses (equal to 0.30%, 0.39%, 0.15%, 0.15%, 0.11% and 0.02% of average daily net assets for the years ended October 31, 2008, 2007, 2006 and 2005, the period ended October 31, 2004 and the year ended December 31, 2003, respectively).
(6) Excludes the effect of custody fee credits, if any, of less than 0.005%.
(7) Annualized.
(8) Not annualized.
See notes to financial statements
8
Eaton Vance Low Duration Fund as of October 31, 2008
FINANCIAL STATEMENTS CONT'D
Financial Highlights
| | | Class C | |
| | | Year Ended October 31, | | Period Ended | | Year Ended | |
| | | 2008 | | 2007 | | 2006 | | 2005 | | October 31, 2004(1) | | December 31, 2003 | |
| Net asset value — Beginning of period | | $ | 9.000 | | | $ | 9.060 | | | $ | 9.220 | | | $ | 9.420 | | | $ | 9.590 | | | $ | 9.980 | | |
| Income (loss) from operations | |
| Net investment income(2) | | $ | 0.299 | | | $ | 0.342 | | | $ | 0.277 | | | $ | 0.167 | | | $ | 0.095 | | | $ | 0.040 | | |
| Net realized and unrealized gain (loss) | | | (0.203 | ) | | | 0.038 | | | | 0.003 | | | | (0.033 | ) | | | (0.028 | ) | | | (0.112 | ) | |
| Total income (loss) from operations | | $ | 0.096 | | | $ | 0.380 | | | $ | 0.280 | | | $ | 0.134 | | | $ | 0.067 | | | $ | (0.072 | ) | |
| Less distributions | |
| From net investment income | | $ | (0.366 | ) | | $ | (0.427 | ) | | $ | (0.440 | ) | | $ | (0.334 | ) | | $ | (0.237 | ) | | $ | (0.318 | ) | |
| Tax return of capital | | | — | | | | (0.013 | ) | | | — | | | | — | | | | — | | | | — | | |
| Total distributions | | $ | (0.366 | ) | | $ | (0.440 | ) | | $ | (0.440 | ) | | $ | (0.334 | ) | | $ | (0.237 | ) | | $ | (0.318 | ) | |
| Net asset value — End of period | | $ | 8.730 | | | $ | 9.000 | | | $ | 9.060 | | | $ | 9.220 | | | $ | 9.420 | | | $ | 9.590 | | |
| Total Return(3) | | | 1.02 | % | | | 4.30 | % | | | 3.12 | % | | | 1.45 | % | | | 0.71 | %(8) | | | (0.74 | )% | |
| Ratios/Supplemental Data | |
| Net assets, end of period (000's omitted) | | $ | 34,447 | | | $ | 16,298 | | | $ | 14,937 | | | $ | 25,050 | | | $ | 34,495 | | | $ | 55,078 | | |
| Ratios (As a percentage of average daily net assets): | |
| Expenses before custodian fee reduction(4)(5)(6) | | | 1.60 | % | | | 1.78 | % | | | 1.89 | % | | | 1.84 | % | | | 1.80 | %(7) | | | 1.81 | % | |
| Net investment income | | | 3.32 | % | | | 3.80 | % | | | 3.04 | % | | | 1.79 | % | | | 1.20 | %(7) | | | 0.41 | % | |
| Portfolio Turnover of Investment Portfolio | | | 24 | % | | | 35 | % | | | 46 | % | | | 67 | % | | | 92 | % | | | 43 | % | |
| Portfolio Turnover of Floating Rate Portfolio | | | 7 | % | | | 61 | % | | | 50 | % | | | 57 | % | | | 67 | % | | | n/a | | |
| Portfolio Turnover of Government Obligations Portfolio | | | 19 | % | | | n/a | | | | 2 | % | | | 30 | % | | | 5 | % | | | 67 | % | |
(1) For the ten-month period ended October 31, 2004.
(2) Computed using average shares outstanding.
(3) Returns are historical and are calculated by determining the percentage change in net asset value with all distributions reinvested.
(4) Includes the Fund's share of the Portfolios' allocated expenses.
(5) The investment adviser waived all or a portion of its investment adviser and administration fees and/or the administrator reimbursed expenses (equal to 0.30%, 0.39%, 0.15%, 0.15%, 0.11% and 0.02% of average daily net assets for the years ended October 31, 2008, 2007, 2006 and 2005, the period ended October 31, 2004 and the year ended December 31, 2003, respectively).
(6) Excludes the effect of custody fee credits, if any, of less than 0.005%.
(7) Annualized.
(8) Not annualized.
See notes to financial statements
9
Eaton Vance Low Duration Fund as of October 31, 2008
NOTES TO FINANCIAL STATEMENTS
1 Significant Accounting Policies
Eaton Vance Low Duration Fund (the Fund) is a diversified series of Eaton Vance Mutual Funds Trust (the Trust). The Trust is a Massachusetts business trust registered under the Investment Company Act of 1940, as amended (the 1940 Act), as an open-end management investment company. The Fund offers three classes of shares. Class A shares are generally sold subject to a sales charge imposed at time of purchase. Class B and Class C shares are sold at net asset value and are generally subject to a contingent deferred sales charge (see Note 5). Class B shares automatically convert to Class A shares four years after their purchase as described in the Fund's prospectus. Each class represents a pro-rata interest in the Fund, but votes separately on class-specific matters and (as noted below) is subject to different expenses. Realized and unrealized gains and losses are allocated daily to each class of shares based on the relative net ass ets of each class to the total net assets of the Fund. Net investment income, other than class-specific expenses, is allocated daily to each class of shares based upon the ratio of the value of each class's paid shares to the total value of all paid shares. Each class of shares differs in its distribution plan and certain other class-specific expenses. The Fund's investment objective is to seek total return. The Fund currently pursues its objective by investing all of its investable assets in interests in the following three portfolios managed by Eaton Vance Management (EVM) or its affiliates: Investment Portfolio, Floating Rate Portfolio and Government Obligations Portfolio (the Portfolios), which are New York trusts. The value of the Fund's investment in the Portfolios reflects the Fund's proportionate interest in the net assets of Investment Portfolio, Floating Rate Portfolio and Government Obligations Portfolio (78.2%, 0.3% and 1.8%, respectively, at October 31, 2008). The performance of the Fund is dire ctly affected by the performance of the Portfolios. The financial statements of Investment Portfolio, including the portfolio of investments, are included elsewhere in this report and should be read in conjunction with the Fund's financial statements. A copy of each Portfolio's financial statements is available on the EDGAR Database on the Securities and Exchange Commission's website (www.sec.gov), at the Commission's public reference room in Washington, DC or upon request from the Fund's principal underwriter, Eaton Vance Distributors, Inc. (EVD), by calling 1-800-225-6265.
The following is a summary of significant accounting policies of the Fund. The policies are in conformity with accounting principles generally accepted in the United States of America.
A Investment Valuation — Valuation of securities by Investment Portfolio is discussed in Note 1A of Investment Portfolio's Notes to Financial Statements, which are included elsewhere in this report. Such policies are consistent with those of Floating-Rate Portfolio and Government Obligations Portfolio for applicable investments.
Additional valuation policies for Floating Rate Portfolio are as follows: The Portfolio's investments are primarily in interests in senior floating-rate loans (Senior Loans) of domestic and foreign issues. Interests in Senior Loans for which reliable market quotations are readily available are valued on the basis of prices furnished by an independent pricing service. Other Senior Loans are valued at fair value by the investment adviser under procedures approved by the Trustees. In fair valuing a Senior Loan, the investment adviser utilizes one or more of the following valuation techniques: (i) a matrix pricing approach that considers the yield on the Senior Loan relative to yields on other loan interests issued by companies of comparable credit quality; (ii) a comparison of the value of the borrower's outstanding equity and debt to that of comparable public companies; (iii) a discounted cash flow analysis; or (iv) when the inves tment adviser believes it is likely that a borrower will be liquidated or sold, an analysis of the terms of such liquidation or sale. In certain cases, the investment adviser will use a combination of analytical methods to determine fair value, such as when only a portion of a borrower's assets are likely to be sold. In conducting its assessment and analyses for purposes of determining fair value of a Senior Loan, the investment adviser will use its discretion and judgment in considering and appraising relevant factors. Fair value determinations are made by the portfolio managers of the Portfolio based on information available to such managers. The portfolio managers of other portfolios managed by the investment adviser that invest in Senior Loans may not possess the same information about a Senior Loan borrower as the portfolio managers of the Portfolio. At times, the fair value of a Senior Loan determined by the portfolio managers of other portfolios managed by the investment adviser that invest in Senior Loans may vary from the fair value of the same Senior Loan determined by the portfolio managers of the Portfolio. The fair value of each Senior Loan is periodically reviewed and approved by the investment adviser's Valuation Committee and by the Trustees based upon procedures approved by the Trustees. Junior Loans are valued in the same manner as Senior Loans. Equity securities listed on a U.S. securities exchange generally are valued at the last sale price on the day of valuation or, if no sales took place on such date, at the mean between the closing bid and asked prices therefore on the exchange where such securities are principally traded. Equity securities listed on the NASDAQ Global or Global Select Market generally are valued at the NASDAQ official closing price. Unlisted or listed securities for which closing sales prices or closing quotations are not
10
Eaton Vance Low Duration Fund as of October 31, 2008
NOTES TO FINANCIAL STATEMENTS CONT'D
available are valued at the mean between the latest available bid and asked prices or, in the case of preferred equity securities that are not listed or traded in the over-the-counter market, by an independent pricing service. Credit default swaps are valued by a broker-dealer (usually the counterparty to the agreement). Forward foreign currency exchange contracts are generally valued using prices supplied by a pricing vendor or dealers. Foreign securities and currencies are valued in U.S. dollars, based on foreign currency exchange rate quotations supplied by an independent quotation service. The independent service uses a proprietary model to determine the exchange rate. Inputs to the model include reported trades and implied bid/ask spreads.
B Income — The Fund's net investment income or loss consists of the Fund's pro-rata share of the net investment income or loss of the Portfolios, less all actual and accrued expenses of the Fund.
C Federal Taxes — The Fund's policy is to comply with the provisions of the Internal Revenue Code applicable to regulated investment companies and to distribute to shareholders each year substantially all of its net investment income, and all or substantially all of its net realized capital gains. Accordingly, no provision for federal income or excise tax is necessary. At October 31, 2008, the Fund, for federal income tax purposes, had a capital loss carryforward of $10,583,081 which will reduce its taxable income arising from future net realized gains on investment transactions, if any, to the extent permitted by the Internal Revenue Code, and thus will reduce the amount of distributions to shareholders, which would otherwise be necessary to relieve the Fund of any liabi lity for federal income or excise tax. Such capital loss carryforward will expire on October 31, 2010 ($5,478), October 31, 2011 ($4,082,489), October 31, 2012 ($3,697,770), October 31, 2013 ($1,016,104), October 31, 2014 ($811,882), October 31, 2015 ($374,820) and October 31, 2016 ($594,538).
As of October 31, 2008, the Fund had no uncertain tax positions that would require financial statement recognition, de-recognition, or disclosure. Each of the Fund's federal tax returns filed in the 3-year period ended October 31, 2008 remains subject to examination by the Internal Revenue Service.
D Expenses — The majority of expenses of the Trust are directly identifiable to an individual fund. Expenses which are not readily identifiable to a specific fund are allocated taking into consideration, among other things, the nature and type of expense and the relative size of the funds.
E Expense Reduction — State Street Bank and Trust Company (SSBT) serves as custodian of the Fund. Pursuant to the custodian agreement, SSBT receives a fee reduced by credits, which are determined based on the average daily cash balance the Fund maintains with SSBT. All credit balances, if any, used to reduce the Fund's custodian fees are reported as a reduction of expenses in the Statement of Operations.
F Use of Estimates — The preparation of the financial statements in conformity with accounting principles generally accepted in the United States of America requires management to make estimates and assumptions that affect the reported amounts of assets and liabilities at the date of the financial statements and the reported amounts of income and expense during the reporting period. Actual results could differ from those estimates.
G Indemnifications — Under the Trust's organizational documents, its officers and Trustees may be indemnified against certain liabilities and expenses arising out of the performance of their duties to the Fund, and shareholders are indemnified against personal liability for the obligations of the Trust. Additionally, in the normal course of business, the Fund enters into agreements with service providers that may contain indemnification clauses. The Fund's maximum exposure under these arrangements is unknown as this would involve future claims that may be made against the Fund that have not yet occurred.
H Other — Investment transactions are accounted for on a trade date basis. Dividends to shareholders are recorded on the ex-dividend date.
2 Distributions to Shareholders
The Fund declares dividends daily to shareholders of record at the time of declaration. Distributions are generally paid monthly. Distributions of realized capital gains (reduced by available capital loss carryforwards from prior years, if any) are made at least annually. Distributions are declared separately for each class of shares. Shareholders may reinvest income and capital gain distributions in additional shares of the same class of the Fund at the net asset value as of the reinvestment date or, at the election of the shareholder, receive distributions in cash. The Fund distinguishes between distributions on a tax basis and a financial reporting basis. Accounting principles generally accepted in the United States of America require that only distributions in excess of tax basis earnings and profits be reported in the financial statements as a return of capital. Permanent differences between book and tax accounting relating to distributions are reclassified to paid-in capital.
11
Eaton Vance Low Duration Fund as of October 31, 2008
NOTES TO FINANCIAL STATEMENTS CONT'D
The tax character of distributions declared for the years ended October 31, 2008 and October 31, 2007 was as follows:
| | | Year Ended October 31, | |
| | | 2008 | | 2007 | |
| Distributions declared from: | |
| Ordinary income | | $ | 3,401,654 | | | $ | 1,928,691 | | |
| Tax return of capital | | | — | | | | 55,336 | | |
During the year ended October 31, 2008, accumulated net realized loss was increased by $993,888, accumulated distributions in excess of net investment income were decreased by $429,105 and paid-in capital was increased by $564,783 due to differences between book and tax accounting, primarily for paydown gain (loss), foreign currency gain (loss), mixed straddles, swap contracts and premium amortization. These reclassifications had no effect on the net assets or net asset value per share of the Fund.
As of October 31, 2008, the components of distributable earnings (accumulated losses) and unrealized appreciation (depreciation) on a tax basis were as follows:
| Undistributed ordinary income | | $ | 7,475 | | |
| Capital loss carryforward | | $ | (10,583,081 | ) | |
| Net unrealized depreciation | | $ | (3,510,923 | ) | |
| Other temporary differences | | $ | (171,315 | ) | |
The differences between components of distributable earnings (accumulated losses) on a tax basis and the amounts reflected in the Statement of Assets and Liabilities are primarily due to differences in book and tax policies and for wash sales, future contracts, partnership allocations, premium amortization, and the timing of recognizing distributions to shareholders.
3 Transactions with Affiliates
EVM serves as the investment adviser and administrator of the Fund, providing investment advisory services (relating to the investment of the Fund's assets in the Portfolios), and administering the business affairs of the Fund. Pursuant to the investment advisory and administrative agreement, and subsequent fee waiver agreement between the Fund and EVM, the fee is computed at an annual rate of 0.15% of Fund's average daily net assets, all of which is waived. The fee waiver agreement may not be amended or terminated without the approval of the Fund's Trustees and shareholders. The Portfolios have engaged BMR to render investment advisory services. For the year ended October 31, 2008, the Fund's allocated portion of the adviser fees paid by the Portfolios was 0.52% of the Fund's average daily net assets and amounted to $407,654. EVM has agreed to reimburse the Fund's operating expenses to the extent that they exceed 1.00%, 1.75% and 1.60% annually of the Fund's average daily net assets for Class A, Class B and Class C, respectively. This agreement may be changed or terminated after April 30, 2010. Pursuant to this agreement, EVM was allocated $119,148 of the Fund's operating expenses for the year ended October 31, 2008. EVM serves as the sub-transfer agent of the Fund and receives from the transfer agent an aggregate fee based upon the actual expenses incurred by EVM in the performance of these services. For the year ended October 31, 2008, EVM earned $2,990 in sub-transfer agent fees. The Fund was informed that EVD, an affiliate of EVM, received $11,206 as its portion of the sales charge on sales of Class A shares for the year ended October 31, 2008. EVD also received distribution and service fees from Class A, Class B and Class C shares (see Note 4) and contingent deferred sales charges (see Note 5).
Except for Trustees of the Fund and the Portfolios who are not members of EVM's or BMR's organizations, officers and Trustees receive remuneration for their services to the Fund out of the investment adviser fee. Certain officers and Trustees of the Fund and the Portfolios are officers of the above organizations.
4 Distribution Plans
The Fund has in effect a distribution plan for Class A shares (Class A Plan) pursuant to Rule 12b-1 under the 1940 Act. The Class A Plan provides that the Fund will pay EVD a distribution and service fee of 0.25% per annum of its average daily net assets attributable to Class A shares for distribution services and facilities provided to the Fund by EVD, as well as for personal services and/or the maintenance of shareholder accounts. Distribution and service fees paid or accrued to EVD for the year ended October 31, 2008 amounted to $118,379 for Class A shares. The Fund also has in effect distribution plans for Class B shares (Class B Plan) and Class C shares (Class C Plan) pursuant to Rule 12b-1 under the 1940 Act. The Class B and Class C Plans require the Fund to pay EVD amounts equal to 0.75% and 0.60% per annum of its average daily net assets attributable to Class B and Class C shares, respectively, for providing ongoing dist ribution services and facilities to the Fund. The Fund will automatically discontinue payments to EVD during any period in which there are no outstanding Uncovered Distribution Charges, which are equivalent to the sum of (i) 6.25% of the aggregate amount received by the Fund for Class B and Class C shares sold, plus (ii) interest calculated by applying the rate of 1% over the prevailing prime rate to the
12
Eaton Vance Low Duration Fund as of October 31, 2008
NOTES TO FINANCIAL STATEMENTS CONT'D
outstanding balance of Uncovered Distribution Charges of EVD of each respective class, reduced by the aggregate amount of contingent deferred sales charges (see Note 5) and amounts theretofore paid or payable to EVD by each respective class. For the year ended October 31, 2008, the Fund paid or accrued to EVD $34,013 and $162,033 for Class B and Class C shares, respectively, representing 0.75% and 0.60% of the average daily net assets of Class B and Class C shares, respectively. At October 31, 2008, the amounts of Uncovered Distribution Charges of EVD calculated under the Class B and Class C Plans were approximately $973,000 and $5,482,000, respectively. The Class B and Class C Plans also authorize the Fund to make payments of service fees to EVD, investment dealers and other persons in amounts not exceeding 0.25% per annum of its average daily net assets attributable to that class. Service fees paid or accrued are for personal services and/or the maintenance of shareholder accounts. They are separate and distinct from the sales commissions and distribution fees payable to EVD and, as such, are not subject to automatic discontinuance when there are no outstanding Uncovered Distribution Charges of EVD. Service fees paid or accrued for the year ended October 31, 2008 amounted to $11,338 and $67,514 for Class B and Class C shares, respectively.
5 Contingent Deferred Sales Charges
A contingent deferred sales charge (CDSC) generally is imposed on redemptions of Class B shares made within four years of purchase and on redemptions of Class C shares made within one year of purchase. Class A shares may be subject to a 1% CDSC if redeemed within 18 months of purchase (depending on the circumstances of purchase). Generally, the CDSC is based upon the lower of the net asset value at date of redemption or date of purchase. No charge is levied on shares acquired by reinvestment of dividends or capital gain distributions. The CDSC for Class B is imposed at declining rates that begin at 3% in the case of redemptions in the first year of purchase, declining to 2.5% in the second year, 2.0% in the third year, 1.0% in the fourth year and 0.0% thereafter. Class C shares are subject to a 1% CDSC if redeemed within one year of purchase. No CDSC is levied on shares which have been sold to EVM or its affiliates or to their r espective employees or clients and may be waived under certain other limited conditions. CDSCs received on Class B and Class C redemptions are paid to EVD to reduce the amount of Uncovered Distribution Charges calculated under the Fund's Class B and Class C Plans. CDSCs received on Class B and Class C redemptions when no Uncovered Distribution Charges exist are credited to the Fund. For the year ended October 31, 2008, the Fund was informed that EVD received approximately $12,000, $17,000 and $14,000 of CDSCs paid by Class A, Class B and Class C shareholders, respectively.
6 Investment Transactions
For the year ended October 31, 2008, increases and decreases in the Fund's investment in the Portfolios were as follows:
| Portfolio | | Contributions | | Withdrawals | |
| Investment Portfolio | | $ | 116,176,900 | | | $ | 63,740,832 | | |
| Floating Rate Portfolio | | | 8,496,525 | | | | 2,017,680 | | |
| Government Obligations Portfolio | | | 14,000,000 | | | | — | | |
7 Shares of Beneficial Interest
The Fund's Declaration of Trust permits the Trustees to issue an unlimited number of full and fractional shares of beneficial interest (without par value). Such shares may be issued in a number of different series (such as the Fund) and classes. Transactions in Fund shares were as follows:
| | | Year Ended October 31, | |
| Class A | | 2008 | | 2007 | |
| Sales | | | 7,957,272 | | | | 1,473,045 | | |
Issued to shareholders electing to
receive payments of distributions
in Fund shares | | | 118,417 | | | | 69,494 | | |
| Redemptions | | | (2,526,339 | ) | | | (1,938,771 | ) | |
| Exchange from Class B shares | | | 291,779 | | | | 394,836 | | |
| Net increase (decrease) | | | 5,841,129 | | | | (1,396 | ) | |
| | | Year Ended October 31, | |
| Class B | | 2008 | | 2007 | |
| Sales | | | 993,068 | | | | 234,323 | | |
Issued to shareholders electing to
receive payments of distributions
in Fund shares | | | 11,079 | | | | 14,276 | | |
| Redemptions | | | (251,491 | ) | | | (196,842 | ) | |
| Exchange to Class A shares | | | (291,403 | ) | | | (394,196 | ) | |
| Net increase (decrease) | | | 461,253 | | | | (342,439 | ) | |
| | | Year Ended October 31, | |
| Class C | | 2008 | | 2007 | |
| Sales | | | 3,499,909 | | | | 808,686 | | |
Issued to shareholders electing to
receive payments of distributions
in Fund shares | | | 81,211 | | | | 51,844 | | |
| Redemptions | | | (1,444,738 | ) | | | (698,324 | ) | |
| Net increase | | | 2,136,382 | | | | 162,206 | | |
13
Eaton Vance Low Duration Fund as of October 31, 2008
NOTES TO FINANCIAL STATEMENTS CONT'D
8 Recently Issued Accounting Pronouncement
In September 2006, the Financial Accounting Standards Board issued Statement of Financial Accounting Standards No. 157 (FAS 157), "Fair Value Measurements". FAS 157 defines fair value, establishes a framework for measuring fair value in accordance with accounting principles generally accepted in the United States of America and expands disclosure about fair value measurements. FAS 157 is effective for fiscal years beginning after November 15, 2007. As of October 31, 2008, management does not believe the adoption of FAS 157 will impact the amounts reported in the financial statements; however, additional disclosures may be required about the inputs used to develop the measurements of fair value and the effect of certain of the measurements on changes in net assets for the period.
14
Eaton Vance Low Duration Fund as of October 31, 2008
REPORT OF INDEPENDENT REGISTERED PUBLIC ACCOUNTING FIRM
To the Trustees of Eaton Vance Mutual Funds Trust and Shareholders of Eaton Vance Low Duration Fund:
We have audited the accompanying statement of assets and liabilities of Eaton Vance Low Duration Fund (the "Fund") (one of the series of Eaton Vance Mutual Funds Trust) as of October 31, 2008, and the related statement of operations for the year then ended, the statements of changes in net assets and the financial highlights for each of the two years in the period then ended. These financial statements and financial highlights are the responsibility of the Fund's management. Our responsibility is to express an opinion on these financial statements and financial highlights based on our audits. The financial highlights for the year ended October 31, 2006, and all prior periods presented were audited by other auditors. Those auditors expressed an unqualified opinion on those financial statements and financial highlights in their report dated December 27, 2006.
We conducted our audits in accordance with the standards of the Public Company Accounting Oversight Board (United States). Those standards require that we plan and perform the audit to obtain reasonable assurance about whether the financial statements and financial highlights are free of material misstatement. The Fund is not required to have, nor were we engaged to perform, an audit of its internal control over financial reporting. Our audits included consideration of internal control over financial reporting as a basis for designing audit procedures that are appropriate in the circumstances, but not for the purpose of expressing an opinion on the effectiveness of the Fund's internal control over financial reporting. Accordingly, we express no such opinion. An audit also includes examining, on a test basis, evidence supporting the amounts and disclosures in the financial statements, assessing the accounting principles used and significant estimates made by management, as well as evaluating the overall financial statement presentation. We believe that our audits provide a reasonable basis for our opinion.
In our opinion, the financial statements and financial highlights referred to above present fairly, in all material respects, the financial position of Eaton Vance Low Duration Fund as of October 31, 2008, the results of its operations for the year then ended, the changes in its net assets and the financial highlights for each of the two years in the period then ended, in conformity with accounting principles generally accepted in the United States of America.
DELOITTE & TOUCHE LLP
Boston, Massachusetts
December 18, 2008
15
Eaton Vance Low Duration Fund as of October 31, 2008
FEDERAL TAX INFORMATION (Unaudited)
The Form 1099-DIV you receive in January 2009 will show the tax status of all distributions paid to your account in calendar 2008. Shareholders are advised to consult their own tax adviser with respect to the tax consequences of their investment in the Fund.
16
Investment Portfolio as of October 31, 2008
PORTFOLIO OF INVESTMENTS
| Mortgage-Backed Securities — 107.1% | |
| Mortgage Pass-Throughs — 96.6% | |
| Security | | Principal
Amount
(000's omitted) | | Value | |
| Federal Home Loan Mortgage Corp.: | |
| 3.948%, with various maturities to 2037(1) | | $ | 909 | | | $ | 904,266 | | |
| 4.471%, with maturity at 2030(1) | | | 1,493 | | | | 1,491,214 | | |
| 5.00%, with maturity at 2014 | | | 2,680 | | | | 2,676,205 | | |
| 5.50%, with various maturities to 2017 | | | 2,388 | | | | 2,424,963 | | |
| 5.514%, with maturity at 2022(1) | | | 782 | | | | 782,892 | | |
| 6.00%, with various maturities to 2029(2) | | | 11,315 | | | | 11,519,766 | | |
| 6.50%, with various maturities to 2030 | | | 1,539 | | | | 1,587,815 | | |
| 7.50%, with various maturities to 2017 | | | 3,653 | | | | 3,806,418 | | |
| 8.00%, with various maturities to 2025 | | | 840 | | | | 903,626 | | |
| 9.25%, with maturity at 2017 | | | 10 | | | | 10,222 | | |
| | | $ | 26,107,387 | | |
| Federal National Mortgage Association: | |
| 3.943%, with maturity at 2027(1) | | $ | 1,485 | | | $ | 1,480,096 | | |
| 3.948%, with various maturities to 2035(1) | | | 1,979 | | | | 1,974,477 | | |
| 4.133%, with maturity at 2036(1) | | | 992 | | | | 991,712 | | |
| 4.366%, with maturity at 2035(1) | | | 4,975 | | | | 4,957,346 | | |
| 4.407%, with maturity at 2036(1) | | | 1,072 | | | | 1,079,507 | | |
| 4.50%, with various maturities to 2018 | | | 23,598 | | | | 23,042,133 | | |
| 4.716%, with maturity at 2018(1) | | | 153 | | | | 151,593 | | |
| 4.826%, with maturity at 2018(1) | | | 56 | | | | 55,641 | | |
| 5.00%, with various maturities to 2024 | | | 4,123 | | | | 4,113,246 | | |
| 5.00%, TBA with maturity at 2024(7) | | | 10,000 | | | | 9,750,806 | | |
| 5.309%, with maturity at 2034(1) | | | 8,401 | | | | 8,485,303 | | |
| 5.50%, with various maturities to 2017 | | | 9,236 | | | | 9,378,133 | | |
| 6.00%, with various maturities to 2031 | | | 8,945 | | | | 9,077,416 | | |
| 6.321%, with maturity at 2032(1) | | | 1,067 | | | | 1,093,361 | | |
| 6.50%, with various maturities to 2019 | | | 3,687 | | | | 3,768,239 | | |
| 7.00%, with various maturities to 2016 | | | 1,223 | | | | 1,271,016 | | |
| 8.00%, with maturity at 2023 | | | 291 | | | | 313,638 | | |
| 9.00%, with maturity at 2011 | | | 57 | | | | 58,081 | | |
| 9.50%, with various maturities to 2022 | | | 1,384 | | | | 1,516,766 | | |
| 9.52%, with maturity at 2018(3) | | | 770 | | | | 852,475 | | |
| | | $ | 83,410,985 | | |
| Government National Mortgage Association: | |
| 5.125%, with various maturities to 2027(1) | | $ | 1,512 | | | $ | 1,491,625 | | |
| 8.25%, with maturity at 2020 | | | 489 | | | | 532,659 | | |
| 9.00%, with maturity at 2017 | | | 607 | | | | 666,450 | | |
| | | $ | 2,690,734 | | |
Total Mortgage Pass-Throughs
(identified cost $113,461,151) | | $ | 112,209,106 | | |
| Collateralized Mortgage Obligations — 5.4% | |
| Security | | Principal
Amount
(000's omitted) | | Value | |
| Federal Home Loan Mortgage Corp.: | |
| Series 1395, Class F, 3.343%, 10/15/22(4) | | $ | 166 | | | $ | 164,470 | | |
| | | $ | 164,470 | | |
| Federal National Mortgage Association: | |
| Series G93-17, Class FA, 4.25%, 4/25/23(4) | | $ | 346 | | | $ | 339,528 | | |
| Series G93-36, Class ZQ, 6.50%, 12/25/23 | | | 1,603 | | | | 1,631,858 | | |
| Series G97-4, Class FA, 5.144%, 6/17/27(4) | | | 307 | | | | 298,603 | | |
| Series 1993-140, Class J, 6.65%, 6/25/13 | | | 440 | | | | 442,257 | | |
| Series 1993-203, Class PI, 6.50%, 10/25/23 | | | 2,186 | | | | 2,205,850 | | |
| Series 1993-250, Class Z, 7.00%, 12/25/23 | | | 667 | | | | 690,177 | | |
| Series 2001-4, Class GA, 10.168%, 4/17/25(4) | | | 448 | | | | 498,063 | | |
| | | $ | 6,106,336 | | |
Total Collateralized Mortgage Obligations
(identified cost $6,400,242) | | $ | 6,270,806 | | |
Commercial Mortgage-Backed
Securities — 5.1% | |
| Security | | Principal
Amount
(000's omitted) | | Value | |
| GS Mortgage Securities Corp. II: | |
| Series 2001-LIB, Class A2, 6.615%, due 2016(5) | | $ | 1,000 | | | $ | 1,060,818 | | |
Series 2001-ROCK, Class A2FL,
4.363%, due 2018(4)(5) | | | 2,000 | | | | 1,972,533 | | |
| | | $ | 3,033,351 | | |
| Host Marriott Pool Trust: | |
Series 1999-HMTA, Class A, 6.98%,
with maturity at 2015(5) | | $ | 1,868 | | | $ | 1,888,945 | | |
Series 1999-HMTA, Class C, 7.73%,
with maturity at 2015(5) | | | 580 | | | | 592,511 | | |
Series 1999-HMTA, Class D, 7.97%,
with maturity at 2015(5) | | | 180 | | | | 184,096 | | |
Series 1999-HMTA, Class E, 8.07%,
with maturity at 2015(5) | | | 180 | | | | 184,186 | | |
| | | $ | 2,849,738 | | |
| JP Morgan Chase Commercial Mortgage Securities: | |
Series 2004-PNC1, Class A1, 2.802%,
with maturity at 2041 | | $ | 66 | | | $ | 66,167 | | |
| | | $ | 66,167 | | |
Total Commercial Mortgage-Backed Securities
(identified cost $5,951,636) | | $ | 5,949,256 | | |
Total Mortgage-Backed Securities
(identified cost $125,813,029) | | $ | 124,429,168 | | |
See notes to financial statements
17
Investment Portfolio as of October 31, 2008
PORTFOLIO OF INVESTMENTS CONT'D
| Short-Term Investments — 1.0% | |
| Description | | Interest
(000's omitted) | | Value | |
| Cash Management Portfolio, 1.90%(6) | | $ | 1,222 | | | $ | 1,222,191 | | |
Total Short-Term Investments
(identified cost $1,222,191) | | $ | 1,222,191 | | |
Total Investments — 108.1%
(identified cost $127,035,220) | | $ | 125,651,359 | | |
| Other Assets, Less Liabilities — (8.1)% | | $ | (9,437,372 | ) | |
| Net Assets — 100.0% | | | | $ | 116,213,987 | | |
(1) Adjustable rate mortgage.
(2) Security (or a portion thereof) has been segregated to cover margin requirements on open financial futures contracts.
(3) Weighted average fixed-rate coupon that changes/updates monthly.
(4) Variable rate security. The stated interest rate represents the rate in effect at October 31, 2008.
(5) Security exempt from registration under Rule 144A of the Securities Act of 1933. These securities may be sold in transactions exempt from registration, normally to qualified institutional buyers. At October 31, 2008, the aggregate value of the securities is $5,833,089 or 5.1% of the Portfolio's net assets.
(6) Affiliated investment company available to Eaton Vance portfolios and funds which invests in high quality, U.S. dollar denominated money market instruments. The rate shown is the annualized seven-day yield as of October 31, 2008.
(7) TBA (To Be Announced) securities are purchased on a forward commitment basis with an approximate principal amount and no definite maturity date. The actual principal amount and maturity date will be determined upon settlement when the specific mortgage pools are assigned.
See notes to financial statements
18
Investment Portfolio as of October 31, 2008
FINANCIAL STATEMENTS
Statement of Assets and Liabilities
As of October 31, 2008
| Assets | |
| Unaffiliated investments, at value (identified cost, $125,813,029) | | $ | 124,429,168 | | |
| Affiliated investment, at value (identified cost, $1,222,191) | | | 1,222,191 | | |
| Receivable for investments sold | | | 27,812 | | |
| Interest receivable | | | 560,505 | | |
| Interest receivable from affiliated investment | | | 12,151 | | |
| Total assets | | $ | 126,251,827 | | |
| Liabilities | |
| Payable for investments purchased | | $ | 9,926,389 | | |
| Payable to affiliate for investment adviser fee | | | 49,917 | | |
| Payable for daily variation margin on open financial futures contracts | | | 7,013 | | |
| Payable to affiliate for Trustees' fees | | | 148 | | |
| Accrued expenses | | | 54,373 | | |
| Total liabilities | | $ | 10,037,840 | | |
| Net Assets applicable to investors' interest in Portfolio | | $ | 116,213,987 | | |
| Sources of Net Assets | |
| Net proceeds from capital contributions and withdrawals | | $ | 117,537,287 | | |
| Net unrealized depreciation (computed on the basis of identified cost) | | | (1,323,300 | ) | |
| Total | | $ | 116,213,987 | | |
Statement of Operations
For the Year Ended
October 31, 2008
| Investment Income | |
| Interest | | $ | 3,759,736 | | |
| Interest income allocated from affiliated investment | | | 299,958 | | |
| Expenses allocated from affiliated investment | | | (44,131 | ) | |
| Total investment income | | $ | 4,015,563 | | |
| Expenses | |
| Investment adviser fee | | $ | 399,202 | | |
| Trustees' fees and expenses | | | 2,544 | | |
| Custodian fee | | | 67,121 | | |
| Legal and accounting services | | | 35,464 | | |
| Miscellaneous | | | 5,798 | | |
| Total expenses | | $ | 510,129 | | |
Deduct —
Reduction of custodian fee | | $ | 19 | | |
| Total expense reductions | | $ | 19 | | |
| Net expenses | | $ | 510,110 | | |
| Net investment income | | $ | 3,505,453 | | |
| Realized and Unrealized Gain (Loss) | |
Net realized gain (loss) —
Investment transactions (identified cost basis) | | $ | (1,040 | ) | |
| Financial futures contracts | | | 226,625 | | |
| Net realized gain | | $ | 225,585 | | |
Change in unrealized appreciation (depreciation) —
Investments (identified cost basis) | | $ | (1,386,384 | ) | |
| Financial futures contracts | | | 15,900 | | |
| Net change in unrealized appreciation (depreciation) | | $ | (1,370,484 | ) | |
| Net realized and unrealized loss | | $ | (1,144,899 | ) | |
| Net increase in net assets from operations | | $ | 2,360,554 | | |
See notes to financial statements
19
Investment Portfolio as of October 31, 2008
FINANCIAL STATEMENTS CONT'D
Statements of Changes in Net Assets
Increase (Decrease)
in Net Assets | | Year Ended
October 31, 2008 | | Year Ended
October 31, 2007 | |
From operations —
Net investment income | | $ | 3,505,453 | | | $ | 1,729,341 | | |
Net realized gain from investment
transactions and financial
futures contracts | | | 225,585 | | | | 15,956 | | |
Net change in unrealized
appreciation (depreciation) from
investments and
financial futures contracts | | | (1,370,484 | ) | | | 232,646 | | |
| Net increase in net assets from operations | | $ | 2,360,554 | | | $ | 1,977,943 | | |
Capital transactions —
Contributions | | $ | 165,109,548 | | | $ | 34,404,809 | | |
| Withdrawals | | | (93,579,773 | ) | | | (32,894,354 | ) | |
Net increase in net assets from
capital transactions | | $ | 71,529,775 | | | $ | 1,510,455 | | |
| Net increase in net assets | | $ | 73,890,329 | | | $ | 3,488,398 | | |
| Net Assets | |
| At beginning of year | | $ | 42,323,658 | | | $ | 38,835,260 | | |
| At end of year | | $ | 116,213,987 | | | $ | 42,323,658 | | |
See notes to financial statements
20
Investment Portfolio as of October 31, 2008
FINANCIAL STATEMENTS CONT'D
Supplementary Data
| | | Year Ended October 31, | | Period Ended | | Year Ended | |
| | | 2008 | | 2007 | | 2006 | | 2005 | | October 31, 2004(1) | | December 31, 2003 | |
| Ratios/Supplemental Data | |
| Ratios (As a percentage of average daily net assets): | |
| Expenses before custodian fee reduction | | | 0.63 | % | | | 0.65 | % | | | 0.66 | % | | | 0.65 | % | | | 0.62 | %(2) | | | 0.59 | % | |
| Expenses after custodian fee reduction | | | 0.63 | % | | | 0.65 | % | | | 0.66 | % | | | 0.64 | % | | | 0.62 | %(2) | | | 0.59 | % | |
| Net investment income | | | 3.96 | % | | | 4.67 | % | | | 4.03 | % | | | 2.65 | % | | | 1.51 | %(2) | | | 0.92 | % | |
| Portfolio Turnover | | | 24 | % | | | 35 | % | | | 46 | % | | | 67 | % | | | 92 | % | | | 43 | % | |
| Total Return | | | 4.34 | % | | | 5.52 | % | | | 4.29 | % | | | 2.32 | % | | | 1.12 | %(3) | | | 0.74 | % | |
| Net assets, end of period (000's omitted) | | $ | 116,214 | | | $ | 42,324 | | | $ | 38,835 | | | $ | 46,041 | | | $ | 58,345 | | | $ | 72,157 | | |
(1) For the ten-month period ended October 31, 2004.
(2) Annualized.
(3) Not annualized.
See notes to financial statements
21
Investment Portfolio as of October 31, 2008
NOTES TO FINANCIAL STATEMENTS
1 Significant Accounting Policies
Investment Portfolio (the Portfolio) is a New York trust registered under the Investment Company Act of 1940, as amended (the 1940 Act), as a diversified, open-end management investment company. The Portfolio's investment objective is to seek total return. The Declaration of Trust permits the Trustees to issue interests in the Portfolio. At October 31, 2008, Eaton Vance Low Duration Fund and Eaton Vance Strategic Income Fund held an interest of 78.2% and 19.6%, respectively, in the Portfolio.
The following is a summary of significant accounting policies of the Portfolio. The policies are in conformity with accounting principles generally accepted in the United States of America.
A Investment Valuation — Debt obligations, including listed securities and securities for which quotations are available, will normally be valued on the basis of market quotations provided by independent pricing services. The pricing services consider various factors relating to bonds and/or market transactions to determine market value. Most seasoned, fixed rate 30-year mortgage-backed securities are valued through the use of the investment adviser's matrix pricing system, which takes into account bond prices, yield differentials, anticipated prepayments and interest rates provided by dealers. Short-term debt securities with a remaining maturity of sixty days or less are valued at amortized cost, which approximates market value. If short-term debt securities are acquired with a remaining maturity of more than sixty days, they will be valued by a pricing service. Financial futures contracts listed on commodity exchanges are valued based on the closing price on the primary exchange on which such contracts trade. Investments for which valuations or market quotations are not readily available are valued at fair value using methods determined in good faith by or at the direction of the Trustees of the Portfolio considering relevant factors, data and information including the market value of freely tradable securities of the same class in the principal market on which such securities are normally traded.
The Portfolio may invest in Cash Management Portfolio (Cash Management), an affiliated investment company managed by Boston Management and Research (BMR), a subsidiary of Eaton Vance Management (EVM). Cash Management values its investment securities utilizing the amortized cost valuation technique permitted by Rule 2a-7 of the 1940 Act, pursuant to which Cash Management must comply with certain conditions. This technique involves initially valuing a portfolio security at its cost and thereafter assuming a constant amortization to maturity of any discount or premium. If amortized cost is determined not to approximate fair value, Cash Management may value its investment securities based on available market quotations provided by a pricing service.
B Investment Transactions — Investment transactions for financial statement purposes are accounted for on a trade date basis. Realized gains and losses on investments sold are determined on the basis of identified cost.
C Income — Interest income is recorded on the basis of interest accrued, adjusted for amortization of premium or accretion of discount.
D Federal Taxes — The Portfolio has elected to be treated as a partnership for federal tax purposes. No provision is made by the Portfolio for federal or state taxes on any taxable income of the Portfolio because each investor in the Portfolio is ultimately responsible for the payment of any taxes on its share of taxable income. Since at least one of the Portfolio's investors is a regulated investment company that invests all or substantially all of its assets in the Portfolio, the Portfolio normally must satisfy the applicable source of income and diversification requirements (under the Internal Revenue Code) in order for its investors to satisfy them. The Portfolio will allocate, at least annually among its investors, each investor's distributive share of the Portfolio' s net investment income, net realized capital gains and any other items of income, gain, loss, deduction or credit.
As of October 31, 2008, the Portfolio had no uncertain tax positions that would require financial statement recognition, de-recognition, or disclosure. Each of the Portfolio's federal tax returns filed in the 3-year period ended October 31, 2008 remains subject to examination by the Internal Revenue Service.
E Expense Reduction — State Street Bank and Trust Company (SSBT) serves as custodian of the Portfolio. Pursuant to the custodian agreement, SSBT receives a fee reduced by credits, which are determined based on the average daily cash balance the Portfolio maintains with SSBT. All credit balances, if any, used to reduce the Portfolio's custodian fees are reported as a reduction of expenses in the Statement of Operations.
F Use of Estimates — The preparation of the financial statements in conformity with accounting principles generally accepted in the United States of America requires management to make estimates and assumptions that affect the reported amounts of assets and liabilities at the date of the financial statements and the reported amounts of income and expense during the reporting period. Actual results could differ from those estimates.
22
Investment Portfolio as of October 31, 2008
NOTES TO FINANCIAL STATEMENTS CONT'D
G Indemnifications — Under the Portfolio's organizational documents, its officers and Trustees may be indemnified against certain liabilities and expenses arising out of the performance of their duties to the Portfolio. Interestholders in the Portfolio are jointly and severally liable for the liabilities and obligations of the Portfolio in the event that the Portfolio fails to satisfy such liabilities and obligations; provided, however, that, to the extent assets are available in the Portfolio, the Portfolio may, under certain circumstances, indemnify interestholders from and against any claim or liability to which such holder may become subject by reason of being or having been an interestholder in the Portfolio. Additionally, in the normal course of business, the Portfo lio enters into agreements with service providers that may contain indemnification clauses. The Portfolio's maximum exposure under these arrangements is unknown as this would involve future claims that may be made against the Portfolio that have not yet occurred.
H When-Issued Securities and Delayed Delivery Transactions — The Portfolio may purchase or sell securities on a delayed delivery or when-issued basis, including TBA (To Be Announced) securities. Payment and delivery may take place after the customary settlement period for that security. At the time the transaction is negotiated, the price of the security that will be delivered is fixed. The Portfolio maintains security positions for these commitments such that sufficient liquid assets will be available to make payments upon settlement. Securities purchased on a delayed delivery or when-issued basis are marked-to-market daily and begin earning interest on settlement date. Losses may arise due to change s in the market value of the underlying securities or if the counterparty does not perform under the contract.
I Financial Futures Contracts — The Portfolio may enter into financial futures contracts. The Portfolio's investment in financial futures contracts is designed for hedging against changes in interest rates or as a substitute for the purchase of securities. Upon entering into a financial futures contract, the Portfolio is required to deposit with the broker, either in cash or securities an amount equal to a certain percentage of the purchase price (initial margin). Subsequent payments, known as variation margin, are made or received by the Portfolio each business day, depending on the daily fluctuations in the value of the underlying security, and are recorded as unrealized gains or losses by the Portfolio. Gains (losses) are realized upon the expiration or closing of the financial futures contracts. Should market conditions change unexpectedly, the Portfolio may not achieve the anticipated benefits of the financial futures contracts and may realize a loss. In entering such contracts, the Portfolio bears the risk if the counterparties do not perform under the contracts' terms.
2 Investment Adviser Fee and Other Transactions with Affiliates
The investment adviser fee is earned by BMR as compensation for investment advisory services rendered to the Portfolio. The fee is computed at an annual rate of 0.50% of the Portfolio's average daily net assets and is payable monthly. The portion of the adviser fee payable by Cash Management on the Portfolio's investment of cash therein is credited against the Portfolio's adviser fee. For the year ended October 31, 2008, the Portfolio's adviser fee totaled $441,771 of which $42,569 was allocated from Cash Management and $399,202 was paid or accrued directly by the Portfolio.
Except for Trustees of the Portfolio who are not members of EVM's or BMR's organizations, officers and Trustees receive remuneration for their services to the Portfolio out of the investment adviser fee. Trustees of the Portfolio who are not affiliated with the investment adviser may elect to defer receipt of all or a percentage of their annual fees in accordance with the terms of the Trustees Deferred Compensation Plan. For the year ended October 31, 2008, no significant amounts have been deferred. Certain officers and Trustees of the Portfolio are officers of the above organizations.
3 Purchases and Sales of Investments
Purchases and sales of investments, other than short-term obligations and including maturities and paydowns, for the year ended October 31, 2008 were as follows:
| Purchases | |
| Investments (non-U.S. Government) | | $ | 3,125,542 | | |
| U.S. Government and Agency Securities | | | 101,970,794 | | |
| | | $ | 105,096,336 | | |
| Sales | |
| Investments (non-U.S. Government) | | $ | 227,857 | | |
| U.S. Government and Agency Securities | | | 19,860,793 | | |
| | | $ | 20,088,650 | | |
23
Investment Portfolio as of October 31, 2008
NOTES TO FINANCIAL STATEMENTS CONT'D
4 Federal Income Tax Basis of Investments
The cost and unrealized appreciation (depreciation) of investments of the Portfolio at October 31, 2008, as determined on a federal income tax basis, were as follows:
| Aggregate cost | | $ | 127,304,520 | | |
| Gross unrealized appreciation | | $ | 167,827 | | |
| Gross unrealized depreciation | | | (1,820,988 | ) | |
| Net unrealized depreciation | | $ | (1,653,161 | ) | |
5 Financial Instruments
The Portfolio may trade in financial instruments with off-balance sheet risk in the normal course of its investing activities. These financial instruments may include financial futures contracts and may involve, to a varying degree, elements of risk in excess of the amounts recognized for financial statement purposes. The notional or contractual amounts of these instruments represent the investment the Portfolio has in particular classes of financial instruments and does not necessarily represent the amounts potentially subject to risk. The measurement of the risks associated with these instruments is meaningful only when all related and offsetting transactions are considered.
A summary of obligations under these financial instruments at October 31, 2008 is as follows:
Futures Contracts
Expiration
Date | |
Contracts | |
Position | | Aggregate
Cost | |
Value | | Net Unrealized
Appreciation | |
| | 12/08 | | | 130 U.S Treasury Note | | Short | | $ | (14,784,077 | ) | | $ | (14,723,516 | ) | | $ | 60,561 | | |
At October 31, 2008, the Portfolio had sufficient cash and/or securities to cover commitments under these contracts.
6 Line of Credit
The Portfolio participates with other portfolios and funds managed by EVM and its affiliates in a $450 million unsecured line of credit agreement with a group of banks. Borrowings are made by the Portfolio solely to facilitate the handling of unusual and/or unanticipated short-term cash requirements. Interest is charged to the Portfolio based on its borrowings at an amount above either the Eurodollar rate or Federal Funds rate. In addition, a fee computed at an annual rate of 0.10% on the daily unused portion of the line of credit is allocated among the participating portfolios and funds at the end of each quarter. The Portfolio did not have any significant borrowings or allocated fees during the year ended October 31, 2008.
7 Recently Issued Accounting Pronouncements
In September 2006, the Financial Accounting Standards Board (FASB) issued Statement of Financial Accounting Standards No. 157 (FAS 157), "Fair Value Measurements". FAS 157 defines fair value, establishes a framework for measuring fair value in accordance with accounting principles generally accepted in the United States of America and expands disclosure about fair value measurements. FAS 157 is effective for fiscal years beginning after November 15, 2007. As of October 31, 2008, management does not believe the adoption of FAS 157 will impact the amounts reported in the financial statements; however, additional disclosures may be required about the inputs used to develop the measurements of fair value and the effect of certain of the measurements on changes in net assets for the period.
In March 2008, the FASB issued Statement of Financial Accounting Standards No. 161 (FAS 161), "Disclosures about Derivative Instruments and Hedging Activities". FAS 161 requires enhanced disclosures about an entity's derivative and hedging activities, including qualitative disclosures about the objectives and strategies for using derivatives, quantitative disclosures about fair value amounts of and gains and losses on derivative instruments, and disclosures about credit-risk related contingent features in derivative instruments. FAS 161 is effective for fiscal years and interim periods beginning after November 15, 2008. Management is currently evaluating the impact the adoption of FAS 161 will have on the Portfolio's financial statement disclosures.
24
Investment Portfolio as of October 31, 2008
REPORT OF INDEPENDENT REGISTERED PUBLIC ACCOUNTING FIRM
To the Trustees and Investors of
Investment Portfolio:
We have audited the accompanying statement of assets and liabilities of Investment Portfolio (the "Portfolio"), including the portfolio of investments, as of October 31, 2008, and the related statement of operations for the year then ended, the statements of changes in net assets and the supplementary data for each of the two years in the period then ended. These financial statements and supplementary data are the responsibility of the Portfolio's management. Our responsibility is to express an opinion on these financial statements and supplementary data based on our audits. The supplementary data for the year ended October 31, 2006, and all prior periods presented were audited by other auditors. Those auditors expressed an unqualified opinion on those financial statements and supplementary data in their report dated December 27, 2006.
We conducted our audits in accordance with the standards of the Public Company Accounting Oversight Board (United States). Those standards require that we plan and perform the audit to obtain reasonable assurance about whether the financial statements and supplementary data are free of material misstatement. The Portfolio is not required to have, nor were we engaged to perform, an audit of its internal control over financial reporting. Our audits included consideration of internal control over financial reporting as a basis for designing audit procedures that are appropriate in the circumstances, but not for the purpose of expressing an opinion on the effectiveness of the Portfolio's internal control over financial reporting. Accordingly, we express no such opinion. An audit also includes examining, on a test basis, evidence supporting the amounts and disclosures in the financial statements, assessing the accounting principles u sed and significant estimates made by management, as well as evaluating the overall financial statement presentation. Our procedures include confirmation of securities owned as of October 31, 2008, by correspondence with the custodian and brokers; where replies were not received from brokers, we performed other auditing procedures. We believe that our audits provide a reasonable basis for our opinion.
In our opinion, the financial statements and supplementary data referred to above present fairly, in all material respects, the financial position of Investment Portfolio as of October 31, 2008, the results of its operations for the year then ended, the changes in its net assets and the supplementary data for the two years in the period then ended in conformity with accounting principles generally accepted in the United States of America.
DELOITTE & TOUCHE LLP
Boston, Massachusetts
December 18, 2008
25
Eaton Vance Low Duration Fund
Investment Portfolio
SPECIAL MEETING OF SHAREHOLDERS (Unaudited)
Eaton Vance Low Duration Fund
The Fund held a Special Meeting of Shareholders on November 14, 2008 to elect Trustees. The results of the vote were as follows:
| | | Number of Shares | |
| Nominee for Trustee | | For | | Withheld | |
| Benjamin C. Esty | | | 9,778,347 | | | | 75,913 | | |
| Thomas E. Faust Jr. | | | 9,778,347 | | | | 75,913 | | |
| Allen R. Freedman | | | 9,778,347 | | | | 75,913 | | |
| William H. Park | | | 9,778,353 | | | | 75,907 | | |
| Ronald A. Pearlman | | | 9,781,374 | | | | 72,886 | | |
| Helen Frame Peters | | | 9,782,417 | | | | 71,843 | | |
| Heidi L. Steiger | | | 9,782,417 | | | | 71,843 | | |
| Lynn A. Stout | | | 9,782,417 | | | | 71,843 | | |
| Ralph F. Verni | | | 9,782,411 | | | | 71,849 | | |
Each nominee was also elected a Trustee of Investment Portfolio.
Investment Portfolio
The Portfolio held a Special Meeting of Interestholders on November 14, 2008 to elect Trustees. The results of the vote were as follows:
| | | Interest in the Portfolio | |
| Nominee for Trustee | | For | | Withheld | |
| Benjamin C. Esty | | | 94 | % | | | 1 | % | |
| Thomas E. Faust Jr. | | | 94 | % | | | 1 | % | |
| Allen R. Freedman | | | 94 | % | | | 1 | % | |
| William H. Park | | | 94 | % | | | 1 | % | |
| Ronald A. Pearlman | | | 94 | % | | | 1 | % | |
| Helen Frame Peters | | | 94 | % | | | 1 | % | |
| Heidi L. Steiger | | | 94 | % | | | 1 | % | |
| Lynn A. Stout | | | 94 | % | | | 1 | % | |
| Ralph F. Verni | | | 94 | % | | | 1 | % | |
Results are rounded to the nearest whole number.
26
Eaton Vance Low Duration Fund
MANAGEMENT AND ORGANIZATION
Fund Management. The Trustees of Eaton Vance Mutual Funds Trust (the Trust), Floating Rate Portfolio (FRP), Government Obligations Portfolio (GOP) and Investment Portfolio (IP) (collectively, the Portfolios) are responsible for the overall management and supervision of the Trust's and Portfolios' affairs. The Trustees and officers of the Trust and the Portfolios are listed below. Except as indicated, each individual has held the office shown or other offices in the same company for the last five years. Trustees and officers of the Trust and the Portfolios hold indefinite terms of office. The "noninterested Trustees" consist of those Trustees who are not "interested persons" of the Trust and the Portfolios, as that term is defined under the 1940 Act. The business address of each Trustee and officer is The Eaton Vance Building, 255 State Street, Boston, Massachusetts 02109. As used below, "EVC" refers to Eaton Vance Corp., "EV" refers to Eaton Vance, Inc., "EVM" refers to Eaton Vance Management, "BMR" refers to Boston Management and Research, "Parametric" refers to Parametric Portfolio Associates, and "EVD" refers to Eaton Vance Distributors, Inc. EVC and EV are the corporate parent and trustee, respectively, of EVM and BMR. EVD is the Fund's principal underwriter, the Portfolios' placement agent and a wholly-owned subsidiary of EVC. Each officer affiliated with Eaton Vance may hold a position with other Eaton Vance affiliates that is comparable to his or her position with EVM listed below.
Name and
Date of Birth | | Position(s)
with the
Trust and
the Portfolios | | Term of
Office and
Length of
Service | | Principal Occupation(s)
During Past Five Years | | Number of Portfolios
in Fund Complex
Overseen By
Trustee(1) | | Other Directorships Held | |
| Interested Trustee | | | | | | | | | | | | | |
|
| Thomas E. Faust Jr. 5/31/58 | | Trustee and President of the Trust | | Trustee since 2007 and President of the Trust since 2002 | | Chairman, Chief Executive Officer and President of EVC, Director and President of EV, Chief Executive Officer and President of EVM and BMR, and Director of EVD. Trustee and/or Officer of 173 registered investment companies and 4 private companies managed by EVM or BMR. Mr. Faust is an interested person because of his positions with EVM, BMR, EVD, EVC and EV, which are affiliates of the Trust and Portfolios. | | | 173 | | | Director of EVC | |
|
| Noninterested Trustees | | | | | | | | | | | | | |
|
| Benjamin C. Esty 1/2/63 | | Trustee | | Since 2005 | | Roy and Elizabeth Simmons Professor of Business Administration, Harvard University Graduate School of Business Administration. | | | 173 | | | None | |
|
| Allen R. Freedman 4/3/40 | | Trustee | | Since 2007 | | Former Chairman (2002-2004) and a Director (1983-2004) of Systems & Computer Technology Corp. (provider of software to higher education). Formerly, a Director of Loring Ward International (fund distributor) (2005-2007). Formerly, Chairman and a Director of Indus International, Inc. (provider of enterprise management software to the power generating industry) (2005-2007). | | | 173 | | | Director of Assurant, Inc. and Stonemor Partners L.P. (owner and operator of cemeteries) | |
|
| William H. Park 9/19/47 | | Trustee | | Since 2003 | | Vice Chairman, Commercial Industrial Finance Corp. (specialty finance company) (since 2006). Formerly, President and Chief Executive Officer, Prizm Capital Management, LLC (investment management firm) (2002-2005). | | | 173 | | | None | |
|
| Ronald A. Pearlman 7/10/40 | | Trustee | | Since 2003 | | Professor of Law, Georgetown University Law Center. | | | 173 | | | None | |
|
| Helen Frame Peters 3/22/48 | | Trustee | | Since 2008 | | Professor of Finance, Carroll School of Management, Boston College (since 2003). Adjunct Professor of Finance, Peking University, Beijing, China (since 2005). Formerly, Dean, Carroll School of Management, Boston College (2000-2003). | | | 173 | | | Director of Federal Home Loan Bank of Boston (a bank for banks) and BJ's Wholesale Clubs (wholesale club retailer); Trustee of SPDR Index Shares Funds and SPDR Series Trust (exchange traded funds) | |
|
27
Eaton Vance Low Duration Fund
MANAGEMENT AND ORGANIZATION CONT'D
Name and
Date of Birth | | Position(s)
with the
Trust and
the Portfolios | | Term of
Office and
Length of
Service | | Principal Occupation(s)
During Past Five Years | | Number of Portfolios
in Fund Complex
Overseen By
Trustee(1) | | Other Directorships Held | |
| Noninterested Trustees (continued) | | | | | | | | | | | | | |
|
| Heidi L. Steiger 7/8/53 | | Trustee | | Since 2007 | | Managing Partner, Topridge Associates LLC (global wealth management firm) (since 2008); Senior Advisor (since 2008), President (2005-2008), Lowenhaupt Global Advisors, LLC (global wealth management firm). Formerly, President and Contributing Editor, Worth Magazine (2004-2005). Formerly, Executive Vice President and Global Head of Private Asset Management (and various other positions), Neuberger Berman (investment firm) (1986-2004). | | | 173 | | | Director of Nuclear Electric Insurance Ltd. (nuclear insurance provider) and Aviva USA (insurance provider) | |
|
| Lynn A. Stout 9/14/57 | | Trustee | | Of the Trust and GOP since 1998; of FRP since 2000 and of IP since 2002 | | Paul Hastings Professor of Corporate and Securities Law (since 2006) and Professor of Law (2001-2006), University of California at Los Angeles School of Law. | | | 173 | | | None | |
|
| Ralph F. Verni 1/26/43 | | Chairman of the Board and Trustee | | Chairman of the Board since 2007 and Trustee since 2005 | | Consultant and private investor. | | | 173 | | | None | |
|
| Principal Officers who are not Trustees | | | | | | | | | | | | | |
|
Name and
Date of Birth | | Position(s)
with the
Trust and
the Portfolios | | Term of
Office and
Length of
Service | | Principal Occupation(s)
During Past Five Years | |
| William H. Ahern, Jr. 7/28/59 | | Vice President of the Trust | | Since 1995 | | Vice President of EVM and BMR. Officer of 75 registered investment companies managed by EVM or BMR. | |
|
| John R. Baur 2/10/70 | | Vice President of the Trust | | Since 2007 | | Vice President of EVM and BMR. Previously, attended Johnson Graduate School of Management, Cornell University (2002-2005), and prior thereto he was an Account Team Representative in Singapore for Applied Materials Inc. Officer of 33 registered investment companies managed by EVM or BMR. | |
|
| Michael A. Cirami 12/24/75 | | Vice President of the Trust | | Since 2007 | | Vice President of EVM and BMR. Previously, attended the University of Rochester William E. Simon Graduate School of Business Administration (2001-2003), and prior thereto he was a Team Leader for the Institutional Services Group for State Street Bank in Luxembourg. Officer of 33 registered investment companies managed by EVM or BMR. | |
|
| Cynthia J. Clemson 3/2/63 | | Vice President of the Trust | | Since 2005 | | Vice President of EVM and BMR. Officer of 90 registered investment companies managed by EVM or BMR. | |
|
| Charles B. Gaffney 12/4/72 | | Vice President of the Trust | | Since 2007 | | Vice President of EVM and BMR. Previously, Sector Portfolio Manager and Senior Equity Analyst of Brown Brothers Harriman (1997-2003). Officer of 29 registered investment companies managed by EVM or BMR. | |
|
| Christine M. Johnston 11/9/72 | | Vice President of the Trust and IP, GOP | | Of the Trust since 2007, of GOP since 2006 and of IP since 2003 | | Vice President of EVM and BMR. Officer of 35 registered investment companies managed by EVM or BMR. | |
|
| Aamer Khan 6/7/60 | | Vice President of the Trust | | Since 2005 | | Vice President of EVM and BMR. Officer of 33 registered investment companies managed by EVM or BMR. | |
|
28
Eaton Vance Low Duration Fund
MANAGEMENT AND ORGANIZATION CONT'D
| Principal Officers who are not Trustees (continued) | |
|
Name and
Date of Birth | | Position(s)
with the
Trust and
the Portfolios | | Term of
Office and
Length of
Service | | Principal Occupation(s)
During Past Five Years | |
| Thomas H. Luster 4/8/62 | | Vice President of the Trust | | Since 2006 | | Vice President of EVM and BMR. Officer of 51 registered investment companies managed by EVM or BMR. | |
|
| Robert B. MacIntosh 1/22/57 | | Vice President of the Trust | | Since 1998 | | Vice President of EVM and BMR. Officer of 90 registered investment companies managed by EVM or BMR. | |
|
| Scott H. Page 11/30/59 | | President of FRP | | Since 2007 | | Vice President of EVM and BMR. Officer of 11 registered investment companies managed by EVM or BMR. | |
|
| Duncan W. Richardson 10/26/57 | | Vice President of the Trust | | Since 2001 | | Executive Vice President and Chief Equity Investment Officer of EVC, EVM and BMR. Officer 81 registered investment companies managed by EVM or BMR. | |
|
| Craig P. Russ 10/30/63 | | Vice President of FRP | | Since 2007 | | Vice President of EVM and BMR. Officer of 6 registered investment companies managed by EVM or BMR. | |
|
| Judith A. Saryan 8/21/54 | | Vice President of the Trust | | Since 2003 | | Vice President of EVM and BMR. Officer of 55 registered investment companies managed by EVM or BMR. | |
|
| Susan Schiff 3/13/61 | | Vice President of the Trust, GOP and IP | | Of the Trust and IP since 2002; of GOP since 1993 | | Vice President of EVM and BMR. Officer of 36 registered investment companies managed by EVM or BMR. | |
|
| Thomas Seto 9/27/62 | | Vice President of the Trust | | Since 2007 | | Vice President and Director of Portfolio Management of Parametric. Officer of 31 registered investment companies managed by EVM or BMR. | |
|
| David M. Stein 5/4/51 | | Vice President of the Trust | | Since 2007 | | Managing Director and Chief Investment Officer of Parametric. Officer of 31 registered investment companies managed by EVM or BMR. | |
|
| Mark S. Venezia 5/23/49 | | Vice President of the Trust and President of GOP and IP | | Vice President of the Trust since 2007 and President of GOP and IP since 2002 | | Vice President of EVM and BMR. Officer of 36 registered investment companies managed by EVM or BMR. | |
|
| Adam A. Weigold 3/22/75 | | Vice President of the Trust | | Since 2007 | | Vice President of EVM and BMR. Officer of 71 registered investment companies managed by EVM or BMR. | |
|
| Barbara E. Campbell 6/19/57 | | Treasurer | | Of the Trust since 2005 and of the Portfolios since 2008(2) | | Vice President of EVM and BMR. Officer of 173 registered investment companies managed by EVM or BMR. | |
|
| Maureen A. Gemma 5/24/60 | | Secretary and Chief Legal Officer | | Secretary since 2007 and Chief Legal Officer since 2008 | | Vice President of EVM and BMR. Officer of 173 registered investment companies managed by EVM or BMR. | |
|
| Paul M. O'Neil 7/11/53 | | Chief Compliance Officer | | Since 2004 | | Vice President of EVM and BMR. Officer of 173 registered investment companies managed by EVM or BMR. | |
|
(1) Includes both master and feeder funds in a master-feeder structure.
(2) Prior to 2008, Ms. Campbell served as Assistant Treasurer of GOP since 1998, of FRP since 2000 and of IP since 2002.
The SAI for the Fund includes additional information about the Trustees and officers of the Fund and the Portfolios and can be obtained without charge on Eaton Vance's website at eatonvance.com or by calling 1-800-262-1122.
29
Eaton Vance Low Duration Fund
BOARD OF TRUSTEES' ANNUAL APPROVAL OF THE INVESTMENT ADVISORY AGREEMENTS
Overview of the Contract Review Process
The Investment Company Act of 1940, as amended (the "1940 Act"), provides, in substance, that each investment advisory agreement between a fund and its investment adviser will continue in effect from year to year only if its continuance is approved at least annually by the fund's board of trustees, including by a vote of a majority of the trustees who are not "interested persons" of the fund ("Independent Trustees"), cast in person at a meeting called for the purpose of considering such approval.
At a meeting of the Boards of Trustees (each a "Board") of the Eaton Vance group of mutual funds (the "Eaton Vance Funds") held on April 21, 2008, the Board, including a majority of the Independent Trustees, voted to approve continuation of existing advisory and sub-advisory agreements for the Eaton Vance Funds for an additional one-year period. In voting its approval, the Board relied upon the affirmative recommendation of the Contract Review Committee of the Board (formerly the Special Committee), which is a committee comprised exclusively of Independent Trustees. Prior to making its recommendation, the Contract Review Committee reviewed information furnished for a series of meetings of the Contract Review Committee held in February, March and April 2008. Such information included, among other things, the following:
Information about Fees, Performance and Expenses
• An independent report comparing the advisory and related fees paid by each fund with fees paid by comparable funds;
• An independent report comparing each fund's total expense ratio and its components to comparable funds;
• An independent report comparing the investment performance of each fund to the investment performance of comparable funds over various time periods;
• Data regarding investment performance in comparison to relevant peer groups of funds and appropriate indices;
• Comparative information concerning fees charged by each adviser for managing other mutual funds and institutional accounts using investment strategies and techniques similar to those used in managing the fund;
• Profitability analyses for each adviser with respect to each fund;
Information about Portfolio Management
• Descriptions of the investment management services provided to each fund, including the investment strategies and processes employed, and any changes in portfolio management processes and personnel;
• Information concerning the allocation of brokerage and the benefits received by each adviser as a result of brokerage allocation, including information concerning the acquisition of research through "soft dollar" benefits received in connection with the funds' brokerage, and the implementation of a soft dollar reimbursement program established with respect to the funds;
• Data relating to portfolio turnover rates of each fund;
• The procedures and processes used to determine the fair value of fund assets and actions taken to monitor and test the effectiveness of such procedures and processes;
Information about each Adviser
• Reports detailing the financial results and condition of each adviser;
• Descriptions of the qualifications, education and experience of the individual investment professionals whose responsibilities include portfolio management and investment research for the funds, and information relating to their compensation and responsibilities with respect to managing other mutual funds and investment accounts;
• Copies of the Codes of Ethics of each adviser and its affiliates, together with information relating to compliance with and the administration of such codes;
• Copies of or descriptions of each adviser's proxy voting policies and procedures;
• Information concerning the resources devoted to compliance efforts undertaken by each adviser and its affiliates on behalf of the funds (including descriptions of various compliance programs) and their record of compliance with investment policies and restrictions, including policies with respect to market-timing, late trading and selective portfolio disclosure, and with policies on personal securities transactions;
• Descriptions of the business continuity and disaster recovery plans of each adviser and its affiliates;
Other Relevant Information
• Information concerning the nature, cost and character of the administrative and other non-investment management services provided by Eaton Vance Management and its affiliates;
• Information concerning management of the relationship with the custodian, subcustodians and fund accountants by each adviser or the funds' administrator; and
• The terms of each advisory agreement.
30
Eaton Vance Low Duration Fund
BOARD OF TRUSTEES' ANNUAL APPROVAL OF THE INVESTMENT ADVISORY AGREEMENTS CONT'D
In addition to the information identified above, the Contract Review Committee considered information provided from time to time by each adviser throughout the year at meetings of the Board and its committees. Over the course of the twelve-month period ended April 30, 2008, the Board met eleven times and the Contract Review Committee, the Audit Committee and the Governance Committee, each of which is a Committee comprised solely of Independent Trustees, met twelve, seven and five times, respectively. At such meetings, the Trustees received, among other things, presentations by the portfolio managers and other investment professionals of each adviser relating to the investment performance of each fund and the investment strategies used in pursuing the fund's investment objective. The Portfolio Management Committee and the Compliance Reports and Regulatory Matters Committee are newly established and did not meet during the twel ve-month period ended April 30, 2008.
For funds that invest through one or more underlying portfolios, the Board considered similar information about the portfolio(s) when considering the approval of advisory agreements. In addition, in cases where the fund's investment adviser has engaged a sub-adviser, the Board considered similar information about the sub-adviser when considering the approval of any sub-advisory agreement.
The Contract Review Committee was assisted throughout the contract review process by Goodwin Procter LLP, legal counsel for the Independent Trustees. The members of the Contract Review Committee relied upon the advice of such counsel and their own business judgment in determining the material factors to be considered in evaluating each advisory and sub-advisory agreement and the weight to be given to each such factor. The conclusions reached with respect to each advisory and sub-advisory agreement were based on a comprehensive evaluation of all the information provided and not any single factor. Moreover, each member of the Contract Review Committee may have placed varying emphasis on particular factors in reaching conclusions with respect to each advisory and sub-advisory agreement.
Results of the Process
Based on its consideration of the foregoing, and such other information as it deemed relevant, including the factors and conclusions described below, the Contract Review Committee concluded that the continuance of the investment advisory and administration agreement of the Eaton Vance Low Duration Fund (the "Fund") with Eaton Vance Management ("EVM"), as well as the investment advisory agreements of the Floating Rate Portfolio, the Government Obligations Portfolio and the Investment Portfolio (the "Portfolios"), the portfolios in which the Fund invests, each with Boston Management and Research ("BMR"), including their fee structures, is in the interests of shareholders and, therefore, the Contract Review Committee recommended to the Board approval of each agreement. The Board accepted the recommendation of the Contract Review Committee as well as the factors considered and conclusions reached by the Contract Review Committee wi th respect to each agreement. Accordingly, the Board, including a majority of the Independent Trustees, voted to approve continuation of the investment advisory and administration agreement and the investment advisory agreements for the Fund and the Portfolios, respectively. EVM and BMR are each referred to as an "Adviser" herein; EVM with respect to the Fund and BMR with respect to the Portfolios. EVM and BMR are affiliates.
Nature, Extent and Quality of Services
In considering whether to approve the investment advisory and administration agreement and the investment advisory agreements of the Fund and each Portfolio, respectively, the Board evaluated the nature, extent and quality of services provided to each Portfolio by BMR and to the Fund by EVM. BMR manages the Portfolios, while EVM allocates the assets of the Fund among the Portfolios.
The Board considered BMR's management capabilities and investment process with respect to the types of investments held by the Portfolios, including the education, experience and number of its investment professionals and other personnel who provide portfolio management, investment research, and similar services to the Portfolios. In particular, the Board evaluated the abilities and experience of such investment personnel in analyzing special considerations relevant to investing in investment grade securities. With respect to the Floating Rate Portfolio, the Board noted the experience of BMR's large group of bank loan investment professionals and other personnel who provide services to the Portfolios, including portfolio managers and analysts. With respect to the Government Obligations Portfolio, the Board noted the Adviser's experience in investing in mortgage-backed securities, including seasoned mortgage-backed securities. For all the Portfolios, the Board also took into account the resources dedicated to portfolio management and other services, including the compensation paid to recruit and retain investment personnel, and the time and attention devoted to the Fund and each Portfolio by senior management.
The Board also reviewed the compliance programs of the Adviser and relevant affiliates thereof. Among other matters, the Board considered compliance and reporting matters relating to personal trading by investment personnel, selective disclosure of portfolio holdings, late trading, frequent trading, portfolio valuation, business continuity and the allocation of investment opportunities. The Board also evaluated the responses of the Adviser and its affiliates to requests from regulatory authorities such as the Securities and Exchange Commission.
31
Eaton Vance Low Duration Fund
BOARD OF TRUSTEES' ANNUAL APPROVAL OF THE INVESTMENT ADVISORY AGREEMENTS CONT'D
The Board considered shareholder and other administrative services provided or managed by Eaton Vance Management and its affiliates, including transfer agency and accounting services. The Board evaluated the benefits to shareholders of investing in a fund that is a part of a large family of funds, including the ability, in many cases, to exchange an investment among different funds without incurring additional sales charges.
After consideration of the foregoing factors, among others, the Board concluded that the nature, extent and quality of services provided by the Adviser, taken as a whole, are appropriate and consistent with the terms of the investment advisory and administration agreement and investment advisory agreements.
Fund Performance
The Board compared the Fund's investment performance to a relevant universe of similarly managed funds identified by an independent data provider and appropriate benchmark indices for the one-, three- and five-year periods ended September 30, 2007 for the Fund. The Board also considered the performance of the underlying Portfolios. The Board concluded that the Fund's performance was satisfactory.
Management Fees and Expenses
The Board reviewed contractual investment advisory fee rates, including any administrative fee rates, payable by the Portfolios and the Fund (referred to as "management fees"). As part of its review, the Board considered the management fees and the Fund's total expense ratio for the one-year period ended September 30, 2007, as compared to a group of similarly managed funds selected by an independent data provider. The Board considered that EVM is waiving its investment advisory and administration fee in its entirety and has agreed to pay other expenses of the Fund, which will lower the Fund's total expense ratios.
After reviewing the foregoing information, and in light of the nature, extent and quality of the services provided by the Adviser, the Board concluded that, given the small asset size of the Fund, the management fees charged for advisory and related services and the Fund's total expense ratio are reasonable.
Profitability
The Board reviewed the level of profits realized by the Adviser and relevant affiliates thereof in providing investment advisory and administrative services to the Fund, the Portfolios and all Eaton Vance Funds as a group. The Board considered the level of profits realized without regard to revenue sharing or other payments by the Adviser and its affiliates to third parties in respect of distribution services. The Board also considered other direct or indirect benefits received by the Adviser and its affiliates in connection with its relationship with the Fund and the Portfolios.
The Board concluded that, in light of the foregoing factors and the nature, extent and quality of the services rendered, the profits realized by the Adviser and its affiliates are reasonable.
Economies of Scale
In reviewing management fees and profitability, the Board also considered the extent to which the Adviser and its affiliates, on the one hand, and the Fund, on the other hand, can expect to realize benefits from economies of scale as the assets of the Fund and the Portfolios increase. The Board acknowledged the difficulty in accurately measuring the benefits resulting from the economies of scale with respect to the management of any specific fund or group of funds. The Board reviewed data summarizing the increases and decreases in the assets of the Portfolios and of all Eaton Vance Funds as a group over various time periods, and evaluated the extent to which the total expense ratio of the Fund and the profitability of the Adviser and its affiliates may have been affected by such increases or decreases. Based upon the foregoing, the Board concluded that the benefits from economies of scale are currently being shared equitably by the Adviser and its affiliates and the Fund. The Board also concluded that, assuming reasonably foreseeable increases in the assets of the Portfolios, the structure of the advisory fees, which include breakpoints at several asset levels, can be expected to cause the Adviser and its affiliates and the Fund to continue to share such benefits equitably.
32
Investment Adviser of Investment Portfolio
Boston Management and Research
The Eaton Vance Building
255 State Street
Boston, MA 02109
Investment Adviser and Administrator of Eaton Vance Low Duration Fund
Eaton Vance Management
The Eaton Vance Building
255 State Street
Boston, MA 02109
Principal Underwriter
Eaton Vance Distributors, Inc.
The Eaton Vance Building
255 State Street
Boston, MA 02109
(617) 482-8260
Custodian
State Street Bank and Trust Company
200 Clarendon Street
Boston, MA 02116
Transfer Agent
PNC Global Investment Servicing
Attn: Eaton Vance Funds
P.O. Box 9653
Providence, RI 02940-9653
(800) 262-1122
Independent Registered Public Accounting Firm
Deloitte & Touche LLP
200 Berkeley Street
Boston, MA 02116-5022
Eaton Vance Low Duration Fund
The Eaton Vance Building
255 State Street
Boston, MA 02109
This report must be preceded or accompanied by a current prospectus. Before investing, investors should consider carefully the Fund's investment objective, risks, and charges and expenses. The Fund's current prospectus contains this and other information about the Fund and is available through your financial advisor. Please read the prospectus carefully before you invest or send money. For further information please call 1-800-262-1122.
1560-12/08 LDSRC

Annual Report October 31, 2008


EATON VANCE
STRATEGIC
INCOME
FUND
IMPORTANT NOTICES REGARDING PRIVACY,
DELIVERY OF SHAREHOLDER DOCUMENTS,
PORTFOLIO HOLDINGS AND PROXY VOTING
Privacy. The Eaton Vance organization is committed to ensuring your financial privacy. Each of the financial institutions identified below has in effect the following policy ("Privacy Policy") with respect to nonpublic personal information about its customers:
• Only such information received from you, through application forms or otherwise, and information about your Eaton Vance fund transactions will be collected. This may include information such as name, address, social security number, tax status, account balances and transactions.
• None of such information about you (or former customers) will be disclosed to anyone, except as permitted by law (which includes disclosure to employees necessary to service your account). In the normal course of servicing a customer's account, Eaton Vance may share information with unaffiliated third parties that perform various required services such as transfer agents, custodians and broker/dealers.
• Policies and procedures (including physical, electronic and procedural safeguards) are in place that are designed to protect the confidentiality of such information.
• We reserve the right to change our Privacy Policy at any time upon proper notification to you. Customers may want to review our Policy periodically for changes by accessing the link on our homepage: www.eatonvance.com.
Our pledge of privacy applies to the following entities within the Eaton Vance organization: the Eaton Vance Family of Funds, Eaton Vance Management, Eaton Vance Investment Counsel, Boston Management and Research, and Eaton Vance Distributors, Inc.
In addition, our Privacy Policy only applies to those Eaton Vance customers who are individuals and who have a direct relationship with us. If a customer's account (i.e., fund shares) is held in the name of a third-party financial adviser/ broker-dealer, it is likely that only such adviser's privacy policies apply to the customer. This notice supersedes all previously issued privacy disclosures.
For more information about Eaton Vance's Privacy Policy, please call 1-800-262-1122.
Delivery of Shareholder Documents. The Securities and Exchange Commission (the "SEC") permits funds to deliver only one copy of shareholder documents, including prospectuses, proxy statements and shareholder reports, to fund investors with multiple accounts at the same residential or post office box address. This practice is often called "householding" and it helps eliminate duplicate mailings to shareholders.
Eaton Vance, or your financial adviser, may household the mailing of your documents indefinitely unless you instruct Eaton Vance, or your financial adviser, otherwise.
If you would prefer that your Eaton Vance documents not be householded, please contact Eaton Vance at 1-800-262-1122, or contact your financial adviser.
Your instructions that householding not apply to delivery of your Eaton Vance documents will be effective within 30 days of receipt by Eaton Vance or your financial adviser.
Portfolio Holdings. Each Eaton Vance Fund and its underlying Portfolio (if applicable) will file a schedule of its portfolio holdings on Form N-Q with the SEC for the first and third quarters of each fiscal year. The Form N-Q will be available on the Eaton Vance website www.eatonvance.com, by calling Eaton Vance at 1-800-262-1122 or in the EDGAR database on the SEC's website at www.sec.gov. Form N-Q may also be reviewed and copied at the SEC's public reference room in Washington, D.C. (call 1-800-732-0330 for information on the operation of the public reference room).
Proxy Voting. From time to time, funds are required to vote proxies related to the securities held by the funds. The Eaton Vance Funds or their underlying Portfolios (if applicable) vote proxies according to a set of policies and procedures approved by the Funds' and Portfolios' Boards. You may obtain a description of these policies and procedures and information on how the Funds or Portfolios voted proxies relating to portfolio securities during the most recent 12 month period ended June 30, without charge, upon request, by calling 1-800-262-1122. This description is also available on the SEC's website at www.sec.gov.
Eaton Vance Strategic Income Fund as of October 31, 2008
MANAGEMENT’S DISCUSSION OF FUND PERFORMANCE

Mark S. Venezia, CFA
Portfolio Manager
Economic and Market Conditions
· The credit crisis that began in mid-2007 resulted in unprecedented events in the U.S. financial markets in 2008. Within a two week period in September, investors saw the U.S. government’s bailout of the two largest government sponsored enterprises-Fannie Mae and Freddie Mac, the bankruptcy of Lehman Brothers Holdings, Inc., and the subsequent bailout of one of the world’s largest insurers amidst other government intervention and uncertainty surrounding the future of many of the largest U.S. financial institutions. As the crisis intensified in the last two months of the Fund’s fiscal year, the global fixed income and currency markets reacted with a flight to quality. The U.S. dollar strengthened against the Euro and many emerging market currencies, and U.S. interest rates fell as foreign investors headed for the relative safety of U.S. Treasury bonds. For the year ended October 31, 2008, 2-year and 5-year U.S. Treasury yields fell 240 (2.40%) and 134 basis points (1.34%), respectively. The Federal Funds rate started the year at 4.5% on October 31, 2007 and was cut to 1.0% by October 31, 2008. Many foreign central banks also cut their benchmark short-term interest rates in response to the global financial crisis, including the European Central Bank (ECB), Bank of Japan, Bank of England, and those of certain emerging market countries.
· Within U.S. credit markets, yield spread widening left no market unscathed. The yield spread of seasoned U.S. government agency mortgage-backed securities (MBS) widened by about 200 basis points (2.00%) to finish the year valued at approximately 300 basis points (3.00%) over U.S. Treasuries. Below investment grade corporate debt yield spreads widened by approximately 1,140 basis points (11.40%), with the Merrill Lynch U.S. High Yield Master II Index closing the fiscal year valued at 1,587 basis points (15.87%) over U.S. Treasuries. Similarly, senior, secured loan spreads over the London Inter-Bank Offered Rate (LIBOR) widened by approximately 1,300 basis points (13.00%), with the S&P/LSTA Leveraged Loan Index First Lien Loans valued at approximately 1,695 basis points (16.95%) over LIBOR on October 31, 2008.
Management Discussion
· The Fund’s investment objective is to seek total return. The Fund seeks to achieve its objective by primarily allocating assets among other registered investment companies managed by Eaton Vance or its affiliates that invest in different asset classes (the “Portfolios”). The Fund’s portfolio manager, taking market and other factors into consideration, determines the percentage of the Fund’s assets invested in each Portfolio. Through the Portfolios, the Fund invests in fixed-income securities, interests in floating-rate, senior loans and other securities. The Fund also has exposure to derivative instruments. The Fund also invests directly in securities or other instruments to gain exposure to sectors of the market the investment adviser believes may not be represented or are under-represented by the Portfolios, to hedge certain Portfolio exposures and/or to otherwise manage the exposures of the Fund.
Eaton Vance Strategic Income Fund
Total Return Performance 10/31/07 – 10/31/08
Class A(1) | | -7.09 | % |
Class B(1) | | -7.73 | % |
Class C(1) | | -7.85 | % |
Barclays Capital U.S. Aggregate Bond Index(2) | | 0.30 | % |
Lipper Multi-Sector Income Funds Average(2) | | -15.36 | % |
Please refer to page 3 for additional performance information.
(1) | These returns do not include the 4.75% maximum sales charge for the Fund’s Class A shares or the applicable contingent deferred sales charges (CDSC) for Class B shares and Class C shares. If sales charges were deducted, returns would be lower. |
(2) | It is not possible to invest directly in an Index or Lipper Classification. The Index’s total return does not reflect the commissions or expenses that would have been incurred if an investor individually purchased or sold the securities represented in the Index. The Barclays Capital U.S. Aggregate Bond Index consists of U.S. dollar denominated, investment grade fixed-income securities. Effective 11/3/08, the Index’s name was changed from Lehman Brothers U.S. Aggregate Bond Index. In addition to such securities, the Fund also has significant exposures to non-investment grade investments, global securities and derivatives. The Lipper total return is the average total return, at net asset value, of the funds that are in the same Lipper Classification as the Fund. |
Past performance is no guarantee of future results. Returns are historical and are calculated by determining the percentage change in net asset value or offering price (as applicable) with al distributions reinvested. Investment return and principal value will fluctuate so that shares, when redeemed, may be worth more or less than their original cost. Performance is for the stated time period only; due to market volatility, the Fund’s current performance may be lower or higher than the quoted return. For performance as of the most recent month end, please refer to www.eatonvance.com.
The views expressed throughout this report are those of the portfolio manager and are current only through the end of the period of the report as stated on the cover. These views are subject to change at any time based upon market or other conditions, and the investment adviser disclaims any responsibility to update such views. These views may not be relied on as investment advice and, because investment decisions for a fund are based on many factors, may not be relied on as an indication of trading intent on behalf of any Eaton Vance fund. Portfolio information provided in the report may not be representative of the Portfolio’s current or future investments and may change due to active management.
Fund shares are not insured by the FDIC and are not deposits or other obligations of, or guaranteed by, any depository institution. Shares are subject to investment risks, including possible loss of principal invested.
1
· The Fund outperformed the return of the Lipper Multi-Sector Income Funds Average for the year ended October 31, 2008. The primary drivers of the Fund’s outperformance were certain emerging market currency and fixed income positions, through its investments in Global Macro Portfolio and Emerging Markets Local Income Portfolio, as well as significant positions in seasoned U.S. government agency MBS, through its investments in Global Macro Portfolio and Investment Portfolio. The largest negative impact on the Fund’s return for the period was the performance of the senior, secured loan positions through its investment in Floating Rate Portfolio.
· Within the emerging market countries, the Fund’s performance benefited from positions in Africa and Eastern Europe, as well as certain positions in the Asian region. In Africa, the Fund again benefited from positions in countries with a relatively low correlation to the global economy, such as Egypt and South Africa. The Fund’s positions in Egyptian T-bills were additive to performance, as Egypt benefited from an inflow of Middle East oil revenues. The government has encouraged a stronger pound as a weapon against inflation. Elsewhere, the Fund continued to benefit from a short South African Rand position, as well as a short equity position. The Rand declined to its lowest level in six years, as demand for gold and other precious metals fell amid the global economic downturn.
· Additionally, the Fund benefited from its positions in Eastern Europe, most notably Poland and Turkey. The Fund’s exposure to the Polish Zloty added to performance. The currency was helped by strong industrial production, an economic growth rate twice that of the Euro zone and continuing remittances from workers abroad. Investments in the Turkish Lira were also additive, as the Turkish central bank raised rates to fight inflation. The currency strengthened further late in the period, following a loan accord with the International Monetary Fund. Elsewhere in Europe, the Fund’s performance was negatively impacted by its exposure to Iceland.
· In Asia, the Fund benefited from a long currency position in the Philippines and short currency exposure in South Korea. The Philippine Peso appreciated amid remittances from foreign workers and increasing foreign portfolio investment in Philippine equities. In South Korea, the Won depreciated sharply amid government missteps on the economy, a widening current account deficit, and repatriation of dividends by foreign investors.
· The Fund’s investments in seasoned U.S. government agency MBS (46.6% of net assets as of October 31, 2008), through its investments in Investment Portfolio and Global Macro Portfolio, helped the Fund outperform the Lipper Multi-Sector Income Funds Average.(1) Yield spreads for seasoned U.S. government agency MBS widened over U.S. Treasuries by nearly 200 basis points (2.00%). However, that widening was more than offset by a decline in overall yields of 240 basis points (2.40%), thereby generating positive returns for the seasoned agency MBS sector.
· The Fund had a large exposure (30.5% of net assets on October 31, 2008) to senior, secured floating rate corporate loans, through its investment in Floating Rate Portfolio, which was a drag on performance. Loan prices plunged during the year, as forced selling by hedge funds and other leveraged vehicles pushed loan prices to approximately 72 cents on the dollar at October 31, 2008. With historical recovery rates at roughly 70 cents, the market appeared to be implying near universal default rates or dramatically lower recoveries, thus far exaggerating any weakening in the loan market’s fundamentals.
· During the year, all credit markets experienced unprecented volatility, and the bank loan market was no exception. The total return for the S&P/LSTA Leveraged Loan Index through the first nine months of the fiscal year was -2.91%, disappointing, but, given the environment, not especially bad compared to other markets. However, September brought a series of events that rattled the markets more deeply. In the Fund’s fiscal fourth quarter, the Index declined -18.66%, by far its worst quarterly showing ever. This depreciation had a significant negative impact on the Fund’s performance for the year.
· The Fund’s duration increased slightly during the year, to 1.55 years at October 31, 2008 from 1.40 years at October 31, 2007. Duration is a measure of the sensitivity of a fund or a fixed-income security to changes in interest rates. A shorter duration instrument normally has less exposure to interest rate risk than longer duration instruments.
(1) | It is not possible to invest directly in a Lipper Classification. The Lipper total return is the average total return, at net asset value, of the funds that are in the same Lipper Classification as the Fund. |
2
Eaton Vance Strategic Income Fund as of October 31, 2008
FUND COMPOSITION
Fund Composition
Securities Holdings (excludes derivatives)(2)
By total net assets
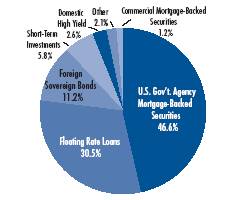
(2) | Securities Holdings reflect the Fund’s securities positions as of 10/31/08. Securities Holdings do not reflect derivatives positions. For International and Emerging Market exposures, please refer to the Regional Currency Exposures chart. |
Regional Currency Exposures (including derivatives)(3),(4)
By total net assets
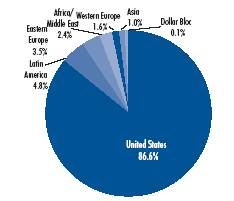
(3) | Regional Currency Exposures reflect the Fund’s exposures through its investments in Global Macro Portfolio, International Income Portfolio, Emerging Markets Local Income Portfolio, Floating Rate Portfolio, High Income Opportunities Portfolio and Investment Portfolio as of 10/31/08. Total exposures may exceed 100% due to implicit leverage created by derivatives. |
Currency Positions(4)
By total net assets
Poland | | 2.3 | % |
Mexico | | 2.0 | |
Nigeria | | 0.9 | |
Brazil | | 0.9 | |
Peru | | 0.8 | |
Iceland | | 0.7 | |
Mauritius | | 0.6 | |
Japan | | 0.6 | |
Hungary | | 0.4 | |
Colombia | | 0.4 | |
Ghana | | 0.4 | |
Georgia | | 0.3 | |
Uruguay | | 0.3 | |
United Arab Emirates | | 0.3 | |
Chile | | 0.3 | |
Indonesia | | 0.3 | |
Czech Republic | | 0.2 | |
Uganda | | 0.2 | |
Costa Rica | | 0.2 | |
United Kingdom | | 0.1 | |
Other Countries | | 0.5 | |
(4) | Currency Positions reflect the Fund’s investments in Global Macro Portfolio, International Income Portfolio and Emerging Markets Local Income Portfolio as of 10/31/08. Currency exposures and positions include all long foreign exchange denominated securities and all long currency derivatives. Net short currency positions and other foreign derivatives are excluded. Short currency exposures are 6.4%. Long foreign derivatives are 12.8%. Other short foreign derivatives are 11.9%. All numbers are a percentage of total net assets. Total exposures may exceed 100% due to implicit leverage created by derivatives. |
3
Eaton Vance Strategic Income Fund as of October 31, 2008
FUND PERFORMANCE
The line graph and table set forth below provide information about the Fund’s performance. The line graph compares the performance of Class B of the Fund with that of the Barclays Capital U.S. Aggregate Bond Index, an unmanaged, broad-based index containing only investment-grade, fixed-income securities traded in the U.S. The lines on the graph represent the total returns of a hypothetical investment of $10,000 in Class B of the Fund and in the Barclays Capital U.S. Aggregate Bond Index. The graph also offers a comparison to the Lipper Multi-Sector Income Fund Classification average, reflecting the total returns of the funds in the same classification as this Fund. The fund classification is established by Lipper Inc., a nationally recognized monitor of mutual fund performance. Funds within a classification have similar investment policies. The table includes the total returns of each Class of the Fund at net asset value and maximum public offering price. The performance presented below does not reflect the deduction of taxes, if any, that a shareholder would pay on Fund distributions or the redemption of Fund shares.
Fund Performance(1)
| | Class A | | Class B | | Class C | |
Share Class Symbols | | ETSIX | | EVSGX | | ECSIX | |
Average Annual Total Returns (at net asset value) | | | | | | | |
One Year | | -7.09 | % | -7.73 | % | -7.85 | % |
Five Years | | 4.20 | | 3.46 | | 3.46 | |
Ten Years | | 5.45 | | 4.63 | | 4.63 | |
Life of Fund† | | 4.92 | | 5.35 | | 5.88 | |
| | | | | | | |
SEC Average Annual Total Returns (including sales charge or applicable CDSC) | | | | | | | |
One Year | | -11.50 | % | -12.06 | % | -8.71 | % |
Five Years | | 3.20 | | 3.16 | | 3.46 | |
Ten Years | | 4.94 | | 4.63 | | 4.63 | |
Life of Fund† | | 4.45 | | 5.35 | | 5.88 | |
† Inception Dates – Class A: 1/23/98; Class B: 11/26/90; Class C: 5/25/94
(1) | Average Annual Total Returns do not include the 4.75% maximum sales charge for Class A shares or the applicable contingent deferred sales charges (CDSC) for Class B shares or Class C shares. If sales charges were reflected, performance would be lower. SEC Average Annual Total Returns for Class A reflect the maximum 4.75% sales charge. SEC Returns for Class B reflect applicable CDSC based on the following schedule: 5% - 1st and 2nd years; 4% - 3rd year; 3% - 4th year; 2% - 5th year; 1% - 6th year. SEC returns for Class C reflect a 1% CDSC for the first year. |
Total Annual
Operating Expenses(2) | | Class A | | Class B | | Class C | |
| | | | | | | |
Expense Ratio | | 1.04 | % | 1.78 | % | 1.78 | % |
(2) From the Fund’s prospectus dated 3/1/08, as supplemented.
Comparison of Change in Value of a $10,000 Investment in Eaton Vance Strategic Income Fund, Class B vs. the Barclays Capital U.S. Aggregate Bond Index & the Lipper Multi-Sector Income Fund Classification*
October 31, 1998 – October 31, 2008
* Source: Lipper Inc. Class B of the Fund commenced operations on 11/26/90. A $10,000 hypothetical investment at net asset value in Class A shares on 10/31/98 and Class C shares on 10/31/98 would have been valued at $17,008 ($16,200 at maximum offering price after investment at net asset value) and $15,735, respectively, on 10/31/08. It is not possible to invest directly in an Index or Lipper Classification. The Index’s total return does not reflect the expenses that would have been incurred if an investor individually purchased or sold the securities represented in the Index. The Lipper average is the average total return, at net asset value, of the funds that are in the same Lipper Classification as the Fund.
Past performance is no guarantee of future results. Returns are historical and are calculated by determining the percentage change in net asset value or offering price (as applicable) with al distributions reinvested. Investment return and principal value will fluctuate so that shares, when redeemed, may be worth more or less than their original cost. Performance is for the stated time period only; due to market volatility, the Fund’s current performance may be lower or higher than the quoted return. For performance as of the most recent month end, please refer to www.eatonvance.com.
4
Eaton Vance Strategic Income Fund as of October 31, 2008
FUND EXPENSES
Example: As a shareholder of the Fund, you incur two types of costs: (1) transaction costs, including sales charges (loads) on purchases and redemption fees (if applicable); and (2) ongoing costs, including management fees; distribution or service fees; and other Fund expenses. This Example is intended to help you understand your ongoing costs (in dollars) of investing in the Fund and to compare these costs with the ongoing costs of investing in other mutual funds. The Example is based on an investment of $1,000 invested at the beginning of the period and held for the entire period (May 1, 2008 – October 31, 2008).
Actual Expenses: The first section of the table below provides information about actual account values and actual expenses. You may use the information in this section, together with the amount you invested, to estimate the expenses that you paid over the period. Simply divide your account value by $1,000 (for example, an $8,600 account value divided by $1,000 = 8.6), then multiply the result by the number in the first section under the heading entitled "Expenses Paid During Period" to estimate the expenses you paid on your account during this period.
Hypothetical Example for Comparison Purposes: The second section of the table below provides information about hypothetical account values and hypothetical expenses based on the actual Fund expense ratio and an assumed rate of return of 5% per year (before expenses), which is not the actual return of the Fund. The hypothetical account values and expenses may not be used to estimate the actual ending account balance or expenses you paid for the period. You may use this information to compare the ongoing costs of investing in your Fund and other funds. To do so, compare this 5% hypothetical example with the 5% hypothetical examples that appear in the shareholder reports of the other funds.
Please note that the expenses shown in the table are meant to highlight your ongoing costs only and do not reflect any transactional costs, such as sales charges (loads) or redemption fees (if applicable). Therefore, the second section of the table is useful in comparing ongoing costs only, and will not help you determine the relative total costs of owning different funds. In addition, if these transactional costs were included, your costs would have been higher.
Eaton Vance Strategic Income Fund
| | | Beginning Account Value
(5/1/08) | | Ending Account Value
(10/31/08) | | Expenses Paid During Period*
(5/1/08 – 10/31/08) | |
| Actual | |
| Class A | | $ | 1,000.00 | | | $ | 917.80 | | | $ | 4.92 | | |
| Class B | | $ | 1,000.00 | | | $ | 914.70 | | | $ | 8.47 | | |
| Class C | | $ | 1,000.00 | | | $ | 914.70 | | | $ | 8.52 | | |
| Hypothetical | |
| (5% return per year before expenses) | |
| Class A | | $ | 1,000.00 | | | $ | 1,020.00 | | | $ | 5.18 | | |
| Class B | | $ | 1,000.00 | | | $ | 1,016.30 | | | $ | 8.92 | | |
| Class C | | $ | 1,000.00 | | | $ | 1,016.20 | | | $ | 8.97 | | |
* Expenses are equal to the Fund's annualized expense ratio of 1.02% for Class A shares, 1.76% for Class B shares and 1.77% for Class C shares, multiplied by 184/366 (to reflect the one-half year period). The Example assumes that the $1,000 was invested at the net asset value per share determined at the close of business on April 30, 2008. The Example reflects the expenses of both the Fund and the Portfolios.
5
Strategic Income Fund as of October 31, 2008
PORTFOLIO OF INVESTMENTS
Investment in Affiliated Portfolios — 92.6% | |
| Security | | | | Value | |
Boston Income Portfolio
| |
| (identified cost, $8,803,363) | | | | | | $ | 8,826,667 | | |
Emerging Markets Local Income Portfolio
(identified cost, $59,586,563) | | | | | | | 52,680,945 | | |
Floating Rate Portfolio
(identified cost, $535,106,182) | | | | | | | 398,294,136 | | |
Global Macro Portfolio
(identified cost, $709,564,932) | | | | | | | 681,302,677 | | |
High Income Opportunities Portfolio
(identified cost, $30,751,003) | | | | | | | 24,768,152 | | |
International Income Portfolio
(identified cost, $26,431,107) | | | | | | | 24,925,389 | | |
Investment Portfolio
(identified cost, $23,038,239) | | | | | | | 22,780,107 | | |
Total Investment in Affiliated Portfolios
(identified cost, $1,393,281,389) | | $ | 1,213,578,073 | | |
| Mortgage Pass-Throughs — 8.7% | |
| Security | | Principal
Amount | | Value | |
| Federal Home Loan Mortgage Corp.: | |
| 4.471%, 6/1/30(1) | | $ | 1,492,939 | | | $ | 1,491,214 | | |
| 6.50%, 9/1/30 | | | 11,434,040 | | | | 11,756,091 | | |
| 7.00%, 3/1/24 | | | 10,530,954 | | | | 11,010,754 | | |
| 8.00%, 4/17/26 | | | 4,723,677 | | | | 5,079,823 | | |
| Federal National Mortgage Association: | |
| 4.366%, 3/1/35(1) | | | 3,730,911 | | | | 3,718,010 | | |
| 5.00% with various maturities to 2018 | | | 14,649,016 | | | | 14,439,047 | | |
| 5.00% TBA with maturity at 2024 | | | 25,000,000 | | | | 24,377,015 | | |
| 6.00%, 6/1/30 | | | 1,197,419 | | | | 1,203,815 | | |
| 6.50%, 1/1/29 | | | 7,294,674 | | | | 7,497,799 | | |
| 7.00%, 8/1/23 | | | 9,867,027 | | | | 10,304,836 | | |
| 9.50%, 12/1/20 | | | 5,314,780 | | | | 5,962,747 | | |
| Government National Mortgage Association: | |
| 7.00% with various maturities to 2034 | | $ | 11,258,923 | | | $ | 11,817,104 | | |
| 7.50%, 12/15/22 | | | 5,479,724 | | | | 5,831,113 | | |
Total Mortgage Pass-Throughs
(identified cost, $116,497,590) | | $ | 114,489,368 | | |
| Security | | Principal
Amount | | Value | |
| U.S. Treasury Obligations — 0.2% | |
| U.S. Treasury Notes, 4.875%, 6/30/12 | | $ | 2,000,000 | | | $ | 2,199,064 | | |
Total U.S. Treasury Obligations
(identified cost, $2,035,625) | | $ | 2,199,064 | | |
| Short-Term Investments — 0.7% | |
| Security | | Principal
Amount | | Value | |
State Street Bank and Trust Time Deposit,
0.50%, 11/3/08 | | $ | 9,121,243 | | | $ | 9,121,243 | | |
Total Short-Term Investments
(identified cost, $9,121,243) | | $ | 9,121,243 | | |
Total Investments — 102.2%
(identified cost, $1,520,935,847) | | $ | 1,339,387,748 | | |
| Other Assets, Less Liabilities — (2.2)% | | $ | (28,435,934 | ) | |
| Net Assets — 100.0% | | $ | 1,310,951,814 | | |
TBA - (To Be Announced) securities are purchased on a forward commitment basis with an approximate principal amount and no definite maturity date. The actual principal amount and maturity date will be determined upon settlement when the specific mortgage pools are assigned.
(1) Adjustable Rate Mortgage
See notes to financial statements
6
Eaton Vance Strategic Income Fund as of October 31, 2008
FINANCIAL STATEMENTS
Statement of Assets and Liabilities
As of October 31, 2008
| Assets | |
Investments in unaffiliated securities, at value
(identified cost, $127,654,458) | | $ | 125,809,675 | | |
Investments in affiliated Portfolios, at value
(identified cost, $1,393,281,389) | | | 1,213,578,073 | | |
| Receivable for Fund shares sold | | | 5,798,261 | | |
| Interest receivable | | | 596,649 | | |
| Receivable for open forward foreign currency exchange contracts | | | 31, 731 | | |
| Total assets | | $ | 1,345,814,389 | | |
| Liabilities | |
| Payable for Fund shares redeemed | | $ | 6,348,956 | | |
| Dividends payable | | | 2,424,527 | | |
| Payable to affiliate for distribution and service fees | | | 653,660 | | |
| Payable to affiliate for investment adviser fee | | | 56,486 | | |
| Payable to affiliate for Trustees' fees | | | 42 | | |
| Payable for when-issued securities | | | 25,011,285 | | |
| Payable for open forward foreign currency exchange contracts | | | 148,844 | | |
| Accrued expenses | | | 218,775 | | |
| Total liabilities | | $ | 34,862,575 | | |
| Net Assets | | $ | 1,310,951,814 | | |
| Sources of Net Assets | |
| Paid-in capital | | $ | 1,552,224,580 | | |
| Accumulated net realized loss (computed on the basis of identified cost) | | | (52,631,780 | ) | |
| Accumulated distributions in excess of net investment income | | | (6,968,024 | ) | |
| Net unrealized depreciation (computed on the basis of identified cost) | | | (181,672,962 | ) | |
| Total | | $ | 1,310,951,814 | | |
| Class A Shares | |
| Net Assets | | $ | 760,071,701 | | |
| Shares Outstanding | | | 109,489,299 | | |
Net Asset Value and Redemption Price Per Share
(net assets ÷ shares of beneficial interest outstanding) | | $ | 6.94 | | |
Maximum Offering Price Per Share
(100 ÷ 95.25 of $6.94) | | $ | 7.29 | | |
| Class B Shares | |
| Net Assets | | $ | 151,015,437 | | |
| Shares Outstanding | | | 23,002,381 | | |
Net Asset Value and Offering Price Per Share*
(net assets ÷ shares of beneficial interest outstanding) | | $ | 6.57 | | |
| Class C Shares | |
| Net Assets | | $ | 399,864,676 | | |
| Shares Outstanding | | | 60,847,268 | | |
Net Asset Value and Offering Price Per Share*
(net assets ÷ shares of beneficial interest outstanding) | | $ | 6.57 | | |
| On sales of $25,000 or more, the offering price of Class A shares is reduced. | |
* Redemption price per share is equal to the net asset value less any applicable contingent deferred sales charge.
Statement of Operations
For the Year Ended
October 31, 2008
| Investment Income | |
| Interest income | | $ | 3,305,489 | | |
Interest income allocated from affiliated Portfolios
(net of foreign taxes, $284,877) | | | 78,701,785 | | |
| Dividends allocated from affiliated Portfolios | | | 51,653 | | |
| Expenses allocated from affiliated Portfolios | | | (8,569,206 | ) | |
| Total investment income | | $ | 73,489,721 | | |
| Expenses | |
| Investment adviser fee | | $ | 482,529 | | |
| Trustees' fees and expenses | | | 1,735 | | |
Distribution and service fees
Class A | | | 1,850,109 | | |
| Class B | | | 1,763,095 | | |
| Class C | | | 3,984,880 | | |
| Transfer and dividend disbursing agent fees | | | 923,045 | | |
| Printing and postage | | | 178,250 | | |
| Legal and accounting services | | | 104,533 | | |
| Registration fees | | | 96,316 | | |
| Custodian fee | | | 57,104 | | |
| Miscellaneous | | | 17,028 | | |
| Total expenses | | $ | 9,458,624 | | |
| Net investment income | | $ | 64,031,097 | | |
| Realized and Unrealized Gain (Loss) | |
Net realized gain (loss) —
Foreign currency and forward foreign currency exchange contracts | | $ | 2,494,443 | | |
Net realized gain (loss) allocated from affiliated Portfolios —
Investment transactions (identified cost basis) | | | (3,555,240 | ) | |
| Financial futures contracts | | | (660,774 | ) | |
| Swap contracts | | | 149,899 | | |
Foreign currency and forward foreign currency exchange
contract transactions | | | 9,297,198 | | |
| Net realized gain | | $ | 7,725,526 | | |
Change in unrealized appreciation (depreciation) —
Investments | | $ | (1,879,252 | ) | |
| Foreign currency and forward foreign currency exchange contracts | | | (117,113 | ) | |
Change in unrealized appreciation (depreciation) allocated from
affiliated Portfolios —
Investments (identified cost basis) | | | (192,324,018 | ) | |
| Financial futures contracts | | | 1,099,998 | | |
| Written options | | | (53,784 | ) | |
| Swap contracts | | | 2,511,778 | | |
| Foreign currency and forward foreign currency exchange contracts | | | 8,665,021 | | |
| Net change in unrealized appreciation (depreciation) | | $ | (182,097,370 | ) | |
| Net realized and unrealized loss | | $ | (174,371,844 | ) | |
| Net decrease in net assets from operations | | $ | (110,340,747 | ) | |
See notes to financial statements
7
Eaton Vance Strategic Income Fund as of October 31, 2008
FINANCIAL STATEMENTS CONT'D
Statements of Changes in Net Assets
Increase (Decrease)
in Net Assets | | Year Ended
October 31, 2008 | | Year Ended
October 31, 2007 | |
From operations —
Net investment income | | $ | 64,031,097 | | | $ | 48,680,201 | | |
Net realized gain from investment
transactions, financial futures contracts,
swap contracts, and foreign currency
and forward foreign currency
exchange contract transactions | | | 7,725,526 | | | | 23,650,828 | | |
Net change in unrealized appreciation
(depreciation) from investments,
financial futures contracts, written
options, swap contracts, and foreign
currency and forward foreign currency
exchange contracts | | | (182,097,370 | ) | | | 3,498,735 | | |
Net increase (decrease) in net assets
from operations | | $ | (110,340,747 | ) | | $ | 75,829,764 | | |
Distributions to shareholders —
From net investment income | |
| Class A | | $ | (50,504,569 | ) | | $ | (32,848,581 | ) | |
| Class B | | | (10,925,392 | ) | | | (11,061,989 | ) | |
| Class C | | | (24,184,474 | ) | | | (15,659,037 | ) | |
| Tax return of capital | |
| Class A | | | (1,511,992 | ) | | | — | | |
| Class B | | | (327,081 | ) | | | — | | |
| Class C | | | (724,028 | ) | | | — | | |
| Total distributions to shareholders | | $ | (88,177,536 | ) | | $ | (59,569,607 | ) | |
Transactions in shares of beneficial interest —
Proceeds from sale of shares
Class A | | $ | 481,969,000 | | | $ | 286,655,999 | | |
| Class B | | | 42,279,143 | | | | 28,631,188 | | |
| Class C | | | 269,066,623 | | | | 129,421,778 | | |
Net asset value of shares issued to
shareholders in payment of
distributions declared
Class A | | | 36,244,553 | | | | 20,752,041 | | |
| Class B | | | 5,345,992 | | | | 4,761,298 | | |
| Class C | | | 14,556,311 | | | | 8,379,375 | | |
Cost of shares redeemed
Class A | | | (255,579,917 | ) | | | (145,149,166 | ) | |
| Class B | | | (40,548,990 | ) | | | (37,458,867 | ) | |
| Class C | | | (134,206,087 | ) | | | (57,129,220 | ) | |
Net asset value of shares exchanged
Class A | | | 12,614,319 | | | | 12,358,352 | | |
| Class B | | | (12,614,319 | ) | | | (12,358,352 | ) | |
Net increase in net assets from Fund
share transactions | | $ | 419,126,628 | | | $ | 238,864,426 | | |
| Net increase in net assets | | $ | 220,608,345 | | | $ | 255,124,583 | | |
| Net Assets | | Year Ended
October 31, 2008 | | Year Ended
October 31, 2007 | |
| At beginning of year | | $ | 1,090,343,469 | | | $ | 835,218,886 | | |
| At end of year | | $ | 1,310,951,814 | | | $ | 1,090,343,469 | | |
Accumulated undistributed
(distributions in excess of)
net investment income
included in net assets | |
| At end of year | | $ | (6,968,024 | ) | | $ | 15,820,057 | | |
See notes to financial statements
8
Eaton Vance Strategic Income Fund as of October 31, 2008
FINANCIAL STATEMENTS CONT'D
Financial Highlights
| | | Class A | |
| | | Year Ended October 31, | |
| | | 2008 | | 2007 | | 2006 | | 2005 | | 2004 | |
| Net asset value — Beginning of year | | $ | 8.020 | | | $ | 7.890 | | | $ | 7.900 | | | $ | 8.030 | | | $ | 8.100 | | |
| Income (loss) from operations | |
| Net investment income(1) | | $ | 0.402 | | | $ | 0.436 | | | $ | 0.398 | | | $ | 0.294 | | | $ | 0.286 | | |
| Net realized and unrealized gain (loss) | | | (0.929 | ) | | | 0.221 | | | | 0.161 | | | | 0.166 | | | | 0.273 | | |
| Total income (loss) from operations | | $ | (0.527 | ) | | $ | 0.657 | | | $ | 0.559 | | | $ | 0.460 | | | $ | 0.559 | | |
| Less distributions | |
| From net investment income | | $ | (0.537 | ) | | $ | (0.527 | ) | | $ | (0.563 | ) | | $ | (0.590 | ) | | $ | (0.629 | ) | |
| Tax return of capital | | | (0.016 | ) | | | — | | | | (0.006 | ) | | | — | | | | — | | |
| Total distributions | | $ | (0.553 | ) | | $ | (0.527 | ) | | $ | (0.569 | ) | | $ | (0.590 | ) | | $ | (0.629 | ) | |
| Net asset value — End of year | | $ | 6.940 | | | $ | 8.020 | | | $ | 7.890 | | | $ | 7.900 | | | $ | 8.030 | | |
| Total Return(2) | | | (7.09 | )% | | | 8.61 | % | | | 7.30 | % | | | 5.85 | % | | | 7.18 | % | |
| Ratios/Supplemental Data | |
| Net assets, end of year (000's omitted) | | $ | 760,072 | | | $ | 598,155 | | | $ | 414,882 | | | $ | 238,973 | | | $ | 162,022 | | |
| Ratios (As a percentage of average daily net assets): | |
| Expenses before custodian fee reduction(3)(4) | | | 1.04 | % | | | 1.04 | % | | | 0.99 | % | | | 1.02 | % | | | 1.06 | % | |
| Net investment income | | | 5.19 | % | | | 5.49 | % | | | 5.04 | % | | | 3.66 | % | | | 3.57 | % | |
| Portfolio Turnover of the Fund | | | 13 | % | | | — | | | | — | | | | — | | | | — | | |
| Portfolio Turnover of Global Macro Portfolio | | | 26 | % | | | 45 | % | | | 41 | % | | | 59 | % | | | 55 | % | |
| Portfolio Turnover of High Income Opportunities Portfolio | | | 48 | % | | | 81 | % | | | 62 | % | | | 62 | % | | | 80 | % | |
| Portfolio Turnover of Floating Rate Portfolio | | | 7 | % | | | 61 | % | | | 50 | % | | | 57 | % | | | 67 | % | |
| Portfolio Turnover of Investment Portfolio | | | 24 | % | | | 35 | % | | | — | | | | — | | | | — | | |
| Portfolio Turnover of International Income Portfolio | | | 14 | % | | | 2 | % | | | — | | | | — | | | | — | | |
| Portfolio Turnover of Emerging Markets Local Income Portfolio | | | 38 | % | | | 2 | % | | | — | | | | — | | | | — | | |
| Portfolio Turnover of Boston Income Portfolio | | | 54 | % | | | — | | | | — | | | | — | | | | — | | |
(1) Computed using average shares outstanding.
(2) Returns are historical and are calculated by determining the percentage change in net asset value with all distributions reinvested.
(3) Includes the Fund's share of the Portfolios' allocated expenses.
(4) Excludes the effect of custody fee credits, if any, of less than 0.005%.
See notes to financial statements
9
Eaton Vance Strategic Income Fund as of October 31, 2008
FINANCIAL STATEMENTS CONT'D
Financial Highlights
| | | Class B | |
| | | Year Ended October 31, | |
| | | 2008 | | 2007 | | 2006 | | 2005 | | 2004 | |
| Net asset value — Beginning of year | | $ | 7.590 | | | $ | 7.470 | | | $ | 7.480 | | | $ | 7.600 | | | $ | 7.660 | | |
| Income (loss) from operations | |
| Net investment income(1) | | $ | 0.331 | | | $ | 0.356 | | | $ | 0.320 | | | $ | 0.223 | | | $ | 0.224 | | |
| Net realized and unrealized gain (loss) | | | (0.881 | ) | | | 0.207 | | | | 0.153 | | | | 0.159 | | | | 0.254 | | |
| Total income (loss) from operations | | $ | (0.550 | ) | | $ | 0.563 | | | $ | 0.473 | | | $ | 0.382 | | | $ | 0.478 | | |
| Less distributions | |
| From net investment income | | $ | (0.456 | ) | | $ | (0.443 | ) | | $ | (0.477 | ) | | $ | (0.502 | ) | | $ | (0.538 | ) | |
| Tax return of capital | | | (0.014 | ) | | | — | | | | (0.006 | ) | | | — | | | | — | | |
| Total distributions | | $ | (0.470 | ) | | $ | (0.443 | ) | | $ | (0.483 | ) | | $ | (0.502 | ) | | $ | (0.538 | ) | |
| Net asset value — End of year | | $ | 6.570 | | | $ | 7.590 | | | $ | 7.470 | | | $ | 7.480 | | | $ | 7.600 | | |
| Total Return(2) | | | (7.73 | )% | | | 7.77 | % | | | 6.50 | % | | | 5.12 | % | | | 6.47 | % | |
| Ratios/Supplemental Data | |
| Net assets, end of year (000's omitted) | | $ | 151,015 | | | $ | 180,871 | | | $ | 194,351 | | | $ | 196,766 | | | $ | 191,765 | | |
| Ratios (As a percentage of average daily net assets): | |
| Expenses before custodian fee reduction(3)(4) | | | 1.79 | % | | | 1.78 | % | | | 1.74 | % | | | 1.77 | % | | | 1.81 | % | |
| Net investment income | | | 4.50 | % | | | 4.74 | % | | | 4.27 | % | | | 2.94 | % | | | 2.95 | % | |
| Portfolio Turnover of the Fund | | | 13 | % | | | — | | | | — | | | | — | | | | — | | |
| Portfolio Turnover of Global Macro Portfolio | | | 26 | % | | | 45 | % | | | 41 | % | | | 59 | % | | | 55 | % | |
| Portfolio Turnover of High Income Opportunities Portfolio | | | 48 | % | | | 81 | % | | | 62 | % | | | 62 | % | | | 80 | % | |
| Portfolio Turnover of Floating Rate Portfolio | | | 7 | % | | | 61 | % | | | 50 | % | | | 57 | % | | | 67 | % | |
| Portfolio Turnover of Investment Portfolio | | | 24 | % | | | 35 | % | | | — | | | | — | | | | — | | |
| Portfolio Turnover of International Income Portfolio | | | 14 | % | | | 2 | % | | | — | | | | — | | | | — | | |
| Portfolio Turnover of Emerging Markets Local Income Portfolio | | | 38 | % | | | 2 | % | | | — | | | | — | | | | — | | |
| Portfolio Turnover of Boston Income Portfolio | | | 54 | % | | | — | | | | — | | | | — | | | | — | | |
(1) Computed using average shares outstanding.
(2) Returns are historical and are calculated by determining the percentage change in net asset value with all distributions reinvested.
(3) Includes the Fund's share of the Portfolios' allocated expenses.
(4) Excludes the effect of custody fee credits, if any, of less than 0.005%.
See notes to financial statements
10
Eaton Vance Strategic Income Fund as of October 31, 2008
FINANCIAL STATEMENTS CONT'D
Financial Highlights
| | | Class C | |
| | | Year Ended October 31, | |
| | | 2008 | | 2007 | | 2006 | | 2005 | | 2004 | |
| Net asset value — Beginning of year | | $ | 7.600 | | | $ | 7.470 | | | $ | 7.480 | | | $ | 7.610 | | | $ | 7.670 | | |
| Income (loss) from operations | |
| Net investment income(1) | | $ | 0.325 | | | $ | 0.356 | | | $ | 0.320 | | | $ | 0.222 | | | $ | 0.219 | | |
| Net realized and unrealized gain (loss) | | | (0.885 | ) | | | 0.217 | | | | 0.153 | | | | 0.150 | | | | 0.260 | | |
| Total income (loss) from operations | | $ | (0.560 | ) | | $ | 0.573 | | | $ | 0.473 | | | $ | 0.372 | | | $ | 0.479 | | |
| Less distributions | |
| From net investment income | | $ | (0.457 | ) | | $ | (0.443 | ) | | $ | (0.477 | ) | | $ | (0.502 | ) | | $ | (0.539 | ) | |
| Tax return of capital | | | (0.013 | ) | | | — | | | | (0.006 | ) | | | — | | | | — | | |
| Total distributions | | $ | (0.470 | ) | | $ | (0.443 | ) | | $ | (0.483 | ) | | $ | (0.502 | ) | | $ | (0.539 | ) | |
| Net asset value — End of year | | $ | 6.570 | | | $ | 7.600 | | | $ | 7.470 | | | $ | 7.480 | | | $ | 7.610 | | |
| Total Return(2) | | | (7.85 | )% | | | 7.91 | % | | | 6.50 | % | | | 5.21 | %(3) | | | 6.45 | % | |
| Ratios/Supplemental Data | |
| Net assets, end of year (000's omitted) | | $ | 399,865 | | | $ | 311,317 | | | $ | 225,985 | | | $ | 148,541 | | | $ | 103,355 | | |
| Ratios (As a percentage of average daily net assets): | |
| Expenses before custodian fee reduction(4)(5) | | | 1.79 | % | | | 1.78 | % | | | 1.74 | % | | | 1.77 | % | | | 1.81 | % | |
| Net investment income | | | 4.43 | % | | | 4.74 | % | | | 4.29 | % | | | 2.91 | % | | | 2.89 | % | |
| Portfolio Turnover of the Fund | | | 13 | % | | | — | | | | — | | | | — | | | | — | | |
| Portfolio Turnover of Global Macro Portfolio | | | 26 | % | | | 45 | % | | | 41 | % | | | 59 | % | | | 55 | % | |
| Portfolio Turnover of High Income Opportunities Portfolio | | | 48 | % | | | 81 | % | | | 62 | % | | | 62 | % | | | 80 | % | |
| Portfolio Turnover of Floating Rate Portfolio | | | 7 | % | | | 61 | % | | | 50 | % | | | 57 | % | | | 67 | % | |
| Portfolio Turnover of Investment Portfolio | | | 24 | % | | | 35 | % | | | — | | | | — | | | | — | | |
| Portfolio Turnover of International Income Portfolio | | | 14 | % | | | 2 | % | | | — | | | | — | | | | — | | |
| Portfolio Turnover of Emerging Markets Local Income Portfolio | | | 38 | % | | | 2 | % | | | — | | | | — | | | | — | | |
| Portfolio Turnover of Boston Income Portfolio | | | 54 | % | | | — | | | | — | | | | — | | | | — | | |
(1) Computed using average shares outstanding.
(2) Returns are historical and are calculated by determining the percentage change in net asset value with all distributions reinvested.
(3) Total return reflects an increase of 0.17% due to a change in the timing of the payment and reinvestment of distributions.
(4) Includes the Fund's share of the Portfolios' allocated expenses.
(5) Excludes the effect of custody fee credits, if any, of less than 0.005%.
See notes to financial statements
11
Eaton Vance Strategic Income Fund as of October 31, 2008
NOTES TO FINANCIAL STATEMENTS
1 Significant Accounting Policies
Eaton Vance Strategic Income Fund (the Fund) is a non-diversified series of Eaton Vance Mutual Funds Trust (the Trust). The Trust is a Massachusetts business trust registered under the Investment Company Act of 1940, as amended (the 1940 Act), as an open-end management investment company. The Fund offers three classes of shares. Class A shares are generally sold subject to a sales charge imposed at time of purchase. Class B and Class C shares are sold at net asset value and are generally subject to a contingent deferred sales charge (see Note 5). Class B shares automatically convert to Class A shares eight years after their purchase as described in the Fund's prospectus. Each class represents a pro-rata interest in the Fund, but votes separately on class-specific matters and (as noted below) is subject to different expenses. Realized and unrealized gains and losses are allocated daily to each class of shares based on the relativ e net assets of each class to the total net assets of the Fund. Net investment income, other than class-specific expenses, is allocated daily to each class of shares based upon the ratio of the value of each class's paid shares to the total value of all paid shares. Each class of shares differs in its distribution plan and certain other class-specific expenses. The Fund's investment objective is to seek total return. The Fund currently pursues its objective by investing all of its investable assets in interests in the following seven portfolios managed by Eaton Vance Management (EVM) or its affiliates: Boston Income Portfolio, Global Macro Portfolio, Emerging Markets Local Income Portfolio, International Income Portfolio, High Income Opportunities Portfolio, Investment Portfolio, and Floating Rate Portfolio (the Portfolios), which are New York trusts. The value of the Fund's investment in the Portfolios reflects the Fund's proportionate interest in the net assets of the Boston Income Portfolio, Global Macro Portfolio, Emerging Markets Local Income Portfolio, International Income Portfolio, High Income Opportunities Portfolio, Investment Portfolio, and Floating Rate Portfolio (0.6%, 80.6%, 86.6%, 73.8%, 5.2%, 19.6%, and 13.0%, respectively, at October 31, 2008). The performance of the Fund is directly affected by the performance of the Portfolios. A copy of each Portfolio's financial statements is available on the EDGAR Database on the Securities and Exchange Commission's website (www.sec.gov), at the Commission's public reference room in Washington, DC or upon request from the Fund's principal underwriter, Eaton Vance Distributors Inc. (EVD), by calling 1-800-225-6265.
The following is a summary of significant accounting policies of the Fund. The policies are in conformity with accounting principles generally accepted in the United States of America.
A Investment Valuation — The valuation policies common to the Portfolios are as follows: Equity securities listed on a U.S. securities exchange generally are valued at the last sale price on the day of valuation or, if no sales took place on such date, at the mean between the closing bid and asked prices therefore on the exchange where such securities are principally traded. Equity securities listed on the NASDAQ Global or Global Select Market generally are valued at the NASDAQ official closing price. Unlisted or listed securities for which closing sales prices or closing quotations are not available are valued at the mean between the latest available bid and asked prices or, in the case of preferred equity securities that are not listed or traded in the over-the-counter market, by an independent pricing service. Debt obligations, including listed securities and securities for which quotations are available, will normally be valued on the basis of market quotations provided by independent pricing services. The pricing services consider various factors relating to bonds and/or market transactions to determine market value. Short-term debt securities with a remaining maturity of sixty days or less are valued at amortized cost, which approximates market value. If short-term debt securities are acquired with a remaining maturity of more than sixty days, they will be valued by a pricing service. Exchange-traded options are valued at the last sale price for the day of valuation as quoted on any exchange on which the options are traded or, in the absence of sales on such date, at the mean between the closing bid and asked prices therefore. Over-the-counter options are valued based on broker quotations. Financia l futures contracts and options on financial futures contracts listed on commodity exchanges are valued based on the closing price on the primary exchange on which such contracts trade. Forward foreign currency exchange contracts are generally valued using prices supplied by a pricing vendor or dealers. Interest rate swaps are normally valued using valuations provided by a pricing vendor. Such vendor valuations are based on the present value of fixed and projected floating rate cash flows over the term of the swap contract. Future cash flows are discounted to their present value using swap curves provided by electronic data services or by broker/dealers. Credit default swaps are valued by a broker-dealer (usually the counterparty to the agreement). Sovereign credit default swaps, foreign interest rate swaps and over-the-counter currency options are valued by a pricing service. Foreign securities and currencies are valued in U.S. dollars, based on foreign currency exchange rate quotations supplied by an indep endent quotation service. The independent service uses a proprietary model to determine the exchange rate. Inputs to the model include reported trades and implied bid/ask spreads. The daily valuation of exchange-traded foreign securities generally is determined as of the close of trading on the principal
12
Eaton Vance Strategic Income Fund as of October 31, 2008
NOTES TO FINANCIAL STATEMENTS CONT'D
exchange on which such securities trade. Sovereign credit default swaps, foreign interest rate swaps and over-the-counter currency options are valued by a pricing service. Investments for which valuations or market quotations are not readily available are valued at fair value using methods determined in good faith by or at the direction of the Trustees of the Portfolios considering relevant factors, data and information including the market value of freely tradable securities of the same class in the principal market on which such securities are normally traded.
Additional valuation policies for Global Macro Portfolio, Emerging Markets Local Income Portfolio, Investment Portfolio and International Income Portfolio are as follows: Most seasoned, fixed rate 30-year mortgage-backed securities are valued through the use of the investment adviser's matrix pricing system, which takes into account bond prices, yield differentials, anticipated prepayments and interest rates provided by dealers. Short-term debt securities with remaining maturity of sixty days or less (excluding those that are non-U.S. dollar denominated which typically are valued by a pricing service or dealer quotes) are valued at amortized cost.
An additional investment valuation policy for Boston Income Portfolio, Floating Rate Portfolio and High Income Opportunities Portfolio is as follows: Interests in senior floating-rate loans (Senior Loans) for which reliable market quotations are readily available are valued generally at the average mean of bid and ask quotations obtained from an independent pricing service. Other Senior Loans are valued at fair value by the investment adviser under procedures approved by the Trustees. In fair valuing a Senior Loan, the investment adviser utilizes one or more of the following valuation techniques: (i) a matrix pricing approach that considers the yield on the Senior Loan relative to yields on other loan interests issued by companies of comparable credit quality; (ii) a comparison of the value of the borrower's outstanding equity and debt to that of comparable public companies; (iii) a discounted cash flow analysis; or (iv) when th e investment adviser believes it is likely that a borrower will be liquidated or sold, an analysis of the terms of such liquidation or sale. In certain cases, the investment adviser will use a combination of analytical methods to determine fair value, such as when only a portion of a borrower's assets are likely to be sold. In conducting its assessment and analyses for purposes of determining fair value of a Senior Loan, the investment adviser will use its discretion and judgment in considering and appraising relevant factors. Fair value determinations are made by the portfolio managers of the Portfolio based on information available to such
managers. The portfolio managers of other portfolios managed by the investment adviser that invest in Senior Loans may not possess the same information about a Senior Loan borrower as the portfolio managers of the Portfolio. At times, the fair value of a Senior Loan determined by the portfolio managers of other portfolios managed by the investment adviser that invest in Senior Loans may vary from the fair value of the same Senior Loan determined by the portfolio managers of the Portfolio. The fair value of each Senior Loan is periodically reviewed and approved by the investment adviser's Valuation Committee and by the Trustees based upon procedures approved by the Trustees. Junior Loans are valued in the same manner as Senior Loans.
In addition to investing in the Portfolios, the Fund may invest directly in securities. The valuation policies of the Fund are consistent with the valuation policies of the Portfolios.
The Portfolios may invest in Cash Management Portfolio (Cash Management), an affiliated investment company managed by Boston Management and Research (BMR), a subsidiary of EVM. Cash Management values its investment securities utilizing the amortized cost valuation technique permitted by Rule 2a-7 of the 1940 Act, pursuant to which Cash Management must comply with certain conditions. This technique involves initially valuing a portfolio security at its cost and thereafter assuming a constant amortization to maturity of any discount or premium. If amortized cost is determined not to approximate fair value, Cash Management may value its investment securities based on available market quotations provided by a pricing service.
B Income — The Fund's net investment income or loss includes of the Fund's pro-rata share of the net investment income or loss of the Portfolios, less all actual and accrued expenses of the Fund. Interest income on direct investments in securities is recorded on the basis of interest accrued, adjusted for amortization of premium or accretion of discount.
C Federal Taxes — The Fund's policy is to comply with the provisions of the Internal Revenue Code applicable to regulated investment companies and to distribute to shareholders each year substantially all of its net investment income, and all or substantially all of its net realized capital gains. Accordingly, no provision for federal income or excise tax is necessary.
At October 31, 2008, the Fund, for federal income tax purposes, had a capital loss carryforward of $50,616,244
13
Eaton Vance Strategic Income Fund as of October 31, 2008
NOTES TO FINANCIAL STATEMENTS CONT'D
which will reduce its taxable income arising from future net realized gains on investment transactions, if any, to the extent permitted by the Internal Revenue Code, and thus will reduce the amount of distributions to shareholders, which would otherwise be necessary to relieve the Fund of any liability for federal income or excise tax. Such capital loss carryforward will expire on October 31, 2009 ($9,854,300), October 31, 2010 ($14,208,464), October 31, 2011 ($1,234,272), October 31, 2012 ($2,342,991), October 31, 2014 ($1,560,737), October 31, 2015 ($227,470) and October 31, 2016 ($21,188,010).
As of October 31, 2008, the Fund had no uncertain tax positions that would require financial statement recognition, de-recognition, or disclosure. Each of the Fund's federal tax returns filed in the 3-year period ended October 31, 2008 remains subject to examination by the Internal Revenue Service.
D Expenses — The majority of expenses of the Trust are directly identifiable to an individual fund. Expenses which are not readily identifiable to a specific fund are allocated taking into consideration, among other things, the nature and type of expense and the relative size of the funds.
E Expense Reduction — State Street Bank and Trust Company (SSBT) serves as custodian of the Fund. Pursuant to the custodian agreement, SSBT receives a fee reduced by credits, which are determined based on the average daily cash balance the Fund maintains with SSBT. All credit balances, if any, used to reduce the Fund's custodian fees are reported as a reduction of expenses in the Statement of Operations.
F Use of Estimates — The preparation of the financial statements in conformity with accounting principles generally accepted in the United States of America requires management to make estimates and assumptions that affect the reported amounts of assets and liabilities at the date of the financial statements and the reported amounts of income and expense during the reporting period. Actual results could differ from those estimates.
G Indemnifications — Under the Trust's organizational documents, its officers and Trustees may be indemnified against certain liabilities and expenses arising out of the performance of their duties to the Fund, and shareholders are indemnified against personal liability for the obligations of the Trust. Additionally, in the normal course of business, the Fund enters into agreements with service providers that may contain
indemnification clauses. The Fund's maximum exposure under these arrangements is unknown as this would involve future claims that may be made against the Fund that have not yet occurred.
H Forward Foreign Currency Exchange Contracts — The Fund may enter into forward foreign currency exchange contracts for the purchase or sale of a specific foreign currency at a fixed price on a future date. The Fund enters into forward contracts for hedging purposes as well as non-hedging purposes. The forward foreign currency exchange contract is adjusted by the daily exchange rate of the underlying currency and any gains or losses are recorded as unrealized until such time as the contract has been closed or offset by another contract with the same broker for the same settlement date and currency. Risks may arise upon entering these contracts from the potential inability of counterparties to meet the terms of their contracts and from movements in the value of a foreign currency relative to the U.S. dollar.
I When-Issued Securities and Delayed Delivery Transactions — The Fund may purchase or sell securities on a delayed delivery or when-issued basis, including TBA (To Be Announced) securities. Payment and delivery may take place after the customary settlement period for that security. At the time the transaction is negotiated, the price of the security that will be delivered is fixed. The Fund maintains security positions for these commitments such that sufficient liquid assets will be available to make payments upon settlement. Securities purchased on a delayed delivery or when-issued basis are marked-to-market daily and begin earning interest on settlement date. Losses may arise due to changes in the market value of the underlying securities or if the counterparty does not perform under the contract.
J Other — Investment transactions are accounted for on a trade date basis. Realized gains and losses on investments sold are determined on the basis of identified cost. Dividends to shareholders are recorded on the ex-dividend date.
2 Distributions to Shareholders
The Fund declares dividends daily to shareholders of record at the time of declaration. Distributions are generally paid monthly. Distributions of realized capital gains (reduced by available capital loss carryforwards from prior years, if any) are made at least annually. Distributions are declared separately for each class of shares. Shareholders may reinvest income and capital
14
Eaton Vance Strategic Income Fund as of October 31, 2008
NOTES TO FINANCIAL STATEMENTS CONT'D
gain distributions in additional shares of the same class of the Fund at the net asset value as of the reinvestment date or, at the election of the shareholder, receive distributions in cash. The Fund distinguishes between distributions on a tax basis and a financial reporting basis. Accounting principles generally accepted in the United States of America require that only distributions in excess of tax basis earnings and profits be reported in the financial statements as a return of capital. Permanent differences between book and tax accounting relating to distributions are reclassified to paid-in capital.
The tax character of distributions declared for the years ended October 31, 2008 and October 31, 2007 was as follows:
| | | Year Ended October 31, | |
| | | 2008 | | 2007 | |
| Distributions declared from: | |
| Ordinary income | | $ | 85,614,435 | | | $ | 59,569,607 | | |
| Tax return of capital | | $ | 2,563,101 | | | $ | — | | |
During the year ended October 31, 2008, accumulated net realized loss was increased by $29,388,257, accumulated distributions in excess of net investment income was increased by $1,204,743, and paid-in capital was increased by $30,593,000 due to differences between book and tax accounting, primarily for mixed straddles, swap contracts, foreign currency gain (loss), premium amortization and paydown gain (loss). These reclassifications had no effect on the net assets or net asset value per share of the Fund.
As of October 31, 2008, the components of distributable earnings (accumulated losses) and unrealized appreciation (depreciation) on a tax basis were as follows:
| Capital loss carryforward | | $ | (50,616,244 | ) | |
| Unrealized depreciation | | $ | (188,231,995 | ) | |
| Other temporary differences | | $ | (2,424,527 | ) | |
The differences between components of distributable earnings (accumulated losses) on a tax basis and the amounts reflected in the Statement of Assets and Liabilities are primarily due to wash sales, swap contracts, financial futures contracts, the timing of recognizing distributions to shareholders, distributions from real estate investment trusts, premium amortization, partnership allocations and foreign currency transactions.
3 Investment Adviser Fee and Other Transactions with Affiliates
The investment adviser fee is earned by EVM as compensation for investment advisory services rendered to the Fund. The fee is computed at an annual rate of 0.615% of the Fund's average daily net assets which are not invested in other investment companies for which EVM or its affiliates serve as investment adviser or administrator ("Investable Assets") up to $500 million and is payable monthly. On net assets of $500 million and over that are invested in Investable Assets, the annual fee is reduced. To the extent the Fund's assets are invested in the Portfolios, the Fund is allocated its share of the Portfolios' adviser fee. The Portfolios have engaged BMR to render investment advisory services. For the year ended October 31, 2008, the Fund's allocated portion of the adviser fees paid by the Portfolios totaled $6,884,800 and the adviser fees paid by the Fund on Investable Assets amounted to $482,529. For the year ended October 31, 2008, the Fund's investment adviser fee, including the adviser fees allocated from the Portfolios, was 0.56% of the Fund's average daily net assets. EVM also serves as the administrator of the Fund, but receives no compensation.
EVM serves as the sub-transfer agent of the Fund and receives from the transfer agent an aggregate fee based upon the actual expenses incurred by EVM in the performance of these services. For the year ended October 31, 2008, EVM earned $46,983 in sub-transfer agent fees. The Fund was informed that EVD, an affiliate of EVM, received $184,510 as its portion of the sales charge on sales of Class A shares for the year ended October 31, 2008. EVD also received distribution and service fees from Class A, Class B and Class C shares (see Note 4) and contingent deferred sales charges (see Note 5).
Except for Trustees of the Fund and the Portfolios who are not members of EVM's or BMR's organizations, officers and Trustees receive remuneration for their services to the Fund out of the investment adviser fee. Certain officers and Trustees of the Fund and the Portfolios are officers of the above organizations.
4 Distribution Plans
The Fund has in effect a distribution plan for Class A shares (Class A Plan) pursuant to Rule 12b-1 under the 1940 Act. The Class A Plan provides that the Fund will pay EVD a distribution and service fee of 0.25% per annum of its average daily net assets attributable to Class A shares for distribution services and facilities
15
Eaton Vance Strategic Income Fund as of October 31, 2008
NOTES TO FINANCIAL STATEMENTS CONT'D
provided to the Fund by EVD, as well as for personal services and/or the maintenance of shareholder accounts. Distribution and service fees paid or accrued to EVD for the year ended October 31, 2008 amounted to $1,850,109 for Class A shares.
The Fund also has in effect distribution plans for Class B shares (Class B Plan) and Class C shares (Class C Plan) pursuant to Rule 12b-1 under the 1940 Act. The Class B and Class C Plans require the Fund to pay EVD amounts equal to 0.75% per annum of its average daily net assets attributable to Class B and Class C shares for providing ongoing distribution services and facilities to the Fund. The Fund will automatically discontinue payments to EVD during any period in which there are no outstanding Uncovered Distribution Charges, which are equivalent to the sum of (i) 5% and 6.25% of the aggregate amount received by the Fund for Class B and Class C shares sold, respectively, plus (ii) interest calculated by applying the rate of 1% over the prevailing prime rate to the outstanding balance of Uncovered Distribution Charges of EVD of each respective class, reduced by the aggregate amount of contingent deferred sales charges (see No te 5) and amounts theretofore paid or payable to EVD by each respective class. For the year ended October 31, 2008, the Fund paid or accrued to EVD $1,322,321 and $2,988,660 for Class B and Class C shares, respectively, representing 0.75% of the average daily net assets of Class B and Class C shares. At October 31, 2008, the amounts of Uncovered Distribution Charges of EVD calculated under the Class B and Class C Plans were approximately $42,535,000 and $33,189,000, respectively.
The Class B and Class C Plans also authorize the Fund to make payments of service fees to EVD, investment dealers and other persons in amounts not exceeding 0.25% per annum of its average daily net assets attributable to that class. Service fees paid or accrued are for personal services and/or the maintenance of shareholder accounts. They are separate and distinct from the sales commissions and distribution fees payable to EVD and, as such, are not subject to automatic discontinuance when there are no outstanding Uncovered Distribution Charges of EVD. Service fees paid or accrued for the year ended October 31, 2008 amounted to $440,774 and $996,220 for Class B and Class C shares, respectively.
5 Contingent Deferred Sales Charges
A contingent deferred sales charge (CDSC) generally is imposed on redemptions of Class B shares made within six years of purchase and on redemptions of Class C
shares made within one year of purchase. Class A shares may be subject to a 1% CDSC if redeemed within 18 months of purchase (depending on the circumstances of purchase). Generally, the CDSC is based upon the lower of the net asset value at date of redemption or date of purchase. No charge is levied on shares acquired by reinvestment of dividends or capital gain distributions. The CDSC for Class B shares is imposed at declining rates that begin at 5% in the case of redemptions in the first and second year after purchase, declining one percentage point each subsequent year. Class C shares are subject to a 1% CDSC if redeemed within one year of purchase. No CDSC is levied on shares which have been sold to EVM or its affiliates or to their respective employees or clients and may be waived under certain other limited conditions. CDSCs received on Class B and Class C redemptions are paid to EVD to reduce the amount of Uncovered Distr ibution Charges calculated under the Fund's Class B and Class C Plans. CDSCs received on Class B and Class C redemptions when no Uncovered Distribution Charges exist are credited to the Fund. For the year ended October 31, 2008, the Fund was informed that EVD received approximately $40,000, $521,000 and $233,000 of CDSCs paid by Class A, Class B and Class C shareholders, respectively.
6 Investment Transactions
For the year ended October 31, 2008, increases and decreases in the Fund's investment in the Portfolios were as follows:
| Portfolio | | Contributions | | Withdrawals | |
| Global Macro Portfolio | | $ | 162,234,162 | | | $ | 82,918,526 | | |
| Emerging Markets Local Income Portfolio | | | 15,414,005 | | | | 1,898,157 | | |
| International Income Portfolio | | | 6,155,970 | | | | 844,932 | | |
| High Income Opportunities Portfolio | | | 25,298,552 | | | | 929,740 | | |
| Investment Portfolio | | | 40,458,181 | | | | 23,013,410 | | |
| Floating Rate Portfolio | | | 175,206,884 | | | | 59,217,630 | | |
| Boston Income Portfolio | | | 8,800,000 | | | | — | | |
7 Purchases and Sales of Investments
Purchases and sales of investments of the Fund, other than short-term obligations and including maturities and paydowns, for the year ended October 31, 2008 were as follows:
| U.S. Government and Agency Securities | |
| Purchases | | $ | 122,795,041 | | |
| Sales | | | 5,897,218 | | |
16
Eaton Vance Strategic Income Fund as of October 31, 2008
NOTES TO FINANCIAL STATEMENTS CONT'D
8 Federal Income Tax Basis of Investments
The cost and unrealized appreciation (depreciation) of investments of the Fund at October 31, 2008, as determined on a federal income tax basis, were as follows:
| Aggregate cost | | $ | 1,527,467,270 | | |
| Gross unrealized appreciation | | $ | 163,439 | | |
| Gross unrealized depreciation | | | (188,242,961 | ) | |
| Net unrealized depreciation | | $ | (188,079,522 | ) | |
9 Financial Instruments
The Fund may trade in financial instruments with off-balance sheet risk in the normal course of its investing activities. These financial instruments may include forward foreign currency contracts and may involve, to a varying degree, elements of risk in excess of the amounts recognized for financial statement purposes. The notional or contractual amounts of these instruments represent the investment the Fund has in particular classes of financial instruments and does not necessarily represent the amounts potentially subject to risk. The measurement of the risks associated with these instruments is meaningful only when all related and offsetting transactions are considered.
A summary of obligations under these financial instruments at October 31, 2008 is as follows:
Forward Foreign Currency Exchange Contracts
Sales
| Settlement Date | | Deliver | | In Exchange For | | Net Unrealized
Depreciation | |
| 11/4/08 | | Euro | | United States Dollar | |
| |
| | | 30,220,000 | | | | 38,409,610 | | | $ | (107,281 | ) | |
11/12/08
| | Euro
30,220,000 | | United States Dollar
38,463,412 | | | (41,563 | ) | |
| | | $ | (148,844 | ) | |
Purchases
| Settlement Date | | In Exchange for | | Deliver | | Net Unrealized
Appreciation | |
| 11/4/08 | | Euro | | United States Dollar | |
| |
| | | 30,220,000 | | | | 38,485,170 | | | $ | 31,731 | | |
| | | $ | 31,731 | | |
At October 31, 2008, the Fund had sufficient cash and/or securities to cover commitments under these contracts.
10 Shares of Beneficial Interest
The Fund's Declaration of Trust permits the Trustees to issue an unlimited number of full and fractional shares of beneficial interest (without par value). Such shares may be issued in a number of different series (such as the Fund) and classes. Transactions in Fund shares were as follows:
| | | Year Ended October 31, | |
| Class A | | 2008 | | 2007 | |
| Sales | | | 62,028,040 | | | | 36,133,235 | | |
Issued to shareholders electing to receive
payments of distributions in Fund shares | | | 4,696,883 | | | | 2,614,322 | | |
| Redemptions | | | (33,427,139 | ) | | | (18,311,473 | ) | |
| Exchange from Class B shares | | | 1,631,070 | | | | 1,558,993 | | |
| Net increase | | | 34,928,854 | | | | 21,995,077 | | |
| | | Year Ended October 31, | |
| Class B | | 2008 | | 2007 | |
| Sales | | | 5,749,789 | | | | 3,819,059 | | |
Issued to shareholders electing to receive
payments of distributions in Fund shares | | | 730,153 | | | | 634,051 | | |
| Redemptions | | | (5,589,037 | ) | | | (4,995,212 | ) | |
| Exchange to Class A shares | | | (1,722,733 | ) | | | (1,646,768 | ) | |
| Net decrease | | | (831,828 | ) | | | (2,188,870 | ) | |
| | | Year Ended October 31, | |
| Class C | | 2008 | | 2007 | |
| Sales | | | 36,506,856 | | | | 17,241,126 | | |
Issued to shareholders electing to receive
payments of distributions in Fund shares | | | 1,992,657 | | | | 1,114,681 | | |
| Redemptions | | | (18,637,235 | ) | | | (7,609,311 | ) | |
| Net increase | | | 19,862,278 | | | | 10,746,496 | | |
17
Eaton Vance Strategic Income Fund as of October 31, 2008
NOTES TO FINANCIAL STATEMENTS CONT'D
11 Investment in Portfolios
For the year ended October 31, 2008, the Fund was allocated net investment income and realized and unrealized gain (loss) from the Portfolios as follows:
| | | Global
Macro
Portfolio | | Other
Portfolios | | Total | |
| Interest income (net of foreign taxes, $217,987 and $66,890 and $284,877, respectively) | | $ | 40,936,597 | | | $ | 37,765,188 | | | $ | 78,701,785 | | |
| Dividends | | | 45,551 | | | | 6,102 | | | | 51,653 | | |
| Expenses | | | (4,570,575 | ) | | | (3,998,631 | ) | | | (8,569,206 | ) | |
| Net investment income | | $ | 36,411,573 | | | $ | 33,772,659 | | | $ | 70,184,232 | | |
| Net realized gain (loss) — | |
| Investment transactions | | $ | 4,178,929 | | | $ | (7,734,169 | ) | | $ | (3,555,240 | ) | |
| Financial futures contracts | | | (763,880 | ) | | | 103,106 | | | | (660,774 | ) | |
| Swap contracts | | | 536,510 | | | | (386,611 | ) | | | 149,899 | | |
| Foreign currency and forward foreign currency exchange contract transactions | | | 2,465,078 | | | | 6,832,120 | | | | 9,297,198 | | |
| Net realized gain (loss) | | $ | 6,416,637 | | | $ | (1,185,554 | ) | | $ | 5,231,083 | | |
| Change in unrealized appreciation (depreciation) | |
| Investments | | $ | (40,952,670 | ) | | $ | (151,371,348 | ) | | $ | (192,324,018 | ) | |
| Financial futures contracts | | | 1,056,163 | | | | 43,835 | | | | 1,099,998 | | |
| Written Options | | | — | | | | (53,784 | ) | | | (53,784 | ) | |
| Swap contracts | | | 2,918,735 | | | | (406,957 | ) | | | 2,511,778 | | |
| Foreign currency and forward foreign currency exchange contracts | | | 8,221,573 | | | | 443,448 | | | | 8,665,021 | | |
| Net change in unrealized appreciation (depreciation) | | $ | (28,756,199 | ) | | $ | (151,344,806 | ) | | $ | (180,101,005 | ) | |
12 Recently Issued Accounting Pronouncements
In September 2006, the Financial Accounting Standards Board (FASB) issued Statement of Financial Accounting Standards No. 157 (FAS 157), "Fair Value Measurements". FAS 157 defines fair value, establishes a framework for measuring fair value in accordance with accounting principles generally accepted in the United States of America and expands disclosure about fair value measurements. FAS 157 is effective for fiscal years beginning after November 15, 2007. As of October 31, 2008, management does not believe the adoption of FAS 157 will impact the amounts reported in the financial statements; however, additional disclosures may be required about the inputs used to develop the measurements of fair value and the effect of certain of the measurements on changes in net assets for the period.
In March 2008, the FASB issued Statement of Financial Accounting Standards No. 161 (FAS 161), "Disclosures about Derivative Instruments and Hedging Activities". FAS 161 requires enhanced disclosures about an entity's derivative and hedging activities, including qualitative disclosures about the objectives and strategies for using derivatives, quantitative disclosures about fair value amounts of and gains and losses on derivative instruments, and disclosures about credit-risk related contingent features in derivative instruments. FAS 161 is effective for fiscal years and interim periods beginning after November 15, 2008. Management is currently evaluating the impact the adoption of FAS 161 will have on the Fund's financial statement disclosures.
18
Eaton Vance Strategic Income Fund as of October 31, 2008
REPORT OF INDEPENDENT REGISTERED PUBLIC ACCOUNTING FIRM
To the Trustees of Eaton Vance Mutual Funds Trust and Shareholders of Eaton Vance Strategic Income Fund:
We have audited the accompanying statement of assets and liabilities of Eaton Vance Strategic Income Fund (the "Fund") (one of the series of Eaton Vance Mutual Funds Trust), including the portfolio of investments, as of October 31, 2008, the related statement of operations for the year then ended, and the statements of changes in net assets and the financial highlights for each of the two years in the period then ended. These financial statements and financial highlights are the responsibility of the Fund's management. Our responsibility is to express an opinion on these financial statements and financial highlights based on our audits. The financial highlights for the year ended October 31, 2006, and all prior periods presented were audited by other auditors. Those auditors expressed an unqualified opinion on those financial highlights in their report dated December 27, 2006.
We conducted our audits in accordance with the standards of the Public Company Accounting Oversight Board (United States). Those standards require that we plan and perform the audit to obtain reasonable assurance about whether the financial statements and financial highlights are free of material misstatement. The Fund is not required to have, nor were we engaged to perform, an audit of its internal control over financial reporting. Our audits included consideration of internal control over financial reporting as a basis for designing audit procedures that are appropriate in the circumstances, but not for the purpose of expressing an opinion on the effectiveness of the Fund's internal control over financial reporting. Accordingly, we express no such opinion. An audit also includes examining, on a test basis, evidence supporting the amounts and disclosures in the financial statements, assessing the accounting principles used and significant estimates made by management, as well as evaluating the overall financial statement presentation. Our procedures included confirmation of securities owned as of October 31, 2008, by correspondence with the custodian and brokers; where replies were not received from brokers, we performed other auditing procedures. We believe that our audits provide a reasonable basis for our opinion.
In our opinion, the financial statements and financial highlights referred to above present fairly, in all material respects, the financial position of Eaton Vance Strategic Income Fund as of October 31, 2008, the results of its operations for the year then ended, and the changes in its net assets and the financial highlights for each of the two years in the period then ended, in conformity with accounting principles generally accepted in the United States of America.
DELOITTE & TOUCHE LLP
Boston, Massachusetts
December 18, 2008
19
Eaton Vance Strategic Income Fund as of October 31, 2008
FEDERAL TAX INFORMATION (Unaudited)
The Form 1099-DIV you receive in January 2009 will show the tax status of all distributions paid to your account in calendar 2008. Shareholders are advised to consult their own tax adviser with respect to the tax consequences of their investment in the Fund.
20
Eaton Vance Strategic Income Fund
SPECIAL MEETING OF SHAREHOLDERS (Unaudited)
The Fund held a Special Meeting of Shareholders on November 14, 2008 to elect Trustees. The results of the vote were as follows:
| | | Number of Shares | |
| Nominee for Trustee | | For | | Withheld | |
| Benjamin C. Esty | | | 181,557,795 | | | | 2,080,357 | | |
| Thomas E. Faust Jr. | | | 181,554,079 | | | | 2,084,072 | | |
| Allen R. Freedman | | | 181,552,369 | | | | 2,085,783 | | |
| William H. Park | | | 181,628,309 | | | | 2,009,843 | | |
| Ronald A. Pearlman | | | 181,563,157 | | | | 2,074,995 | | |
| Helen Frame Peters | | | 181,531,053 | | | | 2,107,099 | | |
| Heidi L. Steiger | | | 181,570,882 | | | | 2,067,270 | | |
| Lynn A. Stout | | | 181,633,994 | | | | 2,004,158 | | |
| Ralph F. Verni | | | 181,615,173 | | | | 2,022,979 | | |
Each nominee was also elected a Trustee of the following Portfolios: Boston Income Portfolio, Emerging Markets Local Income Portfolio, Floating Rate Portfolio, Global Macro Portfolio, High Income Opportunities Portfolio, International Income Portfolio and Investment Portfolio.
21
Eaton Vance Strategic Income Fund
BOARD OF TRUSTEES' ANNUAL APPROVAL OF THE INVESTMENT ADVISORY AGREEMENT
Overview of the Contract Review Process
The Investment Company Act of 1940, as amended (the "1940 Act"), provides, in substance, that each investment advisory agreement between a fund and its investment adviser will continue in effect from year to year only if its continuance is approved at least annually by the fund's board of trustees, including by a vote of a majority of the trustees who are not "interested persons" of the fund ("Independent Trustees"), cast in person at a meeting called for the purpose of considering such approval.
At a meeting of the Boards of Trustees (each a "Board") of the Eaton Vance group of mutual funds (the "Eaton Vance Funds") held on April 21, 2008, the Board, including a majority of the Independent Trustees, voted to approve continuation of existing advisory and sub-advisory agreements for the Eaton Vance Funds for an additional one-year period. In voting its approval, the Board relied upon the affirmative recommendation of the Contract Review Committee of the Board (formerly the Special Committee), which is a committee comprised exclusively of Independent Trustees. Prior to making its recommendation, the Contract Review Committee reviewed information furnished for a series of meetings of the Contract Review Committee held in February, March and April 2008. Such information included, among other things, the following:
Information about Fees, Performance and Expenses
• An independent report comparing the advisory and related fees paid by each fund with fees paid by comparable funds;
• An independent report comparing each fund's total expense ratio and its components to comparable funds;
• An independent report comparing the investment performance of each fund to the investment performance of comparable funds over various time periods;
• Data regarding investment performance in comparison to relevant peer groups of funds and appropriate indices;
• Comparative information concerning fees charged by each adviser for managing other mutual funds and institutional accounts using investment strategies and techniques similar to those used in managing the fund;
• Profitability analyses for each adviser with respect to each fund;
Information about Portfolio Management
• Descriptions of the investment management services provided to each fund, including the investment strategies and processes employed, and any changes in portfolio management processes and personnel;
• Information concerning the allocation of brokerage and the benefits received by each adviser as a result of brokerage allocation, including information concerning the acquisition of research through "soft dollar" benefits received in connection with the funds' brokerage, and the implementation of a soft dollar reimbursement program established with respect to the funds;
• Data relating to portfolio turnover rates of each fund;
• The procedures and processes used to determine the fair value of fund assets and actions taken to monitor and test the effectiveness of such procedures and processes;
Information about each Adviser
• Reports detailing the financial results and condition of each adviser;
• Descriptions of the qualifications, education and experience of the individual investment professionals whose responsibilities include portfolio management and investment research for the funds, and information relating to their compensation and responsibilities with respect to managing other mutual funds and investment accounts;
• Copies of the Codes of Ethics of each adviser and its affiliates, together with information relating to compliance with and the administration of such codes;
• Copies of or descriptions of each adviser's proxy voting policies and procedures;
• Information concerning the resources devoted to compliance efforts undertaken by each adviser and its affiliates on behalf of the funds (including descriptions of various compliance programs) and their record of compliance with investment policies and restrictions, including policies with respect to market-timing, late trading and selective portfolio disclosure, and with policies on personal securities transactions;
• Descriptions of the business continuity and disaster recovery plans of each adviser and its affiliates;
Other Relevant Information
• Information concerning the nature, cost and character of the administrative and other non-investment management services provided by Eaton Vance Management and its affiliates;
• Information concerning management of the relationship with the custodian, subcustodians and fund accountants by each adviser or the funds' administrator; and
• The terms of each advisory agreement.
22
Eaton Vance Strategic Income Fund
BOARD OF TRUSTEES' ANNUAL APPROVAL OF THE INVESTMENT ADVISORY AGREEMENT CONT'D
In addition to the information identified above, the Contract Review Committee considered information provided from time to time by each adviser throughout the year at meetings of the Board and its committees. Over the course of the twelve-month period ended April 30, 2008, the Board met eleven times and the Contract Review Committee, the Audit Committee and the Governance Committee, each of which is a Committee comprised solely of Independent Trustees, met twelve, seven and five times, respectively. At such meetings, the Trustees received, among other things, presentations by the portfolio managers and other investment professionals of each adviser relating to the investment performance of each fund and the investment strategies used in pursuing the fund's investment objective. The Portfolio Management Committee and the Compliance Reports and Regulatory Matters Committee are newly established and did not meet during the twelve- month period ended April 30, 2008.
For funds that invest through one or more underlying portfolios, the Board considered similar information about the portfolio(s) when considering the approval of advisory agreements. In addition, in cases where the fund's investment adviser has engaged a sub-adviser, the Board considered similar information about the sub-adviser when considering the approval of any sub-advisory agreement.
The Contract Review Committee was assisted throughout the contract review process by Goodwin Procter LLP, legal counsel for the Independent Trustees. The members of the Contract Review Committee relied upon the advice of such counsel and their own business judgment in determining the material factors to be considered in evaluating each advisory and sub-advisory agreement and the weight to be given to each such factor. The conclusions reached with respect to each advisory and sub-advisory agreement were based on a comprehensive evaluation of all the information provided and not any single factor. Moreover, each member of the Contract Review Committee may have placed varying emphasis on particular factors in reaching conclusions with respect to each advisory and sub-advisory agreement.
Results of the Process
Based on its consideration of the foregoing, and such other information as it deemed relevant, including the factors and conclusions described below, the Contract Review Committee concluded that the continuance of the investment advisory agreements of the Boston Income Portfolio, Emerging Markets Local Income Portfolio (formerly, Emerging Markets Income Portfolio), Floating Rate Portfolio, Global Macro Portfolio, High Income Opportunities Portfolio (formerly, High Income Portfolio), International Income Portfolio, Investment Grade Income Portfolio and Investment Portfolio (the "Underlying Funds"), the portfolios in which the Eaton Vance Strategic Income Fund (the "Fund") invests, each with Boston Management and Research ("BMR"), including their fee structure, are in the interests of shareholders and, therefore, the Contract Review Committee recommended to the Board approval of each agreement. The Board accepted the recommendatio n of the Contract Review Committee as well as the factors considered and conclusions reached by the Contract Review Committee with respect to each agreement. Accordingly, the Board, including a majority of the Independent Trustees, voted to approve continuation of the advisory agreements for the Underlying Funds. The Board noted that it had previously approved the Fund's investment advisory agreement with Eaton Vance Management ("EVM") dated as of June 22, 2007, which agreement will be considered for continuance in April 2009.
Nature, Extent and Quality of Services
In considering whether to approve the investment advisory agreements of the Underlying Funds, the Board evaluated the nature, extent and quality of services to be provided to the Underlying Funds by BMR.
The Board considered BMR's management capabilities and investment process with respect to the types of investments to be held by the Underlying Funds, including the education, experience and number of its investment professionals and other personnel who provide portfolio management, investment research, and similar services to the Underlying Funds. The Board noted BMR's in-house equity research capabilities. The Board also took into account the resources dedicated to portfolio management and other services, including the compensation paid to recruit and retain investment personnel, and the time and attention devoted to each of the Underlying Funds by senior management. In approving the advisory agreements, the Board noted that EVM would be responsible for periodic rebalancing of assets among the Underlying Funds and, potentially, for investing in other securities, but would not receive a separate fee from the Fund for the rebala ncing.
The Board also reviewed the compliance programs of BMR and relevant affiliates thereof. Among other matters, the Board considered compliance and reporting matters relating to personal trading by investment personnel, selective disclosure of portfolio holdings, late trading, frequent trading, portfolio valuation, business continuity and the allocation of investment opportunities. The Board also evaluated the responses of BMR and its affiliates to requests from regulatory authorities such as the Securities and Exchange Commission.
23
Eaton Vance Strategic Income Fund
BOARD OF TRUSTEES' ANNUAL APPROVAL OF THE INVESTMENT ADVISORY AGREEMENT CONT'D
The Board considered shareholder and other administrative services provided or managed by EVM and its affiliates, including transfer agency and accounting services. The Board evaluated the benefits to shareholders of investing in a fund that is a part of a large family of funds, including the ability, in many cases, to exchange an investment among different funds without incurring additional sales charges.
After consideration of the foregoing factors, among others, the Board concluded that the nature, extent and quality of services to be provided by BMR, taken as a whole, are appropriate and consistent with the terms of the investment advisory agreements.
Fund Performance
The Board compared the Fund's investment performance to a relevant universe of similarly managed funds identified by an independent data provider and appropriate benchmark indices. The Board reviewed comparative performance data for the one-, three- and five-year periods ended September 30, 2007 for the Fund. The Board also considered the performance of the Underlying Funds. The Board concluded that the Fund's performance was satisfactory.
Management Fees and Expenses
The Board reviewed contractual investment advisory fee rates payable by the Fund, directly or indirectly through its pro rata share of the expenses of the Underlying Funds (referred to as "management fees"). As part of its review, the Board considered the Fund's management fees and expense ratio for the year ended September 30, 2007, as compared to a group of similarly managed funds selected by an independent data provider. The Board noted that there is no separate advisory fee for assets invested in the Underlying Funds and that for assets the Fund invests indirectly, the advisory fee would approximate the total fees to be paid on the expected allocation among the Underlying Fund(s).
After reviewing the foregoing information, and in light of the nature, extent and quality of the services to be provided by BMR, the Board concluded that the management fees charged to the Fund for advisory and related services and the Fund's total expense ratio are reasonable.
Profitability
The Board reviewed the level of profits realized by BMR and EVM, and the relevant affiliates thereof, in providing investment advisory and administrative services to the Underlying Funds and all Eaton Vance Funds as a group. The Board considered the level of profits realized without regard to revenue sharing or other payments by BMR and its affiliates to third parties in respect of distribution services. The Board also considered other direct or indirect benefits received by BMR and its affiliates in connection with its relationship with the Fund and the Underlying Funds.
The Board concluded that, in light of the foregoing factors and the nature, extent and quality of the services rendered, the profits realized by BMR and its affiliates are reasonable.
Economies of Scale
In reviewing management fees, the Board also considered the extent to which BMR and its affiliates, on the one hand, and the Fund, on the other hand, can expect to realize benefits from economies of scale as the assets of the Fund increase. The Board noted the structure of the advisory fee, which includes breakpoints at several asset levels for assets directly held by the Fund and includes no separate advisory fee for assets invested in the Underlying Funds. The Board noted that for assets invested in Underlying Funds, the Fund will automatically receive the benefits of such breakpoints as have been established for the Underlying Funds based on their total assets. Based upon the foregoing, the Board concluded that BMR and its affiliates and the Fund can be expected to share such benefits equitably.
24
Eaton Vance Strategic Income Fund
MANAGEMENT AND ORGANIZATION
Fund Management. The Trustees of Eaton Vance Mutual Funds Trust (the Trust), Boston Income Portfolio (BIP), Emerging Markets Local Income Portfolio (EMLIP), Floating Rate Portfolio (FRP), Global Macro Portfolio (GMP), High Income Opportunities Portfolio (HIOP), International Income Portfolio (IIP), Investment Grade Income Portfolio (IGIP) and Investment Portfolio (IP) (collectively, the Portfolios) are responsible for the overall management and supervision of the Trust's and Portfolios' affairs. The Trustees and officers of the Trust and the Portfolios are listed below. Except as indicated, each individual has held the office shown or other offices in the same company for the last five years. Trustees and officers of the Trust and the Portfolios hold indefinite terms of office. The "noninterested Trustees" consist of those Trustees who are not "interested pe rsons" of the Trust and the Portfolios, as that term is defined under the 1940 Act. The business address of each Trustee and officer is The Eaton Vance Building, 255 State Street, Boston, Massachusetts 02109. As used below, "EVC" refers to Eaton Vance Corp., "EV" refers to Eaton Vance, Inc., "EVM" refers to Eaton Vance Management, "BMR" refers to Boston Management and Research, "Parametric" refers to Parametric Portfolio Associates and "EVD" refers to Eaton Vance Distributors, Inc. EVC and EV are the corporate parent and trustee, respectively, of EVM and BMR. EVD is the Fund's principal underwriter, the Portfolios' placement agent and a wholly-owned subsidiary of EVC. Each officer affiliated with Eaton Vance may hold a position with other Eaton Vance affiliates that is comparable to his or her position with EVM listed below.
Name and
Date of Birth | | Position(s)
with the
Trust and
the Portfolios | | Term of
Office and
Length of
Service | | Principal Occupation(s)
During Past Five Years | | Number of Portfolios
in Fund Complex
Overseen By
Trustee(1) | | Other Directorships Held | |
| Interested Trustee | | | | | | | | | | | | | |
|
Thomas E. Faust Jr.
5/31/58 | | Trustee and President of the Trust | | Trustee since 2007 and President of the Trust since 2002 | | Chairman, Chief Executive Officer and President of EVC, Director and President of EV, Chief Executive Officer and President of EVM and BMR, and Director of EVD. Trustee and/or Officer of 173 registered investment companies and 4 private companies managed by EVM or BMR. Mr. Faust is an interested person because of his positions with EVM, BMR, EVD, EVC and EV, which are affiliates of the Trust and Portfolios. | | | 173 | | | Director of EVC | |
|
| Noninterested Trustees | | | | | | | | | | | | | |
|
Benjamin C. Esty
1/2/63 | | Trustee | | Of the Trust, BIP, FRP, GMP, HIOP, IP and IGIP since 2005; of EMLIP and IIP since 2007 | | Roy and Elizabeth Simmons Professor of Business Administration, Harvard University Graduate School of Business Administration. | | | 173 | | | None | |
|
Allen R. Freedman
4/3/40 | | Trustee | | Since 2007 | | Former Chairman (2002-2004) and a Director (1983-2004) of Systems & Computer Technology Corp. (provider of software to higher education). Formerly, a Director of Loring Ward International (fund distributor) (2005-2007). Formerly, Chairman and a Director of Indus International Inc. (provider of enterprise management software to the power generating industry) (2005-2007). | | | 173 | | | Director of Assurant, Inc. and Stonemor Partners L.P. (owner and operator of cemeteries) | |
|
William H. Park
9/19/47 | | Trustee | | Of the Trust, BIP, FRP, GMP, HIOP, IP and IGIP since 2003; of EMLIP and IIP since 2007 | | Vice Chairman, Commercial Industrial Finance Corp. (specialty finance company) (since 2006). Formerly, President and Chief Executive Officer, Prizm Capital Management, LLC (investment management firm) (2002-2005). | | | 173 | | | None | |
|
Ronald A. Pearlman
7/10/40 | | Trustee | | Of the Trust, BIP, FRP, GMP, HIOP, IP and IGIP since 2003; of EMLIP and IIP since 2007 | | Professor of Law, Georgetown University Law Center. | | | 173 | | | None | |
|
Helen Frame Peters
3/22/48 | | Trustee | | Since 2008 | | Professor of Finance, Carroll School of Management, Boston College (since 2003), Adjunct Professor of Finance, Peking University, Beijing, China (since 2005). Formerly, Dean, Carroll School of Management, Boston College (2000-2003). | | | 173 | | | Director of Federal Home Loan Bank of Boston (a bank for banks) and BJ's Wholesale Clubs (wholesale club retailer); Trustee of SPDR Index Shares Funds and SPDR Series Trust (exchange traded funds) | |
|
25
Eaton Vance Strategic Income Fund
MANAGEMENT AND ORGANIZATION CONT'D
Name and
Date of Birth | | Position(s)
with the
Trust and
the Portfolios | | Term of
Office and
Length of
Service | | Principal Occupation(s)
During Past Five Years | | Number of Portfolios
in Fund Complex
Overseen By
Trustee(1) | | Other Directorships Held | |
| Noninterested Trustees (continued) | | | | | | | | | | | | | |
|
Heidi L. Steiger
7/8/53 | | Trustee | | Since 2007 | | Managing Partner, Topridge Associates LLC (global wealth management firm) (since 2008); Senior Advisor (since 2008), President (2005-2008), Lowenhaupt Global Advisors, LLC (global wealth management firm). Formerly, President and Contributing Editor, Worth Magazine (2004-2005). Formerly, Executive Vice President and Global Head of Private Asset Management (and various other positions), Neuberger Berman (investment firm) (1986-2004). | | | 173 | | | Director of Nuclear Electric Insurance Ltd. (nuclear insurance provider) and Aviva USA (insurance provider) | |
|
| Lynn A. Stout 9/14/57 | | Trustee | | Of the Trust, HIOP and GMP since 1998; of FRP and IGIP since 2000; of BIP since 2001; of IP since 2002; of EMLIP and IIP since 2007 | | Paul Hastings Professor of Corporate and Securities Law (since 2006) and Professor of Law (2001-2006), University of California at Los Angeles School of Law. | | | 173 | | | None | |
|
| Ralph F. Verni 1/26/43 | | Chairman of the Board and Class II Trustee | | Chairman of the Board since 2007. Trustee of the Trust, BIP, FRP, GMP, HIOP, IP and IGIP since 2005; of EMLIP and IIP since 2007 | | Consultant and private investor. | | | 173 | | | None | |
|
| Principal Officers who are not Trustees | | | | | | | |
|
Name and
Date of Birth | | Position(s)
with the
Trust and
the Portfolios | | Term of
Office and
Length of
Service | | Principal Occupation(s)
During Past Five Years | |
| William H. Ahern, Jr. 7/28/59 | | Vice President of the Trust | | Since 1995 | | Vice President of EVM and BMR. Officer of 75 registered investment companies managed by EVM or BMR. | |
|
John R. Baur
2/10/70 | | Vice President of the Trust, EMLIP, GMP and IIP | | Since 2007 | | Vice President of EVM and BMR. Previously, attended Johnson Graduate School of Management, Cornell University (2002-2005), and prior thereto he was an Account Team Representative in Singapore for Applied Materials Inc. Officer of 33 registered investment companies managed by EVM or BMR. | |
|
Michael A. Cirami
12/24/75 | | Vice President of the Trust, EMLIP, GMP and IIP | | Since 2007 | | Vice President of EVM and BMR. Previously, attended the University of Rochester William E. Simon Graduate School of Business Administration (2001-2003), and prior thereto he was a Team Leader for the Institutional Services Group for State Street Bank in Luxembourg. Officer of 33 registered investment companies managed by EVM or BMR. | |
|
| Cynthia J. Clemson 3/2/63 | | Vice President of the Trust | | Since 2005 | | Vice President of EVM and BMR. Officer of 90 registered investment companies managed by EVM or BMR. | |
|
| Charles B. Gaffney 12/4/72 | | Vice President of the Trust | | Since 2007 | | Vice President of EVM and BMR. Previously, Sector Portfolio Manager and Senior Equity Analyst of Brown Brothers Harriman (1997-2003). Officer of 30 registered investment companies managed by EVM or BMR. | |
|
| Thomas P. Huggins 3/7/66 | | Vice President of BIP and HIOP | | Of HIOP since 2000 and of BIP since 2001 | | Vice President of EVM and BMR. Officer of 4 registered investment companies managed by EVM or BMR. | |
|
26
Eaton Vance Strategic Income Fund
MANAGEMENT AND ORGANIZATION CONT'D
Name and
Date of Birth | | Position(s)
with the
Trust and
the Portfolios | | Term of
Office and
Length of
Service | | Principal Occupation(s)
During Past Five Years | |
| Principal Officers who are not Trustees (continued) | | | | | | | |
|
| Christine M. Johnston 11/9/72 | | Vice President of the Trust, EMLIP, IIP and IP | | Of the Trust, EMLIP and IIP since 2007, of IP since 2003 | | Vice President of EVM and BMR. Officer of 35 registered investment companies managed by EVM or BMR. | |
|
| Aamer Khan 6/7/60 | | Vice President of the Trust | | Since 2005 | | Vice President of EVM and BMR. Officer of 33 registered investment companies managed by EVM or BMR. | |
|
| Duke E. Laflamme 4/8/69 | | President of IGIP | | Since 2008(2) | | Vice President of EVM and BMR. Officer of 19 registered investment companies managed by EVM or BMR. | |
|
| Thomas H. Luster 4/8/62 | | Vice President of the Trust and IGIP | | Of the Trust since 2006 and of IGIP since 2002 | | Vice President of EVM and BMR. Officer of 51 registered investment companies managed by EVM or BMR. | |
|
| Robert B. MacIntosh 1/22/57 | | Vice President of the Trust | | Since 1998 | | Vice President of EVM and BMR. Officer of 90 registered investment companies managed by EVM or BMR. | |
|
| Scott H. Page 11/30/59 | | President of FRP | | Since 2007 | | Vice President of EVM and BMR. Officer of 11 registered investment companies managed by EVM or BMR. | |
|
| Duncan W. Richardson 10/26/57 | | Vice President of the Trust | | Since 2001 | | Executive Vice President and Chief Equity Investment Officer of EVC, EVM and BMR. Officer of 81 registered investment companies managed by EVM or BMR. | |
|
| Craig P. Russ 10/30/63 | | Vice President of FRP | | Since 2007 | | Vice President of EVM and BMR. Officer of 6 registered investment companies managed by EVM or BMR. | |
|
| Judith A. Saryan 8/21/54 | | Vice President of the Trust | | Since 2003 | | Vice President of EVM and BMR. Officer of 55 registered investment companies managed by EVM or BMR. | |
|
| Susan Schiff 3/13/61 | | Vice President of the Trust, EMLIP, GMP, IIP and IP | | Vice President of the Trust, GMP and IP since 2002; of EMLIP and IIP since 2007 | | Vice President of EVM and BMR. Officer of 36 registered investment companies managed by EVM or BMR. | |
|
| Thomas Seto 9/27/62 | | Vice President of the Trust | | Since 2007 | | Vice President and Director of Portfolio Management of Parametric. Officer of 31 registered investment companies managed by EVM or BMR. | |
|
| David M. Stein 5/4/51 | | Vice President of the Trust | | Since 2007 | | Managing Director and Chief Investment Officer of Parametric. Officer of 31 registered investment companies managed by EVM or BMR. | |
|
| Mark S. Venezia 5/23/49 | | Vice President of the Trust; President of EMLIP, GMP, IIP and IP | | Vice President of the Trust since 2007; President of GMP and IP since 2002; of EMLIP and IIP since 2007 | | Vice President of EVM and BMR. Officer of 36 registered investment companies managed by EVM or BMR. | |
|
| Adam A. Weigold 3/22/75 | | Vice President of the Trust | | Since 2007 | | Vice President of EVM and BMR. Officer of 71 registered investment companies managed by EVM or BMR. | |
|
| Michael W. Weilheimer 2/11/61 | | President of BIP and HIOP | | Since 2002 | | Vice President of EVM and BMR. Officer of 26 registered investment companies managed by EVM or BMR. | |
|
| Barbara E. Campbell 6/19/57 | | Treasurer | | Of the Trust since 2005 and of the Portfolios since 2008(3) | | Vice President of EVM and BMR. Officer of 173 registered investment companies managed by EVM or BMR. | |
|
| Maureen A. Gemma 5/24/60 | | Secretary and Chief Legal Officer | | Secretary since 2007 and Chief Legal Officer since 2008 | | Vice President of EVM and BMR. Officer of 173 registered investment companies managed by EVM or BMR. | |
|
27
Eaton Vance Strategic Income Fund
MANAGEMENT AND ORGANIZATION CONT'D
Name and
Date of Birth | | Position(s)
with the
Trust and
the Portfolios | | Term of
Office and
Length of
Service | | Principal Occupation(s)
During Past Five Years | |
| Principal Officers who are not Trustees (continued) | | | | | | | |
|
| Paul M. O'Neil 7/11/53 | | Chief Compliance Officer | | Of the Trust, BIP, FRP, GMP, HIOP, IGIP and IP since 2004; of EMLIP and IIP since 2007 | | Vice President of EVM and BMR. Officer of 173 registered investment companies managed by EVM or BMR. | |
|
(1) Includes both master and feeder funds in a master-feeder structure.
(2) Prior to 2008, Mr. Laflamme served as Vice President of IGIP since 2006.
(3) Prior to 2008, Ms. Campbell served as Assistant Treasurer of HIOP since 1993, GMP since 1998, FRP and IGIP since 2000, BIP since 2001, IP since 2002, and EMLIP and IIP since 2007.
The SAI for the Fund includes additional information about the Trustees and officers of the Fund and the Portfolios and can be obtained without charge on Eaton Vance's website at www.eatonvance.com or by calling 1-800-262-1122.
28
Investment Adviser and Administrator of Eaton Vance Strategic Income Fund
Eaton Vance Management
The Eaton Vance Building
255 State Street
Boston, MA 02109
Principal Underwriter
Eaton Vance Distributors, Inc.
The Eaton Vance Building
255 State Street
Boston, MA 02109
(617) 482-8260
Custodian
State Street Bank and Trust Company
200 Clarendon Street
Boston, MA 02116
Transfer Agent
PNC Global Investment Servicing
Attn: Eaton Vance Funds
P.O. Box 9653
Providence, RI 02940-9653
(800) 262-1122
Independent Registered Public Accounting Firm
Deloitte & Touche LLP
200 Berkeley Street
Boston, MA 02116-5022
Eaton Vance Strategic Income Fund
The Eaton Vance Building
255 State Street
Boston, MA 02109
This report must be preceded or accompanied by a current prospectus. Before investing, investors should consider carefully the Fund's investment
objective(s), risks, and charges and expenses. The Fund's current prospectus contains this and other information about the Fund and is available
through your financial advisor. Please read the prospectus carefully before you invest or send money. For further information please call 1-800-262-1122.
028-12/08 SISRC

Annual Report October 31, 2008


EATON VANCE
GLOBAL
MACRO
FUND
IMPORTANT NOTICES REGARDING PRIVACY,
DELIVERY OF SHAREHOLDER DOCUMENTS,
PORTFOLIO HOLDINGS AND PROXY VOTING
Privacy. The Eaton Vance organization is committed to ensuring your financial privacy. Each of the financial institutions identified below has in effect the following policy ("Privacy Policy") with respect to nonpublic personal information about its customers:
• Only such information received from you, through application forms or otherwise, and information about your Eaton Vance fund transactions will be collected. This may include information such as name, address, social security number, tax status, account balances and transactions.
• None of such information about you (or former customers) will be disclosed to anyone, except as permitted by law (which includes disclosure to employees necessary to service your account). In the normal course of servicing a customer's account, Eaton Vance may share information with unaffiliated third parties that perform various required services such as transfer agents, custodians and broker/dealers.
• Policies and procedures (including physical, electronic and procedural safeguards) are in place that are designed to protect the confidentiality of such information.
• We reserve the right to change our Privacy Policy at any time upon proper notification to you. Customers may want to review our Policy periodically for changes by accessing the link on our homepage: www.eatonvance.com.
Our pledge of privacy applies to the following entities within the Eaton Vance organization: the Eaton Vance Family of Funds, Eaton Vance Management, Eaton Vance Investment Counsel, Boston Management and Research, and Eaton Vance Distributors, Inc.
In addition, our Privacy Policy only applies to those Eaton Vance customers who are individuals and who have a direct relationship with us. If a customer's account (i.e., fund shares) is held in the name of a third-party financial adviser/ broker-dealer, it is likely that only such adviser's privacy policies apply to the customer. This notice supersedes all previously issued privacy disclosures.
For more information about Eaton Vance's Privacy Policy, please call 1-800-262-1122.
Delivery of Shareholder Documents. The Securities and Exchange Commission (the "SEC") permits funds to deliver only one copy of shareholder documents, including prospectuses, proxy statements and shareholder reports, to fund investors with multiple accounts at the same residential or post office box address. This practice is often called "householding" and it helps eliminate duplicate mailings to shareholders.
Eaton Vance, or your financial adviser, may household the mailing of your documents indefinitely unless you instruct Eaton Vance, or your financial adviser, otherwise.
If you would prefer that your Eaton Vance documents not be householded, please contact Eaton Vance at 1-800-262-1122, or contact your financial adviser.
Your instructions that householding not apply to delivery of your Eaton Vance documents will be effective within 30 days of receipt by Eaton Vance or your financial adviser.
Portfolio Holdings. Each Eaton Vance Fund and its underlying Portfolio (if applicable) will file a schedule of its portfolio holdings on Form N-Q with the SEC for the first and third quarters of each fiscal year. The Form N-Q will be available on the Eaton Vance website www.eatonvance.com, by calling Eaton Vance at 1-800-262-1122 or in the EDGAR database on the SEC's website at www.sec.gov. Form N-Q may also be reviewed and copied at the SEC's public reference room in Washington, D.C. (call 1-800-732-0330 for information on the operation of the public reference room).
Proxy Voting. From time to time, funds are required to vote proxies related to the securities held by the funds. The Eaton Vance Funds or their underlying Portfolios (if applicable) vote proxies according to a set of policies and procedures approved by the Funds' and Portfolios' Boards. You may obtain a description of these policies and procedures and information on how the Funds or Portfolios voted proxies relating to portfolio securities during the most recent 12 month period ended June 30, without charge, upon request, by calling 1-800-262-1122. This description is also available on the SEC's website at www.sec.gov.
Eaton Vance Global Macro Fund as of October 31, 2008
MANAGEMENT’S DISCUSSION OF FUND PERFORMANCE

Mark S. Venezia, CFA
Co-Portfolio Manager

John R. Baur
Co-Portfolio Manager

Michael A. Cirami, CFA
Co-Portfolio Manager
Economic and Market Conditions
· The credit crisis that began in mid-2007 resulted in unprecedented events in the U.S. financial markets in 2008. Within a two week period in September, investors saw the U.S. government’s bailout of the two largest government-sponsored enterprises – Fannie Mae and Freddie Mac, the bankruptcy of Lehman Brothers Holding, Inc., and the subsequent bailout of one of the world’s largest insurers amidst other government intervention and uncertainty surrounding the future of many of the largest U.S. financial institutions. As the crisis intensified in the last two months of the Fund’s fiscal year, the global fixed-income and currency markets reacted with a flight to quality. The U.S. dollar strengthened against the Euro and many emerging market currencies, and U.S. interest rates fell as foreign investors headed for the relative safety of U.S. Treasury bonds. For the year ended October 31, 2008, 2-year and 5-year U.S. Treasury yields fell 240 (2.40%) and 134 basis points (1.34%), respectively. The Fed Funds Target Rate started the year at 4.5% on October 31, 2007 and was cut to 1.0% by October 31, 2008. Many foreign central banks also cut their benchmark short-term interest rates in response to the global financial crisis, including the European Central Bank (ECB), Bank of Japan, Bank of England, and those of certain emerging market countries.
Management Discussion
· The Fund(1) seeks to provide total return through exposure to currencies and foreign and domestic interest rates and issuers. The Fund invests in fixed-income securities and derivatives instruments to gain exposure to foreign currencies and foreign and domestic issuers, interest rates and credit markets. Foreign exposures include both developed and emerging markets.
· The Fund slightly underperformed its benchmark, the Merrill Lynch 3-Month U.S. Treasury Bill Index, during the year.(3) The primary reason for the Fund’s underperformance was the adverse performance of some of its foreign currency positions. While emerging market investments fared relatively well in the first half of the year, they were an increasing drag on performance in the second half, as the global financial crisis deepened.
· Two major drivers of the Fund’s underperformance were positions in Iceland and the Latin American region. In addition, certain positions in Asia also contributed to underperformance, specifically, a short position in Japanese government bonds and a long Indonesian currency position. Iceland was the Fund’s worst performer. The Icelandic government seized the nation’s banks in October, as the banks collapsed under the weight of a falling currency and large debts abroad. In Latin America, the Fund’s position in Uruguay declined in value toward the end of the fiscal year in response to negative developments in Argentina, one of its major trading partners. The Fund’s position in Colombia also detracted from performance; despite relatively stable economic growth, the Colombian peso fared poorly,
Eaton Vance Global Macro Fund
Total Return Performance 10/31/07 – 10/31/08
Class A(2) | | 2.49 | % |
Class I(2) | | 2.69 | % |
Merrill Lynch 3-Month U.S. Treasury Bill Index(3) | | 2.72 | % |
Lipper Global Income Funds Average(3) | | -9.26 | % |
Please refer to page 3 for additional performance information.
(1) | The Fund currently invests in a separate registered investment company, Global Macro Portfolio (the Portfolio), with the same objective and policies as the Fund. References to investments are to the Portfolio’s holdings. |
(2) | These returns do not include the 4.75% maximum sales charge for the Fund’s Class A shares. If sales charges were deducted, the returns would be lower. Class I shares are offered to investors at net asset value. |
(3) | It is not possible to invest directly in an Index or Lipper Classification. The Index’s total return does not reflect the commissions or expenses that would have been incurred if an investor individually purchased or sold the securities represented in the Index. The Lipper average is the average total return, at net asset value, of the funds that are in the same Lipper Classification as the Fund. |
Past performance is no guarantee of future results. Returns are historical and are calculated by determining the percentage change in net asset value or offering price (as applicable) with all distributions reinvested. Investment return and principal value will fluctuate so that shares, when redeemed, may be worth more or less than their original cost. Performance is for the stated time period only; due to market volatility, the Fund’s current performance may be lower or higher than the quoted return. Absent an allocation of expenses to the administrator, the return would be lower. For performance as of the most recent month end, please refer to www.eatonvance.com.
Fund shares are not insured by the FDIC and are not deposits or other obligations of, or guaranteed by, any depository institution. Shares are subject to investment risks, including possible loss of principal invested.
1
as the government suspended its efforts to support it. The Fund’s position in Brazil also weakened; however, the country’s influence as an economic power in Latin America continued to grow.
· Although the Fund underperformed its benchmark, it produced a positive total return for the year ended October 31, 2008. The Fund benefited again this year from positions in countries with a relatively low correlation to the global economy, such as Egypt. The Fund’s positions in Egyptian T-bills were additive to performance, as Egypt benefited from an inflow of Middle East oil revenues. The government has encouraged a stronger pound as a weapon against inflation. Elsewhere, the Fund continued to benefit from a short South African Rand position, as well as a short equity position. The Rand declined to its lowest level in six years, as demand for gold and other precious metals fell amid the global economic downturn.
· Additionally, the Fund benefited from its positions in Eastern Europe, most notably Poland and Turkey. The Fund’s exposure to the Polish Zloty added to performance. The currency was helped by strong industrial production, an economic growth rate twice that of the Euro zone and continuing remittances from workers abroad. Investments in the Turkish Lira were also additive, as the Turkish central bank raised rates to fight inflation. The currency strengthened further late in the period, following a loan accord with the International Monetary Fund.
· Finally, in an unsettled bond market, the Fund’s investments in seasoned U.S. agency mortgage-backed securities (MBS) performed well. Yield spreads for seasoned U.S. agency MBS widened over U.S. Treasuries by nearly 200 basis points (2.00%). That was more than offset by a decline in 2-year U.S. Treasury bond yields of 240 basis points (2.40%), generating positive returns for the agency MBS sector.
· The Fund’s duration declined during the year, to 1.61 years at October 31, 2008 from 2.0 years at October 31, 2007. Duration is a measure of the sensitivity of a fund or a fixed-income security to changes in interest rates. A shorter duration instrument normally has less exposure to interest rate risk than longer duration instruments.
Portfolio Composition
Securities Holdings (excludes derivatives)(1)
By total net assets
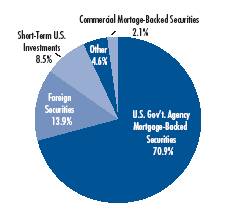
(1) | Securities Holdings reflect the Portfolio’s securities positions as of 10/31/08. Securities Holdings do not reflect derivatives positions. For International and Emerging Market exposures, please refer to the Regional Currency Exposures chart. |
Regional Currency Exposures (including derivatives)(2),(3)
By total net assets
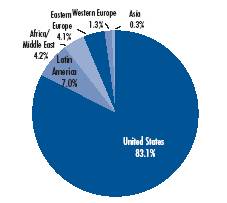
(2) | Regional Currency Exposures reflect the Portfolio’s exposures as of 10/31/08. Total exposure may exceed 100% due to implicit leverage created by derivatives. |
Currency Positions(3)
By total net assets
Poland | | 3.5 | % |
Mexico | | 2.9 | |
Nigeria | | 1.6 | |
Peru | | 1.4 | |
Iceland | | 1.3 | |
Mauritius | | 1.1 | |
Brazil | | 0.8 | |
Ghana | | 0.7 | |
Colombia | | 0.7 | |
Georgia | | 0.6 | |
Uruguay | | 0.5 | |
United Arab Emirates | | 0.5 | |
Chile | | 0.4 | |
Uganda | | 0.3 | |
Costa Rica | | 0.3 | |
Hong Kong | | 0.2 | |
South Korea | | 0.1 | |
(3) | Currency Positions reflect the Portfolio’s investments as of 10/31/08. Currency exposures and positions include all long foreign exchange denominated securities and all long currency derivatives. Net short currency positions and other foreign derivatives are excluded. Short currency exposures are 14.1%. Long foreign derivatives are 17.1%. Other short foreign derivatives are 22.1%. All numbers are a percentage of total net assets. Total exposures may exceed 100% due to implicit leverage created by derivatives. |
The views expressed throughout this report are those of the portfolio managers and are current only through the end of the period of the report as stated on the cover. These views are subject to change at any time based upon market or other conditions, and the investment adviser disclaims any responsibility to update such views. These views may not be relied on as investment advice and, because investment decisions for a fund are based on many factors, may not be relied on as an indication of trading intent on behalf of any Eaton Vance fund. Portfolio information provided in the report may not be representative of the Portfolio’s current or future investments and may change due to active management.
2
Eaton Vance Global Macro Fund as of October 31, 2008
FUND PERFORMANCE
The line graph and table set forth below provide information about the Fund’s performance. The line graph compares the performance of Class A and Class I of the Fund with that of the Merrill Lynch 3-Month U.S. Treasury Bill Index, an unmanaged market index of U.S. Treasury securities maturing in 90 days that assumes reinvestment of all income. The lines on the graph represent the total returns of a hypothetical investment of $10,000 in Class A and Class I of the Fund and in the Merrill Lynch 3-Month U.S. Treasury Bill Index. The table includes the total returns of each Class of the Fund at net asset value and maximum public offering price. The performance presented below does not reflect the deduction of taxes, if any, that a shareholder would pay on Fund distributions or the redemption of Fund shares.
Fund Performance(1)
| | Class A | | Class I | |
Share Class Symbols | | EAGMX | | EIGMX | |
| | | | | |
Average Annual Total Returns (at net asset value) | | | | | |
One year | | 2.49 | % | 2.69 | % |
Life of Fund† | | 5.22 | | 5.37 | |
| | | | | |
SEC Average Annual Total Returns (including sales charge or applicable CDSC) | | | | | |
One Year | | -2.38 | % | 2.69 | % |
Life of Fund† | | 1.48 | | 5.37 | |
† Inception Dates – Class A: 6/27/07; Class I: 6/27/07. |
|
(1) | Average Annual Total Returns do not include the 4.75% maximum sales charge for Class A shares. If sales charges were deducted, the returns would be lower. SEC Average Annual Total Returns for Class A reflect the maximum 4.75% sales charge. Class I shares are offered to investors at net asset value. |
Total Annual Operating Expenses(2)
| | Class A | | Class I | |
| | | | | |
Expense Ratio | | 1.05 | % | 0.75 | % |
(2) | From the Fund’s prospectus dated 3/1/08, as supplemented. |
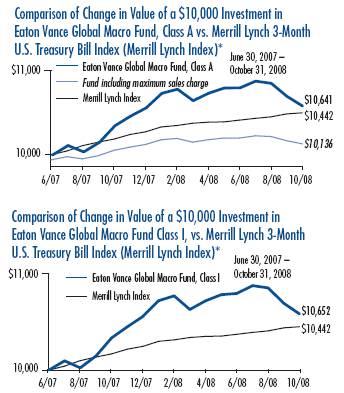
* | Sources: Lipper Inc. Class A and Class I of the Fund commenced operations on 6/27/07. Index data is available as of month end only. |
| |
| It is not possible to invest directly in an Index. The Index’s total return does not reflect the expenses that would have been incurred if an investor individually purchased or sold the securities represented in the Index. |
Past performance is no guarantee of future results. Returns are historical and are calculated by determining the percentage change in net asset value or offering price (as applicable) with all distributions reinvested. Investment return and principal value will fluctuate so that shares, when redeemed, may be worth more or less than their original cost. Performance is for the stated time period only; due to market volatility, the Fund’s current performance may be lower or higher than the quoted return. Absent an allocation of expenses to the administrator, the return would be lower. For performance as of the most recent month end, please refer to www.eatonvance.com.
3
Eaton Vance Global Macro Fund as of October 31, 2008
FUND EXPENSES
Example: As a shareholder of the Fund, you incur two types of costs: (1) transaction costs, including sales charges (loads) on purchases and redemption fees (if applicable); and (2) ongoing costs, including management fees; distribution or service fees; and other Fund expenses. This Example is intended to help you understand your ongoing costs (in dollars) of investing in the Fund and to compare these costs with the ongoing costs of investing in other mutual funds. The Example is based on an investment of $1,000 invested at the beginning of the period and held for the entire period (May 1, 2008 – October 31, 2008).
Actual Expenses: The first section of the table below provides information about actual account values and actual expenses. You may use the information in this section, together with the amount you invested, to estimate the expenses that you paid over the period. Simply divide your account value by $1,000 (for example, an $8,600 account value divided by $1,000 = 8.6), then multiply the result by the number in the first section under the heading entitled "Expenses Paid During Period" to estimate the expenses you paid on your account during this period.
Hypothetical Example for Comparison Purposes: The second section of the table below provides information about hypothetical account values and hypothetical expenses based on the actual Fund expense ratio and an assumed rate of return of 5% per year (before expenses), which is not the actual return of the Fund. The hypothetical account values and expenses may not be used to estimate the actual ending account balance or expenses you paid for the period. You may use this information to compare the ongoing costs of investing in your Fund and other funds. To do so, compare this 5% hypothetical example with the 5% hypothetical examples that appear in the shareholder reports of the other funds.
Please note that the expenses shown in the table are meant to highlight your ongoing costs only and do not reflect any transactional costs, such as sales charges (loads) or redemption fees (if applicable). Therefore, the second section of the table is useful in comparing ongoing costs only, and will not help you determine the relative total costs of owning different funds. In addition, if these transactional costs were included, your costs would have been higher.
Eaton Vance Global Macro Fund
| | | Beginning Account Value
(5/1/08) | | Ending Account Value
(10/31/08) | | Expenses Paid During Period*
(5/1/08 – 10/31/08) | |
| Actual | |
| Class A | | $ | 1,000.00 | | | $ | 984.50 | | | $ | 5.49 | ** | |
| Class I | | $ | 1,000.00 | | | $ | 985.90 | | | $ | 3.99 | ** | |
| Hypothetical | |
| (5% return per year before expenses) | |
| Class A | | $ | 1,000.00 | | | $ | 1,019.60 | | | $ | 5.58 | ** | |
| Class I | | $ | 1,000.00 | | | $ | 1,021.10 | | | $ | 4.06 | ** | |
* Expenses are equal to the Fund's annualized expense ratio of 1.10% for Class A shares and 0.80% for Class I shares, multiplied by the average account value over the period, multiplied by 184/366 (to reflect the one-half year period). The Example assumes that the $1,000 was invested at the net asset value per share determined at the close of business on April 30, 2008. The Example reflects the expenses of both the Fund and the Portfolio.
** Absent an allocation of expenses to the administrator, the expenses would have been higher.
4
Eaton Vance Global Macro Fund as of October 31, 2008
FINANCIAL STATEMENTS
Statement of Assets and Liabilities
As of October 31, 2008
| Assets | |
Investment in Global Macro Portfolio, at value
(identified cost, $56,349,635) | | $ | 54,290,883 | | |
| Receivable for Fund shares sold | | | 371,822 | | |
| Receivable from the administrator | | | 26,059 | | |
| Total assets | | $ | 54,688,764 | | |
| Liabilities | |
| Payable for Fund shares redeemed | | $ | 140,789 | | |
| Dividends payable | | | 35,530 | | |
| Payable to affiliate for distribution and service fees | | | 9,154 | | |
| Payable to affiliate for Trustees' fees | | | 255 | | |
| Accrued expenses | | | 34,919 | | |
| Total liabilities | | $ | 220,647 | | |
| Net Assets | | $ | 54,468,117 | | |
| Sources of Net Assets | |
| Paid-in capital | | $ | 56,913,828 | | |
Accumulated net realized gain from Portfolio (computed on the basis of
identified cost) | | | 48,156 | | |
| Accumulated distributions in excess of net investment income | | | (435,115 | ) | |
Net unrealized depreciation from Portfolio (computed on the basis of
identified cost) | | | (2,058,752 | ) | |
| Total | | $ | 54,468,117 | | |
| Class A Shares | |
| Net Assets | | $ | 38,177,584 | | |
| Shares Outstanding | | | 3,883,366 | | |
Net Asset Value and Redemption Price Per Share
(net assets ÷ shares of beneficial interest outstanding) | | $ | 9.83 | | |
Maximum Offering Price Per Share
(100 ÷ 95.25 of $9.83) | | $ | 10.32 | | |
| Class I Shares | |
| Net Assets | | $ | 16,290,533 | | |
| Shares Outstanding | | | 1,659,533 | | |
Net Asset Value, Offering Price and Redemption Price Per Share
(net assets ÷ shares of beneficial interest outstanding) | | $ | 9.82 | | |
| On sales of $25,000 or more, the offering price of Class A shares is reduced. | |
Statement of Operations
For the Year Ended
October 31, 2008
| Investment Income | |
| Interest allocated from Portfolio (net of foreign taxes, $5,494) | | $ | 1,159,240 | | |
| Dividends allocated from Portfolio | | | 1,295 | | |
| Expenses allocated from Portfolio | | | (130,262 | ) | |
| Net investment income from Portfolio | | $ | 1,030,273 | | |
| Expenses | |
| Trustees' fees and expenses | | $ | 505 | | |
Distribution and service fees
Class A | | | 45,527 | | |
| Legal and accounting services | | | 29,149 | | |
| Registration fees | | | 26,494 | | |
| Custodian fee | | | 17,997 | | |
| Transfer and dividend disbursing agent fees | | | 8,968 | | |
| Printing and postage | | | 3,248 | | |
| Miscellaneous | | | 6,941 | | |
| Total expenses | | $ | 138,829 | | |
Deduct —
Allocation of expenses to the administrator | | $ | 64,511 | | |
| Total expense reductions | | $ | 64,511 | | |
| Net expenses | | $ | 74,318 | | |
| Net investment income | | $ | 955,955 | | |
Realized and Unrealized
Gain (Loss) from Portfolio | |
Net realized gain (loss) —
Investment transactions (identified cost basis) | | $ | (35,390 | ) | |
| Financial futures contracts | | | (52,178 | ) | |
| Swap contracts | | | 141,285 | | |
| Foreign currency and forward foreign currency exchange contract transactions | | | (165,385 | ) | |
| Net realized loss | | $ | (111,668 | ) | |
Change in unrealized appreciation (depreciation) —
Investments (identified cost basis) | | $ | (2,920,836 | ) | |
| Financial futures contracts | | | 134,455 | | |
| Swap contracts | | | (2,893 | ) | |
| Foreign currency and forward foreign currency exchange contracts | | | 730,239 | | |
| Net change in unrealized appreciation (depreciation) | | $ | (2,059,035 | ) | |
| Net realized and unrealized loss | | $ | (2,170,703 | ) | |
| Net decrease in net assets from operations | | $ | (1,214,748 | ) | |
See notes to financial statements
5
Eaton Vance Global Macro Fund as of October 31, 2008
FINANCIAL STATEMENTS CONT'D
Statements of Changes in Net Assets
Increase (Decrease)
in Net Assets | | Year Ended
October 31, 2008 | | Period Ended
October 31, 2007(1) | |
From operations —
Net investment income | | $ | 955,955 | | | $ | 288 | | |
Net realized gain (loss) from
investment transactions,
financial futures contracts, swap
contracts, and foreign currency
and forward foreign currency
exchange contract transactions | | | (111,668 | ) | | | 267 | | |
Net change in unrealized appreciation
(depreciation) of investments,
financial futures contracts, swap
contracts, and foreign currency and
forward foreign currency
exchange contracts | | | (2,059,035 | ) | | | 283 | | |
Net increase (decrease) in net assets
from operations | | $ | (1,214,748 | ) | | $ | 838 | | |
Distributions to shareholders —
From net investment income
Class A | | $ | (803,464 | ) | | $ | (242 | ) | |
| Class I | | | (224,233 | ) | | | (235 | ) | |
From capital gains
Class A | | | | | | | (142,661 | ) | |
| Class I | | | (60,966 | ) | | | | | |
| Total distributions to shareholders | | $ | (1,231,324 | ) | | $ | (477 | ) | |
Transactions in shares of beneficial interest —
Proceeds from sale of shares
Class A | | $ | 42,583,546 | | | $ | 25,000 | | |
| Class I | | | 17,174,634 | | | | 10,000 | | |
Net asset value of shares issued to
shareholders in payment of
distributions declared
Class A | | | 879,628 | | | | 21 | | |
| Class I | | | 218,239 | | | | — | | |
Capital contribution from administrator
Class A | | | — | | | | 139 | | |
| Class I | | | — | | | | 56 | | |
Cost of shares redeemed
Class A | | | (3,496,420 | ) | | | — | | |
| Class I | | | (481,015 | ) | | | — | | |
Net increase in net assets from Fund
share transactions | | $ | 56,878,612 | | | $ | 35,216 | | |
| Net increase in net assets | | $ | 54,432,540 | | | $ | 35,577 | | |
| Net Assets | | Year Ended
October 31, 2008 | | Period Ended
October 31, 2007(1) | |
| At beginning of period | | $ | 35,577 | | | $ | — | | |
| At end of period | | $ | 54,468,117 | | | $ | 35,577 | | |
Accumulated undistributed
(distributions in excess of)
net investment income
included in net assets | |
| At end of period | | $ | (435,115 | ) | | $ | 2,652 | | |
(1) For the period from the start of business, June 27, 2007, to October 31, 2007.
See notes to financial statements
6
Eaton Vance Global Macro Fund as of October 31, 2008
FINANCIAL STATEMENTS CONT'D
Financial Highlights
| | | Class A | |
| | | Year Ended
October 31, 2008 | | Period Ended
October 31, 2007(1) | |
| Net asset value — Beginning of period | | $ | 10.220 | | | $ | 10.000 | | |
| Income (loss) from operations | |
| Net investment income(2) | | $ | 0.499 | | | $ | 0.123 | | |
| Net realized and unrealized gain (loss) | | | (0.247 | ) | | | 0.201 | | |
| Total income from operations | | $ | 0.252 | | | $ | 0.324 | | |
| Less distributions | |
| From net investment income | | $ | (0.605 | ) | | $ | (0.225 | ) | |
| From capital gains | | | (0.037 | ) | | | — | | |
| Total distributions | | $ | (0.642 | ) | | $ | (0.225 | ) | |
| Capital contribution from administrator | | $ | — | | | $ | 0.121 | | |
| Net asset value — End of period | | $ | 9.830 | | | $ | 10.220 | | |
| Total Return(3) | | | 2.49 | % | | | 4.50 | %(4)(9) | |
| Ratios/Supplemental Data | |
| Net assets, end of period (000's omitted) | | $ | 38,178 | | | $ | 25 | | |
| Ratios (As a percentage of average daily net assets): | |
| Expenses before custodian fee reduction(5)(6)(7) | | | 1.10 | % | | | 1.05 | %(8) | |
| Net investment income | | | 4.90 | % | | | 3.55 | %(8) | |
| Portfolio Turnover of the Portfolio | | | 26 | % | | | 45 | % | |
(1) For the period from the start of business, June 27, 2007, to October 31, 2007.
(2) Computed using average shares outstanding.
(3) Returns are historical and are calculated by determining the percentage change in net asset value with all distributions reinvested.
(4) Absent a capital contribution by the administrator for the period from the start of business, June 27, 2007, to October 31, 2007, total return would have been 3.99%.
(5) Includes the Fund's share of the Portfolio's allocated expenses.
(6) Excludes the effect of custody fee credits, if any, of less than 0.005%.
(7) The administrator subsidized certain operating expenses (equal to 0.33% and 673.39% of average daily net assets for the year ended October 31, 2008 and the period from the start of business, June 27, 2007, to October 31, 2007, respectively).
(8) Annualized.
(9) Not annualized.
See notes to financial statements
7
Eaton Vance Global Macro Fund as of October 31, 2008
FINANCIAL STATEMENTS CONT'D
Financial Highlights
| | | Class I | |
| | | Year Ended
October 31, 2008 | | Period Ended
October 31, 2007(1) | |
| Net asset value — Beginning of period | | $ | 10.210 | | | $ | 10.000 | | |
| Income (loss) from operations | |
| Net investment income(2) | | $ | 0.464 | | | $ | 0.146 | | |
| Net realized and unrealized gain (loss) | | | (0.181 | ) | | | 0.243 | | |
| Total income from operations | | $ | 0.283 | | | $ | 0.389 | | |
| Less distributions | |
| From net investment income | | $ | (0.636 | ) | | $ | (0.235 | ) | |
| From capital gains | | | (0.037 | ) | | | — | | |
| Total distributions | | $ | (0.673 | ) | | $ | (0.235 | ) | |
| Capital contribution from administrator | | $ | — | | | $ | 0.056 | | |
| Net asset value — End of period | | $ | 9.820 | | | $ | 10.210 | | |
| Total Return(3) | | | 2.69 | % | | | 4.50 | %(4)(9) | |
| Ratios/Supplemental Data | |
| Net assets, end of period (000's omitted) | | $ | 16,291 | | | $ | 10 | | |
| Ratios (As a percentage of average daily net assets): | |
| Expenses before custodian fee reduction(5)(6)(7) | | | 0.80 | % | | | 0.75 | %(8) | |
| Net investment income | | | 4.59 | % | | | 4.15 | %(8) | |
| Portfolio Turnover of the Portfolio | | | 26 | % | | | 45 | % | |
(1) For the period from the start of business, June 27, 2007, to October 31, 2007.
(2) Computed using average shares outstanding.
(3) Returns are historical and are calculated by determining the percentage change in net asset value with all distributions reinvested.
(4) Absent a capital contribution by the administrator for the period from the start of business, June 27, 2007, to October 31, 2007, total return would have been 3.99%.
(5) Includes the Fund's share of the Portfolio's allocated expenses.
(6) Excludes the effect of custody fee credits, if any, of less than 0.005%.
(7) The administrator subsidized certain operating expenses (equal to 0.33% and 673.39% of average daily net assets for the year ended October 31, 2008 and the period from the start of business, June 27, 2007, to October 31, 2007, respectively).
(8) Annualized.
(9) Not annualized.
See notes to financial statements
8
Eaton Vance Global Macro Fund as of October 31, 2008
NOTES TO FINANCIAL STATEMENTS
1 Significant Accounting Policies
Eaton Vance Global Macro Fund (the Fund) is a non-diversified series of Eaton Vance Mutual Funds Trust (the Trust). The Trust is a Massachusetts business trust registered under the Investment Company Act of 1940, as amended (the 1940 Act), as an open-end management investment company. The Fund offers two classes of shares. Class A shares are generally sold subject to a sales charge imposed at time of purchase. Class I shares are sold at net asset value and are not subject to a sales charge. Each class represents a pro-rata interest in the Fund, but votes separately on class-specific matters and (as noted below) is subject to different expenses. Realized and unrealized gains and losses are allocated daily to each class of shares based on the relative net assets of each class to the total net assets of the Fund. Net investment income, other than class-specific expenses, is allocated daily to each class of shares based upon the rat io of the value of each class's paid shares to the total value of all paid shares. Each class of shares differs in its distribution plan and certain other class-specific expenses. The Fund invests all of its investable assets in interests in Global Macro Portfolio (the Portfolio), a New York trust, having the same investment objective and policies as the Fund. The value of the Fund's investment in the Portfolio reflects the Fund's proportionate interest in the net assets of the Portfolio (6.4% at October 31, 2008). The performance of the Fund is directly affected by the performance of the Portfolio. The financial statements of the Portfolio, including the portfolio of investments, are included elsewhere in this report and should be read in conjunction with the Fund's financial statements.
The following is a summary of significant accounting policies of the Fund. The policies are in conformity with accounting principles generally accepted in the United States of America.
A Investment Valuation — Valuation of securities by the Portfolio is discussed in Note 1A of the Portfolio's Notes to Financial Statements, which are included elsewhere in this report.
B Income — The Fund's net investment income or loss consists of the Fund's pro-rata share of the net investment income or loss of the Portfolio, less all actual and accrued expenses of the Fund.
C Federal Taxes — The Fund's policy is to comply with the provisions of the Internal Revenue Code applicable to regulated investment companies and to distribute to shareholders each year substantially all of its net investment income, and all or substantially all of its net realized capital gains. Accordingly, no provision for federal income or excise tax is necessary.
During the year ended October 31, 2008, a capital loss carryforward of $2,455 was utilized to offset net realized gains by the Fund.
As of October 31, 2008, the Fund had no uncertain tax positions that would require financial statement recognition, de-recognition, or disclosure. Each of the Fund's federal tax returns filed since the start of business on June 27, 2007 to October 31, 2008 remains subject to examination by the Internal Revenue Service.
D Expenses — The majority of expenses of the Trust are directly identifiable to an individual fund. Expenses which are not readily identifiable to a specific fund are allocated taking into consideration, among other things, the nature and type of expense and the relative size of the funds.
E Expense Reduction — State Street Bank and Trust Company (SSBT) serves as custodian of the Fund. Pursuant to the custodian agreement, SSBT receives a fee reduced by credits, which are determined based on the average daily cash balance the Fund maintains with SSBT. All credit balances, if any, used to reduce the Fund's custodian fees are reported as a reduction of expenses in the Statement of Operations.
F Use of Estimates — The preparation of the financial statements in conformity with accounting principles generally accepted in the United States of America requires management to make estimates and assumptions that affect the reported amounts of assets and liabilities at the date of the financial statements and the reported amounts of income and expense during the reporting period. Actual results could differ from those estimates.
G Indemnifications — Under the Trust's organizational documents, its officers and Trustees may be indemnified against certain liabilities and expenses arising out of the performance of their duties to the Fund, and shareholders are indemnified against personal liability for the obligations of the Trust. Additionally, in the normal course of business, the Fund enters into agreements with service providers that may contain indemnification clauses. The Fund's maximum exposure under these arrangements is unknown as this would involve future claims that may be made against the Fund that have not yet occurred.
H Other — Investment transactions are accounted for on a trade date basis. Dividends to shareholders are recorded on the ex-dividend date.
9
Eaton Vance Global Macro Fund as of October 31, 2008
NOTES TO FINANCIAL STATEMENTS CONT'D
2 Distributions to Shareholders
The Fund declares dividends daily to shareholders of record at the time of declaration. Distributions are generally paid monthly. Distributions of realized capital gains (reduced by available capital loss carryforwards from prior years, if any) are made at least annually. Distributions are declared separately for each class of shares. Shareholders may reinvest income and capital gain distributions in additional shares of the same class of the Fund at the net asset value as of the reinvestment date or, at the election of the shareholder, receive distributions in cash. The Fund distinguishes between distributions on a tax basis and a financial reporting basis. Accounting principles generally accepted in the United States of America require that only distributions in excess of tax basis earnings and profits be reported in the financial statements as a return of capital. Permanent differences between book and tax accounting relating to distributions are reclassified to paid-in capital.
The tax character of distributions declared for the year ended October 31, 2008 and for the period from the start of business, June 27, 2007, to October 31, 2007 was as follows:
| | | Year Ended
October 31, 2008 | | Period Ended
October 31, 2007 | |
| Distributions declared from: | |
| Ordinary income | | $ | 1,027,697 | | | $ | 477 | | |
| Long-term capital gains | | $ | 203,627 | | | $ | — | | |
During the year ended October 31, 2008, accumulated net realized loss was decreased by $366,025 and accumulated distributions in excess of net investment income was increased by $366,025 due to differences between book and tax accounting, primarily for foreign currency gain (loss), swap contracts, premium amortization and paydown gain (loss). These reclassifications had no effect on the net assets or net asset value per share of the Fund.
As of October 31, 2008, the components of distributable earnings (accumulated losses) and unrealized appreciation (depreciation) on a tax basis were as follows:
| Undistributed long-term capital gains | | $ | 52,215 | | |
| Net unrealized depreciation | | $ | (2,462,396 | ) | |
| Other temporary differences | | $ | (35,530 | ) | |
The differences between components of distributable earnings (accumulated losses) on a tax basis and the amounts reflected in the Statement of Assets and Liabilities are primarily due to swap contracts, futures contracts, partnership allocations, premium amortization and the timing of recognizing distributions to shareholders.
3 Investment Adviser Fee and Other Transactions with Affiliates
The investment adviser fee is earned by Eaton Vance Management (EVM) as compensation for investment advisory services rendered to the Fund. The fee is computed at an annual rate of 0.615% of the Fund's average daily net assets that are not invested in other investment companies for which EVM or its affiliates serve as investment adviser or administrator ("Investable Assets") up to $500 million and is payable monthly. On net assets of $500 million and over that are invested in Investable Assets, the annual fee is reduced. For the year ended October 31, 2008, the Fund incurred no adviser fee on Investable Assets. To the extent the Fund's assets are invested in the Portfolio, the Fund is allocated its share of the Portfolio's adviser fee. The Portfolio has engaged Boston Management and Research (BMR), a subsidiary of EVM, to render investment advisory services. See Note 2 of the Portfolio's Notes to Financial Statements which are i ncluded elsewhere in this report. EVM also serves as the administrator to the Fund, but receives no compensation. EVM has agreed to reimburse the Fund's operating expenses to the extent that they exceed 1.10% and 0.80% annually of the Fund's average daily net assets attributable to Class A and Class I shares, respectively. This agreement may be changed or terminated after February 28, 2009. Pursuant to this agreement, EVM was allocated $64,511 of the Fund's operating expenses for the year ended October 31, 2008.
EVM serves as the sub-transfer agent of the Fund and receives from the transfer agent an aggregate fee based upon the actual expenses incurred by EVM in the performance of these services. For the year ended October 31, 2008, EVM earned $925 in sub-transfer agent fees. The Fund was informed that Eaton Vance Distributors, Inc. (EVD), an affiliate of EVM and the Fund's principal underwriter, received $2,399 as its portion of the sales charge on sales of Class A shares for the year ended October 31, 2008. EVD also received distribution and service fees from Class A shares (see Note 4).
Except for Trustees of the Fund and the Portfolio who are not members of EVM's or BMR's organizations, officers and Trustees receive remuneration for their services to the Fund out of the investment adviser fee. Certain officers and Trustees of the Fund and the Portfolio are officers of the above organizations.
4 Distribution Plan
The Fund has in effect a distribution plan for Class A shares (Class A Plan) pursuant to Rule 12b-1 under the 1940 Act. The Class A Plan provides that the Fund will pay EVD a distribution and service fee of 0.30% per annum of its average daily net assets attributable to Class A shares for distribution services and facilities provided to the Fund by
10
Eaton Vance Global Macro Fund as of October 31, 2008
NOTES TO FINANCIAL STATEMENTS CONT'D
EVD, as well as for personal services and/or the maintenance of shareholder accounts. Distribution and service fees paid or accrued to EVD for the year ended October 31, 2008 amounted to $45,527 for Class A shares.
5 Contingent Deferred Sales Charges
Class A shares may be subject to a 1% contingent deferred sales charge (CDSC) if redeemed within 18 months of purchase (depending on the circumstances of purchase). Generally, the CDSC is based upon the lower of the net asset value at date of redemption or date of purchase. No charge is levied on shares acquired by reinvestment of dividends or capital gain distributions. No CDSC is levied on shares which have been sold to EVM or its affiliates or to their respective employees or clients and may be waived under certain other limited conditions. For the year ended October 31, 2008, the Fund was informed that EVD received no CDSCs paid by Class A shareholders.
6 Investment Transactions
For the year ended October 31, 2008, increases and decreases in the Fund's investment in the Portfolio aggregated $59,386,258 and $3,982,236, respectively.
7 Shares of Beneficial Interest
The Fund's Declaration of Trust permits the Trustees to issue an unlimited number of full and fractional shares of beneficial interest (without par value). Such shares may be issued in a number of different series (such as the Fund) and classes. Transactions in Fund shares were as follows:
| Class A | | Year Ended
October 31, 2008 | | Period Ended
October 31, 2007(1) | |
| Sales | | | 4,139,596 | | | | 2,479 | | |
Issued to shareholders electing to
receive payments of distributions
in Fund shares | | | 86,745 | | | | 2 | | |
| Redemptions | | | (345,456 | ) | | | — | | |
| Net increase | | | 3,880,885 | | | | 2,481 | | |
| Class I | | Year Ended
October 31, 2008 | | Period Ended
October 31, 2007(1) | |
| Sales | | | 1,684,471 | | | | 1,000 | | |
Issued to shareholders electing to
receive payments of distributions
in Fund shares | | | 21,726 | | | | — | | |
| Redemptions | | | (47,664 | ) | | | — | | |
| Net increase | | | 1,658,533 | | | | 1,000 | | |
(1) For the period from the start of business, June 27, 2007, to October 31, 2007.
8 Recently Issued Accounting Pronouncements
In September 2006, the Financial Accounting Standards Board (FASB) issued Statement of Financial Accounting Standards No. 157 (FAS 157), "Fair Value Measurements". FAS 157 defines fair value, establishes a framework for measuring fair value in accordance with accounting principles generally accepted in the United States of America and expands disclosure about fair value measurements. FAS 157 is effective for fiscal years beginning after November 15, 2007. As of October 31, 2008, management does not believe the adoption of FAS 157 will impact the amounts reported in the financial statements; however, additional disclosures may be required about the inputs used to develop the measurements of fair value and the effect of certain of the measurements on changes in net assets for the period.
In March 2008, the FASB issued Statement of Financial Accounting Standards No. 161 (FAS 161), "Disclosures about Derivative Instruments and Hedging Activities". FAS 161 requires enhanced disclosures about an entity's derivative and hedging activities, including qualitative disclosures about the objectives and strategies for using derivatives, quantitative disclosures about fair value amounts of and gains and losses on derivative instruments, and disclosures about credit-risk related contingent features in derivative instruments. FAS 161 is effective for fiscal years and interim periods beginning after November 15, 2008. Management is currently evaluating the impact the adoption of FAS 161 will have on the Fund's financial statement disclosures.
11
Eaton Vance Global Macro Fund as of October 31, 2008
REPORT OF INDEPENDENT REGISTERED PUBLIC ACCOUNTING FIRM
To the Trustees of Eaton Vance Mutual Funds Trust and Shareholders of Eaton Vance Global Macro Fund:
We have audited the accompanying statement of assets and liabilities of Eaton Vance Global Macro Fund (the "Fund") (one of the series of Eaton Vance Mutual Funds Trust) as of October 31, 2008, the related statement of operations for the year then ended, and the statements of changes in net assets and the financial highlights for the year then ended and the period from the start of business, June 27, 2007, to October 31, 2007. These financial statements and financial highlights are the responsibility of the Fund's management. Our responsibility is to express an opinion on these financial statements and financial highlights based on our audits.
We conducted our audits in accordance with the standards of the Public Company Accounting Oversight Board (United States). Those standards require that we plan and perform the audit to obtain reasonable assurance about whether the financial statements and financial highlights are free of material misstatement. The Fund is not required to have, nor were we engaged to perform, an audit of its internal control over financial reporting. Our audits included consideration of internal control over financial reporting as a basis for designing audit procedures that are appropriate in the circumstances, but not for the purpose of expressing an opinion on the effectiveness of the Fund's internal control over financial reporting. Accordingly, we express no such opinion. An audit also includes examining, on a test basis, evidence supporting the amounts and disclosures in the financial statements, assessing the accounting principles used and significant estimates made by management, as well as evaluating the overall financial statement presentation. We believe that our audits provide a reasonable basis for our opinion.
In our opinion, the financial statements and financial highlights referred to above present fairly, in all material respects, the financial position of Eaton Vance Global Macro Fund as of October 31, 2008, the results of its operations for the year then ended, and the changes in its net assets and the financial highlights for the year then ended and the period from the start of business, June 27, 2007, to October 31, 2007, in conformity with accounting principles generally accepted in the United States of America.
DELOITTE & TOUCHE LLP
Boston, Massachusetts
December 18, 2008
12
Eaton Vance Global Macro Fund as of October 31, 2008
FEDERAL TAX INFORMATION (Unaudited)
The Form 1099-DIV you receive in January 2009 will show the tax status of all distributions paid to your account in calendar 2008. Shareholders are advised to consult their own tax adviser with respect to the tax consequences of their investment in the Fund.
Capital Gain Dividends — The Fund designates $203,627 as a capital gain dividend.
13
Global Macro Portfolio as of October 31, 2008
PORTFOLIO OF INVESTMENTS
| Foreign Government Bonds — 8.5% | |
| Security | | Principal | | U.S. $ Value | |
| Brazil — 1.9% | |
| Letra Tesouro Nacional, 0.00%, 1/1/09 | | BRL | 25,587,000 | | | $ | 11,556,908 | | |
| Nota Do Tesouro Nacional, 6.00%, 5/15/15(1) | | BRL | 11,004,556 | | | | 4,188,231 | | |
| Total Brazil (identified cost $20,649,824) | | | | | | $ | 15,745,139 | | |
| Costa Rica — 0.3% | |
| Titulo Propiedad Ud, 1.00%, 1/12/22(2) | | CRC | 2,137,993,200 | | | $ | 1,989,428 | | |
| Titulo Propiedad Ud, 1.63%, 7/13/16(3) | | CRC | 250,492,050 | | | | 234,202 | | |
| Total Costa Rica (identified cost $2,521,409) | | | | | | $ | 2,223,630 | | |
| Ecuador — 0.0% | |
| Republic of Ecuador, 10.00%, 8/15/30 | | USD | 765,000 | | | $ | 225,675 | | |
| Total Ecuador (identified cost $240,975) | | | | | | $ | 225,675 | | |
| Ivory Coast — 0.1% | |
| Ivory Coast, 4.00%, 3/31/28 | | USD | 2,296,000 | | | $ | 765,359 | | |
| Total Ivory Coast (identified cost $803,841) | | | | | | $ | 765,359 | | |
| Georgia — 2.0% | |
| Republic of Georgia, 7.50%, 4/15/13 | | USD | 23,384,000 | | | $ | 16,836,480 | | |
| Total Georgia (identified cost $17,996,901) | | | | | | $ | 16,836,480 | | |
| Ghana — 0.6% | |
| Ghanaian Government Bond, 13.00%, 8/2/10(4) | | GHS | 600,000 | | | $ | 455,596 | | |
| Ghanaian Government Bond, 13.50%, 3/30/10(4) | | GHS | 980,000 | | | | 768,202 | | |
| Ghanaian Government Bond, 13.67%, 6/11/12(4) | | GHS | 4,300,000 | | | | 3,008,348 | | |
| Ghanaian Government Bond, 13.69%, 3/15/10(4) | | GHS | 1,900,000 | | | | 1,496,593 | | |
| Total Ghana (identified cost $8,311,289) | | | | | | $ | 5,728,739 | | |
| Iceland — 0.5% | |
| Central Bank of Iceland, 17.75%, 3/25/09(10) | | ISK | 600,000,000 | | | $ | 3,962,627 | | |
| Total Iceland (identified cost $8,081,909) | | | | | | $ | 3,962,627 | | |
| Security | | Principal | | U.S. $ Value | |
| Indonesia — 0.2% | |
| Republic of Indonesia, 6.875%, 1/17/18 | | USD | 2,300,000 | | | $ | 1,508,082 | | |
| Total Indonesia (identified cost $1,581,250) | | | | | | $ | 1,508,082 | | |
| Kenya — 0.0% | |
| Kenyan Treasury Bond, 9.50%, 3/23/09 | | KES | 12,500,000 | | | $ | 157,675 | | |
| Total Kenya (identified cost $181,554) | | | | | | $ | 157,675 | | |
| Nigeria — 1.0% | |
| Nigerian Treasury Bond, 12.00%, 4/28/09 | | NGN | 523,213,000 | | | $ | 4,503,544 | | |
| Nigerian Treasury Bond, 17.00%, 12/16/08 | | NGN | 444,300,000 | | | | 3,811,430 | | |
| Total Nigeria (identified cost $7,976,009) | | | | | | $ | 8,314,974 | | |
| Peru — 1.0% | |
| Republic of Peru, 12.25%, 8/10/11 | | PEN | 24,833,000 | | | $ | 8,675,318 | | |
| Total Peru (identified cost $10,652,988) | | | | | | $ | 8,675,318 | | |
| Sri Lanka — 0.2% | |
| Republic of Sri Lanka, 11.50%, 11/1/08 | | LKR | 199,000,000 | | | $ | 1,805,885 | | |
| Total Sri Lanka (identified cost $1,844,728) | | | | | | $ | 1,805,885 | | |
| Turkey — 0.1% | |
| Republic of Turkey, 6.875%, 3/17/36 | | USD | 765,000 | | | $ | 524,025 | | |
| Total Turkey (identified cost $466,655) | | | | | | $ | 524,025 | | |
| Uruguay — 0.6% | |
| Republic of Uruguay, 5.00%, 9/14/18(5) | | UYU | 159,573,924 | | | $ | 4,512,673 | | |
| Republic of Uruguay, 7.875%, 1/15/33 | | USD | 765,000 | | | | 482,141 | | |
| Total Uruguay (identified cost $7,408,034) | | | | | | $ | 4,994,814 | | |
Total Foreign Government Bonds
(identified cost $88,717,366) | | | | | | $ | 71,468,422 | | |
See notes to financial statements
14
Global Macro Portfolio as of October 31, 2008
PORTFOLIO OF INVESTMENTS CONT'D
| Foreign Corporate Bonds — 0.7% | |
| Security | | Principal | | U.S. $ Value | |
| Chile — 0.3% | |
JP Morgan Chilean Inflation Linked Note,
3.80%, 11/17/15(6) | | USD | 3,547,686 | | | $ | 2,910,595 | | |
| Total Chile (identified cost $3,000,000) | | | | | | $ | 2,910,595 | | |
| Indonesia — 0.0% | |
| APP Finance VI, 0.00%, 11/18/12(8)(9) | | USD | 4,000,000 | | | $ | 20,000 | | |
| APP Finance VII, 3.50%, 4/30/24(8)(9) | | USD | 2,000,000 | | | | 10,000 | | |
| Total Indonesia (identified cost $2,910,368) | | | | | | $ | 30,000 | | |
| Kazakhstan — 0.4% | |
| Kazkommerts International, 7.875%, 4/7/14 | | USD | 7,500,000 | | | $ | 3,441,825 | | |
| Total Kazakhstan (identified cost $6,030,575) | | | | | | $ | 3,441,825 | | |
Total Foreign Corporate Bonds
(identified cost $11,940,943) | | | | | | $ | 6,382,420 | | |
| Debt Obligations — United States — 79.2% | |
| Security | | Principal | | U.S. $ Value | |
| Corporate Bonds and Notes — 0.2% | |
| Eaton Corp., 8.875%, 6/15/19 | | $ | 500,000 | | | $ | 548,285 | | |
| Ingersoll-Rand Co., 6.48%, 6/1/25 | | | 1,050,000 | | | | 874,969 | | |
Total Corporate Bonds and Notes
(identified cost $1,529,154) | | | | | | $ | 1,423,254 | | |
| Mortgage-Backed Securities — 78.8% | |
| Collateralized Mortgage Obligations — 11.2% | |
| Federal Home Loan Mortgage Corp.: | |
| Series 4, Class D, 8.00%, 12/25/22 | | $ | 506,281 | | | $ | 518,262 | | |
| Series 1548, Class Z, 7.00%, 7/15/23 | | | 684,999 | | | | 709,552 | | |
| Series 1650, Class K, 6.50%, 1/15/24 | | | 4,056,612 | | | | 4,083,264 | | |
| Series 1817, Class Z, 6.50%, 2/15/26 | | | 590,117 | | | | 599,714 | | |
| Series 1927, Class ZA, 6.50%, 1/15/27 | | | 2,278,919 | | | | 2,324,803 | | |
| Series 2127, Class PG, 6.25%, 2/15/29 | | | 2,711,481 | | | | 2,720,716 | | |
| | | $ | 10,956,311 | | |
| Federal National Mortgage Association: | |
| Series 1992-180, Class F, 4.40%, 10/25/22(10) | | $ | 2,341,882 | | | $ | 2,311,574 | | |
| Series 1993-16, Class Z, 7.50%, 2/25/23 | | | 2,211,466 | | | | 2,323,086 | | |
| Series 1993-79, Class PL, 7.00%, 6/25/23 | | | 1,703,351 | | | | 1,757,743 | | |
| Series 1993-104, Class ZB, 6.50%, 7/25/23 | | | 716,736 | | | | 734,074 | | |
| Series 1993-121, Class Z, 7.00%, 7/25/23 | | | 10,929,816 | | | | 11,277,983 | | |
| Security | | Principal | | U.S. $ Value | |
| Mortgage-Backed Securities (continued) | |
| Series 1993-141, Class Z, 7.00%, 8/25/23 | | $ | 1,740,416 | | | $ | 1,802,008 | | |
| Series 1994-42, Class ZQ, 7.00%, 4/25/24 | | | 10,749,755 | | | | 11,061,023 | | |
| Series 1994-63, Class PJ, 7.00%, 12/25/23 | | | 744,820 | | | | 748,262 | | |
| Series 1994-79, Class Z, 7.00%, 4/25/24 | | | 2,135,422 | | | | 2,201,293 | | |
| Series 1994-89, Class ZQ, 8.00%, 7/25/24 | | | 1,422,373 | | | | 1,511,531 | | |
| Series 1996-35, Class Z, 7.00%, 7/25/26 | | | 536,113 | | | | 549,792 | | |
| Series 1998-16, Class H, 7.00%, 4/18/28 | | | 1,625,638 | | | | 1,664,996 | | |
| Series 1999-25, Class Z, 6.00%, 6/25/29 | | | 4,981,966 | | | | 4,878,691 | | |
| Series 2000-2, Class ZE, 7.50%, 2/25/30 | | | 604,767 | | | | 631,810 | | |
| Series 2000-49, Class A, 8.00%, 3/18/27 | | | 1,761,748 | | | | 1,877,834 | | |
| Series 2001-37, Class GA, 8.00%, 7/25/16 | | | 230,918 | | | | 244,636 | | |
| Series G93-1, Class K, 6.675%, 1/25/23 | | | 2,448,489 | | | | 2,509,789 | | |
| Series G93-31, Class PN, 7.00%, 9/25/23 | | | 7,924,641 | | | | 8,181,991 | | |
| Series G93-41, Class ZQ, 7.00%, 12/25/23 | | | 15,593,180 | | | | 16,115,441 | | |
| | | $ | 72,383,557 | | |
| Government National Mortgage Association: | |
| Series 1996-22, Class Z, 7.00%, 10/16/26 | | $ | 1,391,548 | | | $ | 1,440,059 | | |
| Series 1999-42, Class Z, 8.00%, 11/16/29 | | | 3,581,862 | | | | 3,819,280 | | |
| Series 2001-35, Class K, 6.45%, 10/26/23 | | | 571,983 | | | | 579,113 | | |
| Series 2002-48, Class OC, 6.00%, 9/16/30 | | | 5,000,000 | | | | 5,088,256 | | |
| | | $ | 10,926,708 | | |
Total Collaterialized Mortgage Obligations
(identified cost $95,651,998) | | | | | | $ | 94,266,576 | | |
| Commercial Mortgage Backed Securities — 2.1% | |
JPMCC, Series 2005-LDP5, Class AM,
5.221%, 12/15/44(11) | | $ | 9,960,000 | | | $ | 6,823,976 | | |
MLMT, Series 2006-C2, Class A2,
5.756%, 8/12/43(11) | | | 7,000,000 | | | | 5,770,153 | | |
WBCMT, Series 2005-C17, Class A4,
5.083%, 3/15/42(11) | | | 6,000,000 | | | | 4,862,386 | | |
Total Commercial Mortgage Backed Securities
(identified cost $22,633,083) | | | | | | $ | 17,456,515 | | |
| Mortgage Pass-Throughs — 65.5% | |
| Federal Home Loan Mortgage Corp.: | |
| 4.471% with maturity at 2030(12) | | $ | 2,985,879 | | | $ | 2,982,431 | | |
| 5.00% with various maturities to 2019 | | | 13,644,695 | | | | 13,429,932 | | |
| 5.50% with maturity at 2013 | | | 14,957,536 | | | | 15,226,699 | | |
| 6.00% with maturity at 2024 | | | 5,219,378 | | | | 5,284,620 | | |
| 6.024% with maturity at 2023(12) | | | 1,037,381 | | | | 1,045,968 | | |
| 6.50% with various maturities to 2024 | | | 6,317,657 | | | | 6,538,680 | | |
| 7.00% with various maturities to 2031 | | | 6,881,425 | | | | 7,210,293 | | |
| 7.31% with maturity at 2026 | | | 447,831 | | | | 472,508 | | |
| 7.50% with various maturities to 2029 | | | 22,652,046 | | | | 24,050,654 | | |
| 7.95% with maturity at 2022 | | | 673,470 | | | | 723,489 | | |
| 8.00% with various maturities to 2030 | | | 3,799,180 | | | | 4,093,466 | | |
| 8.15% with maturity at 2021 | | | 412,595 | | | | 447,283 | | |
| 8.30% with maturity at 2021 | | | 315,801 | | | | 337,348 | | |
See notes to financial statements
15
Global Macro Portfolio as of October 31, 2008
PORTFOLIO OF INVESTMENTS CONT'D
| Security | | Principal | | U.S. $ Value | |
| Mortgage-Backed Securities (continued) | |
| 8.47% with maturity at 2018 | | $ | 364,386 | | | $ | 394,688 | | |
| 8.50% with various maturities to 2028 | | | 2,189,033 | | | | 2,395,488 | | |
| 9.00% with various maturities to 2027 | | | 4,315,848 | | | | 4,780,228 | | |
| 9.25% with various maturities to 2016 | | | 2,972 | | | | 2,979 | | |
| 9.50% with various maturities to 2027 | | | 408,332 | | | | 447,780 | | |
| 9.75% with various maturities to 2020 | | | 17,544 | | | | 19,184 | | |
| 10.00% with various maturities to 2020 | | | 1,586,090 | | | | 1,808,899 | | |
| 10.50% with maturity at 2021 | | | 674,276 | | | | 784,060 | | |
| 11.00% with maturity at 2016 | | | 1,107,565 | | | | 1,270,199 | | |
| 13.25% with maturity at 2013 | | | 1,424 | | | | 1,566 | | |
| | | $ | 93,748,442 | | |
| Federal National Mortgage Association: | |
| 3.948% with various maturities to 2035(12) | | $ | 38,002,666 | | | $ | 37,914,170 | | |
| 3.961% with maturity at 2022(12) | | | 3,855,282 | | | | 3,842,132 | | |
| 4.00% with maturity at 2035(12) | | | 8,886,217 | | | | 8,859,638 | | |
| 4.079% with various maturities to 2033(12) | | | 30,519,737 | | | | 30,413,290 | | |
| 4.098% with maturity at 2025(12) | | | 2,352,214 | | | | 2,351,226 | | |
| 4.298% with maturity at 2024(12) | | | 1,910,148 | | | | 1,917,399 | | |
| 4.366% with maturity at 2035 | | | 22,938,194 | | | | 22,858,873 | | |
| 5.00% with various maturities to 2018 | | | 35,572,246 | | | | 35,062,375 | | |
| 5.00% TBA with maturity at 2024 | | | 50,000,000 | | | | 48,754,030 | | |
| 5.50% with various maturities to 2018 | | | 6,086,742 | | | | 6,158,342 | | |
| 5.756% with maturity at 2023(12) | | | 213,778 | | | | 215,458 | | |
| 5.979% with maturity at 2028(12) | | | 353,397 | | | | 357,629 | | |
| 6.00% with maturity at 2030 | | | 6,797,820 | | | | 6,834,134 | | |
| 6.321% with maturity at 2032(12) | | | 6,958,815 | | | | 7,130,615 | | |
| 6.50% with various maturities to 2030 | | | 41,305,214 | | | | 42,476,033 | | |
| 6.85% with maturity at 2025(12) | | | 825,856 | | | | 856,825 | | |
| 7.00% with various maturities to 2032 | | | 42,149,862 | | | | 43,977,385 | | |
| 7.50% with various maturities to 2034 | | | 32,647,205 | | | | 34,566,677 | | |
| 8.00% with various maturities to 2030 | | | 13,113,299 | | | | 14,092,635 | | |
| 8.50% with various maturities to 2026 | | | 126,145 | | | | 137,075 | | |
| 9.00% with various maturities to 2027(11) | | | 1,550,228 | | | | 1,689,079 | | |
| 9.047% with maturity at 2028(11) | | | 1,234,938 | | | | 1,361,698 | | |
| 9.50% with various maturities to 2031 | | | 6,365,411 | | | | 6,993,834 | | |
| 10.50% with maturity at 2029 | | | 714,458 | | | | 836,541 | | |
| 11.00% with maturity at 2016 | | | 102,482 | | | | 110,590 | | |
| 11.023% with maturity at 2027(11) | | | 1,279,519 | | | | 1,477,756 | | |
| 11.50% with maturity at 2031 | | | 857,450 | | | | 1,035,332 | | |
| | | $ | 362,280,771 | | |
| Government National Mortgage Association: | |
| 5.125% with maturity at 2024(12) | | $ | 923,471 | | | $ | 912,016 | | |
| 6.50% with maturity at 2013 | | | 886,051 | | | | 921,999 | | |
| 7.00% with various maturities to 2033 | | | 33,137,585 | | | | 34,720,725 | | |
| 7.50% with various maturities to 2031 | | | 13,262,406 | | | | 14,103,783 | | |
| 7.75% with maturity at 2019 | | | 43,169 | | | | 46,269 | | |
| 8.00% with various maturities to 2034 | | | 37,538,637 | | | | 40,498,784 | | |
| 8.30% with various maturities to 2020 | | | 252,284 | | | | 271,250 | | |
| 8.50% with various maturities to 2021 | | | 2,571,095 | | | | 2,793,362 | | |
| 9.00% with various maturities to 2025 | | | 782,591 | | | | 865,016 | | |
| 9.50% with various maturities to 2026(13) | | | 2,587,640 | | | | 2,929,017 | | |
| | | $ | 98,062,221 | | |
| Security | | Principal | | U.S. $ Value | |
Total Mortgage Pass-Throughs
(identified cost $556,750,781) | | | | | | $ | 554,091,434 | | |
Total Mortgage-Backed Securities
(identified cost $675,035,862) | | | | | | $ | 665,814,525 | | |
| U.S. Treasury Obligations — 0.2% | |
| United States Treasury Bond, 7.875%, 2/15/21 | | $ | 1,500,000 | | | $ | 1,920,587 | | |
Total U.S. Treasury Obligations
(identified cost $1,783,745) | | | | | | $ | 1,920,587 | | |
Total Debt Obligations — United States
(identified cost $678,348,761) | | | | | | $ | 669,158,365 | | |
| Common Stocks — 0.1% | |
| Security | | Shares | | Value | |
| China — 0.1% | |
| Business Services — 0.0% | |
| APP China(7) | | | 8,155 | | | $ | 326,200 | | |
| | | $ | 326,200 | | |
| Commercial Banks — 0.1% | |
| Industrial and Commercial Bank of China | | | 2,191,752 | | | $ | 1,031,264 | | |
| | | $ | 1,031,264 | | |
| Total China (identified cost $2,395,650) | | | | | | $ | 1,357,464 | | |
Total Common Stocks
(identified cost $2,395,650) | | | | | | $ | 1,357,464 | | |
| Short-Term Investments — 15.2% | |
| Foreign Government Securities — 6.6% | |
| Security | | Principal Amount
(000's omitted) | | U.S. $ Value | |
| Georgia — 0.6% | |
| Bank of Georgia Group, 8.75%, 12/26/08(4) | | GEL | 7,525 | | | $ | 5,083,165 | | |
| Total Georgia (identified cost $5,310,425) | | | | | | $ | 5,083,165 | | |
See notes to financial statements
16
Global Macro Portfolio as of October 31, 2008
PORTFOLIO OF INVESTMENTS CONT'D
| Security | | Principal Amount
(000's omitted) | | U.S. $ Value | |
| Iceland — 2.3% | |
| Republic of Iceland, 8.50%, 12/12/08 | | ISK | 2,971,120 | | | $ | 19,445,308 | | |
| Total Iceland (identified cost $35,160,889) | | | | | | $ | 19,445,308 | | |
| Nigeria — 0.6% | |
| Nigerian Treasury Bill, 0.00%, 7/2/09 | | NGN | 145,000,000 | | | $ | 1,159,474 | | |
| Nigerian Treasury Bill, 0.00%, 9/3/09 | | NGN | 517,354 | | | | 4,070,297 | | |
| Total Nigeria (identified cost $5,215,702) | | | | | | $ | 5,229,771 | | |
| Peru — 3.1% | |
| Peru Certificates of Deposit, 0.00%, 11/6/08 | | PEN | 28,700 | | | $ | 9,323,479 | | |
| Peru Certificates of Deposit, 0.00%, 12/9/08 | | PEN | 14,100 | | | | 4,553,245 | | |
| Peru Certificates of Deposit, 0.00%, 1/5/09 | | PEN | 9,600 | | | | 3,084,334 | | |
| Peru Certificates of Deposit, 0.00%, 2/9/09 | | PEN | 29,800 | | | | 9,508,678 | | |
| Total Peru (identified cost $27,495,907) | | | | | | $ | 26,469,736 | | |
Total Foreign Government Securities
(identified cost $73,182,923) | | | | | | $ | 56,227,980 | | |
| Other Securities — 8.6% | |
| Description | | Interest/
Principal Amount
(000's omitted) | | U.S. $ Value | |
| Cash Management Portfolio, 1.90%(14) | | $ | 67,616 | | | $ | 67,615,620 | | |
State Street Bank and Trust Time Deposit,
0.50%, 11/3/08 | | | 4,590 | | | | 4,590,000 | | |
Total Other Securities
(identified cost $72,205,620) | | | | | | $ | 72,205,620 | | |
Total Short-Term Investments
(identified cost $145,388,543) | | | | | | $ | 128,433,600 | | |
| Currency Options Purchased — 0.1% | |
| Description | | Principal Amount of
Contracts
(000's omitted) | | Strike Price | | Expiration
Date | | U.S. $ Value | |
South Korean Won
Call Option | | KRW | 7,324,000 | | | | 915.5 | | | 6/2/09 | | $ | 182,441 | | |
| Euro Put Option | | EUR | 800 | | | | 1.3195 | | | 11/13/08 | | | 46,689 | | |
| Euro Put Option | | EUR | 800 | | | | 1.354 | | | 11/26/08 | | | 73,995 | | |
| Euro Put Option | | EUR | 800 | | | | 1.3506 | | | 12/11/08 | | | 76,157 | | |
| Euro Put Option | | EUR | 800 | | | | 1.327 | | | 1/8/09 | | | 68,785 | | |
| Euro Put Option | | EUR | 800 | | | | 1.3375 | | | 2/12/09 | | | 80,582 | | |
| Description | | Principal Amount of
Contracts
(000's omitted) | | Strike Price | | Expiration
Date | | U.S. $ Value | |
| Euro Put Option | | EUR | 800 | | | | 1.3705 | | | | 4/8/09 | | | $ | 104,472 | | |
| Euro Put Option | | EUR | 800 | | | | 1.3745 | | | | 5/13/09 | | | | 109,734 | | |
Total Currency Options Purchased
(identified cost $428,903) | | $ | 742,855 | | |
Total Investments — 103.8%
(identified cost $927,220,166) | | $ | 877,543,127 | | |
| Other Assets, Less Liabilities — (3.8)% | | $ | (32,522,225 | ) | |
| Net Assets — 100.0% | | $ | 845,020,902 | | |
TBA - (To Be Announced) securities are purchased on a forward commitment basis with an approximate principal amount and no definite maturity date. The actual principal amount and maturity date will be determined upon settlement when the specific mortgage pools are assigned.
BRL - Brazilian Real
CRC - Costa Rican Colon
EUR - Euro
GEL - Georgian Lari
GHS - Ghanaian Cedi
ISK - Icelandic Krona
KES - Kenyan Shilling
KRW - South Korean Won
LKR - Sri Lanka Rupee
NGN - Nigerian Naira
PEN - Peruvian New Sol
USD - United States Dollar
UYU - Uruguayan Peso
(1) Bond pays a 6.00% coupon on the face at the end of the payment period. Principal is adjusted based on the ICPA (Amplified Consumer Price Index) as determined by the Brazilian Institute of Geography and Statistics. The original face is BRL 6,281,000 and the current face is BRL 11,004,556.
(2) Bond pays a 1.00% coupon on the face at the end of the payment period. Principal is adjusted based on Development Units (Unidades de Desarrollo) as calculated by the General Superintendent of Values. The original face is CRC 1,834,400,000 and the current face is CRC 2,137,993,200.
(3) Bond pays a 1.63% coupon on the face at the end of the payment period. Principal is adjusted based on Development Units (Unidades de Desarrollo) as calculated by the General Superintendent of Values. The original face is CRC 204,500,000 and the current face is CRC 250,492,050.
(4) Security valued at fair value using methods determined in good faith by or at the direction of the Trustees.
See notes to financial statements
17
Global Macro Portfolio as of October 31, 2008
PORTFOLIO OF INVESTMENTS CONT'D
(5) Bond pays a coupon of 5.00% on the face at the end of the payment period. Principal grows with the Uruguayan inflation rate. Original face of the bond is UYU 135,030,000 and the current face is UYU 159,573,924.
(6) Bond pays a coupon of 3.80% on the face at the end of the payment period. Principal is adjusted based on changes in the Chilean UF (Unidad de Fomento) Rate. Original face of the bond is $3,000,000 and the current face is $3,547,686.
(7) Non-income producing security.
(8) Convertible bond.
(9) Defaulted security.
(10) Floating-rate security.
(11) Weighted average fixed-rate coupon that changes/updates monthly.
(12) Adjustable rate mortgage security. Rate shown is the rate at October 31, 2008.
(13) Security (or a portion thereof) has been segregated to cover margin requirements on open financial futures contracts.
(14) Affiliated investment company available to Eaton Vance portfolios and funds which invests in high quality, U.S. dollar denominated money market instruments. The rate shown is the annualized seven-day yield as of October 31, 2008.
See notes to financial statements
18
Global Macro Portfolio as of October 31, 2008
FINANCIAL STATEMENTS
Statement of Assets and Liabilities
As of October 31, 2008
| Assets | |
| Unaffiliated investments, at value (identified cost, $859,604,546) | | $ | 809,927,507 | | |
| Affiliated investment, at value (identified cost, $67,615,620) | | | 67,615,620 | | |
| Interest receivable | | | 7,161,170 | | |
| Interest receivable from affiliated investment | | | 85,456 | | |
| Receivable for investments sold | | | 73,421 | | |
| Receivable for daily variation margin on open financial futures contracts | | | 870,870 | | |
| Receivable for open forward foreign currency exchange contracts | | | 21,504,444 | | |
| Receivable for closed forward foreign currency exchange contracts | | | 1,403,661 | | |
| Receivable for open swap contracts | | | 14,235,191 | | |
| Receivable for closed options | | | 25,462 | | |
| Total assets | | $ | 922,902,802 | | |
| Liabilities | |
| Payable for investments purchased | | $ | 2,706,619 | | |
| Payable for when-issued securities | | | 49,631,944 | | |
| Due to custodian — foreign currency, at value (identified cost, $1,078,526) | | | 987,641 | | |
| Payable for open forward foreign currency exchange contracts | | | 6,308,800 | | |
| Payable for closed forward foreign currency exchange contracts | | | 1,575,223 | | |
| Payable for open swap contracts | | | 14,261,233 | | |
| Payable for closed swap contracts | | | 1,170,176 | | |
| Payable to affiliate for investment adviser fee | | | 434,175 | | |
| Payable to affiliate for Trustees' fees | | | 2,123 | | |
| Accrued expenses and other liabilities | | | 803,966 | | |
| Total liabilities | | $ | 77,881,900 | | |
| Net Assets applicable to investors' interest in Portfolio | | $ | 845,020,902 | | |
| Sources of Net Assets | |
| Net proceeds from capital contributions and withdrawals | | $ | 879,533,089 | | |
| Net unrealized depreciation (computed on the basis of identified cost) | | | (34,512,187 | ) | |
| Total | | $ | 845,020,902 | | |
Statement of Operations
For the Year Ended
October 31, 2008
| Investment Income | |
| Interest (net of foreign taxes, $263,007) | | $ | 47,716,955 | | |
| Dividends | | | 55,602 | | |
| Interest income allocated from affiliated investment | | | 1,813,814 | | |
| Expenses allocated from affiliated investment | | | (260,646 | ) | |
| Total investment income | | $ | 49,325,725 | | |
| Expenses | |
| Investment adviser fee | | $ | 4,843,386 | | |
| Trustees' fees and expenses | | | 23,628 | | |
| Custodian fee | | | 195,563 | | |
| Legal and accounting services | | | 182,865 | | |
| Miscellaneous | | | 24,338 | | |
| Total expenses | | $ | 5,269,780 | | |
Deduct —
Reduction of custodian fee | | $ | 300 | | |
| Total expense reductions | | $ | 300 | | |
| Net expenses | | $ | 5,269,480 | | |
| Net investment income | | $ | 44,056,245 | | |
| Realized and Unrealized Gain (Loss) | |
Net realized gain (loss) —
Investment transactions (identified cost basis) | | $ | 5,426,608 | | |
| Financial futures contracts | | | (980,637 | ) | |
| Swap contracts | | | 709,640 | | |
Foreign currency and forward foreign currency
exchange contract transactions | | | 2,672,926 | | |
| Net realized gain | | $ | 7,828,537 | | |
Change in unrealized appreciation (depreciation) —
Investments (identified cost basis) | | $ | (51,595,525 | ) | |
| Financial futures contracts | | | 1,410,666 | | |
| Swap contracts | | | 3,291,398 | | |
| Foreign currency and forward foreign currency exchange contracts | | | 10,397,691 | | |
| Net change in unrealized appreciation (depreciation) | | $ | (36,495,770 | ) | |
| Net realized and unrealized loss | | $ | (28,667,233 | ) | |
| Net increase in net assets from operations | | $ | 15,389,012 | | |
See notes to financial statements
19
Global Macro Portfolio as of October 31, 2008
FINANCIAL STATEMENTS CONT'D
Statements of Changes in Net Assets
Increase (Decrease)
in Net Assets | | Year Ended
October 31, 2008 | | Year Ended
October 31, 2007 | |
From operations —
Net investment income | | $ | 44,056,245 | | | $ | 33,560,082 | | |
Net realized gain from investment
transactions, financial futures
contracts, swap contracts, and
foreign currency and forward
foreign currency exchange
contract transactions | | | 7,828,537 | | | | 23,939,718 | | |
Net change in unrealized appreciation
(depreciation) of investments,
financial futures contracts, swap
contracts, and foreign currency and
forward foreign currency
exchange contracts | | | (36,495,770 | ) | | | 7,097,918 | | |
| Net increase in net assets from operations | | $ | 15,389,012 | | | $ | 64,597,718 | | |
Capital transactions —
Contributions | | $ | 275,977,287 | | | $ | 398,182,177 | | |
| Withdrawals | | | (134,738,001 | ) | | | (337,613,129 | ) | |
Net increase in net assets from
capital transactions | | $ | 141,239,286 | | | $ | 60,569,048 | | |
| Net increase in net assets | | $ | 156,628,298 | | | $ | 125,166,766 | | |
| Net Assets | |
| At beginning of year | | $ | 688,392,604 | | | $ | 563,225,838 | | |
| At end of year | | $ | 845,020,902 | | | $ | 688,392,604 | | |
See notes to financial statements
20
Global Macro Portfolio as of October 31, 2008
FINANCIAL STATEMENTS CONT'D
Supplementary Data
| | | Year Ended October 31, | |
| | | 2008 | | 2007 | | 2006 | | 2005 | | 2004 | |
| Ratios/Supplemental Data | |
| Ratios (As a percentage of average daily net assets): | |
| Expenses before custodian fee reduction(1) | | | 0.63 | % | | | 0.67 | % | | | 0.66 | % | | | 0.66 | % | | | 0.68 | % | |
| Net investment income | | | 5.25 | % | | | 5.16 | % | | | 4.49 | % | | | 3.23 | % | | | 3.10 | % | |
| Portfolio Turnover | | | 26 | % | | | 45 | % | | | 41 | % | | | 59 | % | | | 55 | % | |
| Total Return | | | 2.97 | % | | | 10.34 | % | | | 7.60 | % | | | 6.48 | % | | | 6.97 | % | |
| Net assets, end of year (000's omitted) | | $ | 845,021 | | | $ | 688,393 | | | $ | 563,226 | | | $ | 410,680 | | | $ | 323,944 | | |
(1) Excludes the effect of custody fee credits, if any, of less than than 0.005%.
See notes to financial statements
21
Global Macro Portfolio as of October 31, 2008
NOTES TO FINANCIAL STATEMENTS
1 Significant Accounting Policies
Global Macro Portfolio (the Portfolio) is a New York trust registered under the Investment Company Act of 1940, as amended (the 1940 Act), as a non-diversified, open-end management investment company. The Portfolio's investment objective is to seek total return. The Declaration of Trust permits the Trustees to issue interests in the Portfolio. At October 31, 2008, Eaton Vance Strategic Income Fund, Eaton Vance Global Macro Fund and Eaton Vance Medallion Strategic Income Fund held an interest of 80.6%, 6.4% and 10.7%, respectively, in the Portfolio.
The following is a summary of significant accounting policies of the Portfolio. The policies are in conformity with accounting principles generally accepted in the United States of America.
A Investment Valuation — Debt obligations, including listed securities and securities for which quotations are available, will normally be valued on the basis of market quotations provided by independent pricing services. The pricing services consider various factors relating to bonds and/or market transactions to determine market value. Most seasoned, fixed rate 30-year mortgage-backed securities are valued through the use of the investment adviser's matrix pricing system, which takes into account bond prices, yield differentials, anticipated prepayments and interest rates provided by dealers. Short-term debt securities with a remaining maturity of sixty days or less (excluding those that are non-U.S . dollar denominated, which typically are valued by a pricing service or dealer quotes) are valued at amortized cost, which approximates market value. If short-term debt securities are acquired with a remaining maturity of more than sixty days, they will be valued by a pricing service.
Equity securities listed on a U.S. securities exchange generally are valued at the last sale price on the day of valuation or, if no sales took place on such date, at the mean between the closing bid and asked prices therefore on the exchange where such securities are principally traded. Equity securities listed on the NASDAQ Global or Global Select Market generally are valued at the NASDAQ official closing price. Unlisted or listed securities for which closing sales prices or closing quotations are not available are valued at the mean between the latest available bid and asked prices or, in the case of preferred equity securities that are not listed or traded in the over-the-counter market, by an independent pricing service. Exchange-traded options are valued at the last sale price for the day of valuation as quoted on any exchange on which the options are traded or, in the absence of sales on such date, at the mean between the closing bid and asked prices therefore. Over-the-counter options are valued based on broker quotations. Financial futures contracts and options on financial futures contracts listed on commodity exchanges are valued based on the closing price on the primary exchange on which such contracts trade. Forward foreign currency exchange contracts are generally valued using prices supplied by a pricing vendor or dealers. Sovereign credit default swaps, foreign interest rate swaps and over-the-counter currency options are valued by a pricing service. Foreign securities and currencies are valued in U.S. dollars, based on foreign currency exchange rate quotations supplied by an independent quotation service. The independent service uses a proprietary model to determine the exchange rate. Inputs to the model include reported trades and implied bid/ask spreads. Investments for which valuations or market quotations are not readily available are value d at fair value using methods determined in good faith by or at the direction of the Trustees of the Portfolio considering relevant factors, data and information including the market value of freely tradable securities of the same class in the principal market on which such securities are normally traded.
The Portfolio may invest in Cash Management Portfolio (Cash Management), an affiliated investment company managed by Boston Management and Research (BMR), a subsidiary of Eaton Vance Management (EVM). Cash Management values its investment securities utilizing the amortized cost valuation technique permitted by Rule 2a-7 of the 1940 Act, pursuant to which Cash Management must comply with certain conditions. This technique involves initially valuing a portfolio security at its cost and thereafter assuming a constant amortization to maturity of any discount or premium. If amortized cost is determined not to approximate fair value, Cash Management may value its investment securities based on available market quotations provided by a pricing service.
B Investment Transactions — Investment transactions for financial statement purposes are accounted for on a trade date basis. Realized gains and losses on investments sold are determined on the basis of identified cost.
C Income — Interest income is recorded on the basis of interest accrued, adjusted for amortization of premium or accretion of discount. Dividend income is recorded on the ex-dividend date for dividends received in cash and/or securities. However, if the ex-dividend date has passed, certain dividends from foreign securities are recorded as the Portfolio is informed of the ex-dividend date. Withholding taxes on foreign dividends and capital gains have been provided for in accordance with the Portfolio's understanding of the applicable countries' tax rules and rates.
22
Global Macro Portfolio as of October 31, 2008
NOTES TO FINANCIAL STATEMENTS CONT'D
D Federal Taxes — The Portfolio has elected to be treated as a partnership for federal tax purposes. No provision is made by the Portfolio for federal or state taxes on any taxable income of the Portfolio because each investor in the Portfolio is ultimately responsible for the payment of any taxes on its share of taxable income. Since at least one of the Portfolio's investors is a regulated investment company that invests all or substantially all of its assets in the Portfolio, the Portfolio normally must satisfy the applicable source of income and diversification requirements (under the Internal Revenue Code) in order for its investors to satisfy them. The Portfolio will allocate, at least annually a mong its investors, each investor's distributive share of the Portfolio's net investment income, net realized capital gains and any other items of income, gain, loss, deduction or credit.
As of October 31, 2008, the Portfolio had no uncertain tax positions that would require financial statement recognition, de-recognition, or disclosure. Each of the Portfolio's federal tax returns filed in the 3-year period ended October 31, 2008 remains subject to examination by the Internal Revenue Service.
E Expense Reduction — State Street Bank and Trust Company (SSBT) serves as custodian of the Portfolio. Pursuant to the custodian agreement, SSBT receives a fee reduced by credits, which are determined based on the average daily cash balance the Portfolio maintains with SSBT. All credit balances, if any, used to reduce the Portfolio's custodian fees are reported as a reduction of expenses in the Statement of Operations.
F Foreign Currency Translation — Investment valuations, other assets, and liabilities initially expressed in foreign currencies are translated each business day into U.S. dollars based upon current exchange rates. Purchases and sales of foreign investment securities and income and expenses denominated in foreign currencies are translated into U.S. dollars based upon currency exchange rates in effect on the respective dates of such transactions. Recognized gains or losses on investment transactions attributable to changes in foreign currency exchange rates are recorded for financial statement purposes as net realized gains and losses on investments. That portion of unrealized gains and losses on invest ments that results from fluctuations in foreign currency exchange rates is not separately disclosed.
G Use of Estimates — The preparation of the financial statements in conformity with accounting principles generally accepted in the United States of America requires management to make estimates and assumptions that affect the reported amounts of assets and liabilities at the date of the financial statements and the reported amounts of income and expense during the reporting period. Actual results could differ from those estimates.
H Indemnifications — Under the Portfolio's organizational documents, its officers and Trustees may be indemnified against certain liabilities and expenses arising out of the performance of their duties to the Portfolio. Interestholders in the Portfolio are jointly and severally liable for the liabilities and obligations of the Portfolio in the event that the Portfolio fails to satisfy such liabilities and obligations; provided, however, that, to the extent assets are available in the Portfolio, the Portfolio may, under certain circumstances, indemnify interestholders from and against any claim or liability to which such holder may become subject by reason of being or having been an interestholder in t he Portfolio. Additionally, in the normal course of business, the Portfolio enters into agreements with service providers that may contain indemnification clauses. The Portfolio's maximum exposure under these arrangements is unknown as this would involve future claims that may be made against the Portfolio that have not yet occurred.
I Financial Futures Contracts — The Portfolio may enter into financial futures contracts. The Portfolio's investment in financial futures contracts is designed for hedging against changes in interest rates or as a substitute for the purchase of securities.Upon entering into a financial futures contract, the Portfolio is required to deposit with the broker, either in cash or securities an amount equal to a certain percentage of the purchase price (initial margin). Subsequent payments, known as variation margin, are made or received by the Portfolio each business day, depending on the daily fluctuations in the value of the underlying security, and are recorded as unrealized gains or losses by the Portfo lio. Gains (losses) are realized upon the expiration or closing of the financial futures contracts. Should market conditions change unexpectedly, the Portfolio may not achieve the anticipated benefits of the financial futures contracts and may realize a loss. In entering such contracts, the Portfolio bears the risk if the counterparties do not perform under the contracts' terms.
J Forward Foreign Currency Exchange Contracts — The Portfolio may enter into forward foreign currency exchange contracts for the purchase or sale of a specific foreign currency at a fixed price on a future date. The Portfolio enters into forward contracts for hedging purposes as well as non-hedging purposes. The forward foreign currency exchange contract is adjusted by the daily exchange rate of the underlying currency and any gains or losses are recorded as unrealized until such time as the contract has been closed or offset by another contract with the same broker for the same settlement date and
23
Global Macro Portfolio as of October 31, 2008
NOTES TO FINANCIAL STATEMENTS CONT'D
currency. Risks may arise upon entering these contracts from the potential inability of counterparties to meet the terms of their contracts and from movements in the value of a foreign currency relative to the U.S. dollar.
K Purchased Options — Upon the purchase of a call or put option, the premium paid by the Portfolio is included in the Statement of Assets and Liabilities as an investment. The amount of the investment is subsequently marked-to-market to reflect the current market value of the option purchased, in accordance with the Portfolio's policies on investment valuations discussed above. If an option which the Portfolio has purchased expires on the stipulated expiration date, the Portfolio will realize a loss in the amount of the cost of the option. If the Portfolio enters into a closing sale transaction, the Portfolio will realize a gain or loss, depending on whether the sales proceeds from the closing sale tr ansaction are greater or less than the cost of the option. If the Portfolio exercises a put option, it will realize a gain or loss from the sale of the underlying security, and the proceeds from such sale will be decreased by the premium originally paid. If the Portfolio exercises a call option, the cost of the security which the Portfolio purchases upon exercise will be increased by the premium originally paid.
L Interest Rate Swaps — The Portfolio may enter into interest rate swap agreements to enhance return, to hedge against fluctuations in securities prices or interest rates, or as substitution for the purchase or sale of securities. Pursuant to these agreements, the Portfolio either makes floating-rate payments based on a benchmark interest rate in exchange for fixed-rate payments or the Portfolio makes fixed-rate payments in exchange for payments on a floating benchmark interest rate. During the term of the outstanding swap agreement, changes in the underlying value of the swap are recorded as unrealized gains or losses. The value of the swap is determined by changes in the relationship between two rat es of interest. The Portfolio is exposed to credit loss in the event of non-performance by the swap counterparty. Risk may also arise from movements in interest rates.
M Credit Default Swaps — The Portfolio may enter into credit default swap contracts to buy or sell protection against default on an individual issuer or a basket of issuers of bonds. When the Portfolio is the buyer of a credit default swap contract, the Portfolio is entitled to receive the par (or other agreed-upon) value of a referenced debt obligation (or basket of debt obligations) from the counterparty to the contract in the event of default by a third party, such as a U.S. or foreign corporate issuer, on the debt obligation. In return, the Portfolio pays the counterparty a periodic stream of payments over the term of the contract provided that no event of default has occurred. If no default occur s, the Portfolio would have spent the stream of payments and received no benefits from the contract. When the Portfolio is the seller of a credit default swap contract, it receives the stream of payments, but is obligated to pay upon default of the referenced debt obligation. As the seller, the Portfolio effectively adds leverage to its portfolio because, in addition to its total net assets, the Portfolio is subject to investment exposure on the notional amount of the swap. The interest fee paid or received on the swap contract, which is based on a specified interest rate on a fixed notional amount, is accrued daily as a component of unrealized appreciation (depreciation) and is recorded as realized gain upon receipt or realized loss upon payment. The Portfolio also records an increase or decrease to unrealized appreciation (depreciation) in an amount equal to the daily valuation. Up-front payments or receipts, if any, are recorded as ot her assets or other liabilities, respectively, and amortized over the life of the swap contract as realized gains or losses. The Portfolio segregates assets in the form of cash and cash equivalents in an amount equal to the aggregate market value of the credit default swaps of which it is the seller, marked to market on a daily basis. These transactions involve certain risks, including the risk that the seller may be unable to fulfill the transaction.
N Total Return Swaps — The Portfolio may enter into swap agreements to enhance return, to hedge against fluctuations in securities prices or interest rates or as substitution for the purchase or sale of securities. In a total return swap, the Portfolio makes payments at a rate equal to a predetermined spread to the one or three month LIBOR. In exchange, the Portfolio receives payments based on the rate of return of a benchmark industry index or basket of securities. During the term of the outstanding swap agreement, changes in the underlying value of the swap are recorded as unrealized gains and losses. Periodic payments received or made are recorded as realized gains or losses. The value of the swap is determined by changes in the relationship between the rate of interest and the benchmark industry index or basket of securities. The Portfolio is exposed to credit loss in the event of nonperformance by the swap counterparty. Risk may also arise from the unanticipated movements in value of interest rates, securities, or the index.
O When-Issued Securities and Delayed Delivery Transactions — The Portfolio may purchase or sell securities on a delayed delivery or when-issued basis, including TBA (To Be Announced) securities. Payment and delivery may take place after the customary settlement period for that security. At the time the transaction is negotiated, the price of the security that will be delivered is fixed. The Portfolio maintains security positions for these commitments such that sufficient liquid assets will be available to make payments upon settlement. Securities purchased on a delayed delivery or when-issued basis are marked-to-market daily and begin earning interest
24
Global Macro Portfolio as of October 31, 2008
NOTES TO FINANCIAL STATEMENTS CONT'D
on settlement date. Losses may arise due to changes in the market value of the underlying securities or if the counterparty does not perform under the contract.
2 Investment Adviser Fee and Other Transactions with Affiliates
The investment adviser fee is earned by BMR as compensation for management and investment advisory services rendered to the Portfolio. The fee is computed at an annual rate of 0.615% of the Portfolio's average daily net assets up to $500 million, 0.595% from $500 million up to $1 billion and at reduced rates as daily net assets exceed that level, and is payable monthly. The portion of the adviser fee payable by Cash Management on the Portfolio's investment of cash therein is credited against the Portfolio's adviser fee. For the year ended October 31, 2008, the Portfolio's adviser fee totaled $5,091,334 of which $247,948 was allocated from Cash Management and $4,843,386 was paid or accrued directly by the Portfolio. For the year ended October 31, 2008, the Portfolio's adviser fee, including the portion allocated from Cash Management, was 0.61% of the Portfolio's average daily net assets.
Except for Trustees of the Portfolio who are not members of EVM's or BMR's organizations, officers and Trustees receive remuneration for their services to the Portfolio out of the investment adviser fee. Trustees of the Portfolio who are not affiliated with the investment adviser may elect to defer receipt of all or a percentage of their annual fees in accordance with the terms of the Trustees Deferred Compensation Plan. For the year ended October 31, 2008, no significant amounts have been deferred. Certain officers and Trustees of the Portfolio are officers of the above organizations.
3 Purchases and Sales of Investments
Purchases and sales of investments, other than short-term obligations and including maturities and paydowns, for the year ended October 31, 2008 were as follows:
| Purchases | |
| Investments (non-U.S. Government) | | $ | 63,100,541 | | |
| U.S. Government and Agency Securities | | | 268,215,537 | | |
| | | $ | 331,316,078 | | |
| Sales | |
| Investments (non-U.S. Government) | | $ | 41,481,520 | | |
| U.S. Government and Agency Securities | | | 119,838,050 | | |
| | | $ | 161,319,570 | | |
4 Federal Income Tax Basis of Investments
The cost and unrealized appreciation (depreciation) of investments of the Portfolio at October 31, 2008, as determined on a federal income tax basis, were as follows:
| Aggregate cost | | $ | 934,430,267 | | |
| Gross unrealized appreciation | | $ | 1,764,346 | | |
| Gross unrealized depreciation | | | (58,651,486 | ) | |
| Net unrealized depreciation | | $ | (56,887,140 | ) | |
The net unrealized appreciation on futures contracts, swaps, and foreign currency and forward foreign currency exchange contracts at October 31, 2008 on a federal income tax basis was $14,993,290.
5 Financial Instruments
The Portfolio may trade in financial instruments with off-balance sheet risk in the normal course of its investing activities. These financial instruments may include forward foreign currency contracts, financial futures contracts and swaps, and may involve, to a varying degree, elements of risk in excess of the amounts recognized for financial statement purposes. The notional or contractual amounts of these instruments represent the investment the Portfolio has in particular classes of financial instruments and does not necessarily represent the amounts potentially subject to risk. The measurement of the risks associated with these instruments is meaningful only when all related and offsetting transactions are considered.
A summary of obligations under these financial instruments at October 31, 2008 is as follows:
Forward Foreign Currency Exchange Contracts
Sales
| Settlement Date(s) | | Deliver | | In Exchange For | | Net Unrealized
Appreciation
(Depreciation) | |
1/05/09
| | Brazilian Real
35,580,991 | | United States Dollar
19,047,640 | | $ | 2,919,547 | | |
12/22/08
| | Croatia Kuna
23,766,000 | | Euro
3,273,554 | | | (13,924 | ) | |
1/26/09
| | Croatia Kuna
12,815,500 | | Euro
1,752,427 | | | (11,649 | ) | |
11/03/08
| | Euro
831,561 | | United States Dollar
1,052,400 | | | (7,466 | ) | |
11/04/08
| | Euro
800,000 | | United States Dollar
1,035,200 | | | 15,560 | | |
11/04/08
| | Euro
6,500,000 | | United States Dollar
8,261,500 | | | (23,075 | ) | |
25
Global Macro Portfolio as of October 31, 2008
NOTES TO FINANCIAL STATEMENTS CONT'D
| Settlement Date | | Deliver | | In Exchange For | | Net Unrealized
Appreciation
(Depreciation) | |
11/06/08
| | Euro
8,962,498 | | United States Dollar
12,323,435 | | $ | 901,164 | | |
11/12/08
| | Euro
7,300,000 | | United States Dollar
9,291,294 | | | (10,040 | ) | |
11/14/08
| | Euro
3,750,151 | | United States Dollar
4,782,193 | | | 4,288 | | |
11/03/08
| | Ghanian Cedi
66,150 | | United States Dollar
56,059 | | | (407 | ) | |
12/12/08
| | Icelandic Krona
2,111,929,478 | | United States Dollar
26,942,529 | | | 12,994,549 | | |
11/24/08
| | Indonesian Rupiah
85,590,000,000 | | United States Dollar
6,686,719 | | | (799,287 | ) | |
11/06/08
| | Israeli Shekel
15,940,000 | | United States Dollar
4,248,174 | | | (42,115 | ) | |
11/10/08
| | Malaysian Ringgit
31,545,000 | | United States Dollar
9,003,853 | | | 121,491 | | |
11/28/08
| | Malaysian Ringgit
31,014,000 | | United States Dollar
8,660,709 | | | (69,038 | ) | |
11/03/08
| | Mauritian Rupee
222,200,000 | | United States Dollar
7,053,968 | | | 142,615 | | |
11/04/08
| | New Turkish Lira
6,927,975 | | United States Dollar
4,111,558 | | | (375,076 | ) | |
11/28/08
| | New Zealand Dollar
6,503,002 | | United States Dollar
3,787,999 | | | 12,772 | | |
11/06/08
| | Peruvian New Sol
14,100,000 | | United States Dollar
4,789,402 | | | 205,438 | | |
11/10/08
| | Peruvian New Sol
14,600,000 | | United States Dollar
4,956,714 | | | 213,096 | | |
12/11/08
| | Peruvian New Sol
14,100,000 | | United States Dollar
4,789,402 | | | 228,906 | | |
2/09/09
| | Peruvian New Sol
29,800,000 | | United States Dollar
10,088,016 | | | 525,339 | | |
11/10/08
| | Philippine Peso
426,700,000 | | United States Dollar
8,845,357 | | | 162,356 | | |
11/03/08
| | Polish Zloty
28,642,375 | | Euro
8,063,732 | | | (74,912 | ) | |
11/05/08
| | South African Rand
64,737,400 | | United States Dollar
5,847,739 | | | (773,160 | ) | |
11/07/08
| | South African Rand
125,771,407 | | United States Dollar
12,316,644 | | | (539,205 | ) | |
11/03/08
| | Sri Lanka Rupee
210,442,500 | | United States Dollar
1,877,610 | | | (32,465 | ) | |
11/28/08
| | Taiwan Dollar
328,236,000 | | United States Dollar
9,876,512 | | | (108,005 | ) | |
12/26/08
| | Taiwan Dollar
297,240,000 | | United States Dollar
8,888,490 | | | (165,812 | ) | |
| Settlement Date | | Deliver | | In Exchange For | | Net Unrealized
Appreciation
(Depreciation) | |
1/21/09
| | Taiwan Dollar
252,400,000 | | United States Dollar
7,763,765 | | $ | 68,643 | | |
11/28/08
| | Thai Baht
610,000,000 | | United States Dollar
17,463,498 | | | 119,171 | | |
11/04/08
| | Zambian Kwacha
7,930,000,000 | | United States Dollar
1,667,767 | | | (106,282 | ) | |
11/07/08
| | Zambian Kwacha
7,930,000,000 | | United States Dollar
1,683,294 | | | (89,269 | ) | |
1/15/09
| | Zambian Kwacha
8,114,000,000 | | United States Dollar
1,979,024 | | | 196,319 | | |
| | | $ | 15,590,067 | | |
Purchases
| Settlement Date | | In Exchange For | | Deliver | | Net Unrealized
Appreciation
(Depreciation) | |
12/02/08
| | Brazilian Real
20,910,000 | | United States Dollar
9,739,171 | | $ | (197,413 | ) | |
11/07/08
| | Colombian Peso
13,574,303,631 | | United States Dollar
6,252,558 | | | (563,268 | ) | |
11/03/08
| | Euro
800,000 | | United States Dollar
1,035,280 | | | (15,640 | ) | |
11/04/08
| | Euro
8,445,280 | | United States Dollar
10,751,995 | | | 11,937 | | |
11/24/08
| | Indonesian Rupiah
85,590,000,000 | | United States Dollar
8,474,257 | | | (988,252 | ) | |
11/03/08
| | Mauritian Rupee
222,200,000 | | United States Dollar
7,910,288 | | | (998,935 | ) | |
11/07/08
| | Mauritian Rupee
222,200,000 | | United States Dollar
7,048,956 | | |
(139,752) | | |
11/17/08
| | Mauritian Rupee
71,128,624 | | United States Dollar
2,370,954 | | |
(161,533) | | |
11/06/08
| | Mexican Peso
214,860,000 | | United States Dollar
16,339,164 | | | 348,646 | | |
11/07/08
| | Mexican Peso
99,480,000 | | United States Dollar
7,312,018 | | | 412,095 | | |
11/03/08
| | Polish Zloty
28,642,375 | | Euro
8,003,570 | | | 151,591 | | |
11/10/08
| | Polish Zloty
28,642,375 | | Euro
8,063,425 | | | 72,176 | | |
11/14/08
| | Polish Zloty
52,953,625 | | Euro
13,761,337 | | | 1,589,930 | | |
11/05/08
| | Ugandan Shilling
4,563,765,520 | | United States Dollar
2,404,196 | | | (2,820 | ) | |
11/04/08
| | Zambian Kwacha
7,930,000 | | United States Dollar
1,687,234 | | | 86,815 | | |
| | | $ | (394,423 | ) | |
26
Global Macro Portfolio as of October 31, 2008
NOTES TO FINANCIAL STATEMENTS CONT'D
At October 31, 2008, closed forward foreign currency purchases and sales contracts excluded above amounted to a receivable of $1,403,661 and a payable of $1,575,223.
Futures Contracts
Expiration
Date | | Contracts | | Position | | Aggregate
Cost | | Value | | Net Unrealized
Appreciation
(Depreciation) | |
| 12/08 | | 165 FTSE/
JSE Top 40 Index | | Short | | $ | (4,036,128 | ) | | $ | (3,275,187 | ) | | $ | 760,941 | | |
| 12/08 | | 68 Japan
10 Year Bond | | Short | | | (94,891,270 | ) | | | (94,762,359 | ) | | | 128,911 | | |
| 12/08 | | 210
Mexican Bolsa Index | | Short | | | (3,454,356 | ) | | | (3,388,071 | ) | | | 66,285 | | |
| 12/08 | | 102
U.S. Treasury Bond | | Short | | | (11,854,924 | ) | | | (11,538,750 | ) | | | 316,174 | | |
| 12/08 | | 86 U.S. 5 Year
Treasury Note | | Short | | | (9,671,287 | ) | | | (9,740,072 | ) | | | (68,785 | ) | |
| | | $ | 1,203,526 | | |
Descriptions of the underlying instruments to Futures Contracts:
• FTSE/JSE Top 40 Index: The FTSE/JSE Top 40 Index is a capitalization weighted index of the 40 largest companies by market capitalization included in the FTSE/JSE All Shares Index.
• Japan 10 Year Bond: Japanese Government Bonds (JGB) having a maturity of 7 years or more but less than 11 years.
• Mexican Bolsa Index: Mexican Bolsa Index is a capitalization weighted index of the leading stocks traded on the Mexican Stock Exchange.
Interest Rate Swaps
| Counterparty | | Notional
Amount | | Portfolio
Pays/
Receives
Floating
Rate | | Floating
Rate Index | | Annual
Fixed Rate | | Termination
Date | | Net
Unrealized
Appreciation
(Depreciation) | |
Barclays
Capital PLC | | MYR | 36,000,000 | | | Pay | | KLIBOR | | | 3.85 | % | | March 27, 2012 | | $ | 33,468 | | |
J.P. Morgan
Chase, N.A. | | BRL | 10,533,705 | | | Pay | | Brazilian
Interbank
Deposit
Rate | | | 12.73 | | | January 2, 2012 | | | (609,106 | ) | |
J.P. Morgan
Chase, N.A. | | BRL | 12,290,767 | | | Pay | | Brazilian
Interbank
Deposit
Rate | | | 10.35 | | | January 2, 2012 | | | (1,222,384 | ) | |
J.P. Morgan
Chase, N.A. | | BRL | 38,710,005 | | | Pay | | Brazilian
Interbank
Deposit
Rate | | | 11.34 | | | January 2, 2009 | | | (166,070 | ) | |
| | | $ | (1,964,092 | ) | |
BRL - Brazilian Real
KLIBOR- Kuala Lumpur Interbank Offered Rate
MYR - Malaysian Ringit
Credit Default Swaps
| Counterparty | | Reference
Entity | | Buy/
Sell | | Notional
Amount
(000's
omitted) | | Pay/
Receive
Annual
Fixed
Rate | | Termination
Date | | Net
Unrealized
Appreciation
(Depreciation) | |
Barclays
Bank PLC | | Austria | | Buy | | $ | 8,800 | | | | 0.44 | % | | 12/20/13 | | $ | 148,475 | | |
Barclays
Bank PLC | | Egypt | | Buy | | | 6,000 | | | | 0.75 | | | 1/20/11 | | | 670,858 | | |
Barclays
Bank PLC | | Iceland | | Sell | | | 5,000 | | | | 1.70 | | | 3/20/18 | | | (1,608,552 | ) | |
Barclays
Bank PLC | | Iceland | | Sell | | | 3,900 | | | | 1.88 | | | 3/20/18 | | | (1,216,946 | ) | |
Barclays
Bank PLC | | Kazakhstan | | Buy | | | 7,500 | | | | 2.43 | | | 9/20/13 | | | 1,379,980 | | |
Barclays
Bank PLC | | Kazakhstan | | Sell | | | 7,600 | | | | 9.75 | | | 11/20/09 | | | 133,905 | | |
Barclays
Bank PLC | | Turkey | | Buy | | | 4,170 | | | | 2.12 | | | 1/20/13 | | | 392,921 | | |
Citigroup
Global Markets | | Kazakhstan | | Sell | | | 7,600 | | | | 8.00 | | | 10/20/09 | | | 1,593 | | |
Citigroup
Global Markets | | Peru | | Sell | | | 7,400 | | | | 2.00 | | | 9/20/11 | | | (186,674 | ) | |
Citigroup
Global Markets | | Peru | | Sell | | | 3,800 | | | | 2.90 | | | 10/20/13 | | | (76,600 | ) | |
Citigroup
Global Markets | | Philippines
(Republic of the) | | Buy | | | 5,000 | | | | 1.88 | | | 6/20/11 | | | 280,775 | | |
Credit Suisse
First Boston | | Columbia | | Sell | | | 8,800 | | | | 4.90 | | | 11/20/09 | | | 242,106 | | |
Credit Suisse
First Boston | | Greece | | Buy | | | 20,000 | | | | 0.195 | | | 6/20/20 | | | 2,154,573 | | |
Credit Suisse
First Boston | | Iceland | | Sell | | | 5,000 | | | | 1.70 | | | 3/20/18 | | | (1,608,552 | ) | |
Credit Suisse
First Boston | | Italy | | Buy | | | 18,200 | | | | 0.20 | | | 12/20/16 | | | 1,192,037 | | |
Credit Suisse
First Boston | | Philippines
(Republic of the) | | Buy | | | 5,000 | | | | 1.88 | | | 6/20/11 | | | 280,775 | | |
Credit Suisse
First Boston | | Turkey | | Buy | | | 5,000 | | | | 2.87 | | | 7/20/11 | | | 228,880 | | |
Credit Suisse
First Boston | | Turkey | | Buy | | | 4,120 | | | | 2.11 | | | 1/20/13 | | | 389,651 | | |
Goldman
Sachs, Inc. | | Greece | | Buy | | | 35,000 | | | | 0.29 | | | 6/20/15 | | | 2,176,170 | | |
| HSBC Bank USA | | Serbia | | Buy | | | 7,000 | | | | 1.30 | | | 5/20/11 | | | 656,854 | | |
J.P. Morgan
Chase Bank | | Brazil | | Sell | | | 8,400 | | | | 5.25 | | | 11/20/09 | | | 152,259 | | |
J.P. Morgan
Chase Bank | | Greece | | Buy | | | 20,000 | | | | 0.12625 | | | 9/20/17 | | | 1,846,266 | | |
J.P. Morgan
Chase Bank | | Iceland | | Sell | | | 3,300 | | | | 1.70 | | | 3/20/18 | | | (1,061,645 | ) | |
J.P. Morgan
Chase Bank | | Iceland | | Sell | | | 6,600 | | | | 1.75 | | | 3/20/18 | | | (2,105,555 | ) | |
J.P. Morgan
Chase Bank | | Iceland | | Sell | | | 4,000 | | | | 1.90 | | | 3/20/18 | | | (1,243,851 | ) | |
J.P. Morgan
Chase Bank | | Iceland | | Sell | | | 5,000 | | | | 2.10 | | | 3/20/23 | | | (1,502,420 | ) | |
27
Global Macro Portfolio as of October 31, 2008
NOTES TO FINANCIAL STATEMENTS CONT'D
Credit Default Swap Contracts (continued)
| Counterparty | | Reference
Entity | | Buy/
Sell | | Notional
Amount
(000's
omitted) | | Pay/
Receive
Annual
Fixed
Rate | | Termination
Date | | Net
Unrealized
Appreciation
(Depreciation) | |
J.P. Morgan
Chase Bank | | Iceland | | Sell | | $ | 5,000 | | | | 2.45 | % | | 3/20/23 | | $ | (1,384,729 | ) | |
J.P. Morgan
Chase Bank | | Philippines
(Republic of the) | | Buy | | | 5,000 | | | | 1.88 | | | 6/20/11 | | | 280,775 | | |
J.P. Morgan
Chase Bank | | Turkey | | Buy | | | 12,610 | | | | 2.12 | | | 1/20/13 | | | 1,188,185 | | |
J.P. Morgan
Chase Bank | | Turkey | | Buy | | | 10,000 | | | | 3.16 | | | 4/1/10 | | | 212,908 | | |
J.P. Morgan
Chase Bank | | Turkey | | Buy | | | 4,000 | | | | 3.60 | | | 4/6/09 | | | 18,077 | | |
| Morgan Stanley | | Turkey | | Buy | | | 3,000 | | | | 3.40 | | | 1/29/09 | | | 9,456 | | |
| Morgan Stanley | | Turkey | | Buy | | | 5,000 | | | | 4.05 | | | 4/6/14 | | | 164,244 | | |
| | | $ | 2,206,199 | | |
Total Return Swaps
| Counterparty | | Notional
Amount | | Expiration
Date | | Portfolio
Pays | | Portfolio
Receives | | Net
Unrealized
Depreciation | |
Merrill Lynch
Capital Services | |
$2,230,208 | |
12/1/08 | |
1-month USD-
LIBOR-BBA+50bp | | Total Return
on Merrill Lynch
Abu Dhabi Index | | |
$(28,097) | | |
J.P. Morgan
Chase Bank | |
2,433,129 | |
7/23/09 | |
1-month USD-
LIBOR-BBA+50bp | | Total Return
on J. P. Morgan
Abu Dhabi Index | | |
(240,052) | | |
| | | $ | (268,149 | ) | |
At October 31, 2008, the Portfolio had sufficient cash and/or securities to cover commitments under these contracts.
6 Line of Credit
The Portfolio participates with other portfolios and funds managed by EVM and its affiliates in a $450 million unsecured line of credit agreement with a group of banks. Borrowings are made by the Portfolio solely to facilitate the handling of unusual and/or unanticipated short-term cash requirements. Interest is charged to the Portfolio based on its borrowings at an amount above either the Eurodollar rate or Federal Funds rate. In addition, a fee computed at an annual rate of 0.10% on the daily unused portion of the line of credit is allocated among the participating portfolios and funds at the end of each quarter. The Portfolio did not have any significant borrowings or allocated fees during the year ended October 31, 2008.
7 Risks Associated with Foreign Investments
Investing in securities issued by entities whose principal business activities are outside the United States may involve significant risks not present in domestic investments. For example, there is generally less publicly available information about foreign companies, particularly those not subject to the disclosure and reporting requirements of the U.S. securities laws. Certain foreign issuers are generally not bound by uniform accounting, auditing, and financial reporting requirements and standards of practice comparable to those applicable to domestic issuers. Investments in foreign securities also involve the risk of possible adverse changes in investment or exchange control regulations, expropriation or confiscatory taxation, limitation on the removal of funds or other assets of the Portfolio, political or financial instability or diplomatic and other developments which could affect such investments. Foreign stock markets, while growing in volume and sophistication, are generally not as developed as those in the United States, and securities of some foreign issuers (particularly those located in developing countries) may be less liquid and more volatile than securities of comparable U.S. companies. In general, there is less overall governmental supervision and regulation of foreign securities markets, broker-dealers and issuers than in the United States.
8 Recently Issued Accounting Pronouncements
In September 2006, the Financial Accounting Standards Board (FASB) issued Statement of Financial Accounting Standards No. 157 (FAS 157), "Fair Value Measurements". FAS 157 defines fair value, establishes a framework for measuring fair value in accordance with accounting principles generally accepted in the United States of America and expands disclosure about fair value measurements. FAS 157 is effective for fiscal years beginning after November 15, 2007. As of October 31, 2008, management does not believe the adoption of FAS 157 will impact the amounts reported in the financial statements; however, additional disclosures may be required about the inputs used to develop the measurements of fair value and the effect of certain of the measurements on changes in net assets for the period.
In March 2008, the FASB issued Statement of Financial Accounting Standards No. 161 (FAS 161), "Disclosures about Derivative Instruments and Hedging Activities ". FAS 161 requires enhanced disclosures about an entity's derivative and hedging activities, including qualitative
28
Global Macro Portfolio as of October 31, 2008
NOTES TO FINANCIAL STATEMENTS CONT'D
disclosures about the objectives and strategies for using derivatives, quantitative disclosures about fair value amounts of and gains and losses on derivative instruments, and disclosures about credit-risk related contingent features in derivative instruments. FAS 161 is effective for fiscal years and interim periods beginning after November 15, 2008. Management is currently evaluating the impact the adoption of FAS 161 will have on the Portfolio's financial statement disclosures.
29
Global Macro Portfolio as of October 31, 2008
REPORT OF INDEPENDENT REGISTERED PUBLIC ACCOUNTING FIRM
To the Trustees and Investors of Global Macro Portfolio:
We have audited the accompanying statement of assets and liabilities of Global Macro Portfolio (the "Portfolio"), including the portfolio of investments, as of October 31, 2008, the related statement of operations for the year then ended, and the statements of changes in net assets and the supplementary data for each of the two years in the period then ended. These financial statements and supplementary data are the responsibility of the Portfolio's management. Our responsibility is to express an opinion on these financial statements and supplementary data based on our audits. The supplementary data for the years ended October 31, 2006, and all prior periods presented were audited by other auditors. Those auditors expressed an unqualified opinion on the supplementary data in their report dated December 27, 2006.
We conducted our audits in accordance with the standards of the Public Company Accounting Oversight Board (United States). Those standards require that we plan and perform the audit to obtain reasonable assurance about whether the financial statements and supplementary data are free of material misstatement. The Portfolio is not required to have, nor were we engaged to perform, an audit of its internal control over financial reporting. Our audits included consideration of internal control over financial reporting as a basis for designing audit procedures that are appropriate in the circumstances, but not for the purpose of expressing an opinion on the effectiveness of the Portfolio's internal control over financial reporting. Accordingly, we express no such opinion. An audit also includes examining, on a test basis, evidence supporting the amounts and disclosures in the financial statements, assessing the accounting principles used and significant estimates made by management, as well as evaluating the overall financial statement presentation. Our procedures included confirmation of securities owned as of October 31, 2008, by correspondence with the custodian and brokers; where replies were not received from brokers, we performed other auditing procedures. We believe that our audits provide a reasonable basis for our opinion.
In our opinion, the financial statements and supplementary data referred to above present fairly, in all material respects, the financial position of Global Macro Portfolio as of October 31, 2008, the results of its operations for the year then ended, and the changes in its net assets and the supplementary data for each of the two years in the period then ended, in conformity with accounting principles generally accepted in the United States of America.
DELOITTE & TOUCHE LLP
Boston, Massachusetts
December 18, 2008
30
Eaton Vance Global Macro Fund as of October 31, 2008
Global Macro Portfolio
SPECIAL MEETING OF SHAREHOLDERS (Unaudited)
Eaton Vance Global Macro Fund
The Fund held a Special Meeting of Shareholders on November 14, 2008 to elect Trustees. The results of the vote were as follows:
| | | Number of Shares | |
| Nominee for Trustee | | For | | Withheld | |
| Benjamin C. Esty | | | 4,496,597 | | | | 8,561 | | |
| Thomas E. Faust Jr. | | | 4,496,597 | | | | 8,561 | | |
| Allen R. Freedman | | | 4,496,597 | | | | 8,561 | | |
| William H. Park | | | 4,496,597 | | | | 8,561 | | |
| Ronald A. Pearlman | | | 4,494,136 | | | | 11,022 | | |
| Helen Frame Peters | | | 4,496,597 | | | | 8,561 | | |
| Heidi L. Steiger | | | 4,496,597 | | | | 8,561 | | |
| Lynn A. Stout | | | 4,496,597 | | | | 8,561 | | |
| Ralph F. Verni | | | 4,496,597 | | | | 8,561 | | |
Each nominee was also elected a Trustee of the Global Macro Portfolio.
Global Macro Portfolio
The Portfolio held a Special Meeting of Interestholders on November 14, 2008 to elect Trustees. The results of the vote were as follows:
| | | Interest in the Portfolio | |
| Nominee for Trustee | | For | | Withheld | |
| Benjamin C. Esty | | | 85 | % | | | 1 | % | |
| Thomas E. Faust Jr. | | | 85 | % | | | 1 | % | |
| Allen R. Freedman | | | 85 | % | | | 1 | % | |
| William H. Park | | | 85 | % | | | 1 | % | |
| Ronald A. Pearlman | | | 85 | % | | | 1 | % | |
| Helen Frame Peters | | | 85 | % | | | 1 | % | |
| Heidi L. Steiger | | | 85 | % | | | 1 | % | |
| Lynn A. Stout | | | 85 | % | | | 1 | % | |
| Ralph F. Verni | | | 85 | % | | | 1 | % | |
Results are rounded to the nearest whole number.
31
Eaton Vance Global Macro Fund
BOARD OF TRUSTEES' ANNUAL APPROVAL OF THE INVESTMENT ADVISORY AGREEMENT
Overview of the Contract Review Process
The Investment Company Act of 1940, as amended (the "1940 Act"), provides, in substance, that each investment advisory agreement between a fund and its investment adviser will continue in effect from year to year only if its continuance is approved at least annually by the fund's board of trustees, including by a vote of a majority of the trustees who are not "interested persons" of the fund ("Independent Trustees"), cast in person at a meeting called for the purpose of considering such approval.
At a meeting of the Boards of Trustees (each a "Board") of the Eaton Vance group of mutual funds (the "Eaton Vance Funds") held on April 21, 2008, the Board, including a majority of the Independent Trustees, voted to approve continuation of existing advisory and sub-advisory agreements for the Eaton Vance Funds for an additional one-year period. In voting its approval, the Board relied upon the affirmative recommendation of the Contract Review Committee of the Board (formerly the Special Committee), which is a committee comprised exclusively of Independent Trustees. Prior to making its recommendation, the Contract Review Committee reviewed information furnished for a series of meetings of the Contract Review Committee held in February, March and April 2008. Such information included, among other things, the following:
Information about Fees, Performance and Expenses
• An independent report comparing the advisory and related fees paid by each fund with fees paid by comparable funds;
• An independent report comparing each fund's total expense ratio and its components to comparable funds;
• An independent report comparing the investment performance of each fund to the investment performance of comparable funds over various time periods;
• Data regarding investment performance in comparison to relevant peer groups of funds and appropriate indices;
• Comparative information concerning fees charged by each adviser for managing other mutual funds and institutional accounts using investment strategies and techniques similar to those used in managing the fund;
• Profitability analyses for each adviser with respect to each fund;
Information about Portfolio Management
• Descriptions of the investment management services provided to each fund, including the investment strategies and processes employed, and any changes in portfolio management processes and personnel;
• Information concerning the allocation of brokerage and the benefits received by each adviser as a result of brokerage allocation, including information concerning the acquisition of research through "soft dollar" benefits received in connection with the funds' brokerage, and the implementation of a soft dollar reimbursement program established with respect to the funds;
• Data relating to portfolio turnover rates of each fund;
• The procedures and processes used to determine the fair value of fund assets and actions taken to monitor and test the effectiveness of such procedures and processes;
Information about each Adviser
• Reports detailing the financial results and condition of each adviser;
• Descriptions of the qualifications, education and experience of the individual investment professionals whose responsibilities include portfolio management and investment research for the funds, and information relating to their compensation and responsibilities with respect to managing other mutual funds and investment accounts;
• Copies of the Codes of Ethics of each adviser and its affiliates, together with information relating to compliance with and the administration of such codes;
• Copies of or descriptions of each adviser's proxy voting policies and procedures;
• Information concerning the resources devoted to compliance efforts undertaken by each adviser and its affiliates on behalf of the funds (including descriptions of various compliance programs) and their record of compliance with investment policies and restrictions, including policies with respect to market-timing, late trading and selective portfolio disclosure, and with policies on personal securities transactions;
• Descriptions of the business continuity and disaster recovery plans of each adviser and its affiliates;
Other Relevant Information
• Information concerning the nature, cost and character of the administrative and other non-investment management services provided by Eaton Vance Management and its affiliates;
• Information concerning management of the relationship with the custodian, subcustodians and fund accountants by each adviser or the funds' administrator; and
• The terms of each advisory agreement.
In addition to the information identified above, the Contract Review Committee considered information provided from time to time by each adviser throughout the year at meetings of the Board and its committees. Over the course of the twelve-month period ended April 30, 2008,
32
Eaton Vance Global Macro Fund
BOARD OF TRUSTEES' ANNUAL APPROVAL OF THE INVESTMENT ADVISORY AGREEMENT CONT'D
the Board met eleven times and the Contract Review Committee, the Audit Committee and the Governance Committee, each of which is a Committee comprised solely of Independent Trustees, met twelve, seven and five times, respectively. At such meetings, the Trustees received, among other things, presentations by the portfolio managers and other investment professionals of each adviser relating to the investment performance of each fund and the investment strategies used in pursuing the fund's investment objective. The Portfolio Management Committee and the Compliance Reports and Regulatory Matters Committee are newly established and did not meet during the twelve-month period ended April 30, 2008.
For funds that invest through one or more underlying portfolios, the Board considered similar information about the portfolio(s) when considering the approval of advisory agreements. In addition, in cases where the fund's investment adviser has engaged a sub-adviser, the Board considered similar information about the sub-adviser when considering the approval of any sub-advisory agreement.
The Contract Review Committee was assisted throughout the contract review process by Goodwin Procter LLP, legal counsel for the Independent Trustees. The members of the Contract Review Committee relied upon the advice of such counsel and their own business judgment in determining the material factors to be considered in evaluating each advisory and sub-advisory agreement and the weight to be given to each such factor. The conclusions reached with respect to each advisory and sub-advisory agreement were based on a comprehensive evaluation of all the information provided and not any single factor. Moreover, each member of the Contract Review Committee may have placed varying emphasis on particular factors in reaching conclusions with respect to each advisory and sub-advisory agreement.
Results of the Process
Based on its consideration of the foregoing, and such other information as it deemed relevant, including the factors and conclusions described below, the Contract Review Committee concluded that the continuance of the investment advisory agreements between the Eaton Vance Global Macro Fund (the "Fund") with Eaton Vance Management ("EVM"), as well as the investment advisory agreement for the Global Macro Portfolio (the "Portfolio"), the portfolio in which the Fund will invest substantially all of its assets, with Boston Management and Research ("BMR"), an affiliate of EVM (EVM, with respect to the Fund, and BMR, with respect to the Portfolio, are each referred to herein as the "Adviser"), including their fee structures, is in the interests of shareholders and, therefore, the Contract Review Committee recommended to the Board approval of the agreements. The Board accepted the recommendation of the Contract Review Committee as well as the factors considered and conclusions reached by the Contract Review Committee with respect to the agreements. Accordingly, the Board, including a majority of the Independent Trustees, voted to approve continuation of the investment advisory agreements for the Fund and Portfolio.
Nature, Extent and Quality of Services
In considering whether to approve the investment advisory agreements of the Fund and the Portfolio, the Board evaluated the nature, extent and quality of services to be provided to the Fund by EVM and Portfolio by BMR.
The Board considered EVM's and BMR's management capabilities and investment process with respect to the types of investments to be held by the Fund and the Portfolio, including the education, experience and number of its investment professionals and other personnel who provide portfolio management, investment research, and similar services to the Fund and the Portfolio. The Board specifically noted EVM's and BMR's expertise with respect to global markets and in-house research capabilities. The Board also took into account the resources dedicated to portfolio management and other services, including the compensation paid to recruit and retain investment personnel, and the time and attention devoted to the Fund and Portfolio by senior management.
The Board noted that, under the terms of the investment advisory agreement of the Fund, EVM may invest assets of the Fund directly in securities, for which it may receive a fee, or in the Portfolio, for which it receives no separate fee but for which BMR receives an advisory fee from the Portfolio. The Trustees considered the potential benefits to the Fund of the ability to make direct investments, such as an improved ability to: manage the Fund's duration, or other general market exposures, using certain derivatives; add exposure to specific market sectors or asset classes without changing the Portfolio's investments, which would affect any other fund investing in the Portfolio; hedge some of the general market risks of the Portfolio while retaining the value added by the individual manager; and hedge a portion of the exposures of the Portfolio while retaining others (e.g., hedging the U.S. government exposure of the Portfolio while retaining its exposure to high-grade corporate bonds).
The Board also reviewed the compliance programs of the Adviser and relevant affiliates thereof. Among other matters, the Board considered compliance and reporting matters relating to personal trading by investment personnel, selective disclosure of portfolio holdings, late trading, frequent trading, portfolio valuation, business continuity and the allocation of investment opportunities. The Board also evaluated the responses of the Adviser and its affiliates to requests from regulatory authorities such as the Securities and Exchange Commission.
33
Eaton Vance Global Macro Fund
BOARD OF TRUSTEES' ANNUAL APPROVAL OF THE INVESTMENT ADVISORY AGREEMENT CONT'D
The Board considered shareholder and other administrative services provided or managed by EVM and its affiliates, including transfer agency and accounting services. The Board evaluated the benefits to shareholders of investing in a fund that is a part of a large family of funds, including the ability, in many cases, to exchange an investment among different funds without incurring additional sales charges.
After consideration of the foregoing factors, among others, the Board concluded that the nature, extent and quality of services provided by the Adviser, taken as a whole, are appropriate and consistent with the terms of the investment advisory agreements.
Portfolio Performance
The Board compared the Fund's investment performance to a relevant universe of similarly managed funds identified by an independent data provider and appropriate benchmark indices. The Board reviewed comparative performance data for the period from inception (June 27, 2007) through September 30, 2007 for the Fund. In light of the Fund's relatively brief operating history, the Board concluded that additional time was required to evaluate Fund performance.
Management Fees and Expenses
The Board reviewed contractual investment advisory fee rates, including any administrative fee rates, payable by the Portfolio and the Fund (referred to collectively as "management fees"). As part of its review, the Board considered the management fees, including administrative fees, and the Fund's total expense ratio for the period since inception through September 30, 2007, as compared to a group of similarly managed funds selected by an independent data provider. The Board considered the fact that the Adviser had waived fees and/or paid expenses for the Fund.
After reviewing the foregoing information, and in light of the nature, extent and quality of the services provided by the Adviser, the Board concluded that the management fees proposed to be charged for advisory and related services and the Fund's total expense ratio are reasonable.
Profitability
The Board reviewed the level of profits realized by the Adviser and relevant affiliates thereof in providing investment advisory and administrative services to the Portfolio, the Fund and all Eaton Vance Funds as a group. The Board considered the level of profits realized without regard to revenue sharing or other payments by the Adviser and its affiliates to third parties in respect of distribution services. The Board also considered other direct or indirect benefits received by the Adviser and its affiliates in connection with its relationship with the Portfolio and the Fund, including the benefits of research services that may be available to the Adviser as a result of securities transactions effected for the Portfolio and other advisory clients.
The Board concluded that, in light of the foregoing factors and the nature, extent and quality of the services rendered, the profits realized by the Adviser and its affiliates are reasonable.
Economies of Scale
In reviewing management fees and profitability, the Board also considered the extent to which the Adviser and its affiliates, on the one hand, and the Fund, on the other hand, can expect to realize benefits from economies of scale as the assets of the Fund and the Portfolio increase. The Board acknowledged the difficulty in accurately measuring the benefits resulting from the economies of scale with respect to the management of any specific fund or group of funds. The Board reviewed data summarizing the increases and decreases in the assets of the Fund and of all Eaton Vance Funds as a group over various time periods, and evaluated the extent to which the total expense ratio of the Fund and the profitability of the Adviser and its affiliates may have been affected by such increases or decreases. Based upon the foregoing, the Board concluded that the benefits from economies of scale are currently being shared equitably by the Adv iser and its affiliates and the Fund. The Board also concluded that, assuming reasonably foreseeable increases in the assets of the Portfolio, the structure of the advisory fee, which includes breakpoints at several asset levels, can be expected to cause the Adviser and its affiliates and the Fund to continue to share such benefits equitably.
34
Eaton Vance Global Macro Fund
MANAGEMENT AND ORGANIZATION
Fund Management. The Trustees of Eaton Vance Mutual Funds Trust (the Trust) and Global Macro Portfolio (the Portfolio) are responsible for the overall management and supervision of the Trust's and Portfolio's affairs. The Trustees and officers of the Trust and the Portfolio are listed below. Except as indicated, each individual has held the office shown or other offices in the same company for the last five years. Trustees and officers of the Trust and the Portfolio hold indefinite terms of office. The "noninterested Trustees" consist of those Trustees who are not "interested persons" of the Trust and the Portfolio, as that term is defined under the 1940 Act. The business address of each Trustee and officer is The Eaton Vance Building, 255 State Street, Boston, Massachusetts 02109. As used below, "EVC" refers to Eaton Vance Corp., "EV" refers to Eaton Vance, Inc., "EVM" refers to Eaton Vance Management, "BMR" refers to Boston Management and Research, "Parametric" refers to Parametric Portfolio Associates and "EVD" refers to Eaton Vance Distributors, Inc. EVC and EV are the corporate parent and trustee, respectively, of EVM and BMR. EVD is the Fund's principal underwriter, the Portfolio's placement agent and a wholly-owned subsidiary of EVC. Each officer affiliated with Eaton Vance may hold a position with other Eaton Vance affiliates that is comparable to his or her position with EVM listed below.
Name and
Date of Birth | | Position(s)
with the
Trust and
the Portfolio | | Term of
Office and
Length of
Service | | Principal Occupation(s)
During Past Five Years | | Number of Portfolios
in Fund Complex
Overseen By
Trustee(1) | | Other Directorships Held | |
| Interested Trustee | | | | | | | | | | | | | |
|
Thomas E. Faust Jr.
5/31/58 | | Trustee and President of
the Trust | | Trustee since 2007 and President of the Trust since 2002 | | Chairman, Chief Executive Officer and President of EVC, Director and President of EV, Chief Executive Officer and President of EVM and BMR, and Director of EVD. Trustee and/or Officer of 173 registered investment companies and 4 private companies managed by EVM or BMR. Mr. Faust is an interested person because of his positions with EVM, BMR, EVD, EVC and EV, which are affiliates of the Trust and Portfolio. | | | 173 | | | Director of EVC | |
|
| Noninterested Trustees | | | | | | | | | | | | | |
|
Benjamin C. Esty
1/2/63 | | Trustee | | Since 2005 | | Roy and Elizabeth Simmons Professor of Business Administration, Harvard University Graduate School of Business Administration. | | | 173 | | | None | |
|
Allen R. Freedman
4/3/40 | | Trustee | | Since 2007 | | Former Chairman (2002-2004) and a Director (1983-2004) of Systems & Computer Technology Corp. (provider of software to higher education). Formerly, a Director of Loring Ward International (fund distributor) (2005-2007). Formerly, Chairman and a Director of Indus International, Inc. (provider of enterprise management software to the power generating industry) (2005-2007). | | | 173 | | | Director of Assurant, Inc. and Stonemor Partners L.P. (owner and operator of cemeteries) | |
|
William H. Park
9/19/47 | | Trustee | | Since 2003 | | Vice Chairman, Commercial Industrial Finance Corp. (specialty finance company) (since 2006). Formerly, President and Chief Executive Officer, Prizm Capital Management, LLC (investment management firm) (2002-2005). | | | 173 | | | None | |
|
Ronald A. Pearlman
7/10/40 | | Trustee | | Since 2003 | | Professor of Law, Georgetown University Law Center. | | | 173 | | | None | |
|
Helen Frame Peters
3/22/48 | | Trustee | | Since 2008 | | Professor of Finance, Carroll School of Management, Boston College (since 2003). Adjunct Professor of Finance, Peking University, Beijing, China (since 2005). Formerly, Dean, Carroll School of Management, Boston College (2000-2003). | | | 173 | | | Director of Federal Home Loan Bank of Boston (a bank for banks) and BJ's Wholesale Clubs (wholesale club retailer); Trustee of SPDR Index Shares Funds and SPDR Series Trust (exchange traded funds) | |
|
35
Eaton Vance Global Macro Fund
MANAGEMENT AND ORGANIZATION CONT'D
Name and
Date of Birth | | Position(s)
with the
Trust and
the Portfolio | | Term of
Office and
Length of
Service | | Principal Occupation(s)
During Past Five Years | | Number of Portfolios
in Fund Complex
Overseen By
Trustee(1) | | Other Directorships Held | |
| Noninterested Trustees (continued) | | | | | | | | | | | | | |
|
Heidi L. Steiger
7/8/53 | | Trustee | | Since 2007 | | Managing Partner, Topridge Associates LLC (global wealth management firm) (since 2008); Senior Advisor (since 2008), President (2005-2008), Lowenhaupt Global Advisors, LLC (global wealth management firm). Formerly, President and Contributing Editor, Worth Magazine (2004-2005). Formerly, Executive Vice President and Global Head of Private Asset Management (and various other positions), Neuberger Berman (investment firm) (1986-2004). | | | 173 | | | Director of Nuclear Electric Insurance Ltd. (nuclear insurance provider) and Aviva USA (insurance provider) | |
|
Lynn A. Stout
9/14/57 | | Trustee | | Since 1998 | | Paul Hastings Professor of Corporate and Securities Law (since 2006) and Professor of Law (2001-2006), University of California at Los Angeles School of Law. | | | 173 | | | None | |
|
Ralph F. Verni
1/26/43 | | Chairman of
the Board and Trustee | | Chairman of the Board since 2007 and Trustee since 2005 | | Consultant and private investor. | | | 173 | | | None | |
|
| Principal Officers who are not Trustees | | | | | | | |
|
Name and
Date of Birth | | Position(s)
with the
Trust and
the Portfolio | | Term of
Office and
Length of
Service | | Principal Occupation(s)
During Past Five Years | |
William H. Ahern, Jr.
7/28/59 | | Vice President of
the Trust | | Since 1995 | | Vice President of EVM and BMR. Officer of 75 registered investment companies managed by EVM or BMR. | |
|
John R. Baur
2/10/70 | | Vice President | | Since 2007 | | Vice President of EVM and BMR. Previously, attended Johnson Graduate School of Management, Cornell University (2002-2005), and prior thereto he was an Account Team Representative in Singapore for Applied Materials Inc. Officer of 33 registered investment companies managed by EVM or BMR. | |
|
Michael A. Cirami
12/24/75 | | Vice President | | Since 2007 | | Vice President of EVM and BMR. Previously, attended the University of Rochester William E. Simon Graduate School of Business Administration (2001-2003), and prior thereto he was a Team Leader for the Institutional Services Group for State Street Bank in Luxembourg. Officer of 33 registered investment companies managed by EVM or BMR. | |
|
Cynthia J. Clemson
3/2/63 | | Vice President of
the Trust | | Since 2005 | | Vice President of EVM and BMR. Officer of 90 registered investment companies managed by EVM or BMR. | |
|
Charles B. Gaffney
12/4/72 | | Vice President of
the Trust | | Since 2007 | | Vice President of EVM and BMR. Previously, Sector Portfolio Manager and Senior Equity Analyst of Brown Brothers Harriman (1997-2003). Officer of 30 registered investment companies managed by EVM or BMR. | |
|
Christine M. Johnston
11/9/72 | | Vice President of
the Trust | | Since 2007 | | Vice President of EVM and BMR. Officer of 35 registered investment companies managed by EVM or BMR. | |
|
Aamer Khan
6/7/60 | | Vice President of
the Trust | | Since 2005 | | Vice President of EVM and BMR. Officer of 33 registered investment companies managed by EVM or BMR. | |
|
Thomas H. Luster
4/8/62 | | Vice President of
the Trust | | Since 2006 | | Vice President of EVM and BMR. Officer of 51 registered investment companies managed by EVM or BMR. | |
|
Robert B. MacIntosh
1/22/57 | | Vice President of
the Trust | | Since 1998 | | Vice President of EVM and BMR. Officer of 90 registered investment companies managed by EVM or BMR. | |
|
36
Eaton Vance Global Macro Fund
MANAGEMENT AND ORGANIZATION CONT'D
Name and
Date of Birth | | Position(s)
with the
Trust and
the Portfolio | | Term of
Office and
Length of
Service | | Principal Occupation(s)
During Past Five Years | |
| Principal Officers who are not Trustees (continued) | | | | | | | |
|
Duncan W. Richardson
10/26/57 | | Vice President of
the Trust | | Since 2001 | | Executive Vice President and Chief Equity Investment Officer of EVC, EVM and BMR. Officer of 81 registered investment companies managed by EVM or BMR. | |
|
Judith A. Saryan
8/21/54 | | Vice President of
the Trust | | Since 2003 | | Vice President of EVM and BMR. Officer of 55 registered investment companies managed by EVM or BMR. | |
|
Susan Schiff
3/13/61 | | Vice President | | Since 2002 | | Vice President of EVM and BMR. Officer of 36 registered investment companies managed by EVM or BMR. | |
|
Thomas Seto
9/27/62 | | Vice President of
the Trust | | Since 2007 | | Vice President and Director of Portfolio Management of Parametric. Officer of 31 registered investment companies managed by EVM or BMR. | |
|
David M. Stein
5/4/51 | | Vice President of
the Trust | | Since 2007 | | Managing Director and Chief Investment Officer of Parametric. Officer of 31 registered investment companies managed by EVM or BMR. | |
|
Mark S. Venezia
5/23/49 | | Vice President of the Trust and President of the Portfolio | | Vice President of the Trust since 2007 and President of the Portfolio since 2002 | | Vice President of EVM and BMR. Officer of 36 registered investment companies managed by EVM or BMR. | |
|
Adam A. Weigold
3/22/75 | | Vice President of
the Trust | | Since 2007 | | Vice President of EVM and BMR. Officer of 71 registered investment companies managed by EVM or BMR. | |
|
Barbara E. Campbell
6/19/57 | | Treasurer | | Of the Trust since 2005 and of the Portfolio since 2008(2) | | Vice President of EVM and BMR. Officer of 173 registered investment companies managed by EVM or BMR. | |
|
Maureen A. Gemma
5/24/60 | | Secretary and Chief Legal Officer | | Secretary since 2007 and Chief Legal Officer since 2008 | | Vice President of EVM and BMR. Officer of 173 registered investment companies managed by EVM or BMR. | |
|
Paul M. O'Neil
7/11/53 | | Chief
Compliance Officer | | Since 2004 | | Vice President of EVM and BMR. Officer of 173 registered investment companies managed by EVM or BMR. | |
|
(1) Includes both master and feeder funds in a master-feeder structure.
(2) Prior to 2008, Ms. Campbell served as Assistant Treasurer of the Portfolio since 1998.
The SAI for the Fund includes additional information about the Trustees and officers of the Fund and the Portfolio and can be obtained without charge on Eaton Vance's website at eatonvance.com or by calling 1-800-262-1122.
37
This Page Intentionally Left Blank
This Page Intentionally Left Blank
This Page Intentionally Left Blank
Investment Adviser of Global Macro Portfolio
Boston Management and Research
The Eaton Vance Building
255 State Street
Boston, MA 02109
Investment Adviser and Administrator
of Eaton Vance Global Macro Fund
Eaton Vance Management
The Eaton Vance Building
255 State Street
Boston, MA 02109
Principal Underwriter
Eaton Vance Distributors, Inc.
The Eaton Vance Building
255 State Street
Boston, MA 02109
(617) 482-8260
Custodian
State Street Bank and Trust Company
200 Clarendon Street
Boston, MA 02116
Transfer Agent
PNC Global Investment Servicing
Attn: Eaton Vance Funds
P.O. Box 9653
Providence, RI 02940-9653
(800) 262-1122
Independent Registered Public Accounting Firm
Deloitte & Touche LLP
200 Berkeley Street
Boston, MA 02116-5022
Eaton Vance Global Macro Fund
The Eaton Vance Building
255 State Street
Boston, MA 02109
This report must be preceded or accompanied by a current prospectus. Before investing, investors should consider carefully the Fund's investment
objective(s), risks, and charges and expenses. The Fund's current prospectus contains this and other information about the Fund and is available
through your financial advisor. Please read the prospectus carefully before you invest or send money. For further information please call 1-800-262-1122.
3041-12/08 GMSRC

Annual Report October 31, 2008


EATON VANCE
TAX-MANAGED
DIVIDEND
INCOME
FUND
IMPORTANT NOTICES REGARDING PRIVACY,
DELIVERY OF SHAREHOLDER DOCUMENTS,
PORTFOLIO HOLDINGS AND PROXY VOTING
Privacy. The Eaton Vance organization is committed to ensuring your financial privacy. Each of the financial institutions identified below has in effect the following policy ("Privacy Policy") with respect to nonpublic personal information about its customers:
• Only such information received from you, through application forms or otherwise, and information about your Eaton Vance fund transactions will be collected. This may include information such as name, address, social security number, tax status, account balances and transactions.
• None of such information about you (or former customers) will be disclosed to anyone, except as permitted by law (which includes disclosure to employees necessary to service your account). In the normal course of servicing a customer's account, Eaton Vance may share information with unaffiliated third parties that perform various required services such as transfer agents, custodians and broker/dealers.
• Policies and procedures (including physical, electronic and procedural safeguards) are in place that are designed to protect the confidentiality of such information.
• We reserve the right to change our Privacy Policy at any time upon proper notification to you. Customers may want to review our Policy periodically for changes by accessing the link on our homepage: www.eatonvance.com.
Our pledge of privacy applies to the following entities within the Eaton Vance organization: the Eaton Vance Family of Funds, Eaton Vance Management, Eaton Vance Investment Counsel, Boston Management and Research, and Eaton Vance Distributors, Inc.
In addition, our Privacy Policy only applies to those Eaton Vance customers who are individuals and who have a direct relationship with us. If a customer's account (i.e., fund shares) is held in the name of a third-party financial adviser/ broker-dealer, it is likely that only such adviser's privacy policies apply to the customer. This notice supersedes all previously issued privacy disclosures.
For more information about Eaton Vance's Privacy Policy, please call 1-800-262-1122.
Delivery of Shareholder Documents. The Securities and Exchange Commission (the "SEC") permits funds to deliver only one copy of shareholder documents, including prospectuses, proxy statements and shareholder reports, to fund investors with multiple accounts at the same residential or post office box address. This practice is often called "householding" and it helps eliminate duplicate mailings to shareholders.
Eaton Vance, or your financial adviser, may household the mailing of your documents indefinitely unless you instruct Eaton Vance, or your financial adviser, otherwise.
If you would prefer that your Eaton Vance documents not be householded, please contact Eaton Vance at 1-800-262-1122, or contact your financial adviser.
Your instructions that householding not apply to delivery of your Eaton Vance documents will be effective within 30 days of receipt by Eaton Vance or your financial adviser.
Portfolio Holdings. Each Eaton Vance Fund and its underlying Portfolio (if applicable) will file a schedule of its portfolio holdings on Form N-Q with the SEC for the first and third quarters of each fiscal year. The Form N-Q will be available on the Eaton Vance website www.eatonvance.com, by calling Eaton Vance at 1-800-262-1122 or in the EDGAR database on the SEC's website at www.sec.gov. Form N-Q may also be reviewed and copied at the SEC's public reference room in Washington, D.C. (call 1-800-732-0330 for information on the operation of the public reference room).
Proxy Voting. From time to time, funds are required to vote proxies related to the securities held by the funds. The Eaton Vance Funds or their underlying Portfolios (if applicable) vote proxies according to a set of policies and procedures approved by the Funds' and Portfolios' Boards. You may obtain a description of these policies and procedures and information on how the Funds or Portfolios voted proxies relating to portfolio securities during the most recent 12 month period ended June 30, without charge, upon request, by calling 1-800-262-1122. This description is also available on the SEC's website at www.sec.gov.
Eaton Vance Tax-Managed Dividend Income Fund as of October 31, 2008
MANAGEMENT’S DISCUSSION OF FUND PERFORMANCE

Aamer Khan, CFA
Co-Portfolio Manager

Thomas H. Luster, CFA
Co-Portfolio Manager

Judith A. Saryan, CFA
Co-Portfolio Manager
Economic and Market Conditions
· The stock market moved dramatically lower during the year that ended October 31, 2008. After reaching record highs in October 2007, the major market indices began to decline at the end of 2007 as investors realized that the difficulties in subprime lending and the troubled housing market were likely to slow the economy significantly. By the summer of 2008, the magnitude of the damage became increasingly apparent. Many banks were faced with enormous write-offs from bad real estate loans, losses that severely impaired their overall lending capacity. As the market declined further, investor and consumer sentiment worsened. That trend was accelerated by soaring energy prices, as oil hit $145 per barrel in July 2008 and pinched consumers even more.
· The failure of Lehman Brothers in September 2008 and the tenuous condition of other capital-starved banks and financial institutions sparked fears of a global financial collapse. In late September, in an effort to jump-start lending, the U.S. Treasury department unveiled a controversial proposal to purchase troubled loans from banks and financial institutions. Congress’s initial rejection of the plan sent the market into a near-freefall. A revised version of the measure was subsequently approved by Congress and was followed by a coordinated effort by the world’s central banks to inject liquidity into the global banking system. While those actions reassured many investors, volatility remained high as the one-year period drew to a close.
· For the year ended October 31, 2008, all ten sectors within the Russell 1000 Value Index(1) (the Index) registered negative returns. The consumer staples sector was the best performing sector, posting the smallest sector loss in the Index. All of the other sectors had declines exceeding 20%, with the most severe occurring in the information technology, financials and materials sectors. Market-leading industries during the year included biotechnology, tobacco and road & rail, which were among a handful of industries to post positive returns. In contrast, thrifts & mortgage finance, automobiles, Internet & catalog retail and communications equipment were among the worst performing industries.
Management Discussion
· In a year in which all market sectors experienced losses, the Fund posted negative returns during the year ended October 31, 2008. Nevertheless, the Fund outperformed the Index for the year ended October 31, 2008. Stock selection was the primary driver of the Fund’s outperformance versus the Index. The largest contribution to the Fund’s relative returns came from the financials sector, both because the Fund was underweighted in this sector, relative to the Index, and also because management’s selections, especially in the insurance and capital markets industries, outperformed those in the Index. The Fund’s investments in the consumer discretionary sector, especially in the hotels and restaurants industry, contributed positively. In the industrials sector, the Fund’s underweight to these stocks benefited relative performance. Finally, Fund investments in the information technology sector outperformed, especially within the computers & peripherals and communications equipment industries.(1)
Eaton Vance Tax-Managed Dividend Income Fund
Total Return Performance 10/31/07 – 10/31/08
Fund - Class A(2) | | -35.08 | % |
Fund - Class B(2) | | -35.51 | |
Fund - Class C(2) | | -35.51 | |
Fund - Class I(2) | | -34.84 | |
Russell 1000 Value Index(1) | | -36.80 | |
Lipper Equity Income Funds Average(1) | | -33.80 | |
See pages 3 and 4 for more performance information, including after-tax returns.
(1) | It is not possible to invest directly in an Index or a Lipper Classification. The Index’s total return does not reflect commissions or expenses that would have been incurred if an investor individually purchased or sold the securities represented in the Index. The Lipper total return is the average total return, at net asset value, of the funds that are in the same Lipper Classification as the Fund. |
(2) | These returns do not include the 5.75% maximum sales charge for Class A shares or the applicable contingent deferred sales charge (CDSC) for Class B and Class C shares. If sales charges were deducted, the returns would be lower. Class I shares are offered to certain investors at net asset value. |
Past performance is no guarantee of future results. Returns are historical and are calculated by determining the percentage change in net asset value or offering price (as applicable) with all distributions reinvested. Investment return and principal value will fluctuate so that shares, when redeemed, may be worth more or less than their original cost. Performance is for stated time period only; due to market volatility, the Fund’s current performance may be lower or higher than the quoted return. For performance as of the most recent month end, please refer to www.eatonvance.com.
Fund shares are not insured by the FDIC and are not deposits or other obligations of, or guaranteed by, any depository institution. Shares are subject to investment risks, including possible loss of principal invested.
1
· Limiting returns relative to the Index were Fund holdings in the materials sector, where selections in the metals and mining industry underperformed similar stocks in the Index. Energy stocks also underperformed, with oil and gas holdings lagging those in the Index. In the utilities sector, electric utilities underperformed. Fund holdings in the health care sector also detracted from relative returns during the year ended October 31, 2008.(1)
· Based on the Fund’s objective of achieving after-tax total return consisting primarily of tax-favored dividend income and capital appreciation, the Fund was primarily invested in securities that generated a relatively high level of qualified dividend income (QDI) during the year ended October 31, 2008. Within the common stock portfolio, the Fund had significant exposure to the higher-yielding financials and energy sectors.
· The continued payment of the Fund’s monthly dividends reflected the continued use of the Fund’s dividend capture strategy, a trading strategy designed to enhance the level of QDI earned by the Fund. By using this strategy, the Fund has been able to collect a greater number of dividend payments than it would have collected by simply adhering to a buy-and-hold strategy. There can be no assurance that the continued use of dividend capture trading will be successful. In addition, the use of this strategy exposes the Fund to increased trading costs and the potential for capital loss or gain.
· Despite the volatile market conditions, all of the dividends paid by the Fund during the fiscal year were qualified dividends subject to federal income tax at long-term capital gain rates (up to 15%, as long as certain holding periods and other requirements have been met by receiving Fund shareholders).
(1) It is not possible to invest directly in an Index.
Fund Composition
Top Ten Holdings(2)
By net assets
Johnson & Johnson | | 3.7 | % |
Philip Morris International, Inc. | | 3.4 | |
Nestle SA | | 3.2 | |
Chevron Corp. | | 3.0 | |
Exxon Mobil Corp. | | 3.0 | |
McDonald’s Corp. | | 2.8 | |
Novartis AG ADR | | 2.8 | |
Wal-Mart Stores, Inc. | | 2.7 | |
Hewlett-Packard Co. | | 2.7 | |
Bank of New York Mellon Corp. (The) | | 2.6 | |
(2) Top Ten Holdings represented 29.9% of the Fund’s net assets as of 10/31/08. Excludes cash equivalents.
Sector Weightings(3)
By net assets
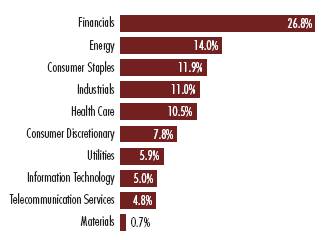
(3) As a percentage of the Fund’s net assets as of 10/31/08. Excludes cash equivalents.
The views expressed throughout this report are those of the portfolio managers and are current only through the end of the period of the report as stated on the cover. These views are subject to change at any time based upon market or other conditions, and the investment adviser disclaims any responsibility to update such views. These views may not be relied on as investment advice and, because investment decisions for a fund are based on many factors, may not be relied on as an indication of trading intent on behalf of any Eaton Vance fund. Portfolio information provided in the report may not be representative of the Fund’s current or future investments and may change due to active management.
2
Eaton Vance Tax-Managed Dividend Income Fund as of October 31, 2008
FUND PERFORMANCE
The line graphs and table set forth below provide information about the Fund’s performance. The line graphs compare the performance of Class A, Class B, Class C and Class I of the Fund with that of the Russell 1000 Value Index, a broad-based, unmanaged market index of 1000 U.S. value stocks. The lines on the graph represent the total returns of a hypothetical investment of $10,000 in each of Class A, Class B, Class C and Class I of the Fund and the Russell 1000 Value Index. Class A total returns are presented at net asset value and maximum public offering price. The table includes the total returns of each Class of the Fund at net asset value and maximum public offering price. The performance presented below does not reflect the deduction of taxes, if any, that a shareholder would pay on distributions or redemptions of Fund shares.
Performance(1)
| | Class A | | Class B | | Class C | | Class I | |
Share Class Symbol | | EADIX | | EBDIX | | ECDIX | | EIDIX | |
| | | | | | | | | |
Average Annual Total Returns (at net asset value) | | | | | | | | | |
One Year | | -35.08 | % | -35.51 | % | -35.51 | % | -34.84 | % |
Five Years | | 2.25 | | 1.50 | | 1.50 | | N.A. | |
Life of Fund† | | 2.85 | | 2.11 | | 2.11 | | -28.05 | |
| | | | | | | | | |
SEC Average Annual Total Returns (including sales charge or applicable CDSC) | | | | | | | |
One Year | | -38.83 | % | -38.55 | % | -36.12 | % | -34.84 | % |
Five Years | | 1.05 | | 1.18 | | 1.50 | | N.A. | |
Life of Fund† | | 1.74 | | 1.96 | | 2.11 | | -28.05 | |
† Inception Dates – Class A: 5/30/03; Class B: 5/30/03; Class C: 5/30/03; Class I: 8/27/07
(1) Average Annual Total Returns do not include the 5.75% maximum sales charge for Class A shares or the applicable contingent deferred sales charge (CDSC) for Class B and Class C shares. If sales charges were deducted, the returns would be lower. SEC Average Annual Total Returns for Class A reflect the maximum 5.75% sales charge. SEC returns for Class B shares reflect the applicable CDSC based on the following schedule: 5% - 1st and 2nd years; 4% - 3rd year; 3% - - 4th year; 2% - 5th year; 1% - 6th year. SEC returns for Class C reflect a 1% CDSC for the first year. Class I shares are offered to certain investors at net asset value.
Total Annual Operating Expenses(2)
| | Class A | | Class B | | Class C | | Class I | |
| | | | | | | | | |
Expense Ratio | | 1.14 | % | 1.89 | % | 1.89 | % | 0.89 | % |
(2) Source: Prospectus dated 3/1/08.
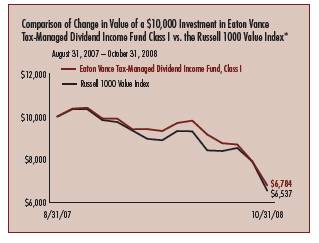
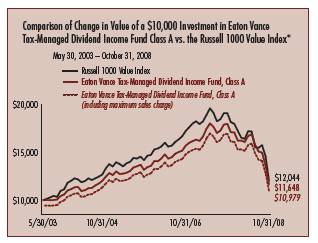
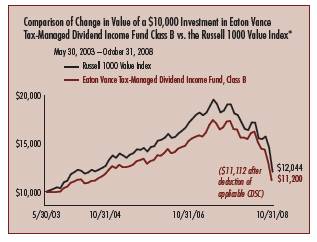
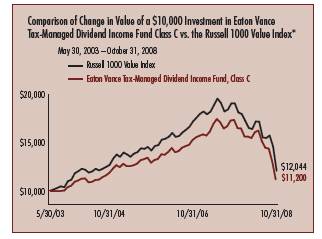
* Source: Lipper, Inc. Investment operations for Class A, Class B and Class C commenced on 5/30/03. Investment operations for Class I commenced on 8/27/07. It is not possible to invest directly in an Index. The Index’s total return does not reflect commissions or expenses that would have been incurred if an investor individually purchased or sold the securities represented in the Index. Index returns are available as of month end only.
Past performance is no guarantee of future results. Returns are historical and are calculated by determining the percentage change in net asset value or offering price (as applicable) with all distributions reinvested. Investment return and principal value will fluctuate so that shares, when redeemed, may be worth more or less than their original cost. Performance is for stated time period only; due to market volatility, the Fund’s current performance may be lower or higher than the quoted return. For performance as of the most recent month end, please refer to www.eatonvance.com.
3
“Return Before Taxes” does not take into consideration shareholder taxes. It is most relevant to tax-free or tax-deferred shareholder accounts. “Return After Taxes on Distributions” reflects the impact of federal income taxes due on Fund distributions of dividends and capital gains. It is most relevant to taxpaying shareholders who continue to hold their shares. “Return After Taxes on Distributions and Sale of Fund Shares” also reflects the impact of taxes on capital gain or loss realized upon a sale of shares. It is most relevant to taxpaying shareholders who sell their shares.
Average Annual Total Returns
(For the periods ended October 31, 2008)
Returns at Net Asset Value (NAV) (Class A)
| | One Year | | Five Years | | Life of Fund | |
| | | | | | | |
Return Before Taxes | | -35.08 | % | 2.25 | % | 2.85 | % |
Return After Taxes on Distributions | | -35.82 | | 1.40 | | 2.04 | |
Return After Taxes on Distributions and Sale of Fund Shares | | -21.63 | | 2.14 | | 2.64 | |
Returns at Public Offering Price (POP) (Class A)
| | One Year | | Five Years | | Life of Fund | |
| | | | | | | |
Return Before Taxes | | -38.83 | % | 1.05 | % | 1.74 | % |
Return After Taxes on Distributions | | -39.52 | | 0.21 | | 0.93 | |
Return After Taxes on Distributions and Sale of Fund Shares | | -24.14 | | 1.10 | | 1.68 | |
Average Annual Total Returns
(For the periods ended October 31, 2008)
Returns at Net Asset Value (NAV) (Class C)
| | One Year | | Five Years | | Life of Fund | |
| | | | | | | |
Return Before Taxes | | -35.51 | % | 1.50 | % | 2.11 | % |
Return After Taxes on Distributions | | -36.16 | | 0.78 | | 1.41 | |
Return After Taxes on Distributions and Sale of Fund Shares | | -22.05 | | 1.48 | | 1.99 | |
Returns at Public Offering Price (POP) (Class C)
| | One Year | | Five Years | | Life of Fund | |
| | | | | | | |
Return Before Taxes | | -36.12 | % | 1.50 | % | 2.11 | % |
Return After Taxes on Distributions | | -36.77 | | 0.78 | | 1.41 | |
Return After Taxes on Distributions and Sale of Fund Shares | | -22.45 | | 1.48 | | 1.99 | |
Average Annual Total Returns
(For the periods ended October 31, 2008)
Returns at Net Asset Value (NAV) (Class B)
| | One Year | | Five Years | | Life of Fund | |
| | | | | | | |
Return Before Taxes | | -35.51 | % | 1.50 | % | 2.11 | % |
Return After Taxes on Distributions | | -36.16 | | 0.78 | | 1.41 | |
Return After Taxes on Distributions and Sale of Fund Shares | | -22.06 | | 1.48 | | 1.98 | |
Returns at Public Offering Price (POP) (Class B)
| | One Year | | Five Years | | Life of Fund | |
| | | | | | | |
Return Before Taxes | | -38.55 | % | 1.18 | % | 1.96 | % |
Return After Taxes on Distributions | | -39.21 | | 0.44 | | 1.26 | |
Return After Taxes on Distributions and Sale of Fund Shares | | -24.03 | | 1.20 | | 1.86 | |
Average Annual Total Returns
(For the periods ended October 31, 2008)
Returns at Net Asset Value (NAV) (Class I)
| | One Year | | Five Years | | Life of Fund | |
| | | | | | | |
Return Before Taxes | | -34.84 | % | N.A. | | N.A. | |
Return After Taxes on Distributions | | -35.61 | | N.A. | | N.A. | |
Return After Taxes on Distributions and Sale of Fund Shares | | -21.43 | | N.A. | | N.A. | |
Returns at Public Offering Price (POP) (Class I)
| | One Year | | Five Years | | Life of Fund | |
| | | | | | | |
Return Before Taxes | | -34.84 | % | N.A. | | N.A. | |
Return After Taxes on Distributions | | -35.61 | | N.A. | | N.A. | |
Return After Taxes on Distributions and Sale of Fund Shares | | -21.43 | | N.A. | | N.A. | |
Class A, Class B and Class C commenced investment operations on 5/30/03. Class I of the Fund commenced investment operations on 8/27/07. Returns at Public Offering Price (POP) reflect the deduction of the maximum initial sales charge and applicable CDSC, while Returns at Net Asset Value (NAV) do not.
After-tax returns are calculated using certain assumptions. After-tax returns are calculated using the highest historical individual federal income tax rates and do not reflect the impact of state and local taxes. Actual after-tax returns depend on a shareholder’s tax situation and the actual characterization of distributions and may differ from those shown. After-tax returns are not relevant to shareholders who hold shares in tax-deferred accounts or to shares held by non-taxable entities. Return After Taxes on Distributions for a period may be the same as Return Before Taxes for the same period because no distributions were made during that period. Return After Taxes on Distributions and Sale of Fund Shares for a period may be greater than or equal to Return After Taxes on Distributions for the same period because of losses realized on the sale of Fund shares.
Past performance is no guarantee of future results. Returns are historical and are calculated by determining the percentage change in net asset value or offering price (as applicable) with all distributions reinvested. Investment return and principal value will fluctuate so that shares, when redeemed, may be worth more or less than their original cost. Performance is for the stated time period only; due to market volatility, the Fund’s current performance may be lower or higher than the quoted return. For performance as of the most recent month end, please refer to www.eatonvance.com.
4
Eaton Vance Tax-Managed Dividend Income Fund as of October 31, 2008
FUND EXPENSES
Example: As a shareholder of the Fund, you incur two types of costs: (1) transaction costs, including sales charges (loads) on purchases and redemption fees (if applicable); and (2) ongoing costs, including management fees; distribution or service fees; and other Fund expenses. This Example is intended to help you understand your ongoing costs (in dollars) of investing in the Fund and to compare these costs with the ongoing costs of investing in other mutual funds. The Example is based on an investment of $1,000 invested at the beginning of the period and held for the entire period (May 1, 2008 – October 31, 2008).
Actual Expenses: The first section of the table below provides information about actual account values and actual expenses. You may use the information in this section, together with the amount you invested, to estimate the expenses that you paid over the period. Simply divide your account value by $1,000 (for example, an $8,600 account value divided by $1,000 = 8.6), then multiply the result by the number in the first section under the heading entitled "Expenses Paid During Period" to estimate the expenses you paid on your account during this period.
Hypothetical Example for Comparison Purposes: The second section of the table below provides information about hypothetical account values and hypothetical expenses based on the actual Fund expense ratio and an assumed rate of return of 5% per year (before expenses), which is not the actual return of the Fund. The hypothetical account values and expenses may not be used to estimate the actual ending account balance or expenses you paid for the period. You may use this information to compare the ongoing costs of investing in your Fund and other funds. To do so, compare this 5% hypothetical example with the 5% hypothetical examples that appear in the shareholder reports of the other funds.
Please note that the expenses shown in the table are meant to highlight your ongoing costs only and do not reflect any transactional costs, such as sales charges (loads) or redemption fees (if applicable). Therefore, the second section of the table is useful in comparing ongoing costs only, and will not help you determine the relative total costs of owning different funds. In addition, if these transactional costs were included, your costs would have been higher.
Eaton Vance Tax-Managed Dividend Income Fund
| | | Beginning Account Value
(5/1/08) | | Ending Account Value
(10/31/08) | | Expenses Paid During Period*
(5/1/08 – 10/31/08) | |
| Actual | |
| Class A | | $ | 1,000.00 | | | $ | 698.20 | | | $ | 4.95 | | |
| Class B | | $ | 1,000.00 | | | $ | 695.80 | | | $ | 8.14 | | |
| Class C | | $ | 1,000.00 | | | $ | 695.80 | | | $ | 8.14 | | |
| Class I | | $ | 1,000.00 | | | $ | 699.40 | | | $ | 3.84 | | |
| Hypothetical | |
| (5% return per year before expenses) | |
| Class A | | $ | 1,000.00 | | | $ | 1,019.30 | | | $ | 5.89 | | |
| Class B | | $ | 1,000.00 | | | $ | 1,015.50 | | | $ | 9.68 | | |
| Class C | | $ | 1,000.00 | | | $ | 1,015.50 | | | $ | 9.68 | | |
| Class I | | $ | 1,000.00 | | | $ | 1,020.60 | | | $ | 4.57 | | |
* Expenses are equal to the Fund's annualized expense ratio of 1.16% for Class A shares, 1.91% for Class B shares, 1.91% for Class C shares and 0.90% for Class I shares, multiplied by the average account value over the period, multiplied by 184/366 (to reflect the one-half year period). The Example assumes that the $1,000 was invested at the net asset value per share determined at the close of business on April 30, 2008.
5
Eaton Vance Tax-Managed Dividend Income Fund as of October 31, 2008
PORTFOLIO OF INVESTMENTS
| Common Stocks — 82.1% | |
| Security | | Shares | | Value | |
| Aerospace & Defense — 7.5% | |
| General Dynamics Corp. | | | 500,000 | | | $ | 30,160,000 | | |
| Lockheed Martin Corp. | | | 300,000 | | | | 25,515,000 | | |
| Raytheon Co. | | | 583,661 | | | | 29,830,914 | | |
| United Technologies Corp. | | | 130,000 | | | | 7,144,800 | | |
| | | $ | 92,650,714 | | |
| Capital Markets — 4.3% | |
| Bank of New York Mellon Corp. (The) | | | 996,427 | | | $ | 32,483,520 | | |
| State Street Corp. | | | 465,295 | | | | 20,170,538 | | |
| | | $ | 52,654,058 | | |
| Commercial Banks — 1.8% | |
| PNC Financial Services Group, Inc. | | | 325,071 | | | $ | 21,672,484 | | |
| | | $ | 21,672,484 | | |
| Commercial Services & Supplies — 1.1% | |
| Waste Management, Inc. | | | 450,000 | | | $ | 14,053,500 | | |
| | | $ | 14,053,500 | | |
| Computers & Peripherals — 5.0% | |
| Hewlett-Packard Co. | | | 870,117 | | | $ | 33,308,079 | | |
| International Business Machines Corp. | | | 302,040 | | | | 28,080,659 | | |
| | | $ | 61,388,738 | | |
| Diversified Financial Services — 2.1% | |
| Citigroup, Inc. | | | 670,000 | | | $ | 9,145,500 | | |
| JPMorgan Chase & Co. | | | 400,000 | | | | 16,500,000 | | |
| | | $ | 25,645,500 | | |
| Diversified Telecommunication Services — 4.8% | |
| AT&T, Inc. | | | 1,093,750 | | | $ | 29,279,687 | | |
| Verizon Communications, Inc. | | | 1,000,000 | | | | 29,670,000 | | |
| | | $ | 58,949,687 | | |
| Electric Utilities — 5.9% | |
| E.ON AG | | | 375,000 | | | $ | 14,053,062 | | |
| Edison International | | | 550,000 | | | | 19,574,500 | | |
| FirstEnergy Corp. | | | 475,000 | | | | 24,776,000 | | |
| Fortum Oyj | | | 600,000 | | | | 14,745,626 | | |
| | | $ | 73,149,188 | | |
| Security | | Shares | | Value | |
| Energy Equipment & Services — 1.0% | |
| Schlumberger, Ltd. | | | 250,000 | | | $ | 12,912,500 | | |
| | | $ | 12,912,500 | | |
| Food & Staples Retailing — 3.6% | |
| Kroger Co. (The) | | | 398,892 | | | $ | 10,953,574 | | |
| Wal-Mart Stores, Inc. | | | 598,769 | | | | 33,417,298 | | |
| | | $ | 44,370,872 | | |
| Food Products — 3.2% | |
| Nestle SA | | | 1,000,000 | | | $ | 38,886,992 | | |
| | | $ | 38,886,992 | | |
| Hotels, Restaurants & Leisure — 2.8% | |
| McDonald's Corp. | | | 590,000 | | | $ | 34,178,700 | | |
| | | $ | 34,178,700 | | |
| Household Products — 0.8% | |
| Kimberly-Clark de Mexico SA de CV | | | 3,000,000 | | | $ | 9,862,056 | | |
| | | $ | 9,862,056 | | |
| Insurance — 3.5% | |
| Aflac, Inc. | | | 200,000 | | | $ | 8,856,000 | | |
| Chubb Corp. | | | 292,084 | | | | 15,135,793 | | |
| Travelers Companies, Inc. (The) | | | 450,000 | | | | 19,147,500 | | |
| | | $ | 43,139,293 | | |
| Leisure Equipment & Products — 1.9% | |
| Mattel, Inc. | | | 1,550,000 | | | $ | 23,281,000 | | |
| | | $ | 23,281,000 | | |
| Metals & Mining — 0.7% | |
| Southern Copper Corp. | | | 600,000 | | | $ | 8,736,000 | | |
| | | $ | 8,736,000 | | |
| Oil, Gas & Consumable Fuels — 12.4% | |
| BP PLC ADR | | | 580,000 | | | $ | 28,826,000 | | |
| Chevron Corp. | | | 500,000 | | | | 37,300,000 | | |
| Exxon Mobil Corp. | | | 500,000 | | | | 37,060,000 | | |
| Marathon Oil Corp. | | | 744,648 | | | | 21,669,257 | | |
| Total SA ADR | | | 500,000 | | | | 27,720,000 | | |
| | | $ | 152,575,257 | | |
See notes to financial statements
6
Eaton Vance Tax-Managed Dividend Income Fund as of October 31, 2008
PORTFOLIO OF INVESTMENTS CONT'D
| Security | | Shares | | Value | |
| Pharmaceuticals — 10.5% | |
| Johnson & Johnson | | | 750,000 | | | $ | 46,005,000 | | |
| Merck & Co., Inc. | | | 753,975 | | | | 23,335,526 | | |
| Novartis AG ADR | | | 670,271 | | | | 34,177,118 | | |
| Schering-Plough Corp. | | | 1,760,375 | | | | 25,507,834 | | |
| | | $ | 129,025,478 | | |
| Real Estate Investment Trusts (REITs) — 0.5% | |
| Simon Property Group, Inc. | | | 100,000 | | | $ | 6,703,000 | | |
| | | $ | 6,703,000 | | |
| Road & Rail — 2.3% | |
| Canadian National Railway Co. | | | 650,000 | | | $ | 28,119,000 | | |
| | | $ | 28,119,000 | | |
| Specialty Retail — 2.0% | |
| Home Depot, Inc. | | | 1,068,696 | | | $ | 25,210,539 | | |
| | | $ | 25,210,539 | | |
| Textiles, Apparel & Luxury Goods — 1.1% | |
| VF Corp. | | | 250,000 | | | $ | 13,775,000 | | |
| | | $ | 13,775,000 | | |
| Tobacco — 3.3% | |
| Philip Morris International, Inc. | | | 950,000 | | | $ | 41,296,500 | | |
| | | $ | 41,296,500 | | |
Total Common Stocks
(identified cost $1,078,179,355) | | $ | 1,012,236,056 | | |
| Preferred Stocks — 15.4% | |
| Security | | Shares | | Value | |
| Commercial Banks — 6.6% | |
| Abbey National Capital Trust I, 8.963%(1) | | | 3,500 | | | $ | 2,756,113 | | |
| Auction Pass-Through Trust 2006-5B - USB H, 0.00%(1)(2) | | | 40 | | | | 1,000 | | |
| Auction Pass-Through Trust 2006-6B - USB H, 0.00%(1)(2) | | | 40 | | | | 1,000 | | |
| Barclays Bank PLC, 8.55%(1)(2) | | | 2,560 | | | | 2,061,335 | | |
| BBVA International Preferred SA Unipersonal, 5.919%(1) | | | 3,500 | | | | 1,651,849 | | |
| Citigroup Inc., Series AA, 8.125% | | | 355,500 | | | | 5,990,175 | | |
| Credit Agricole SA/London, 6.637%(1)(2) | | | 10,400 | | | | 8,428,701 | | |
| DB Capital Funding VIII, 6.375% | | | 115,000 | | | | 1,844,600 | | |
| Security | | Shares | | Value | |
| Commercial Banks (continued) | |
| DB Contingent Capital Trust II, 6.55% | | | 160,000 | | | $ | 2,390,400 | | |
| HBOS PLC, 6.657%(1)(2) | | | 11,350 | | | | 5,319,257 | | |
| HSBC Capital Funding LP, 9.547%(1)(2) | | | 4,000 | | | | 3,449,192 | | |
| HSBC Capital Funding LP, 10.176%(1)(2) | | | 3,250 | | | | 2,698,212 | | |
| JPMorgan Chase & Co., 7.90%(1) | | | 16,000 | | | | 13,007,360 | | |
| Landsbanki Islands HF, 7.431%(1)(2)(4) | | | 14,750 | | | | 221,250 | | |
| National City Corp., Series F, 9.875%(1) | | | 270,000 | | | | 5,656,500 | | |
| Royal Bank of Scotland Group PLC, 7.64%(1) | | | 115 | | | | 5,586,413 | | |
| Royal Bank of Scotland Group PLC, 9.118% | | | 800 | | | | 747,537 | | |
| Santander Finance Unipersonal, 6.50% | | | 525,000 | | | | 8,400,000 | | |
| Standard Chartered PLC, 6.409%(1)(2) | | | 103 | | | | 5,624,325 | | |
| UBS Preferred Funding Trust I, 8.622%(1) | | | 7,105 | | | | 5,321,979 | | |
| | | $ | 81,157,198 | | |
| Diversified Financial Services — 3.8% | |
| CoBank, 11.00% | | | 300,000 | | | $ | 15,197,250 | | |
| Merrill Lynch & Co., Inc., 4.00%(1) | | | 1,275,000 | | | | 12,265,500 | | |
| Merrill Lynch & Co., Inc., 6.25% | | | 95,000 | | | | 1,382,250 | | |
| Merrill Lynch & Co., Inc., 6.70% | | | 387,350 | | | | 6,193,727 | | |
Preferred Pass-Through Trust, 2006-A GS,
Class A, 5.875%(1)(2) | | | 70 | | | | 11,446,918 | | |
Structured Auction Rate Securities/Stock
Custodial-Receipts Merrill H, 5.88%(1)(2) | | | 2,100 | | | | 5,271 | | |
| | | $ | 46,490,916 | | |
| Food Products — 0.1% | |
| Ocean Spray Cranberries, Inc., 6.25%(2) | | | 13,250 | | | $ | 1,254,196 | | |
| | | $ | 1,254,196 | | |
| Insurance — 3.5% | |
| Aegon NV, 6.375% | | | 205,000 | | | $ | 2,050,000 | | |
| Arch Capital Group, Ltd., Series A, 8.00% | | | 185,500 | | | | 3,552,325 | | |
| Arch Capital Group, Ltd., Series B, 7.875% | | | 26,500 | | | | 478,590 | | |
| AXA SA, 6.463%(1)(2) | | | 5,000 | | | | 2,872,160 | | |
| Endurance Specialty Holdings, Ltd., 7.75% | | | 181,550 | | | | 2,857,597 | | |
| ING Capital Funding Trust III, 8.439%(1) | | | 11,750 | | | | 9,485,552 | | |
| ING Groep NV, 8.50% | | | 325,000 | | | | 5,599,750 | | |
| MetLife, Inc., 6.50% | | | 350,000 | | | | 5,747,000 | | |
| PartnerRe, Ltd., 6.50% | | | 52,000 | | | | 876,200 | | |
| PartnerRe, Ltd., 6.75% | | | 139,700 | | | | 2,444,750 | | |
| RAM Holdings, Ltd., Series A, 7.50%(1) | | | 5,000 | | | | 3,156,563 | | |
| RenaissanceRe Holdings, Ltd., 6.08% | | | 82,000 | | | | 1,158,660 | | |
| RenaissanceRe Holdings, Ltd., 6.60% | | | 175,000 | | | | 2,857,750 | | |
| | | $ | 43,136,897 | | |
See notes to financial statements
7
Eaton Vance Tax-Managed Dividend Income Fund as of October 31, 2008
PORTFOLIO OF INVESTMENTS CONT'D
| Security | | Shares | | Value | |
| Oil, Gas & Consumable Fuels — 0.6% | |
| Kinder Morgan GP, Inc., 8.33%(1)(2) | | | 7,000 | | | $ | 7,567,000 | | |
| | | $ | 7,567,000 | | |
| Real Estate Investment Trusts (REITs) — 0.8% | |
| AMB Property Corp., 6.75% | | | 79,900 | | | $ | 984,368 | | |
| BRE Properties, Series D, 6.75% | | | 40,000 | | | | 639,600 | | |
| Duke Realty Corp., 6.95% | | | 120,000 | | | | 1,578,000 | | |
| Health Care Property, Inc., 7.10% | | | 150,000 | | | | 2,437,500 | | |
| ProLogis Trust, 6.75% | | | 65,000 | | | | 915,850 | | |
| PS Business Parks, Inc., 6.70% | | | 50,000 | | | | 747,500 | | |
| PS Business Parks, Inc., 7.95% | | | 50,000 | | | | 862,500 | | |
| Vornado Realty Trust, 6.75% | | | 75,000 | | | | 1,208,250 | | |
| | | $ | 9,373,568 | | |
| Thrifts & Mortgage Finance — 0.0% | |
| Federal National Mortgage Association, Series O, 7.00%(1) | | | 100,000 | | | $ | 303,130 | | |
| Indymac Bank FSB, 8.50%(2)(4) | | | 475,000 | | | | 4,750 | | |
| | | $ | 307,880 | | |
Total Preferred Stocks
(identified cost $310,820,093) | | $ | 189,287,655 | | |
| Corporate Bonds & Notes — 0.9% | |
| Security | | Principal
Amount
(000's omitted) | | Value | |
| Retail-Food and Drug — 0.9% | |
| CVS Caremark Corp., 6.302%, 6/1/37(1) | | $ | 15,000 | | | $ | 10,507,665 | | |
| | | $ | 10,507,665 | | |
Total Corporate Bonds & Notes
(identified cost $12,413,286) | | $ | 10,507,665 | | |
| Short-Term Investments — 2.4% | |
| Description | | Interest
(000's omitted) | | Value | |
| Cash Management Portfolio, 1.90%(3) | | $ | 30,202 | | | $ | 30,202,412 | | |
Total Short-Term Investments
(identified cost $30,202,412) | | $ | 30,202,412 | | |
Total Investments — 100.8%
(identified cost $1,431,615,146) | | | | $ | 1,242,233,788 | | |
| Other Assets, Less Liabilities — (0.8)% | | | | $ | (9,776,262 | ) | |
| Net Assets — 100.0% | | | | $ | 1,232,457,526 | | |
ADR - American Depository Receipt
(1) Variable rate security. The stated interest rate represents the rate in effect at October 31, 2008.
(2) Security exempt from registration under Rule 144A of the Securities Act of 1933. These securities may be sold in transactions exempt from registration, normally to qualified institutional buyers. At October 31, 2008, the aggregate value of the securities is $50,954,567 or 4.1% of the Fund's net assets.
(3) Affiliated investment company available to Eaton Vance portfolios and funds which invests in high quality, U.S. dollar denominated money market instruments. The rate shown is the annualized seven-day yield as of October 31, 2008.
(4) Defaulted security.
See notes to financial statements
8
Eaton Vance Tax-Managed Dividend Income Fund as of October 31, 2008
FINANCIAL STATEMENTS
Statement of Assets and Liabilities
As of October 31, 2008
| Assets | |
| Unaffiliated investments, at value (identified cost, $1,401,412,734) | | $ | 1,212,031,376 | | |
| Affiliated investment, at value (identified cost, $30,202,412) | | | 30,202,412 | | |
| Receivable for investments sold | | | 29,655,056 | | |
| Receivable for Fund shares sold | | | 3,547,904 | | |
| Dividends and interest receivable | | | 3,138,468 | | |
| Interest receivable from affiliated investment | | | 22,994 | | |
| Tax reclaims receivable | | | 1,646,193 | | |
| Total assets | | $ | 1,280,244,403 | | |
| Liabilities | |
| Payable for investments purchased | | $ | 41,084,035 | | |
| Payable for Fund shares redeemed | | | 4,830,131 | | |
| Payable to affiliate for investment adviser fee | | | 655,979 | | |
| Payable to affiliate for distribution and service fees | | | 619,945 | | |
| Payable to affiliate for administration fee | | | 158,061 | | |
| Payable to affiliate for Trustees' fees | | | 4,315 | | |
| Accrued expenses | | | 434,411 | | |
| Total liabilities | | $ | 47,786,877 | | |
| Net Assets | | $ | 1,232,457,526 | | |
| Sources of Net Assets | |
| Paid-in capital | | $ | 1,796,117,327 | | |
| Accumulated net realized loss (computed on the basis of identified cost) | | | (390,995,754 | ) | |
| Accumulated undistributed net investment income | | | 16,914,325 | | |
| Net unrealized depreciation (computed on the basis of identified cost) | | | (189,578,372 | ) | |
| Total | | $ | 1,232,457,526 | | |
| Class A Shares | |
| Net Assets | | $ | 673,781,566 | | |
| Shares Outstanding | | | 76,278,544 | | |
Net Asset Value and Redemption Price Per Share
(net assets ÷ shares of beneficial interest outstanding) | | $ | 8.83 | | |
Maximum Offering Price Per Share
(100 ÷ 94.25 of $8.83) | | $ | 9.37 | | |
| Class B Shares | |
| Net Assets | | $ | 97,996,105 | | |
| Shares Outstanding | | | 11,116,545 | | |
Net Asset Value and Offering Price Per Share*
(net assets ÷ shares of beneficial interest outstanding) | | $ | 8.82 | | |
| Class C Shares | |
| Net Assets | | $ | 458,907,105 | | |
| Shares Outstanding | | | 52,044,195 | | |
Net Asset Value and Offering Price Per Share*
(net assets ÷ shares of beneficial interest outstanding) | | $ | 8.82 | | |
| Class I Shares | |
| Net Assets | | $ | 1,772,750 | | |
| Shares Outstanding | | | 200,512 | | |
Net Asset Value, Offering Price and Redemption Price Per Share
(net assets ÷ shares of beneficial interest outstanding) | | $ | 8.84 | | |
| On sales of $50,000 or more, the offering price of Class A shares is reduced. | |
* Redemption price per share is equal to the net asset value less any applicable contingent deferred sales charge.
Statement of Operations
For the Year Ended
October 31, 2008
| Investment Income | |
| Dividends (net of foreign taxes, $7,322,542) | | $ | 145,561,487 | | |
| Interest and other | | | 553,612 | | |
| Interest income allocated from affiliated investment | | | 1,009,744 | | |
| Expenses allocated from affiliated investment | | | (141,790 | ) | |
| Total investment income | | $ | 146,983,053 | | |
| Expenses | |
| Investment adviser fee | | $ | 11,083,983 | | |
| Administration fee | | | 2,711,850 | | |
| Trustees' fees and expenses | | | 43,377 | | |
Distribution and service fees
Class A | | | 2,465,974 | | |
| Class B | | | 1,487,568 | | |
| Class C | | | 6,718,708 | | |
| Transfer and dividend disbursing agent fees | | | 1,176,485 | | |
| Custodian fee | | | 531,870 | | |
| Printing and postage | | | 186,545 | | |
| Registration fees | | | 85,211 | | |
| Legal and accounting services | | | 78,802 | | |
| Miscellaneous | | | 133,054 | | |
| Total expenses | | $ | 26,703,427 | | |
Deduct —
Reduction of custodian fee | | $ | 11 | | |
| Total expense reductions | | $ | 11 | | |
| Net expenses | | $ | 26,703,416 | | |
| Net investment income | | $ | 120,279,637 | | |
| Realized and Unrealized Gain (Loss) | |
Net realized gain (loss) —
Investment transactions (identified cost basis) | | $ | (345,549,855 | ) | |
| Foreign currency transactions | | | (153,452 | ) | |
| Net realized loss | | $ | (345,703,307 | ) | |
Change in unrealized appreciation (depreciation) —
Investments (identified cost basis) | | $ | (498,127,969 | ) | |
| Foreign currency | | | (255,884 | ) | |
| Net change in unrealized appreciation (depreciation) | | $ | (498,383,853 | ) | |
| Net realized and unrealized loss | | $ | (844,087,160 | ) | |
| Net decrease in net assets from operations | | $ | (723,807,523 | ) | |
See notes to financial statements
9
Eaton Vance Tax-Managed Dividend Income Fund as of October 31, 2008
FINANCIAL STATEMENTS CONT'D
Statements of Changes in Net Assets
Increase (Decrease)
in Net Assets | | Year Ended
October 31, 2008 | | Year Ended
October 31, 2007 | |
| From operations — | |
| Net investment income | | $ | 120,279,637 | | | $ | 93,928,131 | | |
Net realized loss from investment
and foreign currency transactions | | | (345,703,307 | ) | | | (10,814,604 | ) | |
Net change in unrealized appreciation
(depreciation) of investments and
foreign currency | | | (498,383,853 | ) | | | 133,375,955 | | |
Net increase (decrease) in net assets
from operations | | $ | (723,807,523 | ) | | $ | 216,489,482 | | |
Distributions to shareholders —
From net investment income
Class A | | $ | (63,970,171 | ) | | $ | (50,655,751 | ) | |
| Class B | | | (8,505,890 | ) | | | (7,862,281 | ) | |
| Class C | | | (38,497,628 | ) | | | (30,524,646 | ) | |
| Class I | | | (64,070 | ) | | | (3,118 | ) | |
| Total distributions to shareholders | | $ | (111,037,759 | ) | | $ | (89,045,796 | ) | |
Transactions in shares of beneficial interest —
Proceeds from sale of shares
Class A | | $ | 266,401,511 | | | $ | 516,071,451 | | |
| Class B | | | 16,020,877 | | | | 45,311,998 | | |
| Class C | | | 130,221,388 | | | | 289,421,744 | | |
| Class I | | | 2,375,343 | | | | 451,000 | | |
Net asset value of shares issued to
shareholders in payment of
distributions declared
Class A | | | 43,709,066 | | | | 34,879,017 | | |
| Class B | | | 5,316,986 | | | | 4,910,874 | | |
| Class C | | | 21,289,921 | | | | 16,632,343 | | |
| Class I | | | 40,804 | | | | 1,545 | | |
Cost of shares redeemed
Class A | | | (327,279,717 | ) | | | (142,102,164 | ) | |
| Class B | | | (31,280,249 | ) | | | (19,341,240 | ) | |
| Class C | | | (161,997,125 | ) | | | (64,509,162 | ) | |
| Class I | | | (424,363 | ) | | | — | | |
Net asset value of shares exchanged
Class A | | | 5,783,728 | | | | 5,875,976 | | |
| Class B | | | (5,783,728 | ) | | | (5,875,976 | ) | |
Net increase (decrease) in net assets from
Fund share transactions | | $ | (35,605,558 | ) | | $ | 681,727,406 | | |
| Net increase (decrease) in net assets | | $ | (870,450,840 | ) | | $ | 809,171,092 | | |
| Net Assets | |
| At beginning of year | | $ | 2,102,908,366 | | | $ | 1,293,737,274 | | |
| At end of year | | $ | 1,232,457,526 | | | $ | 2,102,908,366 | | |
Accumulated undistributed
net investment income
included in net assets | |
| At end of year | | $ | 16,914,325 | | | $ | 11,250,564 | | |
See notes to financial statements
10
Eaton Vance Tax-Managed Dividend Income Fund as of October 31, 2008
FINANCIAL STATEMENTS CONT'D
Financial Highlights
| | | Class A | |
| | | Year Ended October 31, | | Period Ended | | Year Ended April 30, | | Period Ended | |
| | | 2008 | | 2007 | | October 31, 2006(1) | | 2006 | | 2005 | | April 30, 2004(2) | |
| Net asset value — Beginning of period | | $ | 14.520 | | | $ | 13.400 | | | $ | 12.990 | | | $ | 11.820 | | | $ | 10.640 | | | $ | 10.000 | | |
| Income (loss) from operations | |
| Net investment income(3) | | $ | 0.862 | | | $ | 0.810 | | | $ | 0.239 | | | $ | 0.922 | | | $ | 0.743 | | | $ | 0.500 | | |
| Net realized and unrealized gain (loss) | | | (5.751 | ) | | | 1.080 | | | | 0.534 | | | | 0.889 | | | | 0.989 | | | | 0.437 | | |
| Total income (loss) from operations | | $ | (4.889 | ) | | $ | 1.890 | | | $ | 0.773 | | | $ | 1.811 | | | $ | 1.732 | | | $ | 0.937 | | |
| Less distributions | |
| From net investment income | | $ | (0.801 | ) | | $ | (0.770 | ) | | $ | (0.363 | ) | | $ | (0.641 | ) | | $ | (0.552 | ) | | $ | (0.297 | ) | |
| Total distributions | | $ | (0.801 | ) | | $ | (0.770 | ) | | $ | (0.363 | ) | | $ | (0.641 | ) | | $ | (0.552 | ) | | $ | (0.297 | ) | |
| Net asset value — End of period | | $ | 8.830 | | | $ | 14.520 | | | $ | 13.400 | | | $ | 12.990 | | | $ | 11.820 | | | $ | 10.640 | | |
| Total Return(4) | | | (35.08 | )% | | | 14.47 | % | | | 6.14 | %(8) | | | 15.78 | % | | | 16.54 | % | | | 9.44 | %(8) | |
| Ratios/Supplemental Data | |
| Net assets, end of period (000's omitted) | | $ | 673,782 | | | $ | 1,141,383 | | | $ | 659,950 | | | $ | 452,785 | | | $ | 215,759 | | | $ | 104,169 | | |
| Ratios (As a percentage of average daily net assets): | | | | | | | | | | | | | | | | | | | | | | | | | |
| Expenses before custodian fee reduction(6) | | | 1.15 | % | | | 1.14 | % | | | 1.19 | %(7) | | | 1.21 | %(5) | | | 1.25 | %(5) | | | 1.40 | %(5)(7) | |
| Net investment income | | | 7.00 | % | | | 5.72 | % | | | 3.69 | %(7) | | | 7.49 | % | | | 6.46 | % | | | 5.05 | %(7) | |
| Portfolio Turnover | | | 181 | % | | | 139 | % | | | 46 | %(8) | | | 247 | % | | | 162 | % | | | 117 | %(8) | |
(1) For the six month period ended October 31, 2006. During the period ended October 31, 2006, the Fund changed its fiscal year end from April 30 to October 31.
(2) For the period from the start of business, May 30, 2003, to April 30, 2004.
(3) Computed using average shares outstanding.
(4) Net investment income per share was calculated by determining the percentage change in net asset value with all distributions reinvested.
(5) The investment adviser waived a portion of its investment adviser fee and/or the administrator subsidized certain operating expenses (equal to 0.01%, 0.01% and 0.07% of average daily net assets for the years ended April 30, 2006 and 2005 and the period ended April 30, 2004, respectively).
(6) Excludes the effect of custody fee credits, if any, of less than 0.005%.
(7) Annualized.
(8) Not annualized.
See notes to financial statements
11
Eaton Vance Tax-Managed Dividend Income Fund as of October 31, 2008
FINANCIAL STATEMENTS CONT'D
Financial Highlights
| | | Class B | |
| | | Year Ended October 31, | | Period Ended | | Year Ended April 30, | | Period Ended | |
| | | 2008 | | 2007 | | October 31, 2006(1) | | 2006 | | 2005 | | April 30, 2004(2) | |
| Net asset value — Beginning of period | | $ | 14.490 | | | $ | 13.370 | | | $ | 12.960 | | | $ | 11.790 | | | $ | 10.630 | | | $ | 10.000 | | |
| Income (loss) from operations | |
| Net investment income(3) | | $ | 0.772 | | | $ | 0.716 | | | $ | 0.200 | | | $ | 0.801 | | | $ | 0.648 | | | $ | 0.427 | | |
| Net realized and unrealized gain (loss) | | | (5.736 | ) | | | 1.064 | | | | 0.526 | | | | 0.919 | | | | 0.986 | | | | 0.446 | | |
| Total income (loss) from operations | | $ | (4.964 | ) | | $ | 1.780 | | | $ | 0.726 | | | $ | 1.720 | | | $ | 1.634 | | | $ | 0.873 | | |
| Less distributions | |
| From net investment income | | $ | (0.706 | ) | | $ | (0.660 | ) | | $ | (0.316 | ) | | $ | (0.550 | ) | | $ | (0.474 | ) | | $ | (0.243 | ) | |
| Total distributions | | $ | (0.706 | ) | | $ | (0.660 | ) | | $ | (0.316 | ) | | $ | (0.550 | ) | | $ | (0.474 | ) | | $ | (0.243 | ) | |
| Net asset value — End of period | | $ | 8.820 | | | $ | 14.490 | | | $ | 13.370 | | | $ | 12.960 | | | $ | 11.790 | | | $ | 10.630 | | |
| Total Return(4) | | | (35.51 | )% | | | 13.62 | % | | | 5.76 | %(8) | | | 14.97 | % | | | 15.57 | % | | | 8.79 | %(8) | |
| Ratios/Supplemental Data | |
| Net assets, end of period (000's omitted) | | $ | 97,996 | | | $ | 181,741 | | | $ | 143,731 | | | $ | 120,272 | | | $ | 79,871 | | | $ | 40,731 | | |
| Ratios (As a percentage of average daily net assets): | | | | | | | | | | | | | | | | | | | | | | | | | |
| Expenses before custodian fee reduction(6) | | | 1.90 | % | | | 1.89 | % | | | 1.94 | %(7) | | | 1.96 | %(5) | | | 2.00 | %(5) | | | 2.15 | %(5)(7) | |
| Net investment income | | | 6.26 | % | | | 5.08 | % | | | 3.11 | %(7) | | | 6.53 | % | | | 5.65 | % | | | 4.31 | %(7) | |
| Portfolio Turnover | | | 181 | % | | | 139 | % | | | 46 | %(8) | | | 247 | % | | | 162 | % | | | 117 | %(8) | |
(1) For the six month period ended October 31, 2006. During the period ended October 31, 2006, the Fund changed its fiscal year end from April 30 to October 31.
(2) For the period from the start of business, May 30, 2003, to April 30, 2004.
(3) Computed using average shares outstanding.
(4) Net investment income per share was calculated by determining the percentage change in net asset value with all distributions reinvested.
(5) The investment adviser waived a portion of its investment adviser fee and/or the administrator subsidized certain operating expenses (equal to 0.01%, 0.01% and 0.07% of average daily net assets for the years ended April 30, 2006 and 2005 and the period ended April 30, 2004, respectively).
(6) Excludes the effect of custody fee credits, if any, of less than 0.005%.
(7) Annualized.
(8) Not annualized.
See notes to financial statements
12
Eaton Vance Tax-Managed Dividend Income Fund as of October 31, 2008
FINANCIAL STATEMENTS CONT'D
Financial Highlights
| | | Class C | |
| | | Year Ended October 31, | | Period Ended | | Year Ended April 30, | | Period Ended | |
| | | 2008 | | 2007 | | October 31, 2006(1) | | 2006 | | 2005 | | April 30, 2004(2) | |
| Net asset value — Beginning of period | | $ | 14.500 | | | $ | 13.370 | | | $ | 12.960 | | | $ | 11.800 | | | $ | 10.630 | | | $ | 10.000 | | |
| Income (loss) from operations | |
| Net investment income(3) | | $ | 0.769 | | | $ | 0.704 | | | $ | 0.192 | | | $ | 0.817 | | | $ | 0.653 | | | $ | 0.432 | | |
| Net realized and unrealized gain (loss) | | | (5.742 | ) | | | 1.086 | | | | 0.534 | | | | 0.893 | | | | 0.991 | | | | 0.441 | | |
| Total income (loss) from operations | | $ | (4.973 | ) | | $ | 1.790 | | | $ | 0.726 | | | $ | 1.710 | | | $ | 1.644 | | | $ | 0.873 | | |
| Less distributions | |
| From net investment income | | $ | (0.707 | ) | | $ | (0.660 | ) | | $ | (0.316 | ) | | $ | (0.550 | ) | | $ | (0.474 | ) | | $ | (0.243 | ) | |
| Total distributions | | $ | (0.707 | ) | | $ | (0.660 | ) | | $ | (0.316 | ) | | $ | (0.550 | ) | | $ | (0.474 | ) | | $ | (0.243 | ) | |
| Net asset value — End of period | | $ | 8.820 | | | $ | 14.500 | | | $ | 13.370 | | | $ | 12.960 | | | $ | 11.800 | | | $ | 10.630 | | |
| Total Return(4) | | | (35.51 | )% | | | 13.63 | % | | | 5.76 | %(8) | | | 14.87 | % | | | 15.66 | % | | | 8.79 | %(8) | |
| Ratios/Supplemental Data | |
| Net assets, end of period (000's omitted) | | $ | 458,907 | | | $ | 779,330 | | | $ | 490,056 | | | $ | 350,758 | | | $ | 185,303 | | | $ | 92,329 | | |
| Ratios (As a percentage of average daily net assets): | | | | | | | | | | | | | | | | | | | | | | | | | |
| Expenses before custodian fee reduction(6) | | | 1.90 | % | | | 1.89 | % | | | 1.94 | %(7) | | | 1.96 | %(5) | | | 2.00 | %(5) | | | 2.15 | %(5)(7) | |
| Net investment income | | | 6.25 | % | | | 4.98 | % | | | 2.98 | %(7) | | | 6.65 | % | | | 5.69 | % | | | 4.34 | %(7) | |
| Portfolio Turnover | | | 181 | % | | | 139 | % | | | 46 | %(8) | | | 247 | % | | | 162 | % | | | 117 | %(8) | |
(1) For the six month period ended October 31, 2006. During the period ended October 31, 2006, the Fund changed its fiscal year end from April 30 to October 31.
(2) For the period from the start of business, May 30, 2003, to April 30, 2004.
(3) Computed using average shares outstanding.
(4) Net investment income per share was calculated by determining the percentage change in net asset value with all distributions reinvested.
(5) The investment adviser waived a portion of its investment adviser fee and/or the administrator subsidized certain operating expenses (equal to 0.01%, 0.01% and 0.07% of average daily net assets for the years ended April 30, 2006 and 2005 and the period ended April 30, 2004, respectively).
(6) Excludes the effect of custody fee credits, if any, of less than 0.005%.
(7) Annualized.
(8) Not annualized.
See notes to financial statements
13
Eaton Vance Tax-Managed Dividend Income Fund as of October 31, 2008
FINANCIAL STATEMENTS CONT'D
Financial Highlights
| | | Class I | |
| | | Year Ended
October 31, 2008 | | Period Ended
October 31, 2007(1) | |
| Net asset value — Beginning of period | | $ | 14.530 | | | $ | 14.100 | | |
| Income (loss) from operations | |
| Net investment income(2) | | $ | 0.681 | | | $ | 0.054 | | |
| Net realized and unrealized gain (loss) | | | (5.538 | ) | | | 0.514 | | |
| Total income (loss) from operations | | $ | (4.857 | ) | | $ | 0.568 | | |
| Less distributions | |
| From net investment income | | $ | (0.833 | ) | | $ | (0.138 | ) | |
| Total distributions | | $ | (0.833 | ) | | $ | (0.138 | ) | |
| Net asset value — End of period | | $ | 8.840 | | | $ | 14.530 | | |
| Total Return(3) | | | (34.84 | )% | | | 4.04 | %(6) | |
| Ratios/Supplemental Data | |
| Net assets, end of period (000's omitted) | | $ | 1,773 | | | $ | 453 | | |
| Ratios (As a percentage of average daily net assets): | |
| Expenses before custodian fee reduction(4) | | | 0.90 | % | | | 0.89 | %(5) | |
| Net investment income | | | 5.95 | % | | | 2.06 | %(5) | |
| Portfolio Turnover | | | 181 | % | | | 139 | % | |
(1) For the period from the start of business, August 27, 2007, to October 31, 2007.
(2) Computed using average shares outstanding.
(3) Net investment income per share was calculated by determining the percentage change in net asset value with all distributions reinvested.
(4) Excludes the effect of custody fee credits, if any, of less than 0.005%.
(5) Annualized.
(6) Not annualized.
See notes to financial statements
14
Eaton Vance Tax-Managed Dividend Income Fund as of October 31, 2008
NOTES TO FINANCIAL STATEMENTS
1 Significant Accounting Policies
Eaton Vance Tax-Managed Dividend Income Fund (the Fund) is a diversified series of Eaton Vance Mutual Funds Trust (the Trust). The Trust is a Massachusetts business trust registered under the Investment Company Act of 1940, as amended (the 1940 Act), as an open-end management investment company. The Fund's investment objective is to achieve after-tax total return by investing primarily in a diversified portfolio of common and preferred stocks. The Fund offers four classes of shares. Class A shares are generally sold subject to a sales charge imposed at time of purchase. Class B and Class C shares are sold at net asset value and are generally subject to a contingent deferred sales charge (see Note 5). Class I shares are sold at net asset value and are not subject to a sales charge. Class B shares automatically convert to Class A shares eight years after their purchase as described in the Fund's prospectus. Each class represents a pro-rata interest in the Fund, but votes separately on class-specific matters and (as noted below) is subject to different expenses. Realized and unrealized gains and losses and net investment income and losses, other than class-specific expenses, are allocated daily to each class of shares based on the relative net assets of each class to the total net assets of the Fund. Each class of shares differs in its distribution plan and certain other class-specific expenses.
The following is a summary of significant accounting policies of the Fund. The policies are in conformity with accounting principles generally accepted in the United States of America.
A Investment Valuation — Equity securities listed on a U.S. securities exchange generally are valued at the last sale price on the day of valuation or, if no sales took place on such date, at the mean between the closing bid and asked prices therefore on the exchange where such securities are principally traded. Equity securities listed on the NASDAQ Global or Global Select Market generally are valued at the NASDAQ official closing price. Unlisted or listed securities for which closing sales prices or closing quotations are not available are valued at the mean between the latest available bid and asked prices or, in the case of preferred equity securities that are not listed or traded in the over-the-counter market, by an independent pricing service. The value of preferre d equity securities that are valued by a pricing service on a bond basis will be adjusted by an income factor, to be determined by the investment adviser, to reflect the next anticipated regular dividend. Debt obligations, including listed securities and securities for which quotations are available, will normally be valued on the basis of market quotations provided by independent pricing services. The pricing services consider various factors relating to bonds and/or market transactions to determine market value. Short-term debt securities with a remaining maturity of sixty days or less are valued at amortized cost, which approximates market value. If short-term debt securities are acquired with a remaining maturity of more than sixty days, they will be valued by a pricing service. Foreign securities and currencies are valued in U.S. dollars, based on foreign currency exchange rate quotations supplied by an independent quotation service . The independent service uses a proprietary model to determine the exchange rate. Inputs to the model include reported trades and implied bid/ask spreads. The daily valuation of exchange-traded foreign securities generally is determined as of the close of trading on the principal exchange on which such securities trade. Events occurring after the close of trading on foreign exchanges may result in adjustments to the valuation of foreign securities to more accurately reflect their fair value as of the close of regular trading on the New York Stock Exchange. When valuing foreign equity securities that meet certain criteria, the Trustees have approved the use of a fair value service that values such securities to reflect market trading that occurs after the close of the applicable foreign markets of comparable securities or other instruments that have a strong correlation to the fair-valued securities. Investments for which valuations or market quotations are not readily available are valued at fair value usin g methods determined in good faith by or at the direction of the Trustees of the Fund considering relevant factors, data and information including the market value of freely tradable securities of the same class in the principal market on which such securities are normally traded.
The Fund may invest in Cash Management Portfolio (Cash Management), an affiliated investment company managed by Boston Management and Research, a subsidiary of Eaton Vance Management (EVM). Cash Management values its investment securities utilizing the amortized cost valuation technique permitted by Rule 2a-7 of the 1940 Act, pursuant to which Cash Management must comply with certain conditions. This technique involves initially valuing a portfolio security at its cost and thereafter assuming a constant amortization to maturity of any discount or premium. If amortized cost is determined not to approximate fair value, Cash Management may value its investment securities based on available market quotations provided by a pricing service.
B Investment Transactions — Investment transactions for financial statement purposes are accounted for on a trade date basis. Realized gains and losses on investments sold are determined on the basis of identified cost.
15
Eaton Vance Tax-Managed Dividend Income Fund as of October 31, 2008
NOTES TO FINANCIAL STATEMENTS CONT'D
C Income — Dividend income is recorded on the ex-dividend date for dividends received in cash and/or securities. However, if the ex-dividend date has passed, certain dividends from foreign securities are recorded as the Fund is informed of the ex-dividend date. Withholding taxes on foreign dividends and capital gains have been provided for in accordance with the Fund's understanding of the applicable countries' tax rules and rates. Interest income is recorded on the basis of interest accrued, adjusted for amortization of premium or accretion of discount.
D Federal Taxes — The Fund's policy is to comply with the provisions of the Internal Revenue Code applicable to regulated investment companies and to distribute to shareholders each year substantially all of its net investment income, and all or substantially all of its net realized capital gains. Accordingly, no provision for federal income or excise tax is necessary.
At October 31, 2008, the Fund, for federal income tax purposes, had a capital loss carryforward of $369,808,775 which will reduce its taxable income arising from future net realized gains on investment transactions, if any, to the extent permitted by the Internal Revenue Code, and thus will reduce the amount of distributions to shareholders, which would otherwise be necessary to relieve the Fund of any liability for federal income or excise tax. Such capital loss carryforward will expire on October 31, 2011 ($252,492), October 31, 2012 ($2,039,433), October 31, 2013 ($4,586,180), October 31, 2014 ($31,957,656), October 31, 2015 ($6,082,839) and October 31, 2016 ($324,890,175).
As of October 31, 2008, the Fund had no uncertain tax positions that would require financial statement recognition, de-recognition, or disclosure. Each of the Fund's federal tax returns filed in the 3-year period ended October 31, 2008 remains subject to examination by the Internal Revenue Service.
E Expenses — The majority of expenses of the Trust are directly identifiable to an individual fund. Expenses which are not readily identifiable to a specific fund are allocated taking into consideration, among other things, the nature and type of expense and the relative size of the funds.
F Expense Reduction — State Street Bank and Trust Company (SSBT) serves as custodian of the Fund. Pursuant to the custodian agreement, SSBT receives a fee reduced by credits, which are determined based on the average daily cash balance the Fund maintains with SSBT. All credit balances, if any, used to reduce the Fund's custodian fees are reported as a reduction of expenses in the Statement of Operations.
G Foreign Currency Translation — Investment valuations, other assets, and liabilities initially expressed in foreign currencies are translated each business day into U.S. dollars based upon current exchange rates. Purchases and sales of foreign investment securities and income and expenses denominated in foreign currencies are translated into U.S. dollars based upon currency exchange rates in effect on the respective dates of such transactions. Recognized gains or losses on investment transactions attributable to changes in foreign currency exchange rates are recorded for financial statement purposes as net realized gains and losses on investments. That portion of unrealized gains and losses on investments that results from fluctuations in foreign currency exchange rates is not separately disclosed.
H Use of Estimates — The preparation of the financial statements in conformity with accounting principles generally accepted in the United States of America requires management to make estimates and assumptions that affect the reported amounts of assets and liabilities at the date of the financial statements and the reported amounts of income and expense during the reporting period. Actual results could differ from those estimates.
I Indemnifications — Under the Trust's organizational documents, its officers and Trustees may be indemnified against certain liabilities and expenses arising out of the performance of their duties to the Fund, and shareholders are indemnified against personal liability for the obligations of the Trust. Additionally, in the normal course of business, the Fund enters into agreements with service providers that may contain indemnification clauses. The Fund's maximum exposure under these arrangements is unknown as this would involve future claims that may be made against the Fund that have not yet occurred.
2 Distributions to Shareholders
It is the present policy of the Fund to make monthly distributions of all or substantially all of its net investment income and to distribute annually all or substantially all of its net realized capital gains (reduced by available capital loss carryforwards from prior years, if any). Distributions to shareholders are recorded on the ex-dividend date. Distributions are declared separately for each class of shares. Shareholders may reinvest income and capital gain distributions in additional shares of the same class of the Fund at the net asset value as of the
16
Eaton Vance Tax-Managed Dividend Income Fund as of October 31, 2008
NOTES TO FINANCIAL STATEMENTS CONT'D
ex-dividend date or, at the election of the shareholder, receive distributions in cash. The Fund distinguishes between distributions on a tax basis and a financial reporting basis. Accounting principles generally accepted in the United States of America require that only distributions in excess of tax basis earnings and profits be reported in the financial statements as a return of capital. Permanent differences between book and tax accounting relating to distributions are reclassified to paid-in capital. For tax purposes, distributions from short-term capital gains are considered to be from ordinary income.
The tax character of distributions declared for the years ended October 31, 2008 and October 31, 2007 was as follows:
| | | Year Ended October 31, | |
| | | 2008 | | 2007 | |
| Distributions declared from: | |
| Ordinary income | | $ | 111,037,759 | | | $ | 89,045,796 | | |
During the year ended October 31, 2008, accumulated net realized loss was decreased by $3,578,117 and accumulated undistributed net investment income was decreased by $3,578,117 due to differences between book and tax accounting, primarily for foreign currency gain (loss), distributions from real estate investment trusts (REITs) and return of capital distributions from securities. These reclassifications had no effect on the net assets or net asset value per share of the Fund.
As of October 31, 2008, the components of distributable earnings (accumulated losses) and unrealized appreciation (depreciation) on a tax basis were as follows:
| Undistributed ordinary income | | $ | 16,881,319 | | |
| Capital loss carryforward | | $ | (369,808,775 | ) | |
| Net unrealized depreciation | | $ | (210,732,345 | ) | |
The differences between components of distributable earnings (accumulated losses) on a tax basis and the amounts reflected in the Statement of Assets and Liabilities are primarily due to wash sales and distributions from REITs.
3 Investment Adviser Fee and Other Transactions with Affiliates
The investment adviser fee is earned by EVM as compensation for management and investment advisory services rendered to the Fund. The fee is computed at an annual rate of 0.65% of the Fund's average daily net assets up to $500 million, 0.625% from $500 million up to $1 billion, 0.600% from $1 billion up to $2.5 billion and at reduced rates as daily net assets exceed that level, and is payable monthly. The portion of the adviser fee payable by Cash Management on the Fund's investment of cash therein is credited against the Fund's adviser fee. For the year ended October 31, 2008, the Fund's adviser fee totaled $11,219,807 of which $135,824 was allocated from Cash Management and $11,083,983 was paid or accrued directly by the Fund. For the year ended October 31, 2008, the Fund's adviser fee, including the portion allocated from Cash Management, was 0.62% of the Fund's average daily net assets. The administration fee is earned by EVM for administering the business affairs of the Fund and is computed at an annual rate of 0.15% of the Fund's average daily net assets. For the year ended October 31, 2008, the administration fee amounted to $2,711,850. EVM serves as the sub-transfer agent of the Fund and receives from the transfer agent an aggregate fee based upon the actual expenses incurred by EVM in the performance of these services. For the year ended October 31, 2008, EVM earned $62,516 in sub-transfer agent fees. The Fund was informed that Eaton Vance Distributors, Inc. (EVD), an affiliate of EVM and the Fund's principal underwriter, received $476,280 as its portion of the sales charge on sales of Class A shares for the year ended October 31, 2008. EVD also received distribution and service fees from Class A, Class B and Class C shares (see Note 4) and contingent deferred sales charges (see Note 5).
Except for Trustees of the Fund who are not members of EVM's organization, officers and Trustees receive remuneration for their services to the Fund out of the investment adviser fee. Trustees of the Fund who are not affiliated with EVM may elect to defer receipt of all or a percentage of their annual fees in accordance with the terms of the Trustees Deferred Compensation Plan. For the year ended October 31, 2008, no significant amounts have been deferred. Certain officers and Trustees of the Fund are officers of EVM.
4 Distribution Plans
The Fund has in effect a distribution plan for Class A shares (Class A Plan) pursuant to Rule 12b-1 under the 1940 Act. The Class A Plan provides that the Fund will pay EVD a distribution and service fee of 0.25% per annum of its average daily net assets attributable to Class A shares for distribution services and facilities provided to the Fund by EVD, as well as for personal services and/or the maintenance of shareholder accounts. Distribution and service fees paid or accrued to EVD for the year ended October 31, 2008 amounted to $2,465,974 for Class A shares.
17
Eaton Vance Tax-Managed Dividend Income Fund as of October 31, 2008
NOTES TO FINANCIAL STATEMENTS CONT'D
The Fund also has in effect distribution plans for Class B shares (Class B Plan) and Class C shares (Class C Plan) pursuant to Rule 12b-1 under the 1940 Act. The Class B and Class C Plans require the Fund to pay EVD amounts equal to 0.75% per annum of its average daily net assets attributable to Class B and Class C shares for providing ongoing distribution services and facilities to the Fund. The Fund will automatically discontinue payments to EVD during any period in which there are no outstanding Uncovered Distribution Charges, which are equivalent to the sum of (i) 6.25% of the aggregate amount received by the Fund for Class B and Class C shares sold, plus (ii) interest calculated by applying the rate of 1% over the prevailing prime rate to the outstanding balance of Uncovered Distribution Charges of EVD of each respective class, reduced by the aggregate amount of contingent deferred sales charges (see Note 5) and amounts the retofore paid or payable to EVD by each respective class. For the year ended October 31, 2008, the Fund paid or accrued to EVD $1,115,676 and $5,039,031 for Class B and Class C shares, respectively, representing 0.75% of the average daily net assets of Class B and Class C shares. At October 31, 2008, the amounts of Uncovered Distribution Charges of EVD calculated under the Class B and Class C Plans were approximately $5,940,000 and $43,511,000, respectively.
The Class B and Class C Plans also authorize the Fund to make payments of service fees to EVD, investment dealers and other persons in amounts not exceeding 0.25% per annum of its average daily net assets attributable to that class. Service fees paid or accrued are for personal services and/or the maintenance of shareholder accounts. They are separate and distinct from the sales commissions and distribution fees payable to EVD and, as such, are not subject to automatic discontinuance when there are no outstanding Uncovered Distribution Charges of EVD. Service fees paid or accrued for the year ended October 31, 2008 amounted to $371,892 and $1,679,677 for Class B and Class C shares, respectively.
5 Contingent Deferred Sales Charges
A contingent deferred sales charge (CDSC) generally is imposed on redemptions of Class B shares made within six years of purchase and on redemptions of Class C shares made within one year of purchase. Class A shares may be subject to a CDSC up to 1% if redeemed within two years of purchase (depending on the circumstances of purchase). Generally, the CDSC is based upon the lower of the net asset value at date of redemption or date of purchase. No charge is levied on shares acquired by reinvestment of dividends or capital gain distributions. The CDSC for Class B shares is imposed at declining rates that begin at 5% in the case of redemptions in the first and second year after purchase, declining one percentage point each subsequent year. Class C shares are subject to a 1% CDSC if redeemed within one year of purchase. No CDSC is levied on shares which have been sold to EVM or its affiliates or to their respective employees or clients and may be waived under certain other limited conditions. CDSCs received on Class B and Class C redemptions are paid to EVD to reduce the amount of Uncovered Distribution Charges calculated under the Fund's Class B and Class C Plans. CDSCs received on Class B and Class C redemptions when no Uncovered Distribution Charges exist are credited to the Fund. For the year ended October 31, 2008, the Fund was informed that EVD received approximately $129,000, $204,000 and $60,000 of CDSCs paid by Class A, Class B and Class C shareholders, respectively.
6 Purchases and Sales of Investments
Purchases and sales of investments, other than short-term obligations, aggregated $3,233,932,416 and $3,285,451,281, respectively, for the year ended October 31, 2008.
7 Shares of Beneficial Interest
The Fund's Declaration of Trust permits the Trustees to issue an unlimited number of full and fractional shares of beneficial interest (without par value). Such shares may be issued in a number of different series (such as the Fund) and classes. Transactions in Fund shares were as follows:
| | | Year Ended October 31, | |
| Class A | | 2008 | | 2007 | |
| Sales | | | 21,673,137 | | | | 36,503,881 | | |
Issued to shareholders electing to
receive payments of distributions
in Fund shares | | | 3,604,769 | | | | 2,453,960 | | |
| Redemptions | | | (28,062,001 | ) | | | (10,041,320 | ) | |
| Exchange from Class B shares | | | 480,151 | | | | 415,268 | | |
| Net increase (decrease) | | | (2,303,944 | ) | | | 29,331,789 | | |
18
Eaton Vance Tax-Managed Dividend Income Fund as of October 31, 2008
NOTES TO FINANCIAL STATEMENTS CONT'D
| | | Year Ended October 31, | |
| Class B | | 2008 | | 2007 | |
| Sales | | | 1,295,321 | | | | 3,227,137 | | |
Issued to shareholders electing to
receive payments of distributions
in Fund shares | | | 438,744 | | | | 346,877 | | |
| Redemptions | | | (2,674,975 | ) | | | (1,369,909 | ) | |
| Exchange to Class A shares | | | (481,183 | ) | | | (416,181 | ) | |
| Net increase (decrease) | | | (1,422,093 | ) | | | 1,787,924 | | |
| | | Year Ended October 31, | |
| Class C | | 2008 | | 2007 | |
| Sales | | | 10,566,813 | | | | 20,514,400 | | |
Issued to shareholders electing to
receive payments of distributions
in Fund shares | | | 1,761,020 | | | | 1,172,364 | | |
| Redemptions | | | (14,041,253 | ) | | | (4,576,769 | ) | |
| Net increase (decrease) | | | (1,713,420 | ) | | | 17,109,995 | | |
| Class I | | Year Ended
October 31, 2008 | | Period Ended
October 31, 2007(1) | |
| Sales | | | 206,676 | | | | 31,110 | | |
Issued to shareholders electing to
receive payments of distributions
in Fund shares | | | 3,693 | | | | 109 | | |
| Redemptions | | | (41,076 | ) | | | — | | |
| Net increase | | | 169,293 | | | | 31,219 | | |
(1) For the period from the start of business, August 27, 2007, to October 31, 2007.
8 Federal Income Tax Basis of Investments
The cost and unrealized appreciation (depreciation) of investments of the Fund at October 31, 2008, as determined on a federal income tax basis, were as follows:
| Aggregate cost | | $ | 1,452,769,119 | | |
| Gross unrealized appreciation | | $ | 23,021,204 | | |
| Gross unrealized depreciation | | | (233,556,535 | ) | |
| Net unrealized depreciation | | $ | (210,535,331 | ) | |
9 Line of Credit
The Fund participates with other portfolios and funds managed by EVM and its affiliates in a $450 million unsecured line of credit agreement with a group of banks. Borrowings are made by the Fund solely to facilitate the handling of unusual and/or unanticipated short-term cash requirements. Interest is charged to the Fund based on its borrowings at an amount above either the Eurodollar rate or Federal Funds rate. In addition, a fee computed at an annual rate of 0.10% on the daily unused portion of the line of credit is allocated among the participating portfolios and funds at the end of each quarter. The Fund did not have any significant borrowings or allocated fees during the year ended October 31, 2008.
10 Recently Issued Accounting Pronouncement
In September 2006, the Financial Accounting Standards Board issued Statement of Financial Accounting Standards No. 157 (FAS 157), "Fair Value Measurements". FAS 157 defines fair value, establishes a framework for measuring fair value in accordance with accounting principles generally accepted in the United States of America and expands disclosure about fair value measurements. FAS 157 is effective for fiscal years beginning after November 15, 2007. As of October 31, 2008, management does not believe the adoption of FAS 157 will impact the amounts reported in the financial statements; however, additional disclosures may be required about the inputs used to develop the measurements of fair value and the effect of certain of the measurements on changes in net assets for the period.
19
Eaton Vance Tax-Managed Dividend Income Fund as of October 31, 2008
REPORT OF INDEPENDENT REGISTERED PUBLIC ACCOUNTING FIRM
To the Trustees of Eaton Vance Mutual Funds Trust and Shareholders of Eaton Vance Tax-Managed Dividend Income Fund:
We have audited the accompanying statement of assets and liabilities of Eaton Vance Tax-Managed Dividend Income Fund (the "Fund") (one of the series of Eaton Vance Mutual Funds Trust), including the portfolio of investments, as of October 31, 2008, and the related statement of operations for the year then ended, the statements of changes in net assets for each of the two years in the period then ended, and the financial highlights for the periods presented. These financial statements and financial highlights are the responsibility of the Fund's management. Our responsibility is to express an opinion on these financial statements and financial highlights based on our audits.
We conducted our audits in accordance with the standards of the Public Company Accounting Oversight Board (United States). Those standards require that we plan and perform the audit to obtain reasonable assurance about whether the financial statements and financial highlights are free of material misstatement. The Fund is not required to have, nor were we engaged to perform, an audit of its internal control over financial reporting. Our audits included consideration of internal control over financial reporting as a basis for designing audit procedures that are appropriate in the circumstances, but not for the purpose of expressing an opinion on the effectiveness of the Fund's internal control over financial reporting. Accordingly, we express no such opinion. An audit also includes examin ing, on a test basis, evidence supporting the amounts and disclosures in the financial statements, assessing the accounting principles used and significant estimates made by management, as well as evaluating the overall financial statement presentation. Our procedures included confirmation of securities owned as of October 31, 2008, by correspondence with the custodian and brokers; where replies were not received from brokers, we performed other auditing procedures. We believe that our audits provide a reasonable basis for our opinion.
In our opinion, the financial statements and financial highlights referred to above present fairly, in all material respects, the financial position of the Eaton Vance Tax-Managed Dividend Income Fund as of October 31, 2008, the results of its operations for the year then ended, the changes in its net assets for each of the two years in the period then ended, and the financial highlights for each of the periods presented, in conformity with accounting principles generally accepted in the United States of America.
DELOITTE & TOUCHE LLP
Boston, Massachusetts
December 15, 2008
20
Eaton Vance Tax-Managed Dividend Income Fund as of October 31, 2008
FEDERAL TAX INFORMATION (Unaudited)
The Form 1099-DIV you receive in January 2009 will show the tax status of all distributions paid to your account in calendar year 2008. Shareholders are advised to consult their own tax adviser with respect to the tax consequences of their investment in the Fund. As required by the Internal Revenue Code regulations, shareholders must be notified within 60 days of the Fund's fiscal year end regarding the status of qualified dividend income for individuals and the dividends received deduction for corporations.
Qualified Dividend Income. The Fund designates $122,025,676, or up to the maximum amount of such dividend allowable pursuant to the Internal Revenue Code, as qualified dividend income eligible for the reduced tax rate of 15%.
Dividends Received Deduction. Corporate shareholders are generally entitled to take the dividends received deduction on the portion of the Fund's dividend distribution that qualifies under tax law. For the Fund's fiscal 2008 ordinary income dividends, 42.1% qualifies for the corporate dividends received deduction.
21
Eaton Vance Tax-Managed Dividend Income Fund
SPECIAL MEETING OF SHAREHOLDERS (Unaudited)
Eaton Vance Tax-Managed Dividend Income Fund
The Fund held a Special Meeting of Shareholders on November 14, 2008 to elect Trustees. The results of the vote were as follows:
| | | Number of Shares | |
| Nominee for Trustee | | For | | Withheld | |
| Benjamin C. Esty | | | 132,253,248 | | | | 2,717,383 | | |
| Thomas E. Faust Jr. | | | 132,241,983 | | | | 2,728,648 | | |
| Allen R. Freedman | | | 132,199,583 | | | | 2,771,047 | | |
| William H. Park | | | 132,278,402 | | | | 2,692,228 | | |
| Ronald A. Pearlman | | | 132,207,131 | | | | 2,763,500 | | |
| Helen Frame Peters | | | 132,227,502 | | | | 2,743,129 | | |
| Heidi L. Steiger | | | 132,229,004 | | | | 2,741,626 | | |
| Lynn A. Stout | | | 132,239,556 | | | | 2,731,075 | | |
| Ralph F. Verni | | | 132,219,352 | | | | 2,751,278 | | |
22
Eaton Vance Tax-Managed Dividend Income Fund
BOARD OF TRUSTEES' ANNUAL APPROVAL OF THE INVESTMENT ADVISORY AGREEMENT
Overview of the Contract Review Process
The Investment Company Act of 1940, as amended (the "1940 Act"), provides, in substance, that each investment advisory agreement between a fund and its investment adviser will continue in effect from year to year only if its continuance is approved at least annually by the fund's board of trustees, including by a vote of a majority of the trustees who are not "interested persons" of the fund ("Independent Trustees"), cast in person at a meeting called for the purpose of considering such approval.
At a meeting of the Boards of Trustees (each a "Board") of the Eaton Vance group of mutual funds (the "Eaton Vance Funds") held on April 21, 2008, the Board, including a majority of the Independent Trustees, voted to approve continuation of existing advisory and sub-advisory agreements for the Eaton Vance Funds for an additional one-year period. In voting its approval, the Board relied upon the affirmative recommendation of the Contract Review Committee of the Board (formerly the Special Committee), which is a committee comprised exclusively of Independent Trustees. Prior to making its recommendation, the Contract Review Committee reviewed information furnished for a series of meetings of the Contract Review Committee held in February, March and April 2008. Such information included, among other things, the following:
Information about Fees, Performance and Expenses
• An independent report comparing the advisory and related fees paid by each fund with fees paid by comparable funds;
• An independent report comparing each fund's total expense ratio and its components to comparable funds;
• An independent report comparing the investment performance of each fund to the investment performance of comparable funds over various time periods;
• Data regarding investment performance in comparison to relevant peer groups of funds and appropriate indices;
• Comparative information concerning fees charged by each adviser for managing other mutual funds and institutional accounts using investment strategies and techniques similar to those used in managing the fund;
• Profitability analyses for each adviser with respect to each fund;
Information about Portfolio Management
• Descriptions of the investment management services provided to each fund, including the investment strategies and processes employed, and any changes in portfolio management processes and personnel;
• Information concerning the allocation of brokerage and the benefits received by each adviser as a result of brokerage allocation, including information concerning the acquisition of research through "soft dollar" benefits received in connection with the funds' brokerage, and the implementation of a soft dollar reimbursement program established with respect to the funds;
• Data relating to portfolio turnover rates of each fund;
• The procedures and processes used to determine the fair value of fund assets and actions taken to monitor and test the effectiveness of such procedures and processes;
Information about each Adviser
• Reports detailing the financial results and condition of each adviser;
• Descriptions of the qualifications, education and experience of the individual investment professionals whose responsibilities include portfolio management and investment research for the funds, and information relating to their compensation and responsibilities with respect to managing other mutual funds and investment accounts;
• Copies of the Codes of Ethics of each adviser and its affiliates, together with information relating to compliance with and the administration of such codes;
• Copies of or descriptions of each adviser's proxy voting policies and procedures;
• Information concerning the resources devoted to compliance efforts undertaken by each adviser and its affiliates on behalf of the funds (including descriptions of various compliance programs) and their record of compliance with investment policies and restrictions, including policies with respect to market-timing, late trading and selective portfolio disclosure, and with policies on personal securities transactions;
• Descriptions of the business continuity and disaster recovery plans of each adviser and its affiliates;
Other Relevant Information
• Information concerning the nature, cost and character of the administrative and other non-investment management services provided by Eaton Vance Management and its affiliates;
• Information concerning management of the relationship with the custodian, subcustodians and fund accountants by each adviser or the funds' administrator; and
• The terms of each advisory agreement.
23
Eaton Vance Tax-Managed Dividend Income Fund
BOARD OF TRUSTEES' ANNUAL APPROVAL OF THE INVESTMENT ADVISORY AGREEMENT CONT'D
In addition to the information identified above, the Contract Review Committee considered information provided from time to time by each adviser throughout the year at meetings of the Board and its committees. Over the course of the twelve-month period ended April 30, 2008, the Board met eleven times and the Contract Review Committee, the Audit Committee and the Governance Committee, each of which is a Committee comprised solely of Independent Trustees, met twelve, seven and five times, respectively. At such meetings, the Trustees received, among other things, presentations by the portfolio managers and other investment professionals of each adviser relating to the investment performance of each fund and the investment strategies used in pursuing the fund's investment objective. The Portfolio Management Committee and the Compliance Reports and Regulatory Matters Committee are newly established and did not meet during the twelve- month period ended April 30, 2008.
For funds that invest through one or more underlying portfolios, the Board considered similar information about the portfolio(s) when considering the approval of advisory agreements. In addition, in cases where the fund's investment adviser has engaged a sub-adviser, the Board considered similar information about the sub-adviser when considering the approval of any sub-advisory agreement.
The Contract Review Committee was assisted throughout the contract review process by Goodwin Procter LLP, legal counsel for the Independent Trustees. The members of the Contract Review Committee relied upon the advice of such counsel and their own business judgment in determining the material factors to be considered in evaluating each advisory and sub-advisory agreement and the weight to be given to each such factor. The conclusions reached with respect to each advisory and sub-advisory agreement were based on a comprehensive evaluation of all the information provided and not any single factor. Moreover, each member of the Contract Review Committee may have placed varying emphasis on particular factors in reaching conclusions with respect to each advisory and sub-advisory agreement.
Results of the Process
Based on its consideration of the foregoing, and such other information as it deemed relevant, including the factors and conclusions described below, the Contract Review Committee concluded that the continuance of the investment advisory agreement of the Eaton Vance Tax-Managed Dividend Income Fund (the "Fund") with Eaton Vance Management (the "Adviser"), including its fee structure, is in the interests of shareholders and, therefore, the Contract Review Committee recommended to the Board approval of the agreement. The Board accepted the recommendation of the Contract Review Committee as well as the factors considered and conclusions reached by the Contract Review Committee with respect to the agreement. Accordingly, the Board, including a majority of the Independent Trustees, voted to approve continuation of the investment advisory agreement for the Fund.
Nature, Extent and Quality of Services
In considering whether to approve the investment advisory agreement of the Fund, the Board evaluated the nature, extent and quality of services provided to the Fund by the Adviser.
The Board considered the Adviser's management capabilities and investment process with respect to the types of investments held by the Fund, including the education, experience and number of its investment professionals and other personnel who provide portfolio management, investment research, and similar services to the Fund, including recent changes to such personnel. The Board evaluated the abilities and experience of such investment personnel in analyzing factors such as special considerations relevant to investing in dividend-paying common and preferred stock . The Board specifically noted the Adviser's in-house equity research capabilities and experience in managing funds that seek to maximize after-tax returns. The Board also took into account the resources dedicated to portfolio management and other services, including the compensation paid to recruit and retain investment personnel, and the time and attention devoted to the Fund by senior management.
The Board also reviewed the compliance programs of the Adviser and relevant affiliates thereof. Among other matters, the Board considered compliance and reporting matters relating to personal trading by investment personnel, selective disclosure of portfolio holdings, late trading, frequent trading, portfolio valuation, business continuity and the allocation of investment opportunities. The Board also evaluated the responses of the Adviser and its affiliates to requests from regulatory authorities such as the Securities and Exchange Commission.
The Board considered shareholder and other administrative services provided or managed by Eaton Vance Management and its affiliates, including transfer agency and accounting services. The Board evaluated the benefits to shareholders of investing in a fund that is a part of a large family of funds, including the ability, in many cases, to exchange an investment among different funds without incurring additional sales charges.
After consideration of the foregoing factors, among others, the Board concluded that the nature, extent and quality of services provided by the Adviser, taken as a whole, are appropriate and consistent with the terms of the investment advisory agreement.
24
Eaton Vance Tax-Managed Dividend Income Fund
BOARD OF TRUSTEES' ANNUAL APPROVAL OF THE INVESTMENT ADVISORY AGREEMENT CONT'D
Fund Performance
The Board compared the Fund's investment performance to a relevant universe of similarly managed funds identified by an independent data provider and appropriate benchmark indices. The Board reviewed comparative performance data for the one- and three-year periods ended September 30, 2007 for the Fund. The Board concluded that the performance of the Fund was satisfactory.
Management Fees and Expenses
The Board reviewed contractual investment advisory fee rates, including any administrative fee rates, payable by the Fund (referred to collectively as "management fees"). As part of its review, the Board considered the Fund's management fees (including administrative fees) and total expense ratio for the year ended September 30, 2007, as compared to a group of similarly managed funds selected by an independent data provider.
After reviewing the foregoing information, and in light of the nature, extent and quality of the services provided by the Adviser, the Board concluded that the management fees charged for advisory and related services and the Fund's total expense ratio are reasonable.
Profitability
The Board reviewed the level of profits realized by the Adviser and relevant affiliates thereof in providing investment advisory and administrative services to the Fund and to all Eaton Vance Funds as a group. The Board considered the level of profits realized without regard to revenue sharing or other payments by the Adviser and its affiliates to third parties in respect of distribution services. The Board also considered other direct or indirect benefits received by the Adviser in connection with its relationship with the Fund, including the benefits of research services that may be available to the Adviser as a result of securities transactions effected for the Fund and other investment advisory clients.
The Board concluded that, in light of the foregoing factors and the nature, extent and quality of the services rendered, the profits realized by the Adviser and its affiliates are reasonable.
Economies of Scale
In reviewing management fees and profitability, the Board also considered the extent to which the Adviser and its affiliates, on the one hand, and the Fund, on the other hand, can expect to realize benefits from economies of scale as the assets of the Fund increase. The Board acknowledged the difficulty in accurately measuring the benefits resulting from the economies of scale with respect to the management of any specific fund or group of funds. The Board reviewed data summarizing the increases and decreases in the assets of the Fund and of all Eaton Vance Funds as a group over various time periods, and evaluated the extent to which the total expense ratio of the Fund and the Adviser's profitability may have been affected by such increases or decreases. Based upon the foregoing, the Board concluded that the benefits from economies of scale are currently being shared equitably by the Adviser and the Fund. The Board also conclude d that the structure of the advisory fee, which includes breakpoints at several asset levels, can be expected to cause the Adviser and its affiliates and the Fund to continue to share such benefits equitably.
25
Eaton Vance Tax-Managed Dividend Income Fund
MANAGEMENT AND ORGANIZATION
Fund Management. The Trustees of Eaton Vance Mutual Funds Trust (the Trust) are responsible for the overall management and supervision of the Trust's affairs. The Trustees and officers of the Trust are listed below. Except as indicated, each individual has held the office shown or other offices in the same company for the last five years. Trustees and officers of the Trust hold indefinite terms of office. The "noninterested Trustees" consist of those Trustees who are not "interested persons" of the Trust, as that term is defined under the 1940 Act. The business address of each Trustee and officer is The Eaton Vance Building, 255 State Street, Boston, Massachusetts 02109. As used below, "EVC" refers to Eaton Vance Corp., "EV" refers to Eaton Vance, Inc., "EVM" refers to Eaton Vance Management, "BMR" refers to Boston Management and Research, "Parametric" refer s to Parametric Portfolio Associates and "EVD" refers to Eaton Vance Distributors, Inc. EVC and EV are the corporate parent and trustee, respectively, of EVM and BMR. EVD is the Fund's principal underwriter and a wholly-owned subsidiary of EVC. Each officer affiliated with Eaton Vance may hold a position with other Eaton Vance affiliates that is comparable to his or her position with EVM listed below.
Name and
Date of Birth | | Position(s)
with the
Trust | | Term of
Office and
Length of
Service | | Principal Occupation(s)
During Past Five Years | | Number of Portfolios
in Fund Complex
Overseen By
Trustee(1) | | Other Directorships Held | |
| Interested Trustee | | | | | | | | | | | | | |
|
| Thomas E. Faust Jr. 5/31/58 | | Trustee and President | | Trustee since 2007 and President since 2002 | | Chairman, Chief Executive Officer and President of EVC, Director and President of EV, Chief Executive Officer and President of EVM and BMR, and Director of EVD. Trustee and/or Officer of 173 registered investment companies and 4 private companies managed by EVM or BMR. Mr. Faust is an interested person because of his positions with EVM, BMR, EVD, EVC and EV, which are affiliates of the Trust. | | | 173 | | | Director of EVC | |
|
| Noninterested Trustees | | | | | | | | | | | | | |
|
| Benjamin C. Esty 1/2/63 | | Trustee | | Since 2005 | | Roy and Elizabeth Simmons Professor of Business Administration, Harvard University Graduate School of Business Administration. | | | 173 | | | None | |
|
| Allen R. Freedman 4/3/40 | | Trustee | | Since 2007 | | Former Chairman (2002-2004) and a Director (1983-2004) of Systems & Computer Technology Corp. (provider of software to higher education). Formerly, a Director of Loring Ward International (fund distributor) (2005-2007). Formerly, Chairman and a Director of Indus International Inc. (provider of enterprise management software to the power generating industry) (2005-2007). | | | 173 | | | Director of Assurant, Inc. and Stonemor Partners L.P. (owner and operator of cemeteries) | |
|
| William H. Park 9/19/47 | | Trustee | | Since 2003 | | Vice Chairman, Commercial Industrial Finance Corp. (specialty finance company) (since 2006). Formerly, President and Chief Executive Officer, Prizm Capital Management, LLC (investment management firm) (2002-2005). | | | 173 | | | None | |
|
| Ronald A. Pearlman 7/10/40 | | Trustee | | Since 2003 | | Professor of Law, Georgetown University Law Center. | | | 173 | | | None | |
|
| Helen Frame Peters 3/22/48 | | Trustee | | Since 2008 | | Professor of Finance, Carroll School of Management, Boston College (since 2003). Adjunct Professor of Finance, Peking University, Beijing, China (since 2005). Formerly, Dean, Carroll School of Management, Boston College (2000-2003). | | | 173 | | | Director of Federal Home Loan Bank of Boston (a bank for banks) and BJ's Wholesale Clubs (wholesale club retailer); Trustee of SPDR Index Shares Funds and SPDR Series Trust (exchange traded funds) | |
|
26
Eaton Vance Tax-Managed Dividend Income Fund
MANAGEMENT AND ORGANIZATION CONT'D
Name and
Date of Birth | | Position(s)
with the
Trust | | Term of
Office and
Length of
Service | | Principal Occupation(s)
During Past Five Years | | Number of Portfolios
in Fund Complex
Overseen By
Trustee(1) | | Other Directorships Held | |
| Noninterested Trustees (continued) | | | | | | | | | | | | | |
|
| Heidi L. Steiger 7/8/53 | | Trustee | | Since 2007 | | Managing Partner, Topridge Associates LLC (global wealth management firm) (since 2008); Senior Advisor (since 2008), President (2005-2008), Lowenhaupt Global Advisors, LLC (global wealth management firm). Formerly, President and Contributing Editor, Worth Magazine (2004-2005). Formerly, Executive Vice President and Global Head of Private Asset Management (and various other positions), Neuberger Berman (investment firm) (1986-2004). | | | 173 | | | Director of Nuclear Electric Insurance Ltd. (nuclear insurance provider) and Aviva USA (insurance provider) | |
|
| Lynn A. Stout 9/14/57 | | Trustee | | Since 1998 | | Paul Hastings Professor of Corporate and Securities Law (since 2006) and Professor of Law (2001-2006), University of California at Los Angeles School of Law. | | | 173 | | | None | |
|
| Ralph F. Verni 1/26/43 | | Chairman of the Board and Trustee | | Chairman of the
Board since 2007 and Trustee since 2005 | | Consultant and private investor. | | | 173 | | | None | |
|
| Principal Officers who are not Trustees | | | | | | | |
|
Name and
Date of Birth | | Position(s)
with the
Trust | | Term of
Office and
Length of
Service | | Principal Occupation(s)
During Past Five Years | |
| William H. Ahern, Jr. 7/28/59 | | Vice President | | Since 1995 | | Vice President of EVM and BMR. Officer of 75 registered investment companies managed by EVM or BMR. | |
|
| John R. Baur 2/10/70 | | Vice President | | Since 2007 | | Vice President of EVM and BMR. Previously, attended Johnson Graduate School of Management, Cornell University (2002-2005), and prior thereto he was an Account Team Representative in Singapore for Applied Materials, Inc. Officer of 33 registered investment companies managed by EVM or BMR. | |
|
| Michael A. Cirami 12/24/75 | | Vice President | | Since 2007 | | Vice President of EVM and BMR. Previously, attended the University of Rochester William E. Simon Graduate School of Business Administration (2001-2003), and prior thereto he was a Team Leader for the Institutional Services Group for State Street Bank in Luxembourg. Officer of 33 registered investment companies managed by EVM or BMR. | |
|
| Cynthia J. Clemson 3/2/63 | | Vice President | | Since 2005 | | Vice President of EVM and BMR. Officer of 90 registered investment companies managed by EVM or BMR. | |
|
| Charles B. Gaffney 12/4/72 | | Vice President | | Since 2007 | | Vice President of EVM and BMR. Previously, Sector Portfolio Manager and Senior Equity Analyst of Brown Brothers Harriman (1997-2003). Officer of 30 registered investment companies managed by EVM or BMR. | |
|
| Christine M. Johnston 11/9/72 | | Vice President | | Since 2007 | | Vice President of EVM and BMR. Officer of 35 registered investment companies managed by EVM or BMR. | |
|
| Aamer Khan 6/7/60 | | Vice President | | Since 2005 | | Vice President of EVM and BMR. Officer of 33 registered investment companies managed by EVM or BMR. | |
|
| Thomas H. Luster 4/8/62 | | Vice President | | Since 2006 | | Vice President of EVM and BMR. Officer of 51 registered investment companies managed by EVM or BMR. | |
|
| Robert B. MacIntosh 1/22/57 | | Vice President | | Since 1998 | | Vice President of EVM and BMR. Officer of 90 registered investment companies managed by EVM or BMR. | |
|
| Duncan W. Richardson 10/26/57 | | Vice President | | Since 2001 | | Executive Vice President and Chief Equity Investment Officer of EVC, EVM and BMR. Officer of 81 registered investment companies managed by EVM or BMR. | |
|
27
Eaton Vance Tax-Managed Dividend Income Fund
MANAGEMENT AND ORGANIZATION CONT'D
Name and
Date of Birth | | Position(s)
with the
Trust | | Term of
Office and
Length of
Service | | Principal Occupation(s)
During Past Five Years | |
| Principal Officers who are not Trustees (continued) | | | | | | | |
|
| Judith A. Saryan 8/21/54 | | Vice President | | Since 2003 | | Vice President of EVM and BMR. Officer of 55 registered investment companies managed by EVM or BMR. | |
|
| Susan Schiff 3/13/61 | | Vice President | | Since 2002 | | Vice President of EVM and BMR. Officer of 36 registered investment companies managed by EVM or BMR. | |
|
| Thomas Seto 9/27/62 | | Vice President | | Since 2007 | | Vice President and Director of Portfolio Management of Parametric. Officer of 31 registered investment companies managed by EVM or BMR. | |
|
| David M. Stein 5/4/51 | | Vice President | | Since 2007 | | Managing Director and Chief Investment Officer of Parametric. Officer of 31 registered investment companies managed by EVM or BMR. | |
|
| Mark S. Venezia 5/23/49 | | Vice President | | Since 2007 | | Vice President of EVM and BMR. Officer of 36 registered investment companies managed by EVM or BMR. | |
|
| Adam A. Weigold 3/22/75 | | Vice President | | Since 2007 | | Vice President of EVM and BMR. Officer of 71 registered investment companies managed by EVM or BMR. | |
|
| Barbara E. Campbell 6/19/57 | | Treasurer | | Since 2005 | | Vice President of EVM and BMR. Officer of 173 registered investment companies managed by EVM or BMR. | |
|
| Maureen A. Gemma 5/24/60 | | Secretary and Chief Legal Officer | | Secretary since 2007 and Chief Legal Officer
since 2008 | | Vice President of EVM and BMR. Officer of 173 registered investment companies managed by EVM or BMR. | |
|
| Paul M. O'Neil 7/11/53 | | Chief Compliance Officer | | Since 2004 | | Vice President of EVM and BMR. Officer of 173 registered investment companies managed by EVM or BMR. | |
|
(1) Includes both master and feeder funds in a master-feeder structure.
The SAI for the Fund includes additional information about the Trustees and officers of the Fund and can be obtained without charge on Eaton Vance's website at www.eatonvance.com or by calling 1-800-262-1122.
28
Investment Adviser and Administrator of
Eaton Vance Tax-Managed Dividend Income Fund
Eaton Vance Management
The Eaton Vance Building
255 State Street
Boston, MA 02109
Principal Underwriter
Eaton Vance Distributors, Inc.
The Eaton Vance Building
255 State Street
Boston, MA 02109
(617) 482-8260
Custodian
State Street Bank and Trust Company
200 Clarendon Street
Boston, MA 02116
Transfer Agent
PNC Global Investment Servicing
Attn: Eaton Vance Funds
P.O. Box 9653
Providence, RI 02940-9653
(800) 262-1122
Independent Registered Public Accounting Firm
Deloitte & Touche LLP
200 Berkeley Street
Boston, MA 02116-5022
Eaton Vance Tax-Managed Dividend Income Fund
The Eaton Vance Building
255 State Street
Boston, MA 02109
This report must be preceded or accompanied by a current prospectus. Before investing, investors should consider carefully the Fund's investment objective(s), risks, and charges and expenses. The Fund's current prospectus contains this and other information about the Fund and is available through your financial advisor. Please read the prospectus carefully before you invest or send money. For further information please call 1-800-262-1122.
1857-12/08 TMDISRC

Annual Report October 31, 2008


EATON VANCE
TAX-MANAGED
INTERNATIONAL
EQUITY
FUND
IMPORTANT NOTICES REGARDING PRIVACY,
DELIVERY OF SHAREHOLDER DOCUMENTS,
PORTFOLIO HOLDINGS AND PROXY VOTING
Privacy. The Eaton Vance organization is committed to ensuring your financial privacy. Each of the financial institutions identified below has in effect the following policy ("Privacy Policy") with respect to nonpublic personal information about its customers:
• Only such information received from you, through application forms or otherwise, and information about your Eaton Vance fund transactions will be collected. This may include information such as name, address, social security number, tax status, account balances and transactions.
• None of such information about you (or former customers) will be disclosed to anyone, except as permitted by law (which includes disclosure to employees necessary to service your account). In the normal course of servicing a customer's account, Eaton Vance may share information with unaffiliated third parties that perform various required services such as transfer agents, custodians and broker/dealers.
• Policies and procedures (including physical, electronic and procedural safeguards) are in place that are designed to protect the confidentiality of such information.
• We reserve the right to change our Privacy Policy at any time upon proper notification to you. Customers may want to review our Policy periodically for changes by accessing the link on our homepage: www.eatonvance.com.
Our pledge of privacy applies to the following entities within the Eaton Vance organization: the Eaton Vance Family of Funds, Eaton Vance Management, Eaton Vance Investment Counsel, Boston Management and Research, and Eaton Vance Distributors, Inc.
In addition, our Privacy Policy only applies to those Eaton Vance customers who are individuals and who have a direct relationship with us. If a customer's account (i.e., fund shares) is held in the name of a third-party financial adviser/ broker-dealer, it is likely that only such adviser's privacy policies apply to the customer. This notice supersedes all previously issued privacy disclosures.
For more information about Eaton Vance's Privacy Policy, please call 1-800-262-1122.
Delivery of Shareholder Documents. The Securities and Exchange Commission (the "SEC") permits funds to deliver only one copy of shareholder documents, including prospectuses, proxy statements and shareholder reports, to fund investors with multiple accounts at the same residential or post office box address. This practice is often called "householding" and it helps eliminate duplicate mailings to shareholders.
Eaton Vance, or your financial adviser, may household the mailing of your documents indefinitely unless you instruct Eaton Vance, or your financial adviser, otherwise.
If you would prefer that your Eaton Vance documents not be householded, please contact Eaton Vance at 1-800-262-1122, or contact your financial adviser.
Your instructions that householding not apply to delivery of your Eaton Vance documents will be effective within 30 days of receipt by Eaton Vance or your financial adviser.
Portfolio Holdings. Each Eaton Vance Fund and its underlying Portfolio (if applicable) will file a schedule of its portfolio holdings on Form N-Q with the SEC for the first and third quarters of each fiscal year. The Form N-Q will be available on the Eaton Vance website www.eatonvance.com, by calling Eaton Vance at 1-800-262-1122 or in the EDGAR database on the SEC's website at www.sec.gov. Form N-Q may also be reviewed and copied at the SEC's public reference room in Washington, D.C. (call 1-800-732-0330 for information on the operation of the public reference room).
Proxy Voting. From time to time, funds are required to vote proxies related to the securities held by the funds. The Eaton Vance Funds or their underlying Portfolios (if applicable) vote proxies according to a set of policies and procedures approved by the Funds' and Portfolios' Boards. You may obtain a description of these policies and procedures and information on how the Funds or Portfolios voted proxies relating to portfolio securities during the most recent 12 month period ended June 30, without charge, upon request, by calling 1-800-262-1122. This description is also available on the SEC's website at www.sec.gov.
Eaton Vance Tax-Managed International Equity Fund as of October 31, 2008
MANAGEMENT’S DISCUSSION OF FUND PERFORMANCE

Edward R. Allen, III, CFA
Eagle Global Advisors
Co-Portfolio Manager

Thomas N. Hunt, III, CFA
Eagle Global Advisors
Co-Portfolio Manager
Economic and Market Conditions
· Global economic fundamentals deteriorated markedly during the Fund’s fiscal year ended October 31, 2008, as the severe credit crunch caused by the worldwide financial crisis reverberated across the world’s major economies. In the first half of the period, stock markets globally began to experience dramatic sell-offs, several banks had to be rescued, and central banks moved quickly to cut rates. European governments pledged over $2 trillion to shore up their financial sector, while the U.S. also unveiled its own comprehensive rescue plan to expand depositor protection, recapitalize some financial institutions, and provide a temporary guarantee of bank borrowing. Europe struggled with high inflation and a slowing economy; however, unlike in the U.S., where the Federal Reserve had been gradually reducing interest rates, the European Central Bank had maintained its relatively high rate policy until recently. As a result, economic activity in many European countries, including France, Italy, Spain, Ireland, and Sweden, turned down swiftly, while the Euro and British pound depreciated versus the U.S. dollar. By the end of the period, the Eurozone had officially declared a recession.
· Elsewhere, Japan showed signs of economic slowdown, and is now officially in a recession. China, which had been the bright spot among the emerging markets, experienced slower-than-expected economic growth and announced a stimulus package of its own. Russian economic growth came to a halt, India appeared headed for an outright slowdown, and although Brazil remained fundamentally healthy, risk appetite for investing there had dwindled by the end of the Fund’s fiscal year on October 31, 2008.
Management Discussion
· By the end of the fiscal year ended October 31, 2008, there was a marked transformation in the performance of global equities, as they moved from a position of relative strength to one of underperformance. Against this backdrop, the Fund’s benchmark, the MSCI Europe, Australasia, Far East Index (the MSCI EAFE Index), posted double-digit losses in each of its 10 economic sectors. The Fund (1) also posted negative returns, which trailed those of its benchmark and its Lipper peer group for the year ended October 31, 2008. (2)
· Markets worldwide also saw a reshuffling of sector leadership in reaction to the dramatic downshift in economic activity. As oil prices and commodities fell drastically in the third and fourth quarters, the economically sensitive energy and materials sectors were hardest hit. Management shifted the Fund’s positions, reducing exposure to these sectors, while selectively adding to health care and consumer staples holdings, which historically have been more defensive investments. However, although the Fund’s sector allocations were generally additive to performance, momentum changed so rapidly that the Fund’s stock selection in some of these areas underperformed the MSCI EAFE Index. (2)
Eaton Vance Tax-Managed International Equity Fund
Total Return Performance 10/31/07 — 10/31/08
Class A(3) | | -49.06 | % |
Class B(3) | | -49.47 | |
Class C(3) | | -49.46 | |
Class I(3) | | -34.46 | * |
MSCI EAFE Index(2) | | -46.62 | |
Lipper International Multi-Cap Core Funds Average(2) | | -47.01 | |
* Performance since share class inception on 9/2/08.
See pages 3 and 4 for more performance information, including after-tax returns.
(1) | The Fund currently invests in a separate registered investment company, Tax-Managed International Equity Portfolio, with the same objective and policies as the Fund. References to investments are to the Portfolio’s holdings. |
| |
(2) | It is not possible to invest directly in an Index or a Lipper Classification. The Index’s total return does not reflect commissions or expenses that would have been incurred if an investor individually purchased or sold the securities represented in the Index. The Lipper total return is the average total return, at net asset value, of the funds that are in the same Lipper Classification as the Fund. |
| |
(3) | These returns do not include the 5.75% maximum sales charge for Class A shares or the applicable contingent deferred sales charge (CDSC) for Class B and Class C shares. If sales charges were deducted, the returns would be lower. Class I shares are offered to certain investors at net asset value. Class A shares are subject to a 1.00% redemption fee if redeemed or exchanged within 90 days of settlement of purchase. |
Past performance is no guarantee of future results. Returns are historical and are calculated by determining the percentage change in net asset value or offering price (as applicable) with all distributions reinvested. Investment return and principal value will fluctuate so that shares, when redeemed, may be worth more or less than their original cost. Performance is for the stated time period only; due to market volatility, the Fund’s current performance may be lower or higher than the quoted return. For performance as of the most recent month end, please refer to www.eatonvance.com.
Fund shares are not insured by the FDIC and are not deposits or other obligations of, or guaranteed by, any depository institution. Shares are subject to investment risks, including possible loss of principal invested.
1
· Specifically, energy was the biggest detractor from relative performance on a sector level, as Fund holdings among oil, gas, and consumables names underperformed their Index counterparts. With the cyclical sectors — materials, industrials, and utilities — falling out of favor during the period, stock selection in those groups also made negative contributions to returns.
· The Fund’s exposure to the underperforming emerging markets also proved to be a drag on performance. Management reduced the exposure during the period, as the once-outperforming group began to show signs it was not immune to the global economic downturn.
· Conversely, the Fund’s best relative performance came from stock selection in the health care sector, particularly among pharmaceutical stocks. The Fund’s increased weighting in this group was focused on two Swiss and U.K. names, which were among the Fund’s top performers for the period. An overweight and stock selection in telecommunication services and an overweight in consumer staples were also additive to relative returns.
· At the end of the period, the Fund was more defensively positioned, as management concentrated increasingly on those sectors that historically have better weathered recessionary conditions, while reducing exposure to more sensitive sectors. The Fund remained focused on investing in companies across the globe that management believes, through sound balance sheets, strong management, and dominant market position, can weather today’s volatility over time.
Portfolio Composition
Global Allocation*
By net assets
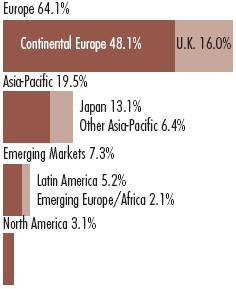
* As a percentage of the Portfolio’s net assets as of 10/31/08. Excludes cash equivalents.
Top Ten Holdings**
By net assets
Novartis AG | | 4.7 | % |
Nestle SA | | 4.1 | |
Diageo PLC | | 4.1 | |
Nintendo Co., Ltd. | | 3.4 | |
France Telecom SA ADR | | 3.3 | |
Total SA | | 3.1 | |
British American Tobacco PLC | | 3.1 | |
Banco Santander Central Hispano SA | | 2.7 | |
Sanofi-Aventis | | 2.5 | |
Koninklijke KPN N.V. | | 2.5 | |
** Top Ten Holdings represented 33.5% of the Portfolio’s net assets as of 10/31/08. Excludes cash equivalents.
The views expressed throughout this report are those of the portfolio managers and are current only through the end of the period of the report as stated on the cover. These views are subject to change at any time based upon market or other conditions, and the investment adviser disclaims any responsibility to update such views. These views may not be relied on as investment advice and, because investment decisions for a fund are based on many factors, may not be relied on as an indication of trading intent on behalf of any Eaton Vance fund. Portfolio information provided in the report may not be representative of the Portfolio’s current or future investments and may change due to active management.
2
Eaton Vance Tax-Managed International Equity Fund as of October 31, 2008
FUND PERFORMANCE
The line graph and table set forth below provide information about the Fund’s performance. The line graph compares the performance of Class A of the Fund with that of the MSCI EAFE Index, a broad-based, unmanaged market index of international stocks. The lines on the graph represent the total returns of a hypothetical investment of $10,000 in each of Class A and the Index. Class A total returns are presented at net asset value and maximum public offering price. The table includes the total returns of each Class of the Fund at net asset value and maximum public offering price. The performance presented below does not reflect the deduction of taxes, if any, that a shareholder would pay on distributions or redemptions of Fund shares.
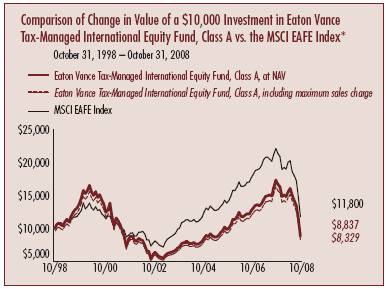
* Source: Lipper Inc. Class A commenced investment operations on 4/22/98.
A $10,000 hypothetical investment at net asset value in Class B shares on 10/31/98, Class C shares on 10/31/98, and Class I shares on 9/2/08 (commencement of operations) would have been valued at $8,180, $8,182, and $6,554, respectively, on 10/31/08. It is not possible to invest directly in an Index. The Index’s total return does not reflect commissions or expenses that would have been incurred if an investor individually purchased or sold the securities represented in the Index.
Performance(1) | | Class A | | Class B | | Class C | | Class I | |
Share Class Symbol | | ETIGX | | EMIGX | | ECIGX | | EITIX | |
Average Annual Total Returns (at net asset value) | | | | | | | | | |
One Year | | -49.06 | % | -49.47 | % | -49.46 | % | N.A. | |
Five Years | | 4.55 | | 3.76 | | 3.79 | | N.A. | |
Ten Years | | -1.23 | | -1.99 | | -1.98 | | N.A. | |
Life of Fund† | | -2.32 | | -3.06 | | -3.07 | | -34.46 | †† |
| | | | | | | | | |
SEC Average Annual Total Returns (including sales charge or applicable CDSC) | | | | | | | | | |
One Year | | -51.98 | % | -51.98 | % | -49.96 | % | N.A. | |
Five Years | | 3.31 | | 3.41 | | 3.79 | | N.A. | |
Ten Years | | -1.81 | | -1.99 | | -1.98 | | N.A. | |
Life of Fund† | | -2.86 | | -3.06 | | -3.07 | | -34.46 | †† |
† | Inception Dates — Class A, Class B, and Class C: 4/22/98; Class I: 9/2/08 |
| |
†† | Returns are cumulative since inception of the share class. |
| |
(1) | Average annual total returns do not include the 5.75% maximum sales charge for Class A shares or the applicable contingent deferred sales charge (CDSC) for Class B and Class C shares. If sales charges were deducted, the returns would be lower. Class I shares are offered to certain investors at net asset value. Class A shares are subject to a 1.00% redemption fee if redeemed or exchanged within 90 days of settlement of purchase. SEC average annual total returns for Class A reflect the maximum 5.75% sales charge. SEC returns for Class B shares reflect the applicable CDSC based on the following schedule: 5% - 1st and 2nd years; 4% - 3rd year; 3% - 4th year; 2% - 5th year; 1% - 6th year. SEC returns for Class C reflect a 1% CDSC for the first year. |
Total Annual | | | | | | | | | |
Operating Expenses(2) | | Class A | | Class B | | Class C | | Class I | |
Expense Ratio | | 1.57 | % | 2.32 | % | 2.32 | % | 1.32 | % |
(2) | Source: Prospectus dated 3/1/08 for Class A, Class B and Class C, and Prospectus dated 9/1/08 for Class I |
Past performance is no guarantee of future results. Returns are historical and are calculated by determining the percentage change in net asset value or offering price (as applicable) with all distributions reinvested. Investment return and principal value will fluctuate so that shares, when redeemed, may be worth more or less than their original cost. Performance is for the stated time period only; due to market volatility, the Fund’s current performance may be lower or higher than the quoted return. For performance as of the most recent month end, please refer to www.eatonvance.com.
3
“Return Before Taxes” does not take into consideration shareholder taxes. It is most relevant to tax-free or tax-deferred shareholder accounts. “Return After Taxes on Distributions” reflects the impact of federal income taxes due on Fund distributions of dividends and capital gains. It is most relevant to taxpaying shareholders who continue to hold their shares. “Return After Taxes on Distributions and Sale of Fund Shares” also reflects the impact of taxes on capital gain or loss realized upon a sale of shares. It is most relevant to taxpaying shareholders who sell their shares.
Average Annual Total Returns
(For the periods ended October 31, 2008)
Returns at Net Asset Value (NAV) (Class A)
| | One Year | | Five Years | | Ten Years | |
Return Before Taxes | | -49.06 | % | 4.55 | % | -1.23 | % |
Return After Taxes on Distributions | | -49.05 | | 4.65 | | -1.18 | |
Return After Taxes on Distributions and Sale of Fund Shares | | -31.46 | | 4.17 | | -0.89 | |
Returns at Public Offering Price (POP) (Class A)
| | One Year | | Five Years | | Ten Years | |
Return Before Taxes | | -51.98 | % | 3.31 | % | -1.81 | % |
Return After Taxes on Distributions | | -51.97 | | 3.42 | | -1.76 | |
Return After Taxes on Distributions and Sale of Fund Shares | | -33.39 | | 3.10 | | -1.37 | |
Average Annual Total Returns
(For the periods ended October 31, 2008)
Returns at Net Asset Value (NAV) (Class B)
| | One Year | | Five Years | | Ten Years | |
Return Before Taxes | | -49.47 | % | 3.76 | % | -1.99 | % |
Return After Taxes on Distributions | | -49.47 | | 3.87 | | -1.92 | |
Return After Taxes on Distributions and Sale of Fund Shares | | -31.99 | | 3.38 | | -1.57 | |
Returns at Public Offering Price (POP) (Class B)
| | One Year | | Five Years | | Ten Years | |
Return Before Taxes | | -51.98 | % | 3.41 | % | -1.99 | % |
Return After Taxes on Distributions | | -51.98 | | 3.52 | | -1.92 | |
Return After Taxes on Distributions and Sale of Fund Shares | | -33.62 | | 3.08 | | -1.57 | |
Average Annual Total Returns
(For the periods ended October 31, 2008)
Returns at Net Asset Value (NAV) (Class C)
| | One Year | | Five Years | | Ten Years | |
Return Before Taxes | | -49.46 | % | 3.79 | % | -1.98 | % |
Return After Taxes on Distributions | | -49.45 | | 3.90 | | -1.91 | |
Return After Taxes on Distributions and Sale of Fund Shares | | -31.90 | | 3.44 | | -1.54 | |
Returns at Public Offering Price (POP) (Class C)
| | One Year | | Five Years | | Ten Years | |
Return Before Taxes | | -49.96 | % | 3.79 | % | -1.98 | % |
Return After Taxes on Distributions | | -49.95 | | 3.90 | | -1.91 | |
Return After Taxes on Distributions and Sale of Fund Shares | | -32.23 | | 3.44 | | -1.54 | |
Class A, Class B and Class C of the Fund commenced investment operations on 4/22/98. Class I after-tax returns are not provided because the class has less than a full year of operations. Returns at Public Offering Price (POP) reflect the deduction of the maximum initial sales charge and applicable CDSC, while Returns at Net Asset Value (NAV) do not.
After-tax returns are calculated using certain assumptions. After-tax returns are calculated using the highest historical individual federal income tax rates and do not reflect the impact of state and local taxes. Actual after-tax returns depend on a shareholder’s tax situation and the actual characterization of distributions and may differ from those shown. After-tax returns are not relevant to shareholders who hold shares in tax-deferred accounts or to shares held by non-taxable entities. Return After Taxes on Distributions for a period may be the same as Return Before Taxes for the same period because no taxable distributions were made during that period. Return After Taxes on Distributions and Sale of Fund Shares for a period may be greater than or equal to Return After Taxes on Distributions for the same period because of losses realized on the sale of Fund shares. The Fund’s after-tax returns also may reflect foreign tax credits passed by the Fund to its shareholders.
Past performance is no guarantee of future results. Returns are historical and are calculated by determining the percentage change in net asset value or offering price (as applicable) with all distributions reinvested. Investment return and principal value will fluctuate so that shares, when redeemed, may be worth more or less than their original cost. Performance is for the stated time period only; due to market volatility, the Fund’s current performance may be lower or higher than the quoted return. For performance as of the most recent month end, please refer to www.eatonvance.com.
4
Eaton Vance Tax-Managed International Equity Fund as of October 31, 2008
FUND EXPENSES
Example: As a shareholder of the Fund, you incur two types of costs: (1) transaction costs, including sales charges (loads) on purchases and redemption fees (if applicable); and (2) ongoing costs, including management fees; distribution or service fees; and other Fund expenses. This Example is intended to help you understand your ongoing costs (in dollars) of investing in the Fund and to compare these costs with the ongoing costs of investing in other mutual funds. The Example is based on an investment of $1,000 invested at the beginning of the period and held for the entire period (May 1, 2008 – October 31, 2008).
Actual Expenses: The first section of the table below provides information about actual account values and actual expenses. You may use the information in this section, together with the amount you invested, to estimate the expenses that you paid over the period. Simply divide your account value by $1,000 (for example, an $8,600 account value divided by $1,000 = 8.6), then multiply the result by the number in the first section under the heading entitled "Expenses Paid During Period" to estimate the expenses you paid on your account during this period.
Hypothetical Example for Comparison Purposes: The second section of the table below provides information about hypothetical account values and hypothetical expenses based on the actual Fund expense ratio and an assumed rate of return of 5% per year (before expenses), which is not the actual return of the Fund. The hypothetical account values and expenses may not be used to estimate the actual ending account balance or expenses you paid for the period. You may use this information to compare the ongoing costs of investing in your Fund and other funds. To do so, compare this 5% hypothetical example with the 5% hypothetical examples that appear in the shareholder reports of the other funds.
Please note that the expenses shown in the table are meant to highlight your ongoing costs only and do not reflect any transactional costs, such as sales charges (loads) or redemption fees (if applicable). Therefore, the second section of the table is useful in comparing ongoing costs only, and will not help you determine the relative total costs of owning different funds. In addition, if these transactional costs were included, your costs would have been higher.
Eaton Vance Tax-Managed International Equity Fund
| | | Beginning Account Value
(5/1/08) | | Ending Account Value
(10/31/08) | | Expenses Paid During Period*
(5/1/08 – 10/31/08) | |
| Actual* | |
| Class A | | $ | 1,000.00 | | | $ | 567.40 | | | $ | 6.19 | | |
| Class B | | $ | 1,000.00 | | | $ | 564.40 | | | $ | 9.12 | | |
| Class C | | $ | 1,000.00 | | | $ | 564.80 | | | $ | 9.13 | | |
| Class I | | $ | 1,000.00 | | | $ | 655.40 | | | $ | 1.67 | | |
| Hypothetical** | |
| (5% return per year before expenses) | |
| Class A | | $ | 1,000.00 | | | $ | 1,017.20 | | | $ | 7.96 | | |
| Class B | | $ | 1,000.00 | | | $ | 1,013.50 | | | $ | 11.74 | | |
| Class C | | $ | 1,000.00 | | | $ | 1,013.50 | | | $ | 11.74 | | |
| Class I | | $ | 1,000.00 | | | $ | 1,018.70 | | | $ | 6.24 | | |
* Class I had not commenced operations as of May 1, 2008. Actual expenses are equal to the Fund's annualized expense ratio of 1.57% for Class A shares, 2.32% for Class B shares, 2.32% for Class C shares and 1.23% for Class I shares, multiplied by the average account value over the period, multiplied by 184/366 for Class A, Class B and Class C (to reflect the one-half year period) and by 60/366 for Class I (to reflect the period from commencement of operations on September 2, 2008 to October 31, 2008). The Example assumes that the $1,000 was invested at the net asset value per share determined at the close of business on April 30, 2008 (August 31, 2008 for Class I).
** Hypothetical expenses are equal to the Fund's annualized expense ratio of 1.57% for Class A shares, 2.32% for Class B shares, 2.32% for Class C shares and 1.23% for Class I shares, multiplied by the average account value over the period, multiplied by 184/366 (to reflect the one-half year period). The Example assumes that the $1,000 was invested at the net asset value per share determined at the close of business on April 30, 2008.
5
Eaton Vance Tax-Managed International Equity Fund as of October 31, 2008
FINANCIAL STATEMENTS
Statement of Assets and Liabilities
As of October 31, 2008
| Assets | |
Investment in Tax-Managed International Equity Portfolio, at value
(identified cost, $167,255,953) | | $ | 131,913,094 | | |
| Receivable for Fund shares sold | | | 459,930 | | |
| Total assets | | $ | 132,373,024 | | |
| Liabilities | |
| Payable for Fund shares redeemed | | $ | 795,569 | | |
| Payable to affiliate for distribution and service fees | | | 57,270 | | |
| Accrued expenses | | | 84,995 | | |
| Total liabilities | | $ | 937,834 | | |
| Net Assets | | $ | 131,435,190 | | |
| Sources of Net Assets | |
| Paid-in capital | | $ | 283,199,591 | | |
Accumulated net realized loss from Portfolio (computed on
the basis of identified cost) | | | (118,287,900 | ) | |
| Accumulated undistributed net investment income | | | 1,866,358 | | |
Net unrealized depreciation from Portfolio (computed on the basis of
identified cost) | | | (35,342,859 | ) | |
| Total | | $ | 131,435,190 | | |
| Class A Shares | |
| Net Assets | | $ | 92,173,338 | | |
| Shares Outstanding | | | 12,244,310 | | |
Net Asset Value and Redemption Price Per Share
(net assets ÷ shares of beneficial interest outstanding) | | $ | 7.53 | | |
Maximum Offering Price Per Share
(100 ÷ 94.25 of $7.53) | | $ | 7.99 | | |
| Class B Shares | |
| Net Assets | | $ | 9,717,149 | | |
| Shares Outstanding | | | 1,360,115 | | |
Net Asset Value and Offering Price Per Share*
(net assets ÷ shares of beneficial interest outstanding) | | $ | 7.14 | | |
| Class C Shares | |
| Net Assets | | $ | 29,443,774 | | |
| Shares Outstanding | | | 4,147,784 | | |
Net Asset Value and Offering Price Per Share*
(net assets ÷ shares of beneficial interest outstanding) | | $ | 7.10 | | |
| Class I Shares | |
| Net Assets | | $ | 100,929 | | |
| Shares Outstanding | | | 13,403 | | |
Net Asset Value, Offering Price and Redemption Price Per Share
(net assets ÷ shares of beneficial interest outstanding) | | $ | 7.53 | | |
| On sales of $50,000 or more, the offering price of Class A shares is reduced. | |
* Redemption price per share is equal to the net asset value less any applicable contingent deferred sales charge.
Statement of Operations
For the Year Ended
October 31, 2008
| Investment Income | |
| Dividends allocated from Portfolio (net of foreign taxes, $720,607) | | $ | 6,544,238 | | |
| Miscellaneous income | | | 28,137 | | |
| Interest allocated from Portfolio | | | 184,627 | | |
| Expenses allocated from Portfolio | | | (2,303,132 | ) | |
| Net investment income from Portfolio | | $ | 4,453,870 | | |
| Expenses | |
| Trustees' fees and expenses | | $ | 1,735 | | |
Distribution and service fees
Class A | | | 345,526 | | |
| Class B | | | 223,775 | | |
| Class C | | | 508,065 | | |
| Transfer and dividend disbursing agent fees | | | 239,014 | | |
| Registration fees | | | 59,848 | | |
| Custodian fee | | | 42,730 | | |
| Printing and postage | | | 42,686 | | |
| Legal and accounting services | | | 23,273 | | |
| Miscellaneous | | | 15,855 | | |
| Total expenses | | $ | 1,502,507 | | |
| Net investment income | | $ | 2,951,363 | | |
Realized and Unrealized
Gain (Loss) from Portfolio | |
Net realized gain (loss) —
Investment transactions (identified cost basis),
net of foreign taxes of $7,566 | | $ | (12,928,366 | ) | |
| Foreign currency transactions | | | (599,001 | ) | |
| Net realized loss | | $ | (13,527,367 | ) | |
Change in unrealized appreciation (depreciation) —
Investments (identified cost basis) | | $ | (118,189,406 | ) | |
| Foreign currency | | | (31,119 | ) | |
| Net change in unrealized appreciation (depreciation) | | $ | (118,220,525 | ) | |
| Net realized and unrealized loss | | $ | (131,747,892 | ) | |
| Net decrease in net assets from operations | | $ | (128,796,529 | ) | |
See notes to financial statements
6
Eaton Vance Tax-Managed International Equity Fund as of October 31, 2008
FINANCIAL STATEMENTS CONT'D
Statements of Changes in Net Assets
Increase (Decrease)
in Net Assets | | Year Ended
October 31, 2008 | | Year Ended
October 31, 2007 | |
From operations —
Net investment income | | $ | 2,951,363 | | | $ | 2,683,945 | | |
Net realized gain (loss) from investment
and foreign currency transactions | | | (13,527,367 | ) | | | 6,147,487 | | |
Net change in unrealized appreciation
(depreciation) from investments and
foreign currency | | | (118,220,525 | ) | | | 41,556,515 | | |
Net increase (decrease) in net assets
from operations | | $ | (128,796,529 | ) | | $ | 50,387,947 | | |
Distributions to shareholders —
From net investment income
Class A | | $ | (1,638,403 | ) | | $ | (612,786 | ) | |
| Class B | | | (142,946 | ) | | | (41,077 | ) | |
| Class C | | | (386,213 | ) | | | (120,816 | ) | |
| Total distributions to shareholders | | $ | (2,167,562 | ) | | $ | (774,679 | ) | |
Transactions in shares of beneficial interest —
Proceeds from sale of shares
Class A | | $ | 88,104,539 | | | $ | 46,330,072 | | |
| Class B | | | 2,799,005 | | | | 3,517,847 | | |
| Class C | | | 19,258,675 | | | | 17,068,814 | | |
| Class I | | | 101,000 | | | | — | | |
Net asset value of shares issued to
shareholders in payment of
distributions declared
Class A | | | 1,230,841 | | | | 463,056 | | |
| Class B | | | 122,626 | | | | 35,468 | | |
| Class C | | | 289,863 | | | | 93,928 | | |
Cost of shares redeemed
Class A | | | (42,415,388 | ) | | | (12,860,695 | ) | |
| Class B | | | (5,061,456 | ) | | | (6,353,502 | ) | |
| Class C | | | (12,433,464 | ) | | | (4,457,400 | ) | |
Net asset value of shares exchanged
Class A | | | 7,815,265 | | | | 3,487,781 | | |
| Class B | | | (7,815,265 | ) | | | (3,487,781 | ) | |
| Redemption fees | | | 20,656 | | | | 6,630 | | |
Net increase in net assets from
Fund share transactions | | $ | 52,016,897 | | | $ | 43,844,218 | | |
| Net increase (decrease) in net assets | | $ | (78,947,194 | ) | | $ | 93,457,486 | | |
| Net Assets | |
| At beginning of year | | $ | 210,382,384 | | | $ | 116,924,898 | | |
| At end of year | | $ | 131,435,190 | | | $ | 210,382,384 | | |
Accumulated undistributed
net investment income
included in net assets | |
| At end of year | | $ | 1,866,358 | | | $ | 1,681,858 | | |
See notes to financial statements
7
Eaton Vance Tax-Managed International Equity Fund as of October 31, 2008
FINANCIAL STATEMENTS CONT'D
Financial Highlights
| | | Class A | |
| | | Year Ended October 31, | |
| | | 2008(1) | | 2007(1) | | 2006(1) | | 2005(1) | | 2004(1) | |
| Net asset value — Beginning of year | | $ | 14.970 | | | $ | 11.080 | | | $ | 8.670 | | | $ | 7.080 | | | $ | 6.210 | | |
| Income (loss) from operations | |
| Net investment income | | $ | 0.205 | | | $ | 0.266 | (2) | | $ | 0.082 | | | $ | 0.056 | | | $ | 0.026 | | |
| Net realized and unrealized gain (loss) | | | (7.470 | ) | | | 3.731 | | | | 2.403 | | | | 1.534 | | | | 0.844 | | |
| Total income (loss) from operations | | $ | (7.265 | ) | | $ | 3.997 | | | $ | 2.485 | | | $ | 1.590 | | | $ | 0.870 | | |
| Less distributions | |
| From net investment income | | $ | (0.176 | ) | | $ | (0.107 | ) | | $ | (0.075 | ) | | $ | — | | | $ | — | | |
| Total distributions | | $ | (0.176 | ) | | $ | (0.107 | ) | | $ | (0.075 | ) | | $ | — | | | $ | — | | |
| Redemption fees | | $ | 0.001 | | | $ | 0.000 | (3) | | $ | 0.000 | (3) | | $ | 0.000 | (3) | | $ | 0.000 | (3) | |
| Net asset value — End of year | | $ | 7.530 | | | $ | 14.970 | | | $ | 11.080 | | | $ | 8.670 | | | $ | 7.080 | | |
| Total Return(4) | | | (49.06 | )% | | | 36.35 | % | | | 28.85 | % | | | 22.46 | % | | | 14.01 | % | |
| Ratios/Supplemental Data | |
| Net assets, end of year (000's omitted) | | $ | 92,173 | | | $ | 125,311 | | | $ | 59,486 | | | $ | 29,634 | | | $ | 24,714 | | |
| Ratios (As a percentage of average daily net assets): | |
| Expenses before custodian fee reduction(5)(6) | | | 1.54 | % | | | 1.57 | % | | | 1.67 | % | | | 1.89 | % | | | 2.08 | % | |
| Net investment income | | | 1.67 | % | | | 2.12 | %(2) | | | 0.81 | % | | | 0.70 | % | | | 0.38 | % | |
| Portfolio Turnover of the Portfolio | | | 34 | % | | | 23 | % | | | 25 | % | | | 39 | % | | | 62 | % | |
(1) Net investment income and redemption fees per share were computed using average shares outstanding.
(2) Net investment income per share reflects a dividend resulting from a corporate action allocated from the Portfolio which amounted to $0.132 per share. Excluding this dividend, the ratio of net investment income to average daily net assets would have been 1.07%.
(3) Amount represents less than $0.0005 per share.
(4) Returns are historical and are calculated by determining the percentage change in net asset value with all distributions reinvested.
(5) Includes the Fund's share of the Portfolio's allocated expenses.
(6) Excludes the effect of custody fee credits, if any, of less than 0.005%.
See notes to financial statements
8
Eaton Vance Tax-Managed International Equity Fund as of October 31, 2008
FINANCIAL STATEMENTS CONT'D
Financial Highlights
| | | Class B | |
| | | Year Ended October 31, | |
| | | 2008(1) | | 2007(1) | | 2006(1) | | 2005(1) | | 2004(1) | |
| Net asset value — Beginning of year | | $ | 14.200 | | | $ | 10.510 | | | $ | 8.230 | | | $ | 6.770 | | | $ | 5.980 | | |
| Income (loss) from operations | |
| Net investment income (loss) | | $ | 0.098 | | | $ | 0.132 | (2) | | $ | 0.008 | | | $ | (0.004 | ) | | $ | (0.026 | ) | |
| Net realized and unrealized gain (loss) | | | (7.094 | ) | | | 3.573 | | | | 2.281 | | | | 1.464 | | | | 0.816 | | |
| Total income (loss) from operations | | $ | (6.996 | ) | | $ | 3.705 | | | $ | 2.289 | | | $ | 1.460 | | | $ | 0.790 | | |
| Less distributions | |
| From net investment income | | $ | (0.065 | ) | | $ | (0.015 | ) | | $ | (0.009 | ) | | $ | — | | | $ | — | | |
| Total distributions | | $ | (0.065 | ) | | $ | (0.015 | ) | | $ | (0.009 | ) | | $ | — | | | $ | — | | |
| Redemption fees | | $ | 0.001 | | | $ | 0.000 | (3) | | $ | 0.000 | (3) | | $ | 0.000 | (3) | | $ | 0.000 | (3) | |
| Net asset value — End of year | | $ | 7.140 | | | $ | 14.200 | | | $ | 10.510 | | | $ | 8.230 | | | $ | 6.770 | | |
| Total Return(4) | | | (49.47 | )% | | | 35.29 | % | | | 27.83 | % | | | 21.56 | % | | | 13.21 | % | |
| Ratios/Supplemental Data | |
| Net assets, end of year (000's omitted) | | $ | 9,717 | | | $ | 31,892 | | | $ | 29,214 | | | $ | 27,861 | | | $ | 27,546 | | |
| Ratios (As a percentage of average daily net assets): | |
| Expenses before custodian fee reduction(5)(6) | | | 2.29 | % | | | 2.32 | % | | | 2.42 | % | | | 2.64 | % | | | 2.83 | % | |
| Net investment income (loss) | | | 0.82 | % | | | 1.12 | %(2) | | | 0.08 | % | | | (0.05 | )% | | | (0.40 | )% | |
| Portfolio Turnover of the Portfolio | | | 34 | % | | | 23 | % | | | 25 | % | | | 39 | % | | | 62 | % | |
(1) Net investment income (loss) and redemption fees per share were computed using average shares outstanding.
(2) Net investment income per share reflects a dividend resulting from a corporate action allocated from the Portfolio which amounted to $0.097 per share. Excluding this dividend, the ratio of net investment income to average daily net assets would have been 0.29%.
(3) Amount represents less than $0.0005 per share.
(4) Returns are historical and are calculated by determining the percentage change in net asset value with all distributions reinvested.
(5) Includes the Fund's share of the Portfolio's allocated expenses.
(6) Excludes the effect of custody fee credits, if any, of less than 0.005%.
See notes to financial statements
9
Eaton Vance Tax-Managed International Equity Fund as of October 31, 2008
FINANCIAL STATEMENTS CONT'D
Financial Highlights
| | | Class C | |
| | | Year Ended October 31, | |
| | | 2008(1) | | 2007(1) | | 2006(1) | | 2005(1) | | 2004(1) | |
| Net asset value — Beginning of year | | $ | 14.150 | | | $ | 10.500 | | | $ | 8.220 | | | $ | 6.760 | | | $ | 5.970 | | |
| Income (loss) from operations | |
| Net investment income (loss) | | $ | 0.105 | | | $ | 0.156 | (2) | | $ | 0.009 | | | $ | (0.004 | ) | | $ | (0.025 | ) | |
| Net realized and unrealized gain (loss) | | | (7.060 | ) | | | 3.536 | | | | 2.287 | | | | 1.464 | | | | 0.815 | | |
| Total income (loss) from operations | | $ | (6.955 | ) | | $ | 3.692 | | | $ | 2.296 | | | $ | 1.460 | | | $ | 0.790 | | |
| Less distributions | |
| From net investment income | | $ | (0.096 | ) | | $ | (0.042 | ) | | $ | (0.016 | ) | | $ | — | | | $ | — | | |
| Total distributions | | $ | (0.096 | ) | | $ | (0.042 | ) | | $ | (0.016 | ) | | $ | — | | | $ | — | | |
| Redemption fees | | $ | 0.001 | | | $ | 0.000 | (3) | | $ | 0.000 | (3) | | $ | 0.000 | (3) | | $ | 0.000 | (3) | |
| Net asset value — End of year | | $ | 7.100 | | | $ | 14.150 | | | $ | 10.500 | | | $ | 8.220 | | | $ | 6.760 | | |
| Total Return(4) | | | (49.46 | )% | | | 35.27 | % | | | 27.96 | % | | | 21.60 | % | | | 13.23 | % | |
| Ratios/Supplemental Data | |
| Net assets, end of year (000's omitted) | | $ | 29,444 | | | $ | 53,180 | | | $ | 28,225 | | | $ | 18,647 | | | $ | 17,797 | | |
| Ratios (As a percentage of average daily net assets): | |
| Expenses before custodian fee reduction(5)(6) | | | 2.29 | % | | | 2.32 | % | | | 2.42 | % | | | 2.64 | % | | | 2.83 | % | |
| Net investment income (loss) | | | 0.90 | % | | | 1.32 | %(2) | | | 0.09 | % | | | (0.06 | )% | | | (0.39 | )% | |
| Portfolio Turnover of the Portfolio | | | 34 | % | | | 23 | % | | | 25 | % | | | 39 | % | | | 62 | % | |
(1) Net investment income (loss) and redemption fees per share were computed using average shares outstanding.
(2) Net investment income per share reflects a dividend resulting from a corporate action allocated from the Portfolio which amounted to $0.119 per share. Excluding this dividend, the ratio of net investment income to average daily net assets would have been 0.31%.
(3) Amount represents less than $0.0005 per share.
(4) Returns are historical and are calculated by determining the percentage change in net asset value with all distributions reinvested.
(5) Includes the Fund's share of the Portfolio's allocated expenses.
(6) Excludes the effect of custody fee credits, if any, of less than 0.005%.
See notes to financial statements
10
Eaton Vance Tax-Managed International Equity Fund as of October 31, 2008
FINANCIAL STATEMENTS CONT'D
Financial Highlights
| | | Class I | |
| | | Period Ended October 31, | |
| | | 2008(1)(2) | |
| Net asset value — Beginning of period | | $ | 11.490 | | |
| Income (loss) from operations | |
| Net investment income | | $ | 0.003 | | |
| Net realized and unrealized loss | | | (3.963 | ) | |
| Total loss from operations | | $ | (3.960 | ) | |
| Redemption fees | | $ | 0.000 | (3) | |
| Net asset value — End of period | | $ | 7.530 | | |
| Total Return(4) | | | (34.46 | )%(8) | |
| Ratios/Supplemental Data | |
| Net assets, end of period (000's omitted) | | $ | 101 | | |
| Ratios (As a percentage of average daily net assets): | |
| Expenses(6) | | | 1.23 | %(5) | |
| Net investment income | | | 0.25 | %(5) | |
| Portfolio Turnover of the Portfolio | | | 34 | %(7) | |
(1) For the period from the start of business, September 2, 2008, to October 31, 2008.
(2) Net investment income and redemption fees per share were computed using average shares outstanding.
(3) Amount represents less than $0.0005 per share.
(4) Returns are historical and are calculated by determining the percentage change in net asset value with all distributions reinvested.
(5) Annualized.
(6) Includes the Fund's share of the Portfolio's allocated expenses.
(7) For the Portfolio's year ended October 31, 2008.
(8) Not annualized.
See notes to financial statements
11
Eaton Vance Tax-Managed International Equity Fund as of October 31, 2008
NOTES TO FINANCIAL STATEMENTS
1 Significant Accounting Policies
Eaton Vance Tax-Managed International Equity Fund (the Fund) is a diversified series of Eaton Vance Mutual Funds Trust (the Trust). The Trust is a Massachusetts business trust registered under the Investment Company Act of 1940, as amended (the 1940 Act), as an open-end management investment company. The Fund offers four classes of shares. Class A shares are generally sold subject to a sales charge imposed at time of purchase. Class B and Class C shares are sold at net asset value and are generally subject to a contingent deferred sales charge (see Note 5). Class I shares are sold at net asset value and are not subject to a sales charge. Class B shares automatically convert to Class A shares eight years after their purchase as described in the Fund's prospectus. Each class represents a pro-rata interest in the Fund, but votes separately on class-specific matters and (as noted below) is subject to different expenses. Realized and unrealized gains and losses and net investment income and losses, other than class-specific expenses, are allocated daily to each class of shares based on the relative net assets of each class to the total net assets of the Fund. Each class of shares differs in its distribution plan and certain other class-specific expenses. The Fund invests all of its investable assets in interests in Tax-Managed International Equity Portfolio (the Portfolio), a New York trust, having the same investment objective and policies as the Fund. The value of the Fund's investment in the Portfolio reflects the Fund's proportionate interest in the net assets of the Portfolio (58.1% at October 31, 2008). The performance of the Fund is directly affected by the performance of the Portfolio. The financial statements of the Portfolio, including the portfolio of investments, are included elsewhere in this report and should be read in conjunctio n with the Fund's financial statements.
The following is a summary of significant accounting policies of the Fund. The policies are in conformity with accounting principles generally accepted in the United States of America.
A Investment Valuation — Valuation of securities by the Portfolio is discussed in Note 1A of the Portfolio's Notes to Financial Statements, which are included elsewhere in this report.
B Income — The Fund's net investment income or loss consists of the Fund's pro-rata share of the net investment income or loss of the Portfolio, less all actual and accrued expenses of the Fund.
C Federal Taxes — The Fund's policy is to comply with the provisions of the Internal Revenue Code applicable to regulated investment companies and to distribute to shareholders each year substantially all of its net investment income, and all or substantially all of its net realized capital gains. Accordingly, no provision for federal income or excise tax is necessary. At October 31, 2008, the Fund, for federal income tax purposes, had a capital loss carryforward of $117,687,754 which will reduce its taxable income arising from future net realized gains on investment transactions, if any, to the extent permitted by the Internal Revenue Code, and thus will reduce the amount of distributions to shareholders, which would otherwise be necessary to relieve the Fund of any liab ility for federal income or excise tax. Such capital loss carryforward will expire on October 31, 2009 ($16,044,050), October 31, 2010 ($49,131,487), October 31, 2011 ($39,935,051) and October 31, 2016 ($12,577,166).
In addition to the requirements of the Internal Revenue Code, the Fund may also be required to recognize its pro-rata share of the capital gains taxes incurred by the Portfolio. In doing so, the daily net asset value would reflect the Fund's pro-rata share of the estimated reserve for such taxes incurred by the Portfolio.
As of October 31, 2008, the Fund had no uncertain tax positions that would require financial statement recognition, de-recognition, or disclosure. Each of the Fund's federal tax returns filed in the 3-year period ended October 31, 2008 remains subject to examination by the Internal Revenue Service.
D Expenses — The majority of expenses of the Trust are directly identifiable to an individual fund. Expenses which are not readily identifiable to a specific fund are allocated taking into consideration, among other things, the nature and type of expense and the relative size of the funds.
E Expense Reduction — State Street Bank and Trust Company (SSBT) serves as custodian of the Fund. Pursuant to the custodian agreement, SSBT receives a fee reduced by credits, which are determined based on the average daily cash balance the Fund maintains with SSBT. All credit balances, if any, used to reduce the Fund's custodian fees are reported as a reduction of expenses in the Statement of Operations.
12
Eaton Vance Tax-Managed International Equity Fund as of October 31, 2008
NOTES TO FINANCIAL STATEMENTS CONT'D
F Use of Estimates — The preparation of the financial statements in conformity with accounting principles generally accepted in the United States of America requires management to make estimates and assumptions that affect the reported amounts of assets and liabilities at the date of the financial statements and the reported amounts of income and expense during the reporting period. Actual results could differ from those estimates.
G Indemnifications — Under the Trust's organizational documents, its officers and Trustees may be indemnified against certain liabilities and expenses arising out of the performance of their duties to the Fund, and shareholders are indemnified against personal liability for the obligations of the Trust. Additionally, in the normal course of business, the Fund enters into agreements with service providers that may contain indemnification clauses. The Fund's maximum exposure under these arrangements is unknown as this would involve future claims that may be made against the Fund that have not yet occurred.
H Redemption Fees — Upon the redemption or exchange of shares by Class A and Class I shareholders within 90 days of the settlement of purchase, a fee of 1% of the current net asset value of these shares will be assessed and retained by the Fund for the benefit of the remaining shareholders. The redemption fee is accounted for as an addition to paid-in capital.
I Other — Investment transactions are accounted for on a trade date basis. Dividends to shareholders are recorded on the ex-dividend date.
2 Distributions to Shareholders
It is the present policy of the Fund to make at least one distribution annually (normally in December) of all or substantially all of its net investment income and to distribute annually all or substantially all of its net realized capital gains (reduced by available capital loss carryforwards from prior years, if any). Distributions are declared separately for each class of shares. Shareholders may reinvest income and capital gain distributions in additional shares of the same class of the Fund at the net asset value as of the ex-dividend date or, at the election of the shareholder, receive distributions in cash. The Fund distinguishes between distributions on a tax basis and a financial reporting basis. Accounting principles generally accepted in the United States of America require that only distributions in excess of tax basis earnings and profits be reported in the financial statements as a return of capital. Permanent diff erences between book and tax accounting relating to distributions are reclassified to paid-in capital.
The tax character of distributions declared for the years ended October 31, 2008 and October 31, 2007 was as follows:
| | | Year Ended October 31, | |
| | | 2008 | | 2007 | |
| Distributions declared from: | |
| Ordinary income | | $ | 2,167,562 | | | $ | 774,679 | | |
During the year ended October 31, 2008, accumulated net realized loss was decreased by $599,301 and accumulated undistributed net investment income was decreased by $599,301 due to differences between book and tax accounting, primarily for foreign currency loss. These reclassifications had no effect on the net assets or net asset value per share of the Fund.
As of October 31, 2008, the components of distributable earnings (accumulated losses) and unrealized appreciation (depreciation) on a tax basis were as follows:
| Undistributed ordinary income | | $ | 1,618,375 | | |
| Capital loss carryforward | | $ | (117,687,754 | ) | |
| Net unrealized depreciation | | $ | (35,695,022 | ) | |
The differences between components of distributable earnings (accumulated losses) on a tax basis and the amounts reflected in the Statement of Assets and Liabilities are primarily due to wash sales, investments in passive foreign investment companies and partnership allocations.
3 Transactions with Affiliates
Eaton Vance Management (EVM) serves as the administrator to the Fund, but receives no compensation. The Portfolio has engaged Boston Management and Research (BMR), a subsidiary of EVM, to render investment advisory services. See Note 2 of the Portfolio's Notes to Financial Statements which are included elsewhere in this report. EVM serves as the sub-transfer agent of the Fund and receives from the transfer agent an aggregate fee based upon the actual expenses incurred by EVM in the performance of these services. For the year ended October 31, 2008, EVM earned $14,541 in sub-transfer agent fees. The Fund was informed that Eaton Vance Distributors, Inc. (EVD), an affiliate of EVM and the Fund's principal underwriter, received $59,149 as its portion of the sales charge on sales of Class A shares for the year ended October 31, 2008. EVD also received distribution and service fees from Class A, Class B and
13
Eaton Vance Tax-Managed International Equity Fund as of October 31, 2008
NOTES TO FINANCIAL STATEMENTS CONT'D
Class C shares (see Note 4) and contingent deferred sales charges (see Note 5).
Except for Trustees of the Fund and the Portfolio who are not members of EVM's or BMR's organizations, officers and Trustees receive remuneration for their services to the Fund out of the investment adviser fee. Certain officers and Trustees of the Fund and the Portfolio are officers of the above organizations.
4 Distribution Plans
The Fund has in effect a distribution plan for Class A shares (Class A Plan) pursuant to Rule 12b-1 under the 1940 Act. The Class A Plan provides that the Fund will pay EVD a distribution and service fee of 0.25% per annum of its average daily net assets attributable to Class A shares for distribution services and facilities provided to the Fund by EVD, as well as for personal services and/or the maintenance of shareholder accounts. Distribution and service fees paid or accrued to EVD for the year ended October 31, 2008 amounted to $345,526 for Class A shares. The Fund also has in effect distribution plans for Class B shares (Class B Plan) and Class C shares (Class C Plan) pursuant to Rule 12b-1 under the 1940 Act. The Class B and Class C Plans require the Fund to pay EVD amounts equal to 0.75% per annum of its average daily net assets attributable to Class B and Class C shares for providing ongoing distribution services and fac ilities to the Fund. The Fund will automatically discontinue payments to EVD during any period in which there are no outstanding Uncovered Distribution Charges, which are equivalent to the sum of (i) 5% and 6.25% of the aggregate amount received by the Fund for Class B and Class C shares sold, respectively, plus (ii) interest calculated by applying the rate of 1% over the prevailing prime rate to the outstanding balance of Uncovered Distribution Charges of EVD of each respective class, reduced by the aggregate amount of contingent deferred sales charges (see Note 5) and amounts theretofore paid or payable to EVD by each respective class. For the year ended October 31, 2008, the Fund paid or accrued to EVD $167,831 and $381,049 for Class B and Class C shares, respectively, representing 0.75% of the average daily net assets of Class B and Class C shares. At October 31, 2008, the amounts of Uncovered Distribution Charges of EVD calculated under the Class B and Class C Plans were approximately $3,992,000 and $9, 691,000, respectively.
The Class B and Class C Plans also authorize the Fund to make payments of service fees to EVD, investment dealers and other persons in amounts not exceeding 0.25% per annum of its average daily net assets attributable to that class. Service fees paid or accrued are for personal services and/or the maintenance of shareholder accounts. They are separate and distinct from sales commissions and distribution fees payable to EVD and, as such, are not subject to automatic discontinuance when there are no outstanding Uncovered Distribution Charges of EVD. Service fees paid or accrued for the year ended October 31, 2008 amounted to $55,944 and $127,016 for Class B and Class C shares, respectively.
5 Contingent Deferred Sales Charges
A contingent deferred sales charge (CDSC) generally is imposed on redemptions of Class B shares made within six years of purchase and on redemptions of Class C shares made within one year of purchase. Class A shares may be subject to a CDSC up to 1% if redeemed within two years of purchase (depending on the circumstances of purchase). Generally, the CDSC is based upon the lower of the net asset value at date of redemption or date of purchase. No charge is levied on shares acquired by reinvestment of dividends or capital gain distributions. The CDSC for Class B shares is imposed at declining rates that begin at 5% in the case of redemptions in the first and second year after purchase, declining one percentage point each subsequent year. Class C shares are subject to a 1% CDSC if redeemed within one year of purchase. No CDSC is levied on shares which have been sold to EVM or its affiliates or to their respective employees or clients and may be waived under certain other limited conditions. CDSCs received on Class B and Class C redemptions are paid to EVD to reduce the amount of Uncovered Distribution Charges calculated under the Fund's Class B and Class C Plans. CDSCs received on Class B and Class C redemptions when no Uncovered Distribution Charges exist are credited to the Fund. For the year ended October 31, 2008, the Fund was informed that EVD received approximately $62,000, $28,000 and $11,000 of CDSCs paid by Class A, Class B and Class C shareholders, respectively.
6 Investment Transactions
For the year ended October 31, 2008, increases and decreases in the Fund's investment in the Portfolio aggregated $110,751,971 and $61,308,710, respectively.
7 Shares of Beneficial Interest
The Fund's Declaration of Trust permits the Trustees to issue an unlimited number of full and fractional shares of beneficial interest (without par value). Such shares may be
14
Eaton Vance Tax-Managed International Equity Fund as of October 31, 2008
NOTES TO FINANCIAL STATEMENTS CONT'D
issued in a number of different series (such as the Fund) and classes. Transactions in Fund shares were as follows:
| | | Year Ended October 31, | |
| Class A | | 2008 | | 2007 | |
| Sales | | | 6,958,032 | | | | 3,726,794 | | |
Issued to shareholders electing to
receive payments of distributions
in Fund shares | | | 88,677 | | | | 39,578 | | |
| Redemptions | | | (3,807,459 | ) | | | (1,037,452 | ) | |
| Exchange from Class B shares | | | 632,372 | | | | 275,806 | | |
| Net increase | | | 3,871,622 | | | | 3,004,726 | | |
| | | Year Ended October 31, | |
| Class B | | 2008 | | 2007 | |
| Sales | | | 222,383 | | | | 295,582 | | |
Issued to shareholders electing to
receive payments of distributions
in Fund shares | | | 9,248 | | | | 3,172 | | |
| Redemptions | | | (452,290 | ) | | | (542,019 | ) | |
| Exchange to Class A shares | | | (664,400 | ) | | | (289,919 | ) | |
| Net decrease | | | (885,059 | ) | | | (533,184 | ) | |
| | | Year Ended October 31, | |
| Class C | | 2008 | | 2007 | |
| Sales | | | 1,596,250 | | | | 1,444,871 | | |
Issued to shareholders electing to
receive payments of distributions
in Fund shares | | | 22,009 | | | | 8,439 | | |
| Redemptions | | | (1,229,102 | ) | | | (383,223 | ) | |
| Net increase | | | 389,157 | | | | 1,070,087 | | |
| Class I | | Period Ended
October 31, 2008(1) | |
| Sales | | | 13,403 | | |
| Net increase | | | 13,403 | | |
(1) For the period from start of business, September 2, 2008, to October 31, 2008.
For the years ended October 31, 2008 and 2007, the Fund received $20,656 and $6,630, respectively, in redemption fees.
8 Recently Issued Accounting Pronouncement
In September 2006, the Financial Accounting Standards Board issued Statement of Financial Accounting Standards No. 157 (FAS 157), "Fair Value Measurements". FAS 157 defines fair value, establishes a framework for measuring fair value in accordance with accounting principles generally accepted in the United States of America and expands disclosure about fair value measurements. FAS 157 is effective for fiscal years beginning after November 15, 2007. As of October 31, 2008, management does not believe the adoption of FAS 157 will impact the amounts reported in the financial statements; however, additional disclosures may be required about the inputs used to develop the measurements of fair value and the effect of certain of the measurements on changes in net assets for the period.
.
15
Eaton Vance Tax-Managed International Equity Fund as of October 31, 2008
REPORT OF INDEPENDENT REGISTERED PUBLIC ACCOUNTING FIRM
To the Trustees of Eaton Vance Mutual Funds Trust and the Shareholders of Eaton Vance
Tax-Managed International Equity Fund:
We have audited the accompanying statement of assets and liabilities of Eaton Vance Tax-Managed International Equity Fund (the "Fund") (one of the series of Eaton Vance Mutual Funds Trust) as of October 31, 2008, and the related statement of operations for the year then ended, the statements of changes in net assets for each of the two years in the period then ended, and the financial highlights for each of the five years in the period then ended. These financial statements and financial highlights are the responsibility of the Fund's management. Our responsibility is to express an opinion on these financial statements and financial highlights based on our audits.
We conducted our audits in accordance with the standards of the Public Company Accounting Oversight Board (United States). Those standards require that we plan and perform the audit to obtain reasonable assurance about whether the financial statements and financial highlights are free of material misstatement. The Fund is not required to have, nor were we engaged to perform, an audit of its internal control over financial reporting. Our audits included consideration of internal control over financial reporting as a basis for designing audit procedures that are appropriate in the circumstances, but not for the purpose of expressing an opinion on the effectiveness of the Fund's internal control over financial reporting. Accordingly, we express no such opinion. An audit also includes examining, on a test basis, evidence supporting the amounts and disclosures in the financial statements, assessing the accounting principles used and significant estimates made by management, as well as evaluating the overall financial statement presentation. We believe that our audits provide a reasonable basis for our opinion.
In our opinion, the financial statements and financial highlights referred to above present fairly, in all material respects, the financial position of Eaton Vance Tax-Managed International Equity Fund as of October 31, 2008, the results of its operations for the year then ended, the changes in its net assets for each of the two years in the period then ended, and the financial highlights for each of the five years in the period then ended, in conformity with accounting principles generally accepted in the United States of America.
DELOITTE & TOUCHE LLP
Boston, Massachusetts
December 15, 2008
16
Eaton Vance Tax-Managed International Equity Fund as of October 31, 2008
FEDERAL TAX INFORMATION (Unaudited)
The Form 1099-DIV you receive in January 2009 will show the tax status of all distributions paid to your account in calendar 2008. Shareholders are advised to consult their own tax adviser with respect to the tax consequences of their investment in the Fund. As required by the Internal Revenue Code regulations, shareholders must be notified within 60 days of the Fund's fiscal year end regarding the status of the qualified dividend income for individuals and the foreign tax credit.
Qualified Dividend Income. The Fund designates approximately $7,264,962, or up to the maximum amount of such dividends allowable pursuant to the Internal Revenue Code, as qualified dividend income eligible for the reduced tax rate of 15%.
Foreign Tax Credit. The Fund designates a foreign tax credit of $720,607 and recognizes foreign source income of $7,292,982.
17
Tax-Managed International Equity Portfolio as of October 31, 2008
PORTFOLIO OF INVESTMENTS
| Common Stocks — 94.0% | |
| Security | | Shares | | Value | |
| Automobiles — 2.6% | |
| Honda Motor Co., Ltd. | | | 116,000 | | | $ | 2,884,386 | | |
| Toyota Motor Corp. | | | 79,700 | | | | 3,112,358 | | |
| | | $ | 5,996,744 | | |
| Beverages — 7.8% | |
| Diageo PLC | | | 607,000 | | | $ | 9,263,140 | | |
| Fomento Economico Mexicano SA de C.V. ADR | | | 173,400 | | | | 4,385,286 | | |
| Foster's Group, Ltd. | | | 685,000 | | | | 2,618,615 | | |
| Heineken Holding N.V. | | | 45,000 | | | | 1,366,131 | | |
| | | $ | 17,633,172 | | |
| Capital Markets — 0.8% | |
| Invesco, Ltd. | | | 115,000 | | | $ | 1,714,650 | | |
| | | $ | 1,714,650 | | |
| Chemicals — 1.8% | |
| Agrium, Inc. | | | 75,000 | | | $ | 2,848,500 | | |
| BASF AG | | | 40,000 | | | | 1,320,546 | | |
| | | $ | 4,169,046 | | |
| Commercial Banks — 9.3% | |
| Banco Bilbao Vizcaya Argentaria SA | | | 116,700 | | | $ | 1,354,457 | | |
| Banco Santander Central Hispano SA | | | 575,000 | | | | 6,218,716 | | |
| Barclays PLC | | | 306,800 | | | | 879,468 | | |
| BNP Paribas SA | | | 26,500 | | | | 1,913,335 | | |
| BOC Hong Kong Holdings, Ltd. | | | 1,600,000 | | | | 1,831,889 | | |
| DBS Group Holdings, Ltd. | | | 400,000 | | | | 3,053,398 | | |
| Grupo Financiero Banorte SAB de C.V. | | | 500,000 | | | | 915,873 | | |
| Mitsubishi UFJ Financial Group, Inc. | | | 769,000 | | | | 4,832,529 | | |
| | | $ | 20,999,665 | | |
| Communications Equipment — 1.0% | |
| Nokia Oyj | | | 150,000 | | | $ | 2,297,729 | | |
| | | $ | 2,297,729 | | |
| Construction & Engineering — 1.3% | |
| Bouygues SA | | | 35,000 | | | $ | 1,490,310 | | |
| Vinci SA | | | 38,000 | | | | 1,367,519 | | |
| | | $ | 2,857,829 | | |
| Security | | Shares | | Value | |
| Diversified Financial Services — 1.3% | |
| ING Groep N.V. | | | 310,439 | | | $ | 2,912,027 | | |
| | | $ | 2,912,027 | | |
| Diversified Telecommunication Services — 8.7% | |
| Deutsche Telekom AG | | | 155,000 | | | $ | 2,274,014 | | |
| France Telecom SA ADR | | | 300,000 | | | | 7,596,000 | | |
| Koninklijke KPN N.V. | | | 400,000 | | | | 5,633,277 | | |
| Telefonica SA | | | 230,000 | | | | 4,258,436 | | |
| | | $ | 19,761,727 | | |
| Electric Utilities — 3.1% | |
| E.ON AG | | | 58,020 | | | $ | 2,174,290 | | |
| E.ON AG ADR | | | 51,350 | | | | 1,951,300 | | |
| Scottish and Southern Energy PLC | | | 145,000 | | | | 2,842,251 | | |
| | | $ | 6,967,841 | | |
| Electrical Equipment — 1.5% | |
| ABB, Ltd. ADR | | | 255,000 | | | $ | 3,353,250 | | |
| | | $ | 3,353,250 | | |
| Energy Equipment & Services — 1.9% | |
| Acergy SA | | | 300,000 | | | $ | 2,028,758 | | |
| Fred Olsen Energy ASA | | | 70,000 | | | | 2,314,250 | | |
| | | $ | 4,343,008 | | |
| Food Products — 5.1% | |
| Nestle SA | | | 240,000 | | | $ | 9,332,878 | | |
| Unilever PLC | | | 99,000 | | | | 2,224,119 | | |
| | | $ | 11,556,997 | | |
| Health Care Providers & Services — 1.0% | |
| Fresenius Medical Care AG & Co. KGaA | | | 52,000 | | | $ | 2,303,735 | | |
| | | $ | 2,303,735 | | |
| Industrial Conglomerates — 1.4% | |
| Keppel Corp., Ltd. | | | 990,000 | | | $ | 3,086,515 | | |
| | | $ | 3,086,515 | | |
| Insurance — 3.9% | |
| Aviva PLC | | | 156,700 | | | $ | 934,718 | | |
| AXA SA | | | 152,900 | | | | 2,921,008 | | |
See notes to financial statements
18
Tax-Managed International Equity Portfolio as of October 31, 2008
PORTFOLIO OF INVESTMENTS CONT'D
| Security | | Shares | | Value | |
| Insurance (continued) | |
| Muenchener Rueckversicherungs-Gesellschaft AG | | | 21,000 | | | $ | 2,726,212 | | |
| Tokio Marine Holdings, Inc. | | | 75,400 | | | | 2,325,780 | | |
| | | $ | 8,907,718 | | |
| Machinery — 2.0% | |
| Atlas Copco AB, Class B | | | 286,000 | | | $ | 2,141,094 | | |
| Komatsu, Ltd. | | | 160,000 | | | | 1,758,987 | | |
| Vallourec SA | | | 6,300 | | | | 704,711 | | |
| | | $ | 4,604,792 | | |
| Metals & Mining — 4.2% | |
| Anglo American PLC ADR | | | 127,400 | | | $ | 1,598,870 | | |
| Companhia Vale do Rio Doce ADR | | | 217,500 | | | | 2,546,925 | | |
| Rio Tinto, Ltd. | | | 74,400 | | | | 3,848,925 | | |
| Silver Wheaton Corp.(1) | | | 435,000 | | | | 1,566,000 | | |
| | | $ | 9,560,720 | | |
| Multi-Utilities — 4.7% | |
| National Grid PLC | | | 390,000 | | | $ | 4,393,399 | | |
| RWE AG | | | 58,000 | | | | 4,754,896 | | |
| Veolia Environnement | | | 63,400 | | | | 1,571,154 | | |
| | | $ | 10,719,449 | | |
| Oil, Gas & Consumable Fuels — 6.9% | |
| Addax Petroleum Corp. | | | 46,600 | | | $ | 695,926 | | |
| ENI SpA | | | 75,000 | | | | 1,790,111 | | |
| Petroleo Brasileiro SA ADR | | | 183,000 | | | | 4,038,810 | | |
| StatoilHydro ASA | | | 107,720 | | | | 2,166,639 | | |
| Total SA | | | 128,000 | | | | 7,041,720 | | |
| | | $ | 15,733,206 | | |
| Pharmaceuticals — 11.9% | |
| AstraZeneca PLC ADR | | | 129,000 | | | $ | 5,477,340 | | |
| Novartis AG | | | 209,500 | | | | 10,633,804 | | |
| Roche Holding AG | | | 24,400 | | | | 3,731,415 | | |
| Sanofi-Aventis | | | 88,800 | | | | 5,672,792 | | |
| Shionogi & Co., Ltd. | | | 94,000 | | | | 1,599,847 | | |
| | | $ | 27,115,198 | | |
| Security | | Shares | | Value | |
| Software — 3.4% | |
| Nintendo Co., Ltd. | | | 24,000 | | | $ | 7,711,399 | | |
| | | $ | 7,711,399 | | |
| Tobacco — 3.1% | |
| British American Tobacco PLC | | | 253,000 | | | $ | 6,939,620 | | |
| | | $ | 6,939,620 | | |
| Trading Companies & Distributors — 2.4% | |
| Mitsubishi Corp. | | | 330,000 | | | $ | 5,531,411 | | |
| | | $ | 5,531,411 | | |
| Wireless Telecommunication Services — 2.9% | |
| Turkcell Iletisim Hizmetleri AS ADR | | | 395,000 | | | $ | 4,846,650 | | |
| Vodafone Group PLC ADR | | | 95,000 | | | | 1,830,650 | | |
| | | $ | 6,677,300 | | |
Total Common Stocks
(identified cost $259,923,955) | | $ | 213,454,748 | | |
| Short-Term Investments — 6.5% | |
| Description | | Interest
(000's omitted) | | Value | |
| Cash Management Portfolio, 1.90%(2) | | $ | 14,692 | | | $ | 14,691,697 | | |
Total Short-Term Investments
(identified cost $14,691,697) | | $ | 14,691,697 | | |
Total Investments — 100.5%
(identified cost $274,615,652) | | | | | | $ | 228,146,445 | | |
| Other Assets, Less Liabilities — (0.5)% | | | | | | $ | (1,166,588 | ) | |
| Net Assets — 100.0% | | | | | | $ | 226,979,857 | | |
ADR - American Depository Receipt
(1) Non-income producing security.
(2) Affiliated investment company available to Eaton Vance portfolios and funds which invests in high quality, U.S. dollar denominated money market instruments. The rate shown is the annualized seven-day yield as of October 31, 2008.
See notes to financial statements
19
Tax-Managed International Equity Portfolio as of October 31, 2008
PORTFOLIO OF INVESTMENTS CONT'D
| Country Concentration of Portfolio | |
| Country | | Percentage
of Net Assets | | Value | |
| United Kingdom | | | 16.0 | % | | $ | 36,383,576 | | |
| France | | | 13.3 | | | | 30,278,549 | | |
| Japan | | | 13.1 | | | | 29,756,697 | | |
| Switzerland | | | 11.9 | | | | 27,051,347 | | |
| Germany | | | 7.7 | | | | 17,504,992 | | |
| United States | | | 6.5 | | | | 14,691,697 | | |
| Spain | | | 5.2 | | | | 11,831,609 | | |
| Netherlands | | | 4.4 | | | | 9,911,435 | | |
| Brazil | | | 2.9 | | | | 6,585,735 | | |
| Norway | | | 2.9 | | | | 6,509,647 | | |
| Australia | | | 2.9 | | | | 6,467,540 | | |
| Singapore | | | 2.7 | | | | 6,139,913 | | |
| Canada | | | 2.3 | | | | 5,110,426 | | |
| Mexico | | | 2.3 | | | | 5,301,159 | | |
| Turkey | | | 2.1 | | | | 4,846,650 | | |
| Finland | | | 1.0 | | | | 2,297,729 | | |
| Sweden | | | 0.9 | | | | 2,141,094 | | |
| Bermuda | | | 0.8 | | | | 1,714,650 | | |
| Hong Kong | | | 0.8 | | | | 1,831,889 | | |
| Italy | | | 0.8 | | | | 1,790,111 | | |
| Total Investments | | | 100.5 | % | | $ | 228,146,445 | | |
See notes to financial statements
20
Tax-Managed International Equity Portfolio as of October 31, 2008
FINANCIAL STATEMENTS
Statement of Assets and Liabilities
As of October 31, 2008
| Assets | |
| Unaffiliated investments, at value (identified cost, $259,923,955) | | $ | 213,454,748 | | |
| Affiliated investment, at value (identified cost, $14,691,697) | | | 14,691,697 | | |
| Receivable for investments sold | | | 713,490 | | |
| Dividends receivable | | | 569,521 | | |
| Interest receivable from affiliated investment | | | 12,894 | | |
| Tax reclaims receivable | | | 384,441 | | |
| Total assets | | $ | 229,826,791 | | |
| Liabilities | |
| Payable for investments purchased | | $ | 2,529,137 | | |
| Payable to affiliate for investment adviser fee | | | 197,485 | | |
| Payable to affiliate for Trustees' fees | | | 958 | | |
| Accrued expenses | | | 119,354 | | |
| Total liabilities | | $ | 2,846,934 | | |
| Net Assets applicable to investors' interest in Portfolio | | $ | 226,979,857 | | |
| Sources of Net Assets | |
| Net proceeds from capital contributions and withdrawals | | $ | 273,464,455 | | |
| Net unrealized depreciation (computed on the basis of identified cost) | | | (46,484,598 | ) | |
| Total | | $ | 226,979,857 | | |
Statement of Operations
For the Year Ended
October 31, 2008
| Investment Income | |
| Dividends (net of foreign taxes, $1,233,004) | | $ | 11,214,846 | | |
| Interest | | | 232 | | |
| Interest income allocated from affiliated investment | | | 317,552 | | |
| Expenses allocated from affiliated investment | | | (47,150 | ) | |
| Total investment income | | $ | 11,485,480 | | |
| Expenses | |
| Investment adviser fee | | $ | 3,595,302 | | |
| Trustees' fees and expenses | | | 14,320 | | |
| Custodian fee | | | 264,411 | | |
| Legal and accounting services | | | 36,229 | | |
| Miscellaneous | | | 10,535 | | |
| Total expenses | | $ | 3,920,797 | | |
| Net investment income | | $ | 7,564,683 | | |
| Realized and Unrealized Gain (Loss) | |
Net realized gain (loss) —
Investment transactions (identified cost basis),
net of foreign taxes of $12,921 | | $ | (16,982,862 | ) | |
| Foreign currency transactions | | | (1,019,765 | ) | |
| Net realized loss | | $ | (18,002,627 | ) | |
Change in unrealized appreciation (depreciation) —
Investments (identified cost basis) | | $ | (205,765,361 | ) | |
| Foreign currency | | | (52,450 | ) | |
| Net change in unrealized appreciation (depreciation) | | $ | (205,817,811 | ) | |
| Net realized and unrealized loss | | $ | (223,820,438 | ) | |
| Net decrease in net assets from operations | | $ | (216,255,755 | ) | |
See notes to financial statements
21
Tax-Managed International Equity Portfolio as of October 31, 2008
FINANCIAL STATEMENTS CONT'D
Statements of Changes in Net Assets
Increase (Decrease)
in Net Assets | | Year Ended
October 31, 2008 | | Year Ended
October 31, 2007 | |
From operations —
Net investment income | | $ | 7,564,683 | | | $ | 7,582,579 | | |
Net realized gain (loss) from investment and
foreign currency transactions | | | (18,002,627 | ) | | | 11,749,773 | | |
Net change in unrealized appreciation
(depreciation) from investments and
foreign currency | | | (205,817,811 | ) | | | 80,205,125 | | |
Net increase (decrease) in net assets
from operations | | $ | (216,255,755 | ) | | $ | 99,537,477 | | |
Capital transactions —
Contributions | | $ | 112,879,082 | | | $ | 88,908,570 | | |
| Withdrawals | | | (61,316,483 | ) | | �� | (25,049,824 | ) | |
Net increase in net assets from
capital transactions | | $ | 51,562,599 | | | $ | 63,858,746 | | |
| Net increase (decrease) in net assets | | $ | (164,693,156 | ) | | $ | 163,396,223 | | |
| Net Assets | |
| At beginning of year | | $ | 391,673,013 | | | $ | 228,276,790 | | |
| At end of year | | $ | 226,979,857 | | | $ | 391,673,013 | | |
See notes to financial statements
22
Tax-Managed International Equity Portfolio as of October 31, 2008
FINANCIAL STATEMENTS CONT'D
Supplementary Data
| | | Year Ended October 31, | |
| | | 2008 | | 2007 | | 2006 | | 2005 | | 2004 | |
| Ratios/Supplemental Data | |
| Ratios (As a percentage of average daily net assets): | |
| Expenses before custodian fee reduction(1) | | | 1.09 | % | | | 1.10 | % | | | 1.12 | % | | | 1.16 | % | | | 1.21 | % | |
| Net investment income | | | 2.08 | % | | | 2.51 | %(2) | | | 1.38 | % | | | 1.42 | % | | | 1.24 | % | |
| Portfolio Turnover | | | 34 | % | | | 23 | % | | | 25 | % | | | 39 | % | | | 62 | % | |
| Total Return | | | (48.82 | )% | | | 36.97 | % | | | 29.54 | % | | | 23.36 | % | | | 15.04 | % | |
| Net assets, end of year (000's omitted) | | $ | 226,980 | | | $ | 391,673 | | | $ | 228,277 | | | $ | 151,601 | | | $ | 132,015 | | |
(1) Excludes the effect of custody fee credits, if any, of less than 0.005%.
(2) Includes a dividend resulting from a corporate action equal to 0.96% of average daily net assets.
See notes to financial statements
23
Tax-Managed International Equity Portfolio as of October 31, 2008
NOTES TO FINANCIAL STATEMENTS
1 Significant Accounting Policies
Tax-Managed International Equity Portfolio (the Portfolio) is a New York trust registered under the Investment Company Act of 1940, as amended (the 1940 Act), as a diversified, open-end management investment company. The Portfolio's investment objective is to achieve long-term after-tax returns by investing in a diversified portfolio of foreign equity securities. The Declaration of Trust permits the Trustees to issue interests in the Portfolio. At October 31, 2008, Eaton Vance Tax-Managed International Equity Fund and Eaton Vance Tax-Managed Equity Asset Allocation Fund held an interest of 58.1% and 41.8%, respectively, in the Portfolio.
The following is a summary of significant accounting policies of the Portfolio. The policies are in conformity with accounting principles generally accepted in the United States of America.
A Investment Valuation — Equity securities listed on a U.S. securities exchange generally are valued at the last sale price on the day of valuation or, if no sales took place on such date, at the mean between the closing bid and asked prices therefore on the exchange where such securities are principally traded. Equity securities listed on the NASDAQ Global or Global Select Market generally are valued at the NASDAQ official closing price. Unlisted or listed securities for which closing sales prices or closing quotations are not available are valued at the mean between the latest available bid and asked prices or, in the case of preferred equity securities that are not listed or traded in the over-the- counter market, by an independent pricing service. Short-term debt securities with a remaining maturity of sixty days or less are valued at amortized cost, which approximates market value. If short-term debt securities are acquired with a remaining maturity of more than sixty days, they will be valued by a pricing service. The daily valuation of exchange-traded foreign securities generally is determined as of the close of trading on the principal exchange on which such securities trade. Events occurring after the close of trading on foreign exchanges may result in adjustments to the valuation of foreign securities to more accurately reflect their fair value as of the close of regular trading on the New York Stock Exchange. When valuing foreign equity securities that meet certain criteria, the Trustees have approved the use of a fair value service that values such securities to reflect market trading that occurs after the close of the applicable foreign markets of comparable securities or other instruments th at have a strong correlation to the fair-valued securities. Forward foreign currency exchange contracts are generally valued using prices supplied by a pricing vendor or dealers. Foreign securities and currencies are valued in U.S. dollars, based on foreign currency exchange rate quotations supplied by an independent quotation service. The independent service uses a proprietary model to determine the exchange rate. Inputs to the model include reported trades and implied bid/ask spreads. Investments for which valuations or market quotations are not readily available are valued at fair value using methods determined in good faith by or at the direction of the Trustees of the Portfolio considering relevant factors, data and information including the market value of freely tradable securities of the same class in the principal market on which such securities are normally traded.
The Portfolio may invest in Cash Management Portfolio (Cash Management), an affiliated investment company managed by Boston Management and Research (BMR), a subsidiary of Eaton Vance Management (EVM). Cash Management values its investment securities utilizing the amortized cost valuation technique permitted by Rule 2a-7 of the 1940 Act, pursuant to which Cash Management must comply with certain conditions. This technique involves initially valuing a portfolio security at its cost and thereafter assuming a constant amortization to maturity of any discount or premium. If amortized cost is determined not to approximate fair value, Cash Management may value its investment securities based on available market quotations provided by a pricing service.
B Investment Transactions — Investment transactions for financial statement purposes are accounted for on a trade date basis. Realized gains and losses on investments sold are determined on the basis of identified cost.
C Income — Dividend income is recorded on the ex-dividend date for dividends received in cash and/or securities. However, if the ex-dividend date has passed, certain dividends from foreign securities are recorded as the Portfolio is informed of the ex-dividend date. Withholding taxes on foreign dividends and capital gains have been provided for in accordance with the Portfolio's understanding of the applicable countries' tax rules and rates. Interest income is recorded on the basis of interest accrued, adjusted for amortization of premium or accretion of discount.
D Federal Taxes — The Portfolio has elected to be treated as a partnership for federal tax purposes. No provision is made by the Portfolio for federal or state taxes on any taxable income of the Portfolio because each investor in the Portfolio is ultimately responsible for the payment of any taxes on its share of taxable income. Since at least one of the Portfolio's investors is a regulated investment company that invests all or substantially all of its assets in the Portfolio, the Portfolio normally must satisfy the applicable source of income and diversification
24
Tax-Managed International Equity Portfolio as of October 31, 2008
NOTES TO FINANCIAL STATEMENTS CONT'D
requirements (under the Internal Revenue Code) in order for its investors to satisfy them. The Portfolio will allocate, at least annually among its investors, each investor's distributive share of the Portfolio's net investment income, net realized capital gains and any other items of income, gain, loss, deduction or credit.
In addition to the requirements of the Internal Revenue Code, the Portfolio may also be subject to local taxes on the recognition of capital gains in certain countries. In determining the daily net asset value, the Portfolio estimates the accrual for such taxes, if any, based on the unrealized appreciation on certain portfolio securities and the related tax rates. Tax expense attributable to unrealized appreciation is included in the change in unrealized appreciation (depreciation) on investments. Capital gains taxes on securities sold are included in net realized gain (loss) on investments.
As of October 31, 2008, the Portfolio had no uncertain tax positions that would require financial statement recognition, de-recognition, or disclosure. Each of the Portfolio's federal tax returns filed in the 3-year period ended October 31, 2008 remains subject to examination by the Internal Revenue Service.
E Expense Reduction — State Street Bank and Trust Company (SSBT) serves as custodian of the Portfolio. Pursuant to the custodian agreement, SSBT receives a fee reduced by credits, which are determined based on the average daily cash balance the Portfolio maintains with SSBT. All credit balances, if any, used to reduce the Portfolio's custodian fees are reported as a reduction of expenses in the Statement of Operations.
F Foreign Currency Translation — Investment valuations, other assets, and liabilities initially expressed in foreign currencies are translated each business day into U.S. dollars based upon current exchange rates. Purchases and sales of foreign investment securities and income and expenses denominated in foreign currencies are translated into U.S. dollars based upon currency exchange rates in effect on the respective dates of such transactions. Recognized gains or losses on investment transactions attributable to changes in foreign currency exchange rates are recorded for financial statement purposes as net realized gains and losses on investments. That portion of unrealized gains and losses on invest ments that results from fluctuations in foreign currency exchange rates is not separately disclosed.
G Use of Estimates — The preparation of the financial statements in conformity with accounting principles generally accepted in the United States of America requires management to make estimates and assumptions that affect the reported amounts of assets and liabilities at the date of the financial statements and the reported amounts of income and expense during the reporting period. Actual results could differ from those estimates.
H Indemnifications — Under the Portfolio's organizational documents, its officers and Trustees may be indemnified against certain liabilities and expenses arising out of the performance of their duties to the Portfolio. Interestholders in the Portfolio are jointly and severally liable for the liabilities and obligations of the Portfolio in the event that the Portfolio fails to satisfy such liabilities and obligations; provided, however, that, to the extent assets are available in the Portfolio, the Portfolio may, under certain circumstances, indemnify interestholders from and against any claim or liability to which such holder may become subject by reason of being or having been an interestholder in t he Portfolio. Additionally, in the normal course of business, the Portfolio enters into agreements with service providers that may contain indemnification clauses. The Portfolio's maximum exposure under these arrangements is unknown as this would involve future claims that may be made against the Portfolio that have not yet occurred.
2 Investment Adviser Fee and Other Transactions with Affiliates
The investment adviser fee is earned by BMR as compensation for investment advisory services rendered to the Portfolio. The fee is computed at an annual rate of 1.00% of the Portfolio's average daily net assets up to $500 million and at reduced rates as daily net assets exceed that level, and is payable monthly. Pursuant to a sub-advisory agreement, BMR pays Eagle Global Advisors, L.L.C. (Eagle) a portion of its adviser fee for sub-advisory services provided to the Portfolio. The portion of the adviser fee payable by Cash Management on the Portfolio's investment of cash therein is credited against the Portfolio's adviser fee. For the year ended October 31, 2008, the Portfolio's adviser fee totaled $3,640,520 of which $45,218 was allocated from Cash Management and $3,595,302 was paid or accrued directly by the Portfolio. For the year ended October 31, 2008, the adviser fee, including the portion allocated from Cash Management, wa s 1.00% of the Portfolio's average daily net assets.
25
Tax-Managed International Equity Portfolio as of October 31, 2008
NOTES TO FINANCIAL STATEMENTS CONT'D
Except for Trustees of the Portfolio who are not members of EVM's or BMR's organizations, officers and Trustees receive remuneration for their services to the Portfolio out of the investment adviser fee. Trustees of the Portfolio who are not affiliated with the investment adviser may elect to defer receipt of all or a percentage of their annual fees in accordance with the terms of the Trustees Deferred Compensation Plan. For the year ended October 31, 2008, no significant amounts have been deferred. Certain officers and Trustees of the Portfolio are officers of the above organizations.
3 Purchases and Sales of Investments
Purchases and sales of investments, other than short-term obligations, aggregated $172,866,341 and $121,679,608, respectively, for the year ended October 31, 2008.
4 Federal Income Tax Basis of Investments
The cost and unrealized appreciation (depreciation) of investments of the Portfolio at October 31, 2008, as determined on a federal income tax basis, were as follows:
| Aggregate cost | | $ | 275,159,328 | | |
| Gross unrealized appreciation | | $ | 11,675,229 | | |
| Gross unrealized depreciation | | | (58,688,112 | ) | |
| Net unrealized depreciation | | $ | (47,012,883 | ) | |
The net unrealized depreciation on foreign currency at October 31, 2008 on a federal income tax basis was $15,391.
5 Line of Credit
The Portfolio participates with other portfolios and funds managed by EVM and its affiliates in a $450 million unsecured line of credit agreement with a group of banks. Borrowings are made by the Portfolio solely to facilitate the handling of unusual and/or unanticipated short-term cash requirements. Interest is charged to the Portfolio based on its borrowings at an amount above either the Eurodollar rate or Federal Funds rate. In addition, a fee computed at an annual rate of 0.10% on the daily unused portion of the line of credit is allocated among the participating portfolios and funds at the end of each quarter. The Portfolio did not have any significant borrowings or allocated fees during the year ended October 31, 2008.
6 Risks Associated with Foreign Investments
Investing in securities issued by companies whose principal business activities are outside the United States may involve significant risks not present in domestic investments. For example, there is generally less publicly available information about foreign companies, particularly those not subject to the disclosure and reporting requirements of the U.S. securities laws. Certain foreign issuers are generally not bound by uniform accounting, auditing, and financial reporting requirements and standards of practice comparable to those applicable to domestic issuers. Investments in foreign securities also involve the risk of possible adverse changes in investment or exchange control regulations, expropriation or confiscatory taxation, limitation on the removal of funds or other assets of the Portfolio, political or financial instability or diplomatic and other developments which could affect such investments. Foreign securities mar kets, while growing in volume and sophistication, are generally not as developed as those in the United States, and securities of some foreign issuers (particularly those located in developing countries) may be less liquid and more volatile than securities of comparable U.S. companies. In general, there is less overall governmental supervision and regulation of foreign securities markets, broker-dealers and issuers than in the United States.
7 Recently Issued Accounting Pronouncement
In September 2006, the Financial Accounting Standards Board issued Statement of Financial Accounting Standards No. 157 (FAS 157), "Fair Value Measurements". FAS 157 defines fair value, establishes a framework for measuring fair value in accordance with accounting principles generally accepted in the United States of America and expands disclosure about fair value measurements. FAS 157 is effective for fiscal years beginning after November 15, 2007. As of October 31, 2008, management does not believe the adoption of FAS 157 will impact the amounts reported in the financial statements; however, additional disclosures may be required about the inputs used to develop the measurements of fair value and the effect of certain of the measurements on changes in net assets for the period.
26
Tax-Managed International Equity Portfolio as of October 31, 2008
REPORT OF INDEPENDENT REGISTERED PUBLIC ACCOUNTING FIRM
To the Trustees and Investors of
Tax-Managed International Equity Portfolio:
We have audited the accompanying statement of assets and liabilities of Tax-Managed International Equity Portfolio (the "Portfolio"), including the portfolio of investments, as of October 31, 2008, and the related statement of operations for the year then ended, the statements of changes in net assets for each of the two years in the period then ended, and the supplementary data for each of the five years in the period then ended. These financial statements and supplementary data are the responsibility of the Portfolio's management. Our responsibility is to express an opinion on these financial statements and supplementary data based on our audits.
We conducted our audits in accordance with the standards of the Public Company Accounting Oversight Board (United States). Those standards require that we plan and perform the audit to obtain reasonable assurance about whether the financial statements and supplementary data are free of material misstatement. The Portfolio is not required to have, nor were we engaged to perform, an audit of its internal control over financial reporting. Our audits included consideration of internal control over financial reporting as a basis for designing audit procedures that are appropriate in the circumstances, but not for the purpose of expressing an opinion on the effectiveness of the Portfolio's internal control over financial reporting. Accordingly, we express no such opinion. An audit also includes examining, on a test basis, evidence supporting the amounts and disclosures in the financial statements, assessing the accounting principles u sed and significant estimates made by management, as well as evaluating the overall financial statement presentation. Our procedures included confirmation of securities owned as of October 31, 2008, by correspondence with the custodian and brokers; where replies were not received from brokers, we performed other auditing procedures. We believe that our audits provide a reasonable basis for our opinion.
In our opinion, the financial statements and supplementary data referred to above present fairly, in all material respects, the financial position of Tax-Managed International Equity Portfolio as of October 31, 2008, the results of its operations for the year then ended, the changes in its net assets for each of the two years in the period then ended, and the supplementary data for each of the five years in the period then ended, in conformity with accounting principles generally accepted in the United States of America.
DELOITTE & TOUCHE LLP
Boston, Massachusetts
December 15, 2008
27
Eaton Vance Tax-Managed International Equity Fund
Tax-Managed International Equity Portfolio
SPECIAL MEETING OF SHAREHOLDERS (Unaudited)
Eaton Vance Tax-Managed International Equity Fund
The Fund held a Special Meeting of Shareholders on November 14, 2008 to elect Trustees. The results of the vote were as follows:
| | | Number of Shares | |
| Nominee for Trustee | | For | | Withheld | |
| Benjamin C. Esty | | | 15,733,577 | | | | 110,624 | | |
| Thomas E. Faust Jr. | | | 15,734,789 | | | | 109,412 | | |
| Allen R. Freedman | | | 15,732,430 | | | | 111,771 | | |
| William H. Park | | | 15,734,789 | | | | 109,412 | | |
| Ronald A. Pearlman | | | 15,733,581 | | | | 110,620 | | |
| Helen Frame Peters | | | 15,732,564 | | | | 111,637 | | |
| Heidi L. Steiger | | | 15,732,564 | | | | 111,637 | | |
| Lynn A. Stout | | | 15,733,877 | | | | 110,323 | | |
| Ralph F. Verni | | | 15,733,131 | | | | 111,070 | | |
Each nominee was also elected a Trustee of Tax-Managed International Equity Portfolio.
Tax-Managed International Equity Portfolio
The Portfolio held a Special Meeting of Interestholders on November 14, 2008 to elect Trustees. The results of the vote were as follows:
| | | Interest in the Portfolio | |
| Nominee for Trustee | | For | | Withheld | |
| Benjamin C. Esty | | | 99 | % | | | 1 | % | |
| Thomas E. Faust Jr. | | | 99 | % | | | 1 | % | |
| Allen R. Freedman | | | 99 | % | | | 1 | % | |
| William H. Park | | | 99 | % | | | 1 | % | |
| Ronald A. Pearlman | | | 99 | % | | | 1 | % | |
| Helen Frame Peters | | | 99 | % | | | 1 | % | |
| Heidi L. Steiger | | | 99 | % | | | 1 | % | |
| Lynn A. Stout | | | 99 | % | | | 1 | % | |
| Ralph F. Verni | | | 99 | % | | | 1 | % | |
Results are rounded to the nearest whole number.
28
Eaton Vance Tax-Managed International Equity Fund
BOARD OF TRUSTEES' ANNUAL APPROVAL OF THE INVESTMENT ADVISORY AGREEMENT
Overview of the Contract Review Process
The Investment Company Act of 1940, as amended (the "1940 Act"), provides, in substance, that each investment advisory agreement between a fund and its investment adviser will continue in effect from year to year only if its continuance is approved at least annually by the fund's board of trustees, including by a vote of a majority of the trustees who are not "interested persons" of the fund ("Independent Trustees"), cast in person at a meeting called for the purpose of considering such approval.
At a meeting of the Boards of Trustees (each a "Board") of the Eaton Vance group of mutual funds (the "Eaton Vance Funds") held on April 21, 2008, the Board, including a majority of the Independent Trustees, voted to approve continuation of existing advisory and sub-advisory agreements for the Eaton Vance Funds for an additional one-year period. In voting its approval, the Board relied upon the affirmative recommendation of the Contract Review Committee of the Board (formerly the Special Committee), which is a committee comprised exclusively of Independent Trustees. Prior to making its recommendation, the Contract Review Committee reviewed information furnished for a series of meetings of the Contract Review Committee held in February, March and April 2008. Such information included, among other things, the following:
Information about Fees, Performance and Expenses
• An independent report comparing the advisory and related fees paid by each fund with fees paid by comparable funds;
• An independent report comparing each fund's total expense ratio and its components to comparable funds;
• An independent report comparing the investment performance of each fund to the investment performance of comparable funds over various time periods;
• Data regarding investment performance in comparison to relevant peer groups of funds and appropriate indices;
• Comparative information concerning fees charged by each adviser for managing other mutual funds and institutional accounts using investment strategies and techniques similar to those used in managing the fund;
• Profitability analyses for each adviser with respect to each fund;
Information about Portfolio Management
• Descriptions of the investment management services provided to each fund, including the investment strategies and processes employed, and any changes in portfolio management processes and personnel;
• Information concerning the allocation of brokerage and the benefits received by each adviser as a result of brokerage allocation, including information concerning the acquisition of research through "soft dollar" benefits received in connection with the funds' brokerage, and the implementation of a soft dollar reimbursement program established with respect to the funds;
• Data relating to portfolio turnover rates of each fund;
• The procedures and processes used to determine the fair value of fund assets and actions taken to monitor and test the effectiveness of such procedures and processes;
Information about each Adviser
• Reports detailing the financial results and condition of each adviser;
• Descriptions of the qualifications, education and experience of the individual investment professionals whose responsibilities include portfolio management and investment research for the funds, and information relating to their compensation and responsibilities with respect to managing other mutual funds and investment accounts;
• Copies of the Codes of Ethics of each adviser and its affiliates, together with information relating to compliance with and the administration of such codes;
• Copies of or descriptions of each adviser's proxy voting policies and procedures;
• Information concerning the resources devoted to compliance efforts undertaken by each adviser and its affiliates on behalf of the funds (including descriptions of various compliance programs) and their record of compliance with investment policies and restrictions, including policies with respect to market-timing, late trading and selective portfolio disclosure, and with policies on personal securities transactions;
• Descriptions of the business continuity and disaster recovery plans of each adviser and its affiliates;
Other Relevant Information
• Information concerning the nature, cost and character of the administrative and other non-investment management services provided by Eaton Vance Management and its affiliates;
• Information concerning management of the relationship with the custodian, subcustodians and fund accountants by each adviser or the funds' administrator; and
• The terms of each advisory agreement.
29
Eaton Vance Tax-Managed International Equity Fund
BOARD OF TRUSTEES' ANNUAL APPROVAL OF THE INVESTMENT ADVISORY AGREEMENT CONT'D
In addition to the information identified above, the Contract Review Committee considered information provided from time to time by each adviser throughout the year at meetings of the Board and its committees. Over the course of the twelve-month period ended April 30, 2008, the Board met eleven times and the Contract Review Committee, the Audit Committee and the Governance Committee, each of which is a Committee comprised solely of Independent Trustees, met twelve, seven and five times, respectively. At such meetings, the Trustees received, among other things, presentations by the portfolio managers and other investment professionals of each adviser relating to the investment performance of each fund and the investment strategies used in pursuing the fund's investment objective. The Portfolio Management Committee and the Compliance Reports and Regulatory Matters Committee are newly established and did not meet during the twelve- month period ended April 30, 2008.
For funds that invest through one or more underlying portfolios, the Board considered similar information about the portfolio(s) when considering the approval of advisory agreements. In addition, in cases where the fund's investment adviser has engaged a sub-adviser, the Board considered similar information about the sub-adviser when considering the approval of any sub-advisory agreement.
The Contract Review Committee was assisted throughout the contract review process by Goodwin Procter LLP, legal counsel for the Independent Trustees. The members of the Contract Review Committee relied upon the advice of such counsel and their own business judgment in determining the material factors to be considered in evaluating each advisory and sub-advisory agreement and the weight to be given to each such factor. The conclusions reached with respect to each advisory and sub-advisory agreement were based on a comprehensive evaluation of all the information provided and not any single factor. Moreover, each member of the Contract Review Committee may have placed varying emphasis on particular factors in reaching conclusions with respect to each advisory and sub-advisory agreement.
Results of the Process
Based on its consideration of the foregoing, and such other information as it deemed relevant, including the factors and conclusions described below, the Contract Review Committee concluded that the continuance of the investment advisory agreement of the Tax-Managed International Equity Portfolio, the portfolio in which the Eaton Vance Tax-Managed International Equity Fund (the "Fund") invests, with Boston Management and Research (the "Adviser"), and the sub-advisory agreement with Eagle Global Advisors, L.L.C. ("Eagle" or the "Sub-adviser") including the fee structures, is in the interests of shareholders and, therefore, the Contract Review Committee recommended to the Board approval of the respective agreements. The Board accepted the recommendation of the Contract Review Committee as well as the factors considered and conclusions reached by the Contract Review Committee with respect to the agreements. Accordingly, the Board, including a majority of the Independent Trustees, voted to approve continuation of the investment advisory agreement and the sub-advisory agreement for the Portfolio.
Nature, Extent and Quality of Services
In considering whether to approve the investment advisory agreement and sub-advisory agreement of the Portfolio, the Board evaluated the nature, extent and quality of services provided to the Portfolio by the Adviser and the Sub-adviser.
The Board considered the Adviser's and the Sub-adviser's management capabilities and investment process with respect to the types of investments held by the Portfolio, including the education, experience and number of its investment professionals and other personnel who provide portfolio management, investment research, and similar services to the Portfolio and whose responsibilities include supervising the Sub-adviser. The Board specifically noted the Adviser's in-house equity research capabilities. The Board also took into account the resources dedicated to portfolio management and other services, including the compensation paid to recruit and retain investment personnel, and the time and attention devoted to the Portfolio by senior management. With respect to the Sub-adviser, the Board took into consideration the resources available to the Sub-adviser in fulfilling its duties under the sub-advisory agreement and the Sub-advis er's experience in managing international equity portfolios, as well as recent changes in personnel.
The Board also reviewed the compliance programs of the Adviser and relevant affiliates thereof, and of the Sub-adviser. Among other matters, the Board considered compliance and reporting matters relating to personal trading by investment personnel, selective disclosure of portfolio holdings, late trading, frequent trading, portfolio valuation, business continuity and the allocation of investment opportunities. The Board also evaluated the responses of the Adviser and its affiliates to requests from regulatory authorities such as the Securities and Exchange Commission.
The Board considered shareholder and other administrative services provided or managed by Eaton Vance Management and its affiliates, including transfer agency and accounting services. The Board evaluated the benefits to shareholders of investing in a fund that is a part of a large family of funds, including the ability, in many cases, to exchange an investment among different funds without incurring additional sales charges.
30
Eaton Vance Tax-Managed International Equity Fund
BOARD OF TRUSTEES' ANNUAL APPROVAL OF THE INVESTMENT ADVISORY AGREEMENT CONT'D
After consideration of the foregoing factors, among others, the Board concluded that the nature, extent and quality of services provided by the Adviser and Sub-adviser, taken as a whole, are appropriate and consistent with the terms of the investment advisory agreement and sub-advisory agreement, respectively.
Fund Performance
The Board compared the Fund's investment performance to a relevant universe of similarly managed funds identified by an independent data provider and appropriate benchmark indices. The Board reviewed comparative performance data for the one-, three- and five-year periods ended September 30, 2007 for the Fund. The Board concluded that the performance of the Fund was satisfactory.
Management Fees and Expenses
The Board reviewed contractual investment advisory fee rates, including any administrative fee rates, payable by the Portfolio and the Fund (referred to as "management fees"). As part of its review, the Board considered the management fees and the Fund's total expense ratio for the year ended September 30, 2007, as compared to a group of similarly managed funds selected by an independent data provider.
After reviewing the foregoing information, and in light of the nature, extent and quality of the services provided by the Adviser, the Board concluded that the management fees charged for advisory and related services and the Fund's total expense ratio are reasonable.
Profitability
The Board reviewed the level of profits realized by the Adviser and relevant affiliates thereof in providing investment advisory and administrative services to the Fund, to the Portfolio and to all Eaton Vance Funds as a group. The Board considered the level of profits realized without regard to revenue sharing or other payments by the Adviser and its affiliates to third parties in respect of distribution services. The Board also considered other direct or indirect benefits received by the Adviser and its affiliates in connection with its relationship with the Fund. The Board also concluded that, in light of its role as a sub-adviser not affiliated with the Adviser, the Sub-adviser's profitability in managing the Portfolio was not a material factor.
The Board concluded that, in light of the foregoing factors and the nature, extent and quality of the services rendered, the profits realized by the Adviser and its affiliates are reasonable.
Economies of Scale
In reviewing management fees and profitability, the Board also considered the extent to which the Adviser and its affiliates, on the one hand, and the Fund, on the other hand, can expect to realize benefits from economies of scale as the assets of the Fund and Portfolio increase. The Board acknowledged the difficulty in accurately measuring the benefits resulting from the economies of scale with respect to the management of any specific fund or group of funds. The Board reviewed data summarizing the increases and decreases in the assets of the Fund and of all Eaton Vance Funds as a group over various time periods, and evaluated the extent to which the total expense ratio of the Fund and the profitability of the Adviser and its affiliates may have been affected by such increases or decreases. Based upon the foregoing, the Board concluded that the benefits from economies of scale are currently being shared equitably by the Adviser and its affiliates and the Fund. The Board also concluded that, assuming reasonably foreseeable increases in the assets of the Portfolio, the structure of the advisory fee, which includes breakpoints at several asset levels, can be expected to cause the Adviser and its affiliates and the Fund to continue to share such benefits equitably.
31
Eaton Vance Tax-Managed International Equity Fund
MANAGEMENT AND ORGANIZATION
Fund Management. The Trustees of Eaton Vance Mutual Funds Trust (the Trust) and Tax-Managed International Equity Portfolio (the Portfolio) are responsible for the overall management and supervision of the Trust's and Portfolio's affairs. The Trustees and officers of the Trust and the Portfolio are listed below. Except as indicated, each individual has held the office shown or other offices in the same company for the last five years. Trustees and officers of the Trust and the Portfolio hold indefinite terms of office. The "noninterested Trustees" consist of those Trustees who are not "interested persons" of the Trust and the Portfolio, as that term is defined under the 1940 Act. The business address of each Trustee and officer is The Eaton Vance Building, 255 State Street, Boston, Massachusetts 02109. As used below, "EVC" refers to Eaton Vance Corp., "EV" re fers to Eaton Vance, Inc., "EVM" refers to Eaton Vance Management, "BMR" refers to Boston Management and Research, "EVD" refers to Eaton Vance Distributors, Inc., "Parametric" refers to Parametric Portfolio Associates and "Eagle" refers to Eagle Global Advisors, L.L.C. EVC and EV are the corporate parent and trustee, respectively, of EVM and BMR. EVD is the Fund's principal underwriter, the Portfolio's placement agent and a wholly-owned subsidiary of EVC. Each officer affiliated with Eaton Vance may hold a position with other Eaton Vance affiliates that is comparable to his or her position with EVM listed below.
Name and
Date of Birth | | Position(s)
with the
Trust and
the Portfolio | | Term of
Office and
Length of
Service | | Principal Occupation(s)
During Past Five Years | | Number of Portfolios
in Fund Complex
Overseen By
Trustee(1) | | Other Directorships Held | |
| Interested Trustee | | | | | | | | | | | | | |
|
Thomas E. Faust Jr.
5/31/58 | | Trustee and President of the Trust | | Trustee since 2007 and President of the Trust since 2002 | | Chairman, Chief Executive Officer and President of EVC, Director and President of EV, Chief Executive Officer and President of EVM and BMR, and Director of EVD. Trustee and/or Officer of 173 registered investment companies and 4 private companies managed by EVM or BMR. Mr. Faust is an interested person because of his positions with EVM, BMR, EVD, EVC and EV, which are affiliates of the Trust and Portfolio. | | | 173 | | | Director of EVC | |
|
| Noninterested Trustees | | | | | | | | | | | | | |
|
Benjamin C. Esty
1/2/63 | | Trustee | | Since 2005 | | Roy and Elizabeth Simmons Professor of Business Administration, Harvard University Graduate School of Business Administration. | | | 173 | | | None | |
|
Allen R. Freedman
4/3/40 | | Trustee | | Since 2007 | | Former Chairman (2002-2004) and a Director (1983-2004) of Systems & Computer Technology Corp. (provider of software to higher education). Formerly, a Director of Loring Ward International (fund distributor) (2005-2007). Formerly, Chairman and a Director of Indus International, Inc. (provider of enterprise management software to the power generating industry) (2005-2007). | | | 173 | | | Director of Assurant, Inc. and Stonemor Partners L.P. (owner and operator of cemeteries) | |
|
William H. Park
9/19/47 | | Trustee | | Since 2003 | | Vice Chairman, Commercial Industrial Finance Corp. (specialty finance company) (since 2006). Formerly, President and Chief Executive Officer, Prizm Capital Management, LLC (investment management firm) (2002-2005). | | | 173 | | | None | |
|
Ronald A. Pearlman
7/10/40 | | Trustee | | Since 2003 | | Professor of Law, Georgetown University Law Center. | | | 173 | | | None | |
|
Helen Frame Peters
3/22/48 | | Trustee | | Since 2008 | | Professor of Finance, Carroll School of Management, Boston College (since 2003), Adjunct Professor of Finance, Peking University, Beijing, China (since 2005). Formerly, Dean, Carroll School of Management, Boston College (2000-2003). | | | 173 | | | Director of Federal Home Loan Bank of Boston (a bank for banks) and BJ's Wholesale Clubs (wholesale club retailer); Trustee of SPDR Index Shares Funds and SPDR Series Trust (exchange traded funds) | |
|
32
Eaton Vance Tax-Managed International Equity Fund
MANAGEMENT AND ORGANIZATION CONT'D
Name and
Date of Birth | | Position(s)
with the
Trust and
the Portfolio | | Term of
Office and
Length of
Service | | Principal Occupation(s)
During Past Five Years | | Number of Portfolios
in Fund Complex
Overseen By
Trustee(1) | | Other Directorships Held | |
| Noninterested Trustees (continued) | | | | | | | | | | | | | |
|
Heidi L. Steiger
7/8/53 | | Trustee | | Since 2007 | | Managing Partner, Topridge Associates LLC (global wealth management firm) (since 2008); Senior Advisor (since 2008), President (2005-2008), Lowenhaupt Global Advisors, LLC (global wealth management firm). Formerly, President and Contributing Editor, Worth Magazine (2004-2005). Formerly, Executive Vice President and Global Head of Private Asset Management (and various other positions), Neuberger Berman (investment firm) (1986-2004). | | | 173 | | | Director of Nuclear Electric Insurance Ltd. (nuclear insurance provider) and Aviva USA (insurance provider) | |
|
Lynn A. Stout
9/14/57 | | Trustee | | Since 1998 | | Paul Hastings Professor of Corporate and Securities Law (since 2006) and Professor of Law (2001-2006), University of California at Los Angeles School of Law. | | | 173 | | | None | |
|
Ralph F. Verni
1/26/43 | | Chairman of the Board and Trustee | | Chairman of the Board since 2007 and Trustee since 2005 | | Consultant and private investor. | | | 173 | | | None | |
|
Principal Officers who are not Trustees
Name and
Date of Birth | | Position(s)
with the
Trust and
the Portfolio | | Term of
Office and
Length of
Service | | Principal Occupation(s)
During Past Five Years | |
William H. Ahern, Jr.
7/28/59 | | Vice President of the Trust | | Since 1995 | | Vice President of EVM and BMR. Officer of 75 registered investment companies managed by EVM or BMR. | |
|
Edward R. Allen, III
7/5/60 | | Vice President of the Portfolio | | Since 2004 | | Senior Partner of Eagle. Officer of 3 registered investment companies managed by EVM or BMR. | |
|
John R. Baur
2/10/70 | | Vice President of the Trust | | Since 2007 | | Vice President of EVM and BMR. Previously, attended Johnson Graduate School of Management, Cornell University (2002-2005), and prior thereto he was an Account Team Representative in Singapore for Applied Materials Inc. Officer of 33 registered investment companies managed by EVM or BMR. | |
|
Michael A. Cirami
12/24/75 | | Vice President of the Trust | | Since 2007 | | Vice President of EVM and BMR. Previously, attended the University of Rochester William E. Simon Graduate School of Business Administration (2001-2003), and prior thereto he was a Team Leader for the Institutional Services Group for State Street Bank in Luxembourg. Officer of 33 registered investment companies managed by EVM or BMR. | |
|
Cynthia J. Clemson
3/2/63 | | Vice President of the Trust | | Since 2005 | | Vice President of EVM and BMR. Officer of 90 registered investment companies managed by EVM or BMR. | |
|
Charles B. Gaffney
12/4/72 | | Vice President of the Trust | | Since 2007 | | Vice President of EVM and BMR. Previously, Sector Portfolio Manager and Senior Equity Analyst of Brown Brothers Harriman (1997-2003). Officer of 30 registered investment companies managed by EVM or BMR. | |
|
Thomas N. Hunt, III
11/6/64 | | Vice President of the Portfolio | | Since 2004 | | Senior Partner at Eagle. Officer of 3 registered investment companies managed by EVM or BMR. | |
|
Christine M. Johnston
11/9/72 | | Vice President of the Trust | | Since 2007 | | Vice President of EVM and BMR. Officer of 35 registered investment companies managed by EVM or BMR. | |
|
Aamer Khan
6/7/60 | | Vice President of the Trust | | Since 2005 | | Vice President of EVM and BMR. Officer of 33 registered investment companies managed by EVM or BMR. | |
|
Thomas H. Luster
4/8/62 | | Vice President of the Trust | | Since 2006 | | Vice President of EVM and BMR. Officer of 51 registered investment companies managed by EVM or BMR. | |
|
33
Eaton Vance Tax-Managed International Equity Fund
MANAGEMENT AND ORGANIZATION CONT'D
Name and
Date of Birth | | Position(s)
with the
Trust and
the Portfolio | | Term of
Office and
Length of
Service | | Principal Occupation(s)
During Past Five Years | |
| Principal Officers who are not Trustees (continued) | | | | | | | |
|
Robert B. MacIntosh
1/22/57 | | Vice President of the Trust | | Since 1998 | | Vice President of EVM and BMR. Officer of 90 registered investment companies managed by EVM or BMR. | |
|
Duncan W. Richardson
10/26/57 | | Vice President of the Trust and President of the Portfolio | | Vice President of the Trust since 2001 and President of the Portolio since 2002 | | Executive Vice President and Chief Equity Investment Officer of EVC, EVM and BMR. Officer of 81 registered investment companies managed by EVM or BMR. | |
|
Judith A. Saryan
8/21/54 | | Vice President of the Trust | | Since 2003 | | Vice President of EVM and BMR. Officer of 55 registered investment companies managed by EVM or BMR. | |
|
Susan Schiff
3/13/61 | | Vice President of the Trust | | Since 2002 | | Vice President of EVM and BMR. Officer of 36 registered investment companies managed by EVM or BMR. | |
|
Thomas Seto
9/27/62 | | Vice President of the Trust | | Since 2007 | | Vice President and Director of Portfolio Management of Parametric. Officer of 31 registered investment companies managed by EVM or BMR. | |
|
David M. Stein
5/4/51 | | Vice President of the Trust | | Since 2007 | | Managing Director and Chief Investment Officer of Parametric. Officer of 31 registered investment companies managed by EVM or BMR. | |
|
Mark S. Venezia
5/23/49 | | Vice President of the Trust | | Since 2007 | | Vice President of EVM and BMR. Officer of 36 registered investment companies managed by EVM or BMR. | |
|
Adam A. Weigold
3/22/75 | | Vice President of the Trust | | Since 2007 | | Vice President of EVM and BMR. Officer of 71 registered investment companies managed by EVM or BMR. | |
|
Barbara E. Campbell
6/19/57 | | Treasurer | | Of the Trust since 2005 and of the Portfolio since 2008(2) | | Vice President of EVM and BMR. Officer of 173 registered investment companies managed by EVM or BMR. | |
|
Maureen A. Gemma
5/24/60 | | Secretary and Chief Legal Officer | | Secretary since 2007 and Chief Legal Officer since 2008 | | Vice President of EVM and BMR. Officer of 173 registered investment companies managed by EVM or BMR. | |
|
Paul M. O'Neil
7/11/53 | | Chief Compliance Officer | | Since 2004 | | Vice President of EVM and BMR. Officer of 173 registered investment companies managed by EVM or BMR. | |
|
(1) Includes both master and feeder funds in a master-feeder structure.
(2) Prior to 2008, Ms. Campbell served as Assistant Treasurer of the Portfolio since 1998.
The SAI for the Fund includes additional information about the Trustees and officers of the Fund and the Portfolio and can be obtained without charge on Eaton Vance's website at www.eatonvance.com or by calling 1-800-262-1122.
34
This Page Intentionally Left Blank
This Page Intentionally Left Blank
Investment Adviser of Tax-Managed International Equity Portfolio
Boston Management and Research
The Eaton Vance Building
255 State Street
Boston, MA 02109
Sub-Adviser of Tax-Managed International Equity Portfolio
Eagle Global Advisors, L.L.C.
5847 San Felipe, Suite 930
Houston, TX 77057
Administrator of Eaton Vance Tax-Managed International Equity Fund
Eaton Vance Management
The Eaton Vance Building
255 State Street
Boston, MA 02109
Principal Underwriter
Eaton Vance Distributors, Inc.
The Eaton Vance Building
255 State Street
Boston, MA 02109
(617) 482-8260
Custodian
State Street Bank and Trust Company
200 Clarendon Street
Boston, MA 02116
Transfer Agent
PNC Global Investment Servicing
Attn: Eaton Vance Funds
P.O. Box 9653
Providence, RI 02940-9653
(800) 262-1122
Independent Registered Public Accounting Firm
Deloitte & Touche LLP
200 Berkeley Street
Boston, MA 02116-5022
Eaton Vance Tax-Managed International Equity Fund
The Eaton Vance Building
255 State Street
Boston, MA 02109
This report must be preceded or accompanied by a current prospectus. Before investing, investors should consider carefully the Fund's investment objective(s), risks, and charges and expenses. The Fund's current prospectus contains this and other information about the Fund and is available through your financial advisor. Please read the prospectus carefully before you invest or send money. For further information please call 1-800-262-1122.
038-12/08 IGSRC

Annual Report October 31, 2008


EATON VANCE
TAX-MANAGED
MID-CAP
CORE
FUND
IMPORTANT NOTICES REGARDING PRIVACY,
DELIVERY OF SHAREHOLDER DOCUMENTS,
PORTFOLIO HOLDINGS AND PROXY VOTING
Privacy. The Eaton Vance organization is committed to ensuring your financial privacy. Each of the financial institutions identified below has in effect the following policy ("Privacy Policy") with respect to nonpublic personal information about its customers:
• Only such information received from you, through application forms or otherwise, and information about your Eaton Vance fund transactions will be collected. This may include information such as name, address, social security number, tax status, account balances and transactions.
• None of such information about you (or former customers) will be disclosed to anyone, except as permitted by law (which includes disclosure to employees necessary to service your account). In the normal course of servicing a customer's account, Eaton Vance may share information with unaffiliated third parties that perform various required services such as transfer agents, custodians and broker/dealers.
• Policies and procedures (including physical, electronic and procedural safeguards) are in place that are designed to protect the confidentiality of such information.
• We reserve the right to change our Privacy Policy at any time upon proper notification to you. Customers may want to review our Policy periodically for changes by accessing the link on our homepage: www.eatonvance.com.
Our pledge of privacy applies to the following entities within the Eaton Vance organization: the Eaton Vance Family of Funds, Eaton Vance Management, Eaton Vance Investment Counsel, Boston Management and Research, and Eaton Vance Distributors, Inc.
In addition, our Privacy Policy only applies to those Eaton Vance customers who are individuals and who have a direct relationship with us. If a customer's account (i.e., fund shares) is held in the name of a third-party financial adviser/ broker- dealer, it is likely that only such adviser's privacy policies apply to the customer. This notice supersedes all previously issued privacy disclosures.
For more information about Eaton Vance's Privacy Policy, please call 1-800-262-1122.
Delivery of Shareholder Documents. The Securities and Exchange Commission (the "SEC") permits funds to deliver only one copy of shareholder documents, including prospectuses, proxy statements and shareholder reports, to fund investors with multiple accounts at the same residential or post office box address. This practice is often called "householding" and it helps eliminate duplicate mailings to shareholders.
Eaton Vance, or your financial adviser, may household the mailing of your documents indefinitely unless you instruct Eaton Vance, or your financial adviser, otherwise.
If you would prefer that your Eaton Vance documents not be householded, please contact Eaton Vance at 1-800-262-1122, or contact your financial adviser.
Your instructions that householding not apply to delivery of your Eaton Vance documents will be effective within 30 days of receipt by Eaton Vance or your financial adviser.
Portfolio Holdings. Each Eaton Vance Fund and its underlying Portfolio (if applicable) will file a schedule of its portfolio holdings on Form N-Q with the SEC for the first and third quarters of each fiscal year. The Form N-Q will be available on the Eaton Vance website www.eatonvance.com, by calling Eaton Vance at 1-800-262-1122 or in the EDGAR database on the SEC's website at www.sec.gov. Form N-Q may also be reviewed and copied at the SEC's public reference room in Washington, D.C. (call 1-800-732-0330 for information on the operation of the public reference room).
Proxy Voting. From time to time, funds are required to vote proxies related to the securities held by the funds. The Eaton Vance Funds or their underlying Portfolios (if applicable) vote proxies according to a set of policies and procedures approved by the Funds' and Portfolios' Boards. You may obtain a description of these policies and procedures and information on how the Funds or Portfolios voted proxies relating to portfolio securities during the most recent 12 month period ended June 30, without charge, upon request, by calling 1-800-262-1122. This description is also available on the SEC's website at www.sec.gov.
Eaton Vance Tax-Managed Mid-Cap Core Fund as of October 31, 2008
MANAGEMENT’s DISCUSSION oF FuND pERFoRMANcE

William O. Bell IV, CFA
Co-Portfolio Manager

William R. Hackney, III, CFA
Co-Portfolio Manager

Marilyn Robinson Irvin, CFA
Co-Portfolio Manager
Economic and Market Conditions
· The stock market moved dramatically lower during the year that ended October 31, 2008. After reaching record highs in October 2007, the major market indices began to decline at the end of 2007, as investors realized that the difficulties in subprime lending and the troubled housing market were likely to slow the economy significantly. By the summer of 2008, the magnitude of the damage became increasingly apparent. Many banks were faced with enormous write-offs from bad real estate loans, losses that severely impaired their overall lending capacity. As the market declined further, investor and consumer sentiment worsened. That trend was accelerated by soaring energy prices, as oil hit $145 per barrel in July and pinched consumers even more.
· The failure of Lehman Brothers in September 2008 and the tenuous condition of other capital-starved banks and financial institutions sparked fears of a global financial collapse. In late September, in an effort to jump-start lending, the U.S. Treasury department unveiled a controversial proposal to purchase troubled loans from banks and financial institutions. Congress’s initial rejection of the plan sent the market into a near-freefall. A revised version of the measure was subsequently approved by Congress, and was followed by a coordinated effort by the world’s central banks to inject liquidity into the global banking system. While those actions reassured many investors, volatility remained high as the one-year period drew to a close.
· Mid-cap stocks, as measured by the S&P Midcap 400 Index (the “Index”), posted a return of -36.5% for the year ended October 31, 2008.(1) Each of the 10 economic sectors represented in the Index posted double-digit negative returns over the 12-month period. The best performance was seen in the more defensive sectors of the economy, while the weakest performance was seen in the more economically sensitive sectors. The utilities and consumer staples sectors fell the least, as investors believed the earnings of these companies would fare relatively better in the challenging global economic environment. The prospects of a slowing global economy and weak consumer spending was reflected in the declines of the telecommunication services, energy, and consumer discretionary sectors.
Management Discussion
· The Fund(2) outperformed its benchmark and its Lipper peer group for the fiscal year ended October 31, 2008, primarily due to stock selection within the industrials, health care and information technology (IT) sectors. Selections in air freight and logistics, as well as machinery, led to the relative outperformance in the industrials sector. The Fund’s emphasis on health care equipment and services names led to
Eaton Vance Tax-Managed Mid-cap core Fund
Total Return performance 10/31/07 – 10/31/08
Class A(3) | | -31.02 | % |
Class B(3) | | -31.56 | |
Class C(3) | | -31.63 | |
S&P MidCap 400 Index(1) | | -36.46 | |
Lipper Mid-Cap Core Funds Average(1) | | -38.53 | |
See pages 3 and 4 for more performance information, including after-tax returns.
(1) | It is not possible to invest directly in an Index or a Lipper Classification. The Index’s total return does not reflect commissions or expenses that would have been incurred if an investor individually purchased or sold the securities represented in the Index. The Lipper total return is the average total return, at net asset value, of the funds that are in the same Lipper Classification as the Fund. |
| |
(2) | The Fund currently invests in a separate registered investment company, Tax-Managed Mid-Cap Core Portfolio, with the same objective and policies as the Fund. References to investments are to the Portfolio’s holdings. |
| |
(3) | These returns do not include the 5.75% maximum sales charge for Class A shares or the applicable contingent deferred sales charge (CDSC) for Class B and Class C shares. If sales charges were deducted, the returns would be lower. |
Past performance is no guarantee of future results. Returns are historical and are calculated by determining the percentage change in net asset value or offering price (as applicable) with all distributions reinvested. Investment return and principal value will fluctuate so that shares, when redeemed, may be worth more or less than their original cost. Performance is for the stated time period only; due to market volatility, the Fund’s current performance may be lower or higher than the quoted return. Absent a reimbursement of certain expenses by the administrator of the Fund, the returns would be lower. For performance as of the most recent month end, please refer to www.eatonvance.com.
Fund shares are not insured by the FDIC and are not deposits or other obligations of, or guaranteed by, any depository institution. Shares are subject to investment risks, including possible loss of principal invested.
1
the positive comparison in the health care sector. Semiconductors and equipment and instrument names carried IT sector performance. Stock selection was least favorable in the energy sector, due to the performance of the Fund’s oil, gas and consumables names.
· Management seeks stocks that, in their opinion, have attractive relative valuations and/or the potential for above-average sustainable growth. As of October 31, 2008, the Fund’s holdings were broadly diversified across nine of the 10 economic sectors of the Index. (The Fund had no exposure to the telecommunications services sector, which represented less than 1% of the market capitalization of the Index.)(1)
(1) It is not possible to invest directly in an Index.
Portfolio Information
Top Ten Holdings(2)
By net assets
Dollar Tree, Inc. | | 2.7 | % |
Alberto-Culver Co. | | 2.7 | |
Cullen/Frost Bankers, Inc. | | 2.5 | |
Jack Henry & Associates, Inc. | | 2.1 | |
CH Robinson Worldwide, Inc. | | 2.0 | |
Donaldson Co., Inc. | | 2.0 | |
Microchip Technology, Inc. | | 2.0 | |
National Instruments Corp. | | 2.0 | |
AMETEK, Inc. | | 2.0 | |
Bard (C.R.), Inc. | | 2.0 | |
(2) Top Ten Holdings represented 22.0% of the Portfolio’s net assets as of 10/31/08. Excludes cash equivalents.
Sector Weightings(3)
By net assets
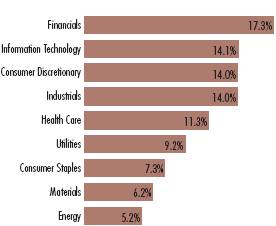
(3) As a percentage of the Portfolio’s net assets as of 10/31/08. Excludes cash equivalents.
The views expressed throughout this report are those of the portfolio managers and are current only through the end of the period of the report as stated on the cover. These views are subject to change at any time based upon market or other conditions, and the investment adviser disclaims any responsibility to update such views. These views may not be relied on as investment advice and, because investment decisions for a fund are based on many factors, may not be relied on as an indication of trading intent on behalf of any Eaton Vance fund. Portfolio information provided in the report may not be representative of the Portfolio’s current or future investments and may change due to active management.
2
Eaton Vance Tax-Managed Mid-Cap Core Fund as of October 31, 2008
FuND pERFoRMANcE
The line graph and table set forth below provide information about the Fund’s performance. The line graph compares the performance of Class A of the Fund with that of the S&P MidCap 400 Index, a broad-based, unmanaged index commonly used as a measure of U.S. mid-cap stock performance. The lines on the graph represent the total returns of a hypothetical investment of $10,000 in each of Class A and the S&P MidCap 400 Index. The table includes the total returns of each Class of the Fund at net asset value and maximum public offering price. The performance presented below does not reflect the deduction of taxes, if any, that a shareholder would pay on distributions or redemption of Fund shares.

* Source: Lipper Inc. Class A of the Fund commenced investment operations on 3/4/02.
A $10,000 hypothetical investment at net asset value in Class B shares and Class C shares on 3/4/02 (commencement of operations) would have been valued at $10,718 and $10,706, respectively, on 10/31/08. It is not possible to invest directly in an Index. The Index’s total return does not reflect commissions or expenses that would have been incurred if an investor individually purchased or sold the securities represented in the Index. Absent a reimbursement of certain expenses by the administrator of the Fund, the returns would have been lower.
Fund Performance(1)
| | Class A | | Class B | | Class C | |
Share Class Symbol | | EXMCX | | EBMCX | | ECMCX | |
| | | | | | | |
Average Annual Total Returns (at net asset value) | | | | | | | |
One Year | | -31.02 | % | -31.56 | % | -31.63 | % |
Five Years | | 1.08 | | 0.33 | | 0.31 | |
Life of Fund† | | 1.80 | | 1.05 | | 1.03 | |
| | | | | | | |
SEC Average Annual Total Returns (including sales charge or applicable CDSC) | | | | | | | |
One Year | | -34.98 | % | -34.74 | % | -32.26 | % |
Five Years | | -0.10 | | -0.02 | | 0.31 | |
Life of Fund† | | 0.90 | | 1.05 | | 1.03 | |
† Inception Dates – Class A, Class B, and Class C: 3/4/02
(1) Average Annual Total Returns do not include the 5.75% maximum sales charge for Class A shares or the applicable contingent deferred sales charge (CDSC) for Class B and Class C shares. If sales charges were deducted, the returns would be lower. SEC Average Annual Total Returns for Class A reflect the maximum 5.75% sales charge. SEC returns for Class B shares reflect the applicable CDSC based on the following schedule: 5% - 1st and 2nd years; 4% - 3rd year; 3% - - 4th year; 2% - 5th year; 1% - 6th year. SEC returns for Class C reflect a 1% CDSC for the first year.
Total Annual
Operating Expenses(2)
| | Class A | | Class B | | Class C | |
| | | | | | | |
Gross Expense Ratio | | 1.71 | % | 2.46 | % | 2.46 | % |
Net Expense Ratio | | 1.64 | | 2.39 | | 2.39 | |
(2) Source: Prospectus dated 3/1/08. Net expense ratio reflects a contractual expense reimbursement which may be changed or terminated after April 30, 2010. Without this reimbursement, performance would have been lower.
Past performance is no guarantee of future results. Returns are historical and are calculated by determining the percentage change in net asset value or offering price (as applicable) with all distributions reinvested. Investment return and principal value will fluctuate so that shares, when redeemed, may be worth more or less than their original cost. Performance is for the stated time period only; due to market volatility, the Fund’s current performance may be lower or higher than the quoted return. Absent a reimbursement of certain expenses by the administrator of the Fund, the returns would have been lower. For performance as of the most recent month end, please refer to www.eatonvance.com.
3
“Return Before Taxes” does not take into consideration shareholder taxes. It is most relevant to tax-free or tax-deferred shareholder accounts. “Return After Taxes on Distributions” reflects the impact of federal income taxes due on Fund distributions of dividends and capital gains. It is most relevant to taxpaying shareholders who continue to hold their shares. “Return After Taxes on Distributions and Sale of Fund Shares” also reflects the impact of taxes on capital gain or loss realized upon a sale of shares. It is most relevant to taxpaying shareholders who sell their shares.
Average Annual Total Returns
(For the periods ended October 31, 2008)
Returns at Net Asset Value (NAV) (Class A)
| | One Year | | Five Years | | Life of Fund | |
| | | | | | | |
Return Before Taxes | | -31.02 | % | 1.08 | % | 1.80 | % |
Return After Taxes on Distributions | | -31.71 | | 0.71 | | 1.51 | |
Return After Taxes on Distributions and Sale of Fund Shares | | -18.63 | | 1.14 | | 1.70 | |
Returns at Public Offering Price (POP) (Class A)
| | One Year | | Five Years | | Life of Fund | |
| | | | | | | |
Return Before Taxes | | -34.98 | % | -0.10 | % | 0.90 | % |
Return After Taxes on Distributions | | -35.64 | | -0.48 | | 0.62 | |
Return After Taxes on Distributions and Sale of Fund Shares | | -21.30 | | 0.12 | | 0.93 | |
Average Annual Total Returns
(For the periods ended October 31, 2008)
Returns at Net Asset Value (NAV) (Class B)
| | One Year | | Five Years | | Life of Fund | |
| | | | | | | |
Return Before Taxes | | -31.56 | % | 0.33 | % | 1.05 | % |
Return After Taxes on Distributions | | -32.28 | | -0.05 | | 0.75 | |
Return After Taxes on Distributions and Sale of Fund Shares | | -18.91 | | 0.51 | | 1.07 | |
Returns at Public Offering Price (POP) (Class B)
| | One Year | | Five Years | | Life of Fund | |
| | | | | | | |
Return Before Taxes | | -34.74 | % | -0.02 | % | 1.05 | % |
Return After Taxes on Distributions | | -35.46 | | -0.41 | | 0.75 | |
Return After Taxes on Distributions and Sale of Fund Shares | | -20.98 | | 0.21 | | 1.07 | |
Average Annual Total Returns
(For the periods ended October 31, 2008)
Returns at Net Asset Value (NAV) (Class C)
| | One Year | | Five Years | | Life of Fund | |
| | | | | | | |
Return Before Taxes | | -31.63 | % | 0.31 | % | 1.03 | % |
Return After Taxes on Distributions | | -32.35 | | -0.08 | | 0.73 | |
Return After Taxes on Distributions and Sale of Fund Shares | | -18.96 | | 0.49 | | 1.05 | |
Returns at Public Offering Price (POP) (Class C)
| | One Year | | Five Years | | Life of Fund | |
| | | | | | | |
Return Before Taxes | | -32.26 | % | 0.31 | % | 1.03 | % |
Return After Taxes on Distributions | | -32.98 | | -0.08 | | 0.73 | |
Return After Taxes on Distributions and Sale of Fund Shares | | -19.37 | | 0.49 | | 1.05 | |
Class A, Class B and Class C of the Fund commenced investment operations on 3/4/02. Returns at Public Offering Price (POP) reflect the deduction of the maximum initial sales charge and applicable CDSC, while Returns at Net Asset Value (NAV) do not.
After-tax returns are calculated using certain assumptions. After-tax returns are calculated using the highest historical individual federal income tax rates and do not reflect the impact of state and local taxes. Actual after-tax returns depend on a shareholder’s tax situation and the actual characterization of distributions and may differ from those shown. After-tax returns are not relevant to shareholders who hold shares in tax-deferred accounts or to shares held by non-taxable entities. Return After Taxes on Distributions for a period may be the same as Return Before Taxes for the same period because no taxable distributions were made during that period. Return After Taxes on Distributions and Sale of Fund Shares for a period may be greater than or equal to Return After Taxes on Distributions for the same period because of losses realized on the sale of Fund shares.
Past performance is no guarantee of future results. Returns are historical and are calculated by determining the percentage change in net asset value or offering price (as applicable) with all distributions reinvested. Investment return and principal value will fluctuate so that shares, when redeemed, may be worth more or less than their original cost. Performance is for the stated time period only; due to market volatility, the Fund’s current performance may be lower or higher than the quoted return. For performance as of the most recent month-end, please refer to www.eatonvance.com.
4
Eaton Vance Tax-Managed Mid-Cap Core Fund as of October 31, 2008
FUND EXPENSES
Example: As a shareholder of the Fund, you incur two types of costs: (1) transaction costs, including sales charges (loads) on purchases and redemption fees (if applicable); and (2) ongoing costs, including management fees; distribution or service fees; and other Fund expenses. This Example is intended to help you understand your ongoing costs (in dollars) of investing in the Fund and to compare these costs with the ongoing costs of investing in other mutual funds. The Example is based on an investment of $1,000 invested at the beginning of the period and held for the entire period (May 1, 2008 – October 31, 2008).
Actual Expenses: The first section of the table below provides information about actual account values and actual expenses. You may use the information in this section, together with the amount you invested, to estimate the expenses that you paid over the period. Simply divide your account value by $1,000 (for example, an $8,600 account value divided by $1,000 = 8.6), then multiply the result by the number in the first section under the heading entitled "Expenses Paid During Period" to estimate the expenses you paid on your account during this period.
Hypothetical Example for Comparison Purposes: The second section of the table below provides information about hypothetical account values and hypothetical expenses based on the actual Fund expense ratio and an assumed rate of return of 5% per year (before expenses), which is not the actual return of the Fund. The hypothetical account values and expenses may not be used to estimate the actual ending account balance or expenses you paid for the period. You may use this information to compare the ongoing costs of investing in your Fund and other funds. To do so, compare this 5% hypothetical example with the 5% hypothetical examples that appear in the shareholder reports of the other funds.
Please note that the expenses shown in the table are meant to highlight your ongoing costs only and do not reflect any transactional costs, such as sales charges (loads) or redemption fees (if applicable). Therefore, the second section of the table is useful in comparing ongoing costs only, and will not help you determine the relative total costs of owning different funds. In addition, if these transactional costs were included, your costs would have been higher.
Eaton Vance Tax-Managed Mid-Cap Core Fund
| | | Beginning Account Value
(5/1/08) | | Ending Account Value
(10/31/08) | | Expenses Paid During Period*
(5/1/08 – 10/31/08) | |
| Actual | |
| Class A | | $ | 1,000.00 | | | $ | 724.40 | | | $ | 6.94 | ** | |
| Class B | | $ | 1,000.00 | | | $ | 721.00 | | | $ | 10.17 | ** | |
| Class C | | $ | 1,000.00 | | | $ | 720.20 | | | $ | 10.16 | ** | |
| Hypothetical | |
| (5% return per year before expenses) | |
| Class A | | $ | 1,000.00 | | | $ | 1,017.10 | | | $ | 8.11 | ** | |
| Class B | | $ | 1,000.00 | | | $ | 1,013.30 | | | $ | 11.89 | ** | |
| Class C | | $ | 1,000.00 | | | $ | 1,013.30 | | | $ | 11.89 | ** | |
* Expenses are equal to the Fund's annualized expense ratio of 1.60% for Class A shares 2.35% for Class B shares, and 2.35% for Class C shares multiplied by the average account value over the period, multiplied by 184/366 (to reflect the one-half year period). The Example assumes that the $1,000 was invested at the net asset value per share determined at the close of business on April 30, 2008. The Example reflects the expenses of both the Fund and the Portfolio.
** Absent an allocation of certain expenses to the administrator of the Fund and sub-adviser of the Portfolio, expenses would be higher.
5
Eaton Vance Tax-Managed Mid-Cap Core Fund as of October 31, 2008
FINANCIAL STATEMENTS
Statement of Assets and Liabilities
As of October 31, 2008
| Assets | |
Investment in Tax-Managed Mid-Cap Core Portfolio, at value
(identified cost, $25,618,263) | | $ | 24,745,368 | | |
| Receivable for Fund shares sold | | | 109,958 | | |
| Total assets | | $ | 24,855,326 | | |
| Liabilities | |
| Payable to affiliate for distribution and service fees | | $ | 10,812 | | |
| Payable for Fund shares redeemed | | | 9,681 | | |
| Payable to affiliate for administration fee | | | 3,182 | | |
| Payable to the administrator of the Fund and sub-advisor of the Portfolio | | | 13,862 | | |
| Accrued expenses | | | 32,650 | | |
| Total liabilities | | $ | 70,187 | | |
| Net Assets | | $ | 24,785,139 | | |
| Sources of Net Assets | |
| Paid-in capital | | $ | 26,401,216 | | |
Accumulated net realized loss from Portfolio (computed on
the basis of identified cost) | | | (743,182 | ) | |
Net unrealized depreciation from Portfolio (computed on the basis of
identified cost) | | | (872,895 | ) | |
| Total | | $ | 24,785,139 | | |
| Class A Shares | |
| Net Assets | | $ | 16,196,492 | | |
| Shares Outstanding | | | 1,635,061 | | |
Net Asset Value and Redemption Price Per Share
(net assets ÷ shares of beneficial interest outstanding) | | $ | 9.91 | | |
Maximum Offering Price Per Share
(100 ÷ 94.25 of $9.91) | | $ | 10.51 | | |
| Class B Shares | |
| Net Assets | | $ | 3,315,758 | | |
| Shares Outstanding | | | 353,525 | | |
Net Asset Value and Offering Price Per Share*
(net assets ÷ shares of beneficial interest outstanding) | | $ | 9.38 | | |
| Class C Shares | |
| Net Assets | | $ | 5,272,889 | | |
| Shares Outstanding | | | 562,664 | | |
Net Asset Value and Offering Price Per Share*
(net assets ÷ shares of beneficial interest outstanding) | | $ | 9.37 | | |
| On sales of $50,000 or more, the offering price of Class A shares is reduced. | |
* Redemption price per share is equal to the net asset value less any applicable contingent deferred sales charge.
Statement of Operations
For the Year Ended
October 31, 2008
| Investment Income | |
| Dividends allocated from Portfolio | | $ | 451,703 | | |
| Interest allocated from Portfolio | | | 4,243 | | |
| Expenses allocated from Portfolio | | | (306,313 | ) | |
| Net investment income from Portfolio | | $ | 149,633 | | |
| Expenses | |
| Administration fee | | $ | 51,198 | | |
| Trustees' fees and expenses | | | 80 | | |
Distribution and service fees
Class A | | | 54,673 | | |
| Class B | | | 48,800 | | |
| Class C | | | 73,827 | | |
| Transfer and dividend disbursing agent fees | | | 39,197 | | |
| Registration fees | | | 30,659 | | |
| Custodian fee | | | 18,466 | | |
| Legal and accounting services | | | 14,857 | | |
| Printing and postage | | | 11,481 | | |
| Miscellaneous | | | 9,007 | | |
| Total expenses | | $ | 352,245 | | |
Deduct —
Allocation of expenses to the administrator of the
Fund and sub-adviser of the Portfolio | | $ | 20,429 | | |
| Total expense reductions | | $ | 20,429 | | |
| Net expenses | | $ | 331,816 | | |
| Net investment loss | | $ | (182,183 | ) | |
Realized and Unrealized
Gain (Loss) from Portfolio | |
Net realized gain (loss) —
Investment transactions (identified cost basis) | | $ | (712,147 | ) | |
| Net realized loss | | $ | (712,147 | ) | |
Change in unrealized appreciation (depreciation) —
Investments (identified cost basis) | | $ | (10,849,356 | ) | |
| Net change in unrealized appreciation (depreciation) | | $ | (10,849,356 | ) | |
| Net realized and unrealized loss | | $ | (11,561,503 | ) | |
| Net decrease in net assets from operations | | $ | (11,743,686 | ) | |
See notes to financial statements
6
Eaton Vance Tax-Managed Mid-Cap Core Fund as of October 31, 2008
FINANCIAL STATEMENTS CONT'D
Statements of Changes in Net Assets
Increase (Decrease)
in Net Assets | | Year Ended
October 31, 2008 | | Year Ended
October 31, 2007 | |
From operations —
Net investment loss | | $ | (182,183 | ) | | $ | (224,875 | ) | |
Net realized gain (loss) from
investment transactions | | | (712,147 | ) | | | 2,630,199 | | |
Net change in unrealized
appreciation (depreciation)
of investments | | | (10,849,356 | ) | | | 2,853,010 | | |
Net increase (decrease) in net assets
from operations | | $ | (11,743,686 | ) | | $ | 5,258,334 | | |
Distributions to shareholders —
From net realized gain
Class A | | $ | (1,631,947 | ) | | $ | (947,771 | ) | |
| Class B | | | (403,944 | ) | | | (355,120 | ) | |
| Class C | | | (596,306 | ) | | | (393,590 | ) | |
| Total distributions to shareholders | | $ | (2,632,197 | ) | | $ | (1,696,481 | ) | |
Transactions in shares of beneficial interest —
Proceeds from sale of shares
Class A | | $ | 4,078,939 | | | $ | 6,448,468 | | |
| Class B | | | 195,836 | | | | 301,473 | | |
| Class C | | | 894,312 | | | | 1,813,005 | | |
Net asset value of shares issued to
shareholders in payment of
distributions declared
Class A | | | 1,437,508 | | | | 818,042 | | |
| Class B | | | 369,556 | | | | 324,495 | | |
| Class C | | | 492,053 | | | | 323,252 | | |
Cost of shares redeemed
Class A | | | (4,805,013 | ) | | | (3,433,448 | ) | |
| Class B | | | (856,013 | ) | | | (1,198,300 | ) | |
| Class C | | | (1,736,810 | ) | | | (1,214,224 | ) | |
Net asset value of shares exchanged
Class A | | | 276,499 | | | | 671,373 | | |
| Class B | | | (276,499 | ) | | | (671,373 | ) | |
Net increase in net assets from Fund
share transactions | | $ | 70,368 | | | $ | 4,182,763 | | |
| Net increase (decrease) in net assets | | $ | (14,305,515 | ) | | $ | 7,744,616 | | |
| Net Assets | |
| At beginning of year | | $ | 39,090,654 | | | $ | 31,346,038 | | |
| At end of year | | $ | 24,785,139 | | | $ | 39,090,654 | | |
Accumulated undistributed
net investment income
included in net assets | |
| At end of year | | $ | — | | | $ | 4,714 | | |
See notes to financial statements
7
Eaton Vance Tax-Managed Mid-Cap Core Fund as of October 31, 2008
FINANCIAL STATEMENTS CONT'D
Financial Highlights
| | | Class A | |
| | | Year Ended October 31, | |
| | | 2008 | | 2007 | | 2006 | | 2005 | | 2004 | |
| Net asset value — Beginning of year | | $ | 15.400 | | | $ | 13.890 | | | $ | 12.360 | | | $ | 11.270 | | | $ | 10.670 | | |
| Income (loss) from operations | |
| Net investment loss(1) | | $ | (0.035 | ) | | $ | (0.049 | ) | | $ | (0.067 | ) | | $ | (0.108 | ) | | $ | (0.102 | ) | |
| Net realized and unrealized gain (loss) | | | (4.430 | ) | | | 2.299 | | | | 1.663 | | | | 1.198 | | | | 0.702 | | |
| Total income (loss) from operations | | $ | (4.465 | ) | | $ | 2.250 | | | $ | 1.596 | | | $ | 1.090 | | | $ | 0.600 | | |
| Less distributions | |
| From net realized gain | | $ | (1.025 | ) | | $ | (0.740 | ) | | $ | (0.066 | ) | | $ | — | | | $ | — | | |
| Total distributions | | $ | (1.025 | ) | | $ | (0.740 | ) | | $ | (0.066 | ) | | $ | — | | | $ | — | | |
| Net asset value — End of year | | $ | 9.910 | | | $ | 15.400 | | | $ | 13.890 | | | $ | 12.360 | | | $ | 11.270 | | |
| Total Return(2) | | | (31.02 | )% | | | 16.93 | % | | | 12.96 | % | | | 9.67 | % | | | 5.62 | % | |
| Ratios/Supplemental Data | |
| Net assets, end of year (000's omitted) | | $ | 16,196 | | | $ | 24,406 | | | $ | 17,718 | | | $ | 13,761 | | | $ | 11,226 | | |
| Ratios (As a percentage of average daily net assets): | |
| Expenses(3)(4) | | | 1.60 | % | | | 1.64 | % | | | 1.70 | % | | | 1.70 | % | | | 1.70 | % | |
| Net investment loss | | | (0.26 | )% | | | (0.34 | )% | | | (0.50 | )% | | | (0.89 | )% | | | (0.93 | )% | |
| Portfolio Turnover of the Portfolio | | | 40 | % | | | 38 | % | | | 55 | % | | | 53 | % | | | 42 | % | |
(1) Computed using average shares outstanding.
(2) Returns are historical and are calculated by determining the percentage change in net asset value with all distributions reinvested.
(3) Includes the Fund's share of the Portfolio's allocated expenses.
(4) The investment adviser of the Portfolio waived a portion of its investment adviser fee and the administrator of the Fund subsidized certain operating expenses (equal to 0.06%, 0.07%, 0.07%, 0.16% and 0.22% of average daily net assets for the years ended October 31, 2008, 2007, 2006, 2005 and 2004, respectively). A portion of the waiver and subsidy was borne by the sub-adviser of the Portfolio. Absent this waiver and subsidy, total return would be lower.
See notes to financial statements
8
Eaton Vance Tax-Managed Mid-Cap Core Fund as of October 31, 2008
FINANCIAL STATEMENTS CONT'D
Financial Highlights
| | | Class B | |
| | | Year Ended October 31, | |
| | | 2008 | | 2007 | | 2006 | | 2005 | | 2004 | |
| Net asset value — Beginning of year | | $ | 14.740 | | | $ | 13.420 | | | $ | 12.030 | | | $ | 11.050 | | | $ | 10.540 | | |
| Income (loss) from operations | |
| Net investment loss(1) | | $ | (0.127 | ) | | $ | (0.151 | ) | | $ | (0.161 | ) | | $ | (0.194 | ) | | $ | (0.182 | ) | |
| Net realized and unrealized gain (loss) | | | (4.208 | ) | | | 2.211 | | | | 1.617 | | | | 1.174 | | | | 0.692 | | |
| Total income (loss) from operations | | $ | (4.335 | ) | | $ | 2.060 | | | $ | 1.456 | | | $ | 0.980 | | | $ | 0.510 | | |
| Less distributions | |
| From net realized gain | | $ | (1.025 | ) | | $ | (0.740 | ) | | $ | (0.066 | ) | | $ | — | | | $ | — | | |
| Total distributions | | $ | (1.025 | ) | | $ | (0.740 | ) | | $ | (0.066 | ) | | $ | — | | | $ | — | | |
| Net asset value — End of year | | $ | 9.380 | | | $ | 14.740 | | | $ | 13.420 | | | $ | 12.030 | | | $ | 11.050 | | |
| Total Return(2) | | | (31.56 | )% | | | 16.07 | % | | | 12.15 | % | | | 8.87 | % | | | 4.84 | % | |
| Ratios/Supplemental Data | |
| Net assets, end of year (000's omitted) | | $ | 3,316 | | | $ | 5,950 | | | $ | 6,577 | | | $ | 6,436 | | | $ | 5,741 | | |
| Ratios (As a percentage of average daily net assets): | |
| Expenses(3)(4) | | | 2.35 | % | | | 2.39 | % | | | 2.45 | % | | | 2.45 | % | | | 2.45 | % | |
| Net investment loss | | | (1.01 | )% | | | (1.08 | )% | | | (1.25 | )% | | | (1.64 | )% | | | (1.67 | )% | |
| Portfolio Turnover of the Portfolio | | | 40 | % | | | 38 | % | | | 55 | % | | | 53 | % | | | 42 | % | |
(1) Computed using average shares outstanding.
(2) Returns are historical and are calculated by determining the percentage change in net asset value with all distributions reinvested.
(3) Includes the Fund's share of the Portfolio's allocated expenses.
(4) The investment adviser of the Portfolio waived a portion of its investment adviser fee and the administrator of the Fund subsidized certain operating expenses (equal to 0.06%, 0.07%, 0.07%, 0.16% and 0.22% of average daily net assets for the years ended October 31, 2008, 2007, 2006, 2005 and 2004, respectively). A portion of the waiver and subsidy was borne by the sub-adviser of the Portfolio. Absent this waiver and subsidy, total return would be lower.
See notes to financial statements
9
Eaton Vance Tax-Managed Mid-Cap Core Fund as of October 31, 2008
FINANCIAL STATEMENTS CONT'D
Financial Highlights
| | | Class C | |
| | | Year Ended October 31, | |
| | | 2008 | | 2007 | | 2006 | | 2005 | | 2004 | |
| Net asset value — Beginning of year | | $ | 14.740 | | | $ | 13.420 | | | $ | 12.030 | | | $ | 11.050 | | | $ | 10.540 | | |
| Income (loss) from operations | |
| Net investment loss(1) | | $ | (0.127 | ) | | $ | (0.151 | ) | | $ | (0.161 | ) | | $ | (0.194 | ) | | $ | (0.182 | ) | |
| Net realized and unrealized gain (loss) | | | (4.218 | ) | | | 2.211 | | | | 1.617 | | | | 1.174 | | | | 0.692 | | |
| Total income (loss) from operations | | $ | (4.345 | ) | | $ | 2.060 | | | $ | 1.456 | | | $ | 0.980 | | | $ | 0.510 | | |
| Less distributions | |
| From net realized gain | | $ | (1.025 | ) | | $ | (0.740 | ) | | $ | (0.066 | ) | | $ | — | | | $ | — | | |
| Total distributions | | $ | (1.025 | ) | | $ | (0.740 | ) | | $ | (0.066 | ) | | $ | — | | | $ | — | | |
| Net asset value — End of year | | $ | 9.370 | | | $ | 14.740 | | | $ | 13.420 | | | $ | 12.030 | | | $ | 11.050 | | |
| Total Return(2) | | | (31.63 | )% | | | 16.07 | % | | | 12.15 | % | | | 8.87 | % | | | 4.84 | % | |
| Ratios/Supplemental Data | |
| Net assets, end of year (000's omitted) | | $ | 5,273 | | | $ | 8,735 | | | $ | 7,051 | | | $ | 6,027 | | | $ | 5,450 | | |
| Ratios (As a percentage of average daily net assets): | |
| Expenses(3)(4) | | | 2.35 | % | | | 2.39 | % | | | 2.45 | % | | | 2.45 | % | | | 2.45 | % | |
| Net investment loss | | | (1.02 | )% | | | (1.08 | )% | | | (1.25 | )% | | | (1.64 | )% | | | (1.68 | )% | |
| Portfolio Turnover of the Portfolio | | | 40 | % | | | 38 | % | | | 55 | % | | | 53 | % | | | 42 | % | |
(1) Computed using average shares outstanding.
(2) Returns are historical and are calculated by determining the percentage change in net asset value with all distributions reinvested.
(3) Includes the Fund's share of the Portfolio's allocated expenses.
(4) The investment adviser of the Portfolio waived a portion of its investment adviser fee and the administrator of the Fund subsidized certain operating expenses (equal to 0.06%, 0.07%, 0.07%, 0.16% and 0.22% of average daily net assets for the years ended October 31, 2008, 2007, 2006, 2005 and 2004, respectively). A portion of the waiver and subsidy was borne by the sub-adviser of the Portfolio. Absent this waiver and subsidy, total return would be lower.
See notes to financial statements
10
Eaton Vance Tax-Managed Mid-Cap Core Fund as of October 31, 2008
NOTES TO FINANCIAL STATEMENTS
1 Significant Accounting Policies
Eaton Vance Tax-Managed Mid-Cap Core Fund (the Fund) is a diversified series of Eaton Vance Mutual Funds Trust (the Trust). The Trust is a Massachusetts business trust registered under the Investment Company Act of 1940, as amended (the 1940 Act), as an open-end management investment company. The Fund offers three classes of shares. Class A shares are generally sold subject to a sales charge imposed at time of purchase. Class B and Class C shares are sold at net asset value and are generally subject to a contingent deferred sales charge (see Note 5). Class B shares automatically convert to Class A shares eight years after their purchase as described in the Fund's prospectus. Each class represents a pro-rata interest in the Fund, but votes separately on class-specific matters and (as noted below) is subject to different expenses. Realized and unrealized gains and losses and net investment income and losses, other than class-speci fic expenses, are allocated daily to each class of shares based on the relative net assets of each class to the total net assets of the Fund. Each class of shares differs in its distribution plan and certain other class-specific expenses. The Fund invests all of its investable assets in interests in Tax-Managed Mid-Cap Core Portfolio (the Portfolio), a New York trust, having the same investment objective and policies as the Fund. The value of the Fund's investment in the Portfolio reflects the Fund's proportionate interest in the net assets of the Portfolio (35.7% at October 31, 2008). The performance of the Fund is directly affected by the performance of the Portfolio. The financial statements of the Portfolio, including the portfolio of investments, are included elsewhere in this report and should be read in conjunction with the Fund's financial statements.
The following is a summary of significant accounting policies of the Fund. The policies are in conformity with accounting principles generally accepted in the United States of America.
A Investment Valuation — Valuation of securities by the Portfolio is discussed in Note 1A of the Portfolio's Notes to Financial Statements, which are included elsewhere in this report.
B Income — The Fund's net investment income or loss consists of the Fund's pro-rata share of the net investment income or loss of the Portfolio, less all actual and accrued expenses of the Fund.
C Federal Taxes — The Fund's policy is to comply with the provisions of the Internal Revenue Code applicable to regulated investment companies and to distribute to shareholders each year substantially all of its net investment income, and all or substantially all of its net realized capital gains. Accordingly, no provision for federal income or excise tax is necessary.
At October 31, 2008, the Fund, for federal income tax purposes, had a capital loss carryforward of $702,607 which will reduce its taxable income arising from future net realized gains on investment transactions, if any, to the extent permitted by the Internal Revenue Code, and thus will reduce the amount of distributions to shareholders, which would otherwise be necessary to relieve the Fund of any liability for federal income or excise tax. Such capital loss carryforward will expire on October 31, 2016.
As of October 31, 2008, the Fund had no uncertain tax positions that would require financial statement recognition, de-recognition, or disclosure. Each of the Fund's federal tax returns filed in the 3-year period ended October 31, 2008 remains subject to examination by the Internal Revenue Service.
D Expenses — The majority of expenses of the Trust are directly identifiable to an individual fund. Expenses which are not readily identifiable to a specific fund are allocated taking into consideration, among other things, the nature and type of expense and the relative size of the funds.
E Expense Reduction — State Street Bank and Trust Company (SSBT) serves as custodian of the Fund. Pursuant to the custodian agreement, SSBT receives a fee reduced by credits, which are determined based on the average daily cash balance the Fund maintains with SSBT. All credit balances, if any, used to reduce the Fund's custodian fees are reported as a reduction of expenses in the Statement of Operations.
F Use of Estimates — The preparation of the financial statements in conformity with accounting principles generally accepted in the United States of America requires management to make estimates and assumptions that affect the reported amounts of assets and liabilities at the date of the financial statements and the reported amounts of income and expense during the reporting period. Actual results could differ from those estimates.
G Indemnifications — Under the Trust's organizational documents, its officers and Trustees may be indemnified against certain liabilities and expenses arising out of the performance of their duties to the Fund, and shareholders are indemnified against personal liability for the obligations of the Trust. Additionally, in the normal course of business, the Fund enters into agreements with service providers that may contain indemnification clauses.
11
Eaton Vance Tax-Managed Mid-Cap Core Fund as of October 31, 2008
NOTES TO FINANCIAL STATEMENTS CONT'D
The Fund's maximum exposure under these arrangements is unknown as this would involve future claims that may be made against the Fund that have not yet occurred.
H Other — Investment transactions are accounted for on a trade date basis. Dividends to shareholders are recorded on the ex-dividend date.
2 Distributions to Shareholders
It is the present policy of the Fund to make at least one distribution annually (normally in December) of all or substantially all of its net investment income and to distribute annually all or substantially all of its net realized capital gains (reduced by available capital loss carryforwards from prior years, if any). Distributions are declared separately for each class of shares. Shareholders may reinvest income and capital gain distributions in additional shares of the same class of the Fund at the net asset value as of the ex-dividend date or, at the election of the shareholder, receive distributions in cash. The Fund distinguishes between distributions on a tax basis and a financial reporting basis. Accounting principles generally accepted in the United States of America require that only distributions in excess of tax basis earnings and profits be reported in the financial statements as a return of capital. Permanent diff erences between book and tax accounting relating to distributions are reclassified to paid-in capital.
The tax character of distributions declared for the years ended October 31, 2008 and October 31, 2007 was as follows:
| | | Year Ended October 31, | |
| | | 2008 | | 2007 | |
| Distributions declared from: | |
| Long-Term Capital Gain | | $ | 2,632,197 | | | $ | 1,696,481 | | |
During the year ended October 31, 2008, accumulated net realized loss was decreased by $6,554, accumulated net investment loss was decreased by $177,469, and paid-in capital was decreased by $184,023 due to differences between book and tax accounting, primarily for net operating losses, distributions from real estate investment trusts and the Fund's use of equalization accounting. These reclassifications had no effect on the net assets or net asset value per share of the Fund.
As of October 31, 2008, the components of distributable earnings (accumulated losses) and unrealized appreciation (depreciation) on a tax basis were as follows:
| Capital loss carryforward | | $ | (702,607 | ) | |
| Net unrealized depreciation | | $ | (913,470 | ) | |
The differences between components of distributable earnings (accumulated losses) on a tax basis and the amounts reflected in the Statement of Assets and Liabilities are primarily due to wash sales and partnership allocations.
3 Transactions with Affiliates
The administration fee is earned by Eaton Vance Management (EVM) as compensation for administrative services rendered to the Fund. The fee is computed at an annual rate of 0.15% of the Fund's average daily net assets. For the year ended October 31, 2008, the administration fee amounted to $51,198. EVM and the sub-adviser of the Portfolio, Atlanta Capital Management Company LLC (Atlanta Capital), have agreed to reimburse the Fund's operating expenses to the extent that they exceed 1.60% annually of the Fund's average daily net assets for Class A shares and 2.35% annually of the Fund's average daily net assets for Class B and Class C. This agreement may be changed or terminated after April 30, 2010. Pursuant to this agreement, EVM and Atlanta Capital were allocated $6,384 and $14,045, respectively, of the Fund's operating expenses for the year ended October 31, 2008. The Portfolio has engaged Boston Management and Research (BMR), a subsidiary of EVM, to render investment advisory services. See Note 2 of the Portfolio's Notes to Financial Statements which are included elsewhere in this report.
EVM serves as the sub-transfer agent of the Fund and receives from the transfer agent an aggregate fee based upon the actual expenses incurred by EVM in the performance of these services. For the year ended October 31, 2008, EVM earned $2,807 in sub-transfer agent fees. The Fund was informed that Eaton Vance Distributors, Inc. (EVD), an affiliate of EVM and the Fund's principal underwriter, received $5,948 as its portion of the sales charge on sales of Class A shares for the year ended October 31, 2008. EVD also received distribution and service fees from Class A, Class B and Class C shares (see Note 4) and contingent deferred sales charges (see Note 5).
Except for Trustees of the Fund and the Portfolio who are not members of EVM's or BMR's organizations, officers and Trustees receive remuneration for their services to the Fund out of the investment adviser fee. Certain officers and Trustees of the Fund and the Portfolio are officers of the above organizations.
4 Distribution Plans
The Fund has in effect a distribution plan for Class A shares (Class A Plan) pursuant to Rule 12b-1 under the 1940 Act. The Class A Plan provides that the Fund will pay EVD a distribution and service fee of 0.25% per annum of its
12
Eaton Vance Tax-Managed Mid-Cap Core Fund as of October 31, 2008
NOTES TO FINANCIAL STATEMENTS CONT'D
average daily net assets attributable to Class A shares for distribution services and facilities provided to the Fund by EVD, as well as for personal services and/or the maintenance of shareholder accounts. Distribution and service fees paid or accrued to EVD for the year ended October 31, 2008 amounted to $54,673 for Class A shares.
The Fund also has in effect distribution plans for Class B shares (Class B Plan) and Class C shares (Class C Plan) pursuant to Rule 12b-1 under the 1940 Act. The Class B and Class C Plans require the Fund to pay EVD amounts equal to 0.75% per annum of its average daily net assets attributable to Class B and Class C shares for providing ongoing distribution services and facilities to the Fund. The Fund will automatically discontinue payments to EVD during any period in which there are no outstanding Uncovered Distribution Charges, which are equivalent to the sum of (i) 6.25% of the aggregate amount received by the Fund for Class B and Class C shares sold, plus (ii) interest calculated by applying the rate of 1% over the prevailing prime rate to the outstanding balance of Uncovered Distribution Charges of EVD of each respective class, reduced by the aggregate amount of contingent deferred sales charges (see Note 5) and amounts the retofore paid or payable to EVD by each respective class. For the year ended October 31, 2008, the Fund paid or accrued to EVD $36,600 and $55,370 for Class B and Class C shares, respectively, representing 0.75% of the average daily net assets of Class B and Class C shares. At October 31, 2008, the amounts of Uncovered Distribution Charges of EVD calculated under the Class B and Class C Plans were approximately $57,600 and $480,400, respectively.
The Class B and Class C Plans also authorize the Fund to make payments of service fees to EVD, investment dealers and other persons in amounts not exceeding 0.25% per annum of its average daily net assets attributable to that class. Service fees paid or accrued are for personal services and/or the maintenance of shareholder accounts. They are separate and distinct from the sales commissions and distribution fees payable to EVD and, as such, are not subject to automatic discontinuance when there are no outstanding Uncovered Distribution Charges of EVD. Service fees paid or accrued for the year ended October 31, 2008 amounted to $12,200 and $18,457 for Class B and Class C shares, respectively.
5 Contingent Deferred Sales Charges
A contingent deferred sales charge (CDSC) generally is imposed on redemptions of Class B shares made within six years of purchase and on redemptions of Class C shares made within one year of purchase. Class A shares may be subject to a CDSC up to 1% if redeemed within two years of purchase (depending on the circumstances of purchase). Generally, the CDSC is based upon the lower of the net asset value at date of redemption or date of purchase. No charge is levied on shares acquired by reinvestment of dividends or capital gain distributions. The CDSC for Class B shares is imposed at declining rates that begin at 5% in the case of redemptions in the first and second year after purchase, declining one percentage point each subsequent year. Class C shares are subject to a 1% CDSC if redeemed within one year of purchase. No CDSC is levied on shares which have been sold to EVM or its affiliates or to their respective employees or clients and may be waived under certain other limited conditions. CDSCs received on Class B and Class C redemptions are paid to EVD to reduce the amount of Uncovered Distribution Charges calculated under the Fund's Class B and Class C Plans. CDSCs received on Class B and Class C redemptions when no Uncovered Distribution Charges exist are credited to the Fund. For the year ended October 31, 2008, the Fund was informed that EVD received approximately $700, $8,000 and $1,000 of CDSCs paid by Class A, Class B and Class C shareholders, respectively.
6 Investment Transactions
For the year ended October 31, 2008, increases and decreases in the Fund's investment in the Portfolio aggregated $5,183,135 and $8,134,730, respectively.
7 Shares of Beneficial Interest
The Fund's Declaration of Trust permits the Trustees to issue an unlimited number of full and fractional shares of beneficial interest (without par value). Such shares may be issued in a number of different series (such as the Fund) and classes. Transactions in Fund shares were as follows:
| | | Year Ended October 31, | |
| Class A | | 2008 | | 2007 | |
| Sales | | | 308,214 | | | | 439,915 | | |
Issued to shareholders electing to
receive payments of distributions
in Fund shares | | | 100,949 | | | | 60,372 | | |
| Redemptions | | | (380,664 | ) | | | (237,133 | ) | |
| Exchange from Class B shares | | | 21,690 | | | | 45,930 | | |
| Net increase | | | 50,189 | | | | 309,084 | | |
13
Eaton Vance Tax-Managed Mid-Cap Core Fund as of October 31, 2008
NOTES TO FINANCIAL STATEMENTS CONT'D
| | | Year Ended October 31, | |
| Class B | | 2008 | | 2007 | |
| Sales | | | 16,348 | | | | 21,797 | | |
Issued to shareholders electing to
receive payments of distributions
in Fund shares | | | 27,233 | | | | 24,865 | | |
| Redemptions | | | (70,899 | ) | | | (85,330 | ) | |
| Exchange to Class A shares | | | (22,824 | ) | | | (47,798 | ) | |
| Net decrease | | | (50,142 | ) | | | (86,466 | ) | |
| | | Year Ended October 31, | |
| Class C | | 2008 | | 2007 | |
| Sales | | | 74,740 | | | | 129,288 | | |
Issued to shareholders electing to
receive payments of distributions
in Fund shares | | | 36,260 | | | | 24,770 | | |
| Redemptions | | | (141,011 | ) | | | (86,912 | ) | |
| Net increase (decrease) | | | (30,011 | ) | | | 67,146 | | |
8 Recently Issued Accounting Pronouncement
In September 2006, the Financial Accounting Standards Board issued Statement of Financial Accounting Standards No. 157 (FAS 157), "Fair Value Measurements". FAS 157 defines fair value, establishes a framework for measuring fair value in accordance with accounting principles generally accepted in the United States of America and expands disclosure about fair value measurements. FAS 157 is effective for fiscal years beginning after November 15, 2007. As of October 31, 2008, management does not believe the adoption of FAS 157 will impact the amounts reported in the financial statements; however, additional disclosures may be required about the inputs used to develop the measurements of fair value and the effect of certain of the measurements on changes in net assets for the period.
14
Eaton Vance Tax-Managed Mid-Cap Core Fund as of October 31, 2008
REPORT OF INDEPENDENT REGISTERED PUBLIC ACCOUNTING FIRM
To the Trustees of Eaton Vance Mutual Funds
Trust and Shareholders of Eaton Vance
Tax-Managed Mid-Cap Core Fund:
We have audited the accompanying statement of assets and liabilities of Eaton Vance Tax-Managed Mid-Cap Core Fund (the "Fund") (one of the series of Eaton Vance Mutual Funds Trust) as of October 31, 2008, and the related statement of operations for the year then ended, the statements of changes in net assets for each of the two years in the period then ended, and the financial highlights for each of the five years in the period then ended. These financial statements and financial highlights are the responsibility of the Fund's management. Our responsibility is to express an opinion on these financial statements and financial highlights based on our audits.
We conducted our audits in accordance with the standards of the Public Company Accounting Oversight Board (United States). Those standards require that we plan and perform the audit to obtain reasonable assurance about whether the financial statements and financial highlights are free of material misstatement. The Fund is not required to have, nor were we engaged to perform, an audit of its internal control over financial reporting. Our audits included consideration of internal control over financial reporting as a basis for designing audit procedures that are appropriate in the circumstances, but not for the purpose of expressing an opinion on the effectiveness of the Fund's internal control over financial reporting. Accordingly, we express no such opinion. An audit also includes examining, on a test basis, evidence supporting the amounts and disclosures in the financial statements, assessing the accounting principles used and significant estimates made by management, as well as evaluating the overall financial statement presentation. We believe that our audits provide a reasonable basis for our opinion.
In our opinion, the financial statements and financial highlights referred to above present fairly, in all material respects, the financial position of Eaton Vance Tax-Managed Mid-Cap Core Fund as of October 31, 2008, the results of its operations for the year then ended, the changes in its net assets for each of the two years in the period then ended, and the financial highlights for each of the five years in the period then ended, in conformity with accounting principles generally accepted in the United States of America.
DELOITTE & TOUCHE LLP
Boston, Massachusetts
December 15, 2008
15
Eaton Vance Tax-Managed Mid-Cap Core Fund as of October 31, 2008
FEDERAL TAX INFORMATION (Unaudited)
The Form 1099-DIV you receive in January 2009 will show the tax status of all distributions paid to your account in calendar year 2008. Shareholders are advised to consult their own tax adviser with respect to the tax consequences of their investment in the Fund. As required by the Internal Revenue Code regulations, shareholders must be notified within 60 days of the Fund's fiscal year end regarding the status of long-term capital gains distributions.
Long-term Capital Gains Distributions — The Fund designates $2,637,895 as a long-term capital gain distribution.
16
Tax-Managed Mid-Cap Core Portfolio as of October 31, 2008
PORTFOLIO OF INVESTMENTS
| Common Stocks — 98.6% | |
| Security | | Shares | | Value | |
| Air Freight & Logistics — 2.0% | |
| CH Robinson Worldwide, Inc. | | | 27,200 | | | $ | 1,408,416 | | |
| | | $ | 1,408,416 | | |
| Auto Components — 0.8% | |
| BorgWarner, Inc. | | | 26,000 | | | $ | 584,220 | | |
| | | $ | 584,220 | | |
| Capital Markets — 4.7% | |
| Affiliated Managers Group, Inc.(1) | | | 21,000 | | | $ | 973,980 | | |
| Raymond James Financial, Inc. | | | 57,000 | | | | 1,327,530 | | |
| SEI Investments Co. | | | 53,000 | | | | 937,040 | | |
| | | $ | 3,238,550 | | |
| Chemicals — 2.4% | |
| Albemarle Corp. | | | 35,200 | | | $ | 857,120 | | |
| RPM International, Inc. | | | 56,000 | | | | 795,200 | | |
| | | $ | 1,652,320 | | |
| Commercial Banks — 5.5% | |
| City National Corp. | | | 19,500 | | | $ | 1,043,835 | | |
| Cullen/Frost Bankers, Inc. | | | 30,700 | | | | 1,718,279 | | |
| Westamerica Bancorporation | | | 18,000 | | | | 1,030,500 | | |
| | | $ | 3,792,614 | | |
| Commercial Services & Supplies — 1.7% | |
| Mine Safety Appliances Co. | | | 43,000 | | | $ | 1,161,000 | | |
| | | $ | 1,161,000 | | |
| Construction & Engineering — 1.0% | |
| Jacobs Engineering Group, Inc.(1) | | | 20,000 | | | $ | 728,600 | | |
| | | $ | 728,600 | | |
| Construction Materials — 0.8% | |
| Vulcan Materials Co. | | | 10,000 | | | $ | 542,800 | | |
| | | $ | 542,800 | | |
| Containers & Packaging — 2.0% | |
| Sonoco Products Co. | | | 54,000 | | | $ | 1,359,720 | | |
| | | $ | 1,359,720 | | |
| Security | | Shares | | Value | |
| Diversified Consumer Services — 2.8% | |
| H&R Block, Inc. | | | 40,000 | | | $ | 788,800 | | |
| Matthews International Corp., Class A | | | 26,500 | | | | 1,182,695 | | |
| | | $ | 1,971,495 | | |
| Electric Utilities — 1.8% | |
| DPL, Inc. | | | 53,600 | | | $ | 1,222,616 | | |
| | | $ | 1,222,616 | | |
| Electrical Equipment — 2.0% | |
| AMETEK, Inc. | | | 42,000 | | | $ | 1,396,500 | | |
| | | $ | 1,396,500 | | |
| Electronic Equipment, Instruments & Components — 5.6% | |
| Amphenol Corp., Class A | | | 40,500 | | | $ | 1,160,325 | | |
| Mettler Toledo International, Inc.(1) | | | 17,000 | | | | 1,301,180 | | |
| National Instruments Corp. | | | 55,000 | | | | 1,397,000 | | |
| | | $ | 3,858,505 | | |
| Energy Equipment & Services — 4.3% | |
| FMC Technologies, Inc.(1) | | | 30,000 | | | $ | 1,049,700 | | |
| Helmerich & Payne, Inc. | | | 28,000 | | | | 960,680 | | |
| Oceaneering International, Inc.(1) | | | 35,000 | | | | 985,950 | | |
| | | $ | 2,996,330 | | |
| Food & Staples Retailing — 1.3% | |
| Ruddick Corp. | | | 32,000 | | | $ | 916,480 | | |
| | | $ | 916,480 | | |
| Food Products — 2.3% | |
| Hormel Foods Corp. | | | 26,000 | | | $ | 734,760 | | |
| McCormick & Co., Inc. | | | 26,500 | | | | 891,990 | | |
| | | $ | 1,626,750 | | |
| Gas Utilities — 3.9% | |
| AGL Resources, Inc. | | | 36,100 | | | $ | 1,097,440 | | |
| National Fuel Gas Co. | | | 22,000 | | | | 796,180 | | |
| Questar Corp. | | | 23,400 | | | | 806,364 | | |
| | | $ | 2,699,984 | | |
See notes to financial statements
17
Tax-Managed Mid-Cap Core Portfolio as of October 31, 2008
PORTFOLIO OF INVESTMENTS CONT'D
| Security | | Shares | | Value | |
| Health Care Equipment & Supplies — 7.0% | |
| Bard (C.R.), Inc. | | | 15,800 | | | $ | 1,394,350 | | |
| Beckman Coulter, Inc. | | | 18,400 | | | | 918,528 | | |
| DENTSPLY International, Inc. | | | 44,800 | | | | 1,361,024 | | |
| Mentor Corp. | | | 31,000 | | | | 523,900 | | |
| Varian Medical Systems, Inc.(1) | | | 14,000 | | | | 637,140 | | |
| | | $ | 4,834,942 | | |
| Health Care Providers & Services — 3.0% | |
| Henry Schein, Inc.(1) | | | 25,000 | | | $ | 1,170,250 | | |
| Patterson Cos., Inc.(1) | | | 35,000 | | | | 886,550 | | |
| | | $ | 2,056,800 | | |
| Hotels, Restaurants & Leisure — 1.2% | |
| Sonic Corp.(1) | | | 79,850 | | | $ | 854,395 | | |
| | | $ | 854,395 | | |
| Household Durables — 1.6% | |
| Mohawk Industries, Inc.(1) | | | 12,800 | | | $ | 619,264 | | |
| Snap-On, Inc. | | | 13,500 | | | | 498,825 | | |
| | | $ | 1,118,089 | | |
| Insurance — 3.9% | |
| Brown and Brown, Inc. | | | 55,000 | | | $ | 1,128,600 | | |
| HCC Insurance Holdings, Inc. | | | 34,000 | | | | 750,040 | | |
| Markel Corp.(1) | | | 2,300 | | | | 806,932 | | |
| | | $ | 2,685,572 | | |
| IT Services — 1.0% | |
| Fiserv, Inc.(1) | | | 20,200 | | | $ | 673,872 | | |
| | | $ | 673,872 | | |
| Life Sciences Tools & Services — 1.3% | |
| Pharmaceutical Product Development, Inc. | | | 30,000 | | | $ | 929,400 | | |
| | | $ | 929,400 | | |
| Machinery — 4.8% | |
| Donaldson Co., Inc. | | | 40,000 | | | $ | 1,406,000 | | |
| Graco, Inc. | | | 29,200 | | | | 722,116 | | |
| IDEX Corp. | | | 50,000 | | | | 1,159,000 | | |
| John Bean Technologies Corp. | | | 6,480 | | | | 54,302 | | |
| | | $ | 3,341,418 | | |
| Security | | Shares | | Value | |
| Media — 1.0% | |
| John Wiley & Sons, Inc., Class A | | | 21,000 | | | $ | 730,380 | | |
| | | $ | 730,380 | | |
| Metals & Mining — 1.0% | |
| Commercial Metals Co. | | | 66,000 | | | $ | 732,600 | | |
| | | $ | 732,600 | | |
| Multiline Retail — 2.7% | |
| Dollar Tree, Inc.(1) | | | 50,000 | | | $ | 1,901,000 | | |
| | | $ | 1,901,000 | | |
| Multi-Utilities — 3.6% | |
| NSTAR | | | 40,000 | | | $ | 1,322,000 | | |
| OGE Energy Corp. | | | 42,300 | | | | 1,154,790 | | |
| | | $ | 2,476,790 | | |
| Oil, Gas & Consumable Fuels — 0.9% | |
| Holly Corp. | | | 32,000 | | | $ | 628,160 | | |
| | | $ | 628,160 | | |
| Personal Products — 2.7% | |
| Alberto-Culver Co. | | | 72,000 | | | $ | 1,852,560 | | |
| | | $ | 1,852,560 | | |
| Professional Services — 1.3% | |
| FTI Consulting, Inc.(1) | | | 15,000 | | | $ | 873,750 | | |
| | | $ | 873,750 | | |
| Real Estate Investment Trusts (REITs) — 3.3% | |
| Health Care REIT, Inc. | | | 30,000 | | | $ | 1,335,300 | | |
| Rayonier, Inc. | | | 30,000 | | | | 992,400 | | |
| | | $ | 2,327,700 | | |
| Semiconductors & Semiconductor Equipment — 2.0% | |
| Microchip Technology, Inc. | | | 57,050 | | | $ | 1,405,142 | | |
| | | $ | 1,405,142 | | |
| Software — 5.5% | |
| ANSYS, Inc.(1) | | | 41,200 | | | $ | 1,179,556 | | |
| Citrix Systems, Inc.(1) | | | 27,500 | | | | 708,675 | | |
See notes to financial statements
18
Tax-Managed Mid-Cap Core Portfolio as of October 31, 2008
PORTFOLIO OF INVESTMENTS CONT'D
| Security | | Shares | | Value | |
| Software (continued) | |
| Fair Isaac Corp. | | | 30,000 | | | $ | 467,700 | | |
| Jack Henry & Associates, Inc. | | | 78,500 | | | | 1,492,285 | | |
| | | $ | 3,848,216 | | |
| Specialty Retail — 3.7% | |
| O'Reilly Automotive, Inc.(1) | | | 48,000 | | | $ | 1,301,280 | | |
| Ross Stores, Inc. | | | 38,500 | | | | 1,258,565 | | |
| | | $ | 2,559,845 | | |
| Tobacco — 1.0% | |
| Universal Corp., VA | | | 17,000 | | | $ | 673,030 | | |
| | | $ | 673,030 | | |
| Trading Companies & Distributors — 1.2% | |
| Fastenal Co. | | | 20,000 | | | $ | 805,200 | | |
| | | $ | 805,200 | | |
Total Common Stocks
(identified cost $69,160,617) | | $ | 68,465,761 | | |
Total Investments — 98.6%
(identified cost $69,160,617) | | $ | 68,465,761 | | |
| Other Assets, Less Liabilities — 1.4% | | $ | 949,175 | | |
| Net Assets — 100.0% | | $ | 69,414,936 | | |
(1) Non-income producing security.
See notes to financial statements
19
Tax-Managed Mid-Cap Core Portfolio as of October 31, 2008
FINANCIAL STATEMENTS
Statement of Assets and Liabilities
As of October 31, 2008
| Assets | |
| Investments, at value (identified cost, $69,160,617) | | $ | 68,465,761 | | |
| Cash | | | 976,153 | | |
| Dividends and interest receivable | | | 68,063 | | |
| Total assets | | $ | 69,509,977 | | |
| Liabilities | |
| Payable to affiliate for investment adviser fee | | $ | 44,109 | | |
| Payable to affiliate for Trustees' fees | | | 264 | | |
| Accrued expenses | | | 50,668 | | |
| Total liabilities | | $ | 95,041 | | |
| Net Assets applicable to investors' interest in Portfolio | | $ | 69,414,936 | | |
| Sources of Net Assets | |
| Net proceeds from capital contributions and withdrawals | | $ | 70,109,792 | | |
| Net unrealized depreciation (computed on the basis of identified cost) | | | (694,856 | ) | |
| Total | | $ | 69,414,936 | | |
Statement of Operations
For the Year Ended
October 31, 2008
| Investment Income | |
| Dividends | | $ | 1,249,040 | | |
| Interest | | | 11,760 | | |
| Total investment income | | $ | 1,260,800 | | |
| Expenses | |
| Investment adviser fee | | $ | 756,324 | | |
| Trustees' fees and expenses | | | 5,513 | | |
| Custodian fee | | | 68,888 | | |
| Legal and accounting services | | | 24,085 | | |
| Miscellaneous | | | 3,295 | | |
| Total expenses | | $ | 858,105 | | |
Deduct —
Reduction of investment adviser fee | | $ | 11,693 | | |
| Total expense reductions | | $ | 11,693 | | |
| Net expenses | | $ | 846,412 | | |
| Net investment income | | $ | 414,388 | | |
| Realized and Unrealized Gain (Loss) | |
Net realized gain (loss) —
Investment transactions (identified cost basis) | | $ | (1,072,222 | ) | |
| Net realized loss | | $ | (1,072,222 | ) | |
Change in unrealized appreciation (depreciation) —
Investments (identified cost basis) | | $ | (30,626,771 | ) | |
| Net change in unrealized appreciation (depreciation) | | $ | (30,626,771 | ) | |
| Net realized and unrealized loss | | $ | (31,698,993 | ) | |
| Net decrease in net assets from operations | | $ | (31,284,605 | ) | |
See notes to financial statements
20
Tax-Managed Mid-Cap Core Portfolio as of October 31, 2008
FINANCIAL STATEMENTS CONT'D
Statements of Changes in Net Assets
Increase (Decrease)
in Net Assets | | Year Ended
October 31, 2008 | | Year Ended
October 31, 2007 | |
From operations —
Net investment income | | $ | 414,388 | | | $ | 431,454 | | |
Net realized gain (loss) from
investment transactions | | | (1,072,222 | ) | | | 8,082,328 | | |
Net change in unrealized
appreciation (depreciation)
of investments | | | (30,626,771 | ) | | | 8,326,667 | | |
Net increase (decrease) in net assets
from operations | | $ | (31,284,605 | ) | | $ | 16,840,449 | | |
Capital transactions —
Contributions | | $ | 5,183,135 | | | $ | 8,454,067 | | |
| Withdrawals | | | (14,648,201 | ) | | | (13,006,661 | ) | |
Net decrease in net assets from
capital transactions | | $ | (9,465,066 | ) | | $ | (4,552,594 | ) | |
| Net increase (decrease) in net assets | | $ | (40,749,671 | ) | | $ | 12,287,855 | | |
| Net Assets | |
| At beginning of year | | $ | 110,164,607 | | | $ | 97,876,752 | | |
| At end of year | | $ | 69,414,936 | | | $ | 110,164,607 | | |
See notes to financial statements
21
Tax-Managed Mid-Cap Core Portfolio as of October 31, 2008
FINANCIAL STATEMENTS CONT'D
Supplementary Data
| | | Year Ended October 31, | |
| | | 2008 | | 2007 | | 2006 | | 2005 | | 2004 | |
| Ratios/Supplemental Data | |
| Ratios (As a percentage of average daily net assets): | | | | | | | | | | | | | | | | | | | | | |
| Expenses(1) | | | 0.90 | % | | | 0.90 | % | | | 0.91 | % | | | 0.91 | % | | | 0.93 | % | |
| Net investment income (loss) | | | 0.44 | % | | | 0.41 | % | | | 0.29 | % | | | (0.11 | )% | | | (0.15 | )% | |
| Portfolio Turnover | | | 40 | % | | | 38 | % | | | 55 | % | | | 53 | % | | | 42 | % | |
| Total Return | | | (30.51 | )% | | | 17.79 | % | | | 13.85 | % | | | 10.54 | % | | | 6.43 | % | |
| Net assets, end of year (000's omitted) | | $ | 69,415 | | | $ | 110,165 | | | $ | 97,877 | | | $ | 76,091 | | | $ | 67,130 | | |
(1) The investment adviser waived a portion of its investment adviser fee (equal to 0.01% for the year ended October 31, 2008 and less than 0.01% of average daily net assets for each of the years ended October 31, 2007, 2006, 2005 and 2004). A portion of the waiver was borne by the sub-adviser.
See notes to financial statements
22
Tax-Managed Mid-Cap Core Portfolio as of October 31, 2008
NOTES TO FINANCIAL STATEMENTS
1 Significant Accounting Policies
Tax-Managed Mid-Cap Core Portfolio (the Portfolio) is a New York trust registered under the Investment Company Act of 1940, as amended (the 1940 Act), as a diversified, open-end management investment company. The Portfolio's investment objective is to achieve long-term, after-tax returns by investing in a diversified portfolio of common stocks of mid-cap companies. The Declaration of Trust permits the Trustees to issue interests in the Portfolio. At October 31, 2008, Eaton Vance Tax-Managed Mid-Cap Core Fund and Eaton Vance Tax-Managed Equity Asset Allocation Fund held an interest of 35.7% and 64.3%, respectively, in the Portfolio.
The following is a summary of significant accounting policies of the Portfolio. The policies are in conformity with accounting principles generally accepted in the United States of America.
A Investment Valuation — Equity securities listed on a U.S. securities exchange generally are valued at the last sale price on the day of valuation or, if no sales took place on such date, at the mean between the closing bid and asked prices therefore on the exchange where such securities are principally traded. Equity securities listed on the NASDAQ Global or Global Select Market generally are valued at the NASDAQ official closing price. Unlisted or listed securities for which closing sales prices or closing quotations are not available are valued at the mean between the latest available bid and asked prices or, in the case of preferred equity securities that are not listed or traded in the over-the-counter market, by an independent pricing service. Short-term debt secur ities with a remaining maturity of sixty days or less are valued at amortized cost, which approximates market value. If short-term debt securities are acquired with a remaining maturity of more than sixty days, they will be valued by a pricing service. Investments for which valuations or market quotations are not readily available are valued at fair value using methods determined in good faith by or at the direction of the Trustees of the Portfolio considering relevant factors, data and information including the market value of freely tradable securities of the same class in the principal market on which such securities are normally traded.
B Investment Transactions — Investment transactions for financial statement purposes are accounted for on a trade date basis. Realized gains and losses on investments sold are determined on the basis of identified cost.
C Income — Dividend income is recorded on the ex-dividend date for dividends received in cash and/or securities.
D Federal Taxes — The Portfolio has elected to be treated as a partnership for federal tax purposes. No provision is made by the Portfolio for federal or state taxes on any taxable income of the Portfolio because each investor in the Portfolio is ultimately responsible for the payment of any taxes on its share of taxable income. Since at least one of the Portfolio's investors is a regulated investment company that invests all or substantially all of its assets in the Portfolio, the Portfolio normally must satisfy the applicable source of income and diversification requirements (under the Internal Revenue Code) in order for its investors to satisfy them. The Portfolio will allocate, at least annually among its investors, each investor's distributive share of the Portfolio' s net investment income, net realized capital gains and any other items of income, gain, loss, deduction or credit.
As of October 31, 2008, the Portfolio had no uncertain tax positions that would require financial statement recognition, de-recognition, or disclosure. Each of the Portfolio's federal tax returns filed in the 3-year period ended October 31, 2008 remains subject to examination by the Internal Revenue Service.
E Expense Reduction — State Street Bank and Trust Company (SSBT) serves as custodian of the Portfolio. Pursuant to the custodian agreement, SSBT receives a fee reduced by credits, which are determined based on the average daily cash balance the Portfolio maintains with SSBT. All credit balances, if any, used to reduce the Portfolio's custodian fees are reported as a reduction of expenses in the Statement of Operations.
F Use of Estimates — The preparation of the financial statements in conformity with accounting principles generally accepted in the United States of America requires management to make estimates and assumptions that affect the reported amounts of assets and liabilities at the date of the financial statements and the reported amounts of income and expense during the reporting period. Actual results could differ from those estimates.
G Indemnifications — Under the Portfolio's organizational documents, its officers and Trustees may be indemnified against certain liabilities and expenses arising out of the performance of their duties to the Portfolio. Interestholders in the Portfolio are jointly and severally liable for the liabilities and obligations of the Portfolio in the event that the Portfolio fails to satisfy such liabilities and obligations; provided, however, that, to the extent assets are available in the Portfolio, the Portfolio may, under certain circumstances, indemnify interestholders from and against any claim or liability to which such holder may become
23
Tax-Managed Mid-Cap Core Portfolio as of October 31, 2008
NOTES TO FINANCIAL STATEMENTS CONT'D
subject by reason of being or having been an interestholder in the Portfolio. Additionally, in the normal course of business, the Portfolio enters into agreements with service providers that may contain indemnification clauses. The Portfolio's maximum exposure under these arrangements is unknown as this would involve future claims that may be made against the Portfolio that have not yet occurred.
2 Investment Adviser Fee and Other Transactions with Affiliates
The investment adviser fee is earned by Boston Management and Research (BMR), a subsidiary of Eaton Vance Management (EVM), as compensation for management and investment advisory services rendered to the Portfolio. The fee is computed at an annual rate of 0.80% of the Portfolio's average daily net assets up to $500 million and at reduced rates as daily net assets exceed that level, and is payable monthly. Pursuant to a sub-advisory agreement, BMR pays Atlanta Capital Management Company LLC (Atlanta Capital), an affiliate of EVM, a portion of its advisory fee for sub-advisory services provided to the Portfolio. For the year ended October 31, 2008, the adviser fee was 0.80% of the Portfolio's average daily net assets and amounted to $756,324. BMR has also agreed to reduce the investment adviser fee by an amount equal to that portion of commissions paid to broker dealers in execution of security transactions attributed to the Portf olio that is consideration for third-party research services. For the year ended October 31, 2008, BMR waived $11,693 of its adviser fee. Atlanta Capital, in turn, waived $11,693 of its sub-adviser fee.
Except for Trustees of the Portfolio who are not members of EVM's or BMR's organizations, officers and Trustees receive remuneration for their services to the Portfolio out of the investment adviser fee. Trustees of the Portfolio who are not affiliated with the investment adviser may elect to defer receipt of all or a percentage of their annual fees in accordance with the terms of the Trustees Deferred Compensation Plan. For the year ended October 31, 2008, no significant amounts have been deferred. Certain officers and Trustees of the Portfolio are officers of the above organizations.
3 Purchases and Sales of Investments
Purchases and sales of investments, other than short-term obligations, aggregated $37,555,699 and $47,870,507, respectively, for the year ended October 31, 2008.
4 Federal Income Tax Basis of Investments
The cost and unrealized appreciation (depreciation) of investments of the Portfolio at October 31, 2008, as determined on a federal income tax basis, were as follows:
| Aggregate cost | | $ | 69,224,044 | | |
| Gross unrealized appreciation | | $ | 7,502,482 | | |
| Gross unrealized depreciation | | | (8,260,765 | ) | |
| Net unrealized depreciation | | $ | (758,283 | ) | |
5 Line of Credit
The Portfolio participates with other portfolios and funds managed by EVM and its affiliates in a $450 million unsecured line of credit agreement with a group of banks. Borrowings are made by the Portfolio solely to facilitate the handling of unusual and/or unanticipated short-term cash requirements. Interest is charged to the Portfolio based on its borrowings at an amount above either the Eurodollar rate or Federal Funds rate. In addition, a fee computed at an annual rate of 0.10% on the daily unused portion of the line of credit is allocated among the participating portfolios and funds at the end of each quarter. The Portfolio did not have any significant borrowings or allocated fees during the year ended October 31, 2008.
6 Recently Issued Accounting Pronouncement
In September 2006, the Financial Accounting Standards Board issued Statement of Financial Accounting Standards No. 157 (FAS 157), "Fair Value Measurements". FAS 157 defines fair value, establishes a framework for measuring fair value in accordance with accounting principles generally accepted in the United States of America and expands disclosure about fair value measurements. FAS 157 is effective for fiscal years beginning after November 15, 2007. As of October 31, 2008, management does not believe the adoption of FAS 157 will impact the amounts reported in the financial statements; however, additional disclosures may be required about the inputs used to develop the measurements of fair value and the effect of certain of the measurements on changes in net assets for the period.
24
Tax-Managed Mid-Cap Core Portfolio as of October 31, 2008
REPORT OF INDEPENDENT REGISTERED PUBLIC ACCOUNTING FIRM
To the Trustees and Investors of
Tax-Managed Mid-Cap Core Portfolio:
We have audited the accompanying statement of assets and liabilities including the portfolio of investments, of Tax-Managed Mid-Cap Core Portfolio (the "Portfolio"), as of October 31, 2008, and the related statement of operations for the year then ended, the statements of changes in net assets for each of the two years in the period then ended, and the supplementary data for each of the five years in the period then ended. These financial statements and supplementary data are the responsibility of the Portfolio's management. Our responsibility is to express an opinion on these financial statements and supplementary data based on our audits.
We conducted our audits in accordance with standards of the Public Company Accounting Oversight Board (United States). Those standards require that we plan and perform the audit to obtain reasonable assurance about whether the financial statements and supplementary data are free of material misstatement. The Portfolio is not required to have, nor were we engaged to perform, an audit of its internal control over financial reporting. Our audits included consideration of internal control over financial reporting as a basis for designing audit procedures that are appropriate in the circumstances, but not for the purpose of expressing an opinion on the effectiveness of the Portfolio's internal control over financial reporting. Accordingly, we express no such opinion. An audit also includes examining, on a test basis, evidence supporting the amounts and disclosures in the financial statements, assessing the accounting principles used and significant estimates made by management, as well as evaluating the overall financial statement presentation. Our procedures included confirmation of securities owned as of October 31, 2008, by correspondence with the custodian. We believe that our audits provide a reasonable basis for our opinion.
In our opinion, the financial statements and supplementary data referred to above present fairly, in all material respects, the financial position of Tax-Managed Mid-Cap Core Portfolio as of October 31, 2008, the results of its operations for the year then ended, the changes in its net assets for each of the two years in the period then ended, and the supplementary data for each of the five years in the period then ended, in conformity with accounting principles generally accepted in the United States of America.
DELOITTE & TOUCHE LLP
Boston, Massachusetts
December 15, 2008
25
Eaton Vance Tax-Managed Mid-Cap Core Fund
Tax-Managed Mid-Cap Core Portfolio
SPECIAL MEETING OF SHAREHOLDERS (Unaudited)
Eaton Vance Tax-Managed Mid-Cap Core Fund
The Fund held a Special Meeting of Shareholders on November 14, 2008 to elect Trustees. The results of the vote were as follows:
| | | Number of Shares | |
| Nominee for Trustee | | For | | Withheld | |
| Benjamin C. Esty | | | 2,040,828 | | | | 1,428 | | |
| Thomas E. Faust Jr. | | | 2,040,828 | | | | 1,428 | | |
| Allen R. Freedman | | | 2,040,828 | | | | 1,428 | | |
| William H. Park | | | 2,039,499 | | | | 2,757 | | |
| Ronald A. Pearlman | | | 2,040,828 | | | | 1,428 | | |
| Helen Frame Peters | | | 2,040,828 | | | | 1,428 | | |
| Heidi L. Steiger | | | 2,040,828 | | | | 1,428 | | |
| Lynn A. Stout | | | 2,039,499 | | | | 2,757 | | |
| Ralph F. Verni | | | 2,039,728 | | | | 2,527 | | |
Each nominee was also elected a Trustee of the Portfolio.
Tax-Managed Mid-Cap Core Portfolio
The Portfolio held a Special Meeting of Interestholders on November 14, 2008 to elect Trustees. The results of the vote were as follows:
| | | Interest in the Portfolio | |
| Nominee for Trustee | | For | | Withheld | |
| Benjamin C. Esty | | | 99 | % | | | 1 | % | |
| Thomas E. Faust Jr. | | | 99 | % | | | 1 | % | |
| Allen R. Freedman | | | 99 | % | | | 1 | % | |
| William H. Park | | | 99 | % | | | 1 | % | |
| Ronald A. Pearlman | | | 99 | % | | | 1 | % | |
| Helen Frame Peters | | | 99 | % | | | 1 | % | |
| Heidi L. Steiger | | | 99 | % | | | 1 | % | |
| Lynn A. Stout | | | 99 | % | | | 1 | % | |
| Ralph F. Verni | | | 99 | % | | | 1 | % | |
Results are rounded to the nearest whole number.
26
Eaton Vance Tax-Managed Mid-Cap Core Fund
BOARD OF TRUSTEES' ANNUAL APPROVAL OF THE INVESTMENT ADVISORY AGREEMENT
Overview of the Contract Review Process
The Investment Company Act of 1940, as amended (the "1940 Act"), provides, in substance, that each investment advisory agreement between a fund and its investment adviser will continue in effect from year to year only if its continuance is approved at least annually by the fund's board of trustees, including by a vote of a majority of the trustees who are not "interested persons" of the fund ("Independent Trustees"), cast in person at a meeting called for the purpose of considering such approval.
At a meeting of the Boards of Trustees (each a "Board") of the Eaton Vance group of mutual funds (the "Eaton Vance Funds") held on April 21, 2008, the Board, including a majority of the Independent Trustees, voted to approve continuation of existing advisory and sub-advisory agreements for the Eaton Vance Funds for an additional one-year period. In voting its approval, the Board relied upon the affirmative recommendation of the Contract Review Committee of the Board (formerly the Special Committee), which is a committee comprised exclusively of Independent Trustees. Prior to making its recommendation, the Contract Review Committee reviewed information furnished for a series of meetings of the Contract Review Committee held in February, March and April 2008. Such information included, among other things, the following:
Information about Fees, Performance and Expenses
• An independent report comparing the advisory and related fees paid by each fund with fees paid by comparable funds;
• An independent report comparing each fund's total expense ratio and its components to comparable funds;
• An independent report comparing the investment performance of each fund to the investment performance of comparable funds over various time periods;
• Data regarding investment performance in comparison to relevant peer groups of funds and appropriate indices;
• Comparative information concerning fees charged by each adviser for managing other mutual funds and institutional accounts using investment strategies and techniques similar to those used in managing the fund;
• Profitability analyses for each adviser with respect to each fund;
Information about Portfolio Management
• Descriptions of the investment management services provided to each fund, including the investment strategies and processes employed, and any changes in portfolio management processes and personnel;
• Information concerning the allocation of brokerage and the benefits received by each adviser as a result of brokerage allocation, including information concerning the acquisition of research through "soft dollar" benefits received in connection with the funds' brokerage, and the implementation of a soft dollar reimbursement program established with respect to the funds;
• Data relating to portfolio turnover rates of each fund;
• The procedures and processes used to determine the fair value of fund assets and actions taken to monitor and test the effectiveness of such procedures and processes;
Information about each Adviser
• Reports detailing the financial results and condition of each adviser;
• Descriptions of the qualifications, education and experience of the individual investment professionals whose responsibilities include portfolio management and investment research for the funds, and information relating to their compensation and responsibilities with respect to managing other mutual funds and investment accounts;
• Copies of the Codes of Ethics of each adviser and its affiliates, together with information relating to compliance with and the administration of such codes;
• Copies of or descriptions of each adviser's proxy voting policies and procedures;
• Information concerning the resources devoted to compliance efforts undertaken by each adviser and its affiliates on behalf of the funds (including descriptions of various compliance programs) and their record of compliance with investment policies and restrictions, including policies with respect to market-timing, late trading and selective portfolio disclosure, and with policies on personal securities transactions;
• Descriptions of the business continuity and disaster recovery plans of each adviser and its affiliates;
27
Eaton Vance Tax-Managed Mid-Cap Core Fund
BOARD OF TRUSTEES' ANNUAL APPROVAL OF THE INVESTMENT ADVISORY AGREEMENT CONT'D
Other Relevant Information
• Information concerning the nature, cost and character of the administrative and other non-investment management services provided by Eaton Vance Management and its affiliates;
• Information concerning management of the relationship with the custodian, subcustodians and fund accountants by each adviser or the funds' administrator; and
• The terms of each advisory agreement.
In addition to the information identified above, the Contract Review Committee considered information provided from time to time by each adviser throughout the year at meetings of the Board and its committees. Over the course of the twelve-month period ended April 30, 2008, the Board met eleven times and the Contract Review Committee, the Audit Committee and the Governance Committee, each of which is a Committee comprised solely of Independent Trustees, met twelve, seven and five times, respectively. At such meetings, the Trustees received, among other things, presentations by the portfolio managers and other investment professionals of each adviser relating to the investment performance of each fund and the investment strategies used in pursuing the fund's investment objective. The Portfolio Management Committee and the Compliance Reports and Regulatory Matters Committee are newly established and did not meet during the twelve- month period ended April 30, 2008.
For funds that invest through one or more underlying portfolios, the Board considered similar information about the portfolio(s) when considering the approval of advisory agreements. In addition, in cases where the fund's investment adviser has engaged a sub-adviser, the Board considered similar information about the sub-adviser when considering the approval of any sub-advisory agreement.
The Contract Review Committee was assisted throughout the contract review process by Goodwin Procter LLP, legal counsel for the Independent Trustees. The members of the Contract Review Committee relied upon the advice of such counsel and their own business judgment in determining the material factors to be considered in evaluating each advisory and sub-advisory agreement and the weight to be given to each such factor. The conclusions reached with respect to each advisory and sub-advisory agreement were based on a comprehensive evaluation of all the information provided and not any single factor. Moreover, each member of the Contract Review Committee may have placed varying emphasis on particular factors in reaching conclusions with respect to each advisory and sub-advisory agreement.
Results of the Process
Based on its consideration of the foregoing, and such other information as it deemed relevant, including the factors and conclusions described below, the Contract Review Committee concluded that the continuance of the investment advisory agreement of the Tax-Managed Mid-Cap Core Portfolio (the "Portfolio"), the portfolio in which the Eaton Vance Tax-Managed Mid-Cap Core Fund (the "Fund") invests, with Boston Management and Research (the "Adviser"), and the sub-advisory agreement with Atlanta Capital Management Company, LLC (the "Sub-adviser"), including their fee structures, is in the interests of shareholders and, therefore, the Contract Review Committee recommended to the Board approval of the respective agreements. The Board accepted the recommendation of the Contract Review Committee as well as the factors considered and conclusions reached by the Contract Review Committee with respect to the agreements. Accordingly, the Boa rd, including a majority of the Independent Trustees, voted to approve continuation of the investment advisory agreement and sub-advisory agreement for the Portfolio.
Nature, Extent and Quality of Services
In considering whether to approve the investment advisory agreement and sub-advisory agreements of the Portfolio, the Board evaluated the nature, extent and quality of services provided to the Portfolio by the Adviser and the Sub-adviser.
The Board considered the Adviser's and the Sub-adviser's management capabilities and investment process with respect to the types of investments held by the Portfolio, including the education, experience and number of its investment professionals and other personnel who provide portfolio management, investment research, and similar services to the Portfolio and whose responsibilities include supervising the Sub-adviser. The Board specifically noted the Adviser's in-house equity research capabilities. The Board also took into account the resources dedicated to portfolio management and other services, including the compensation paid to recruit and retain investment personnel, and the time and attention devoted to the Portfolio by senior management. With respect to the Sub-adviser, the Board took into account the resources available to the Sub-adviser in fulfilling its duties under the sub-advisory agreement and the Sub-adviser's e xperience in managing equity portfolios.
The Board also reviewed the compliance programs of the Adviser and relevant affiliates thereof, including the Sub-adviser. Among other matters, the Board considered compliance and reporting matters relating to personal trading by investment personnel, selective disclosure of portfolio holdings, late trading, frequent trading, portfolio valuation, business continuity and the allocation of investment
28
Eaton Vance Tax-Managed Mid-Cap Core Fund
BOARD OF TRUSTEES' ANNUAL APPROVAL OF THE INVESTMENT ADVISORY AGREEMENT CONT'D
opportunities. The Board also evaluated the responses of the Adviser and its affiliates to requests from regulatory authorities such as the Securities and Exchange Commission.
The Board also considered shareholder and other administrative services provided or managed by Eaton Vance Management and its affiliates, including transfer agency and accounting services. The Board evaluated the benefits to shareholders of investing in a fund that is a part of a large family of funds, including the ability, in many cases, to exchange an investment among different funds without incurring additional sales charges.
After consideration of the foregoing factors, among others, the Board concluded that the nature, extent and quality of services provided by the Adviser and Sub-adviser, taken as a whole, are appropriate and consistent with the terms of the investment advisory agreement and sub-advisory agreement, respectively.
Fund Performance
The Board compared the Fund's investment performance to a relevant universe of similarly managed funds identified by an independent data provider and appropriate benchmark indices. The Board reviewed comparative performance data for the one-, three- and five-year periods ended September 30, 2007 for the Fund. The Board noted that action was taken during 2006 and 2007 to improve the performance of the Fund and concluded that such actions were effective in improving the Fund's performance since that time.
Management Fees and Expenses
The Board reviewed contractual investment advisory fee rates, including any administrative fee rates, payable by the Portfolio and the Fund (referred to collectively as "management fees"). As part of its review, the Board considered the management fees (including administrative fees) and the Fund's total expense ratio for the year ended September 30, 2007, as compared to a group of similarly managed funds selected by an independent data provider. The Board considered the fact that the Administrator waived fees and/or paid expenses for the Fund and had agreed to waive fees and/or pay expenses in an additional amount for the next two years.
After reviewing the foregoing information, and in light of the nature, extent and quality of the services provided by the Adviser, the Board concluded that the management fees charged for advisory and related services and the Fund's total expense ratio are reasonable.
Profitability
The Board reviewed the level of profits realized by the Adviser and relevant affiliates thereof, including the Sub-adviser, in providing investment advisory and administrative services to the Portfolio, the Fund and to all Eaton Vance Funds as a group. The Board considered the level of profits realized without regard to revenue sharing or other payments by the Adviser and its affiliates to third parties in respect of distribution services. The Board also considered other direct or indirect benefits received by the Adviser and its affiliates in connection with its relationship with the Portfolio and the Fund, including the benefits of research services that may be available to the Adviser or Sub-adviser as a result of securities transactions effected for the Portfolio and other advisory clients.
The Board concluded that, in light of the foregoing factors and the nature, extent and quality of the services rendered, the profits realized by the Adviser and its affiliates, including the Sub-adviser, are reasonable.
Economies of Scale
In reviewing management fees and profitability, the Board also considered the extent to which the Adviser and its affiliates, on the one hand, and the Fund, on the other hand, can expect to realize benefits from economies of scale as the assets of the Fund and the Portfolio increase. The Board acknowledged the difficulty in accurately measuring the benefits resulting from the economies of scale with respect to the management of any specific fund or group of funds. The Board reviewed data summarizing the increases and decreases in the assets of the Fund and of all Eaton Vance Funds as a group over various time periods, and evaluated the extent to which the total expense ratio of the Fund and the profitability of the Adviser and its affiliates may have been affected by such increases or decreases. Based upon the foregoing, the Board concluded that the benefits from economies of scale are currently being shared equitably by the Adv iser and its affiliates and the Fund. The Board also concluded that, assuming reasonably foreseeable increases in the assets of the Portfolio, the structure of the advisory fee, which includes breakpoints at several asset levels, can be expected to cause the Adviser and its affiliates and the Fund to continue to share such benefits equitably.
29
Eaton Vance Tax-Managed Mid-Cap Core Fund
MANAGEMENT AND ORGANIZATION
Fund Management. The Trustees of Eaton Vance Mutual Funds Trust (the Trust) and Tax-Managed Mid-Cap Core Portfolio (the Portfolio) are responsible for the overall management and supervision of the Trust's and Portfolio's affairs. The Trustees and officers of the Trust and the Portfolio are listed below. Except as indicated, each individual has held the office shown or other offices in the same company for the last five years. Trustees and officers of the Trust and the Portfolio hold indefinite terms of office. The "noninterested Trustees" consist of those Trustees who are not "interested persons" of the Trust and the Portfolio, as that term is defined under the 1940 Act. The business address of each Trustee and officer is The Eaton Vance Building, 255 State Street, Boston, Massachusetts 02109. As used below, "EVC" refers to Eaton Vance Corp., "EV" refers to Eaton Vance, Inc., "EVM" refers to Eaton Vance Management, "BMR" refers to Boston Management and Research, "Parametric" refers to Parametric Portfolio Associates, "EVD" refers to Eaton Vance Distributors, Inc. and "Atlanta Capital" refers to Atlanta Capital Management Company, LLC. EVC and EV are the corporate parent and trustee, respectively, of EVM and BMR. EVD is the Fund's principal underwriter, the Portfolio's placement agent and a wholly-owned subsidiary of EVC. Each officer affiliated with Eaton Vance may hold a position with other Eaton Vance affiliates that is comparable to his or her position with EVM listed below.
| Date of Birth | | Position(s)
with the
Name and
the Portfolio | | Term of
Office and
Trust and
Service | | Length of
During Past Five Years | | Number of Portfolios
in Fund Complex
Principal Occupation(s)
Trustee(1) | | Overseen By
Other Directorships Held | |
| Interested Trustee | | | | | | | | | | | | | |
|
Thomas E. Faust Jr.
5/31/58 | | Trustee of the Trust and Portfolio, President of the Trust and Vice President of the Portfolio | | Trustee since 2007, President of the Trust since 2002 and Vice President of the Portfolio since 2001 | | Chairman, Chief Executive Officer and President of EVC, Director and President of EV, Chief Executive Officer and President of EVM and BMR, and Director of EVD. Trustee and/or Officer of 173 registered investment companies and 4 private companies managed by EVM or BMR. Mr. Faust is an interested person because of his positions with EVM, BMR, EVD, EVC and EV, which are affiliates of the Trust and Portfolio. | | | 173 | | | Director of EVC | |
|
| Noninterested Trustees | | | | | | | | | | | | | |
|
| Benjamin C. Esty 1/2/63 | | Trustee | | Since 2005 | | Roy and Elizabeth Simmons Professor of Business Administration, Harvard University Graduate School of Business Administration. | | | 173 | | | None | |
|
| Allen R. Freedman 4/3/40 | | Trustee | | Since 2007 | | Former Chairman (2002-2004) and a Director (1983-2004) of Systems & Computer Technology Corp. (provider of software to higher education). Formerly, a Director of Loring Ward International (fund distributor) (2005-2007). Formerly, Chairman and a Director of Indus International Inc. (provider of enterprise management software to the power generating industry) (2005-2007). | | | 173 | | | Director of Assurant, Inc. and Stonemor Partners L.P. (owner and operator of cemeteries) | |
|
| William H. Park 9/19/47 | | Trustee | | Since 2003 | | Vice Chairman, Commercial Industrial Finance Corp. (specialty finance company) (since 2006). Formerly, President and Chief Executive Officer, Prizm Capital Management, LLC (investment management firm) (2002-2005). | | | 173 | | | None | |
|
| Ronald A. Pearlman 7/10/40 | | Trustee | | Since 2003 | | Professor of Law, Georgetown University Law Center. | | | 173 | | | None | |
|
| Helen Frame Peters 3/22/48 | | Trustee | | Since 2008 | | Professor of Finance, Carroll School of Management, Boston College (since 2003). Adjunct Professor of Finance, Peking University, Beijing, China (since 2005). Formerly, Dean, Carroll School of Management, Boston College (2000-2003). | | | 173 | | | Director of Federal Home Loan Bank of Boston (a bank for banks) and BJ's Wholesale Clubs (wholesale club retailer); Trustee of SPDR Index Shares Funds and SPDR Series Trust (exchange traded funds) | |
|
30
Eaton Vance Tax-Managed Mid-Cap Core Fund
MANAGEMENT AND ORGANIZATION CONT'D
| Date of Birth | | Position(s)
with the
Name and
the Portfolio | | Term of
Office and
Trust and
Service | | Length of
During Past Five Years | | Number of Portfolios
in Fund Complex
Principal Occupation(s)
Trustee(1) | | Overseen By
Other Directorships Held | |
| Noninterested Trustees (continued) | | | | | | | | | | | | | |
|
| Heidi L. Steiger 7/8/53 | | Trustee | | Since 2007 | | Managing Partner, Topridge Associates LLC (global wealth management firm) (since 2008); Senior Advisor (since 2008), President (2005-2008), Lowenhaupt Global Advisors, LLC (global wealth management firm). Formerly, President and Contributing Editor, Worth Magazine (2004-2005). Formerly, Executive Vice President and Global Head of Private Asset Management (and various other positions), Neuberger Berman (investment firm) (1986-2004). | | | 173 | | | Director of Nuclear Electric Insurance Ltd. (nuclear insurance provider) and Aviva USA (insurance provider) | |
|
| Lynn A. Stout 9/14/57 | | Trustee | | Of the Trust since 1998 and of the Portfolio since 2001 | | Paul Hastings Professor of Corporate and Securities Law (since 2006) and Professor of Law (2001-2006), University of California at Los Angeles School of Law. | | | 173 | | | None | |
|
| Ralph F. Verni 1/26/43 | | Chairman of the Board and Trustee | | Chairman of the Board since 2007 and Trustee since 2005 | | Consultant and private investor. | | | 173 | | | None | |
|
| Principal Officers who are not Trustees | | | | | | | |
|
Name and
Date of Birth | | Position(s)
with the
Trust and
the Portfolio | | Term of
Office and
Length of
Service | | Principal Occupation(s)
During Past Five Years | |
| William H. Ahern, Jr. 7/28/59 | | Vice President of the Trust | | Since 1995 | | Vice President of EVM and BMR. Officer of 75 registered investment companies managed by EVM or BMR. | |
|
| John R. Baur 2/10/70 | | Vice President of the Trust | | Since 2007 | | Vice President of EVM and BMR. Previously, attended Johnson Graduate School of Management, Cornell University (2002-2005), and prior thereto he was an Account Team Representative in Singapore for Applied Materials, Inc. Officer of 33 registered investment companies managed by EVM or BMR. | |
|
| William O. Bell, IV 7/26/73 | | Vice President of the Portfolio | | Since 2005 | | Vice President of Atlanta Capital. Officer of 2 registered investment companies managed by EVM or BMR. | |
|
| Michael A. Cirami 12/24/75 | | Vice President of the Trust | | Since 2007 | | Vice President of EVM and BMR. Previously, attended the University of Rochester William E. Simon Graduate School of Business Administration (2001-2003), and prior thereto he was a Team Leader for the Institutional Services Group for State Street Bank in Luxembourg. Officer of 33 registered investment companies managed by EVM or BMR. | |
|
| Cynthia J. Clemson 3/2/63 | | Vice President of the Trust | | Since 2005 | | Vice President of EVM and BMR. Officer of 90 registered investment companies managed by EVM or BMR. | |
|
| Charles B. Gaffney 12/4/72 | | Vice President of the Trust | | Since 2007 | | Vice President of EVM and BMR. Previously, Sector Portfolio Manager and Senior Equity Analyst of Brown Brothers Harriman (1997-2003). Officer of 30 registered investment companies managed by EVM or BMR. | |
|
| William R. Hackney, III 4/12/48 | | Vice President of the Portfolio | | Since 2001 | | Managing Partner and member of the Executive Committee of Atlanta Capital. Officer of 2 registered investment companies managed by EVM or BMR. | |
|
| Marilyn Robinson Irvin 6/17/58 | | Vice President of the Portfolio | | Since 2005 | | Senior Vice President and Principal of Atlanta Capital. Officer of 2 registered investment companies managed by EVM or BMR. | |
|
| Christine M. Johnston 11/9/72 | | Vice President of the Trust | | Since 2007 | | Vice President of EVM and BMR. Officer of 35 registered investment companies managed by EVM or BMR. | |
|
31
Eaton Vance Tax-Managed Mid-Cap Core Fund
MANAGEMENT AND ORGANIZATION CONT'D
Name and
Date of Birth | | Position(s)
with the
Trust and
the Portfolio | | Term of
Office and
Length of
Service | | Principal Occupation(s)
During Past Five Years | |
| Principal Officers who are not Trustees (continued) | | | | | | | |
|
Aamer Khan
6/7/60 | | Vice President of the Trust | | Since 2005 | | Vice President of EVM and BMR. Officer of 33 registered investment companies managed by EVM or BMR. | |
|
| Thomas H. Luster 4/8/62 | | Vice President of the Trust | | Since 2006 | | Vice President of EVM and BMR. Officer of 51 registered investment companies managed by EVM or BMR. | |
|
| Robert B. MacIntosh 1/22/57 | | Vice President of the Trust | | Since 1998 | | Vice President of EVM and BMR. Officer of 90 registered investment companies managed by EVM or BMR. | |
|
| Duncan W. Richardson 10/26/57 | | Vice President of the Trust and President of the Portfolio | | Vice President of the Trust since 2001 and President of the Portfolio since 2007 | | Executive Vice President and Chief Equity Investment Officer of EVC, EVM and BMR. Officer of 81 registered investment companies managed by EVM or BMR. | |
|
| Judith A. Saryan 8/21/54 | | Vice President of the Trust | | Since 2003 | | Vice President of EVM and BMR. Officer of 55 registered investment companies managed by EVM or BMR. | |
|
| Susan Schiff 3/13/61 | | Vice President of the Trust | | Since 2002 | | Vice President of EVM and BMR. Officer of 36 registered investment companies managed by EVM or BMR. | |
|
| Thomas Seto 9/27/62 | | Vice President of the Trust | | Since 2007 | | Vice President and Director of Portfolio Management of Parametric. Officer of 31 registered investment companies managed by EVM or BMR. | |
|
| David M. Stein 5/4/51 | | Vice President of the Trust | | Since 2007 | | Managing Director and Chief Investment Officer of Parametric. Officer of 31 registered investment companies managed by EVM or BMR. | |
|
| Mark S. Venezia 5/23/49 | | Vice President of the Trust | | Since 2007 | | Vice President of EVM and BMR. Officer of 36 registered investment companies managed by EVM or BMR. | |
|
| Adam A. Weigold 3/22/75 | | Vice President of the Trust | | Since 2007 | | Vice President of EVM and BMR. Officer of 71 registered investment companies managed by EVM or BMR. | |
|
| Barbara E. Campbell 6/19/57 | | Treasurer | | Of the Trust since 2005
and of the Portfolio
since 2008(2) | | Vice President of EVM and BMR. Officer of 173 registered investment companies managed by EVM or BMR. | |
|
| Maureen A. Gemma 5/24/60 | | Secretary and Chief Legal Officer | | Secretary since 2007 and Chief Legal Officer since 2008 | | Vice President of EVM and BMR. Officer of 173 registered investment companies managed by EVM or BMR. | |
|
| Paul M. O'Neil 7/11/53 | | Chief Compliance Officer | | Since 2004 | | Vice President of EVM and BMR. Officer of 173 registered investment companies managed by EVM or BMR. | |
|
(1) Includes both master and feeder funds in a master-feeder structure.
(2) Prior to 2008, Ms. Campbell served as Assistant Treasurer of the Portfolio since 2001.
The SAI for the Fund includes additional information about the Trustees and officers of the Fund and the Portfolio and can be obtained without charge on Eaton Vance's website at www.eatonvance.com or by calling 1-800-262-1122.
32
Investment Adviser of Tax-Managed Mid-Cap Core Portfolio
Boston Management and Research
The Eaton Vance Building
255 State Street
Boston, MA 02109
Sub-Adviser of Tax-Managed Mid-Cap Core Portfolio
Atlanta Capital Management Company LLC
1349 West Peachtree Street
Suite 1600
Atlanta, GA 30309
Administrator of Eaton Vance Tax-Managed Mid-Cap Core Fund
Eaton Vance Management
The Eaton Vance Building
255 State Street
Boston, MA 02109
Principal Underwriter
Eaton Vance Distributors, Inc.
The Eaton Vance Building
255 State Street
Boston, MA 02109
(617) 482-8260
Custodian
State Street Bank and Trust Company
200 Clarendon Street
Boston, MA 02116
Transfer Agent
PNC Global Investing Services
Attn: Eaton Vance Funds
P.O. Box 9653
Providence, RI 02940-9653
(800) 262-1122
Independent Registered Public Accounting Firm
Deloitte & Touche LLP
200 Berkeley Street
Boston, MA 02116-5022
Eaton Vance Tax-Managed Mid-Cap Core Fund
The Eaton Vance Building
255 State Street
Boston, MA 02109
This report must be preceded or accompanied by a current prospectus. Before investing, investors should consider carefully the Fund's investment
objective, risks, and charges and expenses. The Fund's current prospectus contains this and other information about the Fund and is available
through your financial advisor. Please read the prospectus carefully before you invest or send money. For further information please call 1-800-262-1122.
1301-12/08 TMMCCSRC

Annual Report October 31, 2008


EATON VANCE
TAX-MANAGED
MULTI-CAP
GROWTH
FUND
IMPORTANT NOTICES REGARDING PRIVACY,
DELIVERY OF SHAREHOLDER DOCUMENTS,
PORTFOLIO HOLDINGS AND PROXY VOTING
Privacy. The Eaton Vance organization is committed to ensuring your financial privacy. Each of the financial institutions identified below has in effect the following policy ("Privacy Policy") with respect to nonpublic personal information about
its customers:
• Only such information received from you, through application forms or otherwise, and information about your Eaton Vance fund transactions will be collected. This may include information such as name, address, social security number, tax status, account balances and transactions.
• None of such information about you (or former customers) will be disclosed to anyone, except as permitted by law (which includes disclosure to employees necessary to service your account). In the normal course of servicing a customer's account, Eaton Vance may share information with unaffiliated third parties that perform various required services such as transfer agents, custodians and broker/dealers.
• Policies and procedures (including physical, electronic and procedural safeguards) are in place that are designed to protect the confidentiality of such information.
• We reserve the right to change our Privacy Policy at any time upon proper notification to you. Customers may want to review our Policy periodically for changes by accessing the link on our homepage: www.eatonvance.com.
Our pledge of privacy applies to the following entities within the Eaton Vance organization: the Eaton Vance Family of Funds, Eaton Vance Management, Eaton Vance Investment Counsel, Boston Management and Research, and Eaton Vance Distributors, Inc.
In addition, our Privacy Policy only applies to those Eaton Vance customers who are individuals and who have a direct relationship with us. If a customer's account (i.e., fund shares) is held in the name of a third-party financial adviser/ broker-dealer, it is likely that only such adviser's privacy policies apply to the customer. This notice supersedes all previously issued privacy disclosures.
For more information about Eaton Vance's Privacy Policy, please call 1-800-262-1122.
Delivery of Shareholder Documents. The Securities and Exchange Commission (the "SEC") permits funds to deliver only one copy of shareholder documents, including prospectuses, proxy statements and shareholder reports, to fund investors with multiple accounts at the same residential or post office box address. This practice is often called "householding" and it helps eliminate duplicate mailings to shareholders.
Eaton Vance, or your financial adviser, may household the mailing of your documents indefinitely unless you instruct Eaton Vance, or your financial adviser, otherwise.
If you would prefer that your Eaton Vance documents not be householded, please contact Eaton Vance at 1-800-262-1122, or contact your financial adviser.
Your instructions that householding not apply to delivery of your Eaton Vance documents will be effective within 30 days of receipt by Eaton Vance or your financial adviser.
Portfolio Holdings. Each Eaton Vance Fund and its underlying Portfolio (if applicable) will file a schedule of its portfolio holdings on Form N-Q with the SEC for the first and third quarters of each fiscal year. The Form N-Q will be available on the Eaton Vance website www.eatonvance.com, by calling Eaton Vance at 1-800-262-1122 or in the EDGAR database on the SEC's website at www.sec.gov. Form N-Q may also be reviewed and copied at the SEC's public reference room in Washington, D.C. (call 1-800-732-0330 for information on the operation of the public reference room).
Proxy Voting. From time to time, funds are required to vote proxies related to the securities held by the funds. The Eaton Vance Funds or their underlying Portfolios (if applicable) vote proxies according to a set of policies and procedures approved by the Funds' and Portfolios' Boards. You may obtain a description of these policies and procedures and information on how the Funds or Portfolios voted proxies relating to portfolio securities during the most recent 12 month period ended June 30, without charge, upon request, by calling 1-800-262-1122. This description is also available on the SEC's website at www.sec.gov.
Eaton Vance Tax-Managed Multi-Cap Growth Fund as of October 31, 2008
MANAGEMENT’S DISCUSSION OF FUND PERFORMANCE

Arieh Coll
Portfolio Manager
Economic and Market Conditions
· The stock market moved dramatically lower during the year that ended October 31, 2008. After reaching record highs in October 2007, the major market indices began to decline at the end of 2007 as investors realized that the difficulties in subprime lending and the troubled housing market were likely to slow the economy significantly. By the summer of 2008, the magnitude of the damage became increasingly apparent. Many banks were faced with enormous write-offs from bad real estate loans, losses that severely impaired their overall lending capacity. As the market declined further, investor and consumer sentiment worsened. That trend was accelerated by soaring energy prices, as oil hit $145 per barrel in July 2008 and pinched consumers even more.
· The failure of Lehman Brothers in September 2008 and the tenuous condition of other capital-starved banks and financial institutions sparked fears of a global financial collapse. In late September, in an effort to jump-start lending, the U.S. Treasury department unveiled a controversial proposal to purchase troubled loans from banks and financial institutions. Congress’s initial rejection of the plan sent the market into a near-freefall. A revised version of the measure was subsequently approved by Congress and was followed by a coordinated effort by the world’s central banks to inject liquidity into the global banking system. While those actions reassured many investors, volatility remained high as the one-year period drew to a close.
· For the year ended October 31, 2008, all ten sectors within the Russell Mid-Cap Growth Index(1) (the “Index”) registered negative returns. The consumer staples sector was the best performing sector but still declined by more than 25% for the year. All of the other sectors had losses exceeding 40%, except for health care, which declined by nearly 30%. The most severe losses occurred in the utilities, industrials and consumer discretionary sectors. Market-leading industries during the year included thrifts & mortgage finance and food products. In contrast, consumer finance stocks in the Index lost nearly 95% of their value, while stocks in the industrial conglomerates and Internet & catalog retail industries also were among the Index’s worst performers.
Management Discussion
· All stock market sectors experienced severe losses during the year ended October 31, 2008, and the Fund’s(2) performance reflected this difficult environment. During the year, the Fund’s performance lagged that of the Index and the Lipper Mid-Cap Growth Funds average primarily as a result of its holdings in the industrials, information technology and telecommunication services sectors.(1) In the industrials sector, electric equipment stocks declined, while communications equipment and Internet software stocks detracted in the information technology sector.
· On the positive side, the Fund benefited from selections in the energy and consumer discretionary sectors, and from a significant underweighting of utility
Eaton Vance Tax-Managed Multi-cap Growth Fund
Total Return Performance 10/31/07 – 10/31/08
Fund - Class A(3) | | -43.97 | % |
Fund - Class B(3) | | -44.36 | |
Fund - Class C(3) | | -44.33 | |
Russell Mid-Cap Growth Index(1) | | -42.65 | |
S&P 500 Index(1) | | -36.08 | |
Lipper Mid-Cap Growth Funds Average(1) | | -42.43 | |
See pages 3-4 for more performance information, including after-tax returns.
(1) | It is not possible to invest directly in an Index or a Lipper Classification. The Indices’ total returns do not reflect commissions or expenses that would have been incurred if an investor individually purchased or sold the securities represented in the Indices. The Lipper total return is the average total return, at net asset value, of the funds that are in the same Lipper Classification as the Fund. |
| |
(2) | The Fund currently invests in a separate registered investment company, Tax-Managed Multi-Cap Growth Portfolio, with the same objective and policies as the Fund. References to investments are to the Portfolio’s holdings. |
| |
(3) | These returns do not include the 5.75% maximum sales charge for Class A shares or the applicable contingent deferred sales charge (CDSC) for Class B and Class C shares. If sales charges were deducted, the returns would be lower. |
Past performance is no guarantee of future results. Returns are historical and are calculated by determining the percentage change in net asset value or offering price (as applicable) with all distributions reinvested. Investment return and principal value will fluctuate so that shares, when redeemed, may be worth more or less than their original cost. Performance is for the stated time period only; due to market volatility, the Fund’s current performance may be lower or higher than the quoted return. For performance as of the most recent month end, please refer to www. eatonvance.com.
Fund shares are not insured by the FDIC and are not deposits or other obligations of, or guaranteed by, any depository institution. Shares are subject to investment risks, including possible loss of principal invested.
The views expressed throughout this report are those of the portfolio manager and are current only through the end of the period of the report as stated on the cover. These views are subject to change at any time based upon market or other conditions, and the investment adviser disclaims any responsibility to update such views. These views may not be relied on as investment advice and, because investment decisions for a fund are based on many factors, may not be relied on as an indication of trading intent on behalf of any Eaton Vance fund. Portfolio information provided in the report may not be representative of the Portfolio’s current or future investments and may change due to active management.
1
stocks during a period in which this sector’s returns within the Index declined more than 50%. The Fund’s relative performance also benefited during the year ended October 31, 2008 from a positive contribution from the financials sector. Oil and gas selections, which were overweighted, outperformed in the energy sector, while the Fund’s retail selections had strong performance in the consumer discretionary sector.
Lipper Quintile Rankings(1)
By total return as of 10/31/08
EATON VANCE TAX-MANAGED MULTI-CAP GROWTH FUND CLASS A
LIPPER MID-CAP GROWTH FUNDS CLASSIFICATION
Period | | Quintile | | Ranking |
1 Year | | 3rd | | 355 of 608 funds |
3 Years | | 1st | | 22 of 529 funds |
5 Years | | 2nd | | 100 of 422 funds |
(1) | Source: Lipper Inc. Rankings are based on percentage change in net asset value with all distributions reinvested and do not take sales charges into consideration. Past performance is no guarantee of future results. It is not possible to invest in a Lipper Classification. |
Portfolio Composition
Top Ten Holdings(2)
By net assets
Gildan Activewear, Inc. | | 3.7 | % |
NASDAQ OMX Group, Inc. (The) | | 3.6 | |
Wells Fargo & Co. | | 3.2 | |
SLM Corp. | | 3.0 | |
Research In Motion, Ltd. | | 2.9 | |
Genzyme Corp. | | 2.7 | |
Equinix, Inc. | | 2.7 | |
BE Aerospace, Inc. | | 2.5 | |
MF Global, Ltd. | | 2.4 | |
Annaly Capital Management, Inc. | | 2.4 | |
(2) | Top Ten Holdings represented 29.1% of the Portfolio’s net assets as of 10/31/08. Excludes cash equivalents. |
Sector Weightings(3)
By net assets
(3) | As a percentage of the Portfolio’s net assets as of 10/31/08. Excludes cash equivalents. |
2
Eaton Vance Tax-Managed Multi-Cap Growth Fund as of October 31, 2008
FUND PERFORMANCE
The line graph and table set forth below provide information about the Fund’s performance. The line graph compares the performance of Class A of the Fund with that of the Russell Mid-Cap Growth Index, an unmanaged index of mid-cap growth companies and the S&P 500 Index, a broad-based, unmanaged market index of common stocks. The lines on the graph represent the total returns of a hypothetical investment of $10,000 in each of Class A, the Russell Mid-Cap Growth Index and the S&P 500 Index. Class A total returns are presented at net asset value and maximum public offering price. The table includes the total returns of each Class of the Fund at net asset value and maximum public offering price. The performance presented below does not reflect the deduction of taxes, if any, that a shareholder would pay on distributions or redemptions of Fund shares.
Performance(1)
Share Class Symbol | | Class A
EACPX | | Class B
EBCPX | | Class C
ECCPX | |
Average Annual Total Returns (at net asset value) | | | | | | | |
One Year | | -43.97 | % | -44.36 | % | -44.33 | % |
Five Years | | 1.57 | | 0.81 | | 0.82 | |
Life of Fund† | | 0.56 | | -0.27 | | -0.24 | |
| | | | | | | |
SEC Average Annual Total Returns (including sales charge or applicable CDSC) | | | | | | | |
One Year | | -47.20 | % | -46.76 | % | -44.81 | % |
Five Years | | 0.37 | | 0.48 | | 0.82 | |
Life of Fund† | | -0.16 | | -0.27 | | -0.24 | |
† | Inception Dates – Class A: 6/30/00; Class B: 7/10/00; Class C: 7/10/00 |
| |
(1) | Average Annual Total Returns do not include the 5.75% maximum sales charge for Class A shares or the applicable contingent deferred sales charge (CDSC) for Class B and Class C shares. If sales charges were deducted, the returns would be lower. SEC Average Annual Total Returns for Class A reflect the maximum 5.75% sales charge. SEC returns for Class B shares reflect the applicable CDSC based on the following schedule: 5% - 1st and 2nd years; 4% - 3rd year; 3% - 4th year; 2% - 5th year; 1% - 6th year. SEC returns for Class C reflect a 1% CDSC for the first year. |
Total Annual | | | | | | | |
Operating Expenses(2) | | Class A | | Class B | | Class C | |
| | | | | | | |
Expense Ratio | | 1.44 | % | 2.20 | % | 2.19 | % |
(2) | Source: Prospectus dated 3/1/08. |
* Source: Lipper, Inc. Class A of the Fund commenced investment operations on June 30, 2000.
A $10,000 hypothetical investment on 7/10/00 (inception date) at net asset value in Class B shares and Class C shares would have been valued at $9,779 and $9,800, respectively, on 10/31/08. It is not possible to invest directly in an Index. The Indices’ total returns do not reflect commissions or expenses that would have been incurred if an investor individually purchased or sold the securities represented in the Indices.
Past performance is no guarantee of future results. Returns are historical and are calculated by determining the percentage change in net asset value or offering price (as applicable) with all distributions reinvested. Investment return and principal value will fluctuate so that shares, when redeemed, may be worth more or less than their original cost. Performance is for the stated time period only; due to market volatility, the Fund’s current performance may be lower or higher than the quoted return. For performance as of the most recent month end, please refer to www.eatonvance.com.
3
“Return Before Taxes” does not take into consideration shareholder taxes. It is most relevant to tax-free or tax-deferred shareholder accounts. “Return After Taxes on Distributions” reflects the impact of federal income taxes due on Fund distributions of dividends and capital gains. It is most relevant to taxpaying shareholders who continue to hold their shares. “Return After Taxes on Distributions and Sale of Fund Shares” also reflects the impact of taxes on capital gain or loss realized upon a sale of shares. It is most relevant to taxpaying shareholders who sell their shares.
Average Annual Total Returns
(For the periods ended October 31, 2008)
Returns at Net Asset Value (NAV) (Class A)
| | One Year | | Five Years | | Life of Fund | |
Return Before Taxes | | -43.97 | % | 1.57 | % | 0.56 | % |
Return After Taxes on Distributions | | -45.52 | | 0.88 | | 0.15 | |
Return After Taxes on Distributions and Sale of Fund Shares | | -25.89 | | 1.79 | | 0.74 | |
Returns at Public Offering Price (POP) (Class A)
| | One Year | | Five Years | | Life of Fund | |
Return Before Taxes | | -47.20 | % | 0.37 | % | -0.16 | % |
Return After Taxes on Distributions | | -48.66 | | -0.30 | | -0.56 | |
Return After Taxes on Distribution and Sale of Fund Shares | | -28.14 | | 0.76 | | 0.13 | |
Average Annual Total Returns
(For the periods ended October 31, 2008)
Returns at Net Asset Value (NAV) (Class B)
| | One Year | | Five Years | | Life of Fund | |
Return Before Taxes | | -44.36 | % | 0.81 | % | -0.27 | % |
Return After Taxes on Distributions | | -45.88 | | 0.14 | | -0.67 | |
Return After Taxes on Distributions and Sale of Fund Shares | | -26.06 | | 1.17 | | 0.05 | |
Returns at Public Offering Price (POP) (Class B)
| | One Year | | Five Years | | Life of Fund | |
Return Before Taxes | | -46.76 | % | 0.48 | % | -0.27 | % |
Return After Taxes on Distributions | | -48.28 | | -0.21 | | -0.67 | |
Return After Taxes on Distributions and Sale of Fund Shares | | -27.62 | | 0.89 | | 0.05 | |
Average Annual Total Returns
(For the periods ended October 31, 2008)
Returns at Net Asset Value (NAV) (Class C)
| | One Year | | Five Years | | Life of Fund | |
Return Before Taxes | | -44.33 | % | 0.82 | % | -0.24 | % |
Return After Taxes on Distributions | | -45.87 | | 0.13 | | -0.65 | |
Return After Taxes on Distributions and Sale of Fund Shares | | -26.03 | | 1.17 | | 0.08 | |
Returns at Public Offering Price (POP) (Class C)
| | One Year | | Five Years | | Life of Fund | |
Return Before Taxes | | -44.81 | | 0.82 | % | -0.24 | % |
Return After Taxes on Distributions | | -46.35 | | 0.13 | | -0.65 | |
Return After Taxes on Distributions and Sale of Fund Shares | | -26.34 | | 1.17 | | 0.08 | |
Class A of the Fund commenced investment operations on 6/30/00. Class B and Class C of the Fund commenced investment operations on 7/10/00. Returns at Public Offering Price (POP) reflect the deduction of the maximum initial sales charge and applicable CDSC, while Returns at Net Asset Value (NAV) do not.
After-tax returns are calculated using certain assumptions. After-tax returns are calculated using the highest historical individual federal income tax rate and do not reflect the impact of state and local taxes. Actual after-tax returns depend on a shareholder’s tax situation and the actual characterization of distributions and may differ from those shown. After-tax returns are not relevant for shareholders who hold shares in tax-deferred accounts or to shares held by non-taxable entities. Return After Taxes on Distributions for a period may be the same as Return Before Taxes for the same period because no taxable distributions were made during that period. Return After Taxes on Distributions and Sale of Fund Shares for a period may be greater than or equal to Return After Taxes on Distributions for the same period because of losses realized on the sale of Fund shares.
Past performance is no guarantee of future results. Returns are historical and are calculated by determining the percentage change in net asset value or offering price (as applicable) with all distributions reinvested. Investment return and principal value will fluctuate so that shares, when redeemed, may be worth more or less than their original cost. Performance is for the stated time period only; due to market volatility, the Fund’s current performance may be lower or higher than the quoted return. For performance as of the most recent month end, please refer to www.eatonvance.com.
4
Eaton Vance Tax-Managed Multi-Cap Growth Fund as of October 31, 2008
FUND EXPENSES
Example: As a shareholder of the Fund, you incur two types of costs: (1) transaction costs, including sales charges (loads) on purchases and redemption fees (if applicable); and (2) ongoing costs, including management fees; distribution or service fees; and other Fund expenses. This Example is intended to help you understand your ongoing costs (in dollars) of investing in the Fund and to compare these costs with the ongoing costs of investing in other mutual funds. The Example is based on an investment of $1,000 invested at the beginning of the period and held for the entire period (May 1, 2008 – October 31, 2008).
Actual Expenses: The first section of the table below provides information about actual account values and actual expenses. You may use the information in this section, together with the amount you invested, to estimate the expenses that you paid over the period. Simply divide your account value by $1,000 (for example, an $8,600 account value divided by $1,000 = 8.6), then multiply the result by the number in the first section under the heading entitled "Expenses Paid During Period" to estimate the expenses you paid on your account during this period.
Hypothetical Example for Comparison Purposes: The second section of the table below provides information about hypothetical account values and hypothetical expenses based on the actual Fund expense ratio and an assumed rate of return of 5% per year (before expenses), which is not the actual return of the Fund. The hypothetical account values and expenses may not be used to estimate the actual ending account balance or expenses you paid for the period. You may use this information to compare the ongoing costs of investing in your Fund and other funds. To do so, compare this 5% hypothetical example with the 5% hypothetical examples that appear in the shareholder reports of the other funds.
Please note that the expenses shown in the table are meant to highlight your ongoing costs only and do not reflect any transactional costs, such as sales charges (loads) or redemption fees (if applicable). Therefore, the second section of the table is useful in comparing ongoing costs only, and will not help you determine the relative total costs of owning different funds. In addition, if these transactional costs were included, your costs would have been higher.
Eaton Vance Tax-Managed Multi-Cap Growth Fund
| | | Beginning Account Value
(5/1/08) | | Ending Account Value
(10/31/08) | | Expenses Paid During Period*
(5/1/08 – 10/31/08) | |
| Actual | |
| Class A | | $ | 1,000.00 | | | $ | 588.30 | | | $ | 5.47 | | |
| Class B | | $ | 1,000.00 | | | $ | 586.30 | | | $ | 8.37 | | |
| Class C | | $ | 1,000.00 | | | $ | 586.60 | | | $ | 8.42 | | |
| Hypothetical | |
| (5% return per year before expenses) | |
| Class A | | $ | 1,000.00 | | | $ | 1,018.20 | | | $ | 6.95 | | |
| Class B | | $ | 1,000.00 | | | $ | 1,014.60 | | | $ | 10.63 | | |
| Class C | | $ | 1,000.00 | | | $ | 1,014.50 | | | $ | 10.68 | | |
* Expenses are equal to the Fund's annualized expense ratio of 1.37% for Class A shares, 2.10% for Class B shares and 2.11% for Class C shares, multiplied by the average account value over the period, multiplied by 184/366 (to reflect the one-half year period). The Example assumes that the $1,000 was invested at the net asset value per share determined at the close of business on April 30, 2008. The Example reflects the expenses of both the Fund and the Portfolio.
5
Eaton Vance Tax-Managed Multi-Cap Growth Fund as of October 31, 2008
FINANCIAL STATEMENTS
Statement of Assets and Liabilities
As of October 31, 2008
| Assets | |
Investment in Tax-Managed Multi-Cap Growth Portfolio, at value
(identified cost, $94,405,513) | | $ | 84,913,169 | | |
| Receivable for Fund shares sold | | | 725,055 | | |
| Total assets | | $ | 85,638,224 | | |
| Liabilities | |
| Payable for Fund shares redeemed | | $ | 403,446 | | |
| Payable to affiliate for distribution and service fees | | | 36,429 | | |
| Payable to affiliate for administration fee | | | 10,860 | | |
| Accrued expenses | | | 47,876 | | |
| Total liabilities | | $ | 498,611 | | |
| Net Assets | | $ | 85,139,613 | | |
| Sources of Net Assets | |
| Paid-in capital | | $ | 121,860,813 | | |
Accumulated net realized loss from Portfolio (computed on the basis
of identified cost) | | | (27,369,640 | ) | |
| Accumulated undistributed net investment income | | | 140,784 | | |
Net unrealized depreciation from Portfolio (computed on the basis of
identified cost) | | | (9,492,344 | ) | |
| Total | | $ | 85,139,613 | | |
| Class A Shares | |
| Net Assets | | $ | 56,537,170 | | |
| Shares Outstanding | | | 6,473,536 | | |
Net Asset Value and Redemption Price Per Share
(net assets ÷ shares of beneficial interest outstanding) | | $ | 8.73 | | |
Maximum Offering Price Per Share
(100 ÷ 94.25 of $8.73) | | $ | 9.26 | | |
| Class B Shares | |
| Net Assets | | $ | 10,119,318 | | |
| Shares Outstanding | | | 1,245,853 | | |
Net Asset Value and Offering Price Per Share*
(net assets ÷ shares of beneficial interest outstanding) | | $ | 8.12 | | |
| Class C Shares | |
| Net Assets | | $ | 18,483,125 | | |
| Shares Outstanding | | | 2,274,035 | | |
Net Asset Value and Offering Price Per Share*
(net assets ÷ shares of beneficial interest outstanding) | | $ | 8.13 | | |
On sales of $50,000 or more, the offering price of Class A shares is reduced.
* Redemption price per share is equal to the net asset value less any applicable contingent deferred sales charge.
Statement of Operations
For the Year Ended
October 31, 2008
| Investment Income | |
| Dividends allocated from Portfolio (net of foreign taxes, $19,258) | | $ | 749,300 | | |
| Interest allocated from Portfolio | | | 206,548 | | |
| Securities lending income allocated from Portfolio, net | | | 435,383 | | |
| Expenses allocated from Portfolio | | | (805,160 | ) | |
| Net investment income from Portfolio | | $ | 586,071 | | |
| Expenses | |
| Administration fee | | $ | 159,857 | | |
| Trustees' fees and expenses | | | 1,018 | | |
Distribution and service fees
Class A | | | 155,446 | | |
| Class B | | | 175,061 | | |
| Class C | | | 268,865 | | |
| Transfer and dividend disbursing agent fees | | | 110,868 | | |
| Registration fees | | | 40,425 | | |
| Custodian fee | | | 30,464 | | |
| Printing and postage | | | 26,248 | | |
| Legal and accounting services | | | 21,388 | | |
| Miscellaneous | | | 11,924 | | |
| Total expenses | | $ | 1,001,564 | | |
| Net investment loss | | $ | (415,493 | ) | |
Realized and Unrealized
Gain (Loss) from Portfolio | |
Net realized gain (loss) —
Investment transactions (identified cost basis) | | $ | (27,512,350 | ) | |
| Foreign currency transactions | | | (2,246 | ) | |
| Net realized loss | | $ | (27,514,596 | ) | |
Change in unrealized appreciation (depreciation) —
Investments (identified cost basis) | | $ | (38,895,017 | ) | |
| Net change in unrealized appreciation (depreciation) | | $ | (38,895,017 | ) | |
| Net realized and unrealized loss | | $ | (66,409,613 | ) | |
| Net decrease in net assets from operations | | $ | (66,825,106 | ) | |
See notes to financial statements
6
Eaton Vance Tax-Managed Multi-Cap Growth Fund as of October 31, 2008
FINANCIAL STATEMENTS CONT'D
Statements of Changes in Net Assets
Increase (Decrease)
in Net Assets | | Year Ended
October 31, 2008 | | Year Ended
October 31, 2007 | |
From operations —
Net investment income (loss) | | $ | (415,493 | ) | | $ | 815,790 | | |
Net realized gain (loss) from investment
and foreign currency transactions | | | (27,514,596 | ) | | | 13,334,318 | | |
Net change in unrealized
appreciation (depreciation)
of investments and foreign currency | | | (38,895,017 | ) | | | 13,077,678 | | |
Net increase (decrease) in net assets
from operations | | $ | (66,825,106 | ) | | $ | 27,227,786 | | |
Distributions to shareholders —
From net investment income
Class A | | $ | (606,256 | ) | | $ | — | | |
| Class B | | | (91,011 | ) | | | — | | |
| Class C | | | (159,283 | ) | | | — | | |
From net realized gain
Class A | | | (6,777,256 | ) | | | (505,546 | ) | |
| Class B | | | (2,724,125 | ) | | | (360,203 | ) | |
| Class C | | | (3,800,678 | ) | | | (382,895 | ) | |
| Total distributions to shareholders | | $ | (14,158,609 | ) | | $ | (1,248,644 | ) | |
Transactions in shares of beneficial interest —
Proceeds from sale of shares
Class A | | $ | 73,631,304 | | | $ | 15,006,829 | | |
| Class B | | | 3,064,951 | | | | 1,502,391 | | |
| Class C | | | 10,641,705 | | | | 4,826,669 | | |
Net asset value of shares issued to
shareholders in payment of
distributions declared
Class A | | | 6,507,868 | | | | 454,534 | | |
| Class B | | | 2,341,547 | | | | 304,962 | | |
| Class C | | | 3,057,193 | | | | 296,062 | | |
Cost of shares redeemed
Class A | | | (23,768,797 | ) | | | (4,426,455 | ) | |
| Class B | | | (3,092,542 | ) | | | (4,227,231 | ) | |
| Class C | | | (5,129,189 | ) | | | (2,428,086 | ) | |
Net asset value of shares exchanged
Class A | | | 1,541,276 | | | | 905,115 | | |
| Class B | | | (1,541,276 | ) | | | (905,115 | ) | |
Net increase in net assets from Fund
share transactions | | $ | 67,254,040 | | | $ | 11,309,675 | | |
| Net increase (decrease) in net assets | | $ | (13,729,675 | ) | | $ | 37,288,817 | | |
| Net Assets | |
| At beginning of year | | $ | 98,869,288 | | | $ | 61,580,471 | | |
| At end of year | | $ | 85,139,613 | | | $ | 98,869,288 | | |
Accumulated undistributed
net investment income
included in net assets | |
| At end of year | | $ | 140,784 | | | $ | 823,958 | | |
See notes to financial statements
7
Eaton Vance Tax-Managed Multi-Cap Growth Fund as of October 31, 2008
FINANCIAL STATEMENTS CONT'D
Financial Highlights
| | | Class A | |
| | | Year Ended October 31, | |
| | | 2008 | | 2007 | | 2006 | | 2005 | | 2004 | |
| Net asset value — Beginning of year | | $ | 17.990 | | | $ | 12.750 | | | $ | 10.850 | | | $ | 10.060 | | | $ | 9.690 | | |
| Income (loss) from operations | |
| Net investment income (loss)(1) | | $ | (0.010 | ) | | $ | 0.217 | (2) | | $ | (0.019 | ) | | $ | (0.072 | ) | | $ | (0.083 | ) | |
| Net realized and unrealized gain (loss) | | | (6.853 | ) | | | 5.276 | | | | 2.144 | | | | 0.862 | | | | 0.453 | | |
| Total income (loss) from operations | | $ | (6.863 | ) | | $ | 5.493 | | | $ | 2.125 | | | $ | 0.790 | | | $ | 0.370 | | |
| Less distributions | |
| From net investment income | | $ | (0.197 | ) | | $ | — | | | $ | — | | | $ | — | | | $ | — | | |
| From net realized gain | | | (2.200 | ) | | | (0.253 | ) | | | (0.225 | ) | | | — | | | | — | | |
| Total distributions | | $ | (2.397 | ) | | $ | (0.253 | ) | | $ | (0.225 | ) | | $ | — | | | $ | — | | |
| Net asset value — End of year | | $ | 8.730 | | | $ | 17.990 | | | $ | 12.750 | | | $ | 10.850 | | | $ | 10.060 | | |
| Total Return(3) | | | (43.97 | )% | | | 43.76 | % | | | 19.84 | % | | | 7.85 | % | | | 3.82 | % | |
| Ratios/Supplemental Data | |
| Net assets, end of year (000's omitted) | | $ | 56,537 | | | $ | 49,517 | | | $ | 25,559 | | | $ | 21,998 | | | $ | 23,462 | | |
| Ratios (As a percentage of average daily net assets): | |
| Expenses before custodian fee reduction(4)(5) | | | 1.38 | % | | | 1.43 | % | | | 1.49 | % | | | 1.55 | % | | | 1.52 | % | |
| Net investment income (loss) | | | (0.07 | )% | | | 1.45 | %(2) | | | (0.16 | )% | | | (0.67 | )% | | | (0.84 | )% | |
| Portfolio Turnover of the Portfolio | | | 283 | % | | | 157 | % | | | 181 | % | | | 217 | % | | | 239 | % | |
(1) Net investment income (loss) per share was computed using average shares outstanding.
(2) Net investment income per share reflects special dividends allocated from the Portfolio which amounted to $0.265 per share. Excluding special dividends, the ratio of net investment income (loss) to average daily net assets would have been (0.31)%.
(3) Returns are historical and are calculated by determining the percentage change in net asset value with all distributions reinvested.
(4) Includes the Fund's share of the Portfolio's allocated expenses. The Portfolio's adviser voluntarily waived a portion of its investment adviser fee (equal to 0.01% of average daily net assets for each of the years ended October 31, 2006 and 2004).
(5) Excludes the effect of custody fee credits, if any, of less than 0.005%.
See notes to financial statements
8
Eaton Vance Tax-Managed Multi-Cap Growth Fund as of October 31, 2008
FINANCIAL STATEMENTS CONT'D
Financial Highlights
| | | Class B | |
| | | Year Ended October 31, | |
| | | 2008 | | 2007 | | 2006 | | 2005 | | 2004 | |
| Net asset value — Beginning of year | | $ | 16.880 | | | $ | 12.070 | | | $ | 10.350 | | | $ | 9.680 | | | $ | 9.390 | | |
| Income (loss) from operations | |
| Net investment income (loss)(1) | | $ | (0.111 | ) | | $ | 0.120 | (2) | | $ | (0.096 | ) | | $ | (0.146 | ) | | $ | (0.153 | ) | |
| Net realized and unrealized gain (loss) | | | (6.375 | ) | | | 4.943 | | | | 2.041 | | | | 0.816 | | | | 0.443 | | |
| Total income (loss) from operations | | $ | (6.486 | ) | | $ | 5.063 | | | $ | 1.945 | | | $ | 0.670 | | | $ | 0.290 | | |
| Less distributions | |
| From net investment income | | $ | (0.074 | ) | | $ | — | | | $ | — | | | $ | — | | | $ | — | | |
| From net realized gain | | | (2.200 | ) | | | (0.253 | ) | | | (0.225 | ) | | | — | | | | — | | |
| Total distributions | | $ | (2.274 | ) | | $ | (0.253 | ) | | $ | (0.225 | ) | | $ | — | | | $ | — | | |
| Net asset value — End of year | | $ | 8.120 | | | $ | 16.880 | | | $ | 12.070 | | | $ | 10.350 | | | $ | 9.680 | | |
| Total Return(3) | | | (44.36 | )% | | | 42.64 | % | | | 19.04 | % | | | 6.92 | % | | | 3.09 | % | |
| Ratios/Supplemental Data | |
| Net assets, end of year (000's omitted) | | $ | 10,119 | | | $ | 20,815 | | | $ | 17,797 | | | $ | 18,653 | | | $ | 20,928 | | |
| Ratios (As a percentage of average daily net assets): | |
| Expenses before custodian fee reduction(4)(5) | | | 2.13 | % | | | 2.19 | % | | | 2.24 | % | | | 2.30 | % | | | 2.27 | % | |
| Net investment income (loss) | | | (0.84 | )% | | | 0.86 | %(2) | | | (0.85 | )% | | | (1.42 | )% | | | (1.60 | )% | |
| Portfolio Turnover of the Portfolio | | | 283 | % | | | 157 | % | | | 181 | % | | | 217 | % | | | 239 | % | |
(1) Net investment income (loss) per share was computed using average shares outstanding.
(2) Net investment income per share reflects special dividends allocated from the Portfolio which amounted to $0.263 per share. Excluding special dividends, the ratio of net investment income (loss) to average daily net assets would have been (1.02)%.
(3) Returns are historical and are calculated by determining the percentage change in net asset value with all distributions reinvested.
(4) Includes the Fund's share of the Portfolio's allocated expenses. The Portfolio's adviser voluntarily waived a portion of its investment adviser fee (equal to 0.01% of average daily net assets for each of the years ended October 31, 2006 and 2004).
(5) Excludes the effect of custody fee credits, if any, of less than 0.005%.
See notes to financial statements
9
Eaton Vance Tax-Managed Multi-Cap Growth Fund as of October 31, 2008
FINANCIAL STATEMENTS CONT'D
Financial Highlights
| | | Class C | |
| | | Year Ended October 31, | |
| | | 2008 | | 2007 | | 2006 | | 2005 | | 2004 | |
| Net asset value — Beginning of year | | $ | 16.910 | | | $ | 12.090 | | | $ | 10.370 | | | $ | 9.700 | | | $ | 9.410 | | |
| Income (loss) from operations | |
| Net investment income (loss)(1) | | $ | (0.109 | ) | | $ | 0.111 | (2) | | $ | (0.100 | ) | | $ | (0.146 | ) | | $ | (0.151 | ) | |
| Net realized and unrealized gain (loss) | | | (6.379 | ) | | | 4.962 | | | | 2.045 | | | | 0.816 | | | | 0.441 | | |
| Total income (loss) from operations | | $ | (6.488 | ) | | $ | 5.073 | | | $ | 1.945 | | | $ | 0.670 | | | $ | 0.290 | | |
| Less distributions | |
| From net investment income | | $ | (0.092 | ) | | $ | — | | | $ | — | | | $ | — | | | $ | — | | |
| From net realized gain | | | (2.200 | ) | | | (0.253 | ) | | | (0.225 | ) | | | — | | | | — | | |
| Total distributions | | $ | (2.292 | ) | | $ | (0.253 | ) | | $ | (0.225 | ) | | $ | — | | | $ | — | | |
| Net asset value — End of year | | $ | 8.130 | | | $ | 16.910 | | | $ | 12.090 | | | $ | 10.370 | | | $ | 9.700 | | |
| Total Return(3) | | | (44.33 | )% | | | 42.65 | % | | | 19.01 | % | | | 6.91 | % | | | 3.08 | % | |
| Ratios/Supplemental Data | |
| Net assets, end of year (000's omitted) | | $ | 18,483 | | | $ | 28,537 | | | $ | 18,224 | | | $ | 17,058 | | | $ | 18,373 | | |
| Ratios (As a percentage of average daily net assets): | |
| Expenses before custodian fee reduction(4)(5) | | | 2.13 | % | | | 2.18 | % | | | 2.24 | % | | | 2.30 | % | | | 2.27 | % | |
| Net investment income (loss) | | | (0.83 | )% | | | 0.79 | %(2) | | | (0.89 | )% | | | (1.42 | )% | | | (1.57 | )% | |
| Portfolio Turnover of the Portfolio | | | 283 | % | | | 157 | % | | | 181 | % | | | 217 | % | | | 239 | % | |
(1) Net investment income (loss) per share was computed using average shares outstanding.
(2) Net investment income per share reflects special dividends allocated from the Portfolio which amounted to $0.260 per share. Excluding special dividends, the ratio of net investment income (loss) to average daily net assets would have been (1.05)%.
(3) Returns are historical and are calculated by determining the percentage change in net asset value with all distributions reinvested.
(4) Includes the Fund's share of the Portfolio's allocated expenses. The Portfolio's adviser voluntarily waived a portion of its investment adviser fee (equal to 0.01% of average daily net assets for each of the years ended October 31, 2006 and 2004).
(5) Excludes the effect of custody fee credits, if any, of less than 0.005%.
See notes to financial statements
10
Eaton Vance Tax-Managed Multi-Cap Growth Fund as of October 31, 2008
NOTES TO FINANCIAL STATEMENTS
1 Significant Accounting Policies
Eaton Vance Tax-Managed Multi-Cap Growth Fund (the Fund) is a diversified series of Eaton Vance Mutual Funds Trust (the Trust). The Trust is a Massachusetts business trust registered under the Investment Company Act of 1940, as amended (the 1940 Act), as an open-end management investment company. The Fund offers three classes of shares. Class A shares are generally sold subject to a sales charge imposed at time of purchase. Class B and Class C shares are sold at net asset value and are generally subject to a contingent deferred sales charge (see Note 5). Class B shares automatically convert to Class A shares eight years after their purchase as de scribed in the Fund's prospectus. Each class represents a pro-rata interest in the Fund, but votes separately on class-specific matters and (as noted below) is subject to different expenses. Realized and unrealized gains and losses and net investment income and losses, other than class-specific expenses, are allocated daily to each class of shares based on the relative net assets of each class to the total net assets of the Fund. Each class of shares differs in its distribution plan and certain other class-specific expenses. The Fund invests all of its investable assets in interests in Tax-Managed Multi-Cap Growth Portfolio (the Portfolio), a New York trust, having the same investment objective and policies as the Fund. The value of the Fund's investment in the Portfolio reflects the Fund's proportionate interest in the net assets of the Portfolio (60.4% at October 31, 2008). The performance of the Fund is directly affected by the performance of the Portfolio. The financial statements of the Portfolio, inclu ding the portfolio of investments, are included elsewhere in this report and should be read in conjunction with the Fund's financial statements.
The following is a summary of significant accounting policies of the Fund. The policies are in conformity with accounting principles generally accepted in the United States of America.
A Investment Valuation — Valuation of securities by the Portfolio is discussed in Note 1A of the Portfolio's Notes to Financial Statements, which are included elsewhere in this report.
B Income — The Fund's net investment income or loss consists of the Fund's pro-rata share of the net investment income or loss of the Portfolio, less all actual and accrued expenses of the Fund.
C Federal Taxes — The Fund's policy is to comply with the provisions of the Internal Revenue Code applicable to regulated investment companies and to distribute to shareholders each year substantially all of its net investment income, and all or substantially all of its net realized capital gains. Accordingly, no provision for federal income or excise tax is necessary.
At October 31, 2008, the Fund, for federal income tax purposes, had a capital loss carryforward of $23,990,714 which will reduce its taxable income arising from future net realized gains on investment transactions, if any, to the extent permitted by the Internal Revenue Code, and thus will reduce the amount of distributions to shareholders, which would otherwise be necessary to relieve the Fund of any liability for federal income or excise tax. Such capital loss carryforward will expire on October 31, 2016.
As of October 31, 2008, the Fund had no uncertain tax positions that would require financial statement recognition, de-recognition, or disclosure. Each of the Fund's federal tax returns filed in the 3-year period ended October 31, 2008 remains subject to examination by the Internal Revenue Service.
D Expenses — The majority of expenses of the Trust are directly identifiable to an individual fund. Expenses which are not readily identifiable to a specific fund are allocated taking into consideration, among other things, the nature and type of expense and the relative size of the funds.
E Expense Reduction — State Street Bank and Trust Company (SSBT) serves as custodian of the Fund. Pursuant to the custodian agreement, SSBT receives a fee reduced by credits, which are determined based on the average daily cash balance the Fund maintains with SSBT. All credit balances, if any, used to reduce the Fund's custodian fees are reported as a reduction of expenses in the Statement of Operations.
F Use of Estimates — The preparation of the financial statements in conformity with accounting principles generally accepted in the United States of America requires management to make estimates and assumptions that affect the reported amounts of assets and liabilities at the date of the financial statements and the reported amounts of income and expense during the reporting period. Actual results could differ from those estimates.
G Indemnifications — Under the Trust's organizational documents, its officers and Trustees may be indemnified against certain liabilities and expenses arising out of the performance of their duties to the Fund, and shareholders are indemnified against personal liability for the obligations of the Trust. Additionally, in the normal
11
Eaton Vance Tax-Managed Multi-Cap Growth Fund as of October 31, 2008
NOTES TO FINANCIAL STATEMENTS CONT'D
course of business, the Fund enters into agreements with service providers that may contain indemnification clauses. The Fund's maximum exposure under these arrangements is unknown as this would involve future claims that may be made against the Fund that have not yet occurred.
H Other — Investment transactions are accounted for on a trade date basis. Dividends to shareholders are recorded on the ex-dividend date.
2 Distributions to Shareholders
It is the present policy of the Fund to make at least one distribution annually (normally in December) of all or substantially all of its net investment income and to distribute annually all or substantially all of its net realized capital gains (reduced by available capital loss carryforwards from prior years, if any). Distributions are declared separately for each class of shares. Shareholders may reinvest income and capital gain distributions in additional shares of the same class of the Fund at the net asset value as of the ex-dividend date or, at the election of the shareholder, receive distributions in cash. The Fund distinguishes between distributions on a tax basis and a financial reporting basis. Accounting principles generally accepted in the United States of America require that only distributions in excess of tax basis earnings and profits be reported in the financial statements as a return of capital. Permanent diff erences between book and tax accounting relating to distributions are reclassified to paid-in capital. For tax purposes, distributions from short-term capital gains are considered to be from ordinary income.
The tax character of distributions declared for the years ended October 31, 2008 and October 31, 2007 was as follows:
| | | Year Ended October 31, | |
| | | 2008 | | 2007 | |
| Distributions declared from: | |
| Ordinary income | | $ | 5,310,190 | | | $ | — | | |
| Long-term capital gains | | $ | 8,848,419 | | | $ | 1,248,644 | | |
During the year ended October 31, 2008, accumulated net realized loss was decreased by $230,690, accumulated undistributed net investment income was increased by $588,869, and paid-in capital was decreased by $819,559 due to differences between book and tax accounting, primarily for foreign currency gain (loss), net operating losses, investments in passive foreign investment companies (PFICs), return of capital distributions from securities and due to the Fund's use of equalization accounting. These reclassifications had no effect on the net assets or net asset value per share of the Fund.
As of October 31, 2008, the components of distributable earnings (accumulated losses) and unrealized appreciation (depreciation) on a tax basis were as follows:
| Undistributed ordinary income | | $ | 72,571 | | |
| Capital loss carryforward | | $ | (23,990,714 | ) | |
| Net unrealized depreciation | | $ | (12,803,057 | ) | |
The differences between components of distributable earnings (accumulated losses) on a tax basis and the amounts reflected in the Statement of Assets and Liabilities are primarily due to wash sales, partnership allocations and investments in PFICs.
3 Transactions with Affiliates
The administration fee is earned by Eaton Vance Management (EVM) as compensation for administrative services rendered to the Fund. The fee is computed at an annual rate of 0.15% of the Fund's average daily net assets. For the year ended October 31, 2008, the administration fee amounted to $159,857. The Portfolio has engaged Boston Management and Research (BMR), a subsidiary of EVM, to render investment advisory services. See Note 2 of the Portfolio's Notes to Financial Statements which are included elsewhere in this report. EVM serves as the sub-transfer agent of the Fund and receives from the transfer agent an aggregate fee based upon the actual expenses incurred by EVM in the performance of these services. For the year ended October 31, 2008, EVM earned $7,319 in sub-transfer agent fees. The Fund was informed that Eaton Vance Distributors, Inc. (EVD), an affiliate of EVM and the Fund's principal underwriter, received $49,925 a s its portion of the sales charge on sales of Class A shares for the year ended October 31, 2008. EVD also received distribution and service fees from Class A, Class B and Class C shares (see Note 4) and contingent deferred sales charges (see Note 5).
Except for Trustees of the Fund and the Portfolio who are not members of EVM's or BMR's organizations, officers and Trustees receive remuneration for their services to the Fund out of the investment adviser fee. Certain officers and Trustees of the Fund and the Portfolio are officers of the above organizations.
4 Distribution Plans
The Fund has in effect a distribution plan for Class A shares (Class A Plan) pursuant to Rule 12b-1 under the 1940 Act.
12
Eaton Vance Tax-Managed Multi-Cap Growth Fund as of October 31, 2008
NOTES TO FINANCIAL STATEMENTS CONT'D
The Class A Plan provides that the Fund will pay EVD a distribution and service fee of 0.25% per annum of its average daily net assets attributable to Class A shares for distribution services and facilities provided to the Fund by EVD, as well as for personal services and/or the maintenance of shareholder accounts. Distribution and service fees paid or accrued to EVD for the year ended October 31, 2008 amounted to $155,446 for Class A shares.
The Fund also has in effect distribution plans for Class B shares (Class B Plan) and Class C shares (Class C Plan) pursuant to Rule 12b-1 under the 1940 Act. The Class B and Class C Plans require the Fund to pay EVD amounts equal to 0.75% per annum of its average daily net assets attributable to Class B and Class C shares for providing ongoing distribution services and facilities to the Fund. The Fund will automatically discontinue payments to EVD during any period in which there are no outstanding Uncovered Distribution Charges, which are equivalent to the sum of (i) 6.25% of the aggregate amount received by the Fund for Class B and Class C shares sold, plus (ii) interest calculated by applying the rate of 1% over the prevailing prime rate to the outstanding balance of Uncovered Distribution Charges of EVD of each respective class, reduced by the aggregate amount of contingent deferred sales charges (see Note 5) and amounts the retofore paid or payable to EVD by each respective class. For the year ended October 31, 2008, the Fund paid or accrued to EVD $131,296 and $201,649 for Class B and Class C shares, respectively, representing 0.75% of the average daily net assets of Class B and Class C shares. At October 31, 2008, the amounts of Uncovered Distribution Charges of EVD calculated under the Class B and Class C Plans were approximately $600,000 and $1,561,000, respectively.
The Class B and Class C Plans also authorize the Fund to make payments of service fees to EVD, investment dealers and other persons in amounts not exceeding 0.25% per annum of its average daily net assets attributable to that class. Service fees paid or accrued are for personal services and/or the maintenance of shareholder accounts. They are separate and distinct from the sales commissions and distribution fees payable to EVD and, as such, are not subject to automatic discontinuance when there are no outstanding Uncovered Distribution Charges of EVD. Service fees paid or accrued for the year ended October 31, 2008 amounted to $43,765 and $67,216 for Class B and Class C shares, respectively.
5 Contingent Deferred Sales Charges
A contingent deferred sales charge (CDSC) generally is imposed on redemptions of Class B shares made within six years of purchase and on redemptions of Class C shares made within one year of purchase. Class A shares may be subject to a 1% CDSC if redeemed within two years of purchase (depending on the circumstances of purchase). Generally, the CDSC is based upon the lower of the net asset value at date of redemption or date of purchase. No charge is levied on shares acquired by reinvestment of dividends or capital gain distributions. The CDSC for Class B shares is imposed at declining rates that begin at 5% in the case of redemptions in the first and second year after purchase, declining one percentage point each sub sequent year. Class C shares are subject to a 1% CDSC if redeemed within one year of purchase. No CDSC is levied on shares which have been sold to EVM or its affiliates or to their respective employees or clients and may be waived under certain other limited conditions. CDSCs received on Class B and Class C redemptions are paid to EVD to reduce the amount of Uncovered Distribution Charges calculated under the Fund's Class B and Class C Plans. CDSCs received on Class B and Class C redemptions when no Uncovered Distribution Charges exist are credited to the Fund. For the year ended October 31, 2008, the Fund was informed that EVD received approximately $2,000, $10,000 and $7,000 of CDSCs paid by Class A, Class B and Class C shareholders, respectively.
6 Investment Transactions
For the year ended October 31, 2008, increases and decreases in the Fund's investment in the Portfolio aggregated $87,002,684 and $34,889,775, respectively.
7 Shares of Beneficial Interest
The Fund's Declaration of Trust permits the Trustees to issue an unlimited number of full and fractional shares of beneficial interest (without par value). Such shares may be issued in a number of different series (such as the Fund) and classes. Transactions in Fund shares were as follows:
| | | Year Ended October 31, | |
| Class A | | 2008 | | 2007 | |
| Sales | | | 5,089,553 | | | | 955,035 | | |
Issued to shareholders electing to
receive payments of distributions
in Fund shares | | | 419,863 | | | | 33,895 | | |
| Redemptions | | | (1,900,703 | ) | | | (302,334 | ) | |
| Exchange from Class B shares | | | 112,178 | | | | 61,431 | | |
| Net increase | | | 3,720,891 | | | | 748,027 | | |
13
Eaton Vance Tax-Managed Multi-Cap Growth Fund as of October 31, 2008
NOTES TO FINANCIAL STATEMENTS CONT'D
| | | Year Ended October 31, | |
| Class B | | 2008 | | 2007 | |
| Sales | | | 228,869 | | | | 100,763 | | |
Issued to shareholders electing to
receive payments of distributions
in Fund shares | | | 161,375 | | | | 24,070 | | |
| Redemptions | | | (257,295 | ) | | | (301,178 | ) | |
| Exchange to Class A shares | | | (120,215 | ) | | | (65,166 | ) | |
| Net increase (decrease) | | | 12,734 | | | | (241,511 | ) | |
| | | Year Ended October 31, | |
| Class C | | 2008 | | 2007 | |
| Sales | | | 803,697 | | | | 327,367 | | |
Issued to shareholders electing to
receive payments of distributions
in Fund shares | | | 210,551 | | | | 23,330 | | |
| Redemptions | | | (427,672 | ) | | | (170,576 | ) | |
| Net increase | | | 586,576 | | | | 180,121 | | |
8 Recently Issued Accounting Pronouncement
In September 2006, the Financial Accounting Standards Board issued Statement of Financial Accounting Standards No. 157 (FAS 157), "Fair Value Measurements". FAS 157 defines fair value, establishes a framework for measuring fair value in accordance with accounting principles generally accepted in the United States of America and expands disclosure about fair value measurements. FAS 157 is effective for fiscal years beginning after November 15, 2007. As of October 31, 2008, management does not believe the adoption of FAS 157 will impact the amounts reported in the financial statements; however, additional disclosures may be required about the inputs used to develop the measurements of fair value and the effect of certain of the measurements on changes in net assets for the period.
14
Eaton Vance Tax-Managed Multi-Cap Growth Fund as of October 31, 2008
REPORT OF INDEPENDENT REGISTERED PUBLIC ACCOUNTING FIRM
To the Trustees of Eaton Vance Mutual Funds Trust and Shareholders of Eaton Vance
Tax-Managed Multi-Cap Growth Fund:
We have audited the accompanying statement of assets and liabilities of Eaton Vance Tax-Managed Multi-Cap Growth Fund (the "Fund") (one of the series of Eaton Vance Mutual Funds Trust) as of October 31, 2008, and the related statement of operations for the year then ended, the statements of changes in net assets for each of the two years in the period then ended, and the financial highlights for each of the five years in the period then ended. These financial statements and financial highlights are the responsibility of the Fund's management. Our responsibility is to express an opinion on these financial statements and financial highlights based on our audits.
We conducted our audits in accordance with the standards of the Public Company Accounting Oversight Board (United States). Those standards require that we plan and perform the audit to obtain reasonable assurance about whether the financial statements and financial highlights are free of material misstatement. The Fund is not required to have, nor were we engaged to perform, an audit of its internal control over financial reporting. Our audits included consideration of internal control over financial reporting as a basis for designing audit procedures that are appropriate in the circumstances, but not for the purpose of expressing an opinion on the effectiveness of the Fund's internal control over financial reporting. Accordingly, we express no such opinion. An audit also includes examining, on a test basis, evidence supporting the amounts and disclosures in the financial statements, assessing the accounting principles used and significant estimates made by management, as well as evaluating the overall financial statement presentation. We believe that our audits provide a reasonable basis for our opinion.
In our opinion, the financial statements and financial highlights referred to above present fairly, in all material respects, the financial position of Eaton Vance Tax-Managed Multi-Cap Growth Fund as of October 31, 2008, the results of its operations for the year ended, the changes in its net assets for each of the two years in the period then ended, and the financial highlights for each of the five years in the period then ended, in conformity with accounting principles generally accepted in the United States of America.
DELOITTE & TOUCHE LLP
Boston, Massachusetts
December 15, 2008
15
Eaton Vance Tax-Managed Multi-Cap Growth Fund as of October 31, 2008
FEDERAL TAX INFORMATION (Unaudited)
The Form 1099-DIV you receive in January 2009 will show the tax status of all distributions paid to your account in calendar 2008. Shareholders are advised to consult their own tax adviser with respect to the tax consequences of their investment in the Fund. As required by the Internal Revenue Code regulations, shareholders must be notified within 60 days of the Fund's fiscal year end regarding the status of qualified dividend income for individuals and capital gain dividends.
Qualified Dividend Income — The Fund designates $599,193 or up to the maximum amount of such dividends allowable pursuant to the Internal Revenue Code, as qualified dividend income eligible for the reduced tax rate of 15%.
Capital Gain Dividends — The Fund designates $8,848,883 as a capital gain dividend.
16
Tax-Managed Multi-Cap Growth Portfolio as of October 31, 2008
PORTFOLIO OF INVESTMENTS
| Common Stocks — 94.5% | |
| Security | | Shares | | Value | |
| Aerospace & Defense — 4.1% | |
| BE Aerospace, Inc.(1) | | | 269,000 | | | $ | 3,462,030 | | |
| Goodrich Corp. | | | 21,000 | | | | 767,760 | | |
| Precision Castparts Corp. | | | 24,000 | | | | 1,555,440 | | |
| | | $ | 5,785,230 | | |
| Airlines — 1.5% | |
| AMR Corp.(1) | | | 142,000 | | | $ | 1,449,820 | | |
| UAL Corp.(2) | | | 45,000 | | | | 655,200 | | |
| | | $ | 2,105,020 | | |
| Beverages — 1.4% | |
| Central European Distribution Corp.(1) | | | 10,365 | | | $ | 298,408 | | |
| Heckmann Corp.(1)(2) | | | 231,000 | | | | 1,727,880 | | |
| | | $ | 2,026,288 | | |
| Biotechnology — 2.7% | |
| Genzyme Corp.(1) | | | 52,848 | | | $ | 3,851,562 | | |
| | | $ | 3,851,562 | | |
| Capital Markets — 5.6% | |
| Aberdeen Asset Management PLC | | | 70,620 | | | $ | 106,648 | | |
| Goldman Sachs Group, Inc. | | | 13,100 | | | | 1,211,750 | | |
| MF Global, Ltd.(1)(2) | | | 852,000 | | | | 3,322,800 | | |
| Morgan Stanley | | | 183,000 | | | | 3,197,010 | | |
| | | $ | 7,838,208 | | |
| Chemicals — 9.7% | |
| Innophos Holdings, Inc. | | | 76,760 | | | $ | 2,053,330 | | |
| Lubrizol Corp. | | | 63,000 | | | | 2,367,540 | | |
| Monsanto Co. | | | 12,479 | | | | 1,110,381 | | |
| NewMarket Corp. | | | 53,000 | | | | 1,997,570 | | |
| Potash Corp. of Saskatchewan, Inc. | | | 37,493 | | | | 3,196,653 | | |
| Syngenta AG | | | 9,300 | | | | 1,738,479 | | |
| Zoltek Cos., Inc.(1)(2) | | | 103,000 | | | | 1,214,370 | | |
| | | $ | 13,678,323 | | |
| Security | | Shares | | Value | |
| Commercial Banks — 3.2% | |
| Banco Itau Holding Financiera SA ADR | | | 1 | | | $ | 6 | | |
| KeyCorp | | | 500 | | | | 6,115 | | |
| Wells Fargo & Co. | | | 132,000 | | | | 4,494,600 | | |
| | | $ | 4,500,721 | | |
| Communications Equipment — 5.0% | |
| Nortel Networks Corp.(1) | | | 1,000 | | | $ | 1,250 | | |
| Polycom, Inc.(1) | | | 81,000 | | | | 1,701,810 | | |
| Research In Motion, Ltd.(1) | | | 81,245 | | | | 4,097,185 | | |
| Riverbed Technology, Inc.(1) | | | 93,235 | | | | 1,168,235 | | |
| | | $ | 6,968,480 | | |
| Computers & Peripherals — 1.9% | |
| Apple, Inc.(1) | | | 24,500 | | | $ | 2,635,955 | | |
| Synaptics, Inc.(1) | | | 150 | | | | 4,633 | | |
| | | $ | 2,640,588 | | |
| Construction & Engineering — 3.7% | |
| Chicago Bridge & Iron Co. NV | | | 256,000 | | | $ | 3,171,840 | | |
| KBR, Inc. | | | 140,000 | | | | 2,077,600 | | |
| | | $ | 5,249,440 | | |
| Consumer Finance — 3.0% | |
| SLM Corp.(1)(2) | | | 400,173 | | | $ | 4,269,846 | | |
| | | $ | 4,269,846 | | |
| Diversified Consumer Services — 1.9% | |
| Capella Education Co.(1) | | | 100 | | | $ | 4,740 | | |
| H&R Block, Inc. | | | 133,000 | | | | 2,622,760 | | |
| | | $ | 2,627,500 | | |
| Diversified Financial Services — 3.6% | |
| IntercontinentalExchange, Inc.(1) | | | 100 | | | $ | 8,556 | | |
| KKR Financial Holdings LLC | | | 100 | | | | 386 | | |
| NASDAQ OMX Group, Inc. (The)(1)(2) | | | 157,000 | | | | 5,096,220 | | |
| | | $ | 5,105,162 | | |
| Diversified Telecommunication Services — 0.0% | |
| Maxcom Telecomunicaciones SAB de CV ADR(1) | | | 39 | | | $ | 167 | | |
| | | $ | 167 | | |
See notes to financial statements
17
Tax-Managed Multi-Cap Growth Portfolio as of October 31, 2008
PORTFOLIO OF INVESTMENTS CONT'D
| Security | | Shares | | Value | |
| Electrical Equipment — 2.1% | |
| Energy Conversion Devices, Inc.(1)(2) | | | 33,000 | | | $ | 1,126,620 | | |
| GrafTech International, Ltd.(1) | | | 154,198 | | | | 1,250,546 | | |
| Vestas Wind Systems A/S(1) | | | 14,833 | | | | 607,561 | | |
| | | $ | 2,984,727 | | |
Electronic Equipment, Instruments &
Components — 0.0% | |
| IPG Photonics Corp.(1) | | | 100 | | | $ | 1,420 | | |
| | | $ | 1,420 | | |
| Energy Equipment & Services — 1.9% | |
| Pride International, Inc.(1) | | | 138,176 | | | $ | 2,596,327 | | |
| | | $ | 2,596,327 | | |
| Food & Staples Retailing — 0.0% | |
| Shoppers Drug Mart Corp. | | | 64 | | | $ | 2,464 | | |
| | | $ | 2,464 | | |
| Health Care Equipment & Supplies — 2.5% | |
| American Medical Systems Holdings, Inc.(1) | | | 77,000 | | | $ | 833,140 | | |
| Kinetic Concepts, Inc.(1)(2) | | | 18,493 | | | | 447,716 | | |
| Thoratec Corp.(1) | | | 88,625 | | | | 2,181,947 | | |
| | | $ | 3,462,803 | | |
| Health Care Providers & Services — 1.4% | |
| Catalyst Health Solutions, Inc.(1) | | | 100 | | | $ | 1,687 | | |
| DaVita, Inc.(1) | | | 22,000 | | | | 1,248,500 | | |
| Henry Schein, Inc.(1) | | | 1,000 | | | | 46,810 | | |
| WellCare Health Plans, Inc.(1) | | | 30,000 | | | | 725,100 | | |
| | | $ | 2,022,097 | | |
| Hotels, Restaurants & Leisure — 0.0% | |
| Starbucks Corp.(1) | | | 500 | | | $ | 6,565 | | |
| | | $ | 6,565 | | |
| Household Durables — 1.0% | |
| Desarrolladora Homex SA de CV, ADR(1)(2) | | | 62,000 | | | $ | 1,443,360 | | |
| Standard Pacific Corp.(1) | | | 100 | | | | 285 | | |
| | | $ | 1,443,645 | | |
| Security | | Shares | | Value | |
| Industrial Conglomerates — 0.0% | |
| McDermott International, Inc.(1) | | | 200 | | | $ | 3,426 | | |
| | | $ | 3,426 | | |
| Insurance — 2.8% | |
| Admiral Group PLC | | | 42,000 | | | $ | 622,623 | | |
| Fairfax Financial Holdings, Ltd. | | | 2,600 | | | | 729,326 | | |
| Fidelity National Financial, Inc., Class A | | | 141,765 | | | | 1,277,303 | | |
| MetLife, Inc. | | | 40,000 | | | | 1,328,800 | | |
| Progressive Corp. | | | 400 | | | | 5,708 | | |
| | | $ | 3,963,760 | | |
| Internet & Catalog Retail — 1.0% | |
| HSN, Inc.(1) | | | 100 | | | $ | 615 | | |
| Priceline.com, Inc.(1)(2) | | | 26,750 | | | | 1,407,852 | | |
| | | $ | 1,408,467 | | |
| Internet Software & Services — 3.0% | |
| Absolute Software Corp.(1) | | | 89,449 | | | $ | 289,431 | | |
| Ariba, Inc.(1) | | | 1,000 | | | | 10,700 | | |
| DealerTrack Holdings, Inc.(1) | | | 1,000 | | | | 10,730 | | |
| Equinix, Inc.(1)(2) | | | 60,000 | | | | 3,745,200 | | |
| Move, Inc.(1) | | | 1,013 | �� | | | 1,702 | | |
| Switch & Data Facilities Co.(1) | | | 9,666 | | | | 91,054 | | |
| | | $ | 4,148,817 | | |
| IT Services — 6.4% | |
| Cognizant Technology Solutions Corp.(1) | | | 160,000 | | | $ | 3,072,000 | | |
| MasterCard, Inc., Class A(2) | | | 20,000 | | | | 2,956,400 | | |
| Satyam Computer Services, Ltd. ADR(2) | | | 184,000 | | | | 2,894,320 | | |
| TeleTech Holdings, Inc.(1) | | | 1,000 | | | | 9,040 | | |
| WNS Holdings, Ltd. ADR(1) | | | 52 | | | | 463 | | |
| | | $ | 8,932,223 | | |
| Machinery — 0.6% | |
| Energy Recovery, Inc.(1) | | | 100 | | | $ | 580 | | |
| Titan International, Inc. | | | 69,375 | | | | 801,975 | | |
| | | $ | 802,555 | | |
See notes to financial statements
18
Tax-Managed Multi-Cap Growth Portfolio as of October 31, 2008
PORTFOLIO OF INVESTMENTS CONT'D
| Security | | Shares | | Value | |
| Media — 1.8% | |
| Central European Media Enterprises, Ltd., Class A(1) | | | 29,096 | | | $ | 777,154 | | |
| CTC Media, Inc.(1) | | | 66,794 | | | | 494,276 | | |
| DISH Network Corp., Class A(1) | | | 81,000 | | | | 1,274,940 | | |
| | | $ | 2,546,370 | | |
| Metals & Mining — 0.2% | |
| Centerra Gold, Inc.(1) | | | 1,000 | | | $ | 871 | | |
| Consolidated Thompson Iron Mines, Ltd.(1) | | | 137,522 | | | | 222,491 | | |
| Schnitzer Steel Industries, Inc.(2) | | | 500 | | | | 13,465 | | |
| Silver Wheaton Corp.(1) | | | 1,000 | | | | 3,600 | | |
| Western Copper Corp.(1) | | | 110,000 | | | | 27,379 | | |
| | | $ | 267,806 | | |
| Multiline Retail — 3.6% | |
| Big Lots, Inc.(1)(2) | | | 87,000 | | | $ | 2,125,410 | | |
| Dollar Tree, Inc.(1) | | | 78,000 | | | | 2,965,560 | | |
| | | $ | 5,090,970 | | |
| Oil, Gas & Consumable Fuels — 4.3% | |
| Bill Barrett Corp.(1)(2) | | | 62,000 | | | $ | 1,264,800 | | |
| Centennial Coal Co., Ltd. | | | 2,000 | | | | 4,703 | | |
| Continental Resources, Inc.(1)(2) | | | 1,000 | | | | 32,390 | | |
| Goodrich Petroleum Corp.(1)(2) | | | 72,848 | | | | 2,022,260 | | |
| Patriot Coal Corp.(1) | | | 500 | | | | 7,915 | | |
| Petrohawk Energy Corp.(1) | | | 137,000 | | | | 2,596,150 | | |
| Petroleo Brasileiro S.A. ADR | | | 1,000 | | | | 26,890 | | |
| W&T Offshore, Inc. | | | 1,000 | | | | 19,170 | | |
| | | $ | 5,974,278 | | |
| Personal Products — 0.0% | |
| Bare Escentuals, Inc.(1)(2) | | | 1,000 | | | $ | 4,180 | | |
| Herbalife, Ltd. | | | 86 | | | | 2,101 | | |
| | | $ | 6,281 | | |
| Pharmaceuticals — 0.4% | |
| Abbott Laboratories | | | 100 | | | $ | 5,515 | | |
| Perrigo Co. | | | 14,000 | | | | 476,000 | | |
| | | $ | 481,515 | | |
| Professional Services — 0.5% | |
| CoStar Group, Inc.(1)(2) | | | 21,000 | | | $ | 756,420 | | |
| | | $ | 756,420 | | |
| Security | | Shares | | Value | |
| Real Estate Investment Trusts (REITs) — 2.3% | |
| Annaly Capital Management, Inc. | | | 234,123 | | | $ | 3,254,310 | | |
| | | $ | 3,254,310 | | |
| Semiconductors & Semiconductor Equipment — 1.4% | |
| Atheros Communications, Inc.(1) | | | 37,000 | | | $ | 664,890 | | |
| Cavium Networks, Inc.(1) | | | 100 | | | | 1,274 | | |
| MEMC Electronic Materials, Inc.(1) | | | 100 | | | | 1,838 | | |
| NVIDIA Corp.(1) | | | 500 | | | | 4,380 | | |
| Renesola, Ltd.(1)(2) | | | 418,704 | | | | 1,311,283 | | |
| | | $ | 1,983,665 | | |
| Software — 0.6% | |
| Check Point Software Technologies, Ltd.(1) | | | 39,000 | | | $ | 788,580 | | |
| | | $ | 788,580 | | |
| Specialty Retail — 3.8% | |
| Advance Auto Parts, Inc. | | | 82,085 | | | $ | 2,561,052 | | |
| CarMax, Inc.(1) | | | 500 | | | | 5,310 | | |
| GameStop Corp., Class A(1) | | | 50,000 | | | | 1,369,500 | | |
| Tiffany & Co. | | | 49,000 | | | | 1,345,050 | | |
| | | $ | 5,280,912 | | |
| Textiles, Apparel & Luxury Goods — 3.7% | |
| Gildan Activewear, Inc.(1)(2) | | | 221,600 | | | $ | 5,176,576 | | |
| | | $ | 5,176,576 | | |
| Thrifts & Mortgage Finance — 0.0% | |
| BankUnited Financial Corp., Class A | | | 94 | | | $ | 44 | | |
| | | $ | 44 | | |
| Trading Companies & Distributors — 0.0% | |
| WESCO International, Inc.(1) | | | 1,000 | | | $ | 19,880 | | |
| | | $ | 19,880 | | |
| Water Utilities — 1.9% | |
| Cia de Saneamento Basico do Estado de Sao Paulo ADR(2) | | | 113,240 | | | $ | 2,604,520 | | |
| | | $ | 2,604,520 | | |
See notes to financial statements
19
Tax-Managed Multi-Cap Growth Portfolio as of October 31, 2008
PORTFOLIO OF INVESTMENTS CONT'D
| Security | | Shares | | Value | |
| Wireless Telecommunication Services — 0.0% | |
| Philippine Long Distance Telephone Co. ADR | | | 1,000 | | | $ | 40,900 | | |
| | | $ | 40,900 | | |
Total Common Stocks
(identified cost $144,778,406) | | | | | | $ | 132,698,858 | | |
| Investment Funds — 0.0% | |
| Security | | Shares | | Value | |
| Capital Markets — 0.0% | |
| India Fund, Inc. | | | 1,000 | | | $ | 20,350 | | |
| SPDR Trust Series 1 | | | 100 | | | | 9,694 | | |
| | | $ | 30,044 | | |
Total Investment Funds
(identified cost $48,140) | | | | | | $ | 30,044 | | |
| Short-Term Investments — 33.9% | |
| Description | | Interest
(000's omitted) | | Value | |
| Eaton Vance Cash Collateral Fund, LLC, 3.45%(3)(4) | | $ | 33,473 | | | $ | 33,472,659 | | |
| Cash Management Portfolio, 1.90%(4) | | | 14,139 | | | | 14,138,874 | | |
Total Short-Term Investments
(identified cost $47,793,009) | | | | | | $ | 47,611,533 | | |
Total Investments — 128.4%
(identified cost $192,619,555) | | | | | | $ | 180,340,435 | | |
| Other Assets, Less Liabilities — (28.4)% | | $ | (39,830,883 | ) | |
| Net Assets — 100.0% | | | | | | $ | 140,509,552 | | |
ADR - American Depository Receipt
(1) Non-income producing security.
(2) All or a portion of this security was on loan at October 31, 2008.
(3) The investment in Eaton Vance Cash Collateral Fund, LLC includes the value of invested cash collateral received for securities on loan at October 31, 2008. Other Assets, Less Liabilities includes an equal and offsetting liability of the Portfolio to repay collateral amounts upon the return of loaned securities plus realized and unrealized losses, if any, on the amount invested. At October 31, 2008, the investment in Eaton Vance Cash Collateral Fund, LLC also includes $136,521 of cash collateral received on security loans that were terminated with the counterparty, for which the repayment obligations were settled by the Portfolio using other available cash.
(4) Affiliated investment company available to Eaton Vance portfolios and funds which invests in high quality, U.S. dollar denominated money market instruments. The rate shown is the annualized seven-day yield as of October 31, 2008.
See notes to financial statements
20
Tax-Managed Multi-Cap Growth Portfolio as of October 31, 2008
FINANCIAL STATEMENTS
Statement of Assets and Liabilities
As of October 31, 2008
| Assets | |
Unaffiliated investments, at value including $32,087,517
of securities on loan (identified cost, $144,826,546) | | $ | 132,728,902 | | |
| Affiliated investments, at value (identified cost, $47,793,009) | | | 47,611,533 | | |
| Receivable for investments sold | | | 1,844,117 | | |
| Dividends and interest receivable | | | 78,565 | | |
| Interest receivable from affiliated investments | | | 34,567 | | |
| Securities lending income receivable | | | 144,702 | | |
| Total assets | | $ | 182,442,386 | | |
| Liabilities | |
| Collateral for securities loaned | | $ | 33,740,571 | | |
| Payable for investments purchased | | | 8,030,404 | | |
| Payable to affiliate for investment adviser fee | | | 69,992 | | |
| Payable to affiliate for Trustees' fees | | | 633 | | |
| Accrued expenses | | | 91,234 | | |
| Total liabilities | | $ | 41,932,834 | | |
| Net Assets applicable to investors' interest in Portfolio | | $ | 140,509,552 | | |
| Sources of Net Assets | |
| Net proceeds from capital contributions and withdrawals | | $ | 152,788,672 | | |
| Net unrealized depreciation (computed on the basis of identified cost) | | | (12,279,120 | ) | |
| Total | | $ | 140,509,552 | | |
Statement of Operations
For the Year Ended
October 31, 2008
| Investment Income | |
| Dividends (net of foreign taxes, $34,982) | | $ | 1,414,148 | | |
| Interest | | | 183 | | |
| Securities lending income, net | | | 808,581 | | |
| Interest income allocated from affiliated investments | | | 391,740 | | |
| Expenses allocated from affiliated investment | | | (56,407 | ) | |
| Total investment income | | $ | 2,558,245 | | |
| Expenses | |
| Investment adviser fee | | $ | 1,257,717 | | |
| Trustees' fees and expenses | | | 10,105 | | |
| Custodian fee | | | 150,524 | | |
| Legal and accounting services | | | 36,425 | | |
| Miscellaneous | | | 11,782 | | |
| Total expenses | | $ | 1,466,553 | | |
| Net investment income | | $ | 1,091,692 | | |
| Realized and Unrealized Gain (Loss) | |
Net realized gain (loss) —
Investment transactions (identified cost basis) | | $ | (31,580,493 | ) | |
| Investment transactions allocated from affiliated investment | | | (222,957 | ) | |
| Foreign currency transactions | | | (10,182 | ) | |
| Net realized loss | | $ | (31,813,632 | ) | |
Change in unrealized appreciation (depreciation) —
Investments (identified cost basis) | | $ | (79,993,225 | ) | |
| Net change in unrealized appreciation (depreciation) | | $ | (79,993,225 | ) | |
| Net realized and unrealized loss | | $ | (111,806,857 | ) | |
| Net decrease in net assets from operations | | $ | (110,715,165 | ) | |
See notes to financial statements
21
Tax-Managed Multi-Cap Growth Portfolio as of October 31, 2008
FINANCIAL STATEMENTS CONT'D
Statements of Changes in Net Assets
Increase (Decrease)
in Net Assets | | Year Ended
October 31, 2008 | | Year Ended
October 31, 2007 | |
From operations —
Net investment income | | $ | 1,091,692 | | | $ | 3,943,925 | | |
Net realized gain (loss) from investment
and foreign currency transactions | | | (31,813,632 | ) | | | 32,232,884 | | |
Net change in unrealized
appreciation (depreciation)
of investments and foreign currency | | | (79,993,225 | ) | | | 29,932,482 | | |
Net increase (decrease) in net assets
from operations | | $ | (110,715,165 | ) | | $ | 66,109,291 | | |
Capital transactions —
Contributions | | $ | 87,002,684 | | | $ | 21,049,018 | | |
| Withdrawals | | | (54,709,084 | ) | | | (18,789,888 | ) | |
Net increase in net assets from
capital transactions | | $ | 32,293,600 | | | $ | 2,259,130 | | |
| Net increase (decrease) in net assets | | $ | (78,421,565 | ) | | $ | 68,368,421 | | |
| Net Assets | |
| At beginning of year | | $ | 218,931,117 | | | $ | 150,562,696 | | |
| At end of year | | $ | 140,509,552 | | | $ | 218,931,117 | | |
See notes to financial statements
22
Tax-Managed Multi-Cap Growth Portfolio as of October 31, 2008
FINANCIAL STATEMENTS CONT'D
Supplementary Data
| | | Year Ended October 31, | |
| | | 2008 | | 2007 | | 2006 | | 2005 | | 2004 | |
| Ratios/Supplemental Data | | | | | | | | | | | | | | | | | | | | | |
| Ratios (As a percentage of average daily net assets): | | | | | | | | | | | | | | | | | | | | | |
| Expenses before custodian fee reduction(1)(2) | | | 0.76 | % | | | 0.72 | % | | | 0.76 | % | | | 0.77 | % | | | 0.76 | % | |
| Net investment income (loss) | | | 0.54 | % | | | 2.24 | %(3) | | | 0.59 | % | | | 0.10 | % | | | (0.06 | )% | |
| Portfolio Turnover | | | 283 | % | | | 157 | % | | | 181 | % | | | 217 | % | | | 239 | % | |
| Total Return | | | (43.60 | )% | | | 44.75 | % | | | 20.69 | % | | | 8.71 | % | | | 4.60 | % | |
| Net assets, end of year (000's omitted) | | $ | 140,510 | | | $ | 218,931 | | | $ | 150,563 | | | $ | 135,774 | | | $ | 108,894 | | |
(1) The investment adviser voluntarily waived a portion of its investment adviser fee (equal to 0.01% of average daily net assets for each of the years ended October 31, 2006 and 2004).
(2) Excludes the effect of custody fee credits, if any, of less than 0.005%.
(3) Includes special dividends equal to 1.85% of average daily net assets.
See notes to financial statements
23
Tax-Managed Multi-Cap Growth Portfolio as of October 31, 2008
NOTES TO FINANCIAL STATEMENTS
1 Significant Accounting Policies
Tax-Managed Multi-Cap Growth Portfolio (the Portfolio) is a New York trust registered under the Investment Company Act of 1940, as amended (the 1940 Act), as a diversified, open-end management investment company. The Portfolio's investment objective is to achieve long-term, after-tax returns. The Declaration of Trust permits the Trustees to issue interests in the Portfolio. At October 31, 2008, Eaton Vance Tax-Managed Multi-Cap Growth Fund and Eaton Vance Tax-Managed Equity Asset Allocation Fund held an interest of 60.4% and 39.5%, respectively, in the Portfolio.
The following is a summary of significant accounting policies of the Portfolio. The policies are in conformity with accounting principles generally accepted in the United States of America.
A Investment Valuation — Equity securities listed on a U.S. securities exchange generally are valued at the last sale price on the day of valuation or, if no sales took place on such date, at the mean between the closing bid and asked prices therefore on the exchange where such securities are principally traded. Equity securities listed on the NASDAQ Global or Global Select Market generally are valued at the NASDAQ official closing price. Unlisted or listed securities for which closing sales prices or closing quotations are not available are valued at the mean between the latest available bid and asked prices or, in the case of preferred equity securities that are not listed or traded in the over-the-counter market, by an independent pricing service. Short-term debt secur ities with a remaining maturity of sixty days or less are valued at amortized cost, which approximates market value. If short-term debt securities are acquired with a remaining maturity of more than sixty days, they will be valued by a pricing service. Foreign securities and currencies are valued in U.S. dollars, based on foreign currency exchange rate quotations supplied by an independent quotation service. The independent service uses a proprietary model to determine the exchange rate. Inputs to the model include reported trades and implied bid/ask spreads. The daily valuation of exchange-traded foreign securities generally is determined as of the close of trading on the principal exchange on which such securities trade. Events occurring after the close of trading on foreign exchanges may result in adjustments to the valuation of foreign securities to more accurately reflect their fair value as of the close of regular trading on the New York Stock Exchange. When valuing foreign equity securities that meet certain criteria, the Trustees have approved the use of a fair value service that values such securities to reflect market trading that occurs after the close of the applicable foreign markets of comparable securities or other instruments that have a strong correlation to the fair-valued securities. Investments for which valuations or market quotations are not readily available are valued at fair value using methods determined in good faith by or at the direction of the Trustees of the Portfolio considering relevant factors, data and information including the market value of freely tradable securities of the same class in the principal market on which such securities are normally traded.
The Portfolio may invest in Cash Management Portfolio (Cash Management) and Eaton Vance Cash Collateral Fund, LLC (Cash Collateral Fund), affiliated investment companies managed by Boston Management and Research (BMR) and Eaton Vance Management (EVM), respectively. Cash Management and Cash Collateral Fund normally value their investment securities utilizing the amortized cost valuation technique in accordance with Rule 2a-7 of the 1940 Act. This technique involves initially valuing a portfolio security at its cost and thereafter assuming a constant amortization to maturity of any discount or premium. If amortized cost is determined not to approximate fair value, Cash Management and Cash Collateral Fund may value their investment securities based on available market quotations provided by a pricing service. At October 31, 2008, Cash Collateral Fund valued its investments based on available market quotations.
B Investment Transactions — Investment transactions for financial statement purposes are accounted for on a trade date basis. Realized gains and losses on investments sold are determined on the basis of identified cost.
C Income — Dividend income is recorded on the ex-dividend date for dividends received in cash and/or securities. However, if the ex-dividend date has passed, certain dividends from foreign securities are recorded as the Portfolio is informed of the ex-dividend date. Withholding taxes on foreign dividends and capital gains have been provided for in accordance with the Portfolio's understanding of the applicable countries' tax rules and rates. Interest income is recorded on the basis of interest accrued, adjusted for amortization of premium or accretion of discount.
D Federal Taxes — The Portfolio has elected to be treated as a partnership for federal tax purposes. No provision is made by the Portfolio for federal or state taxes on any taxable income of the Portfolio because each investor in the Portfolio is ultimately responsible for the payment of any taxes on its share of taxable income. Since
24
Tax-Managed Multi-Cap Growth Portfolio as of October 31, 2008
NOTES TO FINANCIAL STATEMENTS CONT'D
at least one of the Portfolio's investors is a regulated investment company that invests all or substantially all of its assets in the Portfolio, the Portfolio normally must satisfy the applicable source of income and diversification requirements (under the Internal Revenue Code) in order for its investors to satisfy them. The Portfolio will allocate, at least annually among its investors, each investor's distributive share of the Portfolio's net investment income, net realized capital gains and any other items of income, gain, loss, deduction or credit.
As of October 31, 2008, the Portfolio had no uncertain tax positions that would require financial statement recognition, de-recognition, or disclosure. Each of the Portfolio's federal tax returns filed in the 3-year period ended October 31, 2008 remains subject to examination by the Internal Revenue Service.
E Expense Reduction — State Street Bank and Trust Company (SSBT) serves as custodian of the Portfolio. Pursuant to the custodian agreement, SSBT receives a fee reduced by credits, which are determined based on the average daily cash balance the Portfolio maintains with SSBT. All credit balances, if any, used to reduce the Portfolio's custodian fees are reported as a reduction of expenses in the Statement of Operations.
F Foreign Currency Translation — Investment valuations, other assets, and liabilities initially expressed in foreign currencies are translated each business day into U.S. dollars based upon current exchange rates. Purchases and sales of foreign investment securities and income and expenses denominated in foreign currencies are translated into U.S. dollars based upon currency exchange rates in effect on the respective dates of such transactions. Recognized gains or losses on investment transactions attributable to changes in foreign currency exchange rates are recorded for financial statement purposes as net realized gains and losses on investments. That portion of unrealized gains and losses on investments that results from fluctuations in foreign currency exchange rates is not separately disclosed.
G Use of Estimates — The preparation of the financial statements in conformity with accounting principles generally accepted in the United States of America requires management to make estimates and assumptions that affect the reported amounts of assets and liabilities at the date of the financial statements and the reported amounts of income and expense during the reporting period. Actual results could differ from those estimates.
H Indemnifications — Under the Portfolio's organizational documents, its officers and Trustees may be indemnified against certain liabilities and expenses arising out of the performance of their duties to the Portfolio. Interestholders in the Portfolio are jointly and severally liable for the liabilities and obligations of the Portfolio in the event that the Portfolio fails to satisfy such liabilities and obligations; provided, however, that, to the extent assets are available in the Portfolio, the Portfolio may, under certain circumstances, indemnify interestholders from and against any claim or liability to which such holder may become subject by reason of being or having been an interestholder in the Portfolio. Additionally, in the normal course of business, the Portfo lio enters into agreements with service providers that may contain indemnification clauses. The Portfolio's maximum exposure under these arrangements is unknown as this would involve future claims that may be made against the Portfolio that have not yet occurred.
2 Investment Adviser Fee and Other Transactions with Affiliates
The investment adviser fee is earned by BMR, a subsidiary of EVM, as compensation for investment advisory services rendered to the Portfolio. The fee is computed at the annual rate of 0.65% of the Portfolio's average daily net assets up to $500 million and at reduced rates as daily net assets exceed that level, and is payable monthly. The portion of the adviser fee payable by Cash Management on the Portfolio's investment of cash therein is credited against the Portfolio's adviser fee. For the year ended October 31, 2008, the Portfolio's adviser fee totaled $1,311,402 of which $53,685 was allocated from Cash Management and $1,257,717 was paid or accrued directly by the Portfolio.
Except for Trustees of the Portfolio who are not members of EVM's or BMR's organizations, officers and Trustees receive remuneration for their services to the Portfolio out of the investment adviser fee. Trustees of the Portfolio who are not affiliated with the investment adviser may elect to defer receipt of all or a percentage of their annual fees in accordance with the terms of the Trustees Deferred Compensation Plan. For the year ended October 31, 2008, no significant amounts have been deferred. Certain officers and Trustees of the Portfolio are officers of the above organizations.
3 Purchases and Sales of Investments
Purchases and sales of investments, other than short-term obligations, aggregated $590,987,584 and $547,101,376, respectively, for the year ended October 31, 2008.
25
Tax-Managed Multi-Cap Growth Portfolio as of October 31, 2008
NOTES TO FINANCIAL STATEMENTS CONT'D
4 Federal Income Tax Basis of Investments
The cost and unrealized appreciation (depreciation) of investments of the Portfolio at October 31, 2008, as determined on a federal income tax basis, were as follows:
| Aggregate cost | | $ | 195,851,200 | | |
| Gross unrealized appreciation | | $ | 5,645,718 | | |
| Gross unrealized depreciation | | | (21,156,483 | ) | |
| Net unrealized depreciation | | $ | (15,510,765 | ) | |
5 Line of Credit
The Portfolio participates with other portfolios and funds managed by EVM and its affiliates in a $450 million unsecured line of credit agreement with a group of banks. Borrowings are made by the Portfolio solely to facilitate the handling of unusual and/or unanticipated short-term cash requirements. Interest is charged to the Portfolio based on its borrowings at an amount above either the Eurodollar rate or Federal Funds rate. In addition, a fee computed at an annual rate of 0.10% on the daily unused portion of the line of credit is allocated among the participating portfolios and funds at the end of each quarter. The Portfolio did not have any significant borrowings or allocated fees during the year ended October 31, 2008.
6 Securities Lending Agreement
The Portfolio has established a securities lending agreement with SSBT as securities lending agent in which the Portfolio lends portfolio securities to qualified borrowers in exchange for collateral consisting of either cash or U.S. Government securities in an amount at least equal to the market value of the securities on loan. Cash collateral is invested in Cash Collateral Fund. The Portfolio earns interest on the amount invested in Cash Collateral Fund but it must pay the broker a loan rebate fee computed as a varying percentage of the collateral received. The loan rebate fee paid by the Portfolio amounted to $810,960 for the year ended October 31, 2008. At October 31, 2008, the value of the securities loaned and the value of the collateral received amounted to $32,087,517 and $33,740,571, respectively. In the event of counterparty default, the Portfolio is subject to potential loss if it is delayed or prevented from exercisin g its right to dispose of the collateral. The Portfolio bears risk in the event that invested collateral is not sufficient to meet obligations due on loans.
7 Recently Issued Accounting Pronouncement
In September 2006, the Financial Accounting Standards Board issued Statement of Financial Accounting Standards No. 157 (FAS 157), "Fair Value Measurements". FAS 157 defines fair value, establishes a framework for measuring fair value in accordance with accounting principles generally accepted in the United States of America and expands disclosure about fair value measurements. FAS 157 is effective for fiscal years beginning after November 15, 2007. As of October 31, 2008, management does not believe the adoption of FAS 157 will impact the amounts reported in the financial statements; however, additional disclosures may be required about the inputs used to develop the measurements of fair value and the effect of certain of the measurements on changes in net assets for the period.
26
Tax-Managed Multi-Cap Growth Portfolio as of October 31, 2008
REPORT OF INDEPENDENT REGISTERED PUBLIC ACCOUNTING FIRM
To the Trustees and Investors of
Tax-Managed Multi-Cap Growth Portfolio:
We have audited the accompanying statement of assets and liabilities of Tax-Managed Multi-Cap Growth Portfolio (the "Portfolio"), including the portfolio of investments, as of October 31, 2008, and the related statement of operations for the year then ended, the statements of changes in net assets for each of the two years in the period then ended, and the supplementary data for each of the five years in the period then ended. These financial statements and supplementary data are the responsibility of the Portfolio's management. Our responsibility is to express an opinion on these financial statements and supplementary data based on our audits.
We conducted our audits in accordance with standards of the Public Company Accounting Oversight Board (United States). Those standards require that we plan and perform the audit to obtain reasonable assurance about whether the financial statements and supplementary data are free of material misstatement. The Portfolio is not required to have, nor were we engaged to perform, an audit of its internal control over financial reporting. Our audits included consideration of internal control over financial reporting as a basis for designing audit procedures that are appropriate in the circumstances, but not for the purpose of expressing an opinion on the effectiveness of the Portfolio's internal control over financial reporting. Accordingly, we express no such opinion. An audit also includes examining, on a test basis, evidence supporting the amounts and disclosures in the financial statements, assessing the accounting principles used and significant estimates made by management, as well as evaluating the overall financial statement presentation. Our procedures included confirmation of securities owned as of October 31, 2008, by correspondence with the custodian and brokers; where replies were not received from brokers, we performed other auditing procedures. We believe that our audits provide a reasonable basis for our opinion.
In our opinion, the financial statements and supplementary data referred to above present fairly, in all material respects, the financial position of Tax-Managed Multi-Cap Growth Portfolio as of October 31, 2008, the results of its operations for the year then ended, the changes in its net assets for each of the two years in the period then ended, and the supplementary data for each of the five years in the period then ended, in conformity with accounting principles generally accepted in the United States of America.
DELOITTE & TOUCHE LLP
Boston, Massachusetts
December 15, 2008
27
Eaton Vance Tax-Managed Multi-Cap Growth Fund
Tax-Managed Multi-Cap Growth Portfolio
SPECIAL MEETING OF SHAREHOLDERS (Unaudited)
Eaton Vance Tax-Managed Multi-Cap Growth Fund
The Fund held a Special Meeting of Shareholders on November 14, 2008 to elect Trustees. The results of the vote were as follows:
| | | Number of Shares | |
| Nominee for Trustee | | For | | Withheld | |
| Benjamin C. Esty | | | 8,260,726 | | | | 72,649 | | |
| Thomas E. Faust Jr. | | | 8,327,372 | | | | 96,003 | | |
| Allen R. Freedman | | | 8,236,381 | | | | 96,994 | | |
| William H. Park | | | 8,257,481 | | | | 75,894 | | |
| Ronald A. Pearlman | | | 8,256,947 | | | | 76,428 | | |
| Helen Frame Peters | | | 8,256,718 | | | | 76,657 | | |
| Heidi L. Steiger | | | 8,256,156 | | | | 77,219 | | |
| Lynn A. Stout | | | 8,256,504 | | | | 76,871 | | |
| Ralph F. Verni | | | 8,253,464 | | | | 79,992 | | |
Each nominee was also elected a Trustee of the Portfolio.
Tax-Managed Multi-Cap Growth Portfolio
The Portfolio held a Special Meeting of Interestholders on November 14, 2008 to elect Trustees. The results of the vote were as follows:
| | | Interest in the Portfolio | |
| Nominee for Trustee | | For | | Withheld | |
| Benjamin C. Esty | | | 99 | % | | | 1 | % | |
| Thomas E. Faust Jr. | | | 99 | % | | | 1 | % | |
| Allen R. Freedman | | | 99 | % | | | 1 | % | |
| William H. Park | | | 99 | % | | | 1 | % | |
| Ronald A. Pearlman | | | 99 | % | | | 1 | % | |
| Helen Frame Peters | | | 99 | % | | | 1 | % | |
| Heidi L. Steiger | | | 99 | % | | | 1 | % | |
| Lynn A. Stout | | | 99 | % | | | 1 | % | |
| Ralph F. Verni | | | 99 | % | | | 1 | % | |
Results are rounded to the nearest whole number.
28
Eaton Vance Tax-Managed Multi-Cap Growth Fund
BOARD OF TRUSTEES' ANNUAL APPROVAL OF THE INVESTMENT ADVISORY AGREEMENT
Overview of the Contract Review Process
The Investment Company Act of 1940, as amended (the "1940 Act"), provides, in substance, that each investment advisory agreement between a fund and its investment adviser will continue in effect from year to year only if its continuance is approved at least annually by the fund's board of trustees, including by a vote of a majority of the trustees who are not "interested persons" of the fund ("Independent Trustees"), cast in person at a meeting called for the purpose of considering such approval.
At a meeting of the Boards of Trustees (each a "Board") of the Eaton Vance group of mutual funds (the "Eaton Vance Funds") held on April 21, 2008, the Board, including a majority of the Independent Trustees, voted to approve continuation of existing advisory and sub-advisory agreements for the Eaton Vance Funds for an additional one-year period. In voting its approval, the Board relied upon the affirmative recommendation of the Contract Review Committee of the Board (formerly the Special Committee), which is a committee comprised exclusively of Independent Trustees. Prior to making its recommendation, the Contract Review Committee reviewed information furnished for a series of meetings of the Contract Review Committee held in February, March and April 2008. Such information included, among other things, the following:
Information about Fees, Performance and Expenses
• An independent report comparing the advisory and related fees paid by each fund with fees paid by comparable funds;
• An independent report comparing each fund's total expense ratio and its components to comparable funds;
• An independent report comparing the investment performance of each fund to the investment performance of comparable funds over various time periods;
• Data regarding investment performance in comparison to relevant peer groups of funds and appropriate indices;
• Comparative information concerning fees charged by each adviser for managing other mutual funds and institutional accounts using investment strategies and techniques similar to those used in managing the fund;
• Profitability analyses for each adviser with respect to each fund;
Information about Portfolio Management
• Descriptions of the investment management services provided to each fund, including the investment strategies and processes employed, and any changes in portfolio management processes and personnel;
• Information concerning the allocation of brokerage and the benefits received by each adviser as a result of brokerage allocation, including information concerning the acquisition of research through "soft dollar" benefits received in connection with the funds' brokerage, and the implementation of a soft dollar reimbursement program established with respect to the funds;
• Data relating to portfolio turnover rates of each fund;
• The procedures and processes used to determine the fair value of fund assets and actions taken to monitor and test the effectiveness of such procedures and processes;
Information about each Adviser
• Reports detailing the financial results and condition of each adviser;
• Descriptions of the qualifications, education and experience of the individual investment professionals whose responsibilities include portfolio management and investment research for the funds, and information relating to their compensation and responsibilities with respect to managing other mutual funds and investment accounts;
• Copies of the Codes of Ethics of each adviser and its affiliates, together with information relating to compliance with and the administration of such codes;
• Copies of or descriptions of each adviser's proxy voting policies and procedures;
• Information concerning the resources devoted to compliance efforts undertaken by each adviser and its affiliates on behalf of the funds (including descriptions of various compliance programs) and their record of compliance with investment policies and restrictions, including policies with respect to market-timing, late trading and selective portfolio disclosure, and with policies on personal securities transactions;
• Descriptions of the business continuity and disaster recovery plans of each adviser and its affiliates;
Other Relevant Information
• Information concerning the nature, cost and character of the administrative and other non-investment management services provided by Eaton Vance Management and its affiliates;
• Information concerning management of the relationship with the custodian, subcustodians and fund accountants by each adviser or the funds' administrator; and
• The terms of each advisory agreement.
29
Eaton Vance Tax-Managed Multi-Cap Growth Fund
BOARD OF TRUSTEES' ANNUAL APPROVAL OF THE INVESTMENT ADVISORY AGREEMENT CONT'D
In addition to the information identified above, the Contract Review Committee considered information provided from time to time by each adviser throughout the year at meetings of the Board and its committees. Over the course of the twelve-month period ended April 30, 2008, the Board met eleven times and the Contract Review Committee, the Audit Committee and the Governance Committee, each of which is a Committee comprised solely of Independent Trustees, met twelve, seven and five times, respectively. At such meetings, the Trustees received, among other things, presentations by the portfolio managers and other investment professionals of each adviser relating to the investment performance of each fund and the investment strategies used in pursuing the fund's investment objective. The Portfolio Management Committee and the Compliance Reports and Regulatory Matters Committee are newly established and did not meet during the twelve- month period ended April 30, 2008.
For funds that invest through one or more underlying portfolios, the Board considered similar information about the portfolio(s) when considering the approval of advisory agreements. In addition, in cases where the fund's investment adviser has engaged a sub-adviser, the Board considered similar information about the sub-adviser when considering the approval of any sub-advisory agreement.
The Contract Review Committee was assisted throughout the contract review process by Goodwin Procter LLP, legal counsel for the Independent Trustees. The members of the Contract Review Committee relied upon the advice of such counsel and their own business judgment in determining the material factors to be considered in evaluating each advisory and sub-advisory agreement and the weight to be given to each such factor. The conclusions reached with respect to each advisory and sub-advisory agreement were based on a comprehensive evaluation of all the information provided and not any single factor. Moreover, each member of the Contract Review Committee may have placed varying emphasis on particular factors in reaching conclusions with respect to each advisory and sub-advisory agreement.
Results of the Process
Based on its consideration of the foregoing, and such other information as it deemed relevant, including the factors and conclusions described below, the Contract Review Committee concluded that the continuance of the investment advisory agreement of the Tax-Managed Multi-Cap Growth Portfolio (the "Portfolio"), the portfolio in which the Eaton Vance Tax-Managed Multi-Cap Growth Fund (the "Fund") invests, with Boston Management and Research (the "Adviser"), including its fee structure, is in the interests of shareholders and, therefore, the Contract Review Committee recommended to the Board approval of the agreement. The Board accepted the recommendation of the Contract Review Committee as well as the factors considered and conclusions reached by the Contract Review Committee with respect to the agreement. Accordingly, the Board, including a majority of the Independent Trustees, voted to approve continuation of the investment adv isory agreement for the Portfolio.
Nature, Extent and Quality of Services
In considering whether to approve the investment advisory agreement of the Portfolio, the Board evaluated the nature, extent and quality of services provided to the Portfolio by the Adviser.
The Board considered the Adviser's management capabilities and investment process with respect to the types of investments held by the Portfolio, including the education, experience and number of its investment professionals and other personnel who provide portfolio management, investment research, and similar services to the Portfolio. The Board specifically noted the Adviser's in-house equity research capabilities and experience in managing funds that seek to maximize after-tax returns. The Board also took into account the resources dedicated to portfolio management and other services, including the compensation paid to recruit and retain investment personnel, and the time and attention devoted to the Portfolio by senior management.
The Board also reviewed the compliance programs of the Adviser and relevant affiliates thereof. Among other matters, the Board considered compliance and reporting matters relating to personal trading by investment personnel, selective disclosure of portfolio holdings, late trading, frequent trading, portfolio valuation, business continuity and the allocation of investment opportunities. The Board also evaluated the responses of the Adviser and its affiliates to requests from regulatory authorities such as the Securities and Exchange Commission.
The Board considered shareholder and other administrative services provided or managed by Eaton Vance Management and its affiliates, including transfer agency and accounting services. The Board evaluated the benefits to shareholders of investing in a fund that is a part of a large family of funds, including the ability, in many cases, to exchange an investment among different funds without incurring additional sales charges.
After consideration of the foregoing factors, among others, the Board concluded that the nature, extent and quality of services provided by the Adviser, taken as a whole, are appropriate and consistent with the terms of the investment advisory agreement.
30
Eaton Vance Tax-Managed Multi-Cap Growth Fund
BOARD OF TRUSTEES' ANNUAL APPROVAL OF THE INVESTMENT ADVISORY AGREEMENT CONT'D
Fund Performance
The Board compared the Fund's investment performance to a relevant universe of similarly managed funds identified by an independent data provider and appropriate benchmark indices. The Board reviewed comparative performance data for the one-, three- and five-year periods ended September 30, 2007 for the Fund. The Board concluded that performance of the Fund was satisfactory.
Management Fees and Expenses
The Board reviewed contractual investment advisory fee rates, including any administrative fee rates, payable by the Fund (referred to collectively as "management fees"). As part of its review, the Board considered the management fees (including administrative fees) and the Fund's total expense ratio for the year ended September 30, 2007, as compared to a group of similarly managed funds selected by an independent data provider.
After reviewing the foregoing information, and in light of the nature, extent and quality of the services provided by the Adviser, the Board concluded that the management fees charged for advisory and related services and the Fund's total expense ratio are reasonable.
Profitability
The Board reviewed the level of profits realized by the Adviser and relevant affiliates thereof in providing investment advisory and administrative services to the Fund, the Portfolio and all Eaton Vance Funds as a group. The Board considered the level of profits realized without regard to revenue sharing or other payments by the Adviser and its affiliates to third parties in respect of distribution services. The Board also considered other direct or indirect benefits received by the Adviser and its affiliates in connection with its relationship with the Fund and the Portfolio, including the benefits of research services that may be available to the Adviser as a result of securities transactions effected for the Portfolio and other advisory clients.
The Board concluded that, in light of the foregoing factors and the nature, extent and quality of the services rendered, the profits realized by the Adviser and its affiliates are reasonable.
Economies of Scale
In reviewing management fees and profitability, the Board also considered the extent to which the Adviser and its affiliates, on the one hand, and the Fund, on the other hand, can expect to realize benefits from economies of scale as the assets of the Fund and the Portfolio increase. The Board acknowledged the difficulty in accurately measuring the benefits resulting from the economies of scale with respect to the management of any specific fund or group of funds. The Board reviewed data summarizing the increases and decreases in the assets of the Fund and of all Eaton Vance Funds as a group over various time periods, and evaluated the extent to which the total expense ratio of the Fund and the profitability of the Adviser and its affiliates may have been affected by such increases or decreases. Based upon the foregoing, the Board concluded that the benefits from economies of scale are currently being shared equitably by the Adv iser and its affiliates and the Fund. The Board also concluded that, assuming reasonably foreseeable increases in the assets of the Portfolio, the structure of the advisory fee, which includes breakpoints at several asset levels, can be expected to cause the Adviser and its affiliates and the Fund to continue to share such benefits equitably.
31
Eaton Vance Tax-Managed Multi-Cap Growth Fund
MANAGEMENT AND ORGANIZATION
Fund Management. The Trustees of Eaton Vance Mutual Funds Trust (the Trust) and Tax-Managed Multi-Cap Growth Portfolio (the Portfolio) are responsible for the overall management and supervision of the Trust's and Portfolio's affairs. The Trustees and officers of the Trust and the Portfolio are listed below. Except as indicated, each individual has held the office shown or other offices in the same company for the last five years. Trustees and officers of the Trust and the Portfolio hold indefinite terms of office. The "noninterested Trustees" consist of those Trustees who are not "interested persons" of the Trust and the Portfolio, as that term is defined under the 1940 Act. The business address of each Trustee and officer is The Eaton Vance Building, 255 State Street, Boston, Massachusetts 02109. As used below, "EVC" refers to Eaton Vance Corp., "EV" refers to Eaton Vance, Inc., "EVM" refers to Eaton Vance Management, "BMR" refers to Boston Management and Research, "Parametric" refers to Parametric Portfolio Associates and "EVD" refers to Eaton Vance Distributors, Inc. EVC and EV are the corporate parent and trustee, respectively, of EVM and BMR. EVD is the Fund's principal underwriter, the Portfolio's placement agent and wholly-owned subsidiary of EVC. Each officer affiliated with Eaton Vance may hold a position with other Eaton Vance affiliates that is comparable to his or her position with EVM listed below.
Name and
Date of Birth | | Position(s)
with the
Trust and
the Portfolio | | Term of
Office and
Length of
Service | | Principal Occupation(s)
During Past Five Years | | Number of Portfolios
in Fund Complex
Overseen By
Trustee(1) | | Other Directorships Held | |
| Interested Trustee | | | | | | | | | | | | | |
|
| Thomas E. Faust Jr. 5/31/58 | | Trustee and President of the Trust | | Trustee since 2007 and President of the Trust since 2002 | | Chairman, Chief Executive Officer and President of EVC, Director and President of EV, Chief Executive Officer and President of EVM and BMR, and Director of EVD. Trustee and/or Officer of 173 registered investment companies and 4 private companies managed by EVM or BMR. Mr. Faust is an interested person because of his positions with EVM, BMR, EVD, EVC and EV, which are affiliates of the Trust and Portfolio. | | | 173 | | | Director of EVC | |
|
| Noninterested Trustees | | | | | | | | | | | | | |
|
| Benjamin C. Esty 1/2/63 | | Trustee | | Since 2005 | | Roy and Elizabeth Simmons Professor of Business Administration, Harvard University Graduate School of Business Administration. | | | 173 | | | None | |
|
| Allen R. Freedman 4/3/40 | | Trustee | | Since 2007 | | Former Chairman (2002-2004) and a Director (1983-2004) of Systems & Computer Technology Corp. (provider of software to higher education). Formerly, a Director of Loring Ward International (fund distributor) (2005-2007). Formerly, Chairman and a Director of Indus International Inc. (provider of enterprise management software to the power generating industry) (2005-2007). | | | 173 | | | Director of Assurant, Inc. and Stonemor Partners L.P. (owner and operator of cemeteries) | |
|
| William H. Park 9/19/47 | | Trustee | | Since 2003 | | Vice Chairman, Commercial Industrial Finance Corp. (specialty finance company) (since 2006). Formerly, President and Chief Executive Officer, Prizm Capital Management, LLC (investment management firm) (2002-2005). | | | 173 | | | None | |
|
| Ronald A. Pearlman 7/10/40 | | Trustee | | Since 2003 | | Professor of Law, Georgetown University Law Center. | | | 173 | | | None | |
|
| Helen Frame Peters 3/22/48 | | Trustee | | Since 2008 | | Professor of Finance, Carroll School of Management, Boston College (since 2003). Adjunct Professor of Finance, Peking University, Beijing, China (since 2005). Formerly, Dean, Carroll School of Management, Boston College (2000-2003). | | | 173 | | | Director of Federal Home Loan Bank of Boston (a bank for banks) and BJ's Wholesale Clubs (wholesale club retailer); Trustee of SPDR Index Shares Funds and SPDR Series Trust (exchange traded funds) | |
|
32
Eaton Vance Tax-Managed Multi-Cap Growth Fund
MANAGEMENT AND ORGANIZATION CONT'D
Name and
Date of Birth | | Position(s)
with the
Trust and
the Portfolio | | Term of
Office and
Length of
Service | | Principal Occupation(s)
During Past Five Years | | Number of Portfolios
in Fund Complex
Overseen By
Trustee(1) | | Other Directorships Held | |
| Noninterested Trustees (continued) | | | | | | | | | | | | | |
|
| Heidi L. Steiger 7/8/53 | | Trustee | | Since 2007 | | Managing Partner, Topridge Associates LLC (global wealth management firm) (since 2008); Senior Advisor (since 2008), President (2005-2008), Lowenhaupt Global Advisors, LLC (global wealth management firm). Formerly, President and Contributing Editor, Worth Magazine (2004-2005). Formerly, Executive Vice President and Global Head of Private Asset Management (and various other positions), Neuberger Berman (investment firm) (1986-2004). | | | 173 | | | Director of Nuclear Electric Insurance Ltd. (nuclear insurance provider) and Aviva USA (insurance provider) | |
|
| Lynn A. Stout 9/14/57 | | Trustee | | Of the Trust since 1998 and of the Portfolio since 2000 | | Paul Hastings Professor of Corporate and Securities Law (since 2006) and Professor of Law (2001-2006), University of California at Los Angeles School of Law. | | | 173 | | | None | |
|
| Ralph F. Verni 1/26/43 | | Chairman of the Board and Trustee | | Chairman of the Board since 2007 and Trustee since 2005 | | Consultant and private investor. | | | 173 | | | None | |
|
Principal Officers who are not Trustees
Name and
Date of Birth | | Position(s)
with the
Trust and
the Portfolio | | Term of
Office and
Length of
Service | | Principal Occupation(s)
During Past Five Years | |
| William H. Ahern, Jr. 7/28/59 | | Vice President of the Trust | | Since 1995 | | Vice President of EVM and BMR. Officer of 75 registered investment companies managed by EVM or BMR. | |
|
| John R. Baur 2/10/70 | | Vice President of the Trust | | Since 2007 | | Vice President of EVM and BMR. Previously, attended Johnson Graduate School of Management, Cornell University (2002-2005), and prior thereto he was an Account Team Representative in Singapore for Applied Materials, Inc. Officer of 33 registered investment companies managed by EVM or BMR. | |
|
| Michael A. Cirami 12/24/75 | | Vice President of the Trust | | Since 2007 | | Vice President of EVM and BMR. Previously, attended the University of Rochester William E. Simon Graduate School of Business Administration (2001-2003), and prior thereto he was a Team Leader for the Institutional Services Group for State Street Bank in Luxembourg. Officer of 33 registered investment companies managed by EVM or BMR. | |
|
| Cynthia J. Clemson 3/2/63 | | Vice President of the Trust | | Since 2005 | | Vice President of EVM and BMR. Officer of 90 registered investment companies managed by EVM or BMR. | |
|
| Arieh Coll 11/9/63 | | Vice President of the Portfolio | | Since 2000 | | Vice President of EVM and BMR. Officer of 4 registered investment companies managed by EVM or BMR. | |
|
| Charles B. Gaffney 12/4/72 | | Vice President of the Trust | | Since 2007 | | Vice President of EVM and BMR. Previously, Sector Portfolio Manager and Senior Equity Analyst of Brown Brothers Harriman (1997-2003). Officer of 30 registered investment companies managed by EVM or BMR. | |
|
| Christine M. Johnston 11/9/72 | | Vice President of the Trust | | Since 2007 | | Vice President of EVM and BMR. Officer of 35 registered investment companies managed by EVM or BMR. | |
|
| Aamer Khan 6/7/60 | | Vice President of the Trust | | Since 2005 | | Vice President of EVM and BMR. Officer of 33 registered investment companies managed by EVM or BMR. | |
|
| Thomas H. Luster 4/8/62 | | Vice President of the Trust | | Since 2006 | | Vice President of EVM and BMR. Officer of 51 registered investment companies managed by EVM or BMR. | |
|
33
Eaton Vance Tax-Managed Multi-Cap Growth Fund
MANAGEMENT AND ORGANIZATION CONT'D
Name and
Date of Birth | | Position(s)
with the
Trust and
the Portfolio | | Term of
Office and
Length of
Service | | Principal Occupation(s)
During Past Five Years | |
| Principal Officers who are not Trustees (continued) | | | | | | | |
|
| Robert B. MacIntosh 1/22/57 | | Vice President of the Trust | | Since 1998 | | Vice President of EVM and BMR. Officer of 90 registered investment companies managed by EVM or BMR. | |
|
| Duncan W. Richardson 10/26/57 | | Vice President of the Trust and President of the Portfolio | | Vice President of the Trust since 2001 and President of the Portfolio since 2002 | | Executive Vice President and Chief Equity Investment Officer of EVC, EVM and BMR. Officer of 81 registered investment companies managed by EVM or BMR. | |
|
| Judith A. Saryan 8/21/54 | | Vice President of the Trust | | Since 2003 | | Vice President of EVM and BMR. Officer of 55 registered investment companies managed by EVM or BMR. | |
|
| Susan Schiff 3/13/61 | | Vice President of the Trust | | Since 2002 | | Vice President of EVM and BMR. Officer of 36 registered investment companies managed by EVM or BMR. | |
|
| Thomas Seto 9/27/62 | | Vice President of the Trust | | Since 2007 | | Vice President and Director of Portfolio Management of Parametric. Officer of 31 registered investment companies managed by EVM or BMR. | |
|
| David M. Stein 5/4/51 | | Vice President of the Trust | | Since 2007 | | Managing Director and Chief Investment Officer of Parametric. Officer of 31 registered investment companies managed by EVM or BMR. | |
|
| Mark S. Venezia 5/23/49 | | Vice President of the Trust | | Since 2007 | | Vice President of EVM and BMR. Officer of 36 registered investment companies managed by EVM or BMR. | |
|
| Adam A. Weigold 3/22/75 | | Vice President of the Trust | | Since 2007 | | Vice President of EVM and BMR. Officer of 71 registered investment companies managed by EVM or BMR. | |
|
| Barbara E. Campbell 6/19/57 | | Treasurer | | Of the Trust since 2005 and of the Portfolio since 2008(2) | | Vice President of EVM and BMR. Officer of 173 registered investment companies managed by EVM or BMR. | |
|
| Maureen A. Gemma 5/24/60 | | Secretary and Chief Legal Officer | | Secretary since 2007 and Chief Legal Officer since 2008 | | Vice President of EVM and BMR. Officer of 173 registered investment companies managed by EVM or BMR. | |
|
| Paul M. O'Neil 7/11/53 | | Chief Compliance Officer | | Since 2004 | | Vice President of EVM and BMR. Officer of 173 registered investment companies managed by EVM or BMR. | |
|
(1) Includes both master and feeder funds in a master-feeder structure.
(2) Prior to 2008, Ms. Campbell served as Assistant Treasurer of the Portfolio since 2000.
The SAI for the Fund includes additional information about the Trustees and officers of the Fund and the Portfolio and can be obtained without charge on Eaton Vance's website at www.eatonvance.com or by calling 1-800-262-1122.
34
This Page Intentionally Left Blank
This Page Intentionally Left Blank
Investment Adviser of Tax-Managed Multi-Cap Growth Portfolio
Boston Management and Research
The Eaton Vance Building
255 State Street
Boston, MA 02109
Administrator of Eaton Vance Tax-Managed Multi-Cap Growth Fund
Eaton Vance Management
The Eaton Vance Building
255 State Street
Boston, MA 02109
Principal Underwriter
Eaton Vance Distributors, Inc.
The Eaton Vance Building
255 State Street
Boston, MA 02109
(617) 482-8260
Custodian
State Street Bank and Trust Company
200 Clarendon Street
Boston, MA 02116
Transfer Agent
PNC Global Investment Servicing
Attn: Eaton Vance Funds
P.O. Box 9653
Providence, RI 02940-9653
(800) 262-1122
Independent Registered Public Accounting Firm
Deloitte & Touche LLP
200 Berkeley Street
Boston, MA 02116-5022
Eaton Vance Tax-Managed Multi-Cap Growth Fund
The Eaton Vance Building
255 State Street
Boston, MA 02109
This report must be preceded or accompanied by a current prospectus. Before investing, investors should consider carefully the Fund's investment objective(s), risks, and charges and expenses. The Fund's current prospectus contains this and other information about the Fund and is available through your financial advisor. Please read the prospectus carefully before you invest or send money. For further information please call 1-800-262-1122.
824-12/08 TMCAPSRC

Annual Report October 31, 2008


EATON VANCE
TAX-MANAGED
SMALL-CAP
FUND
IMPORTANT NOTICES REGARDING PRIVACY,
DELIVERY OF SHAREHOLDER DOCUMENTS,
PORTFOLIO HOLDINGS AND PROXY VOTING
Privacy. The Eaton Vance organization is committed to ensuring your financial privacy. Each of the financial institutions identified below has in effect the following policy ("Privacy Policy") with respect to nonpublic personal information about its customers:
• Only such information received from you, through application forms or otherwise, and information about your Eaton Vance fund transactions will be collected. This may include information such as name, address, social security number, tax status, account balances and transactions.
• None of such information about you (or former customers) will be disclosed to anyone, except as permitted by law (which includes disclosure to employees necessary to service your account). In the normal course of servicing a customer's account, Eaton Vance may share information with unaffiliated third parties that perform various required services such as transfer agents, custodians and broker/dealers.
• Policies and procedures (including physical, electronic and procedural safeguards) are in place that are designed to protect the confidentiality of such information.
• We reserve the right to change our Privacy Policy at any time upon proper notification to you. Customers may want to review our Policy periodically for changes by accessing the link on our homepage: www.eatonvance.com.
Our pledge of privacy applies to the following entities within the Eaton Vance organization: the Eaton Vance Family of Funds, Eaton Vance Management, Eaton Vance Investment Counsel, Boston Management and Research, and Eaton Vance Distributors, Inc.
In addition, our Privacy Policy only applies to those Eaton Vance customers who are individuals and who have a direct relationship with us. If a customer's account (i.e., fund shares) is held in the name of a third-party financial adviser/broker-dealer, it is likely that only such adviser's privacy policies apply to the customer. This notice supersedes all previously issued privacy disclosures.
For more information about Eaton Vance's Privacy Policy, please call 1-800-262-1122.
Delivery of Shareholder Documents. The Securities and Exchange Commission ("the SEC") permits funds to deliver only one copy of shareholder documents, including prospectuses, proxy statements and shareholder reports, to fund investors with multiple accounts at the same residential or post office box address. This practice is often called "householding" and it helps eliminate duplicate mailings to shareholders.
Eaton Vance, or your financial adviser, may household the mailing of your documents indefinitely unless you instruct Eaton Vance, or your financial adviser, otherwise.
If you would prefer that your Eaton Vance documents not be householded, please contact Eaton Vance at 1-800-262-1122, or contact your financial adviser.
Your instructions that householding not apply to delivery of your Eaton Vance documents will be effective within 30 days of receipt by Eaton Vance or your financial adviser.
Portfolio Holdings. Each Eaton Vance Fund and its underlying Portfolio (if applicable) will file a schedule of its portfolio holdings on Form N-Q with the SEC for the first and third quarters of each fiscal year. The Form N-Q will be available on the Eaton Vance website www.eatonvance.com, by calling Eaton Vance at 1-800-262-1122 or in the EDGAR database on the SEC's website at www.sec.gov. Form N-Q may also be reviewed and copied at the SEC's public reference room in Washington, D.C. (call 1-800-732-0330 for information on the operation of the public reference room).
Proxy Voting. From time to time, funds are required to vote proxies related to the securities held by the funds. The Eaton Vance Funds or their underlying Portfolios (if applicable) vote proxies according to a set of policies and procedures approved by the Funds' and Portfolios' Boards. You may obtain a description of these policies and procedures and information on how the Funds or Portfolios voted proxies relating to portfolio securities during the most recent 12 month period ended June 30, without charge, upon request, by calling 1-800-262-1122. This description is also available on the SEC's website at www.sec.gov.
Eaton Vance Tax-Managed Small-Cap Fund as of October 31, 2008
MANAGEMENT’S DISCUSSION OF FUND PERFORMANCE
Economic and Market Conditions

Nancy Tooke, CFA,
Portfolio Manager
· The stock market moved dramatically lower during the year that ended October 31, 2008. After reaching record highs in October 2007, the major market indices began to decline at the end of 2007 as investors realized that the difficulties in subprime lending and the troubled housing market were likely to slow the economy significantly. By the summer of 2008, the magnitude of the damage became increasingly apparent. Many banks were faced with enormous write-offs from bad real estate loans, losses that severely impaired their overall lending capacity. As the market declined further, investor and consumer sentiment worsened. That trend was accelerated by soaring energy prices, as oil hit $145 per barrel in July 2008 and pinched consumers even more. The failure of Lehman Brothers in September 2008 and the tenuous condition of other capital-starved banks and financial institutions sparked fears of a global financial collapse. In late September 2008, in an effort to jump-start lending, the U.S. Treasury department unveiled a controversial proposal to purchase troubled loans from banks and financial institutions. Congress’s initial rejection of the plan sent the market into a near-freefall. A revised version of the measure was subsequently approved by Congress, and was followed by a coordinated effort by the world’s central banks to inject liquidity into the global banking system. While those actions reassured many investors, volatility remained high as the one-year period drew to a close.
· For the year ended October 31, 2008, all ten sectors within the S&P SmallCap 600 Index registered negative returns. The utilities sector was, by far, the best performing sector, posting a small loss for the year. Consumer staples was also able to somewhat limit its losses for the year. The telecommunications services, consumer discretionary, information technology, energy, industrials and financial sectors all suffered severe declines. Market-leading industries during the year included pharmaceuticals, gas utilities and food staples, which were among a handful of industries to post positive returns. In contrast, automobiles, metals and mining, diversified telecommunications, textiles and real estate management were the year’s worst performing industries.(1)
Management Discussion
· Effective September 1, 2008, the Fund(2) changed its name to Eaton Vance Tax-Managed Small-Cap Fund.
· The Fund slightly underperformed its benchmark – the S&P SmallCap 600 Index – for the year ended October 31, 2008.(1) In a period of extraordinary market volatility, a weaker economy and growing concern over global financial stability, the Fund was hurt by investors’ shift away from small-cap stocks and into established, large-cap companies.
· The Fund’s industrials sector investments detracted most significantly from performance. Although some of these companies were able to register continuing earnings growth, the stocks performed poorly due to a deteriorating economic outlook. Machinery manufacturers were a prime example, as the weaker economy raised concerns about demand for industrial, mining and transportation equipment. Railroads also performed badly, as the slower economy resulted in lower freightloads.
· An overweighting in the energy sector was a drag on performance, with energy equipment and services companies notably weak. Engineering and construction companies specializing in energy projects lost
Eaton Vance Tax-Managed Small-Cap Fund
Total Return Performance 10/31/07 – 10/31/08
Class A(3) | | -34.70 | % |
Class B(3) | | -35.12 | |
Class C(3) | | -35.17 | |
S&P SmallCap 600 Index(1) | | -32.44 | |
Russell 2000 Index(1) | | -34.16 | |
Lipper Small-Cap Growth Funds Average(1) | | -42.01 | |
See pages 3 and 4 for more performance information, including after-tax returns.
(1) It is not possible to invest directly in an Index or a Lipper Classification. The Indices’ total returns do not reflect commissions or expenses that would have been incurred if an investor individually purchased or sold the securities represented in the Indices. The Lipper total return is the average total return, at net asset value, of the funds that are in the same Lipper Classification as the Fund.
(2) The Fund currently invests in a separate registered investment company, Tax-Managed Small-Cap Portfolio (formerly Tax-Managed Small-Cap Growth Portfolio), with the same objective and policies as the Fund. References to investments are to the Portfolio’s holdings.
(3) These returns do not include the 5.75% maximum sales charge for Class A shares or the applicable contingent deferred sales charge (CDSC) for Class B and Class C shares. If sales charges were deducted, the returns would be lower.
Past performance is no guarantee of future results. Returns are historical and are calculated by determining the percentage change in net asset value or offering price (as applicable) with all distributions reinvested. Investment return and principal value will fluctuate so that shares, when redeemed, may be worth more or less than their original cost. Performance is for stated time period only; due to market volatility, the Fund’s current performance may be lower or higher than the quoted return. For performance as of the most recent month end, please refer to www.eatonvance.com.
Fund shares are not insured by the FDIC and are not deposits or other obligations of, or guaranteed by, any depository institution. Shares are subject to investment risks, including possible loss of principal invested.
1
ground, as customers scaled back their near-term capital spending plans. A manufacturer of equipment and systems used in offshore drilling declined sharply, as some major projects were disrupted by a busy hurricane season.
· The Fund remained significantly underweighted in the troubled financial sector, where the Fund’s investments turned in a mixed performance. Commercial banks fared poorly amid still-rising loan loss provisions, while asset managers suffered from a sharp decline in equity assets under management following the stock market decline. On a more positive note, the Fund’s insurance investments benefited from takeover activity, while diversified financial companies were less severely impacted by the credit crisis.
· The Fund’s performance for the year ended October 31, 2008 was helped by an underweighting in the consumer discretionary sector, where media and luxury goods investments turned in especially weak performances. However, the sector also featured some of the Fund’s best performers. The Fund’s investments in discount retailers performed well, including a company that specializes in selling closeout merchandize and excess inventories. While not entirely immune from the softening retail trends, these companies’ sales volumes held up better than more economically-sensitive mass market retailers.
· The Fund’s performance was helped by stock selection in the consumer staples sector. Sales of food, beverages and household and consumer product companies, whose products represent non-discretionary purchases, withstood the twin hurdles of rising energy prices and plunging home values. Investments in household product companies also performed well, as the companies’ revenue growth was boosted by pricing flexibility and new product introductions. Other consumer staples investments benefited from an exposure to expanding foreign markets, reflecting a growing consumer appetite in emerging economies for products like premium brand beverages and nutritional supplements.
Portfolio Composition
Top Ten Holdings(1)
By net assets
Chattem, Inc. | | 2.4 | % |
Gildan Activewear, Inc. | | 2.3 | |
Church & Dwight Co., Inc. | | 2.2 | |
Perrigo Co. | | 2.1 | |
Cullen/Frost Bankers, Inc. | | 2.1 | |
Ralcorp Holdings, Inc. | | 2.1 | |
Dollar Tree, Inc. | | 2.0 | |
FLIR Systems, Inc. | | 1.8 | |
Verigy, Ltd. | | 1.8 | |
Landstar System, Inc. | | 1.8 | |
(1) Top Ten Holdings represented 20.6% of the Portfolio’s net assets as of 10/31/08. Excludes cash equivalents.
Sector Weightings(2)
By net assets
(2) As a percentage of the Portfolio’s net assets as of 10/31/08. Excludes cash equivalents.
The views expressed throughout this report are those of the portfolio manager and are current only through the end of the period of the report as stated on the cover. These views are subject to change at any time based upon market or other conditions, and the investment adviser disclaims any responsibility to update such views. These views may not be relied on as investment advice and, because investment decisions for a fund are based on many factors, may not be relied on as an indication of trading intent on behalf of any Eaton Vance fund. Portfolio information provided in the report may not be representative of the Portfolio’s current or future investments and may change due to active management.
2
Eaton Vance Tax-Managed Small-Cap Fund as of October 31, 2008
FUND PERFORMANCE
The line graph and table set forth below provide information about the Fund’s performance. The line graph compares the performance of Class A of the Fund with that of the S&P SmallCap 600 Index, a broad-based, unmanaged market index of 600 small-capitalization stocks traded in the U.S., and the Russell 2000 Index, a market capitalization weighted index of 2,000 small company stocks The lines on the graph represent the total returns of a hypothetical investment of $10,000 in each of Class A, the S&P SmallCap 600 Index and the Russell 2000 Index. Class A total returns are presented at net asset value and maximum public offering price. The table includes the total returns of each Class of the Fund at net asset value and maximum public offering price. The performance presented below does not reflect the deduction of taxes, if any, that a shareholder would pay on distributions or redemptions of Fund shares.
Performance(1)
| | Class A | | Class B | | Class C | |
Share Class Symbol | | ETMGX | | EMMGX | | ECMGX | |
Average Annual Total Returns (at net asset value) | | | | | | | |
One Year | | -34.70 | % | -35.12 | % | -35.17 | % |
Five Years | | 1.82 | % | 1.08 | % | 1.07 | % |
Ten Years | | 1.09 | % | 0.33 | % | 0.31 | % |
Life of Fund† | | 0.47 | % | -0.27 | % | -0.31 | % |
| | | | | | | |
SEC Average Annual Total Returns (including sales charge or applicable CDSC) | | | | | | | |
One Year | | -38.43 | % | -38.36 | % | -35.82 | % |
Five Years | | 0.62 | % | 0.70 | % | 1.07 | % |
Ten Years | | 0.49 | % | 0.33 | % | 0.31 | % |
Life of Fund† | | -0.06 | % | -0.27 | % | -0.31 | % |
†Inception Dates – Class A: 9/25/97; Class B: 9/29/97; Class C: 9/29/97
(1) Average Annual Total Returns do not include the 5.75% maximum sales charge for Class A shares or the applicable contingent deferred sales charge (CDSC) for Class B and Class C shares. If sales charges were deducted, the returns would be lower. SEC Average Annual Total Returns for Class A reflect the maximum 5.75% sales charge. SEC returns for Class B shares reflect the applicable CDSC based on the following schedule: 5% - 1st and 2nd years; 4% - 3rd year; 3% - 4th year; 2% - 5th year; 1% - 6th year. SEC returns for Class C reflect a 1% CDSC for the first year.
Total Annual
Operating Expenses(2)
| | Class A | | Class B | | Class C | |
Expense Ratio | | 1.34 | % | 2.09 | % | 2.09 | % |
(2) Source: Prospectus dated 3/1/08.
Comparison of Change in Value of a $10,000 Investment in Eaton Vance Tax-Managed Small-Cap Fund Class A vs. the S&P SmallCap 600 Index and the Russell 2000 Index*
October 31, 1998 – October 31, 2008
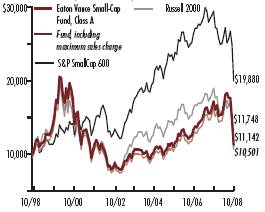
* Source: Lipper Inc. Class A of the Fund commenced investment operations on 9/25/97. A $10,000 hypothetical investment at net asset value in Class B shares and Class C shares on 10/31/98 would have been valued at $10,330 and $10,310, respectively, on 10/31/08. It is not possible to invest directly in an Index. The Indices’ total returns do not reflect commissions or expenses that would have been incurred if an investor individually purchased or sold the securities represented in the Indices.
Past performance is no guarantee of future results. Returns are historical and are calculated by determining the percentage change in net asset value or offering price (as applicable) with all distributions reinvested. Investment return and principal value will fluctuate so that shares, when redeemed, may be worth more or less than their original cost. Performance is for stated time period only; due to market volatility, the Fund’s current performance may be lower or higher than the quoted return. For performance as of the most recent month end, please refer to www.eatonvance.com.
3
Eaton Vance Tax-Managed Small-Cap Fund as of October 31, 2008
FUND PERFORMANCE
“Return Before Taxes” does not take into consideration shareholder taxes. It is most relevant to tax-free or tax-deferred shareholder accounts. “Return After Taxes on Distributions” reflects the impact of federal income taxes due on Fund distributions of dividends and capital gains. It is most relevant to taxpaying shareholders who continue to hold their shares. “Return After Taxes on Distributions and Sale of Fund Shares” also reflects the impact of taxes on capital gain or loss realized upon a sale of shares. It is most relevant to taxpaying shareholders who sell their shares.
Average Annual Total Returns
(For the periods ended October 31, 2008)
Returns at Net Asset Value (NAV) (Class A)
| | One Year | | Five Years | | Ten Years | |
Return Before Taxes | | -34.70 | % | 1.82 | % | 1.09 | % |
Return After Taxes on Distributions | | -34.70 | % | 1.82 | % | 1.09 | % |
Return After Taxes on Distributions and Sale of Fund Shares | | -22.55 | % | 1.56 | % | 0.93 | % |
Returns at Public Offering Price (POP) (Class A)
| | One Year | | Five Years | | Ten Years | |
Return Before Taxes | | -38.43 | % | 0.62 | % | 0.49 | % |
Return After Taxes on Distributions | | -38.43 | % | 0.62 | % | 0.49 | % |
Return After Taxes on Distributions and Sale of Fund shares | | -24.98 | % | 0.53 | % | 0.42 | % |
Average Annual Total Returns
(For the periods ended October 31, 2008)
Returns at Net Asset Value (NAV) (Class B)
| | One Year | | Five Years | | Ten Years | |
Return Before Taxes | | -35.12 | % | 1.08 | % | 0.33 | % |
Return After Taxes on Distributions | | -35.12 | % | 1.08 | % | 0.33 | % |
Return After Taxes on Distributions and Sale of Fund Shares | | -22.83 | % | 0.93 | % | 0.28 | % |
Returns at Public Offering Price (POP) (Class B)
| | One Year | | Five Years | | Ten Years | |
Return Before Taxes | | -38.36 | % | 0.70 | % | 0.33 | % |
Return After Taxes on Distributions | | -38.36 | % | 0.70 | % | 0.33 | % |
Return After Taxes on Distributions and Sale of Fund Shares | | -24.93 | % | 0.60 | % | 0.28 | % |
Average Annual Total Returns
(For the periods ended October 31, 2008)
Returns at Net Asset Value (NAV) (Class C)
| | One Year | | Five Years | | Ten Years | |
Return Before Taxes | | -35.17 | % | 1.07 | % | 0.31 | % |
Return After Taxes on Distributions | | -35.17 | % | 1.07 | % | 0.31 | % |
Return After Taxes on Distributions and Sale of Fund Shares | | -22.86 | % | 0.91 | % | 0.26 | % |
Returns at Public Offering Price (POP) (Class C)
| | One Year | | Five Years | | Ten Years | |
Return Before Taxes | | -35.82 | % | 1.07 | % | 0.31 | % |
Return After Taxes on Distributions | | -35.82 | % | 1.07 | % | 0.31 | % |
Return After Taxes on Distributions and Sale of Fund Shares | | -23.28 | % | 0.91 | % | 0.26 | % |
Class A of the Fund commenced investment operations on 9/25/97, and Class B and Class C of the Fund commenced investment operations on 9/29/97. Returns at Public Offering Price (POP) reflect the deduction of the maximum initial sales charge and applicable CDSC, while Returns at Net Asset Value (NAV) do not.
After-tax returns are calculated using certain assumptions. After-tax returns are calculated using the highest historical individual federal income tax rates and do not reflect the impact of state and local taxes. Actual after-tax returns depend on a shareholder’s tax situation and the actual characterization of distributions and may differ from those shown. After-tax returns are not relevant to shareholders who hold shares in tax-deferred accounts or to shares held by non-taxable entities. Return After Taxes on Distributions for a period may be the same as Return Before Taxes for the same period because no taxable distributions were made during that period. Return After Taxes on Distributions and Sale of Fund Shares for a period may be greater than or equal to Return After Taxes on Distributions for the same period because of losses realized on the sale of Fund shares.
Past performance is no guarantee of future results. Returns are historical and are calculated by determining the percentage change in net asset value or offering price (as applicable) with all distributions reinvested. Investment return and principal value will fluctuate so that shares, when redeemed, may be worth more or less than their original cost. Performance is for the stated time period only; due to market volatility, the Fund’s current performance may be lower or higher than the quoted return. For performance as of the most recent month end, please refer to www.eatonvance.com.
4
Eaton Vance Tax-Managed Small-Cap Fund as of October 31, 2008
FUND EXPENSES
Example: As a shareholder of the Fund, you incur two types of costs: (1) transaction costs, including sales charges (loads) on purchases and redemption fees (if applicable); and (2) ongoing costs, including management fees; distribution or service fees; and other Fund expenses. This Example is intended to help you understand your ongoing costs (in dollars) of investing in the Fund and to compare these costs with the ongoing costs of investing in other mutual funds. The Example is based on an investment of $1,000 invested at the beginning of the period and held for the entire period (May 1, 2008 – October 31, 2008).
Actual Expenses: The first section of the table below provides information about actual account values and actual expenses. You may use the information in this section, together with the amount you invested, to estimate the expenses that you paid over the period. Simply divide your account value by $1,000 (for example, an $8,600 account value divided by $1,000 = 8.6), then multiply the result by the number in the first section under the heading entitled "Expenses Paid During Period" to estimate the expenses you paid on your account during this period.
Hypothetical Example for Comparison Purposes: The second section of the table below provides information about hypothetical account values and hypothetical expenses based on the actual Fund expense ratio and an assumed rate of return of 5% per year (before expenses), which is not the actual return of the Fund. The hypothetical account values and expenses may not be used to estimate the actual ending account balance or expenses you paid for the period. You may use this information to compare the ongoing costs of investing in your Fund and other funds. To do so, compare this 5% hypothetical example with the 5% hypothetical examples that appear in the shareholder reports of the other funds.
Please note that the expenses shown in the table are meant to highlight your ongoing costs only and do not reflect any transactional costs, such as sales charges (loads) or redemption fees (if applicable). Therefore, the second section of the table is useful in comparing ongoing costs only, and will not help you determine the relative total costs of owning different funds. In addition, if these transactional costs were included, your costs would have been higher.
Eaton Vance Tax-Managed Small-Cap Fund
| | | Beginning Account Value
(5/1/08) | | Ending Account Value
(10/31/08) | | Expenses Paid During Period*
(5/1/08 – 10/31/08) | |
| Actual | |
| Class A | | $ | 1,000.00 | | | $ | 679.60 | | | $ | 5.07 | | |
| Class B | | $ | 1,000.00 | | | $ | 677.80 | | | $ | 7.97 | | |
| Class C | | $ | 1,000.00 | | | $ | 677.40 | | | $ | 8.14 | | |
| Hypothetical | |
| (5% return per year before expenses) | |
| Class A | | $ | 1,000.00 | | | $ | 1,019.10 | | | $ | 6.09 | | |
| Class B | | $ | 1,000.00 | | | $ | 1,015.60 | | | $ | 9.58 | | |
| Class C | | $ | 1,000.00 | | | $ | 1,015.40 | | | $ | 9.78 | | |
* Expenses are equal to the Fund's annualized expense ratio of 1.20% for Class A shares, 1.89% for Class B shares and 1.93% for Class C shares multiplied by the average account value over the period, multiplied by 184/366 (to reflect the one-half year period). The Example assumes that the $1,000 was invested at the net asset value per share determined at the close of business on April 30, 2008. The Example reflects the expenses of both the Fund and the Portfolio.
5
Eaton Vance Tax-Managed Small-Cap Fund as of October 31, 2008
FINANCIAL STATEMENTS
Statement of Assets and Liabilities
As of October 31, 2008
| Assets | |
Investment in Tax-Managed Small-Cap Portfolio, at value
(identified cost, $150,746,606) | | $ | 114,894,358 | | |
| Receivable for Fund shares sold | | | 1,860,574 | | |
| Total assets | | $ | 116,754,932 | | |
| Liabilities | |
| Payable for Fund shares redeemed | | $ | 376,545 | | |
| Payable to affiliate for distribution and service fees | | | 49,234 | | |
| Accrued expenses | | | 71,059 | | |
| Total liabilities | | $ | 496,838 | | |
| Net Assets | | $ | 116,258,094 | | |
| Sources of Net Assets | |
| Paid-in capital | | $ | 249,380,863 | | |
Accumulated net realized loss from Portfolio (computed on the basis of
identified cost) | | | (97,270,521 | ) | |
Net unrealized depreciation from Portfolio (computed on the basis of
identified cost) | | | (35,852,248 | ) | |
| Total | | $ | 116,258,094 | | |
| Class A Shares | |
| Net Assets | | $ | 80,868,133 | | |
| Shares Outstanding | | | 7,669,804 | | |
Net Asset Value and Redemption Price Per Share
(net assets ÷ shares of beneficial interest outstanding) | | $ | 10.54 | | |
Maximum Offering Price Per Share
(100 ÷ 94.25 of $10.54) | | $ | 11.18 | | |
| Class B Shares | |
| Net Assets | | $ | 12,352,473 | | |
| Shares Outstanding | | | 1,273,177 | | |
Net Asset Value and Offering Price Per Share*
(net assets ÷ shares of beneficial interest outstanding) | | $ | 9.70 | | |
| Class C Shares | |
| Net Assets | | $ | 23,037,488 | | |
| Shares Outstanding | | | 2,384,167 | | |
Net Asset Value and Offering Price Per Share*
(net assets ÷ shares of beneficial interest outstanding) | | $ | 9.66 | | |
| On sales of $50,000 or more, the offering price of Class A shares is reduced. | |
* Redemption price per share is equal to the net asset value less any applicable contingent deferred sales charge.
Statement of Operations
For the Year Ended
October 31, 2008
| Investment Income | |
| Dividends allocated from Portfolio (net of foreign taxes, $3,004) | | $ | 438,182 | | |
| Interest allocated from Portfolio | | | 170,464 | | |
| Expenses allocated from Portfolio | | | (957,489 | ) | |
| Net investment loss from Portfolio | | $ | (348,843 | ) | |
| Expenses | |
| Trustees' fees and expenses | | $ | 1,485 | | |
Distribution and service fees
Class A | | | 189,093 | | |
| Class B | | | 255,413 | | |
| Class C | | | 291,213 | | |
| Transfer and dividend disbursing agent fees | | | 218,467 | | |
| Printing and postage | | | 41,076 | | |
| Registration fees | | | 39,276 | | |
| Legal and accounting services | | | 26,382 | | |
| Custodian fee | | | 26,090 | | |
| Miscellaneous | | | 12,692 | | |
| Total expenses | | $ | 1,101,187 | | |
| Net investment loss | | $ | (1,450,030 | ) | |
Realized and Unrealized
Gain (Loss) from Portfolio | |
Net realized gain (loss) —
Investment transactions (identified cost basis) | | $ | 3,205,383 | | |
| Foreign currency transactions | | | 2,673 | | |
| Net realized gain | | $ | 3,208,056 | | |
Change in unrealized appreciation (depreciation) —
Investments (identified cost basis) | | $ | (66,399,130 | ) | |
| Net change in unrealized appreciation (depreciation) | | $ | (66,399,130 | ) | |
| Net realized and unrealized loss | | $ | (63,191,074 | ) | |
| Net decrease in net assets from operations | | $ | (64,641,104 | ) | |
See notes to financial statements
6
Eaton Vance Tax-Managed Small-Cap Fund as of October 31, 2008
FINANCIAL STATEMENTS CONT'D
Statements of Changes in Net Assets
Increase (Decrease)
in Net Assets | | Year Ended
October 31, 2008 | | Year Ended
October 31, 2007 | |
From operations —
Net investment loss | | $ | (1,450,030 | ) | | $ | (1,521,019 | ) | |
Net realized gain from investment
and foreign currency transactions | | | 3,208,056 | | | | 14,366,935 | | |
Net change in unrealized appreciation
(depreciation) of investments and
foreign currency | | | (66,399,130 | ) | | | 17,930,513 | | |
Net increase (decrease) in net assets
from operations | | $ | (64,641,104 | ) | | $ | 30,776,429 | | |
Transactions in shares of beneficial interest —
Proceeds from sale of shares
Class A | | $ | 73,684,612 | | | $ | 7,251,380 | | |
| Class B | | | 1,203,596 | | | | 623,643 | | |
| Class C | | | 10,441,118 | | | | 3,430,081 | | |
Cost of shares redeemed
Class A | | | (26,016,142 | ) | | | (10,620,119 | ) | |
| Class B | | | (5,497,834 | ) | | | (9,211,666 | ) | |
| Class C | | | (6,125,683 | ) | | | (5,669,347 | ) | |
Net asset value of shares exchanged
Class A | | | 11,907,223 | | | | 7,697,320 | | |
| Class B | | | (11,907,223 | ) | | | (7,697,320 | ) | |
Net increase (decrease) in net assets from
Fund share transactions | | $ | 47,689,667 | | | $ | (14,196,028 | ) | |
| Net increase (decrease) in net assets | | $ | (16,951,437 | ) | | $ | 16,580,401 | | |
| Net Assets | |
| At beginning of year | | $ | 133,209,531 | | | $ | 116,629,130 | | |
| At end of year | | $ | 116,258,094 | | | $ | 133,209,531 | | |
See notes to financial statements
7
Eaton Vance Tax-Managed Small-Cap Fund as of October 31, 2008
FINANCIAL STATEMENTS CONT'D
Financial Highlights
| | | Class A | |
| | | Year Ended October 31, | |
| | | 2008 | | 2007 | | 2006 | | 2005 | | 2004 | |
| Net asset value — Beginning of year | | $ | 16.140 | | | $ | 12.520 | | | $ | 10.300 | | | $ | 9.470 | | | $ | 9.630 | | |
| Income (loss) from operations | |
| Net investment loss(1) | | $ | (0.120 | ) | | $ | (0.117 | ) | | $ | (0.073 | ) | | $ | (0.105 | ) | | $ | (0.107 | ) | |
| Net realized and unrealized gain (loss) | | | (5.480 | ) | | | 3.737 | | | | 2.293 | | | | 0.935 | | | | (0.053 | ) | |
| Total income (loss) from operations | | $ | (5.600 | ) | | $ | 3.620 | | | $ | 2.220 | | | $ | 0.830 | | | $ | (0.160 | ) | |
| Net asset value — End of year | | $ | 10.540 | | | $ | 16.140 | | | $ | 12.520 | | | $ | 10.300 | | | $ | 9.470 | | |
| Total Return(2) | | | (34.70 | )% | | | 28.91 | % | | | 21.55 | % | | | 8.76 | % | | | (1.66 | )%(3) | |
| Ratios/Supplemental Data | |
| Net assets, end of year (000's omitted) | | $ | 80,868 | | | $ | 65,185 | | | $ | 46,895 | | | $ | 24,855 | | | $ | 30,172 | | |
| Ratios (As a percentage of average daily net assets): | |
| Expenses before custodian fee reduction(4)(5) | | | 1.27 | % | | | 1.34 | % | | | 1.41 | %(6) | | | 1.44 | %(6) | | | 1.37 | % | |
| Net investment loss | | | (0.80 | )% | | | (0.82 | )% | | | (0.63 | )% | | | (1.04 | )% | | | (1.12 | )% | |
| Portfolio Turnover of the Portfolio | | | 93 | % | | | 78 | % | | | 99 | % | | | 223 | % | | | 282 | % | |
(1) Computed using average shares outstanding.
(2) Returns are historical and are calculated by determining the percentage change in net asset value with all distributions reinvested.
(3) The effect of the Fund's net increase from payments by affiliate and net gains (losses), through its investment in the Portfolio, realized on the disposal of investments purchased which did not meet the Portfolio's investment guidelines amounted to less than $0.01 per share and had no effect on total return for the year ended October 31, 2004.
(4) Includes the Fund's share of the Portfolio's allocated expenses.
(5) Excludes the effect of custody fee credits, if any, of less than 0.005%.
(6) The investment adviser waived a portion of its investment adviser fee (equal to less than 0.01% and 0.01% of average daily net assets for the years ended October 31, 2006 and 2005, respectively).
See notes to financial statements
8
Eaton Vance Tax-Managed Small-Cap Fund as of October 31, 2008
FINANCIAL STATEMENTS CONT'D
Financial Highlights
| | | Class B | |
| | | Year Ended October 31, | |
| | | 2008 | | 2007 | | 2006 | | 2005 | | 2004 | |
| Net asset value — Beginning of year | | $ | 14.950 | | | $ | 11.690 | | | $ | 9.680 | | | $ | 8.980 | | | $ | 9.190 | | |
| Income (loss) from operations | |
| Net investment loss(1) | | $ | (0.216 | ) | | $ | (0.205 | ) | | $ | (0.152 | ) | | $ | (0.170 | ) | | $ | (0.170 | ) | |
| Net realized and unrealized gain (loss) | | | (5.034 | ) | | | 3.465 | | | | 2.162 | | | | 0.870 | | | | (0.040 | ) | |
| Total income (loss) from operations | | $ | (5.250 | ) | | $ | 3.260 | | | $ | 2.010 | | | $ | 0.700 | | | $ | (0.210 | ) | |
| Net asset value — End of year | | $ | 9.700 | | | $ | 14.950 | | | $ | 11.690 | | | $ | 9.680 | | | $ | 8.980 | | |
| Total Return(2) | | | (35.12 | )% | | | 27.89 | % | | | 20.76 | % | | | 7.80 | % | | | (2.28 | )%(3) | |
| Ratios/Supplemental Data | |
| Net assets, end of year (000's omitted) | | $ | 12,352 | | | $ | 36,554 | | | $ | 43,053 | | | $ | 47,222 | | | $ | 62,553 | | |
| Ratios (As a percentage of average daily net assets): | |
| Expenses before custodian fee reduction(4)(5) | | | 2.02 | % | | | 2.09 | % | | | 2.16 | %(6) | | | 2.19 | %(6) | | | 2.12 | % | |
| Net investment loss | | | (1.55 | )% | | | (1.56 | )% | | | (1.40 | )% | | | (1.79 | )% | | | (1.87 | )% | |
| Portfolio Turnover of the Portfolio | | | 93 | % | | | 78 | % | | | 99 | % | | | 223 | % | | | 282 | % | |
(1) Computed using average shares outstanding.
(2) Returns are historical and are calculated by determining the percentage change in net asset value with all distributions reinvested.
(3) The effect of the Fund's net increase from payments by affiliate and net gains (losses), through its investment in the Portfolio, realized on the disposal of investments purchased which did not meet the Portfolio's investment guidelines amounted to less than $0.01 per share and had no effect on total return for the year ended October 31, 2004.
(4) Includes the Fund's share of the Portfolio's allocated expenses.
(5) Excludes the effect of custody fee credits, if any, of less than 0.005%.
(6) The investment adviser waived a portion of its investment adviser fee (equal to less than 0.01% and 0.01% of average daily net assets for the years ended October 31, 2006 and 2005, respectively).
See notes to financial statements
9
Eaton Vance Tax-Managed Small-Cap Fund as of October 31, 2008
FINANCIAL STATEMENTS CONT'D
Financial Highlights
| | | Class C | |
| | | Year Ended October 31, | |
| | | 2008 | | 2007 | | 2006 | | 2005 | | 2004 | |
| Net asset value — Beginning of year | | $ | 14.900 | | | $ | 11.650 | | | $ | 9.650 | | | $ | 8.940 | | | $ | 9.160 | | |
| Income (loss) from operations | |
| Net investment loss(1) | | $ | (0.215 | ) | | $ | (0.206 | ) | | $ | (0.150 | ) | | $ | (0.170 | ) | | $ | (0.170 | ) | |
| Net realized and unrealized gain (loss) | | | (5.025 | ) | | | 3.456 | | | | 2.150 | | | | 0.880 | | | | (0.050 | ) | |
| Total income (loss) from operations | | $ | (5.240 | ) | | $ | 3.250 | | | $ | 2.000 | | | $ | 0.710 | | | $ | (0.220 | ) | |
| Net asset value — End of year | | $ | 9.660 | | | $ | 14.900 | | | $ | 11.650 | | | $ | 9.650 | | | $ | 8.940 | | |
| Total Return(2) | | | (35.17 | )% | | | 27.90 | % | | | 20.72 | % | | | 7.94 | % | | | (2.40 | )%(3) | |
| Ratios/Supplemental Data | |
| Net assets, end of year (000's omitted) | | $ | 23,037 | | | $ | 31,471 | | | $ | 26,681 | | | $ | 18,341 | | | $ | 25,282 | | |
| Ratios (As a percentage of average daily net assets): | |
| Expenses before custodian fee reduction(4)(5) | | | 2.02 | % | | | 2.09 | % | | | 2.16 | %(6) | | | 2.19 | %(6) | | | 2.12 | % | |
| Net investment loss | | | (1.55 | )% | | | (1.57 | )% | | | (1.38 | )% | | | (1.79 | )% | | | (1.87 | )% | |
| Portfolio Turnover of the Portfolio | | | 93 | % | | | 78 | % | | | 99 | % | | | 223 | % | | | 282 | % | |
(1) Computed using average shares outstanding.
(2) Returns are historical and are calculated by determining the percentage change in net asset value with all distributions reinvested.
(3) The effect of the Fund's net increase from payments by affiliate and net gains (losses), through its investment in the Portfolio, realized on the disposal of investments purchased which did not meet the Portfolio's investment guidelines amounted to less than $0.01 per share and had no effect on total return for the year ended October 31, 2004.
(4) Includes the Fund's share of the Portfolio's allocated expenses.
(5) Excludes the effect of custody fee credits, if any, of less than 0.005%.
(6) The investment adviser waived a portion of its investment adviser fee (equal to less than 0.01% and 0.01% of average daily net assets for the years ended October 31, 2006 and 2005, respectively).
See notes to financial statements
10
Eaton Vance Tax-Managed Small-Cap Fund as of October 31, 2008
NOTES TO FINANCIAL STATEMENTS
1 Significant Accounting Policies
Eaton Vance Tax-Managed Small-Cap Fund (formerly, Eaton Vance Tax-Managed Small-Cap Growth Fund) (the Fund) is a diversified series of Eaton Vance Mutual Funds Trust (the Trust). The Trust is a Massachusetts business trust registered under the Investment Company Act of 1940, as amended (the 1940 Act), as an open-end management investment company. The Fund offers three classes of shares. Class A shares are generally sold subject to a sales charge imposed at time of purchase. Class B and Class C shares are sold at net asset value and are generally subject to a contingent deferred sales charge (see Note 5). Class B shares automatically convert to Class A shares eight years after their purchase as described in the Fund's prospectus. Each class represents a pro-rata interest in the Fund, but votes separately on class-specific matters and (as noted below) is subject to different expenses. Realized and unrealized gains and losses and net investment income and losses, other than class-specific expenses, are allocated daily to each class of shares based on the relative net assets of each class to the total net assets of the Fund. Each class of shares differs in its distribution plan and certain other class-specific expenses. The Fund invests all of its investable assets in interests in Tax-Managed Small-Cap Portfolio (formerly, Tax-Managed Small-Cap Growth Portfolio) (the Portfolio), a New York trust, having the same investment objective and policies as the Fund. The value of the Fund's investment in the Portfolio reflects the Fund's proportionate interest in the net assets of the Portfolio (73.1% at October 31, 2008). The performance of the Fund is directly affected by the performance of the Portfolio. The financial statements of the Portfolio, including the portfolio of investments, are included elsewhere in this report and should be read in conjunction with the Fund's financial statements.
The following is a summary of significant accounting policies of the Fund. The policies are in conformity with accounting principles generally accepted in the United States of America.
A Investment Valuation — Valuation of securities by the Portfolio is discussed in Note 1A of the Portfolio's Notes to Financial Statements, which are included elsewhere in this report.
B Income — The Fund's net investment income or loss consists of the Fund's pro-rata share of the net investment income or loss of the Portfolio, less all actual and accrued expenses of the Fund.
C Federal Taxes — The Fund's policy is to comply with the provisions of the Internal Revenue Code applicable to regulated investment companies and to distribute to shareholders each year substantially all of its net investment income, and all or substantially all of its net realized capital gains. Accordingly, no provision for federal income or excise tax is necessary.
At October 31, 2008, the Fund, for federal income tax purposes, had a capital loss carryforward of $99,531,880 which will reduce its taxable income arising from future net realized gains on investment transactions, if any, to the extent permitted by the Internal Revenue Code, and thus will reduce the amount of distributions to shareholders, which would otherwise be necessary to relieve the Fund of any liability for federal income or excise tax. Such capital loss carryforward will expire on October 31, 2009 ($43,586,142) and October 31, 2010 ($55,945,738). During the year ended October 31, 2008, a capital loss carryforward of $3,660,880 was utilized to offset net realized gains by the Fund.
As of October 31, 2008, the Fund had no uncertain tax positions that would require financial statement recognition, de-recognition, or disclosure. Each of the Fund's federal tax returns filed in the 3-year period ended October 31, 2008 remains subject to examination by the Internal Revenue Service.
D Expenses — The majority of expenses of the Trust are directly identifiable to an individual fund. Expenses which are not readily identifiable to a specific fund are allocated taking into consideration, among other things, the nature and type of expense and the relative size of the funds.
E Expense Reduction — State Street Bank and Trust Company (SSBT) serves as custodian of the Fund. Pursuant to the custodian agreement, SSBT receives a fee reduced by credits, which are determined based on the average daily cash balance the Fund maintains with SSBT. All credit balances, if any, used to reduce the Fund's custodian fees are reported as a reduction of expenses in the Statement of Operations.
F Use of Estimates — The preparation of the financial statements in conformity with accounting principles generally accepted in the United States of America requires management to make estimates and assumptions that affect the reported amounts of assets and liabilities at the date of the financial statements and the reported amounts of income and expense during the reporting period. Actual results could differ from those estimates.
G Indemnifications — Under the Trust's organizational documents, its officers and Trustees may be
11
Eaton Vance Tax-Managed Small-Cap Fund as of October 31, 2008
NOTES TO FINANCIAL STATEMENTS CONT'D
indemnified against certain liabilities and expenses arising out of the performance of their duties to the Fund, and shareholders are indemnified against personal liability for the obligations of the Trust. Additionally, in the normal course of business, the Fund enters into agreements with service providers that may contain indemnification clauses. The Fund's maximum exposure under these arrangements is unknown as this would involve future claims that may be made against the Fund that have not yet occurred.
H Other — Investment transactions are accounted for on a trade date basis. Dividends to shareholders are recorded on the ex-dividend date.
2 Distributions to Shareholders
It is the present policy of the Fund to make at least one distribution annually (normally in December) of all or substantially all of its net investment income and to distribute annually all or substantially all of its net realized capital gains (reduced by available capital loss carryforwards from prior years, if any). Distributions are declared separately for each class of shares. Shareholders may reinvest income and capital gain distributions in additional shares of the same class of the Fund at the net asset value as of the ex-dividend date or, at the election of the shareholder, receive distributions in cash. The Fund distinguishes between distributions on a tax basis and a financial reporting basis. Accounting principles generally accepted in the United States of America require that only distributions in excess of tax basis earnings and profits be reported in the financial statements as a return of capital. Permanent diff erences between book and tax accounting relating to distributions are reclassified to paid-in capital.
During the year ended October 31, 2008, accumulated net realized loss was increased by $2,665, accumulated net investment loss was decreased by $1,450,030, and paid-in capital was decreased by $1,447,365 due to differences between book and tax accounting, primarily for net operating losses and foreign currency gain (loss). These reclassifications had no effect on the net assets or net asset value per share of the Fund.
As of October 31, 2008, the components of distributable earnings (accumulated losses) and unrealized appreciation (depreciation) on a tax basis were as follows:
| Capital loss carryforward | | $ | (99,531,880 | ) | |
| Net unrealized depreciation | | $ | (33,590,889 | ) | |
The differences between components of distributable earnings (accumulated losses) on a tax basis and the amounts reflected in the Statement of Assets and Liabilities are primarily due to differences in book and tax policies for partnership allocations and wash sales.
3 Transactions with Affiliates
Eaton Vance Management (EVM) serves as the administrator to the Fund, but receives no compensation. The Portfolio has engaged Boston Management and Research (BMR), a subsidiary of EVM, to render investment advisory services. See Note 2 of the Portfolio's Notes to Financial Statements which are included elsewhere in this report.
EVM serves as the sub-transfer agent of the Fund and receives from the transfer agent an aggregate fee based upon the actual expenses incurred by EVM in the performance of these services. For the year ended October 31, 2008, EVM earned $15,057 in sub-transfer agent fees. The Fund was informed that Eaton Vance Distributors, Inc. (EVD), an affiliate of EVM and the Fund's principal underwriter, received $29,977 as its portion of the sales charge on sales of Class A shares for the year ended October 31, 2008. EVD also received distribution and service fees from Class A, Class B and Class C shares (see Note 4) and contingent deferred sales charges (see Note 5).
Except for Trustees of the Fund and the Portfolio who are not members of EVM's or BMR's organizations, officers and Trustees receive remuneration for their services to the Fund out of the investment adviser fee earned by BMR. Certain officers and Trustees of the Fund and the Portfolio are officers of the above organizations.
4 Distribution Plans
The Fund has in effect a distribution plan for Class A shares (Class A Plan) pursuant to Rule 12b-1 under the 1940 Act. The Class A Plan provides that the Fund will pay EVD a distribution and service fee of 0.25% per annum of its average daily net assets attributable to Class A shares for distribution services and facilities provided to the Fund by EVD, as well as for personal services and/or the maintenance of shareholder accounts. Distribution and service fees paid or accrued to EVD for the year ended October 31, 2008 amounted to $189,093 for Class A shares. The Fund also has in effect distribution plans for Class B shares (Class B Plan) and Class C shares (Class C Plan) pursuant to Rule 12b-1 under the 1940 Act. The Class B and Class C Plans require the Fund to pay EVD amounts equal to 0.75% per annum of its average daily net assets attributable to Class B and Class C
12
Eaton Vance Tax-Managed Small-Cap Fund as of October 31, 2008
NOTES TO FINANCIAL STATEMENTS CONT'D
shares for providing ongoing distribution services and facilities to the Fund. The Fund will automatically discontinue payments to EVD during any period in which there are no outstanding Uncovered Distribution Charges, which are equivalent to the sum of (i) 6.25% of the aggregate amount received by the Fund for Class B and Class C shares sold, respectively, plus (ii) interest calculated by applying the rate of 1% over the prevailing prime rate to the outstanding balance of Uncovered Distribution Charges of EVD of each respective class, reduced by the aggregate amount of contingent deferred sales charges (see Note 5) and amounts theretofore paid or payable to EVD by each respective class. For the year ended October 31, 2008, the Fund paid or accrued to EVD $191,560 and $218,410 for Class B and Class C shares, respectively, representing 0.75% of the average daily net assets of Class B and Class C shares. At October 31, 2008, the a mounts of Uncovered Distribution Charges of EVD calculated under the Class B and Class C Plans were approximately $6,709,300 and $11,076,800, respectively. The Class B and Class C Plans also authorize the Fund to make payments of service fees to EVD, investment dealers and other persons in amounts not exceeding 0.25% per annum of its average daily net assets attributable to that class. Service fees paid or accrued are for personal services and/or the maintenance of shareholder accounts. They are separate and distinct from the commissions and distribution fees payable to EVD and, as such, are not subject to automatic discontinuance when there are no outstanding Uncovered Distribution Charges of EVD. Service fees paid or accrued for the year ended October 31, 2008 amounted to $63,853 and $72,803 for Class B and Class C shares, respectively.
5 Contingent Deferred Sales Charges
A contingent deferred sales charge (CDSC) generally is imposed on redemptions of Class B shares made within six years of purchase and on redemptions of Class C shares made within one year of purchase. Class A shares may be subject to a CDSC up to 1% if redeemed within two years of purchase (depending on the circumstances of purchase). Generally, the CDSC is based upon the lower of the net asset value at date of redemption or date of purchase. No charge is levied on shares acquired by reinvestment of dividends or capital gain distributions. The CDSC for Class B shares is imposed at declining rates that begin at 5% in the case of redemptions in the first and second year after purchase, declining one percentage point each subsequent year. Class C shares are subject to a 1% CDSC if redeemed within one year of purchase. No CDSC is levied on shares which have been sold to EVM or its affiliates or to their respective employees or clients and may be waived under certain other limited conditions. CDSCs received on Class B and Class C redemptions are paid to EVD to reduce the amount of Uncovered Distribution Charges calculated under the Fund's Class B and Class C Plans. CDSCs received on Class B and Class C redemptions when no Uncovered Distribution Charges exist are credited to the Fund. For the year ended October 31, 2008, the Fund was informed that EVD received approximately $800, $20,300 and $8,100 of CDSCs paid by Class A, Class B and Class C shareholders, respectively.
6 Investment Transactions
For the year ended October 31, 2008, increases and decreases in the Fund's investment in the Portfolio aggregated $83,520,780 and $38,570,391, respectively.
7 Shares of Beneficial Interest
The Fund's Declaration of Trust permits the Trustees to issue an unlimited number of full and fractional shares of beneficial interest (without par value). Such shares may be issued in a number of different series (such as the Fund) and classes. Transactions in Fund shares were as follows:
| | | Year Ended October 31, | |
| Class A | | 2008 | | 2007 | |
| Sales | | | 4,818,451 | | | | 502,180 | | |
| Redemptions | | | (1,974,673 | ) | | | (746,269 | ) | |
| Exchange from Class B shares | | | 786,797 | | | | 538,163 | | |
| Net increase | | | 3,630,575 | | | | 294,074 | | |
| | | Year Ended October 31, | |
| Class B | | 2008 | | 2007 | |
| Sales | | | 83,828 | | | | 46,544 | | |
| Redemptions | | | (402,480 | ) | | | (706,301 | ) | |
| Exchange to Class A shares | | | (852,798 | ) | | | (578,610 | ) | |
| Net decrease | | | (1,171,450 | ) | | | (1,238,367 | ) | |
| | | Year Ended October 31, | |
| Class C | | 2008 | | 2007 | |
| Sales | | | 745,999 | | | | 255,373 | | |
| Redemptions | | | (474,322 | ) | | | (433,923 | ) | |
| Net increase (decrease) | | | 271,677 | | | | (178,550 | ) | |
13
Eaton Vance Tax-Managed Small-Cap Fund as of October 31, 2008
NOTES TO FINANCIAL STATEMENTS CONT'D
8 Recently Issued Accounting Pronouncement
In September 2006, the Financial Accounting Standards Board issued Statement of Financial Accounting Standards No. 157 (FAS 157), "Fair Value Measurements". FAS 157 defines fair value, establishes a framework for measuring fair value in accordance with accounting principles generally accepted in the United States of America and expands disclosure about fair value measurements. FAS 157 is effective for fiscal years beginning after November 15, 2007. As of October 31, 2008, management does not believe the adoption of FAS 157 will impact the amounts reported in the financial statements; however, additional disclosures may be required about the inputs used to develop the measurements of fair value and the effect of certain of the measurements on changes in net assets for the period.
9 Name Change
Effective September 1, 2008, the name of Eaton Vance Tax-Managed Small-Cap Fund was changed from Eaton Vance Tax-Managed Small-Cap Growth Fund.
14
Eaton Vance Tax-Managed Small-Cap Fund as of October 31, 2008
REPORT OF INDEPENDENT REGISTERED PUBLIC ACCOUNTING FIRM
To the Trustees of Eaton Vance Mutual Funds
Trust and Shareholders of Eaton Vance
Tax-Managed Small-Cap Fund:
We have audited the accompanying statement of assets and liabilities of Eaton Vance Tax-Managed Small-Cap Fund (formerly Eaton Vance Tax-Managed Small-Cap Growth Fund)(the "Fund") (one of the series of Eaton Vance Mutual Funds Trust), as of October 31, 2008, and the related statement of operations for the year then ended, the statements of changes in net assets for each of the two years in the period then ended, and the financial highlights for each of the five years in the period then ended. These financial statements and financial highlights are the responsibility of the Fund's management. Our responsibility is to express an opinion on these financial statements and financial highlights based on our audits.
We conducted our audits in accordance with the standards of the Public Company Accounting Oversight Board (United States). Those standards require that we plan and perform the audit to obtain reasonable assurance about whether the financial statements and financial highlights are free of material misstatement. The Fund is not required to have, nor were we engaged to perform, an audit of its internal control over financial reporting. Our audits included consideration of internal control over financial reporting as a basis for designing audit procedures that are appropriate in the circumstances, but not for the purpose of expressing an opinion on the effectiveness of the Fund's internal control over financial reporting. Accordingly, we express no such opinion. An audit also includes examining, on a test basis, evidence supporting the amounts and disclosures in the financial statements, assessing the accounting principles used and significant estimates made by management, as well as evaluating the overall financial statement presentation. We believe that our audits provide a reasonable basis for our opinion.
In our opinion, the financial statements and financial highlights referred to above present fairly, in all material respects, the financial position of Eaton Vance Tax-Managed Small-Cap Fund as of October 31, 2008, the results of its operations for the year then ended, the changes in its net assets for each of the two years in the period then ended, and the financial highlights for each of the five years in the period then ended, in conformity with accounting principles generally accepted in the United States of America.
DELOITTE & TOUCHE LLP
Boston, Massachusetts
December 15, 2008
15
Tax-Managed Small-Cap Portfolio as of October 31, 2008
PORTFOLIO OF INVESTMENTS
| Common Stocks — 96.7% | |
| Security | | Shares | | Value | |
| Aerospace & Defense — 3.0% | |
| Alliant Techsystems, Inc.(1) | | | 34,100 | | | $ | 2,809,840 | | |
| Ceradyne, Inc.(1) | | | 78,800 | | | | 1,851,800 | | |
| | | $ | 4,661,640 | | |
| Capital Markets — 2.9% | |
| Affiliated Managers Group, Inc.(1) | | | 38,390 | | | $ | 1,780,528 | | |
| Greenhill & Co., Inc. | | | 6,120 | | | | 403,736 | | |
| Lazard, Ltd., Class A | | | 80,840 | | | | 2,438,943 | | |
| | | $ | 4,623,207 | | |
| Chemicals — 2.3% | |
| Albemarle Corp. | | | 85,980 | | | $ | 2,093,613 | | |
| Zoltek Cos., Inc.(1) | | | 123,930 | | | | 1,461,135 | | |
| | | $ | 3,554,748 | | |
| Commercial Banks — 2.1% | |
| Cullen/Frost Bankers, Inc. | | | 59,155 | | | $ | 3,310,905 | | |
| | | $ | 3,310,905 | | |
| Commercial Services & Supplies — 2.3% | |
| Clean Harbors, Inc.(1) | | | 34,670 | | | $ | 2,273,312 | | |
| FTI Consulting, Inc.(1) | | | 21,850 | | | | 1,272,762 | | |
| | | $ | 3,546,074 | | |
| Communications Equipment — 1.7% | |
| Comtech Telecommunications Corp.(1) | | | 55,890 | | | $ | 2,706,194 | | |
| | | $ | 2,706,194 | | |
| Computers & Peripherals — 1.6% | |
| Stratasys, Inc.(1) | | | 209,045 | | | $ | 2,525,264 | | |
| | | $ | 2,525,264 | | |
| Construction & Engineering — 2.3% | |
| Foster Wheeler, Ltd.(1) | | | 83,950 | | | $ | 2,300,230 | | |
| Granite Construction, Inc. | | | 38,130 | | | | 1,360,097 | | |
| | | $ | 3,660,327 | | |
| Security | | Shares | | Value | |
| Distributors — 1.5% | |
| LKQ Corp.(1) | | | 204,990 | | | $ | 2,345,086 | | |
| | | $ | 2,345,086 | | |
| Electrical Equipment — 2.8% | |
| Baldor Electric Co. | | | 116,550 | | | $ | 2,046,618 | | |
| Energy Conversion Devices, Inc.(1) | | | 39,360 | | | | 1,343,750 | | |
| Sunpower Corp., Class B(1) | | | 35,257 | | | | 1,043,960 | | |
| | | $ | 4,434,328 | | |
| Electronic Equipment, Instruments & Components — 3.2% | |
| FLIR Systems, Inc.(1) | | | 90,330 | | | $ | 2,899,593 | | |
| National Instruments Corp. | | | 86,200 | | | | 2,189,480 | | |
| | | $ | 5,089,073 | | |
| Energy Equipment & Services — 5.2% | |
| CARBO Ceramics, Inc. | | | 31,860 | | | $ | 1,378,582 | | |
| Hornbeck Offshore Services, Inc.(1) | | | 59,275 | | | | 1,410,745 | | |
| ION Geophysical Corp.(1) | | | 274,380 | | | | 1,799,933 | | |
| NATCO Group, Inc., Class A(1) | | | 79,485 | | | | 1,680,313 | | |
| Willbros Group, Inc.(1) | | | 124,331 | | | | 1,925,887 | | |
| | | $ | 8,195,460 | | |
| Food Products — 2.1% | |
| Ralcorp Holdings, Inc.(1) | | | 48,780 | | | $ | 3,301,430 | | |
| | | $ | 3,301,430 | | |
| Health Care Equipment & Supplies — 8.1% | |
| Analogic Corp. | | | 62,425 | | | $ | 2,756,688 | | |
| IDEXX Laboratories, Inc.(1) | | | 38,820 | | | | 1,366,076 | | |
| Immucor, Inc.(1) | | | 31,560 | | | | 837,918 | | |
| ResMed, Inc.(1) | | | 76,575 | | | | 2,623,459 | | |
| West Pharmaceutical Services, Inc. | | | 68,720 | | | | 2,743,302 | | |
| Wright Medical Group, Inc.(1) | | | 103,830 | | | | 2,406,779 | | |
| | | $ | 12,734,222 | | |
| Health Care Providers & Services — 1.3% | |
| VCA Antech, Inc.(1) | | | 111,770 | | | $ | 2,023,037 | | |
| | | $ | 2,023,037 | | |
See notes to financial statements
16
Tax-Managed Small-Cap Portfolio as of October 31, 2008
PORTFOLIO OF INVESTMENTS CONT'D
| Security | | Shares | | Value | |
| Hotels, Restaurants & Leisure — 1.6% | |
| Scientific Games Corp., Class A(1) | | | 139,670 | | | $ | 2,514,060 | | |
| | | $ | 2,514,060 | | |
| Household Products — 2.2% | |
| Church & Dwight Co., Inc. | | | 57,440 | | | $ | 3,394,130 | | |
| | | $ | 3,394,130 | | |
| Insurance — 2.4% | |
| Hanover Insurance Group (The), Inc. | | | 33,990 | | | $ | 1,334,107 | | |
| Markel Corp.(1) | | | 6,730 | | | | 2,361,153 | | |
| | | $ | 3,695,260 | | |
| IT Services — 1.6% | |
| Euronet Worldwide, Inc.(1) | | | 205,420 | | | $ | 2,448,606 | | |
| | | $ | 2,448,606 | | |
| Life Sciences Tools & Services — 0.7% | |
| Bruker BioSciences Corp.(1) | | | 275,000 | | | $ | 1,124,750 | | |
| | | $ | 1,124,750 | | |
| Machinery — 2.2% | |
| Bucyrus International, Inc., Class A | | | 77,230 | | | $ | 1,863,560 | | |
| Titan International, Inc. | | | 137,435 | | | | 1,588,749 | | |
| | | $ | 3,452,309 | | |
| Media — 0.8% | |
| Dolan Media Co.(1) | | | 289,005 | | | $ | 1,184,921 | | |
| | | $ | 1,184,921 | | |
| Metals & Mining — 1.0% | |
| Cliffs Natural Resources, Inc. | | | 55,960 | | | $ | 1,510,360 | | |
| | | $ | 1,510,360 | | |
| Multiline Retail — 3.6% | |
| Big Lots, Inc.(1) | | | 101,140 | | | $ | 2,470,850 | | |
| Dollar Tree, Inc.(1) | | | 83,550 | | | | 3,176,571 | | |
| | | $ | 5,647,421 | | |
| Oil, Gas & Consumable Fuels — 9.7% | |
| Berry Petroleum Co., Class A | | | 44,770 | | | $ | 1,043,141 | | |
| Forest Oil Corp.(1) | | | 50,510 | | | | 1,475,397 | | |
| Security | | Shares | | Value | |
| Oil, Gas & Consumable Fuels (continued) | |
| Foundation Coal Holdings, Inc. | | | 99,960 | | | $ | 2,075,170 | | |
| Goodrich Petroleum Corp.(1) | | | 93,780 | | | | 2,603,333 | | |
| Holly Corp. | | | 35,970 | | | | 706,091 | | |
| Petrohawk Energy Corp.(1) | | | 117,930 | | | | 2,234,774 | | |
| Range Resources Corp. | | | 41,535 | | | | 1,753,608 | | |
| St. Mary Land & Exploration Co. | | | 87,940 | | | | 2,188,827 | | |
| Walter Industries, Inc. | | | 29,380 | | | | 1,138,475 | | |
| | | $ | 15,218,816 | | |
| Personal Products — 2.4% | |
| Chattem, Inc.(1) | | | 50,030 | | | $ | 3,785,770 | | |
| | | $ | 3,785,770 | | |
| Pharmaceuticals — 2.1% | |
| Perrigo Co. | | | 97,910 | | | $ | 3,328,940 | | |
| | | $ | 3,328,940 | | |
| Professional Services — 1.0% | |
| Robert Half International, Inc. | | | 87,000 | | | $ | 1,641,690 | | |
| | | $ | 1,641,690 | | |
| Road & Rail — 3.5% | |
| Kansas City Southern(1) | | | 87,800 | | | $ | 2,710,386 | | |
| Landstar System, Inc. | | | 73,270 | | | | 2,827,489 | | |
| | | $ | 5,537,875 | | |
| Semiconductors & Semiconductor Equipment — 7.7% | |
| Atheros Communications, Inc.(1) | | | 104,190 | | | $ | 1,872,294 | | |
| Cypress Semiconductor Corp.(1) | | | 412,580 | | | | 2,067,026 | | |
| Intersil Corp., Class A | | | 139,540 | | | | 1,910,303 | | |
| ON Semiconductor Corp.(1) | | | 353,450 | | | | 1,806,130 | | |
| Varian Semiconductor Equipment Associates, Inc.(1) | | | 84,410 | | | | 1,656,124 | | |
| Verigy, Ltd.(1) | | | 195,370 | | | | 2,832,865 | | |
| | | $ | 12,144,742 | | |
| Software — 5.2% | |
| Mentor Graphics Corp.(1) | | | 191,510 | | | $ | 1,405,683 | | |
| Parametric Technology Corp.(1) | | | 171,650 | | | | 2,229,734 | | |
| Sybase, Inc.(1) | | | 102,699 | | | | 2,734,874 | | |
| Synopsys, Inc.(1) | | | 94,770 | | | | 1,732,396 | | |
| | | $ | 8,102,687 | | |
See notes to financial statements
17
Tax-Managed Small-Cap Portfolio as of October 31, 2008
PORTFOLIO OF INVESTMENTS CONT'D
| Security | | Shares | | Value | |
| Specialty Retail — 3.2% | |
| Advance Auto Parts, Inc. | | | 90,100 | | | $ | 2,811,120 | | |
| Collective Brands, Inc.(1) | | | 173,710 | | | | 2,221,751 | | |
| | | $ | 5,032,871 | | |
| Textiles, Apparel & Luxury Goods — 2.3% | |
| Gildan Activewear, Inc.(1) | | | 155,640 | | | $ | 3,635,750 | | |
| | | $ | 3,635,750 | | |
| Trading Companies & Distributors — 1.1% | |
| GATX Corp. | | | 62,374 | | | $ | 1,780,778 | | |
| | | $ | 1,780,778 | | |
Total Common Stocks
(identified cost $190,621,005) | | | | | | $ | 151,892,731 | | |
| Special Warrants — 0.1% | |
| Security | | Shares | | Value | |
| Metals & Mining — 0.1% | |
| Western Exploration and Development, Ltd.(1)(2)(3) | | | 600,000 | | | $ | 180,000 | | |
| | | $ | 180,000 | | |
Total Special Warrants
(identified cost $480,000) | | | | | | $ | 180,000 | | |
| Private Placements — 0.0% | |
| Security | | Shares | | Value | |
| Metals & Mining — 0.0% | |
| Nevada Pacific Mining Co.(1)(2)(3) | | | 80,000 | | | $ | 56,000 | | |
| | | $ | 56,000 | | |
Total Private Placements
(identified cost $80,000) | | | | | | $ | 56,000 | | |
| Short-Term Investments — 5.6% | |
| Description | | Interest
(000's omitted) | | Value | |
| Cash Management Portfolio, 1.90%(4) | | $ | 8,831 | | | $ | 8,831,263 | | |
Total Short-Term Investments
(identified cost $8,831,263) | | | | $ | 8,831,263 | | |
Total Investments — 102.4%
(identified cost $200,012,268) | | | | $ | 160,959,994 | | |
| Other Assets, Less Liabilities — (2.4)% | | | | $ | (3,817,481 | ) | |
| Net Assets — 100.0% | | | | $ | 157,142,513 | | |
(1) Non-income producing security.
(2) Restricted security.
(3) Security valued at fair value using methods determined in good faith by or at the direction of the Trustees of the Portfolio.
(4) Affiliated investment company available to Eaton Vance portfolios and funds which invests in high quality, U.S. dollar denominated money market instruments. The rate shown is the annualized seven-day yield as of October 31, 2008.
See notes to financial statements
18
Tax-Managed Small-Cap Portfolio as of October 31, 2008
FINANCIAL STATEMENTS
Statement of Assets and Liabilities
As of October 31, 2008
| Assets | |
| Unaffiliated investments, at value (identified cost, $191,181,005) | | $ | 152,128,731 | | |
| Affiliated investments, at value (identified cost, $8,831,263) | | | 8,831,263 | | |
| Dividends receivable | | | 23,052 | | |
| Interest receivable from affiliated investment | | | 18,818 | | |
| Total assets | | $ | 161,001,864 | | |
| Liabilities | |
| Payable for investments purchased | | $ | 3,671,568 | | |
| Payable to affiliate for investment advisory fee | | | 81,512 | | |
| Payable to affiliate for Trustees' fees | | | 540 | | |
| Accrued expenses | | | 105,731 | | |
| Total liabilities | | $ | 3,859,351 | | |
| Net Assets applicable to investors' interest in Portfolio | | $ | 157,142,513 | | |
| Sources of Net Assets | |
| Net proceeds from capital contributions and withdrawals | | $ | 196,194,787 | | |
| Net unrealized depreciation (computed on the basis of identified cost) | | | (39,052,274 | ) | |
| Total | | $ | 157,142,513 | | |
Statement of Operations
For the Year Ended
October 31, 2008
| Investment Income | |
| Dividends (net of foreign taxes, $4,304) | | $ | 631,632 | | |
| Interest | | | 461 | | |
| Interest income allocated from affiliated investment | | | 244,680 | | |
| Expenses allocated from affiliated investment | | | (34,953 | ) | |
| Total investment income | | $ | 841,820 | | |
| Expenses | |
| Investment adviser fee | | $ | 1,143,285 | | |
| Trustees' fees and expenses | | | 8,677 | | |
| Custodian fee | | | 139,346 | | |
| Legal and accounting services | | | 53,200 | | |
| Miscellaneous | | | 5,166 | | |
| Total expenses | | $ | 1,349,674 | | |
| Net investment loss | | $ | (507,854 | ) | |
| Realized and Unrealized Gain (Loss) | |
Net realized gain (loss) —
Investment transactions (identified cost basis) | | $ | 5,106,688 | | |
| Foreign currency transactions | | | 4,056 | | |
| Net realized gain | | $ | 5,110,744 | | |
Change in unrealized appreciation (depreciation) —
Investments (identified cost basis) | | $ | (89,195,076 | ) | |
| Net change in unrealized appreciation (depreciation) | | $ | (89,195,076 | ) | |
| Net realized and unrealized loss | | $ | (84,084,332 | ) | |
| Net decrease in net assets from operations | | $ | (84,592,186 | ) | |
See notes to financial statements
19
Tax-Managed Small-Cap Portfolio as of October 31, 2008
FINANCIAL STATEMENTS CONT'D
Statements of Changes in Net Assets
Increase (Decrease)
in Net Assets | | Year Ended
October 31, 2008 | | Year Ended
October 31, 2007 | |
From operations —
Net investment loss | | $ | (507,854 | ) | | $ | (370,789 | ) | |
Net realized gain from investment
and foreign currency transactions | | | 5,110,744 | | | | 19,547,987 | | |
Net change in unrealized appreciation
(depreciation) of investments | | | (89,195,076 | ) | | | 25,306,878 | | |
Net increase (decrease) in net assets
from operations | | $ | (84,592,186 | ) | | $ | 44,484,076 | | |
Capital transactions —
Contributions | | $ | 92,270,609 | | | $ | 19,007,575 | | |
| Withdrawals | | | (38,574,422 | ) | | | (34,503,149 | ) | |
Net increase (decrease) in net assets from
capital transactions | | $ | 53,696,187 | | | $ | (15,495,574 | ) | |
| Net increase (decrease) in net assets | | $ | (30,895,999 | ) | | $ | 28,988,502 | | |
| Net Assets | |
| At beginning of year | | $ | 188,038,512 | | | $ | 159,050,010 | | |
| At end of year | | $ | 157,142,513 | | | $ | 188,038,512 | | |
See notes to financial statements
20
Tax-Managed Small-Cap Portfolio as of October 31, 2008
FINANCIAL STATEMENTS CONT'D
Supplementary Data
| | | Year Ended October 31, | |
| | | 2008 | | 2007 | | 2006 | | 2005 | | 2004 | |
| Ratios/Supplemental Data | |
| Ratios (As a percentage of average daily net assets): | |
| Expenses before custodian fee reduction(1) | | | 0.74 | % | | | 0.74 | % | | | 0.74 | %(2) | | | 0.74 | %(2) | | | 0.75 | % | |
| Net investment income (loss) | | | (0.27 | )% | | | (0.22 | )% | | | 0.01 | % | | | (0.34 | )% | | | (0.50 | )% | |
| Portfolio Turnover | | | 93 | % | | | 78 | % | | | 99 | % | | | 223 | % | | | 282 | % | |
| Total Return | | | (34.33 | )% | | | 29.67 | % | | | 22.33 | % | | | 9.52 | % | | | (1.05 | )%(3) | |
| Net assets, end of year (000's omitted) | | $ | 157,143 | | | $ | 188,039 | | | $ | 159,050 | | | $ | 153,121 | | | $ | 180,777 | | |
(1) Excludes the effect of custody fee credits, if any, of less than 0.005%.
(2) The investment adviser waived a portion of its investment adviser fee (equal to less than 0.01% and 0.01% of average daily net assets for the years ended October 31, 2006 and 2005, respectively).
(3) The Portfolio's net increase from payments by affiliate and net gains (losses) realized on the disposal of investments purchased which did not meet the Portfolio's investment guidelines had no effect on total return for the year ended October 31, 2004.
See notes to financial statements
21
Tax-Managed Small-Cap Portfolio as of October 31, 2008
NOTES TO FINANCIAL STATEMENTS
1 Significant Accounting Policies
Tax-Managed Small-Cap Portfolio (formerly, Tax-Managed Small-Cap Growth Portfolio) (the Portfolio) is a New York trust registered under the Investment Company Act of 1940, as amended (the 1940 Act), as a diversified, open-end management investment company. The Portfolio's investment objective is to achieve long-term, after-tax returns by investing in a diversified portfolio of publicly traded equity securities of small-cap companies. The Declaration of Trust permits the Trustees to issue interests in the Portfolio. At October 31, 2008, Eaton Vance Tax-Managed Small-Cap Fund and Eaton Vance Tax-Managed Equity Asset Allocation Fund held an interest of 73.1% and 26.8%, respectively, in the Portfolio.
The following is a summary of significant accounting policies of the Portfolio. The policies are in conformity with accounting principles generally accepted in the United States of America.
A Investment Valuation — Equity securities listed on a U.S. securities exchange generally are valued at the last sale price on the day of valuation or, if no sales took place on such date, at the mean between the closing bid and asked prices therefore on the exchange where such securities are principally traded. Equity securities listed on the NASDAQ Global or Global Select Market generally are valued at the NASDAQ official closing price. Unlisted or listed securities for which closing sales prices or closing quotations are not available are valued at the mean between the latest available bid and asked prices or, in the case of preferred equity securities that are not listed or traded in the over-the-counter market, by an independent pricing service. Short-term debt secur ities with a remaining maturity of sixty days or less are valued at amortized cost, which approximates market value. If short-term debt securities are acquired with a remaining maturity of more than sixty days, they will be valued by a pricing service. The daily valuation of exchange-traded foreign securities generally is determined as of the close of trading on the principal exchange on which such securities trade. Events occurring after the close of trading on foreign exchanges may result in adjustments to the valuation of foreign securities to more accurately reflect their fair value as of the close of regular trading on the New York Stock Exchange. When valuing foreign equity securities that meet certain criteria, the Trustees have approved the use of a fair value service that values such securities to reflect market trading that occurs after the close of the applicable foreign markets of comparable securities or other instruments that have a strong correlation to the fair-valued securities. Foreign securities and currencies are valued in U.S. dollars, based on foreign currency exchange rate quotations supplied by an independent quotation service. The independent service uses a proprietary model to determine the exchange rate. Inputs to the model include reported trades and implied bid/ask spreads. Investments for which valuations or market quotations are not readily available are valued at fair value using methods determined in good faith by or at the direction of the Trustees of the Portfolio considering relevant factors, data and information including the market value of freely tradable securities of the same class in the principal market on which such securities are normally traded.
The Portfolio may invest in Cash Management Portfolio (Cash Management), an affiliated investment company managed by Boston Management and Research (BMR), a subsidiary of Eaton Vance Management (EVM). Cash Management values its investment securities utilizing the amortized cost valuation technique permitted by Rule 2a-7 of the 1940 Act, pursuant to which Cash Management must comply with certain conditions. This technique involves initially valuing a portfolio security at its cost and thereafter assuming a constant amortization to maturity of any discount or premium. If amortized cost is determined not to approximate fair value, Cash Management ma y value its investment securities based on available market quotations provided by a pricing service.
B Investment Transactions — Investment transactions for financial statement purposes are accounted for on a trade date basis. Realized gains and losses on investments sold are determined on the basis of identified cost.
C Income — Dividend income is recorded on the ex-dividend date for dividends received in cash and/or securities. However, if the ex-dividend date has passed, certain dividends from foreign securities are recorded as the Portfolio is informed of the ex-dividend date. Withholding taxes on foreign dividends and capital gains have been provided for in accordance with the Portfolio's understanding of the applicable countries' tax rules and rates. Interest income is recorded on the basis of interest accrued, adjusted for amortization of premium or accretion of discount.
D Federal Taxes — The Portfolio has elected to be treated as a partnership for federal tax purposes. No provision is made by the Portfolio for federal or state taxes on any taxable income of the Portfolio because each investor in the Portfolio is ultimately responsible for the
22
Tax-Managed Small-Cap Portfolio as of October 31, 2008
NOTES TO FINANCIAL STATEMENTS CONT'D
payment of any taxes on its share of taxable income. Since at least one of the Portfolio's investors is a regulated investment company that invests all or substantially all of its assets in the Portfolio, the Portfolio normally must satisfy the applicable source of income and diversification requirements (under the Internal Revenue Code) in order for its investors to satisfy them. The Portfolio will allocate, at least annually among its investors, each investor's distributive share of the Portfolio's net investment income, net realized capital gains and any other items of income, gain, loss, deduction or credit.
As of October 31, 2008, the Portfolio had no uncertain tax positions that would require financial statement recognition, de-recognition, or disclosure. Each of the Portfolio's federal tax returns filed in the 3-year period ended October 31, 2008 remains subject to examination by the Internal Revenue Service.
E Expense Reduction — State Street Bank and Trust Company (SSBT) serves as custodian of the Portfolio. Pursuant to the custodian agreement, SSBT receives a fee reduced by credits, which are determined based on the average daily cash balance the Portfolio maintains with SSBT. All credit balances, if any, used to reduce the Portfolio's custodian fees are reported as a reduction of expenses in the Statement of Operations.
F Foreign Currency Translation — Investment valuations, other assets, and liabilities initially expressed in foreign currencies are translated each business day into U.S. dollars based upon current exchange rates. Purchases and sales of foreign investment securities and income and expenses denominated in foreign currencies are translated into U.S. dollars based upon currency exchange rates in effect on the respective dates of such transactions. Recognized gains or losses on investment transactions attributable to changes in foreign currency exchange rates are recorded for financial statement purposes as net realized gains and losses on investments. That portion of unrealized gains and losses on invest ments that results from fluctuations in foreign currency exchange rates is not separately disclosed.
G Use of Estimates — The preparation of the financial statements in conformity with accounting principles generally accepted in the United States of America requires management to make estimates and assumptions that affect the reported amounts of assets and liabilities at the date of the financial statements and the reported amounts of income and expense during the reporting period. Actual results could differ from those estimates.
H Indemnifications — Under the Portfolio's organizational documents, its officers and Trustees may be indemnified against certain liabilities and expenses arising out of the performance of their duties to the Portfolio. Interestholders in the Portfolio are jointly and severally liable for the liabilities and obligations of the Portfolio in the event that the Portfolio fails to satisfy such liabilities and obligations; provided, however, that, to the extent assets are available in the Portfolio, the Portfolio may, under certain circumstances, indemnify interestholders from and against any claim or liability to which such holder may become subject by reason of being or having been an interestholder in t he Portfolio. Additionally, in the normal course of business, the Portfolio enters into agreements with service providers that may contain indemnification clauses. The Portfolio's maximum exposure under these arrangements is unknown as this would involve future claims that may be made against the Portfolio that have not yet occurred.
2 Investment Adviser Fee and Other Transactions with Affiliates
The investment adviser fee is earned by BMR as compensation for management and investment advisory services rendered to the Portfolio. The fee is computed at an annual rate of 0.625% of the Portfolio's average daily net assets up to $500 million and at reduced rates as daily net assets exceed that level, and is payable monthly. The portion of the adviser fee payable by Cash Management on the Portfolio's investment of cash therein is credited against the Portfolio's adviser fee. For the year ended October 31, 2008, the Portfolio's adviser fee totaled $1,178,238 of which $34,953 was allocated from Cash Management and $1,143,285 was paid or accrued directly by the Portfolio. For the year ended October 31, 2008, the Portfolio's adviser fee, including the portion allocated from Cash Management, was 0.625% (annualized) of the Portfolio's average daily net assets.
Except for Trustees of the Portfolio who are not members of EVM's or BMR's organizations, officers and Trustees receive remuneration for their services to the Portfolio out of the investment adviser fee. Trustees of the Portfolio who are not affiliated with the investment adviser may elect to defer receipt of all or a percentage of their annual fees in accordance with the terms of the Trustees Deferred Compensation Plan. For the year ended October 31, 2008, no significant amounts have been deferred. Certain officers and Trustees of the Portfolio are officers of the above organizations.
23
Tax-Managed Small-Cap Portfolio as of October 31, 2008
NOTES TO FINANCIAL STATEMENTS CONT'D
3 Purchases and Sales of Investments
Purchases and sales of investments, other than short-term obligations, aggregated $222,158,652 and $171,297,164, respectively, for the year ended October 31, 2008.
4 Federal Income Tax Basis of Investments
The cost and unrealized appreciation (depreciation) of investments of the Portfolio at October 31, 2008, as determined on a federal income tax basis, were as follows:
| Aggregate cost | | $ | 200,651,430 | | |
| Gross unrealized appreciation | | $ | 8,786,891 | | |
| Gross unrealized depreciation | | | (48,478,327 | ) | |
| Net unrealized depreciation | | $ | (39,691,436 | ) | |
5 Restricted Securities
At October 31, 2008, the Portfolio owned the following securities (representing 0.15% of net assets) which were restricted as to public resale and not registered under the Securities Act of 1933 (excluding Rule 144A securities). The Portfolio has various registration rights (exercisable under a variety of circumstances) with respect to these securities. The value of these securities is determined based on valuations provided by brokers when available, or if not available, they are valued at fair value using methods determined in good faith by or at the direction of the Trustees.
| Description | | Date of
Acquisition | | Share/
Par Value | | Cost | | Value | |
| Private Placements | |
| Nevada Pacific Mining Co. | | 12/21/98 | | | 80,000 | | | $ | 80,000 | | | $ | 56,000 | | |
| | | $ | 80,000 | | | $ | 56,000 | | |
| Special Warrants | |
Western Exploration and
Development, Ltd. | | 12/21/98 | | | 600,000 | | | $ | 480,000 | | | $ | 180,000 | | |
| | | $ | 480,000 | | | $ | 180,000 | | |
| Total Restricted Securities | | | | | | | | $ | 236,000 | | |
6 Line of Credit
The Portfolio participates with other portfolios and funds managed by EVM and its affiliates in a $450 million unsecured line of credit agreement with a group of banks. Borrowings are made by the Portfolio solely to facilitate the handling of unusual and/or unanticipated short-term cash requirements. Interest is charged to the Portfolio based on its borrowings at an amount above either the Eurodollar rate or Federal Funds rate. In addition, a fee computed at an annual rate of 0.10% on the daily unused portion of the line of credit is allocated among the participating portfolios and funds at the end of each quarter. The Portfolio did not have any significant borrowings or allocated fees during the year ended October 31, 2008.
7 Risks Associated with Foreign Investments
Investing in securities issued by Eaton Vance Tax-Managed Small-Cap Portfolio whose principal business activities are outside the United States may involve significant risks not present in domestic investments. For example, there is generally less publicly available information about foreign companies, particularly those not subject to the disclosure and reporting requirements of the U.S. securities laws. Certain foreign issuers are generally not bound by uniform accounting, auditing, and financial reporting requirements and standards of practice comparable to those applicable to domestic issuers. Investments in foreign securities also involve the risk of possible adverse changes in investment or exchange control regulations, expropriation or confiscatory taxation, limitation on the removal of funds or other assets of the Portfolio, political or financial instability or diplomatic and other developments which could affect such i nvestments. Foreign securities markets, while growing in volume and sophistication, are generally not as developed as those in the United States, and securities of some foreign issuers (particularly those located in developing countries) may be less liquid and more volatile than securities of comparable U.S. companies. In general, there is less overall governmental supervision and regulation of foreign securities markets, broker-dealers and issuers than in the United States.
8 Recently Issued Accounting Pronouncement
In September 2006, the Financial Accounting Standards Board issued Statement of Financial Accounting Standards No. 157 (FAS 157), "Fair Value Measurements". FAS 157 defines fair value, establishes a framework for measuring fair value in accordance with accounting principles generally accepted in the United States of America and expands disclosure about fair value measurements. FAS 157 is effective for fiscal years beginning after November 15, 2007. As of October 31, 2008, management does not believe the adoption of FAS 157 will impact the amounts reported in the financial statements; however, additional disclosures may be required about the input s used to develop the measurements of fair value and the effect of certain of the measurements on changes in net assets for the period.
9 Name Change
Effective September 1, 2008, the name of the Tax-Managed Small-Cap Portfolio was changed from Tax-Managed Small-Cap Growth Portfolio.
24
Tax-Managed Small-Cap Portfolio as of October 31, 2008
REPORT OF INDEPENDENT REGISTERED PUBLIC ACCOUNTING FIRM
To the Trustees and Investors of Tax-Managed Small-Cap Portfolio:
We have audited the accompanying statement of assets and liabilities of Tax-Managed Small-Cap Portfolio (the "Portfolio") (formerly Tax-Managed Small-Cap Growth Portfolio), including the portfolio of investments, as of October 31, 2008, and the related statement of operations for the year then ended, the statements of changes in net assets for each of the two years in the period then ended, and the supplementary data for each of the five years in the period then ended. These financial statements and supplementary data are the responsibility of the Portfolio's management. Our responsibility is to express an opinion on these financial statements and supplementary data based on our audits.
We conducted our audits in accordance with the standards of the Public Company Accounting Oversight Board (United States). Those standards require that we plan and perform the audit to obtain reasonable assurance about whether the financial statements and supplementary data are free of material misstatement. The Portfolio is not required to have, nor were we engaged to perform, an audit of its internal control over financial reporting. Our audits included consideration of internal control over financial reporting as a basis for designing audit procedures that are appropriate in the circumstances, but not for the purpose of expressing an opinion on the effectiveness of the Portfolio's internal control over financial reporting. Accordingly, we express no such opinion. An audit also includes examining, on a test basis, evidence supporting the amounts and disclosures in the financial statements, assessing the accounting principles u sed and significant estimates made by management, as well as evaluating the overall financial statement presentation. Our procedures included confirmation of securities owned as of October 31, 2008, by correspondence with the custodian and brokers; where replies were not received from brokers, we performed other auditing procedures. We believe that our audits provide a reasonable basis for our opinion.
In our opinion, the financial statements and supplementary data referred to above present fairly, in all material respects, the financial position of Tax-Managed Small-Cap Portfolio as of October 31, 2008, the results of its operations for the year then ended, the changes in its net assets for each of the two years in the period then ended, and the supplementary data for each of the five years in the period then ended, in conformity with accounting principles generally accepted in the United States of America.
DELOITTE & TOUCHE LLP
Boston, Massachusetts
December 15, 2008
25
Eaton Vance Tax-Managed Small-Cap Fund
Tax-Managed Small-Cap Portfolio
SPECIAL MEETING OF SHAREHOLDERS (Unaudited)
Eaton Vance Tax-Managed Small-Cap Fund
The Fund held a Special Meeting of Shareholders on November 14, 2008 to elect Trustees. The results of the vote were as follows:
| | | Number of Shares | |
| Nominee for Trustee | | For | | Withheld | |
| Benjamin C. Esty | | | 8,363,266 | | | | 103,857 | | |
| Thomas E. Faust Jr. | | | 8,362,220 | | | | 104,903 | | |
| Allen R. Freedman | | | 8,359,140 | | | | 107,984 | | |
| William H. Park | | | 8,364,370 | | | | 102,753 | | |
| Ronald A. Pearlman | | | 8,354,581 | | | | 112,543 | | |
| Helen Frame Peters | | | 8,359,730 | | | | 107,393 | | |
| Heidi L. Steiger | | | 8,358,948 | | | | 108,175 | | |
| Lynn A. Stout | | | 8,361,847 | | | | 105,276 | | |
| Ralph F. Verni | | | 8,360,826 | | | | 106,297 | | |
Each nominee was also elected a Trustee of the Portfolio.
Tax-Managed Small-Cap Portfolio
The Portfolio held a Special Meeting of Interestholders on November 14, 2008 to elect Trustees. The results of the vote were as follows:
| | | Interest in the Portfolio | |
| Nominee for Trustee | | For | | Withheld | |
| Benjamin C. Esty | | | 99 | % | | | 1 | % | |
| Thomas E. Faust Jr. | | | 99 | % | | | 1 | % | |
| Allen R. Freedman | | | 99 | % | | | 1 | % | |
| William H. Park | | | 99 | % | | | 1 | % | |
| Ronald A. Pearlman | | | 99 | % | | | 1 | % | |
| Helen Frame Peters | | | 99 | % | | | 1 | % | |
| Heidi L. Steiger | | | 99 | % | | | 1 | % | |
| Lynn A. Stout | | | 99 | % | | | 1 | % | |
| Ralph F. Verni | | | 99 | % | | | 1 | % | |
Results are rounded to the nearest whole number.
26
Eaton Vance Tax-Managed Small-Cap Fund
BOARD OF TRUSTEES' ANNUAL APPROVAL OF THE INVESTMENT ADVISORY AGREEMENT
Overview of the Contract Review Process
The Investment Company Act of 1940, as amended (the "1940 Act"), provides, in substance, that each investment advisory agreement between a fund and its investment adviser will continue in effect from year to year only if its continuance is approved at least annually by the fund's board of trustees, including by a vote of a majority of the trustees who are not "interested persons" of the fund ("Independent Trustees"), cast in person at a meeting called for the purpose of considering such approval.
At a meeting of the Boards of Trustees (each a "Board") of the Eaton Vance group of mutual funds (the "Eaton Vance Funds") held on April 21, 2008, the Board, including a majority of the Independent Trustees, voted to approve continuation of existing advisory and sub-advisory agreements for the Eaton Vance Funds for an additional one-year period. In voting its approval, the Board relied upon the affirmative recommendation of the Contract Review Committee of the Board (formerly the Special Committee), which is a committee comprised exclusively of Independent Trustees. Prior to making its recommendation, the Contract Review Committee reviewed information furnished for a series of meetings of the Contract Review Committee held in February, March and April 2008. Such information included, among other things, the following:
Information about Fees, Performance and Expenses
• An independent report comparing the advisory and related fees paid by each fund with fees paid by comparable funds;
• An independent report comparing each fund's total expense ratio and its components to comparable funds;
• An independent report comparing the investment performance of each fund to the investment performance of comparable funds over various time periods;
• Data regarding investment performance in comparison to relevant peer groups of funds and appropriate indices;
• Comparative information concerning fees charged by each adviser for managing other mutual funds and institutional accounts using investment strategies and techniques similar to those used in managing the fund;
• Profitability analyses for each adviser with respect to each fund;
Information about Portfolio Management
• Descriptions of the investment management services provided to each fund, including the investment strategies and processes employed, and any changes in portfolio management processes and personnel;
• Information concerning the allocation of brokerage and the benefits received by each adviser as a result of brokerage allocation, including information concerning the acquisition of research through "soft dollar" benefits received in connection with the funds' brokerage, and the implementation of a soft dollar reimbursement program established with respect to the funds;
• Data relating to portfolio turnover rates of each fund;
• The procedures and processes used to determine the fair value of fund assets and actions taken to monitor and test the effectiveness of such procedures and processes;
Information about each Adviser
• Reports detailing the financial results and condition of each adviser;
• Descriptions of the qualifications, education and experience of the individual investment professionals whose responsibilities include portfolio management and investment research for the funds, and information relating to their compensation and responsibilities with respect to managing other mutual funds and investment accounts;
• Copies of the Codes of Ethics of each adviser and its affiliates, together with information relating to compliance with and the administration of such codes;
• Copies of or descriptions of each adviser's proxy voting policies and procedures;
• Information concerning the resources devoted to compliance efforts undertaken by each adviser and its affiliates on behalf of the funds (including descriptions of various compliance programs) and their record of compliance with investment policies and restrictions, including policies with respect to market-timing, late trading and selective portfolio disclosure, and with policies on personal securities transactions;
• Descriptions of the business continuity and disaster recovery plans of each adviser and its affiliates;
Other Relevant Information
• Information concerning the nature, cost and character of the administrative and other non-investment management services provided by Eaton Vance Management and its affiliates;
• Information concerning management of the relationship with the custodian, subcustodians and fund accountants by each adviser or the funds' administrator; and
• The terms of each advisory agreement.
27
Eaton Vance Tax-Managed Small-Cap Fund
BOARD OF TRUSTEES' ANNUAL APPROVAL OF THE INVESTMENT ADVISORY AGREEMENT CONT'D
In addition to the information identified above, the Contract Review Committee considered information provided from time to time by each adviser throughout the year at meetings of the Board and its committees. Over the course of the twelve-month period ended April 30, 2008, the Board met eleven times and the Contract Review Committee, the Audit Committee and the Governance Committee, each of which is a Committee comprised solely of Independent Trustees, met twelve, seven and five times, respectively. At such meetings, the Trustees received, among other things, presentations by the portfolio managers and other investment professionals of each adviser relating to the investment performance of each fund and the investment strategies used in pursuing the fund's investment objective. The Portfolio Management Committee and the Compliance Reports and Regulatory Matters Committee are newly established and did not meet during the twelve- month period ended April 30, 2008.
For funds that invest through one or more underlying portfolios, the Board considered similar information about the portfolio(s) when considering the approval of advisory agreements. In addition, in cases where the fund's investment adviser has engaged a sub-adviser, the Board considered similar information about the sub-adviser when considering the approval of any sub-advisory agreement.
The Contract Review Committee was assisted throughout the contract review process by Goodwin Procter LLP, legal counsel for the Independent Trustees. The members of the Contract Review Committee relied upon the advice of such counsel and their own business judgment in determining the material factors to be considered in evaluating each advisory and sub-advisory agreement and the weight to be given to each such factor. The conclusions reached with respect to each advisory and sub-advisory agreement were based on a comprehensive evaluation of all the information provided and not any single factor. Moreover, each member of the Contract Review Committee may have placed varying emphasis on particular factors in reaching conclusions with respect to each advisory and sub-advisory agreement.
Results of the Process
Based on its consideration of the foregoing, and such other information as it deemed relevant, including the factors and conclusions described below, the Contract Review Committee concluded that the continuance of the investment advisory agreement of the Tax-Managed Small-Cap Growth Portfolio (the "Portfolio"), the portfolio in which the Eaton Vance Tax-Managed Small-Cap Growth Fund (the "Fund") invests, with Boston Management and Research (the "Adviser"), including its fee structure, is in the interests of shareholders and, therefore, the Contract Review Committee recommended to the Board approval of the agreement. The Board accepted the recommendation of the Contract Review Committee as well as the factors considered and conclusions reached by the Contract Review Committee with respect to the agreement. Accordingly, the Board, including a majority of the Independent Trustees, voted to approve continuation of the investment adv isory agreement for the Portfolio.
Nature, Extent and Quality of Services
In considering whether to approve the investment advisory agreement of the Portfolio, the Board evaluated the nature, extent and quality of services provided to the Portfolio by the Adviser.
The Board considered the Adviser's management capabilities and investment process with respect to the types of investments held by the Portfolio, including the education, experience and number of its investment professionals and other personnel who provide portfolio management, investment research, and similar services to the Portfolio. The Board specifically noted the Adviser's in-house equity research capabilities and experience in managing funds that seek to maximize after-tax returns. The Board also took into account the resources dedicated to portfolio management and other services, including the compensation paid to recruit and retain investment personnel, and the time and attention devoted to the Portfolio by senior management.
The Board also reviewed the compliance programs of the Adviser and relevant affiliates thereof. Among other matters, the Board considered compliance and reporting matters relating to personal trading by investment personnel, selective disclosure of portfolio holdings, late trading, frequent trading, portfolio valuation, business continuity and the allocation of investment opportunities. The Board also evaluated the responses of the Adviser and its affiliates to requests from regulatory authorities such as the Securities and Exchange Commission.
The Board considered shareholder and other administrative services provided or managed by Eaton Vance Management and its affiliates, including transfer agency and accounting services. The Board evaluated the benefits to shareholders of investing in a fund that is a part of a large family of funds, including the ability, in many cases, to exchange an investment among different funds without incurring additional sales charges.
After consideration of the foregoing factors, among others, the Board concluded that the nature, extent and quality of services provided by the Adviser, taken as a whole, are appropriate and consistent with the terms of the investment advisory agreement.
28
Eaton Vance Tax-Managed Small-Cap Fund
BOARD OF TRUSTEES' ANNUAL APPROVAL OF THE INVESTMENT ADVISORY AGREEMENT CONT'D
Fund Performance
The Board compared the Fund's investment performance to a relevant universe of similarly managed funds identified by an independent data provider and appropriate benchmark indices. The Board reviewed comparative performance data for the one-, three-, five- and ten-year periods ended September 30, 2007 for the Fund. The Board concluded that performance of the Fund was satisfactory.
Management Fees and Expenses
The Board reviewed contractual investment advisory fee rates payable, including any administrative fee rates, payable by the Portfolio and the Fund (referred to as "management fees"). As part of its review, the Board considered the management fees and the Fund's total expense ratio for the year ended September 30, 2007, as compared to a group of similarly managed funds selected by an independent data provider.
After reviewing the foregoing information, and in light of the nature, extent and quality of the services provided by the Adviser, the Board concluded that the management fees charged for advisory and related services and the Fund's total expense ratio are reasonable.
Profitability
The Board reviewed the level of profits realized by the Adviser and relevant affiliates thereof in providing investment advisory and administrative services to the Portfolio, the Fund and to all Eaton Vance Funds as a group. The Board considered the level of profits realized without regard to revenue sharing or other payments by the Adviser and its affiliates to third parties in respect of distribution services. The Board also considered other direct or indirect benefits received by the Adviser and its affiliates in connection with its relationship with the Portfolio and the Fund, including the benefits of research services that may be available to the Adviser as a result of securities transactions effected for the Portfolio and other advisory clients.
The Board concluded that, in light of the foregoing factors and the nature, extent and quality of the services rendered, the profits realized by the Adviser and its affiliates are reasonable.
Economies of Scale
In reviewing management fees and profitability, the Board also considered the extent to which the Adviser and its affiliates, on the one hand, and the Fund, on the other hand, can expect to realize benefits from economies of scale as the assets of the Fund and the Portfolio increase. The Board acknowledged the difficulty in accurately measuring the benefits resulting from the economies of scale with respect to the management of any specific fund or group of funds. The Board reviewed data summarizing the increases and decreases in the assets of the Fund and of all Eaton Vance Funds as a group over various time periods, and evaluated the extent to which the total expense ratio of the Fund and the profitability of the Adviser and its affiliates may have been affected by such increases or decreases. Based upon the foregoing, the Board concluded that the benefits from economies of scale are currently being shared equitably by the Adv iser and its affiliates and the Fund. The Board also concluded that, assuming reasonably foreseeable increases in the assets of the Portfolio, the structure of the Portfolio advisory fee, which includes breakpoints at several asset levels, can be expected to cause the Adviser and its affiliates and the Fund and the Portfolio to continue to share such benefits equitably.
29
Eaton Vance Tax-Managed Small-Cap Fund
MANAGEMENT AND ORGANIZATION
Fund Management. The Trustees of Eaton Vance Mutual Funds Trust (the Trust) and Tax-Managed Small-Cap Portfolio (the Portfolio) are responsible for the overall management and supervision of the Trust's and Portfolio's affairs. The Trustees and officers of the Trust and the Portfolio are listed below. Except as indicated, each individual has held the office shown or other offices in the same company for the last five years. Trustees and officers of the Trust and the Portfolio hold indefinite terms of office. The "noninterested Trustees" consist of those Trustees who are not "interested persons" of the Trust and the Portfolio, as that term is defined under the 1940 Act. The business address of each Trustee and officer is The Eaton Vance Building, 255 State Street, Boston, Massachusetts 02109. As used below, "EVC" refers to Eaton Vance Corp., "EV" refers to Eat on Vance, Inc., "EVM" refers to Eaton Vance Management, "BMR" refers to Boston Management and Research, "Parametric" refers to Parametric Portfolio Associates and "EVD" refers to Eaton Vance Distributors, Inc. EVC and EV are the corporate parent and trustee, respectively, of EVM and BMR. EVD is the Fund's principal underwriter, the Portfolio's placement agent and a wholly-owned subsidiary of EVC. Each officer affiliated with Eaton Vance may hold a position with other Eaton Vance affiliates that is comparable to his and her position with EVM listed below.
Name and
Date of Birth | | Position(s)
with the
Trust and the
Portfolio | | Term of
Office and
Length of
Service | | Principal Occupation(s)
During Past Five Years | | Number of Portfolios
in Fund Complex
Overseen By
Trustee(1) | | Other Directorships Held | |
| Interested Trustee | | | | | | | | | | | | | |
|
Thomas E. Faust Jr.
5/31/58 | | Trustee and President of
the Trust | | Trustee since 2007 and President of the Trust since 2002 | | Chairman, Chief Executive Officer and President of EVC, Director and President of EV, Chief Executive Officer and President of EVM and BMR, and Director of EVD. Trustee and/or Officer of 173 registered investment companies and 4 private companies managed by EVM or BMR. Mr. Faust is an interested person because of his positions with EVM, BMR, EVD, EVC and EV, which are affiliates of the Trust and Portfolio. | | | 173 | | | Director of EVC | |
|
| Noninterested Trustees | | | | | | | | | | | | | |
|
Benjamin C. Esty
1/2/63 | | Trustee | | Since 2005 | | Roy and Elizabeth Simmons Professor of Business Administration, Harvard University Graduate School of Business Administration. | | | 173 | | | None | |
|
Allen R. Freedman
4/3/40 | | Trustee | | Since 2007 | | Former Chairman (2002-2004) and a Director (1983-2004) of Systems & Computer Technology Corp. (provider of software to higher education). Formerly, a Director of Loring Ward International (fund distributor) (2005-2007). Formerly, Chairman and a Director of Indus International Inc. (provider of enterprise management software to the power generating industry) (2005-2007). | | | 173 | | | Director of Assurant, Inc. and Stonemor Partners L.P. (owner and operator of cemeteries) | |
|
William H. Park
9/19/47 | | Trustee | | Since 2003 | | Vice Chairman, Commercial Industrial Finance Corp. (specialty finance company) (since 2006). Formerly, President and Chief Executive Officer, Prizm Capital Management, LLC (investment management firm) (2002-2005). | | | 173 | | | None | |
|
Ronald A. Pearlman
7/10/40 | | Trustee | | Since 2003 | | Professor of Law, Georgetown University Law Center. | | | 173 | | | None | |
|
Helen Frame Peters
3/22/48 | | Trustee | | Since 2008 | | Professor of Finance, Carroll School of Management, Boston College (since 2003). Adjunct Professor of Finance, Peking University, Beijing, China (since 2005). Formerly, Dean, Carroll School of Management Boston College (2000-2003). | | | 173 | | | Director of Federal Home Loan Bank of Boston (a bank for banks) and BJ's Wholesale Clubs (wholesale club retailer); Trustee of SPDR Index Shares Funds and SPDR Series Trust (exchange traded funds) | |
|
Heidi L. Steiger
7/8/53 | | Trustee | | Since 2007 | | Managing Partner, Topridge Associates LLC (global wealth management firm) (since 2008); Senior Advisor (since 2008), President (2005-2008), Lowenhaupt Global Advisors, LLC (global wealth management firm). Formerly, President and Contributing Editor, Worth Magazine (2004-2005). Formerly, Executive Vice President and Global Head of Private Asset Management (and various other positions), Neuberger Berman (investment firm) (1986-2004). | | | 173 | | | Director of Nuclear Electric Insurance Ltd. (nuclear insurance provider) and Aviva USA (insurance provider) | |
|
30
Eaton Vance Tax-Managed Small-Cap Fund
MANAGEMENT AND ORGANIZATION CONT'D
Name and
Date of Birth | | Position(s)
with the
Trust and the
Portfolio | | Term of
Office and
Length of
Service | | Principal Occupation(s)
During Past Five Years | | Number of Portfolios
in Fund Complex
Overseen By
Trustee(1) | | Other Directorships Held | |
| Noninterested Trustees (continued) | | | | | | | | | | | |
|
Lynn A. Stout
9/14/57 | | Trustee | | Since 1998 | | Paul Hastings Professor of Corporate and Securities Law (since 2006) and Professor of Law (2001-2006), University of California at Los Angeles School of Law. | | | 173 | | | None | |
|
Ralph F. Verni
1/26/43 | | Chairman of
the Board
and Trustee | | Chairman of the Board since 2007 and Trustee since 2005 | | Consultant and private investor. | | | 173 | | | None | |
|
| Principal Officers who are not Trustees | | | | | | | | | | | |
|
Name and
Date of Birth | | Position(s)
with the
Trust and the
Portfolio | | Term of
Office and
Length of
Service | | Principal Occupation(s)
During Past Five Years | |
William H. Ahern, Jr.
7/28/59 | | Vice President
of the Trust | | Since 1995 | | Vice President of EVM and BMR. Officer of 75 registered investment companies managed by EVM or BMR. | |
|
John R. Baur
2/10/70 | | Vice President
of the Trust | | Since 2007 | | Vice President of EVM and BMR. Previously, attended Johnson Graduate School of Management, Cornell University (2002-2005), and prior thereto he was an Account Team Representative in Singapore for Applied Materials, Inc. Officer of 33 registered investment companies managed by EVM or BMR. | |
|
Michael A. Cirami
12/24/75 | | Vice President
of the Trust | | Since 2007 | | Vice President of EVM and BMR. Previously, attended the University of Rochester William E. Simon Graduate School of Business Administration (2001-2003), and prior thereto he was a Team Leader for the Institutional Services Group for State Street Bank in Luxembourg. Officer of 33 registered investment companies managed by EVM or BMR. | |
|
Cynthia J. Clemson
3/2/63 | | Vice President
of the Trust | | Since 2005 | | Vice President of EVM and BMR. Officer of 90 registered investment companies managed by EVM or BMR. | |
|
Charles B. Gaffney
12/4/72 | | Vice President
of the Trust | | Since 2007 | | Vice President of EVM and BMR. Previously, Sector Portfolio Manager and Senior Equity Analyst of Brown Brothers Harriman (1997-2003). Officer of 30 registered investment companies managed by EVM or BMR. | |
|
Christine M. Johnston
11/9/72 | | Vice President
of the Trust | | Since 2007 | | Vice President of EVM and BMR. Officer of 35 registered investment companies managed by EVM or BMR. | |
|
Aamer Khan
6/7/60 | | Vice President
of the Trust | | Since 2005 | | Vice President of EVM and BMR. Officer of 33 registered investment companies managed by EVM or BMR. | |
|
Thomas H. Luster
4/8/62 | | Vice President
of the Trust | | Since 2006 | | Vice President of EVM and BMR. Officer of 51 registered investment companies managed by EVM or BMR. | |
|
Robert B. MacIntosh
1/22/57 | | Vice President
of the Trust | | Since 1998 | | Vice President of EVM and BMR. Officer of 90 registered investment companies managed by EVM or BMR. | |
|
Duncan W. Richardson
10/26/57 | | Vice President of the Trust and President
of the Portfolio | | Vice President of the Trust since 2001 and President of the Portfolio since 2002 | | Executive Vice President and Chief Equity Investment Officer of EVC, EVM and BMR. Officer of 81 registered investment companies managed by EVM or BMR. | |
|
| Judith A. Saryan 8/21/54 | | Vice President
of the Trust | | Since 2003 | | Vice President of EVM and BMR. Officer of 55 registered investment companies managed by EVM or BMR. | |
|
| Susan Schiff 3/13/61 | | Vice President
of the Trust | | Since 2002 | | Vice President of EVM and BMR. Officer of 36 registered investment companies managed by EVM or BMR. | |
|
| Thomas Seto 9/27/62 | | Vice President
of the Trust | | Since 2007 | �� | Vice President and Director of Portfolio Management of Parametric. Officer of 31 registered investment companies managed by EVM or BMR. | |
|
| David M. Stein 5/4/51 | | Vice President
of the Trust | | Since 2007 | | Managing Director and Chief Investment Officer of Parametric. Officer of 31 registered investment companies managed by EVM or BMR. | |
|
31
Eaton Vance Tax-Managed Small-Cap Fund
MANAGEMENT AND ORGANIZATION CONT'D
| Principal Officers who are not Trustees (continued) | |
|
Name and
Date of Birth | | Position(s)
with the
Trust and the
Portfolio | | Term of
Office and
Length of
Service | | Principal Occupation(s)
During Past Five Years | |
Nancy B. Tooke
10/25/46 | | Vice President
of the Portfolio | | Since 2006 | | Vice President of EVM and BMR. Previously, Senior Managing Director and small- and mid-cap core portfolio manager with ForstmannLeff Associates (2004-2006). Previously, Executive Vice President and portfolio manager with Schroder Investment Management North America, Inc. (1994-2004). Officer of 3 registered investment companies managed by EVM or BMR. | |
|
Mark S. Venezia
5/23/49 | | Vice President
of the Trust | | Since 2007 | | Vice President of EVM and BMR. Officer of 36 registered investment companies managed by EVM or BMR. | |
|
Adam A. Weigold
3/22/75 | | Vice President
of the Trust | | Since 2007 | | Vice President of EVM and BMR. Officer of 71 registered investment companies managed by EVM or BMR. | |
|
Barbara E. Campbell
6/19/57 | | Treasurer | | Of the Trust since 2005 and of the Portfolio since 2008(2) | | Vice President of EVM and BMR. Officer of 173 registered investment companies managed by EVM or BMR. | |
|
Maureen A. Gemma
5/24/60 | | Secretary and Chief Legal Officer | | Secretary since 2007 and Chief Legal Officer since 2008 | | Vice President of EVM and BMR. Officer of 173 registered investment companies managed by EVM or BMR. | |
|
Paul M. O'Neil
7/11/53 | | Chief
Compliance Officer | | Since 2004 | | Vice President of EVM and BMR. Officer of 173 registered investment companies managed by EVM or BMR. | |
|
(1) Includes both master and feeder funds in a master-feeder structure.
(2) Prior to 2008, Ms. Campbell served as Assistant Treasurer of the Portfolio since 1998.
The SAI for the Fund includes additional information about the Trustees and officers of the Fund and the Portfolio and can be obtained without charge on Eaton Vance's website at www.eatonvance.com or by calling 1-800-262-1122.
32
Investment Adviser of Tax-Managed Small-Cap Portfolio
Boston Management and Research
The Eaton Vance Building
255 State Street
Boston, MA 02109
Administrator of Eaton Vance Tax-Managed Small-Cap Fund
Eaton Vance Management
The Eaton Vance Building
255 State Street
Boston, MA 02109
Principal Underwriter
Eaton Vance Distributors, Inc.
The Eaton Vance Building
255 State Street
Boston, MA 02109
(617) 482-8260
Custodian
State Street Bank and Trust Company
200 Clarendon Street
Boston, MA 02116
Transfer Agent
PNC Global Investing Services
Attn: Eaton Vance Funds
P.O. Box 9653
Providence, RI 02940-9653
(800) 262-1122
Independent Registered Public Accounting Firm
Deloitte & Touche LLP
200 Berkeley Street
Boston, MA 02116-5022
Eaton Vance Tax-Managed Small-Cap Fund
The Eaton Vance Building
255 State Street
Boston, MA 02109
This report must be preceded or accompanied by a current prospectus. Before investing, investors should consider carefully the Fund's investment objective(s), risks, and charges and expenses. The Fund's current prospectus contains this and other information about the Fund and is available through your financial advisor. Please read the prospectus carefully before you invest or send money. For further information please call 1-800-262-1122.
130-12/08 MGSRC

Annual Report October 31, 2008


EATON VANCE
TAX-MANAGED
SMALL-CAP
VALUE
FUND
IMPORTANT NOTICES REGARDING PRIVACY,
DELIVERY OF SHAREHOLDER DOCUMENTS,
PORTFOLIO HOLDINGS AND PROXY VOTING
Privacy. The Eaton Vance organization is committed to ensuring your financial privacy. Each of the financial institutions identified below has in effect the following policy ("Privacy Policy") with respect to nonpublic personal information about its customers:
• Only such information received from you, through application forms or otherwise, and information about your Eaton Vance fund transactions will be collected. This may include information such as name, address, social security number, tax status, account balances and transactions.
• None of such information about you (or former customers) will be disclosed to anyone, except as permitted by law (which includes disclosure to employees necessary to service your account). In the normal course of servicing a customer's account, Eaton Vance may share information with unaffiliated third parties that perform various required services such as transfer agents, custodians and broker/dealers.
• Policies and procedures (including physical, electronic and procedural safeguards) are in place that are designed to protect the confidentiality of such information.
• We reserve the right to change our Privacy Policy at any time upon proper notification to you. Customers may want to review our Policy periodically for changes by accessing the link on our homepage: www.eatonvance.com.
Our pledge of privacy applies to the following entities within the Eaton Vance organization: the Eaton Vance Family of Funds, Eaton Vance Management, Eaton Vance Investment Counsel, Boston Management and Research, and Eaton Vance Distributors, Inc.
In addition, our Privacy Policy only applies to those Eaton Vance customers who are individuals and who have a direct relationship with us. If a customer's account (i.e., fund shares) is held in the name of a third-party financial adviser/broker-dealer, it is likely that only such adviser's privacy policies apply to the customer. This notice supersedes all previously issued privacy disclosures.
For more information about Eaton Vance's Privacy Policy, please call 1-800-262-1122.
Delivery of Shareholder Documents. The Securities and Exchange Commission (the "SEC") permits funds to deliver only one copy of shareholder documents, including prospectuses, proxy statements and shareholder reports, to fund investors with multiple accounts at the same residential or post office box address. This practice is often called "householding" and it helps eliminate duplicate mailings to shareholders.
Eaton Vance, or your financial adviser, may household the mailing of your documents indefinitely unless you instruct Eaton Vance, or your financial adviser, otherwise.
If you would prefer that your Eaton Vance documents not be householded, please contact Eaton Vance at 1-800-262-1122, or contact your financial adviser.
Your instructions that householding not apply to delivery of your Eaton Vance documents will be effective within 30 days of receipt by Eaton Vance or your financial adviser.
Portfolio Holdings. Each Eaton Vance Fund and its underlying Portfolio will (if applicable) file a schedule of its portfolio holdings on Form N-Q with the SEC for the first and third quarters of each fiscal year. The Form N-Q will be available on the Eaton Vance website www.eatonvance.com, by calling Eaton Vance at 1-800-262-1122 or in the EDGAR database on the SEC's website at www.sec.gov. Form N-Q may also be reviewed and copied at the SEC's public reference room in Washington, D.C. (call 1-800-732-0330 for information on the operation of the public reference room).
Proxy Voting. From time to time, funds are required to vote proxies related to the securities held by the funds. The Eaton Vance Funds or their underlying Portfolios (if applicable) vote proxies according to a set of policies and procedures approved by the Funds' and Portfolios' Boards. You may obtain a description of these policies and procedures and information on how the Funds or Portfolios voted proxies relating to portfolio securities during the most recent 12 month period ended June 30, without charge, upon request, by calling 1-800-262-1122. This description is also available on the SEC's website at www.sec.gov.
Eaton Vance Tax-Managed Small-Cap Value Fund as of October 31, 2008
MANAGEMENT’S DISCUSSION OF FUND PERFORMANCE

Gregory R. Greene, CFA
Lead Portfolio Manager
Economic and Market Conditions
· The stock market moved dramatically lower during the year that ended October 31, 2008. After reaching record highs in October 2007, the major market indices began to decline at the end of 2007 as investors realized that the difficulties in subprime lending and the troubled housing market were likely to slow the economy significantly. By the summer of 2008, the magnitude of the damage became increasingly apparent. Many banks were faced with enormous write-offs from bad real estate loans, losses that severely impaired their overall lending capacity. As the market declined further, investor and consumer sentiment worsened. That trend was accelerated by soaring energy prices, as oil hit $145 per barrel in July 2008 and pinched consumers even more. The failure of Lehman Brothers in September 2008 and the tenuous condition of other capital- starved banks and financial institutions sparked fears of a global financial collapse. In late September 2008, in an effort to jump-start lending, the U.S. Treasury department unveiled a controversial proposal to purchase troubled loans from banks and financial institutions. Congress’s initial rejection of the plan sent the market into a near-freefall. A revised version of the measure was subsequently approved by Congress, and was followed by a coordinated effort by the world’s central banks to inject liquidity into the global banking system. While those actions reassured many investors, volatility remained high as the one-year period drew to a close.
· For the year ended October 31, 2008, all ten sectors within the Russell 2000 Value Index(1) registered negative returns. The utilities sector was, by far, the best performing sector, posting a relatively modest loss for the year. Consumer staples was the next best performing sector, but still turned in a double-digit loss for the year. The consumer discretionary, telecommunications services, information technology, materials, energy, industrials, financial and health care sectors all suffered severe declines. Market-leading industries during the year included food products, pharmaceuticals and gas utilities, the only industries to post positive returns. In contrast, independent power producers, automobiles, auto components, paper and forest products and real estate management were the year’s worst performing industries.(1)
Management Discussion
· The Fund(2) posted a negative total return during the year ended October 31, 2008, reflecting the dramatic downtrend of the broad market, as concerned investors became increasingly risk-averse. Nonetheless, the Fund outpaced its primary benchmark, the Russell 2000 Value Index. The Fund’s outperformance relative to its benchmark was a function of management’s continuing emphasis on companies they believed could maintain relatively stable revenues in a deteriorating economic environment.(1)
· While the Fund was significantly underweighted in financial stocks, the steep decline in the sector was nonetheless a drag on performance. The Fund’s limited commercial bank exposure was hurt by increasing loan loss provisions amid the deepening real estate and credit crisis. An investment in a life insurer performed poorly, as the company’s investment losses pressured its reserve levels, while beleaguered credit markets further impaired the company’s ability to raise capital.
Eaton Vance Tax-Managed Small-Cap Value Fund
Total Return Performance 10/31/07 – 10/31/08
Class A(3) | | -21.61 | % |
Class B(3) | | -22.15 | |
Class C(3) | | -22.19 | |
Russell 2000 Value Index(1) | | -30.54 | |
Lipper Small Cap Value Funds Average(1) | | -34.10 | |
Please refer to pages 3-4 for additional performance information, including after-tax returns.
(1) | It is not possible to invest directly in an Index or a Lipper Classification. The Index’s total return does not reflect commissions or expenses that would have been incurred if an investor individually purchased or sold the securities represented in the Index. The Lipper total return is the average total return, at net asset value, of the funds that are in the same Lipper Classification as the Fund. |
(2) | The Fund currently invests in a separate registered investment company, Tax-Managed Small-Cap Value Portfolio, with the same objective and policies as the Fund. References to investments are to the Portfolio’s holdings. |
(3) | These returns do not include the 5.75% maximum sales charge for Class A shares or the applicable contingent deferred sales charge (CDSC) for Class B and Class C shares. If sales charges were deducted, the returns would be lower. Absent an allocation of certain expenses to the administrator of the Fund and the sub-adviser of the Portfolio, the returns would have been lower. |
Past performance is no guarantee of future results. Returns are historical and are calculated by determining the percentage change in net asset value or offering price (as applicable) with all distributions reinvested. Investment return and principal value will fluctuate so that shares, when redeemed, may be worth more or less than their original cost. Performance is for the stated time period only; due to market volatility, the Fund’s current performance may be lower or higher than the quoted return. Absent an expense limitation or waiver in effect for certain periods, performance would have been lower. For performance as of the most recent month end, please refer to www.eatonvance.com.
Fund shares are not insured by the FDIC and are not deposits or other obligations of, or guaranteed by, any depository institution. Shares are subject to investment risks, including possible loss of principal invested.
1
· The Fund’s information technology stocks also constrained performance during the year ended October 31, 2008. A chip manufacturer saw slower earnings growth in concert with a slowing economy, weaker global demand for consumer electronics and cutbacks in the capital spending plans of businesses. A maker of precision electrical contact products also fared poorly, as margins were squeezed by rising precious metals prices as well as unfavorable currency translation abroad.
· The Fund’s performance was helped by an overweighting and favorable stock selection in the consumer staples sector during the year. These companies enjoyed relatively stable earnings because of the non-discretionary nature of their products and services. The Fund benefited from an investment in a supplier of food products to hotels, restaurants, hospitals and cafeterias, which performed well and was acquired at a sizeable premium during the year. The Fund was also helped by an investment in a drug store chain with a growing benefits management business, which was also acquired at a premium during the year. Investments in two household products companies also performed well, as the companies’ revenue growth was boosted by pricing flexibility and new product introductions.
· An overweighting and favorable stock selection in the health care sector was additive to performance during the year. A pharmaceuticals manufacturer with a strong new product pipeline enjoyed good earnings growth and was acquired at a sizable premium by a Japanese drug maker. The Fund also benefited from stock selection in the utilities sector. A gas utility bucked the market trend on the strength of continuing revenue growth and the recent regulatory approval of a rate hike.
· The Fund’s industrial sector investments turned in a mixed performance. An industrial conglomerate was among the Fund’s best performers during the year as its large coal holdings benefited from significant price hikes in the price of metallurgical coal and coke used in steel making. Less successful was a company that provides services to electric utilities for power distribution and transmission, as margins were squeezed by increased costs for labor, insurance and fuel.
Portfolio Composition
Top Ten Holdings(1)
By net assets
iShares Russell 2000 Value Index Fund | | 4.5 | % |
Piedmont Natural Gas Co., Inc. | | 4.2 | |
National Penn Bancshares, Inc. | | 4.1 | |
First Niagara Financial Group, Inc. | | 4.0 | |
Carter’s, Inc. | | 4.0 | |
Trustmark Corp. | | 3.6 | |
ON Semiconductor Corp. | | 2.9 | |
Chattem, Inc. | | 2.7 | |
Teleflex, Inc. | | 2.6 | |
Tupperware Brands Corp. | | 2.6 | |
(1) Top Ten Holdings represented 35.2% of Portfolio net assets as of 10/31/08. Excludes cash equivalents.
Sector Weightings(2)
By net assets

(2) As a percentage of the Portfolio’s net assets as of 10/31/08. Excludes cash equivalents.
The views expressed throughout this report are those of the portfolio managers and are current only through the end of the period of the report as stated on the cover. These views are subject to change at any time based upon market or other conditions, and the investment adviser disclaims any responsibility to update such views. These views may not be relied on as investment advice and, because investment decisions for a fund are based on many factors, may not be relied on as an indication of trading intent on behalf of any Eaton Vance fund. Portfolio information provided in the report may not be representative of the Portfolio’s current or future investments and may change due to active management.
2
Eaton Vance Tax-Managed Small-Cap Value Fund as of October 31, 2008
FUND PERFORMANCE
The line graph and table set forth below provide information about the Fund’s performance. The line graph compares the performance of Class A of the Fund with that of the Russell 2000 Value Index, a broad-based, unmanaged market index of those Russell 2000 Index companies with lower price-to-book ratios and higher forecasted growth values. The lines on the graph represent the total returns of a hypothetical investment of $10,000 in each of Class A and the Russell 2000 Value Index. Class A total returns are presented at net asset value and maximum public offering price. The table includes the total returns of each Class of the Fund at net asset value and maximum public offering price. The performance presented below does not reflect the deduction of taxes, if any, that a shareholder would pay on distributions or redemptions of Fund shares.
Performance(1) | | Class A | | Class B | | Class C | |
Share Class Symbol | | ESVAX | | ESVBX | | ESVCX | |
Average Annual Total Returns (at net asset value) | | | | | | | |
One Year | | -21.61 | % | -22.15 | % | -22.19 | % |
Five Years | | 4.65 | % | 3.88 | % | 3.89 | % |
Life of Fund† | | 5.55 | % | 4.79 | % | 4.80 | % |
| | | | | | | |
SEC Average Annual Total Returns (including sales charge or applicable CDSC) | | | | | | | |
One Year | | -26.12 | % | -25.66 | % | -22.89 | % |
Five Years | | 3.41 | % | 3.55 | % | 3.89 | % |
Life of Fund† | | 4.62 | % | 4.79 | % | 4.80 | % |
†Inception date of all Classes: 3/4/02.
(1) Average Annual Total Returns do not include the 5.75% maximum sales charge for Class A shares or the applicable contingent deferred sales charge (CDSC) for Class B and Class C shares. If sales charges were deducted, the returns would be lower. SEC Average Annual Total Returns for Class A reflect the maximum 5.75% sales charge. SEC returns for Class B shares reflect the applicable CDSC based on the following schedule: 5% - 1st and 2nd years; 4% - 3rd year; 3% - 4th year; 2% - 5th year; 1% - 6th year. SEC returns for Class C reflect a 1% CDSC for the first year. Absent an allocation of certain expenses to the administrator of the Fund and the sub-adviser of the Portfolio, the returns would have been lower.
Total Annual | | | | | | | |
Operating Expenses(2) | | Class A | | Class B | | Class C | |
Gross Expense Ratio | | 2.01 | % | 2.76 | % | 2.76 | % |
Net Expense Ratio | | 1.69 | % | 2.44 | % | 2.44 | % |
(2) Source: Prospectus dated 3/1/08. The Net Expense Ratio reflects a contractual expense reimbursement that continues through 4/30/10. Thereafter, the expense reimbursement may be changed or terminated at any time. Without this expense reimbursement, performance would have been lower.
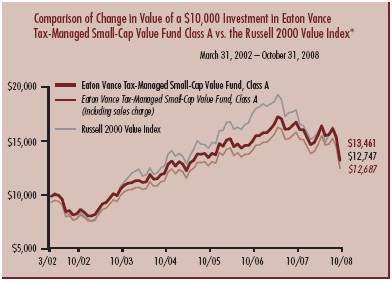
* Source: Lipper Inc. Investment operations commenced 3/4/02. A $10,000 hypothetical investment at net asset value in Class B shares and Class C shares on 3/4/02 would have been valued at $12,826 and $12,847, respectively, on 10/31/08. It is not possible to invest directly in an Index. The Index’s total returns do not reflect commissions or expenses that would have been incurred if an investor individually purchased or sold the securities represented in the Index.
Past performance is no guarantee of future results. Returns are historical and are calculated by determining the percentage change in net asset value or offering price (as applicable) with all distributions reinvested. Investment return and principal value will fluctuate so that shares, when redeemed, may be worth more or less than their original cost. Performance is for stated time period only; due to market volatility, the Fund’s current performance may be lower or higher than the quoted return. Absent an expense limitation or waiver in effect for certain periods, performance would have been lower. For performance as of the most recent month end, please refer to www.eatonvance.com.
3
“Return Before Taxes” does not take into consideration shareholder taxes. It is most relevant to tax-free or tax-deferred shareholder accounts. “Return After Taxes on Distributions” reflects the impact of federal income taxes due on Fund distributions of dividends and capital gains. It is most relevant to taxpaying shareholders who continue to hold their shares. “Return After Taxes on Distributions and Sale of Fund Shares” also reflects the impact of taxes on capital gain or loss realized upon a sale of shares. It is most relevant to taxpaying shareholders who sell their shares.
Average Annual Total Returns
(For the periods ended October 31, 2008)
Returns at Net Asset Value (NAV) (Class A)
| | One Year | | Five Years | | Life of Fund | |
Return Before Taxes | | -21.61 | % | 4.65 | % | 5.55 | % |
Return After Taxes on Distributions | | -22.73 | % | 3.95 | % | 5.03 | % |
Return After Taxes on Distributions and Sale of Fund Shares | | -11.99 | % | 4.20 | % | 4.90 | % |
Returns at Public Offering Price (POP) (Class A)
| | One Year | | Five Years | | Life of Fund | |
Return Before Taxes | | -26.12 | % | 3.41 | % | 4.62 | % |
Return After Taxes on Distributions | | -27.17 | % | 2.72 | % | 4.10 | % |
Return After Taxes on Distributions and Sale of Fund Shares | | -15.04 | % | 3.12 | % | 4.08 | % |
Average Annual Total Returns
(For the periods ended October 31, 2008)
Returns at Net Asset Value (NAV) (Class C)
| | One Year | | Five Years | | Life of Fund | |
Return Before Taxes | | -22.19 | % | 3.89 | % | 4.80 | % |
Return After Taxes on Distributions | | -23.35 | % | 3.18 | % | 4.26 | % |
Return After Taxes on Distributions and Sale of Fund Shares | | -12.27 | % | 3.56 | % | 4.25 | % |
Returns at Public Offering Price (POP) (Class C)
| | One Year | | Five Years | | Life of Fund | |
Return Before Taxes | | -22.89 | % | 3.89 | % | 4.80 | % |
Return After Taxes on Distributions | | -24.05 | % | 3.18 | % | 4.26 | % |
Return After Taxes on Distributions and Sale of Fund Shares | | -12.72 | % | 3.56 | % | 4.25 | % |
Average Annual Total Returns
(For the periods ended October 31, 2008)
Returns at Net Asset Value (NAV) (Class B)
| | One Year | | Five Years | | Life of Fund | |
Return Before Taxes | | -22.15 | % | 3.88 | % | 4.79 | % |
Return After Taxes on Distributions | | -23.31 | % | 3.16 | % | 4.25 | % |
Return After Taxes on Distributions and Sale of Fund Shares | | -12.24 | % | 3.55 | % | 4.24 | % |
Returns at Public Offering Price (POP) (Class B)
| | One Year | | Five Years | | Life of Fund | |
Return Before Taxes | | -25.66 | % | 3.55 | % | 4.79 | % |
Return After Taxes on Distributions | | -26.82 | % | 2.82 | % | 4.25 | % |
Return After Taxes on Distributions and Sale of Fund Shares | | -14.52 | % | 3.26 | % | 4.24 | % |
Class A, Class B and Class C of the Fund commenced investment operations on 3/4/02. Returns at Public Offering Price (POP) reflect the deduction of the maximum initial sales charge and applicable CDSC, while Returns at Net Asset Value (NAV) do not. Absent an allocation of certain expenses to the administrator of the Fund and the sub-adviser of the Portfolio, the returns would have been lower.
After-tax returns are calculated using certain assumptions. After-tax returns are calculated using the highest historical individual federal income tax rates and do not reflect the impact of state and local taxes. Actual after-tax returns depend on a shareholder’s tax situation and the actual characterization of distributions and may differ from those shown. After-tax returns are not relevant to shareholders who hold shares in tax-deferred accounts or to shares held by non-taxable entities. Return After Taxes on Distributions for a period may be the same as Return Before Taxes for the same period because no taxable distributions were made during that period. Return After Taxes on Distributions and Sale of Fund Shares for a period may be greater than or equal to Return After Taxes on Distributions for the same period because of losses realized on the sale of Fund shares.
Past performance is no guarantee of future results. Returns are historical and are calculated by determining the percentage change in net asset value or offering price (as applicable) with all distributions reinvested. Investment return and principal value will fluctuate so that shares, when redeemed, may be worth more or less than their original cost. Performance is for the stated time period only; due to market volatility, the Fund’s current performance may be lower or higher than the quoted return. Absent an expense limitation or waiver in effect for certain periods, performance would have been lower. For performance as of the most recent month end, please refer to www.eatonvance.com.
4
Eaton Vance Tax-Managed Small-Cap Value Fund as of October 31, 2008
FUND EXPENSES
Example: As a shareholder of the Fund, you incur two types of costs: (1) transaction costs, including sales charges (loads) on purchases and redemption fees (if applicable); and (2) ongoing costs, including management fees; distribution or service fees; and other Fund expenses. This Example is intended to help you understand your ongoing costs (in dollars) of investing in the Fund and to compare these costs with the ongoing costs of investing in other mutual funds. The Example is based on an investment of $1,000 invested at the beginning of the period and held for the entire period (May 1, 2008 – October 31, 2008).
Actual Expenses: The first section of the table below provides information about actual account values and actual expenses. You may use the information in this section, together with the amount you invested, to estimate the expenses that you paid over the period. Simply divide your account value by $1,000 (for example, an $8,600 account value divided by $1,000 = 8.6), then multiply the result by the number in the first section under the heading entitled "Expenses Paid During Period" to estimate the expenses you paid on your account during this period.
Hypothetical Example for Comparison Purposes: The second section of the table below provides information about hypothetical account values and hypothetical expenses based on the actual Fund expense ratio and an assumed rate of return of 5% per year (before expenses), which is not the actual return of the Fund. The hypothetical account values and expenses may not be used to estimate the actual ending account balance or expenses you paid for the period. You may use this information to compare the ongoing costs of investing in your Fund and other funds. To do so, compare this 5% hypothetical example with the 5% hypothetical examples that appear in the shareholder reports of the other funds.
Please note that the expenses shown in the table are meant to highlight your ongoing costs only and do not reflect any transactional costs, such as sales charges (loads) or redemption fees (if applicable). Therefore, the second section of the table is useful in comparing ongoing costs only, and will not help you determine the relative total costs of owning different funds. In addition, if these transactional costs were included, your costs would have been higher.
Eaton Vance Tax-Managed Small-Cap Value Fund
| | | Beginning Account Value
(5/1/08) | | Ending Account Value
(10/31/08) | | Expenses Paid During Period*
(5/1/08 – 10/31/08) | |
| Actual | |
| Class A | | $ | 1,000.00 | | | $ | 846.20 | | | $ | 7.66 | ** | |
| Class B | | $ | 1,000.00 | | | $ | 843.10 | | | $ | 11.12 | ** | |
| Class C | | $ | 1,000.00 | | | $ | 843.30 | | | $ | 11.12 | ** | |
| Hypothetical | |
| (5% return per year before expenses) | |
| Class A | | $ | 1,000.00 | | | $ | 1,016.80 | | | $ | 8.36 | ** | |
| Class B | | $ | 1,000.00 | | | $ | 1,013.10 | | | $ | 12.14 | ** | |
| Class C | | $ | 1,000.00 | | | $ | 1,013.10 | | | $ | 12.14 | ** | |
* Expenses are equal to the Fund's annualized expense ratio of 1.65% for Class A shares, 2.40% for Class B shares and 2.40% for Class C shares, multiplied by the average account value over the period, multiplied by 184/366 (to reflect the one-half year period). The Example assumes that the $1,000 was invested at the net asset value per share determined at the close of business on April 30, 2008. The Example reflects the expenses of both the Fund and the Portfolio.
** Absent an allocation of certain expenses to the administrator of the Fund and the sub-adviser of the Portfolio, expenses would be higher.
5
Eaton Vance Tax-Managed Small-Cap Value Fund as of October 31, 2008
FINANCIAL STATEMENTS
Statement of Assets and Liabilities
As of October 31, 2008
| Assets | |
Investment in Tax-Managed Small-Cap Value Portfolio, at value
(identified cost, $24,656,774) | | $ | 26,517,116 | | |
| Receivable for Fund shares sold | | | 85,511 | | |
| Total assets | | $ | 26,602,627 | | |
| Liabilities | |
| Payable for Fund shares redeemed | | $ | 31,355 | | |
| Payable to affiliate for distribution and service fees | | | 11,079 | | |
| Payable to affiliate for administration fee | | | 3,273 | | |
| Payable to affiliate for Trustees' fees | | | 42 | | |
| Payable to the administrator of the Fund and the sub-adviser of the Portfolio | | | 16,723 | | |
| Accrued expenses | | | 38,376 | | |
| Total liabilities | | $ | 100,848 | | |
| Net Assets | | $ | 26,501,779 | | |
| Sources of Net Assets | |
| Paid-in capital | | $ | 25,363,427 | | |
Accumulated net realized loss from Portfolio (computed on
the basis of identified cost) | | | (721,990 | ) | |
Net unrealized appreciation from Portfolio (computed on
the basis of identified cost) | | | 1,860,342 | | |
| Total | | $ | 26,501,779 | | |
| Class A Shares | |
| Net Assets | | $ | 17,628,161 | | |
| Shares Outstanding | | | 1,547,003 | | |
Net Asset Value and Redemption Price Per Share
(net assets ÷ shares of beneficial interest outstanding) | | $ | 11.40 | | |
Maximum Offering Price Per Share
(100 ÷ 94.25 of $11.40) | | $ | 12.10 | | |
| Class B Shares | |
| Net Assets | | $ | 3,537,707 | | |
| Shares Outstanding | | | 329,104 | | |
Net Asset Value and Offering Price Per Share*
(net assets ÷ shares of beneficial interest outstanding) | | $ | 10.75 | | |
| Class C Shares | |
| Net Assets | | $ | 5,335,911 | | |
| Shares Outstanding | | | 495,856 | | |
Net Asset Value and Offering Price Per Share*
(net assets ÷ shares of beneficial interest outstanding) | | $ | 10.76 | | |
| On sales of $50,000 or more, the offering price of Class A shares is reduced. | |
* Redemption price per share is equal to the net asset value less any applicable contingent deferred sales charge.
Statement of Operations
For the Year Ended
October 31, 2008
| Investment Income | |
| Dividends allocated from Portfolio | | $ | 442,406 | | |
| Interest allocated from Portfolio | | | 33,649 | | |
| Expenses allocated from Portfolio | | | (327,459 | ) | |
| Net investment income from Portfolio | | $ | 148,596 | | |
| Expenses | |
| Administration fee | | $ | 43,987 | | |
| Trustees' fees and expenses | | | 264 | | |
Distribution and service fees
Class A | | | 45,565 | | |
| Class B | | | 49,865 | | |
| Class C | | | 61,121 | | |
| Transfer and dividend disbursing agent fees | | | 43,438 | | |
| Registration fees | | | 31,966 | | |
| Custodian fee | | | 18,115 | | |
| Legal and accounting services | | | 18,043 | | |
| Printing and postage | | | 10,647 | | |
| Miscellaneous | | | 11,128 | | |
| Total expenses | | $ | 334,139 | | |
Deduct —
Allocation of expenses to the administrator of the Fund and
the sub-adviser of the Portfolio | | $ | 94,587 | | |
| Total expense reductions | | $ | 94,587 | | |
| Net expenses | | $ | 239,552 | | |
| Net investment loss | | $ | (90,956 | ) | |
| Realized and Unrealized Gain (Loss) from Portfolio | |
Net realized gain (loss) —
Investment transactions (identified cost basis) | | $ | (689,465 | ) | |
| Net realized loss | | $ | (689,465 | ) | |
Change in unrealized appreciation (depreciation) —
Investments (identified cost basis) | | $ | (6,445,768 | ) | |
| Net change in unrealized appreciation (depreciation) | | $ | (6,445,768 | ) | |
| Net realized and unrealized loss | | $ | (7,135,233 | ) | |
| Net decrease in net assets from operations | | $ | (7,226,189 | ) | |
See notes to financial statements
6
Eaton Vance Tax-Managed Small-Cap Value Fund as of October 31, 2008
FINANCIAL STATEMENTS CONT'D
Statements of Changes in Net Assets
Increase (Decrease)
in Net Assets | | Year Ended
October 31, 2008 | | Year Ended
October 31, 2007 | |
From operations —
Net investment loss | | $ | (90,956 | ) | | $ | (228,758 | ) | |
Net realized gain (loss) from
investment transactions | | | (689,465 | ) | | | 3,075,285 | | |
Net change in unrealized appreciation
(depreciation) from investments | | | (6,445,768 | ) | | | 681,473 | | |
Net increase (decrease) in net assets
from operations | | $ | (7,226,189 | ) | | $ | 3,528,000 | | |
Distributions to shareholders —
From net realized gain
Class A | | $ | (1,783,471 | ) | | $ | (1,148,098 | ) | |
| Class B | | | (595,814 | ) | | | (528,019 | ) | |
| Class C | | | (673,040 | ) | | | (594,019 | ) | |
| Total distributions to shareholders | | $ | (3,052,325 | ) | | $ | (2,270,136 | ) | |
Transactions in shares of beneficial interest —
Proceeds from sale of shares
Class A | | $ | 8,336,836 | | | $ | 3,953,402 | | |
| Class B | | | 342,683 | | | | 412,469 | | |
| Class C | | | 1,451,061 | | | | 1,118,200 | | |
Net asset value of shares issued to
shareholders in payment of
distributions declared
Class A | | | 1,488,333 | | | | 978,525 | | |
| Class B | | | 464,355 | | | | 401,815 | | |
| Class C | | | 531,411 | | | | 408,179 | | |
Cost of shares redeemed
Class A | | | (5,434,692 | ) | | | (2,960,442 | ) | |
| Class B | | | (1,394,883 | ) | | | (1,137,489 | ) | |
| Class C | | | (1,539,228 | ) | | | (2,430,665 | ) | |
Net asset value of shares exchanged
Class A | | | 503,874 | | | | 520,721 | | |
| Class B | | | (503,874 | ) | | | (520,721 | ) | |
Net increase in net assets from
Fund share transactions | | $ | 4,245,876 | | | $ | 743,994 | | |
| Net increase (decrease) in net assets | | $ | (6,032,638 | ) | | $ | 2,001,858 | | |
| Net Assets | |
| At beginning of year | | $ | 32,534,417 | | | $ | 30,532,559 | | |
| At end of year | | $ | 26,501,779 | | | $ | 32,534,417 | | |
See notes to financial statements
7
Eaton Vance Tax-Managed Small-Cap Value Fund as of October 31, 2008
FINANCIAL STATEMENTS CONT'D
Financial Highlights
| | | Class A | |
| | | Year Ended October 31, | |
| | | 2008 | | 2007 | | 2006 | | 2005 | | 2004 | |
| Net asset value — Beginning of year | | $ | 16.050 | | | $ | 15.400 | | | $ | 14.640 | | | $ | 13.010 | | | $ | 11.420 | | |
| Income (loss) from operations | |
| Net investment loss(1) | | $ | (0.003 | ) | | $ | (0.058 | ) | | $ | (0.066 | ) | | $ | (0.087 | ) | | $ | (0.082 | ) | |
| Net realized and unrealized gain (loss) | | | (3.146 | ) | | | 1.857 | | | | 1.644 | | | | 1.717 | | | | 1.672 | | |
| Total income (loss) from operations | | $ | (3.149 | ) | | $ | 1.799 | | | $ | 1.578 | | | $ | 1.630 | | | $ | 1.590 | | |
| Less distributions | |
| From net realized gain | | $ | (1.501 | ) | | $ | (1.149 | ) | | $ | (0.818 | ) | | $ | — | | | $ | — | | |
| Total distributions | | $ | (1.501 | ) | | $ | (1.149 | ) | | $ | (0.818 | ) | | $ | — | | | $ | — | | |
| Net asset value — End of year | | $ | 11.400 | | | $ | 16.050 | | | $ | 15.400 | | | $ | 14.640 | | | $ | 13.010 | | |
| Total Return(2) | | | (21.61 | )% | | | 12.30 | % | | | 11.24 | % | | | 12.53 | % | | | 13.92 | % | |
| Ratios/Supplemental Data | |
| Net assets, end of year (000's omitted) | | $ | 17,628 | | | $ | 18,978 | | | $ | 15,695 | | | $ | 14,303 | | | $ | 10,772 | | |
| Ratios (As a percentage of average daily net assets): | |
| Expenses before custodian fee reduction(3)(4)(5) | | | 1.65 | % | | | 1.69 | % | | | 1.75 | % | | | 1.75 | % | | | 1.75 | % | |
| Net investment loss | | | (0.02 | )% | | | (0.37 | )% | | | (0.44 | )% | | | (0.61 | )% | | | (0.67 | )% | |
| Portfolio Turnover of the Portfolio | | | 103 | % | | | 80 | % | | | 49 | % | | | 24 | % | | | 12 | % | |
(1) Computed using average shares outstanding.
(2) Returns are historical and are calculated by determining the percentage change in net asset value with all distributions reinvested.
(3) Includes the Fund's share of the Portfolio's allocated expenses.
(4) The administrator subsidized certain operating expenses (equal to 0.32%, 0.32%, 0.26%, 0.28% and 0.35% of average daily net assets for the years ended October 31, 2008, 2007, 2006, 2005 and 2004, respectively). A portion of the subsidy was borne by the sub-adviser of the Portfolio.
(5) Excludes the effect of custody fee credits, if any, of less than 0.005%.
See notes to financial statements
8
Eaton Vance Tax-Managed Small-Cap Value Fund as of October 31, 2008
FINANCIAL STATEMENTS CONT'D
Financial Highlights
| | | Class B | |
| | | Year Ended October 31, | |
| | | 2008 | | 2007 | | 2006 | | 2005 | | 2004 | |
| Net asset value — Beginning of year | | $ | 15.330 | | | $ | 14.870 | | | $ | 14.260 | | | $ | 12.770 | | | $ | 11.290 | | |
| Income (loss) from operations | |
| Net investment loss(1) | | $ | (0.102 | ) | | $ | (0.168 | ) | | $ | (0.174 | ) | | $ | (0.189 | ) | | $ | (0.171 | ) | |
| Net realized and unrealized gain (loss) | | | (2.977 | ) | | | 1.777 | | | | 1.602 | | | | 1.679 | | | | 1.651 | | |
| Total income (loss) from operations | | $ | (3.079 | ) | | $ | 1.609 | | | $ | 1.428 | | | $ | 1.490 | | | $ | 1.480 | | |
| Less distributions | |
| From net realized gain | | $ | (1.501 | ) | | $ | (1.149 | ) | | $ | (0.818 | ) | | $ | — | | | $ | — | | |
| Total distributions | | $ | (1.501 | ) | | $ | (1.149 | ) | | $ | (0.818 | ) | | $ | — | | | $ | — | | |
| Net asset value — End of year | | $ | 10.750 | | | $ | 15.330 | | | $ | 14.870 | | | $ | 14.260 | | | $ | 12.770 | | |
| Total Return(2) | | | (22.15 | )% | | | 11.41 | % | | | 10.45 | % | | | 11.67 | % | | | 13.11 | % | |
| Ratios/Supplemental Data | |
| Net assets, end of year (000's omitted) | | $ | 3,538 | | | $ | 6,412 | | | $ | 7,033 | | | $ | 7,802 | | | $ | 7,784 | | |
| Ratios (As a percentage of average daily net assets): | |
| Expenses before custodian fee reduction(3)(4)(5) | | | 2.40 | % | | | 2.44 | % | | | 2.50 | % | | | 2.50 | % | | | 2.50 | % | |
| Net investment loss | | | (0.79 | )% | | | (1.12 | )% | | | (1.20 | )% | | | (1.36 | )% | | | (1.41 | )% | |
| Portfolio Turnover of the Portfolio | | | 103 | % | | | 80 | % | | | 49 | % | | | 24 | % | | | 12 | % | |
(1) Computed using average shares outstanding.
(2) Returns are historical and are calculated by determining the percentage change in net asset value with all distributions reinvested.
(3) Includes the Fund's share of the Portfolio's allocated expenses.
(4) The administrator subsidized certain operating expenses (equal to 0.32%, 0.32%, 0.26%, 0.28% and 0.35% of average daily net assets for the years ended October 31, 2008, 2007, 2006, 2005 and 2004, respectively). A portion of the subsidy was borne by the sub-adviser of the Portfolio.
(5) Excludes the effect of custody fee credits, if any, of less than 0.005%.
See notes to financial statements
9
Eaton Vance Tax-Managed Small-Cap Value Fund as of October 31, 2008
FINANCIAL STATEMENTS CONT'D
Financial Highlights
| | | Class C | |
| | | Year Ended October 31, | |
| | | 2008 | | 2007 | | 2006 | | 2005 | | 2004 | |
| Net asset value — Beginning of year | | $ | 15.350 | | | $ | 14.880 | | | $ | 14.270 | | | $ | 12.780 | | | $ | 11.290 | | |
| Income (loss) from operations | |
| Net investment loss(1) | | $ | (0.100 | ) | | $ | (0.169 | ) | | $ | (0.174 | ) | | $ | (0.189 | ) | | $ | (0.171 | ) | |
| Net realized and unrealized gain (loss) | | | (2.989 | ) | | | 1.788 | | | | 1.602 | | | | 1.679 | | | | 1.661 | | |
| Total income (loss) from operations | | $ | (3.089 | ) | | $ | 1.619 | | | $ | 1.428 | | | $ | 1.490 | | | $ | 1.490 | | |
| Less distributions | |
| From net realized gain | | $ | (1.501 | ) | | $ | (1.149 | ) | | $ | (0.818 | ) | | $ | — | | | $ | — | | |
| Total distributions | | $ | (1.501 | ) | | $ | (1.149 | ) | | $ | (0.818 | ) | | $ | — | | | $ | — | | |
| Net asset value — End of year | | $ | 10.760 | | | $ | 15.350 | | | $ | 14.880 | | | $ | 14.270 | | | $ | 12.780 | | |
| Total Return(2) | | | (22.19 | )% | | | 11.47 | % | | | 10.44 | % | | | 11.66 | % | | | 13.20 | % | |
| Ratios/Supplemental Data | |
| Net assets, end of year (000's omitted) | | $ | 5,336 | | | $ | 7,145 | | | $ | 7,805 | | | $ | 6,968 | | | $ | 5,179 | | |
| Ratios (As a percentage of average daily net assets): | |
| Expenses before custodian fee reduction(3)(4)(5) | | | 2.40 | % | | | 2.44 | % | | | 2.50 | % | | | 2.50 | % | | | 2.50 | % | |
| Net investment loss | | | (0.78 | )% | | | (1.12 | )% | | | (1.19 | )% | | | (1.36 | )% | | | (1.42 | )% | |
| Portfolio Turnover of the Portfolio | | | 103 | % | | | 80 | % | | | 49 | % | | | 24 | % | | | 12 | % | |
(1) Computed using average shares outstanding.
(2) Returns are historical and are calculated by determining the percentage change in net asset value with all distributions reinvested.
(3) Includes the Fund's share of the Portfolio's allocated expenses.
(4) The administrator subsidized certain operating expenses (equal to 0.32%, 0.32%, 0.26%, 0.28% and 0.35% of average daily net assets for the years ended October 31, 2008, 2007, 2006, 2005 and 2004, respectively). A portion of the subsidy was borne by the sub-adviser of the Portfolio.
(5) Excludes the effect of custody fee credits, if any, of less than 0.005%.
See notes to financial statements
10
Eaton Vance Tax-Managed Small-Cap Value Fund as of October 31, 2008
NOTES TO FINANCIAL STATEMENTS
1 Significant Accounting Policies
Eaton Vance Tax-Managed Small-Cap Value Fund (the Fund) is a diversified series of Eaton Vance Mutual Funds Trust (the Trust). The Trust is a Massachusetts business trust registered under the Investment Company Act of 1940, as amended (the 1940 Act), as an open-end management investment company. The Fund offers three classes of shares. Class A shares are generally sold subject to a sales charge imposed at time of purchase. Class B and Class C shares are sold at net asset value and are generally subject to a contingent deferred sales charge (see Note 5). Class B shares automatically convert to Class A shares eight years after their purchase as described in the Fund's prospectus. Each class represents a pro-rata interest in the Fund, but votes separately on class-specific matters and (as noted below) is subject to different expenses. Realized and unrealized gains and losses and net investment income and losses, other than class-sp ecific expenses, are allocated daily to each class of shares based on the relative net assets of each class to the total net assets of the Fund. Each class of shares differs in its distribution plan and certain other class-specific expenses. The Fund invests all of its investable assets in interests in Tax-Managed Small-Cap Value Portfolio (the Portfolio), a New York trust, having the same investment objective and policies as the Fund. The value of the Fund's investment in the Portfolio reflects the Fund's proportionate interest in the net assets of the Portfolio (42.9% at October 31, 2008). The performance of the Fund is directly affected by the performance of the Portfolio. The financial statements of the Portfolio, including the portfolio of investments, are included elsewhere in this report and should be read in conjunction with the Fund's financial statements.
The following is a summary of significant accounting policies of the Fund. The policies are in conformity with accounting principles generally accepted in the United States of America.
A Investment Valuation — Valuation of securities by the Portfolio is discussed in Note 1A of the Portfolio's Notes to Financial Statements, which are included elsewhere in this report.
B Income — The Fund's net investment income or loss consists of the Fund's pro-rata share of the net investment income or loss of the Portfolio, less all actual and accrued expenses of the Fund.
C Federal Taxes — The Fund's policy is to comply with the provisions of the Internal Revenue Code applicable to regulated investment companies and to distribute to shareholders each year substantially all of its net investment income, and all or substantially all of its net realized capital gains. Accordingly, no provision for federal income or excise tax is necessary. At October 31, 2008, the Fund, for federal income tax purposes, had a capital loss carryforward of $501,958 which will reduce its taxable income arising from future net realized gains on investment transactions, if any, to the extent permitted by the Internal Revenue Code, and thus will reduce the amount of distributions to shareholders which would otherwise be necessary to relieve the Fund of any liability for federal income or excise tax. Such capital loss carryforward will expire on October 31, 2016.
As of October 31, 2008, the Fund had no uncertain tax positions that would require financial statement recognition, de-recognition, or disclosure. Each of the Fund's federal tax returns filed in the 3-year period ended October 31, 2008 remains subject to examination by the Internal Revenue Service.
D Expenses — The majority of expenses of the Trust are directly identifiable to an individual fund. Expenses which are not readily identifiable to a specific fund are allocated taking into consideration, among other things, the nature and type of expense and the relative size of the funds.
E Expense Reduction — State Street Bank and Trust Company (SSBT) serves as custodian of the Fund. Pursuant to the custodian agreement, SSBT receives a fee reduced by credits, which are determined based on the average daily cash balance the Fund maintains with SSBT. All credit balances, if any, used to reduce the Fund's custodian fees are reported as a reduction of expenses in the Statement of Operations.
F Use of Estimates — The preparation of the financial statements in conformity with accounting principles generally accepted in the United States of America requires management to make estimates and assumptions that affect the reported amounts of assets and liabilities at the date of the financial statements and the reported amounts of income and expense during the reporting period. Actual results could differ from those estimates.
G Indemnifications — Under the Trust's organizational documents, its officers and Trustees may be indemnified against certain liabilities and expenses arising out of the performance of their duties to the Fund, and shareholders are indemnified against personal liability for the obligations of the Trust. Additionally, in the normal
11
Eaton Vance Tax-Managed Small-Cap Value Fund as of October 31, 2008
NOTES TO FINANCIAL STATEMENTS CONT'D
course of business, the Fund enters into agreements with service providers that may contain indemnification clauses. The Fund's maximum exposure under these arrangements is unknown as this would involve future claims that may be made against the Fund that have not yet occurred.
H Other — Investment transactions are accounted for on a trade date basis. Dividends to shareholders are recorded on the ex-dividend date.
2 Distributions to Shareholders
It is the present policy of the Fund to make at least one distribution annually (normally in December) of all or substantially all of its net investment income and to distribute annually all or substantially all of its net realized capital gains (reduced by available capital loss carryforwards from prior years, if any). Distributions are declared separately for each class of shares. Shareholders may reinvest income and capital gain distributions in additional shares of the same class of the Fund at the net asset value as of the ex-dividend date or, at the election of the shareholder, receive distributions in cash. The Fund distinguishes between distributions on a tax basis and a financial reporting basis. Accounting principles generally accepted in the United States of America require that only distributions in excess of tax basis earnings and profits be reported in the financial statements as a return of capital. Permanent diff erences between book and tax accounting relating to distributions are reclassified to paid-in capital.
The tax character of distributions declared for the years ended October 31, 2008 and October 31, 2007 was as follows:
| | | Year Ended October 31, | |
| | | 2008 | | 2007 | |
| Distributions declared from: | |
| Long-term capital gains | | $ | 3,052,325 | | | $ | 2,270,136 | | |
During the year ended October 31, 2008, accumulated net realized loss was decreased by $1,805, accumulated net investment loss was decreased by $90,956 and paid-in capital was decreased by $92,761 due to differences between book and tax accounting, primarily for net operating losses. These reclassifications had no effect on the net assets or net asset value per share of the Fund.
As of October 31, 2008, the components of distributable earnings (accumulated losses) and unrealized appreciation (depreciation) on a tax basis were as follows:
| Capital loss carryforward | | $ | (501,958 | ) | |
| Net unrealized appreciation | | $ | 1,640,310 | | |
The differences between components of distributable earnings (accumulated losses) on a tax basis and the amounts reflected in the Statement of Assets and Liabilities are primarily due to wash sales and partnership allocations.
3 Transactions with Affiliates
The administration fee is earned by Eaton Vance Management (EVM) as compensation for administrative services rendered to the Fund. The fee is computed at an annual rate of 0.15% of the Fund's average daily net assets. For the year ended October 31, 2008, the administration fee amounted to $43,987. EVM and the sub-adviser of the Portfolio, Fox Asset Management LLC (Fox), have agreed to reimburse the Fund's operating expenses to the extent that they exceed 1.65% annually of the Fund's average daily net assets for Class A and 2.40% annually of the Fund's average daily net assets for Class B and Class C. This agreement may be changed or terminated after April 30, 2010. Pursuant to this agreement, EVM and Fox were allocated $23,647 and $70,940, respectively, of the Fund's operating expenses for the year ended October 31, 2008. The Portfolio has engaged Boston Management and Research (BMR), a subsidiary of EVM, to render investment ad visory services. See Note 2 of the Portfolio's Notes to Financial Statements which are included elsewhere in this report. EVM serves as the sub-transfer agent of the Fund and receives from the transfer agent an aggregate fee based upon the actual expenses incurred by EVM in the performance of these services. For the year ended October 31, 2008, EVM earned $2,967 in sub-transfer agent fees. The Fund was informed that Eaton Vance Distributors, Inc. (EVD), an affiliate of EVM and the Fund's principal underwriter, received $4,843 as its portion of the sales charge on sales of Class A shares for the year ended October 31, 2008. EVD also received distribution and service fees from Class A, Class B and Class C shares (see Note 4) and contingent deferred sales charges (see Note 5).
Except for Trustees of the Fund and the Portfolio who are not members of EVM's or BMR's organizations, officers and Trustees receive remuneration for their services to the Fund out of the investment adviser fee. Certain officers and Trustees of the Fund and the Portfolio are officers of the above organizations.
12
Eaton Vance Tax-Managed Small-Cap Value Fund as of October 31, 2008
NOTES TO FINANCIAL STATEMENTS CONT'D
4 Distribution Plans
The Fund has in effect a distribution plan for Class A shares (Class A Plan) pursuant to Rule 12b-1 under the 1940 Act. The Class A Plan provides that the Fund will pay EVD a distribution and service fee of 0.25% per annum of its average daily net assets attributable to Class A shares for distribution services and facilities provided to the Fund by EVD, as well as for personal services and/or the maintenance of shareholder accounts. Distribution and service fees paid or accrued to EVD for the year ended October 31, 2008 amounted to $45,565 for Class A shares. The Fund also has in effect distribution plans for Class B shares (Class B Plan) and Class C shares (Class C Plan) pursuant to Rule 12b-1 under the 1940 Act. The Class B and Class C Plans require the Fund to pay EVD amounts equal to 0.75% per annum of its average daily net assets attributable to Class B and Class C shares for providing ongoing distribution services and faci lities to the Fund. The Fund will automatically discontinue payments to EVD during any period in which there are no outstanding Uncovered Distribution Charges, which are equivalent to the sum of (i) 6.25% of the aggregate amount received by the Fund for Class B and Class C shares sold, plus (ii) interest calculated by applying the rate of 1% over the prevailing prime rate to the outstanding balance of Uncovered Distribution Charges of EVD of each respective class, reduced by the aggregate amount of contingent deferred sales charges (see Note 5) and amounts theretofore paid or payable to EVD by each respective class. For the year ended October 31, 2008, the Fund paid or accrued to EVD $37,399 and $45,841 for Class B and Class C shares, respectively, representing 0.75% of the average daily net assets of Class B and Class C shares. At October 31, 2008, the amounts of Uncovered Distribution Charges of EVD calculated under the Class B and Class C Plans were approximately $63,000 and $460,000, respectively.
The Class B and Class C Plans also authorize the Fund to make payments of service fees to EVD, investment dealers and other persons in amounts not exceeding 0.25% per annum of its average daily net assets attributable to that class. Service fees paid or accrued are for personal services and/or the maintenance of shareholder accounts. They are separate and distinct from the Class B and Class C sales commissions and distribution fees payable to EVD and, as such, are not subject to automatic discontinuance when there are no outstanding Uncovered Distribution Charges of EVD. Service fees paid or accrued for the year ended October 31, 2008 amounted to $12,466 and $15,280 for Class B and Class C shares, respectively.
5 Contingent Deferred Sales Charges
A contingent deferred sales charge (CDSC) generally is imposed on redemptions of Class B shares made within six years of purchase and on redemptions of Class C shares made within one year of purchase. Class A shares may be subject to a CDSC up to 1% if redeemed within two years of purchase (depending on the circumstances of purchase). Generally, the CDSC is based upon the lower of the net asset value at date of redemption or date of purchase. No charge is levied on shares acquired by reinvestment of dividends or capital gain distributions. The CDSC for Class B shares is imposed at declining rates that begin at 5% in the case of redemptions in the first and second year after purchase, declining one percentage point each subsequent year. Class C shares are subject to a 1% CDSC if redeemed within one year of purchase. No CDSC is levied on shares which have been sold to EVM or its affiliates or to their respective employees or clien ts and may be waived under certain other limited conditions. CDSCs received on Class B and Class C redemptions are paid to EVD to reduce the amount of Uncovered Distribution Charges calculated under the Fund's Class B and Class C Plans. CDSCs received on Class B and Class C redemptions when no Uncovered Distribution Charges exist are credited to the Fund. For the year ended October 31, 2008, the Fund was informed that EVD received approximately $200, $7,000 and $1,000 of CDSCs paid by Class A, Class B and Class C shareholders, respectively.
6 Investment Transactions
For the year ended October 31, 2008, increases and decreases in the Fund's investment in the Portfolio aggregated $10,077,255 and $9,173,427, respectively.
7 Shares of Beneficial Interest
The Fund's Declaration of Trust permits the Trustees to issue an unlimited number of full and fractional shares of beneficial interest (without par value). Such shares may be issued in a number of different series (such as the Fund) and classes. Transactions in Fund shares were as follows:
| | | Year Ended October 31, | |
| Class A | | 2008 | | 2007 | |
| Sales | | | 635,154 | | | | 252,535 | | |
Issued to shareholders electing to
receive payments of distributions
in Fund shares | | | 103,717 | | | | 66,027 | | |
| Redemptions | | | (412,112 | ) | | | (188,524 | ) | |
| Exchange from Class B shares | | | 37,769 | | | | 33,476 | | |
| Net increase | | | 364,528 | | | | 163,514 | | |
13
Eaton Vance Tax-Managed Small-Cap Value Fund as of October 31, 2008
NOTES TO FINANCIAL STATEMENTS CONT'D
| | | Year Ended October 31, | |
| Class B | | 2008 | | 2007 | |
| Sales | | | 27,054 | | | | 27,844 | | |
Issued to shareholders electing to
receive payments of distributions
in Fund shares | | | 34,094 | | | | 28,198 | | |
| Redemptions | | | (110,917 | ) | | | (75,874 | ) | |
| Exchange to Class A shares | | | (39,377 | ) | | | (34,916 | ) | |
| Net decrease | | | (89,146 | ) | | | (54,748 | ) | |
| | | Year Ended October 31, | |
| Class C | | 2008 | | 2007 | |
| Sales | | | 114,504 | | | | 74,710 | | |
Issued to shareholders electing to
receive payments of distributions
in Fund shares | | | 38,960 | | | | 28,624 | | |
| Redemptions | | | (123,128 | ) | | | (162,266 | ) | |
| Net increase (decrease) | | | 30,336 | | | | (58,932 | ) | |
8 Recently Issued Accounting Pronouncement
In September 2006, the Financial Accounting Standards Board issued Statement of Financial Accounting Standards No. 157 (FAS 157), "Fair Value Measurements". FAS 157 defines fair value, establishes a framework for measuring fair value in accordance with accounting principles generally accepted in the United States of America and expands disclosure about fair value measurements. FAS 157 is effective for fiscal years beginning after November 15, 2007. As of October 31, 2008, management does not believe the adoption of FAS 157 will impact the amounts reported in the financial statements; however, additional disclosures may be required about the inputs used to develop the measurements of fair value and the effect of certain of the measurements on changes in net assets for the period.
14
Eaton Vance Tax-Managed Small-Cap Value Fund as of October 31, 2008
REPORT OF INDEPENDENT REGISTERED PUBLIC ACCOUNTING FIRM
To the Trustees of Eaton Vance Mutual Funds Trust and Shareholders of Eaton Vance Tax-Managed Small-Cap Value Fund:
We have audited the accompanying statement of assets and liabilities of Eaton Vance Tax-Managed Small-Cap Value Fund (the "Fund") (one of the series of Eaton Vance Mutual Funds Trust) as of October 31, 2008, and the related statement of operations for the year then ended, the statements of changes in net assets for each of the two years in the period then ended, and the financial highlights for each of the five years in the period then ended. These financial statements and financial highlights are the responsibility of the Fund's management. Our responsibility is to express an opinion on these financial statements and financial highlights based on our audits.
We conducted our audits in accordance with the standards of the Public Company Accounting Oversight Board (United States). Those standards require that we plan and perform the audit to obtain reasonable assurance about whether the financial statements and financial highlights are free of material misstatement. The Fund is not required to have, nor were we engaged to perform, an audit of its internal control over financial reporting. Our audits included consideration of internal control over financial reporting as a basis for designing audit procedures that are appropriate in the circumstances, but not for the purpose of expressing an opinion on the effectiveness of the Fund's internal control over financial reporting. Accordingly, we express no such opinion. An audit also includes examining, on a test basis, evidence supporting the amounts and disclosures in the financial statements, assessing the accounting principles used and significant estimates made by management, as well as evaluating the overall financial statement presentation. We believe that our audits provide a reasonable basis for our opinion.
In our opinion, the financial statements and financial highlights referred to above present fairly, in all material respects, the financial position of Eaton Vance Tax-Managed Small-Cap Value Fund as of October 31, 2008, the results of its operations for the year then ended, the changes in its net assets for each of the two years in the period then ended, and the financial highlights for each of the five years in the period then ended, in conformity with accounting principles generally accepted in the United States of America.
DELOITTE & TOUCHE LLP
Boston, Massachusetts
December 15, 2008
15
Eaton Vance Tax-Managed Small-Cap Value Fund as of October 31, 2008
FEDERAL TAX INFORMATION (Unaudited)
The Form 1099-DIV you receive in January 2009 will show the tax status of all distributions paid to your account in calendar year 2008. Shareholders are advised to consult their own tax adviser with respect to the tax consequences of their investment in the Fund. As required by the Internal Revenue Code regulations, shareholders must be notified within 60 days of the Fund's fiscal year end regarding the status of capital gain dividends.
Capital Gain Dividends — The Fund designates $3,052,325 as a capital gain dividend.
16
Tax-Managed Small-Cap Value Portfolio as of October 31, 2008
PORTFOLIO OF INVESTMENTS
| Common Stocks — 88.5% | |
| Security | | Shares | | Value | |
| Auto Components — 3.2% | |
| BorgWarner, Inc. | | | 47,300 | | | $ | 1,062,831 | | |
| Cooper Tire & Rubber Co. | | | 119,500 | | | | 911,785 | | |
| | | $ | 1,974,616 | | |
| Chemicals — 1.8% | |
| RPM International, Inc. | | | 78,600 | | | $ | 1,116,120 | | |
| | | $ | 1,116,120 | | |
| Commercial Banks — 16.4% | |
| First Midwest Bancorp, Inc. | | | 49,400 | | | $ | 1,097,174 | | |
| Glacier Bancorp, Inc. | | | 67,500 | | | | 1,361,475 | | |
| National Penn Bancshares, Inc. | | | 151,300 | | | | 2,563,022 | | |
| Prosperity Bancshares, Inc. | | | 45,500 | | | | 1,511,055 | | |
| Sterling Bancshares, Inc. | | | 176,200 | | | | 1,402,552 | | |
| Trustmark Corp. | | | 108,100 | | | | 2,218,212 | | |
| | | $ | 10,153,490 | | |
| Communications Equipment — 1.0% | |
| NETGEAR, Inc.(1) | | | 56,500 | | | $ | 624,325 | | |
| | | $ | 624,325 | | |
| Containers & Packaging — 2.0% | |
| AptarGroup, Inc. | | | 40,700 | | | $ | 1,234,024 | | |
| | | $ | 1,234,024 | | |
| Electric Utilities — 3.7% | |
| Cleco Corp. | | | 66,900 | | | $ | 1,539,369 | | |
| Westar Energy, Inc. | | | 38,600 | | | | 752,314 | | |
| | | $ | 2,291,683 | | |
| Electrical Equipment — 2.1% | |
| A.O. Smith Corp. | | | 41,000 | | | $ | 1,293,550 | | |
| | | $ | 1,293,550 | | |
| Energy Equipment & Services — 3.4% | |
| Bristow Group, Inc.(1) | | | 50,000 | | | $ | 1,238,500 | | |
| Oil States International, Inc.(1) | | | 38,400 | | | | 888,192 | | |
| | | $ | 2,126,692 | | |
| Security | | Shares | | Value | |
| Food & Staples Retailing — 2.5% | |
| BJ's Wholesale Club, Inc.(1) | | | 44,000 | | | $ | 1,548,800 | | |
| | | $ | 1,548,800 | | |
| Food Products — 2.1% | |
| Chiquita Brands International, Inc.(1) | | | 93,700 | | | $ | 1,279,005 | | |
| | | $ | 1,279,005 | | |
| Gas Utilities — 4.2% | |
| Piedmont Natural Gas Co., Inc. | | | 79,400 | | | $ | 2,613,848 | | |
| | | $ | 2,613,848 | | |
| Health Care Equipment & Supplies — 4.8% | |
| Teleflex, Inc. | | | 30,300 | | | $ | 1,605,597 | | |
| West Pharmaceutical Services, Inc. | | | 33,500 | | | | 1,337,320 | | |
| | | $ | 2,942,917 | | |
| Health Care Providers & Services — 2.2% | |
| Owens & Minor, Inc. | | | 31,400 | | | $ | 1,358,678 | | |
| | | $ | 1,358,678 | | |
| Hotels, Restaurants & Leisure — 2.5% | |
| Jack in the Box, Inc.(1) | | | 75,800 | | | $ | 1,523,580 | | |
| | | $ | 1,523,580 | | |
| Household Durables — 2.6% | |
| Tupperware Brands Corp. | | | 62,600 | | | $ | 1,583,780 | | |
| | | $ | 1,583,780 | | |
| Household Products — 2.4% | |
| Church & Dwight Co., Inc. | | | 25,500 | | | $ | 1,506,795 | | |
| | | $ | 1,506,795 | | |
| Insurance — 3.7% | |
| IPC Holdings, Ltd. | | | 52,600 | | | $ | 1,452,286 | | |
| Zenith National Insurance Corp. | | | 25,200 | | | | 828,072 | | |
| | | $ | 2,280,358 | | |
See notes to financial statements
17
Tax-Managed Small-Cap Value Portfolio as of October 31, 2008
PORTFOLIO OF INVESTMENTS CONT'D
| Security | | Shares | | Value | |
| IT Services — 2.1% | |
| MAXIMUS, Inc. | | | 21,000 | | | $ | 670,740 | | |
| Ness Technologies, Inc.(1) | | | 87,000 | | | | 642,930 | | |
| | | $ | 1,313,670 | | |
| Machinery — 4.3% | |
| Barnes Group, Inc. | | | 24,600 | | | $ | 356,946 | | |
| Nordson Corp. | | | 35,400 | | | | 1,307,322 | | |
| Wabtec Corp. | | | 25,400 | | | | 1,009,904 | | |
| | | $ | 2,674,172 | | |
| Oil, Gas & Consumable Fuels — 3.1% | |
| Rosetta Resources, Inc.(1) | | | 58,600 | | | $ | 618,230 | | |
| Walter Industries, Inc. | | | 32,700 | | | | 1,267,125 | | |
| | | $ | 1,885,355 | | |
| Personal Products — 2.7% | |
| Chattem, Inc.(1) | | | 21,650 | | | $ | 1,638,256 | | |
| | | $ | 1,638,256 | | |
| Semiconductors & Semiconductor Equipment — 2.9% | |
| ON Semiconductor Corp.(1) | | | 350,500 | | | $ | 1,791,055 | | |
| | | $ | 1,791,055 | | |
| Specialty Retail — 2.6% | |
| Dick's Sporting Goods, Inc.(1) | | | 53,000 | | | $ | 811,960 | | |
| Stage Stores, Inc. | | | 106,500 | | | | 821,115 | | |
| | | $ | 1,633,075 | | |
| Textiles, Apparel & Luxury Goods — 4.0% | |
| Carter's, Inc.(1) | | | 115,700 | | | $ | 2,457,468 | | |
| | | $ | 2,457,468 | | |
| Thrifts & Mortgage Finance — 6.2% | |
| Astoria Financial Corp. | | | 70,500 | | | $ | 1,340,910 | | |
| First Niagara Financial Group, Inc. | | | 157,100 | | | | 2,477,467 | | |
| | | $ | 3,818,377 | | |
Total Common Stocks
(identified cost $51,954,518) | | $ | 54,663,689 | | |
| Investment Funds — 4.5% | |
| Security | | Shares | | Value | |
| iShares Russell 2000 Value Index Fund | | | 53,500 | | | $ | 2,820,520 | | |
| | | $ | 2,820,520 | | |
Total Investment Funds
(identified cost $2,625,138) | | $ | 2,820,520 | | |
Total Investments — 93.0%
(identified cost $54,579,656) | | $ | 57,484,209 | | |
| Other Assets, Less Liabilities — 7.0% | | $ | 4,293,886 | | |
| Net Assets — 100.0% | | $ | 61,778,095 | | |
(1) Non-income producing security.
See notes to financial statements
18
Tax-Managed Small-Cap Value Portfolio as of October 31, 2008
FINANCIAL STATEMENTS
Statement of Assets and Liabilities
As of October 31, 2008
| Assets | |
| Investments, at value (identified cost, $54,579,656) | | $ | 57,484,209 | | |
| Cash | | | 7,170,126 | | |
| Receivable for investments sold | | | 2,637,020 | | |
| Dividends and interest receivable | | | 108,768 | | |
| Total assets | | $ | 67,400,123 | | |
| Liabilities | |
| Payable for investments purchased | | $ | 5,528,431 | | |
| Payable to affiliate for investment adviser fee | | | 47,290 | | |
| Payable to affiliate for Trustees' fees | | | 207 | | |
| Accrued expenses | | | 46,100 | | |
| Total liabilities | | $ | 5,622,028 | | |
| Net Assets applicable to investors' interest in Portfolio | | $ | 61,778,095 | | |
| Sources of Net Assets | |
| Net proceeds from capital contributions and withdrawals | | $ | 58,873,542 | | |
| Net unrealized appreciation (computed on the basis of identified cost) | | | 2,904,553 | | |
| Total | | $ | 61,778,095 | | |
Statement of Operations
For the Year Ended
October 31, 2008
| Investment Income | |
| Dividends | | $ | 1,037,905 | | |
| Interest | | | 74,813 | | |
| Total investment income | | $ | 1,112,718 | | |
| Expenses | |
| Investment adviser fee | | $ | 680,971 | | |
| Trustees' fees and expenses | | | 3,846 | | |
| Custodian fee | | | 54,890 | | |
| Legal and accounting services | | | 22,927 | | |
| Miscellaneous | | | 1,532 | | |
| Total expenses | | $ | 764,166 | | |
| Net investment income | | $ | 348,552 | | |
| Realized and Unrealized Gain (Loss) | |
Net realized gain (loss) —
Investment transactions (identified cost basis) | | $ | (2,701,584 | ) | |
| Net realized loss | | $ | (2,701,584 | ) | |
Change in unrealized appreciation (depreciation) —
Investments (identified cost basis) | | $ | (13,498,031 | ) | |
| Net change in unrealized appreciation (depreciation) | | $ | (13,498,031 | ) | |
| Net realized and unrealized loss | | $ | (16,199,615 | ) | |
| Net decrease in net assets from operations | | $ | (15,851,063 | ) | |
See notes to financial statements
19
Tax-Managed Small-Cap Value Portfolio as of October 31, 2008
FINANCIAL STATEMENTS CONT'D
Statements of Changes in Net Assets
Increase (Decrease)
in Net Assets | | Year Ended
October 31, 2008 | | Year Ended
October 31, 2007 | |
From operations —
Net investment income | | $ | 348,552 | | | $ | 108,016 | | |
Net realized gain (loss) from
investment transactions | | | (2,701,584 | ) | | | 6,466,302 | | |
Net change in unrealized
appreciation (depreciation)
from investments | | | (13,498,031 | ) | | | 321,816 | | |
Net increase (decrease) in net assets
from operations | | $ | (15,851,063 | ) | | $ | 6,896,134 | | |
Capital transactions —
Contributions | | $ | 27,291,365 | | | $ | 5,518,111 | | |
| Withdrawals | | | (9,173,427 | ) | | | (7,234,160 | ) | |
Net increase (decrease) in net assets
from capital transactions | | $ | 18,117,938 | | | $ | (1,716,049 | ) | |
| Net increase in net assets | | $ | 2,266,875 | | | $ | 5,180,085 | | |
| Net Assets | |
| At beginning of year | | $ | 59,511,220 | | | $ | 54,331,135 | | |
| At end of year | | $ | 61,778,095 | | | $ | 59,511,220 | | |
See notes to financial statements
20
Tax-Managed Small-Cap Value Portfolio as of October 31, 2008
FINANCIAL STATEMENTS CONT'D
Supplementary Data
| | | Year Ended October 31, | |
| | | 2008 | | 2007 | | 2006 | | 2005 | | 2004 | |
| Ratios/Supplemental Data | |
| Ratios (As a percentage of average daily net assets): | |
| Expenses before custodian fee reduction(1) | | | 1.12 | % | | | 1.14 | % | | | 1.14 | % | | | 1.15 | % | | | 1.14 | % | |
| Net investment income (loss) | | | 0.51 | % | | | 0.19 | % | | | 0.17 | % | | | (0.00 | )%(2) | | | (0.06 | )% | |
| Portfolio Turnover | | | 103 | % | | | 80 | % | | | 49 | % | | | 24 | % | | | 12 | % | |
| Total Return | | | (21.19 | )% | | | 12.92 | % | | | 11.91 | % | | | 13.20 | % | | | 14.62 | % | |
| Net assets, end of year (000's omitted) | | $ | 61,778 | | | $ | 59,511 | | | $ | 54,331 | | | $ | 50,791 | | | $ | 53,226 | | |
(1) Excludes the effect of custody fee credits, if any, of less than 0.005%.
(2) Amounts to less than (0.01)%.
See notes to financial statements
21
Tax-Managed Small-Cap Value Portfolio as of October 31, 2008
NOTES TO FINANCIAL STATEMENTS
1 Significant Accounting Policies
Tax-Managed Small-Cap Value Portfolio (the Portfolio) is a New York trust registered under the Investment Company Act of 1940, as amended (the 1940 Act), as a diversified, open-end management investment company. The Portfolio's investment objective is to achieve long-term after-tax returns by investing in a diversified portfolio of value stocks of small-cap companies. The Declaration of Trust permits the Trustees to issue interests in the Portfolio. At October 31, 2008, Eaton Vance Tax-Managed Small-Cap Value Fund and Eaton Vance Tax-Managed Equity Asset Allocation Fund held an interest of 42.9% and 57.1%, respectively, in the Portfolio.
The following is a summary of significant accounting policies of the Portfolio. The policies are in conformity with accounting principles generally accepted in the United States of America.
A Investment Valuation — Equity securities listed on a U.S. securities exchange generally are valued at the last sale price on the day of valuation or, if no sales took place on such date, at the mean between the closing bid and asked prices therefore on the exchange where such securities are principally traded. Equity securities listed on the NASDAQ Global or Global Select Market generally are valued at the NASDAQ official closing price. Unlisted or listed securities for which closing sales prices or closing quotations are not available are valued at the mean between the latest available bid and asked prices or, in the case of preferred equity securities that are not listed or traded in the over-the-counter market, by an independent pricing service. Short-term debt secur ities with a remaining maturity of sixty days or less are valued at amortized cost, which approximates market value. If short-term debt securities are acquired with a remaining maturity of more than sixty days, they will be valued by a pricing service. Investments for which valuations or market quotations are not readily available are valued at fair value using methods determined in good faith by or at the direction of the Trustees of the Portfolio considering relevant factors, data and information including the market value of freely tradable securities of the same class in the principal market on which such securities are normally traded.
B Investment Transactions — Investment transactions for financial statement purposes are accounted for on a trade date basis. Realized gains and losses on investments sold are determined on the basis of identified cost.
C Income — Dividend income is recorded on the ex-dividend date for dividends received in cash and/or securities. Interest income is recorded on the basis of interest accrued, adjusted for amortization of premium or accretion of discount.
D Federal Taxes — The Portfolio has elected to be treated as a partnership for federal tax purposes. No provision is made by the Portfolio for federal or state taxes on any taxable income of the Portfolio because each investor in the Portfolio is ultimately responsible for the payment of any taxes on its share of taxable income. Since at least one of the Portfolio's investors is a regulated investment company that invests all or substantially all of its assets in the Portfolio, the Portfolio normally must satisfy the applicable source of income and diversification requirements (under the Internal Revenue Code) in order for its investors to satisfy them. The Portfolio will allocate, at least annually among its investors, each investor's distributive share of the Portfolio' s net investment income, net realized capital gains and any other items of income, gain, loss, deduction or credit.
As of October 31, 2008, the Portfolio had no uncertain tax positions that would require financial statement recognition, de-recognition, or disclosure. Each of the Portfolio's federal tax returns filed in the 3-year period ended October 31, 2008 remains subject to examination by the Internal Revenue Service.
E Expense Reduction — State Street Bank and Trust Company (SSBT) serves as custodian of the Portfolio. Pursuant to the custodian agreement, SSBT receives a fee reduced by credits, which are determined based on the average daily cash balance the Portfolio maintains with SSBT. All credit balances, if any, used to reduce the Portfolio's custodian fees are reported as a reduction of expenses in the Statement of Operations.
F Use of Estimates — The preparation of the financial statements in conformity with accounting principles generally accepted in the United States of America requires management to make estimates and assumptions that affect the reported amounts of assets and liabilities at the date of the financial statements and the reported amounts of income and expense during the reporting period. Actual results could differ from those estimates.
G Indemnifications — Under the Portfolio's organizational documents, its officers and Trustees may be indemnified against certain liabilities and expenses arising
22
Tax-Managed Small-Cap Value Portfolio as of October 31, 2008
NOTES TO FINANCIAL STATEMENTS CONT'D
out of the performance of their duties to the Portfolio. Interestholders in the Portfolio are jointly and severally liable for the liabilities and obligations of the Portfolio in the event that the Portfolio fails to satisfy such liabilities and obligations; provided, however, that, to the extent assets are available in the Portfolio, the Portfolio may, under certain circumstances, indemnify interestholders from and against any claim or liability to which such holder may become subject by reason of being or having been an interestholder in the Portfolio. Additionally, in the normal course of business, the Portfolio enters into agreements with service providers that may contain indemnification clauses. The Portfolio's maximum exposure under these arrangements is unknown as this would involve future claims that may be made against the Portfolio that have not yet occurred.
2 Investment Adviser Fee and
Other Transactions with Affiliates
The investment adviser fee is earned by Boston Management and Research (BMR), a subsidiary of Eaton Vance Management (EVM), as compensation for management and investment advisory services rendered to the Portfolio. The fee is computed at an annual rate of 1.00% of the Portfolio's average daily net assets up to $500 million and at reduced rates as daily net assets exceed that level, and is payable monthly. Pursuant to a sub-advisory agreement, BMR pays Fox Asset Management LLC (Fox), an affiliate of EVM, a portion of its adviser fee for sub-advisory services provided to the Portfolio. For the year ended October 31, 2008, the adviser fee was 1.00% of the Portfolio's average daily net assets and amounted to $680,971.
Except for Trustees of the Portfolio who are not members of EVM's or BMR's organizations, officers and Trustees receive remuneration for their services to the Portfolio out of the investment adviser fee. Trustees of the Portfolio who are not affiliated with the investment adviser may elect to defer receipt of all or a percentage of their annual fees in accordance with the terms of the Trustees Deferred Compensation Plan. For the year ended October 31, 2008, no significant amounts have been deferred. Certain officers and Trustees of the Portfolio are officers of the above organizations.
3 Purchases and Sales of Investments
Purchases and sales of investments, other than short-term obligations, aggregated $84,761,263 and $66,046,692, respectively, for the year ended October 31, 2008.
4 Federal Income Tax Basis of Ivestments
The cost and unrealized appreciation (depreciation) of investments of the Portfolio at October 31, 2008, as determined on a federal income tax basis, were as follows:
| Aggregate cost | | $ | 54,988,523 | | |
| Gross unrealized appreciation | | $ | 6,965,819 | | |
| Gross unrealized depreciation | | | (4,470,133 | ) | |
| Net unrealized appreciation | | $ | 2,495,686 | | |
5 Line of Credit
The Portfolio participates with other portfolios and funds managed by EVM and its affiliates in a $450 million unsecured line of credit agreement with a group of banks. Borrowings are made by the Portfolio solely to facilitate the handling of unusual and/or unanticipated short-term cash requirements. Interest is charged to the Portfolio based on its borrowings at an amount above either the Eurodollar rate or Federal Funds rate. In addition, a fee computed at an annual rate of 0.10% on the daily unused portion of the line of credit is allocated among the participating portfolios and funds at the end of each quarter. The Portfolio did not have any significant borrowings or allocated fees during the year ended October 31, 2008.
6 Recently Issued Accounting Pronouncement
In September 2006, the Financial Accounting Standards Board issued Statement of Financial Accounting Standards No. 157 (FAS 157), "Fair Value Measurements". FAS 157 defines fair value, establishes a framework for measuring fair value in accordance with accounting principles generally accepted in the United States of America and expands disclosure about fair value measurements. FAS 157 is effective for fiscal years beginning after November 15, 2007. As of October 31, 2008, management does not believe the adoption of FAS 157 will impact the amounts reported in the financial statements; however, additional disclosures may be required about the inputs used to develop the measurements of fair value and the effect of certain of the measurements on changes in net assets for the period.
23
Tax-Managed Small-Cap Value Portfolio as of October 31, 2008
REPORT OF INDEPENDENT REGISTERED PUBLIC ACCOUNTING FIRM
To the Trustees and Investors of
Tax-Managed Small-Cap Value Portfolio:
We have audited the accompanying statement of assets and liabilities of Tax-Managed Small-Cap Value Portfolio (the "Portfolio"), including the portfolio of investments, as of October 31, 2008, and the related statement of operations for the year then ended, the statements of changes in net assets for each of the two years in the period then ended, and the supplementary data for each of the five years in the period then ended. These financial statements and supplementary data are the responsibility of the Portfolio's management. Our responsibility is to express an opinion on these financial statements and supplementary data based on our audits.
We conducted our audits in accordance with the standards of the Public Company Accounting Oversight Board (United States). Those standards require that we plan and perform the audit to obtain reasonable assurance about whether the financial statements and supplementary data are free of material misstatement. The Portfolio is not required to have, nor were we engaged to perform, an audit of its internal control over financial reporting. Our audits included consideration of internal control over financial reporting as a basis for designing audit procedures that are appropriate in the circumstances, but not for the purpose of expressing an opinion on the effectiveness of the Portfolio's internal control over financial reporting. Accordingly, we express no such opinion. An audit also includes examining, on a test basis, evidence supporting the amounts and disclosures in the financial statements, assessing the accounting principles u sed and significant estimates made by management, as well as evaluating the overall financial statement presentation. Our procedures included confirmation of securities owned as of October 31, 2008, by correspondence with the custodian and brokers; where replies were not received from brokers, we performed other audit procedures. We believe that our audits provide a reasonable basis for our opinion.
In our opinion, the financial statements and supplementary data referred to above present fairly, in all material respects, the financial position of Tax-Managed Small-Cap Value Portfolio as of October 31, 2008, the results of its operations for the year then ended, the changes in its net assets for each of the two years in the period then ended, and the supplementary data for each of the five years in the period then ended, in conformity with accounting principles generally accepted in the United States of America.
DELOITTE & TOUCHE LLP
Boston, Massachusetts
December 15, 2008
24
Eaton Vance Tax-Managed Small-Cap Value Fund
Tax-Managed Small-Cap Value Portfolio
SPECIAL MEETING OF SHAREHOLDERS (Unaudited)
Eaton Vance Tax-Managed Small-Cap Value Fund
The Fund held a Special Meeting of Shareholders on November 14, 2008 to elect Trustees. The results of the vote were as follows:
| | | Number of Shares | |
| Nominee for Trustee | | For | | Withheld | |
| Benjamin C. Esty | | | 1,921,541 | | | | 4,390 | | |
| Thomas E. Faust Jr. | | | 1,921,541 | | | | 4,390 | | |
| Allen R. Freedman | | | 1,921,541 | | | | 4,390 | | |
| William H. Park | | | 1,920,312 | | | | 5,619 | | |
| Ronald A. Pearlman | | | 1,921,541 | | | | 4,390 | | |
| Helen Frame Peters | | | 1,921,541 | | | | 4,390 | | |
| Heidi L. Steiger | | | 1,921,541 | | | | 4,390 | | |
| Lynn A. Stout | | | 1,920,312 | | | | 5,619 | | |
| Ralph F. Verni | | | 1,920,312 | | | | 5,619 | | |
Each nominee was also elected a Trustee of Tax-Managed Small-Cap Value Portfolio.
Tax-Managed Small-Cap Value Portfolio
The Portfolio held a Special Meeting of Interestholders on November 14, 2008 to elect Trustees. The results of the vote were as follows:
| | | Interest in the Portfolio | |
| Nominee for Trustee | | For | | Withheld | |
| Benjamin C. Esty | | | 99 | % | | | 1 | % | |
| Thomas E. Faust Jr. | | | 99 | % | | | 1 | % | |
| Allen R. Freedman | | | 99 | % | | | 1 | % | |
| William H. Park | | | 99 | % | | | 1 | % | |
| Ronald A. Pearlman | | | 99 | % | | | 1 | % | |
| Helen Frame Peters | | | 99 | % | | | 1 | % | |
| Heidi L. Steiger | | | 99 | % | | | 1 | % | |
| Lynn A. Stout | | | 99 | % | | | 1 | % | |
| Ralph F. Verni | | | 99 | % | | | 1 | % | |
Results are rounded to the nearest whole number.
25
Eaton Vance Tax-Managed Small-Cap Value Fund
BOARD OF TRUSTEES' ANNUAL APPROVAL OF THE INVESTMENT ADVISORY AGREEMENT
Overview of the Contract Review Process
The Investment Company Act of 1940, as amended (the "1940 Act"), provides, in substance, that each investment advisory agreement between a fund and its investment adviser will continue in effect from year to year only if its continuance is approved at least annually by the fund's board of trustees, including by a vote of a majority of the trustees who are not "interested persons" of the fund ("Independent Trustees"), cast in person at a meeting called for the purpose of considering such approval.
At a meeting of the Boards of Trustees (each a "Board") of the Eaton Vance group of mutual funds (the "Eaton Vance Funds") held on April 21, 2008, the Board, including a majority of the Independent Trustees, voted to approve continuation of existing advisory and sub-advisory agreements for the Eaton Vance Funds for an additional one-year period. In voting its approval, the Board relied upon the affirmative recommendation of the Contract Review Committee of the Board (formerly the Special Committee), which is a committee comprised exclusively of Independent Trustees. Prior to making its recommendation, the Contract Review Committee reviewed information furnished for a series of meetings of the Contract Review Committee held in February, March and April 2008. Such information included, among other things, the following:
Information about Fees, Performance and Expenses
• An independent report comparing the advisory and related fees paid by each fund with fees paid by comparable funds;
• An independent report comparing each fund's total expense ratio and its components to comparable funds;
• An independent report comparing the investment performance of each fund to the investment performance of comparable funds over various time periods;
• Data regarding investment performance in comparison to relevant peer groups of funds and appropriate indices;
• Comparative information concerning fees charged by each adviser for managing other mutual funds and institutional accounts using investment strategies and techniques similar to those used in managing the fund;
• Profitability analyses for each adviser with respect to each fund;
Information about Portfolio Management
• Descriptions of the investment management services provided to each fund, including the investment strategies and processes employed, and any changes in portfolio management processes and personnel;
• Information concerning the allocation of brokerage and the benefits received by each adviser as a result of brokerage allocation, including information concerning the acquisition of research through "soft dollar" benefits received in connection with the funds' brokerage, and the implementation of a soft dollar reimbursement program established with respect to the funds;
• Data relating to portfolio turnover rates of each fund;
• The procedures and processes used to determine the fair value of fund assets and actions taken to monitor and test the effectiveness of such procedures and processes;
Information about each Adviser
• Reports detailing the financial results and condition of each adviser;
• Descriptions of the qualifications, education and experience of the individual investment professionals whose responsibilities include portfolio management and investment research for the funds, and information relating to their compensation and responsibilities with respect to managing other mutual funds and investment accounts;
• Copies of the Codes of Ethics of each adviser and its affiliates, together with information relating to compliance with and the administration of such codes;
• Copies of or descriptions of each adviser's proxy voting policies and procedures;
• Information concerning the resources devoted to compliance efforts undertaken by each adviser and its affiliates on behalf of the funds (including descriptions of various compliance programs) and their record of compliance with investment policies and restrictions, including policies with respect to market-timing, late trading and selective portfolio disclosure, and with policies on personal securities transactions;
• Descriptions of the business continuity and disaster recovery plans of each adviser and its affiliates;
Other Relevant Information
• Information concerning the nature, cost and character of the administrative and other non-investment management services provided by Eaton Vance Management and its affiliates;
• Information concerning management of the relationship with the custodian, subcustodians and fund accountants by each adviser or the funds' administrator; and
• The terms of each advisory agreement.
26
Eaton Vance Tax-Managed Small-Cap Value Fund
BOARD OF TRUSTEES' ANNUAL APPROVAL OF THE INVESTMENT ADVISORY AGREEMENT CONT'D
In addition to the information identified above, the Contract Review Committee considered information provided from time to time by each adviser throughout the year at meetings of the Board and its committees. Over the course of the twelve-month period ended April 30, 2008, the Board met eleven times and the Contract Review Committee, the Audit Committee and the Governance Committee, each of which is a Committee comprised solely of Independent Trustees, met twelve, seven and five times, respectively. At such meetings, the Trustees received, among other things, presentations by the portfolio managers and other investment professionals of each adviser relating to the investment performance of each fund and the investment strategies used in pursuing the fund's investment objective. The Portfolio Management Committee and the Compliance Reports and Regulatory Matters Committee are newly established and did not meet during the twelve- month period ended April 30, 2008.
For funds that invest through one or more underlying portfolios, the Board considered similar information about the portfolio(s) when considering the approval of advisory agreements. In addition, in cases where the fund's investment adviser has engaged a sub-adviser, the Board considered similar information about the sub-adviser when considering the approval of any sub-advisory agreement.
The Contract Review Committee was assisted throughout the contract review process by Goodwin Procter LLP, legal counsel for the Independent Trustees. The members of the Contract Review Committee relied upon the advice of such counsel and their own business judgment in determining the material factors to be considered in evaluating each advisory and sub-advisory agreement and the weight to be given to each such factor. The conclusions reached with respect to each advisory and sub-advisory agreement were based on a comprehensive evaluation of all the information provided and not any single factor. Moreover, each member of the Contract Review Committee may have placed varying emphasis on particular factors in reaching conclusions with respect to each advisory and sub-advisory agreement.
Results of the Process
Based on its consideration of the foregoing, and such other information as it deemed relevant, including the factors and conclusions described below, the Contract Review Committee concluded that the continuance of the investment advisory agreement of the Tax-Managed Small-Cap Value Portfolio (the "Portfolio"), the portfolio in which the Eaton Vance Tax-Managed Small-Cap Value Fund (the "Fund") invests, with Boston Management and Research (the "Adviser"), and the sub-advisory agreement with Fox Asset Management LLC (the "Sub-adviser"), including their fee structures, is in the interests of shareholders and, therefore, the Contract Review Committee recommended to the Board approval of the respective agreements. The Board accepted the recommendation of the Contract Review Committee as well as the factors considered and conclusions reached by the Contract Review Committee with respect to the agreements. Accordingly, the Board, inclu ding a majority of the Independent Trustees, voted to approve continuation of the investment advisory agreement and sub-advisory agreement for the Portfolio.
Nature, Extent and Quality of Services
In considering whether to approve the investment advisory agreement and sub-advisory agreements of the Portfolio, the Board evaluated the nature, extent and quality of services provided to the Portfolio by the Adviser and the Sub-adviser.
The Board considered the Adviser's and the Sub-adviser's management capabilities and investment process with respect to the types of investments held by the Portfolio, including the education, experience and number of its investment professionals and other personnel who provide portfolio management, investment research, and similar services to the Portfolio and whose responsibilities include supervising the Sub-adviser. The Board specifically noted the Adviser's in-house equity research capabilities. The Board also took into account the resources dedicated to portfolio management and other services, including the compensation paid to recruit and retain investment personnel, and the time and attention devoted to the Portfolio by senior management. With respect to the Sub-adviser, the Board took into account the resources available to the Sub-adviser in fulfilling its duties under the sub-advisory agreement and the Sub-adviser's e xperience in managing equity portfolios.
The Board also reviewed the compliance programs of the Adviser and relevant affiliates thereof, including the Sub-adviser. Among other matters, the Board considered compliance and reporting matters relating to personal trading by investment personnel, selective disclosure of portfolio holdings, late trading, frequent trading, portfolio valuation, business continuity and the allocation of investment opportunities. The Board also evaluated the responses of the Adviser and its affiliates to requests from regulatory authorities such as the Securities and Exchange Commission.
The Board considered shareholder and other administrative services provided or managed by Eaton Vance Management and its affiliates, including transfer agency and accounting services. The Board evaluated the benefits to shareholders of investing in a fund that is a part of a large family of funds, including the ability, in many cases, to exchange an investment among different funds without incurring additional sales charges.
27
Eaton Vance Tax-Managed Small-Cap Value Fund
BOARD OF TRUSTEES' ANNUAL APPROVAL OF THE INVESTMENT ADVISORY AGREEMENT CONT'D
After consideration of the foregoing factors, among others, the Board concluded that the nature, extent and quality of services provided by the Adviser and Sub-adviser, taken as a whole, are appropriate and consistent with the terms of the investment advisory agreement and sub-advisory agreement, respectively.
Fund Performance
The Board compared the Fund's investment performance to a relevant universe of similarly managed funds identified by an independent data provider and appropriate benchmark indices. The Board reviewed comparative performance data for the one-, three- and five-year periods ended September 30, 2007 for the Fund. The Board concluded that performance of the Fund was satisfactory.
Management Fees and Expenses
The Board reviewed contractual investment advisory fee rates, including any administrative fee rates, payable by the Portfolio and the Fund (referred to collectively as "management fees"). As part of its review, the Board considered the management fees, including administrative fees, and the Fund's total expense ratio for the year ended September 30, 2007, as compared to a group of similarly managed funds selected by an independent data provider. The Board considered the fact that the Adviser had waived fees and/or paid expenses for the Fund and had agreed to increase the amount of such waiver or expense payment to reduce further the Fund's expense ratios.
After reviewing the foregoing information, and in light of the nature, extent and quality of the services provided by the Adviser, the Board concluded that the management fees charged for advisory and related services and the Fund's total expense ratio are reasonable.
Profitability
The Board reviewed the level of profits realized by the Adviser and relevant affiliates thereof, including the Sub-adviser, in providing investment advisory and administrative services to the Portfolio, the Fund and all Eaton Vance Funds as a group. The Board considered the level of profits realized without regard to revenue sharing or other payments by the Adviser and its affiliates to third parties in respect of distribution services. The Board also considered other direct or indirect benefits received by the Adviser and its affiliates, including the Sub-adviser, in connection with its relationship with the Portfolio and the Fund, including the benefits of research services that may be available to the Adviser as a result of securities transactions effected for the Portfolio and other advisory clients.
The Board concluded that, in light of the foregoing factors and the nature, extent and quality of the services rendered, the profits realized by the Adviser and its affiliates, including the Sub-adviser, are reasonable.
Economies of Scale
In reviewing management fees and profitability, the Board also considered the extent to which the Adviser and its affiliates, including the Sub-adviser, on the one hand, and the Fund, on the other hand, can expect to realize benefits from economies of scale as the assets of the Fund and the Portfolio increase. The Board acknowledged the difficulty in accurately measuring the benefits resulting from the economies of scale with respect to the management of any specific fund or group of funds. The Board reviewed data summarizing the increases and decreases in the assets of the Fund and of all Eaton Vance Funds as a group over various time periods, and evaluated the extent to which the total expense ratio of the Fund and the profitability of the Adviser and its affiliates may have been affected by such increases or decreases. Based upon the foregoing, the Board concluded that the benefits from economies of scale are currently being shared equitably by the Adviser and its affiliates, including the Sub-adviser, and the Fund. The Board also concluded that, assuming reasonably foreseeable increases in the assets of the Portfolio, the structure of the Portfolio advisory fee, which includes breakpoints at several asset levels, can be expected to cause the Adviser and its affiliates, including the Sub-adviser, and the Fund and the Portfolio to continue to share such benefits equitably.
28
Eaton Vance Tax-Managed Small-Cap Value Fund
MANAGEMENT AND ORGANIZATION
Fund Management. The Trustees of Eaton Vance Mutual Funds Trust (the Trust) and Tax-Managed Small-Cap Value Portfolio (the Portfolio) are responsible for the overall management and supervision of the Trust's and Portfolio's affairs. The Trustees and officers of the Trust and the Portfolio are listed below. Except as indicated, each individual has held the office shown or other offices in the same company for the last five years. Trustees and officers of the Trust and the Portfolio hold indefinite terms of office. The "noninterested Trustees" consist of those Trustees who are not "interested persons" of the Trust and the Portfolio, as that term is defined under the 1940 Act. The business address of each Trustee and officer is The Eaton Vance Building, 255 State Street, Boston, Massachusetts 02109. As used below, "EVC" refers to Eaton Vance Corp., "EV" refers to Eaton Vance, Inc., "EVM" refers to Eaton Vance Management, "BMR" refers to Boston Management and Research, "EVD" refers to Eaton Vance Distributors, Inc., "Parametric" refers to Parametric Portfolio Associates and "Fox" refers to Fox Asset Management LLC. EVC and EV are the corporate parent and trustee, respectively, of EVM and BMR. EVD is the Fund's principal underwriter, the Portfolio's placement agent and a wholly-owned subsidiary of EVC. Each officer affiliated with Eaton Vance may hold a position with other Eaton Vance affiliates that is comparable to his or her position with EVM listed below.
Name and
Date of Birth | | Position(s)
with the
Trust and
the Portfolio | | Term of
Office and
Length of
Service | | Principal Occupation(s)
During Past Five Years | | Number of Portfolios
in Fund Complex
Overseen By
Trustee(1) | | Other Directorships Held | |
| Interested Trustee | | | | | | | | | | | | | |
|
Thomas E. Faust Jr.
5/31/58 | | Trustee of
the Trust
and Portfolio,
President of
the Trust and
Vice President of
the Portfolio | | Trustee since 2007, President of the Trust since 2002 and Vice President of the Portfolio since 2001 | | Chairman, Chief Executive Officer and President of EVC, Director and President of EV, Chief Executive Officer and President of EVM and BMR, and Director of EVD. Trustee and/or Officer of 173 registered investment companies and 4 private companies managed by EVM or BMR. Mr. Faust is an interested person because of his positions with EVM, BMR, EVD, EVC and EV, which are affiliates of the Trust and Portfolio. | | | 173 | | | Director of EVC | |
|
| Noninterested Trustees | | | | | | | | | | | | | |
|
Benjamin C. Esty
1/2/63 | | Trustee | | Since 2005 | | Roy and Elizabeth Simmons Professor of Business Administration, Harvard University Graduate School of Business Administration. | | | 173 | | | None | |
|
Allen R. Freedman
4/3/40 | | Trustee | | Since 2007 | | Former Chairman (2002-2004) and a Director (1983-2004) of Systems & Computer Technology Corp. (provider of software to higher education). Formerly, a Director of Loring Ward International (fund distributor) (2005-2007). Formerly, Chairman and a Director of Indus International, Inc. (provider of enterprise management software to the power generating industry) (2005-2007). | | | 173 | | | Director of Assurant, Inc. and Stonemor Partners L.P. (owner and operator of cemeteries) | |
|
William H. Park
9/19/47 | | Trustee | | Since 2003 | | Vice Chairman, Commercial Industrial Finance Corp. (specialty finance company) (since 2006). Formerly, President and Chief Executive Officer, Prizm Capital Management, LLC (investment management firm) (2002-2005). | | | 173 | | | None | |
|
Ronald A. Pearlman
7/10/40 | | Trustee | | Since 2003 | | Professor of Law, Georgetown University Law Center. | | | 173 | | | None | |
|
Helen Frame Peters
3/22/48 | | Trustee | | Since 2008 | | Professor of Finance, Carroll School of Management, Boston College (since 2003). Adjunct Professor of Finance, Peking University, Beijing, China (since 2005). Formerly, Dean, Carroll School of Management, Boston College (2000-2003). | | | 173 | | | Director of Federal Home Loan Bank of Boston (a bank for banks) and BJ's Wholesale Clubs (wholesale club retailer); Trustee of SPDR Index Shares Funds and SPDR Series Trust (exchange traded funds) | |
|
29
Eaton Vance Tax-Managed Small-Cap Value Fund
MANAGEMENT AND ORGANIZATION CONT'D
Name and
Date of Birth | | Position(s)
with the
Trust and
the Portfolio | | Term of
Office and
Length of
Service | | Principal Occupation(s)
During Past Five Years | | Number of Portfolios
in Fund Complex
Overseen By
Trustee(1) | | Other Directorships Held | |
| Noninterested Trustees (continued) | | | | | | | | | | | | | |
|
Heidi L. Steiger
7/8/53 | | Trustee | | Since 2007 | | Managing Partner, Topridge Associates LLC (global wealth management firm) (since 2008); Senior Advisor (since 2008), President (2005-2008), Lowenhaupt Global Advisors, LLC (global wealth management firm). Formerly, President and Contributing Editor, Worth Magazine (2004-2005). Formerly, Executive Vice President and Global Head of Private Asset Management (and various other positions), Neuberger Berman (investment firm) (1986-2004). | | | 173 | | | Director of Nuclear Electric Insurance Ltd. (nuclear insurance provider) and Aviva USA (insurance provider) | |
|
Lynn A. Stout
9/14/57 | | Trustee | | Of the Trust since 1998 and of the Portfolio since 2001 | | Paul Hastings Professor of Corporate and Securities Law (since 2006) and Professor of Law (2001-2006), University of California at Los Angeles School of Law. | | | 173 | | | None | |
|
Ralph F. Verni
1/26/43 | | Chairman of the Board and Trustee | | Chairman of the Board since 2007 and Trustee since 2005 | | Consultant and private investor. | | | 173 | | | None | |
|
| Principal Officers who are not Trustees | | | | | | | | | | | | | |
|
Name and
Date of Birth | | Position(s)
with the
Trust and
the Portfolio | | Term of
Office and
Length of
Service | | Principal Occupation(s)
During Past Five Years | |
William H. Ahern, Jr.
7/28/59 | | Vice President
of the Trust | | Since 1995 | | Vice President of EVM and BMR. Officer of 75 registered investment companies managed by EVM or BMR. | |
|
John R. Baur
2/10/70 | | Vice President
of the Trust | | Since 2007 | | Vice President of EVM and BMR. Previously, attended Johnson Graduate School of Management, Cornell University (2002-2005), and prior thereto he was an Account Team Representative in Singapore for Applied Materials, Inc. Officer of 33 registered investment companies managed by EVM or BMR. | |
|
Michael A. Cirami
12/24/75 | | Vice President
of the Trust | | Since 2007 | | Vice President of EVM and BMR. Previously, attended the University of Rochester William E. Simon Graduate School of Business Administration (2001-2003), and prior thereto he was a Team Leader for the Institutional Services Group for State Street Bank in Luxembourg. Officer of 33 registered investment companies managed by EVM or BMR. | |
|
Cynthia J. Clemson
3/2/63 | | Vice President
of the Trust | | Since 2005 | | Vice President of EVM and BMR. Officer of 90 registered investment companies managed by EVM or BMR. | |
|
Charles B. Gaffney
12/4/72 | | Vice President
of the Trust | | Since 2007 | | Vice President of EVM and BMR. Previously, Sector Portfolio Manager and Senior Equity Analyst of Brown Brothers Harriman (1997-2003). Officer of 30 registered investment companies managed by EVM or BMR. | |
|
Gregory R. Greene
11/13/66 | | Vice President
of the Portfolio | | Since 2006 | | Managing Director of Fox and member of the Investment Committee. Officer of 18 registered investment companies managed by EVM or BMR. | |
|
Christine M. Johnston
11/9/72 | | Vice President
of the Trust | | Since 2007 | | Vice President of EVM and BMR. Officer of 35 registered investment companies managed by EVM or BMR. | |
|
Aamer Khan
6/7/60 | | Vice President
of the Trust | | Since 2005 | | Vice President of EVM and BMR. Officer of 33 registered investment companies managed by EVM or BMR. | |
|
30
Eaton Vance Tax-Managed Small-Cap Value Fund
MANAGEMENT AND ORGANIZATION CONT'D
| Principal Officers who are not Trustees (continued) | |
|
Name and
Date of Birth | | Position(s)
with the
Trust and
the Portfolio | | Term of
Office and
Length of
Service | | Principal Occupation(s)
During Past Five Years | |
Thomas H. Luster
4/8/62 | | Vice President
of the Trust | | Since 2006 | | Vice President of EVM and BMR. Officer of 51 registered investment companies managed by EVM or BMR. | |
|
Robert B. MacIntosh
1/22/57 | | Vice President
of the Trust | | Since 1998 | | Vice President of EVM and BMR. Officer of 90 registered investment companies managed by EVM or BMR. | |
|
Robert J. Milmore
4/3/69 | | Vice President
of the Portfolio | | Since 2006 | | Vice President of Fox and member of the Investment Committee. Previously, Manager of International Treasury of Cendant Corporation (2001-2005). Officer of 18 registered investment companies managed by EVM or BMR. | |
|
J. Bradley Ohlmuller
6/14/68 | | Vice President
of the Portfolio | | Since 2006 | | Principal of Fox and member of the Investment Committee. Previously, Vice President and research analyst at Goldman Sachs & Co. (2001-2004). Officer of 18 registered investment companies managed by EVM or BMR. | |
|
Duncan W. Richardson
10/26/57 | | Vice President
of the Trust
and President
of the Portfolio | | Vice President of the Trust
since 2001 and
President of the Portfolio
since 2007 | | Executive Vice President and Chief Equity Investment Officer of EVC, EVM and BMR. Officer of 81 registered investment companies managed by EVM or BMR. | |
|
Judith A. Saryan
8/21/54 | | Vice President
of the Trust | | Since 2003 | | Vice President of EVM and BMR. Officer of 55 registered investment companies managed by EVM or BMR. | |
|
Susan Schiff
3/13/61 | | Vice President
of the Trust | | Since 2002 | | Vice President of EVM and BMR. Officer of 36 registered investment companies managed by EVM or BMR. | |
|
Thomas Seto
9/27/62 | | Vice President
of the Trust | | Since 2007 | | Vice President and Director of Portfolio Management of Parametric. Officer of 31 registered investment companies managed by EVM or BMR. | |
|
David M. Stein
5/4/51 | | Vice President
of the Trust | | Since 2007 | | Managing Director and Chief Investment Officer of Parametric. Officer of 31 registered investment companies managed by EVM or BMR. | |
|
Mark S. Venezia
5/23/49 | | Vice President
of the Trust | | Since 2007 | | Vice President of EVM and BMR. Officer of 36 registered investment companies managed by EVM or BMR. | |
|
Adam A. Weigold
3/22/75 | | Vice President
of the Trust | | Since 2007 | | Vice President of EVM and BMR. Officer of 71 registered investment companies managed by EVM or BMR. | |
|
Barbara E. Campbell
6/19/57 | | Treasurer | | Of the Trust since 2005
and of the Portfolio
since 2008(2) | | Vice President of EVM and BMR. Officer of 173 registered investment companies managed by EVM or BMR. | |
|
Maureen A. Gemma
5/24/60 | | Secretary and
Chief Legal Officer | | Secretary since 2007 and
Chief Legal Officer
since 2008 | | Vice President of EVM and BMR. Officer of 173 registered investment companies managed by EVM or BMR. | |
|
Paul M. O'Neil
7/11/5 | | Chief Compliance Officer | | Since 2004 | | Vice President of EVM and BMR. Officer of 173 registered investment companies managed by EVM or BMR. | |
|
(1) Includes both master and feeder funds in a master-feeder structure.
(2) Prior to 2008, Ms. Campbell served as Assistant Treasurer of the Portfolio since 2001.
The SAI for the Fund includes additional information about the Trustees and officers of the Fund and the Portfolio and can be obtained without charge on Eaton Vance's website at www.eatonvance.com or by calling 1-800-262-1122.
31
This Page Intentionally Left Blank
Investment Adviser of Tax-Managed Small-Cap Value Portfolio
Boston Management and Research
The Eaton Vance Building
255 State Street
Boston, MA 02109
Sub-Adviser of Tax-Managed Small-Cap Value Portfolio
Fox Asset Management LLC
331 Newman Springs Road, Suite 122
Red Bank, NJ 07701
Administrator of Eaton Vance Tax-Managed Small-Cap Value Fund
Eaton Vance Management
The Eaton Vance Building
255 State Street
Boston, MA 02109
Principal Underwriter
Eaton Vance Distributors, Inc.
The Eaton Vance Building
255 State Street
Boston, MA 02109
(617) 482-8260
Custodian
State Street Bank and Trust Company
200 Clarendon Street
Boston, MA 02116
Transfer Agent
PNC Global Investment Servicing
Attn: Eaton Vance Funds
P.O. Box 9653
Providence, RI 02940-9653
(800) 262-1122
Independent Registered Public Accounting Firm
Deloitte & Touche LLP
200 Berkeley Street
Boston, MA 02116-5022
Eaton Vance Tax-Managed Small-Cap Value Fund
The Eaton Vance Building
255 State Street
Boston, MA 02109
This report must be preceded or accompanied by a current prospectus. Before investing, investors should consider carefully the Fund's investment objective(s), risks, and charges and expenses. The Fund's current prospectus contains this and other information about the Fund and is available through your financial advisor. Please read the prospectus carefully before you invest or send money. For further information please call 1-800-262-1122.
1300-12/08 TMSCVSRC

Annual Report October 31, 2008


EATON VANCE
TAX-MANAGED
VALUE
FUND
IMPORTANT NOTICES REGARDING PRIVACY,
DELIVERY OF SHAREHOLDER DOCUMENTS,
PORTFOLIO HOLDINGS AND PROXY VOTING
Privacy. The Eaton Vance organization is committed to ensuring your financial privacy. Each of the financial institutions identified below has in effect the following policy ("Privacy Policy") with respect to nonpublic personal information about its customers:
• Only such information received from you, through application forms or otherwise, and information about your Eaton Vance fund transactions will be collected. This may include information such as name, address, social security number, tax status, account balances and transactions.
• None of such information about you (or former customers) will be disclosed to anyone, except as permitted by law (which includes disclosure to employees necessary to service your account). In the normal course of servicing a customer's account, Eaton Vance may share information with unaffiliated third parties that perform various required services such as transfer agents, custodians and broker/dealers.
• Policies and procedures (including physical, electronic and procedural safeguards) are in place that are designed to protect the confidentiality of such information.
• We reserve the right to change our Privacy Policy at any time upon proper notification to you. Customers may want to review our Policy periodically for changes by accessing the link on our homepage: www.eatonvance.com.
Our pledge of privacy applies to the following entities within the Eaton Vance organization: the Eaton Vance Family of Funds, Eaton Vance Management, Eaton Vance Investment Counsel, Boston Management and Research, and Eaton Vance Distributors, Inc.
In addition, our Privacy Policy only applies to those Eaton Vance customers who are individuals and who have a direct relationship with us. If a customer's account (i.e., fund shares) is held in the name of a third-party financial adviser/broker-dealer, it is likely that only such adviser's privacy policies apply to the customer. This notice supersedes all previously issued privacy disclosures.
For more information about Eaton Vance's Privacy Policy, please call 1-800-262-1122.
Delivery of Shareholder Documents. The Securities and Exchange Commission (the "SEC") permits funds to deliver only one copy of shareholder documents, including prospectuses, proxy statements and shareholder reports, to fund investors with multiple accounts at the same residential or post office box address. This practice is often called "householding" and it helps eliminate duplicate mailings to shareholders.
Eaton Vance, or your financial adviser, may household the mailing of your documents indefinitely unless you instruct Eaton Vance, or your financial adviser, otherwise.
If you would prefer that your Eaton Vance documents not be householded, please contact Eaton Vance at 1-800-262-1122, or contact your financial adviser.
Your instructions that householding not apply to delivery of your Eaton Vance documents will be effective within 30 days of receipt by Eaton Vance or your financial adviser.
Portfolio Holdings. Each Eaton Vance Fund and its underlying Portfolio (if applicable) will file a schedule of its portfolio holdings on Form N-Q with the SEC for the first and third quarters of each fiscal year. The Form N-Q will be available on the Eaton Vance website www.eatonvance.com, by calling Eaton Vance at 1-800-262-1122 or in the EDGAR database on the SEC's website at www.sec.gov. Form N-Q may also be reviewed and copied at the SEC's public reference room in Washington, D.C. (call 1-800-732-0330 for information on the operation of the public reference room).
Proxy Voting. From time to time, funds are required to vote proxies related to the securities held by the funds. The Eaton Vance Funds or their underlying Portfolios (if applicable) vote proxies according to a set of policies and procedures approved by the Funds' and Portfolios' Boards. You may obtain a description of these policies and procedures and information on how the Funds or Portfolios voted proxies relating to portfolio securities during the most recent 12 month period ended June 30, without charge, upon request, by calling 1-800-262-1122. This description is also available on the SEC's website at www.sec.gov.
Eaton Vance Tax-Managed Value Fund as of October 31, 2008
MANAGEMENT’S DISCUSSION OF FUND PERFORMANCE

Michael R. Mach, CFA
Portfolio Manager
Economic and Market Conditions
· The stock market moved dramatically lower during the year that ended October 31, 2008. After reaching record highs in October 2007, the major market indices began to decline at the end of 2007, as investors realized that the difficulties in subprime lending and the troubled housing market were likely to slow the economy significantly. By the summer of 2008, the magnitude of the damage became increasingly apparent. Many banks were faced with enormous write- offs from bad real estate loans, losses that severely impaired their overall lending capacity. As the market declined further, investor and consumer sentiment worsened. That trend was accelerated by soaring energy prices, as oil hit $145 per barrel in July 2008 and pinched consumers even more.
· The failure of Lehman Brothers in September 2008 and the tenuous condition of other capital-starved banks and financial institutions sparked fears of a global financial collapse. In late September, in an effort to jump-start lending, the U.S. Treasury department unveiled a controversial proposal to purchase troubled loans from banks and financial institutions. Congress’s initial rejection of the plan sent the market into a near-freefall. A revised version of the measure was subsequently approved by Congress, and was followed by a coordinated effort by the world’s central banks to inject liquidity into the global banking system. While those actions reassured many investors, volatility remained high at the Fund’s year end on October 31, 2008.
· Against this backdrop, the Russell 1000 Value Index (the Index) posted double-digit losses in each of its 10 economic sectors. The weakest performers were information technology and financials, in which the large- cap value-oriented Index was heavily weighted. By comparison, the relatively modest losses from defensive consumer staples stocks and the health care sector detracted the least from Index returns.(1)
Management Discussion
· For the fiscal year that ended October 31, 2008, the Fund(2) outperformed the Index, as well as the average return of the Lipper Large-Cap Value Funds Classification. As the Lipper rankings on page 2 indicate, the Fund’s Class A shares were ranked 70th of 547 funds in the Lipper Large-Cap Value Funds Classification for one year; 27th of 474 funds for 3 years; and 15th of 390 funds for 5 years – the top quintile for each period.(1),(3)
· The Fund outperformed the Index in six of its ten economic sectors, primarily due to strong stock selection. Although the financials sector was battered throughout the period, the Fund’s minimal exposure to many of the financial stocks that collapsed in September 2008 was one of the most beneficial contributors to performance relative to the Index.(1)
· Selection among information technology stocks was positive, and consumer discretionary stock selection was also beneficial. Reduced exposure to cyclical names hit hard by drastic cutbacks in consumer spending was also a positive contributor to performance.
Eaton Vance Tax-Managed Value Fund
Total Return Performance 10/31/07 – 10/31/08
Class A(4) | | -33.19 | % |
Class B(4) | | -33.67 | |
Class C(4) | | -33.72 | |
Class I(4) | | -30.53 | * |
Russell 1000 Value Index(1) | | -36.80 | |
S&P 500 Index(1) | | -36.08 | |
Lipper Large-Cap Value Funds Average(1) | | -37.24 | |
*Performance since inception on 11/30/07.
See pages 3 and 4 for more performance information, including after-tax returns.
(1) | It is not possible to invest directly in an Index or a Lipper Classification. The Indices’ total returns do not reflect commissions or expenses that would have been incurred if an investor individually purchased or sold the securities represented in the Indices. The Lipper total return is the average total return, at net asset value, of the funds that are in the same Lipper Classification as the Fund. |
(2) | The Fund currently invests in a separate registered investment company, Tax- Managed Value Portfolio, with the same objective and policies as the Fund. References to investments are to the Portfolio’s holdings. |
(3) | Source: Lipper Inc. Rankings are based on percentage change in net asset value with all distributions reinvested and do not take sales charges into consideration. Past performance is no guarantee of future results. It is not possible to invest in a Lipper Classification. |
(4) | These returns do not include the 5.75% maximum sales charge for Class A shares or the applicable contingent deferred sales charge (CDSC) for Class B and Class C shares. If sales charges were deducted, the returns would be lower. Class I shares are offered to certain investors at net asset value. |
Past performance is no guarantee of future results. Returns are historical and are calculated by determining the percentage change in net asset value or offering price (as applicable) with all distributions reinvested. Investment return and principal value will fluctuate so that shares, when redeemed, may be worth more or less than their original cost. Performance is for the stated time period only; due to market volatility, the Fund’s current performance may be lower or higher than the quoted return. For performance as of the most recent month end, please refer to www.eatonvance.com.
Fund shares are not insured by the FDIC and are not deposits or other obligations of, or guaranteed by, any depository institution. Shares are subject to investment risks, including possible loss of principal invested.
1
· Fund holdings in the energy and health care sectors detracted the most from relative performance versus the Index, due to unfavorable stock selection in oil, gas, & consumable fuel stocks and the pharmaceutical industry.(1)
· The Fund remains committed to its strategy of investing in companies that are considered to be attractive in their long-term investment prospects, are favorably priced in relation to their fundamental value, and which are likely to grow in value over time on an after-tax basis.
· In addition, it is important to consider the Fund’s tax- managed strategy of balancing investment and tax considerations. The goal in managing a tax-managed fund is not to avoid taxes, but rather to maximize after-tax returns. Investment decisions are made from the perspective of long-term, tax-paying shareholders interested in the level of fund pre-tax returns and how tax-efficiently fund returns are achieved. The Fund’s after-tax return information can be found on page 4 of this report.
· In closing, I would like to thank my fellow shareholders for your continued confidence and participation in the Fund.
(1) It is not possible to invest directly in an Index.
Lipper Quintile Rankings(2)
By total return as of 10/31/08
EATON VANCE TAX-MANAGED VALUE FUND CLASS A
LIPPER LARGE-CAP VALUE FUNDS CLASSIFICATION
Period | | Quintile | | Ranking | |
| | | | | |
1 Year | | 1st | | 70 of 547 funds | |
3 Years | | 1st | | 27 of 474 funds | |
5 Years | | 1st | | 15 of 390 funds | |
(2) | Source: Lipper Inc. Rankings are based on percentage change in net asset value with all distributions reinvested and do not take sales charges into consideration. Past performance is no guarantee of future results. It is not possible to invest in a Lipper Classification. |
Portfolio Composition
Top Ten Holdings(3)
By net assets
JPMorgan Chase & Co. | | 2.9 | % |
Wells Fargo & Co. | | 2.6 | |
Nestle SA | | 2.6 | |
CVS Caremark Corp. | | 2.5 | |
Exxon Mobil Corp. | | 2.5 | |
International Business Machines Corp. | | 2.4 | |
Hewlett-Packard Co. | | 2.4 | |
Travelers Companies, Inc. (The) | | 2.3 | |
Chevron Corp. | | 2.3 | |
Bank of America Corp. | | 2.3 | |
(3) Top Ten Holdings represented 24.8% of the Portfolio’s net assets as of 10/31/08. Excludes cash equivalents.
Sector Weightings(4)
By net assets
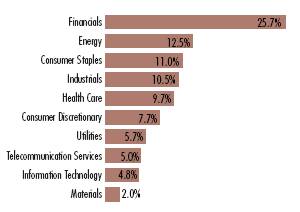
(4) As a percentage of the Portfolio’s net assets as of 10/31/08. Excludes cash equivalents.
The views expressed throughout this report are those of the portfolio manager and are current only through the end of the period of the report as stated on the cover. These views are subject to change at any time based upon market or other conditions, and the investment adviser disclaims any responsibility to update such views. These views may not be relied on as investment advice and, because investment decisions for a fund are based on many factors, may not be relied on as an indication of trading intent on behalf of any Eaton Vance fund. Portfolio information provided in the report may not be representative of the Portfolio’s current or future investments and may change due to active management.
2
Eaton Vance Tax-Managed Value Fund as of October 31, 2008
FUND PERFORMANCE
The line graph and table set forth below provide information about the Fund’s performance. The line graph compares the performance of Class A of the Fund with that of the Russell 1000 Value Index, a broad-based, unmanaged market index of 1,000 U.S. value stocks, and the S&P 500 Index, a broad-based, unmanaged market index of common stocks. The lines on the graph represent the total returns of a hypothetical investment of $10,000 in each of Class A, the Russell 1000 Value Index, and the S&P 500 Index. Class A total returns are presented at net asset value and maximum public offering price. The table includes the total returns of each Class of the Fund at net asset value and maximum public offering price. The performance presented below does not reflect the deduction of taxes, if any, that a shareholder would pay on distributions or redemptions of Fund shares.
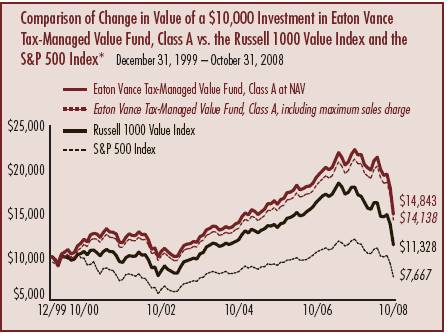
* Source: Lipper Inc. Class A of the Fund commenced investment operations on 12/27/99.
A $10,000 hypothetical investment at net asset value in Class B shares on 1/18/00 (commencement of operations), Class C shares on 1/24/00 (commencement of operations), and Class I shares on 11/30/07 (commencement of operations) would have been valued at $1 3,672, $1 4,024, and $6,888, respectively, on 10/31/08. It is not possible to invest directly in an Index. The Indices’ total returns do not reflect commissions or expenses that would have been incurred if an investor individually purchased or sold the securities represented in the Indices.
Fund Performance(1) | | Class A | | Class B | | Class C | | Class I | |
Share Class Symbol | | EATVX | | EBTVX | | ECTVX | | EITVX | |
| | | | | | | | | |
Average Annual Total Returns (at net asset value) | | | | | | | | | |
One Year | | -33.19 | % | -33.67 | % | -33.72 | % | N.A. | |
Five Years | | 3.86 | | 3.09 | | 3.08 | | N.A. | |
Life of Fund† | | 4.74 | | 3.62 | | 3.93 | | -30.53 | †† |
| | | | | | | | | |
SEC Average Annual Total Returns (including sales charge or applicable CDSC) | | | | | | | |
One Year | | -37.04 | % | -36.98 | % | -34.38 | % | N.A. | |
Five Years | | 2.64 | | 2.73 | | 3.08 | | N.A. | |
Life of Fund† | | 4.04 | | 3.62 | | 3.93 | | -30.53 | †† |
† Inception Dates – Class A: 12/27/99; Class B: 1/18/00; Class C: 1/24/00; and Class I: 11/30/07
†† Returns are cumulative since inception of the share class.
(1) | Average Annual Total Returns do not include the 5.75% maximum sales charge for Class A shares or the applicable contingent deferred sales charge (CDSC) for Class B and Class C shares. If sales charges were deducted, the returns would be lower. SEC Average Annual Total Returns for Class A reflect the maximum 5.75% sales charge. SEC returns for Class B shares reflect the applicable CDSC based on the folowing schedule: 5% - 1st and 2nd years; 4% - 3rd year; 3% - 4th year; 2% - 5th year; 1% - 6th year. SEC returns for Class C reflect a 1% CDSC for the first year. Class I shares are offered to certain investors at net asset value. |
Total Annual | | | | | | | | | |
Operating Expenses(2) | | Class A | | Class B | | Class C | | Class I | |
Expense Ratio | | 1.16 | % | 1.91 | % | 1.91 | % | 0.91 | % |
(2) Source: Prospectus dated 3/1/08.
Past performance is no guarantee of future results. Returns are historical and are calculated by determining the percentage change in net asset value or offering price (as applicable) with all distributions reinvested. Investment return and principal value will fluctuate so that shares, when redeemed, may be worth more or less than their original cost. Performance is for the stated time period only; due to market volatility, the Fund’s current performance may be lower or higher than the quoted return. For performance as of the most recent month end, please refer to www.eatonvance.com.
3
“Return Before Taxes” does not take into consideration shareholder taxes. It is most relevant to tax-free or tax-deferred shareholder accounts. “Return After Taxes on Distributions” reflects the impact of federal income taxes due on Fund distributions of dividends and capital gains. It is most relevant to taxpaying shareholders who continue to hold their shares. “Return After Taxes on Distributions and Sale of Fund Shares” also reflects the impact of taxes on capital gain or loss realized upon a sale of shares. It is most relevant to taxpaying shareholders who sell their shares.
Average Annual Total Returns
(For the periods ended October 31, 2008)
Returns at Net Asset Value (NAV) (Class A)
| | One Year | | Five Years | | Life of Fund | |
Return Before Taxes | | -33.19 | % | 3.86 | % | 4.74 | % |
Return After Taxes on Distributions | | -33.28 | | 3.72 | | 4.66 | |
Return After Taxes on Distributions and Sale of Fund Shares | | -21.37 | | 3.34 | | 4.14 | |
Returns at Public Offering Price (POP) (Class A)
| | One Year | | Five Years | | Life of Fund | |
Return Before Taxes | | -37.04 | % | 2.64 | % | 4.04 | % |
Return After Taxes on Distributions | | -37.13 | | 2.50 | | 3.96 | |
Return After Taxes on Distributions and Sale of Fund Shares | | -23.88 | | 2.28 | | 3.52 | |
Average Annual Total Returns
(For the periods ended October 31, 2008)
Returns at Net Asset Value (NAV) (Class B)
| | One Year | | Five Years | | Life of Fund | |
Return Before Taxes | | -33.67 | % | 3.09 | % | 3.62 | % |
Return After Taxes on Distributions | | -33.68 | | 3.05 | | 3.60 | |
Return After Taxes on Distributions and Sale of Fund Shares | | -21.86 | | 2.65 | | 3.14 | |
Returns at Public Offering Price (POP) (Class B)
| | One Year | | Five Years | | Life of Fund | |
Return Before Taxes | | -36.98 | % | 2.73 | % | 3.62 | % |
Return After Taxes on Distributions | | -36.99 | | 2.69 | | 3.60 | |
Return After Taxes on Distributions and Sale of Fund Shares | | -24.01 | | 2.34 | | 3.14 | |
Average Annual Total Returns
(For the periods ended October 31, 2008)
Returns at Net Asset Value (NAV) (Class C)
| | One Year | | Five Years | | Life of Fund | |
Return Before Taxes | | -33.72 | % | 3.08 | % | 3.93 | % |
Return After Taxes on Distributions | | -33.73 | | 3.04 | | 3.91 | |
Return After Taxes on Distributions and Sale of Fund Shares | | -21.88 | | 2.64 | | 3.41 | |
Returns at Public Offering Price (POP) (Class C)
| | One Year | | Five Years | | Life of Fund | |
Return Before Taxes | | -34.38 | % | 3.08 | % | 3.93 | % |
Return After Taxes on Distributions | | -34.40 | | 3.04 | | 3.91 | |
Return After Taxes on Distributions and Sale of Fund Shares | | -22.31 | | 2.64 | | 3.41 | |
Class A, Class B, Class C, and Class I of the Fund commenced investment operations on 12/27/99, 1/18/00, 1/24/00, and 11/30/07, respectively. Class I after-tax returns are not provided because the class has less than a full year of operations. Returns at Public Offering Price (POP) reflect the deduction of the maximum initial sales charge and applicable CDSC, while Returns at Net Asset Value (NAV) do not.
After-tax returns are calculated using certain assumptions. After-tax returns are calculated using the highest historical individual federal income tax rates and do not reflect the impact of state and local taxes. Actual after-tax returns depend on a shareholder’s tax situation and the actual characterization of distributions and may differ from those shown. After-tax returns are not relevant to shareholders who hold shares in tax-deferred accounts or to shares held by non-taxable entities. Return After Taxes on Distributions for a period may be the same as Return Before Taxes for the same period because no taxable distributions were made during that period. Return After Taxes on Distributions and Sale of Fund Shares for a period may be greater than or equal to Return After Taxes on Distributions for the same period because of losses realized on the sale of Fund shares.
Past performance is no guarantee of future results. Returns are historical and are calculated by determining the percentage change in net asset value or offering price (as applicable) with all distributions reinvested. Investment return and principal value will fluctuate so that shares, when redeemed, may be worth more or less than their original cost. Performance is for the stated time period only; due to market volatility, the Fund’s current performance may be lower or higher than the quoted return. For performance as of the most recent month-end, please refer to www.eatonvance.com.
4
Eaton Vance Tax-Managed Value Fund as of October 31, 2008
FUND EXPENSES
Example: As a shareholder of the Fund, you incur two types of costs: (1) transaction costs, including sales charges (loads) on purchases and redemption fees (if applicable); and (2) ongoing costs, including management fees; distribution or service fees; and other Fund expenses. This Example is intended to help you understand your ongoing costs (in dollars) of investing in the Fund and to compare these costs with the ongoing costs of investing in other mutual funds. The Example is based on an investment of $1,000 invested at the beginning of the period and held for the entire period (May 1, 2008 – October 31, 2008).
Actual Expenses: The first section of the table below provides information about actual account values and actual expenses. You may use the information in this section, together with the amount you invested, to estimate the expenses that you paid over the period. Simply divide your account value by $1,000 (for example, an $8,600 account value divided by $1,000 = 8.6), then multiply the result by the number in the first section under the heading entitled "Expenses Paid During Period" to estimate the expenses you paid on your account during this period.
Hypothetical Example for Comparison Purposes: The second section of the table below provides information about hypothetical account values and hypothetical expenses based on the actual Fund expense ratio and an assumed rate of return of 5% per year (before expenses), which is not the actual return of the Fund. The hypothetical account values and expenses may not be used to estimate the actual ending account balance or expenses you paid for the period. You may use this information to compare the ongoing costs of investing in your Fund and other funds. To do so, compare this 5% hypothetical example with the 5% hypothetical examples that appear in the shareholder reports of the other funds.
Please note that the expenses shown in the table are meant to highlight your ongoing costs only and do not reflect any transactional costs, such as sales charges (loads) or redemption fees (if applicable). Therefore, the second section of the table is useful in comparing ongoing costs only, and will not help you determine the relative total costs of owning different funds. In addition, if these transactional costs were included, your costs would have been higher.
Eaton Vance Tax-Managed Value Fund
| | | Beginning Account Value
(05/1/08) | | Ending Account Value
(10/31/08) | | Expenses Paid During Period*
(05/1/08 – 10/31/08) | |
| Actual | |
| Class A | | $ | 1,000.00 | | | $ | 708.30 | | | $ | 4.98 | | |
| Class B | | $ | 1,000.00 | | | $ | 706.20 | | | $ | 7.98 | | |
| Class C | | $ | 1,000.00 | | | $ | 705.90 | | | $ | 8.19 | | |
| Class I | | $ | 1,000.00 | | | $ | 709.50 | | | $ | 3.91 | | |
| Hypothetical | |
| (5% return per year before expenses) | |
| Class A | | $ | 1,000.00 | | | $ | 1,019.30 | | | $ | 5.89 | | |
| Class B | | $ | 1,000.00 | | | $ | 1,015.80 | | | $ | 9.42 | | |
| Class C | | $ | 1,000.00 | | | $ | 1,015.50 | | | $ | 9.68 | | |
| Class I | | $ | 1,000.00 | | | $ | 1,020.60 | | | $ | 4.62 | | |
* Expenses are equal to the Fund's annualized expense ratio of 1.16% for Class A shares, 1.86% for Class B shares, 1.91% for Class C shares and 0.91% for Class I shares, multiplied by the average account value over the period, multiplied by 184/366 (to reflect the one-half year period). The Example assumes that the $1,000 was invested at the net asset value per share determined at the close of business on April 30, 2008. The Example reflects the expenses of both the Fund and the Portfolio.
5
Eaton Vance Tax-Managed Value Fund as of October 31, 2008
FINANCIAL STATEMENTS
Statement of Assets and Liabilities
As of October 31, 2008
| Assets | |
Investment in Tax-Managed Value Portfolio, at value
(identified cost, $1,082,274,763) | | $ | 1,226,768,697 | | |
| Receivable for Fund shares sold | | | 6,483,451 | | |
| Total assets | | $ | 1,233,252,148 | | |
| Liabilities | |
| Payable for Fund shares redeemed | | $ | 7,403,820 | | |
| Payable to affiliate for distribution and service fees | | | 410,471 | | |
| Payable to affiliate for administration fee | | | 154,528 | | |
| Accrued expenses | | | 241,543 | | |
| Total liabilities | | $ | 8,210,362 | | |
| Net Assets | | $ | 1,225,041,786 | | |
| Sources of Net Assets | |
| Paid-in capital | | $ | 1,311,089,721 | | |
Accumulated net realized loss from Portfolio (computed on
the basis of identified cost) | | | (241,363,800 | ) | |
| Accumulated undistributed net investment income | | | 10,821,931 | | |
Net unrealized appreciation from Portfolio (computed on the basis of
identified cost) | | | 144,493,934 | | |
| Total | | $ | 1,225,041,786 | | |
| Class A Shares | |
| Net Assets | | $ | 710,257,757 | | |
| Shares Outstanding | | | 49,328,539 | | |
Net Asset Value and Redemption Price Per Share
(net assets ÷ shares of beneficial interest outstanding) | | $ | 14.40 | | |
Maximum Offering Price Per Share
(100 ÷ 94.25 of $14.40) | | $ | 15.28 | | |
| Class B Shares | |
| Net Assets | | $ | 122,000,555 | | |
| Shares Outstanding | | | 9,017,967 | | |
Net Asset Value and Offering Price Per Share*
(net assets ÷ shares of beneficial interest outstanding) | | $ | 13.53 | | |
| Class C Shares | |
| Net Assets | | $ | 218,319,925 | | |
| Shares Outstanding | | | 15,742,183 | | |
Net Asset Value and Offering Price Per Share*
(net assets ÷ shares of beneficial interest outstanding) | | $ | 13.87 | | |
| Class I Shares | |
| Net Assets | | $ | 174,463,549 | | |
| Shares Outstanding | | | 12,107,634 | | |
Net Asset Value, Offering Price and Redemption Price Per Share
(net assets ÷ shares of beneficial interest outstanding) | | $ | 14.41 | | |
| On sales of $50,000 or more, the offering price of Class A shares is reduced. | |
* Redemption price per share is equal to the net asset value less any applicable contingent deferred sales charge.
Statement of Operations
For the Year Ended
October 31, 2008
| Investment Income | |
| Dividends allocated from Portfolio (net of foreign taxes, $150,383) | | $ | 31,855,550 | | |
| Interest allocated from Portfolio | | | 1,335,999 | | |
| Securities lending income allocated from Portfolio, net | | | 212,575 | | |
| Expenses allocated from Portfolio | | | (9,276,284 | ) | |
| Net investment income from Portfolio | | $ | 24,127,840 | | |
| Expenses | |
| Administration fee | | $ | 2,122,496 | | |
| Trustees' fees and expenses | | | 1,735 | | |
Distribution and service fees
Class A | | | 2,088,765 | | |
| Class B | | | 1,927,307 | | |
| Class C | | | 3,066,061 | | |
| Transfer and dividend disbursing agent fees | | | 1,060,385 | | |
| Registration fees | | | 165,525 | | |
| Printing and postage | | | 148,856 | | |
| Custodian fee | | | 41,904 | | |
| Legal and accounting services | | | 30,741 | | |
| Miscellaneous | | | 21,590 | | |
| Total expenses | | $ | 10,675,365 | | |
Deduct —
Reduction of custodian fee | | $ | 1 | | |
| Total expense reductions | | $ | 1 | | |
| Net expenses | | $ | 10,675,364 | | |
| Net investment income | | $ | 13,452,476 | | |
Realized and Unrealized
Gain (Loss) from Portfolio | |
Net realized gain (loss) —
Investment transactions (identified cost basis) | | $ | (197,426,759 | ) | |
| Foreign currency transactions | | | (47,866 | ) | |
| Net realized loss | | $ | (197,474,625 | ) | |
Change in unrealized appreciation (depreciation) —
Investments (identified cost basis) | | $ | (396,252,822 | ) | |
| Foreign currency | | | (19,990 | ) | |
| Net change in unrealized appreciation (depreciation) | | $ | (396,272,812 | ) | |
| Net realized and unrealized loss | | $ | (593,747,437 | ) | |
| Net decrease in net assets from operations | | $ | (580,294,961 | ) | |
See notes to financial statements
6
Eaton Vance Tax-Managed Value Fund as of October 31, 2008
FINANCIAL STATEMENTS CONT'D
Statements of Changes in Net Assets
Increase (Decrease)
in Net Assets | | Year Ended
October 31, 2008 | | Year Ended
October 31, 2007 | |
From operations —
Net investment income | | $ | 13,452,476 | | | $ | 8,607,277 | | |
Net realized gain (loss) from investment
and foreign currency transactions | | | (197,474,625 | ) | | | 9,565,275 | | |
Net change in unrealized appreciation
(depreciation) of investments
and foreign currency | | | (396,272,812 | ) | | | 165,949,134 | | |
Net increase (decrease) in net assets
from operations | | $ | (580,294,961 | ) | | $ | 184,121,686 | | |
Distributions to shareholders —
From net investment income
Class A | | $ | (8,147,261 | ) | | $ | (5,102,992 | ) | |
| Class B | | | (270,151 | ) | | | (548,266 | ) | |
| Class C | | | (564,275 | ) | | | (808,982 | ) | |
| Class I | | | (1,733 | ) | | | — | | |
| Total distributions to shareholders | | $ | (8,983,420 | ) | | $ | (6,460,240 | ) | |
Transactions in shares of beneficial interest —
Proceeds from sale of shares
Class A | | $ | 735,258,748 | | | $ | 184,489,045 | | |
| Class B | | | 4,034,974 | | | | 6,462,599 | | |
| Class C | | | 34,081,205 | | | | 35,076,780 | | |
| Class I | | | 246,290,357 | | | | — | | |
Net asset value of shares issued to
shareholders in payment of
distributions declared
Class A | | | 5,630,048 | | | | 4,219,394 | | |
| Class B | | | 202,834 | | | | 409,092 | | |
| Class C | | | 403,573 | | | | 566,033 | | |
| Class I | | | 1,733 | | | | — | | |
Cost of shares redeemed
Class A | | | (447,294,284 | ) | | | (85,219,600 | ) | |
| Class B | | | (35,682,394 | ) | | | (33,513,124 | ) | |
| Class C | | | (47,758,186 | ) | | | (32,395,726 | ) | |
| Class I | | | (15,180,621 | ) | | | — | | |
Net asset value of shares exchanged
Class A | | | 23,617,530 | | | | 12,185,797 | | |
| Class B | | | (23,617,530 | ) | | | (12,185,797 | ) | |
Net increase in net assets from Fund
share transactions | | $ | 479,987,987 | | | $ | 80,094,493 | | |
| Net increase (decrease) in net assets | | $ | (109,290,394 | ) | | $ | 257,755,939 | | |
| Net Assets | |
| At beginning of year | | $ | 1,334,332,180 | | | $ | 1,076,576,241 | | |
| At end of year | | $ | 1,225,041,786 | | | $ | 1,334,332,180 | | |
Accumulated undistributed net
investment income included in net assets | |
| At end of year | | $ | 10,821,931 | | | $ | 6,811,010 | | |
See notes to financial statements
7
Eaton Vance Tax-Managed Value Fund as of October 31, 2008
FINANCIAL STATEMENTS CONT'D
Financial Highlights
| | | Class A | |
| | | Year Ended October 31, | |
| | | 2008(1) | | 2007 | | 2006 | | 2005 | | 2004 | |
| Net asset value — Beginning of year | | $ | 21.750 | | | $ | 18.770 | | | $ | 15.920 | | | $ | 13.950 | | | $ | 12.460 | | |
| Income (loss) from operations | |
| Net investment income | | $ | 0.229 | | | $ | 0.202 | | | $ | 0.189 | | | $ | 0.122 | | | $ | 0.135 | | |
| Net realized and unrealized gain (loss) | | | (7.386 | ) | | | 2.955 | | | | 2.805 | | | | 1.984 | | | | 1.471 | | |
| Total income (loss) from operations | | $ | (7.157 | ) | | $ | 3.157 | | | $ | 2.994 | | | $ | 2.106 | | | $ | 1.606 | | |
| Less distributions | |
| From net investment income | | $ | (0.193 | ) | | $ | (0.177 | ) | | $ | (0.144 | ) | | $ | (0.136 | ) | | $ | (0.116 | ) | |
| Total distributions | | $ | (0.193 | ) | | $ | (0.177 | ) | | $ | (0.144 | ) | | $ | (0.136 | ) | | $ | (0.116 | ) | |
| Net asset value — End of year | | $ | 14.400 | | | $ | 21.750 | | | $ | 18.770 | | | $ | 15.920 | | | $ | 13.950 | | |
| Total Return(2) | | | (33.19 | )% | | | 16.93 | % | | | 18.92 | % | | | 15.17 | % | | | 12.96 | % | |
| Ratios/Supplemental Data | |
| Net assets, end of year (000's omitted) | | $ | 710,258 | | | $ | 737,940 | | | $ | 529,073 | | | $ | 363,527 | | | $ | 269,908 | | |
| Ratios (As a percentage of average daily net assets): | |
| Expenses before custodian fee reduction(3)(4) | | | 1.16 | % | | | 1.16 | % | | | 1.18 | %(5) | | | 1.21 | %(5) | | | 1.22 | % | |
| Net investment income | | | 1.20 | % | | | 1.06 | % | | | 1.16 | % | | | 0.86 | % | | | 1.03 | % | |
| Portfolio Turnover of the Portfolio | | | 84 | % | | | 14 | % | | | 26 | % | | | 40 | % | | | 44 | % | |
(1) Net investment income per share was computed using average shares outstanding.
(2) Returns are historical and are calculated by determining the percentage change in net asset value with all distributions reinvested.
(3) Includes the Fund's share of the Portfolio's allocated expenses.
(4) Excludes the effect of custody fee credits, if any, of less than 0.005%.
(5) The investment adviser waived a portion of its investment adviser fee (equal to less than 0.005% of average daily net assets for the years ended October 31, 2006 and 2005).
See notes to financial statements
8
Eaton Vance Tax-Managed Value Fund as of October 31, 2008
FINANCIAL STATEMENTS CONT'D
Financial Highlights
| | | Class B | |
| | | Year Ended October 31, | |
| | | 2008(1) | | 2007 | | 2006 | | 2005 | | 2004 | |
| Net asset value — Beginning of year | | $ | 20.420 | | | $ | 17.630 | | | $ | 14.970 | | | $ | 13.130 | | | $ | 11.740 | | |
| Income (loss) from operations | |
| Net investment income | | $ | 0.091 | | | $ | 0.068 | | | $ | 0.073 | | | $ | 0.018 | | | $ | 0.035 | | |
| Net realized and unrealized gain (loss) | | | (6.958 | ) | | | 2.761 | | | | 2.618 | | | | 1.862 | | | | 1.384 | | |
| Total income (loss) from operations | | $ | (6.867 | ) | | $ | 2.829 | | | $ | 2.691 | | | $ | 1.880 | | | $ | 1.419 | | |
| Less distributions | |
| From net investment income | | $ | (0.023 | ) | | $ | (0.039 | ) | | $ | (0.031 | ) | | $ | (0.040 | ) | | $ | (0.029 | ) | |
| Total distributions | | $ | (0.023 | ) | | $ | (0.039 | ) | | $ | (0.031 | ) | | $ | (0.040 | ) | | $ | (0.029 | ) | |
| Net asset value — End of year | | $ | 13.530 | | | $ | 20.420 | | | $ | 17.630 | | | $ | 14.970 | | | $ | 13.130 | | |
| Total Return(2) | | | (33.67 | )% | | | 16.07 | % | | | 18.00 | % | | | 14.34 | % | | | 12.10 | % | |
| Ratios/Supplemental Data | |
| Net assets, end of year (000's omitted) | | $ | 122,001 | | | $ | 248,127 | | | $ | 250,030 | | | $ | 239,392 | | | $ | 227,778 | | |
| Ratios (As a percentage of average daily net assets): | |
| Expenses before custodian fee reduction(3)(4) | | | 1.89 | % | | | 1.91 | % | | | 1.93 | %(5) | | | 1.96 | %(5) | | | 1.97 | % | |
| Net investment income | | | 0.50 | % | | | 0.33 | % | | | 0.44 | % | | | 0.13 | % | | | 0.29 | % | |
| Portfolio Turnover of the Portfolio | | | 84 | % | | | 14 | % | | | 26 | % | | | 40 | % | | | 44 | % | |
(1) Net investment income per share was computed using average shares outstanding.
(2) Returns are historical and are calculated by determining the percentage change in net asset value with all distributions reinvested.
(3) Includes the Fund's share of the Portfolio's allocated expenses.
(4) Excludes the effect of custody fee credits, if any, of less than 0.005%.
(5) The investment adviser waived a portion of its investment adviser fee (equal to less than 0.005% of average daily net assets for the years ended October 31, 2006 and 2005).
See notes to financial statements
9
Eaton Vance Tax-Managed Value Fund as of October 31, 2008
FINANCIAL STATEMENTS CONT'D
Financial Highlights
| | | Class C | |
| | | Year Ended October 31, | |
| | | 2008(1) | | 2007 | | 2006 | | 2005 | | 2004 | |
| Net asset value — Beginning of year | | $ | 20.960 | | | $ | 18.100 | | | $ | 15.370 | | | $ | 13.470 | | | $ | 12.050 | | |
| Income (loss) from operations | |
| Net investment income | | $ | 0.087 | | | $ | 0.062 | | | $ | 0.071 | | | $ | 0.018 | | | $ | 0.038 | | |
| Net realized and unrealized gain (loss) | | | (7.143 | ) | | | 2.847 | | | | 2.694 | | | | 1.915 | | | | 1.412 | | |
| Total income (loss) from operations | | $ | (7.056 | ) | | $ | 2.909 | | | $ | 2.765 | | | $ | 1.933 | | | $ | 1.450 | | |
| Less distributions | |
| From net investment income | | $ | (0.034 | ) | | $ | (0.049 | ) | | $ | (0.035 | ) | | $ | (0.033 | ) | | $ | (0.030 | ) | |
| Total distributions | | $ | (0.034 | ) | | $ | (0.049 | ) | | $ | (0.035 | ) | | $ | (0.033 | ) | | $ | (0.030 | ) | |
| Net asset value — End of year | | $ | 13.870 | | | $ | 20.960 | | | $ | 18.100 | | | $ | 15.370 | | | $ | 13.470 | | |
| Contingent deferred sales charges(1) | | $ | 0.000 | (6) | | $ | — | | | $ | — | | | $ | — | | | $ | — | | |
| Total Return(2) | | | (33.72 | )% | | | 16.10 | % | | | 18.02 | % | | | 14.37 | % | | | 12.05 | % | |
| Ratios/Supplemental Data | |
| Net assets, end of year (000's omitted) | | $ | 218,320 | | | $ | 348,265 | | | $ | 297,473 | | | $ | 246,593 | | | $ | 216,066 | | |
| Ratios (As a percentage of average daily net assets): | |
| Expenses before custodian fee reduction(3)(4) | | | 1.91 | % | | | 1.91 | % | | | 1.93 | %(5) | | | 1.96 | %(5) | | | 1.97 | % | |
| Net investment income | | | 0.47 | % | | | 0.32 | % | | | 0.43 | % | | | 0.12 | % | | | 0.29 | % | |
| Portfolio Turnover of the Portfolio | | | 84 | % | | | 14 | % | | | 26 | % | | | 40 | % | | | 44 | % | |
(1) Net investment income and contingent deferred sales charges per share were computed using average shares outstanding.
(2) Returns are historical and are calculated by determining the percentage change in net asset value with all distributions reinvested.
(3) Includes the Fund's share of the Portfolio's allocated expenses.
(4) Excludes the effect of custody fee credits, if any, of less than 0.005%.
(5) The investment adviser waived a portion of its investment adviser fee (equal to less than 0.005% of average daily net assets for the years ended October 31, 2006 and 2005).
(6) Amount represents less than $0.0005 per share.
See notes to financial statements
10
Eaton Vance Tax-Managed Value Fund as of October 31, 2008
FINANCIAL STATEMENTS CONT'D
Financial Highlights
| | | Class I | |
| | | Period Ended
October 31, 2008(1)(2) | |
| Net asset value — Beginning of period | | $ | 20.970 | | |
| Income (loss) from operations | |
| Net investment income | | $ | 0.224 | | |
| Net realized and unrealized loss | | | (6.551 | ) | |
| Total loss from operations | | $ | (6.327 | ) | |
| Less distributions | |
| From net investment income | | $ | (0.233 | ) | |
| Total distributions | | $ | (0.233 | ) | |
| Net asset value — End of period | | $ | 14.410 | | |
| Total Return(3) | | | (30.53 | )%(8) | |
| Ratios/Supplemental Data | |
| Net assets, end of period (000's omitted) | | $ | 174,464 | | |
| Ratios (As a percentage of average daily net assets): | |
| Expenses before custodian fee reduction(4)(5) | | | 0.91 | %(6) | |
| Net investment income | | | 1.36 | %(6) | |
| Portfolio Turnover of the Portfolio | | | 84 | %(7) | |
(1) For the period from the start of business, November 30, 2007, to October 31, 2008.
(2) Net investment income per share was computed using average shares outstanding.
(3) Returns are historical and are calculated by determining the percentage change in net asset value with all distributions reinvested.
(4) Includes the Fund's share of the Portfolio's allocated expenses.
(5) Excludes the effect of custody fee credits, if any, of less than 0.005%.
(6) Annualized.
(7) For the Portfolio's fiscal year ended October 31, 2008.
(8) Not annualized.
See notes to financial statements
11
Eaton Vance Tax-Managed Value Fund as of October 31, 2008
NOTES TO FINANCIAL STATEMENTS
1 Significant Accounting Policies
Eaton Vance Tax-Managed Value Fund (the Fund) is a diversified series of Eaton Vance Mutual Funds Trust (the Trust). The Trust is a Massachusetts business trust registered under the Investment Company Act of 1940, as amended (the 1940 Act), as an open-end management investment company. The Fund offers four classes of shares. Class A shares are generally sold subject to a sales charge imposed at time of purchase. Class B and Class C shares are sold at net asset value and are generally subject to a contingent deferred sales charge (see Note 5). Class I shares are sold at net asset value and are not subject to a sales charge. Class B shares automatically convert to Class A shares eight years after their purchase as described in the Fund's prospectus. Each class represents a pro-rata interest in the Fund, but votes separately on class-specific matters and (as noted below) is subject to different expenses. Realized and unrealized gai ns and losses and net investment income and losses, other than class-specific expenses, are allocated daily to each class of shares based on the relative net assets of each class to the total net assets of the Fund. Each class of shares differs in its distribution plan and certain other class-specific expenses. The Fund invests all of its investable assets in interests in Tax-Managed Value Portfolio (the Portfolio), a New York trust, having the same investment objective and policies as the Fund. The value of the Fund's investment in the Portfolio reflects the Fund's proportionate interest in the net assets of the Portfolio (90.4% at October 31, 2008). The performance of the Fund is directly affected by the performance of the Portfolio. The financial statements of the Portfolio, including the portfolio of investments, are included elsewhere in this report and should b e read in conjunction with the Fund's financial statements.
The following is a summary of significant accounting policies of the Fund. The policies are in conformity with accounting principles generally accepted in the United States of America.
A Investment Valuation — Valuation of securities by the Portfolio is discussed in Note 1A of the Portfolio's Notes to Financial Statements, which are included elsewhere in this report.
B Income — The Fund's net investment income or loss consists of the Fund's pro-rata share of the net investment income or loss of the Portfolio, less all actual and accrued expenses of the Fund.
C Federal Taxes — The Fund's policy is to comply with the provisions of the Internal Revenue Code applicable to regulated investment companies and to distribute to shareholders each year substantially all of its net investment income, and all or substantially all of its net realized capital gains. Accordingly, no provision for federal income or excise tax is necessary.
At October 31, 2008, the Fund, for federal income tax purposes, had a capital loss carryforward of $237,164,573 which will reduce its taxable income arising from future net realized gains on investment transactions, if any, to the extent permitted by the Internal Revenue Code, and thus will reduce the amount of distributions to shareholders, which would otherwise be necessary to relieve the Fund of any liability for federal income or excise tax. Such capital loss carryforward will expire on October 31, 2010 ($43,295,557) and October 31, 2016 ($193,869,016).
As of October 31, 2008, the Fund had no uncertain tax positions that would require financial statement recognition, de-recognition, or disclosure. Each of the Fund's federal tax returns filed in the 3-year period ended October 31, 2008 remains subject to examination by the Internal Revenue Service.
D Expenses — The majority of expenses of the Trust are directly identifiable to an individual fund. Expenses which are not readily identifiable to a specific fund are allocated taking into consideration, among other things, the nature and type of expense and the relative size of the funds.
E Expense Reduction — State Street Bank and Trust Company (SSBT) serves as custodian of the Fund. Pursuant to the custodian agreement, SSBT receives a fee reduced by credits, which are determined based on the average daily cash balance the Fund maintains with SSBT. All credit balances, if any, used to reduce the Fund's custodian fees are reported as a reduction of expenses in the Statement of Operations.
F Use of Estimates — The preparation of the financial statements in conformity with accounting principles generally accepted in the United States of America requires management to make estimates and assumptions that affect the reported amounts of assets and liabilities at the date of the financial statements and the reported amounts of income and expense during the reporting period. Actual results could differ from those estimates.
G Indemnifications — Under the Trust's organizational documents, its officers and Trustees may be indemnified against certain liabilities and expenses arising out of the performance of their duties to the Fund, and shareholders are indemnified against personal liability for the obligations of the Trust. Additionally, in the normal
12
Eaton Vance Tax-Managed Value Fund as of October 31, 2008
NOTES TO FINANCIAL STATEMENTS CONT'D
course of business, the Fund enters into agreements with service providers that may contain indemnification clauses. The Fund's maximum exposure under these arrangements is unknown as this would involve future claims that may be made against the Fund that have not yet occurred.
H Other — Investment transactions are accounted for on a trade date basis. Dividends to shareholders are recorded on the ex-dividend date.
2 Distributions to Shareholders
It is the present policy of the Fund to make at least one distribution annually (normally in December) of all or substantially all of its net investment income and to distribute annually all or substantially all of its net realized capital gains (reduced by available capital loss carryforwards from prior years, if any). Distributions are declared separately for each class of shares. Shareholders may reinvest income and capital gain distributions in additional shares of the same class of the Fund at the net asset value as of the ex-dividend date or, at the election of the shareholder, receive distributions in cash. The Fund distinguishes between distributions on a tax basis and a financial reporting basis. Accounting principles generally accepted in the United States of America require th at only distributions in excess of tax basis earnings and profits be reported in the financial statements as a return of capital. Permanent differences between book and tax accounting relating to distributions are reclassified to paid-in capital.
The tax character of distributions declared for the years ended October 31, 2008 and October 31, 2007 was as follows:
| | | Year Ended October 31, | |
| | | 2008 | | 2007 | |
| Distributions declared from: | |
| Ordinary income | | $ | 8,983,420 | | | $ | 6,460,240 | | |
During the year ended October 31, 2008, accumulated net realized loss was decreased by $460,458, accumulated undistributed net investment income was decreased by $458,135, and paid-in capital was decreased by $2,323 due to differences between book and tax accounting, primarily for distributions from real estate investment trusts (REITs), foreign currency gain (loss) and non-deductible expenses. These reclassifications had no effect on the net assets or net asset value per share of the Fund.
As of October 31, 2008, the components of distributable earnings (accumulated losses) and unrealized appreciation (depreciation) on tax basis were as follows:
| Undistributed ordinary income | | $ | 10,614,613 | | |
| Capital loss carryforward | | $ | (237,164,573 | ) | |
| Net unrealized appreciation | | $ | 140,502,025 | | |
The differences between components of distributable earnings (accumulated losses) on a tax basis and the amounts reflected in the Statement of Assets and Liabilities are primarily due to wash sales, partnership allocations, investments in partnerships and distributions from REITs.
3 Transactions with Affiliates
The administration fee is earned by Eaton Vance Management (EVM) as compensation for administrative services rendered to the Fund. The fee is computed at an annual rate of 0.15% of the Fund's average daily net assets. For the year ended October 31, 2008, the administration fee amounted to $2,122,496. The Portfolio has engaged Boston Management and Research (BMR), a subsidiary of EVM, to render investment advisory services. See Note 2 of the Portfolio's Notes to Financial Statements which are included elsewhere in this report. EVM serves as the sub-transfer agent of the Fund and receives from the transfer agent an aggregate fee based upon the actual expenses incurred by EVM in the performance of these services. For the year ended October 31, 2008, EVM earned $64,637 in sub-transfer agent fees. The Fund was informed that Eaton Vance Distributors, Inc. (EVD), an affiliate of EVM and the Fund's principal underwriter, received $113,1 65 as its portion of the sales charge on sales of Class A shares for the year ended October 31, 2008. EVD also received distribution and service fees from Class A, Class B and Class C shares (see Note 4) and contingent deferred sales charges (see Note 5).
Except for Trustees of the Fund and the Portfolio who are not members of EVM's or BMR's organizations, officers and Trustees receive remuneration for their services to the Fund out of the investment adviser fee. Certain officers and Trustees of the Fund and the Portfolio are officers of the above organizations.
4 Distribution Plans
The Fund has in effect a distribution plan for Class A shares (Class A Plan) pursuant to Rule 12b-1 under the 1940 Act. The Class A Plan provides that the Fund will pay EVD a distribution and service fee of 0.25% per annum of its average daily net assets attributable to Class A shares for distribution services and facilities provided to the Fund by
13
Eaton Vance Tax-Managed Value Fund as of October 31, 2008
NOTES TO FINANCIAL STATEMENTS CONT'D
EVD, as well as for personal services and/or the maintenance of shareholder accounts. Distribution and service fees paid or accrued to EVD for the year ended October 31, 2008 amounted to $2,088,765 for Class A shares.
The Fund also has in effect distribution plans for Class B shares (Class B Plan) and Class C shares (Class C Plan) pursuant to Rule 12b-1 under the 1940 Act. The Class B and Class C Plans require the Fund to pay EVD amounts equal to 0.75% per annum of its average daily net assets attributable to Class B and Class C shares for providing ongoing distribution services and facilities to the Fund. The Fund will automatically discontinue payments to EVD during any period in which there are no outstanding Uncovered Distribution Charges, which are equivalent to the sum of (i) 5% and 6.25% of the aggregate amount received by the Fund for Class B and Class C shares sold, respectively, plus (ii) interest calculated by applying the rate of 1% over the prevailing prime rate to the outstanding balance of Uncovered Distribution Charges of EVD of each respective class, reduced by the aggregate amount of contingent deferred sales charges (see No te 5) and amounts theretofore paid or payable to EVD by each respective class. Such payments were discontinued during portions of the year ended October 31, 2008 with respect to Class B. For the year ended October 31, 2008, the Fund paid or accrued to EVD $1,433,727 and $2,299,546 for Class B and Class C shares, respectively, representing 0.73% and 0.75% of the average daily net assets of Class B and Class C shares, respectively. At October 31, 2008, the amount of Uncovered Distribution Charges of EVD calculated under the Class C Plan was approximately $23,519,000. There were no Uncovered Distribution Charges calculated under the Class B Plan at October 31, 2008.
The Class B and Class C Plans also authorize the Fund to make payments of service fees to EVD, investment dealers and other persons in amounts not exceeding 0.25% per annum of its average daily net assets attributable to that class. Service fees paid or accrued are for personal services and/or the maintenance of shareholder accounts. They are separate and distinct from the sales commissions and distribution fees payable to EVD and, as such, are not subject to automatic discontinuance when there are no outstanding Uncovered Distribution Charges of EVD. Service fees paid or accrued for the year ended October 31, 2008 amounted to $493,580 and $766,515 for Class B and Class C shares, respectively.
5 Contingent Deferred Sales Charges
A contingent deferred sales charge (CDSC) generally is imposed on redemptions of Class B shares made within six years of purchase and on redemptions of Class C shares made within one year of purchase. Class A shares may be subject to a CDSC up to 1% if redeemed within two years of purchase (depending on the circumstances of purchase). Generally, the CDSC is based upon the lower of the net asset value at date of redemption or date of purchase. No charge is levied on shares acquired by reinvestment of dividends or capital gain distributions. The CDSC for Class B shares is imposed at declining rates that begin at 5% in the case of redemptions in the first and second year after purchase, declining one percentage point each subsequent year. Class C shares are subject to a 1% CDSC if redeemed within one year of purchase. No CDSC is levied on shares which have been sold to EVM or its affiliates or to their respective employees or clien ts and may be waived under certain other limited conditions. CDSCs received on Class B and Class C redemptions are paid to EVD to reduce the amount of Uncovered Distribution Charges calculated under the Fund's Class B and Class C Plans. CDSCs received on Class B and Class C redemptions when no Uncovered Distribution Charges exist are credited to the Fund. For the year ended October 31, 2008, the Fund was informed that EVD received approximately $7,000, $117,000 and $23,000 of CDSCs paid by Class A, Class B and Class C shareholders, respectively. In addition, $14,700 of CDSCs was paid by Class B shareholders directly to the Fund for days when no Uncovered Distribution Charges existed.
6 Investment Transactions
For the year ended October 31, 2008, increases and decreases in the Fund's investment in the Portfolio aggregated $1,015,740,952 and $553,767,152, respectively.
7 Shares of Beneficial Interest
The Fund's Declaration of Trust permits the Trustees to issue an unlimited number of full and fractional shares of beneficial interest (without par value). Such shares may be issued in a number of different series (such as the Fund) and classes. Transactions in Fund shares were as follows:
| | | Year Ended October 31, | |
| Class A | | 2008 | | 2007 | |
| Sales | | | 38,743,553 | | | | 9,106,356 | | |
Issued to shareholders electing to
receive payments of distributions
in Fund shares | | | 263,579 | | | | 217,382 | | |
| Redemptions | | | (24,845,762 | ) | | | (4,194,738 | ) | |
| Exchange from Class B shares | | | 1,246,356 | | | | 599,225 | | |
| Net increase | | | 15,407,726 | | | | 5,728,225 | | |
14
Eaton Vance Tax-Managed Value Fund as of October 31, 2008
NOTES TO FINANCIAL STATEMENTS CONT'D
| | | Year Ended October 31, | |
| Class B | | 2008 | | 2007 | |
| Sales | | | 228,065 | | | | 340,581 | | |
Issued to shareholders electing to
receive payments of distributions
in Fund shares | | | 10,046 | | | | 22,306 | | |
| Redemptions | | | (2,045,593 | ) | | | (1,760,747 | ) | |
| Exchange to Class A shares | | | (1,323,839 | ) | | | (636,294 | ) | |
| Net decrease | | | (3,131,321 | ) | | | (2,034,154 | ) | |
| | | Year Ended October 31, | |
| Class C | | 2008 | | 2007 | |
| Sales | | | 1,855,880 | | | | 1,804,499 | | |
Issued to shareholders electing to
receive payments of distributions
in Fund shares | | | 19,487 | | | | 30,076 | | |
| Redemptions | | | (2,751,581 | ) | | | (1,654,125 | ) | |
| Net increase (decrease) | | | (876,214 | ) | | | 180,450 | | |
| Class I | | Period Ended
October 31, 2008(1) | |
| Sales | | | 13,008,304 | | |
Issued to shareholders electing to
receive payments of distributions
in Fund shares | | | 81 | | |
| Redemptions | | | (900,751 | ) | |
| Net increase | | | 12,107,634 | | |
(1)Class I commenced operations on November 30, 2007.
8 Recently Issued Accounting Pronouncement
In September 2006, the Financial Accounting Standards Board issued Statement of Financial Accounting Standards No. 157 (FAS 157), "Fair Value Measurements". FAS 157 defines fair value, establishes a framework for measuring fair value in accordance with accounting principles generally accepted in the United States of America and expands disclosure about fair value measurements. FAS 157 is effective for fiscal years beginning after November 15, 2007. As of October 31, 2008, management does not believe the adoption of FAS 157 will impact the amounts reported in the financial statements; however, additional disclosures may be required about the inputs used to develop the measurements of fair value and the effect of certain of the measurements on changes in net assets for the period.
15
Eaton Vance Tax-Managed Value Fund as of October 31, 2008
REPORT OF INDEPENDENT REGISTERED PUBLIC ACCOUNTING FIRM
To the Trustees of Eaton Vance
Mutual Funds Trust and Shareholders
of Eaton Vance Tax-Managed Value Fund:
We have audited the accompanying statement of assets and liabilities of Eaton Vance Tax-Managed Value Fund (the "Fund") (one of the series of Eaton Vance Mutual Funds Trust) as of October 31, 2008, and the related statement of operations for the year then ended, the statements of changes in net assets for each of the two years in the period then ended, and the financial highlights for each of the five years in the period then ended. These financial statements and financial highlights are the responsibility of the Fund's management. Our responsibility is to express an opinion on these financial statements and financial highlights based on our audits.
We conducted our audits in accordance with the standards of the Public Company Accounting Oversight Board (United States). Those standards require that we plan and perform the audit to obtain reasonable assurance about whether the financial statements and financial highlights are free of material misstatement. The Fund is not required to have, nor were we engaged to perform, an audit of its internal control over financial reporting. Our audits included consideration of internal control over financial reporting as a basis for designing audit procedures that are appropriate in the circumstances, but not for the purpose of expressing an opinion on the effectiveness of the Fund's internal control over financial reporting. Accordingly, we express no such opinion. An audit also includes examining, on a test basis, evidence supporting the amounts and disclosures in the financial statements, assessing the accounting principles used and significant estimates made by management, as well as evaluating the overall financial statement presentation. We believe that our audits provide a reasonable basis for our opinion.
In our opinion, the financial statements and financial highlights referred to above present fairly, in all material respects, the financial position of Eaton Vance Tax-Managed Value Fund as of October 31, 2008, the results of its operations for the year then ended, the changes in its net assets for each of the two years in the period then ended, and the financial highlights for each of the five years in the period then ended, in conformity with accounting principles generally accepted in the United States of America.
DELOITTE & TOUCHE LLP
Boston, Massachusetts
December 15, 2008
16
Eaton Vance Tax-Managed Value Fund as of October 31, 2008
FEDERAL TAX INFORMATION (Unaudited)
The Form 1099-DIV you receive in January 2009 will show the tax status of all distributions paid to your account in calendar 2008. Shareholders are advised to consult their own tax adviser with respect to the tax consequences of their investment in the Fund. As required by the Internal Revenue Code regulations, shareholders must be notified within 60 days of the Fund's fiscal year end regarding the status of qualified dividend income for individuals and the dividends received deduction for corporations.
Qualified Dividend Income. The Fund designates $31,948,283, or up to the maximum amount of such dividends allowable pursuant to the Internal Revenue Code, as qualified dividend income eligible for the reduced tax rate of 15%.
Dividends Received Deduction. Corporate shareholders are generally entitled to take the dividends received deduction on the portion of the Fund's dividend distribution that qualifies under tax law. For the Fund's fiscal 2008 ordinary income dividends, 100% qualifies for the corporate dividends received deduction.
17
Tax-Managed Value Portfolio as of October 31, 2008
PORTFOLIO OF INVESTMENTS
| Common Stocks — 94.6% | |
| Security | | Shares | | Value | |
| Aerospace & Defense — 4.5% | |
| General Dynamics Corp. | | | 450,000 | | | $ | 27,144,000 | | |
| Raytheon Co. | | | 400,000 | | | | 20,444,000 | | |
| United Technologies Corp. | | | 250,000 | | | | 13,740,000 | | |
| | | $ | 61,328,000 | | |
| Auto Components — 0.8% | |
| BorgWarner, Inc. | | | 500,000 | | | $ | 11,235,000 | | |
| | | $ | 11,235,000 | | |
| Biotechnology — 0.9% | |
| Amgen, Inc.(1) | | | 200,000 | | | $ | 11,978,000 | | |
| | | $ | 11,978,000 | | |
| Capital Markets — 2.3% | |
| Goldman Sachs Group, Inc. | | | 110,000 | | | $ | 10,175,000 | | |
| Invesco, Ltd. | | | 1,400,000 | | | | 20,874,000 | | |
| | | $ | 31,049,000 | | |
| Chemicals — 2.1% | |
| Air Products and Chemicals, Inc. | | | 250,000 | | | $ | 14,532,500 | | |
| Dow Chemical Co. (The) | | | 500,000 | | | | 13,335,000 | | |
| | | $ | 27,867,500 | | |
| Commercial Banks — 5.9% | |
| PNC Financial Services Group, Inc. | | | 200,000 | | | $ | 13,334,000 | | |
| U.S. Bancorp | | | 1,050,000 | | | | 31,300,500 | | |
| Wells Fargo & Co. | | | 1,050,000 | | | | 35,752,500 | | |
| | | $ | 80,387,000 | | |
| Commercial Services & Supplies — 0.7% | |
| Waste Management, Inc. | | | 300,000 | | | $ | 9,369,000 | | |
| | | $ | 9,369,000 | | |
| Computers & Peripherals — 4.8% | |
| Hewlett-Packard Co. | | | 850,000 | | | $ | 32,538,000 | | |
| International Business Machines Corp. | | | 350,000 | | | | 32,539,500 | | |
| | | $ | 65,077,500 | | |
| Security | | Shares | | Value | |
| Diversified Financial Services — 5.7% | |
| Bank of America Corp. | | | 1,300,000 | | | $ | 31,421,000 | | |
| Citigroup, Inc. | | | 450,000 | | | | 6,142,500 | | |
| JPMorgan Chase & Co. | | | 950,000 | | | | 39,187,500 | | |
| | | $ | 76,751,000 | | |
| Diversified Telecommunication Services — 3.7% | |
| AT&T, Inc. | | | 950,000 | | | $ | 25,431,500 | | |
| Verizon Communications, Inc. | | | 825,000 | | | | 24,477,750 | | |
| | | $ | 49,909,250 | | |
| Electric Utilities — 4.8% | |
| Edison International | | | 300,000 | | | $ | 10,677,000 | | |
| Entergy Corp. | | | 200,000 | | | | 15,610,000 | | |
| Exelon Corp. | | | 400,000 | | | | 21,696,000 | | |
| FPL Group, Inc. | | | 350,000 | | | | 16,534,000 | | |
| | | $ | 64,517,000 | | |
| Energy Equipment & Services — 1.5% | |
| Schlumberger, Ltd. | | | 125,000 | | | $ | 6,456,250 | | |
| Transocean, Inc.(1) | | | 176,295 | | | | 14,514,367 | | |
| | | $ | 20,970,617 | | |
| Food & Staples Retailing — 5.7% | |
| CVS Caremark Corp. | | | 1,100,000 | | | $ | 33,715,000 | | |
| Kroger Co. (The) | | | 1,000,000 | | | | 27,460,000 | | |
| Wal-Mart Stores, Inc. | | | 300,000 | | | | 16,743,000 | | |
| | | $ | 77,918,000 | | |
| Food Products — 2.6% | |
| Nestle SA | | | 900,000 | | | $ | 34,998,293 | | |
| | | $ | 34,998,293 | | |
| Health Care Providers & Services — 0.9% | |
| Aetna, Inc. | | | 225,000 | | | $ | 5,595,750 | | |
| UnitedHealth Group, Inc. | | | 300,000 | | | | 7,119,000 | | |
| | | $ | 12,714,750 | | |
| Hotels, Restaurants & Leisure — 1.1% | |
| McDonald's Corp. | | | 250,000 | | | $ | 14,482,500 | | |
| | | $ | 14,482,500 | | |
See notes to financial statements
18
Tax-Managed Value Portfolio as of October 31, 2008
PORTFOLIO OF INVESTMENTS CONT'D
| Security | | Shares | | Value | |
| Household Products — 1.4% | |
| Kimberly-Clark Corp. | | | 300,000 | | | $ | 18,387,000 | | |
| | | $ | 18,387,000 | | |
| Industrial Conglomerates — 1.9% | |
| General Electric Co. | | | 1,350,000 | | | $ | 26,338,500 | | |
| | | $ | 26,338,500 | | |
| Insurance — 9.6% | |
| ACE, Ltd. | | | 350,000 | | | $ | 20,076,000 | | |
| Aflac, Inc. | | | 450,000 | | | | 19,926,000 | | |
| Chubb Corp. | | | 600,000 | | | | 31,092,000 | | |
| MetLife, Inc. | | | 825,000 | | | | 27,406,500 | | |
| Travelers Companies, Inc. (The) | | | 750,000 | | | | 31,912,500 | | |
| | | $ | 130,413,000 | | |
| Machinery — 1.7% | |
| Caterpillar, Inc. | | | 200,000 | | | $ | 7,634,000 | | |
| Deere & Co. | | | 400,000 | | | | 15,424,000 | | |
| | | $ | 23,058,000 | | |
| Media — 3.3% | |
| Comcast Corp., Class A | | | 1,200,000 | | | $ | 18,912,000 | | |
| Vivendi SA | | | 500,000 | | | | 13,069,552 | | |
| Walt Disney Co. | | | 500,000 | | | | 12,950,000 | | |
| | | $ | 44,931,552 | | |
| Multiline Retail — 0.5% | |
| Target Corp. | | | 180,000 | | | $ | 7,221,600 | | |
| | | $ | 7,221,600 | | |
| Multi-Utilities — 0.9% | |
| Dominion Resources, Inc. | | | 350,000 | | | $ | 12,698,000 | | |
| | | $ | 12,698,000 | | |
| Oil, Gas & Consumable Fuels — 11.0% | |
| Apache Corp. | | | 165,000 | | | $ | 13,584,450 | | |
| Chevron Corp. | | | 425,000 | | | | 31,705,000 | | |
| ConocoPhillips | | | 250,000 | | | | 13,005,000 | | |
| Exxon Mobil Corp. | | | 450,000 | | | | 33,354,000 | | |
| Hess Corp. | | | 125,000 | | | | 7,526,250 | | |
| Marathon Oil Corp. | | | 250,000 | | | | 7,275,000 | | |
| Security | | Shares | | Value | |
| Oil, Gas & Consumable Fuels (continued) | |
| Occidental Petroleum Corp. | | | 450,000 | | | $ | 24,993,000 | | |
| Peabody Energy Corp.(2) | | | 300,000 | | | | 10,353,000 | | |
| XTO Energy, Inc. | | | 200,000 | | | | 7,190,000 | | |
| | | $ | 148,985,700 | | |
| Pharmaceuticals — 7.9% | |
| Abbott Laboratories | | | 250,000 | | | $ | 13,787,500 | | |
| Johnson & Johnson | | | 325,000 | | | | 19,935,500 | | |
| Merck & Co., Inc. | | | 1,000,000 | | | | 30,950,000 | | |
| Pfizer, Inc. | | | 1,700,000 | | | | 30,107,000 | | |
| Wyeth | | | 400,000 | | | | 12,872,000 | | |
| | | $ | 107,652,000 | | |
| Real Estate Investment Trusts (REITs) — 2.2% | |
| AvalonBay Communities, Inc. | | | 125,000 | | | $ | 8,877,500 | | |
| Boston Properties, Inc.(2) | | | 125,000 | | | | 8,860,000 | | |
| Public Storage, Inc. | | | 75,000 | | | | 6,112,500 | | |
| Simon Property Group, Inc. | | | 100,000 | | | | 6,703,000 | | |
| | | $ | 30,553,000 | | |
| Road & Rail — 1.6% | |
| Burlington Northern Santa Fe Corp. | | | 250,000 | | | $ | 22,265,000 | | |
| | | $ | 22,265,000 | | |
| Specialty Retail — 2.0% | |
| Staples, Inc. | | | 900,000 | | | $ | 17,487,000 | | |
| TJX Companies, Inc. (The) | | | 350,000 | | | | 9,366,000 | | |
| | | $ | 26,853,000 | | |
| Tobacco — 1.3% | |
| Philip Morris International, Inc. | | | 400,000 | | | $ | 17,388,000 | | |
| | | $ | 17,388,000 | | |
| Wireless Telecommunication Services — 1.3% | |
| Rogers Communications, Inc., Class B | | | 600,000 | | | $ | 17,454,000 | | |
| | | $ | 17,454,000 | | |
Total Common Stocks
(identified cost $1,121,821,008) | | $ | 1,284,750,762 | | |
See notes to financial statements
19
Tax-Managed Value Portfolio as of October 31, 2008
PORTFOLIO OF INVESTMENTS CONT'D
| Short-Term Investments — 6.2% | |
| Description | | Interest
(000's omitted) | | Value | |
| Eaton Vance Cash Collateral Fund, LLC, 3.45%(3)(4) | | $ | 30,959 | | | $ | 30,958,774 | | |
| Cash Management Portfolio, 1.90%(4) | | | 53,069 | | | | 53,068,994 | | |
Total Short-Term Investments
(identified cost $84,610,524) | | $ | 84,027,768 | | |
Total Investments — 100.8%
(identified cost $1,206,431,532) | | $ | 1,368,778,530 | | |
| Other Assets, Less Liabilities — (0.8)% | | $ | (11,498,489 | ) | |
| Net Assets — 100.0% | | $ | 1,357,280,041 | | |
(1) Non-income producing security.
(2) All or a portion of this security was on loan at October 31, 2008.
(3) The investment in Eaton Vance Cash Collateral Fund, LLC includes the value of invested cash collateral received for securities on loan at October 31, 2008. Other Assets, Less Liabilities includes an equal and offsetting liability of the Portfolio to repay collateral amounts upon the return of loaned securities plus realized and unrealized losses, if any, on the amount invested. At October 31, 2008, the investment in Eaton Vance Cash Collateral Fund, LLC also includes $20,757,100 of cash collateral received on security loans that were terminated with the counterparty, for which the repayment obligations were settled by the Portfolio using other available cash.
(4) Affiliated investment company available to Eaton Vance portfolios and funds which invests in high quality, U.S. dollar denominated money market instruments. The rate shown is the annualized seven-day yield as of October 31, 2008.
See notes to financial statements
20
Tax-Managed Value Portfolio as of October 31, 2008
FINANCIAL STATEMENTS
Statement of Assets and Liabilities
As of October 31, 2008
| Assets | |
Unaffiliated investments, at value including $10,688,640 of securities
on loan (identified cost, $1,121,821,008) | | $ | 1,284,750,762 | | |
| Affiliated investments, at value (identified cost, $84,610,524) | | | 84,027,768 | | |
| Receivable for investments sold | | | 36,799,816 | | |
| Dividends receivable | | | 2,495,775 | | |
| Interest receivable from affiliated investments | | | 113,397 | | |
| Securities lending income receivable | | | 39,052 | | |
| Tax reclaims receivable | | | 507,783 | | |
| Total assets | | $ | 1,408,734,353 | | |
| Liabilities | |
| Payable for investments purchased | | $ | 39,594,200 | | |
| Collateral for securities loaned | | | 10,961,150 | | |
| Payable to affiliate for investment adviser fee | | | 701,186 | | |
| Payable to affiliate for Trustees' fees | | | 2,924 | | |
| Accrued expenses | | | 194,852 | | |
| Total liabilities | | $ | 51,454,312 | | |
| Net Assets applicable to investors' interest in Portfolio | | $ | 1,357,280,041 | | |
| Sources of Net Assets | |
| Net proceeds from capital contributions and withdrawals | | $ | 1,194,926,473 | | |
| Net unrealized appreciation (computed on the basis of identified cost) | | | 162,353,568 | | |
| Total | | $ | 1,357,280,041 | | |
Statement of Operations
For the Year Ended
October 31, 2008
| Investment Income | |
| Dividends (net of foreign taxes, $169,590) | | $ | 35,742,826 | | |
| Interest | | | 93 | | |
| Securities lending income, net | | | 237,638 | | |
| Interest income allocated from affiliated investments | | | 1,499,961 | | |
| Expenses allocated from affiliated investment | | | (206,174 | ) | |
| Total investment income | | $ | 37,274,344 | | |
| Expenses | |
| Investment adviser fee | | $ | 9,687,821 | | |
| Trustees' fees and expenses | | | 37,330 | | |
| Custodian fee | | | 336,804 | | |
| Legal and accounting services | | | 84,168 | | |
| Miscellaneous | | | 47,869 | | |
| Total expenses | | $ | 10,193,992 | | |
Deduct —
Reduction of custodian fee | | $ | 1 | | |
| Total expense reductions | | $ | 1 | | |
| Net expenses | | $ | 10,193,991 | | |
| Net investment income | | $ | 27,080,353 | | |
| Realized and Unrealized Gain (Loss) | |
Net realized gain (loss) —
Investment transactions (identified cost basis) | | $ | (221,571,208 | ) | |
| Investment transactions allocated from affiliated investment | | | (176,720 | ) | |
| Foreign currency transactions | | | (53,178 | ) | |
| Net realized loss | | $ | (221,801,106 | ) | |
Change in unrealized appreciation (depreciation) —
Investments (identified cost basis) | | $ | (439,263,488 | ) | |
| Foreign currency | | | (21,336 | ) | |
| Net change in unrealized appreciation (depreciation) | | $ | (439,284,824 | ) | |
| Net realized and unrealized loss | | $ | (661,085,930 | ) | |
| Net decrease in net assets from operations | | $ | (634,005,577 | ) | |
See notes to financial statements
21
Tax-Managed Value Portfolio as of October 31, 2008
FINANCIAL STATEMENTS CONT'D
Statements of Changes in Net Assets
Increase (Decrease)
in Net Assets | | Year Ended
October 31, 2008 | | Year Ended
October 31, 2007 | |
From operations —
Net investment income | | $ | 27,080,353 | | | $ | 21,338,601 | | |
Net realized gain (loss) from investment
and foreign currency transactions | | | (221,801,106 | ) | | | 10,402,351 | | |
Net change in unrealized
appreciation (depreciation) of
investments and foreign currency | | | (439,284,824 | ) | | | 187,564,735 | | |
Net increase (decrease) in net assets
from operations | | $ | (634,005,577 | ) | | $ | 219,305,687 | | |
Capital transactions —
Contributions | | $ | 1,026,614,787 | | | $ | 253,731,971 | | |
| Withdrawals | | | (556,492,962 | ) | | | (164,869,742 | ) | |
Net increase in net assets from
capital transactions | | $ | 470,121,825 | | | $ | 88,862,229 | | |
| Net increase (decrease) in net assets | | $ | (163,883,752 | ) | | $ | 308,167,916 | | |
| Net Assets | |
| At beginning of year | | $ | 1,521,163,793 | | | $ | 1,212,995,877 | | |
| At end of year | | $ | 1,357,280,041 | | | $ | 1,521,163,793 | | |
See notes to financial statements
22
Tax-Managed Value Portfolio as of October 31, 2008
FINANCIAL STATEMENTS CONT'D
Supplementary Data
| | | Year Ended October 31, | |
| | | 2008 | | 2007 | | 2006 | | 2005 | | 2004 | |
| Ratios/Supplemental Data | |
| Ratios (As a percentage of average daily net assets): | |
| Expenses before custodian fee reduction(2) | | | 0.66 | % | | | 0.66 | % | | | 0.67 | %(1) | | | 0.68 | %(1) | | | 0.69 | % | |
| Net investment income | | | 1.71 | % | | | 1.56 | % | | | 1.67 | % | | | 1.40 | % | | | 1.57 | % | |
| Portfolio Turnover | | | 84 | % | | | 14 | % | | | 26 | % | | | 40 | % | | | 44 | % | |
| Total Return | | | (32.85 | )% | | | 17.51 | % | | | 19.53 | % | | | 15.76 | % | | | 13.55 | % | |
| Net assets, end of year (000's omitted) | | $ | 1,357,280 | | | $ | 1,521,164 | | | $ | 1,212,996 | | | $ | 946,075 | | | $ | 797,423 | | |
(1) The investment adviser waived a portion of its investment adviser fee (equal to less than 0.005% of average daily net assets for the years ended October 31, 2006 and 2005).
(2) Excludes the effect of custody credits, if any, of less than 0.005%.
See notes to financial statements
23
Tax-Managed Value Portfolio as of October 31, 2008
NOTES TO FINANCIAL STATEMENTS
1 Significant Accounting Policies
Tax-Managed Value Portfolio (the Portfolio) is a New York trust registered under the Investment Company Act of 1940, as amended (the 1940 Act), as a diversified, open-end management investment company. The Portfolio's investment objective is to achieve long-term, after-tax returns. The Declaration of Trust permits the Trustees to issue interests in the Portfolio. At October 31, 2008, Eaton Vance Tax-Managed Value Fund and Eaton Vance Tax-Managed Equity Asset Allocation Fund held an interest of 90.4% and 9.6%, respectively, in the Portfolio.
The following is a summary of significant accounting policies of the Portfolio. The policies are in conformity with accounting principles generally accepted in the United States of America.
A Investment Valuation — Equity securities listed on a U.S. securities exchange generally are valued at the last sale price on the day of valuation or, if no sales took place on such date, at the mean between the closing bid and asked prices therefore on the exchange where such securities are principally traded. Equity securities listed on the NASDAQ Global or Global Select Market generally are valued at the NASDAQ official closing price. Unlisted or listed securities for which closing sales prices or closing quotations are not available are valued at the mean between the latest available bid and asked prices or, in the case of preferred equity securities that are not listed or traded in the over-the- counter market, by an independent pricing service. Short-term debt securities with a remaining maturity of sixty days or less are valued at amortized cost, which approximates market value. If short-term debt securities are acquired with a remaining maturity of more than sixty days, they will be valued by a pricing service. Foreign securities and currencies are valued in U.S. dollars, based on foreign currency exchange rate quotations supplied by an independent quotation service. The independent service uses a proprietary model to determine the exchange rate. Inputs to the model include reported trades and implied bid/ask spreads. The daily valuation of exchange-traded foreign securities generally is determined as of the close of trading on the principal exchange on which such securities trade. Events occurring after the close of trading on foreign exchanges may result in adjustments to the valuation of foreign securities to more accurately reflect their fair value as of the close of regular trading on the Ne w York Stock Exchange. When valuing foreign equity securities that meet certain criteria, the Trustees have approved the use of a fair value service that values such securities to reflect market trading that occurs after the close of the applicable foreign markets of comparable securities or other instruments that have a strong correlation to the fair-valued securities. Investments for which valuations or market quotations are not readily available are valued at fair value using methods determined in good faith by or at the direction of the Trustees of the Portfolio considering relevant factors, data and information including the market value of freely tradable securities of the same class in the principal market on which such securities are normally traded.
The Portfolio may invest in Cash Management Portfolio (Cash Management) and Eaton Vance Cash Collateral Fund, LLC (Cash Collateral Fund), affiliated investment companies managed by Boston Management and Research (BMR) and Eaton Vance Management (EVM), respectively. Cash Management and Cash Collateral Fund normally value their investment securities utilizing the amortized cost valuation technique in accordance with Rule 2a-7 of the 1940 Act. This technique involves initially valuing a portfolio security at its cost and thereafter assuming a constant amortization to maturity of any discount or premium. If amortized cost is determined not to approximate fair value, Cash Management and Cash Collateral Fund may value their investment securities based on available market quotations provided by a pricing service. At October 31, 2008, Cash Collateral Fund valued its investments based on available market quotations.
B Investment Transactions — Investment transactions for financial statement purposes are accounted for on a trade date basis. Realized gains and losses on investments sold are determined on the basis of identified cost.
C Income — Dividend income is recorded on the ex-dividend date for dividends received in cash and/or securities. However, if the ex-dividend date has passed, certain dividends from foreign securities are recorded as the Portfolio is informed of the ex-dividend date. Withholding taxes on foreign dividends and capital gains have been provided for in accordance with the Portfolio's understanding of the applicable countries' tax rules and rates. Interest income is recorded on the basis of interest accrued, adjusted for amortization of premium or accretion of discount.
D Federal Taxes — The Portfolio has elected to be treated as a partnership for federal tax purposes. No provision is made by the Portfolio for federal or state taxes on any taxable income of the Portfolio because each investor in the Portfolio is ultimately responsible for the
24
Tax-Managed Value Portfolio as of October 31, 2008
NOTES TO FINANCIAL STATEMENTS CONT'D
payment of any taxes on its share of taxable income. Since at least one of the Portfolio's investors is a regulated investment company that invests all or substantially all of its assets in the Portfolio, the Portfolio normally must satisfy the applicable source of income and diversification requirements (under the Internal Revenue Code) in order for its investors to satisfy them. The Portfolio will allocate, at least annually among its investors, each investor's distributive share of the Portfolio's net investment income, net realized capital gains and any other items of income, gain, loss, deduction or credit.
As of October 31, 2008, the Portfolio had no uncertain tax positions that would require financial statement recognition, de-recognition, or disclosure. Each of the Portfolio's federal tax returns filed in the 3-year period ended October 31, 2008 remains subject to examination by the Internal Revenue Service.
E Expense Reduction — State Street Bank and Trust Company (SSBT) serves as custodian of the Portfolio. Pursuant to the custodian agreement, SSBT receives a fee reduced by credits, which are determined based on the average daily cash balance the Portfolio maintains with SSBT. All credit balances, if any, used to reduce the Portfolio's custodian fees are reported as a reduction of expenses in the Statement of Operations.
F Foreign Currency Translation — Investment valuations, other assets, and liabilities initially expressed in foreign currencies are translated each business day into U.S. dollars based upon current exchange rates. Purchases and sales of foreign investment securities and income and expenses denominated in foreign currencies are translated into U.S. dollars based upon currency exchange rates in effect on the respective dates of such transactions. Recognized gains or losses on investment transactions attributable to changes in foreign currency exchange rates are recorded for financial statement purposes as net realized gains and losses on investments. That portion of unrealized gains and losses on invest ments that results from fluctuations in foreign currency exchange rates is not separately disclosed.
G Use of Estimates — The preparation of the financial statements in conformity with accounting principles generally accepted in the United States of America requires management to make estimates and assumptions that affect the reported amounts of assets and liabilities at the date of the financial statements and the reported amounts of income and expense during the reporting period. Actual results could differ from those estimates.
H Indemnifications — Under the Portfolio's organizational documents, its officers and Trustees may be indemnified against certain liabilities and expenses arising out of the performance of their duties to the Portfolio. Interestholders in the Portfolio are jointly and severally liable for the liabilities and obligations of the Portfolio in the event that the Portfolio fails to satisfy such liabilities and obligations; provided, however, that, to the extent assets are available in the Portfolio, the Portfolio may, under certain circumstances, indemnify interestholders from and against any claim or liability to which such holder may become subject by reason of being or having been an interestholder in t he Portfolio. Additionally, in the normal course of business, the Portfolio enters into agreements with service providers that may contain indemnification clauses. The Portfolio's maximum exposure under these arrangements is unknown as this would involve future claims that may be made against the Portfolio that have not yet occurred.
2 Investment Adviser Fee and Other Transactions with Affiliates
The investment adviser fee is earned by BMR as compensation for investment advisory services rendered to the Portfolio. Pursuant to the investment advisory agreement and subsequent fee reduction agreement between the Portfolio and BMR, the fee is computed at an annual rate of 0.65% of the Portfolio's average daily net assets up to $500 million, 0.625% from $500 million up to $1 billion, 0.600% from $1 billion up to $2 billion and at reduced rates as average net assets exceed that level, and is payable monthly. The fee reduction cannot be terminated without the consent of the Trustees and shareholders. The portion of the adviser fee payable by Cash Management on the Portfolio's investment of cash therein is credited against the Portfolio's adviser fee. For the year ended October 31, 2008, the Portfolio's adviser fee totaled $9,886,138 of which $198,317 was allocated from Cash Management and $9,687,821 was paid or accrued directly by the Portfolio. For the year ended October 31, 2008, the Portfolio's adviser fee, including the portion allocated from Cash Management, was 0.62% of the Portfolio's average daily net assets.
Except for Trustees of the Portfolio who are not members of EVM's or BMR's organizations, officers and Trustees receive remuneration for their services to the Portfolio out of the investment adviser fee. Trustees of the Portfolio who are not affiliated with the investment adviser may elect to defer receipt of all or a percentage of their annual fees in accordance with the terms of the Trustees Deferred Compensation Plan. For the year ended October 31, 2008,
25
Tax-Managed Value Portfolio as of October 31, 2008
NOTES TO FINANCIAL STATEMENTS CONT'D
no significant amounts have been deferred. Certain officers and Trustees of the Portfolio are officers of the above organizations.
3 Purchases and Sales of Investments
Purchases and sales of investments, other than short-term obligations, aggregated $1,756,784,102 and $1,295,314,826, respectively, for the year ended October 31, 2008.
4 Federal Income Tax Basis of Investments
The cost and unrealized appreciation (depreciation) of investments of the Portfolio at October 31, 2008, as determined on a federal income tax basis, were as follows:
| Aggregate cost | | $ | 1,211,959,599 | | |
| Gross unrealized appreciation | | $ | 211,814,092 | | |
| Gross unrealized depreciation | | | (54,995,161 | ) | |
| Net unrealized appreciation | | $ | 156,818,931 | | |
The net unrealized appreciation on foreign currency transactions at October 31, 2008 on a federal income tax basis was $6,570.
5 Line of Credit
The Portfolio participates with other portfolios and funds managed by EVM and its affiliates in a $450 million unsecured line of credit agreement with a group of banks. Borrowings are made by the Portfolio solely to facilitate the handling of unusual and/or unanticipated short-term cash requirements. Interest is charged to the Portfolio based on its borrowings at an amount above either the Eurodollar rate or Federal Funds rate. In addition, a fee computed at an annual rate of 0.10% on the daily unused portion of the line of credit is allocated among the participating portfolios and funds at the end of each quarter. The Portfolio did not have any significant borrowings or allocated fees during the year ended October 31, 2008.
6 Securities Lending Agreement
The Portfolio has established a securities lending agreement with SSBT as securities lending agent in which the Portfolio lends portfolio securities to qualified borrowers in exchange for collateral consisting of either cash or U.S. Government securities in an amount at least equal to the market value of the securities on loan. Cash collateral is invested in Cash Collateral Fund. The Portfolio earns interest on the amount invested in Cash Collateral Fund but it must pay the broker a loan rebate fee computed as a varying percentage of the collateral received. The loan rebate fee paid by the Portfolio amounted to $1,012,519 for the year ended October 31, 2008. At October 31, 2008, the value of the securities loaned and the value of the collateral received amounted to $10,688,640 and $10,961,150, respectively. In the event of counterparty default, the Portfolio is subject to potential loss if it is delayed or prevented from exercising its right to dispose of the collateral. The Portfolio bears risk in the event that invested collateral is not sufficient to meet obligations due on loans.
7 Recently Issued Accounting Pronouncement
In September 2006, the Financial Accounting Standards Board issued Statement of Financial Accounting Standards No. 157 (FAS 157), "Fair Value Measurements". FAS 157 defines fair value, establishes a framework for measuring fair value in accordance with accounting principles generally accepted in the United States of America and expands disclosure about fair value measurements. FAS 157 is effective for fiscal years beginning after November 15, 2007. As of October 31, 2008, management does not believe the adoption of FAS 157 will impact the amounts reported in the financial statements; however, additional disclosures may be required about the inputs used to develop the measurements of fair value and the effect of certain of the measurements on changes in net assets for the period.
26
Tax-Managed Value Portfolio as of October 31, 2008
REPORT OF INDEPENDENT REGISTERED PUBLIC ACCOUNTING FIRM
To the Trustees and Investors
of Tax-Managed Value Portfolio:
We have audited the accompanying statement of assets and liabilities of Tax-Managed Value Portfolio (the "Portfolio"), including the portfolio of investments, as of October 31, 2008, and the related statement of operations for the year then ended, the statements of changes in net assets for each of the two years in the period then ended, and the supplementary data for each of the five years in the period then ended. These financial statements and supplementary data are the responsibility of the Portfolio's management. Our responsibility is to express an opinion on these financial statements and supplementary data based on our audits.
We conducted our audits in accordance with the standards of the Public Company Accounting Oversight Board (United States). Those standards require that we plan and perform the audit to obtain reasonable assurance about whether the financial statements and supplementary data are free of material misstatement. The Portfolio is not required to have, nor were we engaged to perform, an audit of its internal control over financial reporting. Our audits included consideration of internal control over financial reporting as a basis for designing audit procedures that are appropriate in the circumstances, but not for the purpose of expressing an opinion on the effectiveness of the Portfolio's internal control over financial reporting. Accordingly, we express no such opinion. An audit also includes examining, on a test basis, evidence supporting the amounts and disclosures in the financial statements, assessing the accounting principles u sed and significant estimates made by management, as well as evaluating the overall financial statement presentation. Our procedures included confirmation of securities owned as of October 31, 2008, by correspondence with the custodian and brokers; where replies were not received from brokers, we performed other auditing procedures. We believe that our audits provide a reasonable basis for our opinion.
In our opinion, the financial statements and supplementary data referred to above present fairly, in all material respects, the financial position of Tax-Managed Value Portfolio as of October 31, 2008, the results of its operations for the year then ended, the changes in its net assets for each of the two years in the period then ended, and the supplementary data for each of the five years in the period then ended, in conformity with accounting principles generally accepted in the United States of America.
DELOITTE & TOUCHE LLP
Boston, Massachusetts
December 15, 2008
27
Eaton Vance Tax-Managed Value Fund
Tax-Managed Value Portfolio
SPECIAL MEETING OF SHAREHOLDERS (Unaudited)
Eaton Vance Tax-Managed Value Fund
The Fund held a Special Meeting of Shareholders on November 14, 2008 to elect Trustees. The results of the vote were as follows:
| | | Number of Shares | |
| Nominee for Trustee | | For | | Withheld | |
| Benjamin C. Esty | | | 79,366,850 | | | | 779,273 | | |
| Thomas E. Faust Jr. | | | 79,354,633 | | | | 791,490 | | |
| Allen R. Freedman | | | 79,351,101 | | | | 795,021 | | |
| William H. Park | | | 79,370,649 | | | | 775,473 | | |
| Ronald A. Pearlman | | | 79,377,895 | | | | 768,227 | | |
| Helen Frame Peters | | | 79,369,399 | | | | 776,723 | | |
| Heidi L. Steiger | | | 79,379,659 | | | | 766,464 | | |
| Lynn A. Stout | | | 79,390,539 | | | | 755,584 | | |
| Ralph F. Verni | | | 79,353,279 | | | | 792,844 | | |
Each nominee was also elected a Trustee of the Portfolio.
Tax-Managed Value Portfolio
The Portfolio held a Special Meeting of Interestholders on November 14, 2008 to elect Trustees. The results of the vote were as follows:
| | | Interest in the Portfolio | |
| Nominee for Trustee | | For | | Withheld | |
| Benjamin C. Esty | | | 99 | % | | | 1 | % | |
| Thomas E. Faust Jr. | | | 99 | % | | | 1 | % | |
| Allen R. Freedman | | | 99 | % | | | 1 | % | |
| William H. Park | | | 99 | % | | | 1 | % | |
| Ronald A. Pearlman | | | 99 | % | | | 1 | % | |
| Helen Frame Peters | | | 99 | % | | | 1 | % | |
| Heidi L. Steiger | | | 99 | % | | | 1 | % | |
| Lynn A. Stout | | | 99 | % | | | 1 | % | |
| Ralph F. Verni | | | 99 | % | | | 1 | % | |
Results are rounded to the nearest whole number.
28
Eaton Vance Tax-Managed Value Fund
BOARD OF TRUSTEES' ANNUAL APPROVAL OF THE INVESTMENT ADVISORY AGREEMENT
Overview of the Contract Review Process
The Investment Company Act of 1940, as amended (the "1940 Act"), provides, in substance, that each investment advisory agreement between a fund and its investment adviser will continue in effect from year to year only if its continuance is approved at least annually by the fund's board of trustees, including by a vote of a majority of the trustees who are not "interested persons" of the fund ("Independent Trustees"), cast in person at a meeting called for the purpose of considering such approval.
At a meeting of the Boards of Trustees (each a "Board") of the Eaton Vance group of mutual funds (the "Eaton Vance Funds") held on April 21, 2008, the Board, including a majority of the Independent Trustees, voted to approve continuation of existing advisory and sub-advisory agreements for the Eaton Vance Funds for an additional one-year period. In voting its approval, the Board relied upon the affirmative recommendation of the Contract Review Committee of the Board (formerly the Special Committee), which is a committee comprised exclusively of Independent Trustees. Prior to making its recommendation, the Contract Review Committee reviewed information furnished for a series of meetings of the Contract Review Committee held in February, March and April 2008. Such information included, among other things, the following:
Information about Fees, Performance and Expenses
• An independent report comparing the advisory and related fees paid by each fund with fees paid by comparable funds;
• An independent report comparing each fund's total expense ratio and its components to comparable funds;
• An independent report comparing the investment performance of each fund to the investment performance of comparable funds over various time periods;
• Data regarding investment performance in comparison to relevant peer groups of funds and appropriate indices;
• Comparative information concerning fees charged by each adviser for managing other mutual funds and institutional accounts using investment strategies and techniques similar to those used in managing the fund;
• Profitability analyses for each adviser with respect to each fund;
Information about Portfolio Management
• Descriptions of the investment management services provided to each fund, including the investment strategies and processes employed, and any changes in portfolio management processes and personnel;
• Information concerning the allocation of brokerage and the benefits received by each adviser as a result of brokerage allocation, including information concerning the acquisition of research through "soft dollar" benefits received in connection with the funds' brokerage, and the implementation of a soft dollar reimbursement program established with respect to the funds;
• Data relating to portfolio turnover rates of each fund;
• The procedures and processes used to determine the fair value of fund assets and actions taken to monitor and test the effectiveness of such procedures and processes;
Information about each Adviser
• Reports detailing the financial results and condition of each adviser;
• Descriptions of the qualifications, education and experience of the individual investment professionals whose responsibilities include portfolio management and investment research for the funds, and information relating to their compensation and responsibilities with respect to managing other mutual funds and investment accounts;
• Copies of the Codes of Ethics of each adviser and its affiliates, together with information relating to compliance with and the administration of such codes;
• Copies of or descriptions of each adviser's proxy voting policies and procedures;
• Information concerning the resources devoted to compliance efforts undertaken by each adviser and its affiliates on behalf of the funds (including descriptions of various compliance programs) and their record of compliance with investment policies and restrictions, including policies with respect to market-timing, late trading and selective portfolio disclosure, and with policies on personal securities transactions;
• Descriptions of the business continuity and disaster recovery plans of each adviser and its affiliates;
Other Relevant Information
• Information concerning the nature, cost and character of the administrative and other non-investment management services provided by Eaton Vance Management and its affiliates;
• Information concerning management of the relationship with the custodian, subcustodians and fund accountants by each adviser or the funds' administrator; and
• The terms of each advisory agreement.
29
Eaton Vance Tax-Managed Value Fund
BOARD OF TRUSTEES' ANNUAL APPROVAL OF THE INVESTMENT ADVISORY AGREEMENT CONT'D
In addition to the information identified above, the Contract Review Committee considered information provided from time to time by each adviser throughout the year at meetings of the Board and its committees. Over the course of the twelve-month period ended April 30, 2008, the Board met eleven times and the Contract Review Committee, the Audit Committee and the Governance Committee, each of which is a Committee comprised solely of Independent Trustees, met twelve, seven and five times, respectively. At such meetings, the Trustees received, among other things, presentations by the portfolio managers and other investment professionals of each adviser relating to the investment performance of each fund and the investment strategies used in pursuing the fund's investment objective. The Portfolio Management Committee and the Compliance Reports and Regulatory Matters Committee are newly established and did not meet during the twelve- month period ended April 30, 2008.
For funds that invest through one or more underlying portfolios, the Board considered similar information about the portfolio(s) when considering the approval of advisory agreements. In addition, in cases where the fund's investment adviser has engaged a sub-adviser, the Board considered similar information about the sub-adviser when considering the approval of any sub-advisory agreement.
The Contract Review Committee was assisted throughout the contract review process by Goodwin Procter LLP, legal counsel for the Independent Trustees. The members of the Contract Review Committee relied upon the advice of such counsel and their own business judgment in determining the material factors to be considered in evaluating each advisory and sub-advisory agreement and the weight to be given to each such factor. The conclusions reached with respect to each advisory and sub-advisory agreement were based on a comprehensive evaluation of all the information provided and not any single factor. Moreover, each member of the Contract Review Committee may have placed varying emphasis on particular factors in reaching conclusions with respect to each advisory and sub-advisory agreement.
Results of the Process
Based on its consideration of the foregoing, and such other information as it deemed relevant, including the factors and conclusions described below, the Contract Review Committee concluded that the continuance of the investment advisory agreement of the Tax-Managed Value Portfolio (the "Portfolio"), the portfolio in which the Eaton Vance Tax-Managed Value Fund (the "Fund") invests, with Boston Management and Research (the "Adviser"), including its fee structure, is in the interests of shareholders and, therefore, the Contract Review Committee recommended to the Board approval of the agreement. The Board accepted the recommendation of the Contract Review Committee as well as the factors considered and conclusions reached by the Contract Review Committee with respect to the agreements. Accordingly, the Board, including a majority of the Independent Trustees, voted to approve continuation of the investment advisory agreement for t he Portfolio.
Nature, Extent and Quality of Services
In considering whether to approve the investment advisory agreement of the Portfolio, the Board evaluated the nature, extent and quality of services provided to the Portfolio by the Adviser.
The Board considered the Adviser's management capabilities and investment process with respect to the types of investments held by the Portfolio, including the education, experience and number of its investment professionals and other personnel who provide portfolio management, investment research, and similar services to the Portfolio. The Board specifically noted the Adviser's in-house equity research capabilities and experience managing funds that seek to maximize after-tax returns. The Board also took into account the resources dedicated to portfolio management and other services, including the compensation paid to recruit and retain investment personnel, and the time and attention devoted to the Portfolio by senior management.
The Board also reviewed the compliance programs of the Adviser and relevant affiliates thereof. Among other matters, the Board considered compliance and reporting matters relating to personal trading by investment personnel, selective disclosure of portfolio holdings, late trading, frequent trading, portfolio valuation, business continuity and the allocation of investment opportunities. The Board also evaluated the responses of the Adviser and its affiliates to requests from regulatory authorities such as the Securities and Exchange Commission.
The Board considered shareholder and other administrative services provided or managed by Eaton Vance Management and its affiliates, including transfer agency and accounting services. The Board evaluated the benefits to shareholders of investing in a fund that is a part of a large family of funds, including the ability, in many cases, to exchange an investment among different funds without incurring additional sales charges.
After consideration of the foregoing factors, among others, the Board concluded that the nature, extent and quality of services provided by the Adviser, taken as a whole, are appropriate and consistent with the terms of the investment advisory agreement.
30
Eaton Vance Tax-Managed Value Fund
BOARD OF TRUSTEES' ANNUAL APPROVAL OF THE INVESTMENT ADVISORY AGREEMENT CONT'D
Fund Performance
The Board compared the Fund's investment performance to a relevant universe of similarly managed funds identified by an independent data provider and appropriate benchmark indices. The Board reviewed comparative performance data for the one-, three- and five-year periods ended September 30, 2007 for the Fund. The Board concluded that the Fund's performance was satisfactory.
Management Fees and Expenses
The Board reviewed contractual investment advisory fee rates, including any administrative fee rates, payable by the Portfolio and the Fund (referred to collectively as "management fees"). As part of its review, the Board considered the management fees, including administrative fees, and the Fund's total expense ratio for the year ended September 30, 2007, as compared to a group of similarly managed funds selected by an independent data provider.
After reviewing the foregoing information, and in light of the nature, extent and quality of the services provided by the Adviser, the Board concluded that the management fees charged for advisory and related services and the Fund's total expense ratio are reasonable.
Profitability
The Board reviewed the level of profits realized by the Adviser and relevant affiliates thereof in providing investment advisory and administrative services to the Portfolio, the Fund and all Eaton Vance Funds as a group. The Board considered the level of profits realized without regard to revenue sharing or other payments by the Adviser and its affiliates to third parties in respect of distribution services. The Board also considered other direct or indirect benefits received by the Adviser and its affiliates in connection with its relationship with the Portfolio and the Fund, including the benefits of research services that may be available to the Adviser as a result of securities transactions effected for the Portfolio and other advisory clients.
The Board concluded that, in light of the foregoing factors and the nature, extent and quality of the services rendered, the profits realized by the Adviser and its affiliates are reasonable.
Economies of Scale
In reviewing management fees and profitability, the Board also considered the extent to which the Adviser and its affiliates, on the one hand, and the Fund, on the other hand, can expect to realize benefits from economies of scale as the assets of the Fund and the Portfolio increase. The Board acknowledged the difficulty in accurately measuring the benefits resulting from the economies of scale with respect to the management of any specific fund or group of funds. The Board reviewed data summarizing the increases and decreases in the assets of the Fund and of all Eaton Vance Funds as a group over various time periods, and evaluated the extent to which the total expense ratio of the Fund and the profitability of the Adviser and its affiliates may have been affected by such increases or decreases. Based upon the foregoing, the Board concluded that the benefits from economies of scale are currently being shared equitably by the Adv iser and its affiliates and the Fund. The Board also concluded that, assuming reasonably foreseeable increases in the assets of the Portfolio, the structure of the Portfolio advisory fee, which includes breakpoints at several asset levels, can be expected to cause the Adviser and its affiliates and the Fund and Portfolio to continue to share such benefits equitably.
31
Eaton Vance Tax-Managed Value Fund
MANAGEMENT AND ORGANIZATION
Fund Management. The Trustees of Eaton Vance Mutual Funds Trust (the Trust) and Tax-Managed Value Portfolio (the Portfolio) are responsible for the overall management and supervision of the Trust's and Portfolio's affairs. The Trustees and officers of the Trust and the Portfolio are listed below. Except as indicated, each individual has held the office shown or other offices in the same company for the last five years. Trustees and officers of the Trust and the Portfolio hold indefinite terms of office. The "noninterested Trustees" consist of those Trustees who are not "interested persons" of the Trust and the Portfolio, as that term is defined under the 1940 Act. The business address of each Trustee and officer is T he Eaton Vance Building, 255 State Street, Boston, Massachusetts 02109. As used below, "EVC" refers to Eaton Vance Corp., "EV" refers to Eaton Vance, Inc., "EVM" refers to Eaton Vance Management, "BMR" refers to Boston Management and Research; "Parametric" refers to Parametric Portfolio Associates and "EVD" refers to Eaton Vance Distributors, Inc. EVC and EV are the corporate parent and trustee, respectively, of EVM and BMR. EVD is the Fund's principal underwriter, the Portfolio's placement agent and a wholly-owned subsidiary of EVM. Each officer affiliated with Eaton Vance may hold a position with other Eaton Vance affiliates that is comparable to his or her position with EVM listed below.
Name and
Date of Birth | | Position(s)
with the
Trust and
the Portfolio | | Term of
Office and
Length of
Service | | Principal Occupation(s)
During Past Five Years | | Number of Portfolios
in Fund Complex
Overseen By
Trustee(1) | | Other Directorships Held | |
| Interested Trustee | | | | | | | | | | | | | |
|
| Thomas E. Faust Jr. 5/31/58 | | Trustee and President of the Trust | | Trustee since 2007 and President of the Trust since 2002 | | Chairman, Chief Executive Officer and President of EVC, Director and President of EV, Chief Executive Officer and President of EVM and BMR, and Director of EVD. Trustee and/or Officer of 173 registered investment companies and 4 private companies managed by EVM or BMR. Mr. Faust is an interested person because of his positions with EVM, BMR, EVD, EVC and EV, which are affiliates of the Trust and Portfolio. | | | 173 | | | Director of EVC | |
|
| Noninterested Trustees | | | | | | | | | | | | | |
|
| Benjamin C. Esty 1/2/63 | | Trustee | | Since 2005 | | Roy and Elizabeth Simmons Professor of Business Administration, Harvard University Graduate School of Business Administration. | | | 173 | | | None | |
|
| Allen R. Freedman 4/3/40 | | Trustee | | Since 2007 | | Former Chairman (2002-2004) and a Director (1983-2004) of Systems & Computer Technology Corp. (provider of software to higher education). Formerly, a Director of Loring Ward International (fund distributor) (2005-2007). Formerly, Chairman and a Director of Indus International Inc. (provider of enterprise management software to the power generating industry) (2005-2007). | | | 173 | | | Director of Assurant, Inc. and Stonemor Partners L.P. (owner and operator of cemeteries) | |
|
| William H. Park 9/19/47 | | Trustee | | Since 2003 | | Vice Chairman, Commercial Industrial Finance Corp. (specialty finance company) (since 2006). Formerly, President and Chief Executive Officer, Prizm Capital Management, LLC (investment management firm) (2002-2005). | | | 173 | | | None | |
|
| Ronald A. Pearlman 7/10/40 | | Trustee | | Since 2003 | | Professor of Law, Georgetown University Law Center. | | | 173 | | | None | |
|
| Helen Frame Peters 3/22/48 | | Trustee | | Since 2008 | | Professor of Finance, Carroll School of Management, Boston College (since 2003). Adjunct Professor of Finance, Peking University, Beijing, China (since 2005). Formerly, Dean, Carroll School of Management, Boston College (2000-2003). | | | 173 | | | Director of Federal Home Loan Bank of Boston (a bank for banks) and BJ's Wholesale Clubs (wholesale club retailer); Trustee of SPDR Index Shares Funds and SPDR Series Trust (exchange traded funds) | |
|
32
Eaton Vance Tax-Managed Value Fund
MANAGEMENT AND ORGANIZATION CONT'D
Name and
Date of Birth | | Position(s)
with the
Trust and
the Portfolio | | Term of
Office and
Length of
Service | | Principal Occupation(s)
During Past Five Years | | Number of Portfolios
in Fund Complex
Overseen By
Trustee(1) | | Other Directorships Held | |
| Noninterested Trustees (continued) | | | | | | | | | | | | | |
|
| Heidi L. Steiger 7/8/53 | | Trustee | | Since 2007 | | Managing Partner, Topridge Associates LLC (global wealth management firm) (since 2008); Senior Advisor (since 2008), President (2005-2008), Lowenhaupt Global Advisors, LLC (global wealth management firm). Formerly, President and Contributing Editor, Worth Magazine (2004-2005). Formerly, Executive Vice President and Global Head of Private Asset Management (and various other positions), Neuberger Berman (investment firm) (1986-2004). | | | 173 | | | Director of Nuclear Electric Insurance Ltd. (nuclear insurance provider) and Aviva USA (insurance provider) | |
|
| Lynn A. Stout 9/14/57 | | Trustee | | Of the Trust since 1998 and of the Portfolio since 2001 | | Paul Hastings Professor of Corporate and Securities Law (since 2006) and Professor of Law (2001-2006), University of California at Los Angeles School of Law. | | | 173 | | | None | |
|
| Ralph F. Verni 1/26/43 | | Chairman of the Board and Trustee | | Chairman of the Board since 2007 and Trustee since 2005 | | Consultant and private investor. | | | 173 | | | None | |
|
| Principal Officers who are not Trustees | | | | | | | | | | | | | |
|
Name and
Date of Birth | | Position(s)
with the
Trust and
the Portfolio | | Term of
Office and
Length of
Service | | Principal Occupation(s)
During Past Five Years | |
| William H. Ahern, Jr. 7/28/59 | | Vice President of the Trust | | Since 1995 | | Vice President of EVM and BMR. Officer of 75 registered investment companies managed by EVM or BMR. | |
|
| John R. Baur 2/10/70 | | Vice President of the Trust | | Since 2007 | | Vice President of EVM and BMR. Previously, attended Johnson Graduate School of Management, Cornell University (2002-2005), and prior thereto he was an Account Team Representative in Singapore for Applied Materials, Inc. Officer of 33 registered investment companies managed by EVM or BMR. | |
|
| Michael A. Cirami 12/24/75 | | Vice President of the Trust | | Since 2007 | | Vice President of EVM and BMR. Previously, attended the University of Rochester William E. Simon Graduate School of Business Administration (2001-2003), and prior thereto he was a Team Leader for the Institutional Services Group for State Street Bank in Luxembourg. Officer of 33 registered investment companies managed by EVM or BMR. | |
|
| Cynthia J. Clemson 3/2/63 | | Vice President of the Trust | | Since 2005 | | Vice President of EVM and BMR. Officer of 90 registered investment companies managed by EVM or BMR. | |
|
| Charles B. Gaffney 12/4/72 | | Vice President of the Trust | | Since 2007 | | Vice President of EVM and BMR. Previously, Sector Portfolio Manager and Senior Equity Analyst of Brown Brothers Harriman (1997-2003). Officer of 30 registered investment companies managed by EVM or BMR. | |
|
| Christine M. Johnston 11/9/72 | | Vice President of the Trust | | Since 2007 | | Vice President of EVM and BMR. Officer of 35 registered investment companies managed by EVM or BMR. | |
|
| Aamer Khan 6/7/60 | | Vice President of the Trust | | Since 2005 | | Vice President of EVM and BMR. Officer of 33 registered investment companies managed by EVM or BMR. | |
|
| Thomas H. Luster 4/8/62 | | Vice President of the Trust | | Since 2006 | | Vice President of EVM and BMR. Officer of 51 registered investment companies managed by EVM or BMR. | |
|
| Michael R. Mach 7/15/47 | | Vice President of the Portfolio | | Since 2001 | | Vice President of EVM and BMR. Officer of 25 registered investment companies managed by EVM or BMR. | |
|
| Robert B. MacIntosh 1/22/57 | | Vice President of the Trust | | Since 1998 | | Vice President of EVM and BMR. Officer of 90 registered investment companies managed by EVM or BMR. | |
|
33
Eaton Vance Tax-Managed Value Fund
MANAGEMENT AND ORGANIZATION CONT'D
Name and
Date of Birth | | Position(s)
with the
Trust and
the Portfolio | | Term of
Office and
Length of
Service | | Principal Occupation(s)
During Past Five Years | |
| Principal Officers who are not Trustees (continued) | | | | | | | |
|
| Duncan W. Richardson 10/26/57 | | Vice President of the Trust and President of the Portfolio | | Vice President of the Trust since 2001 and President of the Portfolio since 2002 | | Executive Vice President and Chief Equity Investment Officer of EVC, EVM and BMR. Officer of 81 registered investment companies managed by EVM or BMR. | |
|
| Judith A. Saryan 8/21/54 | | Vice President of the Trust | | Since 2003 | | Vice President of EVM and BMR. Officer of 55 registered investment companies managed by EVM or BMR. | |
|
| Susan Schiff 3/13/61 | | Vice President of the Trust | | Since 2002 | | Vice President of EVM and BMR. Officer of 36 registered investment companies managed by EVM or BMR. | |
|
| Thomas Seto 9/27/62 | | Vice President of the Trust | | Since 2007 | | Vice President and Director of Portfolio Management of Parametric. Officer of 31 registered investment companies managed by EVM or BMR. | |
|
| David M. Stein 5/4/51 | | Vice President of the Trust | | Since 2007 | | Managing Director and Chief Investment Officer of Parametric. Officer of 31 registered investment companies managed by EVM or BMR. | |
|
| Mark S. Venezia 5/23/49 | | Vice President of the Trust | | Since 2007 | | Vice President of EVM and BMR. Officer of 36 registered investment companies managed by EVM or BMR. | |
|
| Adam A. Weigold 3/22/75 | | Vice President of the Trust | | Since 2007 | | Vice President of EVM and BMR. Officer of 71 registered investment companies managed by EVM or BMR. | |
|
| Barbara E. Campbell 6/19/57 | | Treasurer | | Of the Trust since 2005 and of the Portfolio since 2008(2) | | Vice President of EVM and BMR. Officer of 173 registered investment companies managed by EVM or BMR. | |
|
| Maureen A. Gemma 5/24/60 | | Secretary and Chief Legal Officer | | Secretary since 2007 and Chief Legal Officer since 2008 | | Vice President of EVM and BMR. Officer of 173 registered investment companies managed by EVM or BMR. | |
|
| Paul M. O'Neil 7/11/53 | | Chief Compliance Officer | | Since 2004 | | Vice President of EVM and BMR. Officer of 173 registered investment companies managed by EVM or BMR. | |
|
(1) Includes both master and feeder funds in a master-feeder structure.
(2) Prior to 2008, Ms. Campbell served as Assistant Treasurer of the Portfolio since 2001.
The SAI for the Fund includes additional information about the Trustees and officers of the Fund and the Portfolio and can be obtained without charge on Eaton Vance's website at www.eatonvance.com or by calling 1-800-262-1122.
34
This Page Intentionally Left Blank
This Page Intentionally Left Blank
Investment Adviser of Tax-Managed Value Portfolio
Boston Management and Research
The Eaton Vance Building
255 State Street
Boston, MA 02109
Administrator of Eaton Vance Tax-Managed Value Fund
Eaton Vance Management
The Eaton Vance Building
255 State Street
Boston, MA 02109
Principal Underwriter
Eaton Vance Distributors, Inc.
The Eaton Vance Building
255 State Street
Boston, MA 02109
(617) 482-8260
Custodian
State Street Bank and Trust Company
200 Clarendon Street
Boston, MA 02116
Transfer Agent
PNC Global Investment Servicing
Attn: Eaton Vance Funds
P.O. Box 9653
Providence, RI 02940-9653
(800) 262-1122
Independent Registered Public Accounting Firm
Deloitte & Touche LLP
200 Berkeley Street
Boston, MA 02116-5022
Eaton Vance Tax-Managed Value Fund
The Eaton Vance Building
255 State Street
Boston, MA 02109
This report must be preceded or accompanied by a current prospectus. Before investing, investors should consider carefully the Fund's investment objective(s), risks, and charges and expenses. The Fund's current prospectus contains this and other information about the Fund and is available through your financial advisor. Please read the prospectus carefully before you invest or send money. For further information please call 1-800-262-1122.
501-12/08 TVSRC

Annual Report October 31, 2008


EATON VANCE
FLOATING-RATE ADVANTAGE FUND
IMPORTANT NOTICES REGARDING PRIVACY,
DELIVERY OF SHAREHOLDER DOCUMENTS,
PORTFOLIO HOLDINGS AND PROXY VOTING
Privacy. The Eaton Vance organization is committed to ensuring your financial privacy. Each of the financial institutions identified below has in effect the following policy ("Privacy Policy") with respect to nonpublic personal information about its customers:
• Only such information received from you, through application forms or otherwise, and information about your Eaton Vance fund transactions will be collected. This may include information such as name, address, social security number, tax status, account balances and transactions.
• None of such information about you (or former customers) will be disclosed to anyone, except as permitted by law (which includes disclosure to employees necessary to service your account). In the normal course of servicing a customer's account, Eaton Vance may share information with unaffiliated third parties that perform various required services such as transfer agents, custodians and broker/dealers.
• Policies and procedures (including physical, electronic and procedural safeguards) are in place that are designed to protect the confidentiality of such information.
• We reserve the right to change our Privacy Policy at any time upon proper notification to you. Customers may want to review our Policy periodically for changes by accessing the link on our homepage: www.eatonvance.com.
Our pledge of privacy applies to the following entities within the Eaton Vance organization: the Eaton Vance Family of Funds, Eaton Vance Management, Eaton Vance Investment Counsel, Boston Management and Research, and Eaton Vance Distributors, Inc.
In addition, our Privacy Policy only applies to those Eaton Vance customers who are individuals and who have a direct relationship with us. If a customer's account (i.e., fund shares) is held in the name of a third-party financial adviser/
broker-dealer, it is likely that only such adviser's privacy policies apply to the customer. This notice supersedes all previously issued privacy disclosures.
For more information about Eaton Vance's Privacy Policy, please call 1-800-262-1122.
Delivery of Shareholder Documents. The Securities and Exchange Commission (the "SEC") permits funds to deliver only one copy of shareholder documents, including prospectuses, proxy statements and shareholder reports, to fund investors with multiple accounts at the same residential or post office box address. This practice is often called "householding" and it helps eliminate duplicate mailings to shareholders.
Eaton Vance, or your financial adviser, may household the mailing of your documents indefinitely unless you instruct Eaton Vance, or your financial adviser, otherwise.
If you would prefer that your Eaton Vance documents not be householded, please contact Eaton Vance at 1-800-262-1122, or contact your financial adviser.
Your instructions that householding not apply to delivery of your Eaton Vance documents will be effective within 30 days of receipt by Eaton Vance or your financial adviser.
Portfolio Holdings. Each Eaton Vance Fund and its underlying Portfolio (if applicable) will file a schedule of its portfolio holdings on Form N-Q with the SEC for the first and third quarters of each fiscal year. The Form N-Q will be available on the Eaton Vance website www.eatonvance.com, by calling Eaton Vance at 1-800-262-1122 or in the EDGAR database on the SEC's website at www.sec.gov. Form N-Q may also be reviewed and copied at the SEC's public reference room in Washington, D.C. (call 1-800-732-0330 for information on the operation of the public reference room).
Proxy Voting. From time to time, funds are required to vote proxies related to the securities held by the funds. The Eaton Vance Funds or their underlying Portfolios (if applicable) vote proxies according to a set of policies and procedures approved by the Funds' and Portfolios' Boards. You may obtain a description of these policies and procedures and information on how the Funds or Portfolios voted proxies relating to portfolio securities during the most recent 12 month period ended June 30, without charge, upon request, by calling 1-800-262-1122. This description is also available on the SEC's website at www.sec.gov.
Eaton Vance Floating-Rate Advantage Fund as of October 31, 2008
MANAGEMENT’S DISCUSSION FUND PERFORMANCE

Scott H. Page, CFA
Co-Portfolio Manager

Craig P. Russ
Co-Portfolio Manager
Economic and Market Conditions
· During the year ended October 31, 2008, all credit markets experienced unprecedented volatility, and the bank loan market was no exception. The subprime crisis of 2007 expanded in 2008 to include nearly all credit instruments, which in turn, caused the world economy to slip into recession. The year was a rollercoaster for the loan market and for the Fund. The total return for the S&P/LSTA Leveraged Loan Index (the Index) through the first nine months of the Fund’s fiscal year was - 2.91%, disappointing, but, given the environment, not especially bad compared to other markets. However, September brought a series of events that rattled the markets more deeply: the bailouts of Fannie Mae and Freddie Mac, the bankruptcy of Lehman Brothers, the rescue of American International Group, Inc. and a litany of unprecedented steps by the U.S. Treasury and the Federal Reserve to stabilize the credit markets. In the Fund’s fiscal fourth quarter, the Index declined - -18.66%, by far its worst quarterly showing ever. The average loan price in the Fund was 71.1% of par at October 31, 2008. Although statistics vary with respect to recovery rates of loans in default, the historical rate has been approximately 70% of par. As such, bank loan prices at year-end were approaching levels that implied near universal default. At year-end, 1.8% of the Fund was in default versus 2.0% for the Index.
· While there is little doubt that a recession would-bring higher default rates, it is difficult to reconcile recent trading levels with market fundamentals. A range of credit statistics and criteria used to monitor creditworthiness suggested that overall credit quality appeared to be in line with historical patterns. Despite this, bank loans traded below historical recovery levels, thus implying a near 100% default rate. The most compelling, albeit obvious, explanation for the market’s depressed trading level was that there were more sellers of bank loans than buyers. Some selling was forced, especially by hedge funds and structured investment vehicles unable to meet margin requirements. Some selling was voluntary, as redemptions from mutual funds were significant throughout the year. In addition, many hard-pressed banks and investment banks that typically make markets in bank loans were hesitant to own loans, making trading more volatile. Later in the period, there were signs that many institutional investors were attracted to the asset class by record low loan prices. However, selling outweighed buying, pushing loan prices lower.
Management Discussion
· The Fund’s(1) investment objective is to provide a high level of current income. The Fund invests primarily in senior floating-rate loans of domestic and foreign borrowers. The Fund also utilizes leverage for the purpose of acquiring additional income-producing
Eaton Vance Floating-Rate Advantage Fund
Total Return Performance 3/15/08 – 10/31/08
Advisers Class(2) | | -20.84 | % |
Class C(2) | | -21.06 | % |
Class I(2) | | -20.71 | % |
S&P/LSTA Leveraged Loan Index(3) | | -22.33 | % |
Total Return Performance 3/17/08 – 10/31/08
Class A(2) | | -20.94 | % |
S&P/LSTA Leveraged Loan Index(3) | | -22.18 | % |
Total Return Performance 10/31/07 – 10/31/08
Class B(2) | | -27.45 | %* |
S&P/LSTA Leveraged Loan Index(3) | | -21.02 | % |
Please refer to page 3 for additional performance information.
(1) | The Fund currently invests in a separate registered investment company, Senior Debt Portfolio (the Portfolio), with the same investment objective and policies as the Fund. References to investments and borrowings are to the Portfolio’s holdings and borrowings. |
| |
(2) | These returns do not include the 2.25% maximum sales charge for Class A shares or the applicable contingent deferred sales charges (CDSC) for Class B or Class C shares. If sales charges were deducted, the performance would be lower. Advisers Class and Class I shares are offered to certain investors at net asset value. |
| |
(3) | It is not possible to invest directly in an Index. The Index’s total return reflects changes in value of the loans constituting the Index and accrual of interest and does not reflect the commissions or expenses that would have been incurred if an investor individually purchased or sold the loans represented in the Index. |
| |
* | Performance for period prior to 3/15/08 reflects performance of Eaton Vance Prime Rate Reserves. The Fund is the successor to Eaton Vance Prime Rate Reserves. |
Past performance is no guarantee of future results. Returns are historical and are calculated by determining the percentage change in net asset value or offering price (as applicable) with all distributions reinvested. Investment return and principal value will fluctuate so that shares, when redeemed, may be worth more or less than their original cost. Performance is for the stated time period only; due to market volatility, the Fund’s current performance may be lower or higher than the quoted return. For performance as of the most recent month end, please refer to www.eatonvance.com.
Fund shares are not insured by the FDIC and are not deposits or other obligations of, or guaranteed by, any depository institution. Shares are subject to investment risks, including possible loss of principal invested.
1
investments. In managing the Fund, the investment adviser seeks to invest in a portfolio of senior loans that it believes will be less volatile over time than the general loan market.
· The Fund’s investments included 419 borrowers at October 31, 2008, with an average loan size of 0.23% of total investments, and no industry constituting more than 9% of total investments. Healthcare, business equipment and services, publishing, chemicals and plastics, and cable and satellite television and were the top industry weightings.
· The Fund’s underperformance of its benchmark during the year was due primarily to its exposure to the European leveraged loan market and the Fund’s use of leverage.
· As of October 31, 2008, the Fund had borrowings of approximately 25% of its total investments. The Fund currently borrows through a commercial paper program. Use of financial leverage creates an opportunity for increased income, but at the same time creates special risks (including the likelihood of greater volatility in the net asset value). The cost of borrowings under the Fund’s commercial paper facility rises and falls with changes in short-term interest rates. Such increases/decreases in the cost of leverage may be offset by increased/decreased income from the Fund’s senior loan investments.
· The Fund had a 14% exposure to European loans at October 31, 2008. While the Fund’s involvement in the European leveraged loan market represented further opportunity for diversification, this market was affected more significantly than the U.S. market by the recent credit market turmoil. However, defaults and credit losses in the European loan market remained minimal.
Portfolio Composition
Top Ten Holdings(1)
By total investments
HCA, Inc. | | 1.2 | % |
SunGard Data Systems, Inc. | | 1.1 | |
Georgia-Pacific Corp. | | 1.1 | |
Charter Communications Operating, Inc. | | 1.1 | |
Univision Communications, Inc. | | 1.0 | |
UPC Broadband Holding B.V. | | 0.9 | |
Hexion Specialty Chemicals, Inc. | | 0.9 | |
Nielsen Finance, LLC | | 0.8 | |
Celanese Holdings LLC | | 0.8 | |
NRG Energy, Inc. | | 0.8 | |
(1) | Top Ten Holdings reflect the Portfolio’s investments as of 10/31/08. Holdings are shown as a percentage of the Portfolio’s total investments. |
Top Five Industries(2)
By total investments
Health Care | | 8.2 | % |
Publishing | | 7.9 | |
Business Equipment & Services | | 6.8 | |
Chemicals & Plastics | | 6.7 | |
Cable & Satellite Television | | 6.3 | |
(2) | Reflects the Portfolio’s investments as of 10/31/08. Industries are shown as a percentage of the Portfolio’s total investments. |
Credit Quality Ratings for Total Loan Investments(3)
By total loan investments
Baa | | 0.7 | % |
Ba | | 46.6 | |
B | | 33.9 | |
Caa | | 2.3 | |
Non-Rated(4) | | 16.6 | |
(3) | Credit Quality ratings are those provided by Moody’s Investor Services, Inc., a nationally recognized bond rating service. Reflects the Portfolio’s total loan investments as of 10/31/08. Although the investment adviser considers ratings when making investment decisions, it performs its own credit and investment analysis and does not rely primarily on the ratings assigned by the rating services. Credit quality can change from time to time, and recently issued credit ratings may not fully reflect the actual risks posed by a particular security or the issuer’s current financial condition. |
(4) | Certain loans in which the Portfolio invests are not rated by a rating agency. In management’s opinion, such securities are comparable to securities rated by a rating agency in the categories listed above. |
The views expressed throughout this report are those of the portfolio managers and are current only through the end of the period of the report as stated on the cover. These views are subject to change at any time based upon market or other conditions, and the investment adviser disclaims any responsibility to update such views. These views may not be relied on as investment advice and, because investment decisions for a fund are based on many factors, may not be relied on as an indication of trading intent on behalf of any Eaton Vance fund. Portfolio information provided in the report may not be representative of the Portfolio’s current or future investments and may change due to active management.
2
Eaton Vance Floating-Rate Advantage Fund as of October 31, 2008
PERFORMANCE
The line graph and table set forth below provide information about the Fund’s performance. The line graph compares the performance of Class B of the Fund with that of the S&P/LSTA Leveraged Loan Index, an unmanaged loan market index. The lines on the graph represent the total returns of a hypothetical investment of $10,000 in Class B of the Fund and the S&P/LSTA Leveraged Loan Index. The table includes the total returns of each Class of the Fund at net asset value and maximum public offering price. The performance presented below does not reflect the deduction of taxes, if any, that a shareholder would pay on Fund distributions or the redemption of Fund shares.
Performance(1)
| | Advisers | | | | | | | | | |
| | Class | | Class A | | Class B | | Class C | | Class I | |
Share Class Symbol | | EVFAX | | EAFAX | | EBFHX | | ECFAX | | EIFAX | |
Average Annual Total Returns (at net asset value) | | | | | | | | | | | |
One year | | N.A. | | N.A. | | -27.45 | % | N.A. | | N.A. | |
Five years | | N.A. | | N.A. | | -2.59 | | N.A. | | N.A. | |
Ten years | | N.A. | | N.A. | | 0.67 | | N.A. | | N.A. | |
Life of Fund† | | -20.84 | %* | -20.94 | %* | 3.74 | | -21.06 | %* | -20.71 | %* |
SEC Average Annual Total Returns (including sales charge or applicable CDSC) | | | | | | | | | | | |
One year | | N.A. | | N.A. | | -29.50 | % | N.A. | | N.A. | |
Five years | | N.A. | | N.A. | | -2.59 | | N.A. | | N.A. | |
Ten years | | N.A. | | N.A. | | 0.67 | | N.A. | | N.A. | |
Life of Fund† | | -20.84 | %* | -22.72 | %* | 3.74 | | -21.82 | %* | -20.71 | %* |
† Inception Dates: – Advisers Class: 3/15/08; Class A: 3/17/08; Class B: 8/4/89; Class C: 3/15/08; Class I: 3/15/08.
*Performance represents cumulative returns.
(1) Average Annual Total Returns at net asset value do not include the 2.25% maximum sales charge for Class A shares or the applicable contingent deferred sales charges (CDSC) for Class B or Class C shares. If sales charges were deducted, the performance would be lower. SEC Average Annual Total Returns for Class A reflect the maximum 2.25% sales charge. Advisers Class and Class I shares are offered to certain investors at net asset value. SEC Average Annual Total Returns for Class B reflect applicable CDSC based on the following schedule: 3% - 1st year; 2.5% - 2nd year; 2% - 3rd year; 1% - 4th year. 1-year SEC returns for Class C reflect 1% CDSC. Class A, Advisers Class and Class I shares are subject to a 1% redemption fee if redeemed or exchanged within 90 days of the settlement of the purchase.
Total Annual | | Advisers | | | | | | | | | |
Operating Expenses(2) | | Class | | Class A | | Class B | | Class C | | Class I | |
| | | | | | | | | | | |
Expense Ratio | | 1.75 | % | 1.75 | % | 2.10 | % | 2.25 | % | 1.50 | % |
(2) From the Fund’s prospectus dated 3/14/08.
Comparison of Change in Value of a $10,000 Investment in Eaton Vance Floating-Rate Advantage Fund Class B vs. the S&P/LSTA Leveraged Loan Index*
October 31, 1998 – October 31, 2008
* Sources: Lipper Inc. Class B of the Fund commenced operations on 8/4/89. Index data is available as of month end only.
A $10,000 hypothetical investment at net asset value in Class A on 3/17/08, Class C on 3/15/08, Class I on 3/15/08 and Advisers Class on 3/15/08 would have been valued at $7,906 ($7,728 at the maximum offering price), $7,894 ($7,818, including CDSC)), $7 ,929 and $7,916, respectively, on 10/31/08. It is not possible to invest directly in an Index. The Index’s total return does not reflect the expenses that would have been incurred if an investor individually purchased or sold the securities represented in the Index.
Past performance is no guarantee of future results. Returns are historical and are calculated by determining the percentage change in net asset value or offering price (as applicable) with all distributions reinvested. Investment return and principal value wil fluctuate so that shares, when redeemed, may be worth more or less than their original cost. Performance is for the stated time period only; due to market volatility, the Fund’s current performance may be lower or higher than the quoted return. For performance as of the most recent month end, please refer to www.eatonvance.com.
3
Eaton Vance Floating-Rate Advantage Fund as of October 31, 2008
FUND EXPENSES
Example: As a shareholder of the Fund, you incur two types of costs: (1) transaction costs, including sales charges (loads) on purchases and redemption fees (if applicable); and (2) ongoing costs, including management fees; distribution or service fees; and other Fund expenses. This Example is intended to help you understand your ongoing costs (in dollars) of investing in the Fund and to compare these costs with the ongoing costs of investing in other mutual funds. The Example is based on an investment of $1,000 invested at the beginning of the period and held for the entire period (May 1, 2008 – October 31, 2008).
Actual Expenses: The first section of the table below provides information about actual account values and actual expenses. You may use the information in this section, together with the amount you invested, to estimate the expenses that you paid over the period. Simply divide your account value by $1,000 (for example, an $8,600 account value divided by $1,000 = 8.6), then multiply the result by the number in the first section under the heading entitled "Expenses Paid During Period" to estimate the expenses you paid on your account during this period.
Hypothetical Example for Comparison Purposes: The second section of the table below provides information about hypothetical account values and hypothetical expenses based on the actual Fund expense ratio and an assumed rate of return of 5% per year (before expenses), which is not the actual return of the Fund. The hypothetical account values and expenses may not be used to estimate the actual ending account balance or expenses you paid for the period. You may use this information to compare the ongoing costs of investing in your Fund and other funds. To do so, compare this 5% hypothetical example with the 5% hypothetical examples that appear in the shareholder reports of the other funds.
Please note that the expenses shown in the table are meant to highlight your ongoing costs only and do not reflect any transactional costs, such as sales charges (loads) or redemption fees (if applicable). Therefore, the second section of the table is useful in comparing ongoing costs only, and will not help you determine the relative total costs of owning different funds. In addition, if these transactional costs were included, your costs would have been higher.
Eaton Vance Floating-Rate Advantage Fund
| | | Beginning Account Value
(5/1/08) | | Ending Account Value
(10/31/08) | | Expenses Paid During Period*
(5/1/08 – 10/31/08) | |
| Actual | |
| Advisers Class | | $ | 1,000.00 | | | $ | 759.10 | | | $ | 9.46 | | |
| Class A | | $ | 1,000.00 | | | $ | 758.10 | | | $ | 9.32 | | |
| Class B | | $ | 1,000.00 | | | $ | 758.00 | | | $ | 11.31 | | |
| Class C | | $ | 1,000.00 | | | $ | 757.40 | | | $ | 11.66 | | |
| Class I | | $ | 1,000.00 | | | $ | 760.10 | | | $ | 8.36 | | |
| Hypothetical | |
| (5% return per year before expenses) | |
| Advisers Class | | $ | 1,000.00 | | | $ | 1,014.40 | | | $ | 10.84 | | |
| Class A | | $ | 1,000.00 | | | $ | 1,014.50 | | | $ | 10.68 | | |
| Class B | | $ | 1,000.00 | | | $ | 1,012.30 | | | $ | 12.95 | | |
| Class C | | $ | 1,000.00 | | | $ | 1,011.90 | | | $ | 13.35 | | |
| Class I | | $ | 1,000.00 | | | $ | 1,015.60 | | | $ | 9.58 | | |
* Expenses are equal to the Fund's annualized expense ratio of 2.14% for Advisers Class shares, 2.11% for Class A shares, 2.56% for Class B shares, 2.64% for Class C shares and 1.89% for Class I shares, multiplied by the average account value over the period, multiplied by 184/366 (to reflect the one-half year period). The Example assumes that the $1,000 was invested at the net asset value per share determined at the close of business of April 30, 2008. The Example reflects the expenses of both the Fund and the Portfolio.
4
Eaton Vance Floating-Rate Advantage Fund as of October 31, 2008
FINANCIAL STATEMENTS
Statement of Assets and Liabilities
As of October 31, 2008
| Assets | |
Investment in Senior Debt Portfolio, at value
(identified cost, $1,720,943,286) | | $ | 1,119,305,022 | | |
| Receivable for Fund shares sold | | | 8,469,004 | | |
| Total assets | | $ | 1,127,774,026 | | |
| Liabilities | |
| Dividends payable | | $ | 2,850,075 | | |
| Payable for Fund shares redeemed | | | 2,635,982 | | |
| Payable to affiliate for distribution and service fees | | | 536,712 | | |
| Payable to affiliate for administration fee | | | 104,461 | | |
| Payable to affiliate for Trustees' fees | | | 40 | | |
| Accrued expenses | | | 156,485 | | |
| Total liabilities | | $ | 6,283,755 | | |
| Net Assets | | $ | 1,121,490,271 | | |
| Sources of Net Assets | |
| Paid-in capital | | $ | 2,299,105,601 | | |
Accumulated net realized loss from Portfolio (computed on the basis of
identified cost) | | | (573,402,243 | ) | |
| Accumulated distributions in excess of net investment income | | | (2,574,823 | ) | |
Net unrealized depreciation from Portfolio (computed on the basis of
identified cost) | | | (601,638,264 | ) | |
| Total | | $ | 1,121,490,271 | | |
| Advisers Class Shares | |
| Net Assets | | $ | 27,959,820 | | |
| Shares Outstanding | | | 3,669,770 | | |
Net Asset Value, Offering Price and Redemption Price Per Share
(net assets ÷ shares of beneficial interest outstanding) | | $ | 7.62 | | |
| Class A Shares | |
| Net Assets | | $ | 444,144,110 | | |
| Shares Outstanding | | | 58,330,177 | | |
Net Asset Value and Redemption Price Per Share
(net assets ÷ shares of beneficial interest outstanding) | | $ | 7.61 | | |
Maximum Offering Price Per Share
(100 ÷ 97.75 of $7.61) | | $ | 7.79 | | |
| Class B Shares | |
| Net Assets | | $ | 151,320,981 | | |
| Shares Outstanding | | | 19,837,665 | | |
Net Asset Value and Offering Price Per Share*
(net assets ÷ shares of beneficial interest outstanding) | | $ | 7.63 | | |
| Class C Shares | |
| Net Assets | | $ | 484,550,859 | | |
| Shares Outstanding | | | 63,626,315 | | |
Net Asset Value and Offering Price Per Share*
(net assets ÷ shares of beneficial interest outstanding) | | $ | 7.62 | | |
| Class I Shares | |
| Net Assets | | $ | 13,514,501 | | |
| Shares Outstanding | | | 1,773,339 | | |
Net Asset Value, Offering Price and Redemption Price Per Share
(net assets ÷ shares of beneficial interest outstanding) | | $ | 7.62 | | |
| On sales of $100,000 or more, the offering price of Class A shares is reduced. | |
* Redemption price per share is equal to the net asset value less any applicable contingent deferred sales charge.
Statement of Operations
For the Year Ended
October 31, 2008**
| Investment Income | |
| Interest allocated from Portfolio | | $ | 119,945,952 | | |
| Expenses allocated from Portfolio | | | (23,063,633 | ) | |
| Net investment income from Portfolio | | $ | 96,882,319 | | |
| Expenses | |
| Administration fee | | $ | 1,017,451 | | |
| Trustees' fees and expenses | | | 1,733 | | |
Distribution and service fees
Advisers Class | | | 47,400 | | |
| Class A | | | 774,315 | | |
| Class B | | | 4,107,201 | | |
| Class C | | | 3,319,479 | | |
| Transfer and dividend disbursing agent fees | | | 1,166,770 | | |
| Printing and postage | | | 352,036 | | |
| Legal and accounting services | | | 106,383 | | |
| Registration fees | | | 171,412 | | |
| Custodian fee | | | 57,094 | | |
| Miscellaneous | | | 170,308 | | |
| Total expenses | | $ | 11,291,582 | | |
| Net investment income | | $ | 85,590,737 | | |
Realized and Unrealized
Gain (Loss) from Portfolio | |
Net realized gain (loss) —
Investment transactions (identified cost basis) | | $ | (51,648,588 | ) | |
| Swap contracts | | | 207,192 | | |
Foreign currency and forward foreign currency exchange
contract transactions | | | 33,599,101 | | |
| Net realized loss | | $ | (17,842,295 | ) | |
Change in unrealized appreciation (depreciation) —
Investments (identified cost basis) | | $ | (467,379,342 | ) | |
| Swap contracts | | | (349,832 | ) | |
| Foreign currency and forward foreign currency exchange contracts | | | 8,342,059 | | |
| Net change in unrealized appreciation (depreciation) | | $ | (459,387,115 | ) | |
| Net realized and unrealized loss | | $ | (477,229,410 | ) | |
| Net decrease in net assets from operations | | $ | (391,638,673 | ) | |
** Information prior to the close of business on March 14, 2008 reflects the historical financial results of Eaton Vance Prime Rate Reserves prior to its reorganization.
See notes to financial statements
5
Eaton Vance Floating-Rate Advantage Fund as of October 31, 2008
FINANCIAL STATEMENTS CONT'D
Statements of Changes in Net Assets
| Increase (Decrease) in Net Assets | | Year Ended
October 31, 2008* | | Year Ended
October 31, 2007(1) | | Year Ended
November 30, 2006 | |
From operations —
Net investment income | | $ | 85,590,737 | | | $ | 72,132,046 | | | $ | 79,925,750 | | |
Net realized gain (loss) from investment transactions, swap contracts, and foreign currency and forward foreign
currency exchange contract transactions | | | (17,842,295 | ) | | | 452,285 | | | | (5,986,627 | ) | |
Net change in unrealized appreciation (depreciation) from investments, swap contracts, and foreign currency and
forward foreign currency exchange contracts | | | (459,387,115 | ) | | | (32,930,601 | ) | | | 7,596,342 | | |
| Net increase (decrease) in net assets from operations | | $ | (391,638,673 | ) | | $ | 39,653,730 | | | $ | 81,535,465 | | |
Distributions to shareholders —
From net investment income
Advisers Class | | $ | (995,935 | ) | | $ | — | | | $ | — | | |
| Class A | | | (16,194,549 | ) | | | — | | | | — | | |
| Class B | | | (34,565,370 | ) | | | (73,797,943 | ) | | | (80,790,251 | ) | |
| Class C | | | (21,425,668 | ) | | | — | | | | — | | |
| Class I | | | (827,902 | ) | | | — | | | | — | | |
Tax return of capital
Advisers Class | | | | | | | (119,637 | ) | | | | | |
| Class A | | | (1,945,383 | ) | | | | | | | | | |
| Class B | | | (4,152,193 | ) | | | | | | | | | |
| Class C | | | (2,573,775 | ) | | | | | | | | | |
| Class I | | | (99,453 | ) | | | | | | | | | |
| Total distributions to shareholders | | $ | (82,899,865 | ) | | $ | (73,797,943 | ) | | $ | (80,790,251 | ) | |
Transactions in shares of beneficial interest —
Proceeds from sale of shares
Advisers Class | | $ | 9,129,233 | | | $ | — | | | $ | — | | |
| Class A | | | 56,985,769 | | | | — | | | | — | | |
| Class B | | | 9,777,200 | | | | 40,166,348 | | | | 53,849,567 | | |
| Class C | | | 7,957,428 | | | | — | | | | — | | |
| Class I | | | 897,901 | | | | — | | | | — | | |
Net asset value of shares issued to shareholders in payment of distributions declared
Advisers Class | | | 762,435 | | | | — | | | | — | | |
| Class A | | | 10,442,266 | | | | — | | | | — | | |
| Class B | | | 20,026,914 | | | | 39,453,791 | | | | 42,998,968 | | |
| Class C | | | 16,706,127 | | | | — | | | | — | | |
| Class I | | | 488,897 | | | | — | | | | — | | |
Cost of shares redeemed
Advisers Class | | | (10,722,609 | ) | | | — | | | | — | | |
| Class A | | | (73,490,146 | ) | | | — | | | | — | | |
| Class B | | | (279,290,004 | ) | | | (160,508,272 | ) | | | (252,093,538 | ) | |
| Class C | | | (165,335,095 | ) | | | — | | | | — | | |
| Class I | | | (13,372,559 | ) | | | — | | | | — | | |
Net asset value of shares exchanged
Class A | | | 605,354,584 | | | | — | | | | — | | |
| Class B | | | (605,354,584 | ) | | | — | | | | — | | |
Issued in connection with tax-free reorganization (see Note 9)
Advisers Class | | | 34,997,278 | | | | — | | | | — | | |
| Class C | | | 781,241,870 | | | | — | | | | — | | |
| Class I | | | 29,992,032 | | | | — | | | | — | | |
| Net increase (decrease) in net assets from Fund share transactions | | $ | 437,194,937 | | | $ | (80,888,133 | ) | | $ | (155,245,003 | ) | |
| Net increase (decrease) in net assets | | $ | (37,343,601 | ) | | $ | (115,032,346 | ) | | $ | (154,499,789 | ) | |
| Net Assets | |
| At beginning of period | | $ | 1,158,833,872 | | | $ | 1,273,866,218 | | | $ | 1,428,366,007 | | |
| At end of period | | $ | 1,121,490,271 | | | $ | 1,158,833,872 | | | $ | 1,273,866,218 | | |
Accumulated undistributed (distributions in excess of)
net investment income included in net assets | |
| At end of period | | $ | (307,675 | ) | | $ | (2,168,555 | ) | | $ | 786,134 | | |
(1) For the eleven months ended October 31, 2007.
* Information prior to the close of business on March 14, 2008 reflects the historical financial results of Eaton Vance Prime Rate Reserves prior to its reorganization.
See notes to financial statements
6
Eaton Vance Floating-Rate Advantage Fund as of October 31, 2008
FINANCIAL STATEMENTS CONT'D
Financial Highlights
| | | Advisers Class | |
| | | Period Ended
October 31, 2008(1) | |
| Net asset value — Beginning of period | | $ | 10.000 | | |
| Income (loss) from operations | |
| Net investment income(2) | | $ | 0.395 | | |
| Net realized and unrealized loss | | | (2.405 | ) | |
| Total loss from operations | | $ | (2.010 | ) | |
| Less distributions | |
| From net investment income | | $ | (0.330 | ) | |
| Tax return of capital | | | (0.040 | ) | |
| Total distributions | | $ | (0.370 | ) | |
| Net asset value — End of period | | $ | 7.620 | | |
| Total Return(3) | | | (20.84 | )%(7) | |
| Ratios/Supplemental Data | |
| Net assets, end of period (000's omitted) | | $ | 27,960 | | |
| Ratios (As a percentage of average daily net assets): | |
| Expenses before custodian fee reduction(4)(5) | | | 1.17 | %(6) | |
| Interest expense(4) | | | 0.96 | %(6) | |
| Total expenses(4) | | | 2.13 | %(6) | |
| Net investment income | | | 6.25 | %(6) | |
| Portfolio Turnover of the Portfolio | | | 7 | %(8) | |
(1) Advisers Class commenced operations on March 15, 2008.
(2) Computed using average shares outstanding.
(3) Returns are historical and are calculated by determining the percentage change in net asset value with all distributions reinvested.
(4) Includes the Fund's share of the Portfolio's allocated expenses.
(5) Excludes the effect of custody fee credits, if any, of less than 0.005%.
(6) Annualized.
(7) Not annualized.
(8) For the Portfolio's year ended October 31, 2008.
See notes to financial statements
7
Eaton Vance Floating-Rate Advantage Fund as of October 31, 2008
FINANCIAL STATEMENTS CONT'D
Financial Highlights
| | | Class A | |
| | | Period Ended
October 31, 2008(1) | |
| Net asset value — Beginning of period | | $ | 10.000 | | |
| Income (loss) from operations | |
| Net investment income(2) | | $ | 0.388 | | |
| Net realized and unrealized loss | | | (2.408 | ) | |
| Total loss from operations | | $ | (2.020 | ) | |
| Less distributions | |
| From net investment income | | $ | (0.330 | ) | |
| Tax return of capital | | | (0.040 | ) | |
| Total distributions | | $ | (0.370 | ) | |
| Net asset value — End of period | | $ | 7.610 | | |
| Total Return(3) | | | (20.94 | )%(7) | |
| Ratios/Supplemental Data | |
| Net assets, end of period (000's omitted) | | $ | 444,144 | | |
| Ratios (As a percentage of average daily net assets): | |
| Expenses before custodian fee reduction(4)(5) | | | 1.16 | %(6) | |
| Interest expense(4) | | | 0.97 | %(6) | |
| Total expenses(4) | | | 2.13 | %(6) | |
| Net investment income | | | 6.23 | %(6) | |
| Portfolio Turnover of the Portfolio | | | 7 | %(8) | |
(1) Class A commenced operations on March 17, 2008.
(2) Computed using average shares outstanding.
(3) Returns are historical and are calculated by determining the percentage change in net asset value with all distributions reinvested.
(4) Includes the Fund's share of the Portfolio's allocated expenses.
(5) Excludes the effect of custody fee credits, if any, of less than 0.005%.
(6) Annualized.
(7) Not annualized.
(8) For the Portfolio's year ended October 31, 2008.
See notes to financial statements
8
Eaton Vance Floating-Rate Advantage Fund as of October 31, 2008
FINANCIAL STATEMENTS CONT'D
Financial Highlights
| | | Class B† | |
| | | Year Ended | | Period Ended | | Year Ended November 30, | |
| | | October 31, 2008(1) | | October 31, 2007(1)(2) | | 2006(1) | | 2005(1) | | 2004 | | 2003 | |
| Net asset value — Beginning of period | | $ | 11.180 | | | $ | 11.500 | | | $ | 11.500 | | | $ | 11.490 | | | $ | 11.240 | | | $ | 10.830 | | |
| Income (loss) from operations | |
| Net investment income | | $ | 0.662 | | | $ | 0.670 | | | $ | 0.667 | | | $ | 0.481 | | | $ | 0.345 | | | $ | 0.365 | | |
| Net realized and unrealized gain (loss) | | | (3.601 | ) | | | (0.307 | ) | | | 0.008 | | | | 0.014 | | | | 0.249 | | | | 0.409 | | |
| Total income (loss) from operations | | $ | (2.939 | ) | | $ | 0.363 | | | $ | 0.675 | | | $ | 0.495 | | | $ | 0.594 | | | $ | 0.774 | | |
| Less distributions | |
| From net investment income | | $ | (0.545 | ) | | $ | (0.683 | ) | | $ | (0.675 | ) | | $ | (0.485 | ) | | $ | (0.344 | ) | | $ | (0.364 | ) | |
| Tax return of capital | | | (0.066 | ) | | | | | | | | | | | | | | | | | | | | | |
| Total distributions | | $ | (0.611 | ) | | $ | (0.683 | ) | | $ | (0.675 | ) | | $ | (0.485 | ) | | $ | (0.344 | ) | | $ | (0.364 | ) | |
| Net asset value — End of period | | $ | 7.630 | | | $ | 11.180 | | | $ | 11.500 | | | $ | 11.500 | | | $ | 11.490 | | | $ | 11.240 | | |
| Total Return(3) | | | (27.45 | )% | | | 3.23 | %(8) | | | 6.02 | % | | | 4.41 | % | | | 5.30 | % | | | 7.32 | % | |
| Ratios/Supplemental Data | |
| Net assets, end of period (000's omitted) | | $ | 151,321 | | | $ | 1,158,834 | | | $ | 1,273,866 | | | $ | 1,428,366 | | | $ | 1,636,855 | | | $ | 1,840,559 | | |
| Ratios (As a percentage of average daily net assets): | |
| Expenses before custodian fee reduction(4)(5) | | | 1.51 | % | | | 1.40 | %(6) | | | 1.32 | % | | | 1.33 | % | | | 1.31 | % | | | 1.31 | % | |
| Interest expense(4) | | | 1.02 | % | | | 0.70 | %(6) | | | 0.01 | % | | | 0.00 | %(7) | | | 0.00 | %(7) | | | 0.01 | % | |
| Total expenses(4) | | | 2.53 | % | | | 2.10 | %(6) | | | 1.33 | % | | | 1.33 | % | | | 1.31 | % | | | 1.32 | % | |
| Net investment income | | | 6.37 | % | | | 6.39 | %(6) | | | 5.79 | % | | | 4.18 | % | | | 3.02 | % | | | 3.34 | % | |
| Portfolio Turnover of the Portfolio | | | 7 | % | | | 55 | %(8) | | | 51 | % | | | 65 | % | | | 87 | % | | | 47 | % | |
† Information prior to the close of business on March 14, 2008 reflects the historical financial results of Eaton Vance Prime Rate Reserves prior to its reorganization. The per share data has been restated for a 0.8166 for 1 split, representing the share exchange rate on the date of the reorganization.
(1) Net investment income per share was computed using average shares outstanding.
(2) For the eleven month period ended October 31, 2007.
(3) Returns are historical and are calculated by determining the percentage change in net asset value with all distributions reinvested.
(4) Includes the Fund's share of the Portfolio's allocated expenses.
(5) Excludes the effect of custody fee credits, if any, of less than 0.005%.
(6) Annualized.
(7) Represents less than 0.01%.
(8) Not annualized.
See notes to financial statements
9
Eaton Vance Floating-Rate Advantage Fund as of October 31, 2008
FINANCIAL STATEMENTS CONT'D
Financial Highlights
| | | Class C | |
| | | Period Ended
October 31, 2008(1) | |
| Net asset value — Beginning of period | | $ | 10.000 | | |
| Income (loss) from operations | |
| Net investment income(2) | | $ | 0.362 | | |
| Net realized and unrealized loss | | | (2.400 | ) | |
| Total loss from operations | | $ | (2.038 | ) | |
| Less distributions | |
| From net investment income | | $ | (0.305 | ) | |
| Tax return of capital | | | (0.037 | ) | |
| Total distributions | | $ | (0.342 | ) | |
| Net asset value — End of period | | $ | 7.620 | | |
| Total Return(3) | | | (21.06 | )%(7) | |
| Ratios/Supplemental Data | |
| Net assets, end of period (000's omitted) | | $ | 484,551 | | |
| Ratios (As a percentage of average daily net assets): | |
| Expenses before custodian fee reduction(4)(5) | | | 1.68 | %(6) | |
| Interest expense(4) | | | 0.96 | %(6) | |
| Total expenses(4) | | | 2.64 | %(6) | |
| Net investment income | | | 5.74 | %(6) | |
| Portfolio Turnover of the Portfolio | | | 7 | %(8) | |
(1) Class C commenced operations on March 15, 2008.
(2) Computed using average shares outstanding.
(3) Returns are historical and are calculated by determining the percentage change in net asset value with all distributions reinvested.
(4) Includes the Fund's share of the Portfolio's allocated expenses.
(5) Excludes the effect of custody fee credits, if any, of less than 0.005%.
(6) Annualized.
(7) Not annualized.
(8) For the Portfolio's year ended October 31, 2008.
See notes to financial statements
10
Eaton Vance Floating-Rate Advantage Fund as of October 31, 2008
FINANCIAL STATEMENTS CONT'D
Financial Highlights
| | | Class I | |
| | | Period Ended
October 31, 2008(1) | |
| Net asset value — Beginning of period | | $ | 10.000 | | |
| Income (loss) from operations | |
| Net investment income(2) | | $ | 0.412 | | |
| Net realized and unrealized loss | | | (2.407 | ) | |
| Total loss from operations | | $ | (1.995 | ) | |
| Less distributions | |
| From net investment income | | $ | (0.344 | ) | |
| Tax return of capital | | | (0.041 | ) | |
| Total distributions | | $ | (0.385 | ) | |
| Net asset value — End of period | | $ | 7.620 | | |
| Total Return(3) | | | (20.71 | )%(7) | |
| Ratios/Supplemental Data | |
| Net assets, end of period (000's omitted) | | $ | 13,515 | | |
| Ratios (As a percentage of average daily net assets): | |
| Expenses before custodian fee reduction(4)(5) | | | 0.92 | %(6) | |
| Interest expense(4) | | | 0.96 | %(6) | |
| Total expenses(4) | | | 1.88 | %(6) | |
| Net investment income | | | 6.51 | %(6) | |
| Portfolio Turnover of the Portfolio | | | 7 | %(8) | |
(1) Class I commenced operations on March 15, 2008.
(2) Computed using average shares outstanding.
(3) Returns are historical and are calculated by determining the percentage change in net asset value with all distributions reinvested.
(4) Includes the Fund's share of the Portfolio's allocated expenses.
(5) Excludes the effect of custody fee credits, if any, of less than 0.005%.
(6) Annualized.
(7) Not annualized.
(8) For the Portfolio's year ended October 31, 2008.
See notes to financial statements
11
Eaton Vance Floating-Rate Advantage Fund as of October 31, 2008
NOTES TO FINANCIAL STATEMENTS
1 Significant Accounting Policies
Eaton Vance Floating-Rate Advantage Fund (the Fund) is a diversified series of Eaton Vance Mutual Funds Trust (the Trust). The Trust is a Massachusetts business trust registered under the Investment Company Act of 1940, as amended (the 1940 Act), as an open-end management investment company. The Fund offers five classes of shares. Class A shares are generally sold subject to a sales charge imposed at time of purchase. Class B and Class C shares are sold at net asset value and are generally subject to a contingent deferred sales charge (see Note 5). The Advisers Class and Class I shares are generally sold at net asset value and are not subject to a sales charge. Class B shares automatically convert to Class A shares eight years after their purchase as described in the Fund's prospectus. Each class represents a pro-rata interest in the Fund, but votes separately on class-specific matters and (as noted below) is subject to differen t expenses. Realized and unrealized gains and losses are allocated daily to each class of shares based on the relative net assets of each class to the total net assets of the Fund. Net investment income, other than class-specific expenses, is allocated daily to each class of shares based upon the ratio of the value of each class's paid shares to the total value of all paid shares. Each class of shares differs in its distribution plan and certain other class-specific expenses. The Fund invests all of its investable assets in interests in Senior Debt Portfolio (the Portfolio), a New York trust, having the same investment objective and policies as the Fund. The value of the Fund's investment in the Portfolio reflects the Fund's proportionate interest in the net assets of the Portfolio (99.9% at October 31, 2008). The performance of the Fund is directly affected by the performance of the Portfolio. The financial statements of the Portfolio, including the portfolio of investments, are included elsewhere in this r eport and should be read in conjunction with the Fund's financial statements.
The financial statements of the Fund reflect the historical financial results of Eaton Vance Prime Rate Reserves (the Predecessor Fund) prior to its reorganization (see Note 9). The investment objective and policies of the Predecessor Fund, which also invested in the Portfolio, were substantially similar to those of the Fund.
The following is a summary of significant accounting policies of the Fund. The policies are in conformity with accounting principles generally accepted in the United States of America.
A Investment Valuation — Valuation of securities by the Portfolio is discussed in Note 1A of the Portfolio's Notes to Financial Statements, which are included elsewhere in this report.
B Income — The Fund's net investment income or loss consists of the Fund's pro-rata share of the net investment income or loss of the Portfolio, less all actual and accrued expenses of the Fund.
C Federal Taxes — The Fund's policy is to comply with the provisions of the Internal Revenue Code applicable to regulated investment companies and to distribute to shareholders each year substantially all of its net investment income, and all or substantially all of its net realized capital gains. Accordingly, no provision for federal income or excise tax is necessary. At October 31, 2008, the Fund, for federal income tax purposes, had a capital loss carryforward of $576,484,544 which will reduce its taxable income arising from future net realized gains on investment transactions, if any, to the extent permitted by the Internal Revenue Code, and thus will reduce the amount of distributions to shareholders, which would otherwise be necessary to relieve the Fund of any liab ility for federal income or excise tax: Such capital loss carryforward will expire on October 31, 2009 ($194,462,963), October 31, 2010 ($154,919,765), October 31, 2011 ($86,475,719), October 31, 2012 (774,702), October 31, 2013 ($704,819), October 31, 2015 (14,497,995) and October 31, 2016 ($124,648,581).
A capital loss carryforward of $160,589,153 included in the amounts above will be available to the Fund as a result of the reorganization of Eaton Vance Advisers Senior Floating-Rate Fund, EV Classic Senior Floating-Rate Fund and Eaton Vance Institutional Senior Floating-Rate Fund on March 14, 2008 (see Note 9). Utilization of this additional capital loss carryforward may be limited in accordance with certain income tax regulations.
As of October 31, 2008, the Fund had no uncertain tax positions that would require financial statement recognition, de-recognition, or disclosure. Each of the Fund's and Predecessor Fund's federal tax returns filed in the 3-year period ended October 31, 2008 remains subject to examination by the Internal Revenue Service.
D Expenses — The majority of expenses of the Trust are directly identifiable to an individual fund. Expenses which are not readily identifiable to a specific fund are allocated taking into consideration, among other things, the nature and type of expense and the relative size of the funds.
E Expense Reduction — State Street Bank and Trust Company (SSBT) serves as custodian of the Fund. Pursuant to the custodian agreement, SSBT receives a fee reduced by credits, which are determined based on the average daily cash balance the Fund maintains with SSBT. All credit balances, if
12
Eaton Vance Floating-Rate Advantage Fund as of October 31, 2008
NOTES TO FINANCIAL STATEMENTS CONT'D
any, used to reduce the Fund's custodian fees are reported as a reduction of expenses in the Statement of Operations.
F Use of Estimates — The preparation of the financial statements in conformity with accounting principles generally accepted in the United States of America requires management to make estimates and assumptions that affect the reported amounts of assets and liabilities at the date of the financial statements and the reported amounts of income and expense during the reporting period. Actual results could differ from those estimates.
G Indemnifications — Under the Trust's organizational documents, its officers and Trustees may be indemnified against certain liabilities and expenses arising out of the performance of their duties to the Fund, and shareholders are indemnified against personal liability for the obligations of the Trust. Additionally, in the normal course of business, the Fund enters into agreements with service providers that may contain indemnification clauses. The Fund's maximum exposure under these arrangements is unknown as this would involve future claims that may be made against the Fund that have not yet occurred.
H Redemption Fees — Upon the redemption or exchange of shares by Advisers Class, Class A and Class I shareholders within 90 days of the settlement of purchase, a fee of 1% of the current net asset value of these shares will be assessed and retained by the Fund for the benefit of the remaining shareholders. The redemption fee is accounted for as an addition to paid-in capital.
I Other — Investment transactions are accounted for on a trade date basis. Dividends to shareholders are recorded on the ex-dividend date.
2 Distributions to Shareholders
The Fund declares dividends daily to shareholders of record at the time of declaration. Distributions are generally paid monthly. Distributions of realized capital gains (reduced by available capital loss carryforwards from prior years, if any) are made at least annually. Distributions are declared separately for each class of shares. Shareholders may reinvest income and capital gain distributions in additional shares of the same class of the Fund at the net asset value as of the reinvestment date or, at the election of the shareholder, receive distributions in cash. The Fund distinguishes between distributions on a tax basis and a financial reporting basis. Accounting principles generally accepted in the United States of America require that only distributions in excess of tax basis earnings and profits be reported in the financial statements as a return of capital. Permanent differences between book and tax accounting relating to distributions are reclassified to paid-in capital.
The tax character of distributions declared for the year ended October 31, 2008, period ended October 31, 2007 and year ended November 30, 2006 was as follows:
| | | Year Ended
October 31, 2008 | | Period Ended
October 31, 2007 | | Year Ended
November 30, 2006 | |
Distributions
declared from: | |
| Ordinary income | | $ | 74,009,424 | | | $ | 73,797,943 | | | $ | 80,790,251 | | |
| Tax return of capital | | | 8,890,441 | | | | | | |
During the year ended October 31, 2008, accumulated net investment income were decreased by $11,987,581, accumulated net realized loss was increased by $223,297,339 and paid-in capital was increased by $235,284,920 due to differences between book and tax accounting, primarily for mixed straddles, swap contracts and foreign currency gain (loss). These reclassifications had no effect on the net assets or net asset value per share of the Fund.
As of October 31, 2008, the components of distributable earnings (accumulated losses) and unrealized appreciation (depreciation) on a tax basis were as follows:
| Capital loss carryforward | | $ | (576,484,544 | ) | |
| Net unrealized depreciation | | $ | (598,280,711 | ) | |
| Other temporary differences | | $ | (2,850,075 | ) | |
The differences between components of distributable earnings (accumulated losses) on a tax basis and the amounts reflected in the Statement of Assets and Liabilities are primarily due to wash sales, partnership allocations, swap contracts and timing of recognizing distributions to shareholders.
3 Transactions with Affiliates
Effective March 15, 2008, an administration fee is earned by Eaton Vance Management (EVM) as compensation for administrative services rendered to the Fund. The fee is computed at an annual rate of 0.10% of the Fund's average daily net assets. Prior to March 15, 2008, EVM served as the administrator of the Predecessor Fund, but received no compensation as long as the distribution fee was paid by the Predecessor Fund. For the year ended October 31, 2008, the administration fee amounted to $1,017,451. The Portfolio
13
Eaton Vance Floating-Rate Advantage Fund as of October 31, 2008
NOTES TO FINANCIAL STATEMENTS CONT'D
has engaged Boston Management and Research (BMR), a subsidiary of EVM, to render investment advisory services. See Note 2 of the Portfolio's Notes to Financial Statements which are included elsewhere in this report.
EVM serves as the sub-transfer agent of the Fund and receives from the transfer agent an aggregate fee based upon the actual expenses incurred by EVM in the performance of these services. For the year ended October 31, 2008, EVM earned $54,943 in sub-transfer agent fees. The Fund was informed that Eaton Vance Distributors, Inc. (EVD), an affiliate of EVM and the Fund's principal underwriter, received $1,937 as its portion of the sales charge on sales of Class A shares for the period from March 17, 2008 to October 31, 2008. EVD also received distribution and service fees from Advisers Class, Class A, Class B and Class C shares (see Note 4) and contingent deferred sales charges (see Note 5).
Except for Trustees of the Fund and the Portfolio who are not members of EVM's or BMR's organizations, officers and Trustees receive remuneration for their services to the Fund out of the investment adviser fee. Trustees of the Fund who are not affiliated with EVM may elect to defer receipt of all or a percentage of their annual fees in accordance with the terms of the Trustees Deferred Compensation Plan. For the year ended October 31, 2008, no significant amounts have been deferred. Certain officers and Trustees of the Fund and the Portfolio are officers of the above organizations.
4 Distribution Plans
The Fund has in effect distribution plans for the Advisers Class shares (Advisers Plan) and Class A shares (Class A Plan) pursuant to Rule 12b-1 under the 1940 Act. The Advisers Plan and Class A Plan provide that the Fund will pay EVD a distribution and service fee of 0.25% per annum of its average daily net assets attributable to Advisers Class and Class A shares for distribution services and facilities provided to the Fund by EVD, as well as for personal services and/or the maintenance of shareholder accounts. Distribution and service fees paid or accrued to EVD for the period from March 15, 2008 to October 31, 2008 amounted to $47,400 for Advisers Class shares, and for the period from March 17, 2008 to October 31, 2008 amounted to $774,315 for Class A shares.
The Fund also has in effect distribution plans for Class B shares (Class B Plan) and Class C shares (Class C Plan) pursuant to Rule 12b-1 under the 1940 Act. The Class B and Class C Plans require the Fund to pay EVD amounts equal to 0.40% and 0.60% per annum of its average daily net assets attributable to Class B and Class C shares, respectively, for providing ongoing distribution services and facilities to the Fund. Prior to March 15, 2008, the Predecessor Fund had a distribution plan in effect that allowed it to pay distribution fees of 0.70% per annum of its average daily net assets to EVD for the sale and distribution of its shares. For the year ended October 31, 2008, the Fund paid or accrued to EVD $3,645,276 (including $2,721,426 related to the Predecessor Fund) and $2,655,583 for Class B and Class C shares, respectively.
The Class B and Class C Plans also authorize the Fund to make payments of service fees to EVD, investment dealers and other persons in amounts not exceeding 0.20% and 0.15% per annum of its average daily net assets attributable to Class B and Class C shares, respectively. Service fees paid or accrued are for personal services and/or the maintenance of shareholder accounts. They are separate and distinct from the sales commissions and distribution fees payable to EVD. Service fees paid or accrued for the period from March 15, 2008 to October 31, 2008 amounted to $461,925 and $663,896 for Class B and Class C shares, respectively.
5 Contingent Deferred Sales Charges
A contingent deferred sales charge (CDSC) generally is imposed on redemptions of Class B shares made within four years of purchase and on redemptions of Class C shares made within one year of purchase. Class A shares may be subject to a 1% CDSC if redeemed within 18 months of purchase (depending on the circumstances of purchase). Generally, the CDSC is based upon the lower of the net asset value at date of redemption or date of purchase. No charge is levied on shares acquired by reinvestment of dividends or capital gain distributions. The Class B CDSC is imposed at declining rates that begin at 3% in the case of redemptions in the first year of p urchase, declining to 2.5% in the second year, 2.0% in the third year, 1.0% in the fourth year and 0.0% thereafter. Class C shares are subject to a 1% CDSC if redeemed within one year of purchase. For the period from March 15, 2008 to October 31, 2008, the Fund was informed that EVD received approximately $197,000 and $31,000 of CDSCs paid by Class B and Class C shareholders, respectively.
Prior to March 15, 2008, an early withdrawal charge (EWC) was charged to repurchasing shareholders and paid to EVD in connection with most shares held for less than four years which were accepted by the Predecessor Fund for repurchase. The EWC was imposed at declining rates that began at 3% in the case of repurchases in the first year after purchase, declined to 2.5%, 2% and 1% in the second, third and fourth year, respectively, and 0% thereafter. The EWC was based on the lower of the net asset value at the time of purchase or repurchase. Shares acquired through the reinvestment of distributions were
14
Eaton Vance Floating-Rate Advantage Fund as of October 31, 2008
NOTES TO FINANCIAL STATEMENTS CONT'D
exempt from the EWC. Redemptions were made first from shares that were not subject to an EWC. The Predecessor Fund was informed that EVD received approximately $182,800 in EWCs for the period from November 1, 2007 through March 14, 2008.
6 Investment Transactions
For the year ended October 31, 2008, increases and decreases in the Portfolio, excluding the effect of the reorganization of Advisers Fund, Classic Fund and Institutional Fund as described in Note 9, aggregated $1,844,822,272 and $1,507,257,257, respectively.
7 Shares of Beneficial Interest
The Fund's Declaration of Trust permits the Trustees to issue an unlimited number of full and fractional shares of beneficial interest (without par value). Such shares may be issued in a number of different series (such as the Fund) and classes. Transactions in Fund shares were as follows:
| Advisers Class | | Period Ended
October 31, 2008(1) | |
| Sales | | | 1,173,587 | | |
Issued in connection with the acquisition of Eaton Vance
Advisers Senior Floating-Rate Fund | | | 3,499,728 | | |
Issued to shareholders electing to receive payments of
distributions in Fund shares | | | 78,774 | | |
| Redemptions | | | (1,082,319 | ) | |
| Net increase | | | 3,669,770 | | |
| Class A | | Period Ended
October 31, 2008(1) | |
| Sales | | | 5,673,088 | | |
Issued to shareholders electing to receive payments of
distributions in Fund shares | | | 1,090,809 | | |
| Redemptions | | | (7,603,566 | ) | |
| Exchange from Class B shares | | | 59,169,846 | | |
| Net increase | | | 58,330,177 | | |
| Class B | | Year Ended
October 31,
2008* | | Period Ended
October 31,
2007(2)* | | Year Ended
November 30,
2006* | |
| Sales | | | 929,409 | | | | 3,511,289 | | | | 4,674,415 | | |
Issued to shareholders
electing to receive
payments of distributions
in Fund shares | | | 1,941,559 | | | | 3,466,814 | | | | 3,733,457 | | |
| Redemptions | | | (27,546,856 | ) | | | (14,135,638 | ) | | | (21,796,565 | ) | |
| Exchange to Class A shares | | | (59,168,319 | ) | | | — | | | | — | | |
| Net decrease | | | (83,844,207 | ) | | | (7,157,535 | ) | | | (13,388,693 | ) | |
| Class C | | Period Ended
October 31, 2008(1) | |
| Sales | | | 781,462 | | |
Issued in connection with the acquisition of EV Classic
Senior Floating-Rate Fund | | | 78,124,187 | | |
Issued to shareholders electing to receive payments of
distributions in Fund shares | | | 1,723,721 | | |
| Redemptions | | | (17,003,055 | ) | |
| Net increase | | | 63,626,315 | | |
| Class I | | Period Ended
October 31, 2008(1) | |
| Sales | | | 87,165 | | |
Issued in connection with the acquisition of Eaton Vance Institutional
Senior Floating-Rate Fund | | | 2,999,203 | | |
Issued to shareholders electing to receive payments of
distributions in Fund shares | | | 49,463 | | |
| Redemptions | | | (1,362,492 | ) | |
| Net increase | | | 1,773,339 | | |
(1) For the period from the start of business, March 15, 2008, to October 31, 2008 for Advisers Class, Class C and Class I, and March 17, 2008 to October 31, 2008 for Class A.
(2) For the eleven months ended October 31, 2007.
* Information prior to the close of business on March 14, 2008 reflects the historical financial results of Eaton Vance Prime Rate Reserves prior to its reorganization. The information has been restated for a 0.8166 for 1 split, representing the share exchange rate on the date of reorganization.
8 Recently Issued Accounting Pronouncement
In September 2006, the FASB issued Statement of Financial Accounting Standards No. 157 (FAS 157), "Fair Value Measurements". FAS 157 defines fair value, establishes a framework for measuring fair value in accordance with generally accepted accounting principles and expands disclosure about fair value measurements. FAS 157 is effective for fiscal years beginning after November 15, 2007. As of October 31, 2008, management does not believe the adoption of FAS 157 will impact the amounts reported in the financial statements; however, additional disclosures may be required about the inputs used to develop the measurements of fair value and the effect of certain of the measurements on changes in net assets for the period.
9 Reorganization
As of the close of business on March 14, 2008, the Fund acquired the net assets of Eaton Vance Prime Rate Reserves (Prime Rate Reserves) pursuant to a plan of reorganization
15
Eaton Vance Floating-Rate Advantage Fund as of October 31, 2008
NOTES TO FINANCIAL STATEMENTS CONT'D
approved by its shareholders. Prior to this acquisition, the Fund had not commenced operations. The acquisition was accomplished by a tax-free exchange of 92,146,278 shares of Class B of the Fund for the 112,846,521 shares of Prime Rate Reserves outstanding on March 14, 2008. The aggregate net assets of Prime Rate Reserves on March 14, 2008 were $921,462,778.
Additionally, as of the close of business on March 14, 2008, the Fund acquired the net assets of Eaton Vance Advisers Senior Floating-Rate Fund (Advisers Fund), EV Classic Senior Floating-Rate Fund (Classic Fund) and Eaton Vance Institutional Senior Floating-Rate Fund (Institutional Fund), each of which also invested in the Portfolio, pursuant to a plan of reorganization approved by the shareholders. The acquisitions were accomplished by tax-free exchanges of 3,499,728 shares of Advisers Class of the Fund for the 4,294,600 shares of the Advisers Fund outstanding on March 14, 2008, 78,124,187 shares of Class C of the Fund for the 95,962,919 shares of the Classic Fund outstanding on March 14, 2008 and 2,999,203 shares of Class I of the Fund for the 3,680,699 shares of the Institutional Fund outstanding on March 14, 2008. The aggregate net assets of the Fund immediately before the acquisition were $921,462,778. The net assets of th e Advisers Fund, Classic Fund and Institutional Fund at that date of $34,997,278, $781,241,870 and $29,992,032, respectively, including $5,962,341, $106,752,582 and $5,311,335 of unrealized appreciation, respectively, were combined with those of the Fund, resulting in combined net assets of $1,767,693,958.
16
Eaton Vance Floating-Rate Advantage Fund as of October 31, 2008
REPORT OF INDEPENDENT REGISTERED PUBLIC ACCOUNTING FIRM
To the Trustees and Shareholders
of Eaton Vance Floating-Rate Advantage Fund:
We have audited the accompanying statement of assets and liabilities of Eaton Vance Floating-Rate Advantage Fund (the "Fund") (one of the funds constituting Eaton Vance Mutual Funds Trust) as of October 31, 2008, the related statements of operations and changes in net assets for the year then ended, the statements of changes in net assets of Prime Rate Reserves ("Predecessor Fund") for the eleven months ended October 31, 2007, and the year ended November 30, 2006, and the financial highlights for the periods presented. These financial statements and financial highlights are the responsibility of the Fund's management. Our responsibility is to express an opinion on these financial statements and financial highlights based on our audits.
As discussed in Note 9 to the financial statements, on March 14, 2008, the Fund acquired the net assets of Eaton Vance Prime Rate Reserves, Eaton Vance Advisers Senior Floating-Rate Fund, EV Classic Senior Floating-Rate Fund, and Eaton Vance Institutional Senior Floating-Rate Fund, pursuant to a tax-free plan of reorganization approved by the shareholders. Accordingly, the accompanying financial statements have been prepared in conformity with accounting principles generally accepted in the United States of America.
We conducted our audits in accordance with the standards of the Public Company Accounting Oversight Board (United States). Those standards require that we plan and perform the audit to obtain reasonable assurance about whether the financial statements and financial highlights are free of material misstatement. The Fund is not required to have, nor were we engaged to perform, an audit of its internal control over financial reporting. Our audits included consideration of internal control over financial reporting as a basis for designing audit procedures that are appropriate in the circumstances, but not for the purpose of expressing an opinion on the effectiveness of the Fund's internal control over financial reporting. Accordingly, we express no such opinion. An audit also includes examining, on a test basis, evidence supporting the amounts and disclosures in the financial statements, assessing the accounting principles used and significant estimates made by management, as well as evaluating the overall financial statement presentation. We believe that our audits provide a reasonable basis for our opinion.
In our opinion, the financial statements and financial highlights referred to above present fairly, in all material respects, the financial position of Eaton Vance Floating-Rate Advantage Fund as of October 31, 2008, the results of its operations and changes in its net assets for the year then ended, the changes in net assets of Prime Rate Reserves for the eleven months ended October 31, 2007, and the year ended November 30, 2006,and the financial highlights for the periods presented, in conformity with accounting principles generally accepted in the United States of America.
DELOITTE & TOUCHE LLP
Boston, Massachusetts
December 18, 2008
17
Eaton Vance Floating-Rate Advantage Fund as of October 31, 2008
FEDERAL TAX INFORMATION (Unaudited)
The Form 1099-DIV you receive in January 2009 will show the tax status of all distributions paid to your account in calendar 2008. Shareholders are advised to consult their own tax adviser with respect to the tax consequences of their investment in the Fund.
18
Senior Debt Portfolio as of October 31, 2008
PORTFOLIO OF INVESTMENTS
| Senior Floating-Rate Interests — 127.4%(1) | | | |
Principal
Amount* | | Borrower/Tranche Description | | Value | |
| Aerospace and Defense — 2.1% | | | |
| Atlantic Inertial Systems, Inc. | | | |
| GBP | 839,278 | | | Term Loan, 9.31%, Maturing July 20, 2014 | | $ | 1,094,061 | | |
| AWAS Capital, Inc. | | | |
| | 5,001,523 | | | Term Loan, 5.00%, Maturing March 22, 2013 | | | 3,576,089 | | |
| Colt Defense, LLC | | | |
| | 1,472,129 | | | Term Loan, 7.18%, Maturing July 9, 2014 | | | 1,155,622 | | |
| DAE Aviation Holdings, Inc. | | | |
| | 567,742 | | | Term Loan, 7.17%, Maturing July 31, 2014 | | | 422,968 | | |
| | 574,468 | | | Term Loan, 7.37%, Maturing July 31, 2014 | | | 427,979 | | |
| Evergreen International Aviation | | | |
| | 2,724,628 | | | Term Loan, 9.00%, Maturing October 31, 2011 | | | 2,077,529 | | |
| Hawker Beechcraft Acquisition | | | |
| | 186,335 | | | Term Loan, 5.76%, Maturing March 26, 2014 | | | 120,985 | | |
| | 3,574,343 | | | Term Loan, 5.76%, Maturing March 26, 2014 | | | 2,320,771 | | |
| Hexcel Corp. | | | |
| | 1,531,348 | | | Term Loan, 5.25%, Maturing March 1, 2012 | | | 1,362,900 | | |
| IAP Worldwide Services, Inc. | | | |
| | 581,302 | | | Term Loan, 9.06%, Maturing December 30, 2012 | | | 389,473 | | |
| Jet Aviation Holding, AG | | | |
| | 897,122 | | | Term Loan, 3.16%, Maturing May 15, 2013 | | | 758,068 | | |
| Spirit AeroSystems, Inc. | | | |
| | 2,681,909 | | | Term Loan, 6.50%, Maturing December 31, 2011 | | | 2,286,328 | | |
| TransDigm, Inc. | | | |
| | 3,000,000 | | | Term Loan, 5.21%, Maturing June 23, 2013 | | | 2,298,750 | | |
| Vought Aircraft Industries, Inc. | | | |
| | 2,000,000 | | | Revolving Loan, 0.00%, Maturing December 22, 2009(2) | | | 1,770,000 | | |
| | 2,198,015 | | | Term Loan, 5.62%, Maturing December 17, 2011 | | | 1,747,422 | | |
| | 1,000,000 | | | Term Loan, 6.42%, Maturing December 17, 2011 | | | 750,000 | | |
| Wesco Aircraft Hardware Corp. | | | |
| | 1,000,000 | | | Term Loan - Second Lien, 8.87%, Maturing
September 29, 2014 | | | 767,500 | | |
| | | | | | | $ | 23,326,445 | | |
| Air Transport — 0.6% | | | |
| Delta Air Lines, Inc. | | | |
| | 4,944,962 | | | Term Loan - Second Lien, 6.25%, Maturing
April 30, 2014 | | $ | 2,843,353 | | |
| Northwest Airlines, Inc. | | | |
| | 4,746,000 | | | DIP Loan, 5.00%, Maturing August 21, 2009 | | | 3,862,057 | | |
| | | | | | | $ | 6,705,410 | | |
Principal
Amount* | |
Borrower/Tranche Description | |
Value | |
| Automotive — 4.6% | | | |
| Accuride Corp. | | | |
| | 5,855,002 | | | Term Loan, 7.31%, Maturing January 31, 2012 | | $ | 4,435,164 | | |
| Adesa, Inc. | | | |
| | 7,222,157 | | | Term Loan, 6.02%, Maturing October 18, 2013 | | | 4,808,750 | | |
| Allison Transmission, Inc. | | | |
| | 3,871,915 | | | Term Loan, 5.67%, Maturing September 30, 2014 | | | 2,659,177 | | |
| Chrysler Financial | | | |
| | 2,493,703 | | | Term Loan, 6.82%, Maturing August 1, 2014 | | | 1,710,264 | | |
| CSA Acquisition Corp. | | | |
| | 922,575 | | | Term Loan, 6.31%, Maturing December 23, 2011 | | | 643,496 | | |
| | 1,196,898 | | | Term Loan, 6.31%, Maturing December 23, 2011 | | | 834,836 | | |
| Dayco Products, LLC | | | |
| | 4,577,330 | | | Term Loan, 8.01%, Maturing June 21, 2011 | | | 1,556,292 | | |
| Federal-Mogul Corp. | | | |
| | 3,575,166 | | | Term Loan, 5.48%, Maturing December 27, 2014 | | | 2,176,382 | | |
| | 2,767,879 | | | Term Loan, 6.12%, Maturing December 27, 2015 | | | 1,684,947 | | |
| Financiere Truck (Investissement) | | | |
| EUR | 475,962 | | | Term Loan, 6.97%, Maturing February 15, 2012 | | | 415,546 | | |
| Ford Motor Co. | | | |
| | 4,937,063 | | | Term Loan, 7.59%, Maturing December 15, 2013 | | | 2,743,595 | | |
| Fraikin, Ltd. | | | |
| GBP | 596,292 | | | Term Loan, 8.14%, Maturing February 15, 2012 | | | 633,365 | | |
| GBP | 690,864 | | | Term Loan, 8.27%, Maturing February 15, 2012(2) | | | 733,816 | | |
| General Motors Corp. | | | |
| | 8,253,311 | | | Term Loan, 5.80%, Maturing November 29, 2013 | | | 4,564,081 | | |
| Goodyear Tire & Rubber Co. | | | |
| | 11,799,293 | | | Term Loan - Second Lien, 4.78%, Maturing
April 30, 2010 | | | 8,397,168 | | |
| HLI Operating Co., Inc. | | | |
| EUR | 109,091 | | | Term Loan, 4.87%, Maturing May 30, 2014 | | | 119,576 | | |
| EUR | 1,867,273 | | | Term Loan, 7.67%, Maturing May 30, 2014 | | | 1,856,347 | | |
| Keystone Automotive Operations, Inc. | | | |
| | 4,495,088 | | | Term Loan, 7.15%, Maturing January 12, 2012 | | | 2,584,676 | | |
| Kwik Fit Group Ltd. | | | |
| GBP | 2,500,000 | | | Term Loan, 7.92%, Maturing August 31, 2013 | | | 1,683,111 | | |
| Locafroid Services S.A.S. | | | |
| EUR | 714,174 | | | Term Loan, 7.30%, Maturing February 15, 2012(2) | | | 623,522 | | |
| Tenneco Automotive, Inc. | | | |
| | 3,125,000 | | | Term Loan, 5.50%, Maturing March 17, 2014 | | | 2,437,500 | | |
| TriMas Corp. | | | |
| | 375,000 | | | Term Loan, 4.88%, Maturing August 2, 2011 | | | 285,000 | | |
| | 1,592,500 | | | Term Loan, 5.63%, Maturing August 2, 2013 | | | 1,210,300 | | |
| United Components, Inc. | | | |
| | 2,779,297 | | | Term Loan, 4.81%, Maturing June 30, 2010 | | | 2,115,740 | | |
| | | | | | | $ | 50,912,651 | | |
See notes to financial statements
19
Senior Debt Portfolio as of October 31, 2008
PORTFOLIO OF INVESTMENTS CONT'D
Principal
Amount* | |
Borrower/Tranche Description | |
Value | |
| Beverage and Tobacco — 0.4% | | | |
| Beverage Packaging Holdings | | | |
| EUR | 412,389 | | | Term Loan, 7.40%, Maturing May 11, 2015 | | $ | 389,828 | | |
| EUR | 412,389 | | | Term Loan, 7.65%, Maturing May 11, 2016 | | | 391,580 | | |
| Culligan International Co. | | | |
| EUR | 3,000,000 | | | Term Loan - Second Lien, 9.78%, Maturing
May 31, 2013 | | | 764,730 | | |
| Liberator Midco, Ltd. | | | |
| EUR | 875,000 | | | Term Loan, 6.75%, Maturing October 27, 2013 | | | 874,062 | | |
| EUR | 855,249 | | | Term Loan, 7.13%, Maturing October 27, 2014 | | | 854,332 | | |
| Van Houtte, Inc. | | | |
| | 1,738,000 | | | Term Loan, 6.26%, Maturing July 11, 2014 | | | 1,407,780 | | |
| | 237,000 | | | Term Loan, 6.26%, Maturing July 11, 2014 | | | 191,970 | | |
| | | | | | | $ | 4,874,282 | | |
| Brokers, Dealers and Investment Houses — 0.5% | | | |
| AmeriTrade Holding Corp. | | | |
| | 6,577,782 | | | Term Loan, 4.50%, Maturing December 31, 2012 | | $ | 5,500,670 | | |
| | | | | | | $ | 5,500,670 | | |
| Building and Development — 6.7% | | | |
| 401 North Wabash Venture, LLC | | | |
| | 3,760,708 | | | Term Loan, 4.95%, Maturing May 7, 2009(2) | | $ | 2,820,531 | | |
| AIMCO Properties, L.P. | | | |
| | 9,000,000 | | | Term Loan, 5.43%, Maturing March 23, 2011 | | | 7,785,000 | | |
| Banning Lewis Ranch Co., LLC | | | |
| | 5,250,000 | | | Term Loan, 4.68%, Maturing December 3, 2012(2) | | | 4,882,500 | | |
| Beacon Sales Acquisition, Inc. | | | |
| | 1,960,000 | | | Term Loan, 6.02%, Maturing September 30, 2013 | | | 1,470,000 | | |
| Brickman Group Holdings, Inc. | | | |
| | 4,457,125 | | | Term Loan, 5.12%, Maturing January 23, 2014 | | | 3,498,843 | | |
| Building Materials Corp. of America | | | |
| | 446,203 | | | Term Loan, 6.62%, Maturing February 22, 2014 | | | 311,450 | | |
| Capital Automotive (REIT) | | | |
| | 3,000,130 | | | Term Loan, 5.47%, Maturing December 16, 2010 | | | 1,911,083 | | |
| Epco/Fantome, LLC | | | |
| | 4,692,000 | | | Term Loan, 5.80%, Maturing November 23, 2010 | | | 4,410,480 | | |
| Financiere Daunou S.A. | | | |
| | 1,411,871 | | | Term Loan, 5.89%, Maturing May 31, 2015 | | | 510,627 | | |
| | 1,430,448 | | | Term Loan, 6.14%, Maturing February 28, 2016 | | | 517,346 | | |
| Forestar USA Real Estate Group, Inc. | | | |
| | 4,225,000 | | | Revolving Loan, 5.97%, Maturing December 1, 2010(2) | | | 3,971,500 | | |
| | 4,225,000 | | | Term Loan, 7.48%, Maturing December 1, 2010 | | | 4,140,500 | | |
| Hearthstone Housing Partners II, LLC | | | |
| | 5,976,667 | | | Revolving Loan, 5.92%, Maturing December 1, 2009(2) | | | 3,704,936 | | |
Principal
Amount* | |
Borrower/Tranche Description | |
Value | |
| Building and Development (continued) | | | |
| Hovstone Holdings, LLC | | | |
| | 2,205,000 | | | Term Loan, 6.75%, Maturing February 28, 2009 | | $ | 1,447,362 | | |
| LNR Property Corp. | | | |
| | 1,718,000 | | | Term Loan, 6.04%, Maturing July 3, 2011 | | | 940,605 | | |
| Materis | | | |
| EUR | 823,329 | | | Term Loan, 6.88%, Maturing April 27, 2014 | | | 663,204 | | |
| EUR | 876,671 | | | Term Loan, 7.25%, Maturing April 27, 2015 | | | 706,172 | | |
| Mueller Water Products, Inc. | | | |
| | 4,381,603 | | | Term Loan, 5.22%, Maturing May 24, 2014 | | | 3,373,834 | | |
| NCI Building Systems, Inc. | | | |
| | 2,183,847 | | | Term Loan, 5.42%, Maturing June 18, 2010 | | | 1,856,270 | | |
| Panolam Industries Holdings, Inc. | | | |
| | 2,103,590 | | | Term Loan, 6.51%, Maturing September 30, 2012 | | | 1,809,087 | | |
| Realogy Corp. | | | |
| | 4,193,277 | | | Term Loan, 6.50%, Maturing September 1, 2014 | | | 2,697,673 | | |
| | 1,128,961 | | | Term Loan, 6.93%, Maturing September 1, 2014 | | | 726,298 | | |
| South Edge, LLC | | | |
| | 4,475,000 | | | Term Loan, 6.25%, Maturing October 31, 2009(3) | | | 727,187 | | |
| TRU 2005 RE Holding Co. | | | |
| | 13,750,000 | | | Term Loan, 6.72%, Maturing December 9, 2008 | | | 10,048,954 | | |
| United Subcontractors, Inc. | | | |
| | 2,690,763 | | | Term Loan - Second Lien, 12.42%, Maturing
June 27, 2013(4) | | | 1,022,490 | | |
| WCI Communities, Inc. | | | |
| | 6,220,272 | | | Term Loan, 8.97%, Maturing December 23, 2010 | | | 4,644,472 | | |
| Wintergames Acquisition ULC | | | |
| | 5,479,074 | | | Term Loan, 10.74%, Maturing April 24, 2009 | | | 4,053,967 | | |
| | | | | | | $ | 74,652,371 | | |
| Business Equipment and Services — 9.1% | | | |
| Activant Solutions, Inc. | | | |
| | 2,157,538 | | | Term Loan, 6.07%, Maturing May 1, 2013 | | $ | 1,445,551 | | |
| Affiliated Computer Services | | | |
| | 1,935,070 | | | Term Loan, 5.26%, Maturing March 20, 2013 | | | 1,638,762 | | |
| | 6,402,625 | | | Term Loan, 5.81%, Maturing March 20, 2013 | | | 5,422,223 | | |
| Affinion Group, Inc. | | | |
| | 6,764,971 | | | Term Loan, 5.32%, Maturing October 17, 2012 | | | 5,395,064 | | |
| Allied Barton Security Service | | | |
| | 2,250,000 | | | Term Loan, 7.75%, Maturing February 21, 2015 | | | 2,008,125 | | |
| Education Management, LLC | | | |
| | 5,704,937 | | | Term Loan, 5.56%, Maturing June 1, 2013 | | | 4,021,980 | | |
| Info USA, Inc. | | | |
| | 1,945,350 | | | Term Loan, 5.77%, Maturing February 14, 2012 | | | 1,711,908 | | |
See notes to financial statements
20
Senior Debt Portfolio as of October 31, 2008
PORTFOLIO OF INVESTMENTS CONT'D
Principal
Amount* | |
Borrower/Tranche Description | |
Value | |
| Business Equipment and Services (continued) | | | |
| Intergraph Corp. | | | |
| | 837,381 | | | Term Loan, 4.81%, Maturing May 29, 2014 | | $ | 653,157 | | |
| | 2,000,000 | | | Term Loan - Second Lien, 8.81%, Maturing
November 29, 2014 | | | 1,555,000 | | |
| iPayment, Inc. | | | |
| | 2,864,809 | | | Term Loan, 5.70%, Maturing May 10, 2013 | | | 2,220,227 | | |
| ista International GmbH | | | |
| EUR | 3,545,609 | | | Term Loan, 7.12%, Maturing May 14, 2015 | | | 2,604,106 | | |
| EUR | 704,391 | | | Term Loan, 7.12%, Maturing May 14, 2015 | | | 517,347 | | |
| Kronos, Inc. | | | |
| | 2,622,455 | | | Term Loan, 6.01%, Maturing June 11, 2014 | | | 1,796,382 | | |
| Language Line, Inc. | | | |
| | 6,706,716 | | | Term Loan, 7.02%, Maturing June 11, 2011 | | | 5,667,175 | | |
| Mitchell International, Inc. | | | |
| | 1,000,000 | | | Term Loan - Second Lien, 9.06%, Maturing
March 28, 2015 | | | 810,000 | | |
| N.E.W. Holdings I, LLC | | | |
| | 4,735,414 | | | Term Loan, 5.89%, Maturing May 22, 2014 | | | 3,658,107 | | |
| Protection One, Inc. | | | |
| | 3,169,987 | | | Term Loan, 5.42%, Maturing March 31, 2012 | | | 2,567,690 | | |
| Quantum Corp. | | | |
| | 890,625 | | | Term Loan, 7.26%, Maturing July 12, 2014 | | | 774,844 | | |
| Quintiles Transnational Corp. | | | |
| | 5,655,000 | | | Term Loan, 5.77%, Maturing March 31, 2013 | | | 4,566,412 | | |
| RiskMetrics Group Holdings, LLC | | | |
| | 3,511,650 | | | Term Loan, 5.76%, Maturing January 11, 2014 | | | 3,142,927 | | |
| Sabre, Inc. | | | |
| | 12,884,245 | | | Term Loan, 5.25%, Maturing September 30, 2014 | | | 7,465,699 | | |
| Serena Software, Inc. | | | |
| | 1,540,000 | | | Term Loan, 5.50%, Maturing March 10, 2013 | | | 1,328,250 | | |
| Sitel (Client Logic) | | | |
| | 4,758,204 | | | Term Loan, 6.51%, Maturing January 29, 2014 | | | 2,854,922 | | |
| Solera Nederland Holdings | | | |
| | 2,608,274 | | | Term Loan, 4.57%, Maturing May 15, 2014 | | | 2,060,536 | | |
| SunGard Data Systems, Inc. | | | |
| | 20,133,009 | | | Term Loan, 4.55%, Maturing February 11, 2013 | | | 15,516,792 | | |
| | 1,700,000 | | | Term Loan, 6.75%, Maturing February 28, 2014 | | | 1,462,000 | | |
| TDS Investor Corp. | | | |
| | 3,950,000 | | | Term Loan, 5.37%, Maturing August 23, 2013 | | | 2,409,500 | | |
| | 4,957,361 | | | Term Loan, 6.01%, Maturing August 23, 2013 | | | 3,080,648 | | |
| | 994,697 | | | Term Loan, 6.01%, Maturing August 23, 2013 | | | 618,134 | | |
| EUR | 1,052,910 | | | Term Loan, 7.39%, Maturing August 23, 2013 | | | 845,451 | | |
| Transaction Network Services, Inc. | | | |
| | 1,842,259 | | | Term Loan, 4.80%, Maturing May 4, 2012 | | | 1,588,949 | | |
Principal
Amount* | |
Borrower/Tranche Description | |
Value | |
| Business Equipment and Services (continued) | | | |
| Valassis Communications, Inc. | | | |
| | 1,337,792 | | | Term Loan, 5.52%, Maturing March 2, 2014 | | $ | 940,913 | | |
| VWR International, Inc. | | | |
| | 3,400,000 | | | Term Loan, 5.67%, Maturing June 28, 2013 | | | 2,374,332 | | |
| West Corp. | | | |
| | 10,052,417 | | | Term Loan, 5.73%, Maturing October 24, 2013 | | | 6,508,940 | | |
| | | | | | | $ | 101,232,053 | | |
| Cable and Satellite Television — 8.3% | | | |
| Atlantic Broadband Finance, LLC | | | |
| | 5,427,488 | | | Term Loan, 6.02%, Maturing February 10, 2011 | | $ | 4,966,152 | | |
| Bresnan Broadband Holdings, LLC | | | |
| | 3,000,000 | | | Term Loan, 4.86%, Maturing March 29, 2014 | | | 2,379,999 | | |
| | 1,447,000 | | | Term Loan, 6.06%, Maturing March 29, 2014 | | | 1,147,953 | | |
| Casema | | | |
| EUR | 1,000,000 | | | Term Loan - Second Lien, 8.75%, Maturing May 14, 2016 | | | 966,533 | | |
| Cequel Communications, LLC | | | |
| | 12,021,414 | | | Term Loan, 6.21%, Maturing November 5, 2013 | | | 8,914,215 | | |
| | 1,000,000 | | | Term Loan - Second Lien, 7.30%, Maturing May 5, 2014 | | | 640,000 | | |
| Charter Communications Operating, Inc. | | | |
| | 20,720,147 | | | Term Loan, 5.31%, Maturing April 28, 2013 | | | 15,601,628 | | |
| CSC Holdings, Inc. | | | |
| | 9,360,000 | | | Term Loan, 4.57%, Maturing March 29, 2013 | | | 8,136,517 | | |
| DirectTV Holdings, LLC | | | |
| | 1,703,420 | | | Term Loan, 4.62%, Maturing April 13, 2013 | | | 1,515,570 | | |
| Foxco Acquisition Sub., LLC | | | |
| | 1,500,000 | | | Term Loan, 7.25%, Maturing July 2, 2015 | | | 1,185,000 | | |
| Insight Midwest Holdings, LLC | | | |
| | 7,838,125 | | | Term Loan, 5.93%, Maturing April 6, 2014 | | | 6,205,185 | | |
| Mediacom Broadband Group | | | |
| | 1,930,760 | | | Term Loan, 3.89%, Maturing January 31, 2015 | | | 1,404,628 | | |
| Mediacom Illinois, LLC | | | |
| | 2,775,000 | | | Term Loan, 2.12%, Maturing September 30, 2012 | | | 2,011,875 | | |
| | 4,920,872 | | | Term Loan, 3.64%, Maturing January 31, 2015 | | | 3,538,929 | | |
| NTL Investment Holdings, Ltd. | | | |
| | 3,295,583 | | | Term Loan, 5.83%, Maturing March 30, 2012 | | | 2,282,191 | | |
| GBP | 1,501,472 | | | Term Loan, 8.13%, Maturing March 30, 2012 | | | 1,620,083 | | |
| GBP | 763,460 | | | Term Loan, 8.13%, Maturing March 30, 2012 | | | 823,771 | | |
| GBP | 1,388,164 | | | Term Loan, 8.15%, Maturing March 30, 2012 | | | 1,497,825 | | |
| GBP | 1,187,641 | | | Term Loan, 8.15%, Maturing March 30, 2012 | | | 1,281,461 | | |
| GBP | 1,000,000 | | | Term Loan, 8.74%, Maturing March 30, 2013 | | | 960,246 | | |
| Orion Cable GmbH | | | |
| EUR | 872,189 | | | Term Loan, 7.69%, Maturing October 31, 2014 | | | 730,909 | | |
| EUR | 872,189 | | | Term Loan, 8.41%, Maturing October 31, 2015 | | | 730,909 | | |
See notes to financial statements
21
Senior Debt Portfolio as of October 31, 2008
PORTFOLIO OF INVESTMENTS CONT'D
Principal
Amount* | |
Borrower/Tranche Description | |
Value | |
| Cable and Satellite Television (continued) | | | |
| ProSiebenSat.1 Media AG | | | |
| EUR | 1,071,555 | | | Term Loan, 7.53%, Maturing March 2, 2015 | | $ | 341,438 | | |
| EUR | 219,923 | | | Term Loan, 6.85%, Maturing June 26, 2015 | | | 152,503 | | |
| EUR | 5,315,144 | | | Term Loan, 6.85%, Maturing June 26, 2015 | | | 3,685,709 | | |
| EUR | 1,071,555 | | | Term Loan, 7.78%, Maturing March 2, 2016 | | | 341,438 | | |
| San Juan Cable, LLC | | | |
| | 972,523 | | | Term Loan, 4.82%, Maturing October 31, 2012 | | | 656,453 | | |
| UPC Broadband Holding B.V. | | | |
| EUR | 14,151,329 | | | Term Loan, 7.01%, Maturing October 16, 2011 | | | 12,024,390 | | |
| | 2,456,905 | | | Term Loan, 5.47%, Maturing December 31, 2014 | | | 1,762,829 | | |
| YPSO Holding SA | | | |
| EUR | 3,969,097 | | | Term Loan, 7.00%, Maturing July 28, 2014 | | | 2,497,789 | | |
| EUR | 1,531,743 | | | Term Loan, 7.00%, Maturing July 28, 2014 | | | 963,940 | | |
| EUR | 2,499,160 | | | Term Loan, 7.00%, Maturing July 28, 2014 | | | 1,572,744 | | |
| | | | | | | $ | 92,540,812 | | |
| Chemicals and Plastics — 8.9% | | | |
| Arizona Chemicals, Inc. | | | |
| | 931,603 | | | Term Loan, 4.64%, Maturing February 28, 2013 | | $ | 654,451 | | |
| Brenntag Holding GmbH and Co. KG | | | |
| | 883,636 | | | Term Loan, 5.07%, Maturing December 23, 2013 | | | 614,127 | | |
| | 3,616,364 | | | Term Loan, 5.07%, Maturing December 23, 2013 | | | 2,513,373 | | |
| EUR | 2,117,647 | | | Term Loan, 7.14%, Maturing December 23, 2013 | | | 2,076,018 | | |
| EUR | 496,877 | | | Term Loan, 7.39%, Maturing December 23, 2014 | | | 487,109 | | |
| EUR | 385,476 | | | Term Loan, 7.39%, Maturing December 23, 2014 | | | 377,898 | | |
| | 1,000,000 | | | Term Loan - Second Lien, 7.79%, Maturing
December 23, 2015 | | | 645,000 | | |
| Celanese Holdings, LLC | | | |
| | 2,500,000 | | | Term Loan, 4.35%, Maturing April 2, 2014 | | | 2,032,142 | | |
| | 12,238,625 | | | Term Loan, 5.55%, Maturing April 2, 2014 | | | 9,948,252 | | |
| Cognis GmbH | | | |
| EUR | 2,510,246 | | | Term Loan, 6.96%, Maturing September 15, 2013 | | | 2,018,843 | | |
| EUR | 614,754 | | | Term Loan, 6.96%, Maturing September 15, 2013 | | | 494,410 | | |
| Columbian Chemicals Acquisition | | | |
| | 436,534 | | | Term Loan, 7.01%, Maturing March 16, 2013 | | | 288,112 | | |
| Ferro Corp. | | | |
| | 6,174,958 | | | Term Loan, 5.81%, Maturing June 6, 2012 | | | 5,619,212 | | |
| Foamex International, Inc. | | | |
| | 3,265,000 | | | Term Loan, 8.04%, Maturing February 12, 2013 | | | 1,510,063 | | |
| Georgia Gulf Corp. | | | |
| | 1,986,735 | | | Term Loan, 9.05%, Maturing October 3, 2013 | | | 1,591,375 | | |
| Hexion Specialty Chemicals, Inc. | | | |
| EUR | 744,216 | | | Term Loan, 7.39%, Maturing May 5, 2012 | | | 611,808 | | |
| | 2,556,876 | | | Term Loan, 6.06%, Maturing May 5, 2013 | | | 1,779,159 | | |
| | 11,770,445 | | | Term Loan, 6.19%, Maturing May 5, 2013 | | | 8,190,264 | | |
| | 3,950,000 | | | Term Loan, 6.06%, Maturing June 15, 2014 | | | 2,748,540 | | |
Principal
Amount* | |
Borrower/Tranche Description | |
Value | |
| Chemicals and Plastics (continued) | | | |
| INEOS Group | | | |
| EUR | 424,893 | | | Term Loan, Maturing December 14, 2011(5) | | $ | 563,498 | | |
| EUR | 75,107 | | | Term Loan, Maturing December 14, 2011(5) | | | 51,650 | | |
| EUR | 424,893 | | | Term Loan, Maturing December 14, 2011(5) | | | 563,498 | | |
| EUR | 75,107 | | | Term Loan, Maturing December 14, 2011(5) | | | 51,650 | | |
| EUR | 1,000,000 | | | Term Loan, 7.77%, Maturing December 14, 2011 | | | 416,368 | | |
| EUR | 1,000,000 | | | Term Loan, 8.27%, Maturing December 14, 2011 | | | 416,368 | | |
| | 1,997,243 | | | Term Loan, 5.93%, Maturing December 14, 2012 | | | 1,283,229 | | |
| | 2,201,402 | | | Term Loan, 5.95%, Maturing December 14, 2013 | | | 1,225,448 | | |
| | 2,133,286 | | | Term Loan, 5.38%, Maturing December 14, 2014 | | | 1,167,974 | | |
| Innophos, Inc. | | | |
| | 1,059,588 | | | Term Loan, 6.76%, Maturing August 10, 2010 | | | 911,246 | | |
| Invista B.V. | | | |
| | 6,764,875 | | | Term Loan, 4.92%, Maturing April 29, 2011 | | | 5,614,846 | | |
| | 1,964,115 | | | Term Loan, 4.92%, Maturing April 29, 2011 | | | 1,630,216 | | |
| ISP Chemco, Inc. | | | |
| | 6,702,575 | | | Term Loan, 5.06%, Maturing June 4, 2014 | | | 5,295,035 | | |
| Kleopatra | | | |
| | 3,347,500 | | | Term Loan, 6.82%, Maturing January 3, 2016 | | | 1,590,062 | | |
| EUR | 1,900,000 | | | Term Loan, 7.88%, Maturing January 3, 2016 | | | 1,241,093 | | |
| Kranton Polymers, LLC | | | |
| | 4,508,323 | | | Term Loan, 5.31%, Maturing May 12, 2013 | | | 3,486,435 | | |
| Lucite International Group Holdings | | | |
| | 1,773,304 | | | Term Loan, 5.37%, Maturing July 7, 2013 | | | 1,609,274 | | |
| | 627,929 | | | Term Loan, 5.37%, Maturing July 7, 2013 | | | 500,251 | | |
| MacDermid, Inc. | | | |
| EUR | 1,197,702 | | | Term Loan, 7.39%, Maturing April 12, 2014 | | | 1,060,939 | | |
| Millenium Inorganic Chemicals | | | |
| | 4,367,000 | | | Term Loan, 6.01%, Maturing April 30, 2014 | | | 2,816,715 | | |
| Momentive Performance Material | | | |
| | 5,080,186 | | | Term Loan, 5.38%, Maturing December 4, 2013 | | | 3,958,313 | | |
| Propex Fabrics, Inc. | | | |
| | 2,579,014 | | | Term Loan, 8.00%, Maturing July 31, 2012 | | | 780,152 | | |
| Rockwood Specialties Group, Inc. | | | |
| | 8,959,538 | | | Term Loan, 4.62%, Maturing December 10, 2012 | | | 7,503,613 | | |
| Schoeller Arca Systems Holding | | | |
| EUR | 886,834 | | | Term Loan, 8.40%, Maturing November 16, 2015 | | | 972,070 | | |
| EUR | 824,121 | | | Term Loan, 8.40%, Maturing November 16, 2015 | | | 903,329 | | |
| EUR | 289,045 | | | Term Loan, 8.40%, Maturing November 16, 2015 | | | 316,826 | | |
| Solo Cup Co. | | | |
| | 4,799,116 | | | Term Loan, 6.65%, Maturing February 27, 2011 | | | 4,171,233 | | |
| TPG Spring UK, Ltd. | | | |
| EUR | 2,288,006 | | | Term Loan, 7.87%, Maturing June 27, 2013 | | | 1,739,987 | | |
| EUR | 2,288,006 | | | Term Loan, 8.37%, Maturing June 27, 2013 | | | 1,739,987 | | |
See notes to financial statements
22
Senior Debt Portfolio as of October 31, 2008
PORTFOLIO OF INVESTMENTS CONT'D
Principal
Amount* | |
Borrower/Tranche Description | |
Value | |
| Chemicals and Plastics (continued) | | | |
| Wellman, Inc. | | | |
| | 3,301,774 | | | Term Loan, 6.74%, Maturing February 10, 2009(3) | | $ | 1,565,041 | | |
| | | | | | | $ | 99,346,502 | | |
| Clothing / Textiles — 0.7% | | | |
| Hanesbrands, Inc. | | | |
| | 2,643,504 | | | Term Loan, 5.26%, Maturing September 5, 2013 | | $ | 2,259,094 | | |
| | 2,025,000 | | | Term Loan - Second Lien, 7.27%, Maturing
March 5, 2014 | | | 1,586,249 | | |
| St. John Knits International, Inc. | | | |
| | 1,924,442 | | | Term Loan, 6.17%, Maturing March 23, 2012 | | | 1,606,909 | | |
| The William Carter Co. | | | |
| | 2,199,473 | | | Term Loan, 4.76%, Maturing July 14, 2012 | | | 1,853,056 | | |
| | | | | | | $ | 7,305,308 | | |
| Conglomerates — 3.1% | | | |
| Amsted Industries, Inc. | | | |
| | 1,604,238 | | | Term Loan, 6.56%, Maturing October 15, 2010 | | $ | 1,235,263 | | |
| Doncasters (Dunde HoldCo 4 Ltd.) | | | |
| | 1,416,569 | | | Term Loan, 4.85%, Maturing July 13, 2015 | | | 1,055,344 | | |
| | 1,416,569 | | | Term Loan, 5.35%, Maturing July 13, 2015 | | | 1,055,344 | | |
| GBP | 641,409 | | | Term Loan, 7.77%, Maturing July 13, 2015 | | | 763,866 | | |
| GBP | 641,409 | | | Term Loan, 8.27%, Maturing July 13, 2015 | | | 763,866 | | |
| Jarden Corp. | | | |
| | 5,456,685 | | | Term Loan, 5.51%, Maturing January 24, 2012 | | | 4,467,660 | | |
| | 1,287,561 | | | Term Loan, 5.51%, Maturing January 24, 2012 | | | 1,054,190 | | |
| | 1,975,003 | | | Term Loan, 6.26%, Maturing January 24, 2012 | | | 1,652,830 | | |
| Johnson Diversey, Inc. | | | |
| | 1,044,755 | | | Term Loan, 4.79%, Maturing December 16, 2010 | | | 830,580 | | |
| | 4,961,813 | | | Term Loan, 4.79%, Maturing December 16, 2011 | | | 3,944,642 | | |
| Polymer Group, Inc. | | | |
| | 2,000,000 | | | Revolving Loan, 5.00%, Maturing November 22, 2010(2) | | | 1,700,000 | | |
| | 5,747,552 | | | Term Loan, 5.73%, Maturing November 22, 2012 | | | 4,569,304 | | |
| RBS Global, Inc. | | | |
| | 1,078,808 | | | Term Loan, 5.76%, Maturing July 19, 2013 | | | 857,652 | | |
| | 3,877,869 | | | Term Loan, 6.37%, Maturing July 19, 2013 | | | 3,102,295 | | |
| RGIS Holdings, LLC | | | |
| | 5,595,833 | | | Term Loan, 5.46%, Maturing April 30, 2014 | | | 3,842,474 | | |
| | 279,792 | | | Term Loan, 5.62%, Maturing April 30, 2014 | | | 192,124 | | |
| The Manitowoc Company, Inc. | | | |
| | 2,800,000 | | | Term Loan, Maturing August 21, 2014(5) | | | 2,213,400 | | |
| US Investigations Services, Inc. | | | |
| | 1,979,950 | | | Term Loan, 5.95%, Maturing February 21, 2015 | | | 1,405,764 | | |
| | | | | | | $ | 34,706,598 | | |
Principal
Amount* | |
Borrower/Tranche Description | |
Value | |
| Containers and Glass Products — 5.1% | | | |
| Berry Plastics Corp. | | | |
| | 8,150,875 | | | Term Loan, 4.80%, Maturing April 3, 2015 | | $ | 6,001,082 | | |
| Consolidated Container Co. | | | |
| | 896,226 | | | Term Loan, 5.75%, Maturing March 28, 2014 | | | 545,204 | | |
| | 1,500,000 | | | Term Loan - Second Lien, 8.69%, Maturing
September 28, 2014 | | | 581,250 | | |
| Crown Americas, Inc. | | | |
| | 1,347,500 | | | Term Loan, 6.34%, Maturing November 15, 2012 | | | 1,185,800 | | |
| EUR | 980,000 | | | Term Loan, 6.87%, Maturing November 15, 2012 | | | 1,236,568 | | |
| Graham Packaging Holdings Co. | | | |
| | 12,891,032 | | | Term Loan, 5.74%, Maturing October 7, 2011 | | | 10,557,755 | | |
| Graphic Packaging International, Inc. | | | |
| | 11,148,239 | | | Term Loan, 5.75%, Maturing May 16, 2014 | | | 9,141,556 | | |
| | 1,970,906 | | | Term Loan, 6.86%, Maturing May 16, 2014 | | | 1,678,965 | | |
| JSG Acquisitions | | | |
| EUR | 5,500,000 | | | Term Loan, 6.96%, Maturing December 31, 2014 | | | 4,611,594 | | |
| EUR | 5,500,000 | | | Term Loan, 7.12%, Maturing December 31, 2014 | | | 4,611,594 | | |
| OI European Group B.V. | | | |
| EUR | 3,830,000 | | | Term Loan, 6.62%, Maturing June 14, 2013 | | | 4,015,056 | | |
| Owens-Brockway Glass Container | | | |
| | 4,787,500 | | | Term Loan, 6.09%, Maturing June 14, 2013 | | | 4,075,359 | | |
| Pregis Corp. | | | |
| EUR | 2,425,000 | | | Term Loan, 7.64%, Maturing October 12, 2012 | | | 2,472,627 | | |
| Smurfit-Stone Container Corp. | | | |
| | 4,342,995 | | | Term Loan, 4.88%, Maturing November 1, 2011 | | | 3,452,681 | | |
| | 2,016,115 | | | Term Loan, 4.90%, Maturing November 1, 2011 | | | 1,602,811 | | |
| | 1,986,462 | | | Term Loan, 5.93%, Maturing November 1, 2011 | | | 1,579,237 | | |
| | | | | | | $ | 57,349,139 | | |
| Cosmetics / Toiletries — 0.5% | | | |
| American Safety Razor Co. | | | |
| | 1,000,000 | | | Term Loan - Second Lien, 9.41%, Maturing July 31, 2014 | | $ | 835,000 | | |
| Bausch & Lomb, Inc. | | | |
| | 227,586 | | | Term Loan, 4.71%, Maturing April 30, 2015(2) | | | 184,724 | | |
| | 903,514 | | | Term Loan, 7.01%, Maturing April 30, 2015 | | | 733,353 | | |
| Prestige Brands, Inc. | | | |
| | 4,766,463 | | | Term Loan, 5.82%, Maturing April 7, 2011 | | | 3,837,003 | | |
| | | | | | | $ | 5,590,080 | | |
| Drugs — 1.4% | | | |
| Chattem, Inc. | | | |
| | 1,128,750 | | | Term Loan, 4.54%, Maturing January 2, 2013 | | $ | 965,081 | | |
| Graceway Pharmaceuticals, LLC | | | |
| | 5,306,479 | | | Term Loan, 6.51%, Maturing May 3, 2012 | | | 3,732,221 | | |
See notes to financial statements
23
Senior Debt Portfolio as of October 31, 2008
PORTFOLIO OF INVESTMENTS CONT'D
Principal
Amount* | |
Borrower/Tranche Description | |
Value | |
| Drugs (continued) | | | |
| Pharmaceutical Holdings Corp. | | | |
| | 1,387,314 | | | Term Loan, 6.51%, Maturing January 30, 2012 | | $ | 1,165,343 | | |
| Stiefel Laboratories, Inc. | | | |
| | 1,804,253 | | | Term Loan, 7.00%, Maturing December 28, 2013 | | | 1,470,466 | | |
| | 2,358,894 | | | Term Loan, 7.00%, Maturing December 28, 2013 | | | 1,922,499 | | |
| Warner Chilcott Corp. | | | |
| | 2,226,564 | | | Term Loan, 5.76%, Maturing January 18, 2012 | | | 1,840,255 | | |
| | 5,934,185 | | | Term Loan, 5.76%, Maturing January 18, 2012 | | | 4,904,604 | | |
| | | | | | | $ | 16,000,469 | | |
| Ecological Services and Equipment — 1.4% | | | |
| Allied Waste Industries, Inc. | | | |
| | 1,900,382 | | | Term Loan, 4.90%, Maturing January 15, 2012 | | $ | 1,818,033 | | |
| | 24,727 | | | Term Loan, 5.44%, Maturing January 15, 2012 | | | 23,655 | | |
| Blue Waste B.V. (AVR Acquisition) | | | |
| EUR | 4,000,000 | | | Term Loan, 7.21%, Maturing April 1, 2015 | | | 4,040,323 | | |
| Environmental Systems Products Holdings, Inc. | | | |
| | 233,025 | | | Term Loan - Second Lien, 13.74%, Maturing
December 12, 2010 | | | 168,151 | | |
| Kemble Water Structure, Ltd. | | | |
| GBP | 6,500,000 | | | Term Loan, 10.16%, Maturing October 13, 2013 | | | 7,270,239 | | |
| Sensus Metering Systems, Inc. | | | |
| | 3,060,888 | | | Term Loan, 5.20%, Maturing December 17, 2010 | | | 2,831,321 | | |
| | | | | | | $ | 16,151,722 | | |
| Electronics / Electrical — 2.5% | | | |
| Aspect Software, Inc. | | | |
| | 4,797,000 | | | Term Loan, 6.25%, Maturing July 11, 2011 | | $ | 3,885,570 | | |
| FCI International S.A.S. | | | |
| | 685,705 | | | Term Loan, 6.47%, Maturing November 1, 2013 | | | 555,421 | | |
| | 660,143 | | | Term Loan, 6.47%, Maturing November 1, 2013 | | | 534,716 | | |
| | 660,143 | | | Term Loan, 6.47%, Maturing November 1, 2013 | | | 534,716 | | |
| | 685,705 | | | Term Loan, 6.47%, Maturing November 1, 2013 | | | 555,421 | | |
| Freescale Semiconductor, Inc. | | | |
| | 2,589,562 | | | Term Loan, 5.47%, Maturing December 1, 2013 | | | 1,771,693 | | |
| Infor Enterprise Solutions Holdings | | | |
| | 7,953,400 | | | Term Loan, 7.52%, Maturing July 28, 2012 | | | 5,030,525 | | |
| | 4,149,600 | | | Term Loan, 7.52%, Maturing July 28, 2012 | | | 2,624,622 | | |
| EUR | 1,965,000 | | | Term Loan, 8.14%, Maturing July 28, 2012 | | | 1,559,045 | | |
| | 500,000 | | | Term Loan - Second Lien, 9.26%, Maturing
March 2, 2014 | | | 160,000 | | |
| Network Solutions, LLC | | | |
| | 2,254,504 | | | Term Loan, 5.95%, Maturing March 7, 2014 | | | 1,296,340 | | |
Principal
Amount* | |
Borrower/Tranche Description | |
Value | |
| Electronics / Electrical (continued) | | | |
| Open Solutions, Inc. | | | |
| | 5,492,353 | | | Term Loan, 5.96%, Maturing January 23, 2014 | | $ | 3,020,794 | | |
| Sensata Technologies Finance Co. | | | |
| | 2,394,875 | | | Term Loan, 5.26%, Maturing April 27, 2013 | | | 1,547,089 | | |
| Spectrum Brands, Inc. | | | |
| | 48,479 | | | Term Loan, 4.70%, Maturing March 30, 2013 | | | 33,269 | | |
| | 946,752 | | | Term Loan, 7.58%, Maturing March 30, 2013 | | | 649,708 | | |
| VeriFone, Inc. | | | |
| | 231,250 | | | Term Loan, 5.87%, Maturing October 31, 2013 | | | 196,562 | | |
| Vertafore, Inc. | | | |
| | 4,876,213 | | | Term Loan, 5.31%, Maturing January 31, 2012 | | | 3,961,923 | | |
| | | | | | | $ | 27,917,414 | | |
| Equipment Leasing — 0.3% | | | |
| The Hertz Corp. | | | |
| | 4,320,414 | | | Term Loan, 4.55%, Maturing December 21, 2012 | | $ | 3,135,385 | | |
| | 785,140 | | | Term Loan, 4.70%, Maturing December 21, 2012 | | | 569,787 | | |
| | | | | | | $ | 3,705,172 | | |
| Farming / Agriculture — 0.4% | | | |
| BF Bolthouse HoldCo, LLC | | | |
| | 1,993,625 | | | Term Loan, 6.19%, Maturing December 16, 2012 | | $ | 1,669,661 | | |
| | 1,000,000 | | | Term Loan - Second Lien, 9.26%, Maturing
December 16, 2013 | | | 760,000 | | |
| Central Garden & Pet Co. | | | |
| | 3,670,838 | | | Term Loan, 4.74%, Maturing February 28, 2014 | | | 2,468,639 | | |
| | | | | | | $ | 4,898,300 | | |
| Financial Intermediaries — 1.9% | | | |
| Citco III, Ltd. | | | |
| | 5,261,313 | | | Term Loan, 5.13%, Maturing June 30, 2014 | | $ | 4,261,664 | | |
| E.A. Viner International Co. | | | |
| | 251,150 | | | Term Loan, 6.77%, Maturing July 31, 2013 | | | 236,081 | | |
| Grosvenor Capital Management | | | |
| | 1,449,911 | | | Term Loan, 5.59%, Maturing December 5, 2013 | | | 1,159,929 | | |
| INVESTools, Inc. | | | |
| | 1,386,667 | | | Term Loan, 6.25%, Maturing August 13, 2012 | | | 1,261,867 | | |
| Jupiter Asset Management Group | | | |
| GBP | 1,364,884 | | | Term Loan, 7.89%, Maturing June 30, 2015 | | | 1,658,415 | | |
| LPL Holdings, Inc. | | | |
| | 11,726,401 | | | Term Loan, 5.51%, Maturing December 18, 2014 | | | 9,381,121 | | |
| Nuveen Investments, Inc. | | | |
| | 1,393,000 | | | Term Loan, 6.35%, Maturing November 2, 2014 | | | 803,297 | | |
See notes to financial statements
24
Senior Debt Portfolio as of October 31, 2008
PORTFOLIO OF INVESTMENTS CONT'D
Principal
Amount* | |
Borrower/Tranche Description | |
Value | |
| Financial Intermediaries (continued) | | | |
| Oxford Acquisition III, Ltd. | | | |
| | 2,979,595 | | | Term Loan, 5.58%, Maturing May 24, 2014 | | $ | 1,882,112 | | |
| RJO Holdings Corp. (RJ O'Brien) | | | |
| | 1,509,750 | | | Term Loan, 6.00%, Maturing July 31, 2014(4) | | | 1,087,020 | | |
| | | | | | | $ | 21,731,506 | | |
| Food Products — 3.7% | | | |
| Advantage Sales & Marketing, Inc. | | | |
| | 6,478,238 | | | Term Loan, 5.20%, Maturing March 29, 2013 | | $ | 4,550,962 | | |
| American Seafoods Group, LLC | | | |
| | 1,939,260 | | | Term Loan, 5.51%, Maturing September 30, 2012 | | | 1,716,245 | | |
| B&G Foods, Inc. | | | |
| | 1,130,435 | | | Term Loan, 4.81%, Maturing February 23, 2013 | | | 926,957 | | |
| BL Marketing, Ltd. | | | |
| GBP | 1,500,000 | | | Term Loan, 8.04%, Maturing December 31, 2013 | | | 1,774,308 | | |
| Black Lion Beverages III B.V. | | | |
| EUR | 1,000,000 | | | Term Loan, 7.61%, Maturing December 31, 2013 | | | 880,714 | | |
| EUR | 961,151 | | | Term Loan, 8.00%, Maturing December 31, 2014 | | | 846,499 | | |
| Dean Foods Co. | | | |
| | 12,090,875 | | | Term Loan, 5.26%, Maturing April 2, 2014 | | | 9,109,725 | | |
| Dole Food Company, Inc. | | | |
| | 525,581 | | | Term Loan, 4.69%, Maturing April 12, 2013 | | | 385,208 | | |
| | 931,548 | | | Term Loan, 5.28%, Maturing April 12, 2013 | | | 682,747 | | |
| | 3,843,314 | | | Term Loan, 5.93%, Maturing April 12, 2013 | | | 2,816,830 | | |
| Pinnacle Foods Finance, LLC | | | |
| | 3,000,000 | | | Revolving Loan, 5.27%, Maturing April 2, 2013(2) | | | 1,950,000 | | |
| | 12,062,213 | | | Term Loan, 6.76%, Maturing April 2, 2014 | | | 8,757,166 | | |
| Reddy Ice Group, Inc. | | | |
| | 7,975,000 | | | Term Loan, 6.50%, Maturing August 9, 2012 | | | 5,961,312 | | |
| Ruby Acquisitions, Ltd. | | | |
| GBP | 770,085 | | | Term Loan, 8.84%, Maturing January 5, 2015 | | | 960,486 | | |
| | | | | | | $ | 41,319,159 | | |
| Food Service — 2.2% | | | |
| AFC Enterprises, Inc. | | | |
| | 1,057,594 | | | Term Loan, 6.06%, Maturing May 23, 2009 | | $ | 835,499 | | |
| Aramark Corp. | | | |
| | 301,080 | | | Term Loan, 4.94%, Maturing January 26, 2014 | | | 252,832 | | |
| | 4,868,574 | | | Term Loan, 5.64%, Maturing January 26, 2014 | | | 4,088,385 | | |
| Buffets, Inc. | | | |
| | 1,311,437 | | | Term Loan, 10.42%, Maturing January 22, 2009 | | | 406,545 | | |
| | 130,656 | | | Term Loan, 10.42%, Maturing January 22, 2009 | | | 40,503 | | |
| | 2,217,101 | | | DIP Loan, 12.25%, Maturing January 22, 2009 | | | 2,228,186 | | |
| | 405,539 | | | Term Loan, 10.97%, Maturing May 1, 2013 | | | 119,634 | | |
| | 2,727,903 | | | Term Loan, 10.42%, Maturing November 1, 2013 | | | 804,731 | | |
Principal
Amount* | |
Borrower/Tranche Description | |
Value | |
| Food Service (continued) | | | |
| CBRL Group, Inc. | | | |
| | 4,475,603 | | | Term Loan, 4.30%, Maturing April 27, 2013 | | $ | 3,438,753 | | |
| JRD Holdings, Inc. | | | |
| | 2,082,813 | | | Term Loan, 5.75%, Maturing June 26, 2014 | | | 1,582,938 | | |
| Maine Beverage Co., LLC | | | |
| | 1,714,286 | | | Term Loan, 5.63%, Maturing June 30, 2010 | | | 1,560,000 | | |
| NPC International, Inc. | | | |
| | 1,965,030 | | | Term Loan, 5.40%, Maturing May 3, 2013 | | | 1,434,472 | | |
| OSI Restaurant Partners, LLC | | | |
| | 197,368 | | | Term Loan, 5.28%, Maturing May 9, 2013 | | | 103,783 | | |
| | 2,316,767 | | | Term Loan, 5.25%, Maturing May 9, 2014 | | | 1,218,232 | | |
| QCE Finance, LLC | | | |
| | 4,210,618 | | | Term Loan, 5.81%, Maturing May 5, 2013 | | | 2,779,008 | | |
| Sagittarius Restaurants, LLC | | | |
| | 1,144,004 | | | Term Loan, 9.50%, Maturing March 29, 2013 | | | 554,842 | | |
| Selecta | | | |
| GBP | 2,500,000 | | | Term Loan, 8.55%, Maturing June 28, 2015 | | | 2,695,661 | | |
| | | | | | | $ | 24,144,004 | | |
| Food / Drug Retailers — 2.3% | | | |
| General Nutrition Centers, Inc. | | | |
| | 4,538,443 | | | Term Loan, 6.14%, Maturing September 16, 2013 | | $ | 3,146,653 | | |
| Pantry, Inc. (The) | | | |
| | 2,726,597 | | | Term Loan, 4.87%, Maturing May 15, 2014 | | | 1,935,884 | | |
| | 784,944 | | | Term Loan, 4.87%, Maturing May 15, 2014 | | | 557,311 | | |
| Rite Aid Corp. | | | |
| | 12,736,000 | | | Term Loan, 5.01%, Maturing June 1, 2014 | | | 9,456,480 | | |
| | 2,475,000 | | | Term Loan, 6.00%, Maturing June 4, 2014 | | | 1,955,250 | | |
| Roundy's Supermarkets, Inc. | | | |
| | 10,879,404 | | | Term Loan, 5.38%, Maturing November 3, 2011 | | | 8,839,515 | | |
| | | | | | | $ | 25,891,093 | | |
| Forest Products — 2.1% | | | |
| Appleton Papers, Inc. | | | |
| | 4,394,375 | | | Term Loan, 5.38%, Maturing June 5, 2014 | | $ | 3,537,472 | | |
| Georgia-Pacific Corp. | | | |
| | 10,521,784 | | | Term Loan, 4.65%, Maturing December 20, 2012 | | | 8,765,235 | | |
| | 8,421,454 | | | Term Loan, 5.37%, Maturing December 20, 2012 | | | 7,015,542 | | |
| Newpage Corp. | | | |
| | 2,868,275 | | | Term Loan, 7.00%, Maturing December 5, 2014 | | | 2,341,743 | | |
| Xerium Technologies, Inc. | | | |
| | 2,918,112 | | | Term Loan, 9.26%, Maturing May 18, 2012 | | | 2,159,403 | | |
| | | | | | | $ | 23,819,395 | | |
See notes to financial statements
25
Senior Debt Portfolio as of October 31, 2008
PORTFOLIO OF INVESTMENTS CONT'D
Principal
Amount* | |
Borrower/Tranche Description | |
Value | |
| Healthcare — 10.8% | | | |
| Accellent, Inc. | | | |
| | 2,664,797 | | | Term Loan, 5.31%, Maturing November 22, 2012 | | $ | 1,838,710 | | |
| Advanced Medical Optics, Inc. | | | |
| | 990,155 | | | Term Loan, 4.76%, Maturing April 2, 2014 | | | 720,338 | | |
| Alliance Imaging, Inc. | | | |
| | 1,821,086 | | | Term Loan, 5.78%, Maturing December 29, 2011 | | | 1,584,345 | | |
| American Medical Systems | | | |
| | 3,236,768 | | | Term Loan, 5.44%, Maturing July 20, 2012 | | | 2,783,621 | | |
| AMN Healthcare, Inc. | | | |
| | 917,416 | | | Term Loan, 5.51%, Maturing November 2, 2011 | | | 798,152 | | |
| AMR HoldCo, Inc. | | | |
| | 1,785,862 | | | Term Loan, 4.82%, Maturing February 10, 2012 | | | 1,589,417 | | |
| Biomet, Inc. | | | |
| | 4,430,250 | | | Term Loan, 6.76%, Maturing December 26, 2014 | | | 3,866,501 | | |
| EUR | 4,059,000 | | | Term Loan, 8.14%, Maturing December 26, 2014 | | | 4,436,189 | | |
| Capio AB | | | |
| EUR | 339,606 | | | Term Loan, 7.16%, Maturing April 24, 2015 | | | 330,261 | | |
| EUR | 408,268 | | | Term Loan, 7.16%, Maturing April 24, 2015 | | | 397,033 | | |
| EUR | 339,606 | | | Term Loan, 7.29%, Maturing April 16, 2016 | | | 330,261 | | |
| EUR | 304,490 | | | Term Loan, 7.29%, Maturing April 24, 2016 | | | 296,111 | | |
| Cardinal Health 409, Inc. | | | |
| | 5,999,063 | | | Term Loan, 6.01%, Maturing April 10, 2014 | | | 3,884,393 | | |
| Carestream Health, Inc. | | | |
| | 5,555,960 | | | Term Loan, 5.43%, Maturing April 30, 2013 | | | 3,657,672 | | |
| Carl Zeiss Vision Holding GmbH | | | |
| | 3,700,889 | | | Term Loan, 5.62%, Maturing March 23, 2015 | | | 2,115,676 | | |
| Community Health Systems, Inc. | | | |
| | 362,914 | | | Term Loan, 0.00%, Maturing July 25, 2014(2) | | | 291,737 | | |
| | 7,089,206 | | | Term Loan, 5.16%, Maturing July 25, 2014 | | | 5,698,836 | | |
| Concentra, Inc. | | | |
| | 2,172,500 | | | Term Loan, 6.02%, Maturing June 25, 2014 | | | 1,466,438 | | |
| ConMed Corp. | | | |
| | 1,039,478 | | | Term Loan, 4.67%, Maturing April 13, 2013 | | | 852,372 | | |
| CRC Health Corp. | | | |
| | 1,372,000 | | | Term Loan, 6.01%, Maturing February 6, 2013 | | | 946,680 | | |
| | 3,476,317 | | | Term Loan, 6.01%, Maturing February 6, 2013 | | | 2,398,659 | | |
| Dako (Eqt Project Delphi) | | | |
| EUR | 1,336,866 | | | Term Loan, 7.13%, Maturing June 12, 2015 | | | 945,666 | | |
| DaVita, Inc. | | | |
| | 10,807,224 | | | Term Loan, 4.67%, Maturing October 5, 2012 | | | 9,417,728 | | |
| Gambro Holding AB | | | |
| | 1,292,918 | | | Term Loan, 5.62%, Maturing June 5, 2014 | | | 818,848 | | |
| | 1,292,918 | | | Term Loan, 6.12%, Maturing June 5, 2015 | | | 818,848 | | |
Principal
Amount* | |
Borrower/Tranche Description | |
Value | |
| Healthcare (continued) | | | |
| HCA, Inc. | | | |
| | 21,413,236 | | | Term Loan, 6.01%, Maturing November 18, 2013 | | $ | 17,724,806 | | |
| Health Management Association, Inc. | | | |
| | 9,249,940 | | | Term Loan, 5.51%, Maturing February 28, 2014 | | | 6,521,208 | | |
| HealthSouth Corp. | | | |
| | 2,606,066 | | | Term Loan, 5.50%, Maturing March 10, 2013 | | | 2,165,568 | | |
| Iasis Healthcare, LLC | | | |
| | 259,141 | | | Term Loan, 4.58%, Maturing March 14, 2014 | | | 209,905 | | |
| | 969,351 | | | Term Loan, 5.12%, Maturing March 14, 2014 | | | 785,174 | | |
| | 2,801,417 | | | Term Loan, 5.12%, Maturing March 14, 2014 | | | 2,269,148 | | |
| IM U.S. Holdings, LLC | | | |
| | 3,875,938 | | | Term Loan, 5.16%, Maturing June 26, 2014 | | | 2,861,733 | | |
| Invacare Corp. | | | |
| | 2,318,400 | | | Term Loan, 5.60%, Maturing February 12, 2013 | | | 1,982,232 | | |
| inVentiv Health, Inc. | | | |
| | 2,149,904 | | | Term Loan, 5.52%, Maturing July 6, 2014 | | | 1,676,925 | | |
| Leiner Health Products, Inc. | | | |
| | 319,417 | | | Term Loan, 8.75%, Maturing May 27, 2011(3) | | | 303,446 | | |
| LifePoint Hospitals, Inc. | | | |
| | 6,327,801 | | | Term Loan, 4.44%, Maturing April 15, 2012 | | | 5,335,127 | | |
| MultiPlan Merger Corp. | | | |
| | 1,535,833 | | | Term Loan, 5.63%, Maturing April 12, 2013 | | | 1,209,469 | | |
| | 1,215,529 | | | Term Loan, 5.63%, Maturing April 12, 2013 | | | 957,229 | | |
| National Mentor Holdings, Inc. | | | |
| | 190,400 | | | Term Loan, 4.94%, Maturing June 29, 2013 | | | 160,888 | | |
| | 3,137,384 | | | Term Loan, 5.77%, Maturing June 29, 2013 | | | 2,651,089 | | |
| Nyco Holdings | | | |
| EUR | 3,828,603 | | | Term Loan, 7.42%, Maturing December 29, 2014 | | | 2,668,611 | | |
| EUR | 3,828,603 | | | Term Loan, 8.17%, Maturing December 29, 2015 | | | 2,668,611 | | |
| RadNet Management, Inc. | | | |
| | 1,621,135 | | | Term Loan, 7.06%, Maturing November 15, 2012 | | | 1,296,908 | | |
| ReAble Therapeutics Finance, LLC | | | |
| | 4,501,702 | | | Term Loan, 5.76%, Maturing November 16, 2013 | | | 3,398,785 | | |
| Select Medical Holdings Corp. | | | |
| | 6,077,388 | | | Term Loan, 4.91%, Maturing February 24, 2012 | | | 4,679,589 | | |
| Sunrise Medical Holdings, Inc. | | | |
| | 1,994,553 | | | Term Loan, 7.90%, Maturing May 13, 2010 | | | 1,529,424 | | |
| Vanguard Health Holding Co., LLC | | | |
| | 5,829,020 | | | Term Loan, 5.74%, Maturing September 23, 2011 | | | 4,976,526 | | |
| Viant Holdings, Inc. | | | |
| | 733,163 | | | Term Loan, 6.02%, Maturing June 25, 2014 | | | 436,232 | | |
| | | | | | | $ | 120,753,125 | | |
See notes to financial statements
26
Senior Debt Portfolio as of October 31, 2008
PORTFOLIO OF INVESTMENTS CONT'D
Principal
Amount* | |
Borrower/Tranche Description | |
Value | |
| Home Furnishings — 1.8% | | | |
| Hunter Fan Co. | | | |
| | 1,415,093 | | | Term Loan, 5.31%, Maturing April 16, 2014 | | $ | 792,452 | | |
| Interline Brands, Inc. | | | |
| | 2,762,500 | | | Term Loan, 4.75%, Maturing June 23, 2013 | | | 2,127,125 | | |
| | 1,913,043 | | | Term Loan, 4.75%, Maturing June 23, 2013 | | | 1,473,043 | | |
| National Bedding Co., LLC | | | |
| | 1,853,265 | | | Term Loan, 5.35%, Maturing August 31, 2011 | | | 1,227,788 | | |
| Oreck Corp. | | | |
| | 1,246,972 | | | Term Loan, 5.61%, Maturing February 2, 2012(4) | | | 487,566 | | |
| Sanitec, Ltd. Oy | | | |
| EUR | 2,943,828 | | | Term Loan, 8.38%, Maturing April 7, 2013 | | | 2,141,797 | | |
| EUR | 2,943,828 | | | Term Loan, 8.88%, Maturing April 7, 2014 | | | 2,154,307 | | |
| Sealy Mattress Co. | | | |
| | 3,470,343 | | | Term Loan, 4.62%, Maturing August 25, 2012 | | | 2,637,461 | | |
| Simmons Co. | | | |
| | 8,777,717 | | | Term Loan, 5.44%, Maturing December 19, 2011 | | | 6,232,179 | | |
| | 2,000,000 | | | Term Loan, 8.35%, Maturing February 15, 2012 | | | 355,000 | | |
| | | | | | | $ | 19,628,718 | | |
| Industrial Equipment — 2.5% | | | |
| CEVA Group PLC U.S. | | | |
| | 3,467,944 | | | Term Loan, 6.75%, Maturing January 4, 2014 | | $ | 2,783,025 | | |
| | 413,158 | | | Term Loan, 6.76%, Maturing January 4, 2014 | | | 331,559 | | |
| EUR | 261,808 | | | Term Loan, 7.53%, Maturing January 4, 2014 | | | 267,784 | | |
| EUR | 444,580 | | | Term Loan, 7.53%, Maturing January 4, 2014 | | | 454,728 | | |
| EUR | 546,391 | | | Term Loan, 7.53%, Maturing January 4, 2014 | | | 558,863 | | |
| EUR | 435,446 | | | Term Loan, 8.14%, Maturing January 4, 2014 | | | 445,386 | | |
| EPD Holdings (Goodyear Engineering Products) | | | |
| | 455,930 | | | Term Loan, 5.50%, Maturing July 13, 2014 | | | 330,549 | | |
| | 3,183,469 | | | Term Loan, 5.50%, Maturing July 13, 2014 | | | 2,308,015 | | |
| | 1,000,000 | | | Term Loan - Second Lien, 8.75%, Maturing
July 13, 2015 | | | 580,000 | | |
| Generac Acquisition Corp. | | | |
| | 3,744,892 | | | Term Loan, 6.65%, Maturing November 7, 2013 | | | 2,365,525 | | |
| | 2,000,000 | | | Term Loan - Second Lien, 10.15%, Maturing
April 7, 2014 | | | 650,000 | | |
| Gleason Corp. | | | |
| | 590,855 | | | Term Loan, 5.22%, Maturing June 30, 2013 | | | 505,181 | | |
| | 1,748,933 | | | Term Loan, 5.22%, Maturing June 30, 2013 | | | 1,495,338 | | |
| Jason, Inc. | | | |
| | 1,455,881 | | | Term Loan, 5.50%, Maturing April 30, 2010 | | | 1,135,588 | | |
| John Maneely Co. | | | |
| | 5,524,574 | | | Term Loan, 7.66%, Maturing December 8, 2013 | | | 4,074,373 | | |
| KION Group GmbH | | | |
| | 750,000 | | | Term Loan, 5.12%, Maturing December 23, 2014 | | | 465,750 | | |
| | 750,000 | | | Term Loan, 5.62%, Maturing December 23, 2015 | | | 465,750 | | |
Principal
Amount* | |
Borrower/Tranche Description | |
Value | |
| Industrial Equipment (continued) | | | |
| Polypore, Inc. | | | |
| | 8,393,750 | | | Term Loan, 5.39%, Maturing July 3, 2014 | | $ | 6,547,125 | | |
| EUR | 733,710 | | | Term Loan, 6.81%, Maturing July 3, 2014 | | | 762,147 | | |
| TFS Acquisition Corp. | | | |
| | 1,935,500 | | | Term Loan, 7.26%, Maturing August 11, 2013 | | | 1,800,015 | | |
| | | | | | | $ | 28,326,701 | | |
| Insurance — 2.0% | | | |
| Alliant Holdings I, Inc. | | | |
| | 5,000,000 | | | Term Loan, 5.37%, Maturing August 21, 2012(2) | | $ | 3,450,000 | | |
| | 2,702,500 | | | Term Loan, 6.76%, Maturing August 21, 2014 | | | 1,864,725 | | |
| CCC Information Services Group, Inc. | | | |
| | 1,984,889 | | | Term Loan, 6.02%, Maturing February 10, 2013 | | | 1,597,836 | | |
| Conseco, Inc. | | | |
| | 9,441,327 | | | Term Loan, 5.00%, Maturing October 10, 2013 | | | 6,254,879 | | |
| Crump Group, Inc. | | | |
| | 2,752,911 | | | Term Loan, 6.71%, Maturing August 4, 2014 | | | 2,050,918 | | |
| Getty Images, Inc. | | | |
| | 3,800,000 | | | Term Loan, 8.05%, Maturing July 2, 2015 | | | 3,459,900 | | |
| Hub International Holdings, Inc. | | | |
| | 503,209 | | | Term Loan, 6.26%, Maturing June 13, 2014 | | | 347,214 | | |
| | 2,238,817 | | | Term Loan, 6.26%, Maturing June 13, 2014 | | | 1,544,784 | | |
| U.S.I. Holdings Corp. | | | |
| | 2,740,312 | | | Term Loan, 6.52%, Maturing May 4, 2014 | | | 1,993,577 | | |
| | | | | | | $ | 22,563,833 | | |
| Leisure Goods / Activities / Movies — 7.0% | | | |
| 24 Hour Fitness Worldwide, Inc. | | | |
| | 1,758,420 | | | Term Loan, 6.18%, Maturing June 8, 2012 | | $ | 1,310,023 | | |
| AMC Entertainment, Inc. | | | |
| | 5,051,542 | | | Term Loan, 5.01%, Maturing January 26, 2013 | | | 3,873,901 | | |
| Bombardier Recreational Products | | | |
| | 5,650,633 | | | Term Loan, 6.16%, Maturing June 28, 2013 | | | 3,913,063 | | |
| Carmike Cinemas, Inc. | | | |
| | 2,179,040 | | | Term Loan, 6.31%, Maturing May 19, 2012 | | | 1,748,680 | | |
| | 2,369,490 | | | Term Loan, 6.47%, Maturing May 19, 2012 | | | 1,901,516 | | |
| Cedar Fair, L.P. | | | |
| | 4,846,784 | | | Term Loan, 5.12%, Maturing August 30, 2012 | | | 3,562,386 | | |
| Cinemark, Inc. | | | |
| | 9,439,545 | | | Term Loan, 4.64%, Maturing October 5, 2013 | | | 7,236,987 | | |
| Deluxe Entertainment Services | | | |
| | 1,847,464 | | | Term Loan, 5.67%, Maturing January 28, 2011 | | | 1,477,971 | | |
| | 178,127 | | | Term Loan, 6.01%, Maturing January 28, 2011 | | | 142,501 | | |
| | 96,457 | | | Term Loan, 6.01%, Maturing January 28, 2011 | | | 77,165 | | |
See notes to financial statements
27
Senior Debt Portfolio as of October 31, 2008
PORTFOLIO OF INVESTMENTS CONT'D
Principal
Amount* | |
Borrower/Tranche Description | |
Value | |
| Leisure Goods / Activities / Movies (continued) | | | |
| DW Funding, LLC | | | |
| | 1,901,101 | | | Term Loan, 5.93%, Maturing April 30, 2011 | | $ | 1,663,463 | | |
| Easton-Bell Sports, Inc. | | | |
| | 1,473,552 | | | Term Loan, 5.29%, Maturing March 16, 2012 | | | 1,167,790 | | |
| Fender Musical Instruments Corp. | | | |
| | 618,800 | | | Term Loan, 5.17%, Maturing June 9, 2014 | | | 386,750 | | |
| | 312,533 | | | Term Loan, 6.02%, Maturing June 9, 2014 | | | 195,333 | | |
| Metro-Goldwyn-Mayer Holdings, Inc. | | | |
| | 19,911,919 | | | Term Loan, 7.01%, Maturing April 8, 2012 | | | 10,067,964 | | |
| National CineMedia, LLC | | | |
| | 2,700,000 | | | Term Loan, 4.57%, Maturing February 13, 2015 | | | 1,881,001 | | |
| Regal Cinemas Corp. | | | |
| | 11,497,456 | | | Term Loan, 5.26%, Maturing November 10, 2010 | | | 8,693,353 | | |
| Revolution Studios Distribution Co., LLC | | | |
| | 3,757,725 | | | Term Loan, 6.87%, Maturing December 21, 2014 | | | 3,118,911 | | |
| | 2,825,000 | | | Term Loan, 10.12%, Maturing June 21, 2015 | | | 2,005,750 | | |
| Six Flags Theme Parks, Inc. | | | |
| | 7,185,633 | | | Term Loan, 5.69%, Maturing April 30, 2015 | | | 4,706,590 | | |
| Southwest Sports Group, LLC | | | |
| | 3,725,000 | | | Term Loan, 6.31%, Maturing December 22, 2010 | | | 2,886,875 | | |
| Universal City Development Partners, Ltd. | | | |
| | 6,256,073 | | | Term Loan, 6.68%, Maturing June 9, 2011 | | | 5,380,223 | | |
| WMG Acquisition Corp. | | | |
| | 2,850,000 | | | Revolving Loan, 0.00%, Maturing
February 28, 2010(2) | | | 2,401,125 | | |
| | 10,456,067 | | | Term Loan, 5.06%, Maturing February 28, 2011 | | | 8,469,414 | | |
| | | | | | | $ | 78,268,735 | | |
| Lodging and Casinos — 3.8% | | | |
| Ameristar Casinos, Inc. | | | |
| | 3,525,313 | | | Term Loan, 5.77%, Maturing November 10, 2012 | | $ | 2,027,055 | | |
| Choctaw Resort Development Enterprise | | | |
| | 1,147,826 | | | Term Loan, 5.51%, Maturing November 4, 2011 | | | 964,174 | | |
| Full Moon Holdco 3 Ltd. | | | |
| GBP | 500,000 | | | Term Loan, 8.38%, Maturing November 20, 2014 | | | 577,354 | | |
| GBP | 500,000 | | | Term Loan, 8.88%, Maturing November 20, 2015 | | | 577,354 | | |
| Gala Electric Casinos, Ltd. | | | |
| GBP | 2,417,776 | | | Term Loan, 7.83%, Maturing December 12, 2013 | | | 2,133,002 | | |
| GBP | 2,418,085 | | | Term Loan, 8.33%, Maturing December 12, 2014 | | | 2,133,275 | | |
| Green Valley Ranch Gaming, LLC | | | |
| | 1,636,398 | | | Term Loan, 5.00%, Maturing February 16, 2014 | | | 818,199 | | |
| Harrah's Operating Co. | | | |
| | 995,000 | | | Term Loan, 6.54%, Maturing January 28, 2015 | | | 684,753 | | |
| Herbst Gaming, Inc. | | | |
| | 2,438,458 | | | Term Loan, 10.50%, Maturing December 2, 2011 | | | 1,353,344 | | |
| | 4,662,507 | | | Term Loan, 10.50%, Maturing December 2, 2011 | | | 2,587,691 | | |
Principal
Amount* | |
Borrower/Tranche Description | |
Value | |
| Lodging and Casinos (continued) | | | |
| Isle of Capri Casinos, Inc. | | | |
| | 4,472,794 | | | Term Loan, 5.51%, Maturing November 30, 2013 | | $ | 3,034,044 | | |
| | 1,348,633 | | | Term Loan, 5.51%, Maturing November 30, 2013 | | | 914,822 | | |
| | 1,789,117 | | | Term Loan, 5.51%, Maturing November 30, 2013 | | | 1,213,617 | | |
| LodgeNet Entertainment Corp. | | | |
| | 2,671,625 | | | Term Loan, 5.77%, Maturing April 4, 2014 | | | 1,562,901 | | |
| New World Gaming Partners, Ltd. | | | |
| | 3,329,010 | | | Term Loan, 6.26%, Maturing June 30, 2014 | | | 1,664,505 | | |
| | 670,833 | | | Term Loan, 6.55%, Maturing June 30, 2014 | | | 335,417 | | |
| Penn National Gaming, Inc. | | | |
| | 13,402,514 | | | Term Loan, 5.01%, Maturing October 3, 2012 | | | 11,205,990 | | |
| Venetian Casino Resort/Las Vegas Sands, Inc. | | | |
| | 11,297,000 | | | Term Loan, 5.52%, Maturing May 23, 2014 | | | 6,498,599 | | |
| | 2,852,850 | | | Term Loan, 5.52%, Maturing May 14, 2014 | | | 1,641,102 | | |
| Wimar OpCo, LLC | | | |
| | 2,151,576 | | | Term Loan, 7.25%, Maturing January 3, 2012 | | | 998,691 | | |
| | | | | | | $ | 42,925,889 | | |
| Nonferrous Metals / Minerals — 1.3% | | | |
| Alpha Natural Resources, LLC | | | |
| | 2,727,563 | | | Term Loan, 5.56%, Maturing October 26, 2012 | | $ | 2,526,405 | | |
| Euramax Europe B.V. | | | |
| EUR | 1,338,317 | | | Term Loan, 10.12%, Maturing June 29, 2012 | | | 852,876 | | |
| Euramax International, Inc. | | | |
| | 2,042,016 | | | Term Loan, 8.00%, Maturing June 28, 2012 | | | 1,055,042 | | |
| Murray Energy Corp. | | | |
| | 1,524,700 | | | Term Loan, 6.94%, Maturing January 28, 2010 | | | 1,326,489 | | |
| Noranda Aluminum Acquisition | | | |
| | 1,219,695 | | | Term Loan, 4.81%, Maturing May 18, 2014 | | | 975,756 | | |
| Novelis, Inc. | | | |
| | 1,950,305 | | | Term Loan, 5.77%, Maturing June 28, 2014 | | | 1,392,518 | | |
| | 4,290,670 | | | Term Loan, 5.77%, Maturing June 28, 2014 | | | 3,063,539 | | |
| Oxbow Carbon and Mineral Holdings | | | |
| | 377,768 | | | Term Loan, 5.76%, Maturing May 8, 2014 | | | 273,882 | | |
| | 4,219,678 | | | Term Loan, 5.76%, Maturing May 8, 2014 | | | 3,059,267 | | |
| | | | | | | $ | 14,525,774 | | |
| Oil and Gas — 2.3% | | | |
| Atlas Pipeline Partners, L.P. | | | |
| | 4,600,000 | | | Term Loan, 5.68%, Maturing July 20, 2014 | | $ | 3,783,500 | | |
| Big West Oil, LLC | | | |
| | 1,333,750 | | | Term Loan, 5.25%, Maturing May 1, 2014 | | | 900,281 | | |
| | 1,060,938 | | | Term Loan, 5.25%, Maturing May 1, 2014 | | | 716,133 | | |
See notes to financial statements
28
Senior Debt Portfolio as of October 31, 2008
PORTFOLIO OF INVESTMENTS CONT'D
Principal
Amount* | |
Borrower/Tranche Description | |
Value | |
| Oil and Gas (continued) | | | |
| Dresser, Inc. | | | |
| | 4,713,888 | | | Term Loan, 5.07%, Maturing May 4, 2014 | | $ | 3,430,829 | | |
| Dynegy Holdings, Inc. | | | |
| | 4,382,979 | | | Term Loan, 4.62%, Maturing April 2, 2013 | | | 3,247,055 | | |
| | 759,351 | | | Term Loan, 4.62%, Maturing April 2, 2013 | | | 562,552 | | |
| Energy Transfer Equity, L.P. | | | |
| | 2,825,000 | | | Term Loan, 4.55%, Maturing February 8, 2012 | | | 2,329,213 | | |
| Enterprise GP Holdings, L.P. | | | |
| | 3,325,000 | | | Term Loan, 6.68%, Maturing October 31, 2014 | | | 2,809,625 | | |
| Hercules Offshore, Inc. | | | |
| | 2,271,250 | | | Term Loan, 5.64%, Maturing July 6, 2013 | | | 1,550,128 | | |
| Targa Resources, Inc. | | | |
| | 1,225,740 | | | Term Loan, 5.14%, Maturing October 31, 2012 | | | 936,465 | | |
| | 3,213,684 | | | Term Loan, 5.97%, Maturing October 31, 2012 | | | 2,455,254 | | |
| Volnay Acquisition Co. | | | |
| | 3,206,750 | | | Term Loan, 5.15%, Maturing January 12, 2014 | | | 2,597,468 | | |
| | | | | | | $ | 25,318,503 | | |
| Publishing — 10.4% | | | |
| American Media Operations, Inc. | | | |
| | 11,723,227 | | | Term Loan, 7.56%, Maturing January 31, 2013 | | $ | 7,883,870 | | |
| Aster Zweite Beteiligungs GmbH | | | |
| | 2,475,000 | | | Term Loan, 6.13%, Maturing September 27, 2013 | | | 1,553,063 | | |
| Black Press US Partnership | | | |
| | 645,006 | | | Term Loan, 4.81%, Maturing August 2, 2013 | | | 422,479 | | |
| | 1,062,363 | | | Term Loan, 4.81%, Maturing August 2, 2013 | | | 695,848 | | |
| CanWest MediaWorks, Ltd. | | | |
| | 2,666,250 | | | Term Loan, 4.81%, Maturing July 10, 2014 | | | 1,906,369 | | |
| Dex Media West, LLC | | | |
| | 6,210,000 | | | Term Loan, 7.54%, Maturing October 24, 2014 | | | 3,458,970 | | |
| GateHouse Media Operating, Inc. | | | |
| | 4,838,043 | | | Term Loan, 4.81%, Maturing August 28, 2014 | | | 1,193,386 | | |
| | 2,061,957 | | | Term Loan, 4.98%, Maturing August 28, 2014 | | | 508,617 | | |
| | 4,225,000 | | | Term Loan, 5.07%, Maturing August 28, 2014 | | | 1,954,063 | | |
| Idearc, Inc. | | | |
| | 24,459,536 | | | Term Loan, 5.74%, Maturing November 17, 2014 | | | 10,558,375 | | |
| MediaNews Group, Inc. | | | |
| | 2,169,185 | | | Term Loan, 5.82%, Maturing August 25, 2010 | | | 1,193,052 | | |
| | 2,186,694 | | | Term Loan, 7.07%, Maturing August 2, 2013 | | | 1,148,014 | | |
| Mediannuaire Holding | | | |
| EUR | 3,100,000 | | | Term Loan, 6.62%, Maturing October 24, 2013 | | | 2,156,173 | | |
| EUR | 484,408 | | | Term Loan, 7.38%, Maturing October 10, 2014 | | | 275,258 | | |
| EUR | 484,408 | | | Term Loan, 7.88%, Maturing October 10, 2015 | | | 275,258 | | |
| Merrill Communications, LLC | | | |
| | 5,594,858 | | | Term Loan, 5.98%, Maturing February 9, 2009 | | | 3,636,658 | | |
Principal
Amount* | |
Borrower/Tranche Description | |
Value | |
| Publishing (continued) | | | |
| Nebraska Book Co., Inc. | | | |
| | 3,933,965 | | | Term Loan, 6.38%, Maturing March 4, 2011 | | $ | 2,871,794 | | |
| Nelson Education, Ltd. | | | |
| | 1,534,500 | | | Term Loan, 6.26%, Maturing July 5, 2014 | | | 1,265,963 | | |
| Newspaper Holdings, Inc. | | | |
| | 8,925,000 | | | Term Loan, 4.38%, Maturing July 24, 2014 | | | 6,247,500 | | |
| Nielsen Finance, LLC | | | |
| | 16,448,372 | | | Term Loan, 4.80%, Maturing August 9, 2013 | | | 11,990,863 | | |
| Penton Media, Inc. | | | |
| | 1,773,000 | | | Term Loan, 5.66%, Maturing February 1, 2013 | | | 984,015 | | |
| Philadelphia Newspapers, LLC | | | |
| | 2,171,434 | | | Term Loan, 7.25%, Maturing June 29, 2013 | | | 651,430 | | |
| R.H. Donnelley Corp. | | | |
| | 8,891,467 | | | Term Loan, 6.85%, Maturing June 30, 2010 | | | 5,647,931 | | |
| Reader's Digest Association, Inc. (The) | | | |
| | 4,750,000 | | | Revolving Loan, 4.50%, Maturing March 2, 2013(2) | | | 2,873,750 | | |
| | 13,176,670 | | | Term Loan, 5.23%, Maturing March 2, 2014 | | | 6,720,102 | | |
| Seat Pagine Gialle SpA | | | |
| EUR | 5,419,677 | | | Term Loan, 4.61%, Maturing May 25, 2012 | | | 4,724,832 | | |
| Source Interlink Companies, Inc. | | | |
| | 1,989,924 | | | Term Loan, 6.47%, Maturing August 1, 2014 | | | 1,343,199 | | |
| Source Media, Inc. | | | |
| | 2,020,155 | | | Term Loan, 8.77%, Maturing November 8, 2011 | | | 1,363,605 | | |
| Springer Science+Business Media | | | |
| | 945,117 | | | Term Loan, 6.14%, Maturing May 5, 2011 | | | 663,945 | | |
| | 1,023,877 | | | Term Loan, 6.51%, Maturing May 5, 2012 | | | 719,273 | | |
| | 945,117 | | | Term Loan, 6.51%, Maturing May 5, 2012 | | | 663,945 | | |
| Star Tribune Co. (The) | | | |
| | 1,629,375 | | | Term Loan, 5.05%, Maturing March 5, 2014(3) | | | 517,327 | | |
| TL Acquisitions, Inc. | | | |
| | 2,112,538 | | | Term Loan, 5.62%, Maturing July 5, 2014 | | | 1,585,578 | | |
| Trader Media Corp. | | | |
| GBP | 6,321,250 | | | Term Loan, 8.26%, Maturing March 23, 2015 | | | 5,264,581 | | |
| Tribune Co. | | | |
| | 2,984,229 | | | Term Loan, 7.08%, Maturing May 17, 2009 | | | 2,348,588 | | |
| | 1,943,408 | | | Term Loan, 6.00%, Maturing May 17, 2014 | | | 872,590 | | |
| | 4,450,398 | | | Term Loan, 6.50%, Maturing May 17, 2014 | | | 1,646,647 | | |
| World Directories Acquisition | | | |
| EUR | 3,510,703 | | | Term Loan, 6.72%, Maturing May 31, 2014 | | | 2,729,486 | | |
| Xsys, Inc. | | | |
| | 3,795,776 | | | Term Loan, 6.13%, Maturing September 27, 2013 | | | 2,381,849 | | |
| | 3,877,093 | | | Term Loan, 6.13%, Maturing September 27, 2014 | | | 2,432,876 | | |
| EUR | 1,546,742 | | | Term Loan, 7.54%, Maturing September 27, 2014 | | | 1,251,839 | | |
| | 1,290,100 | | | Term Loan - Second Lien, 7.38%, Maturing
September 27, 2015 | | | 541,842 | | |
See notes to financial statements
29
Senior Debt Portfolio as of October 31, 2008
PORTFOLIO OF INVESTMENTS CONT'D
Principal
Amount* | |
Borrower/Tranche Description | |
Value | |
| Publishing (continued) | | | |
| YBR Acquisition BV | | | |
| EUR | 750,000 | | | Term Loan, 7.01%, Maturing June 30, 2013 | | $ | 736,053 | | |
| EUR | 1,500,000 | | | Term Loan, 7.01%, Maturing June 30, 2013 | | | 1,472,105 | | |
| EUR | 750,000 | | | Term Loan, 7.51%, Maturing June 30, 2014 | | | 737,115 | | |
| EUR | 1,500,000 | | | Term Loan, 7.51%, Maturing June 30, 2014 | | | 1,474,229 | | |
| Yell Group, PLC | | | |
| | 4,850,000 | | | Term Loan, 6.12%, Maturing February 10, 2013 | | | 3,346,500 | | |
| | | | | | | $ | 116,890,805 | | |
| Radio and Television — 6.2% | | | |
| Block Communications, Inc. | | | |
| | 1,796,684 | | | Term Loan, 5.27%, Maturing December 22, 2011 | | $ | 1,446,331 | | |
| Citadel Broadcasting Corp. | | | |
| | 11,850,000 | | | Term Loan, 5.07%, Maturing June 12, 2014 | | | 6,458,250 | | |
| CMP Susquehanna Corp. | | | |
| | 4,143,857 | | | Term Loan, 5.17%, Maturing May 5, 2013 | | | 1,864,736 | | |
| Discovery Communications, Inc. | | | |
| | 2,987,026 | | | Term Loan, 5.76%, Maturing April 30, 2014 | | | 2,476,245 | | |
| Emmis Operating Co. | | | |
| | 2,213,145 | | | Term Loan, 5.54%, Maturing November 2, 2013 | | | 1,272,558 | | |
| Gray Television, Inc. | | | |
| | 3,512,396 | | | Term Loan, 5.04%, Maturing January 19, 2015 | | | 2,002,066 | | |
| LBI Media, Inc. | | | |
| | 1,950,000 | | | Term Loan, 4.62%, Maturing March 31, 2012 | | | 1,228,500 | | |
| NEP II, Inc. | | | |
| | 2,142,355 | | | Term Loan, 6.01%, Maturing February 16, 2014 | | | 1,574,631 | | |
| Nexstar Broadcasting, Inc. | | | |
| | 4,502,783 | | | Term Loan, 5.51%, Maturing October 1, 2012 | | | 3,129,434 | | |
| | 4,261,057 | | | Term Loan, 5.51%, Maturing October 1, 2012 | | | 2,961,434 | | |
| NextMedia Operating, Inc. | | | |
| | 565,359 | | | Term Loan, 7.26%, Maturing November 15, 2012 | | | 387,271 | | |
| | 251,266 | | | Term Loan, 8.28%, Maturing November 15, 2012 | | | 172,118 | | |
| PanAmSat Corp. | | | |
| | 2,458,662 | | | Term Loan, 6.65%, Maturing January 3, 2014 | | | 2,040,690 | | |
| | 2,457,919 | | | Term Loan, 6.65%, Maturing January 3, 2014 | | | 2,040,073 | | |
| | 2,457,919 | | | Term Loan, 6.65%, Maturing January 3, 2014 | | | 2,040,073 | | |
| Paxson Communications Corp. | | | |
| | 8,300,000 | | | Term Loan, 8.00%, Maturing January 15, 2012 | | | 4,606,500 | | |
| Raycom TV Broadcasting, LLC | | | |
| | 7,850,000 | | | Term Loan, 3.69%, Maturing June 25, 2014 | | | 6,476,250 | | |
| SFX Entertainment | | | |
| | 3,587,503 | | | Term Loan, 7.02%, Maturing June 21, 2013 | | | 2,887,940 | | |
| Spanish Broadcasting System, Inc. | | | |
| | 6,127,750 | | | Term Loan, 5.52%, Maturing June 10, 2012 | | | 2,841,744 | | |
Principal
Amount* | |
Borrower/Tranche Description | |
Value | |
| Radio and Television (continued) | | | |
| Tyrol Acquisition 2 SAS | | | |
| EUR | 2,800,000 | | | Term Loan, 6.50%, Maturing January 19, 2015 | | $ | 2,176,931 | | |
| EUR | 2,800,000 | | | Term Loan, 7.40%, Maturing January 19, 2016 | | | 2,176,931 | | |
| EUR | 1,250,000 | | | Term Loan - Second Lien, 7.75%, Maturing
July 19, 2016 | | | 716,934 | | |
| Univision Communications, Inc. | | | |
| | 3,003,300 | | | Term Loan - Second Lien, 5.50%, Maturing
March 29, 2009 | | | 2,635,396 | | |
| | 21,150,000 | | | Term Loan, 5.25%, Maturing September 29, 2014 | | | 11,495,025 | | |
| Young Broadcasting, Inc. | | | |
| | 3,516,863 | | | Term Loan, 6.30%, Maturing November 3, 2012 | | | 2,325,525 | | |
| | | | | | | $ | 69,433,586 | | |
| Rail Industries — 0.8% | | | |
| Kansas City Southern Railway Co. | | | |
| | 5,160,801 | | | Term Loan, 5.21%, Maturing April 26, 2013 | | $ | 4,464,093 | | |
| Rail America, Inc. | | | |
| | 311,600 | | | Term Loan, 7.88%, Maturing August 14, 2009 | | | 278,882 | | |
| | 4,813,400 | | | Term Loan, 7.88%, Maturing August 13, 2010 | | | 4,307,993 | | |
| | | | | | | $ | 9,050,968 | | |
| Retailers (Except Food and Drug) — 2.6% | | | |
| American Achievement Corp. | | | |
| | 1,056,462 | | | Term Loan, 5.07%, Maturing March 25, 2011 | | $ | 950,816 | | |
| Amscan Holdings, Inc. | | | |
| | 1,576,000 | | | Term Loan, 5.41%, Maturing May 25, 2013 | | | 1,182,000 | | |
| Claire's Stores, Inc. | | | |
| | 1,160,313 | | | Term Loan, 5.85%, Maturing May 24, 2014 | | | 575,805 | | |
| Cumberland Farms, Inc. | | | |
| | 4,145,302 | | | Term Loan, 5.26%, Maturing September 29, 2013 | | | 3,419,874 | | |
| Harbor Freight Tools USA, Inc. | | | |
| | 4,941,826 | | | Term Loan, 5.43%, Maturing July 15, 2010 | | | 3,558,115 | | |
| Josten's Corp. | | | |
| | 2,392,586 | | | Term Loan, 5.17%, Maturing October 4, 2011 | | | 1,994,819 | | |
| Mapco Express, Inc. | | | |
| | 755,157 | | | Term Loan, 5.93%, Maturing April 28, 2011 | | | 471,973 | | |
| Orbitz Worldwide, Inc. | | | |
| | 3,885,750 | | | Term Loan, 6.39%, Maturing July 25, 2014 | | | 2,496,594 | | |
| Oriental Trading Co., Inc. | | | |
| | 1,000,000 | | | Term Loan - Second Lien, 9.12%, Maturing
January 31, 2013 | | | 416,667 | | |
| | 5,628,137 | | | Term Loan, 5.25%, Maturing July 31, 2013 | | | 3,454,269 | | |
| Rent-A-Center, Inc. | | | |
| | 2,582,943 | | | Term Loan, 4.95%, Maturing November 15, 2012 | | | 2,092,184 | | |
See notes to financial statements
30
Senior Debt Portfolio as of October 31, 2008
PORTFOLIO OF INVESTMENTS CONT'D
Principal
Amount* | |
Borrower/Tranche Description | |
Value | |
| Retailers (Except Food and Drug) (continued) | | | |
| Rover Acquisition Corp. | | | |
| | 2,954,887 | | | Term Loan, 5.84%, Maturing October 26, 2013 | | $ | 2,225,030 | | |
| Savers, Inc. | | | |
| | 1,029,746 | | | Term Loan, 6.25%, Maturing August 11, 2012 | | | 813,499 | | |
| | 1,126,534 | | | Term Loan, 6.25%, Maturing August 11, 2012 | | | 889,962 | | |
| The Yankee Candle Company, Inc. | | | |
| | 2,331,255 | | | Term Loan, 5.76%, Maturing February 6, 2014 | | | 1,573,597 | | |
| Vivarte | | | |
| EUR | 2,500,000 | | | Term Loan, 7.20%, Maturing May 29, 2015 | | | 1,388,348 | | |
| EUR | 2,500,000 | | | Term Loan, 7.70%, Maturing May 29, 2016 | | | 1,388,348 | | |
| | | | | | | $ | 28,891,900 | | |
| Steel — 0.1% | | | |
| Algoma Acquisition Corp. | | | |
| | 1,821,837 | | | Term Loan, 6.00%, Maturing June 20, 2013 | | $ | 1,475,688 | | |
| | | | | | | $ | 1,475,688 | | |
| Surface Transport — 0.4% | | | |
| Delphi Acquisition Holding, Inc. | | | |
| | 1,000,000 | | | Term Loan, 6.01%, Maturing April 10, 2015 | | $ | 615,000 | | |
| | 1,000,000 | | | Term Loan, 6.64%, Maturing April 10, 2016 | | | 615,000 | | |
| Ozburn-Hessey Holding Co., LLC | | | |
| | 1,281,857 | | | Term Loan, 6.61%, Maturing August 9, 2012 | | | 1,147,262 | | |
| Swift Transportation Co., Inc. | | | |
| | 4,323,256 | | | Term Loan, 6.06%, Maturing May 10, 2014 | | | 2,507,488 | | |
| | | | | | | $ | 4,884,750 | | |
| Telecommunications — 4.1% | | | |
| Alaska Communications Systems Holdings, Inc. | | | |
| | 5,568,982 | | | Term Loan, 5.51%, Maturing February 1, 2012 | | $ | 4,557,282 | | |
| Alltell Communication | | | |
| | 994,975 | | | Term Loan, 5.32%, Maturing May 16, 2014 | | | 949,704 | | |
| | 1,591,237 | | | Term Loan, 5.50%, Maturing May 16, 2015 | | | 1,523,113 | | |
| Asurion Corp. | | | |
| | 8,525,000 | | | Term Loan, 6.06%, Maturing July 13, 2012 | | | 6,379,539 | | |
| | 1,000,000 | | | Term Loan - Second Lien, 10.84%, Maturing
January 13, 2013 | | | 673,333 | | |
| Cellular South, Inc. | | | |
| | 1,143,750 | | | Term Loan, 4.75%, Maturing May 29, 2014 | | | 966,469 | | |
| | 3,388,359 | | | Term Loan, 5.08%, Maturing May 29, 2014 | | | 2,863,164 | | |
| Centennial Cellular Operating Co., LLC | | | |
| | 9,175,000 | | | Term Loan, 5.64%, Maturing February 9, 2011 | | | 7,890,500 | | |
| CommScope, Inc. | | | |
| | 3,153,180 | | | Term Loan, 6.10%, Maturing November 19, 2014 | | | 2,427,948 | | |
Principal
Amount* | |
Borrower/Tranche Description | |
Value | |
| Telecommunications (continued) | | | |
| FairPoint Communications, Inc. | | | |
| | 2,000,000 | | | Term Loan, 5.75%, Maturing March 31, 2015 | | $ | 1,412,500 | | |
| Intelsat Subsidiary Holding Co. | | | |
| | 2,694,386 | | | Term Loan, 6.65%, Maturing July 3, 2013 | | | 2,232,972 | | |
| IPC Systems, Inc. | | | |
| | 3,555,000 | | | Term Loan, 6.01%, Maturing May 31, 2014 | | | 1,839,713 | | |
| GBP | 1,876,250 | | | Term Loan, 8.56%, Maturing May 31, 2014 | | | 1,509,771 | | |
| Macquarie UK Broadcast Ventures, Ltd. | | | |
| GBP | 2,508,196 | | | Term Loan, 7.67%, Maturing December 26, 2014 | | | 3,163,658 | | |
| NTelos, Inc. | | | |
| | 2,203,528 | | | Term Loan, 5.37%, Maturing August 24, 2011 | | | 1,896,869 | | |
| Palm, Inc. | | | |
| | 2,301,750 | | | Term Loan, 7.27%, Maturing April 24, 2014 | | | 1,288,980 | | |
| Stratos Global Corp. | | | |
| | 2,623,653 | | | Term Loan, 6.26%, Maturing February 13, 2012 | | | 2,164,514 | | |
| Telesat Canada, Inc. | | | |
| | 1,984,008 | | | Term Loan, 6.34%, Maturing October 22, 2014 | | | 1,519,419 | | |
| | 170,399 | | | Term Loan, 6.59%, Maturing October 22, 2014 | | | 130,497 | | |
| | | | | | | $ | 45,389,945 | | |
| Utilities — 2.5% | | | |
| AEI Finance Holding, LLC | | | |
| | 636,381 | | | Revolving Loan, 5.66%, Maturing March 30, 2012 | | $ | 423,194 | | |
| | 4,319,465 | | | Term Loan, 6.76%, Maturing March 30, 2014 | | | 2,872,444 | | |
| BRSP, LLC | | | |
| | 5,233,016 | | | Term Loan, 5.86%, Maturing July 13, 2009 | | | 3,738,467 | | |
| Covanta Energy Corp. | | | |
| | 999,509 | | | Term Loan, 3.95%, Maturing February 9, 2014 | | | 832,924 | | |
| | 1,999,799 | | | Term Loan, 4.63%, Maturing February 9, 2014 | | | 1,666,498 | | |
| Electricinvest Holding Co. | | | |
| EUR | 595,770 | | | Term Loan, 8.94%, Maturing October 24, 2012 | | | 601,776 | | |
| GBP | 600,000 | | | Term Loan, 10.10%, Maturing October 24, 2012 | | | 765,246 | | |
| NRG Energy, Inc. | | | |
| | 4,364,395 | | | Term Loan, 5.26%, Maturing June 1, 2014 | | | 3,800,659 | | |
| | 8,877,458 | | | Term Loan, 5.26%, Maturing June 1, 2014 | | | 7,730,784 | | |
| TXU Texas Competitive Electric Holdings Co., LLC | | | |
| | 1,475,000 | | | Term Loan, 6.44%, Maturing October 10, 2014 | | | 1,151,606 | | |
| | 1,475,000 | | | Term Loan, 6.66%, Maturing October 10, 2014 | | | 1,157,055 | | |
| Vulcan Energy Corp. | | | |
| | 4,072,323 | | | Term Loan, 6.25%, Maturing July 23, 2010 | | | 3,563,283 | | |
| | | | | | | $ | 28,303,936 | | |
Total Senior Floating-Rate Interests
(identified cost $2,022,667,121) | | $ | 1,426,253,411 | | |
See notes to financial statements
31
Senior Debt Portfolio as of October 31, 2008
PORTFOLIO OF INVESTMENTS CONT'D
| Corporate Bonds & Notes — 0.8% | | | |
Principal
Amount
(000's omitted) | | Security | | Value | |
| Building and Development — 0.4% | | | |
| Grohe Holding GMBH, Variable Rate | | | |
| EUR | 6,500 | | | 8.193%, 1/15/14 | | $ | 4,597,939 | | |
| | | | | | | $ | 4,597,939 | | |
| Commercial Services — 0.1% | | | |
| Environmental System Products Holdings, Inc., Jr. Notes (PIK) | | | |
| | 673 | | | 18.00%, 3/31/15(4) | | $ | 53,840 | | |
| | | | | | | $ | 53,840 | | |
| Electronics / Electrical — 0.1% | | | |
| NXP BV/NXP Funding, LLC, Variable Rate | | | |
| | 2,300 | | | 7.503%, 10/15/13 | | $ | 1,020,625 | | |
| | | | | | | $ | 1,020,625 | | |
| Telecommunications — 0.2% | | | |
| Qwest Corp., Sr. Notes, Variable Rate | | | |
| | 3,150 | | | 6.069%, 6/15/13 | | $ | 2,299,500 | | |
| | | | | | | $ | 2,299,500 | | |
Total Corporate Bonds & Notes
(identified cost $13,867,903) | | $ | 7,971,904 | | |
| Asset Backed Securities — 0.3% | | | |
Principal
Amount
(000's omitted) | | Security | | Value | |
| $ | 2,570 | | | Assemblies of God Financial Real Estate,
Series 2004-1A, Class A, 4.826%, 6/15/29(6)(7) | | $ | 2,230,355 | | |
| | 1,000 | | | Carlyle High Yield Partners, Series 2004-6A, Class C,
5.253%, 8/11/16(6)(7) | | | 409,600 | | |
Total Asset Backed Securities
(identified cost $3,570,422) | | $ | 2,639,955 | | |
| Common Stocks — 0.0% | | | |
| Shares | | Security | | Value | |
| Automotive — 0.0% | | | |
| | 133,410 | | | Hayes Lemmerz International(8) | | $ | 177,435 | | |
| | | | | | | $ | 177,435 | | |
| Shares | | Security | | Value | |
| Commercial Services — 0.0% | | | |
| | 1,242 | | | Environmental Systems Products Holdings, Inc.(4)(8)(9) | | $ | 0 | | |
| | | | | | | $ | 0 | | |
| Diversified Manufacturing — 0.0% | | | |
| | 1,782 | | | Gentek, Inc.(8) | | $ | 32,076 | | |
| | | | | | | $ | 32,076 | | |
| Investment Services — 0.0% | | | |
| | 20,048 | | | Safelite Realty Corp.(4)(9) | | $ | 0 | | |
| | | | | | | $ | 0 | | |
Total Common Stocks
(identified cost $1,334,100) | | $ | 209,511 | | |
| Preferred Stocks — 0.0% | | | |
| Shares | | Security | | Value | |
| Automotive — 0.0% | | | |
| | 445 | | | Hayes Lemmerz International(8)(9) | | $ | 3,298 | | |
| | 218 | | | Key Plastics, LLC, Series A(4)(9) | | | 0 | | |
| | | | | | | $ | 3,298 | | |
| Commercial Services — 0.0% | | | |
| | 569 | | | Environmental Systems Products Holdings,
Series A(4)(8)(9) | | $ | 13,070 | | |
| | | | | | | $ | 13,070 | | |
Total Preferred Stocks
(identified cost $250,407) | | $ | 16,368 | | |
| Warrants — 0.0% | | | |
| Shares | | Security | | Value | |
| Commercial Services — 0.0% | | | |
| | 4,437 | | | Citation A14 Expires 4/06/12(4)(8) | | $ | 0 | | |
| | 6,545 | | | Citation B18 Expires 4/06/12(4)(8) | | | 0 | | |
| | | | | | | $ | 0 | | |
See notes to financial statements
32
Senior Debt Portfolio as of October 31, 2008
PORTFOLIO OF INVESTMENTS CONT'D
| Shares | | Security | | Value | |
| Diversified Manufacturing — 0.0% | | | |
| | 1,930 | | | Gentek, Inc., Class B Expires 10/31/08(8)(9) | | $ | 579 | | |
| | 940 | | | Gentek, Inc., Class C Expires 10/31/10(8)(9) | | | 1,786 | | |
| | | | | | | $ | 2,365 | | |
Total Warrants
(identified cost $0) | | $ | 2,365 | | |
| Short-Term Investments — 3.8% | | | |
Interest
(000's omitted) | | Description | | Value | |
| $ | 42,176 | | | Cash Management Portfolio, 1.90%(10) | | $ | 42,175,585 | | |
Total Short-Term Investments
(identified cost $42,175,585) | | $ | 42,175,585 | | |
Total Investments — 132.2%
(identified cost $2,083,865,538) | | $ | 1,479,269,099 | | |
Less Unfunded Loan
Commitments — (1.9)% | | $ | (20,785,584 | ) | |
Net Investments — 130.3%
(identified cost $2,063,079,954) | | $ | 1,458,483,515 | | |
| Other Assets, Less Liabilities — (30.3)% | | $ | (339,178,393 | ) | |
| Net Assets — 100.0% | | $ | 1,119,305,122 | | |
DIP - Debtor in Possession
REIT - Real Estate Investment Trust
EUR - Euro
GBP - British Pound Sterling
* In U.S. dollars unless otherwise indicated.
(1) Senior floating-rate interests (Senior Loans) often require prepayments from excess cash flows or permit the borrowers to repay at their election. The degree to which borrowers repay, whether as a contractual requirement or at their election, cannot be predicted with accuracy. As a result, the actual remaining maturity may be substantially less than the stated maturities shown. However, Senior Loans will have an expected average life of approximately two to four years. The stated interest rate represents the weighted average interest rate of all contracts within the senior loan facility. Senior Loans typically have rates of interest which are redetermined either daily, monthly, quarterly or semi-annually by reference to a base lending rate, plus a premium. These base lending rates are primarily the London-Interbank Offered Rate ("LIBOR"), and secondarily the prime rate offered by one or more major United States banks (the "Prime Rate") and the certificate of deposit ("CD") rate or other base lending rates used by commercial lenders.
(2) Unfunded or partially unfunded loan commitments. See Note 1G for description.
(3) Defaulted security. Currently the issuer is in default with respect to interest payments.
(4) Security valued at fair value using methods determined in good faith by or at the direction of the Trustees.
(5) This Senior Loan will settle after October 31, 2008, at which time the interest rate will be determined.
(6) Variable rate security. The stated interest rate represents the rate in effect at October 31, 2008.
(7) Security exempt from registration under Rule 144A of the Securities Act of 1933. These securities may be sold in transactions exempt from registration, normally to qualified institutional buyers. At October 31, 2008, the aggregate value of the securities is $2,639,955 or 0.2% of the Portfolio's net assets.
(8) Non-income producing security.
(9) Restricted security.
(10) Affiliated investment company available to Eaton Vance portfolios and funds which invests in high quality, U.S. dollar denominated money market instruments. The rate shown is the annualized seven-day yield as of October 31, 2008.
See notes to financial statements
33
Senior Debt Portfolio as of October 31, 2008
FINANCIAL STATEMENTS
Statement of Assets and Liabilities
As of October 31, 2008
| Assets | |
| Unaffiliated investments, at value (identified cost, $2,020,904,369) | | $ | 1,416,307,930 | | |
| Affiliated investment, at value (identified cost, $42,175,585) | | | 42,175,585 | | |
| Cash | | | 4,758,407 | | |
| Foreign currency, at value (identified cost, $1,184,878) | | | 1,164,795 | | |
| Receivable for investments sold | | | 25,028,599 | | |
| Interest receivable | | | 12,948,476 | | |
| Interest receivable from affiliated investment | | | 23,154 | | |
| Receivable for open forward foreign currency contracts | | | 2,950,420 | | |
| Prepaid expenses | | | 155,218 | | |
| Total assets | | $ | 1,505,512,584 | | |
| Liabilities | |
| Notes payable | | $ | 380,000,000 | | |
| Payable for investments purchased | | | 3,827,368 | | |
| Payable to affiliate for investment adviser fee | | | 598,927 | | |
| Payable to affiliate for Trustees' fees | | | 4,000 | | |
| Payable for closed swap contracts | | | 14,664 | | |
| Accrued expenses | | | 1,762,503 | | |
| Total liabilities | | $ | 386,207,462 | | |
| Net Assets applicable to investors' interest in Portfolio | | $ | 1,119,305,122 | | |
| Sources of Net Assets | |
| Net proceeds from capital contributions and withdrawals | | $ | 1,720,843,794 | | |
| Net unrealized depreciation (computed on the basis of identified cost) | | | (601,538,672 | ) | |
| Total | | $ | 1,119,305,122 | | |
Statement of Operations
For the Year Ended
October 31, 2008
| Investment Income | |
| Interest | | $ | 157,178,866 | | |
| Interest income allocated from affiliated investment | | | 1,104,064 | | |
| Expenses allocated from affiliated investment | | | (150,494 | ) | |
| Total investment income | | $ | 158,132,436 | | |
| Expenses | |
| Investment adviser fee | | $ | 10,353,354 | | |
| Trustees' fees and expenses | | | 40,980 | | |
| Interest expense and fees | | | 18,179,352 | | |
| Custodian fee | | | 713,288 | | |
| Legal and accounting services | | | 552,216 | | |
| Miscellaneous | | | 101,244 | | |
| Total expenses | | $ | 29,940,434 | | |
Deduct —
Reduction of custodian fee | | $ | 13,029 | | |
| Total expense reductions | | $ | 13,029 | | |
| Net expenses | | $ | 29,927,405 | | |
| Net investment income | | $ | 128,205,031 | | |
| Realized and Unrealized Gain (Loss) | |
Net realized gain (loss) —
Investment transactions (identified cost basis) | | $ | (51,006,922 | ) | |
| Swap contracts | | | 231,696 | | |
| Foreign currency and forward foreign currency exchange contract transactions | | | 30,023,775 | | |
| Net realized loss | | $ | (20,751,451 | ) | |
Change in unrealized appreciation (depreciation) —
Investments (identified cost basis) | | $ | (573,772,495 | ) | |
| Swap contracts | | | (367,002 | ) | |
| Foreign currency and forward foreign currency exchange contracts | | | 4,604,136 | | |
| Net change in unrealized appreciation (depreciation) | | $ | (569,535,361 | ) | |
| Net realized and unrealized loss | | $ | (590,286,812 | ) | |
| Net decrease in net assets from operations | | $ | (462,081,781 | ) | |
See notes to financial statements
34
Senior Debt Portfolio as of October 31, 2008
FINANCIAL STATEMENTS CONT'D
Statements of Changes in Net Assets
| Increase (Decrease) in Net Assets | | Year Ended
October 31, 2008 | | Period Ended
October 31, 2007(1) | | Year Ended
November 30, 2006 | |
From operations —
Net investment income | | $ | 128,205,031 | | | $ | 166,214,896 | | | $ | 189,359,728 | | |
Net realized gain (loss) from investment transactions, swap contracts, and foreign currency and
forward foreign currency exchange contract transactions | | | (20,751,451 | ) | | | 1,101,029 | | | | (12,277,527 | ) | |
Net change in unrealized appreciation (depreciation) of investments, swap contracts, and
foreign currency and forward foreign currency exchange contracts | | | (569,535,361 | ) | | | (67,085,539 | ) | | | 13,528,611 | | |
| Net increase (decrease) in net assets from operations | | $ | (462,081,781 | ) | | $ | 100,230,386 | | | $ | 190,610,812 | | |
Capital transactions —
Contributions | | $ | 1,858,796,192 | | | $ | 190,766,237 | | | $ | 195,494,844 | | |
| Withdrawals | | | (2,611,778,134 | ) | | | (602,426,148 | ) | | | (794,697,437 | ) | |
| Net decrease in net assets from capital transactions | | $ | (752,981,942 | ) | | $ | (411,659,911 | ) | | $ | (599,202,593 | ) | |
| Net decrease in net assets | | $ | (1,215,063,723 | ) | | $ | (311,429,525 | ) | | $ | (408,591,781 | ) | |
| Net Assets | |
| At beginning of period | | $ | 2,334,368,845 | | | $ | 2,645,798,370 | | | $ | 3,054,390,151 | | |
| At end of period | | $ | 1,119,305,122 | | | $ | 2,334,368,845 | | | $ | 2,645,798,370 | | |
(1) For the eleven months ended October 31, 2007.
See notes to financial statements
35
Senior Debt Portfolio as of October 31, 2008
FINANCIAL STATEMENTS CONT'D
Statement of Cash Flows
| Cash Flows From Operating Activities | | For the Year Ended
October 31, 2008 | |
| Net decrease in net assets from operations | | $ | (462,081,781 | ) | |
Adjustments to reconcile net descrease in net assets from
operations to net cash provided by operating activities: | |
| Investment purchased | | | (152,912,563 | ) | |
| Investment sold and principal repayments | | | 818,344,546 | | |
| Net amortization of premium (discount) | | | (112,780 | ) | |
| Increase in short term investments, net | | | (29,525,988 | ) | |
| Decrease in interest receivable | | | 9,188,741 | | |
| Decrease in interest receivable from affiliated investment | | | 133,037 | | |
| Decrease in payable for investments purchased | | | (24,826,168 | ) | |
| Increase in receivable for investments sold | | | (5,402,382 | ) | |
| Decrease in receivable for open swap contracts | | | 367,430 | | |
| Increase in receivable for open forward foreign currency contracts | | | (2,949,980 | ) | |
| Decrease in prepaid expenses | | | 159,599 | | |
| Decrease in payable for open swap contracts | | | (427 | ) | |
| Increase in payable for closed swap contracts | | | 14,664 | | |
| Decrease in payable for open forward foreign currency contracts | | | (2,092,928 | ) | |
| Decrease in payable to affiliate for investment adviser fee | | | (413,434 | ) | |
| Increase in payable to affiliate for Trustees' fees | | | 1,031 | | |
| Decrease in unfunded loan commitments | | | (16,735,845 | ) | |
| Decrease in accrued expenses | | | (791,463 | ) | |
| Net change in unrealized (appreciation) depreciation on investments | | | 573,772,495 | | |
| Net realized (gain) loss on investments | | | 51,006,922 | | |
| Net cash provided by operating activities | | $ | 755,142,726 | | |
| Cash Flows From Financing Activities | |
| Decrease in notes payable | | $ | (15,000,000 | ) | |
| Proceeds from capital contributions | | | 1,858,796,192 | | |
| Payments for capital withdrawals | | | (2,611,778,134 | ) | |
| Net cash used in financing activities | | $ | (767,981,942 | ) | |
| Net decrease in cash | | $ | (12,839,216 | ) | |
| Cash at beginning of year | | $ | 18,762,418 | | |
| Cash at end of year(1) | | $ | 5,923,202 | | |
Supplemental disclosure of
cash flow information: | |
| Cash paid for interest and fees on borrowings | | $ | 18,798,764 | | |
(1) Includes foreign currency, at value.
See notes to financial statements
36
Senior Debt Portfolio as of October 31, 2008
FINANCIAL STATEMENTS CONT'D
Supplementary Data
| | | Year Ended | | Period Ended | | Year Ended November 30, | |
| | | October 31, 2008 | | October 31, 2007(1) | | 2006 | | 2005 | | 2004 | | 2003 | |
| Ratios/Supplemental Data | |
| Ratios (As a percentage of average daily net assets): | |
| Expenses before custodian fee reduction(2) | | | 0.66 | % | | | 0.58 | %(3) | | | 0.51 | % | | | 0.50 | % | | | 0.50 | % | | | 0.51 | % | |
| Interest expense and fees | | | 0.98 | % | | | 0.70 | %(3) | | | 0.01 | % | | | 0.00 | %(4) | | | 0.00 | %(4) | | | 0.01 | % | |
| Total expenses | | | 1.64 | % | | | 1.28 | %(3) | | | 0.52 | % | | | 0.50 | % | | | 0.51 | % | | | 0.51 | % | |
| Net investment income | | | 7.01 | % | | | 7.18 | %(3) | | | 6.57 | % | | | 5.00 | % | | | 3.82 | % | | | 4.14 | % | |
| Portfolio Turnover | | | 7 | % | | | 55 | % | | | 51 | % | | | 65 | % | | | 87 | % | | | 47 | % | |
| Total Return | | | (26.81 | )% | | | 3.89 | %(5) | | | 6.88 | % | | | 5.27 | % | | | 6.15 | % | | | 8.19 | % | |
| Net assets, end of period (000's omitted) | | $ | 1,119,305 | | | $ | 2,334,369 | | | $ | 2,645,798 | | | $ | 3,054,390 | | | $ | 3,340,152 | | | $ | 3,384,305 | | |
(1) For the eleven months ended October 31, 2007.
(2) Excludes the effect of custody fee credits, if any, of less than 0.005%.
(3) Annualized.
(4) Rounds to less than 0.01%.
(5) Not annualized.
See notes to financial statements
37
Senior Debt Portfolio as of October 31, 2008
NOTES TO FINANCIAL STATEMENTS
1 Significant Accounting Policies
Senior Debt Portfolio (the Portfolio) is a New York trust registered under the Investment Company Act of 1940, as amended (the 1940 Act), as a diversified, open-end management investment company. The Portfolio's investment objective is to provide a high level of current income. The Declaration of Trust permits the Trustees to issue interests in the Portfolio. At October 31, 2008, Eaton Vance Floating-Rate Advantage Fund held a 99.9% interest in the Portfolio.
The following is a summary of significant accounting policies of the Portfolio. The policies are in conformity with accounting principles generally accepted in the United States of America.
A Investment Valuation — Interests in senior floating-rate loans (Senior Loans) for which reliable market quotations are readily available are valued generally at the average mean of bid and ask quotations obtained from an independent pricing service. Other Senior Loans are valued at fair value by the investment adviser under procedures approved by the Trustees. In fair valuing a Senior Loan, the investment adviser utilizes one or more of the following valuation techniques: (i) a matrix pricing approach that considers the yield on the Senior Loan relative to yields on other loan interests issued by companies of comparable credit quality; (ii) a comparison of the value of the borrower's outstanding equity and debt to that of comparable public companies; (iii) a discounted cash flow analysis; or (iv) when the investment adviser believes it is likely that a borrower will be liquidated or sold, an analysis of the terms of such liquidation or sale. In certain cases, the investment adviser will use a combination of analytical methods to determine fair value, such as when only a portion of a borrower's assets are likely to be sold. In conducting its assessment and analyses for purposes of determining fair value of a Senior Loan, the investment adviser will use its discretion and judgment in considering and appraising relevant factors. Fair value determinations are made by the portfolio managers of the Portfolio based on information available to such managers. The portfolio managers of other funds managed by the investment adviser that invest in Senior Loans may not possess the same information about a Senior Loan borrower as the portfolio managers of the Portfolio. At times, the fair value of a Senior Loan determined by the portfolio managers of other funds managed by the investmen t adviser that invest in Senior Loans may vary from the fair value of the same Senior Loan determined by the portfolio managers of the Portfolio. The fair value of each Senior Loan is periodically reviewed and approved by the investment adviser's Valuation Committee and by the Trustees based upon procedures approved by the Trustees. Junior Loans are valued in the same manner as Senior Loans.
Equity securities listed on a U.S. securities exchange generally are valued at the last sale price on the day of valuation or, if no sales took place on such date, at the mean between the closing bid and asked prices therefore on the exchange where such securities are principally traded. Equity securities listed on the NASDAQ Global or Global Select Market generally are valued at the NASDAQ official closing price. Unlisted or listed securities for which closing sales prices or closing quotations are not available are valued at the mean between the latest available bid and asked prices or, in the case of preferred equity securities that are not listed or traded in the over-the-counter market, by an independent pricing service. Debt obligations, including listed securities and securities for which price quotations are available, will normally be valued on the basis of market quotations provided by independent pricing services. The pricing services consider various factors relating to bonds and/or market transactions to determine market value. Short-term debt securities with a remaining maturity of sixty days or less are valued at amortized cost, which approximates market value. If short-term debt securities are acquired with a remaining maturity of more than sixty days, they will be valued by a pricing service. Credit default swaps are valued by a broker-dealer (usually the counterparty to the agreement). Forward foreign currency exchange contracts are generally valued using prices supplied by a pricing vendor or dealers. Foreign securities and currencies are valued in U.S. dollars, based on foreign currency exchange rate quotations supplied by an independent quotation service. The independent service uses a proprietary model to determine the exchange rate. Inputs to the model include reported trades and implied bid/ask spreads. Investments for which valuations or market quotations are not readily available are valued at fair value u sing methods determined in good faith by or at the direction of the Trustees of the Fund considering relevant factors, data and information including the market value of freely tradable securities of the same class in the principal market on which such securities are normally traded.
The Portfolio may invest in Cash Management Portfolio (Cash Management), an affiliated investment company managed by Boston Management and Research (BMR), a subsidiary of Eaton Vance Management (EVM). Cash Management values its investment securities utilizing the amortized cost valuation technique permitted by Rule 2a-7 of the 1940 Act, pursuant to which Cash Management must comply with certain conditions. This technique
38
Senior Debt Portfolio as of October 31, 2008
NOTES TO FINANCIAL STATEMENTS CONT'D
involves initially valuing a portfolio security at its cost and thereafter assuming a constant amortization to maturity of any discount or premium. If amortized cost is determined not to approximate fair value, Cash Management may value its investment securities based on available market quotations provided by a pricing service.
B Investment Transactions — Investment transactions for financial statement purposes are accounted for on a trade date basis. Realized gains and losses on investments sold are determined on the basis of identified cost.
C Income — Interest income is recorded on the basis of interest accrued, adjusted for amortization of premium or accretion of discount. Fees associated with loan amendments are recognized immediately.
D Federal Taxes — The Portfolio has elected to be treated as a partnership for federal tax purposes. No provision is made by the Portfolio for federal or state taxes on any taxable income of the Portfolio because each investor in the Portfolio is ultimately responsible for the payment of any taxes on its share of taxable income. Since at least one of the Portfolio's investors is a regulated investment company that invests all or substantially all of its assets in the Portfolio, the Portfolio normally must satisfy the applicable source of income and diversification requirements (under the Internal Revenue Code) in order for its investors to satisfy them. The Portfolio will allocate, at least annually among its investors, each investor's distributive share of the Portfolio' s net investment income, net realized capital gains and any other items of income, gain, loss, deduction or credit.
As of October 31, 2008, the Portfolio had no uncertain tax positions that would require financial statement recognition, de-recognition, or disclosure. Each of the Portfolio's federal tax returns filed in the 3-year period ended October 31, 2008 remains subject to examination by the Internal Revenue Service.
E Expense Reduction — State Street Bank and Trust Company (SSBT) serves as custodian of the Portfolio. Pursuant to the custodian agreement, SSBT receives a fee reduced by credits, which are determined based on the average daily cash balance the Portfolio maintains with SSBT. All credit balances, if any, used to reduce the Portfolio's custodian fees are reported as a reduction of expenses in the Statement of Operations.
F Foreign Currency Translation — Investment valuations, other assets, and liabilities initially expressed in foreign currencies are translated each business day into U.S. dollars based upon current exchange rates. Purchases and sales of foreign investment securities and income and expenses denominated in foreign currencies are translated into U.S. dollars based upon currency exchange rates in effect on the respective dates of such transactions. Recognized gains or losses on investment transactions attributable to changes in foreign currency exchange rates are recorded for financial statement purposes as net realized gains and losses on investments. That portion of unrealized gains and losses on investments that results from fluctuations in foreign currency exchange rates is not separately disclosed.
G Unfunded Loan Commitments — The Portfolio may enter into certain credit agreements all or a portion of which may be unfunded. The Portfolio is obligated to fund these commitments at the borrower's discretion. The commitments are disclosed in the accompanying Portfolio of Investments.
H Use of Estimates — The preparation of the financial statements in conformity with accounting principles generally accepted in the United States of America requires management to make estimates and assumptions that affect the reported amounts of assets and liabilities at the date of the financial statements and the reported amounts of income and expense during the reporting period. Actual results could differ from those estimates.
I Indemnifications — Under the Portfolio's organizational documents, its officers and Trustees may be indemnified against certain liabilities and expenses arising out of the performance of their duties to the Portfolio. Interestholders in the Portfolio are jointly and severally liable for the liabilities and obligations of the Portfolio in the event that the Portfolio fails to satisfy such liabilities and obligations; provided, however, that, to the extent assets are available in the Portfolio, the Portfolio may, under certain circumstances, indemnify interestholders from and against any claim or liability to which such holder may become subject by reason of being or having been an interestholder in the Portfolio. Additionally, in the normal course of business, the Portfo lio enters into agreements with service providers that may contain indemnification clauses. The Portfolio's maximum exposure under these arrangements is unknown as this would involve future claims that may be made against the Portfolio that have not yet occurred.
39
Senior Debt Portfolio as of October 31, 2008
NOTES TO FINANCIAL STATEMENTS CONT'D
J Forward Foreign Currency Exchange Contracts — The Portfolio may enter into forward foreign currency exchange contracts for the purchase or sale of a specific foreign currency at a fixed price on a future date. The Portfolio enters into forward contracts for hedging purposes as well as non-hedging purposes. The forward foreign currency exchange contract is adjusted by the daily exchange rate of the underlying currency and any gains or losses are recorded as unrealized until such time as the contract has been closed or offset by another contract with the same broker for the same settlement date and currency. Risks may arise upon entering these contracts from the potential inability of counterparties to meet the terms of their contracts and from movements in the value of a foreign currency relative to the U.S. dollar.
K Credit Default Swaps — The Portfolio may enter into credit default swap contracts to buy or sell protection against default on an individual issuer or a basket of issuers of bonds. When the Portfolio is the buyer of a credit default swap contract, the Portfolio is entitled to receive the par (or other agreed-upon) value of a referenced debt obligation (or basket of debt obligations) from the counterparty to the contract in the event of default by a third party, such as a U.S. or foreign corporate issuer, on the debt obligation. In return, the Portfolio pays the counterparty a periodic stream of payments over the term of the contract provided that no event of default has occurred. If no default occurs, the Portfolio would have spent the stream of payments and received no benefits from the contract. When the Portfolio is the seller of a credit default swap contract, it receives the stream of payments, but is obligated to pay upon default of the referenced debt obligation. As the seller, the Portfolio effectively adds leverage to its portfolio because, in addition to its total net assets, the Portfolio is subject to investment exposure on the notional amount of the swap. The interest fee paid or received on the swap contract, which is based on a specified interest rate on a fixed notional amount, is accrued daily as a component of unrealized appreciation (depreciation) and is recorded as realized gain upon receipt or realized loss upon payment. The Portfolio also records an increase or decrease to unrealized appreciation (depreciation) in an amount equal to the daily valuation. Up-front payments or receipts, if any, are recorded as other assets or other liabilities, respectively, and amortized over the life of the swap contract as realized gains or losses. The Portfolio segre gates assets in the form of cash and cash equivalents in an amount equal to the aggregate market value of the credit default swaps of which it is the seller, marked to market on a daily basis. These transactions involve certain risks, including the risk that the seller may be unable to fulfill the transaction.
L Statement of Cash Flows — The cash amount shown in the Statement of Cash Flows of the Portfolio is the amount included in the Portfolio's Statement of Assets and Liabilities and represents the cash on hand at its custodian and does not include any short-term investments.
2 Investment Adviser Fee and Other Transactions with Affiliates
The investment adviser fee is earned by BMR as compensation for investment advisory services rendered to the Portfolio. Pursuant to the investment advisory agreement and subsequent fee reduction agreements between the Portfolio and BMR, the fee is computed at an annual rate of 0.50% of the Portfolio's average daily gross assets up to and including $1 billion, 0.45% over $1 billion up to and including $2 billion, 0.40% over $2 billion up to and including $7 billion, and at reduced rates as average daily gross assets exceed that level and is payable monthly. The fee reduction cannot be terminated without the consent of the Trustees and shareholders. The portion of the adviser fee payable by Cash Management on the Portfolio's investment of cash therein is credited against the Portfolio's adviser fee. For the year ended October 31, 2008, the Portfolio's adviser fee totaled $10,495,312 of which $141,958 was allocated from Cash Manage ment and $10,353,354 was paid or accrued directly by the Portfolio. For the year ended October 31, 2008, the Portfolio's adviser fee, including the portion allocated from Cash Management, was 0.57% of the Portfolio's average daily net assets.
Except for Trustees of the Portfolio who are not members of EVM's or BMR's organizations, officers and Trustees receive remuneration for their services to the Portfolio out of the investment adviser fee. Trustees of the Portfolio who are not affiliated with the investment adviser may elect to defer receipt of all or a percentage of their annual fees in accordance with the terms of the Trustees Deferred Compensation Plan. For the year ended October 31, 2008, no significant amounts have been deferred. Certain officers and Trustees of the Portfolio are officers of the above organizations.
3 Purchases and Sales of Investments
Purchases and sales of investments, other than short-term obligations and including maturities and principal repayments on Senior Loans, aggregated $152,912,563 and $818,344,546, respectively, for the year ended October 31, 2008.
40
Senior Debt Portfolio as of October 31, 2008
NOTES TO FINANCIAL STATEMENTS CONT'D
4 Federal Income Tax Basis of Investments
The cost and unrealized appreciation (depreciation) of investments of the Portfolio at October 31, 2008, as determined on a federal income tax basis, were as follows:
| Aggregate cost | | $ | 2,062,902,400 | | |
| Gross unrealized appreciation | | $ | 194,155 | | |
| Gross unrealized depreciation | | | (604,613,040 | ) | |
| Net unrealized depreciation | | $ | (604,418,885 | ) | |
The net unrealized depreciation on foreign currency and forward foreign currency exchange contracts on a federal tax basis was $3,057,765.
5 Restricted Securities
At October 31, 2008, the Portfolio owned the following securities (representing less than 0.01% of net assets) which were restricted as to public resale and not registered under the Securities Act of 1933 (excluding Rule 144A securities). The Portfolio has various registration rights (exercisable under a variety of circumstances) with respect to these securities. The value of these securities is determined based on valuations provided by brokers when available, or if not available, they are valued at fair value using methods determined in good faith by or at the direction of the Trustees.
| Description | | Date of
Acquisition | | Shares | | Cost | | Value | |
| Common Stocks | |
Environmental Systems
Products Holdings, Inc. | | 10/24/00 | | | 1,242 | | | $ | 0 | | | $ | 0 | | |
| Safelite Realty Corp. | | 9/29/00 -
11/10/00 | | | 20,048 | | | | 0 | | | | 0 | | |
| | | | | | | | | $ | 0 | | | $ | 0 | | |
| Preferred Stocks | |
Environmental Systems
Products Holdings,
Series A | | 10/25/07 | | | 569 | | | $ | 9,958 | | | $ | 13,070 | | |
Hayes Lemmerz
International | | 6/04/03 | | | 445 | | | | 22,250 | | | | 3,298 | | |
Key Plastics,
LLC, Series A | | 4/26/01 | | | 218 | | | | 218,200 | | | | 0 | | |
| | | | | | | | | $ | 250,408 | | | $ | 16,368 | | |
| Description | | Date of
Acquisition | | Shares | | Cost | | Value | |
| Warrants | |
Gentek, Inc., Class B,
Expires 10/31/08 | | 11/11/03 | | | 1,930 | | | $ | 0 | | | $ | 579 | | |
Gentek, Inc., Class C,
Expires 10/31/10 | | 11/11/03 | | | 940 | | | | 0 | | | | 1,786 | | |
| | | | | | | $ | 0 | | | $ | 2,365 | | |
| Total Restricted Securities | | | | | | $ | 250,408 | | | $ | 18,733 | | |
6 Financial Instruments
The Portfolio may trade in financial instruments with off-balance sheet risk in the normal course of its investing activities to assist in managing exposure to various market risks. These financial instruments may include forward foreign currency exchange contracts and may involve, to a varying degree, elements of risk in excess of the amounts recognized for financial statement purposes. The notional or contractual amounts of these instruments represent the investment the Portfolio has in particular classes of financial instruments and does not necessarily represent the amounts potentially subject to risk. The measurement of the risks associated with these instruments is meaningful only when all related and offsetting transactions are considered.
A summary of obligations under these financial instruments at October 31, 2008 is as follows:
Forward Foreign Currency Exchange Contracts
| Settlement Date | | Deliver | | In Exchange For | | Net Unrealized
Appreciation | |
| 11/28/08 | | British Pound Sterling
27,109,023 | | United States Dollar
44,371,235 | | $ | 808,391 | | |
| 11/28/08 | | Euro
98,466,349 | | United States Dollar
127,525,737 | | | 2,142,029 | | |
| | | $ | 2,950,420 | | |
At October 31, 2008, the Portfolio had sufficient cash and/or securities to cover commitments under these contracts.
41
Senior Debt Portfolio as of October 31, 2008
NOTES TO FINANCIAL STATEMENTS CONT'D
7 Revolving Credit Agreement
The Portfolio has entered into a Revolving Credit Agreement, as amended, (the "Agreement") with conduit lenders and a bank that allows it to borrow up to $800 million and to invest the borrowings in accordance with its investment practices. Borrowings under the Agreement are secured by the assets of the Portfolio. Interest is charged at a rate above the conduits' commercial paper issuance rate and is payable monthly. Under the terms of the Agreement, the Portfolio also pays a program fee of 0.325% (0.23% prior to February 14, 2008) per annum on its outstanding borrowings to administer the facility and a commitment fee of 0.175% (0.10% prior to February 14, 2008) per annum on the amount of the facility. Program and commitment fees for the year ended October 31, 2008 totaled $1,306,668 and are included in interest expense in the Statement of Operations. In connection with the structuring of the Agreement, the Portfolio is obligate d to pay a fee of $1 million in quarterly installments of $50,000 through February 2012. The entire unpaid balance is payable on termination date if the Agreement is terminated by the Portfolio within the first five years and eliminated if the Agreement is terminated by the lenders at their discretion except for an event of default by the Portfolio. At October 31, 2008, the Portfolio had borrowings outstanding under the Agreement of $380,000,000 at an interest rate of 3.47%. For the year ended October 31, 2008, the average borrowings under the Agreement and the average interest rate were $419,849,727 and 3.66%, respectively.
8 Risks Associated with Foreign Investments
Investing in securities issued by companies whose principal business activities are outside the United States may involve significant risks not present in domestic investments. For example, there is generally less publicly available information about foreign companies, particularly those not subject to the disclosure and reporting requirements of the U.S. securities laws. Certain foreign issuers are generally not bound by uniform accounting, auditing, and financial reporting requirements and standards of practice comparable to those applicable to domestic issuers. Investments in foreign securities also involve the risk of possible adverse changes in investment or exchange control regulations, expropriation or confiscatory taxation, limitation on the removal of funds or other assets of the Portfolio, political or financial instability or diplomatic and other developments which could affect such investments. Foreign security marke ts, while growing in volume and sophistication, are generally not as developed as those in the United States, and securities of some foreign issuers (particularly those located in developing countries) may be less liquid and more volatile than securities of comparable U.S. companies. In general, there is less overall governmental supervision and regulation of foreign securities markets, broker-dealers and issuers than in the United States.
9 Concentration of Credit Risk
The Portfolio invests primarily in below investment grade floating-rate loans, which are considered speculative because of the credit risk of their issuers. Changes in economic conditions or other circumstances are more likely to reduce the capacity of issuers of these securities to make principal and interest payments. Such companies are more likely to default on their payments of interest and principal owed than issuers of investment grade bonds. An economic downturn generally leads to a higher non-payment rate, and a loan or other debt obligation may lose significant value before a default occurs. Lower rated investments also may be subject to a greater price volatility than higher rated investments. Moreover, the specific collateral used to secure a loan may decline in value or become illiquid, which would adversely affect the loan's value.
10 Recently Issued Accounting Pronouncements
In September 2006, the Financial Accounting Standards Board (FASB) issued Statement of Financial Accounting Standards No. 157 (FAS 157), "Fair Value Measurements". FAS 157 defines fair value, establishes a framework for measuring fair value in accordance with generally accepted accounting principles and expands disclosure about fair value measurements. FAS 157 is effective for fiscal years beginning after November 15, 2007. As of October 31, 2008, management does not believe the adoption of FAS 157 will impact the amounts reported in the financial statements; however, additional disclosures may be required about the inputs used to develop the measurements of fair value and the effect of certain of the measurements on changes in net assets for the period.
In March 2008, the FASB issued Statement of Financial Accounting Standards No. 161 (FAS 161), "Disclosures about Derivative Instruments and Hedging Activities." FAS 161 requires enhanced disclosures about an entity's derivative and hedging activities, including qualitative disclosures about the objectives and strategies for using derivatives, quantitative disclosures about fair value amounts of and gains and losses on derivative instruments, and disclosures about credit-risk related contingent features in derivative instruments. FAS 161 is effective for fiscal years and interim periods beginning after November 15, 2008. Management is currently evaluating the impact the adoption of FAS 161 will have on the Portfolio's financial statement disclosures.
42
Senior Debt Portfolio as of October 31, 2008
REPORT OF INDEPENDENT REGISTERED PUBLIC ACCOUNTING FIRM
To the Trustees and Investors
of Eaton Vance Senior Debt Portfolio:
We have audited the accompanying statement of assets and liabilities of Eaton Vance Senior Debt Portfolio (the "Portfolio") as of October 31, 2008, the related statements of operations, cash flows, and changes in net assets for the year then ended, the statements of changes in net assets for the eleven months ended October 31, 2007, and the year ended November 30, 2006, and the supplementary data for the periods presented. These financial statements and supplementary data are the responsibility of the Portfolio's management. Our responsibility is to express an opinion on these financial statements and financial highlights based on our audits.
We conducted our audits in accordance with the standards of the Public Company Accounting Oversight Board (United States). Those standards require that we plan and perform the audit to obtain reasonable assurance about whether the financial statements and financial highlights are free of material misstatement. The Portfolio is not required to have, nor were we engaged to perform, an audit of its internal control over financial reporting. Our audits included consideration of internal control over financial reporting as a basis for designing audit procedures that are appropriate in the circumstances, but not for the purpose of expressing an opinion on the effectiveness of the Portfolio's internal control over financial reporting. Accordingly, we express no such opinion. An audit also includes examining, on a test basis, evidence supporting the amounts and disclosures in the financial statements, assessing the accounting principles used and significant estimates made by management, as well as evaluating the overall financial statement presentation. Our procedures included confirmation of securities and senior loans owned as of October 31, 2008, by correspondence with the custodian and selling or agent banks; where replies were not received from selling or agent banks, we performed other auditing procedures. We believe that our audits provide a reasonable basis for our opinion.
In our opinion, the financial statements and supplementary data referred to above present fairly, in all material respects, the financial position of Eaton Vance Senior Debt Portfolio as of October 31, 2008, the results of its operations and its cash flows, changes in its net assets for the year then ended, the eleven months ended October 31, 2007, and the year ended November 30, 2006, and the supplementary data for the periods presented, in conformity with accounting principles generally accepted in the United States of America.
DELOITTE & TOUCHE LLP
Boston, Massachusetts
December 18, 2008
43
Eaton Vance Floating-Rate Advantage Fund
Senior Debt Portfolio
SPECIAL MEETING OF SHAREHOLDERS (Unaudited)
Eaton Vance Floating-Rate Advantage Fund
The Fund held a Special Meeting of Shareholders on November 14, 2008 to elect Trustees. The results of the vote were as follows:
| | | Number of Shares | |
| Nominee for Trustee | | For | | Withheld | |
| Benjamin C. Esty | | | 113,625,557 | | | | 2,783,309 | | |
| Thomas E. Faust Jr. | | | 113,598,139 | | | | 2,810,727 | | |
| Allen R. Freedman | | | 113,604,163 | | | | 2,804,703 | | |
| William H. Park | | | 113,626,411 | | | | 2,782,455 | | |
| Ronald A. Pearlman | | | 113,578,886 | | | | 2,829,980 | | |
| Helen Frame Peters | | | 113,581,862 | | | | 2,827,004 | | |
| Heidi L. Steiger | | | 113,640,834 | | | | 2,768,032 | | |
| Lynn A. Stout | | | 113,657,232 | | | | 2,751,634 | | |
| Ralph F. Verni | | | 113,607,783 | | | | 2,801,083 | | |
Each nominee was also elected a Trustee of the Senior Debt Portfolio.
Senior Debt Portfolio
The Portfolio held a Special Meeting of Interestholders on November 14, 2008 to elect Trustees. The results of the vote were as follows:
| | | Interest in the Portfolio | |
| Nominee for Trustee | | For | | Withheld | |
| Benjamin C. Esty | | | 98 | % | | | 2 | % | |
| Thomas E. Faust Jr. | | | 98 | % | | | 2 | % | |
| Allen R. Freedman | | | 98 | % | | | 2 | % | |
| William H. Park | | | 98 | % | | | 2 | % | |
| Ronald A. Pearlman | | | 98 | % | | | 2 | % | |
| Helen Frame Peters | | | 98 | % | | | 2 | % | |
| Heidi L. Steiger | | | 98 | % | | | 2 | % | |
| Lynn A. Stout | | | 98 | % | | | 2 | % | |
| Ralph F. Verni | | | 98 | % | | | 2 | % | |
Results are rounded to the nearest whole number.
44
Eaton Vance Floating-Rate Advantage Fund
BOARD OF TRUSTEES' ANNUAL APPROVAL OF THE INVESTMENT ADVISORY AGREEMENT
Overview of the Contract Review Process
The Investment Company Act of 1940, as amended (the "1940 Act"), provides, in substance, that each investment advisory agreement between a fund and its investment adviser will continue in effect from year to year only if its continuance is approved at least annually by the fund's board of trustees, including by a vote of a majority of the trustees who are not "interested persons" of the fund ("Independent Trustees"), cast in person at a meeting called for the purpose of considering such approval.
At a meeting of the Boards of Trustees (each a "Board") of the Eaton Vance group of mutual funds (the "Eaton Vance Funds") held on April 21, 2008, the Board, including a majority of the Independent Trustees, voted to approve continuation of existing advisory and sub-advisory agreements for the Eaton Vance Funds for an additional one-year period. In voting its approval, the Board relied upon the affirmative recommendation of the Contract Review Committee of the Board (formerly the Special Committee), which is a committee comprised exclusively of Independent Trustees. Prior to making its recommendation, the Contract Review Committee reviewed information furnished for a series of meetings of the Contract Review Committee held in February, March and April 2008. Such information included, among other things, the following:
Information about Fees, Performance and Expenses
• An independent report comparing the advisory and related fees paid by each fund with fees paid by comparable funds;
• An independent report comparing each fund's total expense ratio and its components to comparable funds;
• An independent report comparing the investment performance of each fund to the investment performance of comparable funds over various time periods;
• Data regarding investment performance in comparison to relevant peer groups of funds and appropriate indices;
• Comparative information concerning fees charged by each adviser for managing other mutual funds and institutional accounts using investment strategies and techniques similar to those used in managing the fund;
• Profitability analyses for each adviser with respect to each fund;
Information about Portfolio Management
• Descriptions of the investment management services provided to each fund, including the investment strategies and processes employed, and any changes in portfolio management processes and personnel;
• Information concerning the allocation of brokerage and the benefits received by each adviser as a result of brokerage allocation, including information concerning the acquisition of research through "soft dollar" benefits received in connection with the funds' brokerage, and the implementation of a soft dollar reimbursement program established with respect to the funds;
• Data relating to portfolio turnover rates of each fund;
• The procedures and processes used to determine the fair value of fund assets and actions taken to monitor and test the effectiveness of such procedures and processes;
Information about each Adviser
• Reports detailing the financial results and condition of each adviser;
• Descriptions of the qualifications, education and experience of the individual investment professionals whose responsibilities include portfolio management and investment research for the funds, and information relating to their compensation and responsibilities with respect to managing other mutual funds and investment accounts;
• Copies of the Codes of Ethics of each adviser and its affiliates, together with information relating to compliance with and the administration of such codes;
• Copies of or descriptions of each adviser's proxy voting policies and procedures;
• Information concerning the resources devoted to compliance efforts undertaken by each adviser and its affiliates on behalf of the funds (including descriptions of various compliance programs) and their record of compliance with investment policies and restrictions, including policies with respect to market-timing, late trading and selective portfolio disclosure, and with policies on personal securities transactions;
• Descriptions of the business continuity and disaster recovery plans of each adviser and its affiliates;
Other Relevant Information
• Information concerning the nature, cost and character of the administrative and other non-investment management services provided by Eaton Vance Management and its affiliates;
• Information concerning management of the relationship with the custodian, subcustodians and fund accountants by each adviser or the funds' administrator; and
• The terms of each advisory agreement.
45
Eaton Vance Floating-Rate Advantage Fund
BOARD OF TRUSTEES' ANNUAL APPROVAL OF THE INVESTMENT ADVISORY AGREEMENT CONT'D
In addition to the information identified above, the Contract Review Committee considered information provided from time to time by each adviser throughout the year at meetings of the Board and its committees. Over the course of the twelve-month period ended April 30, 2008, the Board met eleven times and the Contract Review Committee, the Audit Committee and the Governance Committee, each of which is a Committee comprised solely of Independent Trustees, met twelve, seven and five times, respectively. At such meetings, the Trustees received, among other things, presentations by the portfolio managers and other investment professionals of each adviser relating to the investment performance of each fund and the investment strategies used in pursuing the fund's investment objective. The Portfolio Management Committee and the Compliance Reports and Regulatory Matters Committee are newly established and did not meet during the twelve- month period ended April 30, 2008.
For funds that invest through one or more underlying portfolios, the Board considered similar information about the portfolio(s) when considering the approval of advisory agreements. In addition, in cases where the fund's investment adviser has engaged a sub-adviser, the Board considered similar information about the sub-adviser when considering the approval of any sub-advisory agreement.
The Contract Review Committee was assisted throughout the contract review process by Goodwin Procter LLP, legal counsel for the Independent Trustees. The members of the Contract Review Committee relied upon the advice of such counsel and their own business judgment in determining the material factors to be considered in evaluating each advisory and sub-advisory agreement and the weight to be given to each such factor. The conclusions reached with respect to each advisory and sub-advisory agreement were based on a comprehensive evaluation of all the information provided and not any single factor. Moreover, each member of the Contract Review Committee may have placed varying emphasis on particular factors in reaching conclusions with respect to each advisory and sub-advisory agreement.
Results of the Process
Based on its consideration of the foregoing, and such other information as it deemed relevant, including the factors and conclusions described below, the Contract Review Committee concluded that the continuance of the investment advisory agreement of the Senior Debt Portfolio (the "Portfolio"), the portfolio in which Eaton Vance Floating-Rate Advantage Fund (the "Fund") invests, with Boston Management and Research (the "Adviser"), including the fee structure, is in the interests of shareholders and, therefore, the Contract Review Committee recommended to the Board approval of the agreement. The Board accepted the recommendation of the Contract Review Committee as well as the factors considered and conclusions reached by the Contract Review Committee with respect to the agreement. Accordingly, the Board, including a majority of the Independent Trustees, voted to approve continuation of the investment advisory agreement for the Po rtfolio.
Nature, Extent and Quality of Services
In considering whether to approve the investment advisory agreement of the Portfolio, the Board evaluated the nature, extent and quality of services provided to the Portfolio by the Adviser.
The Board considered the Adviser's management capabilities and investment process with respect to the types of investments held by the Portfolio, including the education, experience and number of its investment professionals and other personnel who provide portfolio management, investment research, and similar services to the Portfolio. In particular, the Board evaluated the abilities and experience of such investment personnel in analyzing special considerations relevant to investing in senior floating rate loans. The Board noted the experience of the Adviser's large group of bank loan investment professionals and other personnel who provide services to the Portfolio, including portfolio managers and analysts. The Board also took into account the resources dedicated to portfolio management and other services, including the compensation paid to recruit and retain investment personnel, and the time and attention devoted to the Po rtfolio by senior management.
The Board reviewed the compliance programs of the Adviser and relevant affiliates thereof. Among other matters, the Board considered compliance and reporting matters relating to personal trading by investment personnel, selective disclosure of portfolio holdings, late trading, frequent trading, portfolio valuation, business continuity and the allocation of investment opportunities. The Board also evaluated the responses of the Adviser and its affiliates to requests from regulatory authorities such as the Securities and Exchange Commission.
The Board considered shareholder and other administrative services provided or managed by Eaton Vance Management and its affiliates, including transfer agency and accounting services. The Board evaluated the benefits to shareholders of investing in a fund that is a part of a large family of funds, including the ability, in many cases, to exchange an investment among different funds without incurring additional sales charges.
46
Eaton Vance Floating-Rate Advantage Fund
BOARD OF TRUSTEES' ANNUAL APPROVAL OF THE INVESTMENT ADVISORY AGREEMENT CONT'D
After consideration of the foregoing factors, among others, the Board concluded that the nature, extent and quality of services provided by the Adviser, taken as a whole, are appropriate and consistent with the terms of the investment advisory agreement.
Fund Performance
In assessing the Fund's investment performance, the Board noted that the Fund is the successor to the operations of Eaton Vance Prime Rate Reserves (the "Predecessor Fund"), which like the Fund, invested in Senior Debt Portfolio prior to its reorganization into the Fund on March 14, 2008. The Board compared the Predecessor Fund's investment performance to a relevant universe of similarly managed funds identified by an independent data provider and appropriate benchmark indices. The Board reviewed comparative performance data for the one-, three-, five- and ten-year periods ended September 30, 2007 for the Predecessor Fund. The Board noted that the Predecessor Fund's performance relative to its peers was affected by management's focus on reducing volatility. The Board concluded that the performance of the Fund was satisfactory.
Management Fees and Expenses
The Board reviewed contractual investment advisory fee rates, including any administrative fee rates, payable by the Portfolio and the Fund (referred to collectively as "management fees"). As part of its review, the Board considered the management fees and total expense ratio of the Predecessor Fund for the one-year period ended September 30, 2007, as compared to a group of similarly managed funds selected by an independent data provider. In assessing this information, the Board noted that the management fees applicable to the Fund and the Predecessor Fund are identical.
After reviewing the foregoing information, and in light of the nature, extent and quality of the services provided by the Adviser, the Board concluded that the management fees charged for advisory and related services and the total expense ratio anticipated with respect to the Fund are reasonable.
Profitability
The Board reviewed the level of profits realized by the Adviser and relevant affiliates thereof in providing investment advisory and administrative services to the Predecessor Fund, the Portfolio and to all Eaton Vance Funds as a group. The Board considered the level of profits realized without regard to revenue sharing or other payments by the Adviser and its affiliates to third parties in respect of distribution services. The Board also considered other direct or indirect benefits received by the Adviser and its affiliates in connection with its relationship with the Fund and the Portfolio.
The Board concluded that, in light of the foregoing factors and the nature, extent and quality of the services rendered, the profits realized by the Adviser and its affiliates are reasonable.
Economies of Scale
In reviewing management fees and profitability, the Board also considered the extent to which the Adviser and its affiliates, on the one hand, and the Fund, on the other hand, can expect to realize benefits from economies of scale as the assets of the Fund and Portfolio increase. The Board acknowledged the difficulty in accurately measuring the benefits resulting from the economies of scale with respect to the management of any specific fund or group of funds. The Board reviewed data summarizing the increases and decreases in the assets of the Predecessor Fund and of all Eaton Vance Funds as a group over various time periods, and evaluated the extent to which the total expense ratio of the Predecessor Fund and the profitability of the Adviser and its affiliates may have been affected by such increases or decreases. Based upon the foregoing, the Board concluded that the benefits from economies of scale are currently being shared equitably by the Adviser and its affiliates and the Fund. The Board also concluded that, assuming reasonably foreseeable increases in the assets of the Portfolio, the structure of the advisory fee, which includes breakpoints at several asset levels, can be expected to cause the Adviser and its affiliates and the Fund to continue to share such benefits equitably.
47
Eaton Vance Floating-Rate Advantage Fund
MANAGEMENT AND ORGANIZATION
Fund Management. The Trustees of Eaton Vance Mutual Funds Trust (the Trust) and Senior Debt Portfolio (the Portfolio) are responsible for the overall management and supervision of the Trust's and Portfolio's affairs. The Trustees and officers of the Trust and the Portfolio are listed below. Except as indicated, each individual has held the office shown or other offices in the same company for the last five years. Trustees and officers of the Trust and the Portfolio hold indefinite terms of office. The "noninterested Trustees" consist of those Trustees who are not "interested persons" of the Trust and the Portfolio, as that term is defined under the 1940 Act. The business address of each Trustee and officer is The Eaton Vance Building, 255 State Street, Boston, Massachusetts 02109. As used below, "EVC" refers to Eaton Vance Corp., "EV" refers to Eaton Vance, Inc., "EVM" refers to Eaton Vance Management, "BMR" refers to Boston Management and Research, "Parametric" refers to Parametric Portfolio Associates and "EVD" refers to Eaton Vance Distributors, Inc. EVC and EV are the corporate parent and trustee, respectively, of EVM and BMR. EVD is the Fund's principal underwriter, the Portfolio's placement agent and a wholly-owned subsidiary of EVC. Each officer affiliated with Eaton Vance may hold a position with other Eaton Vance affiliates that is comparable to his or her position with EVM listed below.
Name and
Date of Birth | | Position(s)
with the
Trust and
the Portfolio | | Term of
Office and
Length of
Service | | Principal Occupation(s)
During Past Five Years | | Number of Portfolios
in Fund Complex
Overseen By
Trustee(1) | | Other Directorships Held | |
| Interested Trustee | | | | | | | | | | | | | |
|
| Thomas E. Faust Jr. 5/31/58 | | Trustee and President of the Trust | | Trustee since 2007 and President of the Trust since 2002 | | Chairman, Chief Executive Officer and President of EVC, Director and President of EV, Chief Executive Officer and President of EVM and BMR, and Director of EVD. Trustee and/or Officer of 173 registered investment companies and 4 private companies managed by EVM or BMR. Mr. Faust is an interested person because of his positions with EVM, BMR, EVD, EVC and EV, which are affiliates of the Trust and Portfolio. | | | 173 | | | Director of EVC | |
|
| Noninterested Trustees | | | | | | | | | | | | | |
|
| Benjamin C. Esty 1/2/63 | | Trustee | | Since 2005 | | Roy and Elizabeth Simmons Professor of Business Administration, Harvard University Graduate School of Business Administration. | | | 173 | | | None | |
|
| Allen R. Freedman 4/3/40 | | Trustee | | Since 2007 | | Former Chairman (2002-2004) and a Director (1983-2004) of Systems & Computer Technology Corp. (provider of software to higher education). Formerly, a Director of Loring Ward International (fund distributor) (2005-2007). Formerly, Chairman and a Director of Indus International, Inc. (provider of enterprise management software to the power generating industry) (2005-2007). | | | 173 | | | Director of Assurant, Inc. and Stonemor Partners L.P. (owner and operator of cemeteries) | |
|
| William H. Park 9/19/47 | | Trustee | | Since 2003 | | Vice Chairman, Commercial Industrial Finance Corp. (specialty finance company) (since 2006). Formerly, President and Chief Executive Officer, Prizm Capital Management, LLC (investment management firm) (2002-2005). | | | 173 | | | None | |
|
| Ronald A. Pearlman 7/10/40 | | Trustee | | Since 2003 | | Professor of Law, Georgetown University Law Center. | | | 173 | | | None | |
|
| Helen Frame Peters 3/22/48 | | Trustee | | Since 2008 | | Professor of Finance, Carroll School of Management, Boston College (since 2003). Adjunct Professor of Finance, Peking University, Beijing, China (since 2005). Formerly, Dean, Carroll School of Management, Boston College (2000-2003). | | | 173 | | | Director of Federal Home Loan Bank of Boston (a bank for banks) and BJ's Wholesale Clubs (wholesale club retailer); Trustee of SPDR Index Shares Funds and SPDR Series Trust (exchange traded funds) | |
|
48
Eaton Vance Floating-Rate Advantage Fund
MANAGEMENT AND ORGANIZATION CONT'D
| Noninterested Trustees (continued) | | | | | | | | | | | | | |
|
Name and
Date of Birth | | Position(s)
with the
Trust and
the Portfolio | | Term of
Office and
Length of
Service | | Principal Occupation(s)
During Past Five Years | | Number of Portfolios
in Fund Complex
Overseen By
Trustee(1) | | Other Directorships Held | |
| Heidi L. Steiger 7/8/53 | | Trustee | | Since 2007 | | Managing Partner, Topridge Associates LLC (global wealth management firm) (since 2008); Senior Advisor (since 2008), President (2005-2008), Lowenhaupt Global Advisors, LLC (global wealth management firm). Formerly, President and Contributing Editor, Worth Magazine (2004-2005). Formerly, Executive Vice President and Global Head of Private Asset Management (and various other positions), Neuberger Berman (investment firm) (1986-2004). | | | 173 | | | Director of Nuclear Electric Insurance Ltd. (nuclear insurance provider) and Aviva USA (insurance provider) | |
|
| Lynn A. Stout 9/14/57 | | Trustee | | Since 1998 | | Paul Hastings Professor of Corporate and Securities Law (since 2006) and Professor of Law (2001-2006), University of California at Los Angeles School of Law. | | | 173 | | | None | |
|
| Ralph F. Verni 1/26/43 | | Chairman of the Board and Trustee | | Chairman of the Board since 2007 and Trustee since 2005 | | Consultant and private investor. | | | 173 | | | None | |
|
| Principal Officers who are not Trustees | | | | | | | | | | | | | |
|
Name and
Date of Birth | | Position(s)
with the
Trust and
the Portfolio | | Term of
Office and
Length of
Service | | Principal Occupation(s)
During Past Five Years | |
| William H. Ahern, Jr. 7/28/59 | | Vice President of the Trust | | Since 1995 | | Vice President of EVM and BMR. Officer of 75 registered investment companies managed by EVM or BMR. | |
|
| John R. Baur 2/10/70 | | Vice President of the Trust | | Since 2007 | | Vice President of EVM and BMR. Previously, attended Johnson Graduate School of Management, Cornell University (2002-2005), and prior thereto he was an Account Team Representative in Singapore for Applied Materials Inc. Officer of 33 registered investment companies managed by EVM or BMR. | |
|
| Michael A. Cirami 12/24/75 | | Vice President of the Trust | | Since 2007 | | Vice President of EVM and BMR. Previously, attended the University of Rochester William E. Simon Graduate School of Business Administration (2001-2003), and prior thereto he was a Team Leader for the Institutional Services Group for State Street Bank in Luxembourg. Officer of 33 registered investment companies managed by EVM or BMR. | |
|
| Cynthia J. Clemson 3/2/63 | | Vice President of the Trust | | Since 2005 | | Vice President of EVM and BMR. Officer of 90 registered investment companies managed by EVM or BMR. | |
|
| Charles B. Gaffney 12/4/72 | | Vice President of the Trust | | Since 2007 | | Vice President of EVM and BMR. Previously, Sector Portfolio Manager and Senior Equity Analyst of Brown Brothers Harriman (1997-2003). Officer of 30 registered investment companies managed by EVM or BMR. | |
|
| Christine M. Johnston 11/9/72 | | Vice President of the Trust | | Since 2007 | | Vice President of EVM and BMR. Officer of 35 registered investment companies managed by EVM or BMR. | |
|
| Aamer Khan 6/7/60 | | Vice President of the Trust | | Since 2005 | | Vice President of EVM and BMR. Officer of 33 registered investment companies managed by EVM or BMR. | |
|
| Thomas H. Luster 4/8/62 | | Vice President of the Trust | | Since 2006 | | Vice President of EVM and BMR. Officer of 51 registered investment companies managed by EVM or BMR. | |
|
| Robert B. MacIntosh 1/22/57 | | Vice President of the Trust | | Since 1998 | | Vice President of EVM and BMR. Officer of 90 registered investment companies managed by EVM or BMR. | |
|
| Scott H. Page 11/30/59 | | President of the Portfolio | | Since 2002 | | Vice President of EVM and BMR. Officer of 11 registered investment companies managed by EVM or BMR. | |
|
49
Eaton Vance Floating-Rate Advantage Fund
MANAGEMENT AND ORGANIZATION CONT'D
| Principal Officers who are not Trustees (continued) | |
|
Name and
Date of Birth | | Position(s)
with the
Trust and
the Portfolio | | Term of
Office and
Length of
Service | | Principal Occupation(s)
During Past Five Years | |
| Duncan W. Richardson 10/26/57 | | Vice President of the Trust | | Since 2001 | | Executive Vice President and Chief Equity Investment Officer of EVC, EVM and BMR. Officer of 81 registered investment companies managed by EVM or BMR. | |
|
| Craig P. Russ 10/30/63 | | Vice President of the Portfolio | | Since 2007 | | Vice President of EVM and BMR. Officer of 6 registered investment companies managed by EVM or BMR. | |
|
| Judith A. Saryan 8/21/54 | | Vice President of the Trust | | Since 2003 | | Vice President of EVM and BMR. Officer of 55 registered investment companies managed by EVM or BMR. | |
|
| Susan Schiff 3/13/61 | | Vice President of the Trust | | Since 2002 | | Vice President of EVM and BMR. Officer of 36 registered investment companies managed by EVM or BMR. | |
|
| Thomas Seto 9/27/62 | | Vice President of the Trust | | Since 2007 | | Vice President and Director of Portfolio Management of Parametric. Officer of 31 registered investment companies managed by EVM or BMR. | |
|
| David M. Stein 5/4/51 | | Vice President of the Trust | | Since 2007 | | Managing Director and Chief Investment Officer of Parametric. Officer of 31 registered investment companies managed by EVM or BMR. | |
|
| Mark S. Venezia 5/23/49 | | Vice President of the Trust | | Since 2007 | | Vice President of EVM and BMR. Officer of 36 registered investment companies managed by EVM or BMR. | |
|
| Adam A. Weigold 3/22/75 | | Vice President of the Trust | | Since 2007 | | Vice President of EVM and BMR. Officer of 71 registered investment companies managed by EVM or BMR. | |
|
| Barbara E. Campbell 6/19/57 | | Treasurer | | Of the Trust since 2005 and of the Portfolio since 2008(2) | | Vice President of EVM and BMR. Officer of 173 registered investment companies managed by EVM or BMR. | |
|
| Maureen A. Gemma 5/24/60 | | Secretary and Chief Legal Officer | | Secretary since 2007 and Chief Legal Officer since 2008 | | Vice President of EVM and BMR. Officer of 173 registered investment companies managed by EVM or BMR. | |
|
| Paul M. O'Neil 7/11/53 | | Chief Compliance Officer | | Since 2004 | | Vice President of EVM and BMR. Officer of 173 registered investment companies managed by EVM or BMR. | |
|
(1) Includes both master and feeder funds in a master-feeder structure.
(2) Prior to 2008, Ms. Campbell served as Assistant Treasurer of the Portfolio since 1992.
The SAI for the Fund includes additional information about the Trustees and officers of the Fund and the Portfolio and can be obtained without charge on Eaton Vance's website at www.eatonvance.com or by calling 1-800-262-1122.
50
This Page Intentionally Left Blank
This Page Intentionally Left Blank
Investment Adviser of Senior Debt Portfolio
Boston Management and Research
The Eaton Vance Building
255 State Street
Boston, MA 02109
Administrator of Eaton Vance Floating-Rate Advantage Fund
Eaton Vance Management
The Eaton Vance Building
255 State Street
Boston, MA 02109
Principal Underwriter
Eaton Vance Distributors, Inc.
The Eaton Vance Building
255 State Street
Boston, MA 02109
(617) 482-8260
Custodian
State Street Bank and Trust Company
200 Clarendon Street
Boston, MA 02116
Transfer Agent
PNC Global Investment Servicing
Attn: Eaton Vance Funds
P.O. Box 9653
Providence, RI 02940-9653
(800) 262-1122
Independent Registered Public Accounting Firm
Deloitte & Touche LLP
200 Berkeley Street
Boston, MA 02116-5022
Eaton Vance Floating-Rate Advantage Fund
The Eaton Vance Building
255 State Street
Boston, MA 02109
This report must be preceded or accompanied by a current prospectus. Before investing, investors should consider carefully the Fund's investment objective(s), risks, and charges and expenses. The Fund's current prospectus contains this and other information about the Fund and is available through your financial advisor. Please read the prospectus carefully before you invest or send money. For further information please call 1-800-262-1122.
3232-12/08 FRASRC
Item 2. Code of Ethics
The registrant has adopted a code of ethics applicable to its Principal Executive Officer, Principal Financial Officer and Principal Accounting Officer. The registrant undertakes to provide a copy of such code of ethics to any person upon request, without charge, by calling 1-800-262-1122.
Item 3. Audit Committee Financial Expert
The registrant’s Board has designated William H. Park, an independent trustee, as its audit committee financial expert. Mr. Park is a certified public accountant who is the Vice Chairman of Commercial Industrial Finance Corp (specialty finance company). Previously, he served as President and Chief Executive Officer of Prizm Capital Management, LLC (investment management firm) and as Executive Vice President and Chief Financial Officer of United Asset Management Corporation (“UAM”) (a holding company owning institutional investment management firms).
Item 4. Principal Accountant Fees and Services
(a)-(d)
Eaton Vance Tax-Managed Small Cap Value Fund, Eaton Vance Tax-Managed Mid-Cap Core Fund, Eaton Vance Multi-Cap Opportunity Fund, Eaton Vance Tax-Managed Value Fund, Eaton Vance Tax-Managed International Equity Fund, Eaton Vance Tax-Managed Small-Cap Growth Fund, Eaton Vance Tax-Managed Equity Asset Allocation Fund, Eaton Vance High Income Fund, Eaton Vance Floating-Rate Fund, Eaton Vance Floating-Rate High Income Fund, Eaton Vance Floating-Rate Advantage Fund, Eaton Vance Strategic Income Fund, Eaton Vance Global Macro Fund, Eaton Vance Emerging Markets Local Income Fund, Eaton Vance International Income Fund, Eaton Vance Low Duration Fund, Eaton Vance Government Obligations Fund, Eaton Vance Diversified Income Fund, Eaton Vance Equity Research Fund ,Eaton Vance Tax-Managed Dividend Income Fund , Eaton Vance Dividend Income Fund, Eaton Vance International Equity Fund and Eaton Vance Structured Emerging Markets Fund, Eaton Vance Cash Management Fund, Eaton Vance Money Market Fund (the “Fund(s)”) are series of Eaton Vance Mutual Funds Trust (the “Trust”), a Massachusetts business trust, which, including the Funds, contains a total of 29 series (the “Series”). The Trust is registered under the Investment Company Act of 1940 as an open-end management investment company. This Form N-CSR relates to the Funds’ annual reports.
With the exception of Floating-Rate Advantage Fund, the following tables present the aggregate fees billed to each Fund for the Fund’s respective fiscal years ended October 31, 2007 and October 31, 2008 or for those Funds which have not completed two years of operations, for such fiscal periods as indicated on the following tables, by the Fund’s principal accountant for professional services rendered for the audit of the Fund’s annual financial statements and fees billed for other services rendered by the principal accountant during those periods. In 2007, Eaton Vance Cash Management Fund and Eaton Vance Money Market Fund changed their fiscal year ends from December 31 to October 31. The Eaton Vance Global Macro Fund, Eaton Vance Emerging Markets Local Income Fund, and Eaton Vance International Income Fund commenced operations June 27, 2007. The Eaton Vance Floating-Rate Advantage Fund commenced operations on the close of business on March 14, 2008. Accordingly the tables for these Funds show fee information for the fiscal years ended October 31, 2007, October 31, 2008, respectively.
Eaton Vance Tax-Managed Small-Cap Value Fund
Fiscal Years Ended | | 10/31/07 | | 10/31/08 | |
| | | | | |
Audit Fees | | $ | 10,410 | | $ | 11,260 | |
| | | | | |
Audit-Related Fees(1) | | 0 | | 0 | |
| | | | | |
Tax Fees(2) | | 6,541 | | 6,770 | |
| | | | | |
All Other Fees(3) | | 0 | | 0 | |
| | | | | |
Total | | $ | 16,951 | | $ | 18,030 | |
Eaton Vance Tax-Managed Mid-Cap Core Fund
Fiscal Years Ended | | 10/31/07 | | 10/31/08 | |
| | | | | |
Audit Fees | | $ | 10,410 | | $ | 11,260 | |
| | | | | |
Audit-Related Fees(1) | | 0 | | 0 | |
| | | | | |
Tax Fees(2) | | 6,769 | | 7,010 | |
| | | | | |
All Other Fees(3) | | 0 | | 0 | |
| | | | | |
Total | | $ | 17,179 | | $ | 18,270 | |
Eaton Vance Tax-Managed Multi-Cap Growth Fund
Fiscal Years Ended | | 10/31/07 | | 10/31/08 | |
| | | | | |
Audit Fees | | $ | 12,620 | | $ | 13,550 | |
| | | | | |
Audit-Related Fees(1) | | 0 | | 0 | |
| | | | | |
Tax Fees(2) | | 6,541 | | 6,770 | |
| | | | | |
All Other Fees(3) | | 0 | | 0 | |
| | | | | |
Total | | $ | 19,161 | | $ | 20,320 | |
Eaton Vance Tax-Managed Value Fund
Fiscal Years Ended | | 10/31/07 | | 10/31/08 | |
| | | | | |
Audit Fees | | $ | 13,880 | | $ | 15,850 | |
| | | | | |
Audit-Related Fees(1) | | 0 | | 0 | |
| | | | | |
Tax Fees(2) | | 6,769 | | 7,010 | |
| | | | | |
All Other Fees(3) | | 0 | | 0 | |
| | | | | |
Total | | $ | 20,649 | | $ | 22,860 | |
Eaton Vance Tax-Managed International Equity Fund
Fiscal Years Ended | | 10/31/07 | | 10/31/08 | |
| | | | | |
Audit Fees | | $ | 13,880 | | $ | 13,550 | |
| | | | | |
Audit-Related Fees(1) | | 0 | | 0 | |
| | | | | |
Tax Fees(2) | | 6,655 | | 6,890 | |
| | | | | |
All Other Fees(3) | | 0 | | 0 | |
| | | | | |
Total | | $ | 20,535 | | $ | 20,440 | |
Eaton Vance Tax-Managed Small-Cap Fund
Fiscal Years Ended | | 10/31/07 | | 10/31/08 | |
| | | | | |
Audit Fees | | $ | 16,880 | | $ | 17,960 | |
| | | | | |
Audit-Related Fees(1) | | 0 | | 0 | |
| | | | | |
Tax Fees(2) | | 6,769 | | 7,010 | |
| | | | | |
All Other Fees(3) | | 0 | | 0 | |
| | | | | |
Total | | $ | 23,649 | | $ | 24,970 | |
Eaton Vance Tax Managed Equity Asset Allocation Fund
Fiscal Years Ended | | 10/31/07 | | 10/31/08 | |
| | | | | |
Audit Fees | | $ | 51,880 | | $ | 51,835 | |
| | | | | |
Audit-Related Fees(1) | | 0 | | 0 | |
| | | | | |
Tax Fees(2) | | 18,050 | | 18,690 | |
| | | | | |
All Other Fees(3) | | 0 | | 0 | |
| | | | | |
Total | | $ | 69,930 | | $ | 70,525 | |
Eaton Vance High Income Opportunities Fund
Fiscal Years Ended | | 10/31/07 | | 10/31/08 | |
| | | | | |
Audit Fees | | $ | 13,780 | | $ | 14,850 | |
| | | | | |
Audit-Related Fees(1) | | 0 | | 0 | |
| | | | | |
Tax Fees(2) | | 6,541 | | 6,770 | |
| | | | | |
All Other Fees(3) | | 0 | | 0 | |
| | | | | |
Total | | $ | 20,321 | | $ | 21,620 | |
Eaton Vance Floating-Rate Fund
Fiscal Years Ended | | 10/31/07 | | 10/31/08 | |
| | | | | |
Audit Fees | | $ | 13,530 | | $ | 14,600 | |
| | | | | |
Audit-Related Fees(1) | | 0 | | 0 | |
| | | | | |
Tax Fees(2) | | 6,769 | | 7,010 | |
| | | | | |
All Other Fees(3) | | 0 | | 0 | |
| | | | | |
Total | | $ | 20,299 | | $ | 21,610 | |
Eaton Vance Floating-Rate & High Income Fund
Fiscal Years Ended | | 10/31/07 | | 10/31/08 | |
| | | | | |
Audit Fees | | $ | 13,530 | | $ | 14,600 | |
| | | | | |
Audit-Related Fees(1) | | 0 | | 0 | |
| | | | | |
Tax Fees(2) | | 6,769 | | 7,010 | |
| | | | | |
All Other Fees(3) | | 0 | | 0 | |
| | | | | |
Total | | $ | 20,299 | | $ | 21,610 | |
Eaton Vance Strategic Income Fund
Fiscal Years Ended | | 10/31/07 | | 10/31/08 | |
| | | | | |
Audit Fees | | $ | 30,000 | | $ | 32,085 | |
| | | | | |
Audit-Related Fees(1) | | 0 | | 0 | |
| | | | | |
Tax Fees(2) | | 19,000 | | 19,670 | |
| | | | | |
All Other Fees(3) | | 0 | | 504 | |
| | | | | |
Total | | $ | 49,000 | | $ | 52,259 | |
Eaton Vance Global Macro Fund
Fiscal Years Ended | | 10/31/07 | | 10/31/08 | |
| | | | | |
Audit Fees | | $ | 18,000 | | $ | 19,665 | |
| | | | | |
Audit-Related Fees(1) | | 0 | | 0 | |
| | | | | |
Tax Fees(2) | | 10,000 | | 10,350 | |
| | | | | |
All Other Fees(3) | | 0 | | 0 | |
| | | | | |
Total | | $ | 28,000 | | $ | 30,015 | |
Eaton Vance Emerging Markets Local Income Fund
Fiscal Years Ended | | 10/31/07 | | 10/31/08 | |
| | | | | |
Audit Fees | | $ | 10,500 | | $ | 11,905 | |
| | | | | |
Audit-Related Fees(1) | | 0 | | 0 | |
| | | | | |
Tax Fees(2) | | 8,500 | | 8,800 | |
| | | | | |
All Other Fees(3) | | 0 | | 0 | |
| | | | | |
Total | | $ | 19,000 | | $ | 20,705 | |
Eaton Vance International Income Fund
Fiscal Years Ended | | 10/31/07 | | 10/31/08 | |
| | | | | |
Audit Fees | | $ | 10,500 | | $ | 11,905 | |
| | | | | |
Audit-Related Fees(1) | | 0 | | 0 | |
| | | | | |
Tax Fees(2) | | 8,500 | | 8,800 | |
| | | | | |
All Other Fees(3) | | 0 | | 0 | |
| | | | | |
Total | | $ | 19,000 | | $ | 20,705 | |
Eaton Vance Low Duration Fund
Fiscal Years Ended | | 10/31/07 | | 10/31/08 | |
| | | | | |
Audit Fees | | $ | 24,000 | | $ | 25,875 | |
| | | | | |
Audit-Related Fees(1) | | 0 | | 0 | |
| | | | | |
Tax Fees(2) | | 12,000 | | 12,420 | |
| | | | | |
All Other Fees(3) | | 0 | | 0 | |
| | | | | |
Total | | $ | 36,000 | | $ | 38,295 | |
Eaton Vance Government Obligations Fund
Fiscal Years Ended | | 10/31/07 | | 10/31/08 | |
| | | | | |
Audit Fees | | $ | 24,000 | | $ | 25,875 | |
| | | | | |
Audit-Related Fees(1) | | 0 | | 0 | |
| | | | | |
Tax Fees(2) | | 11,000 | | 11,390 | |
| | | | | |
All Other Fees(3) | | 0 | | 0 | |
| | | | | |
Total | | $ | 35,000 | | $ | 37,265 | |
Eaton Vance Diversified Income Fund
Fiscal Years Ended | | 10/31/07 | | 10/31/08 | |
| | | | | |
Audit Fees | | $ | 20,000 | | $ | 19,665 | |
| | | | | |
Audit-Related Fees(1) | | 0 | | 0 | |
| | | | | |
Tax Fees(2) | | 15,000 | | 16,530 | |
| | | | | |
All Other Fees(3) | | 0 | | 0 | |
| | | | | |
Total | | $ | 35,000 | | $ | 36,195 | |
Eaton Vance Floating-Rate Advantage Fund
Period Ended | | 10/31/08 | |
| | | |
Audit Fees | | $ | 17,585 | |
| | | |
Audit-Related Fees(1) | | 0 | |
| | | |
Tax Fees(2) | | 20,000 | |
| | | |
All Other Fees(3) | | 0 | |
| | | |
Total | | $ | 37,585 | |
Eaton Vance Large-Cap Core Research Fund
Fiscal Years Ended | | 10/31/07 | | 10/31/08 | |
| | | | | |
Audit Fees | | $ | 25,000 | | $ | 24,835 | |
| | | | | |
Audit-Related Fees(1) | | 0 | | 0 | |
| | | | | |
Tax Fees(2) | | 7,800 | | 8,080 | |
| | | | | |
All Other Fees(3) | | 0 | | 5 | |
| | | | | |
Total | | $ | 32,800 | | $ | 32,920 | |
Eaton Vance Tax-Managed Dividend Income Fund
Fiscal Years Ended | | 10/31/07 | | 10/31/08 | |
| | | | | |
Audit Fees | | $ | 49,980 | | $ | 51,315 | |
| | | | | |
Audit-Related Fees(1) | | 0 | | 0 | |
| | | | | |
Tax Fees(2) | | 9,957 | | 10,310 | |
| | | | | |
All Other Fees(3) | | 0 | | 194 | |
| | | | | |
Total | | $ | 59,937 | | $ | 61,819 | |
Eaton Vance Dividend Income Fund
Fiscal Years Ended | | 10/31/07 | | 10/31/08 | |
| | | | | |
Audit Fees | | $ | 12,750 | | $ | 13,690 | |
| | | | | |
Audit-Related Fees(1) | | 0 | | 0 | |
| | | | | |
Tax Fees(2) | | 8,280 | | 8,570 | |
| | | | | |
All Other Fees(3) | | 0 | | 0 | |
| | | | | |
Total | | $ | 21,030 | | $ | 22,260 | |
Eaton Vance International Equity Fund
Fiscal Years Ended | | 10/31/07 | | 10/31/08 | |
| | | | | |
Audit Fees | | $ | 12,750 | | $ | 13,690 | |
| | | | | |
Audit-Related Fees(1) | | 0 | | 0 | |
| | | | | |
Tax Fees(2) | | 8,280 | | 8,570 | |
| | | | | |
All Other Fees(3) | | 0 | | 0 | |
| | | | | |
Total | | $ | 21,030 | | $ | 22,260 | |
Eaton Vance Structured Emerging Markets Fund
Fiscal Years Ended | | 10/31/07 | | 10/31/08 | |
| | | | | |
Audit Fees | | $ | 70,000 | | $ | 71,415 | |
| | | | | |
Audit-Related Fees(1) | | 0 | | 0 | |
| | | | | |
Tax Fees(2) | | 11,000 | | 11,390 | |
| | | | | |
All Other Fees(3) | | 0 | | 0 | |
| | | | | |
Total | | $ | 81,000 | | $ | 82,805 | |
Eaton Vance Cash Management Fund
Fiscal Years Ended | | 12/31/2006 | | 1/1/2007– 10/31/2007 | | 10/31/2008 | |
| | | | | | | |
Audit Fees | | $ | 11,900 | | $ | 15,000 | | $ | 16,555 | |
| | | | | | | |
Audit-Related fees (1) | | $ | 0 | | $ | 0 | | $ | 0 | |
| | | | | | | |
Tax Fees (2) | | $ | 5,875 | | $ | 5,800 | | $ | 6,010 | |
| | | | | | | |
All Other Fees (3) | | $ | 0 | | $ | 0 | | $ | 0 | |
| | | | | | | |
Total | | $ | 17,775 | | $ | 20,800 | | $ | 22,565 | |
Eaton Vance Money Market Fund
Fiscal Years Ended | | 12/31/2006 | | 1/1/2007– 10/31/2007 | | 10/31/2008 | |
| | | | | | | |
Audit Fees | | $ | 11,900 | | $ | 15,000 | | $ | 16,555 | |
| | | | | | | |
Audit-Related fees (1) | | 0 | | 0 | | $ | 0 | |
| | | | | | | |
Tax Fees (2) | | $ | 5,875 | | $ | 5,800 | | $ | 6,010 | |
| | | | | | | |
All Other Fees (3) | | 0 | | 0 | | $ | 0 | |
| | | | | | | |
Total | | $ | 17,775 | | $ | 20,800 | | $ | 22,565 | |
(1) Audit-related fees consist of the aggregate fees billed for assurance and related services that are reasonably related to the performance of the audit of financial statements and are not reported under the category of audit fees.
(2) Tax fees consist of the aggregate fees billed for professional services rendered by the principal accountant relating to tax compliance, tax advice, and tax planning and specifically include fees for tax return preparation.
(3) All other fees consist of the aggregate fees billed for products and services provided by the principal accountant other than audit, audit-related, and tax services.
The various Series comprising the Trust have differing fiscal year ends (October 31 or December 31). The following table presents the aggregate audit, audit-related, tax, and other fees billed to all of the Series in the Trust by each Series’ respective principal accountant for the last two fiscal years of each Series. For certain Series, Pricewaterhouse Coopers was the principal accountant for the fiscal years ended 2006. During the fiscal years ended 2007, Pricewaterhouse Coopers was replaced by D&T.
| | | | | | | | | |
Fiscal Years | | 12/31/06 | | 10/31/07 | | 12/31/07 | | 10/31/08 | |
Ended | | PWC | | D&T | | PWC | | D&T | | PWC | | D&T | | PWC | | D&T | |
| | | | | | | | | | | | | | | | | |
Audit Fees | | $ | 74,200 | | $ | 22,670 | | $ | 0 | | $ | 43,070 | | $ | 0 | | $ | 0 | | $ | 0 | | $ | 939,405 | |
| | | | | | | | | | | | | | | | | |
Audit-Related Fees(1) | | 0 | | 0 | | 0 | | 0 | | 0 | | 0 | | 0 | | 0 | |
| | | | | | | | | | | | | | | | | |
Tax Fees(2) | | $ | 31,500 | | $ | 11,550 | | 0 | | $ | 0 | | $ | 0 | | $ | 0 | | 0 | | $ | 309,560 | |
| | | | | | | | | | | | | | | | | |
All Other Fees(3) | | 0 | | 0 | | 0 | | 0 | | 0 | | 0 | | 0 | | 58,322 | |
| | | | | | | | | | | | | | | | | |
Total | | $ | 105,700 | | $ | 34,220 | | $ | 0 | | $ | 62,360 | | $ | 0 | | $ | 0 | | $ | 0 | | $ | 1,307,287 | |
(1) Audit-related fees consist of the aggregate fees billed for assurance and related services that are reasonably related to the performance of the audit of financial statements and are not reported under the category of audit fees.
(2) Tax fees consist of the aggregate fees billed for professional services rendered by the principal accountant relating to tax compliance, tax advice, and tax planning and specifically include fees for tax return preparation.
(3) All other fees consist of the aggregate fees billed for products and services provided by the principal accountant other than audit, audit-related, and tax services.
During the Funds’ fiscal years ended October 31, 2007 and October 31, 2008, the Fund was billed $35,000 and $40,000 by PwC and D&T, respectively, the principal accountant for the Funds, for work done in connection with its Rule 17Ad-13 examination of Eaton Vance Management’s assertion that it has maintained an effective internal control structure over sub-transfer agent and registrar functions, such services being pre-approved in accordance with Rule 2-01(c)(7)(ii) of Regulation S-X.
(e)(1) The registrant’s audit committee has adopted policies and procedures relating to the pre-approval of services provided by the registrant’s principal accountant (the “Pre-Approval Policies”). The Pre-Approval Policies establish a framework intended to assist the audit committee in the proper discharge of its pre-approval responsibilities. As a general matter, the Pre-Approval Policies (i) specify certain types of audit, audit-related, tax, and other services determined to be pre-approved by the audit committee; and (ii) delineate specific procedures governing the mechanics of the pre-approval process, including the approval and monitoring of audit and non-audit service fees. Unless a service is specifically pre-approved under the Pre-Approval Policies, it must be separately pre-approved by the audit committee.
The Pre-Approval Policies and the types of audit and non-audit services pre-approved therein must be reviewed and ratified by the registrant’s audit committee at least annually. The registrant’s audit
committee maintains full responsibility for the appointment, compensation, and oversight of the work of the registrant’s principal accountant.
(e)(2) No services described in paragraphs (b)-(d) above were approved by the registrant’s audit committee pursuant to the “de minimis exception” set forth in Rule 2-01(c)(7)(i)(C) of Regulation S-X.
(f) Not applicable.
(g) The following table presents (i) the aggregate non-audit fees (i.e., fees for audit-related, tax, and other services) billed for services rendered to all of the Series in the Trust by each Series’s respective principal accountant for the last two fiscal years of each Series; and (ii) the aggregate non-audit fees (i.e., fees for audit-related, tax, and other services) billed to the Eaton Vance organization by each Series’ respective principal accountant for the last 2 fiscal years of each Series. For the fiscal years ended 2006, for certain Series, Pricewaterhouse Coopers was replaced by D&T.
| | | | | | | | | | | | | | | | | |
Fiscal | | | | | | | | | | | | | | | | | |
Years | | 12/31/06 | | 10/31/07 | | 12/31/07 | | 10/31/08 | |
Ended | | PWC | | D&T | | PWC | | D&T | | PWC | | D&T | | PWC | | D&T | |
| | | | | | | | | | | | | | | | | |
Registrant(1) | | $ | 31,500 | | $ | 11,550 | | $ | 0 | | $ | 19,290 | | $ | 0 | | $ | 0 | | $ | 0 | | $ | 367,882 | |
| | | | | | | | | | | | | | | | | |
Eaton Vance(2) | | $ | 83,416 | | $ | 42,100 | | $ | 68,486 | | $ | 72,100 | | $ | 0 | | $ | 0 | | $ | 125,781 | | $ | 317,301 | |
| | | | | | | | | | | | | | | | | |
| | | | | | | | | | | | | | | | | | | | | | | | | | | |
(1) Includes all of the Series of the Trust. During the fiscal years reported above, certain of the Funds were “feeder” funds in a “master-feeder” fund structure or funds of funds.
(2) Various subsidiaries of Eaton Vance Corp. act in either an investment advisory and/or service provider capacity with respect to the Series and/or their respective “master” funds (if applicable).
(h) The registrant’s audit committee has considered whether the provision by the registrant’s principal accountant of non-audit services to the registrant’s investment adviser and any entity controlling, controlled by, or under common control with the adviser that provides ongoing services to the registrant that were not pre-approved pursuant to Rule 2-01(c)(7)(ii) of Regulation S-X is compatible with maintaining the principal accountant’s independence.
Item 5. Audit Committee of Listed registrants
Not required in this filing.
Item 6. Schedule of Investments
Please see schedule of investments contained in the Report to Stockholders included under Item 1 of this Form N-CSR.
Item 7. Disclosure of Proxy Voting Policies and Procedures for Closed-End Management Investment Companies
Not required in this filing.
Item 8. Portfolio Managers of Closed-End Management Investment Companies
Not required in this filing.
Item 9. Purchases of Equity Securities by Closed-End Management Investment Company and Affiliated Purchasers.
Not required in this filing.
Item 10. Submission of Matters to a Vote of Security Holders.
No Material Changes.
Item 11. Controls and Procedures
(a) It is the conclusion of the registrant’s principal executive officer and principal financial officer that the effectiveness of the registrant’s current disclosure controls and procedures (such disclosure controls and procedures having been evaluated within 90 days of the date of this filing) provide reasonable assurance that the information required to be disclosed by the registrant has been recorded, processed, summarized and reported within the time period specified in the Commission’s rules and forms and that the information required to be disclosed by the registrant has been accumulated and communicated to the registrant’s principal executive officer and principal financial officer in order to allow timely decisions regarding required disclosure.
(b) There have been no changes in the registrant’s internal controls over financial reporting during the second fiscal quarter of the period covered by this report that has materially affected, or is reasonably likely to materially affect, the registrant’s internal control over financial reporting.
Item 12. Exhibits
(a)(1) | | Registrant’s Code of Ethics — Not applicable (please see Item 2). |
(a)(2)(i) | | Treasurer’s Section 302 certification. |
(a)(2)(ii) | | President’s Section 302 certification. |
(b) | | Combined Section 906 certification. |
Signatures
Pursuant to the requirements of the Securities Exchange Act of 1934 and the Investment Company Act of 1940, the registrant has duly caused this report to be signed on its behalf by the undersigned, thereunto duly authorized.
Eaton Vance Mutual Funds Trust | |
| |
By: | /s/ Thomas E. Faust Jr. | |
| Thomas E. Faust Jr. | |
| President | |
| | |
| | |
Date: | December 15, 2008 | |
| | |
Pursuant to the requirements of the Securities Exchange Act of 1934 and the Investment Company Act of 1940, this report has been signed below by the following persons on behalf of the registrant and in the capacities and on the dates indicated.
By: | /s/ Barbara E. Campbell | |
| Barbara E. Campbell | |
| Treasurer | |
| | |
| | |
Date: | December 15, 2008 | |
| | |
By: | /s/ Thomas E. Faust Jr. | |
| Thomas E. Faust Jr. | |
| President | |
| | |
| | |
Date: | December 15, 2008 | |