UNITED STATES
SECURITIES AND EXCHANGE COMMISSION
Washington, D.C. 20549
Form N-CSR
CERTIFIED SHAREHOLDER REPORT OF REGISTERED
MANAGEMENT INVESTMENT COMPANIES
Investment Company Act File Number: 811-04015
Eaton Vance Mutual Funds Trust
(Exact Name of Registrant as Specified in Charter)
Two International Place, Boston, Massachusetts 02110
(Address of Principal Executive Offices)
Maureen A. Gemma
Two International Place, Boston, Massachusetts 02110
(Name and Address of Agent for Services)
(617) 482-8260
(Registrant’s Telephone Number)
January 31
Date of Fiscal Year End
January 31, 2014
Date of Reporting Period
Item 1. Reports to Stockholders

| | |
Parametric Global Small-Cap Fund Annual Report January 31, 2014 | | |

Commodity Futures Trading Commission Registration. Effective December 31, 2012, the Commodity Futures Trading Commission (“CFTC”) adopted certain regulatory changes that subject registered investment companies and advisers to regulation by the CFTC if a fund invests more than a prescribed level of its assets in certain CFTC-regulated instruments (including futures, certain options and swap agreements) or markets itself as providing investment exposure to such instruments. The Fund has claimed an exclusion from the definition of the term “commodity pool operator” under the Commodity Exchange Act. Accordingly, neither the Fund nor the adviser with respect to the operation of the Fund is subject to CFTC regulation. Because of its management of other strategies, the Fund’s adviser is registered with the CFTC as a commodity pool operator and a commodity trading advisor.
Fund shares are not insured by the FDIC and are not deposits or other obligations of, or guaranteed by, any depository institution. Shares are subject to investment risks, including possible loss of principal invested.
This report must be preceded or accompanied by a current summary prospectus or prospectus. Before investing, investors should consider carefully the investment objective, risks, and charges and expenses of a mutual fund. This and other important information is contained in the summary prospectus and prospectus, which can be obtained from a financial advisor. Prospective investors should read the prospectus carefully before investing. For further information, please call 1-800-260-0761.
Annual Report January 31, 2014
Parametric Global Small-Cap Fund
Table of Contents
| | | | |
Management’s Discussion of Fund Performance | | | 2 | |
| |
Performance | | | 3 | |
| |
Fund Profile | | | 4 | |
| |
Endnotes and Additional Disclosures | | | 5 | |
| |
Fund Expenses | | | 6 | |
| |
Financial Statements | | | 7 | |
| |
Report of Independent Registered Public Accounting Firm | | | 27 | |
| |
Federal Tax Information | | | 28 | |
| |
Management and Organization | | | 29 | |
| |
Important Notices | | | 32 | |
Parametric Global Small-Cap Fund
January 31, 2014
Management’s Discussion of Fund Performance1
Economic and Market Conditions
As the 12-month period started on February 1, 2013, global stocks, as measured by the MSCI All Country World Index (ACWI)2, had recently begun a rally that would continue well into May, driven largely by strengthening economic data in the U.S., Europe and elsewhere, along with highly accommodative monetary policies by global central banks.
In late May 2013, however, then-U.S. Federal Reserve (the Fed) Chairman Ben Bernanke surprised the markets by indicating that the Fed’s $85 billion in monthly asset purchases, known collectively as quantitative easing (QE), could begin to taper off sooner than most investors had expected. The negative effect on worldwide markets was swift and dramatic. Bond investors rushed to sell assets in anticipation of rising interest rates. The prospect of reduced Fed stimulus weighed on global equities as well, most notably in emerging markets.
By late June 2013, however, global equities, in general, resumed their upward trajectory. Factors contributing to the rally included some backtracking by the Fed on its earlier statements regarding QE, ongoing improvements in housing and other U.S. economic data, and news from Europe that the eurozone had officially come out of recession.
After faltering again in August 2013 amid geopolitical tensions in the Middle East, global equities once more trended upward. In mid-September, the Fed again surprised investors by announcing that it was postponing any tapering of QE for the time being. Global stocks initially surged in response, only to drift downward in late September and early October amid investor uncertainty over the Fed’s intentions and a Congressional impasse that led to a partial U.S. government shutdown on October 1, 2013.
In mid-October, global stocks reversed direction again and began a rally that more or less lasted through the rest of 2013, driven largely by moderate economic growth that seemed to confirm the global recovery was gaining strength. Even the Fed’s mid-December announcement that tapering of QE would begin in January 2014 did not derail the rally, as investors appeared relieved that the tapering would be gradual and that the Fed still intended to keep short-term interest rates near zero for an extended period.
However, when the Fed announced further tapering toward the end of January, the reaction from global markets was
more negative. Although the Fed’s latest move was widely expected, many investors worried about continued withdrawal of stimulus in the face of recent turmoil in emerging markets and some mixed economic data. Against this backdrop, the MSCI ACWI slid 4.00% for the month of January 2014.
For the full 12-month period, the MSCI ACWI returned 12.70%. In the U.S., the S&P 500 Index gained 21.52%, achieving multiple all-time closing highs along the way. The nascent European recovery helped power the FTSE Eurotop 100 Index to a 12.59% return. In response to Prime Minister Shinzo Abe’s stimulus efforts, Japan’s Nikkei-225 Stock Average advanced 19.82%. Elsewhere in the Asia-Pacific region, the MSCI Golden Dragon Index declined 2.32% amid slowing growth in China. Emerging markets were among the period’s worst performers, with the MSCI Emerging Markets Index falling 10.17%.
Fund Performance
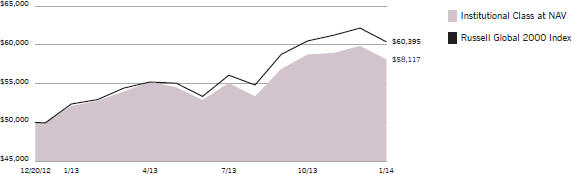
For the 12-month period ended January 31, 2014, Parametric Global Small-Cap Fund (the Fund) had a total return of 11.50% for Institutional Class shares at net asset value (NAV), underperforming the 15.30% return of the Fund’s benchmark, the Russell Global 2000 Index (the Index).
Factors detracting from the Fund’s performance relative to the Index included an underweight position in the United States, where equity markets generally rallied during the 12-month period on continued positive economic and political developments. Overweight positions in Chile, Thailand and Indonesia also detracted from the Fund’s performance versus the Index. Chile, which accounts for nearly one-third of the global copper supply, experienced faltering economic growth during the period amid weaker commodity prices, while Thailand and Indonesia were both beset by political woes.
Factors contributing to the Fund’s performance relative to the Index included an underweight position in the financials sector, which lagged the overall Index for the 12-month period. An underweight position in Australia, whose market was dragged down by poor results among commodity-related stocks, also contributed to the Fund’s performance versus the Index, as did an overweight position in Denmark, whose market was boosted by turnaround results at Vestas Wind Systems. The company makes up a large share of the Index’s Denmark weighting.
See Endnotes and Additional Disclosures in this report.
Past performance is no guarantee of future results. Returns are historical and are calculated by determining the percentage change in net asset value (NAV) or offering price (as applicable) with all distributions reinvested. Investment return and principal value will fluctuate so that shares, when redeemed, may be worth more or less than their original cost. Performance less than one year is cumulative. Performance is for the stated time period only; due to market volatility, the Fund’s current performance may be lower or higher than quoted. Returns are before taxes unless otherwise noted. For performance as of the most recent month end, please refer to eatonvance.com.
Parametric Global Small-Cap Fund
January 31, 2014
Performance2,3
Portfolio Managers David Stein, Ph.D. and Thomas Seto, each of Parametric Portfolio Associates LLC
| | | | | | | | | | | | | | | | | | | | |
| % Average Annual Total Returns | | Class
Inception Date | | | Performance
Inception Date | | | One Year | | | Five Years | | | Since
Inception | |
Institutional Class at NAV | | | 12/20/2012 | | | | 12/20/2012 | | | | 11.50 | % | | | — | | | | 14.44 | % |
Russell Global 2000 Index | | | — | | | | — | | | | 15.30 | % | | | 19.68 | % | | | 18.46 | % |
| | | | | |
| | | | | | | | | | | | | | | | | | | | |
| % Total Annual Operating Expense Ratios4 | | | | | | | | | | | | | | Institutional
Class | |
Gross | | | | | | | | | | | | | | | | | | | 1.00 | % |
Net | | | | | | | | | | | | | | | | | | | 0.85 | |
Growth of $50,000
This graph shows the change in value of a hypothetical investment of $50,000 in Institutional Class of the Fund for the period indicated. For comparison, the same investment is shown in the indicated index.
See Endnotes and Additional Disclosures in this report.
Past performance is no guarantee of future results. Returns are historical and are calculated by determining the percentage change in net asset value (NAV) or offering price (as applicable) with all distributions reinvested. Investment return and principal value will fluctuate so that shares, when redeemed, may be worth more or less than their original cost. Performance less than one year is cumulative. Performance is for the stated time period only; due to market volatility, the Fund’s current performance may be lower or higher than quoted. Returns are before taxes unless otherwise noted. For performance as of the most recent month end, please refer to eatonvance.com.
Parametric Global Small-Cap Fund
January 31, 2014
Fund Profile
Sector Allocation (% of net assets)5
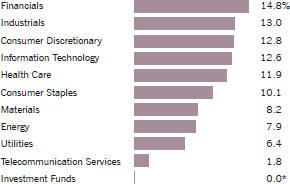
*Amount is less than 0.05%.
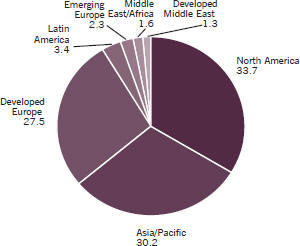
Geographic Allocation (% of common stocks)
Top 10 Holdings (% of net assets)5
| | | | |
Wirecard AG | | | 0.3 | % |
Isis Pharmaceuticals, Inc. | | | 0.3 | |
SouFun Holdings, Ltd. ADR | | | 0.3 | |
Arcadis NV | | | 0.3 | |
WH Smith PLC | | | 0.3 | |
Alnylam Pharmaceuticals, Inc. | | | 0.3 | |
Advantech Co., Ltd. | | | 0.3 | |
Targa Resources Corp. | | | 0.3 | |
Flughafen Zuerich AG | | | 0.3 | |
ICON PLC | | | 0.3 | |
Total | | | 3.0 | % |
See Endnotes and Additional Disclosures in this report.
Parametric Global Small-Cap Fund
January 31, 2014
Endnotes and Additional Disclosures
| 1 | The views expressed in this report are those of the portfolio manager(s) and are current only through the date stated at the top of this page. These views are subject to change at any time based upon market or other conditions, and Eaton Vance and the Fund(s) disclaim any responsibility to update such views. These views may not be relied upon as investment advice and, because investment decisions are based on many factors, may not be relied upon as an indication of trading intent on behalf of any Eaton Vance fund. This commentary may contain statements that are not historical facts, referred to as “forward looking statements”. The Fund’s actual future results may differ significantly from those stated in any forward looking statement, depending on factors such as changes in securities or financial markets or general economic conditions, the volume of sales and purchases of Fund shares, the continuation of investment advisory, administrative and service contracts, and other risks discussed from time to time in the Fund’s filings with the Securities and Exchange Commission. |
| 2 | MSCI All Country World Index is an unmanaged free float-adjusted market-capitalization-weighted index designed to measure the equity market performance of developed and emerging markets. MSCI Golden Dragon Index is an unmanaged index of common stocks traded in China, Hong Kong and Taiwan. MSCI Emerging Markets Index is an unmanaged index of emerging markets common stocks. MSCI indices are net of foreign withholding taxes. Source: MSCI. MSCI data may not be reproduced or used for any other purpose. MSCI provides no warranties, has not prepared or approved this report, and has no liability hereunder. S&P 500 Index is an unmanaged index of large-cap stocks commonly used as a measure of U.S. stock market performance. FTSE Eurotop 100 Index is a tradable index designed to represent the performance of the 100 most highly capitalized blue-chip companies in Europe. The return for the FTSE Eurotop 100 Index is calculated in U.S. dollars. Nikkei-225 Stock Average is an unmanaged, price-weighted average of 225 top-rated Japanese companies listed in the First Section of the Tokyo Stock Exchange. Russell Global 2000 Index is an unmanaged index of 2,000 companies located in the United States, and other developed and emerging markets countries. Unless otherwise stated, index returns do not reflect the effect of any applicable sales charges, commissions, expenses, taxes or leverage, as applicable. It is not possible to invest directly in an index. |
| 3 | Returns are historical and are calculated by determining the percentage change in NAV with all distributions reinvested. Unless otherwise stated, performance does not reflect the deduction of taxes on Fund distributions or redemptions of Fund shares. Performance since inception for an index, if presented, is the performance since the Fund’s or oldest share class’ inception, as applicable. |
| 4 | Source: Fund prospectus. Net expense ratio reflects a contractual expense reimbursement that continues through 5/31/14. Without the reimbursement, performance would have been lower. |
| 5 | Excludes cash and cash equivalents. |
| | Fund profile subject to change due to active management. |
Parametric Global Small-Cap Fund
January 31, 2014
Fund Expenses
Example: As a Fund shareholder, you incur two types of costs: (1) transaction costs, including sales charges (loads) on purchases and redemption fees (if applicable); and (2) ongoing costs, including management fees; distribution and/or service fees; and other Fund expenses. This Example is intended to help you understand your ongoing costs (in dollars) of Fund investing and to compare these costs with the ongoing costs of investing in other mutual funds. The Example is based on an investment of $1,000 invested at the beginning of the period and held for the entire period (August 1, 2013 – January 31, 2014).
Actual Expenses: The first section of the table below provides information about actual account values and actual expenses. You may use the information in this section, together with the amount you invested, to estimate the expenses that you paid over the period. Simply divide your account value by $1,000 (for example, an $8,600 account value divided by $1,000 = 8.6), then multiply the result by the number in the first section under the heading entitled “Expenses Paid During Period” to estimate the expenses you paid on your account during this period.
Hypothetical Example for Comparison Purposes: The second section of the table below provides information about hypothetical account values and hypothetical expenses based on the actual Fund expense ratio and an assumed rate of return of 5% per year (before expenses), which is not the actual Fund return. The hypothetical account values and expenses may not be used to estimate the actual ending account balance or expenses you paid for the period. You may use this information to compare the ongoing costs of investing in your Fund and other funds. To do so, compare this 5% hypothetical example with the 5% hypothetical examples that appear in the shareholder reports of the other funds.
Please note that the expenses shown in the table are meant to highlight your ongoing costs only and do not reflect any transactional costs, such as sales charges (loads) or redemption fees (if applicable). Therefore, the second section of the table is useful in comparing ongoing costs only, and will not help you determine the relative total costs of owning different funds. In addition, if these transactional costs were included, your costs would be higher.
| | | | | | | | | | | | | | | | |
| | | Beginning
Account Value
(8/1/13) | | | Ending
Account Value
(1/31/14) | | | Expenses Paid
During Period*
(8/1/13 – 1/31/14) | | | Annualized
Expense
Ratio | |
| | | | |
| | | | | | | | | | | | | | | | |
Actual | | | | | | | | | | | | | |
Institutional Class | | $ | 1,000.00 | | | $ | 1,055.30 | | | $ | 4.40 | ** | | | 0.85 | % |
| | | | | | | | | | | | | | | | | |
| | | | |
| | | | | | | | | | | | | | | | |
Hypothetical | | | | | | | | | | | | | |
(5% return per year before expenses) | | | | | | | | | | | | | |
Institutional Class | | $ | 1,000.00 | | | $ | 1,020.90 | | | $ | 4.33 | ** | | | 0.85 | % |
| * | Expenses are equal to the Fund’s annualized expense ratio for the indicated Class, multiplied by the average account value over the period, multiplied by 184/365 (to reflect the one-half year period). The Example assumes that the $1,000 was invested at the net asset value per share determined at the close of business on July 31, 2013. |
| ** | Absent an allocation of certain expenses to affiliates, the expenses would be higher. |
Parametric Global Small-Cap Fund
January 31, 2014
Portfolio of Investments
| | | | | | | | |
| Common Stocks — 97.5% | |
| | |
| | | | | | | | |
| Security | | Shares | | | Value | |
| | | | | | | | |
|
Australia — 2.2% | |
Adelaide Brighton, Ltd. | | | 1,852 | | | $ | 6,129 | |
Ansell, Ltd. | | | 130 | | | | 2,179 | |
Aristocrat Leisure, Ltd. | | | 984 | | | | 3,919 | |
Aurora Oil & Gas, Ltd.(1) | | | 2,288 | | | | 5,471 | |
Beach Energy, Ltd. | | | 6,515 | | | | 8,117 | |
carsales.com, Ltd. | | | 1,058 | | | | 8,349 | |
Challenger Ltd. | | | 813 | | | | 4,263 | |
David Jones, Ltd. | | | 1,671 | | | | 4,371 | |
Downer EDI, Ltd. | | | 935 | | | | 4,028 | |
DUET Group | | | 4,931 | | | | 8,994 | |
DuluxGroup, Ltd. | | | 2,698 | | | | 12,638 | |
Energy Resources of Australia, Ltd.(1) | | | 3,794 | | | | 4,194 | |
Goodman Fielder, Ltd. | | | 6,341 | | | | 3,777 | |
Investa Office Fund | | | 2,551 | | | | 6,922 | |
Iress, Ltd. | | | 881 | | | | 6,932 | |
Mesoblast, Ltd.(1) | | | 791 | | | | 4,071 | |
Mineral Resources, Ltd. | | | 398 | | | | 3,919 | |
Myer Holdings, Ltd. | | | 1,814 | | | | 4,011 | |
Regis Resources, Ltd. | | | 1,971 | | | | 4,562 | |
TPG Telecom, Ltd. | | | 2,627 | | | | 12,408 | |
Transpacific Industries Group, Ltd.(1) | | | 4,376 | | | | 4,270 | |
Wotif.com Holdings, Ltd. | | | 998 | | | | 2,127 | |
| | |
| | | | | | $ | 125,651 | |
| | |
|
Austria — 1.1% | |
CA Immobilien Anlagen AG(1) | | | 879 | | | $ | 15,290 | |
Conwert Immobilien Invest SE(1) | | | 881 | | | | 11,411 | |
Kapsch TrafficCom AG | | | 97 | | | | 5,354 | |
RHI AG | | | 324 | | | | 10,614 | |
Schoeller-Bleckmann Oilfield Equipment AG | | | 102 | | | | 10,649 | |
Wienerberger AG | | | 758 | | | | 11,995 | |
| | |
| | | | | | $ | 65,313 | |
| | |
|
Belgium — 0.9% | |
Barco NV | | | 73 | | | $ | 5,529 | |
Befimmo SCA Sicafi | | | 112 | | | | 7,628 | |
Bekaert SA NV | | | 221 | | | | 7,608 | |
Cofinimmo | | | 72 | | | | 8,374 | |
EVS Broadcast Equipment SA | | | 129 | | | | 7,726 | |
Gimv NV | | | 47 | | | | 2,337 | |
KBC Ancora(1) | | | 183 | | | | 6,939 | |
ThromboGenics NV(1) | | | 220 | | | | 5,549 | |
| | |
| | | | | | $ | 51,690 | |
| | |
| | | | | | | | |
| Security | | Shares | | | Value | |
| | | | | | | | |
|
Brazil — 1.3% | |
Abril Educacao SA | | | 200 | | | $ | 2,376 | |
Aliansce Shopping Centers SA | | | 500 | | | | 3,389 | |
Anhanguera Educacional Participacoes SA | | | 800 | | | | 4,208 | |
BR Properties SA | | | 500 | | | | 3,525 | |
Brasil Insurance Participacoes e Administracao SA | | | 500 | | | | 3,931 | |
Brasil Pharma SA(1) | | | 1,900 | | | | 3,947 | |
Cia de Saneamento de Minas Gerais-COPASA | | | 500 | | | | 6,530 | |
Diagnosticos da America SA | | | 800 | | | | 4,917 | |
Equatorial Energia SA | | | 900 | | | | 8,268 | |
Fleury SA | | | 700 | | | | 5,341 | |
Grendene SA | | | 700 | | | | 4,628 | |
JHSF Participacoes SA | | | 1,400 | | | | 2,326 | |
LPS Brasil Consultoria de Imoveis SA | | | 500 | | | | 2,602 | |
Mahle-Metal Leve SA Industria e Comercio | | | 500 | | | | 5,078 | |
Marcopolo SA, PFC Shares | | | 1,800 | | | | 3,867 | |
MRV Engenharia e Participacoes SA | | | 1,000 | | | | 3,404 | |
PDG Realty SA Empreendimentos e Participacoes(1) | | | 5,200 | | | | 3,585 | |
Raia Drogasil SA | | | 500 | | | | 3,001 | |
Santos Brasil Participacoes SA | | | 300 | | | | 2,030 | |
| | |
| | | | | | $ | 76,953 | |
| | |
|
Canada — 3.3% | |
Africa Oil Corp.(1) | | | 1,503 | | | $ | 11,079 | |
AGF Management, Ltd. | | | 356 | | | | 3,644 | |
Alamos Gold, Inc. | | | 341 | | | | 3,129 | |
Allied Properties Real Estate Investment Trust | | | 181 | | | | 5,314 | |
Birchcliff Energy, Ltd.(1) | | | 378 | | | | 2,868 | |
Bonterra Energy Corp. | | | 78 | | | | 3,596 | |
Canfor Corp.(1) | | | 371 | | | | 9,550 | |
Capital Power Corp. | | | 566 | | | | 11,582 | |
CCL Industries, Inc. | | | 178 | | | | 12,842 | |
Celestica, Inc.(1) | | | 500 | | | | 4,961 | |
China Gold International Resources Corp, Ltd.(1) | | | 3,556 | | | | 10,153 | |
Cineplex, Inc. | | | 59 | | | | 2,145 | |
Constellation Software Inc./Canada | | | 24 | | | | 5,157 | |
Dollarama, Inc. | | | 107 | | | | 8,070 | |
Enbridge Income Fund Holdings, Inc. | | | 226 | | | | 5,014 | |
Enerflex, Ltd. | | | 317 | | | | 4,412 | |
First Majestic Silver Corp.(1) | | | 1,109 | | | | 11,581 | |
Freehold Royalties, Ltd. | | | 229 | | | | 4,593 | |
Gibson Energy, Inc. | | | 96 | | | | 2,334 | |
Gran Tierra Energy, Inc.(1) | | | 1,363 | | | | 10,292 | |
Home Capital Group, Inc. | | | 95 | | | | 6,583 | |
Imperial Metals Corp.(1) | | | 684 | | | | 10,330 | |
Just Energy Group, Inc. | | | 622 | | | | 4,362 | |
MacDonald Dettwiler & Associates, Ltd. | | | 57 | | | | 4,049 | |
Mullen Group, Ltd. | | | 179 | | | | 4,339 | |
| | | | |
| | 7 | | See Notes to Financial Statements. |
Parametric Global Small-Cap Fund
January 31, 2014
Portfolio of Investments — continued
| | | | | | | | |
| Security | | Shares | | | Value | |
| | | | | | | | |
|
Canada (continued) | |
North West Co., Inc. (The) | | | 352 | | | $ | 8,034 | |
Northland Power, Inc. | | | 529 | | | | 7,737 | |
Parkland Fuel Corp. | | | 302 | | | | 4,875 | |
Pason Systems, Inc. | | | 201 | | | | 4,539 | |
RONA, Inc. | | | 382 | | | | 4,284 | |
| | |
| | | | | | $ | 191,448 | |
| | |
|
Chile — 1.1% | |
Banmedica SA | | | 4,183 | | | $ | 7,149 | |
Besalco SA | | | 3,333 | | | | 2,735 | |
CFR Pharmaceuticals SA | | | 22,688 | | | | 4,587 | |
Forus SA | | | 1,039 | | | | 4,676 | |
Inversiones Aguas Metropolitanas SA | | | 4,857 | | | | 7,845 | |
Parque Arauco SA | | | 3,727 | | | | 6,363 | |
Ripley Corp. SA | | | 8,187 | | | | 4,587 | |
Salfacorp SA | | | 2,928 | | | | 2,507 | |
Sigdo Koppers SA | | | 2,516 | | | | 3,538 | |
Sonda SA | | | 4,259 | | | | 8,437 | |
Vina Concha y Toro SA | | | 5,444 | | | | 9,886 | |
| | |
| | | | | | $ | 62,310 | |
| | |
|
China — 2.7% | |
Anton Oilfield Services (Group), Ltd. | | | 16,000 | | | $ | 10,252 | |
Beijing Enterprises Water Group, Ltd. | | | 14,000 | | | | 7,870 | |
China Foods, Ltd.(1) | | | 8,000 | | | | 2,837 | |
China Gas Holdings, Ltd. | | | 10,000 | | | | 14,010 | |
China Medical System Holdings, Ltd. | | | 14,000 | | | | 16,104 | |
China Modern Dairy Holdings, Ltd.(1) | | | 9,000 | | | | 4,180 | |
China Power International Development, Ltd. | | | 19,000 | | | | 6,391 | |
Dah Chong Hong Holdings, Ltd. | | | 5,000 | | | | 2,936 | |
Giant Interactive Group, Inc. ADR | | | 475 | | | | 5,230 | |
Kingsoft Corp, Ltd. | | | 4,000 | | | | 13,027 | |
Shenguan Holdings Group, Ltd. | | | 10,000 | | | | 4,410 | |
Sino Biopharmaceutical, Ltd. | | | 20,000 | | | | 16,831 | |
SouFun Holdings, Ltd. ADR | | | 244 | | | | 19,859 | |
Towngas China Co., Ltd. | | | 11,000 | | | | 12,815 | |
Uni-President China Holdings, Ltd. | | | 8,000 | | | | 7,247 | |
Vipshop Holdings, Ltd. ADR(1) | | | 71 | | | | 7,461 | |
Yingde Gases Group Co. | | | 9,500 | | | | 8,331 | |
| | |
| | | | | | $ | 159,791 | |
| | |
|
Denmark — 0.9% | |
D/S Norden A/S | | | 344 | | | $ | 16,074 | |
Genmab AS(1) | | | 274 | | | | 10,909 | |
| | | | | | | | |
| Security | | Shares | | | Value | |
| | | | | | | | |
|
Denmark (continued) | |
NKT Holding A/S | | | 269 | | | $ | 15,650 | |
Sydbank A/S(1) | | | 438 | | | | 11,161 | |
| | |
| | | | | | $ | 53,794 | |
| | |
|
Finland — 1.6% | |
Amer Sports Oyj | | | 600 | | | $ | 12,383 | |
Huhtamaki Oyj | | | 655 | | | | 16,246 | |
Kemira Oyj | | | 790 | | | | 10,994 | |
Konecranes Oyj | | | 244 | | | | 8,584 | |
Outotec Oyj | | | 340 | | | | 3,463 | |
Ramirent Oyj | | | 365 | | | | 4,321 | |
Tieto Oyj | | | 591 | | | | 12,976 | |
Tikkurila Oyj | | | 516 | | | | 12,934 | |
Uponor Oyj | | | 745 | | | | 11,920 | |
| | |
| | | | | | $ | 93,821 | |
| | |
|
France — 1.7% | |
Alten SA | | | 168 | | | $ | 7,565 | |
Eurofins Scientific | | | 67 | | | | 17,044 | |
Havas SA | | | 1,085 | | | | 8,504 | |
Ingenico | | | 191 | | | | 16,389 | |
IPSOS | | | 159 | | | | 6,816 | |
Medica SA | | | 92 | | | | 2,634 | |
Orpea | | | 44 | | | | 2,411 | |
Rubis SCA | | | 174 | | | | 11,297 | |
Societe d’Edition de Canal | | | 781 | | | | 6,183 | |
UBISOFT Entertainment(1) | | | 575 | | | | 8,027 | |
Virbac SA | | | 49 | | | | 10,943 | |
| | |
| | | | | | $ | 97,813 | |
| | |
|
Germany — 2.2% | |
BayWa AG | | | 46 | | | $ | 2,397 | |
Carl Zeiss Meditec AG | | | 305 | | | | 8,933 | |
Deutsche EuroShop AG | | | 269 | | | | 11,354 | |
Deutsche Wohnen AG(1) | | | 459 | | | | 8,345 | |
Deutsche Wohnen AG | | | 308 | | | | 5,764 | |
Dialog Semiconductor PLC(1) | | | 333 | | | | 6,459 | |
DMG Mori Seiki AG | | | 223 | | | | 7,175 | |
Duerr AG | | | 153 | | | | 12,848 | |
Freenet AG(1) | | | 468 | | | | 14,269 | |
Gerry Weber International AG | | | 239 | | | | 10,620 | |
KWS Saat AG | | | 30 | | | | 10,087 | |
Pfeiffer Vacuum Technology AG | | | 51 | | | | 6,051 | |
Vossloh AG | | | 59 | | | | 5,604 | |
Wirecard AG | | | 458 | | | | 20,018 | |
| | |
| | | | | | $ | 129,924 | |
| | |
| | | | |
| | 8 | | See Notes to Financial Statements. |
Parametric Global Small-Cap Fund
January 31, 2014
Portfolio of Investments — continued
| | | | | | | | |
| Security | | Shares | | | Value | |
| | | | | | | | |
|
Greece — 0.9% | |
Hellenic Telecommunications Organization SA(1) | | | 1,047 | | | $ | 15,306 | |
JUMBO SA(1) | | | 555 | | | | 9,438 | |
Motor Oil (Hellas) Corinth Refineries SA | | | 606 | | | | 6,987 | |
National Bank of Greece SA(1) | | | 695 | | | | 3,077 | |
Titan Cement Co. SA(1) | | | 553 | | | | 14,860 | |
| | |
| | | | | | $ | 49,668 | |
| | |
|
Hong Kong — 2.9% | |
Cafe de Coral Holdings, Ltd. | | | 4,000 | | | $ | 12,259 | |
Chow Sang Sang Holdings International, Ltd. | | | 2,000 | | | | 5,358 | |
CIMC Enric Holdings, Ltd. | | | 6,000 | | | | 9,641 | |
Giordano International, Ltd. | | | 12,000 | | | | 8,611 | |
Great Eagle Holdings, Ltd. | | | 2,000 | | | | 6,548 | |
Hanergy Solar Group, Ltd.(1) | | | 26,000 | | | | 3,699 | |
Hutchison Telecommunications Hong Kong Holdings, Ltd. | | | 26,000 | | | | 9,539 | |
Johnson Electric Holdings, Ltd. | | | 15,000 | | | | 13,426 | |
Luk Fook Holdings (International), Ltd. | | | 4,000 | | | | 12,859 | |
Newocean Energy Holdings, Ltd. | | | 14,000 | | | | 11,943 | |
SA SA International Holdings, Ltd. | | | 12,000 | | | | 11,502 | |
Sinopec Kantons Holdings, Ltd. | | | 10,000 | | | | 11,643 | |
SmarTone Telecommunication Holdings, Ltd. | | | 5,000 | | | | 5,534 | |
Stella International Holdings, Ltd. | | | 3,500 | | | | 8,243 | |
Techtronic Industries Co., Ltd. | | | 6,500 | | | | 16,780 | |
Texwinca Holdings, Ltd. | | | 8,000 | | | | 7,669 | |
Transport International Holdings, Ltd. | | | 3,600 | | | | 7,228 | |
Truly International Holdings | | | 8,000 | | | | 4,406 | |
| | |
| | | | | | $ | 166,888 | |
| | |
|
Indonesia — 1.5% | |
AKR Corporindo Tbk PT | | | 10,500 | | | $ | 3,799 | |
Bank Pembangunan Daerah Jawa Barat Dan Banten Tbk PT | | | 74,000 | | | | 5,546 | |
Bhakti Investama Tbk PT | | | 190,500 | | | | 4,682 | |
Bumi Serpong Damai Tbk PT | | | 51,000 | | | | 6,038 | |
Ciputra Development Tbk PT | | | 106,500 | | | | 7,437 | |
Gajah Tunggal Tbk PT | | | 26,000 | | | | 4,023 | |
Garuda Indonesia Persero Tbk PT(1) | | | 90,500 | | | | 3,574 | |
Global Mediacom Tbk PT | | | 46,500 | | | | 7,025 | |
Holcim Indonesia Tbk PT | | | 17,500 | | | | 2,982 | |
Japfa Comfeed Indonesia Tbk PT | | | 33,000 | | | | 3,760 | |
Jasa Marga (Persero) Tbk PT | | | 18,000 | | | | 7,591 | |
Lippo Karawaci Tbk PT | | | 73,000 | | | | 5,682 | |
Media Nusantara Citra Tbk PT | | | 29,500 | | | | 5,416 | |
Perusahaan Perkebunan London Sumatra Indonesia Tbk PT | | | 31,500 | | | | 4,253 | |
Salim Ivomas Pratama Tbk PT | | | 63,500 | | | | 3,761 | |
Tower Bersama Infrastructure Tbk PT | | | 20,500 | | | | 10,404 | |
| | |
| | | | | | $ | 85,973 | |
| | |
| | | | | | | | |
| Security | | Shares | | | Value | |
| | | | | | | | |
|
Ireland — 1.5% | |
C&C Group PLC | | | 2,151 | | | $ | 12,201 | |
DCC PLC | | | 54 | | | | 2,453 | |
Glanbia PLC | | | 1,127 | | | | 16,361 | |
Grafton Group PLC | | | 1,653 | | | | 16,163 | |
ICON PLC(1) | | | 433 | | | | 18,190 | |
Kingspan Group PLC | | | 737 | | | | 14,071 | |
Smurfit Kappa Group PLC | | | 434 | | | | 10,162 | |
| | |
| | | | | | $ | 89,601 | |
| | |
|
Israel — 1.3% | |
Elbit Systems, Ltd. | | | 84 | | | $ | 4,720 | |
Gazit-Globe, Ltd. | | | 830 | | | | 10,225 | |
Migdal Insurance & Financial Holdings, Ltd. | | | 3,773 | | | | 6,117 | |
Mizrahi Tefahot Bank, Ltd. | | | 457 | | | | 5,566 | |
Oil Refineries, Ltd.(1) | | | 12,316 | | | | 3,520 | |
Osem Investment, Ltd. | | | 588 | | | | 13,058 | |
Paz Oil Co., Ltd. | | | 77 | | | | 11,411 | |
RADWARE, Ltd.(1) | | | 600 | | | | 10,152 | |
SodaStream International, Ltd.(1) | | | 75 | | | | 2,742 | |
Strauss Group, Ltd. | | | 470 | | | | 8,249 | |
| | |
| | | | | | $ | 75,760 | |
| | |
|
Italy — 1.6% | |
Amplifon SpA | | | 1,250 | | | $ | 6,729 | |
Atlantia SpA | | | 555 | | | | 12,624 | |
Banca Generali SpA | | | 173 | | | | 5,287 | |
Banca Popolare di Milano Scarl(1) | | | 6,380 | | | | 3,849 | |
Brunello Cucinelli SpA | | | 340 | | | | 9,266 | |
De’Longhi SpA | | | 554 | | | | 9,096 | |
DiaSorin SpA | | | 88 | | | | 3,947 | |
ERG SpA | | | 683 | | | | 9,385 | |
Iren SPA | | | 3,843 | | | | 5,432 | |
Recordati SpA | | | 1,139 | | | | 17,787 | |
Sorin SpA(1) | | | 3,432 | | | | 10,031 | |
| | |
| | | | | | $ | 93,433 | |
| | |
|
Japan — 8.6% | |
Aica Kogyo Co., Ltd. | | | 600 | | | $ | 11,040 | |
Anritsu Corp. | | | 1,000 | | | | 10,962 | |
Autobacs Seven Co., Ltd. | | | 400 | | | | 6,458 | |
Calbee, Inc. | | | 400 | | | | 9,229 | |
Capcom Co., Ltd. | | | 300 | | | | 5,860 | |
Daifuku Co., Ltd. | | | 500 | | | | 5,919 | |
Enplas Corp. | | | 200 | | | | 13,318 | |
Fancl Corp. | | | 700 | | | | 7,688 | |
| | | | |
| | 9 | | See Notes to Financial Statements. |
Parametric Global Small-Cap Fund
January 31, 2014
Portfolio of Investments — continued
| | | | | | | | |
| Security | | Shares | | | Value | |
| | | | | | | | |
|
Japan (continued) | |
FP Corp. | | | 200 | | | $ | 12,471 | |
Hokkoku Bank, Ltd. (The) | | | 2,000 | | | | 6,650 | |
Hokuetsu Kishu Paper Co., Ltd. | | | 1,000 | | | | 4,356 | |
Hoshizaki Electric Co., Ltd. | | | 400 | | | | 14,226 | |
House Foods Corp. | | | 700 | | | | 10,480 | |
Ito En, Ltd. | | | 400 | | | | 8,615 | |
Itoham Foods, Inc. | | | 1,000 | | | | 4,477 | |
Japan Drilling Co., Ltd. | | | 100 | | | | 5,090 | |
Japan Exchange Group, Inc. | | | 500 | | | | 12,080 | |
Kagoshima Bank, Ltd. (The) | | | 1,000 | | | | 5,987 | |
Kakaku.com, Inc. | | | 400 | | | | 7,564 | |
Kaken Pharmaceutical Co., Ltd. | | | 1,000 | | | | 16,019 | |
Kenedix, Inc.(1) | | | 2,300 | | | | 9,184 | |
Kewpie Corp. | | | 800 | | | | 11,389 | |
Kissei Pharmaceutical Co., Ltd. | | | 400 | | | | 9,438 | |
Kobayashi Pharmaceutical Co., Ltd. | | | 200 | | | | 10,849 | |
Komeri Co., Ltd. | | | 200 | | | | 4,738 | |
Kose Corp. | | | 500 | | | | 15,690 | |
KYORIN Holdings, Inc. | | | 300 | | | | 6,718 | |
LEOPALACE21 Corp.(1) | | | 1,800 | | | | 9,384 | |
Lion Corp. | | | 2,000 | | | | 10,450 | |
M3, Inc. | | | 2 | | | | 5,865 | |
Maeda Road Construction Co., Ltd. | | | 1,000 | | | | 16,333 | |
Matsumotokiyoshi Holdings Co., Ltd. | | | 100 | | | | 3,559 | |
Miraca Holdings, Inc. | | | 300 | | | | 14,177 | |
MonotaRO Co., Ltd. | | | 400 | | | | 8,498 | |
Musashino Bank, Ltd. (The) | | | 100 | | | | 3,210 | |
Nichirei Corp. | | | 1,000 | | | | 4,531 | |
Nihon Kohden Corp. | | | 200 | | | | 7,797 | |
NOF Corp. | | | 2,000 | | | | 13,974 | |
Noritz Corp. | | | 400 | | | | 8,369 | |
NS Solutions Corp. | | | 200 | | | | 5,110 | |
Obic Co., Ltd. | | | 300 | | | | 9,262 | |
Otsuka Corp. | | | 100 | | | | 11,861 | |
Plenus Co., Ltd. | | | 200 | | | | 4,656 | |
Point, Inc. | | | 90 | | | | 2,363 | |
Pola Orbis Holdings, Inc. | | | 200 | | | | 6,698 | |
Rohto Pharmaceutical Co., Ltd. | | | 1,000 | | | | 16,045 | |
Ryohin Keikaku Co., Ltd. | | | 100 | | | | 9,211 | |
Sawai Pharmaceutical Co., Ltd. | | | 200 | | | | 11,873 | |
Shimachu Co., Ltd. | | | 200 | | | | 4,449 | |
Sugi Holdings Co., Ltd. | | | 200 | | | | 7,979 | |
Sumitomo Osaka Cement Co., Ltd. | | | 2,000 | | | | 7,478 | |
Sundrug Co., Ltd. | | | 200 | | | | 8,384 | |
T-Gaia Corp. | | | 400 | | | | 4,908 | |
TS Tech Co., Ltd. | | | 300 | | | | 11,063 | |
| | | | | | | | |
| Security | | Shares | | | Value | |
| | | | | | | | |
|
Japan (continued) | |
Tsuruha Holdings, Inc. | | | 100 | | | $ | 9,357 | |
TV Asahi Corp. | | | 200 | | | | 4,119 | |
Wacoal Holdings Corp. | | | 1,000 | | | | 10,316 | |
Xebio Co., Ltd. | | | 200 | | | | 3,985 | |
| | |
| | | | | | $ | 501,759 | |
| | |
|
Luxembourg — 0.1% | |
Aperam(1) | | | 249 | | | $ | 4,467 | |
| | |
| | | | | | $ | 4,467 | |
| | |
|
Malaysia — 2.0% | |
Affin Holdings Bhd | | | 3,400 | | | $ | 4,178 | |
Alliance Financial Group Bhd | | | 8,800 | | | | 12,235 | |
Berjaya Sports Toto Bhd | | | 7,360 | | | | 8,888 | |
Boustead Holdings Bhd | | | 5,300 | | | | 8,303 | |
Bursa Malaysia Bhd | | | 1,800 | | | | 4,190 | |
Dialog Group Bhd | | | 13,000 | | | | 12,629 | |
Genting Plantations Bhd | | | 2,600 | | | | 8,025 | |
HAP Seng Consolidated Bhd | | | 11,000 | | | | 9,023 | |
KLCC Property Holdings Bhd | | | 3,300 | | | | 5,706 | |
KPJ Healthcare Bhd | | | 9,150 | | | | 9,195 | |
Kulim (Malaysia) Bhd(1) | | | 4,500 | | | | 4,302 | |
Lafarge Malayan Cement Bhd | | | 2,700 | | | | 6,854 | |
Malaysia Airports Holdings Bhd | | | 3,600 | | | | 9,049 | |
Media Prima Bhd | | | 8,100 | | | | 5,785 | |
Oriental Holdings Bhd | | | 3,700 | | | | 8,672 | |
| | |
| | | | | | $ | 117,034 | |
| | |
|
Mexico — 1.0% | |
Banregio Grupo Financiero SAB de CV | | | 2,100 | | | $ | 11,494 | |
Bolsa Mexicana de Valores SAB de CV | | | 2,600 | | | | 5,249 | |
Empresas ICA SAB de CV(1) | | | 4,400 | | | | 8,498 | |
Fibra Uno Administracion SA de CV | | | 2,200 | | | | 7,100 | |
Genomma Lab Internacional SA de CV(1) | | | 3,600 | | | | 8,883 | |
Grupo Aeroportuario del Sureste SAB de CV, Class B | | | 900 | | | | 10,130 | |
Grupo Simec SA de CV, Series B(1) | | | 1,300 | | | | 4,848 | |
| | |
| | | | | | $ | 56,202 | |
| | |
|
Netherlands — 1.8% | |
Aalberts Industries NV | | | 518 | | | $ | 16,185 | |
Arcadis NV | | | 537 | | | | 19,181 | |
ASM International NV | | | 168 | | | | 5,617 | |
Brunel International NV | | | 135 | | | | 7,935 | |
Eurocommercial Properties NV | | | 156 | | | | 6,418 | |
InterXion Holding NV(1) | | | 472 | | | | 11,621 | |
| | | | |
| | 10 | | See Notes to Financial Statements. |
Parametric Global Small-Cap Fund
January 31, 2014
Portfolio of Investments — continued
| | | | | | | | |
| Security | | Shares | | | Value | |
| | | | | | | | |
|
Netherlands (continued) | |
Koninklijke BAM Groep NV | | | 777 | | | $ | 3,986 | |
TomTom NV(1) | | | 1,487 | | | | 10,303 | |
Unit4 NV | | | 321 | | | | 16,670 | |
Wereldhave NV | | | 80 | | | | 6,083 | |
| | |
| | | | | | $ | 103,999 | |
| | |
|
New Zealand — 1.2% | |
Fisher & Paykel Healthcare Corp., Ltd. | | | 5,269 | | | $ | 17,268 | |
Ryman Healthcare, Ltd. | | | 2,449 | | | | 15,641 | |
Sky Network Television, Ltd. | | | 1,262 | | | | 5,885 | |
SKYCITY Entertainment Group, Ltd. | | | 3,057 | | | | 9,568 | |
Trade Me, Ltd. | | | 1,790 | | | | 5,907 | |
Xero, Ltd.(1) | | | 499 | | | | 16,727 | |
| | |
| | | | | | $ | 70,996 | |
| | |
|
Norway — 1.3% | |
Algeta ASA(1) | | | 114 | | | $ | 6,539 | |
Atea ASA | | | 708 | | | | 6,545 | |
Cermaq ASA | | | 543 | | | | 5,537 | |
Det Norske Oljeselskap ASA(1) | | | 652 | | | | 6,605 | |
DNO International ASA(1) | | | 4,903 | | | | 16,004 | |
Nordic American Tankers, Ltd. | | | 661 | | | | 7,231 | |
SpareBank 1 SR-Bank ASA | | | 517 | | | | 5,022 | |
Storebrand ASA(1) | | | 706 | | | | 4,218 | |
Tomra Systems ASA | | | 1,323 | | | | 11,323 | |
Wilh. Wilhelmsen ASA | | | 528 | | | | 4,826 | |
| | |
| | | | | | $ | 73,850 | |
| | |
|
Poland — 0.3% | |
Eurocash SA | | | 270 | | | $ | 3,505 | |
Getin Noble Bank SA(1) | | | 5,330 | | | | 5,252 | |
Grupa Azoty SA | | | 163 | | | | 2,706 | |
Synthos SA | | | 2,527 | | | | 4,053 | |
TVN SA | | | 877 | | | | 4,318 | |
| | |
| | | | | | $ | 19,834 | |
| | |
|
Portugal — 0.7% | |
Banco BPI SA(1) | | | 3,044 | | | $ | 6,183 | |
Banco Comercial Portugues SA(1) | | | 39,844 | | | | 8,893 | |
Sonae | | | 9,856 | | | | 15,513 | |
Zon Multimedia Servicos de Telecomunicacoes e Multimedia SGPS SA | | | 1,862 | | | | 12,446 | |
| | |
| | | | | | $ | 43,035 | |
| | |
| | | | | | | | |
| Security | | Shares | | | Value | |
| | | | | | | | |
|
Russia — 0.1% | |
Etalon Group, Ltd. GDR(1)(2) | | | 1,138 | | | $ | 5,121 | |
OAO OGK-2(1) | | | 525,390 | | | | 3,494 | |
| | |
| | | | | | $ | 8,615 | |
| | |
|
Singapore — 1.4% | |
ARA Asset Management, Ltd. | | | 4,400 | | | $ | 5,864 | |
Ascott Residence Trust | | | 4,000 | | | | 3,713 | |
CDL Hospitality Trusts | | | 4,000 | | | | 5,034 | |
Ezion Holdings, Ltd. | | | 4,800 | | | | 8,447 | |
Ho Bee Land, Ltd. | | | 3,000 | | | | 4,708 | |
Hyflux, Ltd. | | | 6,000 | | | | 5,383 | |
Keppel REIT | | | 3,000 | | | | 2,635 | |
M1, Ltd. | | | 4,000 | | | | 10,516 | |
Mapletree Commercial Trust | | | 4,000 | | | | 3,645 | |
Mapletree Industrial Trust | | | 4,000 | | | | 4,097 | |
Mapletree Logistics Trust | | | 4,000 | | | | 3,136 | |
Singapore Post, Ltd. | | | 12,000 | | | | 12,565 | |
Starhill Global REIT | | | 6,000 | | | | 3,585 | |
Suntec REIT | | | 2,000 | | | | 2,513 | |
Venture Corp., Ltd. | | | 1,000 | | | | 5,793 | |
Wheelock Properties, Ltd. | | | 2,000 | | | | 2,470 | |
| | |
| | | | | | $ | 84,104 | |
| | |
|
South Africa — 1.5% | |
AECI, Ltd. | | | 1,107 | | | $ | 12,881 | |
African Bank Investments, Ltd. | | | 4,545 | | | | 4,385 | |
Aveng, Ltd.(1) | | | 1,540 | | | | 3,262 | |
AVI, Ltd. | | | 1,339 | | | | 6,209 | |
DataTec, Ltd.(1) | | | 1,003 | | | | 4,287 | |
Illovo Sugar, Ltd. | | | 1,950 | | | | 4,721 | |
Investec, Ltd. | | | 635 | | | | 4,068 | |
Mondi, Ltd. | | | 284 | | | | 4,316 | |
Murray & Roberts Holdings, Ltd.(1) | | | 1,505 | | | | 3,359 | |
Nampak, Ltd. | | | 3,177 | | | | 9,959 | |
Pick’n Pay Holdings, Ltd. | | | 2,600 | | | | 4,863 | |
Pioneer Foods, Ltd. | | | 834 | | | | 6,629 | |
Reunert, Ltd. | | | 684 | | | | 3,938 | |
Royal Bafokeng Platinum, Ltd.(1) | | | 864 | | | | 4,873 | |
Spar Group, Ltd. (The) | | | 533 | | | | 5,756 | |
Trencor, Ltd. | | | 630 | | | | 4,077 | |
| | |
| | | | | | $ | 87,583 | |
| | |
|
South Korea — 2.5% | |
AMOREPACIFIC Group, Inc. | | | 25 | | | $ | 10,974 | |
Cheil Worldwide, Inc.(1) | | | 380 | | | | 9,879 | |
| | | | |
| | 11 | | See Notes to Financial Statements. |
Parametric Global Small-Cap Fund
January 31, 2014
Portfolio of Investments — continued
| | | | | | | | |
| Security | | Shares | | | Value | |
| | | | | | | | |
|
South Korea (continued) | |
Grand Korea Leisure Co., Ltd. | | | 90 | | | $ | 3,444 | |
Green Cross Corp. | | | 63 | | | | 7,691 | |
GS Engineering & Construction Corp. | | | 120 | | | | 3,718 | |
GS Retail Co., Ltd. | | | 220 | | | | 5,209 | |
Hotel Shilla Co., Ltd. | | | 210 | | | | 15,081 | |
Hyundai Greenfood Co., Ltd. | | | 400 | | | | 6,717 | |
Hyundai Home Shopping Network Corp. | | | 65 | | | | 10,960 | |
Korean Reinsurance Co. | | | 612 | | | | 6,431 | |
Lock & Lock Co., Ltd. | | | 270 | | | | 5,540 | |
Lotte Chilsung Beverage Co., Ltd. | | | 5 | | | | 7,598 | |
LS Industrial Systems Co., Ltd. | | | 72 | | | | 4,444 | |
Nong Shim Co., Ltd. | | | 25 | | | | 6,329 | |
ORION Corp. | | | 7 | | | | 5,693 | |
Ottogi Corp. | | | 13 | | | | 4,785 | |
Paradise Co., Ltd. | | | 132 | | | | 3,361 | |
Posco ICT Co., Ltd. | | | 584 | | | | 4,214 | |
S1 Corp. | | | 77 | | | | 5,586 | |
SK Broadband Co., Ltd.(1) | | | 1,803 | | | | 7,919 | |
Tongyang Life Insurance | | | 630 | | | | 6,378 | |
Young Poong Corp. | | | 3 | | | | 3,406 | |
| | |
| | | | | | $ | 145,357 | |
| | |
|
Spain — 1.5% | |
Abengoa SA, Class B | | | 1,737 | | | $ | 5,736 | |
Almirall SA | | | 611 | | | | 9,745 | |
Antena 3 de Television SA | | | 831 | | | | 15,605 | |
Duro Felguera SA | | | 747 | | | | 4,993 | |
Ence Energia y Celulosa SA | | | 2,912 | | | | 10,687 | |
Gamesa Corporacion Tecnologica SA(1) | | | 472 | | | | 5,175 | |
Grupo Catalana Occidente SA | | | 462 | | | | 17,727 | |
Jazztel PLC(1) | | | 640 | | | | 7,857 | |
Melia Hotels International SA | | | 398 | | | | 5,167 | |
Viscofan SA | | | 41 | | | | 2,171 | |
| | |
| | | | | | $ | 84,863 | |
| | |
|
Sweden — 1.8% | |
AarhusKarlshamn AB | | | 146 | | | $ | 8,915 | |
Atrium Ljungberg AB | | | 326 | | | | 4,442 | |
Axfood AB | | | 305 | | | | 14,618 | |
Axis Communications AB | | | 299 | | | | 9,642 | |
BillerudKorsnas AB | | | 419 | | | | 5,018 | |
Clas Ohlson AB, Class B | | | 452 | | | | 7,714 | |
Hexpol AB | | | 182 | | | | 12,927 | |
Hufvudstaden AB, Class A | | | 640 | | | | 8,572 | |
Loomis AB, Class B | | | 101 | | | | 2,386 | |
| | | | | | | | |
| Security | | Shares | | | Value | |
| | | | | | | | |
|
Sweden (continued) | |
Saab AB, Class B | | | 366 | | | $ | 9,490 | |
Swedish Orphan Biovitrum AB(1) | | | 1,121 | | | | 12,775 | |
Wallenstam AB, Class B | | | 616 | | | | 9,416 | |
| | |
| | | | | | $ | 105,915 | |
| | |
| | |
Switzerland — 2.1% | | | | | | | | |
ams AG | | | 92 | | | $ | 11,295 | |
Burckhardt Compression Holdings AG | | | 36 | | | | 16,216 | |
Flughafen Zuerich AG | | | 31 | | | | 18,210 | |
Forbo Holding AG(1) | | | 17 | | | | 13,886 | |
Georg Fischer AG(1) | | | 7 | | | | 4,795 | |
Kaba Holding AG(1) | | | 30 | | | | 13,692 | |
Kuoni Reisen Holding AG(1) | | | 21 | | | | 9,492 | |
Mobimo Holding AG(1) | | | 54 | | | | 11,255 | |
Nobel Biocare Holding AG(1) | | | 261 | | | | 3,978 | |
Temenos Group AG(1) | | | 174 | | | | 4,872 | |
Vontobel Holding AG | | | 378 | | | | 14,222 | |
| | |
| | | | | | $ | 121,913 | |
| | |
|
Taiwan — 2.6% | |
Advantech Co., Ltd. | | | 3,000 | | | $ | 18,733 | |
Chicony Electronics Co., Ltd. | | | 3,030 | | | | 7,734 | |
China Life Insurance Co., Ltd. | | | 5,000 | | | | 4,765 | |
China Steel Chemical Corp. | | | 3,000 | | | | 16,631 | |
CTCI Corp. | | | 5,000 | | | | 6,800 | |
Feng Hsin Iron & Steel Co., Ltd. | | | 2,000 | | | | 3,422 | |
Formosa Taffeta Co., Ltd. | | | 2,000 | | | | 2,114 | |
Giant Manufacturing Co., Ltd. | | | 2,000 | | | | 12,629 | |
Inventec Co., Ltd. | | | 7,000 | | | | 6,458 | |
Oriental Union Chemical Corp. | | | 2,000 | | | | 1,994 | |
Phison Electronics Corp. | | | 1,000 | | | | 6,257 | |
Powertech Technology, Inc. | | | 2,000 | | | | 2,760 | |
Realtek Semiconductor Corp. | | | 3,030 | | | | 8,240 | |
Ruentex Development Co., Ltd. | | | 2,000 | | | | 3,510 | |
ScinoPharm Taiwan, Ltd. | | | 2,080 | | | | 5,821 | |
Senao International Co., Ltd. | | | 2,000 | | | | 5,843 | |
Simplo Technology Co., Ltd. | | | 1,000 | | | | 4,581 | |
Standard Foods Corp. | | | 3,450 | | | | 10,135 | |
Teco Electric & Machinery Co., Ltd. | | | 8,000 | | | | 8,689 | |
Transcend Information, Inc. | | | 2,000 | | | | 5,965 | |
Vanguard International Semiconductor Corp. | | | 5,000 | | | | 5,471 | |
WPG Holdings Co., Ltd. | | | 3,000 | | | | 3,480 | |
| | |
| | | | | | $ | 152,032 | |
| | |
| | | | |
| | 12 | | See Notes to Financial Statements. |
Parametric Global Small-Cap Fund
January 31, 2014
Portfolio of Investments — continued
| | | | | | | | |
| Security | | Shares | | | Value | |
| | | | | | | | |
|
Thailand — 1.8% | |
Bangchak Petroleum PCL(3) | | | 5,600 | | | $ | 4,532 | |
Bangkok Land PCL(3) | | | 82,400 | | | | 3,570 | |
Berli Jucker PCL(3) | | | 4,500 | | | | 6,164 | |
Bumrungrad Hospital PCL(3) | | | 1,500 | | | | 3,825 | |
Central Pattana PCL(3) | | | 7,400 | | | | 8,409 | |
Delta Electronics (Thailand) PCL(3) | | | 5,800 | | | | 9,295 | |
Electricity Generating PCL(3) | | | 2,500 | | | | 9,664 | |
Quality House PCL(3) | | | 46,000 | | | | 3,581 | |
Ratchaburi Electricity Generating Holding PCL, NVDR | | | 3,700 | | | | 5,354 | |
Robinson Department Store PCL(3) | | | 3,900 | | | | 5,255 | |
Siam City Cement PCL(3) | | | 800 | | | | 8,616 | |
Siam Makro PCL(3) | | | 6,000 | | | | 5,724 | |
Sino Thai Engineering & Construction PCL(3) | | | 5,900 | | | | 2,357 | |
Thai Tap Water Supply Co., Ltd.(3) | | | 20,700 | | | | 6,049 | |
Thai Union Frozen Products PCL(3) | | | 3,100 | | | | 6,547 | |
Thanachart Capital PCL(3) | | | 4,100 | | | | 3,843 | |
Tisco Financial Group Public Co., Ltd.(3) | | | 3,300 | | | | 3,703 | |
True Corp. PCL(1)(3) | | | 24,400 | | | | 5,322 | |
VGI Global Media PCL(3) | | | 12,584 | | | | 3,230 | |
WHA Corp. PCL(3) | | | 3,300 | | | | 2,891 | |
| | |
| | | | | | $ | 107,931 | |
| | |
|
Turkey — 0.9% | |
Aselsan Elektronik Sanayi Ve Ticaret AS | | | 1,359 | | | $ | 4,695 | |
Asya Katilim Bankasi AS(1) | | | 4,925 | | | | 2,359 | |
Aygaz AS | | | 1,376 | | | | 4,642 | |
Dogus Otomotiv Servis ve Ticaret AS | | | 930 | | | | 2,672 | |
Migros Ticaret AS(1) | | | 474 | | | | 3,068 | |
Pegasus Hava Tasimaciligi AS(1) | | | 465 | | | | 5,366 | |
Petkim Petrokimya Holding AS(1) | | | 4,991 | | | | 5,600 | |
TAV Havalimanlari Holding AS | | | 737 | | | | 5,544 | |
Tekfen Holding AS | | | 1,505 | | | | 3,152 | |
Tofas Turk Otomobil Fabrikasi AS | | | 1,218 | | | | 5,729 | |
Turk Traktor ve Ziraat Makineleri AS | | | 222 | | | | 5,123 | |
Turkiye Sinai Kalkinma Bankasi AS | | | 4,382 | | | | 3,306 | |
Yazicilar Holding AS | | | 314 | | | | 2,476 | |
| | |
| | | | | | $ | 53,732 | |
| | |
|
United Kingdom — 6.0% | |
Abcam PLC | | | 1,181 | | | $ | 10,084 | |
Aveva Group PLC | | | 248 | | | | 8,758 | |
AZ Electronic Materials SA | | | 1,082 | | | | 7,045 | |
Beazley PLC | | | 1,650 | | | | 6,917 | |
Berkeley Group Holdings PLC | | | 215 | | | | 9,124 | |
Betfair Group PLC | | | 270 | | | | 4,684 | |
Booker Group PLC | | | 5,528 | | | | 14,037 | |
| | | | | | | | |
| Security | | Shares | | | Value | |
| | | | | | | | |
|
United Kingdom (continued) | |
BTG PLC(1) | | | 715 | | | $ | 6,961 | |
Capital & Counties Properties PLC | | | 1,928 | | | | 11,257 | |
CSR PLC | | | 499 | | | | 5,417 | |
De La Rue PLC | | | 149 | | | | 1,910 | |
Domino’s Pizza Group PLC | | | 751 | | | | 6,521 | |
Dunelm Group PLC | | | 551 | | | | 8,339 | |
Elementis PLC | | | 1,668 | | | | 6,993 | |
EnQuest PLC(1) | | | 6,020 | | | | 12,820 | |
Fidessa Group PLC | | | 343 | | | | 13,024 | |
Filtrona PLC | | | 1,065 | | | | 14,496 | |
Genus PLC | | | 390 | | | | 8,406 | |
Greene King PLC | | | 330 | | | | 4,645 | |
Halfords Group PLC | | | 1,065 | | | | 8,008 | |
Hikma Pharmaceuticals PLC | | | 585 | | | | 11,532 | |
Hunting PLC | | | 682 | | | | 8,440 | |
International Personal Finance PLC | | | 415 | | | | 3,165 | |
Jardine Lloyd Thompson Group PLC | | | 485 | | | | 8,421 | |
Lancashire Holdings, Ltd. | | | 182 | | | | 2,254 | |
Micro Focus International PLC | | | 804 | | | | 9,894 | |
Moneysupermarket.com Group PLC | | | 1,776 | | | | 5,211 | |
N Brown Group PLC | | | 997 | | | | 8,852 | |
Ocado Group PLC(1) | | | 1,848 | | | | 15,856 | |
Pace PLC | | | 957 | | | | 5,617 | |
Rightmove PLC | | | 299 | | | | 12,441 | |
Rotork PLC | | | 117 | | | | 4,729 | |
Shaftesbury PLC | | | 439 | | | | 4,489 | |
Soco International PLC(1) | | | 1,980 | | | | 13,396 | |
Stolt-Nielsen, Ltd. | | | 472 | | | | 13,944 | |
Telecom Plus PLC | | | 424 | | | | 13,271 | |
Ultra Electronics Holdings PLC | | | 486 | | | | 15,603 | |
Victrex PLC | | | 227 | | | | 6,631 | |
WH Smith PLC | | | 1,117 | | | | 19,129 | |
| | |
| | | | | | $ | 352,321 | |
| | |
|
United States — 29.6% | |
ACADIA Pharmaceuticals, Inc.(1) | | | 591 | | | $ | 13,770 | |
ACI Worldwide, Inc.(1) | | | 141 | | | | 8,546 | |
Acorda Therapeutics, Inc.(1) | | | 111 | | | | 3,258 | |
Aegerion Pharmaceuticals, Inc.(1) | | | 159 | | | | 9,537 | |
Akorn, Inc.(1) | | | 217 | | | | 4,926 | |
Alaska Air Group, Inc. | | | 199 | | | | 15,735 | |
Alkermes PLC(1) | | | 347 | | | | 16,892 | |
Allegiant Travel Co. | | | 139 | | | | 12,659 | |
ALLETE, Inc. | | | 236 | | | | 11,795 | |
Alnylam Pharmaceuticals, Inc.(1) | | | 225 | | | | 18,823 | |
Anworth Mortgage Asset Corp. | | | 1,864 | | | | 8,742 | |
| | | | |
| | 13 | | See Notes to Financial Statements. |
Parametric Global Small-Cap Fund
January 31, 2014
Portfolio of Investments — continued
| | | | | | | | |
| Security | | Shares | | | Value | |
| | | | | | | | |
|
United States (continued) | |
ARRIS Group, Inc.(1) | | | 460 | | | $ | 11,914 | |
Aspen Technology, Inc.(1) | | | 272 | | | | 12,395 | |
Athenahealth, Inc.(1) | | | 35 | | | | 5,159 | |
Avista Corp. | | | 353 | | | | 10,177 | |
Balchem Corp. | | | 168 | | | | 9,159 | |
Black Hills Corp. | | | 297 | | | | 16,284 | |
Blackbaud, Inc. | | | 170 | | | | 5,858 | |
Bonanza Creek Energy, Inc.(1) | | | 221 | | | | 8,997 | |
Boston Beer Co., Inc. (The), Class A(1) | | | 55 | | | | 11,457 | |
Bristow Group, Inc. | | | 178 | | | | 12,779 | |
Buckle, Inc. (The) | | | 103 | | | | 4,565 | |
Buffalo Wild Wings, Inc.(1) | | | 53 | | | | 7,519 | |
C&J Energy Services, Inc.(1) | | | 199 | | | | 4,653 | |
Cabot Microelectronics Corp.(1) | | | 174 | | | | 7,016 | |
CACI International, Inc., Class A(1) | | | 123 | | | | 9,104 | |
Calgon Carbon Corp.(1) | | | 468 | | | | 9,505 | |
Capstead Mortgage Corp. | | | 766 | | | | 9,667 | |
Casey’s General Stores, Inc. | | | 116 | | | | 7,966 | |
Celldex Therapeutics, Inc.(1) | | | 550 | | | | 14,179 | |
Cheesecake Factory, Inc. (The) | | | 179 | | | | 7,973 | |
CLARCOR, Inc. | | | 230 | | | | 12,747 | |
Cleco Corp. | | | 226 | | | | 11,042 | |
Cloud Peak Energy, Inc.(1) | | | 541 | | | | 10,133 | |
Cogent Communications Group, Inc. | | | 170 | | | | 7,033 | |
CommVault Systems, Inc.(1) | | | 113 | | | | 7,805 | |
Conn’s, Inc.(1) | | | 216 | | | | 13,113 | |
Contango Oil & Gas Co.(1) | | | 155 | | | | 6,504 | |
Convergys Corp. | | | 361 | | | | 7,354 | |
Conversant, Inc.(1) | | | 302 | | | | 6,493 | |
Cornerstone OnDemand, Inc.(1) | | | 108 | | | | 6,161 | |
Costar Group, Inc.(1) | | | 26 | | | | 4,473 | |
Cracker Barrel Old Country Store, Inc. | | | 93 | | | | 9,208 | |
Cubist Pharmaceuticals, Inc.(1) | | | 219 | | | | 16,007 | |
CYS Investments, Inc. | | | 918 | | | | 7,271 | |
Delek US Holdings, Inc. | | | 269 | | | | 8,151 | |
Diamondback Energy, Inc.(1) | | | 238 | | | | 12,371 | |
Dril-Quip, Inc.(1) | | | 90 | | | | 9,050 | |
Eagle Materials, Inc. | | | 167 | | | | 13,151 | |
El Paso Electric Co. | | | 294 | | | | 10,710 | |
Energy XXI Bermuda, Ltd. | | | 105 | | | | 2,410 | |
EPL Oil & Gas, Inc.(1) | | | 295 | | | | 7,927 | |
Finish Line, Inc. (The), Class A | | | 255 | | | | 6,541 | |
First Financial Bankshares, Inc. | | | 109 | | | | 6,668 | |
Forum Energy Technologies, Inc.(1) | | | 425 | | | | 10,676 | |
GNC Holdings, Inc., Class A | | | 223 | | | | 11,398 | |
Government Properties Income Trust | | | 229 | | | | 5,656 | |
| | | | | | | | |
| Security | | Shares | | | Value | |
| | | | | | | | |
|
United States (continued) | |
Gulf Coast Ultra Deep Royalty Trust(1) | | | 834 | | | $ | 2,102 | |
GulfMark Offshore, Inc., Class A | | | 164 | | | | 6,980 | |
H.B. Fuller Co. | | | 128 | | | | 5,962 | |
Haemonetics Corp.(1) | | | 58 | | | | 2,198 | |
Hain Celestial Group, Inc. (The)(1) | | | 153 | | | | 14,059 | |
Hatteras Financial Corp. | | | 385 | | | | 6,907 | |
Heartland Express, Inc. | | | 165 | | | | 3,475 | |
Heartland Payment Systems, Inc. | | | 106 | | | | 4,570 | |
Hecla Mining Co. | | | 3,530 | | | | 10,696 | |
Helen of Troy, Ltd.(1) | | | 59 | | | | 3,247 | |
Hercules Offshore, Inc.(1) | | | 1,600 | | | | 7,968 | |
Hibbett Sports, Inc.(1) | | | 111 | | | | 6,661 | |
Hillenbrand, Inc. | | | 197 | | | | 5,333 | |
Hittite Microwave Corp.(1) | | | 97 | | | | 5,563 | |
Home BancShares, Inc. | | | 139 | | | | 4,287 | |
HSN, Inc. | | | 168 | | | | 9,201 | |
Hyster-Yale Materials Handling, Inc. | | | 90 | | | | 7,718 | |
IDACORP, Inc. | | | 291 | | | | 15,344 | |
Investors Bancorp, Inc. | | | 105 | | | | 2,664 | |
Isis Pharmaceuticals, Inc.(1) | | | 391 | | | | 19,964 | |
J&J Snack Foods Corp. | | | 95 | | | | 8,369 | |
j2 Global, Inc. | | | 239 | | | | 10,839 | |
Jazz Pharmaceuticals PLC(1) | | | 114 | | | | 17,289 | |
JoS. A. Bank Clothiers, Inc.(1) | | | 137 | | | | 7,702 | |
Kodiak Oil & Gas Corp.(1) | | | 522 | | | | 5,538 | |
Lancaster Colony Corp. | | | 151 | | | | 13,125 | |
Lexicon Pharmaceuticals, Inc.(1) | | | 3,892 | | | | 7,161 | |
Louisiana-Pacific Corp.(1) | | | 446 | | | | 7,818 | |
Lumber Liquidators Holdings, Inc.(1) | | | 138 | | | | 12,281 | |
ManTech International Corp., Class A | | | 190 | | | | 5,529 | |
MarketAxess Holdings, Inc. | | | 69 | | | | 4,329 | |
MAXIMUS, Inc. | | | 265 | | | | 11,228 | |
Medicines Co. (The)(1) | | | 366 | | | | 12,722 | |
Medidata Solutions, Inc.(1) | | | 232 | | | | 14,639 | |
Mentor Graphics Corp. | | | 364 | | | | 7,571 | |
MFA Financial, Inc. | | | 1,138 | | | | 8,296 | |
MGE Energy, Inc. | | | 241 | | | | 13,723 | |
MGIC Investment Corp.(1) | | | 1,649 | | | | 14,000 | |
Middleby Corp.(1) | | | 20 | | | | 4,932 | |
Minerals Technologies, Inc. | | | 155 | | | | 8,010 | |
Monro Muffler Brake, Inc. | | | 242 | | | | 13,433 | |
Montpelier Re Holdings, Ltd. | | | 86 | | | | 2,397 | |
Mueller Industries, Inc. | | | 215 | | | | 13,382 | |
MWI Veterinary Supply, Inc.(1) | | | 80 | | | | 14,901 | |
National Health Investors, Inc. | | | 156 | | | | 9,823 | |
National Retail Properties, Inc. | | | 72 | | | | 2,390 | |
| | | | |
| | 14 | | See Notes to Financial Statements. |
Parametric Global Small-Cap Fund
January 31, 2014
Portfolio of Investments — continued
| | | | | | | | |
| Security | | Shares | | | Value | |
| | | | | | | | |
|
United States (continued) | |
Nektar Therapeutics(1) | | | 1,272 | | | $ | 17,299 | |
New Jersey Resources Corp. | | | 216 | | | | 9,850 | |
NewMarket Corp. | | | 23 | | | | 7,702 | |
Northwest Bancshares, Inc. | | | 164 | | | | 2,306 | |
Northwest Natural Gas Co. | | | 205 | | | | 8,520 | |
NorthWestern Corp. | | | 292 | | | | 13,201 | |
NPS Pharmaceuticals, Inc.(1) | | | 473 | | | | 16,924 | |
Nu Skin Enterprises, Inc., Class A | | | 77 | | | | 6,557 | |
Ocwen Financial Corp.(1) | | | 252 | | | | 11,123 | |
Owens & Minor, Inc. | | | 255 | | | | 8,833 | |
PDC Energy, Inc.(1) | | | 180 | | | | 8,975 | |
Piedmont Natural Gas Co., Inc. | | | 304 | | | | 10,038 | |
Pilgrim’s Pride Corp.(1) | | | 896 | | | | 14,990 | |
Plantronics, Inc. | | | 191 | | | | 8,200 | |
Platinum Underwriters Holdings, Ltd. | | | 132 | | | | 7,503 | |
PNM Resources, Inc. | | | 484 | | | | 11,931 | |
Portland General Electric Co. | | | 361 | | | | 10,895 | |
Post Properties, Inc. | | | 51 | | | | 2,393 | |
Primerica, Inc. | | | 347 | | | | 14,619 | |
ProAssurance Corp. | | | 50 | | | | 2,323 | |
Puma Biotechnology, Inc.(1) | | | 106 | | | | 12,530 | |
RBC Bearings, Inc.(1) | | | 97 | | | | 6,289 | |
Resolute Energy Corp.(1) | | | 714 | | | | 5,705 | |
Rite Aid Corp.(1) | | | 2,585 | | | | 14,347 | |
RLI Corp. | | | 236 | | | | 9,832 | |
Rollins, Inc. | | | 160 | | | | 4,611 | |
Rosetta Resources, Inc.(1) | | | 134 | | | | 5,710 | |
Salix Pharmaceuticals, Ltd.(1) | | | 80 | | | | 7,787 | |
Sanchez Energy Corp.(1) | | | 218 | | | | 5,993 | |
Sanderson Farms, Inc. | | | 190 | | | | 14,126 | |
Saul Centers, Inc. | | | 131 | | | | 6,105 | |
Schweitzer-Mauduit International, Inc. | | | 204 | | | | 9,411 | |
Scorpio Tankers, Inc. | | | 1,048 | | | | 10,480 | |
Seaboard Corp. | | | 3 | | | | 7,650 | |
Seattle Genetics, Inc.(1) | | | 340 | | | | 15,252 | |
SemGroup Corp., Class A | | | 204 | | | | 12,599 | |
Sensient Technologies Corp. | | | 197 | | | | 9,637 | |
Ship Finance International, Ltd. | | | 273 | | | | 4,674 | |
Shutterstock, Inc.(1) | | | 115 | | | | 9,270 | |
Signature Bank(1) | | | 123 | | | | 15,013 | |
Six Flags Entertainment Corp. | | | 198 | | | | 7,106 | |
Snyders-Lance, Inc. | | | 250 | | | | 6,677 | |
Solar Capital, Ltd. | | | 105 | | | | 2,324 | |
SolarWinds, Inc.(1) | | | 155 | | | | 6,183 | |
South Jersey Industries, Inc. | | | 176 | | | | 9,388 | |
Southwest Gas Corp. | | | 274 | | | | 14,722 | |
| | | | | | | | |
| Security | | Shares | | | Value | |
| | | | | | | | |
|
United States (continued) | |
Sovran Self Storage, Inc. | | | 123 | | | $ | 8,353 | |
Spirit Airlines, Inc.(1) | | | 277 | | | | 12,991 | |
SS&C Technologies Holdings, Inc.(1) | | | 138 | | | | 5,357 | |
Starwood Property Trust, Inc. | | | 392 | | | | 11,838 | |
Stepan Co. | | | 130 | | | | 8,241 | |
STERIS Corp. | | | 177 | | | | 8,123 | |
Stone Energy Corp.(1) | | | 320 | | | | 9,904 | |
SunEdison, Inc.(1) | | | 1,209 | | | | 16,817 | |
SunPower Corp.(1) | | | 387 | | | | 12,523 | |
Supervalu, Inc.(1) | | | 1,580 | | | | 9,132 | |
Synaptics, Inc.(1) | | | 211 | | | | 12,314 | |
SYNNEX Corp.(1) | | | 73 | | | | 4,099 | |
Take-Two Interactive Software, Inc.(1) | | | 473 | | | | 9,072 | |
Tanger Factory Outlet Centers | | | 67 | | | | 2,236 | |
Targa Resources Corp. | | | 207 | | | | 18,690 | |
Teledyne Technologies, Inc.(1) | | | 189 | | | | 17,363 | |
Tennant Co. | | | 189 | | | | 12,121 | |
TiVo, Inc.(1) | | | 471 | | | | 5,836 | |
Tootsie Roll Industries, Inc. | | | 229 | | | | 6,948 | |
TreeHouse Foods, Inc.(1) | | | 151 | | | | 9,942 | |
Tyler Technologies, Inc.(1) | | | 74 | | | | 7,803 | |
UIL Holdings Corp. | | | 264 | | | | 10,209 | |
Ultimate Software Group, Inc.(1) | | | 86 | | | | 14,038 | |
United Natural Foods, Inc.(1) | | | 139 | | | | 9,392 | |
Universal Corp. | | | 121 | | | | 6,210 | |
UNS Energy Corp. | | | 236 | | | | 14,132 | |
Vector Group, Ltd. | | | 144 | | | | 2,572 | |
ViaSat, Inc.(1) | | | 101 | | | | 6,011 | |
Watsco, Inc. | | | 124 | | | | 11,733 | |
Weis Markets, Inc. | | | 197 | | | | 9,696 | |
West Pharmaceutical Services, Inc. | | | 286 | | | | 13,571 | |
Westamerica Bancorporation | | | 58 | | | | 2,863 | |
Western Refining, Inc. | | | 423 | | | | 16,544 | |
WGL Holdings, Inc. | | | 239 | | | | 9,029 | |
World Fuel Services Corp. | | | 230 | | | | 9,826 | |
Yelp, Inc.(1) | | | 192 | | | | 14,582 | |
| | |
| | | | | | $ | 1,725,102 | |
| | |
| |
Total Common Stocks
(identified cost $5,143,750) | | | $ | 5,690,475 | |
| | |
| | | | |
| | 15 | | See Notes to Financial Statements. |
Parametric Global Small-Cap Fund
January 31, 2014
Portfolio of Investments — continued
| | | | | | | | | | | | |
| Equity-Linked Securities(4)(5) — 2.0% | |
|
| |
| Security | | Maturity Date | | | Shares | | | Value | |
| | | | | | | | | | | | |
| | | |
India — 2.0% | | | | | | | | | | | | |
Bajaj Finserv, Ltd. | | | 10/26/18 | | | | 430 | | | $ | 4,669 | |
Bharat Forge, Ltd. | | | 11/2/16 | | | | 993 | | | | 5,496 | |
Britannia Industries, Ltd. | | | 10/17/17 | | | | 388 | | | | 5,475 | |
Castrol India, Ltd. | | | 10/17/17 | | | | 1,703 | | | | 8,013 | |
Eicher Motors, Ltd. | | | 4/17/18 | | | | 100 | | | | 7,417 | |
GlaxoSmithKline Consumer Healthcare | | | 9/7/16 | | | | 135 | | | | 9,187 | |
Jaiprakash Power Ventures, Ltd. | | | 10/26/18 | | | | 13,980 | | | | 2,936 | |
JSW Energy, Ltd. | | | 10/26/18 | | | | 5,910 | | | | 4,166 | |
Jubilant Foodworks, Ltd. | | | 7/3/17 | | | | 244 | | | | 4,174 | |
LIC Housing Finance, Ltd. | | | 8/12/15 | | | | 1,319 | | | | 4,122 | |
Mahindra & Mahindra Financial Services | | | 11/3/15 | | | | 1,007 | | | | 3,902 | |
Marico, Ltd. | | | 10/17/17 | | | | 2,500 | | | | 8,537 | |
Motherson Sumi Systems, Ltd. | | | 10/26/18 | | | | 1,586 | | | | 5,161 | |
Petronet LNG, Ltd. | | | 10/17/17 | | | | 3,000 | | | | 5,265 | |
Piramal Enterprises, Ltd. | | | 10/9/14 | | | | 950 | | | | 8,441 | |
Reliance Capital, Ltd. | | | 10/26/18 | | | | 770 | | | | 3,985 | |
Reliance Infrastructure, Ltd. | | | 4/26/16 | | | | 650 | | | | 3,864 | |
Shree Cement, Ltd. | | | 7/20/17 | | | | 125 | | | | 8,853 | |
Unitech, Ltd. | | | 7/27/15 | | | | 15,130 | | | | 3,026 | |
United Phosphorus, Ltd. | | | 7/20/17 | | | | 2,617 | | | | 7,890 | |
| | | | | | | | | | | | | |
| | | |
Total Equity-Linked Securities
(identified cost $123,919) | | | | | | | | | | $ | 114,579 | |
| | | | | | | | | | | | | |
| | | | | | | | |
|
| Investment Funds — 0.0%(6) | |
| | |
| | | | | | | | |
| Security | | Shares | | | Value | |
| | | | | | | | |
|
Australia — 0.0%(6) | |
Australian Infrastructure Fund | | | 1,502 | | | $ | 9 | |
| | |
| |
Total Investment Funds
(identified cost $4,833) | | | $ | 9 | |
| | |
| | | | | | | | |
| Short-Term Investments — 0.4% | |
| | |
| | | | | | | | |
| Description | | Interest
(000’s omitted) | | | Value | |
| | | | | | | | |
Eaton Vance Cash Reserves Fund, LLC, 0.13%(7) | | $ | 27 | | | $ | 26,943 | |
| | | | | | | | | |
| | |
Total Short-Term Investments
(identified cost $26,943) | | | | | | $ | 26,943 | |
| | | | | | | | | |
| | |
Total Investments — 99.9%
(identified cost $5,299,445) | | | | | | $ | 5,832,006 | |
| | | | | | | | | |
| | |
Other Assets, Less Liabilities — 0.1% | | | | | | $ | 4,023 | |
| | | | | | | | | |
| | |
Net Assets — 100.0% | | | | | | $ | 5,836,029 | |
| | | | | | | | | |
The percentage shown for each investment category in the Portfolio of Investments is based on net assets.
| | | | |
| ADR | | – | | American Depositary Receipt |
| GDR | | – | | Global Depositary Receipt |
| NVDR | | – | | Non-Voting Depositary Receipt |
| PCL | | – | | Public Company Ltd. |
| PFC Shares | | – | | Preference Shares |
| REIT | | – | | Real Estate Investment Trust |
| (1) | Non-income producing security. |
| (2) | Security exempt from registration under Regulation S of the Securities Act of 1933, which exempts from registration securities offered and sold outside the United States. Security may not be offered or sold in the United States except pursuant to an exemption from, or in a transaction not subject to, the registration requirements of the Securities Act of 1933. At January 31, 2014, the aggregate value of these securities is $5,121 or 0.1% of the Fund’s net assets. |
| (3) | Indicates a foreign registered security. Shares issued to foreign investors in markets that have foreign ownership limits. |
| (4) | Security exempt from registration pursuant to Rule 144A under the Securities Act of 1933. These securities may be sold in certain transactions (normally to qualified institutional buyers) and remain exempt from registration. At January 31, 2014, the aggregate value of these securities is $114,579 or 2.0% of the Fund’s net assets. |
| (5) | Security whose performance, including redemption at maturity, is linked to the price of the underlying equity security. The investment is subject to credit risk of the issuing financial institution (JPMorgan Chase) in addition to the market risk of the underlying security. |
| (6) | Amount is less than 0.05%. |
| (7) | Affiliated investment company, available to Eaton Vance portfolios and funds, which invests in high quality, U.S. dollar denominated money market instruments. The rate shown is the annualized seven-day yield as of January 31, 2014. |
| | | | |
| | 16 | | See Notes to Financial Statements. |
Parametric Global Small-Cap Fund
January 31, 2014
Portfolio of Investments — continued
| | | | | | | | |
| Currency Concentration of Portfolio | |
| | |
| | | | | | | | |
| Currency | | Percentage of Net Assets | | | Value | |
United States Dollar | | | 33.6 | % | | $ | 1,957,725 | |
Euro | | | 14.7 | | | | 859,200 | |
Japanese Yen | | | 8.6 | | | | 501,759 | |
British Pound Sterling | | | 6.1 | | | | 356,993 | |
Hong Kong Dollar | | | 5.0 | | | | 294,129 | |
Canadian Dollar | | | 3.3 | | | | 191,448 | |
New Taiwan Dollar | | | 2.6 | | | | 152,032 | |
South Korean Won | | | 2.5 | | | | 145,357 | |
Australian Dollar | | | 2.2 | | | | 125,660 | |
Swiss Franc | | | 2.1 | | | | 121,913 | |
Malaysian Ringgit | | | 2.0 | | | | 117,034 | |
Thai Baht | | | 1.8 | | | | 107,931 | |
Swedish Krona | | | 1.8 | | | | 105,915 | |
South African Rand | | | 1.5 | | | | 87,583 | |
Indonesian Rupiah | | | 1.5 | | | | 85,973 | |
Singapore Dollar | | | 1.4 | | | | 84,104 | |
Norwegian Krone | | | 1.4 | | | | 80,563 | |
Brazilian Real | | | 1.3 | | | | 76,953 | |
New Zealand Dollar | | | 1.2 | | | | 70,996 | |
Israeli Shekel | | | 1.1 | | | | 62,866 | |
Chilean Peso | | | 1.1 | | | | 62,310 | |
Other currency, less than 1% each | | | 3.1 | | | | 183,562 | |
| | |
Total Investments | | | 99.9 | % | | $ | 5,832,006 | |
| | |
| | | | | | | | |
| Sector Classification of Portfolio | |
| | |
| | | | | | | | |
| Sector | | Percentage of Net Assets | | | Value | |
Financials | | | 14.8 | % | | $ | 861,147 | |
Industrials | | | 13.0 | | | | 761,718 | |
Consumer Discretionary | | | 12.8 | | | | 747,807 | |
Information Technology | | | 12.6 | | | | 732,891 | |
Health Care | | | 11.9 | | | | 694,306 | |
Consumer Staples | | | 10.1 | | | | 592,502 | |
Materials | | | 8.2 | | | | 477,179 | |
Energy | | | 7.9 | | | | 459,417 | |
Utilities | | | 6.4 | | | | 371,980 | |
Telecommunication Services | | | 1.8 | | | | 106,107 | |
Short-Term Investments | | | 0.4 | | | | 26,943 | |
Investment Funds | | | 0.0 | (1) | | | 9 | |
| | |
Total Investments | | | 99.9 | % | | $ | 5,832,006 | |
| | |
| (1) | Amount is less than 0.05%. |
| | | | |
| | 17 | | See Notes to Financial Statements. |
Parametric Global Small-Cap Fund
January 31, 2014
Statement of Assets and Liabilities
| | | | |
| Assets | | January 31, 2014 | |
Unaffiliated investments, at value (identified cost, $5,272,502) | | $ | 5,805,063 | |
Affiliated investment, at value (identified cost, $26,943) | | | 26,943 | |
Foreign currency, at value (identified cost, $32,271) | | | 31,729 | |
Dividends receivable | | | 3,027 | |
Interest receivable from affiliated investment | | | 2 | |
Receivable for investments sold | | | 55 | |
Tax reclaims receivable | | | 1,414 | |
Receivable from affiliates | | | 23,194 | |
Total assets | | $ | 5,891,427 | |
| |
| Liabilities | | | | |
Payable to affiliate: | | | | |
Investment adviser and administration fee | | $ | 3,561 | |
Accrued expenses | | | 51,837 | |
Total liabilities | | $ | 55,398 | |
Net Assets | | $ | 5,836,029 | |
| |
| Sources of Net Assets | | | | |
Paid-in capital | | $ | 5,308,635 | |
Accumulated net realized gain | | | 3,901 | |
Accumulated distributions in excess of net investment income | | | (8,563 | ) |
Net unrealized appreciation | | | 532,056 | |
Net Assets | | $ | 5,836,029 | |
| |
| Institutional Class | | | | |
Net Assets | | $ | 5,836,029 | |
Shares Outstanding | | | 529,912 | |
Net Asset Value, Offering Price and Redemption Price Per Share | | | | |
(net assets ÷ shares of beneficial interest outstanding) | | $ | 11.01 | |
| | | | |
| | 18 | | See Notes to Financial Statements. |
Parametric Global Small-Cap Fund
January 31, 2014
Statement of Operations
| | | | |
| Investment Income | | Year Ended January 31, 2014 | |
Dividends (net of foreign taxes, $13,679) | | $ | 139,043 | |
Interest allocated from affiliated investment | | | 25 | |
Expenses allocated from affiliated investment | | | (2 | ) |
Total investment income | | $ | 139,066 | |
| |
| Expenses | | | | |
Investment adviser and administration fee | | $ | 39,190 | |
Trustees’ fees and expenses | | | 733 | |
Custodian fee | | | 80,669 | |
Transfer and dividend disbursing agent fees | | | 73 | |
Legal and accounting services | | | 34,567 | |
Printing and postage | | | 16,223 | |
Registration fees | | | 24,176 | |
Miscellaneous | | | 12,365 | |
Total expenses | | $ | 207,996 | |
Deduct — | | | | |
Allocation of expenses to affiliates | | $ | 160,465 | |
Total expense reductions | | $ | 160,465 | |
| |
Net expenses | | $ | 47,531 | |
| |
Net investment income | | $ | 91,535 | |
| |
| Realized and Unrealized Gain (Loss) | | | | |
Net realized gain (loss) — | | | | |
Investment transactions | | $ | 182,317 | |
Foreign currency transactions | | | (2,981 | ) |
Net realized gain | | $ | 179,336 | |
Change in unrealized appreciation (depreciation) — | | | | |
Investments | | $ | 334,363 | |
Foreign currency | | | (512 | ) |
Net change in unrealized appreciation (depreciation) | | $ | 333,851 | |
| |
Net realized and unrealized gain | | $ | 513,187 | |
| |
Net increase in net assets from operations | | $ | 604,722 | |
| | | | |
| | 19 | | See Notes to Financial Statements. |
Parametric Global Small-Cap Fund
January 31, 2014
Statements of Changes in Net Assets
| | | | | | | | |
| Increase (Decrease) in Net Assets | | Year Ended
January 31, 2014 | | | Period Ended
January 31, 2013(1) | |
From operations — | | | | | | | | |
Net investment income | | $ | 91,535 | | | $ | 3,031 | |
Net realized gain from investment and foreign currency transactions, disposal of investments in violation of restrictions and net increase from payment by affiliate | | | 179,336 | | | | 9,268 | |
Net change in unrealized appreciation (depreciation) from investments and foreign currency | | | 333,851 | | | | 198,205 | |
Net increase in net assets from operations | | $ | 604,722 | | | $ | 210,504 | |
Distributions to shareholders — | | | | | | | | |
From net investment income | | $ | (130,296 | ) | | $ | (2,000 | ) |
From net realized gain | | | (180,920 | ) | | | — | |
Total distributions to shareholders | | $ | (311,216 | ) | | $ | (2,000 | ) |
Transactions in shares of beneficial interest — | | | | | | | | |
Proceeds from sale of shares | | $ | 77,608 | | | $ | 5,000,000 | |
Net asset value of shares issued to shareholders in payment of distributions declared | | | 266,667 | | | | — | |
Cost of shares redeemed | | $ | (10,256 | ) | | $ | — | |
Net increase in net assets from Fund share transactions | | $ | 334,019 | | | $ | 5,000,000 | |
| | |
Net increase in net assets | | $ | 627,525 | | | $ | 5,208,504 | |
| | |
| Net Assets | | | | | | | | |
At beginning of period | | $ | 5,208,504 | | | $ | — | |
At end of period | | $ | 5,836,029 | | | $ | 5,208,504 | |
|
Accumulated undistributed (distributions in excess of) net investment income included in net assets | |
At end of period | | $ | (8,563 | ) | | $ | 25,404 | |
| (1) | For the period from the start of business, December 20, 2012, to January 31, 2013. |
| | | | |
| | 20 | | See Notes to Financial Statements. |
Parametric Global Small-Cap Fund
January 31, 2014
Financial Highlights
| | | | | | | | |
| | | Institutional Class | |
| | | Year Ended
January 31, 2014 | | | Period Ended
January 31, 2013(1) | |
Net asset value — Beginning of period | | $ | 10.420 | | | $ | 10.000 | |
|
| Income (Loss) From Operations | |
Net investment income(2) | | $ | 0.181 | | | $ | 0.006 | |
Net realized and unrealized gain | | | 1.023 | | | | 0.418 | |
| | |
Total income from operations | | $ | 1.204 | | | $ | 0.424 | |
|
| Less Distributions | |
From net investment income | | $ | (0.257 | ) | | $ | (0.004 | ) |
From net realized gain | | | (0.357 | ) | | | — | |
| | |
Total distributions | | $ | (0.614 | ) | | $ | (0.004 | ) |
| | |
Net asset value — End of period | | $ | 11.010 | | | $ | 10.420 | |
| | |
Total Return(3) | | | 11.50 | % | | | 4.24 | %(4)(5) |
| | |
| Ratios/Supplemental Data | | | | | | | | |
Net assets, end of period (000’s omitted) | | $ | 5,836 | | | $ | 5,209 | |
Ratios (as a percentage of average daily net assets): | | | | | | | | |
Expenses(6) | | | 0.85 | % | | | 0.85 | %(7) |
Net investment income | | | 1.63 | % | | | 0.52 | %(7) |
Portfolio Turnover | | | 38 | % | | | 13 | %(4) |
| (1) | For the period from the start of business, December 20, 2012, to January 31, 2013. |
| (2) | Computed using average shares outstanding. |
| (3) | Returns are historical and are calculated by determining the percentage change in net asset value with all distributions reinvested. |
| (5) | During the period ended January 31, 2013, the sub-adviser reimbursed the Fund for a net loss realized on the disposal of an investment which did not meet the Fund’s investment guidelines. The reimbursement had no effect on total return for the period ended January 31, 2013. |
| (6) | The investment adviser, sub-adviser and administrator reimbursed certain operating expenses (equal to 2.86% and 10.98% of average daily net assets for the year ended January 31, 2014 and the period ended January 31, 2013, respectively). Absent this subsidy, total return would have been lower. |
| | | | |
| | 21 | | See Notes to Financial Statements. |
Parametric Global Small-Cap Fund
January 31, 2014
Notes to Financial Statements
1 Significant Accounting Policies
Parametric Global Small-Cap Fund (the Fund) is a diversified series of Eaton Vance Mutual Funds Trust (the Trust). The Trust is a Massachusetts business trust registered under the Investment Company Act of 1940, as amended (the 1940 Act), as an open-end management investment company. The Fund commenced operations on December 20, 2012. The Fund’s investment objective is to seek long-term capital appreciation. The Fund offers Institutional Class shares, which are offered at net asset value and are not subject to a sales charge.
The following is a summary of significant accounting policies of the Fund. The policies are in conformity with accounting principles generally accepted in the United States of America.
A Investment Valuation — The following methodologies are used to determine the market value or fair value of investments.
Equity Securities. Equity securities (including common shares of closed-end investment companies) listed on a U.S. securities exchange generally are valued at the last sale or closing price on the day of valuation or, if no sales took place on such date, at the mean between the closing bid and asked prices therefore on the exchange where such securities are principally traded. Equity securities listed on the NASDAQ Global or Global Select Market generally are valued at the NASDAQ official closing price. Unlisted or listed securities for which closing sales prices or closing quotations are not available are valued at the mean between the latest available bid and asked prices.
Foreign Securities and Currencies. Foreign securities and currencies are valued in U.S. dollars, based on foreign currency exchange rate quotations supplied by a third party pricing service. The pricing service uses a proprietary model to determine the exchange rate. Inputs to the model include reported trades and implied bid/ask spreads. The daily valuation of exchange-traded foreign securities generally is determined as of the close of trading on the principal exchange on which such securities trade. Events occurring after the close of trading on foreign exchanges may result in adjustments to the valuation of foreign securities to more accurately reflect their fair value as of the close of regular trading on the New York Stock Exchange. When valuing foreign equity securities that meet certain criteria, the Fund’s Trustees have approved the use of a fair value service that values such securities to reflect market trading that occurs after the close of the applicable foreign markets of comparable securities or other instruments that have a strong correlation to the fair-valued securities.
Affiliated Fund. The Fund may invest in Eaton Vance Cash Reserves Fund, LLC (Cash Reserves Fund), an affiliated investment company managed by Eaton Vance Management (EVM). The value of the Fund’s investment in Cash Reserves Fund reflects the Fund’s proportionate interest in its net assets. Cash Reserves Fund generally values its investment securities utilizing the amortized cost valuation technique in accordance with Rule 2a-7 under the 1940 Act. This technique involves initially valuing a portfolio security at its cost and thereafter assuming a constant amortization to maturity of any discount or premium. If amortized cost is determined not to approximate fair value, Cash Reserves Fund may value its investment securities in the same manner as debt obligations described above.
Fair Valuation. Investments for which valuations or market quotations are not readily available or are deemed unreliable are valued at fair value using methods determined in good faith by or at the direction of the Trustees of the Fund in a manner that fairly reflects the security’s value, or the amount that the Fund might reasonably expect to receive for the security upon its current sale in the ordinary course. Each such determination is based on a consideration of relevant factors, which are likely to vary from one pricing context to another. These factors may include, but are not limited to, the type of security, the existence of any contractual restrictions on the security’s disposition, the price and extent of public trading in similar securities of the issuer or of comparable companies or entities, quotations or relevant information obtained from broker/dealers or other market participants, information obtained from the issuer, analysts, and/or the appropriate stock exchange (for exchange-traded securities), an analysis of the company’s or entity’s financial condition, and an evaluation of the forces that influence the issuer and the market(s) in which the security is purchased and sold.
B Investment Transactions — Investment transactions for financial statement purposes are accounted for on a trade date basis. Realized gains and losses on investments sold are determined on the basis of identified cost.
C Income — Dividend income is recorded on the ex-dividend date for dividends received in cash and/or securities. However, if the ex-dividend date has passed, certain dividends from foreign securities are recorded as the Fund is informed of the ex-dividend date. Withholding taxes on foreign dividends and capital gains have been provided for in accordance with the Fund’s understanding of the applicable countries’ tax rules and rates. Interest income is recorded on the basis of interest accrued, adjusted for amortization of premium or accretion of discount.
D Federal Taxes — The Fund’s policy is to comply with the provisions of the Internal Revenue Code applicable to regulated investment companies and to distribute to shareholders each year substantially all of its net investment income, and all or substantially all of its net realized capital gains. Accordingly, no provision for federal income or excise tax is necessary.
In addition to the requirements of the Internal Revenue Code, the Fund may also be subject to local taxes on the recognition of capital gains in certain countries. In determining the daily net asset value, the Fund estimates the accrual for such taxes, if any, based on the unrealized appreciation on certain portfolio securities and the related tax rates. Taxes attributable to unrealized appreciation are included in the change in unrealized appreciation (depreciation) on investments. Capital gains taxes on securities sold are included in net realized gain (loss) on investments.
Parametric Global Small-Cap Fund
January 31, 2014
Notes to Financial Statements — continued
As of January 31, 2014, the Fund had no uncertain tax positions that would require financial statement recognition, de-recognition, or disclosure. The Fund files a U.S. federal income tax return annually after its fiscal year-end, which is subject to examination by the Internal Revenue Service for a period of three years from the date of filing.
E Expenses — The majority of expenses of the Trust are directly identifiable to an individual fund. Expenses which are not readily identifiable to a specific fund are allocated taking into consideration, among other things, the nature and type of expense and the relative size of the funds.
F Expense Reduction — State Street Bank and Trust Company (SSBT) serves as custodian of the Fund. Pursuant to the custodian agreement, SSBT receives a fee reduced by credits, which are determined based on the average daily cash balance the Fund maintains with SSBT. All credit balances, if any, used to reduce the Fund’s custodian fees are reported as a reduction of expenses in the Statement of Operations.
G Foreign Currency Translation — Investment valuations, other assets, and liabilities initially expressed in foreign currencies are translated each business day into U.S. dollars based upon current exchange rates. Purchases and sales of foreign investment securities and income and expenses denominated in foreign currencies are translated into U.S. dollars based upon currency exchange rates in effect on the respective dates of such transactions. Recognized gains or losses on investment transactions attributable to changes in foreign currency exchange rates are recorded for financial statement purposes as net realized gains and losses on investments. That portion of unrealized gains and losses on investments that results from fluctuations in foreign currency exchange rates is not separately disclosed.
H Use of Estimates — The preparation of the financial statements in conformity with accounting principles generally accepted in the United States of America requires management to make estimates and assumptions that affect the reported amounts of assets and liabilities at the date of the financial statements and the reported amounts of income and expense during the reporting period. Actual results could differ from those estimates.
I Indemnifications — Under the Trust’s organizational documents, its officers and Trustees may be indemnified against certain liabilities and expenses arising out of the performance of their duties to the Fund. Under Massachusetts law, if certain conditions prevail, shareholders of a Massachusetts business trust (such as the Trust) could be deemed to have personal liability for the obligations of the Trust. However, the Trust’s Declaration of Trust contains an express disclaimer of liability on the part of Fund shareholders and the By-laws provide that the Trust shall assume the defense on behalf of any Fund shareholders. Moreover, the By-laws also provide for indemnification out of Fund property of any shareholder held personally liable solely by reason of being or having been a shareholder for all loss or expense arising from such liability. Additionally, in the normal course of business, the Fund enters into agreements with service providers that may contain indemnification clauses. The Fund’s maximum exposure under these arrangements is unknown as this would involve future claims that may be made against the Fund that have not yet occurred.
2 Distributions to Shareholders
It is the present policy of the Fund to make at least one distribution annually (normally in December) of all or substantially all of its net investment income and to distribute annually all or substantially all of its net realized capital gains. Distributions to shareholders are recorded on the ex-dividend date. Shareholders may reinvest income and capital gain distributions in additional shares of the Fund at the net asset value as of the ex-dividend date or, at the election of the shareholder, receive distributions in cash. The Fund distinguishes between distributions on a tax basis and a financial reporting basis. Accounting principles generally accepted in the United States of America require that only distributions in excess of tax basis earnings and profits be reported in the financial statements as a return of capital. Permanent differences between book and tax accounting relating to distributions are reclassified to paid-in capital. For tax purposes, distributions from short-term capital gains are considered to be from ordinary income.
The tax character of distributions declared for the year ended January 31, 2014 and the period ended January 31, 2013 was as follows:
| | | | | | | | |
| | | Year Ended January 31, 2014 | | | Period Ended January 31, 2013 | |
| | |
Distributions declared from: | | | | | | | | |
Ordinary income | | $ | 311,216 | | | $ | 2,000 | |
During the year ended January 31, 2014, accumulated net realized gain was decreased by $4,628, accumulated distributions in excess of net investment income was decreased by $4,794 and paid-in capital was decreased by $166 due to differences between book and tax accounting, primarily for foreign currency gain (loss), investments in passive foreign investment companies (PFICs), distributions from real estate investment trusts (REITs), non-deductible expenses and investments in partnerships. These reclassifications had no effect on the net assets or net asset value per share of the Fund.
Parametric Global Small-Cap Fund
January 31, 2014
Notes to Financial Statements — continued
As of January 31, 2014, the components of distributable earnings (accumulated losses) and unrealized appreciation (depreciation) on a tax basis were as follows:
| | | | |
Undistributed ordinary income | | $ | 8,579 | |
Undistributed long-term capital gains | | $ | 642 | |
Net unrealized appreciation | | $ | 518,173 | |
The difference between components of distributable earnings (accumulated losses) on a tax basis and the amounts reflected in the statement of assets and liabilities is primarily due to wash sales, investments in partnerships, investments in PFICs and the tax treatment of short-term capital gains.
3 Investment Adviser and Administration Fee and Other Transactions with Affiliates
The investment adviser and administration fee is earned by EVM as compensation for investment advisory and administrative services rendered to the Fund. The fee is computed at an annual rate of 0.70% of the Fund’s average daily net assets up to $500 million and is payable monthly. On net assets of $500 million and over, the annual fee is reduced. For the year ended January 31, 2014, the investment adviser and administration fee amounted to $39,190 or 0.70% of the Fund’s average daily net assets. Pursuant to a sub-advisory agreement, EVM has delegated the investment management of the Fund to Parametric Portfolio Associates LLC (Parametric), a majority-owned subsidiary of Eaton Vance Corp. EVM pays Parametric a portion of its advisory and administration fee for sub-advisory services provided to the Fund. The Fund invests its cash in Cash Reserves Fund. EVM does not currently receive a fee for advisory services provided to Cash Reserves Fund.
EVM and Parametric have agreed to reimburse the Fund’s expenses to the extent that total annual operating expenses (relating to ordinary operating expenses only) exceed 0.85% of the Fund’s average daily net assets. This agreement may be changed or terminated after May 31, 2014. Pursuant to this agreement, EVM and Parametric were allocated $160,465 in total of the Fund’s operating expenses for the year ended January 31, 2014.
EVM provides sub-transfer agency services to the Fund and receives a fee based upon the actual expenses it incurs in the performance of these services. For the year ended January 31, 2014, EVM earned $23 in sub-transfer agent fees, which are included in transfer and dividend disbursing agent fees on the Statement of Operations.
Trustees and officers of the Fund who are members of EVM’s organization receive remuneration for their services to the Fund out of the investment adviser and administration fee. Trustees of the Fund who are not affiliated with EVM may elect to defer receipt of all or a percentage of their annual fees in accordance with the terms of the Trustees Deferred Compensation Plan. For the year ended January 31, 2014, no significant amounts have been deferred. Certain officers and Trustees of the Fund are officers of EVM.
4 Purchases and Sales of Investments
Purchases and sales of investments, other than short-term obligations, aggregated $2,225,222 and $2,095,443, respectively, for the year ended January 31, 2014.
5 Shares of Beneficial Interest
The Fund’s Declaration of Trust permits the Trustees to issue an unlimited number of full and fractional shares of beneficial interest (without par value). Such shares may be issued in a number of different series (such as the Fund) and classes. Transactions in Fund shares were as follows:
| | | | | | | | |
| Institutional Class | | Year Ended
January 31, 2014 | | | Period Ended
January 31, 2013(1) | |
| | |
Sales | | | 7,114 | | | | 500,000 | |
Issued to shareholders electing to receive payments of distributions in Fund shares | | | 23,747 | | | | — | |
Redemptions | | | (949 | ) | | | — | |
| | |
Net increase | | | 29,912 | | | | 500,000 | |
| (1) | For the period from the start of business, December 20, 2012, to January 31, 2013. |
At January 31, 2014, an affiliate of EVM owned approximately 99% of the outstanding shares of the Fund.
Parametric Global Small-Cap Fund
January 31, 2014
Notes to Financial Statements — continued
6 Federal Income Tax Basis of Investments
The cost and unrealized appreciation (depreciation) of investments of the Fund at January 31, 2014, as determined on a federal income tax basis, were as follows:
| | | | |
| |
Aggregate cost | | $ | 5,313,328 | |
| |
Gross unrealized appreciation | | $ | 957,294 | |
Gross unrealized depreciation | | | (438,616 | ) |
| |
Net unrealized appreciation | | $ | 518,678 | |
7 Risks Associated with Foreign Investments
Investing in securities issued by companies whose principal business activities are outside the United States may involve significant risks not present in domestic investments. For example, there is generally less publicly available information about foreign companies, particularly those not subject to the disclosure and reporting requirements of the U.S. securities laws. Certain foreign issuers are generally not bound by uniform accounting, auditing, and financial reporting requirements and standards of practice comparable to those applicable to domestic issuers. Investments in foreign securities also involve the risk of possible adverse changes in investment or exchange control regulations, expropriation or confiscatory taxation, limitation on the removal of funds or other assets of the Fund, political or financial instability or diplomatic and other developments which could affect such investments. Foreign securities markets, while growing in volume and sophistication, are generally not as developed as those in the United States, and securities of some foreign issuers (particularly those located in developing countries) may be less liquid and more volatile than securities of comparable U.S. companies. In general, there is less overall governmental supervision and regulation of foreign securities markets, broker/dealers and issuers than in the United States.
8 Line of Credit
The Fund participates with other portfolios and funds managed by EVM and its affiliates in a $750 million unsecured line of credit agreement with a group of banks. Borrowings are made by the Fund solely to facilitate the handling of unusual and/or unanticipated short-term cash requirements. Interest is charged to the Fund based on its borrowings at an amount above either the Eurodollar rate or Federal Funds rate. In addition, a fee computed at an annual rate of 0.08% on the daily unused portion of the line of credit is allocated among the participating portfolios and funds at the end of each quarter. Because the line of credit is not available exclusively to the Fund, it may be unable to borrow some or all of its requested amounts at any particular time. The Fund did not have any significant borrowings or allocated fees during the year ended January 31, 2014.
9 Fair Value Measurements
Under generally accepted accounting principles for fair value measurements, a three-tier hierarchy to prioritize the assumptions, referred to as inputs, is used in valuation techniques to measure fair value. The three-tier hierarchy of inputs is summarized in the three broad levels listed below.
| Ÿ | | Level 1 – quoted prices in active markets for identical investments |
| Ÿ | | Level 2 – other significant observable inputs (including quoted prices for similar investments, interest rates, prepayment speeds, credit risk, etc.) |
| Ÿ | | Level 3 – significant unobservable inputs (including a fund’s own assumptions in determining the fair value of investments) |
In cases where the inputs used to measure fair value fall in different levels of the fair value hierarchy, the level disclosed is determined based on the lowest level input that is significant to the fair value measurement in its entirety. The inputs or methodology used for valuing securities are not necessarily an indication of the risk associated with investing in those securities.
Parametric Global Small-Cap Fund
January 31, 2014
Notes to Financial Statements — continued
At January 31, 2014, the hierarchy of inputs used in valuing the Fund’s investments, which are carried at value, were as follows:
| | | | | | | | | | | | | | | | |
| Asset Description | | Level 1 | | | Level 2 | | | Level 3 | | | Total | |
| | | | |
Common Stocks | | | | | | | | | | | | | | | | |
Asia/Pacific | | $ | 32,550 | | | $ | 1,684,966 | | | $ | — | | | $ | 1,717,516 | |
Developed Europe | | | 45,387 | | | | 1,520,365 | | | | — | | | | 1,565,752 | |
Developed Middle East | | | 12,894 | | | | 62,866 | | | | — | | | | 75,760 | |
Emerging Europe | | | 5,121 | | | | 126,728 | | | | — | | | | 131,849 | |
Latin America | | | 56,202 | | | | 139,263 | | | | — | | | | 195,465 | |
Middle East/Africa | | | — | | | | 87,583 | | | | — | | | | 87,583 | |
North America | | | 1,916,550 | | | | — | | | | — | | | | 1,916,550 | |
| | | | |
Total Common Stocks | | $ | 2,068,704 | | | $ | 3,621,771 | * | | $ | — | | | $ | 5,690,475 | |
| | | | |
Equity-Linked Securities | | $ | — | | | $ | 114,579 | | | $ | — | | | $ | 114,579 | |
Investment Funds | | | — | | | | 9 | | | | — | | | | 9 | |
Short-Term Investments | | | — | | | | 26,943 | | | | — | | | | 26,943 | |
| | | | |
Total Investments | | $ | 2,068,704 | | | $ | 3,763,302 | | | $ | — | | | $ | 5,832,006 | |
| * | Includes foreign equity securities whose values were adjusted to reflect market trading of comparable securities or other correlated instruments that occurred after the close of trading in their applicable foreign markets. |
The Fund held no investments or other financial instruments as of January 31, 2013 whose fair value was determined using Level 3 inputs. At January 31, 2014, the value of investments transferred between Level 1 and Level 2 during the year then ended was not significant.
Parametric Global Small-Cap Fund
January 31, 2014
Report of Independent Registered Public Accounting Firm
To the Trustees of Eaton Vance Mutual Funds Trust and Shareholders of Parametric Global Small-Cap Fund:
We have audited the accompanying statement of assets and liabilities of Parametric Global Small-Cap Fund (“the “Fund”) (one of the funds constituting Eaton Vance Mutual Funds Trust), including the portfolio of investments, as of January 31, 2014, and the related statement of operations for the year then ended, and the statements of changes in net assets and the financial highlights for the year then ended and for the period from the start of business, December 20, 2012, to January 31, 2013. These financial statements and financial highlights are the responsibility of the Fund’s management. Our responsibility is to express an opinion on these financial statements and financial highlights based on our audits.
We conducted our audits in accordance with the standards of the Public Company Accounting Oversight Board (United States). Those standards require that we plan and perform the audit to obtain reasonable assurance about whether the financial statements and financial highlights are free of material misstatement. The Fund is not required to have, nor were we engaged to perform, an audit of its internal control over financial reporting. Our audits included consideration of internal control over financial reporting as a basis for designing audit procedures that are appropriate in the circumstances, but not for the purpose of expressing an opinion on the effectiveness of the Fund’s internal control over financial reporting. Accordingly, we express no such opinion. An audit also includes examining, on a test basis, evidence supporting the amounts and disclosures in the financial statements, assessing the accounting principles used and significant estimates made by management, as well as evaluating the overall financial statement presentation. Our procedures included confirmation of securities owned as of January 31, 2014, by correspondence with the custodian and brokers; where replies were not received from brokers, we performed other auditing procedures. We believe that our audits provide a reasonable basis for our opinion.
In our opinion, such financial statements and financial highlights referred to above present fairly, in all material respects, the financial position of Parametric Global Small-Cap Fund as of January 31, 2014, the results of its operations for the year then ended, and the changes in its net assets and the financial highlights for the year then ended, and for the period from the start of business, December 20, 2012 to January 31, 2013, in conformity with accounting principles generally accepted in the United States of America.
DELOITTE & TOUCHE LLP
Boston, Massachusetts
March 17, 2014
Parametric Global Small-Cap Fund
January 31, 2014
Federal Tax Information (Unaudited)
The Form 1099-DIV you receive in February 2015 will show the tax status of all distributions paid to your account in calendar year 2014. Shareholders are advised to consult their own tax adviser with respect to the tax consequences of their investment in the Fund. As required by the Internal Revenue Code and/or regulations, shareholders must be notified regarding the status of qualified dividend income for individuals, the foreign tax credit and capital gains dividends.
Qualified Dividend Income. The Fund designates approximately $103,523, or up to the maximum amount of such dividends allowable pursuant to the Internal Revenue Code, as qualified dividend income eligible for the reduced tax rate of 15%.
Dividends Received Deduction. Corporate shareholders are generally entitled to take the dividends received deduction on the portion of the Fund’s dividend distribution that qualifies under tax law. For the Fund’s fiscal 2014 ordinary income dividends, 5.66% qualifies for the corporate dividends received deduction.
Foreign Tax Credit. The Fund paid foreign taxes of $12,870 and recognized foreign source income of $124,666.
Capital Gain Dividends. The Fund hereby designates as a capital gain dividend with respect to the taxable year ended January 31, 2014, $642, or, if subsequently determined to be different, the net capital gain of such year.
Parametric Global Small-Cap Fund
January 31, 2014
Management and Organization
Fund Management. The Trustees of Eaton Vance Mutual Funds Trust (the Trust) are responsible for the overall management and supervision of the Trust’s affairs. The Trustees and officers of the Trust are listed below. Except as indicated, each individual has held the office shown or other offices in the same company for the last five years. Trustees and officers of the Trust hold indefinite terms of office. The “Noninterested Trustees” consist of those Trustees who are not “interested persons” of the Trust, as that term is defined under the 1940 Act. The business address of each Trustee and officer is Two International Place, Boston, Massachusetts 02110. As used below, “EVC” refers to Eaton Vance Corp., “EV” refers to Eaton Vance, Inc., “EVM” refers to Eaton Vance Management, “BMR” refers to Boston Management and Research and “EVD” refers to Eaton Vance Distributors, Inc. EVC and EV are the corporate parent and trustee, respectively, of EVM and BMR. EVD is the Fund’s principal underwriter and a wholly-owned subsidiary of EVC. Each officer affiliated with Eaton Vance may hold a position with other Eaton Vance affiliates that is comparable to his or her position with EVM listed below. Each Trustee oversees 182 portfolios in the Eaton Vance Complex (including all master and feeder funds in a master feeder structure). Each officer serves as an officer of certain other Eaton Vance funds. Each Trustee and officer serves until his or her successor is elected.
| | | | | | |
| Name and Year of Birth | | Position(s) with the
Trust | | Trustee Since(1) | | Principal Occupation(s) and Directorships During Past Five Years and Other Relevant Experience |
Interested Trustee | | | | | | |
| | | |
Thomas E. Faust Jr. 1958 | | Trustee | | 2007 | | Chairman, Chief Executive Officer and President of EVC, Director and President of EV, Chief Executive Officer and President of EVM and BMR, and Director of EVD. Trustee and/or officer of 182 registered investment companies. Mr. Faust is an interested person because of his positions with EVM, BMR, EVD, EVC and EV, which are affiliates of the Trust. Directorships in the Last Five Years.(2) Director of EVC and Hexavest Inc. |
| | | |
| | | | | | |
Noninterested Trustees | | | | | | |
| | | |
Scott E. Eston 1956 | | Trustee | | 2011 | | Private investor. Formerly held various positions at Grantham, Mayo, Van Otterloo and Co., L.L.C. (investment management firm) (1997-2009), including Chief Operating Officer (2002-2009), Chief Financial Officer (1997-2009) and Chairman of the Executive Committee (2002-2008); President and Principal Executive Officer, GMO Trust (open-end registered investment company) (2006-2009). Former Partner, Coopers and Lybrand L.L.P. (now PricewaterhouseCoopers) (public accounting firm) (1987-1997). Directorships in the Last Five Years.(2) None. |
| | | |
Allen R. Freedman 1940 | | Trustee | | 2007 | | Private Investor. Former Chairman (2002-2004) and a Director (1983-2004) of Systems & Computer Technology Corp. (provider of software to higher education). Formerly, a Director of Loring Ward International (fund distributor) (2005-2007). Former Chairman and a Director of Indus International, Inc. (provider of enterprise management software to the power generating industry) (2005-2007). Former Chief Executive Officer of Assurant, Inc. (insurance provider) (1979-2000). Directorships in the Last Five Years.(2) Director of Stonemor Partners, L.P. (owner and operator of cemeteries). Formerly, Director of Assurant, Inc. (insurance provider) (1979-2011). |
| | | |
Valerie A. Mosley(3) 1960 | | Trustee | | 2014 | | Chairwoman and Chief Executive Officer of Valmo Ventures (a consulting and investment firm). Former Partner and Senior Vice President, Portfolio Manager and Investment Strategist at Wellington Management Company, LLP (investment management firm) (1992-2012). Former Chief Investment Officer, PG Corbin Asset Management (1990-1992). Formerly worked in institutional corporate bond sales at Kidder Peabody (1986-1990). Directorships in the Last Five Years. Director of Dynex Capital, Inc. (mortgage REIT) (since 2013). |
| | | |
William H. Park 1947 | | Trustee | | 2003 | | Consultant and private investor. Formerly, Chief Financial Officer, Aveon Group L.P. (investment management firm) (2010-2011). Formerly, Vice Chairman, Commercial Industrial Finance Corp. (specialty finance company) (2006-2010). Formerly, President and Chief Executive Officer, Prizm Capital Management, LLC (investment management firm) (2002-2005). Formerly, Executive Vice President and Chief Financial Officer, United Asset Management Corporation (investment management firm) (1982-2001). Formerly, Senior Manager, Price Waterhouse (now PricewaterhouseCoopers) (an independent registered public accounting firm) (1972-1981). Directorships in the Last Five Years.(2) None. |
Parametric Global Small-Cap Fund
January 31, 2014
Management and Organization — continued
| | | | | | |
| Name and Year of Birth | | Position(s) with the
Trust | | Trustee Since(1) | | Principal Occupation(s) and Directorships During Past Five Years and Other Relevant Experience |
Noninterested Trustees (continued) |
| | | |
Ronald A. Pearlman 1940 | | Trustee | | 2003 | | Professor of Law, Georgetown University Law Center. Formerly, Deputy Assistant Secretary (Tax Policy) and Assistant Secretary (Tax Policy), U.S. Department of the Treasury (1983-1985). Formerly, Chief of Staff, Joint Committee on Taxation, U.S. Congress (1988-1990). Directorships in the Last Five Years.(2) None. |
| | | |
Helen Frame Peters 1948 | | Trustee | | 2008 | | Professor of Finance, Carroll School of Management, Boston College. Formerly, Dean, Carroll School of Management, Boston College (2000-2002). Formerly, Chief Investment Officer, Fixed Income, Scudder Kemper Investments (investment management firm) (1998-1999). Formerly, Chief Investment Officer, Equity and Fixed Income, Colonial Management Associates (investment management firm) (1991-1998). Directorships in the Last Five Years.(2) Formerly, Director of BJ’s Wholesale Club, Inc. (wholesale club retailer) (2004-2011). Formerly, Trustee of SPDR Index Shares Funds and SPDR Series Trust (exchange traded funds) (2000-2009). Formerly, Director of Federal Home Loan Bank of Boston (a bank for banks) (2007-2009). |
| | | |
Lynn A. Stout 1957 | | Trustee | | 1998 | | Distinguished Professor of Corporate and Business Law, Jack G. Clarke Business Law Institute, Cornell University Law School. Formerly, the Paul Hastings Professor of Corporate and Securities Law (2006-2012) and Professor of Law (2001-2006), University of California at Los Angeles School of Law. Directorships in the Last Five Years.(2) None. |
| | | |
Harriett Tee Taggart 1948 | | Trustee | | 2011 | | Managing Director, Taggart Associates (a professional practice firm). Formerly, Partner and Senior Vice President, Wellington Management Company, LLP (investment management firm) (1983-2006). Directorships in the Last Five Years.(2) Director of Albemarle Corporation (chemicals manufacturer) (since 2007) and The Hanover Group (specialty property and casualty insurance company) (since 2009). Formerly, Director of Lubrizol Corporation (specialty chemicals) (2007-2011). |
| | | |
Ralph F. Verni 1943 | | Chairman of the Board and Trustee | | 2007 (Chairman);
2005 (Trustee) | | Consultant and private investor. Formerly, Chief Investment Officer (1982-1992), Chief Financial Officer (1988-1990) and Director (1982-1992), New England Life. Formerly, Chairperson, New England Mutual Funds (1982-1992). Formerly, President and Chief Executive Officer, State Street Management & Research (1992-2000). Formerly, Chairperson, State Street Research Mutual Funds (1992-2000). Formerly, Director, W.P. Carey, LLC (1998-2004) and First Pioneer Farm Credit Corp. (2002-2006). Directorships in the Last Five Years.(2) None. |
| | | |
| | | | | | |
Principal Officers who are not Trustees |
| Name and Year of Birth | | Position(s) with the Trust | | Officer
Since(4) | | Principal Occupation(s) During Past Five Years |
Payson F. Swaffield 1956 | | President | | 2003 | | Vice President and Chief Income Investment Officer of EVM and BMR. |
| | | |
Maureen A. Gemma 1960 | | Vice President, Secretary and Chief Legal Officer | | 2005 | | Vice President of EVM and BMR. |
| | | |
James F. Kirchner 1967 | | Treasurer | | 2007 | | Vice President of EVM and BMR. |
Parametric Global Small-Cap Fund
January 31, 2014
Management and Organization — continued
| | | | | | |
| Name and Year of Birth | | Position(s) with the Trust | | Officer
Since(4) | | Principal Occupation(s) During Past Five Years |
Principal Officers who are not Trustees (continued) |
| | | |
Paul M. O’Neil 1953 | | Chief Compliance Officer | | 2004 | | Vice President of EVM and BMR. |
| (1) | Date first appointed to serve as Trustee for a fund in the Eaton Vance family of funds. Each Trustee has served continuously since appointment unless indicated otherwise. |
| (2) | During their respective tenures, the Trustees (except for, Mr. Eston and Ms. Taggart for all funds except eUnitsTM 2 Year U.S. Equity Market Participation Trust: Upside to Cap/Buffered Downside and Ms. Mosley for all funds) also served as Board members of one or more of the following funds (which operated in the years noted): eUnitsTM 2 Year U.S. Equity Market Participation Trust: Upside to Cap/Buffered Downside (launched in 2012 and terminated in 2014); Eaton Vance Credit Opportunities Fund (launched in 2005 and terminated in 2010); Eaton Vance Insured Florida Plus Municipal Bond Fund (launched in 2002 and terminated in 2009); and Eaton Vance National Municipal Income Trust (launched in 1998 and terminated in 2009). |
| (3) | Effective January 1, 2014, Ms. Mosley was appointed as a Trustee of the Trust. |
| (4) | Date first elected to serve as officer of a fund in the Eaton Vance family of funds. Titles may have changed since initial appointment. |
The SAI for the Fund includes additional information about the Trustees and officers of the Fund and can be obtained without charge on Eaton Vance’s website at www.eatonvance.com or by calling 1-800-260-0761.
Eaton Vance Funds
IMPORTANT NOTICES
Privacy. The Eaton Vance organization is committed to ensuring your financial privacy. Each of the financial institutions identified below has in effect the following policy (“Privacy Policy”) with respect to nonpublic personal information about its customers:
| Ÿ | | Only such information received from you, through application forms or otherwise, and information about your Eaton Vance fund transactions will be collected. This may include information such as name, address, social security number, tax status, account balances and transactions. |
| Ÿ | | None of such information about you (or former customers) will be disclosed to anyone, except as permitted by law (which includes disclosure to employees necessary to service your account). In the normal course of servicing a customer’s account, Eaton Vance may share information with unaffiliated third parties that perform various required services such as transfer agents, custodians and broker-dealers. |
| Ÿ | | Policies and procedures (including physical, electronic and procedural safeguards) are in place that are designed to protect the confidentiality of such information. |
| Ÿ | | We reserve the right to change our Privacy Policy at any time upon proper notification to you. Customers may want to review our Privacy Policy periodically for changes by accessing the link on our homepage: www.eatonvance.com. |
Our pledge of privacy applies to the following entities within the Eaton Vance organization: the Eaton Vance Family of Funds, Eaton Vance Management, Eaton Vance Investment Counsel, Eaton Vance Distributors, Inc., Eaton Vance Trust Company, Eaton Vance Management’s Real Estate Investment Group and Boston Management and Research. In addition, our Privacy Policy applies only to those Eaton Vance customers who are individuals and who have a direct relationship with us. If a customer’s account (i.e., fund shares) is held in the name of a third-party financial advisor/broker-dealer, it is likely that only such advisor’s privacy policies apply to the customer. This notice supersedes all previously issued privacy disclosures. For more information about Eaton Vance’s Privacy Policy, please call 1-800-262-1122.
Delivery of Shareholder Documents. The Securities and Exchange Commission (SEC) permits funds to deliver only one copy of shareholder documents, including prospectuses, proxy statements and shareholder reports, to fund investors with multiple accounts at the same residential or post office box address. This practice is often called “householding” and it helps eliminate duplicate mailings to shareholders. Eaton Vance, or your financial advisor, may household the mailing of your documents indefinitely unless you instruct Eaton Vance, or your financial advisor, otherwise. If you would prefer that your Eaton Vance documents not be householded, please contact Eaton Vance at 1-800-260-0761, or contact your financial advisor. Your instructions that householding not apply to delivery of your Eaton Vance documents will be effective within 30 days of receipt by Eaton Vance or your financial advisor.
Portfolio Holdings. Each Eaton Vance Fund and its underlying Portfolio(s) (if applicable) will file a schedule of portfolio holdings on Form N-Q with the SEC for the first and third quarters of each fiscal year. The Form N-Q will be available on the Eaton Vance website at www.eatonvance.com, by calling Eaton Vance at 1-800-260-0761 or in the EDGAR database on the SEC’s website at www.sec.gov. Form N-Q may also be reviewed and copied at the SEC’s public reference room in Washington, D.C. (call 1-800-732-0330 for information on the operation of the public reference room).
Proxy Voting. From time to time, funds are required to vote proxies related to the securities held by the funds. The Eaton Vance Funds or their underlying Portfolios (if applicable) vote proxies according to a set of policies and procedures approved by the Funds’ and Portfolios’ Boards. You may obtain a description of these policies and procedures and information on how the Funds or Portfolios voted proxies relating to portfolio securities during the most recent 12-month period ended June 30, without charge, upon request, by calling 1-800-260-0761 and by accessing the SEC’s website at www.sec.gov.
Investment Adviser and Administrator
Eaton Vance Management
Two International Place
Boston, MA 02110
Sub-Adviser
Parametric Portfolio Associates LLC
1918 Eighth Avenue, Suite 3100
Seattle, WA 98101
Principal Underwriter*
Eaton Vance Distributors, Inc.
Two International Place
Boston, MA 02110
(617) 482-8260
Custodian
State Street Bank and Trust Company
200 Clarendon Street
Boston, MA 02116
Transfer Agent
BNY Mellon Asset Servicing (US) Inc.
Attn: Eaton Vance Funds
P.O. Box 9653
Providence, RI 02940-9653
(800) 260-0761
Independent Registered Public Accounting Firm
Deloitte & Touche LLP
200 Berkeley Street
Boston, MA 02116-5022
Fund Offices
Two International Place
Boston, MA 02110
| * | FINRA BrokerCheck. Investors may check the background of their Investment Professional by contacting the Financial Industry Regulatory Authority (FINRA). FINRA BrokerCheck is a free tool to help investors check the professional background of current and former FINRA-registered securities firms and brokers. FINRA BrokerCheck is available by calling 1-800-289-9999 and at www.FINRA.org. The FINRA BrokerCheck brochure describing the program is available to investors at www.FINRA.org. |

| | |
Parametric International Equity Fund Annual Report January 31, 2014 | | |

Commodity Futures Trading Commission Registration. Effective December 31, 2012, the Commodity Futures Trading Commission (“CFTC”) adopted certain regulatory changes that subject registered investment companies and advisers to regulation by the CFTC if a fund invests more than a prescribed level of its assets in certain CFTC-regulated instruments (including futures, certain options and swap agreements) or markets itself as providing investment exposure to such instruments. The Fund has claimed an exclusion from the definition of the term “commodity pool operator” under the Commodity Exchange Act. Accordingly, neither the Fund nor the adviser with respect to the operation of the Fund is subject to CFTC regulation. Because of its management of other strategies, the Fund’s adviser is registered with the CFTC as a commodity pool operator and a commodity trading advisor.
Fund shares are not insured by the FDIC and are not deposits or other obligations of, or guaranteed by, any depository institution. Shares are subject to investment risks, including possible loss of principal invested.
This report must be preceded or accompanied by a current summary prospectus or prospectus. Before investing, investors should consider carefully the investment objective, risks, and charges and expenses of a mutual fund. This and other important information is contained in the summary prospectus and prospectus, which can be obtained from a financial advisor. Prospective investors should read the prospectus carefully before investing. For further information, please call 1-800-260-0761.
Annual Report January 31, 2014
Parametric International Equity Fund
Table of Contents
| | | | |
Management’s Discussion of Fund Performance | | | 2 | |
| |
Performance | | | 3 | |
| |
Fund Profile | | | 4 | |
| |
Endnotes and Additional Disclosures | | | 5 | |
| |
Fund Expenses | | | 6 | |
| |
Financial Statements | | | 7 | |
| |
Report of Independent Registered Public Accounting Firm | | | 26 | |
| |
Federal Tax Information | | | 27 | |
| |
Management and Organization | | | 28 | |
| |
Important Notices | | | 31 | |
Parametric International Equity Fund
January 31, 2014
Management’s Discussion of Fund Performance1
Economic and Market Conditions
As the 12-month period started on February 1, 2013, global stocks, as measured by the MSCI All Country World Index (ACWI)2, had recently begun a rally that would continue well into May, driven largely by strengthening economic data in the U.S., Europe and elsewhere, along with highly accommodative monetary policies by global central banks.
In late May 2013, however, then-U.S. Federal Reserve (the Fed) Chairman Ben Bernanke surprised the markets by indicating that the Fed’s $85 billion in monthly asset purchases, known collectively as quantitative easing (QE), could begin to taper off sooner than most investors had expected. The negative effect on worldwide markets was swift and dramatic. Bond investors rushed to sell assets in anticipation of rising interest rates. The prospect of reduced Fed stimulus weighed on global equities as well, most notably in emerging markets.
By late June 2013, however, global equities, in general, resumed their upward trajectory. Factors contributing to the rally included some backtracking by the Fed on its earlier statements regarding QE, ongoing improvements in housing and other U.S. economic data, and news from Europe that the eurozone had officially come out of recession.
After faltering again in August 2013 amid geopolitical tensions in the Middle East, global equities once more trended upward. In mid-September, the Fed again surprised investors by announcing that it was postponing any tapering of QE for the time being. Global stocks initially surged in response, only to drift downward in late September and early October amid investor uncertainty over the Fed’s intentions and a Congressional impasse that led to a partial U.S. government shutdown on October 1, 2013.
In mid-October, global stocks reversed direction again and began a rally that more or less lasted through the rest of 2013, driven largely by moderate economic growth that seemed to confirm the global recovery was gaining strength. Even the Fed’s mid-December announcement that tapering of QE would begin in January 2014 did not derail the rally, as investors appeared relieved that the tapering would be gradual and that the Fed still intended to keep short-term interest rates near zero for an extended period.
However, when the Fed announced further tapering toward the end of January, the reaction from global markets was
more negative. Although the Fed’s latest move was widely expected, many investors worried about continued withdrawal of stimulus in the face of recent emerging-market turmoil and some mixed economic data. Against this backdrop, the MSCI ACWI slid 4.00% for the month of January 2014.
For the full 12-month period, the MSCI ACWI returned 12.70%. In the U.S., the S&P 500 Index gained 21.52%, achieving multiple all-time closing highs along the way. The nascent European recovery helped power the FTSE Eurotop 100 Index to a 12.59% return. In response to Prime Minister Shinzo Abe’s stimulus efforts, Japan’s Nikkei-225 Stock Average advanced 19.82%. Elsewhere in the Asia-Pacific region, the MSCI Golden Dragon Index declined 2.32% amid slowing growth in China. Emerging markets were among the period’s worst performers, with the MSCI Emerging Markets Index falling 10.17%.
Fund Performance
For the 12-month period ended January 31, 2014, Parametric International Equity Fund (the Fund) had a total return of 9.04% for Investor Class shares at net asset value (NAV), underperforming the 11.93% return of the Fund’s benchmark, the MSCI EAFE Index (the Index).
Factors detracting from the Fund’s performance relative to the Index included an underweight position in Japan, where equities generally performed strongly for the 12-month period on massive government stimulus measures. Also detracting from the Fund’s performance versus the Index was the Fund’s overweight position in Singapore, whose market was adversely impacted by concerns about tighter U.S. monetary policy. An underweight position in the financials sector also detracted from the Fund’s performance versus the Index, as bank stocks generally rallied during the period on favorable economic conditions.
Factors contributing to the Fund’s performance relative to the Index included an underweight position in Australia, whose market was dragged down by poor results among commodity-related stocks during the period. Overweight positions in Ireland, Finland and Spain further contributed to the Fund’s performance versus the Index, as European markets generally rose during the period on strengthening economic indicators. An overweight position in the industrials sector also aided the Fund’s performance relative to the Index, as economically sensitive sectors benefited from improved economic activity during the period.
See Endnotes and Additional Disclosures in this report.
Past performance is no guarantee of future results. Returns are historical and are calculated by determining the percentage change in net asset value (NAV) or offering price (as applicable) with all distributions reinvested. Investment return and principal value will fluctuate so that shares, when redeemed, may be worth more or less than their original cost. Performance less than one year is cumulative. Performance is for the stated time period only; due to market volatility, the Fund’s current performance may be lower or higher than quoted. Returns are before taxes unless otherwise noted. For performance as of the most recent month end, please refer to eatonvance.com.
Parametric International Equity Fund
January 31, 2014
Performance2,3
Portfolio Managers David Stein, Ph.D. and Thomas Seto, each of Parametric Portfolio Associates LLC
| | | | | | | | | | | | | | | | | | | | |
| % Average Annual Total Returns | | Class
Inception Date | | | Performance
Inception Date | | | One Year | | | Five Years | | | Since Inception | |
Investor Class at NAV | | | 04/01/2010 | | | | 04/01/2010 | | | | 9.04 | % | | | — | | | | 6.78 | % |
Institutional Class at NAV | | | 04/01/2010 | | | | 04/01/2010 | | | | 9.31 | | | | — | | | | 7.05 | |
MSCI EAFE Index | | | — | | | | — | | | | 11.93 | % | | | 13.83 | % | | | 7.01 | % |
| | | | | |
| | | | | | | | | | | | | | | | | | | | |
| % Total Annual Operating Expense Ratios4 | | | | | | | | | | | Investor
Class | | | Institutional
Class | |
Gross | | | | | | | | | | | | | | | 1.51 | % | | | 1.25 | % |
Net | | | | | | | | | | | | | | | 1.05 | | | | 0.80 | |
Growth of $10,000
This graph shows the change in value of a hypothetical investment of $10,000 in Investor Class of the Fund for the period indicated. For comparison, the same investment is shown in the indicated index.
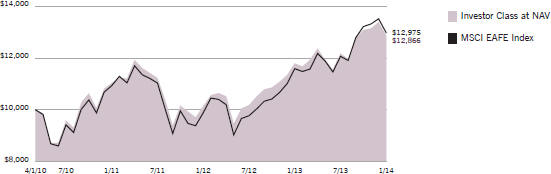
| | | | | | | | | | | | | | | | |
| Growth of Investment | | Amount Invested | | | Period Beginning | | | At NAV | | | With Maximum
Sales Charge | |
Institutional Class | | $ | 50,000 | | | | 04/01/2010 | | | $ | 64,967 | | | | N.A. | |
See Endnotes and Additional Disclosures in this report.
Past performance is no guarantee of future results. Returns are historical and are calculated by determining the percentage change in net asset value (NAV) or offering price (as applicable) with all distributions reinvested. Investment return and principal value will fluctuate so that shares, when redeemed, may be worth more or less than their original cost. Performance less than one year is cumulative. Performance is for the stated time period only; due to market volatility, the Fund’s current performance may be lower or higher than quoted. Returns are before taxes unless otherwise noted. For performance as of the most recent month end, please refer to eatonvance.com.
Parametric International Equity Fund
January 31, 2014
Fund Profile
Sector Allocation (% of net assets)5
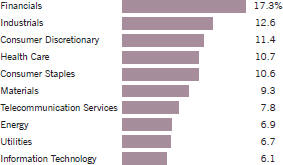
Geographic Allocation (% of common stocks)
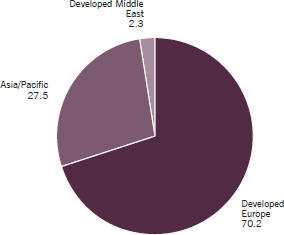
Top 10 Holdings (% of net assets)5
| | | | |
Novo Nordisk A/S, Class B | | | 1.4 | % |
Nestle SA | | | 1.3 | |
SAP AG | | | 1.2 | |
Linde AG | | | 1.1 | |
DBS Group Holdings, Ltd. | | | 1.1 | |
ENI SpA | | | 1.1 | |
Anheuser-Busch InBev NV | | | 1.1 | |
ASML Holding NV | | | 1.1 | |
Coloplast A/S, Class B | | | 1.0 | |
Novartis AG | | | 0.9 | |
Total | | | 11.3 | % |
See Endnotes and Additional Disclosures in this report.
Parametric International Equity Fund
January 31, 2014
Endnotes and Additional Disclosures
| 1 | The views expressed in this report are those of the portfolio manager(s) and are current only through the date stated at the top of this page. These views are subject to change at any time based upon market or other conditions, and Eaton Vance and the Fund(s) disclaim any responsibility to update such views. These views may not be relied upon as investment advice and, because investment decisions are based on many factors, may not be relied upon as an indication of trading intent on behalf of any Eaton Vance fund. This commentary may contain statements that are not historical facts, referred to as “forward looking statements”. The Fund’s actual future results may differ significantly from those stated in any forward looking statement, depending on factors such as changes in securities or financial markets or general economic conditions, the volume of sales and purchases of Fund shares, the continuation of investment advisory, administrative and service contracts, and other risks discussed from time to time in the Fund’s filings with the Securities and Exchange Commission. |
| 2 | MSCI All Country World Index is an unmanaged free float-adjusted market-capitalization-weighted index designed to measure the equity market performance of developed and emerging markets. MSCI Golden Dragon Index is an unmanaged index of common stocks traded in China, Hong Kong and Taiwan. MSCI Emerging Markets Index is an unmanaged index of emerging markets common stocks. MSCI EAFE Index is an unmanaged index of equities in the developed markets, excluding the U.S. and Canada. MSCI indices are net of foreign withholding taxes. Source: MSCI. MSCI data may not be reproduced or used for any other purpose. MSCI provides no warranties, has not prepared or approved this report, and has no liability hereunder. S&P 500 Index is an unmanaged index of large-cap stocks commonly used as a measure of U.S. stock market performance. FTSE Eurotop 100 Index is a tradable index designed to represent the performance of the 100 most highly capitalized blue-chip companies in Europe. The return for the FTSE Eurotop 100 Index is calculated in U.S. dollars. Nikkei-225 Stock Average is an unmanaged, price-weighted average of 225 top-rated Japanese companies listed in the First Section of the Tokyo Stock Exchange. Unless otherwise stated, index returns do not reflect the effect of any applicable sales charges, commissions, expenses, taxes or leverage, as applicable. It is not possible to invest directly in an index. |
| 3 | Returns are historical and are calculated by determining the percentage change in NAV with all distributions reinvested. Unless otherwise stated, performance does not reflect the deduction of taxes on Fund distributions or redemptions of Fund shares. Performance since inception for an index, if presented, is the performance since the Fund’s or oldest share class’ inception, as applicable. |
| 4 | Source: Fund prospectus. Net expense ratio reflects a contractual expense reimbursement that continues through 5/31/14. Without the reimbursement, performance would have been lower. |
| 5 | Excludes cash and cash equivalents. |
| | Fund profile subject to change due to active management. |
Parametric International Equity Fund
January 31, 2014
Fund Expenses
Example: As a Fund shareholder, you incur two types of costs: (1) transaction costs, including sales charges (loads) on purchases and redemption fees (if applicable); and (2) ongoing costs, including management fees; distribution and/or service fees; and other Fund expenses. This Example is intended to help you understand your ongoing costs (in dollars) of Fund investing and to compare these costs with the ongoing costs of investing in other mutual funds. The Example is based on an investment of $1,000 invested at the beginning of the period and held for the entire period (August 1, 2013 – January 31, 2014).
Actual Expenses: The first section of the table below provides information about actual account values and actual expenses. You may use the information in this section, together with the amount you invested, to estimate the expenses that you paid over the period. Simply divide your account value by $1,000 (for example, an $8,600 account value divided by $1,000 = 8.6), then multiply the result by the number in the first section under the heading entitled “Expenses Paid During Period” to estimate the expenses you paid on your account during this period.
Hypothetical Example for Comparison Purposes: The second section of the table below provides information about hypothetical account values and hypothetical expenses based on the actual Fund expense ratio and an assumed rate of return of 5% per year (before expenses), which is not the actual Fund return. The hypothetical account values and expenses may not be used to estimate the actual ending account balance or expenses you paid for the period. You may use this information to compare the ongoing costs of investing in your Fund and other funds. To do so, compare this 5% hypothetical example with the 5% hypothetical examples that appear in the shareholder reports of the other funds.
Please note that the expenses shown in the table are meant to highlight your ongoing costs only and do not reflect any transactional costs, such as sales charges (loads) or redemption fees (if applicable). Therefore, the second section of the table is useful in comparing ongoing costs only, and will not help you determine the relative total costs of owning different funds. In addition, if these transactional costs were included, your costs would be higher.
| | | | | | | | | | | | | | | | |
| | | Beginning
Account Value
(8/1/13) | | | Ending
Account Value
(1/31/14) | | | Expenses Paid
During Period*
(8/1/13 – 1/31/14) | | | Annualized
Expense
Ratio | |
| | | | |
| | | | | | | | | | | | | | | | |
Actual | | | | | | | | | | | | | |
Investor Class | | $ | 1,000.00 | | | $ | 1,056.40 | | | $ | 5.44 | ** | | | 1.05 | % |
Institutional Class | | $ | 1,000.00 | | | $ | 1,058.10 | | | $ | 4.15 | ** | | | 0.80 | % |
| | | | | | | | | | | | | | | | | |
| | | | |
| | | | | | | | | | | | | | | | |
Hypothetical | | | | | | | | | | | | | |
(5% return per year before expenses) | | | | | | | | | | | | | |
Investor Class | | $ | 1,000.00 | | | $ | 1,019.90 | | | $ | 5.35 | ** | | | 1.05 | % |
Institutional Class | | $ | 1,000.00 | | | $ | 1,021.20 | | | $ | 4.08 | ** | | | 0.80 | % |
| * | Expenses are equal to the Fund’s annualized expense ratio for the indicated Class, multiplied by the average account value over the period, multiplied by 184/365 (to reflect the one-half year period). The Example assumes that the $1,000 was invested at the net asset value per share determined at the close of business on July 31, 2013. |
| ** | Absent an allocation of certain expenses to affiliates, the expenses would be higher. |
Parametric International Equity Fund
January 31, 2014
Portfolio of Investments
| | | | | | | | |
| Common Stocks — 99.4% | |
| | |
| | | | | | | | |
| Security | | Shares | | | Value | |
| | | | | | | | |
|
Australia — 5.7% | |
AGL Energy, Ltd. | | | 12,775 | | | $ | 170,008 | |
Amcor, Ltd. | | | 54,391 | | | | 510,204 | |
APA Group | | | 9,374 | | | | 49,115 | |
Australia and New Zealand Banking Group, Ltd. | | | 10,231 | | | | 269,487 | |
BHP Billiton, Ltd. | | | 7,996 | | | | 255,354 | |
Caltex Australia, Ltd. | | | 2,200 | | | | 37,251 | |
CFS Retail Property Trust Group | | | 17,143 | | | | 29,077 | |
Coca-Cola Amatil, Ltd. | | | 12,701 | | | | 129,869 | |
Commonwealth Bank of Australia | | | 5,968 | | | | 387,481 | |
Computershare, Ltd. | | | 6,770 | | | | 66,142 | |
Crown, Ltd. | | | 2,586 | | | | 37,742 | |
CSL, Ltd. | | | 3,715 | | | | 228,666 | |
Federation Centres | | | 14,072 | | | | 27,919 | |
Flight Centre, Ltd. | | | 935 | | | | 38,748 | |
Fortescue Metals Group, Ltd. | | | 7,746 | | | | 35,929 | |
GPT Group | | | 15,885 | | | | 50,198 | |
Harvey Norman Holdings, Ltd. | | | 24,339 | | | | 63,755 | |
James Hardie Industries PLC CDI | | | 4,080 | | | | 46,115 | |
Leighton Holdings, Ltd. | | | 2,358 | | | | 33,890 | |
Metcash, Ltd. | | | 21,442 | | | | 56,583 | |
National Australia Bank, Ltd. | | | 8,497 | | | | 247,021 | |
Orica, Ltd. | | | 11,666 | | | | 240,136 | |
Origin Energy, Ltd. | | | 18,017 | | | | 220,181 | |
Orora, Ltd.(1) | | | 54,391 | | | | 60,928 | |
Qantas Airways, Ltd.(1) | | | 19,690 | | | | 18,854 | |
Rio Tinto, Ltd. | | | 3,764 | | | | 213,878 | |
Seek, Ltd. | | | 3,340 | | | | 36,256 | |
Sydney Airport | | | 9,117 | | | | 31,443 | |
Tabcorp Holdings, Ltd. | | | 11,542 | | | | 34,869 | |
Tatts Group, Ltd. | | | 15,658 | | | | 40,932 | |
Telstra Corp., Ltd. | | | 98,741 | | | | 444,414 | |
Toll Holdings, Ltd. | | | 7,061 | | | | 34,484 | |
Transurban Group | | | 13,826 | | | | 83,538 | |
Wesfarmers, Ltd. | | | 1,358 | | | | 49,827 | |
Westfield Retail Trust | | | 11,310 | | | | 29,881 | |
Westpac Banking Corp. | | | 2,941 | | | | 79,265 | |
Woodside Petroleum, Ltd. | | | 3,407 | | | | 111,425 | |
Woolworths, Ltd. | | | 6,642 | | | | 198,018 | |
| | |
| | | | | | $ | 4,698,883 | |
| | |
|
Austria — 1.0% | |
Andritz AG | | | 490 | | | $ | 26,887 | |
OMV AG | | | 10,325 | | | | 446,741 | |
| | | | | | | | |
| Security | | Shares | | | Value | |
| | | | | | | | |
|
Austria (continued) | |
Raiffeisen Bank International AG | | | 6,543 | | | $ | 250,886 | |
Verbund AG | | | 4,430 | | | | 93,323 | |
| | |
| | | | | | $ | 817,837 | |
| | |
|
Belgium — 3.6% | |
Ageas NV SA | | | 904 | | | $ | 38,792 | |
Anheuser-Busch InBev NV | | | 9,453 | | | | 906,001 | |
Belgacom SA | | | 9,652 | | | | 275,529 | |
Colruyt SA | | | 4,547 | | | | 257,944 | |
Delhaize Group SA | | | 686 | | | | 44,061 | |
Groupe Bruxelles Lambert SA | | | 4,844 | | | | 437,015 | |
KBC Groep NV | | | 730 | | | | 43,056 | |
Solvay SA | | | 1,971 | | | | 275,195 | |
Telenet Group Holding NV | | | 3,343 | | | | 198,575 | |
UCB SA | | | 4,037 | | | | 285,455 | |
Umicore SA | | | 4,293 | | | | 183,565 | |
| | |
| | | | | | $ | 2,945,188 | |
| | |
|
Denmark — 4.6% | |
A.P. Moller-Maersk A/S, Class A | | | 21 | | | $ | 224,790 | |
A.P. Moller-Maersk A/S, Class B | | | 23 | | | | 256,996 | |
Coloplast A/S, Class B | | | 10,805 | | | | 811,676 | |
Danske Bank A/S(1) | | | 2,198 | | | | 49,713 | |
DSV A/S | | | 9,896 | | | | 317,735 | |
Novo Nordisk A/S, Class B | | | 29,935 | | | | 1,185,832 | |
Novozymes A/S, Class B | | | 13,150 | | | | 568,251 | |
TDC A/S | | | 9,435 | | | | 88,764 | |
Tryg A/S | | | 1,718 | | | | 164,060 | |
William Demant Holding A/S(1) | | | 1,217 | | | | 111,995 | |
| | |
| | | | | | $ | 3,779,812 | |
| | |
|
Finland — 3.3% | |
Elisa Oyj | | | 10,113 | | | $ | 259,243 | |
Fortum Oyj | | | 7,742 | | | | 166,379 | |
Kesko Oyj, Class B | | | 2,158 | | | | 79,529 | |
Kone Oyj, Class B | | | 15,245 | | | | 618,654 | |
Metso Oyj | | | 2,592 | | | | 80,912 | |
Neste Oil Oyj | | | 9,917 | | | | 177,022 | |
Nokia Oyj (1) | | | 49,444 | | | | 342,193 | |
Nokian Renkaat Oyj | | | 1,308 | | | | 55,031 | |
Orion Oyj, Class B | | | 7,244 | | | | 189,071 | |
Sampo Oyj | | | 7,909 | | | | 366,723 | |
Stora Enso Oyj | | | 13,165 | | | | 122,873 | |
UPM-Kymmene Oyj | | | 3,398 | | | | 52,046 | |
| | | | |
| | 7 | | See Notes to Financial Statements. |
Parametric International Equity Fund
January 31, 2014
Portfolio of Investments — continued
| | | | | | | | |
| Security | | Shares | | | Value | |
| | | | | | | | |
|
Finland (continued) | |
Valmet Corp.(1) | | | 2,592 | | | $ | 21,866 | |
Wartsila Oyj | | | 4,279 | | | | 231,716 | |
| | |
| | | | | | $ | 2,763,258 | |
| | |
|
France — 6.5% | |
ADP | | | 1,248 | | | $ | 140,806 | |
Air Liquide SA | | | 5,035 | | | | 631,889 | |
AXA SA | | | 1,296 | | | | 33,995 | |
BNP Paribas SA | | | 530 | | | | 40,919 | |
Carrefour SA | | | 2,340 | | | | 80,408 | |
Casino Guichard-Perrachon SA | | | 349 | | | | 35,972 | |
CGG SA(1) | | | 3,549 | | | | 52,718 | |
Christian Dior SA | | | 628 | | | | 114,797 | |
CNP Assurances | | | 3,160 | | | | 61,828 | |
Compagnie Generale des Etablissements Michelin, Class B | | | 278 | | | | 29,243 | |
Credit Agricole SA(1) | | | 3,167 | | | | 42,496 | |
Dassault Systemes SA | | | 1,524 | | | | 180,736 | |
EDF SA | | | 1,139 | | | | 38,665 | |
Essilor International SA | | | 1,598 | | | | 160,357 | |
Eutelsat Communications SA | | | 525 | | | | 15,929 | |
GDF Suez | | | 11,405 | | | | 251,748 | |
Iliad SA | | | 236 | | | | 53,990 | |
Imerys SA | | | 900 | | | | 73,180 | |
JCDecaux SA | | | 771 | | | | 32,879 | |
Kering SA | | | 354 | | | | 70,601 | |
L’Oreal SA | | | 908 | | | | 149,070 | |
Lagardere SCA | | | 2,506 | | | | 88,462 | |
LVMH Moet Hennessy Louis Vuitton SA | | | 4,011 | | | | 713,532 | |
Natixis | | | 10,890 | | | | 63,882 | |
Orange SA | | | 3,618 | | | | 44,788 | |
Pernod-Ricard SA | | | 4,073 | | | | 437,403 | |
Renault SA | | | 4,210 | | | | 365,719 | |
Safran SA | | | 3,384 | | | | 240,488 | |
Sanofi | | | 2,939 | | | | 287,319 | |
SES SA | | | 2,302 | | | | 73,926 | |
Societe BIC SA | | | 1,160 | | | | 133,487 | |
Societe Generale | | | 691 | | | | 39,041 | |
Sodexo | | | 1,047 | | | | 103,112 | |
Suez Environnement Co. SA | | | 3,868 | | | | 69,279 | |
Thales SA | | | 1,044 | | | | 67,938 | |
Total SA | | | 3,048 | | | | 173,893 | |
Unibail-Rodamco SE | | | 310 | | | | 74,608 | |
Vallourec SA | | | 656 | | | | 32,751 | |
Veolia Environnement | | | 4,212 | | | | 66,038 | |
| | |
| | | | | | $ | 5,367,892 | |
| | |
| | | | | | | | |
| Security | | Shares | | | Value | |
| | | | | | | | |
|
Germany — 7.1% | |
Adidas AG | | | 1,780 | | | $ | 198,455 | |
BASF SE | | | 1,083 | | | | 115,785 | |
Bayerische Motoren Werke AG | | | 1,871 | | | | 203,103 | |
Bayerische Motoren Werke AG, PFC Shares | | | 2,475 | | | | 198,349 | |
Beiersdorf AG | | | 999 | | | | 98,740 | |
Brenntag AG | | | 189 | | | | 32,578 | |
Celesio AG | | | 1,421 | | | | 46,810 | |
Commerzbank AG(1) | | | 6,065 | | | | 102,668 | |
Continental AG | | | 533 | | | | 114,390 | |
Daimler AG | | | 2,048 | | | | 171,061 | |
Deutsche Boerse AG | | | 923 | | | | 70,879 | |
Deutsche Lufthansa AG(1) | | | 4,066 | | | | 96,584 | |
Deutsche Post AG | | | 7,780 | | | | 268,704 | |
Deutsche Telekom AG | | | 9,603 | | | | 155,272 | |
E.ON AG | | | 2,053 | | | | 37,159 | |
Fraport AG | | | 442 | | | | 32,616 | |
Fresenius Medical Care AG & Co. KGaA | | | 425 | | | | 29,950 | |
Hannover Rueckversicherung AG | | | 1,121 | | | | 88,929 | |
HeidelbergCement AG | | | 421 | | | | 31,246 | |
Henkel AG & Co. KGaA | | | 1,716 | | | | 166,764 | |
Henkel AG & Co. KGaA, PFC Shares | | | 2,776 | | | | 300,492 | |
Hochtief AG | | | 442 | | | | 35,184 | |
Kabel Deutschland Holding AG | | | 236 | | | | 31,021 | |
Linde AG | | | 5,022 | | | | 948,995 | |
Muenchener Rueckversicherungs-Gesellschaft AG | | | 396 | | | | 81,608 | |
Osram Licht AG(1) | | | 4,976 | | | | 290,820 | |
Porsche Automobil Holding SE, PFC Shares | | | 424 | | | | 41,366 | |
ProSiebenSat.1 Media AG | | | 670 | | | | 30,014 | |
RWE AG | | | 1,057 | | | | 39,002 | |
RWE AG, PFC Shares | | | 1,130 | | | | 35,022 | |
Salzgitter AG | | | 938 | | | | 41,378 | |
SAP AG | | | 13,283 | | | | 1,016,277 | |
Siemens AG | | | 864 | | | | 109,308 | |
ThyssenKrupp AG(1) | | | 3,044 | | | | 78,169 | |
United Internet AG | | | 7,614 | | | | 332,551 | |
Volkswagen AG | | | 452 | | | | 109,454 | |
Volkswagen AG, PFC Shares | | | 326 | | | | 82,272 | |
| | |
| | | | | | $ | 5,862,975 | |
| | |
|
Hong Kong — 5.0% | |
ASM Pacific Technology, Ltd. | | | 3,500 | | | $ | 32,776 | |
Bank of East Asia, Ltd. | | | 46,600 | | | | 177,066 | |
BOC Hong Kong (Holdings), Ltd. | | | 93,000 | | | | 283,249 | |
Cathay Pacific Airways, Ltd. | | | 85,000 | | | | 176,833 | |
Cheung Kong Infrastructure Holdings, Ltd. | | | 33,000 | | | | 193,828 | |
| | | | |
| | 8 | | See Notes to Financial Statements. |
Parametric International Equity Fund
January 31, 2014
Portfolio of Investments — continued
| | | | | | | | |
| Security | | Shares | | | Value | |
| | | | | | | | |
|
Hong Kong (continued) | |
CLP Holdings, Ltd. | | | 27,500 | | | $ | 208,009 | |
Galaxy Entertainment Group, Ltd.(1) | | | 77,000 | | | | 752,643 | |
Hang Seng Bank, Ltd. | | | 39,700 | | | | 626,303 | |
HKT Trust and HKT, Ltd. | | | 40,000 | | | | 38,238 | |
Hong Kong & China Gas Co., Ltd. | | | 198,759 | | | | 409,181 | |
Hopewell Holdings, Ltd. | | | 41,000 | | | | 141,531 | |
Li & Fung, Ltd. | | | 58,000 | | | | 80,595 | |
Link REIT (The) | | | 19,000 | | | | 86,035 | |
MGM China Holdings, Ltd. | | | 8,400 | | | | 32,870 | |
MTR Corp., Ltd. | | | 57,500 | | | | 203,361 | |
Orient Overseas (International), Ltd. | | | 7,000 | | | | 29,156 | |
Power Assets Holdings, Ltd. | | | 55,000 | | | | 412,420 | |
Sands China, Ltd. | | | 5,600 | | | | 43,076 | |
SJM Holdings, Ltd. | | | 10,000 | | | | 30,932 | |
Wheelock & Co., Ltd. | | | 3,000 | | | | 12,167 | |
Wing Hang Bank, Ltd. | | | 8,000 | | | | 114,654 | |
Wynn Macau, Ltd. | | | 10,000 | | | | 42,408 | |
| | |
| | | | | | $ | 4,127,331 | |
| | |
|
Ireland — 1.2% | |
CRH PLC | | | 12,110 | | | $ | 311,401 | |
Kerry Group PLC, Class A | | | 10,275 | | | | 691,102 | |
| | |
| | | | | | $ | 1,002,503 | |
| | |
|
Israel — 2.3% | |
Bank Hapoalim B.M. | | | 46,398 | | | $ | 240,932 | |
Bank Leumi Le-Israel B.M.(1) | | | 54,769 | | | | 208,047 | |
Bezeq Israeli Telecommunication Corp., Ltd. | | | 104,496 | | | | 159,244 | |
Delek Group, Ltd. | | | 333 | | | | 118,809 | |
Israel Chemicals, Ltd. | | | 9,291 | | | | 75,951 | |
Israel Corp., Ltd.(1) | | | 231 | | | | 116,128 | |
Mizrahi Tefahot Bank, Ltd. | | | 10,951 | | | | 133,371 | |
NICE Systems, Ltd. | | | 4,354 | | | | 170,745 | |
Teva Pharmaceutical Industries, Ltd. ADR | | | 14,642 | | | | 653,472 | |
| | |
| | | | | | $ | 1,876,699 | |
| | |
|
Italy — 4.3% | |
Atlantia SpA | | | 9,772 | | | $ | 222,268 | |
Autogrill SpA(1) | | | 4,891 | | | | 44,781 | |
Enel Green Power SpA | | | 113,750 | | | | 286,689 | |
Enel SpA | | | 14,019 | | | | 63,804 | |
ENI SpA | | | 39,987 | | | | 908,050 | |
Fiat SpA(1) | | | 4,092 | | | | 40,700 | |
Finmeccanica SpA(1) | | | 12,888 | | | | 112,933 | |
| | | | | | | | |
| Security | | Shares | | | Value | |
| | | | | | | | |
|
Italy (continued) | |
Intesa Sanpaolo SpA | | | 23,953 | | | $ | 64,557 | |
Luxottica Group SpA | | | 8,491 | | | | 449,958 | |
Pirelli & C. SpA | | | 7,791 | | | | 125,302 | |
Snam Rete Gas SpA | | | 82,053 | | | | 449,811 | |
Telecom Italia SpA | | | 49,299 | | | | 54,747 | |
Telecom Italia SpA, PFC Shares | | | 273,010 | | | | 229,965 | |
Tenaris SA | | | 3,967 | | | | 88,496 | |
Terna Rete Elettrica Nazionale SpA | | | 73,433 | | | | 356,025 | |
UniCredit SpA | | | 6,521 | | | | 48,810 | |
| | |
| | | | | | $ | 3,546,896 | |
| | |
|
Japan — 12.4% | |
ABC-Mart, Inc. | | | 1,100 | | | $ | 47,562 | |
Air Water, Inc. | | | 5,000 | | | | 73,684 | |
Aisin Seiki Co., Ltd. | | | 1,100 | | | | 40,503 | |
Alfresa Holdings Corp. | | | 600 | | | | 34,091 | |
All Nippon Airways Co., Ltd. | | | 17,000 | | | | 36,029 | |
Amada Co., Ltd. | | | 6,000 | | | | 48,545 | |
Asahi Kasei Corp. | | | 5,000 | | | | 37,835 | |
Bank of Kyoto, Ltd. (The) | | | 13,000 | | | | 103,552 | |
Bank of Yokohama, Ltd. (The) | | | 19,000 | | | | 95,507 | |
Bridgestone Corp. | | | 900 | | | | 32,312 | |
Brother Industries, Ltd. | | | 3,400 | | | | 42,751 | |
Calbee, Inc. | | | 1,500 | | | | 34,609 | |
Canon, Inc. | | | 1,800 | | | | 52,580 | |
Chiba Bank, Ltd. (The) | | | 10,000 | | | | 63,281 | |
Chugai Pharmaceutical Co., Ltd. | | | 5,700 | | | | 129,303 | |
Chugoku Bank, Ltd. (The) | | | 8,000 | | | | 98,475 | |
Citizen Holdings Co., Ltd. | | | 5,500 | | | | 42,831 | |
Coca-Cola West Co., Ltd. | | | 1,900 | | | | 37,232 | |
Dai Nippon Printing Co., Ltd. | | | 6,000 | | | | 59,226 | |
Daicel Chemical Industries, Ltd. | | | 4,000 | | | | 32,075 | |
Daihatsu Motor Co., Ltd. | | | 13,000 | | | | 202,748 | |
Denso Corp. | | | 1,000 | | | | 51,429 | |
Electric Power Development Co., Ltd. | | | 1,800 | | | | 53,328 | |
Fuji Electric Co., Ltd. | | | 9,000 | | | | 38,990 | |
Fuji Heavy Industries, Ltd. | | | 3,000 | | | | 81,785 | |
FUJIFILM Holdings Corp. | | | 2,300 | | | | 67,026 | |
Gunma Bank, Ltd. (The) | | | 25,000 | | | | 132,299 | |
Hachijuni Bank, Ltd. (The) | | | 19,000 | | | | 104,916 | |
Hamamatsu Photonics K.K. | | | 1,600 | | | | 67,123 | |
Hino Motors, Ltd. | | | 3,000 | | | | 43,656 | |
Hirose Electric Co., Ltd. | | | 200 | | | | 28,008 | |
Hiroshima Bank, Ltd. (The) | | | 20,000 | | | | 80,770 | |
Hitachi Chemical Co., Ltd. | | | 2,600 | | | | 37,281 | |
| | | | |
| | 9 | | See Notes to Financial Statements. |
Parametric International Equity Fund
January 31, 2014
Portfolio of Investments — continued
| | | | | | | | |
| Security | | Shares | | | Value | |
| | | | | | | | |
|
Japan (continued) | |
Hitachi Construction Machinery Co., Ltd. | | | 1,800 | | | $ | 34,385 | |
Hitachi, Ltd. | | | 8,000 | | | | 60,987 | |
Hokuhoku Financial Group, Inc. | | | 19,000 | | | | 36,000 | |
Hoya Corp. | | | 1,600 | | | | 44,214 | |
Ibiden Co., Ltd. | | | 2,400 | | | | 43,988 | |
IHI Corp. | | | 10,000 | | | | 45,346 | |
Isetan Mitsukoshi Holdings, Ltd. | | | 1,100 | | | | 13,915 | |
Isuzu Motors, Ltd. | | | 7,000 | | | | 41,438 | |
ITOCHU Techno-Solutions Corp. | | | 1,200 | | | | 49,411 | |
Iyo Bank, Ltd. (The) | | | 10,000 | | | | 93,482 | |
Japan Airlines Co., Ltd. | | | 3,900 | | | | 195,209 | |
Japan Tobacco, Inc. | | | 2,900 | | | | 89,521 | |
JFE Holdings, Inc. | | | 1,500 | | | | 31,084 | |
Joyo Bank, Ltd. (The) | | | 9,000 | | | | 42,601 | |
JSR Corp. | | | 2,400 | | | | 42,736 | |
JTEKT Corp. | | | 2,900 | | | | 42,697 | |
JX Holdings, Inc. | | | 5,800 | | | | 27,960 | |
Kamigumi Co., Ltd. | | | 10,000 | | | | 89,566 | |
Kaneka Corp. | | | 6,000 | | | | 37,107 | |
Kansai Paint Co., Ltd. | | | 10,000 | | | | 135,075 | |
Kao Corp. | | | 4,500 | | | | 142,658 | |
Kawasaki Heavy Industries, Ltd. | | | 11,000 | | | | 47,572 | |
KDDI Corp. | | | 2,500 | | | | 137,655 | |
Keikyu Corp. | | | 5,000 | | | | 39,467 | |
Keio Corp. | | | 11,000 | | | | 70,493 | |
Keyence Corp. | | | 300 | | | | 123,184 | |
Kikkoman Corp. | | | 2,000 | | | | 35,514 | |
Kinden Corp. | | | 3,000 | | | | 29,257 | |
Kintetsu Corp. | | | 12,000 | | | | 41,259 | |
Kirin Holdings Co., Ltd. | | | 3,000 | | | | 40,799 | |
Koito Manufacturing Co., Ltd. | | | 1,000 | | | | 20,347 | |
Komatsu, Ltd. | | | 2,400 | | | | 50,661 | |
Konami Corp. | | | 1,600 | | | | 38,028 | |
Kubota Corp. | | | 3,000 | | | | 46,174 | |
Kuraray Co., Ltd. | | | 3,500 | | | | 39,238 | |
Kyowa Hakko Kirin Co., Ltd. | | | 7,000 | | | | 70,920 | |
Lawson, Inc. | | | 600 | | | | 43,650 | |
M3, Inc. | | | 11 | | | | 32,257 | |
Makita Corp. | | | 1,000 | | | | 52,028 | |
Marui Group Co., Ltd. | | | 3,000 | | | | 28,103 | |
Mazda Motor Corp.(1) | | | 9,000 | | | | 43,165 | |
Medipal Holdings Corp. | | | 3,200 | | | | 46,728 | |
MEIJI Holdings Co., Ltd. | | | 600 | | | | 37,443 | |
Miraca Holdings, Inc. | | | 800 | | | | 37,805 | |
Mitsubishi Electric Corp. | | | 9,000 | | | | 101,657 | |
Mitsubishi Gas Chemical Co., Inc. | | | 5,000 | | | | 35,117 | |
| | | | | | | | |
| Security | | Shares | | | Value | |
| | | | | | | | |
|
Japan (continued) | |
Mitsubishi Logistics Corp. | | | 2,000 | | | $ | 27,949 | |
Mitsubishi Materials Corp. | | | 18,000 | | | | 60,427 | |
Mitsubishi Tanabe Pharma Corp. | | | 3,600 | | | | 52,858 | |
Mitsubishi UFJ Financial Group, Inc. | | | 6,100 | | | | 36,672 | |
Mitsui Chemicals, Inc. | | | 14,000 | | | | 33,420 | |
Mitsui O.S.K. Lines, Ltd. | | | 14,000 | | | | 57,386 | |
MS&AD Insurance Group Holdings, Inc. | | | 1,600 | | | | 37,071 | |
Murata Manufacturing Co., Ltd. | | | 800 | | | | 74,283 | |
NGK Spark Plug Co., Ltd. | | | 8,000 | | | | 184,556 | |
NHK Spring Co., Ltd. | | | 3,800 | | | | 38,843 | |
Nintendo Co., Ltd. | | | 400 | | | | 45,878 | |
Nippon Electric Glass Co., Ltd. | | | 8,000 | | | | 36,025 | |
Nippon Express Co., Ltd. | | | 6,000 | | | | 28,183 | |
Nippon Meat Packers, Inc. | | | 2,000 | | | | 34,057 | |
Nippon Telegraph & Telephone Corp. | | | 2,200 | | | | 117,749 | |
Nippon Yusen KK | | | 10,000 | | | | 30,946 | |
Nishi-Nippon City Bank, Ltd. (The) | | | 30,000 | | | | 75,632 | |
Nisshin Seifun Group, Inc. | | | 3,500 | | | | 34,786 | |
Nissin Foods Holdings Co., Ltd. | | | 800 | | | | 34,631 | |
Nitori Holdings Co., Ltd. | | | 700 | | | | 67,982 | |
Nitto Denko Corp. | | | 1,300 | | | | 57,803 | |
NOK Corp. | | | 2,600 | | | | 41,887 | |
Nomura Research Institute, Ltd. | | | 900 | | | | 29,579 | |
NSK, Ltd. | | | 6,000 | | | | 67,275 | |
NTT DoCoMo, Inc. | | | 18,900 | | | | 302,604 | |
Odakyu Electric Railway Co., Ltd. | | | 7,000 | | | | 61,397 | |
OMRON Corp. | | | 2,100 | | | | 83,029 | |
Ono Pharmaceutical Co., Ltd. | | | 2,100 | | | | 182,506 | |
Oracle Corp. Japan | | | 800 | | | | 31,771 | |
Osaka Gas Co., Ltd. | | | 22,000 | | | | 88,850 | |
Panasonic Corp. | | | 6,500 | | | | 73,669 | |
Rakuten, Inc. | | | 4,000 | | | | 65,451 | |
Ricoh Co., Ltd. | | | 4,000 | | | | 42,033 | |
Rinnai Corp. | | | 900 | | | | 70,025 | |
ROHM Co., Ltd. | | | 1,000 | | | | 49,835 | |
Sankyo Co., Ltd. | | | 1,500 | | | | 70,954 | |
Santen Pharmaceutical Co., Ltd. | | | 1,100 | | | | 46,078 | |
Seven Bank, Ltd. | | | 14,800 | | | | 56,411 | |
Shikoku Electric Power Co., Inc.(1) | | | 2,300 | | | | 33,191 | |
Shimamura Co., Ltd. | | | 400 | | | | 35,331 | |
Shin-Etsu Chemical Co., Ltd. | | | 1,100 | | | | 60,902 | |
Shinsei Bank, Ltd. | | | 17,000 | | | | 34,366 | |
Shionogi & Co., Ltd. | | | 1,800 | | | | 36,671 | |
Shiseido Co., Ltd. | | | 1,500 | | | | 23,716 | |
Shizuoka Bank, Ltd. (The) | | | 16,000 | | | | 158,913 | |
Showa Shell Sekiyu K.K. | | | 3,600 | | | | 34,259 | |
| | | | |
| | 10 | | See Notes to Financial Statements. |
Parametric International Equity Fund
January 31, 2014
Portfolio of Investments — continued
| | | | | | | | |
| Security | | Shares | | | Value | |
| | | | | | | | |
|
Japan (continued) | |
SMC Corp. | | | 200 | | | $ | 50,091 | |
SoftBank Corp. | | | 2,300 | | | | 166,513 | |
Sony Corp. | | | 2,000 | | | | 31,334 | |
Stanley Electric Co., Ltd. | | | 2,000 | | | | 45,183 | |
Sumco Corp.(1) | | | 4,800 | | | | 36,722 | |
Sumitomo Chemical Co., Ltd. | | | 10,000 | | | | 40,512 | |
Sumitomo Electric Industries, Ltd. | | | 2,600 | | | | 40,836 | |
Sumitomo Metal Mining Co., Ltd. | | | 4,000 | | | | 51,755 | |
Sumitomo Mitsui Financial Group, Inc. | | | 800 | | | | 37,061 | |
Sumitomo Mitsui Trust Holding, Inc. | | | 8,000 | | | | 37,953 | |
Suntory Beverage & Food, Ltd. | | | 1,200 | | | | 39,166 | |
Suruga Bank, Ltd. | | | 8,000 | | | | 135,105 | |
Suzuken Co., Ltd. | | | 2,700 | | | | 93,320 | |
Suzuki Motor Corp. | | | 1,600 | | | | 41,475 | |
Sysmex Corp. | | | 1,100 | | | | 60,544 | |
Taisho Pharmaceutical Holdings Co., Ltd. | | | 500 | | | | 36,096 | |
Taiyo Nippon Sanso Corp. | | | 6,000 | | | | 41,513 | |
Takashimaya Co., Ltd. | | | 3,000 | | | | 27,814 | |
Takeda Pharmaceutical Co., Ltd. | | | 600 | | | | 27,887 | |
Terumo Corp. | | | 800 | | | | 37,150 | |
THK Co., Ltd. | | | 1,800 | | | | 39,018 | |
Toho Gas Co., Ltd. | | | 21,000 | | | | 96,996 | |
Tohoku Electric Power Co., Inc.(1) | | | 3,000 | | | | 32,356 | |
Tokyo Electric Power Co., Inc.(1) | | | 14,600 | | | | 66,260 | |
Tokyo Electron, Ltd. | | | 1,300 | | | | 67,777 | |
Tokyo Gas Co., Ltd. | | | 18,000 | | | | 89,268 | |
TonenGeneral Sekiyu K.K. | | | 17,000 | | | | 148,152 | |
TOTO, Ltd. | | | 3,000 | | | | 47,451 | |
Toyo Seikan Kaisha, Ltd. | | | 2,200 | | | | 39,023 | |
Toyo Suisan Kaisha, Ltd. | | | 1,000 | | | | 31,512 | |
Toyoda Gosei Co., Ltd. | | | 1,600 | | | | 33,649 | |
Toyota Boshoku Corp. | | | 2,900 | | | | 33,025 | |
Toyota Industries Corp. | | | 700 | | | | 31,984 | |
Toyota Motor Corp. | | | 1,900 | | | | 108,717 | |
Trend Micro, Inc. | | | 1,000 | | | | 30,732 | |
Tsumura & Co. | | | 1,300 | | | | 32,058 | |
Unicharm Corp. | | | 3,300 | | | | 179,287 | |
USS Co., Ltd. | | | 6,800 | | | | 92,899 | |
Yakult Honsha Co., Ltd. | | | 900 | | | | 43,925 | |
Yamaguchi Financial Group, Inc. | | | 3,000 | | | | 27,332 | |
Yamaha Corp. | | | 2,700 | | | | 39,584 | |
Yamaha Motor Co., Ltd. | | | 3,600 | | | | 47,552 | |
Yamato Holdings Co., Ltd. | | | 1,600 | | | | 33,497 | |
Yaskawa Electric Corp. | | | 5,000 | | | | 67,979 | |
| | | | | | | | |
| Security | | Shares | | | Value | |
| | | | | | | | |
|
Japan (continued) | |
Yokogawa Electric Corp. | | | 3,000 | | | $ | 46,467 | |
Yokohama Rubber Co., Ltd. (The) | | | 3,000 | | | | 26,715 | |
| | |
| | | | | | $ | 10,318,328 | |
| | |
|
Netherlands — 4.8% | |
Aegon NV | | | 4,924 | | | $ | 42,920 | |
Akzo Nobel NV | | | 6,766 | | | | 486,624 | |
ASML Holding NV | | | 10,315 | | | | 872,879 | |
Delta Lloyd NV | | | 1,897 | | | | 48,735 | |
European Aeronautic Defence and Space Co. NV | | | 2,606 | | | | 184,623 | |
Gemalto NV | | | 328 | | | | 36,968 | |
Heineken Holding NV | | | 2,563 | | | | 147,604 | |
Heineken NV | | | 5,793 | | | | 352,943 | |
ING Groep NV(1) | | | 3,145 | | | | 41,536 | |
Koninklijke Ahold NV | | | 33,456 | | | | 556,884 | |
Koninklijke DSM NV | | | 7,818 | | | | 517,511 | |
Koninklijke KPN NV(1) | | | 15,138 | | | | 56,642 | |
Koninklijke Vopak NV | | | 675 | | | | 37,098 | |
QIAGEN NV(1) | | | 9,419 | | | | 206,592 | |
Randstad Holding NV | | | 688 | | | | 43,631 | |
Reed Elsevier NV | | | 7,995 | | | | 164,886 | |
STMicroelectronics NV | | | 6,835 | | | | 56,102 | |
Unilever NV | | | 4,185 | | | | 156,150 | |
| | |
| | | | | | $ | 4,010,328 | |
| | |
|
New Zealand — 0.4% | |
Auckland International Airport, Ltd. | | | 54,928 | | | $ | 161,900 | |
Contact Energy, Ltd. | | | 15,940 | | | | 66,419 | |
Fletcher Building, Ltd. | | | 9,121 | | | | 66,813 | |
Telecom Corporation of New Zealand, Ltd. | | | 39,697 | | | | 75,283 | |
| | |
| | | | | | $ | 370,415 | |
| | |
|
Norway — 2.7% | |
Aker Solutions ASA | | | 13,749 | | | $ | 211,169 | |
Gjensidige Forsikring ASA | | | 3,679 | | | | 70,712 | |
Norsk Hydro ASA | | | 33,096 | | | | 150,568 | |
Orkla ASA | | | 13,775 | | | | 107,232 | |
Seadrill, Ltd. | | | 5,973 | | | | 214,576 | |
Statoil ASA | | | 29,036 | | | | 688,172 | |
Subsea 7 SA | �� | | 8,297 | | | | 142,990 | |
Telenor ASA | | | 30,887 | | | | 642,565 | |
Yara International ASA | | | 1,293 | | | | 53,398 | |
| | |
| | | | | | $ | 2,281,382 | |
| | |
| | | | |
| | 11 | | See Notes to Financial Statements. |
Parametric International Equity Fund
January 31, 2014
Portfolio of Investments — continued
| | | | | | | | |
| Security | | Shares | | | Value | |
| | | | | | | | |
|
Portugal — 0.6% | |
Banco Espirito Santo SA(1) | | | 27,615 | | | $ | 41,889 | |
EDP-Energias de Portugal SA | | | 65,790 | | | | 246,990 | |
Galp Energia SGPS SA, Class B | | | 2,207 | | | | 34,121 | |
Jeronimo Martins SGPS SA | | | 8,979 | | | | 153,514 | |
Portugal Telecom SGPS SA | | | 13,859 | | | | 60,917 | |
| | |
| | | | | | $ | 537,431 | |
| | |
|
Singapore — 3.8% | |
Ascendas Real Estate Investment Trust | | | 50,000 | | | $ | 83,066 | |
ComfortDelGro Corp., Ltd. | | | 28,000 | | | | 42,316 | |
DBS Group Holdings, Ltd. | | | 71,000 | | | | 916,927 | |
Jardine Cycle & Carriage, Ltd. | | | 1,000 | | | | 27,310 | |
Noble Group, Ltd. | | | 49,000 | | | | 36,358 | |
Olam International, Ltd. | | | 34,000 | | | | 39,348 | |
Oversea-Chinese Banking Corp., Ltd. | | | 68,000 | | | | 494,078 | |
Singapore Airlines, Ltd. | | | 33,000 | | | | 247,669 | |
Singapore Press Holdings, Ltd. | | | 28,000 | | | | 87,608 | |
Singapore Technologies Engineering, Ltd. | | | 20,000 | | | | 59,236 | |
Singapore Telecommunications, Ltd. | | | 159,000 | | | | 438,652 | |
StarHub, Ltd. | | | 38,000 | | | | 127,002 | |
United Overseas Bank, Ltd. | | | 24,000 | | | | 375,283 | |
UOL Group, Ltd. | | | 28,000 | | | | 128,236 | |
Yangzijiang Shipbuilding Holdings, Ltd. | | | 42,000 | | | | 37,804 | |
| | |
| | | | | | $ | 3,140,893 | |
| | |
|
Spain — 4.6% | |
Abertis Infraestructuras SA | | | 9,492 | | | $ | 211,815 | |
Acciona SA | | | 642 | | | | 42,540 | |
Acerinox SA | | | 4,463 | | | | 57,950 | |
ACS Actividades de Construccion y Servicios SA | | | 1,486 | | | | 52,156 | |
Amadeus IT Holding SA, Class A | | | 8,837 | | | | 349,574 | |
CaixaBank SA | | | 32,417 | | | | 198,675 | |
Distribuidora Internacional de Alimentacion SA | | | 8,077 | | | | 66,371 | |
Enagas | | | 11,136 | | | | 304,413 | |
Ferrovial SA | | | 22,539 | | | | 432,474 | |
Gas Natural SDG SA | | | 1,333 | | | | 32,943 | |
Grifols SA | | | 6,037 | | | | 312,634 | |
Iberdrola SA | | | 12,720 | | | | 78,325 | |
Indra Sistemas SA | | | 4,892 | | | | 86,611 | |
Industria de Diseno Textil SA | | | 3,249 | | | | 483,887 | |
International Consolidated Airlines Group SA(1) | | | 19,811 | | | | 135,536 | |
Red Electrica Corp. SA | | | 3,841 | | | | 268,627 | |
Repsol SA | | | 9,283 | | | | 216,961 | |
| | | | | | | | |
| Security | | Shares | | | Value | |
| | | | | | | | |
|
Spain (continued) | |
Telefonica SA | | | 27,969 | | | $ | 430,761 | |
Zardoya Otis SA | | | 4,388 | | | | 73,631 | |
| | |
| | | | | | $ | 3,835,884 | |
| | |
|
Sweden — 5.2% | |
Atlas Copco AB, Class A | | | 2,400 | | | $ | 65,029 | |
Elekta AB, Class B | | | 4,013 | | | | 58,420 | |
Getinge AB, Class B | | | 2,651 | | | | 91,017 | |
Hennes & Mauritz AB, Class B | | | 12,686 | | | | 545,491 | |
Holmen AB, Class B | | | 4,514 | | | | 155,821 | |
Investor AB, Class B | | | 10,286 | | | | 332,550 | |
Millicom International Cellular SA SDR | | | 2,265 | | | | 220,140 | |
Nordea Bank AB | | | 47,852 | | | | 638,537 | |
Scania AB, Class B | | | 4,361 | | | | 89,101 | |
Skandinaviska Enskilda Banken AB, Class A | | | 28,839 | | | | 371,581 | |
Skanska AB, Class B | | | 11,843 | | | | 233,170 | |
SKF AB, Class B | | | 3,937 | | | | 104,191 | |
Svenska Cellulosa AB, Class B | | | 3,039 | | | | 86,415 | |
Swedbank AB, Class A | | | 13,576 | | | | 354,261 | |
Tele2 AB, Class B | | | 13,458 | | | | 147,999 | |
Telefonaktiebolaget LM Ericsson, Class B | | | 7,673 | | | | 93,955 | |
TeliaSonera AB | | | 95,461 | | | | 706,989 | |
| | |
| | | | | | $ | 4,294,667 | |
| | |
|
Switzerland — 7.3% | |
Actelion, Ltd.(1) | | | 3,987 | | | $ | 374,335 | |
Adecco SA(1) | | | 3,537 | | | | 277,819 | |
ARYZTA AG(1) | | | 429 | | | | 33,711 | |
Baloise Holding AG | | | 832 | | | | 99,385 | |
Compagnie Financiere Richemont SA, Class A | | | 309 | | | | 28,584 | |
Credit Suisse Group AG(1) | | | 2,246 | | | | 67,674 | |
Geberit AG | | | 169 | | | | 48,990 | |
Givaudan SA(1) | | | 98 | | | | 144,914 | |
Holcim, Ltd.(1) | | | 540 | | | | 39,195 | |
Lonza Group AG(1) | | | 1,077 | | | | 108,030 | |
Nestle SA | | | 15,089 | | | | 1,093,519 | |
Novartis AG | | | 9,763 | | | | 771,676 | |
Roche Holding AG PC | | | 2,684 | | | | 736,397 | |
Schindler Holding AG | | | 1,737 | | | | 255,004 | |
Schindler Holding AG PC | | | 317 | | | | 45,906 | |
Sonova Holding AG(1) | | | 1,970 | | | | 270,558 | |
Sulzer AG | | | 701 | | | | 105,553 | |
Swatch Group, Ltd. (The) | | | 274 | | | | 28,058 | |
Swatch Group, Ltd. (The), Bearer Shares | | | 416 | | | | 247,239 | |
| | | | |
| | 12 | | See Notes to Financial Statements. |
Parametric International Equity Fund
January 31, 2014
Portfolio of Investments — continued
| | | | | | | | |
| Security | | Shares | | | Value | |
| | | | | | | | |
|
Switzerland (continued) | |
Swiss Life Holding AG(1) | | | 339 | | | $ | 72,963 | |
Swiss Reinsurance Co., Ltd.(1) | | | 5,794 | | | | 500,028 | |
Swisscom AG | | | 701 | | | | 385,073 | |
Transocean, Ltd. | | | 1,616 | | | | 69,940 | |
Zurich Insurance Group AG(1) | | | 840 | | | | 243,550 | |
| | |
| | | | | | $ | 6,048,101 | |
| | |
|
United Kingdom — 13.0% | |
Aberdeen Asset Management PLC | | | 13,109 | | | $ | 84,081 | |
Anglo American PLC | | | 4,458 | | | | 105,115 | |
Associated British Foods PLC | | | 5,991 | | | | 266,986 | |
AstraZeneca PLC | | | 3,694 | | | | 234,252 | |
Aviva PLC | | | 56,526 | | | | 413,512 | |
BAE Systems PLC | | | 27,684 | | | | 195,307 | |
Barclays PLC | | | 93,387 | | | | 416,903 | |
BHP Billiton PLC | | | 6,299 | | | | 185,434 | |
BP PLC | | | 76,013 | | | | 595,718 | |
Bunzl PLC | | | 1,959 | | | | 44,626 | |
Burberry Group PLC | | | 13,566 | | | | 322,100 | |
Capita PLC | | | 9,287 | | | | 149,850 | |
Centrica PLC | | | 94,038 | | | | 480,257 | |
Cobham PLC | | | 34,677 | | | | 167,314 | |
Coca-Cola HBC AG(1) | | | 4,385 | | | | 116,146 | |
Compass Group PLC | | | 6,746 | | | | 100,821 | |
Croda International PLC | | | 772 | | | | 30,538 | |
Diageo PLC | | | 20,063 | | | | 594,992 | |
easyJet PLC | | | 1,477 | | | | 39,893 | |
Experian PLC | | | 4,808 | | | | 82,070 | |
Fresnillo PLC | | | 4,981 | | | | 62,209 | |
GKN PLC | | | 5,106 | | | | 33,035 | |
GlaxoSmithKline PLC | | | 3,703 | | | | 95,182 | |
HSBC Holdings PLC | | | 35,940 | | | | 368,807 | |
Kingfisher PLC | | | 14,107 | | | | 85,534 | |
Lloyds Banking Group PLC(1) | | | 331,223 | | | | 451,702 | |
Marks & Spencer Group PLC | | | 12,269 | | | | 94,810 | |
Melrose Industries PLC | | | 32,037 | | | | 162,723 | |
National Grid PLC | | | 3,212 | | | | 41,578 | |
Next PLC | | | 1,150 | | | | 117,952 | |
Old Mutual PLC | | | 115,722 | | | | 327,481 | |
Prudential PLC | | | 4,829 | | | | 97,208 | |
Randgold Resources, Ltd. | | | 2,201 | | | | 151,294 | |
Reed Elsevier PLC | | | 5,162 | | | | 75,189 | |
Rexam PLC | | | 6,896 | | | | 55,798 | |
Rio Tinto PLC | | | 3,024 | | | | 160,842 | |
Rolls-Royce Holdings PLC(1) | | | 5,230 | | | | 101,864 | |
Royal Dutch Shell PLC, Class A | | | 20,049 | | | | 694,529 | |
| | | | | | | | |
| Security | | Shares | | | Value | |
| | | | | | | | |
|
United Kingdom (continued) | |
Royal Dutch Shell PLC, Class B | | | 2,721 | | | $ | 99,526 | |
Sage Group PLC (The) | | | 16,525 | | | | 110,814 | |
Schroders PLC | | | 2,441 | | | | 98,800 | |
Serco Group PLC | | | 19,790 | | | | 141,891 | |
Severn Trent PLC | | | 1,874 | | | | 53,082 | |
Shire PLC | | | 2,342 | | | | 116,881 | |
Smiths Group PLC | | | 6,110 | | | | 144,093 | |
SSE PLC | | | 3,277 | | | | 70,305 | |
Standard Chartered PLC | | | 16,337 | | | | 332,032 | |
Tesco PLC | | | 62,643 | | | | 329,186 | |
Travis Perkins PLC | | | 5,487 | | | | 156,562 | |
TUI Travel PLC | | | 5,010 | | | | 34,996 | |
Tullow Oil PLC | | | 16,807 | | | | 217,569 | |
Unilever PLC | | | 988 | | | | 37,919 | |
Vodafone Group PLC | | | 167,839 | | | | 621,964 | |
Whitbread PLC | | | 3,750 | | | | 230,908 | |
WM Morrison Supermarkets PLC | | | 14,366 | | | | 56,612 | |
Wolseley PLC | | | 2,892 | | | | 155,639 | |
| | |
| | | | | | $ | 10,812,431 | |
| | |
| |
Total Common Stocks
(identified cost $69,643,156) | | | $ | 82,439,134 | |
| | |
|
| Rights(1) — 0.0%(2) | |
| | |
| | | | | | | | |
| Security | | Shares | | | Value | |
ACS Actividades de Construccion y Servicios SA, Exp. 2/19/14 | | | 1,486 | | | $ | 846 | |
Raiffeisen Bank International AG, Exp. 2/7/14 | | | 6,543 | | | | 0 | |
| | |
| |
Total Rights
(identified cost $905) | | | $ | 846 | |
| | |
|
| Short-Term Investments — 1.1% | |
| | |
| | | | | | | | |
| Description | | Interest
(000’s omitted) | | | Value | |
Eaton Vance Cash Reserves Fund, LLC, 0.13%(3) | | $ | 890 | | | $ | 890,409 | |
| | |
| |
Total Short-Term Investments
(identified cost $890,409) | | | $ | 890,409 | |
| | |
| |
Total Investments — 100.5%
(identified cost $70,534,470) | | | $ | 83,330,389 | |
| | |
| |
Other Assets, Less Liabilities — (0.5)% | | | $ | (412,175 | ) |
| | |
| |
Net Assets — 100.0% | | | $ | 82,918,214 | |
| | |
| | | | |
| | 13 | | See Notes to Financial Statements. |
Parametric International Equity Fund
January 31, 2014
Portfolio of Investments — continued
The percentage shown for each investment category in the Portfolio of Investments is based on net assets.
| | | | |
| ADR | | – | | American Depositary Receipt |
| CDI | | – | | CHESS Depositary Interest |
| PC | | – | | Participation Certificate |
| PFC Shares | | – | | Preference Shares |
| SDR | | – | | Swedish Depositary Receipt |
| (1) | Non-income producing security. |
| (2) | Amount is less than 0.05%. |
| (3) | Affiliated investment company, available to Eaton Vance portfolios and funds, which invests in high quality, U.S. dollar denominated money market instruments. The rate shown is the annualized seven-day yield as of January 31, 2014. |
| | | | | | | | |
| Currency Concentration of Portfolio | |
| | |
| | | | | | | | |
| Currency | | Percentage
of Net Assets | | | Value | |
Euro | | | 37.0 | % | | $ | 30,691,038 | |
British Pound Sterling | | | 13.0 | | | | 10,812,431 | |
Japanese Yen | | | 12.4 | | | | 10,318,328 | |
Swiss Franc | | | 7.2 | | | | 5,978,161 | |
Australian Dollar | | | 5.7 | | | | 4,698,883 | |
Swedish Krona | | | 5.2 | | | | 4,294,667 | |
Hong Kong Dollar | | | 5.0 | | | | 4,127,331 | |
Danish Krone | | | 4.6 | | | | 3,779,812 | |
Singapore Dollar | | | 3.8 | | | | 3,140,893 | |
Norwegian Krone | | | 2.7 | | | | 2,281,382 | |
United States Dollar | | | 2.0 | | | | 1,613,821 | |
Israeli Shekel | | | 1.5 | | | | 1,223,227 | |
New Zealand Dollar | | | 0.4 | | | | 370,415 | |
| | |
Total Investments | | | 100.5 | % | | $ | 83,330,389 | |
| | |
| | | | | | | | |
| Sector Classification of Portfolio | |
| | |
| | | | | | | | |
| Sector | | Percentage
of Net Assets | | | Value | |
Financials | | | 17.3 | % | | $ | 14,367,129 | |
Industrials | | | 12.6 | | | | 10,468,203 | |
Consumer Discretionary | | | 11.4 | | | | 9,420,946 | |
Health Care | | | 10.7 | | | | 8,891,100 | |
Consumer Staples | | | 10.6 | | | | 8,759,821 | |
Materials | | | 9.3 | | | | 7,730,956 | |
Telecommunication Services | | | 7.8 | | | | 6,442,702 | |
Energy | | | 6.9 | | | | 5,767,326 | |
Utilities | | | 6.7 | | | | 5,541,233 | |
Information Technology | | | 6.1 | | | | 5,050,564 | |
Short-Term Investments | | | 1.1 | | | | 890,409 | |
| | |
Total Investments | | | 100.5 | % | | $ | 83,330,389 | |
| | |
| | | | |
| | 14 | | See Notes to Financial Statements. |
Parametric International Equity Fund
January 31, 2014
Statement of Assets and Liabilities
| | | | |
| Assets | | January 31, 2014 | |
Unaffiliated investments, at value (identified cost, $69,644,061) | | $ | 82,439,980 | |
Affiliated investment, at value (identified cost, $890,409) | | | 890,409 | |
Cash | | | 13,235 | |
Foreign currency, at value (identified cost, $41,689) | | | 41,676 | |
Dividends receivable | | | 30,210 | |
Interest receivable from affiliated investment | | | 125 | |
Receivable for Fund shares sold | | | 538,637 | |
Tax reclaims receivable | | | 77,225 | |
Receivable from affiliates | | | 13,775 | |
Total assets | | $ | 84,045,272 | |
|
| Liabilities | |
Payable for investments purchased | | $ | 703,836 | |
Payable for Fund shares redeemed | | | 301,960 | |
Payable to affiliates: | | | | |
Investment adviser and administration fee | | | 52,876 | |
Distribution and service fees | | | 2,957 | |
Accrued expenses | | | 65,429 | |
Total liabilities | | $ | 1,127,058 | |
Net Assets | | $ | 82,918,214 | |
|
| Sources of Net Assets | |
Paid-in capital | | $ | 74,749,604 | |
Accumulated net realized loss | | | (4,316,312 | ) |
Accumulated distributions in excess of net investment income | | | (312,287 | ) |
Net unrealized appreciation | | | 12,797,209 | |
Total | | $ | 82,918,214 | |
|
| Investor Class Shares | |
Net Assets | | $ | 14,007,134 | |
Shares Outstanding | | | 1,171,171 | |
Net Asset Value, Offering Price and Redemption Price Per Share | | | | |
(net assets ÷ shares of beneficial interest outstanding) | | $ | 11.96 | |
|
| Institutional Class Shares | |
Net Assets | | $ | 68,911,080 | |
Shares Outstanding | | | 5,745,566 | |
Net Asset Value, Offering Price and Redemption Price Per Share | | | | |
(net assets ÷ shares of beneficial interest outstanding) | | $ | 11.99 | |
| | | | |
| | 15 | | See Notes to Financial Statements. |
Parametric International Equity Fund
January 31, 2014
Statement of Operations
| | | | |
| Investment Income | | Year Ended
January 31, 2014 | |
Dividends (net of foreign taxes, $213,317) | | $ | 2,059,200 | |
Interest allocated from affiliated investment | | | 678 | |
Expenses allocated from affiliated investment | | | (85 | ) |
Total investment income | | $ | 2,059,793 | |
|
| Expenses | |
Investment adviser and administration fee | | $ | 522,970 | |
Distribution and service fees | | | | |
Investor Class | | | 25,459 | |
Class C | | | 563 | |
Trustees’ fees and expenses | | | 3,426 | |
Custodian fee | | | 111,517 | |
Transfer and dividend disbursing agent fees | | | 20,482 | |
Legal and accounting services | | | 42,212 | |
Printing and postage | | | 15,146 | |
Registration fees | | | 25,332 | |
Miscellaneous | | | 21,359 | |
Total expenses | | $ | 788,466 | |
Deduct — | | | | |
Allocation of expenses to affiliates | | $ | 205,897 | |
Total expense reductions | | $ | 205,897 | |
| |
Net expenses | | $ | 582,569 | |
| |
Net investment income | | $ | 1,477,224 | |
|
| Realized and Unrealized Gain (Loss) | |
Net realized gain (loss) — | | | | |
Investment transactions | | $ | 1,252,242 | |
Investment transactions allocated from affiliated investment | | | 10 | |
Foreign currency transactions | | | 5,724 | |
Net realized gain | | $ | 1,257,976 | |
Change in unrealized appreciation (depreciation) — | | | | |
Investments | | $ | 3,171,322 | |
Foreign currency | | | 549 | |
Net change in unrealized appreciation (depreciation) | | $ | 3,171,871 | |
| |
Net realized and unrealized gain | | $ | 4,429,847 | |
| |
Net increase in net assets from operations | | $ | 5,907,071 | |
| | | | |
| | 16 | | See Notes to Financial Statements. |
Parametric International Equity Fund
January 31, 2014
Statements of Changes in Net Assets
| | | | | | | | |
| Increase (Decrease) in Net Assets | | Year Ended
January 31, 2014 | | | Year Ended
January 31, 2013 | |
From operations — | | | | | | | | |
Net investment income | | $ | 1,477,224 | | | $ | 1,331,543 | |
Net realized gain (loss) from investment and foreign currency transactions | | | 1,257,976 | | | | (2,089,611 | ) |
Net change in unrealized appreciation (depreciation) from investments and foreign currency | | | 3,171,871 | | | | 9,402,447 | |
Net increase in net assets from operations | | $ | 5,907,071 | | | $ | 8,644,379 | |
Distributions to shareholders — | | | | | | | | |
From net investment income | | | | | | | | |
Investor Class | | $ | (264,173 | ) | | $ | (159,997 | ) |
Class C | | | — | | | | (8,524 | ) |
Institutional Class | | | (1,359,470 | ) | | | (1,417,505 | ) |
Total distributions to shareholders | | $ | (1,623,643 | ) | | $ | (1,586,026 | ) |
Transactions in shares of beneficial interest — | | | | | | | | |
Proceeds from sale of shares | | | | | | | | |
Investor Class | | $ | 11,052,878 | | | $ | 6,166,012 | |
Class C | | | 70,326 | | | | 242,466 | |
Institutional Class | | | 29,593,077 | | | | 15,252,640 | |
Net asset value of shares issued to shareholders in payment of distributions declared | | | | | | | | |
Investor Class | | | 159,632 | | | | 159,076 | |
Class C | | | — | | | | 8,293 | |
Institutional Class | | | 157,259 | | | | 433,419 | |
Cost of shares redeemed | | | | | | | | |
Investor Class | | | (5,346,423 | ) | | | (12,844,202 | ) |
Class C | | | (60 | ) | | | (104,225 | ) |
Institutional Class | | | (18,695,363 | ) | | | (13,202,800 | ) |
Net asset value of shares merged* | | | | | | | | |
Investor Class | | | 519,171 | | | | — | |
Class C | | | (519,171 | ) | | | — | |
Net increase (decrease) in net assets from Fund share transactions | | $ | 16,991,326 | | | $ | (3,889,321 | ) |
| | |
Net increase in net assets | | $ | 21,274,754 | | | $ | 3,169,032 | |
|
| Net Assets | |
At beginning of year | | $ | 61,643,460 | | | $ | 58,474,428 | |
At end of year | | $ | 82,918,214 | | | $ | 61,643,460 | |
|
Accumulated distributions in excess of net investment income
included in net assets | |
At end of year | | $ | (312,287 | ) | | $ | (302,193 | ) |
| * | At the close of business on March 15, 2013, Class C shares were merged into Investor Class shares. |
| | | | |
| | 17 | | See Notes to Financial Statements. |
Parametric International Equity Fund
January 31, 2014
Financial Highlights
| | | | | | | | | | | | | | | | |
| | | Investor Class | |
| | | Year Ended January 31, | | | Period Ended
January 31, 2011(1) | |
| | | 2014 | | | 2013 | | | 2012 | | |
Net asset value — Beginning of period | | $ | 11.180 | | | $ | 9.850 | | | $ | 10.960 | | | $ | 10.000 | |
| | | | |
| Income (Loss) From Operations | | | | | | | | | | | | | | | | |
Net investment income (loss)(2) | | $ | 0.195 | | | $ | 0.227 | | | $ | 0.172 | | | $ | (0.020 | ) |
Net realized and unrealized gain (loss) | | | 0.822 | | | | 1.370 | | | | (1.073 | ) | | | 1.058 | |
| | | | |
Total income (loss) from operations | | $ | 1.017 | | | $ | 1.597 | | | $ | (0.901 | ) | | $ | 1.038 | |
| | | | |
| Less Distributions | | | | | | | | | | | | | | | | |
From net investment income | | $ | (0.237 | ) | | $ | (0.267 | ) | | $ | (0.209 | ) | | $ | (0.078 | ) |
| | | | |
Total distributions | | $ | (0.237 | ) | | $ | (0.267 | ) | | $ | (0.209 | ) | | $ | (0.078 | ) |
| | | | |
Redemption fees(2)(3) | | $ | — | | | $ | — | | | $ | — | | | $ | 0.000 | (4) |
| | | | |
Net asset value — End of period | | $ | 11.960 | | | $ | 11.180 | | | $ | 9.850 | | | $ | 10.960 | |
| | | | |
Total Return(5) | | | 9.04 | % | | | 16.32 | % | | | (8.11 | )% | | | 10.39 | %(6) |
| | | | |
| Ratios/Supplemental Data | | | | | | | | | | | | | | | | |
Net assets, end of period (000’s omitted) | | $ | 14,007 | | | $ | 7,038 | | | $ | 12,263 | | | $ | 3,578 | |
Ratios (as a percentage of average daily net assets): | | | | | | | | | | | | | | | | |
Expenses(7)(8) | | | 1.05 | % | | | 1.29 | % | | | 1.50 | % | | | 1.50 | %(9) |
Net investment income (loss) | | | 1.65 | % | | | 2.22 | % | | | 1.68 | % | | | (0.22 | )%(9) |
Portfolio Turnover | | | 35 | % | | | 44 | % | | | 60 | % | | | 15 | %(6) |
| (1) | For the period from the start of business, April 1, 2010, to January 31, 2011. |
| (2) | Computed using average shares outstanding. |
| (3) | Redemption fees were discontinued as of January 1, 2011. |
| (4) | Amount is less than $0.0005. |
| (5) | Returns are historical and are calculated by determining the percentage change in net asset value with all distributions reinvested and do not reflect the effect of sales charges, if any. |
| (7) | Excludes the effect of custody fee credits, if any, of less than 0.005%. |
| (8) | The investment adviser, sub-adviser and administrator subsidized certain operating expenses (equal to 0.29%, 0.29%, 0.25% and 0.72% of average daily net assets for the years ended January 31, 2014, 2013 and 2012 and the period ended January 31, 2011, respectively). |
| | | | |
| | 18 | | See Notes to Financial Statements. |
Parametric International Equity Fund
January 31, 2014
Financial Highlights — continued
| | | | | | | | | | | | | | | | |
| | | Institutional Class | |
| | | Year Ended January 31, | | | Period Ended
January 31, 2011(1) | |
| | | 2014 | | | 2013 | | | 2012 | | |
Net asset value — Beginning of period | | $ | 11.200 | | | $ | 9.880 | | | $ | 10.970 | | | $ | 10.000 | |
| | | | |
| Income (Loss) From Operations | | | | | | | | | | | | | | | | |
Net investment income(2) | | $ | 0.259 | | | $ | 0.252 | | | $ | 0.239 | | | $ | 0.102 | |
Net realized and unrealized gain (loss) | | | 0.790 | | | | 1.375 | | | | (1.104 | ) | | | 0.950 | |
| | | | |
Total income (loss) from operations | | $ | 1.049 | | | $ | 1.627 | | | $ | (0.865 | ) | | $ | 1.052 | |
| | | | |
| Less Distributions | | | | | | | | | | | | | | | | |
From net investment income | | $ | (0.259 | ) | | $ | (0.307 | ) | | $ | (0.225 | ) | | $ | (0.082 | ) |
| | | | |
Total distributions | | $ | (0.259 | ) | | $ | (0.307 | ) | | $ | (0.225 | ) | | $ | (0.082 | ) |
| | | | |
Redemption fees(2)(3) | | $ | — | | | $ | — | | | $ | — | | | $ | 0.000 | (4) |
| | | | |
Net asset value — End of period | | $ | 11.990 | | | $ | 11.200 | | | $ | 9.880 | | | $ | 10.970 | |
| | | | |
Total Return(5) | | | 9.31 | % | | | 16.59 | % | | | (7.76 | )% | | | 10.54 | %(6) |
| | | | |
| Ratios/Supplemental Data | | | | | | | | | | | | | | | | |
Net assets, end of period (000’s omitted) | | $ | 68,911 | | | $ | 54,167 | | | $ | 45,957 | | | $ | 41,969 | |
Ratios (as a percentage of average daily net assets): | | | | | | | | | | | | | | | | |
Expenses(7)(8) | | | 0.80 | % | | | 1.02 | % | | | 1.25 | % | | | 1.25 | %(9) |
Net investment income | | | 2.20 | % | | | 2.45 | % | | | 2.28 | % | | | 1.20 | %(9) |
Portfolio Turnover | | | 35 | % | | | 44 | % | | | 60 | % | | | 15 | %(6) |
| (1) | For the period from the start of business, April 1, 2010, to January 31, 2011. |
| (2) | Computed using average shares outstanding. |
| (3) | Redemption fees were discontinued as of January 1, 2011. |
| (4) | Amount is less than $0.0005. |
| (5) | Returns are historical and are calculated by determining the percentage change in net asset value with all distributions reinvested. |
| (7) | Excludes the effect of custody fee credits, if any, of less than 0.005%. |
| (8) | The investment adviser, sub-adviser and administrator subsidized certain operating expenses (equal to 0.29%, 0.30%, 0.25% and 0.72% of average daily net assets for the years ended January 31, 2014, 2013 and 2012 and the period ended January 31, 2011, respectively). |
| | | | |
| | 19 | | See Notes to Financial Statements. |
Parametric International Equity Fund
January 31, 2014
Notes to Financial Statements
1 Significant Accounting Policies
Parametric International Equity Fund (formerly, Eaton Vance Parametric Structured International Equity Fund) (the Fund) is a diversified series of Eaton Vance Mutual Funds Trust (the Trust). The Trust is a Massachusetts business trust registered under the Investment Company Act of 1940, as amended (the 1940 Act), as an open-end management investment company. The Fund’s investment objective is to seek long-term capital appreciation. The Fund offers two classes of shares. Investor Class (renamed from Class A effective March 1, 2013) and Institutional Class (renamed from Class I effective March 1, 2013) shares are sold at net asset value and are not subject to a sales charge. Prior to March 1, 2013, the date the sales charge was eliminated and the share class was renamed, Investor Class shares were generally sold subject to a sales charge of 5.75% imposed at time of purchase. The Fund previously offered Class C shares. At the close of business on March 15, 2013, Class C shares were merged into Investor Class shares. Each class represents a pro-rata interest in the Fund, but votes separately on class-specific matters and (as noted below) is subject to different expenses. Realized and unrealized gains and losses and net investment income and losses, other than class-specific expenses, are allocated daily to each class of shares based on the relative net assets of each class to the total net assets of the Fund. Each class of shares differs in its distribution plan and certain other class-specific expenses.
The following is a summary of significant accounting policies of the Fund. The policies are in conformity with accounting principles generally accepted in the United States of America.
A Investment Valuation — The following methodologies are used to determine the market value or fair value of investments.
Equity Securities. Equity securities (including common shares of closed-end investment companies) listed on a U.S. securities exchange generally are valued at the last sale or closing price on the day of valuation or, if no sales took place on such date, at the mean between the closing bid and asked prices therefore on the exchange where such securities are principally traded. Equity securities listed on the NASDAQ Global or Global Select Market generally are valued at the NASDAQ official closing price. Unlisted or listed securities for which closing sales prices or closing quotations are not available are valued at the mean between the latest available bid and asked prices.
Debt Obligations. Short-term obligations purchased with a remaining maturity of sixty days or less are generally valued at amortized cost, which approximates market value.
Foreign Securities and Currencies. Foreign securities and currencies are valued in U.S. dollars, based on foreign currency exchange rate quotations supplied by a third party pricing service. The pricing service uses a proprietary model to determine the exchange rate. Inputs to the model include reported trades and implied bid/ask spreads. The daily valuation of exchange-traded foreign securities generally is determined as of the close of trading on the principal exchange on which such securities trade. Events occurring after the close of trading on foreign exchanges may result in adjustments to the valuation of foreign securities to more accurately reflect their fair value as of the close of regular trading on the New York Stock Exchange. When valuing foreign equity securities that meet certain criteria, the Fund’s Trustees have approved the use of a fair value service that values such securities to reflect market trading that occurs after the close of the applicable foreign markets of comparable securities or other instruments that have a strong correlation to the fair-valued securities.
Affiliated Fund. The Fund may invest in Eaton Vance Cash Reserves Fund, LLC (Cash Reserves Fund), an affiliated investment company managed by Eaton Vance Management (EVM). The value of the Fund’s investment in Cash Reserves Fund reflects the Fund’s proportionate interest in its net assets. Cash Reserves Fund generally values its investment securities utilizing the amortized cost valuation technique in accordance with Rule 2a-7 under the 1940 Act. This technique involves initially valuing a portfolio security at its cost and thereafter assuming a constant amortization to maturity of any discount or premium. If amortized cost is determined not to approximate fair value, Cash Reserves Fund may value its investment securities based on available market quotations provided by a third party pricing service.
Fair Valuation. Investments for which valuations or market quotations are not readily available or are deemed unreliable are valued at fair value using methods determined in good faith by or at the direction of the Trustees of the Fund in a manner that fairly reflects the security’s value, or the amount that the Fund might reasonably expect to receive for the security upon its current sale in the ordinary course. Each such determination is based on a consideration of relevant factors, which are likely to vary from one pricing context to another. These factors may include, but are not limited to, the type of security, the existence of any contractual restrictions on the security’s disposition, the price and extent of public trading in similar securities of the issuer or of comparable companies or entities, quotations or relevant information obtained from broker/dealers or other market participants, information obtained from the issuer, analysts, and/or the appropriate stock exchange (for exchange-traded securities), an analysis of the company’s or entity’s financial condition, and an evaluation of the forces that influence the issuer and the market(s) in which the security is purchased and sold.
B Investment Transactions — Investment transactions for financial statement purposes are accounted for on a trade date basis. Realized gains and losses on investments sold are determined on the basis of identified cost.
C Income — Dividend income is recorded on the ex-dividend date for dividends received in cash and/or securities. However, if the ex-dividend date has passed, certain dividends from foreign securities are recorded as the Fund is informed of the ex-dividend date. Withholding taxes on foreign dividends and capital gains have been provided for in accordance with the Fund’s understanding of the applicable countries’ tax rules and rates. Interest income is recorded on the basis of interest accrued, adjusted for amortization of premium or accretion of discount.
Parametric International Equity Fund
January 31, 2014
Notes to Financial Statements — continued
D Federal Taxes — The Fund’s policy is to comply with the provisions of the Internal Revenue Code applicable to regulated investment companies and to distribute to shareholders each year substantially all of its net investment income, and all or substantially all of its net realized capital gains. Accordingly, no provision for federal income or excise tax is necessary.
In addition to the requirements of the Internal Revenue Code, the Fund may also be subject to local taxes on the recognition of capital gains in certain countries. In determining the daily net asset value, the Fund estimates the accrual for such taxes, if any, based on the unrealized appreciation on certain portfolio securities and the related tax rates. Taxes attributable to unrealized appreciation are included in the change in unrealized appreciation (depreciation) on investments. Capital gains taxes on securities sold are included in net realized gain (loss) on investments.
At January 31, 2014, the Fund, for federal income tax purposes, had a capital loss carryforward of $94,897 and deferred capital losses of $4,189,149 which will reduce its taxable income arising from future net realized gains on investment transactions, if any, to the extent permitted by the Internal Revenue Code, and thus will reduce the amount of distributions to shareholders, which would otherwise be necessary to relieve the Fund of any liability for federal income or excise tax. The capital loss carryforward will expire on January 31, 2019 and its character is short-term. The deferred capital losses are treated as arising on the first day of the Fund’s next taxable year, retaining the same short-term or long-term character as when originally deferred, and are treated as realized prior to the utilization of the capital loss carryforward. Of the deferred capital losses at January 31, 2014, $4,189,149 are short-term.
As of January 31, 2014, the Fund had no uncertain tax positions that would require financial statement recognition, de-recognition, or disclosure. The Fund files a U.S. federal income tax return annually after its fiscal year-end, which is subject to examination by the Internal Revenue Service for a period of three years from the date of filing.
E Expenses — The majority of expenses of the Trust are directly identifiable to an individual fund. Expenses which are not readily identifiable to a specific fund are allocated taking into consideration, among other things, the nature and type of expense and the relative size of the funds.
F Expense Reduction — State Street Bank and Trust Company (SSBT) serves as custodian of the Fund. Pursuant to the custodian agreement, SSBT receives a fee reduced by credits, which are determined based on the average daily cash balance the Fund maintains with SSBT. All credit balances, if any, used to reduce the Fund’s custodian fees are reported as a reduction of expenses in the Statement of Operations.
G Foreign Currency Translation — Investment valuations, other assets, and liabilities initially expressed in foreign currencies are translated each business day into U.S. dollars based upon current exchange rates. Purchases and sales of foreign investment securities and income and expenses denominated in foreign currencies are translated into U.S. dollars based upon currency exchange rates in effect on the respective dates of such transactions. Recognized gains or losses on investment transactions attributable to changes in foreign currency exchange rates are recorded for financial statement purposes as net realized gains and losses on investments. That portion of unrealized gains and losses on investments that results from fluctuations in foreign currency exchange rates is not separately disclosed.
H Use of Estimates — The preparation of the financial statements in conformity with accounting principles generally accepted in the United States of America requires management to make estimates and assumptions that affect the reported amounts of assets and liabilities at the date of the financial statements and the reported amounts of income and expense during the reporting period. Actual results could differ from those estimates.
I Indemnifications — Under the Trust’s organizational documents, its officers and Trustees may be indemnified against certain liabilities and expenses arising out of the performance of their duties to the Fund. Under Massachusetts law, if certain conditions prevail, shareholders of a Massachusetts business trust (such as the Trust) could be deemed to have personal liability for the obligations of the Trust. However, the Trust’s Declaration of Trust contains an express disclaimer of liability on the part of Fund shareholders and the By-laws provide that the Trust shall assume the defense on behalf of any Fund shareholders. Moreover, the By-laws also provide for indemnification out of Fund property of any shareholder held personally liable solely by reason of being or having been a shareholder for all loss or expense arising from such liability. Additionally, in the normal course of business, the Fund enters into agreements with service providers that may contain indemnification clauses. The Fund’s maximum exposure under these arrangements is unknown as this would involve future claims that may be made against the Fund that have not yet occurred.
2 Distributions to Shareholders
It is the present policy of the Fund to make at least one distribution annually (normally in December) of all or substantially all of its net investment income and to distribute annually all or substantially all of its net realized capital gains (reduced by available capital loss carryforwards from prior years). Distributions to shareholders are recorded on the ex-dividend date. Distributions are declared separately for each class of shares. Shareholders may reinvest income and capital gain distributions in additional shares of the same class of the Fund at the net asset value as of the ex-dividend date or, at the election of the shareholder, receive distributions in cash. The Fund distinguishes between distributions on a tax basis and a financial reporting basis. Accounting principles generally accepted in the United States of America require that only distributions in excess of tax basis earnings and profits be reported in the financial statements as a return of capital. Permanent differences between book and tax accounting relating to distributions are reclassified to paid-in capital. For tax purposes, distributions from short-term capital gains are considered to be from ordinary income.
Parametric International Equity Fund
January 31, 2014
Notes to Financial Statements — continued
The tax character of distributions declared for the years ended January 31, 2014 and January 31, 2013 was as follows:
| | | | | | | | |
| | | Year Ended January 31, | |
| | | 2014 | | | 2013 | |
| | |
Distributions declared from: | | | | | | | | |
Ordinary income | | $ | 1,623,643 | | | $ | 1,586,026 | |
During the year ended January 31, 2014, accumulated net realized loss was increased by $136,325 and accumulated distributions in excess of net investment income was decreased by $136,325 due to differences between book and tax accounting, primarily for investments in partnerships, foreign currency gain (loss) and investments in passive foreign investment companies (PFICs). These reclassifications had no effect on the net assets or net asset value per share of the Fund.
As of January 31, 2014, the components of distributable earnings (accumulated losses) and unrealized appreciation (depreciation) on a tax basis were as follows:
| | | | |
Undistributed ordinary income | | $ | 5,791 | |
Capital loss carryforward and deferred capital losses | | $ | (4,284,046 | ) |
Net unrealized appreciation | | $ | 12,446,865 | |
The differences between components of distributable earnings (accumulated losses) on a tax basis and the amounts reflected in the Statement of Assets and Liabilities are primarily due to wash sales, foreign currency transactions, investments in partnerships and investments in PFICs.
3 Investment Adviser and Administration Fee and Other Transactions with Affiliates
The investment adviser and administration fee is earned by EVM as compensation for investment advisory and administrative services rendered to the Fund. Pursuant to the investment advisory and administrative agreement and subsequent fee reduction agreement between the Fund and EVM, the fee is computed at an annual rate of 0.75% of the Fund’s average daily net assets up to $500 million and is payable monthly. On net assets of $500 million and over, the annual fee is reduced. The fee reduction cannot be terminated without the consent of a majority of the Trustees and a majority of shareholders. For the year ended January 31, 2014, the investment adviser and administration fee amounted to $522,970 or 0.75% of the Fund’s average daily net assets. Pursuant to a sub-advisory agreement, EVM has delegated the investment management of the Fund to Parametric Portfolio Associates LLC (Parametric), a majority-owned subsidiary of Eaton Vance Corp. EVM pays Parametric a portion of its advisory and administration fee for sub-advisory services provided to the Fund. The Fund invests its cash in Cash Reserves Fund. EVM does not currently receive a fee for advisory services provided to Cash Reserves Fund.
EVM and Parametric have agreed to reimburse the Fund’s expenses to the extent that total annual operating expenses (relating to ordinary operating expenses only) exceed 1.05% and 0.80% of the Fund’s average daily net assets for Investor Class and Institutional Class, respectively, and prior to the close of business on March 15, 2013, 1.80% of the Fund’s average daily net assets for Class C. This agreement may be changed or terminated after May 31, 2014. Pursuant to this agreement, EVM and Parametric were allocated $205,897 in total of the Fund’s operating expenses for the year ended January 31, 2014.
EVM provides sub-transfer agency services to the Fund and receives a fee based upon the actual expenses it incurs in the performance of these services. For the year ended January 31, 2014, EVM earned $1,058 in sub-transfer agent fees, which are included in transfer and dividend disbursing agent fees on the Statement of Operations. The Fund was informed that Eaton Vance Distributors, Inc. (EVD), an affiliate of EVM and the Fund’s principal underwriter, received $194 as its portion of the sales charge on sales of Investor Class shares for the year ended January 31, 2014. EVD also received distribution and services fees from Investor Class and Class C (prior to the close of business on March 15, 2013) (see Note 4).
Trustees and officers of the Fund who are members of EVM’s organization receive remuneration for their services to the Fund out of the investment adviser and administration fee. Trustees of the Fund who are not affiliated with EVM may elect to defer receipt of all or a percentage of their annual fees in accordance with the terms of the Trustees Deferred Compensation Plan. For the year ended January 31, 2014, no significant amounts have been deferred. Certain officers and Trustees of the Fund are officers of EVM.
4 Distribution Plans
The Fund has in effect a distribution plan for Investor Class shares (Investor Class Plan) pursuant to Rule 12b-1 under the 1940 Act. Pursuant to the Investor Class Plan, the Fund pays EVD a distribution and service fee of 0.25% per annum of its average daily net assets attributable to Investor Class
Parametric International Equity Fund
January 31, 2014
Notes to Financial Statements — continued
shares for distribution services and facilities provided to the Fund by EVD, as well as for personal services and/or the maintenance of shareholder accounts. Distribution and service fees paid or accrued to EVD for the year ended January 31, 2014 amounted to $25,459 for Investor Class shares.
Prior to the close of business on March 15, 2013, the Fund also had in effect a distribution plan for Class C shares (Class C Plan) pursuant to Rule 12b-1 under the 1940 Act. Pursuant to the Class C Plan, the Fund paid EVD amounts equal to 0.75% per annum of its average daily net assets attributable to Class C shares for providing ongoing distribution services and facilities to the Fund. For the year ended January 31, 2014, the Fund paid or accrued to EVD $422 for Class C shares.
Pursuant to the Class C Plan (prior to the close of business on March 15, 2013), the Fund also made payments of service fees to EVD, financial intermediaries and other persons in amounts equal to 0.25% per annum of its average daily net assets attributable to Class C shares. Service fees paid or accrued were for personal services and/or the maintenance of shareholder accounts. They were separate and distinct from the sales commissions and distribution fees payable to EVD. Service fees paid or accrued for the year ended January 31, 2014 amounted to $141 for Class C shares.
Distribution and service fees are subject to the limitations contained in the Financial Industry Regulatory Authority’s NASD Conduct Rule 2830(d).
5 Contingent Deferred Sales Charges
Prior to the close of business on March 15, 2013, a contingent deferred sales charge (CDSC) of 1% generally was imposed on redemptions of Class C shares made within one year of purchase. Class C shares that were merged into Investor Class shares continue to be subject to the Class C CDSC. Prior to March 1, 2013, Class A (renamed Investor Class) shares may have been subject to a 1% CDSC if redeemed within 18 months of purchase (depending on the circumstances of purchase). Generally, the CDSC is based upon the lower of the net asset value at date of redemption or date of purchase. No charge is levied on shares acquired by reinvestment of dividends or capital gain distributions. For the year ended January 31, 2014, the Fund was informed that EVD received no CDSCs paid by Investor Class and Class C shareholders.
6 Purchases and Sales of Investments
Purchases and sales of investments, other than short-term obligations, aggregated $40,502,854 and $23,937,436, respectively, for the year ended January 31, 2014.
7 Shares of Beneficial Interest
The Fund’s Declaration of Trust permits the Trustees to issue an unlimited number of full and fractional shares of beneficial interest (without par value). Such shares may be issued in a number of different series (such as the Fund) and classes. Transactions in Fund shares were as follows:
| | | | | | | | |
| | | Year Ended January 31, | |
| Investor Class | | 2014 | | | 2013 | |
| | |
Sales | | | 930,182 | | | | 609,678 | |
Issued to shareholders electing to receive payments of distributions in Fund shares | | | 13,007 | | | | 14,798 | |
Redemptions | | | (447,045 | ) | | | (1,239,459 | ) |
Merger from Class C shares | | | 45,498 | | | | — | |
| | |
Net increase (decrease) | | | 541,642 | | | | (614,983 | ) |
| | |
| | | | | | | | |
| | | Year Ended January 31, | |
| Class C | | 2014(1) | | | 2013 | |
| | |
Sales | | | 6,372 | | | | 23,268 | |
Issued to shareholders electing to receive payments of distributions in Fund shares | | | — | | | | 778 | |
Redemptions | | | (5 | ) | | | (10,360 | ) |
Merger to Investor Class shares | | | (45,969 | ) | | | — | |
| | |
Net increase (decrease) | | | (39,602 | ) | | | 13,686 | |
| | |
| | | | | | | | |
Parametric International Equity Fund
January 31, 2014
Notes to Financial Statements — continued
| | | | | | | | |
| | | Year Ended January 31, | |
| Institutional Class | | 2014 | | | 2013 | |
| | |
Sales | | | 2,466,781 | | | | 1,468,321 | |
Issued to shareholders electing to receive payments of distributions in Fund shares | | | 12,826 | | | | 40,243 | |
Redemptions | | | (1,569,599 | ) | | | (1,325,254 | ) |
| | |
Net increase | | | 910,008 | | | | 183,310 | |
| (1) | Offering of Class C shares was discontinued during the year ended January 31, 2013 (see Note 1). |
At January 31, 2014, donor advised and pooled income funds (established and maintained by a public charity) managed by EVM and an EVM retirement plan owned 29.2% and 12.9%, respectively, of the value of the outstanding shares of the Fund.
8 Federal Income Tax Basis of Investments
The cost and unrealized appreciation (depreciation) of investments of the Fund at January 31, 2014, as determined on a federal income tax basis, were as follows:
| | | | |
| |
Aggregate cost | | $ | 70,890,781 | |
| |
Gross unrealized appreciation | | $ | 14,349,143 | |
Gross unrealized depreciation | | | (1,909,535 | ) |
| |
Net unrealized appreciation | | $ | 12,439,608 | |
9 Line of Credit
The Fund participates with other portfolios and funds managed by EVM and its affiliates in a $750 million unsecured line of credit agreement with a group of banks. Borrowings are made by the Fund solely to facilitate the handling of unusual and/or unanticipated short-term cash requirements. Interest is charged to the Fund based on its borrowings at an amount above either the Eurodollar rate or Federal Funds rate. In addition, a fee computed at an annual rate of 0.08% on the daily unused portion of the line of credit is allocated among the participating portfolios and funds at the end of each quarter. Because the line of credit is not available exclusively to the Fund, it may be unable to borrow some or all of its requested amounts at any particular time. The Fund did not have any significant borrowings or allocated fees during the year ended January 31, 2014.
10 Risks Associated with Foreign Investments
Investing in securities issued by companies whose principal business activities are outside the United States may involve significant risks not present in domestic investments. For example, there is generally less publicly available information about foreign companies, particularly those not subject to the disclosure and reporting requirements of the U.S. securities laws. Certain foreign issuers are generally not bound by uniform accounting, auditing, and financial reporting requirements and standards of practice comparable to those applicable to domestic issuers. Investments in foreign securities also involve the risk of possible adverse changes in investment or exchange control regulations, expropriation or confiscatory taxation, limitation on the removal of funds or other assets of the Fund, political or financial instability or diplomatic and other developments which could affect such investments. Foreign securities markets, while growing in volume and sophistication, are generally not as developed as those in the United States, and securities of some foreign issuers (particularly those located in developing countries) may be less liquid and more volatile than securities of comparable U.S. companies. In general, there is less overall governmental supervision and regulation of foreign securities markets, broker/dealers and issuers than in the United States.
11 Fair Value Measurements
Under generally accepted accounting principles for fair value measurements, a three-tier hierarchy to prioritize the assumptions, referred to as inputs, is used in valuation techniques to measure fair value. The three-tier hierarchy of inputs is summarized in the three broad levels listed below.
| Ÿ | | Level 1 – quoted prices in active markets for identical investments |
| Ÿ | | Level 2 – other significant observable inputs (including quoted prices for similar investments, interest rates, prepayment speeds, credit risk, etc.) |
| Ÿ | | Level 3 – significant unobservable inputs (including a fund’s own assumptions in determining the fair value of investments) |
Parametric International Equity Fund
January 31, 2014
Notes to Financial Statements — continued
In cases where the inputs used to measure fair value fall in different levels of the fair value hierarchy, the level disclosed is determined based on the lowest level input that is significant to the fair value measurement in its entirety. The inputs or methodology used for valuing securities are not necessarily an indication of the risk associated with investing in those securities.
At January 31, 2014, the hierarchy of inputs used in valuing the Fund’s investments, which are carried at value, were as follows:
| | | | | | | | | | | | | | | | |
| Asset Description | | Level 1 | | | Level 2 | | | Level 3 | | | Total | |
| | | | |
Common Stocks | | | | | | | | | | | | | | | | |
Asia/Pacific | | $ | 60,928 | | | $ | 22,594,922 | | | $ | — | | | $ | 22,655,850 | |
Developed Europe | | | 91,806 | | | | 57,814,779 | | | | — | | | | 57,906,585 | |
Developed Middle East | | | 653,472 | | | | 1,223,227 | | | | — | | | | 1,876,699 | |
| | | | |
Total Common Stocks | | $ | 806,206 | | | $ | 81,632,928 | * | | $ | — | | | $ | 82,439,134 | |
| | | | |
Rights | | $ | 846 | | | $ | — | | | $ | — | | | $ | 846 | |
Short-Term Investments | | | — | | | | 890,409 | | | | — | | | | 890,409 | |
| | | | |
Total Investments | | $ | 807,052 | | | $ | 82,523,337 | | | $ | — | | | $ | 83,330,389 | |
| * | Includes foreign equity securities whose values were adjusted to reflect market trading of comparable securities or other correlated instruments that occurred after the close of trading in their applicable foreign markets. |
The Fund held no investments or other financial instruments as of January 31, 2013 whose fair value was determined using Level 3 inputs. At January 31, 2014, there were no investments transferred between Level 1 and Level 2 during the year then ended.
12 Name Change
Effective March 1, 2013, the name of the Parametric International Equity Fund was changed from Eaton Vance Parametric Structured International Equity Fund.
Parametric International Equity Fund
January 31, 2014
Report of Independent Registered Public Accounting Firm
To the Trustees of Eaton Vance Mutual Funds Trust and Shareholders of Parametric International Equity Fund
(formerly, Eaton Vance Parametric Structured International Equity Fund):
We have audited the accompanying statement of assets and liabilities of Parametric International Equity Fund (formerly, Eaton Vance Parametric Structured International Equity Fund) (the “Fund”) (one of the funds constituting Eaton Vance Mutual Funds Trust), including the portfolio of investments, as of January 31, 2014, and the related statement of operations for the year then ended, the statements of changes in net assets for each of the two years in the period then ended, and the financial highlights for each of the three years in the period then ended and for the period from the start of business, April 1, 2010, to January 31, 2011. These financial statements and financial highlights are the responsibility of the Fund’s management. Our responsibility is to express an opinion on these financial statements and financial highlights based on our audits.
We conducted our audits in accordance with the standards of the Public Company Accounting Oversight Board (United States). Those standards require that we plan and perform the audit to obtain reasonable assurance about whether the financial statements and financial highlights are free of material misstatement. The Fund is not required to have, nor were we engaged to perform, an audit of its internal control over financial reporting. Our audits included consideration of internal control over financial reporting as a basis for designing audit procedures that are appropriate in the circumstances, but not for the purpose of expressing an opinion on the effectiveness of the Fund’s internal control over financial reporting. Accordingly, we express no such opinion. An audit also includes examining, on a test basis, evidence supporting the amounts and disclosures in the financial statements, assessing the accounting principles used and significant estimates made by management, as well as evaluating the overall financial statement presentation. Our procedures included confirmation of securities owned as of January 31, 2014, by correspondence with the custodian and brokers; where replies were not received from brokers, we performed other auditing procedures. We believe that our audits provide a reasonable basis for our opinion.
In our opinion, such financial statements and financial highlights referred to above present fairly, in all material respects, the financial position of Parametric International Equity Fund as of January 31, 2014, the results of its operations for the year then ended, the changes in its net assets for each of the two years in the period then ended, and the financial highlights for each of the three years in the period then ended and for the period from the start of business, April 1 2010, to January 31, 2011, in conformity with accounting principles generally accepted in the United States of America.
DELOITTE & TOUCHE LLP
Boston, Massachusetts
March 18, 2014
Parametric International Equity Fund
January 31, 2014
Federal Tax Information (Unaudited)
The Form 1099-DIV you receive in February 2015 will show the tax status of all distributions paid to your account in calendar year 2014. Shareholders are advised to consult their own tax adviser with respect to the tax consequences of their investment in the Fund. As required by the Internal Revenue Code and/or regulations, shareholders must be notified regarding the status of qualified dividend income for individuals and the foreign tax credit.
Qualified Dividend Income. The Fund designates approximately $1,884,593, or up to the maximum amount of such dividends allowable pursuant to the Internal Revenue Code, as qualified dividend income eligible for the reduced tax rate of 15%.
Foreign Tax Credit. The Fund paid foreign taxes of $197,621 and recognized foreign source income of $2,272,517.
Parametric International Equity Fund
January 31, 2014
Management and Organization
Fund Management. The Trustees of Eaton Vance Mutual Funds Trust (the Trust) are responsible for the overall management and supervision of the Trust’s affairs. The Trustees and officers of the Trust are listed below. Except as indicated, each individual has held the office shown or other offices in the same company for the last five years. Trustees and officers of the Trust hold indefinite terms of office. The “Noninterested Trustees” consist of those Trustees who are not “interested persons” of the Trust, as that term is defined under the 1940 Act. The business address of each Trustee and officer is Two International Place, Boston, Massachusetts 02110. As used below, “EVC” refers to Eaton Vance Corp., “EV” refers to Eaton Vance, Inc., “EVM” refers to Eaton Vance Management, “BMR” refers to Boston Management and Research and “EVD” refers to Eaton Vance Distributors, Inc. EVC and EV are the corporate parent and trustee, respectively, of EVM and BMR. EVD is the Fund’s principal underwriter and a wholly-owned subsidiary of EVC. Each officer affiliated with Eaton Vance may hold a position with other Eaton Vance affiliates that is comparable to his or her position with EVM listed below. Each Trustee oversees 182 portfolios in the Eaton Vance Complex (including all master and feeder funds in a master feeder structure). Each officer serves as an officer of certain other Eaton Vance funds. Each Trustee and officer serves until his or her successor is elected.
| | | | | | |
| Name and Year of Birth | | Position(s) with the
Trust | | Trustee Since(1) | | Principal Occupation(s) and Directorships During Past Five Years and Other Relevant Experience |
Interested Trustee |
| | | |
Thomas E. Faust Jr. 1958 | | Trustee | | 2007 | | Chairman, Chief Executive Officer and President of EVC, Director and President of EV, Chief Executive Officer and President of EVM and BMR, and Director of EVD. Trustee and/or officer of 182 registered investment companies. Mr. Faust is an interested person because of his positions with EVM, BMR, EVD, EVC and EV, which are affiliates of the Trust. Directorships in the Last Five Years.(2) Director of EVC and Hexavest Inc. |
| | | |
| | | | | | |
Noninterested Trustees |
| | | |
Scott E. Eston 1956 | | Trustee | | 2011 | | Private investor. Formerly held various positions at Grantham, Mayo, Van Otterloo and Co., L.L.C. (investment management firm) (1997-2009), including Chief Operating Officer (2002-2009), Chief Financial Officer (1997-2009) and Chairman of the Executive Committee (2002-2008); President and Principal Executive Officer, GMO Trust (open-end registered investment company) (2006-2009). Former Partner, Coopers and Lybrand L.L.P. (now PricewaterhouseCoopers) (public accounting firm) (1987-1997). Directorships in the Last Five Years.(2) None. |
| | | |
Allen R. Freedman 1940 | | Trustee | | 2007 | | Private Investor. Former Chairman (2002-2004) and a Director (1983-2004) of Systems & Computer Technology Corp. (provider of software to higher education). Formerly, a Director of Loring Ward International (fund distributor) (2005-2007). Former Chairman and a Director of Indus International, Inc. (provider of enterprise management software to the power generating industry) (2005-2007). Former Chief Executive Officer of Assurant, Inc. (insurance provider) (1979-2000). Directorships in the Last Five Years.(2) Director of Stonemor Partners, L.P. (owner and operator of cemeteries). Formerly, Director of Assurant, Inc. (insurance provider) (1979-2011). |
| | | |
Valerie A. Mosley(3) 1960 | | Trustee | | 2014 | | Chairwoman and Chief Executive Officer of Valmo Ventures (a consulting and investment firm). Former Partner and Senior Vice President, Portfolio Manager and Investment Strategist at Wellington Management Company, LLP (investment management firm) (1992-2012). Former Chief Investment Officer, PG Corbin Asset Management (1990-1992). Formerly worked in institutional corporate bond sales at Kidder Peabody (1986-1990). Directorships in the Last Five Years. Director of Dynex Capital, Inc. (mortgage REIT) (since 2013). |
| | | |
William H. Park 1947 | | Trustee | | 2003 | | Consultant and private investor. Formerly, Chief Financial Officer, Aveon Group L.P. (investment management firm) (2010-2011). Formerly, Vice Chairman, Commercial Industrial Finance Corp. (specialty finance company) (2006-2010). Formerly, President and Chief Executive Officer, Prizm Capital Management, LLC (investment management firm) (2002-2005). Formerly, Executive Vice President and Chief Financial Officer, United Asset Management Corporation (investment management firm) (1982-2001). Formerly, Senior Manager, Price Waterhouse (now PricewaterhouseCoopers) (an independent registered public accounting firm) (1972-1981). Directorships in the Last Five Years.(2) None. |
Parametric International Equity Fund
January 31, 2014
Management and Organization — continued
| | | | | | |
| Name and Year of Birth | | Position(s) with the
Trust | | Trustee Since(1) | | Principal Occupation(s) and Directorships During Past Five Years and Other Relevant Experience |
Noninterested Trustees (continued) |
| | | |
Ronald A. Pearlman 1940 | | Trustee | | 2003 | | Professor of Law, Georgetown University Law Center. Formerly, Deputy Assistant Secretary (Tax Policy) and Assistant Secretary (Tax Policy), U.S. Department of the Treasury (1983-1985). Formerly, Chief of Staff, Joint Committee on Taxation, U.S. Congress (1988-1990). Directorships in the Last Five Years.(2) None. |
| | | |
Helen Frame Peters 1948 | | Trustee | | 2008 | | Professor of Finance, Carroll School of Management, Boston College. Formerly, Dean, Carroll School of Management, Boston College (2000-2002). Formerly, Chief Investment Officer, Fixed Income, Scudder Kemper Investments (investment management firm) (1998-1999). Formerly, Chief Investment Officer, Equity and Fixed Income, Colonial Management Associates (investment management firm) (1991-1998). Directorships in the Last Five Years.(2) Formerly, Director of BJ’s Wholesale Club, Inc. (wholesale club retailer) (2004-2011). Formerly, Trustee of SPDR Index Shares Funds and SPDR Series Trust (exchange traded funds) (2000-2009). Formerly, Director of Federal Home Loan Bank of Boston (a bank for banks) (2007-2009). |
| | | |
Lynn A. Stout 1957 | | Trustee | | 1998 | | Distinguished Professor of Corporate and Business Law, Jack G. Clarke Business Law Institute, Cornell University Law School. Formerly, the Paul Hastings Professor of Corporate and Securities Law (2006-2012) and Professor of Law (2001-2006), University of California at Los Angeles School of Law. Directorships in the Last Five Years.(2) None. |
| | | |
Harriett Tee Taggart 1948 | | Trustee | | 2011 | | Managing Director, Taggart Associates (a professional practice firm). Formerly, Partner and Senior Vice President, Wellington Management Company, LLP (investment management firm) (1983-2006). Directorships in the Last Five Years.(2) Director of Albemarle Corporation (chemicals manufacturer) (since 2007) and The Hanover Group (specialty property and casualty insurance company) (since 2009). Formerly, Director of Lubrizol Corporation (specialty chemicals) (2007-2011). |
| | | |
Ralph F. Verni 1943 | | Chairman of the Board and Trustee | | 2007 (Chairman);
2005 (Trustee) | | Consultant and private investor. Formerly, Chief Investment Officer (1982-1992), Chief Financial Officer (1988-1990) and Director (1982-1992), New England Life. Formerly, Chairperson, New England Mutual Funds (1982-1992). Formerly, President and Chief Executive Officer, State Street Management & Research (1992-2000). Formerly, Chairperson, State Street Research Mutual Funds (1992-2000). Formerly, Director, W.P. Carey, LLC (1998-2004) and First Pioneer Farm Credit Corp. (2002-2006). Directorships in the Last Five Years.(2) None. |
| | | |
| | | | | | |
Parametric International Equity Fund
January 31, 2014
Management and Organization — continued
| | | | | | |
Principal Officers who are not Trustees |
| Name and Year of Birth | |
Position(s)
with the
Trust | | Officer
Since(4) | | Principal Occupation(s) During Past Five Years |
Payson F. Swaffield 1956 | | President | | 2003 | | Vice President and Chief Income Investment Officer of EVM and BMR. |
| | | |
Maureen A. Gemma 1960 | | Vice President, Secretary and Chief Legal Officer | | 2005 | | Vice President of EVM and BMR. |
| | | |
James F. Kirchner 1967 | | Treasurer | | 2007 | | Vice President of EVM and BMR. |
| | | |
Paul M. O’Neil 1953 | | Chief Compliance Officer | | 2004 | | Vice President of EVM and BMR. |
| (1) | Date first appointed to serve as Trustee for a fund in the Eaton Vance family of funds. Each Trustee has served continuously since appointment unless indicated otherwise. |
| (2) | During their respective tenures, the Trustees (except for, Mr. Eston and Ms. Taggart for all funds except eUnitsTM 2 Year U.S. Equity Market Participation Trust: Upside to Cap / Buffered Downside and Ms. Mosley for all funds) also served as Board members of one or more of the following funds (which operated in the years noted): eUnitsTM 2 Year U.S. Equity Market Participation Trust: Upside to Cap / Buffered Downside (launched in 2012 and terminated in 2014); Eaton Vance Credit Opportunities Fund (launched in 2005 and terminated in 2010); Eaton Vance Insured Florida Plus Municipal Bond Fund (launched in 2002 and terminated in 2009); and Eaton Vance National Municipal Income Trust (launched in 1998 and terminated in 2009). |
| (3) | Effective January 1, 2014, Ms. Mosley was appointed as a Trustee of the Trust. |
| (4) | Date first elected to serve as officer of a fund in the Eaton Vance family of funds. Titles may have changed since initial appointment. |
The SAI for the Fund includes additional information about the Trustees and officers of the Fund and can be obtained without charge on Eaton Vance’s website at www.eatonvance.com or by calling 1-800-260-0761.
Eaton Vance Funds
IMPORTANT NOTICES
Privacy. The Eaton Vance organization is committed to ensuring your financial privacy. Each of the financial institutions identified below has in effect the following policy (“Privacy Policy”) with respect to nonpublic personal information about its customers:
| Ÿ | | Only such information received from you, through application forms or otherwise, and information about your Eaton Vance fund transactions will be collected. This may include information such as name, address, social security number, tax status, account balances and transactions. |
| Ÿ | | None of such information about you (or former customers) will be disclosed to anyone, except as permitted by law (which includes disclosure to employees necessary to service your account). In the normal course of servicing a customer’s account, Eaton Vance may share information with unaffiliated third parties that perform various required services such as transfer agents, custodians and broker-dealers. |
| Ÿ | | Policies and procedures (including physical, electronic and procedural safeguards) are in place that are designed to protect the confidentiality of such information. |
| Ÿ | | We reserve the right to change our Privacy Policy at any time upon proper notification to you. Customers may want to review our Privacy Policy periodically for changes by accessing the link on our homepage: www.eatonvance.com. |
Our pledge of privacy applies to the following entities within the Eaton Vance organization: the Eaton Vance Family of Funds, Eaton Vance Management, Eaton Vance Investment Counsel, Eaton Vance Distributors, Inc., Eaton Vance Trust Company, Eaton Vance Management’s Real Estate Investment Group and Boston Management and Research. In addition, our Privacy Policy applies only to those Eaton Vance customers who are individuals and who have a direct relationship with us. If a customer’s account (i.e., fund shares) is held in the name of a third-party financial advisor/broker-dealer, it is likely that only such advisor’s privacy policies apply to the customer. This notice supersedes all previously issued privacy disclosures. For more information about Eaton Vance’s Privacy Policy, please call 1-800-262-1122.
Delivery of Shareholder Documents. The Securities and Exchange Commission (SEC) permits funds to deliver only one copy of shareholder documents, including prospectuses, proxy statements and shareholder reports, to fund investors with multiple accounts at the same residential or post office box address. This practice is often called “householding” and it helps eliminate duplicate mailings to shareholders. Eaton Vance, or your financial advisor, may household the mailing of your documents indefinitely unless you instruct Eaton Vance, or your financial advisor, otherwise. If you would prefer that your Eaton Vance documents not be householded, please contact Eaton Vance at 1-800-260-0761, or contact your financial advisor. Your instructions that householding not apply to delivery of your Eaton Vance documents will be effective within 30 days of receipt by Eaton Vance or your financial advisor.
Portfolio Holdings. Each Eaton Vance Fund and its underlying Portfolio(s) (if applicable) will file a schedule of portfolio holdings on Form N-Q with the SEC for the first and third quarters of each fiscal year. The Form N-Q will be available on the Eaton Vance website at www.eatonvance.com, by calling Eaton Vance at 1-800-260-0761 or in the EDGAR database on the SEC’s website at www.sec.gov. Form N-Q may also be reviewed and copied at the SEC’s public reference room in Washington, D.C. (call 1-800-732-0330 for information on the operation of the public reference room).
Proxy Voting. From time to time, funds are required to vote proxies related to the securities held by the funds. The Eaton Vance Funds or their underlying Portfolios (if applicable) vote proxies according to a set of policies and procedures approved by the Funds’ and Portfolios’ Boards. You may obtain a description of these policies and procedures and information on how the Funds or Portfolios voted proxies relating to portfolio securities during the most recent 12-month period ended June 30, without charge, upon request, by calling 1-800-260-0761 and by accessing the SEC’s website at www.sec.gov.
This Page Intentionally Left Blank
Investment Adviser and Administrator
Eaton Vance Management
Two International Place
Boston, MA 02110
Sub-Adviser
Parametric Portfolio Associates LLC
1918 Eighth Avenue, Suite 3100
Seattle, WA 98101
Principal Underwriter*
Eaton Vance Distributors, Inc.
Two International Place
Boston, MA 02110
(617) 482-8260
Custodian
State Street Bank and Trust Company
200 Clarendon Street
Boston, MA 02116
Transfer Agent
BNY Mellon Asset Servicing (US) Inc.
Attn: Eaton Vance Funds
P.O. Box 9653
Providence, RI 02940-9653
(800) 260-0761
Independent Registered Public Accounting Firm
Deloitte & Touche LLP
200 Berkeley Street
Boston, MA 02116-5022
Fund Offices
Two International Place
Boston, MA 02110
| * | FINRA BrokerCheck. Investors may check the background of their Investment Professional by contacting the Financial Industry Regulatory Authority (FINRA). FINRA BrokerCheck is a free tool to help investors check the professional background of current and former FINRA-registered securities firms and brokers. FINRA BrokerCheck is available by calling 1-800-289-9999 and at www.FINRA.org. The FINRA BrokerCheck brochure describing the program is available to investors at www.FINRA.org. |

| | |
Parametric Emerging Markets Fund Annual Report January 31, 2014 | | |

Commodity Futures Trading Commission Registration. Effective December 31, 2012, the Commodity Futures Trading Commission (“CFTC”) adopted certain regulatory changes that subject registered investment companies and advisers to regulation by the CFTC if a fund invests more than a prescribed level of its assets in certain CFTC-regulated instruments (including futures, certain options and swap agreements) or markets itself as providing investment exposure to such instruments. The Fund has claimed an exclusion from the definition of the term “commodity pool operator” under the Commodity Exchange Act. Accordingly, neither the Fund nor the adviser with respect to the operation of the Fund is subject to CFTC regulation. Because of its management of other strategies, the Fund’s adviser is registered with the CFTC as a commodity pool operator and a commodity trading advisor.
Fund shares are not insured by the FDIC and are not deposits or other obligations of, or guaranteed by, any depository institution. Shares are subject to investment risks, including possible loss of principal invested.
This report must be preceded or accompanied by a current summary prospectus or prospectus. Before investing, investors should consider carefully the investment objective, risks, and charges and expenses of a mutual fund. This and other important information is contained in the summary prospectus and prospectus, which can be obtained from a financial advisor. Prospective investors should read the prospectus carefully before investing. For further information, please call 1-800-260-0761.
Annual Report January 31, 2014
Parametric Emerging Markets Fund
Table of Contents
| | | | |
Management’s Discussion of Fund Performance | | | 2 | |
| |
Performance | | | 3 | |
| |
Fund Profile | | | 4 | |
| |
Endnotes and Additional Disclosures | | | 5 | |
| |
Fund Expenses | | | 6 | |
| |
Financial Statements | | | 7 | |
| |
Report of Independent Registered Public Accounting Firm | | | 40 | |
| |
Federal Tax Information | | | 41 | |
| |
Management and Organization | | | 42 | |
| |
Important Notices | | | 45 | |
Parametric Emerging Markets Fund
January 31, 2014
Management’s Discussion of Fund Performance1
Economic and Market Conditions
As the 12-month period started on February 1, 2013, global stocks, as measured by the MSCI All Country World Index (ACWI)2, had recently begun a rally that would continue well into May, driven largely by strengthening economic data in the U.S., Europe and elsewhere, along with highly accommodative monetary policies by global central banks.
In late May 2013, however, then-U.S. Federal Reserve (the Fed) Chairman Ben Bernanke surprised the markets by indicating that the Fed’s $85 billion in monthly asset purchases, known collectively as quantitative easing (QE), could begin to taper off sooner than most investors had expected. The negative effect on worldwide markets was swift and dramatic. Bond investors rushed to sell assets in anticipation of rising interest rates. The prospect of reduced Fed stimulus weighed on global equities as well, most notably in emerging markets dependent on exports to developed nations.
By late June 2013, however, global equities, in general, resumed their upward trajectory. Factors contributing to the rally included some backtracking by the Fed on its earlier statements regarding QE, ongoing improvements in housing and other U.S. economic data, and news from Europe that the eurozone had officially come out of recession.
After faltering again in August 2013 amid geopolitical tensions in the Middle East, global equities once more trended upward. In mid-September, the Fed again surprised investors by announcing that it was postponing any tapering of QE for the time being. Global stocks initially surged in response, only to drift downward in late September and early October amid investor uncertainty over the Fed’s intentions and a Congressional impasse that led to a partial U.S. government shutdown on October 1, 2013.
In mid-October, global stocks reversed direction again and began a rally that more or less lasted through the rest of 2013, driven largely by moderate economic growth that seemed to confirm the global recovery was gaining strength. Even the Fed’s mid-December announcement that tapering of QE would begin in January 2014 did not derail the rally, as investors appeared relieved that the tapering would be gradual and that the Fed still intended to keep short-term interest rates near zero for an extended period.
However, when the Fed announced further tapering toward the end of January, the reaction from global markets was
more negative. Although the Fed’s latest move was widely expected, many investors worried about continued withdrawal of stimulus in the face of some mixed economic data and recent turmoil in emerging markets, particularly the so-called “fragile five” — Turkey, Brazil, India, Indonesia and South Africa. Against this backdrop, the MSCI Emerging Markets Index fell 6.49% for the month of January, while the broader MSCI ACWI slid 4.00%.
For the full 12-month period, the MSCI ACWI returned 12.70%. Emerging markets were among the period’s worst performers, with the MSCI Emerging Markets Index falling 10.17%. In the U.S., the S&P 500 Index gained 21.52%, achieving multiple all-time closing highs along the way. The nascent European recovery helped power the FTSE Eurotop 100 Index to a 12.59% return. In response to Prime Minister Shinzo Abe’s stimulus efforts, Japan’s Nikkei-225 Stock Average advanced 19.82%. Elsewhere in the Asia-Pacific region, the MSCI Golden Dragon Index declined 2.32% amid slowing growth in China.
Fund Performance
For the 12-month period ended January 31, 2014,
Parametric Emerging Markets Fund (the Fund) had a total return of -6.62% for Investor Class shares at net asset value (NAV). By comparison, the Fund’s benchmark, the MSCI Emerging Markets Index (the Index), returned -10.17% during the period.
Factors contributing to the Fund’s performance relative to the Index included the Fund’s underweight position in Brazil, which underperformed the overall Index for the 12-month period. The Brazilian equity market fell in response to Brazil’s continued sluggish economic growth and a surge in domestic inflation. In addition, the Fund’s overweight positions in the United Arab Emirates and Qatar, both of which outperformed the Index for the period, also contributed to the Fund’s performance versus the Index.
Detractors from the Fund’s performance relative to the Index included the Fund’s underweight positions in Taiwan and Korea, both of which outperformed the overall Index for the 12-month period. Both countries’ equity markets were buoyed by continued strong growth in their export-driven economies. In addition, the Fund’s overweight position in Chile, which underperformed the Index for the period, also hurt the Fund’s performance versus the Index.
See Endnotes and Additional Disclosures in this report.
Past performance is no guarantee of future results. Returns are historical and are calculated by determining the percentage change in net asset value (NAV) or offering price (as applicable) with all distributions reinvested. Investment return and principal value will fluctuate so that shares, when redeemed, may be worth more or less than their original cost. Performance less than one year is cumulative. Performance is for the stated time period only; due to market volatility, the Fund’s current performance may be lower or higher than quoted. Returns are before taxes unless otherwise noted. For performance as of the most recent month end, please refer to eatonvance.com.
Parametric Emerging Markets Fund
January 31, 2014
Performance2,3
Portfolio Managers David Stein, Ph.D. and Thomas Seto, each of Parametric Portfolio Associates LLC
| | | | | | | | | | | | | | | | | | | | |
| % Average Annual Total Returns | | Class
Inception Date | | | Performance Inception Date | | | One Year | | | Five Years | | | Since Inception | |
Investor Class at NAV | | | 06/30/2006 | | | | 06/30/2006 | | | | –6.62 | % | | | 15.83 | % | | | 5.64 | % |
Class C at NAV | | | 06/30/2006 | | | | 06/30/2006 | | | | –7.27 | | | | 15.01 | | | | 4.85 | |
Class C with 1% Maximum Sales Charge | | | — | | | | — | | | | –8.20 | | | | 15.01 | | | | 4.85 | |
Institutional Class at NAV | | | 06/30/2006 | | | | 06/30/2006 | | | | –6.42 | | | | 16.16 | | | | 5.89 | |
MSCI Emerging Markets Index | | | — | | | | — | | | | –10.17 | % | | | 14.77 | % | | | 5.44 | % |
| | | | | |
| | | | | | | | | | | | | | | | | | | | |
| % Total Annual Operating Expense Ratios4 | | | | | | | | Investor Class | | | Class C | | | Institutional
Class | |
| | | | | | | | | | | 1.42 | % | | | 2.16 | % | | | 1.16 | % |
Growth of $10,000
This graph shows the change in value of a hypothetical investment of $10,000 in Investor Class of the Fund for the period indicated. For comparison, the same investment is shown in the indicated index.
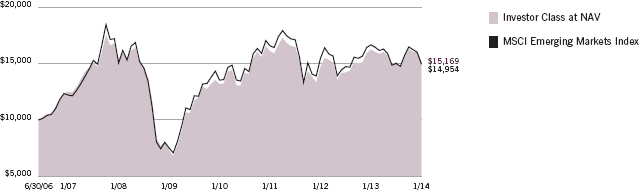
| | | | | | | | |
| Growth of Investment | | Amount Invested | | Period Beginning | | At NAV | | With Maximum Sales Charge |
Class C | | $10,000 | | 06/30/2006 | | $14,328 | | N.A. |
Institutional Class | | $50,000 | | 06/30/2006 | | $77,240 | | N.A. |
See Endnotes and Additional Disclosures in this report.
Past performance is no guarantee of future results. Returns are historical and are calculated by determining the percentage change in net asset value (NAV) or offering price (as applicable) with all distributions reinvested. Investment return and principal value will fluctuate so that shares, when redeemed, may be worth more or less than their original cost. Performance less than one year is cumulative. Performance is for the stated time period only; due to market volatility, the Fund’s current performance may be lower or higher than quoted. Returns are before taxes unless otherwise noted. For performance as of the most recent month end, please refer to eatonvance.com.
Parametric Emerging Markets Fund
January 31, 2014
Fund Profile
Sector Allocation (% of net assets)5
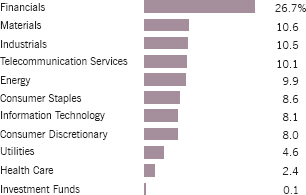
Geographic Allocation (% of common stocks)
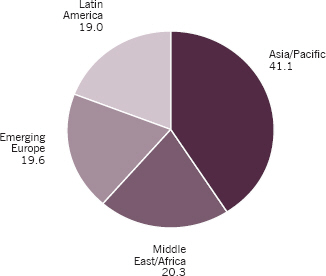
Top 10 Holdings (% of net assets)5
| | | | |
Samsung Electronics Co., Ltd. | | | 1.0 | % |
MTN Group, Ltd. | | | 1.0 | |
OAO Gazprom ADR | | | 0.9 | |
China Mobile, Ltd. | | | 0.7 | |
Tencent Holdings, Ltd. | | | 0.7 | |
America Movil SAB de CV, Series L | | | 0.7 | |
Naspers, Ltd., Class N | | | 0.7 | |
Infosys, Ltd. | | | 0.6 | |
LUKOIL OAO ADR | | | 0.6 | |
CEZ AS | | | 0.6 | |
Total | | | 7.5 | % |
See Endnotes and Additional Disclosures in this report.
Parametric Emerging Markets Fund
January 31, 2014
Endnotes and Additional Disclosures
| 1 | The views expressed in this report are those of the portfolio manager(s) and are current only through the date stated at the top of this page. These views are subject to change at any time based upon market or other conditions, and Eaton Vance and the Fund(s) disclaim any responsibility to update such views. These views may not be relied upon as investment advice and, because investment decisions are based on many factors, may not be relied upon as an indication of trading intent on behalf of any Eaton Vance fund. This commentary may contain statements that are not historical facts, referred to as “forward looking statements”. The Fund’s actual future results may differ significantly from those stated in any forward looking statement, depending on factors such as changes in securities or financial markets or general economic conditions, the volume of sales and purchases of Fund shares, the continuation of investment advisory, administrative and service contracts, and other risks discussed from time to time in the Fund’s filings with the Securities and Exchange Commission. |
| 2 | MSCI All Country World Index is an unmanaged free float-adjusted market-capitalization-weighted index designed to measure the equity market performance of developed and emerging markets. MSCI Emerging Markets Index is an unmanaged index of emerging markets common stocks. MSCI Golden Dragon Index is an unmanaged index of common stocks traded in China, Hong Kong and Taiwan. MSCI indices are net of foreign withholding taxes. Source: MSCI. MSCI data may not be reproduced or used for any other purpose. MSCI provides no warranties, has not prepared or approved this report, and has no liability hereunder. S&P 500 Index is an unmanaged index of large-cap stocks commonly used as a measure of U.S. stock market performance. FTSE Eurotop 100 Index is a tradable index designed to represent the performance of the 100 most highly capitalized blue-chip companies in Europe. The return for the FTSE Eurotop 100 Index is calculated in U.S. dollars. Nikkei-225 Stock Average is an unmanaged, price- weighted average of 225 top-rated Japanese companies listed in the First Section of the Tokyo Stock Exchange. Unless otherwise stated, index returns do not reflect the effect of any applicable sales charges, commissions, expenses, taxes or leverage, as applicable. It is not possible to invest directly in an index. |
| 3 | Total Returns at NAV do not include applicable sales charges. If sales charges were deducted, the returns would be lower. Total Returns shown with maximum sales charge reflect the stated maximum sales charge. Unless otherwise stated, performance does not reflect the deduction of taxes on Fund distributions or redemptions of Fund shares. Performance since inception for an index, if presented, is the performance since the Fund’s or oldest share class’ inception, as applicable. |
| 4 | Source: Fund prospectus. |
| 5 | Excludes cash and cash equivalents. |
| | Fund profile subject to change due to active management. |
Parametric Emerging Markets Fund
January 31, 2014
Fund Expenses
Example: As a Fund shareholder, you incur two types of costs: (1) transaction costs, including sales charges (loads) on purchases and redemption fees (if applicable); and (2) ongoing costs, including management fees; distribution and/or service fees; and other Fund expenses. This Example is intended to help you understand your ongoing costs (in dollars) of Fund investing and to compare these costs with the ongoing costs of investing in other mutual funds. The Example is based on an investment of $1,000 invested at the beginning of the period and held for the entire period (August 1, 2013 – January 31, 2014).
Actual Expenses: The first section of the table below provides information about actual account values and actual expenses. You may use the information in this section, together with the amount you invested, to estimate the expenses that you paid over the period. Simply divide your account value by $1,000 (for example, an $8,600 account value divided by $1,000 = 8.6), then multiply the result by the number in the first section under the heading entitled “Expenses Paid During Period” to estimate the expenses you paid on your account during this period.
Hypothetical Example for Comparison Purposes: The second section of the table below provides information about hypothetical account values and hypothetical expenses based on the actual Fund expense ratio and an assumed rate of return of 5% per year (before expenses), which is not the actual Fund return. The hypothetical account values and expenses may not be used to estimate the actual ending account balance or expenses you paid for the period. You may use this information to compare the ongoing costs of investing in your Fund and other funds. To do so, compare this 5% hypothetical example with the 5% hypothetical examples that appear in the shareholder reports of the other funds.
Please note that the expenses shown in the table are meant to highlight your ongoing costs only and do not reflect any transactional costs, such as sales charges (loads) or redemption fees (if applicable). Therefore, the second section of the table is useful in comparing ongoing costs only, and will not help you determine the relative total costs of owning different funds. In addition, if these transactional costs were included, your costs would be higher.
| | | | | | | | | | | | | | | | |
| | | Beginning
Account Value
(8/1/13) | | | Ending
Account Value
(1/31/14) | | | Expenses Paid
During Period*
(8/1/13 – 1/31/14) | | | Annualized
Expense
Ratio | |
| | | | |
| | | | | | | | | | | | | | | | |
Actual | | | | | | | | | | | | | | | | |
Investor Class | | $ | 1,000.00 | | | $ | 1,002.70 | | | $ | 6.92 | | | | 1.37 | % |
Class C | | $ | 1,000.00 | | | $ | 999.30 | | | $ | 10.68 | | | | 2.12 | % |
Institutional Class | | $ | 1,000.00 | | | $ | 1,004.00 | | | $ | 5.66 | | | | 1.12 | % |
| | | | | | | | | | | | | | | | | |
| | | | |
| | | | | | | | | | | | | | | | |
Hypothetical | | | | | | | | | | | | | | | | |
(5% return per year before expenses) | | | | | | | | | | | | | | | | |
Investor Class | | $ | 1,000.00 | | | $ | 1,018.30 | | | $ | 6.97 | | | | 1.37 | % |
Class C | | $ | 1,000.00 | | | $ | 1,014.50 | | | $ | 10.76 | | | | 2.12 | % |
Institutional Class | | $ | 1,000.00 | | | $ | 1,019.60 | | | $ | 5.70 | | | | 1.12 | % |
| * | Expenses are equal to the Fund’s annualized expense ratio for the indicated Class, multiplied by the average account value over the period, multiplied by 184/365 (to reflect the one-half year period). The Example assumes that the $1,000 was invested at the net asset value per share determined at the close of business on July 31, 2013. |
Parametric Emerging Markets Fund
January 31, 2014
Portfolio of Investments
| | | | | | | | |
| Common Stocks — 98.6% | | | | | | | | |
| | |
| | | | | | | | |
| Security | | Shares | | | Value | |
| | | | | | | | |
| | |
Argentina — 0.6% | | | | | | | | |
Adecoagro SA(1) | | | 77,700 | | | $ | 583,527 | |
Arcos Dorados Holdings, Inc., Class A | | | 341,000 | | | | 3,021,260 | |
Banco Macro SA, Class B ADR(1) | | | 87,487 | | | | 1,590,514 | |
BBVA Banco Frances SA ADR(1) | | | 200,488 | | | | 1,166,840 | |
Cresud SA ADR | | | 202,530 | | | | 1,739,733 | |
Grupo Financiero Galicia SA, Class B ADR | | | 205,600 | | | | 1,634,520 | |
IRSA Inversiones y Representaciones SA ADR | | | 61,510 | | | | 598,492 | |
MercadoLibre, Inc. | | | 69,300 | | | | 6,686,757 | |
Pampa Energia SA ADR(1) | | | 188,600 | | | | 782,690 | |
Petrobras Energia SA ADR | | | 750,308 | | | | 3,533,951 | |
Telecom Argentina SA ADR | | | 385,251 | | | | 5,871,225 | |
| | | | | | | | | |
| | | | | | $ | 27,209,509 | |
| | | | | | | | | |
| | |
Bahrain — 0.2% | | | | | | | | |
Ahli United Bank BSC | | | 740,000 | | | $ | 585,931 | |
Al-Salam Bank | | | 7,121,118 | | | | 3,038,094 | |
Gulf Finance House EC(1) | | | 11,304,802 | | | | 2,628,125 | |
Ithmaar Bank BSC(1) | | | 4,240,000 | | | | 1,019,159 | |
| | | | | | | | | |
| | | | | | $ | 7,271,309 | |
| | | | | | | | | |
| | |
Bangladesh — 0.7% | | | | | | | | |
Aftab Automobiles, Ltd. | | | 783,888 | | | $ | 913,754 | |
Bangladesh Export Import Co., Ltd.(1) | | | 6,237,700 | | | | 2,917,098 | |
Beximco Pharmaceuticals, Ltd.(1) | | | 852,550 | | | | 593,243 | |
BSRM Steels, Ltd. | | | 1,709,000 | | | | 1,833,131 | |
City Bank, Ltd. (The)(1) | | | 4,429,900 | | | | 1,215,261 | |
Grameenphone, Ltd. | | | 988,000 | | | | 2,687,920 | |
Islami Bank Bangladesh, Ltd. | | | 2,337,100 | | | | 1,053,278 | |
Khulna Power Co., Ltd. | | | 736,100 | | | | 575,197 | |
Lankabangla Finance, Ltd.(1) | | | 1,845,500 | | | | 1,895,002 | |
Malek Spinning Mills, Ltd. | | | 897,500 | | | | 340,309 | |
National Bank, Ltd. | | | 9,487,100 | | | | 1,735,818 | |
People’s Leasing and Financial Services, Ltd.(1) | | | 2,043,800 | | | | 730,029 | |
Pubali Bank, Ltd. | | | 1,789,325 | | | | 905,090 | |
Social Islami Bank, Ltd. | | | 4,105,750 | | | | 756,380 | |
Square Pharmaceuticals, Ltd. | | | 1,331,525 | | | | 3,933,659 | |
Summit Power, Ltd.(1) | | | 1,293,300 | | | | 798,981 | |
Titas Gas Transmission & Distribution Co., Ltd. | | | 2,596,000 | | | | 2,746,598 | |
United Airways Bangladesh, Ltd.(1) | | | 6,135,968 | | | | 1,388,389 | |
United Commercial Bank, Ltd. | | | 7,394,000 | | | | 2,993,043 | |
| | | | | | | | | |
| | | | | | $ | 30,012,180 | |
| | | | | | | | | |
| | | | | | | | |
| Security | | Shares | | | Value | |
| | | | | | | | |
| | |
Botswana — 0.2% | | | | | | | | |
Barclays Bank of Botswana | | | 1,137,465 | | | $ | 621,718 | |
Botswana Insurance Holdings Ltd. | | | 575,111 | | | | 672,882 | |
First National Bank of Botswana | | | 6,069,100 | | | | 2,760,449 | |
Letshego Holdings, Ltd. | | | 12,485,691 | | | | 3,280,895 | |
Sechaba Breweries Ltd. | | | 905,550 | | | | 2,033,267 | |
Standard Chartered Bank Botswana | | | 531,120 | | | | 684,467 | |
| | | | | | | | | |
| | | | | | $ | 10,053,678 | |
| | | | | | | | | |
| | |
Brazil — 5.6% | | | | | | | | |
AES Tiete SA, PFC Shares | | | 189,400 | | | $ | 1,481,539 | |
All America Latina Logistica SA (Units) | | | 669,600 | | | | 1,821,380 | |
AMBEV SA | | | 2,158,450 | | | | 14,323,173 | |
AMBEV SA ADR | | | 141,760 | | | | 941,825 | |
Anhanguera Educacional Participacoes SA | | | 307,100 | | | | 1,615,306 | |
B2W Companhia Global do Varejo(1) | | | 176,170 | | | | 1,691,150 | |
Banco Bradesco SA ADR, PFC Shares | | | 67,291 | | | | 708,574 | |
Banco Bradesco SA, PFC Shares | | | 1,193,731 | | | | 12,891,287 | |
Banco do Brasil SA | | | 561,098 | | | | 4,826,384 | |
Banco do Estado do Rio Grande do Sul, PFC Shares | | | 164,900 | | | | 718,357 | |
Banco Santander Brasil SA | | | 533,700 | | | | 2,484,992 | |
BM&F Bovespa SA | | | 962,351 | | | | 3,797,029 | |
BR Malls Participacoes SA | | | 296,000 | | | | 1,856,935 | |
BR Properties SA | | | 153,300 | | | | 1,080,656 | |
Bradespar SA, PFC Shares | | | 121,000 | | | | 1,112,894 | |
Braskem SA, PFC Shares | | | 89,760 | | | | 689,189 | |
BRF-Brasil Foods SA | | | 338,540 | | | | 6,059,280 | |
BRF-Brasil Foods SA ADR | | | 19,900 | | | | 351,832 | |
Brookfield Incorporacoes SA(1) | | | 842,100 | | | | 461,887 | |
Centrais Eletricas Brasileiras SA | | | 471,100 | | | | 1,831,723 | |
CETIP SA - Mercados Organizados | | | 173,900 | | | | 1,664,173 | |
Cia Brasileira de Distribuicao Grupo Pao de Acucar, PFC Shares | | | 63,069 | | | | 2,428,349 | |
Cia de Concessoes Rodoviarias SA (CCR) | | | 953,100 | | | | 6,113,816 | |
Cia de Saneamento Basico do Estado de Sao Paulo | | | 393,660 | | | | 3,624,820 | |
Cia de Saneamento de Minas Gerais-COPASA | | | 72,900 | | | | 952,066 | |
Cia de Transmissao de Energia Eletrica Paulista, PFC Shares | | | 49,290 | | | | 497,531 | |
Cia Energetica de Minas Gerais SA ADR | | | 84,265 | | | | 486,210 | |
Cia Energetica de Minas Gerais SA, PFC Shares | | | 693,855 | | | | 3,992,887 | |
Cia Energetica de Sao Paulo, PFC Shares | | | 228,700 | | | | 2,187,633 | |
Cia Hering | | | 102,400 | | | | 1,136,672 | |
Cia Paranaense de Energia-Copel, PFC Shares | | | 123,300 | | | | 1,415,537 | |
Cia Siderurgica Nacional SA | | | 365,800 | | | | 1,686,893 | |
Cielo SA | | | 409,699 | | | | 10,851,448 | |
Contax Participacoes SA, PFC Shares | | | 121,500 | | | | 175,927 | |
Cosan SA Industria e Comercio | | | 53,700 | | | | 799,694 | |
| | | | |
| | 7 | | See Notes to Financial Statements. |
Parametric Emerging Markets Fund
January 31, 2014
Portfolio of Investments — continued
| | | | | | | | |
| Security | | Shares | | | Value | |
| | | | | | | | |
| | |
Brazil (continued) | | | | | | | | |
CPFL Energia SA | | | 242,100 | | | $ | 1,821,111 | |
Cyrela Brazil Realty SA | | | 221,300 | | | | 1,305,341 | |
Diagnosticos da America SA | | | 215,900 | | | | 1,327,018 | |
Duratex SA | | | 102,326 | | | | 501,109 | |
EcoRodovias Infraestrutura e Logistica SA | | | 217,700 | | | | 1,107,364 | |
EDP-Energias do Brasil SA | | | 313,400 | | | | 1,251,051 | |
Eletropaulo Metropolitana SA, Class B, PFC Shares | | | 210,580 | | | | 764,877 | |
Embraer SA | | | 418,300 | | | | 3,170,431 | |
Embraer SA ADR | | | 85,948 | | | | 2,637,744 | |
Eneva SA(1) | | | 300,500 | | | | 396,391 | |
Estacio Participacoes SA | | | 167,700 | | | | 1,302,552 | |
Fibria Celulose SA(1) | | | 111,757 | | | | 1,244,331 | |
Gafisa SA | | | 632,800 | | | | 803,473 | |
Gerdau SA, PFC Shares | | | 428,500 | | | | 3,027,516 | |
Gol Linhas Aereas Inteligentes SA, PFC Shares | | | 204,000 | | | | 799,421 | |
Hypermarcas SA | | | 267,800 | | | | 1,683,051 | |
Iochpe-Maxion SA | | | 115,700 | | | | 1,165,180 | |
Itau Unibanco Holding SA ADR, PFC Shares | | | 78,727 | | | | 963,618 | |
Itau Unibanco Holding SA, PFC Shares | | | 1,093,590 | | | | 13,634,490 | |
Itausa-Investimentos Itau SA, PFC Shares | | | 2,081,181 | | | | 7,222,009 | |
JBS SA | | | 583,825 | | | | 2,035,950 | |
Klabin SA, PFC Shares | | | 260,000 | | | | 1,326,477 | |
Kroton Educacional SA | | | 54,900 | | | | 836,038 | |
Light SA | | | 132,200 | | | | 1,046,267 | |
LLX Logistica SA(1) | | | 1,596,000 | | | | 638,348 | |
Localiza Rent a Car SA | | | 157,980 | | | | 1,995,226 | |
Lojas Americanas SA, PFC Shares | | | 340,423 | | | | 2,066,984 | |
Lojas Renner SA | | | 78,300 | | | | 1,792,225 | |
Marcopolo SA, PFC Shares | | | 950,200 | | | | 2,041,521 | |
Marfrig Global Foods SA(1) | | | 287,155 | | | | 493,744 | |
Metalurgica Gerdau SA, PFC Shares | | | 148,000 | | | | 1,310,936 | |
MMX Mineracao e Metalicos SA(1) | | | 138,467 | | | | 212,137 | |
MRV Engenharia e Participacoes SA | | | 338,300 | | | | 1,151,650 | |
Natura Cosmeticos SA | | | 120,900 | | | | 1,958,386 | |
OGX Petroleo e Gas Participacoes SA(1) | | | 1,965,400 | | | | 245,659 | |
Oi SA ADR | | | 190,200 | | | | 325,242 | |
Oi SA, PFC Shares | | | 1,257,857 | | | | 2,161,905 | |
PDG Realty SA Empreendimentos e Participacoes(1) | | | 1,224,600 | | | | 844,232 | |
Petroleo Brasileiro SA | | | 43,200 | | | | 243,640 | |
Petroleo Brasileiro SA ADR | | | 71,900 | | | | 855,610 | |
Petroleo Brasileiro SA, PFC Shares | | | 3,018,600 | | | | 18,247,078 | |
Randon Participacoes SA, PFC Shares | | | 242,800 | | | | 936,458 | |
Rossi Residencial SA(1) | | | 716,100 | | | | 573,966 | |
Souza Cruz SA | | | 228,000 | | | | 1,995,716 | |
Suzano Papel e Celulose SA | | | 437,425 | | | | 1,722,595 | |
Telefonica Brasil SA, PFC Shares | | | 304,426 | | | | 5,759,270 | |
| | | | | | | | |
| Security | | Shares | | | Value | |
| | | | | | | | |
| | |
Brazil (continued) | | | | | | | | |
Tim Participacoes SA | | | 944,227 | | | $ | 4,939,720 | |
Totvs SA | | | 191,090 | | | | 2,500,444 | |
Tractebel Energia SA | | | 154,500 | | | | 2,208,271 | |
Ultrapar Participacoes SA | | | 184,384 | | | | 4,061,525 | |
Usinas Siderurgicas de Minas Gerais SA, PFC Shares | | | 283,250 | | | | 1,392,774 | |
Vale SA | | | 34,400 | | | | 467,464 | |
Vale SA ADR | | | 65,300 | | | | 888,080 | |
Vale SA, PFC Shares | | | 1,468,440 | | | | 18,165,672 | |
Weg SA | | | 236,900 | | | | 2,682,695 | |
| | | | | | | | | |
| | | | | | $ | 235,011,031 | |
| | | | | | | | | |
| | |
Bulgaria — 0.1% | | | | | | | | |
CB First Investment Bank AD(1) | | | 235,000 | | | $ | 505,017 | |
Chimimport AD(1) | | | 329,922 | | | | 462,854 | |
Corporate Commercial Bank AD(1) | | | 10,400 | | | | 620,651 | |
MonBat AD | | | 60,235 | | | | 340,923 | |
Petrol AD(1) | | | 102,500 | | | | 225,437 | |
Sopharma AD | | | 354,600 | | | | 966,973 | |
| | | | | | | | | |
| | | | | | $ | 3,121,855 | |
| | | | | | | | | |
| | |
Chile — 2.8% | | | | | | | | |
AES Gener SA | | | 3,010,000 | | | $ | 1,438,854 | |
Aguas Andinas SA, Series A | | | 3,899,500 | | | | 2,487,344 | |
Almendral SA | | | 2,512,600 | | | | 224,978 | |
Antarchile SA, Series A | | | 173,104 | | | | 2,082,562 | |
Banco de Chile | | | 56,702,280 | | | | 7,012,256 | |
Banco de Chile ADR | | | 7,286 | | | | 533,700 | |
Banco de Credito e Inversiones | | | 88,574 | | | | 4,935,159 | |
Banco Santander Chile SA | | | 134,220,710 | | | | 6,728,772 | |
Banmedica SA | | | 484,730 | | | | 828,406 | |
Besalco SA | | | 1,191,000 | | | | 977,330 | |
Cap SA | | | 164,112 | | | | 2,383,030 | |
Cencosud SA | | | 1,685,831 | | | | 4,760,079 | |
CFR Pharmaceuticals SA | | | 4,417,100 | | | | 893,034 | |
Cia Cervecerias Unidas SA | | | 250,590 | | | | 2,682,229 | |
Cia General de Electricidad SA | | | 403,219 | | | | 1,827,228 | |
Cia Sud Americana de Vapores SA(1) | | | 14,510,741 | | | | 594,450 | |
Colbun SA | | | 9,412,410 | | | | 2,192,967 | |
Corpbanca SA | | | 395,674,470 | | | | 4,341,172 | |
E.CL SA | | | 693,400 | | | | 838,321 | |
Embotelladora Andina SA, Class B, PFC Shares | | | 315,241 | | | | 1,181,797 | |
Empresa Nacional de Electricidad SA | | | 4,554,263 | | | | 5,855,018 | |
Empresas CMPC SA | | | 2,182,420 | | | | 4,714,140 | |
Empresas Copec SA | | | 893,176 | | | | 10,169,162 | |
Empresas La Polar SA(1) | | | 1,713,400 | | | | 151,159 | |
| | | | |
| | 8 | | See Notes to Financial Statements. |
Parametric Emerging Markets Fund
January 31, 2014
Portfolio of Investments — continued
| | | | | | | | |
| Security | | Shares | | | Value | |
| | | | | | | | |
| | |
Chile (continued) | | | | | | | | |
Enersis SA | | | 25,224,721 | | | $ | 6,643,376 | |
ENTEL SA | | | 157,000 | | | | 1,902,314 | |
Grupo Security SA | | | 3,397,289 | | | | 1,120,229 | |
Inversiones Aguas Metropolitanas SA | | | 614,900 | | | | 993,256 | |
Inversiones La Construccion SA | | | 54,000 | | | | 636,864 | |
Invexans SA | | | 5,047,652 | | | | 90,463 | |
Latam Airlines Group SA | | | 362,395 | | | | 5,030,481 | |
Latam Airlines Group SA BDR | | | 28,260 | | | | 413,375 | |
Madeco SA(1) | | | 5,047,652 | | | | 28,943 | |
Molibdenos y Metales SA | | | 65,700 | | | | 913,303 | |
Parque Arauco SA | | | 1,208,000 | | | | 2,062,465 | |
Quinenco SA | | | 359,844 | | | | 787,093 | |
Ripley Corp. SA | | | 1,255,600 | | | | 703,474 | |
S.A.C.I. Falabella SA | | | 1,390,300 | | | | 10,838,384 | |
Salfacorp SA | | | 1,726,600 | | | | 1,478,360 | |
Sigdo Koppers SA | | | 1,000,231 | | | | 1,406,385 | |
Sociedad de Inversiones Pampa Calichera SA, Class A | | | 219,730 | | | | 175,677 | |
Sociedad Matriz SAAM SA | | | 6,242,812 | | | | 512,124 | |
Sociedad Quimica y Minera de Chile SA, Series B | | | 212,340 | | | | 5,311,106 | |
Socovesa SA | | | 1,443,206 | | | | 298,106 | |
Sonda SA | | | 2,150,500 | | | | 4,260,034 | |
Vina Concha y Toro SA | | | 727,222 | | | | 1,320,558 | |
| | | | | | | | | |
| | | | | | $ | 116,759,517 | |
| | | | | | | | | |
| | |
China — 8.9% | | | | | | | | |
Agile Property Holdings, Ltd. | | | 1,096,000 | | | $ | 1,003,734 | |
Agricultural Bank of China, Ltd., Class H | | | 7,395,000 | | | | 3,228,272 | |
Air China, Ltd., Class H | | | 2,310,000 | | | | 1,504,323 | |
Aluminum Corp. of China, Ltd., Class H(1) | | | 3,374,000 | | | | 1,200,338 | |
Angang Steel Co., Ltd., Class H(1) | | | 1,226,000 | | | | 781,557 | |
Anhui Conch Cement Co., Ltd., Class H | | | 906,500 | | | | 3,496,667 | |
Anta Sports Products, Ltd. | | | 1,021,000 | | | | 1,490,816 | |
Baidu, Inc. ADR(1) | | | 92,500 | | | | 14,476,250 | |
Bank of China, Ltd., Class H | | | 21,583,000 | | | | 9,109,753 | |
Bank of Communications, Ltd., Class H | | | 3,583,900 | | | | 2,323,305 | |
Beijing Capital International Airport Co., Ltd., Class H | | | 1,568,000 | | | | 1,193,249 | |
Beijing Enterprises Holdings, Ltd. | | | 309,500 | | | | 2,608,881 | |
Belle International Holdings, Ltd. | | | 1,079,000 | | | | 1,172,551 | |
BYD Co., Ltd., Class H(1) | | | 607,200 | | | | 2,878,074 | |
Chaoda Modern Agriculture Holdings, Ltd.(1)(2) | | | 2,391,958 | | | | 0 | |
China Agri-Industries Holdings, Ltd. | | | 2,074,000 | | | | 916,106 | |
China Bluechemical, Ltd., Class H | | | 1,270,000 | | | | 697,934 | |
China CITIC Bank Corp., Ltd., Class H | | | 4,367,000 | | | | 2,089,132 | |
China Coal Energy Co., Class H | | | 3,400,000 | | | | 1,701,365 | |
| | | | | | | | |
| Security | | Shares | | | Value | |
| | | | | | | | |
| | |
China (continued) | | | | | | | | |
China Communications Construction Co., Ltd., Class H | | | 2,930,000 | | | $ | 2,132,231 | |
China Communications Services Corp., Ltd., Class H | | | 2,540,000 | | | | 1,372,516 | |
China Construction Bank Corp., Class H | | | 25,662,630 | | | | 17,777,683 | |
China COSCO Holdings Co., Ltd., Class H(1) | | | 2,694,975 | | | | 1,135,572 | |
China Dongxiang (Group) Co., Ltd. | | | 4,257,000 | | | | 828,258 | |
China Eastern Airlines Corp., Ltd., Class H(1) | | | 1,120,000 | | | | 380,497 | |
China Everbright International, Ltd. | | | 1,986,000 | | | | 2,608,627 | |
China Everbright, Ltd. | | | 536,000 | | | | 728,808 | |
China High Speed Transmission Equipment Group Co., Ltd.(1) | | | 2,184,000 | | | | 1,321,503 | |
China International Marine Containers Co., Ltd., Class B | | | 482,672 | | | | 1,116,873 | |
China Life Insurance Co., Ltd., Class H | | | 2,263,000 | | | | 6,159,579 | |
China Longyuan Power Group Corp., Class H | | | 2,266,000 | | | | 2,726,017 | |
China Mengniu Dairy Co., Ltd. | | | 960,000 | | | | 4,403,316 | |
China Merchants Bank Co., Ltd., Class H | | | 1,723,524 | | | | 3,035,844 | |
China Merchants Holdings (International) Co., Ltd. | | | 710,035 | | | | 2,425,332 | |
China Minsheng Banking Corp., Ltd., Class H | | | 2,080,700 | | | | 2,031,813 | |
China Mobile, Ltd. | | | 3,222,000 | | | | 30,766,111 | |
China National Building Material Co., Ltd., Class H | | | 2,124,000 | | | | 2,039,291 | |
China Oilfield Services, Ltd., Class H | | | 1,090,000 | | | | 2,902,111 | |
China Overseas Land & Investment, Ltd. | | | 1,530,160 | | | | 4,107,479 | |
China Pacific Insurance (Group) Co., Ltd., Class H | | | 848,000 | | | | 3,063,018 | |
China Petroleum & Chemical Corp., Class H | | | 13,122,300 | | | | 10,348,446 | |
China Pharmaceutical Group, Ltd. | | | 1,402,000 | | | | 1,171,445 | |
China Railway Construction Corp., Class H | | | 1,592,000 | | | | 1,334,285 | |
China Railway Group, Ltd., Class H | | | 3,177,000 | | | | 1,404,073 | |
China Resources Enterprise, Ltd. | | | 842,000 | | | | 2,504,812 | |
China Resources Gas Group, Ltd. | | | 642,000 | | | | 1,982,485 | |
China Resources Land, Ltd. | | | 954,000 | | | | 2,240,744 | |
China Resources Power Holdings Co., Ltd. | | | 1,365,600 | | | | 3,246,735 | |
China Shenhua Energy Co., Ltd., Class H | | | 2,164,500 | | | | 5,555,708 | |
China Shineway Pharmaceutical Group, Ltd. | | | 381,000 | | | | 562,582 | |
China Shipping Container Lines Co., Ltd., Class H(1) | | | 4,252,000 | | | | 1,000,148 | |
China Shipping Development Co., Ltd., Class H(1) | | | 1,702,000 | | | | 1,021,072 | |
China Southern Airlines Co., Ltd., Class H | | | 2,700,000 | | | | 934,566 | |
China Taiping Insurance Holdings Co., Ltd.(1) | | | 573,400 | | | | 998,869 | |
China Telecom Corp., Ltd., Class H | | | 9,130,000 | | | | 4,160,016 | |
China Travel International Investment Hong Kong, Ltd. | | | 4,692,000 | | | | 894,288 | |
China Unicom (Hong Kong), Ltd. | | | 3,210,372 | | | | 4,177,828 | |
China Vanke Co., Ltd., Class B | | | 667,820 | | | | 1,108,552 | |
China Yurun Food Group, Ltd.(1) | | | 1,776,000 | | | | 1,045,430 | |
China Zhongwang Holdings, Ltd.(1) | | | 464,000 | | | | 137,273 | |
Chongqing Changan Automobile Co., Ltd., Class B | | | 1,100,286 | | | | 1,986,170 | |
Citic Pacific, Ltd. | | | 1,152,000 | | | | 1,440,009 | |
CNOOC, Ltd. | | | 8,070,000 | | | | 12,535,239 | |
| | | | |
| | 9 | | See Notes to Financial Statements. |
Parametric Emerging Markets Fund
January 31, 2014
Portfolio of Investments — continued
| | | | | | | | |
| Security | | Shares | | | Value | |
| | | | | | | | |
| | |
China (continued) | | | | | | | | |
Cosco Pacific, Ltd. | | | 1,516,000 | | | $ | 1,945,652 | |
Country Garden Holdings Co. | | | 3,294,631 | | | | 1,791,748 | |
Ctrip.com International, Ltd. ADR(1) | | | 140,100 | | | | 5,535,351 | |
Datang International Power Generation Co., Ltd., Class H | | | 3,414,000 | | | | 1,366,835 | |
Dongfeng Motor Group Co., Ltd., Class H | | | 1,966,000 | | | | 2,894,773 | |
Golden Eagle Retail Group, Ltd. | | | 739,000 | | | | 1,009,131 | |
Great Wall Motor Co., Ltd., Class H | | | 862,500 | | | | 4,103,447 | |
Guangdong Investment, Ltd. | | | 2,022,000 | | | | 1,865,183 | |
Guangzhou Automobile Group Co., Ltd., Class H | | | 1,892,013 | | | | 1,894,497 | |
Guangzhou R&F Properties Co., Ltd., Class H | | | 682,000 | | | | 908,362 | |
Hengan International Group Co., Ltd. | | | 149,500 | | | | 1,613,996 | |
Hengdeli Holdings, Ltd. | | | 2,681,800 | | | | 563,413 | |
Hidili Industry International Development, Ltd.(1) | | | 594,000 | | | | 75,200 | |
Home Inns & Hotels Management, Inc. ADR(1) | | | 10,800 | | | | 370,332 | |
Huaneng Power International, Inc., Class H | | | 2,746,000 | | | | 2,567,371 | |
Industrial & Commercial Bank of China, Ltd., Class H | | | 25,680,000 | | | | 15,866,164 | |
Inner Mongolia Eerduosi Cashmere Products Co., Ltd., Class B | | | 401,700 | | | | 369,255 | |
Inner Mongolia Yitai Coal Co., Ltd., Class B | | | 669,000 | | | | 1,040,053 | |
Jiangsu Expressway Co., Ltd., Class H | | | 1,152,000 | | | | 1,453,683 | |
Jiangxi Copper Co., Ltd., Class H | | | 1,092,000 | | | | 1,965,493 | |
Kingboard Chemical Holdings, Ltd. | | | 648,600 | | | | 1,451,205 | |
Kunlun Energy Co., Ltd. | | | 2,206,000 | | | | 3,652,925 | |
Lee & Man Paper Manufacturing, Ltd. | | | 1,220,000 | | | | 815,325 | |
Lenovo Group, Ltd. | | | 3,736,000 | | | | 4,818,303 | |
Li Ning Co., Ltd.(1) | | | 255,500 | | | | 204,584 | |
Maanshan Iron & Steel Co., Ltd., Class H(1) | | | 2,294,000 | | | | 557,946 | |
Mindray Medical International, Ltd. ADR | | | 59,100 | | | | 2,070,864 | |
NetEase.com, Inc. ADR(1) | | | 24,700 | | | | 1,851,759 | |
New Oriental Education & Technology Group, Inc. ADR | | | 380,400 | | | | 11,160,936 | |
Nine Dragons Paper Holdings, Ltd. | | | 1,753,000 | | | | 1,501,729 | |
PetroChina Co., Ltd., Class H | | | 10,618,000 | | | | 10,235,820 | |
PICC Property & Casualty Co., Ltd., Class H | | | 1,228,000 | | | | 1,662,013 | |
Ping An Insurance (Group) Co. of China, Ltd., Class H | | | 610,000 | | | | 4,925,997 | |
Poly Property Group Co., Ltd. | | | 1,918,000 | | | | 914,101 | |
Renhe Commercial Holdings Co., Ltd.(1) | | | 6,322,000 | | | | 310,466 | |
Semiconductor Manufacturing International Corp.(1) | | | 23,397,000 | | | | 2,371,105 | |
Shandong Weigao Group Medical Polymer Co., Ltd., Class H | | | 1,396,000 | | | | 1,645,482 | |
Shanghai Electric Group Co., Ltd., Class H | | | 2,414,000 | | | | 770,855 | |
Shanghai Industrial Holdings, Ltd. | | | 304,000 | | | | 1,012,997 | |
Shimao Property Holdings, Ltd. | | | 665,000 | | | | 1,450,805 | |
SINA Corp.(1) | | | 22,900 | | | | 1,492,851 | |
Sino Biopharmaceutical, Ltd. | | | 2,052,000 | | | | 1,726,833 | |
Sino-Ocean Land Holdings, Ltd. | | | 1,720,500 | | | | 928,892 | |
| | | | | | | | |
| Security | | Shares | | | Value | |
| | | | | | | | |
| | |
China (continued) | | | | | | | | |
Sinopec Shanghai Petrochemical Co., Ltd., Class H | | | 2,931,000 | | | $ | 826,183 | |
Sinopharm Group Co., Ltd., Class H | | | 374,800 | | | | 1,052,160 | |
Sinotrans Shipping, Ltd. | | | 1,000,000 | | | | 327,032 | |
Sohu.com, Inc.(1) | | | 10,300 | | | | 749,634 | |
Sun Art Retail Group, Ltd. | | | 1,476,000 | | | | 1,932,484 | |
Tencent Holdings, Ltd. | | | 423,000 | | | | 29,629,195 | |
Tingyi (Cayman Islands) Holding Corp. | | | 1,266,000 | | | | 3,275,452 | |
Tsingtao Brewery Co., Ltd., Class H | | | 254,000 | | | | 1,861,369 | |
Want Want China Holdings, Ltd. | | | 3,750,000 | | | | 5,049,149 | |
Weichai Power Co., Ltd., Class H | | | 456,400 | | | | 1,734,296 | |
Wumart Stores, Inc., Class H | | | 321,000 | | | | 410,664 | |
WuXi PharmaTech (Cayman), Inc. ADR(1) | | | 61,900 | | | | 2,160,310 | |
Yangzijiang Shipbuilding Holdings, Ltd. | | | 1,809,000 | | | | 1,628,267 | |
Yantai Changyu Pioneer Wine Co., Ltd., Class B | | | 144,216 | | | | 368,159 | |
Yanzhou Coal Mining Co., Ltd., Class H | | | 1,764,000 | | | | 1,320,708 | |
Zhaojin Mining Industry Co., Ltd., Class H | | | 1,140,000 | | | | 665,189 | |
Zhejiang Expressway Co., Ltd., Class H | | | 1,404,000 | | | | 1,260,280 | |
Zhuzhou CSR Times Electric Co., Ltd., Class H | | | 513,000 | | | | 1,585,191 | |
Zijin Mining Group Co., Ltd., Class H | | | 6,290,000 | | | | 1,336,107 | |
ZTE Corp., Class H(1) | | | 730,753 | | | | 1,515,475 | |
| | | | | | | | | |
| | | | | | $ | 372,146,597 | |
| | | | | | | | | |
| | |
Colombia — 1.4% | | | | | | | | |
Almacenes Exito SA | | | 452,090 | | | $ | 5,942,872 | |
Banco Davivienda SA, PFC Shares | | | 154,200 | | | | 1,636,906 | |
Banco de Bogota | | | 91,067 | | | | 2,999,541 | |
Bancolombia SA ADR, PFC Shares | | | 145,000 | | | | 6,371,300 | |
Bolsa de Valores de Colombia | | | 46,242,700 | | | | 497,770 | |
Celsia SA ESP | | | 809,070 | | | | 2,050,844 | |
Cementos Argos SA | | | 476,640 | | | | 1,969,523 | |
Corporacion Financiera Colombiana SA | | | 97,625 | | | | 1,719,155 | |
Ecopetrol SA | | | 4,701,790 | | | | 8,209,780 | |
Empresa de Energia de Bogota SA | | | 3,474,085 | | | | 2,300,633 | |
Empresa de Telecommunicaciones de Bogota SA | | | 2,532,380 | | | | 502,475 | |
Fabricato SA(1) | | | 36,122,860 | | | | 257,134 | |
Grupo Argos SA | | | 346,150 | | | | 3,090,740 | |
Grupo Argos SA, PFC Shares | | | 108,995 | | | | 982,938 | |
Grupo Aval Acciones y Valores SA | | | 3,145,485 | | | | 1,786,565 | |
Grupo Aval Acciones y Valores SA, PFC Shares | | | 5,059,300 | | | | 2,911,213 | |
Grupo de Inversiones Suramericana | | | 254,570 | | | | 3,876,781 | |
Grupo Nutresa SA | | | 482,255 | | | | 5,645,655 | |
Grupo Odinsa SA | | | 150,661 | | | | 597,510 | |
Interconexion Electrica SA | | | 825,160 | | | | 3,037,160 | |
ISAGEN SA ESP | | | 1,935,100 | | | | 2,822,126 | |
| | | | | | | | | |
| | | | | | $ | 59,208,621 | |
| | | | | | | | | |
| | | | |
| | 10 | | See Notes to Financial Statements. |
Parametric Emerging Markets Fund
January 31, 2014
Portfolio of Investments — continued
| | | | | | | | |
| Security | | Shares | | | Value | |
| | | | | | | | |
| | |
Croatia — 0.5% | | | | | | | | |
Adris Grupa DD, PFC Shares | | | 50,044 | | | $ | 2,417,324 | |
Atlantic Grupa DD | | | 5,200 | | | | 682,054 | |
Atlantska Plovidba DD(1) | | | 22,867 | | | | 1,544,424 | |
Croatia Osiguranje DD(1) | | | 500 | | | | 627,693 | |
Dalekovod DD(1) | | | 51,895 | | | | 304,540 | |
Ericsson Nikola Tesla | | | 6,040 | | | | 1,606,879 | |
Hrvatski Telekom DD | | | 199,470 | | | | 5,978,220 | |
INA Industrija Nafte DD | | | 900 | | | | 538,676 | |
Koncar-Elektroindustrija DD | | | 14,719 | | | | 1,825,080 | |
Kras DD(1) | | | 7,262 | | | | 476,613 | |
Petrokemija DD(1) | | | 25,975 | | | | 663,314 | |
Podravka Prehrambena Industrija DD(1) | | | 31,335 | | | | 1,526,086 | |
Privredna Banka Zagreb DD | | | 3,177 | | | | 248,806 | |
Zagrebacka Banka DD | | | 176,195 | | | | 839,904 | |
| | | | | | | | | |
| | | | | | $ | 19,279,613 | |
| | | | | | | | | |
| | |
Czech Republic — 1.6% | | | | | | | | |
CEZ AS | | | 908,060 | | | $ | 22,953,524 | |
Fortuna Entertainment Group NV | | | 246,600 | | | | 1,609,556 | |
Komercni Banka AS | | | 92,864 | | | | 20,145,410 | |
New World Resources PLC, Class A(1) | | | 1,183,100 | | | | 1,001,455 | |
Pegas Nonwovens SA | | | 96,614 | | | | 2,841,393 | |
Philip Morris CR AS | | | 9,113 | | | | 4,870,433 | |
Telefonica 02 Czech Republic AS | | | 544,904 | | | | 7,911,346 | |
Unipetrol AS(1) | | | 617,307 | | | | 4,635,989 | |
| | | | | | | | | |
| | | | | | $ | 65,969,106 | |
| | | | | | | | | |
| | |
Egypt — 2.1% | | | | | | | | |
Alexandria Mineral Oils Co. | | | 193,820 | | | $ | 1,774,280 | |
Amer Group Holding | | | 4,390,500 | | | | 738,999 | |
Arab Cotton Ginning | | | 1,993,380 | | | | 1,339,530 | |
Citadel Capital Co.(1) | | | 2,280,400 | | | | 1,380,218 | |
Commercial International Bank | | | 3,912,306 | | | | 19,310,213 | |
Eastern Tobacco | | | 281,822 | | | | 4,714,715 | |
Egypt Kuwaiti Holding Co. | | | 1,849,596 | | | | 1,867,054 | |
Egyptian Financial Group-Hermes Holding SAE(1) | | | 2,101,605 | | | | 3,462,957 | |
Egyptian Resorts Co.(1) | | | 4,721,950 | | | | 1,048,698 | |
El Ezz Aldekhela Steel Alexa Co. | | | 4,000 | | | | 409,950 | |
El Sewedy Cables Holding Co. | | | 529,606 | | | | 2,469,139 | |
Ezz Steel(1) | | | 1,548,345 | | | | 3,817,684 | |
Global Telecom Holding SAE(1) | | | 12,928,866 | | | | 9,795,139 | |
Juhayna Food Industries | | | 3,370,924 | | | | 7,415,430 | |
Maridive & Oil Services SAE(1) | | | 1,761,799 | | | | 1,871,367 | |
Misr Beni-Suef Cement Co. | | | 69,150 | | | | 498,314 | |
National Societe General Bank | | | 282,510 | | | | 1,273,037 | |
| | | | | | | | |
| Security | | Shares | | | Value | |
| | | | | | | | |
| | |
Egypt (continued) | | | | | | | | |
Orascom Telecom Media and Technology Holding SAE | | | 21,964,609 | | | $ | 3,763,264 | |
Oriental Weavers Co. | | | 187,375 | | | | 988,894 | |
Palm Hills Developments SAE(1) | | | 3,395,160 | | | | 1,538,129 | |
Pioneers Holding(1) | | | 1,229,900 | | | | 1,463,676 | |
Sidi Kerir Petrochemicals Co. | | | 1,686,400 | | | | 4,295,726 | |
Six of October Development & Investment Co.(1) | | | 382,178 | | | | 1,304,438 | |
South Valley Cement(1) | | | 704,261 | | | | 531,913 | |
Talaat Moustafa Group(1) | | | 5,219,460 | | | | 5,466,016 | |
Telecom Egypt | | | 1,949,337 | | | | 4,211,726 | |
| | | | | | | | | |
| | | | | | $ | 86,750,506 | |
| | | | | | | | | |
| | |
Estonia — 0.2% | | | | | | | | |
AS Merko Ehitus | | | 50,618 | | | $ | 516,914 | |
AS Nordecon International(1) | | | 145,374 | | | | 205,869 | |
AS Olympic Entertainment Group | | | 503,790 | | | | 1,285,224 | |
AS Tallink Group | | | 3,623,652 | | | | 4,401,453 | |
AS Tallinna Kaubamaja | | | 137,340 | | | | 1,010,998 | |
AS Tallinna Vesi | | | 58,790 | | | | 990,325 | |
| | | | | | | | | |
| | | | | | $ | 8,410,783 | |
| | | | | | | | | |
| | |
Ghana — 0.1% | | | | | | | | |
Aluworks Ghana, Ltd.(1) | | | 457,409 | | | $ | 10,570 | |
CAL Bank, Ltd. | | | 1,298,010 | | | | 553,107 | |
Ghana Commercial Bank, Ltd. | | | 1,554,441 | | | | 3,315,849 | |
HFC Bank Ghana, Ltd.(1) | | | 1,235,326 | | | | 493,092 | |
Produce Buying Co., Ltd. | | | 582,428 | | | | 41,602 | |
Standard Chartered Bank of Ghana, Ltd. | | | 148,200 | | | | 1,020,963 | |
| | | | | | | | | |
| | | | | | $ | 5,435,183 | |
| | | | | | | | | |
| | |
Greece — 1.6% | | | | | | | | |
Aegean Marine Petroleum Network, Inc. | | | 63,900 | | | $ | 581,490 | |
Alpha Bank AE(1) | | | 4,025,790 | | | | 3,651,817 | |
Costamare, Inc. | | | 76,519 | | | | 1,502,833 | |
Diana Containerships, Inc. | | | 76,800 | | | | 311,808 | |
Diana Shipping, Inc.(1) | | | 164,791 | | | | 2,012,098 | |
DryShips, Inc.(1) | | | 674,500 | | | | 2,293,300 | |
Ellaktor SA(1) | | | 524,621 | | | | 2,384,941 | |
Folli Follie SA(1) | | | 82,904 | | | | 2,500,458 | |
Frigoglass SA(1) | | | 104,857 | | | | 622,727 | |
GasLog, Ltd. | | | 57,055 | | | | 1,195,873 | |
GEK Terna Holding Real Estate Construction SA(1) | | | 381,049 | | | | 1,717,917 | |
Hellenic Exchanges SA | | | 150,168 | | | | 1,479,351 | |
Hellenic Petroleum SA | | | 199,209 | | | | 1,932,265 | |
Hellenic Telecommunications Organization SA(1) | | | 467,190 | | | | 6,829,839 | |
Intralot SA | | | 418,837 | | | | 1,104,982 | |
| | | | |
| | 11 | | See Notes to Financial Statements. |
Parametric Emerging Markets Fund
January 31, 2014
Portfolio of Investments — continued
| | | | | | | | |
| Security | | Shares | | | Value | |
| | | | | | | | |
| | |
Greece (continued) | | | | | | | | |
JUMBO SA(1) | | | 274,881 | | | $ | 4,674,216 | |
Marfin Investment Group Holdings SA(1) | | | 1,321,172 | | | | 756,587 | |
Metka SA | | | 115,677 | | | | 1,844,785 | |
Motor Oil (Hellas) Corinth Refineries SA | | | 170,267 | | | | 1,963,164 | |
Mytilineos Holdings SA(1) | | | 226,317 | | | | 1,776,397 | |
National Bank of Greece SA(1) | | | 762,604 | | | | 3,376,195 | |
Navios Maritime Acqisition Corp. | | | 208,900 | | | | 896,181 | |
Navios Maritime Holdings, Inc. | | | 171,886 | | | | 1,629,479 | |
OPAP SA | | | 473,915 | | | | 6,128,467 | |
Piraeus Bank SA(1) | | | 2,007,941 | | | | 4,734,584 | |
Public Power Corp. SA | | | 216,943 | | | | 2,906,252 | |
Safe Bulkers, Inc. | | | 87,300 | | | | 854,667 | |
StealthGas, Inc.(1) | | | 87,399 | | | | 839,030 | |
Titan Cement Co. SA(1) | | | 123,232 | | | | 3,311,444 | |
Tsakos Energy Navigation, Ltd. | | | 126,700 | | | | 861,560 | |
Viohalco SA(1) | | | 223,488 | | | | 1,130,318 | |
| | | | | | | | | |
| | | | | | $ | 67,805,025 | |
| | | | | | | | | |
| | |
Hungary — 1.6% | | | | | | | | |
Magyar Telekom Rt. | | | 5,561,100 | | | $ | 7,446,480 | |
MOL Hungarian Oil & Gas Rt. | | | 280,600 | | | | 17,173,396 | |
OTP Bank Rt. | | | 1,087,430 | | | | 19,903,179 | |
Richter Gedeon Nyrt. | | | 1,061,000 | | | | 21,446,500 | |
| | | | | | | | | |
| | | | | | $ | 65,969,555 | |
| | | | | | | | | |
| | |
India — 6.5% | | | | | | | | |
ABB, Ltd. | | | 19,900 | | | $ | 186,410 | |
ACC, Ltd. | | | 64,370 | | | | 1,042,821 | |
Adani Enterprises, Ltd. | | | 397,200 | | | | 1,514,755 | |
Adani Ports and Special Economic Zone, Ltd. | | | 1,003,100 | | | | 2,336,311 | |
Aditya Birla Nuvo, Ltd. | | | 17,702 | | | | 311,447 | |
Amtek Auto, Ltd. | | | 152,500 | | | | 157,528 | |
Asian Paints, Ltd. | | | 270,300 | | | | 2,038,829 | |
Axis Bank, Ltd. | | | 186,000 | | | | 3,335,160 | |
Bajaj Auto, Ltd. | | | 59,560 | | | | 1,812,696 | |
Bank of Baroda | | | 114,960 | | | | 1,010,431 | |
Bank of India | | | 247,400 | | | | 757,615 | |
Bharat Forge, Ltd. | | | 63,650 | | | | 355,307 | |
Bharat Heavy Electricals, Ltd. | | | 726,400 | | | | 1,995,619 | |
Bharat Petroleum Corp., Ltd. | | | 253,200 | | | | 1,465,802 | |
Bharti Airtel, Ltd. | | | 2,248,160 | | | | 11,282,860 | |
Biocon, Ltd. | | | 101,600 | | | | 707,355 | |
Cairn India, Ltd. | | | 503,800 | | | | 2,601,545 | |
Canara Bank, Ltd. | | | 176,800 | | | | 626,004 | |
Cipla, Ltd. | | | 287,310 | | | | 1,881,427 | |
| | | | | | | | |
| Security | | Shares | | | Value | |
| | | | | | | | |
| | |
India (continued) | | | | | | | | |
Coal India, Ltd. | | | 623,800 | | | $ | 2,456,904 | |
Colgate-Palmolive (India), Ltd. | | | 24,900 | | | | 518,863 | |
Container Corp. of India, Ltd. | | | 54,240 | | | | 632,167 | |
Crompton Greaves, Ltd. | | | 213,600 | | | | 393,391 | |
Cummins India, Ltd. | | | 49,900 | | | | 349,476 | |
Dabur India, Ltd. | | | 364,400 | | | | 1,003,769 | |
Divi’s Laboratories, Ltd. | | | 46,800 | | | | 981,788 | |
DLF, Ltd. | | | 445,700 | | | | 979,255 | |
Dr. Reddy’s Laboratories, Ltd. | | | 73,620 | | | | 3,062,028 | |
Educomp Solutions, Ltd.(1) | | | 157,865 | | | | 59,569 | |
Essar Oil, Ltd.(1) | | | 425,030 | | | | 304,265 | |
Financial Technologies India, Ltd. | | | 32,600 | | | | 140,815 | |
GAIL (India), Ltd. | | | 585,050 | | | | 3,363,877 | |
GlaxoSmithKline Pharmaceuticals, Ltd. | | | 8,680 | | | | 412,798 | |
Glenmark Pharmaceuticals, Ltd. | | | 125,460 | | | | 1,118,481 | |
GMR Infrastructure, Ltd. | | | 1,721,400 | | | | 556,214 | |
Grasim Industries, Ltd. | | | 8,158 | | | | 333,309 | |
Gujarat Ambuja Cements, Ltd. | | | 657,400 | | | | 1,679,360 | |
Gujarat State Petronet, Ltd. | | | 383,800 | | | | 340,193 | |
GVK Power & Infrastructure, Ltd.(1) | | | 2,796,900 | | | | 405,941 | |
HCL Technologies, Ltd. | | | 199,400 | | | | 4,650,305 | |
HDFC Bank, Ltd. | | | 912,320 | | | | 9,166,452 | |
Hero MotoCorp, Ltd. | | | 60,900 | | | | 1,925,298 | |
Hindalco Industries, Ltd. | | | 886,210 | | | | 1,551,457 | |
Hindustan Petroleum Corp., Ltd. | | | 220,900 | | | | 862,695 | |
Hindustan Unilever, Ltd. | | | 709,000 | | | | 6,449,187 | |
Hindustan Zinc, Ltd. | | | 148,400 | | | | 307,394 | |
Housing Development & Infrastructure, Ltd.(1) | | | 1,151,714 | | | | 782,062 | |
Housing Development Finance Corp., Ltd. | | | 1,278,300 | | | | 16,433,437 | |
ICICI Bank, Ltd. | | | 450,570 | | | | 7,085,976 | |
IDBI Bank, Ltd. | | | 367,000 | | | | 325,974 | |
Idea Cellular, Ltd. | | | 1,624,900 | | | | 3,705,135 | |
IDFC, Ltd. | | | 1,075,200 | | | | 1,597,091 | |
IFCI, Ltd. | | | 1,864,200 | | | | 676,307 | |
Indiabulls Housing Finance, Ltd. | | | 165,200 | | | | 544,458 | |
Indiabulls Real Estate, Ltd. | | | 646,300 | | | | 552,826 | |
Indian Hotels Co., Ltd. | | | 164,280 | | | | 153,437 | |
Indian Oil Corp., Ltd. | | | 242,400 | | | | 948,257 | |
Infosys, Ltd. | | | 459,300 | | | | 26,979,043 | |
ITC, Ltd. | | | 1,313,460 | | | | 6,818,791 | |
IVRCL, Ltd.(1) | | | 1,113,900 | | | | 197,351 | |
Jaiprakash Associates, Ltd. | | | 1,722,800 | | | | 1,106,819 | |
Jindal Steel & Power, Ltd. | | | 437,200 | | | | 1,742,943 | |
JSW Steel, Ltd. | | | 163,300 | | | | 2,387,311 | |
Kotak Mahindra Bank, Ltd. | | | 234,100 | | | | 2,449,324 | |
Lanco Infratech, Ltd.(1) | | | 2,361,100 | | | | 273,504 | |
| | | | |
| | 12 | | See Notes to Financial Statements. |
Parametric Emerging Markets Fund
January 31, 2014
Portfolio of Investments — continued
| | | | | | | | |
| Security | | Shares | | | Value | |
| | | | | | | | |
| | |
India (continued) | | | | | | | | |
Larsen & Toubro, Ltd. | | | 258,090 | | | $ | 4,061,812 | |
LIC Housing Finance, Ltd. | | | 351,400 | | | | 1,098,522 | |
Lupin, Ltd. | | | 148,500 | | | | 2,093,310 | |
Mahindra & Mahindra, Ltd. | | | 226,260 | | | | 3,206,681 | |
Maruti Suzuki India, Ltd. | | | 67,750 | | | | 1,775,121 | |
Mphasis, Ltd. | | | 39,900 | | | | 235,457 | |
Nestle India, Ltd. | | | 11,930 | | | | 958,912 | |
Nicholas Piramal India, Ltd. | | | 76,807 | | | | 686,076 | |
NTPC, Ltd. | | | 2,333,600 | | | | 4,707,530 | |
Oil & Natural Gas Corp., Ltd. | | | 1,829,680 | | | | 8,053,573 | |
Oracle Financial Service Software, Ltd.(1) | | | 16,500 | | | | 847,977 | |
Power Grid Corporation of India, Ltd. | | | 1,946,900 | | | | 2,976,092 | |
Ranbaxy Laboratories, Ltd.(1) | | | 158,960 | | | | 818,390 | |
Reliance Capital, Ltd. | | | 153,735 | | | | 793,301 | |
Reliance Communications, Ltd. | | | 1,731,560 | | | | 3,388,750 | |
Reliance Industries, Ltd. | | | 1,404,338 | | | | 18,621,552 | |
Reliance Infrastructure, Ltd. | | | 288,300 | | | | 1,714,042 | |
Reliance Power, Ltd.(1) | | | 1,400,250 | | | | 1,386,210 | |
Sesa Sterlite, Ltd. | | | 1,223,612 | | | | 3,675,437 | |
Shree Renuka Sugars, Ltd. | | | 777,100 | | | | 228,853 | |
Siemens India, Ltd. | | | 47,180 | | | | 414,608 | |
State Bank of India | | | 99,200 | | | | 2,416,306 | |
State Bank of India GDR(3) | | | 9,600 | | | | 460,886 | |
Steel Authority of India, Ltd. | | | 646,200 | | | | 660,023 | |
Sun Pharmaceuticals Industries, Ltd. | | | 595,400 | | | | 5,595,728 | |
Sun TV Network, Ltd. | | | 147,473 | | | | 848,767 | |
Suzlon Energy, Ltd.(1) | | | 2,099,450 | | | | 357,681 | |
Tata Communications, Ltd. | | | 127,400 | | | | 560,905 | |
Tata Consultancy Services, Ltd. | | | 481,600 | | | | 17,135,265 | |
Tata Motors, Ltd. | | | 742,250 | | | | 4,134,900 | |
Tata Power Co., Ltd. | | | 1,558,700 | | | | 1,851,172 | |
Tata Steel, Ltd. | | | 300,796 | | | | 1,704,493 | |
Tata Tea, Ltd. | | | 279,500 | | | | 627,320 | |
Tech Mahindra, Ltd. | | | 88,511 | | | | 2,533,856 | |
Titan Industries, Ltd. | | | 234,100 | | | | 824,054 | |
UltraTech Cement, Ltd. | | | 64,100 | | | | 1,752,556 | |
Unitech, Ltd.(1) | | | 2,836,900 | | | | 571,890 | |
United Spirits, Ltd. | | | 64,600 | | | | 2,547,787 | |
UPL, Ltd. | | | 303,700 | | | | 916,762 | |
Voltas, Ltd. | | | 296,300 | | | | 502,199 | |
Wipro, Ltd. | | | 527,679 | | | | 4,828,104 | |
Yes Bank, Ltd. | | | 209,900 | | | | 1,033,130 | |
Zee Entertainment Enterprises, Ltd. | | | 373,114 | | | | 1,588,967 | |
| | | | | | | | | |
| | | | | | $ | 269,380,176 | |
| | | | | | | | | |
| | | | | | | | |
| Security | | Shares | | | Value | |
| | | | | | | | |
| | |
Indonesia — 3.3% | | | | | | | | |
Adaro Energy Tbk PT | | | 36,822,500 | | | $ | 2,867,814 | |
Agis Tbk PT(1) | | | 17,097,000 | | | | 617,686 | |
AKR Corporindo Tbk PT | | | 6,850,500 | | | | 2,478,479 | |
Aneka Tambang Tbk PT | | | 10,251,500 | | | | 860,496 | |
Astra Argo Lestari Tbk PT | | | 775,000 | | | | 1,359,148 | |
Astra International Tbk PT | | | 21,623,000 | | | | 11,376,740 | |
Bank Central Asia Tbk PT | | | 13,688,500 | | | | 11,110,588 | |
Bank Danamon Indonesia Tbk PT | | | 4,504,303 | | | | 1,603,886 | |
Bank Mandiri Tbk PT | | | 10,075,000 | | | | 7,146,270 | |
Bank Negara Indonesia Persero Tbk PT | | | 9,366,500 | | | | 3,358,795 | |
Bank Pan Indonesia Tbk PT(1) | | | 4,945,000 | | | | 270,636 | |
Bank Pembangunan Daerah Jawa Barat Dan Banten Tbk PT | | | 12,193,000 | | | | 913,853 | |
Bank Rakyat Indonesia Tbk PT | | | 11,498,000 | | | | 7,857,506 | |
Bank Tabungan Negara Tbk PT | | | 10,171,500 | | | | 748,078 | |
Berlian Laju Tanker Tbk PT(1)(2) | | | 7,544,500 | | | | 0 | |
Bhakti Investama Tbk PT | | | 49,042,500 | | | | 1,205,241 | |
Bumi Resources Tbk PT(1) | | | 37,563,000 | | | | 938,079 | |
Bumi Serpong Damai Tbk PT | | | 13,777,500 | | | | 1,631,296 | |
Charoen Pokphand Indonesia Tbk PT | | | 10,278,000 | | | | 3,467,078 | |
Delta Dunia Makmur Tbk PT(1) | | | 9,252,500 | | | | 70,845 | |
Energi Mega Persada Tbk PT(1) | | | 64,369,200 | | | | 373,694 | |
Gudang Garam Tbk PT | | | 660,000 | | | | 2,267,139 | |
Harum Energy Tbk PT | | | 2,626,500 | | | | 513,481 | |
Holcim Indonesia Tbk PT | | | 3,029,000 | | | | 516,101 | |
Indo Tambangraya Megah Tbk PT | | | 976,500 | | | | 2,145,026 | |
Indocement Tunggal Prakarsa Tbk PT | | | 3,654,500 | | | | 6,710,360 | |
Indofood Sukses Makmur Tbk PT | | | 5,994,500 | | | | 3,426,798 | |
Indosat Tbk PT | | | 2,794,500 | | | | 972,897 | |
Jasa Marga (Persero) Tbk PT | | | 3,198,000 | | | | 1,348,700 | |
Kalbe Farma Tbk PT | | | 28,956,500 | | | | 3,325,842 | |
Lippo Karawaci Tbk PT | | | 28,867,500 | | | | 2,246,862 | |
Matahari Putra Prima Tbk PT | | | 7,240,000 | | | | 1,191,143 | |
Medco Energi Internasional Tbk PT | | | 4,497,500 | | | | 880,302 | |
Media Nusantara Citra Tbk PT | | | 3,201,000 | | | | 587,644 | |
Pembangunan Perumahan Persero Tbk PT | | | 9,145,000 | | | | 1,010,698 | |
Perusahaan Gas Negara Tbk PT | | | 17,387,500 | | | | 6,763,519 | |
Perusahaan Perkebunan London Sumatra Indonesia Tbk PT | | | 7,185,000 | | | | 970,110 | |
Semen Gresik (Persero) Tbk PT | | | 6,584,000 | | | | 7,649,143 | |
Surya Semesta Internusa Tbk PT | | | 14,275,000 | | | | 784,805 | |
Tambang Batubara Bukit Asam Tbk PT | | | 2,036,500 | | | | 1,540,444 | |
Telekomunikasi Indonesia Tbk PT | | | 71,869,500 | | | | 13,327,178 | |
Tower Bersama Infrastructure Tbk PT(1) | | | 2,871,000 | | | | 1,457,020 | |
Trada Maritime Tbk PT(1) | | | 10,350,500 | | | | 1,396,340 | |
Unilever Indonesia Tbk PT | | | 1,486,800 | | | | 3,494,281 | |
| | | | |
| | 13 | | See Notes to Financial Statements. |
Parametric Emerging Markets Fund
January 31, 2014
Portfolio of Investments — continued
| | | | | | | | |
| Security | | Shares | | | Value | |
| | | | | | | | |
| | |
Indonesia (continued) | | | | | | | | |
United Tractors Tbk PT | | | 4,529,583 | | | $ | 7,136,550 | |
Vale Indonesia Tbk PT | | | 5,222,500 | | | | 989,217 | |
Wijaya Karya Persero Tbk PT | | | 11,836,000 | | | | 1,881,730 | |
XL Axiata Tbk PT | | | 4,954,500 | | | | 1,971,883 | |
| | | | | | | | | |
| | | | | | $ | 136,761,421 | |
| | | | | | | | | |
| | |
Jordan — 0.9% | | | | | | | | |
Arab Bank PLC | | | 1,401,120 | | | $ | 18,524,545 | |
Arab Potash Co. PLC | | | 46,536 | | | | 1,809,738 | |
Bank of Jordan | | | 298,710 | | | | 1,100,430 | |
Capital Bank of Jordan(1) | | | 231,454 | | | | 576,158 | |
Jordan Ahli Bank(1) | | | 765,591 | | | | 1,571,495 | |
Jordan Islamic Bank | | | 405,003 | | | | 2,223,598 | |
Jordan Petroleum Refinery | | | 435,706 | | | | 3,025,729 | |
Jordan Phosphate Mines | | | 149,908 | | | | 1,567,721 | |
Jordan Steel | | | 453,091 | | | | 849,338 | |
Jordan Telecom Corp. | | | 339,850 | | | | 1,831,628 | |
Jordanian Electric Power Co. | | | 488,876 | | | | 2,063,181 | |
Royal Jordanian Airlines(1) | | | 455,790 | | | | 394,221 | |
Taameer Jordan Holdings PSC(1) | | | 1,228,805 | | | | 296,748 | |
Union Investment Corp.(1) | | | 595,615 | | | | 1,990,007 | |
Union Land Development(1) | | | 47,830 | | | | 225,055 | |
| | | | | | | | | |
| | | | | | $ | 38,049,592 | |
| | | | | | | | | |
| | |
Kazakhstan — 0.7% | | | | | | | | |
Halyk Savings Bank of Kazakhstan JSC GDR(3) | | | 712,200 | | | $ | 6,982,345 | |
Kazakhmys PLC | | | 1,613,976 | | | | 4,709,750 | |
Kazkommertsbank JSC GDR(1)(3) | | | 340,233 | | | | 593,543 | |
KazMunaiGas Exploration Production GDR(3) | | | 545,900 | | | | 7,897,743 | |
Kcell JSC GDR(3) | | | 385,400 | | | | 6,321,009 | |
Nostrum Oil & Gas, LP GDR | | | 243,200 | | | | 2,672,768 | |
| | | | | | | | | |
| | | | | | $ | 29,177,158 | |
| | | | | | | | | |
| | |
Kenya — 0.8% | | | | | | | | |
Athi River Mining, Ltd. | | | 390,500 | | | $ | 392,904 | |
Bamburi Cement Co., Ltd. | | | 606,300 | | | | 1,445,943 | |
Barclays Bank of Kenya, Ltd. | | | 8,196,160 | | | | 1,606,708 | |
Co-operative Bank of Kenya, Ltd. (The) | | | 7,659,600 | | | | 1,539,652 | |
East African Breweries, Ltd. | | | 2,253,280 | | | | 6,811,982 | |
Equity Bank, Ltd. | | | 10,547,600 | | | | 3,748,917 | |
KenolKobil, Ltd.(1) | | | 4,090,000 | | | | 432,248 | |
Kenya Airways, Ltd.(1) | | | 1,264,800 | | | | 175,621 | |
Kenya Commercial Bank, Ltd. | | | 7,746,920 | | | | 3,797,494 | |
Kenya Electricity Generating Co., Ltd. | | | 2,321,100 | | | | 325,004 | |
Kenya Power & Lighting, Ltd. | | | 9,484,354 | | | | 1,620,423 | |
| | | | | | | | |
| Security | | Shares | | | Value | |
| | | | | | | | |
| | |
Kenya (continued) | | | | | | | | |
Mumias Sugar Co., Ltd.(1) | | | 3,844,600 | | | $ | 133,474 | |
Nation Media Group, Ltd. | | | 407,184 | | | | 1,507,776 | |
Safaricom, Ltd. | | | 71,083,572 | | | | 9,044,980 | |
Standard Chartered Bank Kenya, Ltd. | | | 149,188 | | | | 500,976 | |
| | | | | | | | | |
| | | | | | $ | 33,084,102 | |
| | | | | | | | | |
| | |
Kuwait — 1.6% | | | | | | | | |
Agility Public Warehousing Co. KSC | | | 1,548,750 | | | $ | 3,491,569 | |
Ahli United Bank | | | 303,187 | | | | 762,288 | |
Al Ahli Bank of Kuwait KSC | | | 510,925 | | | | 755,799 | |
Al Safat Energy Holding Co. KSCC(1) | | | 1,880,000 | | | | 336,666 | |
Al Safwa Group Holding Co. KSC(1)(2) | | | 1,361,086 | | | | 0 | |
Al-Qurain Petrochemicals Co. | | | 2,424,073 | | | | 2,048,603 | |
Aviation Lease and Finance Co. KSCC | | | 730,000 | | | | 672,134 | |
Boubyan Bank KSC(1) | | | 499,500 | | | | 982,601 | |
Boubyan Petrochemicals Co. | | | 1,530,000 | | | | 3,693,357 | |
Burgan Bank SAK | | | 1,038,231 | | | | 2,019,559 | |
Combined Group Contracting Co. | | | 73,205 | | | | 326,797 | |
Commercial Bank of Kuwait SAK(1) | | | 365,000 | | | | 986,225 | |
Commercial Real Estate Co. KSCC | | | 2,186,862 | | | | 740,526 | |
Gulf Bank(1) | | | 1,859,887 | | | | 2,394,843 | |
Gulf Cable and Electrical Industries Co. | | | 245,000 | | | | 664,677 | |
Kuwait Cement Co. | | | 223,100 | | | | 291,643 | |
Kuwait Finance House KSC | | | 2,314,471 | | | | 6,578,195 | |
Kuwait Foods Co. (Americana) | | | 425,000 | | | | 3,741,405 | |
Kuwait International Bank | | | 1,224,000 | | | | 1,300,122 | |
Kuwait Pipes Industries & Oil Services Co.(1)(2) | | | 1,188,500 | | | | 201,654 | |
Kuwait Portland Cement Co. | | | 255,000 | | | | 1,219,885 | |
Kuwait Projects Co. Holdings KSC | | | 1,097,933 | | | | 2,547,298 | |
Kuwait Real Estate Co.(1) | | | 4,120,000 | | | | 1,440,762 | |
Mabanee Co. SAKC | | | 932,352 | | | | 3,882,862 | |
Mena Holding Group(1)(2) | | | 198,000 | | | | 0 | |
Mobile Telecommunications Co. | | | 3,780,000 | | | | 9,106,313 | |
National Bank of Kuwait SAK | | | 2,855,412 | | | | 9,505,625 | |
National Industries Group Holding(1) | | | 3,862,500 | | | | 3,104,868 | |
National Investment Co.(1) | | | 1,510,000 | | | | 829,246 | |
National Ranges Co.(1) | | | 7,920,000 | | | | 703,757 | |
Sultan Center Food Products Co.(1) | | | 4,020,000 | | | | 1,322,522 | |
| | | | | | | | | |
| | | | | | $ | 65,651,801 | |
| | | | | | | | | |
| | |
Latvia — 0.0%(4) | | | | | | | | |
Grindeks(1) | | | 42,000 | | | $ | 558,907 | |
Latvian Shipping Co.(1) | | | 405,000 | | | | 305,544 | |
| | | | | | | | | |
| | | | | | $ | 864,451 | |
| | | | | | | | | |
| | | | |
| | 14 | | See Notes to Financial Statements. |
Parametric Emerging Markets Fund
January 31, 2014
Portfolio of Investments — continued
| | | | | | | | |
| Security | | Shares | | | Value | |
| | | | | | | | |
| | |
Lebanon — 0.1% | | | | | | | | |
Solidere GDR(1)(3) | | | 320,943 | | | $ | 4,219,518 | |
Solidere, Class A(1) | | | 86,340 | | | | 1,137,689 | |
Solidere, Class B(1) | | | 1,726 | | | | 22,516 | |
| | | | | | | | | |
| | | | | | $ | 5,379,723 | |
| | | | | | | | | |
| | |
Lithuania — 0.1% | | | | | | | | |
Apranga PVA | | | 278,536 | | | $ | 1,097,261 | |
Klaipedos Nafta PVA | | | 1,345,900 | | | | 558,084 | |
Lesto AB | | | 118,064 | | | | 144,025 | |
Pieno Zvaigzdes | | | 104,200 | | | | 283,305 | |
Rokiskio Suris | | | 122,500 | | | | 284,595 | |
Siauliu Bankas | | | 809,317 | | | | 322,125 | |
| | | | | | | | | |
| | | | | | $ | 2,689,395 | |
| | | | | | | | | |
| | |
Malaysia — 3.2% | | | | | | | | |
Aeon Co. (M) Bhd | | | 165,300 | | | $ | 606,847 | |
Airasia Bhd | | | 1,228,200 | | | | 829,536 | |
Alliance Financial Group Bhd | | | 560,300 | | | | 778,995 | |
AMMB Holdings Bhd | | | 887,900 | | | | 1,942,346 | |
Astro Malaysia Holdings Bhd | | | 979,300 | | | | 860,417 | |
Axiata Group Bhd | | | 2,706,750 | | | | 5,306,652 | |
Batu Kawan Bhd | | | 210,000 | | | | 1,233,336 | |
Berjaya Corp. Bhd | | | 2,289,600 | | | | 348,233 | |
Berjaya Sports Toto Bhd | | | 805,627 | | | | 972,855 | |
Boustead Holdings Bhd | | | 596,210 | | | | 934,077 | |
British American Tobacco Malaysia Bhd | | | 93,800 | | | | 1,705,264 | |
Bumi Armada Bhd(1) | | | 2,088,900 | | | | 2,528,240 | |
Bursa Malaysia Bhd | | | 344,900 | | | | 802,952 | |
CIMB Group Holdings Bhd | | | 1,771,500 | | | | 3,664,644 | |
Dialog Group Bhd | | | 2,704,273 | | | | 2,627,022 | |
Digi.com Bhd | | | 1,873,500 | | | | 2,628,479 | |
Felda Global Ventures Holdings Bhd | | | 1,358,400 | | | | 1,767,626 | |
Gamuda Bhd | | | 2,919,700 | | | | 3,898,829 | |
Genting Bhd | | | 1,448,500 | | | | 4,507,769 | |
Genting Plantations Bhd | | | 261,700 | | | | 807,739 | |
Hong Leong Bank Bhd | | | 382,900 | | | | 1,614,146 | |
Hong Leong Financial Group Bhd | | | 276,000 | | | | 1,306,070 | |
IGB Corp. Bhd | | | 856,200 | | | | 681,877 | |
IHH Healthcare Bhd(1) | | | 2,077,100 | | | | 2,288,088 | |
IJM Corp. Bhd | | | 1,828,190 | | | | 3,235,334 | |
IOI Corp. Bhd | | | 2,088,118 | | | | 2,607,330 | |
IOI Properties Group Bhd(1) | | | 1,044,058 | | | | 842,360 | |
KLCC Property Holdings Bhd | | | 399,100 | | | | 690,103 | |
KNM Group Bhd(1) | | | 5,003,150 | | | | 919,080 | |
Kuala Lumpur Kepong Bhd | | | 284,000 | | | | 1,988,684 | |
| | | | | | | | |
| Security | | Shares | | | Value | |
| | | | | | | | |
| | |
Malaysia (continued) | | | | | | | | |
Kulim (Malaysia) Bhd(1) | | | 860,000 | | | $ | 822,195 | |
Lafarge Malayan Cement Bhd | | | 942,950 | | | | 2,393,579 | |
Malayan Banking Bhd | | | 1,980,587 | | | | 5,706,163 | |
Malaysia Airports Holdings Bhd | | | 342,800 | | | | 861,641 | |
Malaysia Marine and Heavy Engineering Holdings Bhd | | | 739,000 | | | | 801,320 | |
Malaysian Resources Corp. Bhd | | | 1,423,500 | | | | 647,568 | |
Maxis Bhd | | | 1,737,900 | | | | 3,614,515 | |
Media Prima Bhd | | | 575,000 | | | | 410,689 | |
MISC Bhd(1) | | | 482,400 | | | | 865,243 | |
MMC Corp. Bhd | | | 868,200 | | | | 724,217 | |
Mudajaya Group Bhd | | | 510,600 | | | | 399,178 | |
Multi-Purpose Holdings Bhd | | | 940,340 | | | | 858,634 | |
Parkson Holdings Bhd | | | 766,578 | | | | 671,314 | |
Petronas Chemicals Group Bhd | | | 3,748,800 | | | | 7,439,143 | |
Petronas Dagangan Bhd | | | 507,500 | | | | 4,647,811 | |
Petronas Gas Bhd | | | 298,800 | | | | 2,084,592 | |
PPB Group Bhd | | | 404,100 | | | | 1,862,912 | |
Public Bank Bhd | | | 837,820 | | | | 4,787,821 | |
Resorts World Bhd | | | 2,155,600 | | | | 2,803,359 | |
RHB Capital Bhd | | | 733,900 | | | | 1,685,340 | |
Sapurakencana Petroleum Bhd(1) | | | 5,340,168 | | | | 6,996,538 | |
Sime Darby Bhd | | | 3,863,639 | | | | 10,382,370 | |
Sunway Bhd | | | 304,600 | | | | 246,490 | |
Supermax Corp. Bhd | | | 650,400 | | | | 565,198 | |
TA Enterprise Bhd | | | 1,323,000 | | | | 294,007 | |
Tan Chong Motor Holdings Bhd | | | 265,900 | | | | 451,774 | |
Telekom Malaysia Bhd | | | 1,249,900 | | | | 2,057,562 | |
Tenaga Nasional Bhd | | | 1,719,525 | | | | 6,062,096 | |
Top Glove Corp. Bhd | | | 525,500 | | | | 862,652 | |
UEM Land Holdings Bhd | | | 1,683,050 | | | | 1,038,045 | |
UMW Holdings Bhd | | | 448,400 | | | | 1,587,364 | |
Unisem (M) Bhd | | | 1,289,100 | | | | 361,276 | |
Wah Seong Corp. Bhd | | | 439,687 | | | | 252,432 | |
WCT Bhd | | | 1,257,800 | | | | 781,916 | |
YTL Corp. Bhd | | | 2,863,465 | | | | 1,315,403 | |
YTL Power International Bhd | | | 1,793,521 | | | | 1,000,724 | |
| | | | | | | | | |
| | | | | | $ | 133,268,011 | |
| | | | | | | | | |
| | |
Mauritius — 0.6% | | | | | | | | |
CIM Financial Services, Ltd. | | | 5,283,300 | | | $ | 1,411,948 | |
LUX Island Resorts, Ltd.(1) | | | 842,920 | | | | 1,111,358 | |
Mauritius Commercial Bank | | | 1,387,300 | | | | 9,511,350 | |
New Mauritius Hotels, Ltd. | | | 1,630,850 | | | | 4,723,016 | |
Rogers & Co., Ltd. | | | 167,300 | | | | 1,071,227 | |
State Bank of Mauritius, Ltd. | | | 127,622,900 | | | | 4,312,000 | |
| | | | |
| | 15 | | See Notes to Financial Statements. |
Parametric Emerging Markets Fund
January 31, 2014
Portfolio of Investments — continued
| | | | | | | | |
| Security | | Shares | | | Value | |
| | | | | | | | |
| | |
Mauritius (continued) | | | | | | | | |
Sun Resorts, Ltd.(1) | | | 1,042,199 | | | $ | 1,504,649 | |
Terra Mauricia, Ltd. | | | 926,300 | | | | 1,111,443 | |
United Basalt Products, Ltd. | | | 289,200 | | | | 833,066 | |
United Docks, Ltd.(1) | | | 27,400 | | | | 63,532 | |
| | | | | | | | | |
| | | | | | $ | 25,653,589 | |
| | | | | | | | | |
| | |
Mexico — 6.3% | | | | | | | | |
Alfa SAB de CV, Series A | | | 6,966,000 | | | $ | 19,626,057 | |
America Movil SAB de CV ADR, Series L | | | 905,400 | | | | 19,248,804 | |
America Movil SAB de CV, Series L | | | 27,123,050 | | | | 28,919,896 | |
Bolsa Mexicana de Valores SAB de CV | | | 1,503,700 | | | | 3,035,734 | |
Cemex SAB de CV ADR(1) | | | 1,222,390 | | | | 15,120,964 | |
Cemex SAB de CV, Series CPO(1) | | | 10,101,822 | | | | 12,485,653 | |
Coca-Cola Femsa SA de CV, Series L | | | 359,300 | | | | 3,817,059 | |
Compartamos SAB de CV | | | 2,788,400 | | | | 5,035,132 | |
Controladora Comercial Mexicana SA de CV | | | 518,500 | | | | 1,967,152 | |
Corporacion GEO SAB de CV, Series B(1)(2) | | | 1,144,000 | | | | 70,997 | |
Desarrolladora Homex SAB de CV(1) | | | 776,450 | | | | 211,907 | |
Embotelladoras Arca SAB de CV | | | 800,314 | | | | 4,398,915 | |
Empresas ICA SAB de CV(1) | | | 2,013,500 | | | | 3,888,792 | |
Fibra Uno Administracion SA de CV | | | 2,173,500 | | | | 7,014,226 | |
Fomento Economico Mexicano SA de CV ADR | | | 37,200 | | | | 3,356,928 | |
Fomento Economico Mexicano SAB de CV, Series UBD | | | 1,447,100 | | | | 13,089,254 | |
Genomma Lab Internacional SA de CV(1) | | | 1,019,300 | | | | 2,515,097 | |
Grupo Aeroportuario del Pacifico SAB de CV, Class B | | | 442,300 | | | | 2,411,253 | |
Grupo Aeroportuario del Sureste SAB de CV, Class B | | | 220,600 | | | | 2,482,946 | |
Grupo Bimbo SA de CV, Series A | | | 2,277,300 | | | | 6,075,524 | |
Grupo Carso SA de CV, Series A1 | | | 957,500 | | | | 5,008,010 | |
Grupo Elektra SA de CV | | | 74,500 | | | | 2,266,139 | |
Grupo Financiero Banorte SAB de CV, Class O | | | 3,428,600 | | | | 21,642,172 | |
Grupo Financiero Inbursa SAB de CV, Class O | | | 4,951,200 | | | | 12,346,532 | |
Grupo Mexico SAB de CV, Series B | | | 4,508,679 | | | | 14,523,246 | |
Grupo Simec SA de CV, Series B(1) | | | 133,800 | | | | 499,024 | |
Grupo Televisa SA ADR | | | 160,800 | | | | 4,672,848 | |
Grupo Televisa SAB, Series CPO | | | 1,487,900 | | | | 8,644,372 | |
Impulsora del Desarrollo y el Empleo en America Latina SA de CV, Series B1(1) | | | 1,038,200 | | | | 2,343,596 | |
Industrias CH SAB de CV, Series B(1) | | | 225,500 | | | | 1,340,455 | |
Industrias Penoles SA de CV | | | 188,600 | | | | 4,387,834 | |
Inmuebles Carso SAB de CV(1) | | | 714,800 | | | | 711,379 | |
Kimberly-Clark de Mexico SAB de CV, Class A | | | 1,727,100 | | | | 4,435,912 | |
Mexichem SAB de CV | | | 1,483,316 | | | | 5,144,025 | |
Minera Frisco SAB de CV(1) | | | 714,800 | | | | 1,127,731 | |
Organizacion Soriana SAB de CV, Class B(1) | | | 120,000 | | | | 342,755 | |
Promotora y Operadora de Infraestructura SAB de CV(1) | | | 348,200 | | | | 4,217,766 | |
| | | | | | | | |
| Security | | Shares | | | Value | |
| | | | | | | | |
| | |
Mexico (continued) | | | | | | | | |
Ternium SA ADR | | | 46,000 | | | $ | 1,369,880 | |
TV Azteca SAB de CV, Series CPO | | | 1,240,300 | | | | 783,650 | |
Urbi Desarrollos Urbanos SAB de CV(1)(2) | | | 2,260,600 | | | | 132,688 | |
Wal-Mart de Mexico SAB de CV, Series V | | | 5,879,400 | | | | 14,063,258 | |
| | | | | | | | | |
| | | | | | $ | 264,775,562 | |
| | | | | | | | | |
| | |
Morocco — 0.8% | | | | | | | | |
Alliances Developpement Immobilier SA | | | 11,000 | | | $ | 641,324 | |
Attijariwafa Bank | | | 160,000 | | | | 5,882,254 | |
Banque Centrale Populaire | | | 116,860 | | | | 2,691,550 | |
Banque Marocaine du Commerce Exterieur (BMCE) | | | 114,517 | | | | 2,786,548 | |
Banque Marocaine pour le Commerce et l’Industrie (BMCI) | | | 2,860 | | | | 254,427 | |
Ciments du Maroc | | | 4,580 | | | | 454,299 | |
Compagnie Generale Immobiliere | | | 9,100 | | | | 821,471 | |
Cosumar Compagnie Sucriere Marocaine et de Raffinage | | | 3,930 | | | | 898,001 | |
Delta Holding SA(1) | | | 52,900 | | | | 194,049 | |
Douja Promotion Groupe Addoha SA | | | 370,934 | | | | 2,548,187 | |
Holcim Maroc SA | | | 7,774 | | | | 1,460,451 | |
Label Vie | | | 2,100 | | | | 364,083 | |
Lafarge Ciments | | | 17,410 | | | | 2,760,845 | |
Managem | | | 9,862 | | | | 1,477,959 | |
Maroc Telecom | | | 665,524 | | | | 7,780,546 | |
Samir(1) | | | 15,717 | | | | 567,547 | |
SONASID (Societe Nationale de Siderurgie)(1) | | | 4,267 | | | | 478,954 | |
Wafa Assurance | | | 2,730 | | | | 991,662 | |
| | | | | | | | | |
| | | | | | $ | 33,054,157 | |
| | | | | | | | | |
| | |
Nigeria — 0.8% | | | | | | | | |
Access Bank PLC | | | 19,423,730 | | | $ | 1,091,116 | |
Afriland Properties PLC(1)(2) | | | 1,169,236 | | | | 0 | |
Ashaka Cement PLC | | | 2,154,293 | | | | 248,845 | |
Dangote Cement PLC | | | 1,608,950 | | | | 2,313,295 | |
Dangote Flour Mills PLC(1) | | | 2,810,000 | | | | 167,214 | |
Dangote Sugar Refinery PLC | | | 8,508,432 | | | | 610,504 | |
Diamond Bank PLC(1) | | | 16,654,000 | | | | 713,423 | |
Ecobank Transnational, Inc. | | | 12,593,618 | | | | 1,157,860 | |
Fidelity Bank PLC | | | 22,430,824 | | | | 335,298 | |
First Bank of Nigeria PLC | | | 32,229,046 | | | | 2,879,292 | |
First City Monument Bank PLC(1) | | | 23,552,733 | | | | 557,764 | |
Flour Mills of Nigeria PLC | | | 660,000 | | | | 340,697 | |
Guaranty Trust Bank PLC | | | 25,061,574 | | | | 4,280,969 | |
Guiness Nigeria PLC | | | 764,975 | | | | 1,049,511 | |
Intercontinental Wapic Insurance PLC(1) | | | 4,144,875 | | | | 25,091 | |
| | | | |
| | 16 | | See Notes to Financial Statements. |
Parametric Emerging Markets Fund
January 31, 2014
Portfolio of Investments — continued
| | | | | | | | |
| Security | | Shares | | | Value | |
| | | | | | | | |
| | |
Nigeria (continued) | | | | | | | | |
Lafarge Cement WAPCO Nigeria PLC | | | 2,172,600 | | | $ | 1,423,560 | |
Nestle Nigeria PLC | | | 316,060 | | | | 2,183,221 | |
Nigerian Breweries PLC | | | 3,299,505 | | | | 3,184,789 | |
Oando PLC | | | 17,611,194 | | | | 2,091,335 | |
PZ Cussons Nigeria PLC | | | 1,481,250 | | | | 345,382 | |
Skye Bank PLC | | | 16,027,300 | | | | 384,742 | |
UAC of Nigeria PLC | | | 6,144,089 | | | | 2,573,038 | |
UBA Capital PLC(1) | | | 4,676,946 | | | | 61,570 | |
Unilever Nigeria PLC | | | 2,757,800 | | | | 915,266 | |
United Bank for Africa PLC | | | 34,626,110 | | | | 1,742,139 | |
Zenith Bank PLC | | | 25,374,462 | | | | 3,662,306 | |
| | | | | | | | | |
| | | | | | $ | 34,338,227 | |
| | | | | | | | | |
| | |
Oman — 0.9% | | | | | | | | |
Al Anwar Ceramic Tile Co. | | | 309,100 | | | $ | 483,906 | |
Bank Dhofar SAOG | | | 1,533,131 | | | | 1,466,446 | |
Bank Muscat SAOG | | | 4,050,336 | | | | 6,857,608 | |
Bank Sohar SAOG | | | 5,208,479 | | | | 3,062,964 | |
Dhofar International Development & Investment Holding Co. | | | 275,832 | | | | 439,926 | |
Galfar Engineering & Contracting SAOG | | | 1,882,660 | | | | 1,376,073 | |
HSBC Bank Oman SAOG | | | 1,709,435 | | | | 732,500 | |
National Bank of Oman SAOG | | | 1,368,355 | | | | 1,177,439 | |
Oman Cables Industry SAOG | | | 93,600 | | | | 572,148 | |
Oman Cement Co. SAOG | | | 741,260 | | | | 1,623,881 | |
Oman Flour Mills Co. SAOG | | | 561,100 | | | | 913,895 | |
Oman National Investment Corp. Holdings | | | 272,868 | | | | 387,731 | |
Oman Telecommunications Co. SAOG | | | 1,240,071 | | | | 5,086,153 | |
Omani Qatari Telecommunications Co. SAOG | | | 1,590,700 | | | | 2,479,005 | |
Ominvest | | | 1,243,872 | | | | 1,415,769 | |
Raysut Cement Co. SAOG | | | 634,209 | | | | 3,425,307 | |
Renaissance Services SAOG(1) | | | 1,930,523 | | | | 3,980,834 | |
Shell Oman Marketing Co. SAOG | | | 34,398 | | | | 204,928 | |
| | | | | | | | | |
| | | $ | 35,686,513 | |
| | | | | | | | | |
| | |
Pakistan — 0.9% | | | | | | | | |
Adamjee Insurance Co., Ltd. | | | 1,313,244 | | | $ | 492,968 | |
Azgard Nine, Ltd.(1) | | | 1,954,200 | | | | 180,991 | |
Bank Alfalah, Ltd. | | | 4,021,538 | | | | 1,050,150 | |
D.G. Khan Cement Co., Ltd. | | | 1,053,232 | | | | 959,293 | |
Engro Corp., Ltd.(1) | | | 1,080,287 | | | | 1,820,900 | |
Fauji Fertilizer Bin Qasim, Ltd. | | | 1,184,000 | | | | 476,765 | |
Fauji Fertilizer Co., Ltd. | | | 1,768,610 | | | | 1,895,318 | |
Habib Bank, Ltd. | | | 509,107 | | | | 802,465 | |
Hub Power Co., Ltd. | | | 6,688,300 | | | | 4,096,587 | |
| | | | | | | | |
| Security | | Shares | | | Value | |
| | | | | | | | |
| | |
Pakistan (continued) | | | | | | | | |
Kot Addu Power Co., Ltd. | | | 1,009,900 | | | $ | 612,778 | |
Lucky Cement, Ltd. | | | 878,300 | | | | 2,572,742 | |
Millat Tractors, Ltd. | | | 162,140 | | | | 704,712 | |
Muslim Commercial Bank, Ltd. | | | 2,241,119 | | | | 6,002,687 | |
National Bank of Pakistan | | | 1,284,040 | | | | 708,212 | |
Nishat Mills, Ltd. | | | 1,142,810 | | | | 1,458,461 | |
Oil & Gas Development Co., Ltd. | | | 1,890,991 | | | | 4,896,004 | |
Pakistan Oil Fields, Ltd. | | | 278,600 | | | | 1,396,513 | |
Pakistan Petroleum, Ltd. | | | 1,298,277 | | | | 2,721,909 | |
Pakistan State Oil Co., Ltd. | | | 440,928 | | | | 1,430,184 | |
Pakistan Telecommunication Co., Ltd. | | | 2,612,200 | | | | 707,718 | |
United Bank, Ltd. | | | 745,745 | | | | 945,116 | |
| | |
| | | | | | $ | 35,932,473 | |
| | |
|
Panama — 0.3% | |
Copa Holdings SA, Class A | | | 86,900 | | | $ | 11,357,830 | |
| | |
| | | | | | $ | 11,357,830 | |
| | |
|
Peru — 1.6% | |
Alicorp SA | | | 3,057,200 | | | $ | 9,367,616 | |
Banco Continental SA | | | 391,400 | | | | 762,558 | |
Casa Grande SAA | | | 99,420 | | | | 220,816 | |
Cementos Pacasmayo SAA | | | 241,600 | | | | 467,282 | |
Cia de Minas Buenaventura SA ADR | | | 424,180 | | | | 5,259,832 | |
Cia Minera Milpo SA(1) | | | 567,882 | | | | 404,337 | |
Credicorp, Ltd. | | | 123,694 | | | | 16,317,712 | |
Edegel SA | | | 1,592,100 | | | | 1,387,377 | |
Edelnor SA | | | 108,248 | | | | 172,553 | |
Energia del Sur SA | | | 44,784 | | | | 404,531 | |
Ferreyros SA | | | 5,803,179 | | | | 3,659,107 | |
Grana y Montero SA | | | 1,901,212 | | | | 8,014,319 | |
Intergroup Financial Services Corp. | | | 62,900 | | | | 1,997,075 | |
Luz del Sur SAA | | | 484,850 | | | | 1,511,399 | |
Minsur SA | | | 1,488,259 | | | | 848,777 | |
Sociedad Minera Cerro Verde SAA(1) | | | 44,121 | | | | 975,074 | |
Southern Copper Corp. | | | 380,627 | | | | 10,649,943 | |
Union Andina de Cementos SAA | | | 1,014,000 | | | | 1,214,070 | |
Volcan Cia Minera SA, Class B | | | 5,423,215 | | | | 2,190,034 | |
| | |
| | | | | | $ | 65,824,412 | |
| | |
|
Philippines — 1.5% | |
Aboitiz Equity Ventures, Inc. | | | 3,611,100 | | | $ | 4,131,024 | |
Aboitiz Power Corp. | | | 1,176,200 | | | | 927,877 | |
Alliance Global Group, Inc. | | | 4,540,000 | | | | 2,705,282 | |
Ayala Corp. | | | 192,195 | | | | 2,221,055 | |
| | | | |
| | 17 | | See Notes to Financial Statements. |
Parametric Emerging Markets Fund
January 31, 2014
Portfolio of Investments — continued
| | | | | | | | |
| Security | | Shares | | | Value | |
| | | | | | | | |
|
Philippines (continued) | |
Ayala Land, Inc. | | | 4,730,800 | | | $ | 2,724,645 | |
Ayala Land, Inc., PFC Shares(2) | | | 3,951,800 | | | | 8,720 | |
Bank of the Philippine Islands | | | 1,270,595 | | | | 2,484,659 | |
BDO Unibank, Inc. | | | 1,274,481 | | | | 2,215,008 | |
Bloomberry Resorts Corp.(1) | | | 5,481,900 | | | | 1,057,469 | |
DMCI Holdings, Inc. | | | 1,733,600 | | | | 2,277,307 | |
Energy Development Corp. | | | 6,100,000 | | | | 706,505 | |
Filinvest Land, Inc. | | | 14,494,000 | | | | 418,644 | |
First Gen Corp. | | | 1,768,322 | | | | 609,893 | |
First Philippine Holdings Corp. | | | 228,500 | | | | 321,007 | |
Globe Telecom, Inc. | | | 18,040 | | | | 678,276 | |
Holcim Philippines, Inc. | | | 1,492,000 | | | | 463,147 | |
International Container Terminal Services, Inc. | | | 746,400 | | | | 1,618,236 | |
JG Summit Holding, Inc. | | | 4,019,900 | | | | 3,475,251 | |
Jollibee Foods Corp. | | | 725,800 | | | | 2,427,589 | |
Lopez Holdings Corp. | | | 4,600,000 | | | | 438,590 | |
LT Group, Inc. | | | 4,594,700 | | | | 1,859,938 | |
Manila Electric Co. | | | 271,300 | | | | 1,547,351 | |
Manila Water Co. | | | 727,400 | | | | 369,773 | |
Megaworld Corp. | | | 12,596,000 | | | | 988,987 | |
Metro Pacific Investments Corp. | | | 7,682,400 | | | | 728,081 | |
Metropolitan Bank & Trust Co. | | | 835,191 | | | | 1,395,047 | |
Petron Corp. | | | 2,555,500 | | | | 787,470 | |
Philex Mining Corp.(1) | | | 6,094,825 | | | | 1,244,032 | |
Philex Petroleum Corp.(1) | | | 283,500 | | | | 51,290 | |
Philippine Long Distance Telephone Co. | | | 83,920 | | | | 5,014,503 | |
Puregold Price Club, Inc. | | | 1,549,000 | | | | 1,310,196 | |
Robinsons Land Corp. | | | 2,417,100 | | | | 1,058,224 | |
San Miguel Corp. | | | 716,000 | | | | 880,008 | |
Semirara Mining Corp. | | | 306,600 | | | | 2,164,472 | |
SM Investments Corp. | | | 359,172 | | | | 5,555,640 | |
SM Prime Holdings, Inc. | | | 5,515,999 | | | | 1,883,594 | |
Top Frontier Investment Holdings, Inc.(1) | | | 71,600 | | | | 113,751 | |
Universal Robina Corp. | | | 1,463,200 | | | | 3,808,626 | |
Vista Land & Lifescapes, Inc. | | | 3,675,000 | | | | 420,929 | |
| | |
| | | | | | $ | 63,092,096 | |
| | |
|
Poland — 3.1% | |
Agora SA(1) | | | 134,330 | | | $ | 419,406 | |
AmRest Holdings SE (1) | | | 7,766 | | | | 217,224 | |
Asseco Poland SA | | | 445,726 | | | | 6,495,632 | |
Bank Handlowy w Warszawie SA | | | 50,570 | | | | 1,652,266 | |
Bank Millennium SA(1) | | | 687,285 | | | | 1,766,581 | |
Bank Pekao SA | | | 179,638 | | | | 10,545,122 | |
Bioton SA(1) | | | 425,302 | | | | 503,605 | |
| | | | | | | | |
| Security | | Shares | | | Value | |
| | | | | | | | |
|
Poland (continued) | |
Boryszew SA(1) | | | 1,226,700 | | | $ | 205,998 | |
BRE Bank SA | | | 23,504 | | | | 3,795,978 | |
Budimex SA | | | 25,400 | | | | 1,086,534 | |
Cinema City International NV(1) | | | 71,200 | | | | 767,168 | |
Cyfrowy Polsat SA(1) | | | 1,022,728 | | | | 6,393,162 | |
Enea SA | | | 202,800 | | | | 803,974 | |
Eurocash SA | | | 355,800 | | | | 4,619,080 | |
Getin Holding SA | | | 378,250 | | | | 484,668 | |
Getin Noble Bank SA(1) | | | 2,322,186 | | | | 2,288,413 | |
Globe Trade Centre SA(1) | | | 457,190 | | | | 1,072,526 | |
Grupa Azoty SA | | | 40,250 | | | | 668,126 | |
Grupa Lotos SA(1) | | | 101,253 | | | | 1,132,146 | |
ING Bank Slaski SA(1) | | | 47,450 | | | | 1,795,831 | |
Jastrzebska Spolka Weglowa SA | | | 51,700 | | | | 756,131 | |
Kernel Holding SA(1) | | | 97,900 | | | | 1,180,278 | |
KGHM Polska Miedz SA | | | 195,580 | | | | 6,779,173 | |
KOPEX SA | | | 125,900 | | | | 534,724 | |
LPP SA | | | 1,711 | | | | 4,772,504 | |
Lubelski Wegiel Bogdanka SA | | | 45,700 | | | | 1,812,495 | |
Netia SA(1) | | | 1,111,077 | | | | 1,714,885 | |
NG2 SA | | | 43,900 | | | | 1,655,637 | |
Orbis SA | | | 30,000 | | | | 373,513 | |
Polimex-Mostostal SA(1) | | | 9,735,442 | | | | 399,530 | |
Polish Oil & Gas | | | 2,349,400 | | | | 3,450,532 | |
Polska Grupa Energetyczna SA | | | 1,874,600 | | | | 9,795,478 | |
Polski Koncern Naftowy Orlen SA | | | 435,500 | | | | 5,345,995 | |
Powszechna Kasa Oszczednosci Bank Polski SA | | | 1,151,310 | | | | 14,880,061 | |
Powszechny Zaklad Ubezpieczen SA | | | 86,300 | | | | 11,280,704 | |
Synthos SA | | | 844,500 | | | | 1,354,460 | |
Tauron Polska Energia SA | | | 3,279,494 | | | | 4,443,367 | |
Telekomunikacja Polska SA | | | 1,844,550 | | | | 6,141,262 | |
TVN SA | | | 957,538 | | | | 4,714,300 | |
| | | | | | | | | |
| | | | | | $ | 128,098,469 | |
| | | | | | | | | |
| | |
Qatar — 1.7% | | | | | | | | |
Aamal Co. QSC(1) | | | 169,226 | | | $ | 683,073 | |
Barwa Bank(1)(2) | | | 82,170 | | | | 145,068 | |
Barwa Real Estate Co. | | | 282,093 | | | | 2,414,202 | |
Doha Bank, Ltd. | | | 100,995 | | | | 1,774,233 | |
Gulf International Services QSC | | | 224,525 | | | | 4,670,171 | |
Industries Qatar | | | 292,319 | | | | 14,443,433 | |
Masraf Al Rayan | | | 861,150 | | | | 8,176,197 | |
Qatar Electricity & Water Co. | | | 55,780 | | | | 2,773,276 | |
Qatar Fuel | | | 20,665 | | | | 1,627,698 | |
Qatar Gas Transport Co., Ltd. (NAKILAT) | | | 806,240 | | | | 4,598,541 | |
| | | | |
| | 18 | | See Notes to Financial Statements. |
Parametric Emerging Markets Fund
January 31, 2014
Portfolio of Investments — continued
| | | | | | | | |
| Security | | Shares | | | Value | |
| | | | | | | | |
| | |
Qatar (continued) | | | | | | | | |
Qatar Insurance Co. | | | 47,100 | | | $ | 1,010,584 | |
Qatar International Islamic Bank | | | 45,943 | | | | 856,802 | |
Qatar Islamic Bank | | | 113,487 | | | | 2,339,084 | |
Qatar National Bank | | | 235,174 | | | | 11,906,544 | |
Qatar National Cement Co. | | | 11,550 | | | | 371,107 | |
Qatar National Navigation | | | 89,621 | | | | 2,165,291 | |
Qatar Telecom QSC | | | 195,396 | | | | 7,966,686 | |
United Development Co. | | | 112,224 | | | | 695,820 | |
Vodafone Qatar(1) | | | 845,910 | | | | 2,651,759 | |
| | |
| | | | | | $ | 71,269,569 | |
| | |
| | |
Romania — 0.7% | | | | | | | | |
Banca Transilvania(1) | | | 16,436,222 | | | $ | 8,170,736 | |
Biofarm Bucuresti | | | 8,351,488 | | | | 676,459 | |
BRD-Group Societe Generale(1) | | | 3,791,160 | | | | 10,006,802 | |
OMV Petrom SA | | | 54,160,300 | | | | 7,567,438 | |
Transelectrica SA | | | 391,630 | | | | 1,743,685 | |
TRANSGAZ SA Medias | | | 23,600 | | | | 1,282,502 | |
| | |
| | | | | | $ | 29,447,622 | |
| | |
|
Russia — 6.2% | |
Aeroflot-Russian Airlines | | | 352,600 | | | $ | 833,282 | |
CTC Media, Inc. | | | 525,667 | | | | 6,024,144 | |
Evraz PLC(1) | | | 481,905 | | | | 672,864 | |
Federal Grid Co. Unified Energy System JSC(1) | | | 702,395,282 | | | | 1,688,558 | |
Federal Hydrogenerating Co. JSC | | | 188,947,412 | | | | 2,983,102 | |
Federal Hydrogenerating Co. JSC ADR | | | 348,000 | | | | 543,020 | |
Globaltrans Investment PLC GDR(3) | | | 136,400 | | | | 1,807,446 | |
IDGC Holding JSC(1) | | | 55,701,200 | | | | 1,160,924 | |
LSR Group GDR(3) | | | 186,400 | | | | 653,120 | |
LUKOIL OAO ADR | | | 409,577 | | | | 23,253,228 | |
Magnit OJSC | | | 45,600 | | | | 10,888,961 | |
Magnit OJSC GDR(3) | | | 199,200 | | | | 10,487,026 | |
Magnitogorsk Iron & Steel Works GDR(1)(3) | | | 105,708 | | | | 275,985 | |
Mail.ru Group, Ltd. GDR(3) | | | 169,600 | | | | 6,328,267 | |
Mechel ADR(1) | | | 378,000 | | | | 733,320 | |
MegaFon OAO GDR | | | 104,900 | | | | 3,125,819 | |
MMC Norilsk Nickel | | | 2,386 | | | | 365,879 | |
MMC Norilsk Nickel ADR | | | 492,924 | | | | 7,488,979 | |
Mobile TeleSystems OJSC | | | 1,688,728 | | | | 13,854,298 | |
Mosenergo | | | 8,811,603 | | | | 207,029 | |
NovaTek OAO GDR(3) | | | 81,616 | | | | 9,962,155 | |
Novolipetsk Steel GDR(3) | | | 71,436 | | | | 1,026,929 | |
OAO Gazprom | | | 73,400 | | | | 304,324 | |
OAO Gazprom ADR | | | 4,610,254 | | | | 37,965,580 | |
| | | | | | | | |
| Security | | Shares | | | Value | |
| | | | | | | | |
|
Russia (continued) | |
OAO Inter Rao Ues(1) | | | 3,521,574,300 | | | $ | 1,059,994 | |
OAO TMK GDR(3) | | | 64,757 | | | | 714,831 | |
PIK Group GDR(1)(3) | | | 166,400 | | | | 321,368 | |
Polymetal International PLC | | | 160,500 | | | | 1,510,381 | |
Rosneft Oil Co. GDR(3) | | | 867,350 | | | | 5,931,980 | |
Rostelecom | | | 1,279,622 | | | | 4,032,379 | |
Rostelecom ADR | | | 20,859 | | | | 394,339 | |
Sberbank of Russia | | | 7,838,188 | | | | 21,200,825 | |
Sberbank of Russia ADR | | | 1,431,200 | | | | 15,450,075 | |
Severstal OAO GDR(3) | | | 162,445 | | | | 1,313,161 | |
Sistema JSFC | | | 3,124,700 | | | | 3,702,735 | |
Sistema JSFC GDR(3) | | | 41,430 | | | | 1,116,610 | |
SOLLERS | | | 24,262 | | | | 487,503 | |
Surgutneftegas OJSC ADR | | | 788,903 | | | | 6,057,970 | |
Surgutneftegas OJSC, PFC Shares | | | 6,110,400 | | | | 4,414,281 | |
Tatneft ADR | | | 179,866 | | | | 5,932,233 | |
TGK-2(1) | | | 13,779,634 | | | | 358 | |
Transneft, PFC Shares | | | 1,347 | | | | 3,073,811 | |
United Co. RUSAL PLC(1) | | | 744,000 | | | | 262,270 | |
Uralkali OJSC GDR(3) | | | 210,925 | | | | 5,113,205 | |
VimpelCom, Ltd. ADR | | | 562,884 | | | | 5,454,346 | |
VTB Bank OJSC GDR(3) | | | 2,303,670 | | | | 5,838,096 | |
X5 Retail Group NV GDR(1)(3) | | | 472,594 | | | | 7,954,939 | |
Yandex NV, Class A(1) | | | 385,400 | | | | 14,163,450 | |
| | |
| | | | | | $ | 258,135,379 | |
| | |
|
Slovenia — 0.7% | |
Gorenje DD(1) | | | 301,465 | | | $ | 1,711,855 | |
KRKA DD | | | 125,705 | | | | 10,069,945 | |
Luka Koper | | | 118,550 | | | | 2,166,882 | |
Mercator Poslovni Sistem(1) | | | 18,415 | | | | 1,764,390 | |
Petrol | | | 8,994 | | | | 3,084,782 | |
Reinsurance Co. Sava, Ltd.(1) | | | 159,037 | | | | 2,017,362 | |
Sava DD(1) | | | 18,004 | | | | 9,894 | |
Telekom Slovenije DD | | | 17,842 | | | | 3,189,583 | |
Zavarovalnica Triglav DD | | | 123,739 | | | | 3,758,121 | |
| | |
| | | | | | $ | 27,772,814 | |
| | |
|
South Africa — 5.9% | |
Adcock Ingram Holdings, Ltd. | | | 138,900 | | | $ | 843,359 | |
AECI, Ltd. | | | 73,130 | | | | 850,950 | |
African Bank Investments, Ltd. | | | 1,246,994 | | | | 1,203,056 | |
African Rainbow Minerals, Ltd. | | | 94,900 | | | | 1,875,658 | |
Allied Electronics Corp., Ltd., PFC Shares | | | 186,200 | | | | 385,823 | |
Anglo Platinum, Ltd.(1) | | | 58,680 | | | | 2,343,756 | |
| | | | |
| | 19 | | See Notes to Financial Statements. |
Parametric Emerging Markets Fund
January 31, 2014
Portfolio of Investments — continued
| | | | | | | | |
| Security | | Shares | | | Value | |
| | | | | | | | |
|
South Africa (continued) | |
AngloGold Ashanti, Ltd. | | | 341,471 | | | $ | 4,973,038 | |
Aquarius Platinum, Ltd.(1) | | | 173,100 | | | | 111,953 | |
Arcelormittal South Africa, Ltd.(1) | | | 50,577 | | | | 173,593 | |
Aspen Pharmacare Holdings, Ltd. | | | 212,931 | | | | 4,828,305 | |
Aveng, Ltd.(1) | | | 939,990 | | | | 1,990,891 | |
AVI, Ltd. | | | 206,400 | | | | 957,140 | |
Barclays Africa Group, Ltd. | | | 267,950 | | | | 3,142,413 | |
Barloworld, Ltd. | | | 643,720 | | | | 6,059,557 | |
Bidvest Group, Ltd. | | | 598,396 | | | | 13,386,486 | |
Capital Property Fund | | | 1,259,064 | | | | 1,104,176 | |
Capitec Bank Holdings, Ltd. | | | 26,400 | | | | 447,891 | |
Clicks Group, Ltd. | | | 147,300 | | | | 755,974 | |
DataTec, Ltd. | | | 140,700 | | | | 601,344 | |
Discovery Holdings, Ltd. | | | 294,845 | | | | 1,994,092 | |
FirstRand, Ltd. | | | 1,817,650 | | | | 5,111,288 | |
Foschini, Ltd. | | | 156,100 | | | | 1,307,617 | |
Gold Fields, Ltd. | | | 681,677 | | | | 2,362,902 | |
Grindrod, Ltd. | | | 340,300 | | | | 775,439 | |
Group Five, Ltd. | | | 81,460 | | | | 290,732 | |
Growthpoint Properties, Ltd. | | | 1,017,100 | | | | 2,027,251 | |
Harmony Gold Mining Co., Ltd. | | | 374,410 | | | | 1,070,246 | |
Hyprop Investments, Ltd. | | | 92,800 | | | | 606,844 | |
Illovo Sugar, Ltd. | | | 174,700 | | | | 422,978 | |
Impala Platinum Holdings, Ltd. | | | 490,598 | | | | 5,125,145 | |
Imperial Holdings, Ltd. | | | 149,080 | | | | 2,485,600 | |
Investec, Ltd. | | | 206,500 | | | | 1,322,838 | |
JD Group, Ltd. | | | 103,590 | | | | 262,646 | |
JSE, Ltd. | | | 105,800 | | | | 788,958 | |
Kumba Iron Ore, Ltd. | | | 66,960 | | | | 2,721,622 | |
Kumba Resources, Ltd. | | | 118,010 | | | | 1,593,076 | |
Lewis Group, Ltd. | | | 62,700 | | | | 338,648 | |
Liberty Holdings, Ltd. | | | 126,000 | | | | 1,298,522 | |
Life Healthcare Group Holdings, Ltd. | | | 741,700 | | | | 2,371,888 | |
Massmart Holdings, Ltd. | | | 65,350 | | | | 712,574 | |
Mediclinic International, Ltd. | | | 237,520 | | | | 1,529,359 | |
MMI Holdings, Ltd. | | | 873,296 | | | | 1,855,479 | |
Mondi, Ltd. | | | 91,130 | | | | 1,384,988 | |
Mr. Price Group, Ltd. | | | 146,900 | | | | 1,819,416 | |
MTN Group, Ltd. | | | 2,395,440 | | | | 42,776,213 | |
Murray & Roberts Holdings, Ltd.(1) | | | 851,250 | | | | 1,900,148 | |
Nampak, Ltd. | | | 465,438 | | | | 1,459,052 | |
Naspers, Ltd., Class N | | | 276,242 | | | | 28,419,060 | |
Nedbank Group, Ltd. | | | 148,030 | | | | 2,579,997 | |
Netcare, Ltd. | | | 777,350 | | | | 1,559,112 | |
Northam Platinum, Ltd.(1) | | | 207,738 | | | | 778,231 | |
Pick’n Pay Stores, Ltd. | | | 223,470 | | | | 914,837 | |
| | | | | | | | |
| Security | | Shares | | | Value | |
| | | | | | | | |
|
South Africa (continued) | |
PPC, Ltd. | | | 468,427 | | | $ | 1,256,162 | |
Redefine Properties, Ltd. | | | 2,205,400 | | | | 1,756,796 | |
Remgro, Ltd. | | | 330,100 | | | | 5,521,606 | |
Reunert, Ltd. | | | 382,460 | | | | 2,201,959 | |
RMB Holdings, Ltd. | | | 568,400 | | | | 2,202,248 | |
RMI Holdings | | | 562,900 | | | | 1,243,770 | |
Sanlam, Ltd. | | | 1,292,190 | | | | 5,558,909 | |
Sappi, Ltd. (1) | | | 415,236 | | | | 1,285,117 | |
Sasol, Ltd. | | | 445,050 | | | | 21,413,897 | |
Shoprite Holdings, Ltd. | | | 250,900 | | | | 3,233,751 | |
Sibanye Gold, Ltd. | | | 800,277 | | | | 1,135,354 | |
Spar Group, Ltd. | | | 99,800 | | | | 1,077,719 | |
Standard Bank Group, Ltd. | | | 851,021 | | | | 8,993,169 | |
Steinhoff International Holdings, Ltd. | | | 1,066,540 | | | | 4,405,589 | |
Sun International, Ltd. | | | 30,482 | | | | 269,412 | |
Telkom South Africa, Ltd.(1) | | | 253,050 | | | | 689,379 | |
Tiger Brands, Ltd. | | | 128,800 | | | | 3,090,385 | |
Tongaat-Hulett | | | 70,800 | | | | 772,829 | |
Truworths International, Ltd. | | | 300,800 | | | | 1,984,094 | |
Vodacom Group (Pty), Ltd. | | | 613,500 | | | | 6,495,492 | |
Wilson Bayly Holmes-Ovcon, Ltd. | | | 98,500 | | | | 1,301,494 | |
Woolworths Holdings, Ltd. | | | 459,909 | | | | 2,513,445 | |
| | |
| | | | | | $ | 246,404,737 | |
| | |
|
South Korea — 6.2% | |
AMOREPACIFIC Corp. | | | 1,388 | | | $ | 1,304,658 | |
Asiana Airlines, Inc. (1) | | | 92,200 | | | | 461,449 | |
BS Financial Group, Inc. | | | 116,970 | | | | 1,720,160 | |
Celltrion, Inc. | | | 36,202 | | | | 1,517,402 | |
Cheil Industries, Inc. | | | 34,600 | | | | 2,405,757 | |
Cheil Worldwide, Inc.(1) | | | 51,100 | | | | 1,328,427 | |
CJ CheilJedang Corp. | | | 4,296 | | | | 1,057,836 | |
CJ Corp. | | | 6,100 | | | | 668,987 | |
CJ O Shopping Co., Ltd. | | | 3,130 | | | | 1,172,767 | |
Daelim Industrial Co., Ltd. | | | 8,650 | | | | 661,717 | |
Daewoo Engineering & Construction Co., Ltd.(1) | | | 65,741 | | | | 416,213 | |
Daewoo Industrial Development Co., Ltd.(1)(2) | | | 3,657 | | | | 28,067 | |
Daewoo International Corp. | | | 21,675 | | | | 825,685 | |
Daewoo Securities Co., Ltd. | | | 125,693 | | | | 1,000,699 | |
Daewoo Shipbuilding & Marine Engineering Co., Ltd. | | | 27,380 | | | | 871,325 | |
Daum Communications Corp. | | | 5,600 | | | | 415,644 | |
DGB Financial Group Co., Ltd. | | | 65,650 | | | | 1,016,635 | |
Dong-A Pharmaceutical Co., Ltd. | | | 2,407 | | | | 285,300 | |
Dong-A ST Co., Ltd.(1) | | | 4,078 | | | | 436,118 | |
Dongbu Insurance Co., Ltd. | | | 36,640 | | | | 1,824,442 | |
| | | | |
| | 20 | | See Notes to Financial Statements. |
Parametric Emerging Markets Fund
January 31, 2014
Portfolio of Investments — continued
| | | | | | | | |
| Security | | Shares | | | Value | |
| | | | | | | | |
|
South Korea (continued) | |
Dongkuk Steel Mill Co., Ltd. | | | 27,430 | | | $ | 308,945 | |
Doosan Corp. | | | 3,160 | | | | 401,175 | |
Doosan Heavy Industries & Construction Co., Ltd. | | | 23,400 | | | | 793,673 | |
Doosan Infracore Co., Ltd.(1) | | | 34,600 | | | | 415,421 | |
E-Mart Co., Ltd. | | | 7,728 | | | | 1,862,711 | |
GS Engineering & Construction Corp. | | | 15,070 | | | | 466,927 | |
GS Holdings Corp. | | | 38,400 | | | | 1,820,408 | |
Hana Financial Group, Inc. | | | 151,951 | | | | 5,749,733 | |
Hanjin Kal Corp.(1) | | | 7,983 | | | | 174,338 | |
Hanjin Shipping Co., Ltd.(1) | | | 60,891 | | | | 361,452 | |
Hankook Tire Co., Ltd. | | | 21,623 | | | | 1,237,800 | |
Hanmi Pharmaceutical Co., Ltd.(1) | | | 7,344 | | | | 951,876 | |
Hansol Paper Co., Ltd. | | | 60,500 | | | | 677,932 | |
Hanwha Chemical Corp. | | | 81,490 | | | | 1,496,074 | |
Hanwha Corp. | | | 34,490 | | | | 1,160,652 | |
Hite-Jinro Co., Ltd. | | | 20,121 | | | | 400,574 | |
Honam Petrochemical Corp. | | | 11,770 | | | | 2,279,725 | |
Hynix Semiconductor, Inc.(1) | | | 162,890 | | | | 5,675,727 | |
Hyosung Corp. | | | 21,380 | | | | 1,335,487 | |
Hyundai Department Store Co., Ltd. | | | 7,615 | | | | 1,011,517 | |
Hyundai Development Co. | | | 29,900 | | | | 674,153 | |
Hyundai Engineering & Construction Co., Ltd. | | | 22,070 | | | | 1,192,932 | |
Hyundai Glovis Co., Ltd. | | | 13,870 | | | | 2,929,373 | |
Hyundai Heavy Industries Co., Ltd. | | | 13,270 | | | | 2,742,659 | |
Hyundai Hysco Co., Ltd. | | | 10,067 | | | | 363,112 | |
Hyundai Marine & Fire Insurance Co., Ltd. | | | 38,700 | | | | 1,111,218 | |
Hyundai Merchant Marine Co., Ltd.(1) | | | 48,500 | | | | 652,727 | |
Hyundai Mipo Dockyard Co., Ltd. | | | 3,775 | | | | 605,599 | |
Hyundai Mobis | | | 19,100 | | | | 5,470,399 | |
Hyundai Motor Co. | | | 56,700 | | | | 12,305,327 | |
Hyundai Securities Co., Ltd. | | | 43,870 | | | | 233,789 | |
Hyundai Steel Co. | | | 50,817 | | | | 3,579,144 | |
Hyundai Wia Corp. | | | 5,400 | | | | 805,619 | |
Industrial Bank of Korea | | | 96,580 | | | | 1,114,699 | |
Kangwon Land, Inc. | | | 50,840 | | | | 1,597,874 | |
KB Financial Group, Inc. | | | 198,011 | | | | 6,799,700 | |
KCC Corp. | | | 2,345 | | | | 1,067,981 | |
Kia Motors Corp. | | | 86,120 | | | | 4,296,798 | |
Korea Electric Power Corp.(1) | | | 173,220 | | | | 5,648,338 | |
Korea Express Co., Ltd.(1) | | | 4,349 | | | | 430,881 | |
Korea Gas Corp. | | | 17,570 | | | | 1,082,692 | |
Korea Investment Holdings Co., Ltd. | | | 21,590 | | | | 790,151 | |
Korea Zinc Co., Ltd. | | | 8,940 | | | | 2,846,308 | |
Korean Air Lines Co., Ltd.(1) | | | 28,110 | | | | 895,056 | |
Korean Reinsurance Co. | | | 78,574 | | | | 825,706 | |
KT Corp. | | | 69,653 | | | | 2,015,692 | |
| | | | | | | | |
| Security | | Shares | | | Value | |
| | | | | | | | |
|
South Korea (continued) | |
KT Corp. ADR | | | 16,800 | | | $ | 237,720 | |
KT&G Corp. | | | 42,315 | | | | 2,972,008 | |
Kumho Petro Chemical Co., Ltd. | | | 12,900 | | | | 1,043,802 | |
LG Chem, Ltd. | | | 24,918 | | | | 5,969,096 | |
LG Corp. | | | 43,010 | | | | 2,287,306 | |
LG Display Co., Ltd.(1) | | | 71,100 | | | | 1,660,619 | |
LG Electronics, Inc. | | | 39,320 | | | | 2,394,401 | |
LG Hausys, Ltd. | | | 2,858 | | | | 415,175 | |
LG Household & Health Care, Ltd. | | | 3,550 | | | | 1,571,859 | |
LG International Corp. | | | 20,600 | | | | 566,491 | |
LG Life Sciences, Ltd.(1) | | | 11,000 | | | | 418,150 | |
LG Uplus Corp. | | | 154,920 | | | | 1,586,252 | |
LIG Insurance Co., Ltd. | | | 28,900 | | | | 845,802 | |
Lotte Shopping Co., Ltd. | | | 5,065 | | | | 1,791,845 | |
LS Corp. | | | 7,030 | | | | 548,479 | |
LS Industrial Systems Co., Ltd. | | | 9,200 | | | | 567,883 | |
Macquarie Korea Infrastructure Fund | | | 196,315 | | | | 1,099,935 | |
Mirae Asset Securities Co., Ltd. | | | 15,680 | | | | 519,580 | |
Naver Corp. | | | 8,556 | | | | 5,398,447 | |
NCsoft Corp. | | | 5,150 | | | | 946,716 | |
NHN Entertainment Corp.(1) | | | 4,718 | | | | 332,677 | |
Nong Shim Co., Ltd. | | | 2,500 | | | | 632,876 | |
OCI Co., Ltd. | | | 15,570 | | | | 2,728,805 | |
ORION Corp. | | | 1,700 | | | | 1,382,569 | |
POSCO | | | 44,027 | | | | 12,239,508 | |
S-Oil Corp. | | | 29,385 | | | | 1,866,066 | |
S1 Corp. | | | 9,450 | | | | 685,576 | |
Samsung C&T Corp. | | | 32,720 | | | | 1,779,441 | |
Samsung Card Co., Ltd. | | | 20,460 | | | | 661,692 | |
Samsung Electro-Mechanics Co., Ltd. | | | 17,390 | | | | 1,073,292 | |
Samsung Electronics Co., Ltd. | | | 36,500 | | | | 43,223,606 | |
Samsung Engineering Co., Ltd. | | | 12,600 | | | | 839,508 | |
Samsung Fine Chemicals Co., Ltd. | | | 18,150 | | | | 685,172 | |
Samsung Fire & Marine Insurance Co., Ltd. | | | 22,985 | | | | 5,305,779 | |
Samsung Heavy Industries Co., Ltd. | | | 42,450 | | | | 1,317,165 | |
Samsung Life Insurance Co., Ltd. | | | 59,400 | | | | 5,698,831 | |
Samsung SDI Co., Ltd. | | | 13,350 | | | | 1,771,303 | |
Samsung Securities Co., Ltd. | | | 34,040 | | | | 1,370,350 | |
Samsung Techwin Co., Ltd. | | | 14,795 | | | | 725,362 | |
Shinhan Financial Group Co., Ltd. | | | 242,903 | | | | 10,250,618 | |
Shinsegae Co., Ltd. | | | 5,075 | | | | 1,083,584 | |
SK Broadband Co., Ltd.(1) | | | 155,846 | | | | 684,450 | |
SK C&C Co., Ltd. | | | 7,100 | | | | 820,459 | |
SK Chemicals Co., Ltd. | | | 15,660 | | | | 850,312 | |
SK Holdings Co., Ltd. | | | 6,715 | | | | 1,118,199 | |
SK Innovation Co., Ltd. | | | 38,379 | | | | 4,491,502 | |
| | | | |
| | 21 | | See Notes to Financial Statements. |
Parametric Emerging Markets Fund
January 31, 2014
Portfolio of Investments — continued
| | | | | | | | |
| Security | | Shares | | | Value | |
| | | | | | | | |
|
South Korea (continued) | |
SK Networks Co., Ltd. | | | 64,010 | | | $ | 500,986 | |
SK Telecom Co., Ltd. | | | 28,168 | | | | 5,675,437 | |
STX Pan Ocean Co., Ltd.(1) | | | 2,739 | | | | 10,928 | |
TONGYANG Securities, Inc. | | | 78,565 | | | | 172,935 | |
Woongjin Coway Co., Ltd. | | | 22,950 | | | | 1,487,229 | |
Woori Finance Holdings Co., Ltd. | | | 216,660 | | | | 2,478,628 | |
Woori Investment & Securities Co., Ltd. | | | 78,408 | | | | 661,647 | |
Yuhan Corp. | | | 4,368 | | | | 792,042 | |
Zyle Motor Sales Corp.(1)(2) | | | 5,113 | | | | 28,066 | |
| | |
| | | | | | $ | 258,347,528 | |
| | |
|
Taiwan — 6.5% | |
Acer, Inc.(1) | | | 1,854,990 | | | $ | 1,095,602 | |
Advanced Semiconductor Engineering, Inc. | | | 2,915,135 | | | | 2,671,070 | |
Ambassador Hotel | | | 298,000 | | | | 289,525 | |
AmTRAN Technology Co., Ltd. | | | 650,067 | | | | 419,172 | |
Asia Cement Corp. | | | 1,855,251 | | | | 2,275,462 | |
Asia Optical Co., Inc.(1) | | | 658,907 | | | | 688,258 | |
Asustek Computer, Inc. | | | 354,325 | | | | 3,250,780 | |
AU Optronics Corp.(1) | | | 4,898,837 | | | | 1,423,674 | |
Capital Securities Corp. | | | 711,928 | | | | 276,518 | |
Catcher Technology Co., Ltd. | | | 375,647 | | | | 2,491,732 | |
Cathay Financial Holding Co., Ltd. | | | 4,272,889 | | | | 6,425,585 | |
Chailease Holding Co., Ltd. | | | 371,700 | | | | 916,745 | |
Chang Hwa Commercial Bank | | | 2,646,571 | | | | 1,565,060 | |
Cheng Shin Rubber Industry Co., Ltd. | | | 1,614,672 | | | | 4,093,850 | |
Chicony Electronics Co., Ltd. | | | 334,248 | | | | 853,101 | |
Chimei Innolux Corp.(1) | | | 4,571,281 | | | | 1,585,230 | |
China Airlines, Ltd.(1) | | | 2,591,887 | | | | 911,718 | |
China Development Financial Holding Corp. | | | 7,962,050 | | | | 2,316,450 | |
China Life Insurance Co., Ltd. | | | 1,709,684 | | | | 1,629,345 | |
China Motor Corp. | | | 881,315 | | | | 817,228 | |
China Petrochemical Development Corp. | | | 3,333,659 | | | | 1,470,795 | |
China Steel Corp. | | | 8,601,700 | | | | 7,388,967 | |
Chipbond Technology Corp. | | | 513,000 | | | | 782,104 | |
Chong Hong Construction Co., Ltd. | | | 167,800 | | | | 451,242 | |
Chunghwa Telecom Co., Ltd. | | | 2,915,746 | | | | 8,740,225 | |
Clevo Co. | | | 394,155 | | | | 812,244 | |
Compal Electronics, Inc. | | | 2,454,345 | | | | 1,824,562 | |
Coretronic Corp. | | | 649,505 | | | | 601,661 | |
CTBC Financial Holding Co., Ltd. | | | 7,756,398 | | | | 5,105,918 | |
Delta Electronics, Inc. | | | 796,105 | | | | 4,356,959 | |
Dynapack International Technology Corp. | | | 183,374 | | | | 494,735 | |
E Ink Holdings, Inc.(1) | | | 1,234,000 | | | | 658,564 | |
E.Sun Financial Holding Co., Ltd. | | | 3,484,871 | | | | 2,160,497 | |
| | | | | | | | |
| Security | | Shares | | | Value | |
| | | | | | | | |
|
Taiwan (continued) | |
Elan Microelectronics Corp. | | | 345,300 | | | $ | 596,418 | |
Epistar Corp.(1) | | | 526,472 | | | | 1,169,946 | |
EVA Airways Corp.(1) | | | 1,442,118 | | | | 767,264 | |
Evergreen International Storage & Transport Corp. | | | 868,000 | | | | 583,627 | |
Evergreen Marine Corp.(1) | | | 2,081,252 | | | | 1,220,740 | |
Everlight Electronics Co., Ltd. | | | 406,291 | | | | 965,802 | |
Far Eastern Department Stores, Ltd. | | | 2,016,662 | | | | 1,833,503 | |
Far Eastern New Century Corp. | | | 1,778,105 | | | | 1,833,523 | |
Far EasTone Telecommunications Co., Ltd. | | | 1,673,074 | | | | 3,286,864 | |
Faraday Technology Corp. | | | 406,880 | | | | 510,780 | |
Feng Hsin Iron & Steel Co., Ltd. | | | 183,260 | | | | 313,568 | |
First Financial Holding Co., Ltd. | | | 3,873,253 | | | | 2,315,557 | |
Formosa Chemicals & Fibre Corp. | | | 2,491,399 | | | | 6,525,590 | |
Formosa International Hotels Corp. | | | 132,363 | | | | 1,460,880 | |
Formosa Petrochemical Corp. | | | 1,005,320 | | | | 2,534,942 | |
Formosa Plastics Corp. | | | 3,346,896 | | | | 8,595,312 | |
Formosa Taffeta Co., Ltd. | | | 842,000 | | | | 889,913 | |
Formosan Rubber Group, Inc. | | | 433,000 | | | | 397,179 | |
Foxconn International Holdings, Ltd.(1) | | | 1,391,000 | | | | 690,979 | |
Foxconn Technology Co., Ltd. | | | 527,059 | | | | 1,183,988 | |
Fubon Financial Holding Co., Ltd. | | | 3,531,596 | | | | 4,982,227 | |
Giant Manufacturing Co., Ltd. | | | 352,208 | | | | 2,224,087 | |
Gintech Energy Corp.(1) | | | 731,649 | | | | 743,506 | |
Goldsun Development & Construction Co., Ltd. | | | 1,672,928 | | | | 670,653 | |
Great Wall Enterprise Co., Ltd. | | | 716,068 | | | | 619,157 | |
Highwealth Construction Corp. | | | 305,164 | | | | 611,655 | |
Hon Hai Precision Industry Co., Ltd. | | | 3,933,991 | | | | 10,989,943 | |
Hotai Motor Co., Ltd. | | | 278,000 | | | | 3,374,350 | |
HTC Corp. | | | 392,798 | | | | 1,761,434 | |
Hua Nan Financial Holdings Co., Ltd. | | | 3,878,926 | | | | 2,184,930 | |
Inventec Co., Ltd. | | | 2,015,966 | | | | 1,859,940 | |
Kinsus Interconnect Technology Corp. | | | 182,000 | | | | 627,572 | |
Largan Precision Co., Ltd. | | | 57,795 | | | | 2,219,119 | |
Lite-On Technology Corp. | | | 1,019,083 | | | | 1,509,271 | |
Macronix International Corp., Ltd.(1) | | | 1,202,873 | | | | 264,880 | |
MediaTek, Inc. | | | 434,462 | | | | 5,789,944 | |
Mega Financial Holding Co., Ltd. | | | 4,098,035 | | | | 3,308,664 | |
Merida Industry Co., Ltd. | | | 370,150 | | | | 2,284,914 | |
Motech Industries, Inc.(1) | | | 629,451 | | | | 1,110,586 | |
Nan Kang Rubber Tire Co., Ltd.(1) | | | 1,153,253 | | | | 1,397,573 | |
Nan Ya Plastics Corp. | | | 3,893,214 | | | | 8,484,398 | |
Neo Solar Power Corp.(1) | | | 685,542 | | | | 800,054 | |
Novatek Microelectronics Corp., Ltd. | | | 373,942 | | | | 1,503,244 | |
Pegatron Corp. | | | 925,028 | | | | 1,208,859 | |
Phison Electronics Corp. | | | 112,363 | | | | 703,034 | |
Pou Chen Corp. | | | 2,417,819 | | | | 3,342,250 | |
| | | | |
| | 22 | | See Notes to Financial Statements. |
Parametric Emerging Markets Fund
January 31, 2014
Portfolio of Investments — continued
| | | | | | | | |
| Security | | Shares | | | Value | |
| | | | | | | | |
|
Taiwan (continued) | |
Powertech Technology, Inc. | | | 547,865 | | | $ | 756,012 | |
President Chain Store Corp. | | | 619,664 | | | | 4,149,194 | |
Quanta Computer, Inc. | | | 1,417,508 | | | | 3,469,360 | |
Radiant Opto-Electronics Corp. | | | 281,264 | | | | 1,220,738 | |
Radium Life Tech Co., Ltd. | | | 608,826 | | | | 464,316 | |
Realtek Semiconductor Corp. | | | 429,002 | | | | 1,166,609 | |
RichTek Technology Corp. | | | 101,478 | | | | 525,422 | |
Ruentex Development Co., Ltd. | | | 657,306 | | | | 1,153,614 | |
Ruentex Industries, Ltd. | | | 1,233,060 | | | | 2,960,146 | |
Sanyang Industrial Co., Ltd. | | | 1,819,866 | | | | 2,808,486 | |
Shin Kong Financial Holding Co., Ltd. | | | 4,539,440 | | | | 1,520,263 | |
Shin Kong Synthetic Fibers Corp. | | | 1,321,483 | | | | 432,553 | |
Siliconware Precision Industries Co., Ltd. | | | 1,540,243 | | | | 1,855,657 | |
Simplo Technology Co., Ltd. | | | 205,889 | | | | 943,229 | |
Sino-American Silicon Products, Inc.(1) | | | 576,233 | | | | 1,054,264 | |
SinoPac Financial Holdings Co., Ltd. | | | 4,417,872 | | | | 2,058,419 | |
Solar Applied Materials Technology Corp. | | | 336,245 | | | | 298,992 | |
Synnex Technology International Corp. | | | 730,818 | | | | 1,239,095 | |
Tainan Spinning Co., Ltd. | | | 905,338 | | | | 607,763 | |
Taishin Financial Holdings Co., Ltd. | | | 4,690,423 | | | | 2,214,435 | |
Taiwan Business Bank(1) | | | 1,937,164 | | | | 574,968 | |
Taiwan Cement Corp. | | | 2,568,850 | | | | 3,750,044 | |
Taiwan Cooperative Financial Holding Co., Ltd. | | | 3,331,731 | | | | 1,796,327 | |
Taiwan Fertilizer Co., Ltd. | | | 816,000 | | | | 1,701,652 | |
Taiwan Glass Industry Corp. | | | 542,564 | | | | 530,418 | |
Taiwan Mobile Co., Ltd. | | | 1,805,784 | | | | 5,298,600 | |
Taiwan Semiconductor Manufacturing Co., Ltd. | | | 6,491,465 | | | | 22,353,051 | |
Taiwan Tea Corp.(1) | | | 395,711 | | | | 357,529 | |
Tatung Co., Ltd.(1) | | | 2,377,785 | | | | 680,753 | |
Teco Electric & Machinery Co., Ltd. | | | 1,099,000 | | | | 1,193,640 | |
Tong Yang Industry Co., Ltd. | | | 758,608 | | | | 1,026,510 | |
TPK Holding Co., Ltd. | | | 155,148 | | | | 980,552 | |
Tripod Technology Corp. | | | 396,535 | | | | 719,407 | |
TSRC Corp. | | | 660,060 | | | | 936,057 | |
TTY Biopharm Co., Ltd. | | | 500,778 | | | | 1,481,755 | |
Tung Ho Steel Enterprise Corp. | | | 991,060 | | | | 856,027 | |
U-Ming Marine Transport Corp. | | | 186,000 | | | | 308,615 | |
Uni-President Enterprises Corp. | | | 3,814,252 | | | | 6,259,452 | |
Unimicron Technology Corp. | | | 948,000 | | | | 723,402 | |
United Microelectronics Corp. | | | 5,337,090 | | | | 2,183,947 | |
Walsin Lihwa Corp.(1) | | | 1,921,000 | | | | 596,884 | |
Wan Hai Lines, Ltd. | | | 518,962 | | | | 252,345 | |
Waterland Financial Holdings | | | 1,061,384 | | | | 348,723 | |
Wei Chuan Food Corp. | | | 623,000 | | | | 982,760 | |
Wintek Corp.(1) | | | 1,892,877 | | | | 629,637 | |
Wistron Corp. | | | 1,461,102 | | | | 1,204,989 | |
| | | | | | | | |
| Security | | Shares | | | Value | |
| | | | | | | | |
|
Taiwan (continued) | |
WPG Holdings Co., Ltd. | | | 919,489 | | | $ | 1,066,672 | |
Yageo Corp. | | | 551,600 | | | | 227,100 | |
Yang Ming Marine Transport(1) | | | 1,868,755 | | | | 812,099 | |
Yieh Phui Enterprise(1) | | | 1,687,553 | | | | 542,236 | |
Young Fast Optoelectronics Co., Ltd. | | | 147,302 | | | | 146,992 | |
Yuanta Financial Holding Co., Ltd. | | | 5,532,938 | | | | 3,072,081 | |
Yuen Foong Yu Paper Manufacturing Co., Ltd. | | | 899,120 | | | | 431,096 | |
Yulon Motor Co., Ltd. | | | 1,342,809 | | | | 2,302,858 | |
| | |
| | | | | | $ | 270,324,942 | |
| | |
|
Thailand — 2.9% | |
Advanced Info Service PCL(5) | | | 1,829,700 | | | $ | 11,588,551 | |
Airports of Thailand PCL(5) | | | 667,400 | | | | 3,461,956 | |
AP Thailand PCL | | | 2,877,000 | | | | 378,218 | |
Bangkok Bank PCL | | | 252,500 | | | | 1,309,488 | |
Bangkok Bank PCL(5) | | | 235,700 | | | | 1,222,039 | |
Bangkok Dusit Medical Services PCL(5) | | | 559,400 | | | | 1,997,235 | |
Bangkok Land PCL(5) | | | 9,100,500 | | | | 394,280 | |
Banpu PCL(5) | | | 1,134,000 | | | | 905,897 | |
BEC World PCL(5) | | | 1,752,100 | | | | 2,475,077 | |
Berli Jucker PCL(5) | | | 1,391,100 | | | | 1,905,628 | |
Big C Supercenter PCL(5) | | | 268,600 | | | | 1,424,871 | |
BTS Group Holdings PCL | | | 6,774,200 | | | | 1,650,984 | |
Bumrungrad Hospital PCL(5) | | | 899,500 | | | | 2,293,505 | |
Central Pattana PCL(5) | | | 1,562,400 | | | | 1,775,371 | |
CH. Karnchang PCL(5) | | | 1,608,800 | | | | 701,903 | |
Charoen Pokphand Foods PCL(5) | | | 4,351,000 | | | | 3,750,518 | |
CP ALL PCL(5) | | | 5,769,900 | | | | 6,845,018 | |
Delta Electronics (Thailand) PCL(5) | | | 1,345,400 | | | | 2,156,098 | |
Electricity Generating PCL(5) | | | 316,200 | | | | 1,222,283 | |
Glow Energy PCL(5) | | | 877,300 | | | | 1,797,721 | |
Hana Microelectronics PCL(5) | | | 1,397,700 | | | | 1,048,731 | |
Home Product Center PCL(5) | | | 2,567,800 | | | | 663,284 | |
Indorama Ventures PCL(5) | | | 2,106,900 | | | | 1,320,263 | |
IRPC PCL(5) | | | 12,191,400 | | | | 1,150,791 | |
Italian-Thai Development PCL(1)(5) | | | 9,648,906 | | | | 1,023,169 | |
Kasikornbank PCL(5) | | | 1,176,800 | | | | 6,059,588 | |
Khon Kaen Sugar Industry PCL | | | 1,832,000 | | | | 659,427 | |
Kiatnakin Bank PCL(5) | | | 301,600 | | | | 339,812 | |
Krung Thai Bank PCL(5) | | | 3,910,200 | | | | 1,975,787 | |
L.P.N. Development PCL(5) | | | 1,255,000 | | | | 554,954 | |
Land & Houses PCL(5) | | | 2,593,500 | | | | 677,405 | |
Minor International PCL(5) | | | 2,557,797 | | | | 1,611,586 | |
Pruksa Real Estate PCL(5) | | | 1,602,000 | | | | 856,802 | |
PTT Exploration & Production PCL(5) | | | 1,476,598 | | | | 6,842,137 | |
| | | | |
| | 23 | | See Notes to Financial Statements. |
Parametric Emerging Markets Fund
January 31, 2014
Portfolio of Investments — continued
| | | | | | | | |
| Security | | Shares | | | Value | |
| | | | | | | | |
|
Thailand (continued) | |
PTT Global Chemical PCL(5) | | | 1,844,950 | | | $ | 3,971,587 | |
PTT PCL(5) | | | 903,760 | | | | 7,549,463 | |
Quality House PCL(5) | | | 8,677,625 | | | | 675,494 | |
Ratchaburi Electricity Generating Holding PCL(5) | | | 676,000 | | | | 978,233 | |
Samart Corp. PCL(5) | | | 1,846,300 | | | | 813,775 | |
Siam Cement PCL (The)(5) | | | 311,300 | | | | 3,795,396 | |
Siam City Cement PCL(5) | | | 63,690 | | | | 685,904 | |
Siam Commercial Bank PCL(5) | | | 1,626,100 | | | | 7,325,037 | |
Sino Thai Engineering & Construction PCL(5) | | | 2,449,157 | | | | 978,533 | |
Thai Airways International PCL(5) | | | 1,332,800 | | | | 567,755 | |
Thai Beverage PCL(5) | | | 13,827,000 | | | | 5,929,436 | |
Thai Oil PCL(5) | | | 857,600 | | | | 1,367,404 | |
Thai Tap Water Supply Co., Ltd.(5) | | | 3,598,200 | | | | 1,051,451 | |
Thai Union Frozen Products PCL(5) | | | 1,086,302 | | | | 2,294,027 | |
Thanachart Capital PCL(5) | | | 779,400 | | | | 730,605 | |
Thoresen Thai Agencies PCL(1)(5) | | | 1,318,656 | | | | 694,017 | |
TMB Bank PCL(5) | | | 27,016,400 | | | | 1,862,608 | |
Total Access Communication PCL(5) | | | 1,130,500 | | | | 3,217,650 | |
TPI Polene PCL(5) | | | 1,115,200 | | | | 354,575 | |
True Corp. PCL(1)(5) | | | 8,208,197 | | | | 1,790,401 | |
| | |
| | | | | | $ | 120,673,728 | |
| | |
|
Turkey — 3.0% | |
Akbank TAS | | | 3,146,933 | | | $ | 8,050,526 | |
Akcansa Cimento AS | | | 126,800 | | | | 639,767 | |
Akenerji Elektrik Uretim AS(1) | | | 598,472 | | | | 265,007 | |
Aksa Akrilik Kimya Sanayii AS | | | 185,209 | | | | 613,950 | |
Albaraka Turk Katilim Bankasi AS(1) | | | 522,467 | | | | 331,356 | |
Anadolu Efes Biracilik ve Malt Sanayii AS | | | 359,039 | | | | 3,639,681 | |
Arcelik AS | | | 524,754 | | | | 2,592,657 | |
Asya Katilim Bankasi AS(1) | | | 944,900 | | | | 452,507 | |
Aygaz AS | | | 191,813 | | | | 647,121 | |
Bagfas Bandirma Gubre Fabrikalari AS | | | 40,900 | | | | 594,143 | |
BIM Birlesik Magazalar AS | | | 403,820 | | | | 6,907,966 | |
Cimsa Cimento Sanayi ve Ticaret AS | | | 141,400 | | | | 718,390 | |
Coca-Cola Icecek AS | | | 141,600 | | | | 2,965,123 | |
Dogan Sirketler Grubu Holding AS(1) | | | 4,298,609 | | | | 1,333,075 | |
Dogan Yayin Holding AS(1) | | | 2,624,303 | | | | 604,403 | |
Eczacibasi Ilac Sanayi ve Ticaret AS | | | 557,300 | | | | 525,774 | |
Emlak Konut Gayrimenkul Yatirim Ortakligi AS | | | 2,927,700 | | | | 2,779,843 | |
Enka Insaat ve Sanayi AS | | | 1,663,355 | | | | 4,744,907 | |
Eregli Demir ve Celik Fabrikalari TAS | | | 5,387,451 | | | | 6,476,471 | |
Ford Otomotiv Sanayi AS | | | 128,600 | | | | 1,128,027 | |
Gubre Fabrikalari TAS(1) | | | 490,400 | | | | 715,535 | |
Haci Omer Sabanci Holding AS | | | 1,437,018 | | | | 4,764,797 | |
| | | | | | | | |
| Security | | Shares | | | Value | |
| | | | | | | | |
|
Turkey (continued) | |
Ihlas Holding AS(1) | | | 4,223,700 | | | $ | 673,769 | |
Is Gayrimenkul Yatirim Ortakligi AS | | | 553,650 | | | | 309,254 | |
Kardemir Karabuk Demir Celik Sanayi ve Ticaret AS, Class D(1) | | | 4,080,528 | | | | 1,754,228 | |
KOC Holding AS | | | 2,114,960 | | | | 7,187,649 | |
Koza Altin Isletmeleri AS | | | 152,600 | | | | 1,290,477 | |
Koza Anadolu Metal Madencilik Isletmeleri AS(1) | | | 780,100 | | | | 757,232 | |
Petkim Petrokimya Holding AS(1) | | | 1,455,661 | | | | 1,633,215 | |
Sekerbank TAS(1) | | | 747,999 | | | | 671,186 | |
TAV Havalimanlari Holding AS | | | 440,300 | | | | 3,312,364 | |
Tekfen Holding AS | | | 888,117 | | | | 1,859,998 | |
Tofas Turk Otomobil Fabrikasi AS | | | 252,600 | | | | 1,188,170 | |
Trakya Cam Sanayii AS | | | 1,385,367 | | | | 1,283,253 | |
Tupras-Turkiye Petrol Rafinerileri AS | | | 368,970 | | | | 6,081,848 | |
Turcas Petrolculuk AS | | | 395,759 | | | | 401,539 | |
Turk Hava Yollari Anonim Ortakligi (THY) AS | | | 1,718,245 | | | | 5,136,908 | |
Turk Sise ve Cam Fabrikalari AS | | | 2,382,662 | | | | 2,638,973 | |
Turk Telekomunikasyon AS | | | 1,348,500 | | | | 3,352,615 | |
Turkcell Iletisim Hizmetleri AS(1) | | | 1,856,400 | | | | 9,169,990 | |
Turkiye Garanti Bankasi AS | | | 3,413,200 | | | | 9,036,650 | |
Turkiye Halk Bankasi AS | | | 1,017,500 | | | | 5,040,159 | |
Turkiye Is Bankasi | | | 2,426,907 | | | | 4,362,845 | |
Turkiye Sinai Kalkinma Bankasi AS | | | 476,663 | | | | 359,635 | |
Turkiye Vakiflar Bankasi TAO | | | 1,413,300 | | | | 2,166,050 | |
Ulker Gida Sanayi ve Ticaret AS | | | 277,059 | | | | 1,706,157 | |
Yapi ve Kredi Bankasi AS | | | 953,085 | | | | 1,346,070 | |
Yazicilar Holding AS | | | 156,400 | | | | 1,233,051 | |
Zorlu Enerji Elektrik Uretim AS(1) | | | 299,054 | | | | 125,918 | |
| | |
| | | | | | $ | 125,570,229 | |
| | |
|
Ukraine — 0.1% | |
Astarta Holding NV(1) | | | 43,910 | | | $ | 921,612 | |
Avangardco Investments Public, Ltd. GDR(1) | | | 53,218 | | | | 612,574 | |
Ferrexpo PLC | | | 1,008,205 | | | | 2,510,583 | |
MHP SA GDR(3) | | | 91,701 | | | | 1,383,332 | |
| | |
| | | | | | $ | 5,428,101 | |
| | |
|
United Arab Emirates — 1.7% | |
Aabar Investments (PJSC)(1)(2) | | | 2,497,440 | | | $ | 0 | |
Abu Dhabi Commercial Bank (PJSC) | | | 2,930,000 | | | | 5,278,093 | |
Abu Dhabi National Hotels | | | 718,461 | | | | 678,883 | |
Agthia Group (PJSC) | | | 1,252,100 | | | | 1,651,522 | |
Air Arabia (PJSC) | | | 14,733,200 | | | | 6,125,173 | |
Ajman Bank (PJSC)(1) | | | 709,500 | | | | 547,640 | |
Aldar Properties (PJSC) | | | 3,314,659 | | | | 3,022,668 | |
| | | | |
| | 24 | | See Notes to Financial Statements. |
Parametric Emerging Markets Fund
January 31, 2014
Portfolio of Investments — continued
| | | | | | | | |
| Security | | Shares | | | Value | |
| | | | | | | | |
|
United Arab Emirates (continued) | |
Amlak Finance (PJSC)(1)(2) | | | 227,500 | | | $ | 0 | |
Arabtec Holding Co.(1) | | | 10,233,936 | | | | 11,989,007 | |
Aramex (PJSC) | | | 374,500 | | | | 309,132 | |
DP World, Ltd. | | | 661,916 | | | | 12,067,411 | |
Dubai Financial Market(1) | | | 2,424,500 | | | | 1,678,520 | |
Dubai Investments (PJSC) | | | 749,225 | | | | 562,997 | |
Emaar Properties (PJSC) | | | 4,065,400 | | | | 8,848,064 | |
First Gulf Bank (PJSC) | | | 1,090,240 | | | | 5,905,302 | |
National Bank of Abu Dhabi (PJSC) | | | 2,011,863 | | | | 8,335,760 | |
Ras Al Khaimah Properties (PJSC) | | | 1,276,300 | | | | 401,508 | |
Union National Bank | | | 1,523,438 | | | | 2,847,752 | |
Waha Capital (PJSC) | | | 1,349,751 | | | | 1,123,330 | |
| | |
| | | | | | $ | 71,372,762 | |
| | |
|
Vietnam — 0.8% | |
Bank for Foreign Trade of Vietnam JSC | | | 1,353,440 | | | $ | 1,829,847 | |
Baoviet Holdings | | | 676,500 | | | | 1,491,610 | |
Development Investment Construction Corp. | | | 220,934 | | | | 136,031 | |
FPT Corp. | | | 676,666 | | | | 1,781,582 | |
Gemadept Corp. | | | 312,000 | | | | 518,537 | |
Hagl JSC | | | 1,488,938 | | | | 1,550,500 | |
HCM City Infrastructure Investment JSC | | | 547,500 | | | | 516,314 | |
Hoa Phat Group JSC | | | 1,239,332 | | | | 2,676,732 | |
Kim Long Securities Corp.(1) | | | 1,377,700 | | | | 624,873 | |
Kinh Bac City Development Share Holding Corp.(1) | | | 328,860 | | | | 167,360 | |
Kinhdo Corp. | | | 606,900 | | | | 1,636,969 | |
Masan Group Corp.(1) | | | 315,390 | | | | 1,421,595 | |
PetroVietnam Construction JSC(1) | | | 919,725 | | | | 131,732 | |
PetroVietnam Drilling and Well Services JSC | | | 645,791 | | | | 2,199,613 | |
PetroVietnam Fertilizer and Chemical JSC | | | 880,500 | | | | 1,890,979 | |
PetroVietnam Technical Services JSC | | | 1,713,000 | | | | 2,259,644 | |
Pha Lai Thermal Power JSC | | | 483,390 | | | | 597,455 | |
Phu Nhuan Jewelry JSC | | | 181,200 | | | | 266,247 | |
Refrigeration Electrical Engineering Corp. | | | 1,182,100 | | | | 1,941,725 | |
Saigon Securities, Inc. | | | 882,600 | | | | 964,455 | |
Song Da Urban & Industrial Zone Investment and Development JSC(1) | | | 153,250 | | | | 174,966 | |
Tan Tao Investment Industry Co.(1) | | | 1,554,838 | | | | 533,752 | |
Vietnam Construction and Import-Export JSC(1) | | | 621,655 | | | | 327,135 | |
Vietnam Dairy Products JSC | | | 519,727 | | | | 3,483,513 | |
Vietnam Joint Stock Commercial Bank for Industry and Trade | | | 2,825,273 | | | | 2,271,064 | |
Vincom JSC(1) | | | 1,176,119 | | | | 4,268,993 | |
| | |
| | | | | | $ | 35,663,223 | |
| | |
| |
Total Common Stocks
(identified cost $4,028,901,691) | | | $ | 4,112,943,860 | |
| | |
| | | | | | | | |
| Corporate Bonds — 0.0%(4) | |
| | |
| | | | | | | | |
| Security | | Principal
Amount
(000’s omitted) | | | Value | |
| | | | | | | | |
| | |
India — 0.0%(4) | | | | | | | | |
Dr. Reddy’s Laboratories, Ltd., 9.25%, 3/24/14 | | INR | 1,240 | | | $ | 21,288 | |
| | | | | | | | | |
| | |
Total Corporate Bonds
(identified cost $27,437) | | | | | | $ | 21,288 | |
| | | | | | | | | |
| | | | | | | | | | | | |
|
| Equity-Linked Securities(6)(7) — 0.9% | |
| | | |
| | | | | | | | | | | | |
| Security | | Maturity
Date | | | Shares | | | Value | |
| | | | | | | | | | | | |
| | | |
Saudi Arabia — 0.9% | | | | | | | | | | | | |
Abdullah Al Othaim Markets | | | 8/13/14 | | | | 18,000 | | | $ | 678,527 | |
Al Abdullatif Industrial Investment Co. | | | 5/4/15 | | | | 64,200 | | | | 661,616 | |
Al Rajhi Bank | | | 2/16/15 | | | | 137,993 | | | | 2,635,383 | |
Al Tayyar | | | 7/2/15 | | | | 42,100 | | | | 1,198,318 | |
Alinma Bank | | | 2/23/15 | | | | 250,600 | | | | 1,107,539 | |
Almarai Co. | | | 11/24/14 | | | | 59,399 | | | | 948,302 | |
Arab National Bank | | | 5/11/15 | | | | 59,500 | | | | 502,126 | |
Bank Albilad | | | 4/30/15 | | | | 83,166 | | | | 899,203 | |
Banque Saudi Fransi | | | 2/23/15 | | | | 75,630 | | | | 694,715 | |
Dar Al Arkan Real Estate Development | | | 8/10/15 | | | | 185,500 | | | | 492,150 | |
Etihad Etissalat Co | | | 12/5/14 | | | | 134,038 | | | | 3,140,624 | |
Fawaz Abdulaziz Alhokair Co. | | | 2/23/15 | | | | 30,000 | | | | 1,171,875 | |
Jarir Marketing Co. | | | 5/4/15 | | | | 25,425 | | | | 1,180,442 | |
Mobile Telecommunications Co. | | | 5/4/15 | | | | 227,977 | | | | 545,560 | |
National Industrialization Co. | | | 5/4/15 | | | | 156,903 | | | | 1,265,548 | |
Rabigh Refining and Petrochemicals Co. | | | 10/13/14 | | | | 92,400 | | | | 644,268 | |
Riyad Bank | | | 12/15/14 | | | | 80,600 | | | | 791,947 | |
Sahara Petrochemical Co. | | | 9/21/15 | | | | 122,800 | | | | 710,521 | |
Samba Financial Group | | | 2/10/15 | | | | 82,008 | | | | 1,164,391 | |
Saudi Airlines Catering Co. | | | 8/3/15 | | | | 5,500 | | | | 220,710 | |
Saudi Arabian Amiantit Co. | | | 5/11/15 | | | | 106,500 | | | | 441,570 | |
Saudi Arabian Fertilizer Co. | | | 5/11/15 | | | | 28,633 | | | | 1,234,904 | |
Saudi Arabian Mining Co. | | | 5/11/15 | | | | 54,900 | | | | 443,543 | |
Saudi Basic Industries Corp | | | 2/23/15 | | | | 107,696 | | | | 3,201,824 | |
Saudi British Bank | | | 3/27/15 | | | | 62,300 | | | | 767,455 | |
Saudi Cable Co. | | | 8/10/15 | | | | 97,900 | | | | 310,637 | |
Saudi Cement Co. | | | 8/10/15 | | | | 25,900 | | | | 738,935 | |
Saudi Chemical Co. | | | 5/1/15 | | | | 25,900 | | | | 398,819 | |
Saudi Electricity Co. | | | 3/27/15 | | | | 268,400 | | | | 1,052,021 | |
Saudi Industrial Investment Group | | | 3/27/15 | | | | 95,000 | | | | 937,232 | |
Saudi International Petrochemical Co. | | | 3/27/15 | | | | 40,200 | | | | 338,717 | |
Saudi Kayan Petrochemical Co. | | | 3/27/15 | | | | 247,500 | | | | 923,893 | |
| | | | |
| | 25 | | See Notes to Financial Statements. |
Parametric Emerging Markets Fund
January 31, 2014
Portfolio of Investments — continued
| | | | | | | | | | | | |
| Security | | Maturity
Date | | | Shares | | | Value | |
| | | | | | | | | | | | |
| | | |
Saudi Arabia (continued) | | | | | | | | | | | | |
Saudi Telecom Co. | | | 5/11/15 | | | | 98,200 | | | $ | 1,597,213 | |
Savola Group | | | 2/2/15 | | | | 115,300 | | | | 1,783,115 | |
Yanbu National Petrochemical Co. | | | 3/9/15 | | | | 51,400 | | | | 1,000,480 | |
| | | | | | | | | | | | | |
| | | |
Total Equity-Linked Securities
(identified cost $28,212,502) | | | | | | | | | | $ | 35,824,123 | |
| | | | | | | | | | | | | |
| | | | | | | | |
| | |
| Investment Funds — 0.1% | | | | | | | | |
| | |
| | | | | | | | |
| Security | | Shares | | | Value | |
| | | | | | | | |
Vietnam Enterprise Investments, Ltd.(1) | | | 1,239,727 | | | $ | 3,285,277 | |
| | | | | | | | | |
| | |
Total Investment Funds
(identified cost $5,027,204) | | | | | | $ | 3,285,277 | |
| | | | | | | | | |
|
| Rights(1) — 0.0% | |
| | |
| | | | | | | | |
| Security | | Shares | | | Value | |
Citadel Capital Co., Exp. 2/13/14 | | | 1,905,620 | | | $ | 0 | |
Marfrig Global Foods SA, Exp. 2/27/14 | | | 119 | | | | 0 | |
Polimex-Mostostal SA | | | 3,081,072 | | | | 0 | |
| | | | | | | | | |
| | |
Total Rights
(identified cost $0) | | | | | | $ | 0 | |
| | | | | | | | | |
|
| Warrants(1) — 0.0%(4) | |
| | |
| | | | | | | | |
| Security | | Shares | | | Value | |
Malaysian Resources Corp. Bhd, Exp. 9/16/18, Strike MYR 2.30 | | | 474,500 | | | $ | 31,903 | |
WCT Bhd, Exp. 12/11/17, Strike MYR 2.25 | | | 135,200 | | | | 15,756 | |
| | | | | | | | | |
| |
Total Warrants
(identified cost $43,532) | | | $ | 47,659 | |
| | |
| | | | | | | | |
| Short-Term Investments — 0.0%(4) | |
| | |
| | | | | | | | |
| Description | | Principal Amount (000’s omitted) | | | Value | |
| | | | | | | | |
State Street Bank and Trust Euro Time Deposit, 0.01%, 2/3/14 | | $ | 408 | | | $ | 407,955 | |
| | | | | | | | | |
| |
Total Short-Term Investments
(identified cost $407,955) | | | $ | 407,955 | |
| | | | | | | | | |
| |
Total Investments — 99.6%
(identified cost $4,062,620,321) | | | $ | 4,152,530,162 | |
| | | | | | | | | |
| |
Other Assets, Less Liabilities — 0.4% | | | $ | 15,907,174 | |
| | | | | | | | | |
| |
Net Assets — 100.0% | | | $ | 4,168,437,336 | |
| | | | | | | | | |
The percentage shown for each investment category in the Portfolio of Investments is based on net assets.
| | | | |
| ADR | | – | | American Depositary Receipt |
| BDR | | – | | Brazilian Depositary Receipt |
| GDR | | – | | Global Depositary Receipt |
| PCL | | – | | Public Company Ltd. |
| PFC Shares | | – | | Preference Shares |
| | | | |
| INR | | – | | Indian Rupee |
| MYR | | – | | Malaysian Ringgit |
| (1) | Non-income producing security. |
| (2) | For fair value measurement disclosure purposes, security is categorized as Level 3 (see Note 11). |
| (3) | Security exempt from registration under Regulation S of the Securities Act of 1933, which exempts from registration securities offered and sold outside the United States. Security may not be offered or sold in the United States except pursuant to an exemption from, or in a transaction not subject to, the registration requirements of the Securities Act of 1933. At January 31, 2014, the aggregate value of these securities is $86,703,494 or 2.1% of the Fund’s net assets. |
| (4) | Amount is less than 0.05%. |
| (5) | Indicates a foreign registered security. Shares issued to foreign investors in markets that have foreign ownership limits. |
| (6) | Security whose performance, including redemption at maturity, is linked to the price of the underlying equity security. The investment is subject to credit risk of the issuing financial institution (HSBC Bank plc) in addition to the market risk of the underlying security. |
| (7) | Security exempt from registration pursuant to Rule 144A under the Securities Act of 1933. These securities may be sold in certain transactions (normally to qualified institutional buyers) and remain exempt from registration. At January 31, 2014, the aggregate value of these securities is $35,824,123 or 0.9% of the Fund’s net assets. |
| | | | |
| | 26 | | See Notes to Financial Statements. |
Parametric Emerging Markets Fund
January 31, 2014
Portfolio of Investments — continued
| | | | | | | | |
| Currency Concentration of Portfolio | |
| | |
| | | | | | | | |
| Currency | | Percentage
of Net Assets | | | Value | |
United States Dollar | | | 12.7 | % | | $ | 531,530,542 | |
Hong Kong Dollar | | | 7.9 | | | | 330,193,984 | |
New Taiwan Dollar | | | 6.5 | | | | 269,633,963 | |
Indian Rupee | | | 6.4 | | | | 268,940,578 | |
South Korean Won | | | 6.2 | | | | 258,109,808 | |
South African Rand | | | 5.9 | | | | 246,292,784 | |
Brazilian Real | | | 5.4 | | | | 227,265,671 | |
Mexican Peso | | | 5.3 | | | | 221,006,138 | |
Indonesian Rupiah | | | 3.3 | | | | 136,761,421 | |
Malaysian Ringgit | | | 3.2 | | | | 133,315,670 | |
Polish Zloty | | | 3.1 | | | | 129,020,081 | |
New Turkish Lira | | | 3.0 | | | | 125,570,229 | |
Chilean Peso | | | 2.8 | | | | 115,812,442 | |
Thai Baht | | | 2.7 | | | | 113,624,492 | |
Euro | | | 2.3 | | | | 94,564,149 | |
Egyptian Pound | | | 2.0 | | | | 83,012,085 | |
Qatari Riyal | | | 1.7 | | | | 71,269,569 | |
Kuwaiti Dinar | | | 1.6 | | | | 67,256,891 | |
Hungarian Forint | | | 1.6 | | | | 65,969,555 | |
Czech Koruna | | | 1.6 | | | | 65,969,106 | |
United Arab Emirates Dirham | | | 1.6 | | | | 64,971,570 | |
Philippine Peso | | | 1.5 | | | | 63,092,096 | |
Colombian Peso | | | 1.3 | | | | 52,837,321 | |
Other currency, less than 1% each | | | 10.0 | | | | 416,510,017 | |
| | |
Total Investments | | | 99.6 | % | | $ | 4,152,530,162 | |
| | |
| | | | | | | | |
| Sector Classification of Portfolio | |
| | |
| | | | | | | | |
| Sector | | Percentage
of Net Assets | | | Value | |
Financials | | | 26.7 | % | | $ | 1,112,089,150 | |
Materials | | | 10.6 | | | | 440,638,009 | |
Industrials | | | 10.5 | | | | 439,431,532 | |
Telecommunication Services | | | 10.1 | | | | 420,681,694 | |
Energy | | | 9.9 | | | | 414,552,759 | |
Consumer Staples | | | 8.6 | | | | 359,829,697 | |
Information Technology | | | 8.1 | | | | 338,381,209 | |
Consumer Discretionary | | | 8.0 | | | | 332,067,395 | |
Utilities | | | 4.6 | | | | 190,211,334 | |
Health Care | | | 2.4 | | | | 100,932,863 | |
Investment Funds | | | 0.1 | | | | 3,285,277 | |
Other | | | 0.0 | (1) | | | 429,243 | |
| | |
Total Investments | | | 99.6 | % | | $ | 4,152,530,162 | |
| | |
| (1) | Amount is less than 0.05%. |
| | | | |
| | 27 | | See Notes to Financial Statements. |
Parametric Emerging Markets Fund
January 31, 2014
Statement of Assets and Liabilities
| | | | |
| Assets | | January 31, 2014 | |
Investments, at value (identified cost, $4,062,620,321) | | $ | 4,152,530,162 | |
Cash | | | 1,121,681 | |
Foreign currency, at value (identified cost, $5,866,354) | | | 5,815,232 | |
Dividends and interest receivable | | | 2,897,220 | |
Receivable for investments sold | | | 9,584,323 | |
Receivable for Fund shares sold | | | 11,545,527 | |
Tax reclaims receivable | | | 276,285 | |
Total assets | | $ | 4,183,770,430 | |
|
| Liabilities | |
Demand note payable | | $ | 300,000 | |
Payable for Fund shares redeemed | | | 8,893,003 | |
Payable to affiliates: | | | | |
Investment adviser fee | | | 2,838,783 | |
Administration fee | | | 548,647 | |
Distribution and service fees | | | 185,044 | |
Accrued foreign capital gains taxes | | | 1,236,331 | |
Accrued expenses | | | 1,331,286 | |
Total liabilities | | $ | 15,333,094 | |
Net Assets | | $ | 4,168,437,336 | |
|
| Sources of Net Assets | |
Paid-in capital | | $ | 4,111,817,056 | |
Accumulated net realized loss | | | (16,768,171 | ) |
Accumulated distributions in excess of net investment income | | | (15,150,494 | ) |
Net unrealized appreciation | | | 88,538,945 | |
Total | | $ | 4,168,437,336 | |
| |
| Investor Class Shares | | | | |
Net Assets | | $ | 755,767,914 | |
Shares Outstanding | | | 53,699,058 | |
Net Asset Value, Offering Price and Redemption Price Per Share | | | | |
(net assets ÷ shares of beneficial interest outstanding) | | $ | 14.07 | |
| |
| Class C Shares | | | | |
Net Assets | | $ | 19,779,054 | |
Shares Outstanding | | | 1,416,815 | |
Net Asset Value and Offering Price Per Share* | | | | |
(net assets ÷ shares of beneficial interest outstanding) | | $ | 13.96 | |
|
| Institutional Class Shares | |
Net Assets | | $ | 3,392,890,368 | |
Shares Outstanding | | | 240,393,826 | |
Net Asset Value, Offering Price and Redemption Price Per Share | | | | |
(net assets ÷ shares of beneficial interest outstanding) | | $ | 14.11 | |
| * | Redemption price per share is equal to the net asset value less any applicable contingent deferred sales charge. |
| | | | |
| | 28 | | See Notes to Financial Statements. |
Parametric Emerging Markets Fund
January 31, 2014
Statement of Operations
| | | | |
| Investment Income | | Year Ended January 31, 2014 | |
Dividends (net of foreign taxes, $12,422,827) | | $ | 108,888,516 | |
Interest (net of foreign taxes, $247) | | | 4,404 | |
Total investment income | | $ | 108,892,920 | |
| |
| Expenses | | | | |
Investment adviser fee | | $ | 31,650,266 | |
Administration fee | | | 6,105,053 | |
Distribution and service fees | | | | |
Investor Class | | | 2,181,696 | |
Class C | | | 220,815 | |
Trustees’ fees and expenses | | | 68,000 | |
Custodian fee | | | 5,263,917 | |
Transfer and dividend disbursing agent fees | | | 1,992,046 | |
Legal and accounting services | | | 153,984 | |
Printing and postage | | | 206,283 | |
Registration fees | | | 377,052 | |
Stock dividend tax | | | 144,579 | |
Miscellaneous | | | 189,337 | |
Total expenses | | $ | 48,553,028 | |
Deduct — | | | | |
Reduction of custodian fee | | $ | 320 | |
Total expense reductions | | $ | 320 | |
| |
Net expenses | | $ | 48,552,708 | |
| |
Net investment income | | $ | 60,340,212 | |
| |
| Realized and Unrealized Gain (Loss) | | | | |
Net realized gain (loss) — | | | | |
Investment transactions (net of foreign capital gains taxes of $658) | | $ | 52,492,095 | |
Foreign currency transactions | | | (1,926,104 | ) |
Net realized gain | | $ | 50,565,991 | |
Change in unrealized appreciation (depreciation) — | | | | |
Investments (net of increase in accrued foreign capital gains taxes of $788,430) | | $ | (361,631,680 | ) |
Foreign currency | | | (149,271 | ) |
Net change in unrealized appreciation (depreciation) | | $ | (361,780,951 | ) |
| |
Net realized and unrealized loss | | $ | (311,214,960 | ) |
| |
Net decrease in net assets from operations | | $ | (250,874,748 | ) |
| | | | |
| | 29 | | See Notes to Financial Statements. |
Parametric Emerging Markets Fund
January 31, 2014
Statements of Changes in Net Assets
| | | | | | | | |
| | | Year Ended January 31, | |
| Increase (Decrease) in Net Assets | | 2014 | | | 2013 | |
From operations — | | | | | | | | |
Net investment income | | $ | 60,340,212 | | | $ | 41,883,282 | |
Net realized gain (loss) from investment and foreign currency transactions | | | 50,565,991 | | | | (11,146,455 | ) |
Net change in unrealized appreciation (depreciation) from investments and foreign currency | | | (361,780,951 | ) | | | 313,232,350 | |
Net increase (decrease) in net assets from operations | | $ | (250,874,748 | ) | | $ | 343,969,177 | |
Distributions to shareholders — | | | | | | | | |
From net investment income | | | | | | | | |
Investor Class | | $ | (10,167,892 | ) | | $ | (8,541,444 | ) |
Class C | | | (104,628 | ) | | | (112,543 | ) |
Institutional Class | | | (53,474,366 | ) | | | (35,860,230 | ) |
Tax return of capital | | | | | | | | |
Investor Class | | | — | | | | (501,753 | ) |
Class C | | | — | | | | (6,611 | ) |
Institutional Class | | | — | | | | (2,106,548 | ) |
Total distributions to shareholders | | $ | (63,746,886 | ) | | $ | (47,129,129 | ) |
Transactions in shares of beneficial interest — | | | | | | | | |
Proceeds from sale of shares | | | | | | | | |
Investor Class | | $ | 421,136,418 | | | $ | 308,459,699 | |
Class C | | | 2,992,656 | | | | 4,847,765 | |
Institutional Class | | | 1,414,075,531 | | | | 874,027,705 | |
Net asset value of shares issued to shareholders in payment of distributions declared | | | | | | | | |
Investor Class | | | 8,965,960 | | | | 8,746,689 | |
Class C | | | 81,618 | | | | 89,763 | |
Institutional Class | | | 43,279,391 | | | | 30,549,286 | |
Cost of shares redeemed | | | | | | | | |
Investor Class | | | (353,127,985 | ) | | | (139,255,686 | ) |
Class C | | | (4,912,768 | ) | | | (6,181,813 | ) |
Institutional Class | | | (550,702,918 | ) | | | (381,683,788 | ) |
Net increase in net assets from Fund share transactions | | $ | 981,787,903 | | | $ | 699,599,620 | |
| | |
Net increase in net assets | | $ | 667,166,269 | | | $ | 996,439,668 | |
|
| Net Assets | |
At beginning of year | | $ | 3,501,271,067 | | | $ | 2,504,831,399 | |
At end of year | | $ | 4,168,437,336 | | | $ | 3,501,271,067 | |
|
Accumulated distributions in excess of net investment income
included in net assets | |
At end of year | | $ | (15,150,494 | ) | | $ | (10,578,102 | ) |
| | | | |
| | 30 | | See Notes to Financial Statements. |
Parametric Emerging Markets Fund
January 31, 2014
Financial Highlights
| | | | | | | | | | | | | | | | | | | | | | | | |
| | | Investor Class | |
| | | Year Ended January 31, | | | Period Ended
January 31, 2012(1) | | | Year Ended October 31, | |
| | | 2014 | | | 2013 | | | | 2011 | | | 2010 | | | 2009 | |
Net asset value — Beginning of period | | $ | 15.260 | | | $ | 13.940 | | | $ | 13.750 | | | $ | 15.540 | | | $ | 12.440 | | | $ | 8.290 | |
| | | | |
| Income (Loss) From Operations | | | | | | | | | | | | | | | | | |
Net investment income (loss)(2) | | $ | 0.201 | | | $ | 0.173 | | | $ | (0.014 | ) | | $ | 0.201 | | | $ | 0.105 | | | $ | 0.121 | |
Net realized and unrealized gain (loss) | | | (1.204 | ) | | | 1.339 | | | | 0.328 | | | | (1.826 | ) | | | 3.082 | | | | 4.120 | |
| | | | | | |
Total income (loss) from operations | | $ | (1.003 | ) | | $ | 1.512 | | | $ | 0.314 | | | $ | (1.625 | ) | | $ | 3.187 | | | $ | 4.241 | |
| | | | |
| Less Distributions | | | | | | | | | | | | | | | | | |
From net investment income | | $ | (0.187 | ) | | $ | (0.181 | ) | | $ | (0.124 | ) | | $ | (0.165 | ) | | $ | (0.089 | ) | | $ | (0.092 | ) |
Tax return of capital | | | — | | | | (0.011 | ) | | | — | | | | — | | | | — | | | | — | |
| | | | | | |
Total distributions | | $ | (0.187 | ) | | $ | (0.192 | ) | | $ | (0.124 | ) | | $ | (0.165 | ) | | $ | (0.089 | ) | | $ | (0.092 | ) |
| | | | | | |
Redemption fees(2)(3) | | $ | — | | | $ | — | | | $ | — | | | $ | 0.000 | (4) | | $ | 0.002 | | | $ | 0.001 | |
| | | | | | |
Net asset value — End of period | | $ | 14.070 | | | $ | 15.260 | | | $ | 13.940 | | | $ | 13.750 | | | $ | 15.540 | | | $ | 12.440 | |
| | | | | | |
Total Return(5) | | | (6.62 | )% | | | 10.89 | % | | | 2.38 | %(6) | | | (10.59 | )% | | | 25.77 | % | | | 51.81 | % |
| | | | |
| Ratios/Supplemental Data | | | | | | | | | | | | | | | | | |
Net assets, end of period (000’s omitted) | | $ | 755,768 | | | $ | 738,776 | | | $ | 493,567 | | | $ | 481,194 | | | $ | 267,040 | | | $ | 104,727 | |
Ratios (as a percentage of average daily net assets): | | | | | | | | | | | | | | | | | | | | | | | | |
Expenses(7) | | | 1.38 | % | | | 1.42 | % | | | 1.45 | %(8) | | | 1.45 | % | | | 1.51 | % | | | 1.57 | %(9) |
Net investment income (loss) | | | 1.36 | % | | | 1.22 | % | | | (0.43 | )%(8) | | | 1.33 | % | | | 0.77 | % | | | 1.26 | % |
Portfolio Turnover | | | 7 | % | | | 3 | % | | | 0 | %(6)(10) | | | 3 | % | | | 8 | % | | | 11 | % |
| (1) | For the three months ended January 31, 2012. The Fund changed its fiscal year-end from October 31 to January 31. |
| (2) | Computed using average shares outstanding. |
| (3) | Redemption fees were discontinued as of January 1, 2011. |
| (4) | Amount is less than $0.0005. |
| (5) | Returns are historical and are calculated by determining the percentage change in net asset value with all distributions reinvested and do not reflect the effect of sales charges, if any. |
| (7) | Excludes the effect of custody fee credits, if any, of less than 0.005%. |
| (9) | The investment adviser and administrator waived a portion of its fees and subsidized certain operating expenses (equal to 0.02% of average daily net assets for the year ended October 31, 2009). |
| (10) | Amount is less than 0.5%. |
| | | | |
| | 31 | | See Notes to Financial Statements. |
Parametric Emerging Markets Fund
January 31, 2014
Financial Highlights — continued
| | | | | | | | | | | | | | | | | | | | | | | | |
| | | Class C | |
| | | Year Ended January 31, | | | Period Ended
January 31, 2012(1) | | | Year Ended October 31, | |
| | | 2014 | | | 2013 | | | | 2011 | | | 2010 | | | 2009 | |
Net asset value — Beginning of period | | $ | 15.130 | | | $ | 13.820 | | | $ | 13.530 | | | $ | 15.310 | | | $ | 12.280 | | | $ | 8.160 | |
| | | | |
| Income (Loss) From Operations | | | | | | | | | | | | | | | | | |
Net investment income (loss)(2) | | $ | 0.091 | | | $ | 0.095 | | | $ | (0.038 | ) | | $ | 0.074 | | | $ | 0.020 | | | $ | 0.042 | |
Net realized and unrealized gain (loss) | | | (1.188 | ) | | | 1.294 | | | | 0.333 | | | | (1.792 | ) | | | 3.032 | | | | 4.087 | |
| | | | | | |
Total income (loss) from operations | | $ | (1.097 | ) | | $ | 1.389 | | | $ | 0.295 | | | $ | (1.718 | ) | | $ | 3.052 | | | $ | 4.129 | |
| | | | |
| Less Distributions | | | | | | | | | | | | | | | | | |
From net investment income | | $ | (0.073 | ) | | $ | (0.075 | ) | | $ | (0.005 | ) | | $ | (0.062 | ) | | $ | (0.024 | ) | | $ | (0.010 | ) |
Tax return of capital | | | — | | | | (0.004 | ) | | | — | | | | — | | | | — | | | | — | |
| | | | | | |
Total distributions | | $ | (0.073 | ) | | $ | (0.079 | ) | | $ | (0.005 | ) | | $ | (0.062 | ) | | $ | (0.024 | ) | | $ | (0.010 | ) |
| | | | | | |
Redemption fees(2)(3) | | $ | — | | | $ | — | | | $ | — | | | $ | 0.000 | (4) | | $ | 0.002 | | | $ | 0.001 | |
| | | | | | |
Net asset value — End of period | | $ | 13.960 | | | $ | 15.130 | | | $ | 13.820 | | | $ | 13.530 | | | $ | 15.310 | | | $ | 12.280 | |
| | | | | | |
Total Return(5) | | | (7.27 | )% | | | 10.07 | % | | | 2.18 | %(6) | | | (11.27 | )% | | | 24.91 | % | | | 50.69 | % |
| | | | |
| Ratios/Supplemental Data | | | | | | | | | | | | | | | | | |
Net assets, end of period (000’s omitted) | | $ | 19,779 | | | $ | 23,348 | | | $ | 22,646 | | | $ | 22,866 | | | $ | 22,800 | | | $ | 16,918 | |
Ratios (as a percentage of average daily net assets): | | | | | | | | | | | | | | | | | | | | | | | | |
Expenses(7) | | | 2.13 | % | | | 2.16 | % | | | 2.19 | %(8) | | | 2.19 | % | | | 2.26 | % | | | 2.32 | %(9) |
Net investment income (loss) | | | 0.63 | % | | | 0.68 | % | | | (1.18 | )%(8) | | | 0.49 | % | | | 0.15 | % | | | 0.44 | % |
Portfolio Turnover | | | 7 | % | | | 3 | % | | | 0 | %(6)(10) | | | 3 | % | | | 8 | % | | | 11 | % |
| (1) | For the three months ended January 31, 2012. The Fund changed its fiscal year-end from October 31 to January 31. |
| (2) | Computed using average shares outstanding. |
| (3) | Redemption fees were discontinued as of January 1, 2011. |
| (4) | Amount is less than $0.0005. |
| (5) | Returns are historical and are calculated by determining the percentage change in net asset value with all distributions reinvested and do not reflect the effect of sales charges. |
| (7) | Excludes the effect of custody fee credits, if any, of less than 0.005%. |
| (9) | The investment adviser and administrator waived a portion of its fees and subsidized certain operating expenses (equal to 0.02% of average daily net assets for the year ended October 31, 2009). |
| (10) | Amount is less than 0.5%. |
| | | | |
| | 32 | | See Notes to Financial Statements. |
Parametric Emerging Markets Fund
January 31, 2014
Financial Highlights — continued
| | | | | | | | | | | | | | | | | | | | | | | | |
| | | Institutional Class | |
| | | Year Ended January 31, | | | Period Ended
January 31, 2012(1) | | | Year Ended October 31, | |
| | | 2014 | | | 2013 | | | | 2011 | | | 2010 | | | 2009 | |
Net asset value — Beginning of period | | $ | 15.310 | | | $ | 13.970 | | | $ | 13.810 | | | $ | 15.580 | | | $ | 12.460 | | | $ | 8.320 | |
| | | | |
| Income (Loss) From Operations | | | | | | | | | | | | | | | | | |
Net investment income (loss)(2) | | $ | 0.224 | | | $ | 0.222 | | | $ | (0.006 | ) | | $ | 0.233 | | | $ | 0.163 | | | $ | 0.156 | |
Net realized and unrealized gain (loss) | | | (1.197 | ) | | | 1.339 | | | | 0.322 | | | | (1.821 | ) | | | 3.071 | | | | 4.109 | |
| | | | | | |
Total income (loss) from operations | | $ | (0.973 | ) | | $ | 1.561 | | | $ | 0.316 | | | $ | (1.588 | ) | | $ | 3.234 | | | $ | 4.265 | |
| | | | |
| Less Distributions | | | | | | | | | | | | | | | | | |
From net investment income | | $ | (0.227 | ) | | $ | (0.209 | ) | | $ | (0.156 | ) | | $ | (0.182 | ) | | $ | (0.116 | ) | | $ | (0.126 | ) |
Tax return of capital | | | — | | | | (0.012 | ) | | | — | | | | — | | | | — | | | | — | |
| | | | | | |
Total distributions | | $ | (0.227 | ) | | $ | (0.221 | ) | | $ | (0.156 | ) | | $ | (0.182 | ) | | $ | (0.116 | ) | | $ | (0.126 | ) |
| | | | | | |
Redemption fees(2)(3) | | $ | — | | | $ | — | | | $ | — | | | $ | 0.000 | (4) | | $ | 0.002 | | | $ | 0.001 | |
| | | | | | |
Net asset value — End of period | | $ | 14.110 | | | $ | 15.310 | | | $ | 13.970 | | | $ | 13.810 | | | $ | 15.580 | | | $ | 12.460 | |
| | | | | | |
Total Return(5) | | | (6.42 | )% | | | 11.22 | % | | | 2.41 | %(6) | | | (10.39 | )% | | | 26.22 | % | | | 52.15 | % |
| | | | |
| Ratios/Supplemental Data | | | | | | | | | | | | | | | | | |
Net assets, end of period (000’s omitted) | | $ | 3,392,890 | | | $ | 2,739,147 | | | $ | 1,988,618 | | | $ | 1,845,906 | | | $ | 1,623,796 | | | $ | 846,944 | |
Ratios (as a percentage of average daily net assets): | | | | | | | | | | | | | | | | | | | | | | | | |
Expenses(7) | | | 1.13 | % | | | 1.16 | % | | | 1.20 | %(8) | | | 1.20 | % | | | 1.26 | % | | | 1.33 | %(9) |
Net investment income (loss) | | | 1.52 | % | | | 1.56 | % | | | (0.18 | )%(8) | | | 1.53 | % | | | 1.19 | % | | | 1.56 | % |
Portfolio Turnover | | | 7 | % | | | 3 | % | | | 0 | %(6)(10) | | | 3 | % | | | 8 | % | | | 11 | % |
| (1) | For the three months ended January 31, 2012. The Fund changed its fiscal year-end from October 31 to January 31. |
| (2) | Computed using average shares outstanding. |
| (3) | Redemption fees were discontinued as of January 1, 2011. |
| (4) | Amount is less than $0.0005. |
| (5) | Returns are historical and are calculated by determining the percentage change in net asset value with all distributions reinvested. |
| (7) | Excludes the effect of custody fee credits, if any, of less than 0.005%. |
| (9) | The investment adviser and administrator waived a portion of its fees and subsidized certain operating expenses (equal to 0.02% of average daily net assets for the year ended October 31, 2009). |
| (10) | Amount is less than 0.5%. |
| | | | |
| | 33 | | See Notes to Financial Statements. |
Parametric Emerging Markets Fund
January 31, 2014
Notes to Financial Statements
1 Significant Accounting Policies
Parametric Emerging Markets Fund (formerly, Eaton Vance Parametric Structured Emerging Markets Fund) (the Fund) is a diversified series of Eaton Vance Mutual Funds Trust (the Trust). The Trust is a Massachusetts business trust registered under the Investment Company Act of 1940, as amended (the 1940 Act), as an open-end management investment company. The Fund’s investment objective is to seek long-term capital appreciation. The Fund offers three classes of shares. Investor Class (renamed from Class A effective March 1, 2013) and Institutional Class (renamed from Class I effective March 1, 2013) shares are sold at net asset value and are not subject to a sales charge. Class C shares are sold at net asset value and are generally subject to a contingent deferred sales charge (see Note 5). Prior to March 1, 2013, the date the sales charge was eliminated and the share class was renamed, Investor Class shares were generally sold subject to a sales charge of 5.75% imposed at time of purchase. Effective March 1, 2013, Class C shares of the Fund are no longer available for purchase, except by existing shareholders (including shares acquired through the reinvestment of dividends and distributions) or qualified retirement plans. Each class represents a pro-rata interest in the Fund, but votes separately on class-specific matters and (as noted below) is subject to different expenses. Realized and unrealized gains and losses and net investment income and losses, other than class-specific expenses, are allocated daily to each class of shares based on the relative net assets of each class to the total net assets of the Fund. Each class of shares differs in its distribution plan and certain other class-specific expenses.
The following is a summary of significant accounting policies of the Fund. The policies are in conformity with accounting principles generally accepted in the United States of America.
A Investment Valuation — The following methodologies are used to determine the market value or fair value of investments.
Equity Securities. Equity securities (including common shares of closed-end investment companies) listed on a U.S. securities exchange generally are valued at the last sale or closing price on the day of valuation or, if no sales took place on such date, at the mean between the closing bid and asked prices therefore on the exchange where such securities are principally traded. Equity securities listed on the NASDAQ Global or Global Select Market generally are valued at the NASDAQ official closing price. Unlisted or listed securities for which closing sales prices or closing quotations are not available are valued at the mean between the latest available bid and asked prices.
Debt Obligations. Debt obligations (including short-term obligations with a remaining maturity of more than sixty days) are generally valued on the basis of valuations provided by third party pricing services, as derived from such services’ pricing models. Inputs to the models may include, but are not limited to, reported trades, executable bid and asked prices, broker/dealer quotations, prices or yields of securities with similar characteristics, benchmark curves or information pertaining to the issuer, as well as industry and economic events. The pricing services may use a matrix approach, which considers information regarding securities with similar characteristics to determine the valuation for a security. Short-term obligations purchased with a remaining maturity of sixty days or less are generally valued at amortized cost, which approximates market value.
Foreign Securities and Currencies. Foreign securities and currencies are valued in U.S. dollars, based on foreign currency exchange rate quotations supplied by a third party pricing service. The pricing service uses a proprietary model to determine the exchange rate. Inputs to the model include reported trades and implied bid/ask spreads. The daily valuation of exchange-traded foreign securities generally is determined as of the close of trading on the principal exchange on which such securities trade. Events occurring after the close of trading on foreign exchanges may result in adjustments to the valuation of foreign securities to more accurately reflect their fair value as of the close of regular trading on the New York Stock Exchange. When valuing foreign equity securities that meet certain criteria, the Fund’s Trustees have approved the use of a fair value service that values such securities to reflect market trading that occurs after the close of the applicable foreign markets of comparable securities or other instruments that have a strong correlation to the fair-valued securities.
Fair Valuation. Investments for which valuations or market quotations are not readily available or are deemed unreliable are valued at fair value using methods determined in good faith by or at the direction of the Trustees of the Fund in a manner that fairly reflects the security’s value, or the amount that the Fund might reasonably expect to receive for the security upon its current sale in the ordinary course. Each such determination is based on a consideration of relevant factors, which are likely to vary from one pricing context to another. These factors may include, but are not limited to, the type of security, the existence of any contractual restrictions on the security’s disposition, the price and extent of public trading in similar securities of the issuer or of comparable companies or entities, quotations or relevant information obtained from broker/dealers or other market participants, information obtained from the issuer, analysts, and/or the appropriate stock exchange (for exchange-traded securities), an analysis of the company’s or entity’s financial condition, and an evaluation of the forces that influence the issuer and the market(s) in which the security is purchased and sold.
B Investment Transactions — Investment transactions for financial statement purposes are accounted for on a trade date basis. Realized gains and losses on investments sold are determined on the basis of identified cost.
C Income — Dividend income is recorded on the ex-dividend date for dividends received in cash and/or securities. However, if the ex-dividend date has passed, certain dividends from foreign securities are recorded as the Fund is informed of the ex-dividend date. Withholding taxes on foreign dividends, interest and capital gains have been provided for in accordance with the Fund’s understanding of the applicable countries’ tax rules and rates. Interest income is recorded on the basis of interest accrued, adjusted for amortization of premium or accretion of discount.
D Federal Taxes — The Fund’s policy is to comply with the provisions of the Internal Revenue Code applicable to regulated investment companies and to distribute to shareholders each year substantially all of its net investment income, and all or substantially all of its net realized capital gains. Accordingly, no provision for federal income or excise tax is necessary.
Parametric Emerging Markets Fund
January 31, 2014
Notes to Financial Statements — continued
In addition to the requirements of the Internal Revenue Code, the Fund may also be subject to local taxes on the recognition of capital gains in certain countries. In determining the daily net asset value, the Fund estimates the accrual for such taxes, if any, based on the unrealized appreciation on certain portfolio securities and the related tax rates. Taxes attributable to unrealized appreciation are included in the change in unrealized appreciation (depreciation) on investments. Capital gains taxes on securities sold are included in net realized gain (loss) on investments.
At January 31, 2014, the Fund, for federal income tax purposes, had a capital loss carryforward of $10,862,282 which will reduce its taxable income arising from future net realized gains on investment transactions, if any, to the extent permitted by the Internal Revenue Code, and thus will reduce the amount of distributions to shareholders, which would otherwise be necessary to relieve the Fund of any liability for federal income or excise tax. Such capital loss carryforward will expire on January 31, 2017 ($9,781,273) and January 31, 2019 ($1,081,009) and its character is short-term. In addition, such capital loss carryforward cannot be utilized prior to the utilization of new capital losses, if any, created after January 31, 2014.
During the year ended January 31, 2014, a capital loss carryforward of $37,880,663 was utilized to offset net realized gains by the Fund.
Additionally, at January 31, 2014, the Fund had a late year ordinary loss of $2,561,639 which it has elected to defer to the following taxable year pursuant to income tax regulations. Late year ordinary losses represent certain specified losses realized in that portion of a taxable year after October 31 that are treated as ordinary for tax purposes plus ordinary losses attributable to that portion of a taxable year after December 31.
As of January 31, 2014, the Fund had no uncertain tax positions that would require financial statement recognition, de-recognition, or disclosure. The Fund files a U.S. federal income tax return annually after its fiscal year-end, which is subject to examination by the Internal Revenue Service for a period of three years from the date of filing.
E Expenses — The majority of expenses of the Trust are directly identifiable to an individual fund. Expenses which are not readily identifiable to a specific fund are allocated taking into consideration, among other things, the nature and type of expense and the relative size of the funds.
F Expense Reduction — State Street Bank and Trust Company (SSBT) serves as custodian of the Fund. Pursuant to the custodian agreement, SSBT receives a fee reduced by credits, which are determined based on the average daily cash balance the Fund maintains with SSBT. All credit balances, if any, used to reduce the Fund’s custodian fees are reported as a reduction of expenses in the Statement of Operations.
G Foreign Currency Translation — Investment valuations, other assets, and liabilities initially expressed in foreign currencies are translated each business day into U.S. dollars based upon current exchange rates. Purchases and sales of foreign investment securities and income and expenses denominated in foreign currencies are translated into U.S. dollars based upon currency exchange rates in effect on the respective dates of such transactions. Recognized gains or losses on investment transactions attributable to changes in foreign currency exchange rates are recorded for financial statement purposes as net realized gains and losses on investments. That portion of unrealized gains and losses on investments that results from fluctuations in foreign currency exchange rates is not separately disclosed.
H Use of Estimates — The preparation of the financial statements in conformity with accounting principles generally accepted in the United States of America requires management to make estimates and assumptions that affect the reported amounts of assets and liabilities at the date of the financial statements and the reported amounts of income and expense during the reporting period. Actual results could differ from those estimates.
I Indemnifications — Under the Trust’s organizational documents, its officers and Trustees may be indemnified against certain liabilities and expenses arising out of the performance of their duties to the Fund. Under Massachusetts law, if certain conditions prevail, shareholders of a Massachusetts business trust (such as the Trust) could be deemed to have personal liability for the obligations of the Trust. However, the Trust’s Declaration of Trust contains an express disclaimer of liability on the part of Fund shareholders and the By-laws provide that the Trust shall assume the defense on behalf of any Fund shareholders. Moreover, the By-laws also provide for indemnification out of Fund property of any shareholder held personally liable solely by reason of being or having been a shareholder for all loss or expense arising from such liability. Additionally, in the normal course of business, the Fund enters into agreements with service providers that may contain indemnification clauses. The Fund’s maximum exposure under these arrangements is unknown as this would involve future claims that may be made against the Fund that have not yet occurred.
2 Distributions to Shareholders
It is the present policy of the Fund to make at least one distribution annually (normally in December) of all or substantially all of its net investment income and to distribute annually all or substantially all of its net realized capital gains (reduced by available capital loss carryforwards from prior years). Distributions to shareholders are recorded on the ex-dividend date. Distributions are declared separately for each class of shares. Shareholders may reinvest income and capital gain distributions in additional shares of the same class of the Fund at the net asset value as of the ex-dividend date or, at the election of the shareholder, receive distributions in cash. The Fund distinguishes between distributions on a tax basis and a financial reporting basis. Accounting principles generally accepted in the United States of America require that only distributions in excess of tax basis earnings and profits be reported in the financial statements as a return of capital. Permanent differences between book and tax accounting relating to distributions are reclassified to paid-in capital. For tax purposes, distributions from short-term capital gains are considered to be from ordinary income.
Parametric Emerging Markets Fund
January 31, 2014
Notes to Financial Statements — continued
The tax character of distributions declared for the years ended January 31, 2014 and January 31, 2013 was as follows:
| | | | | | | | |
| | | Year Ended January 31, | |
| | | 2014 | | | 2013 | |
| | |
Distributions declared from: | | | | | | | | |
Ordinary income | | $ | 63,746,886 | | | $ | 44,514,217 | |
Tax return of capital | | $ | — | | | $ | 2,614,912 | |
During the year ended January 31, 2014, accumulated net realized loss was decreased by $1,222,374, accumulated distributions in excess of net investment income was increased by $1,165,718 and paid-in capital was decreased by $56,656 due to differences between book and tax accounting, primarily for foreign currency gain (loss), foreign capital gains taxes and investments in passive foreign investment companies (PFICs). These reclassifications had no effect on the net assets or net asset value per share of the Fund.
As of January 31, 2014, the components of distributable earnings (accumulated losses) and unrealized appreciation (depreciation) on a tax basis were as follows:
| | | | |
Capital loss carryforward | | $ | (10,862,282 | ) |
Late year ordinary losses | | $ | (2,561,639 | ) |
Net unrealized appreciation | | $ | 70,044,201 | |
The differences between components of distributable earnings (accumulated losses) on a tax basis and the amounts reflected in the Statement of Assets and Liabilities are primarily due to wash sales and investments in PFICs.
3 Investment Adviser Fee and Other Transactions with Affiliates
The investment adviser fee is earned by Eaton Vance Management (EVM) as compensation for management and investment advisory services rendered to the Fund. The fee is computed at an annual rate of 0.85% of the Fund’s average daily net assets up to $500 million, 0.80% on net assets of $500 million but less than $1 billion, 0.775% on net assets of $1 billion but less than $2.5 billion, 0.75% on net assets of $2.5 billion but less than $5 billion and 0.73% on average daily net assets of $5 billion and over, and is payable monthly. For the year ended January 31, 2014, the investment adviser fee amounted to $31,650,266 or 0.78% of the Fund’s average daily net assets. Pursuant to a sub-advisory agreement, EVM has delegated the investment management of the Fund to Parametric Portfolio Associates LLC (Parametric), a majority-owned subsidiary of Eaton Vance Corp. EVM pays Parametric a portion of its advisory fee for sub-advisory services provided to the Fund. The administration fee is earned by EVM for administering the business affairs of the Fund and is computed at an annual rate of 0.15% of the Fund’s average daily net assets. For the year ended January 31, 2014, the administration fee amounted to $6,105,053.
EVM provides sub-transfer agency services to the Fund and receives a fee based upon the actual expenses it incurs in the performance of these services. For the year ended January 31, 2014, EVM earned $72,393 in sub-transfer agent fees, which are included in transfer and dividend disbursing agent fees on the Statement of Operations. The Fund was informed that Eaton Vance Distributors, Inc. (EVD), an affiliate of EVM and the Fund’s principal underwriter, received $539 as its portion of the sales charge on sales of Investor Class shares for the year ended January 31, 2014. EVD also received distribution and service fees from Investor Class and Class C shares (see Note 4) and contingent deferred sales charges (see Note 5).
Trustees and officers of the Fund who are members of EVM’s organization receive remuneration for their services to the Fund out of the investment adviser fee. Trustees of the Fund who are not affiliated with EVM may elect to defer receipt of all or a percentage of their annual fees in accordance with the terms of the Trustees Deferred Compensation Plan. For the year ended January 31, 2014, no significant amounts have been deferred. Certain officers and Trustees of the Fund are officers of EVM.
4 Distribution Plans
The Fund has in effect a distribution plan for Investor Class shares (Investor Class Plan) pursuant to Rule 12b-1 under the 1940 Act. Pursuant to the Investor Class Plan, the Fund pays EVD a distribution and service fee of 0.25% per annum of its average daily net assets attributable to Investor Class shares for distribution services and facilities provided to the Fund by EVD, as well as for personal services and/or the maintenance of shareholder accounts. Distribution and service fees paid or accrued to EVD for the year ended January 31, 2014 amounted to $2,181,696 for Investor Class shares.
Parametric Emerging Markets Fund
January 31, 2014
Notes to Financial Statements — continued
The Fund also has in effect a distribution plan for Class C shares (Class C Plan) pursuant to Rule 12b-1 under the 1940 Act. Pursuant to the Class C Plan, the Fund pays EVD amounts equal to 0.75% per annum of its average daily net assets attributable to Class C shares for providing ongoing distribution services and facilities to the Fund. For the year ended January 31, 2014, the Fund paid or accrued to EVD $165,611 for Class C shares.
Pursuant to the Class C Plan, the Fund also makes payments of service fees to EVD, financial intermediaries and other persons in amounts equal to 0.25% per annum of its average daily net assets attributable to that class. Service fees paid or accrued are for personal services and/or the maintenance of shareholder accounts. They are separate and distinct from the sales commissions and distribution fees payable to EVD. Service fees paid or accrued for the year ended January 31, 2014 amounted to $55,204 for Class C shares.
Distribution and service fees are subject to the limitations contained in the Financial Industry Regulatory Authority’s NASD Conduct Rule 2830(d).
5 Contingent Deferred Sales Charges
A contingent deferred sales charge (CDSC) of 1% generally is imposed on redemptions of Class C shares made within one year of purchase. Prior to March 1, 2013, Class A (renamed Investor Class) shares may have been subject to a 1% CDSC if redeemed within 18 months of purchase (depending on the circumstances of purchase). Generally, the CDSC is based upon the lower of the net asset value at date of redemption or date of purchase. No charge is levied on shares acquired by reinvestment of dividends or capital gain distributions. For the year ended January 31, 2014, the Fund was informed that EVD received approximately $800 and $3,000 of CDSCs paid by Investor Class and Class C shareholders, respectively.
6 Purchases and Sales of Investments
Purchases and sales of investments, other than short-term obligations, aggregated $1,284,842,355 and $288,873,895, respectively, for the year ended January 31, 2014.
7 Shares of Beneficial Interest
The Fund’s Declaration of Trust permits the Trustees to issue an unlimited number of full and fractional shares of beneficial interest (without par value). Such shares may be issued in a number of different series (such as the Fund) and classes. Transactions in Fund shares were as follows:
| | | | | | | | |
| | | Year Ended January 31, | |
| Investor Class | | 2014 | | | 2013 | |
| | |
Sales | | | 28,688,546 | | | | 22,197,036 | |
Issued to shareholders electing to receive payments of distributions in Fund shares | | | 610,344 | | | | 590,993 | |
Redemptions | | | (24,010,356 | ) | | | (9,787,693 | ) |
| | |
Net increase | | | 5,288,534 | | | | 13,000,336 | |
| | |
| | | | | | | | |
| | | Year Ended January 31, | |
| Class C | | 2014 | | | 2013 | |
| | |
Sales | | | 207,316 | | | | 343,481 | |
Issued to shareholders electing to receive payments of distributions in Fund shares | | | 5,598 | | | | 6,110 | |
Redemptions | | | (338,798 | ) | | | (445,335 | ) |
| | |
Net decrease | | | (125,884 | ) | | | (95,744 | ) |
| | |
| | | | | | | | |
| | | Year Ended January 31, | |
| Institutional Class | | 2014 | | | 2013 | |
| | |
Sales | | | 95,945,622 | | | | 61,302,981 | |
Issued to shareholders electing to receive payments of distributions in Fund shares | | | 2,938,163 | | | | 2,058,577 | |
Redemptions | | | (37,453,290 | ) | | | (26,741,612 | ) |
| | |
Net increase | | | 61,430,495 | | | | 36,619,946 | |
Parametric Emerging Markets Fund
January 31, 2014
Notes to Financial Statements — continued
8 Federal Income Tax Basis of Investments
The cost and unrealized appreciation (depreciation) of investments of the Fund at January 31, 2014, as determined on a federal income tax basis, were as follows:
| | | | |
| |
Aggregate cost | | $ | 4,081,115,065 | |
| |
Gross unrealized appreciation | | $ | 649,962,172 | |
Gross unrealized depreciation | | | (578,547,075 | ) |
| |
Net unrealized appreciation | | $ | 71,415,097 | |
9 Line of Credit
The Fund participates with other portfolios and funds managed by EVM and its affiliates in a $750 million unsecured line of credit agreement with a group of banks. Borrowings are made by the Fund solely to facilitate the handling of unusual and/or unanticipated short-term cash requirements. Interest is charged to the Fund based on its borrowings at an amount above either the Eurodollar rate or Federal Funds rate. In addition, a fee computed at an annual rate of 0.08% on the daily unused portion of the line of credit is allocated among the participating portfolios and funds at the end of each quarter. Because the line of credit is not available exclusively to the Fund, it may be unable to borrow some or all of its requested amounts at any particular time. At January 31, 2014, the Fund had a balance outstanding pursuant to this line of credit of $300,000 at an interest rate of 1.07%. Based on the short-term nature of the borrowings under the line of credit and variable interest rate, the carrying value of the borrowings approximated its fair value at January 31, 2014. If measured at fair value, borrowings under the line of credit would have been considered as Level 2 in the fair value hierarchy (see Note 11) at January 31, 2014. The Fund’s average borrowings or allocated fees during the year ended January 31, 2014 were not significant.
10 Risks Associated with Foreign Investments
Investing in securities issued by companies whose principal business activities are outside the United States may involve significant risks not present in domestic investments. For example, there is generally less publicly available information about foreign companies, particularly those not subject to the disclosure and reporting requirements of the U.S. securities laws. Certain foreign issuers are generally not bound by uniform accounting, auditing, and financial reporting requirements and standards of practice comparable to those applicable to domestic issuers. Investments in foreign securities also involve the risk of possible adverse changes in investment or exchange control regulations, expropriation or confiscatory taxation, limitation on the removal of funds or other assets of the Fund, political or financial instability or diplomatic and other developments which could affect such investments. Foreign securities markets, while growing in volume and sophistication, are generally not as developed as those in the United States, and securities of some foreign issuers (particularly those located in developing countries) may be less liquid and more volatile than securities of comparable U.S. companies. In general, there is less overall governmental supervision and regulation of foreign securities markets, broker/dealers and issuers than in the United States. The foregoing risks of foreign investing can be more significant in less developed countries characterized as emerging market countries.
11 Fair Value Measurements
Under generally accepted accounting principles for fair value measurements, a three-tier hierarchy to prioritize the assumptions, referred to as inputs, is used in valuation techniques to measure fair value. The three-tier hierarchy of inputs is summarized in the three broad levels listed below.
| Ÿ | | Level 1 – quoted prices in active markets for identical investments |
| Ÿ | | Level 2 – other significant observable inputs (including quoted prices for similar investments, interest rates, prepayment speeds, credit risk, etc.) |
| Ÿ | | Level 3 – significant unobservable inputs (including a fund’s own assumptions in determining the fair value of investments) |
In cases where the inputs used to measure fair value fall in different levels of the fair value hierarchy, the level disclosed is determined based on the lowest level input that is significant to the fair value measurement in its entirety. The inputs or methodology used for valuing securities are not necessarily an indication of the risk associated with investing in those securities.
Parametric Emerging Markets Fund
January 31, 2014
Notes to Financial Statements — continued
At January 31, 2014, the hierarchy of inputs used in valuing the Fund’s investments, which are carried at value, were as follows:
| | | | | | | | | | | | | | | | |
| Asset Description | | Level 1 | | | Level 2 | | | Level 3* | | | Total | |
| | | |
Common Stocks | | | | | | | | | | | | |
Asia/Pacific | | $ | 42,181,918 | | | $ | 1,647,423,131 | | | $ | 64,853 | | | $ | 1,689,669,902 | |
Emerging Europe | | | 40,878,236 | | | | 767,684,161 | | | | — | | | | 808,562,397 | |
Latin America | | | 436,487,393 | | | | 343,455,404 | | | | 203,685 | | | | 780,146,482 | |
Middle East/Africa | | | 4,823,122 | | | | 829,395,235 | | | | 346,722 | | | | 834,565,079 | |
| | | | |
Total Common Stocks | | $ | 524,370,669 | | | $ | 3,587,957,931 | ** | | $ | 615,260 | | | $ | 4,112,943,860 | |
| | | | |
Corporate Bonds | | $ | — | | | $ | 21,288 | | | $ | — | | | $ | 21,288 | |
Equity-Linked Securities | | | — | | | | 35,824,123 | | | | — | | | | 35,824,123 | |
Investment Funds | | | — | | | | 3,285,277 | | | | — | | | | 3,285,277 | |
Rights | | | — | | | | 0 | | | | — | | | | 0 | |
Warrants | | | 47,659 | | | | — | | | | — | | | | 47,659 | |
Short-Term Investments | | | — | | | | 407,955 | | | | — | | | | 407,955 | |
| | | | |
Total Investments | | $ | 524,418,328 | | | $ | 3,627,496,574 | | | $ | 615,260 | | | $ | 4,152,530,162 | |
| * | None of the unobservable inputs for Level 3 assets, individually or collectively, had a material impact on the Fund. |
| ** | Includes foreign equity securities whose values were adjusted to reflect market trading of comparable securities or other correlated instruments that occurred after the close of trading in their applicable foreign markets. |
Level 3 investments at the beginning and/or end of the period in relation to net assets were not significant and accordingly, a reconciliation of Level 3 assets for the year ended January 31, 2014 is not presented.
At January 31, 2014, the value of investments transferred between Level 1 and Level 2 during the year then ended was not significant.
12 Name Change
Effective March 1, 2013, the name of the Parametric Emerging Markets Fund was changed from Eaton Vance Parametric Structured Emerging Markets Fund.
Parametric Emerging Markets Fund
January 31, 2014
Report of Independent Registered Public Accounting Firm
To the Trustees of Eaton Vance Mutual Funds Trust and Shareholders of Parametric Emerging Markets Fund (formerly, Eaton Vance Parametric Structured Emerging Markets Fund):
We have audited the accompanying statement of assets and liabilities of Parametric Emerging Markets Fund (formerly, Eaton Vance Parametric Structured Emerging Markets Fund) (the “Fund”) (one of the funds constituting Eaton Vance Mutual Funds Trust), including the portfolio of investments, as of January 31, 2014, and the related statement of operations for the year then ended, the statements of changes in net assets for each of the two years in the period then ended, and the financial highlights for each of the two years in the period then ended, for the three month period ended January 31, 2012 and for each of the three years in the period ended October 31, 2011. These financial statements and financial highlights are the responsibility of the Fund’s management. Our responsibility is to express an opinion on these financial statements and financial highlights based on our audits.
We conducted our audits in accordance with the standards of the Public Company Accounting Oversight Board (United States). Those standards require that we plan and perform the audit to obtain reasonable assurance about whether the financial statements and financial highlights are free of material misstatement. The Fund is not required to have, nor were we engaged to perform, an audit of its internal control over financial reporting. Our audits included consideration of internal control over financial reporting as a basis for designing audit procedures that are appropriate in the circumstances, but not for the purpose of expressing an opinion on the effectiveness of the Fund’s internal control over financial reporting. Accordingly, we express no such opinion. An audit also includes examining, on a test basis, evidence supporting the amounts and disclosures in the financial statements, assessing the accounting principles used and significant estimates made by management, as well as evaluating the overall financial statement presentation. Our procedures included confirmation of securities owned as of January 31, 2014, by correspondence with the custodian and brokers; where replies were not received from brokers, we performed other auditing procedures. We believe that our audits provide a reasonable basis for our opinion.
In our opinion, such financial statements and financial highlights referred to above present fairly, in all material respects, the financial position of Parametric Emerging Markets Fund as of January 31, 2014, the results of its operations for the year then ended, the changes in its net assets for each of the two years in the period then ended, and the financial highlights for each of the two years in the period then ended, for the three month period ended January 31, 2012 and for each of the three years in the period ended October 31, 2011, in conformity with accounting principles generally accepted in the United States of America.
DELOITTE & TOUCHE LLP
Boston, Massachusetts
March 18, 2014
Parametric Emerging Markets Fund
January 31, 2014
Federal Tax Information (Unaudited)
The Form 1099-DIV you receive in February 2015 will show the tax status of all distributions paid to your account in calendar year 2014. Shareholders are advised to consult their own tax adviser with respect to the tax consequences of their investment in the Fund. As required by the Internal Revenue Code and/or regulations, shareholders must be notified regarding the status of qualified dividend income for individuals, the dividends received deduction for corporations and the foreign tax credit.
Qualified Dividend Income. The Fund designates approximately $73,859,979, or up to the maximum amount of such dividends allowable pursuant to the Internal Revenue Code, as qualified dividend income eligible for the reduced tax rate of 15%.
Dividends Received Deduction. Corporate shareholders are generally entitled to take the dividends received deduction on the portion of the Fund’s dividend distribution that qualifies under tax law. For the Fund’s fiscal 2014 ordinary income dividends, 0.49% qualifies for the corporate dividends received deduction.
Foreign Tax Credit. The Fund paid foreign taxes of $12,222,610 and recognized foreign source income of $120,669,558.
Parametric Emerging Markets Fund
January 31, 2014
Management and Organization
Fund Management. The Trustees of Eaton Vance Mutual Funds Trust (the Trust) are responsible for the overall management and supervision of the Trust’s affairs. The Trustees and officers of the Trust are listed below. Except as indicated, each individual has held the office shown or other offices in the same company for the last five years. Trustees and officers of the Trust hold indefinite terms of office. The “Noninterested Trustees” consist of those Trustees who are not “interested persons” of the Trust, as that term is defined under the 1940 Act. The business address of each Trustee and officer is Two International Place, Boston, Massachusetts 02110. As used below, “EVC” refers to Eaton Vance Corp., “EV” refers to Eaton Vance, Inc., “EVM” refers to Eaton Vance Management, “BMR” refers to Boston Management and Research and “EVD” refers to Eaton Vance Distributors, Inc. EVC and EV are the corporate parent and trustee, respectively, of EVM and BMR. EVD is the Fund’s principal underwriter and a wholly-owned subsidiary of EVC. Each officer affiliated with Eaton Vance may hold a position with other Eaton Vance affiliates that is comparable to his or her position with EVM listed below. Each Trustee oversees 182 portfolios in the Eaton Vance Complex (including all master and feeder funds in a master feeder structure). Each officer serves as an officer of certain other Eaton Vance funds. Each Trustee and officer serves until his or her successor is elected.
| | | | | | |
| Name and Year of Birth | | Position(s) with the
Trust | | Trustee Since(1) | | Principal Occupation(s) and Directorships During Past Five Years and Other Relevant Experience |
Interested Trustee |
| | | |
Thomas E. Faust Jr. 1958 | | Trustee | | 2007 | | Chairman, Chief Executive Officer and President of EVC, Director and President of EV, Chief Executive Officer and President of EVM and BMR, and Director of EVD. Trustee and/or officer of 182 registered investment companies. Mr. Faust is an interested person because of his positions with EVM, BMR, EVD, EVC and EV, which are affiliates of the Trust. Directorships in the Last Five Years.(2) Director of EVC and Hexavest Inc. |
| | | |
| | | | | | |
Noninterested Trustees |
| | | |
Scott E. Eston 1956 | | Trustee | | 2011 | | Private investor. Formerly held various positions at Grantham, Mayo, Van Otterloo and Co., L.L.C. (investment management firm) (1997-2009), including Chief Operating Officer (2002-2009), Chief Financial Officer (1997-2009) and Chairman of the Executive Committee (2002-2008); President and Principal Executive Officer, GMO Trust (open-end registered investment company) (2006-2009). Former Partner, Coopers and Lybrand L.L.P. (now PricewaterhouseCoopers) (public accounting firm) (1987-1997). Directorships in the Last Five Years.(2) None. |
| | | |
Allen R. Freedman 1940 | | Trustee | | 2007 | | Private Investor. Former Chairman (2002-2004) and a Director (1983-2004) of Systems & Computer Technology Corp. (provider of software to higher education). Formerly, a Director of Loring Ward International (fund distributor) (2005-2007). Former Chairman and a Director of Indus International, Inc. (provider of enterprise management software to the power generating industry) (2005-2007). Former Chief Executive Officer of Assurant, Inc. (insurance provider) (1979-2000). Directorships in the Last Five Years.(2) Director of Stonemor Partners, L.P. (owner and operator of cemeteries). Formerly, Director of Assurant, Inc. (insurance provider) (1979-2011). |
| | | |
Valerie A. Mosley(3) 1960 | | Trustee | | 2014 | | Chairwoman and Chief Executive Officer of Valmo Ventures (a consulting and investment firm). Former Partner and Senior Vice President, Portfolio Manager and Investment Strategist at Wellington Management Company, LLP (investment management firm) (1992-2012). Former Chief Investment Officer, PG Corbin Asset Management (1990-1992). Formerly worked in institutional corporate bond sales at Kidder Peabody (1986-1990). Directorships in the Last Five Years. Director of Dynex Capital, Inc. (mortgage REIT) (since 2013). |
| | | |
William H. Park 1947 | | Trustee | | 2003 | | Consultant and private investor. Formerly, Chief Financial Officer, Aveon Group L.P. (investment management firm) (2010-2011). Formerly, Vice Chairman, Commercial Industrial Finance Corp. (specialty finance company) (2006-2010). Formerly, President and Chief Executive Officer, Prizm Capital Management, LLC (investment management firm) (2002-2005). Formerly, Executive Vice President and Chief Financial Officer, United Asset Management Corporation (investment management firm) (1982-2001). Formerly, Senior Manager, Price Waterhouse (now PricewaterhouseCoopers) (an independent registered public accounting firm) (1972-1981). Directorships in the Last Five Years.(2) None. |
Parametric Emerging Markets Fund
January 31, 2014
Management and Organization — continued
| | | | | | |
| Name and Year of Birth | | Position(s) with the
Trust | | Trustee Since(1) | | Principal Occupation(s) and Directorships During Past Five Years and Other Relevant Experience |
Noninterested Trustees (continued) |
| | | |
Ronald A. Pearlman 1940 | | Trustee | | 2003 | | Professor of Law, Georgetown University Law Center. Formerly, Deputy Assistant Secretary (Tax Policy) and Assistant Secretary (Tax Policy), U.S. Department of the Treasury (1983-1985). Formerly, Chief of Staff, Joint Committee on Taxation, U.S. Congress (1988-1990). Directorships in the Last Five Years.(2) None. |
| | | |
Helen Frame Peters 1948 | | Trustee | | 2008 | | Professor of Finance, Carroll School of Management, Boston College. Formerly, Dean, Carroll School of Management, Boston College (2000-2002). Formerly, Chief Investment Officer, Fixed Income, Scudder Kemper Investments (investment management firm) (1998-1999). Formerly, Chief Investment Officer, Equity and Fixed Income, Colonial Management Associates (investment management firm) (1991-1998). Directorships in the Last Five Years.(2) Formerly, Director of BJ’s Wholesale Club, Inc. (wholesale club retailer) (2004-2011). Formerly, Trustee of SPDR Index Shares Funds and SPDR Series Trust (exchange traded funds) (2000-2009). Formerly, Director of Federal Home Loan Bank of Boston (a bank for banks) (2007-2009). |
| | | |
Lynn A. Stout 1957 | | Trustee | | 1998 | | Distinguished Professor of Corporate and Business Law, Jack G. Clarke Business Law Institute, Cornell University Law School. Formerly, the Paul Hastings Professor of Corporate and Securities Law (2006-2012) and Professor of Law (2001-2006), University of California at Los Angeles School of Law. Directorships in the Last Five Years.(2) None. |
| | | |
Harriett Tee Taggart 1948 | | Trustee | | 2011 | | Managing Director, Taggart Associates (a professional practice firm). Formerly, Partner and Senior Vice President, Wellington Management Company, LLP (investment management firm) (1983-2006). Directorships in the Last Five Years.(2) Director of Albemarle Corporation (chemicals manufacturer) (since 2007) and The Hanover Group (specialty property and casualty insurance company) (since 2009). Formerly, Director of Lubrizol Corporation (specialty chemicals) (2007-2011). |
| | | |
Ralph F. Verni 1943 | | Chairman of the Board and Trustee | | 2007 (Chairman);
2005 (Trustee) | | Consultant and private investor. Formerly, Chief Investment Officer (1982-1992), Chief Financial Officer (1988-1990) and Director (1982-1992), New England Life. Formerly, Chairperson, New England Mutual Funds (1982-1992). Formerly, President and Chief Executive Officer, State Street Management & Research (1992-2000). Formerly, Chairperson, State Street Research Mutual Funds (1992-2000). Formerly, Director, W.P. Carey, LLC (1998-2004) and First Pioneer Farm Credit Corp. (2002-2006). Directorships in the Last Five Years.(2) None. |
| | | |
| | | | | | |
Principal Officers who are not Trustees |
| Name and Year of Birth | | Position(s)
with the
Trust | | Officer Since(4) | | Principal Occupation(s) During Past Five Years |
Payson F. Swaffield 1956 | | President | | 2003 | | Vice President and Chief Income Investment Officer of EVM and BMR. |
| | | |
Maureen A. Gemma 1960 | | Vice President, Secretary and Chief Legal Officer | | 2005 | | Vice President of EVM and BMR. |
| | | |
James F. Kirchner 1967 | | Treasurer | | 2007 | | Vice President of EVM and BMR. |
Parametric Emerging Markets Fund
January 31, 2014
Management and Organization — continued
| | | | | | |
| Name and Year of Birth | | Position(s)
with the
Trust | | Officer Since(4) | | Principal Occupation(s) During Past Five Years |
Principal Officers who are not Trustees (continued) |
| | | |
Paul M. O’Neil 1953 | | Chief Compliance Officer | | 2004 | | Vice President of EVM and BMR. |
| (1) | Date first appointed to serve as Trustee for a fund in the Eaton Vance family of funds. Each Trustee has served continuously since appointment unless indicated otherwise. |
| (2) | During their respective tenures, the Trustees (except for, Mr. Eston and Ms. Taggart for all funds except eUnitsTM 2 Year U.S. Equity Market Participation Trust: Upside to Cap / Buffered Downside and Ms. Mosley for all funds) also served as Board members of one or more of the following funds (which operated in the years noted): eUnitsTM 2 Year U.S. Equity Market Participation Trust: Upside to Cap / Buffered Downside (launched in 2012 and terminated in 2014); Eaton Vance Credit Opportunities Fund (launched in 2005 and terminated in 2010); Eaton Vance Insured Florida Plus Municipal Bond Fund (launched in 2002 and terminated in 2009); and Eaton Vance National Municipal Income Trust (launched in 1998 and terminated in 2009). |
| (3) | Effective January 1, 2014, Ms. Mosley was appointed as a Trustee of the Trust. |
| (4) | Date first elected to serve as officer of a fund in the Eaton Vance family of funds. Titles may have changed since initial appointment. |
The SAI for the Fund includes additional information about the Trustees and officers of the Fund and can be obtained without charge on Eaton Vance’s website at www.eatonvance.com or by calling 1-800-260-0761.
Eaton Vance Funds
IMPORTANT NOTICES
Privacy. The Eaton Vance organization is committed to ensuring your financial privacy. Each of the financial institutions identified below has in effect the following policy (“Privacy Policy”) with respect to nonpublic personal information about its customers:
| Ÿ | | Only such information received from you, through application forms or otherwise, and information about your Eaton Vance fund transactions will be collected. This may include information such as name, address, social security number, tax status, account balances and transactions. |
| Ÿ | | None of such information about you (or former customers) will be disclosed to anyone, except as permitted by law (which includes disclosure to employees necessary to service your account). In the normal course of servicing a customer’s account, Eaton Vance may share information with unaffiliated third parties that perform various required services such as transfer agents, custodians and broker-dealers. |
| Ÿ | | Policies and procedures (including physical, electronic and procedural safeguards) are in place that are designed to protect the confidentiality of such information. |
| Ÿ | | We reserve the right to change our Privacy Policy at any time upon proper notification to you. Customers may want to review our Privacy Policy periodically for changes by accessing the link on our homepage: www.eatonvance.com. |
Our pledge of privacy applies to the following entities within the Eaton Vance organization: the Eaton Vance Family of Funds, Eaton Vance Management, Eaton Vance Investment Counsel, Eaton Vance Distributors, Inc., Eaton Vance Trust Company, Eaton Vance Management’s Real Estate Investment Group and Boston Management and Research. In addition, our Privacy Policy applies only to those Eaton Vance customers who are individuals and who have a direct relationship with us. If a customer’s account (i.e., fund shares) is held in the name of a third-party financial advisor/broker-dealer, it is likely that only such advisor’s privacy policies apply to the customer. This notice supersedes all previously issued privacy disclosures. For more information about Eaton Vance’s Privacy Policy, please call 1-800-262-1122.
Delivery of Shareholder Documents. The Securities and Exchange Commission (SEC) permits funds to deliver only one copy of shareholder documents, including prospectuses, proxy statements and shareholder reports, to fund investors with multiple accounts at the same residential or post office box address. This practice is often called “householding” and it helps eliminate duplicate mailings to shareholders. Eaton Vance, or your financial advisor, may household the mailing of your documents indefinitely unless you instruct Eaton Vance, or your financial advisor, otherwise. If you would prefer that your Eaton Vance documents not be householded, please contact Eaton Vance at 1-800-260-0761, or contact your financial advisor. Your instructions that householding not apply to delivery of your Eaton Vance documents will be effective within 30 days of receipt by Eaton Vance or your financial advisor.
Portfolio Holdings. Each Eaton Vance Fund and its underlying Portfolio(s) (if applicable) will file a schedule of portfolio holdings on Form N-Q with the SEC for the first and third quarters of each fiscal year. The Form N-Q will be available on the Eaton Vance website at www.eatonvance.com, by calling Eaton Vance at 1-800-260-0761 or in the EDGAR database on the SEC’s website at www.sec.gov. Form N-Q may also be reviewed and copied at the SEC’s public reference room in Washington, D.C. (call 1-800-732-0330 for information on the operation of the public reference room).
Proxy Voting. From time to time, funds are required to vote proxies related to the securities held by the funds. The Eaton Vance Funds or their underlying Portfolios (if applicable) vote proxies according to a set of policies and procedures approved by the Funds’ and Portfolios’ Boards. You may obtain a description of these policies and procedures and information on how the Funds or Portfolios voted proxies relating to portfolio securities during the most recent 12-month period ended June 30, without charge, upon request, by calling 1-800-260-0761 and by accessing the SEC’s website at www.sec.gov.
This Page Intentionally Left Blank
This Page Intentionally Left Blank
This Page Intentionally Left Blank
Investment Adviser and Administrator
Eaton Vance Management
Two International Place
Boston, MA 02110
Sub-Adviser
Parametric Portfolio Associates LLC
1918 Eighth Avenue, Suite 3100
Seattle, WA 98101
Principal Underwriter*
Eaton Vance Distributors, Inc.
Two International Place
Boston, MA 02110
(617) 482-8260
Custodian
State Street Bank and Trust Company
200 Clarendon Street
Boston, MA 02116
Transfer Agent
BNY Mellon Asset Servicing (US) Inc.
Attn: Eaton Vance Funds
P.O. Box 9653
Providence, RI 02940-9653
(800) 260-0761
Independent Registered Public Accounting Firm
Deloitte & Touche LLP
200 Berkeley Street
Boston, MA 02116-5022
Fund Offices
Two International Place
Boston, MA 02110
| * | FINRA BrokerCheck. Investors may check the background of their Investment Professional by contacting the Financial Industry Regulatory Authority (FINRA). FINRA BrokerCheck is a free tool to help investors check the professional background of current and former FINRA-registered securities firms and brokers. FINRA BrokerCheck is available by calling 1-800-289-9999 and at www.FINRA.org. The FINRA BrokerCheck brochure describing the program is available to investors at www.FINRA.org. |
Item 2. Code of Ethics
The registrant has adopted a code of ethics applicable to its Principal Executive Officer, Principal Financial Officer and Principal Accounting Officer. The registrant undertakes to provide a copy of such code of ethics to any person upon request, without charge, by calling 1-800-262-1122.
Item 3. Audit Committee Financial Expert
The registrant’s Board has designated William H. Park, an independent trustee, as its audit committee financial expert. Mr. Park is a certified public accountant who is a consultant and private investor. Previously, he served as the Chief Financial Officer of Aveon Group, L.P. (an investment management firm), as the Vice Chairman of Commercial Industrial Finance Corp. (specialty finance company), as President and Chief Executive Officer of Prizm Capital Management, LLC (investment management firm), as Executive Vice President and Chief Financial Officer of United Asset Management Corporation (an institutional investment management firm) and as a Senior Manager at Price Waterhouse (now PricewaterhouseCoopers) (an independent registered public accounting firm).
Item 4. Principal Accountant Fees and Services
(a)-(d)
Parametric Emerging Markets Fund, Parametric Global Small-Cap Fund, and Parametric International Equity Fund (the “Fund(s)”) are series of Eaton Vance Mutual Funds Trust (the “Trust”), a Massachusetts business trust, which, including the Funds, contains a total of 37 series (the “Series”). The Trust is registered under the Investment Company Act of 1940 as an open-end management investment company. This Form N-CSR relates to the Funds’ annual reports.
The following table presents the aggregate fees billed to each Fund for the Fund’s fiscal years ended January 31, 2013 and January 31, 2014 by the Fund’s principal accountant, Deloitte & Touche LLP (“D&T”), for professional services rendered for the audit of the Fund’s annual financial statements and fees billed for other services rendered by D&T during such periods.
| | | | | | | | |
Parametric Emerging Markets Fund Fiscal Years Ended | | 1/31/13 | | | 1/31/14 | |
Audit Fees | | $ | 73,670 | | | $ | 77,720 | |
Audit-Related Fees(1) | | $ | 0 | | | $ | 0 | |
Tax Fees(2) | | $ | 32,090 | | | $ | 17,290 | |
All Other Fees(3) | | $ | 0 | | | $ | 0 | |
| | | | | | | | |
Total | | $ | 105,760 | | | $ | 95,010 | |
| | | | | | | | |
| | | | | | | | |
Parametric Global Small-Cap Fund Fiscal Years Ended | | 1/31/13* | | | 1/31/14 | |
Audit Fees | | $ | 19,550 | | | $ | 23,250 | |
Audit-Related Fees(1) | | $ | 0 | | | $ | 0 | |
Tax Fees(2) | | $ | 10,240 | | | $ | 10,240 | |
All Other Fees(3) | | $ | 0 | | | $ | 0 | |
| | | | | | | | |
Total | | $ | 29,790 | | | $ | 33,490 | |
| | | | | | | | |
| * | Fund commenced operation on December 20, 2012. |
| | | | | | | | |
Parametric International Equity Fund Fiscal Years Ended | | 1/31/13 | | | 1/31/14 | |
Audit Fees | | $ | 23,310 | | | $ | 24,110 | |
Audit-Related Fees(1) | | $ | 0 | | | $ | 0 | |
Tax Fees(2) | | $ | 13,160 | | | $ | 13,260 | |
All Other Fees(3) | | $ | 0 | | | $ | 0 | |
| | | | | | | | |
Total | | $ | 36,470 | | | $ | 37,370 | |
| | | | | | | | |
| (1) | Audit-related fees consist of the aggregate fees billed for assurance and related services that are reasonably related to the performance of the audit of financial statements and are not reported under the category of audit fees. |
| (2) | Tax fees consist of the aggregate fees billed for professional services rendered by the principal accountant relating to tax compliance, tax advice, and tax planning and specifically include fees for tax return preparation and other related tax/compliance planning matters. |
| (3) | All other fees consist of the aggregate fees billed for products and services provided by the principal accountant other than audit, audit-related, and tax services. |
The various Series comprising the Trust have differing fiscal year ends* (January 31, August 31, September 30, October 31, November 30 or December 31). The following table presents the aggregate audit, audit-related, tax, and other fees billed to all of the Series in the Trust by D&T for the last two fiscal years of each Series.
| | | | | | | | | | | | | | | | | | | | | | | | | | | | | | | | | | | | | | | | |
Fiscal Years Ended* | | 9/30/12 | | | 10/31/12 | | | 11/30/12 | | | 12/31/12 | | | 1/31/13 | | | 9/30/13 | | | 10/31/13 | | | 11/30/13 | | | 12/31/13 | | | 1/31/14 | |
Audit Fees | | $ | 109,600 | | | $ | 524,630 | | | $ | 19,550 | | | $ | 88,479 | | | $ | 116,530 | | | $ | 117,400 | | | $ | 556,530 | | | $ | 24,800 | | | $ | 93,320 | | | $ | 125,080 | |
Audit-Related Fees(1) | | $ | 0 | | | $ | 0 | | | $ | 0 | | | $ | 0 | | | $ | 0 | | | $ | 0 | | | $ | 0 | | | $ | 0 | | | $ | 0 | | | $ | 0 | |
Tax Fees(2) | | $ | 28,740 | | | $ | 281,940 | | | $ | 8,310 | | | $ | 55,380 | | | $ | 55,490 | | | $ | 29,970 | | | $ | 299,460 | | | $ | 9,410 | | | $ | 57,050 | | | $ | 40,790 | |
All Other Fees(3) | | $ | 620 | | | $ | 0 | | | $ | 0 | | | $ | 0 | | | $ | 0 | | | $ | 0 | | | $ | 0 | | | $ | 0 | | | $ | 0 | | | $ | 0 | |
| | | | | | | | | | | | | | | | | | | | | | | | | | | | | | | | | | | | | | | | |
Total | | $ | 138,960 | | | $ | 806,570 | | | $ | 27,860 | | | $ | 143,859 | | | $ | 172,020 | | | $ | 147,370 | | | $ | 855,990 | | | $ | 34,210 | | | $ | 150,370 | | | $ | 165,870 | |
| | | | | | | | | | | | | | | | | | | | | | | | | | | | | | | | | | | | | | | | |
| * | Information is not presented for fiscal years ended 8/31/12 and 8/31/13 as no Series in the Trust with such fiscal year ends was in operation during such periods. |
| (1) | Audit-related fees consist of the aggregate fees billed for assurance and related services that are reasonably related to the performance of the audit of financial statements and are not reported under the category of audit fees. |
| (2) | Tax fees consist of the aggregate fees billed for professional services rendered by the principal accountant relating to tax compliance, tax advice, and tax planning and specifically include fees for tax return preparation and other related tax/compliance planning matters. |
| (3) | All other fees consist of the aggregate fees billed for products and services provided by the principal accountant other than audit, audit-related, and tax services. |
(e)(1) The registrant’s audit committee has adopted policies and procedures relating to the pre-approval of services provided by the registrant’s principal accountant (the “Pre-Approval Policies”). The Pre-Approval Policies establish a framework intended to assist the audit committee in the proper discharge of its pre-approval responsibilities. As a general matter, the Pre-Approval Policies (i) specify certain types of audit, audit-related, tax, and other services determined to be pre-approved by the audit committee; and (ii) delineate specific procedures governing the mechanics of the pre-approval process, including the approval and monitoring of audit and non-audit service fees. Unless a service is specifically pre-approved under the Pre-Approval Policies, it must be separately pre-approved by the audit committee.
The Pre-Approval Policies and the types of audit and non-audit services pre-approved therein must be reviewed and ratified by the registrant’s audit committee at least annually. The registrant’s audit committee maintains full responsibility for the appointment, compensation, and oversight of the work of the registrant’s principal accountant.
(e)(2) No services described in paragraphs (b)-(d) above were approved by the registrant’s audit committee pursuant to the “de minimis exception” set forth in Rule 2-01(c)(7)(i)(C) of Regulation S-X.
(f) Not applicable.
(g) The following table presents (i) the aggregate non-audit fees (i.e., fees for audit-related, tax, and other services) billed for services rendered to all of the Series in the Trust by D&T for the last two fiscal years of each Series; and (ii) the aggregate non-audit fees (i.e., fees for audit-related, tax, and other services) billed to the Eaton Vance organization by D&T for the last two fiscal years of each Series.
| | | | | | | | | | | | | | | | | | | | | | | | | | | | | | | | | | | | | | | | |
Fiscal Years
Ended* | | 9/30/12 | | | 10/31/12 | | | 11/30/12 | | | 12/31/12 | | | 1/31/13 | | | 9/30/13 | | | 10/31/13 | | | 11/30/13 | | | 12/31/13 | | | 1/31/14 | |
Registrant(1) | | $ | 29,360 | | | $ | 281,940 | | | $ | 8,310 | | | $ | 55,380 | | | $ | 55,490 | | | $ | 29,970 | | | $ | 299,460 | | | $ | 9,410 | | | $ | 57,050 | | | $ | 40,790 | |
Eaton Vance(2) | | $ | 606,619 | | | $ | 566,619 | | | $ | 662,119 | | | $ | 615,489 | | | $ | 544,549 | | | $ | 369,820 | | | $ | 526,385 | | | $ | 409,385 | | | $ | 409,385 | | | $ | 370,325 | |
| * | Information is not presented for fiscal years ended 8/31/12 and 8/31/13 as no Series in the Trust with such fiscal year ends was in operation during such periods. |
| (1) | Includes all of the Series of the Trust. During the fiscal years reported above, certain of the Funds were “feeder” funds in a “master-feeder” fund structure or funds of funds. |
| (2) | Various subsidiaries of Eaton Vance Corp. act in either an investment advisory and/or service provider capacity with respect to the Series and/or their respective “master” funds (if applicable). |
(h) The registrant’s audit committee has considered whether the provision by the registrant’s principal accountant of non-audit services to the registrant’s investment adviser and any entity controlling, controlled by, or under common control with the adviser that provides ongoing services to the registrant that were not pre-approved pursuant to Rule 2-01(c)(7)(ii) of Regulation S-X is compatible with maintaining the principal accountant’s independence.
Item 5. Audit Committee of Listed Registrants
Not applicable.
Item 6. Schedule of Investments
Please see schedule of investments contained in the Report to Stockholders included under Item 1 of this Form N-CSR.
Item 7. Disclosure of Proxy Voting Policies and Procedures for Closed-End Management Investment Companies
Not applicable.
Item 8. Portfolio Managers of Closed-End Management Investment Companies
Not applicable.
Item 9. Purchases of Equity Securities by Closed-End Management Investment Company and Affiliated Purchasers
Not applicable.
Item 10. Submission of Matters to a Vote of Security Holders
No material changes.
Item 11. Controls and Procedures
(a) It is the conclusion of the registrant’s principal executive officer and principal financial officer that the effectiveness of the registrant’s current disclosure controls and procedures (such disclosure controls and procedures having been evaluated within 90 days of the date of this filing) provide reasonable assurance that the information required to be disclosed by the registrant has been recorded, processed, summarized and reported within the time period specified in the Commission’s rules and forms and that the information required to be disclosed by the registrant has been accumulated and communicated to the registrant’s principal executive officer and principal financial officer in order to allow timely decisions regarding required disclosure.
(b) There have been no changes in the registrant’s internal controls over financial reporting during the second fiscal quarter of the period covered by this report that has materially affected, or is reasonably likely to materially affect, the registrant’s internal control over financial reporting.
Item 12. Exhibits
| | |
| |
| (a)(1) | | Registrant’s Code of Ethics – Not applicable (please see Item 2). |
| |
| (a)(2)(i) | | Treasurer’s Section 302 certification. |
| |
| (a)(2)(ii) | | President’s Section 302 certification. |
| |
| (b) | | Combined Section 906 certification. |
Signatures
Pursuant to the requirements of the Securities Exchange Act of 1934 and the Investment Company Act of 1940, the registrant has duly caused this report to be signed on its behalf by the undersigned, thereunto duly authorized.
| | |
| Eaton Vance Mutual Funds Trust |
| |
By: | | /s/ Payson F. Swaffield |
| | Payson F. Swaffield |
| | President |
| |
Date: | | March 13, 2014 |
Pursuant to the requirements of the Securities Exchange Act of 1934 and the Investment Company Act of 1940, this report has been signed below by the following persons on behalf of the registrant and in the capacities and on the dates indicated.
| | |
By: | | /s/ James F. Kirchner |
| | James F. Kirchner |
| | Treasurer |
| |
Date: | | March 13, 2014 |
| |
By: | | /s/ Payson F. Swaffield |
| | Payson F. Swaffield |
| | President |
| |
Date: | | March 13, 2014 |