UNITED STATES
SECURITIES AND EXCHANGE COMMISSION
Washington, D.C. 20549
Form N-CSR
CERTIFIED SHAREHOLDER REPORT OF REGISTERED
MANAGEMENT INVESTMENT COMPANIES
Investment Company Act File Number: 811-04015
Eaton Vance Mutual Funds Trust
(Exact Name of Registrant as Specified in Charter)
Two International Place, Boston, Massachusetts 02110
(Address of Principal Executive Offices)
Maureen A. Gemma
Two International Place, Boston, Massachusetts 02110
(Name and Address of Agent for Services)
(617) 482-8260
(Registrant’s Telephone Number)
November 30
Date of Fiscal Year End
November 30, 2013
Date of Reporting Period
Item 1. Reports to Stockholders

Parametric Currency Fund
Annual Report
November 30, 2013

Commodity Futures Trading Commission Registration. Effective December 31, 2012, the Commodity Futures Trading Commission (“CFTC”) adopted certain regulatory changes that subject registered investment companies and advisers to regulation by the CFTC if a fund invests more than a prescribed level of its assets in certain CFTC-regulated instruments (including futures, certain options and swap agreements) or markets itself as providing investment exposure to such instruments. The Fund is considered to be a commodity pool operator under CFTC regulations. The Fund’s adviser is registered with the CFTC as a commodity pool operator and a commodity trading advisor. The CFTC has neither reviewed nor approved the Fund’s investment strategies.
Fund shares are not insured by the FDIC and are not deposits or other obligations of, or guaranteed by, any depository institution. Shares are subject to investment risks, including possible loss of principal invested.
This report must be preceded or accompanied by a current summary prospectus or prospectus. Before investing, investors should consider carefully the investment objective, risks, and charges and expenses of a mutual fund. This and other important information is contained in the summary prospectus and prospectus, which can be obtained from a financial advisor. Prospective investors should read the prospectus carefully before investing. For further information, please call 1-800-260-0761.
Annual Report November 30, 2013
Parametric Currency Fund
Table of Contents
| | | | |
Management’s Discussion of Fund Performance | | | 2 | |
| |
Performance | | | 3 | |
| |
Fund Profile | | | 4 | |
| |
Endnotes and Additional Disclosures | | | 5 | |
| |
Fund Expenses | | | 6 | |
| |
Financial Statements | | | 7 | |
| |
Report of Independent Registered Public Accounting Firm | | | 21 | |
| |
Federal Tax Information | | | 22 | |
| |
Management and Organization | | | 23 | |
| |
Important Notices | | | 25 | |
Parametric Currency Fund
November 30, 2013
Management’s Discussion of Fund Performance1
Economic and Market Conditions
During the 12-month period ended November 30, 2013, central bank activity, U.S. fiscal policy and events in Europe were key drivers of the performance of the global bond markets. Slowing economic growth in China and instability in the Middle East also influenced returns.
In January 2013, the U.S. Federal Reserve (the Fed) increased the size of its monthly bond purchases by adding $45 billion of long-term Treasury securities to the $40 billion in agency mortgage-backed issues it had been buying since September 2012. (The Fed had been buying long-term Treasurys since 2011, but funding these purchases by selling short-term Treasurys — a program dubbed Operation Twist that expired in December 2012.) Then, in the spring, the Fed indicated that it might start tapering its bond purchases, causing Treasury yields to spike. However, the Fed held policy steady over the remainder of the period due to concerns about the economy and fiscal policy. The U.S. government shut down briefly in October until Congress reached an agreement to fund operations and extend the debt ceiling through the beginning of 2014. Just seven months earlier, across-the-board spending cuts had gone into effect because lawmakers could not agree on a targeted plan to reduce the deficit.
In Japan, a newly elected government, together with the Bank of Japan, took bold steps to revive the nation’s economy, including doubling the amount of the central bank’s bond purchases. The European Central Bank (ECB) also eased policy to help boost growth, cutting its key lending rate to a record low. Peripheral eurozone debt markets continued to benefit from ECB President Mario Draghi’s July 2012 pledge to do “whatever it takes to preserve the euro” — a pledge backed by a program to purchase bonds of governments that receive aid from the region’s rescue fund. In March 2013, a rescue package for Cyprus and its ailing banks kept the small country from exiting the eurozone. However, for the first time in a eurozone bailout, bank depositors were taxed, raising concerns that this might be the model for future aid agreements. Near the end of the period, German Chancellor Angela Merkel won re-election, suggesting that there would be no major changes to eurozone policy, at least in the near term.
GDP growth slowed in China during the first half of 2013 as the government worked to rebalance the economy away from exports and investment spending and toward domestic consumption. This was a headwind for countries and companies that produce industrial metals and other commodities consumed by China. On the geopolitical front, Egypt ousted its president, and the United States considered a military strike on Syria for its alleged use of chemical weapons.
Against this backdrop, the currency markets delivered mixed performance. For example, the euro strengthened versus the U.S. dollar amid signs that the region’s economies had stabilized, as well as the ECB’s less-accommodative monetary policy relative to the Fed. Conversely, aggressive monetary easing from the Bank of Japan caused the yen to weaken versus the U.S. dollar. In emerging markets, several Eastern European currencies gained relative to the U.S. dollar and euro, while most currencies of nations with large current account deficits, including India and Brazil, declined.
Fund Performance
For the 12-month period ended November 30, 2013, Parametric Currency Fund (the Fund) Investor Class at net asset value (NAV) had a total return of -3.56%. By comparison, the Fund’s benchmark, the Barclays Global Ex-USD Benchmark Currency (Trade-Weighted) Index2 (the Index) returned -0.52% during the same period.
The negative returns posted by both the Fund and the Index reflected a strengthening trend in the value of the U.S. dollar with respect to a majority of global currencies. This increase was driven by investors’ increasing optimism about the state of the United States economy and a growing belief that the Fed may soon begin to moderate its loose monetary policies.
The main detractor to the Fund’s performance versus the Index was the Fund’s underweight to the Chinese yuan. The yuan’s loose peg to the U.S. dollar typically means that it will rally in times of U.S. dollar strength. In addition, an underweight to the euro was also a detractor to the Fund’s performance versus the Index due to its appreciation on growing optimism about economic growth in the eurozone. Finally, the broad overweight to emerging-market currencies, including a number of non-Index exposures, generally detracted from the Fund’s performance relative to the Index.
The main contributor to the Fund’s performance versus the Index was the Fund’s underweight to the Japanese yen, which declined versus the U.S. dollar due to the pro-inflation policies of the current Japanese government. In addition, the underweight to the Canadian dollar also benefited the Fund’s performance versus the Index. The Fund’s non-Index positions in the Israeli shekel and the Polish zloty also contributed to the Fund’s performance relative to the Index.
The Fund’s emphasis on rebalancing and spreading its holdings across a broad spectrum of global currencies generally aided the Fund’s performance relative to the Index, as many currencies experienced reversals of fortune from month to month, which broadly generated a rebalancing premium.
See Endnotes and Additional Disclosures in this report.
Past performance is no guarantee of future results. Returns are historical and are calculated by determining the percentage change in net asset value (NAV) or offering price (as applicable) with all distributions reinvested. Investment return and principal value will fluctuate so that shares, when redeemed, may be worth more or less than their original cost. Performance less than one year is cumulative. Performance is for the stated time period only; due to market volatility, the Fund’s current performance may be lower or higher than quoted. Returns are before taxes unless otherwise noted. For performance as of the most recent month end, please refer to eatonvance.com.
Parametric Currency Fund
November 30, 2013
Performance2,3
Portfolio Managers David Stein, Ph.D. and Thomas Seto, each of Parametric Portfolio Associates LLC
| | | | | | | | | | | | | | | | |
| % Average Annual Total Returns | | Class Inception Date | | | Performance Inception Date | | | One Year | | | Since Inception | |
Investor Class at NAV | | | 12/30/2011 | | | | 12/30/2011 | | | | -3.56 | % | | | 0.31 | % |
Institutional Class at NAV | | | 12/30/2011 | | | | 12/30/2011 | | | | -3.33 | | | | 0.53 | |
Barclays Global Ex-USD Benchmark Currency (Trade-Weighted) Index | | | — | | | | — | | | | -0.52 | % | | | 1.18 | % |
| | | | |
| | | | | | | | | | | | | | | | |
| % Total Annual Operating Expense Ratios4 | | | | | | | | Investor
Class | | | Institutional
Class | |
Gross | | | | | | | | | | | 7.80 | % | | | 7.55 | % |
Net | | | | | | | | | | | 0.90 | | | | 0.65 | |
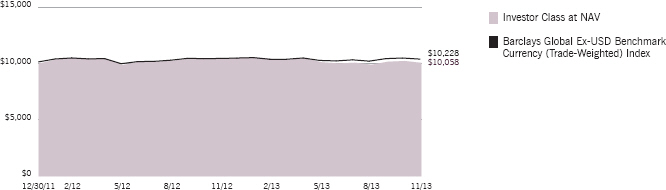
Growth of $10,000
This graph shows the change in value of a hypothetical investment of $10,000 in Investor Class of the Fund for the period indicated. For comparison, the same investment is shown in the indicated index.
| | | | | | | | |
| Growth of Investment | | Amount Invested | | Period Beginning | | At NAV | | With Maximum
Sales Charge |
Institutional Class | | $50,000 | | 12/30/2011 | | $50,507 | | N.A. |
See Endnotes and Additional Disclosures in this report.
Past performance is no guarantee of future results. Returns are historical and are calculated by determining the percentage change in net asset value (NAV) or offering price (as applicable) with all distributions reinvested. Investment return and principal value will fluctuate so that shares, when redeemed, may be worth more or less than their original cost. Performance less than one year is cumulative. Performance is for the stated time period only; due to market volatility, the Fund’s current performance may be lower or higher than quoted. Returns are before taxes unless otherwise noted. For performance as of the most recent month end, please refer to eatonvance.com.
Parametric Currency Fund
November 30, 2013
Fund Profile
Foreign Currency Exposure (% of net assets)5
| | | | | | | | | | |
Africa | | | 3.4 | % | | Europe | | | 33.6 | % |
| | | |
South African Rand | | | 3.4 | | | British Pound Sterling | | | 3.5 | |
| | | |
| | | | | | New Turkish Lira | | | 3.4 | |
| | | |
Asia | | | 33.6 | % | | Euro | | | 3.4 | |
| | | |
Yuan Renminbi | | | 3.4 | | | Swiss Franc | | | 3.4 | |
| | | |
Indian Rupee | | | 3.4 | | | Polish Zloty | | | 3.4 | |
| | | |
South Korean Won | | | 3.4 | | | Swedish Krona | | | 3.4 | |
| | | |
New Taiwan Dollar | | | 3.4 | | | Hungarian Forint | | | 3.3 | |
| | | |
Singapore Dollar | | | 3.4 | | | Russian Ruble | | | 3.3 | |
| | | |
Malaysian Ringgit | | | 3.4 | | | Norwegian Krone | | | 3.3 | |
| | | |
Philippine Peso | | | 3.4 | | | Czech Koruna | | | 3.2 | |
| | | |
Thai Baht | | | 3.3 | | | | | | | |
| | | |
Japanese Yen | | | 3.3 | | | Latin America | | | 16.9 | % |
| | | |
Indonesian Rupiah | | | 3.2 | | | Mexican Peso | | | 3.4 | |
| | | |
| | | | | | Peruvian New Sol | | | 3.4 | |
| | | |
Dollar Bloc | | | 9.9 | % | | Colombian Peso | | | 3.4 | |
| | | |
New Zealand Dollar | | | 3.3 | | | Brazilian Real | | | 3.4 | |
| | | |
Canadian Dollar | | | 3.3 | | | Chilean Peso | | | 3.3 | |
| | | |
Australian Dollar | | | 3.3 | | | | | | | |
| | | |
| | | | | | Middle East | | | 3.4 | % |
| | | |
| | | | | | Israeli Shekel | | | 3.4 | |
See Endnotes and Additional Disclosures in this report.
Parametric Currency Fund
November 30, 2013
Endnotes and Additional Disclosures
| 1 | The views expressed in this report are those of the portfolio manager(s) and are current only through the date stated at the top of this page. These views are subject to change at any time based upon market or other conditions, and Eaton Vance and the Fund(s) disclaim any responsibility to update such views. These views may not be relied upon as investment advice and, because investment decisions are based on many factors, may not be relied upon as an indication of trading intent on behalf of any Eaton Vance fund. This commentary may contain statements that are not historical facts, referred to as “forward looking statements”. The Fund’s actual future results may differ significantly from those stated in any forward looking statement, depending on factors such as changes in securities or financial markets or general economic conditions, the volume of sales and purchases of Fund shares, the continuation of investment advisory, administrative and service contracts, and other risks discussed from time to time in the Fund’s filings with the Securities and Exchange Commission. |
| 2 | Barclays Global Ex-USD Benchmark Currency (Trade-Weighted) Index is an unmanaged index tracking the performance of 1-month FX positions in a basket of currencies versus the U.S. Dollar. Unless otherwise stated, index returns do not reflect the effect of any applicable sales charges, commissions, expenses, taxes or leverage, as applicable. It is not possible to invest directly in an index. |
| 3 | Returns are historical and are calculated by determining the percentage change in net asset value (NAV) with all distributions reinvested. Unless otherwise stated, performance does not reflect the deduction of taxes on Fund distributions or redemptions of Fund shares. Performance since inception for an index, if presented, is the performance since the Fund’s or oldest share class’ inception, as applicable. |
| 4 | Source: Fund prospectus. Net expense ratio reflects a contractual expense reimbursement that continues through 3/31/14. Without the reimbursement, performance would have been lower. |
| 5 | Currency exposures reflect currency derivative holdings. |
| | Fund profile subject to change due to active management. |
Parametric Currency Fund
November 30, 2013
Fund Expenses
Example: As a Fund shareholder, you incur two types of costs: (1) transaction costs, including sales charges (loads) on purchases and redemption fees (if applicable); and (2) ongoing costs, including management fees; distribution and/or service fees; and other Fund expenses. This Example is intended to help you understand your ongoing costs (in dollars) of Fund investing and to compare these costs with the ongoing costs of investing in other mutual funds. The Example is based on an investment of $1,000 invested at the beginning of the period and held for the entire period (June 1, 2013 – November 30, 2013).
Actual Expenses: The first section of the table below provides information about actual account values and actual expenses. You may use the information in this section, together with the amount you invested, to estimate the expenses that you paid over the period. Simply divide your account value by $1,000 (for example, an $8,600 account value divided by $1,000 = 8.6), then multiply the result by the number in the first section under the heading entitled “Expenses Paid During Period” to estimate the expenses you paid on your account during this period.
Hypothetical Example for Comparison Purposes: The second section of the table below provides information about hypothetical account values and hypothetical expenses based on the actual Fund expense ratio and an assumed rate of return of 5% per year (before expenses), which is not the actual Fund return. The hypothetical account values and expenses may not be used to estimate the actual ending account balance or expenses you paid for the period. You may use this information to compare the ongoing costs of investing in your Fund and other funds. To do so, compare this 5% hypothetical example with the 5% hypothetical examples that appear in the shareholder reports of the other funds.
Please note that the expenses shown in the table are meant to highlight your ongoing costs only and do not reflect any transactional costs, such as sales charges (loads) or redemption fees (if applicable). Therefore, the second section of the table is useful in comparing ongoing costs only, and will not help you determine the relative total costs of owning different funds. In addition, if these transactional costs were included, your costs would be higher.
| | | | | | | | | | | | | | | | |
| | | Beginning
Account Value
(6/1/13) | | | Ending
Account Value
(11/30/13) | | | Expenses Paid
During Period*
(6/1/13 – 11/30/13) | | | Annualized
Expense
Ratio | |
| | | | |
| | | | | | | | | | | | | | | | |
Actual | | | | | | | | | | | | | | | | |
Investor Class | | $ | 1,000.00 | | | $ | 994.90 | | | $ | 4.50 | ** | | | 0.90 | % |
Institutional Class | | $ | 1,000.00 | | | $ | 995.90 | | | $ | 3.25 | ** | | | 0.65 | % |
| | | | | | | | | | | | | | | | | |
| | | | |
| | | | | | | | | | | | | | | | |
Hypothetical | | | | | | | | | | | | | | | | |
(5% return per year before expenses) | | | | | | | | | | | | | | | | |
Investor Class | | $ | 1,000.00 | | | $ | 1,020.60 | | | $ | 4.56 | ** | | | 0.90 | % |
Institutional Class | | $ | 1,000.00 | | | $ | 1,021.80 | | | $ | 3.29 | ** | | | 0.65 | % |
| * | Expenses are equal to the Fund’s annualized expense ratio for the indicated Class, multiplied by the average account value over the period, multiplied by 183/365 (to reflect the one-half year period). The Example assumes that the $1,000 was invested at the net asset value per share determined at the close of business on May 31, 2013. |
| ** | Absent an allocation of certain expenses to affiliates, the expenses would be higher. |
Parametric Currency Fund
November 30, 2013
Portfolio of Investments
| | | | | | | | |
| Short-Term Investments — 107.4% | |
|
| U.S. Treasury Obligations — 85.2% | |
| | |
| | | | | | | | |
| Security | | Principal
Amount
(000’s omitted) | | | Value | |
| | | | | | | | |
U.S. Treasury Bill, 0.00%, 12/12/13 | | $ | 700 | | | $ | 699,998 | |
U.S. Treasury Bill, 0.00%, 2/6/14 | | | 650 | | | | 649,961 | |
U.S. Treasury Bill, 0.00%, 5/1/14 | | | 650 | | | | 649,759 | |
U.S. Treasury Bill, 0.00%, 9/18/14 | | | 200 | | | | 199,859 | |
U.S. Treasury Bill, 0.00%, 11/13/14 | | | 1,100 | | | | 1,098,758 | |
| | | | | | | | | |
| | |
Total U.S. Treasury Obligations
(identified cost $3,298,169) | | | | | | $ | 3,298,335 | |
| | | | | | | | | |
| | |
| Other — 22.2% | | | | | | | | |
| | |
| | | | | | | | |
| Description | | Interest
(000’s omitted) | | | Value | |
Eaton Vance Cash Reserves Fund, LLC, 0.12%(1) | | $ | 860 | | | $ | 860,170 | |
| | | | | | | | | |
| | |
Total Other
(identified cost $860,170) | | | | | | $ | 860,170 | |
| | | | | | | | | |
| | |
Total Short-Term Investments
(identified cost $4,158,339) | | | | | | $ | 4,158,505 | |
| | | | | | | | | |
| | |
Other Assets, Less Liabilities — (7.4)% | | | | | | $ | (286,325 | ) |
| | | | | | | | | |
| | |
Net Assets — 100.0% | | | | | | $ | 3,872,180 | |
| | | | | | | | | |
The percentage shown for each investment category in the Portfolio of Investments is based on net assets.
| (1) | Affiliated investment company, available to Eaton Vance portfolios and funds, which invests in high quality, U.S. dollar denominated money market instruments. The rate shown is the annualized seven-day yield as of November 30, 2013. |
| | | | |
| | 7 | | See Notes to Financial Statements. |
Parametric Currency Fund
November 30, 2013
Statement of Assets and Liabilities
| | | | |
| Assets | | November 30, 2013 | |
Unaffiliated investments, at value (identified cost, $3,298,169) | | $ | 3,298,335 | |
Affiliated investment, at value (identified cost, $860,170) | | | 860,170 | |
Interest receivable from affiliated investment | | | 109 | |
Receivable for open forward foreign currency exchange contracts | | | 9,509 | |
Receivable from affiliates | | | 12,970 | |
Total assets | | $ | 4,181,093 | |
| |
| Liabilities | | | | |
Payable for investments purchased | | $ | 199,775 | |
Payable for Fund shares redeemed | | | 3,494 | |
Payable for open forward foreign currency exchange contracts | | | 55,866 | |
Payable to affiliates: | | | | |
Investment adviser and administration fee | | | 1,763 | |
Distribution and service fees | | | 42 | |
Trustees’ fees | | | 110 | |
Accrued expenses | | | 47,863 | |
Total liabilities | | $ | 308,913 | |
Net Assets | | $ | 3,872,180 | |
| |
| Sources of Net Assets | | | | |
Paid-in capital | | $ | 3,985,030 | |
Accumulated net realized gain | | | 113 | |
Accumulated distributions in excess of net investment income | | | (66,772 | ) |
Net unrealized depreciation | | | (46,191 | ) |
Total | | $ | 3,872,180 | |
| |
| Investor Class Shares | | | | |
Net Assets | | $ | 192,849 | |
Shares Outstanding | | | 19,686 | |
Net Asset Value, Offering Price and Redemption Price Per Share | | | | |
(net assets ÷ shares of beneficial interest outstanding) | | $ | 9.80 | |
| |
| Institutional Class Shares | | | | |
Net Assets | | $ | 3,679,331 | |
Shares Outstanding | | | 374,224 | |
Net Asset Value, Offering Price and Redemption Price Per Share | | | | |
(net assets ÷ shares of beneficial interest outstanding) | | $ | 9.83 | |
| | | | |
| | 8 | | See Notes to Financial Statements. |
Parametric Currency Fund
November 30, 2013
Statement of Operations
| | | | |
| Investment Income | | Year Ended November 30, 2013 | |
Interest | | $ | 3,460 | |
Interest allocated from affiliated investment | | | 1,093 | |
Expenses allocated from affiliated investment | | | (135 | ) |
Total investment income | | $ | 4,418 | |
| |
| Expenses | | | | |
Investment adviser and administration fee | | $ | 19,577 | |
Distribution and service fees | | | | |
Investor Class | | | 577 | |
Trustees’ fees and expenses | | | 648 | |
Custodian fee | | | 29,882 | |
Transfer and dividend disbursing agent fees | | | 19 | |
Legal and accounting services | | | 36,900 | |
Printing and postage | | | 12,674 | |
Registration fees | | | 42,488 | |
Miscellaneous | | | 9,871 | |
Total expenses | | $ | 152,636 | |
Deduct — | | | | |
Allocation of expenses to affiliates | | $ | 129,057 | |
Total expense reductions | | $ | 129,057 | |
| |
Net expenses | | $ | 23,579 | |
| |
Net investment loss | | $ | (19,161 | ) |
| |
| Realized and Unrealized Gain (Loss) | | | | |
Net realized gain (loss) — | | | | |
Investment transactions | | $ | 20 | |
Investment transactions allocated from affiliated investment | | | 27 | |
Forward foreign currency exchange contract transactions | | | (12,552 | ) |
Net realized loss | | $ | (12,505 | ) |
Change in unrealized appreciation (depreciation) — | | | | |
Investments | | $ | (216 | ) |
Forward foreign currency exchange contracts | | | (90,067 | ) |
Net change in unrealized appreciation (depreciation) | | $ | (90,283 | ) |
| |
Net realized and unrealized loss | | $ | (102,788 | ) |
| |
Net decrease in net assets from operations | | $ | (121,949 | ) |
| | | | |
| | 9 | | See Notes to Financial Statements. |
Parametric Currency Fund
November 30, 2013
Statements of Changes in Net Assets
| | | | | | | | |
| Increase (Decrease) in Net Assets | | Year Ended
November 30, 2013 | | | Period Ended November 30, 2012(1) | |
From operations — | | | | | | | | |
Net investment loss | | $ | (19,161 | ) | | $ | (10,852 | ) |
Net realized gain (loss) from investment and forward foreign currency exchange contract transactions | | | (12,505 | ) | | | 49,299 | |
Net change in unrealized appreciation (depreciation) from investments and forward foreign currency exchange contracts | | | (90,283 | ) | | | 44,092 | |
Net increase (decrease) in net assets from operations | | $ | (121,949 | ) | | $ | 82,539 | |
Distributions to shareholders — | | | | | | | | |
From net investment income | | | | | | | | |
Investor Class | | $ | (6,295 | ) | | $ | — | |
Institutional Class | | | (82,862 | ) | | | — | |
Total distributions to shareholders | | $ | (89,157 | ) | | $ | — | |
Transactions in shares of beneficial interest — | | | | | | | | |
Proceeds from sale of shares | | | | | | | | |
Investor Class | | $ | 42,000 | | | $ | 249,150 | |
Institutional Class | | | 2,462,638 | | | | 2,990,990 | |
Net asset value of shares issued to shareholders in payment of distributions declared | | | | | | | | |
Investor Class | | | 6,025 | | | | — | |
Institutional Class | | | 3,768 | | | | — | |
Cost of shares redeemed | | | | | | | | |
Investor Class | | | (83,472 | ) | | | (9,917 | ) |
Institutional Class | | | (1,555,728 | ) | | | (104,707 | ) |
Net increase in net assets from Fund share transactions | | $ | 875,231 | | | $ | 3,125,516 | |
| | |
Net increase in net assets | | $ | 664,125 | | | $ | 3,208,055 | |
| | |
| Net Assets | | | | | | | | |
At beginning of period | | $ | 3,208,055 | | | $ | — | |
At end of period | | $ | 3,872,180 | | | $ | 3,208,055 | |
| | |
Accumulated undistributed (distributions in excess of) net investment income
included in net assets | | | | | | | | |
At end of period | | $ | (66,772 | ) | | $ | 53,823 | |
| (1) | For the period from the start of business, December 30, 2011, to November 30, 2012. |
| | | | |
| | 10 | | See Notes to Financial Statements. |
Parametric Currency Fund
November 30, 2013
Financial Highlights
| | | | | | | | |
| | | Investor Class | |
| | | Year Ended
November 30, 2013 | | | Period Ended
November 30, 2012(1) | |
Net asset value — Beginning of period | | $ | 10.430 | | | $ | 10.000 | |
| | |
| Income (Loss) From Operations | | | | | | | | |
Net investment loss(2) | | $ | (0.077 | ) | | $ | (0.071 | ) |
Net realized and unrealized gain (loss) | | | (0.283 | ) | | | 0.501 | |
| | |
Total income (loss) from operations | | $ | (0.360 | ) | | $ | 0.430 | |
| | |
| Less Distributions | | | | | | | | |
From net investment income | | $ | (0.270 | ) | | $ | — | |
| | |
Total distributions | | $ | (0.270 | ) | | $ | — | |
| | |
Net asset value — End of period | | $ | 9.800 | | | $ | 10.430 | |
| | |
Total Return(3) | | | (3.56 | )% | | | 4.30 | %(4) |
| | |
| Ratios/Supplemental Data | | | | | | | | |
Net assets, end of period (000’s omitted) | | $ | 193 | | | $ | 243 | |
Ratios (as a percentage of average daily net assets): | | | | | | | | |
Expenses(5) | | | 0.90 | % | | | 0.90 | %(6) |
Net investment loss | | | (0.77 | )% | | | (0.76 | )%(6) |
Portfolio Turnover | | | 0 | % | | | 0 | % |
| (1) | For the period from the start of business, December 30, 2011, to November 30, 2012. |
| (2) | Computed using average shares outstanding. |
| (3) | Returns are historical and are calculated by determining the percentage change in net asset value with all distributions reinvested and do not reflect the effect of sales charges, if any. |
| (5) | The investment adviser, sub-adviser and administrator subsidized certain operating expenses (equal to 3.62% and 6.90% of average daily net assets for the year ended November 30, 2013 and for the period from the start of business, December 30, 2011, to November 30, 2012, respectively). Absent this subsidy, total return would have been lower. |
| | | | |
| | 11 | | See Notes to Financial Statements. |
Parametric Currency Fund
November 30, 2013
Financial Highlights — continued
| | | | | | | | |
| | | Institutional Class | |
| | | Year Ended
November 30, 2013 | | | Period Ended November 30, 2012(1) | |
Net asset value — Beginning of period | | $ | 10.450 | | | $ | 10.000 | |
| | |
| Income (Loss) From Operations | | | | | | | | |
Net investment loss(2) | | $ | (0.052 | ) | | $ | (0.048 | ) |
Net realized and unrealized gain (loss) | | | (0.285 | ) | | | 0.498 | |
| | |
Total income (loss) from operations | | $ | (0.337 | ) | | $ | 0.450 | |
| | |
| Less Distributions | | | | | | | | |
From net investment income | | $ | (0.283 | ) | | $ | — | |
| | |
Total distributions | | $ | (0.283 | ) | | $ | — | |
| | |
Net asset value — End of period | | $ | 9.830 | | | $ | 10.450 | |
| | |
Total Return(3) | | | (3.33 | )% | | | 4.50 | %(4) |
| | |
| Ratios/Supplemental Data | | | | | | | | |
Net assets, end of period (000’s omitted) | | $ | 3,679 | | | $ | 2,965 | |
Ratios (as a percentage of average daily net assets): | | | | | | | | |
Expenses(5) | | | 0.65 | % | | | 0.65 | %(6) |
Net investment loss | | | (0.52 | )% | | | (0.51 | )%(6) |
Portfolio Turnover | | | 0 | % | | | 0 | % |
| (1) | For the period from the start of business, December 30, 2011, to November 30, 2012. |
| (2) | Computed using average shares outstanding. |
| (3) | Returns are historical and are calculated by determining the percentage change in net asset value with all distributions reinvested. |
| (5) | The investment adviser, sub-adviser and administrator subsidized certain operating expenses (equal to 3.62% and 6.90% of average daily net assets for the year ended November 30, 2013 and for the period from the start of business, December 30, 2011, to November 30, 2012, respectively). Absent this subsidy, total return would have been lower. |
| | | | |
| | 12 | | See Notes to Financial Statements. |
Parametric Currency Fund
November 30, 2013
Notes to Financial Statements
1 Significant Accounting Policies
Parametric Currency Fund (formerly, Eaton Vance Parametric Structured Currency Fund) (the Fund) is a diversified series of Eaton Vance Mutual Funds Trust (the Trust). The Trust is a Massachusetts business trust registered under the Investment Company Act of 1940, as amended (the 1940 Act), as an open-end management investment company. The Fund’s investment objective is to protect against depreciation of the U.S. dollar relative to other currencies. The Fund expects to gain exposure to non-dollar currencies primarily through positions in monthly or other short-dated forward currency contracts or other derivative instruments backed by holdings of U.S. Treasury bills and other short-term U.S. Government obligations. The Fund offers two classes of shares. Investor Class (renamed from Class A effective March 1, 2013) and Institutional Class (renamed from Class I effective March 1, 2013) shares are sold at net asset value and are not subject to a sales charge. Prior to March 1, 2013, the date the sales charge was eliminated and the share class was renamed, Investor Class shares were generally sold subject to a sales charge of 2.25% imposed at time of purchase. Each class represents a pro-rata interest in the Fund, but votes separately on class-specific matters and (as noted below) is subject to different expenses. Realized and unrealized gains and losses and net investment income and losses, other than class-specific expenses, are allocated daily to each class of shares based on the relative net assets of each class to the total net assets of the Fund. Each class of shares differs in its distribution plan and certain other class-specific expenses.
The following is a summary of significant accounting policies of the Fund. The policies are in conformity with accounting principles generally accepted in the United States of America.
A Investment Valuation — The following methodologies are used to determine the market value or fair value of investments.
Debt Obligations. Debt obligations (including short-term obligations with a remaining maturity of more than sixty days) are generally valued on the basis of valuations provided by third party pricing services, as derived from such services’ pricing models. Inputs to the models may include, but are not limited to, reported trades, executable bid and asked prices, broker/dealer quotations, prices or yields of securities with similar characteristics, benchmark curves or information pertaining to the issuer, as well as industry and economic events. The pricing services may use a matrix approach, which considers information regarding securities with similar characteristics to determine the valuation for a security. Short-term obligations purchased with a remaining maturity of sixty days or less are generally valued at amortized cost, which approximates market value.
Derivatives. Forward foreign currency exchange contracts are generally valued at the mean of the average bid and average asked prices that are reported by currency dealers to a third party pricing service at the valuation time. Such third party pricing service valuations are supplied for specific settlement periods and the Fund’s forward foreign currency exchange contracts are valued at an interpolated rate between the closest preceding and subsequent settlement period reported by the third party pricing service.
Affiliated Fund. The Fund may invest in Eaton Vance Cash Reserves Fund, LLC (Cash Reserves Fund), an affiliated investment company managed by Eaton Vance Management (EVM). The value of the Fund’s investment in Cash Reserves Fund reflects the Fund’s proportionate interest in its net assets. Cash Reserves Fund generally values its investment securities utilizing the amortized cost valuation technique in accordance with Rule 2a-7 under the 1940 Act. This technique involves initially valuing a portfolio security at its cost and thereafter assuming a constant amortization to maturity of any discount or premium. If amortized cost is determined not to approximate fair value, Cash Reserves Fund may value its investment securities in the same manner as debt obligations described above.
Fair Valuation. Investments for which valuations or market quotations are not readily available or are deemed unreliable are valued at fair value using methods determined in good faith by or at the direction of the Trustees of the Fund in a manner that fairly reflects the security’s value, or the amount that the Fund might reasonably expect to receive for the security upon its current sale in the ordinary course. Each such determination is based on a consideration of relevant factors, which are likely to vary from one pricing context to another. These factors may include, but are not limited to, the type of security, the existence of any contractual restrictions on the security’s disposition, the price and extent of public trading in similar securities of the issuer or of comparable companies or entities, quotations or relevant information obtained from broker/dealers or other market participants, information obtained from the issuer, analysts, and/or the appropriate stock exchange (for exchange-traded securities), an analysis of the company’s or entity’s financial condition, and an evaluation of the forces that influence the issuer and the market(s) in which the security is purchased and sold.
B Investment Transactions — Investment transactions for financial statement purposes are accounted for on a trade date basis. Realized gains and losses on investments sold are determined on the basis of identified cost.
C Income — Interest income is recorded on the basis of interest accrued, adjusted for amortization of premium or accretion of discount.
D Federal Taxes — The Fund’s policy is to comply with the provisions of the Internal Revenue Code applicable to regulated investment companies and to distribute to shareholders each year substantially all of its net investment income, and all or substantially all of its net realized capital gains. Accordingly, no provision for federal income tax is necessary. The Fund also seeks to avoid payment of federal excise tax.
At November 30, 2013, the Fund had a late year ordinary loss of $92,434 which it has elected to defer to the following taxable year pursuant to income tax regulations. Late year ordinary losses represent certain specified losses realized in that portion of a taxable year after October 31 that are treated as ordinary for tax purposes plus ordinary losses attributable to that portion of a taxable year after December 31.
As of November 30, 2013, the Fund had no uncertain tax positions that would require financial statement recognition, de-recognition, or disclosure. The Fund files a U.S. federal income tax return annually after its fiscal year-end, which is subject to examination by the Internal Revenue Service for a period of three years from the date of filing.
Parametric Currency Fund
November 30, 2013
Notes to Financial Statements — continued
E Expenses — The majority of expenses of the Trust are directly identifiable to an individual fund. Expenses which are not readily identifiable to a specific fund are allocated taking into consideration, among other things, the nature and type of expense and the relative size of the funds.
F Expense Reduction — State Street Bank and Trust Company (SSBT) serves as custodian of the Fund. Pursuant to the custodian agreement, SSBT receives a fee reduced by credits, which are determined based on the average daily cash balance the Fund maintains with SSBT. All credit balances, if any, used to reduce the Fund’s custodian fees are reported as a reduction of expenses in the Statement of Operations.
G Use of Estimates — The preparation of the financial statements in conformity with accounting principles generally accepted in the United States of America requires management to make estimates and assumptions that affect the reported amounts of assets and liabilities at the date of the financial statements and the reported amounts of income and expense during the reporting period. Actual results could differ from those estimates.
H Indemnifications — Under the Trust’s organizational documents, its officers and Trustees may be indemnified against certain liabilities and expenses arising out of the performance of their duties to the Fund. Under Massachusetts law, if certain conditions prevail, shareholders of a Massachusetts business trust (such as the Trust) could be deemed to have personal liability for the obligations of the Trust. However, the Trust’s Declaration of Trust contains an express disclaimer of liability on the part of Fund shareholders and the By-laws provide that the Trust shall assume the defense on behalf of any Fund shareholders. Moreover, the By-laws also provide for indemnification out of Fund property of any shareholder held personally liable solely by reason of being or having been a shareholder for all loss or expense arising from such liability. Additionally, in the normal course of business, the Fund enters into agreements with service providers that may contain indemnification clauses. The Fund’s maximum exposure under these arrangements is unknown as this would involve future claims that may be made against the Fund that have not yet occurred.
I Forward Foreign Currency Exchange Contracts — The Fund may enter into forward foreign currency exchange contracts for the purchase or sale of a specific foreign currency at a fixed price on a future date. The forward foreign currency exchange contracts are adjusted by the daily exchange rate of the underlying currency and any gains or losses are recorded as unrealized until such time as the contracts have been closed. Risks may arise upon entering these contracts from the potential inability of counterparties to meet the terms of their contracts and from movements in the value of a foreign currency relative to the U.S. dollar.
2 Distributions to Shareholders
It is the present policy of the Fund to make at least one distribution annually (normally in December) of all or substantially all of its net investment income and to distribute annually all or substantially all of its net realized capital gains. Distributions to shareholders are recorded on the ex-dividend date. Distributions are declared separately for each class of shares. Shareholders may reinvest income and capital gain distributions in additional shares of the same class of the Fund at the net asset value as of the ex-dividend date or, at the election of the shareholder, receive distributions in cash. The Fund distinguishes between distributions on a tax basis and a financial reporting basis. Accounting principles generally accepted in the United States of America require that only distributions in excess of tax basis earnings and profits be reported in the financial statements as a return of capital. Permanent differences between book and tax accounting relating to distributions are reclassified to paid-in capital. For tax purposes, distributions from short-term capital gains are considered to be from ordinary income.
The tax character of distributions declared for the year ended November 30, 2013 and the period ended November 30, 2012 was as follows:
| | | | | | | | |
| | | Year Ended November 30, 2013 | | | Period Ended November 30, 2012 | |
| | |
Distributions declared from: | | | | | | | | |
Ordinary income | | $ | 89,157 | | | $ | — | |
During the year ended November 30, 2013, accumulated net realized gain was increased by $12,604, accumulated distributions in excess of net investment income was increased by $12,277 and paid-in capital was decreased by $327 due to differences between book and tax accounting, primarily for foreign currency gain (loss), non-deductible expenses, dividend redesignations, net operating losses and investments in partnerships. These reclassifications had no effect on the net assets or net asset value per share of the Fund.
As of November 30, 2013, the components of distributable earnings (accumulated losses) and unrealized appreciation (depreciation) on a tax basis were as follows:
| | | | |
Late year ordinary losses | | $ | (92,434 | ) |
Net unrealized depreciation | | $ | (20,416 | ) |
The differences between components of distributable earnings (accumulated losses) on a tax basis and the amounts reflected in the Statement of Assets and Liabilities are primarily due to foreign currency transactions and investments in partnerships.
Parametric Currency Fund
November 30, 2013
Notes to Financial Statements — continued
3 Investment Adviser and Administration Fee and Other Transactions with Affiliates
The investment adviser and administration fee is earned by EVM as compensation for investment advisory and administrative services rendered to the Fund. The fee is computed at an annual rate of 0.55% of the Fund’s average daily net assets up to $1 billion and is payable monthly. On net assets of $1 billion and over, the annual fee is reduced. For the year ended November 30, 2013, the investment adviser and administration fee amounted to $19,577 or 0.55% of the Fund’s average daily net assets. Pursuant to a sub-advisory agreement, EVM has delegated the investment management of the Fund to Parametric Portfolio Associates LLC (Parametric), a majority-owned subsidiary of Eaton Vance Corp. EVM pays Parametric a portion of its advisory and administration fee for sub-advisory services provided to the Fund. The Fund invests its cash in Cash Reserves Fund. EVM does not currently receive a fee for advisory services provided to Cash Reserves Fund.
EVM and Parametric have agreed to reimburse the Fund’s expenses to the extent that total annual operating expenses (relating to ordinary operating expenses only) exceed 0.90% and 0.65% of the Fund’s average daily net assets for Investor Class and Institutional Class, respectively. This agreement may be changed or terminated after March 31, 2014. Pursuant to this agreement, EVM and Parametric were allocated $129,057 in total of the Fund’s operating expenses for the year ended November 30, 2013.
EVM serves as the sub-transfer agent of the Fund and receives from the transfer agent an aggregate fee based upon the actual expenses incurred by EVM in the performance of these services. For the year ended November 30, 2013, EVM earned $139 in sub-transfer agent fees. The Fund was informed that Eaton Vance Distributors, Inc. (EVD), an affiliate of EVM and the Fund’s principal underwriter, received $199 as its portion of the sales charge on sales of Investor Class shares for the year ended November 30, 2013. EVD also received distribution and service fees from Investor Class shares (see Note 4).
Trustees and officers of the Fund who are members of EVM’s organization receive remuneration for their services to the Fund out of the investment adviser and administration fee. Trustees of the Fund who are not affiliated with EVM may elect to defer receipt of all or a percentage of their annual fees in accordance with the terms of the Trustees Deferred Compensation Plan. For the year ended November 30, 2013, no significant amounts have been deferred. Certain officers and Trustees of the Fund are officers of EVM.
4 Distribution Plan
The Fund has in effect a distribution plan for Investor Class shares (Investor Class Plan) pursuant to Rule 12b-1 under the 1940 Act. Pursuant to the Investor Class Plan, the Fund pays EVD a distribution and service fee of 0.25% per annum of its average daily net assets attributable to Investor Class shares for distribution services and facilities provided to the Fund by EVD, as well as for personal services and/or the maintenance of shareholder accounts. Distribution and service fees paid or accrued to EVD for the year ended November 30, 2013 amounted to $577 for Investor Class shares.
Distribution and service fees are subject to the limitations contained in the Financial Industry Regulatory Authority’s NASD Conduct Rule 2830(d).
5 Contingent Deferred Sales Charges
Prior to March 1, 2013, Investor Class shares may have been subject to a 1% contingent deferred sales charge (CDSC) if redeemed within 18 months of purchase (depending on the circumstances of purchase). Generally, the CDSC was based upon the lower of the net asset value at date of redemption or date of purchase. No charge was levied on shares acquired by reinvestment of dividends or capital gain distributions. For the year ended November 30, 2013, the Fund was informed that EVD received no CDSCs paid by Investor Class shareholders.
6 Purchases and Sales of Investments
The Fund had no purchases and sales of long-term investments for the year ended November 30, 2013.
7 Shares of Beneficial Interest
The Fund’s Declaration of Trust permits the Trustees to issue an unlimited number of full and fractional shares of beneficial interest (without par value). Such shares may be issued in a number of different series (such as the Fund) and classes. Transactions in Fund shares were as follows:
| | | | | | | | |
| Investor Class | | Year Ended
November 30, 2013 | | | Period Ended
November 30, 2012(1) | |
| | |
Sales | | | 4,105 | | | | 24,305 | |
Issued to shareholders electing to receive payments of distributions in Fund shares | | | 590 | | | | — | |
Redemptions | | | (8,341 | ) | | | (973 | ) |
| | |
Net increase (decrease) | | | (3,646 | ) | | | 23,332 | |
Parametric Currency Fund
November 30, 2013
Notes to Financial Statements — continued
| | | | | | | | |
| Institutional Class | | Year Ended
November 30, 2013 | | | Period Ended
November 30, 2012(1) | |
| | |
Sales | | | 244,156 | | | | 293,785 | |
Issued to shareholders electing to receive payments of distributions in Fund shares | | | 368 | | | | — | |
Redemptions | | | (153,891 | ) | | | (10,194 | ) |
| | |
Net increase | | | 90,633 | | | | 283,591 | |
| (1) | For the period from the start of business, December 30, 2011, to November 30, 2012. |
At November 30, 2013, an affiliate of EVM and pooled income funds (established and maintained by a public charity) managed by EVM owned 13.0% and 65.9%, respectively, of the value of the outstanding shares of the Fund.
8 Federal Income Tax Basis of Investments
The cost and unrealized appreciation (depreciation) of investments of the Fund at November 30, 2013, as determined on a federal income tax basis, were as follows:
| | | | |
| |
Aggregate cost | | $ | 4,158,226 | |
| |
Gross unrealized appreciation | | $ | 279 | |
Gross unrealized depreciation | | | — | |
| |
Net unrealized appreciation | | $ | 279 | |
9 Financial Instruments
The Fund may trade in financial instruments with off-balance sheet risk in the normal course of its investing activities. These financial instruments may include forward foreign currency exchange contracts and may involve, to a varying degree, elements of risk in excess of the amounts recognized for financial statement purposes. The notional or contractual amounts of these instruments represent the investment the Fund has in particular classes of financial instruments and do not necessarily represent the amounts potentially subject to risk. The measurement of the risks associated with these instruments is meaningful only when all related and offsetting transactions are considered.
A summary of obligations under these financial instruments at November 30, 2013 is as follows:
| | | | | | | | | | | | | | | | | | |
| Forward Foreign Currency Exchange Contracts | |
| Settlement Date | | Deliver | | In Exchange For | | Counterparty | | Unrealized
Appreciation | | | Unrealized
(Depreciation) | | | Net Unrealized
Appreciation
(Depreciation) | |
| | | | | | |
| 12/18/13 | | Canadian Dollar
1,826 | | United States Dollar
1,746 | | State Street Bank
and Trust Co. | | $ | 29 | | | $ | — | | | $ | 29 | |
| 12/18/13 | | Czech Koruna
38,139 | | United States Dollar
1,893 | | State Street Bank
and Trust Co. | | | — | | | | (0 | ) | | | (0 | ) |
| 12/18/13 | | Hungarian Forint
385,624 | | United States Dollar
1,737 | | State Street Bank
and Trust Co. | | | — | | | | (0 | ) | | | (0 | ) |
| 12/18/13 | | Indonesian Rupiah
23,121,387 | | United States Dollar
2,025 | | State Street Bank
and Trust Co. | | | 97 | | | | — | | | | 97 | |
| 12/18/13 | | Norwegian Krone
10,451 | | United States Dollar
1,729 | | State Street Bank
and Trust Co. | | | 25 | | | | — | | | | 25 | |
| 12/18/13 | | Polish Zloty
6,195 | | United States Dollar
1,976 | | State Street Bank
and Trust Co. | | | — | | | | (25 | ) | | | (25 | ) |
| 12/18/13 | | Russian Ruble
57,101 | | United States Dollar
1,750 | | State Street Bank
and Trust Co. | | | 33 | | | | — | | | | 33 | |
Parametric Currency Fund
November 30, 2013
Notes to Financial Statements — continued
| | | | | | | | | | | | | | | | | | |
| Forward Foreign Currency Exchange Contracts (continued) | |
| Settlement Date | | Deliver | | In Exchange For | | Counterparty | | Unrealized
Appreciation | | | Unrealized
(Depreciation) | | | Net Unrealized
Appreciation
(Depreciation) | |
| | | | | | |
| 12/18/13 | | South Korean Won
1,594,727 | | United States Dollar
1,495 | | State Street Bank
and Trust Co. | | $ | — | | | $ | (10 | ) | | $ | (10 | ) |
| 12/18/13 | | Swedish Krona
9,763 | | United States Dollar
1,492 | | State Street Bank
and Trust Co. | | | 4 | | | | — | | | | 4 | |
| 12/18/13 | | United States Dollar
132,178 | | Australian Dollar
139,101 | | State Street Bank
and Trust Co. | | | — | | | | (5,683 | ) | | | (5,683 | ) |
| 12/18/13 | | United States Dollar
132,031 | | Brazilian Real
304,661 | | State Street Bank
and Trust Co. | | | — | | | | (1,977 | ) | | | (1,977 | ) |
| 12/18/13 | | United States Dollar
132,105 | | British Pound Sterling
82,194 | | State Street Bank
and Trust Co. | | | 2,375 | | | | — | | | | 2,375 | |
| 12/18/13 | | United States Dollar
132,356 | | Canadian Dollar
138,008 | | State Street Bank
and Trust Co. | | | — | | | | (2,524 | ) | | | (2,524 | ) |
| 12/18/13 | | United States Dollar
132,166 | | Chilean Peso
68,382,548 | | State Street Bank
and Trust Co. | | | — | | | | (3,979 | ) | | | (3,979 | ) |
| 12/18/13 | | United States Dollar
132,112 | | Colombian Peso
254,077,994 | | State Street Bank
and Trust Co. | | | — | | | | (787 | ) | | | (787 | ) |
| 12/18/13 | | United States Dollar
132,717 | | Czech Koruna
2,528,944 | | State Street Bank
and Trust Co. | | | — | | | | (7,170 | ) | | | (7,170 | ) |
| 12/18/13 | | United States Dollar
132,418 | | Euro
97,869 | | State Street Bank
and Trust Co. | | | 566 | | | | — | | | | 566 | |
| 12/18/13 | | United States Dollar
132,676 | | Hungarian Forint
29,177,215 | | State Street Bank
and Trust Co. | | | — | | | | (1,279 | ) | | | (1,279 | ) |
| 12/18/13 | | United States Dollar
131,397 | | Indian Rupee
8,289,845 | | State Street Bank
and Trust Co. | | | 784 | | | | — | | | | 784 | |
| 12/18/13 | | United States Dollar
134,674 | | Indonesian Rupiah
1,532,184,597 | | State Street Bank
and Trust Co. | | | — | | | | (6,938 | ) | | | (6,938 | ) |
| 12/18/13 | | United States Dollar
132,064 | | Israeli Shekel
466,624 | | State Street Bank
and Trust Co. | | | 387 | | | | — | | | | 387 | |
| 12/18/13 | | United States Dollar
131,741 | | Japanese Yen
12,996,689 | | State Street Bank
and Trust Co. | | | — | | | | (4,860 | ) | | | (4,860 | ) |
| 12/18/13 | | United States Dollar
132,310 | | Malaysian Ringgit
421,037 | | State Street Bank
and Trust Co. | | | — | | | | (1,797 | ) | | | (1,797 | ) |
| 12/18/13 | | United States Dollar
131,998 | | Mexican Peso
1,741,194 | | State Street Bank
and Trust Co. | | | 558 | | | | — | | | | 558 | |
| 12/18/13 | | United States Dollar
131,855 | | New Taiwan Dollar
3,873,910 | | State Street Bank
and Trust Co. | | | — | | | | (878 | ) | | | (878 | ) |
| 12/18/13 | | United States Dollar
131,873 | | New Turkish Lira
269,752 | | State Street Bank
and Trust Co. | | | 1,210 | | | | — | | | | 1,210 | |
| 12/18/13 | | United States Dollar
132,323 | | New Zealand Dollar
158,164 | | State Street Bank
and Trust Co. | | | — | | | | (3,783 | ) | | | (3,783 | ) |
| 12/18/13 | | United States Dollar
132,642 | | Norwegian Krone
791,089 | | State Street Bank
and Trust Co. | | | — | | | | (3,596 | ) | | | (3,596 | ) |
| 12/18/13 | | United States Dollar
132,243 | | Peruvian New Sol
369,883 | | State Street Bank
and Trust Co. | | | — | | | | (332 | ) | | | (332 | ) |
| 12/18/13 | | United States Dollar
131,665 | | Philippine Peso
5,684,632 | | State Street Bank
and Trust Co. | | | — | | | | (1,686 | ) | | | (1,686 | ) |
| 12/18/13 | | United States Dollar
132,870 | | Polish Zloty
410,587 | | State Street Bank
and Trust Co. | | | — | | | | (258 | ) | | | (258 | ) |
Parametric Currency Fund
November 30, 2013
Notes to Financial Statements — continued
| | | | | | | | | | | | | | | | | | |
| Forward Foreign Currency Exchange Contracts (continued) | |
| Settlement Date | | Deliver | | In Exchange For | | Counterparty | | Unrealized
Appreciation | | | Unrealized
(Depreciation) | | | Net Unrealized
Appreciation
(Depreciation) | |
| | | | | | |
| 12/18/13 | | United States Dollar
132,593 | | Russian Ruble
4,320,940 | | State Street Bank
and Trust Co. | | $ | — | | | $ | (2,651 | ) | | $ | (2,651 | ) |
| 12/18/13 | | United States Dollar
131,833 | | Singapore Dollar
163,836 | | State Street Bank
and Trust Co. | | | — | | | | (1,270 | ) | | | (1,270 | ) |
| 12/18/13 | | United States Dollar
131,460 | | South African Rand
1,357,360 | | State Street Bank
and Trust Co. | | | 1,456 | | | | — | | | | 1,456 | |
| 12/18/13 | | United States Dollar
132,357 | | South Korean Won
140,596,513 | | State Street Bank
and Trust Co. | | | 360 | | | | — | | | | 360 | |
| 12/18/13 | | United States Dollar
132,451 | | Swedish Krona
860,833 | | State Street Bank
and Trust Co. | | | — | | | | (1,256 | ) | | | (1,256 | ) |
| 12/18/13 | | United States Dollar
132,252 | | Swiss Franc
120,419 | | State Street Bank
and Trust Co. | | | 622 | | | | — | | | | 622 | |
| 12/18/13 | | United States Dollar
131,846 | | Thai Baht
4,135,994 | | State Street Bank
and Trust Co. | | | — | | | | (3,127 | ) | | | (3,127 | ) |
| 12/18/13 | | United States Dollar
131,792 | | Yuan Renminbi
809,535 | | State Street Bank
and Trust Co. | | | 1,003 | | | | — | | | | 1,003 | |
| | | | | | |
| | | | | | | | | $ | 9,509 | | | $ | (55,866 | ) | | $ | (46,357 | ) |
At November 30, 2013, the Fund had sufficient cash and/or securities to cover commitments under these contracts.
The Fund is subject to foreign exchange risk in the normal course of pursuing its investment objective. The Fund engages in forward foreign currency exchange contracts to seek return, or as a substitute for the purchase of securities or currencies.
The Fund enters into forward foreign currency exchange contracts that may contain provisions whereby the counterparty may terminate the contract under certain conditions, including but not limited to a decline in the Fund’s net assets below a certain level over a certain period of time, which would trigger a payment by the Fund for those derivatives in a liability position. At November 30, 2013, the fair value of derivatives with credit-related contingent features in a net liability position was $55,866. The Fund may be required to pledge collateral in the form of cash or securities for the benefit of a counterparty if the net amount due to the counterparty exceeds a certain threshold. Collateral pledged for the benefit of a counterparty for over-the-counter derivatives is held in a segregated account by the Fund’s custodian. Securities pledged as collateral, if any, are identified in the Portfolio of Investments. Cash pledged as collateral, if any, is included in restricted cash on the Statement of Assets and Liabilities.
The non-exchange traded derivatives in which the Fund invests, including forward foreign currency exchange contracts, are subject to the risk that the counterparty to the contract fails to perform its obligations under the contract. At November 30, 2013, the maximum amount of loss the Fund would incur due to counterparty risk was $9,509, representing the fair value of such derivatives in an asset position. To mitigate this risk, the Fund has entered into a master netting agreement with its derivative counterparty, which allows it and the counterparty to aggregate amounts owed by each of them for derivative transactions under the agreement into a single net amount payable by either the Fund or the counterparty. At November 30, 2013, the maximum amount of loss the Fund would incur due to counterparty risk would be reduced by approximately $9,500, due to the master netting agreement. Counterparties may be required to pledge collateral in the form of cash, U.S. Government securities or highly-rated bonds for the benefit of the Fund if the net amount due from the counterparty with respect to a derivative contract exceeds a certain threshold. The amount of collateral posted by the counterparties with respect to such contracts would also reduce the amount of any loss incurred.
The fair value of open derivative instruments (not considered to be hedging instruments for accounting disclosure purposes) and whose primary underlying risk exposure is foreign exchange risk at November 30, 2013 was as follows:
| | | | | | | | |
| | | Fair Value | |
| Derivative | | Asset Derivative | | | Liability Derivative | |
| | |
Forward foreign currency exchange contracts | | $ | 9,509 | (1) | | $ | (55,866 | )(2) |
| (1) | Statement of Assets and Liabilities location: Receivable for open forward foreign currency exchange contracts; Net unrealized depreciation. |
| (2) | Statement of Assets and Liabilities location: Payable for open forward foreign currency exchange contracts; Net unrealized depreciation. |
Parametric Currency Fund
November 30, 2013
Notes to Financial Statements — continued
The effect of derivative instruments (not considered to be hedging instruments for accounting disclosure purposes) on the Statement of Operations and whose primary underlying risk exposure is foreign exchange risk for the year ended November 30, 2013 was as follows:
| | | | | | | | |
| Derivative | | Realized Gain (Loss)
on Derivatives Recognized
in Income | | | Change in Unrealized
Appreciation (Depreciation) on
Derivatives Recognized in Income | |
| | |
Forward foreign currency exchange contracts | | $ | (12,552 | )(1) | | $ | (90,067 | )(2) |
| (1) | Statement of Operations location: Net realized gain (loss) – Forward foreign currency exchange contract transactions. |
| (2) | Statement of Operations location: Change in unrealized appreciation (depreciation) – Forward foreign currency exchange contracts. |
The average notional amount of forward foreign currency exchange contracts outstanding during the year ended November 30, 2013, which is indicative of the volume of this derivative type, was approximately $3,782,000.
10 Line of Credit
The Fund participates with other portfolios and funds managed by EVM and its affiliates in a $750 million unsecured line of credit agreement with a group of banks. Borrowings are made by the Fund solely to facilitate the handling of unusual and/or unanticipated short-term cash requirements. Interest is charged to the Fund based on its borrowings at an amount above either the Eurodollar rate or Federal Funds rate. In addition, a fee computed at an annual rate of 0.08% on the daily unused portion of the line of credit is allocated among the participating portfolios and funds at the end of each quarter. Because the line of credit is not available exclusively to the Fund, it may be unable to borrow some or all of its requested amounts at any particular time. The Fund did not have any significant borrowings or allocated fees during the year ended November 30, 2013.
11 Currency Risk
Use of currency instruments by the Fund, including forward foreign currency exchange contracts, may involve substantial currency risk. The value of foreign currencies as measured in U.S. dollars may be unpredictably affected by changes in foreign currency rates and exchange control regulations, application of foreign tax laws (including withholding tax), governmental administration of economic or monetary policies (in the U.S. or abroad), intervention (or the failure to intervene) by U.S. or foreign governments or central banks, and relations between nations. A devaluation of a currency by a country’s government or banking authority will have a significant impact on the value of any investments denominated in that currency. Currency markets generally are not as regulated as securities markets and currency transactions are subject to settlement, custodial and other operational risks.
12 Fair Value Measurements
Under generally accepted accounting principles for fair value measurements, a three-tier hierarchy to prioritize the assumptions, referred to as inputs, is used in valuation techniques to measure fair value. The three-tier hierarchy of inputs is summarized in the three broad levels listed below.
| Ÿ | | Level 1 – quoted prices in active markets for identical investments |
| Ÿ | | Level 2 – other significant observable inputs (including quoted prices for similar investments, interest rates, prepayment speeds, credit risk, etc.) |
| Ÿ | | Level 3 – significant unobservable inputs (including a fund’s own assumptions in determining the fair value of investments) |
In cases where the inputs used to measure fair value fall in different levels of the fair value hierarchy, the level disclosed is determined based on the lowest level input that is significant to the fair value measurement in its entirety. The inputs or methodology used for valuing securities are not necessarily an indication of the risk associated with investing in those securities.
Parametric Currency Fund
November 30, 2013
Notes to Financial Statements — continued
At November 30, 2013, the hierarchy of inputs used in valuing the Fund’s investments and open derivative instruments, which are carried at value, were as follows:
| | | | | | | | | | | | | | | | |
| Asset Description | | Level 1 | | | Level 2 | | | Level 3 | | | Total | |
| | | | |
Short-Term Investments — | | | | | | | | | | | | | | | | |
U.S. Treasury Obligations | | $ | — | | | $ | 3,298,335 | | | $ | — | | | $ | 3,298,335 | |
Other | | | — | | | | 860,170 | | | | — | | | | 860,170 | |
| | | | |
Total Investments | | $ | — | | | $ | 4,158,505 | | | $ | — | | | $ | 4,158,505 | |
| | | | |
Forward Foreign Currency Exchange Contracts | | $ | — | | | $ | 9,509 | | | $ | — | | | $ | 9,509 | |
| | | | |
Total | | $ | — | | | $ | 4,168,014 | | | $ | — | | | $ | 4,168,014 | |
| | | | |
Liability Description | | | | | | | | | | | | | | | | |
| | | | |
Forward Foreign Currency Exchange Contracts | | $ | — | | | $ | (55,866 | ) | | $ | — | | | $ | (55,866 | ) |
| | | | |
Total | | $ | — | | | $ | (55,866 | ) | | $ | — | | | $ | (55,866 | ) |
The Fund held no investments or other financial instruments as of November 30, 2012 whose fair value was determined using Level 3 inputs. At November 30, 2013, there were no investments transferred between Level 1 and Level 2 during the year then ended.
13 Name Change
Effective March 1, 2013, the name of Parametric Currency Fund was changed from Eaton Vance Parametric Structured Currency Fund.
Parametric Currency Fund
November 30, 2013
Report of Independent Registered Public Accounting Firm
To the Trustees of Eaton Vance Mutual Funds Trust and Shareholders of Parametric Currency Fund (formerly, Eaton Vance Parametric Structured Currency Fund):
We have audited the accompanying statement of assets and liabilities of Parametric Currency Fund (formerly, Eaton Vance Parametric Structured Currency Fund) (the “Fund”) (one of the funds constituting Eaton Vance Mutual Funds Trust), including the portfolio of investments, as of November 30, 2013, and the related statement of operations for the year then ended, and the statements of changes in net assets and the financial highlights for the year then ended and for the period from the start of business, December 30, 2011, to November 30, 2012. These financial statements and financial highlights are the responsibility of the Fund’s management. Our responsibility is to express an opinion on these financial statements and financial highlights based on our audits.
We conducted our audits in accordance with the standards of the Public Company Accounting Oversight Board (United States). Those standards require that we plan and perform the audit to obtain reasonable assurance about whether the financial statements and financial highlights are free of material misstatement. The Fund is not required to have, nor were we engaged to perform, an audit of its internal control over financial reporting. Our audits included consideration of internal control over financial reporting as a basis for designing audit procedures that are appropriate in the circumstances, but not for the purpose of expressing an opinion on the effectiveness of the Fund’s internal control over financial reporting. Accordingly, we express no such opinion. An audit also includes examining, on a test basis, evidence supporting the amounts and disclosures in the financial statements, assessing the accounting principles used and significant estimates made by management, as well as evaluating the overall financial statement presentation. Our procedures included confirmation of securities owned as of November 30, 2013, by correspondence with the custodian and brokers; where replies were not received from brokers, we performed other auditing procedures. We believe that our audits provide a reasonable basis for our opinion.
In our opinion, such financial statements and financial highlights referred to above present fairly, in all material respects, the financial position of Parametric Currency Fund as of November 30, 2013, the results of its operations for the year then ended, and the changes in its net assets and the financial highlights for the year then ended and for the period from the start of business, December 30, 2011, to November 30, 2012, in conformity with accounting principles generally accepted in the United States of America.
DELOITTE & TOUCHE LLP
Boston, Massachusetts
January 15, 2014
Parametric Currency Fund
November 30, 2013
Federal Tax Information (Unaudited)
The Form 1099-DIV you receive in January 2014 will show the tax status of all distributions paid to your account in calendar year 2013. Shareholders are advised to consult their own tax adviser with respect to the tax consequences of their investment in the Fund.
Parametric Currency Fund
November 30, 2013
Management and Organization
Fund Management. The Trustees of Eaton Vance Mutual Funds Trust (the Trust) are responsible for the overall management and supervision of the Trust’s affairs. The Trustees and officers of the Trust are listed below. Except as indicated, each individual has held the office shown or other offices in the same company for the last five years. Trustees and officers of the Trust hold indefinite terms of office. The “Noninterested Trustees” consist of those Trustees who are not “interested persons” of the Trust, as that term is defined under the 1940 Act. The business address of each Trustee and officer is Two International Place, Boston, Massachusetts 02110. As used below, “EVC” refers to Eaton Vance Corp., “EV” refers to Eaton Vance, Inc., “EVM” refers to Eaton Vance Management, “BMR” refers to Boston Management and Research and “EVD” refers to Eaton Vance Distributors, Inc. EVC and EV are the corporate parent and trustee, respectively, of EVM and BMR. EVD is the Fund’s principal underwriter and a wholly-owned subsidiary of EVC. Each officer affiliated with Eaton Vance may hold a position with other Eaton Vance affiliates that is comparable to his or her position with EVM listed below. Each Trustee oversees 186 portfolios in the Eaton Vance Complex (including all master and feeder funds in a master feeder structure). Each officer serves as an officer of certain other Eaton Vance funds. Each Trustee and officer serves until his or her successor is elected.
| | | | | | |
| Name and Year of Birth | | Position(s) with the
Trust | | Length of
Service | | Principal Occupation(s) and Directorships During Past Five Years and Other Relevant Experience |
Interested Trustee |
| | | |
Thomas E. Faust Jr. 1958 | | Trustee | | Since 2007 | | Chairman, Chief Executive Officer and President of EVC, Director and President of EV, Chief Executive Officer and President of EVM and BMR, and Director of EVD. Trustee and/or officer of 186 registered investment companies. Mr. Faust is an interested person because of his positions with EVM, BMR, EVD, EVC and EV, which are affiliates of the Trust. Directorships in the Last Five Years.(1) Director of EVC and Hexavest Inc. |
| | | |
| | | | | | |
Noninterested Trustees |
| | | |
Scott E. Eston 1956 | | Trustee | | Since 2011 | | Private investor. Formerly held various positions at Grantham, Mayo, Van Otterloo and Co., L.L.C. (investment management firm) (1997-2009), including Chief Operating Officer (2002-2009), Chief Financial Officer (1997-2009) and Chairman of the Executive Committee (2002-2008); President and Principal Executive Officer, GMO Trust (open-end registered investment company) (2006-2009). Former Partner, Coopers and Lybrand L.L.P. (now PricewaterhouseCoopers) (public accounting firm) (1987-1997). Directorships in the Last Five Years. None. |
| | | |
Allen R. Freedman 1940 | | Trustee | | Since 2007 | | Private Investor. Former Chairman (2002-2004) and a Director (1983-2004) of Systems & Computer Technology Corp. (provider of software to higher education). Formerly, a Director of Loring Ward International (fund distributor) (2005-2007). Former Chairman and a Director of Indus International, Inc. (provider of enterprise management software to the power generating industry) (2005-2007). Former Chief Executive Officer of Assurant, Inc. (insurance provider) (1979-2000). Directorships in the Last Five Years.(1) Director of Stonemor Partners, L.P. (owner and operator of cemeteries). Formerly, Director of Assurant, Inc. (insurance provider) (1979-2011). |
| | | |
Valerie A. Mosley(2) 1960 | | Trustee | | Since 2014 | | Chairwoman and Chief Executive Officer of Valmo Ventures (a consulting and investment firm). Former Partner and Senior Vice President, Portfolio Manager and Investment Strategist at Wellington Management Company, LLP (investment management firm) (1992-2012). Former Chief Investment Officer, PG Corbin Asset Management (1990-1992). Formerly worked in institutional corporate bond sales at Kidder Peabody (1986-1990). Directorships in the Last Five Years. None. |
| | | |
William H. Park 1947 | | Trustee | | Since 2003 | | Consultant and private investor. Formerly, Chief Financial Officer, Aveon Group L.P. (investment management firm) (2010-2011). Formerly, Vice Chairman, Commercial Industrial Finance Corp. (specialty finance company) (2006-2010). Formerly, President and Chief Executive Officer, Prizm Capital Management, LLC (investment management firm) (2002-2005). Formerly, Executive Vice President and Chief Financial Officer, United Asset Management Corporation (investment management firm) (1982-2001). Formerly, Senior Manager, Price Waterhouse (now PricewaterhouseCoopers) (an independent registered public accounting firm) (1972-1981). Directorships in the Last Five Years.(1) None. |
| | | |
Ronald A. Pearlman 1940 | | Trustee | | Since 2003 | | Professor of Law, Georgetown University Law Center. Formerly, Deputy Assistant Secretary (Tax Policy) and Assistant Secretary (Tax Policy), U.S. Department of the Treasury (1983-1985). Formerly, Chief of Staff, Joint Committee on Taxation, U.S. Congress (1988-1990). Directorships in the Last Five Years.(1) None. |
Parametric Currency Fund
November 30, 2013
Management and Organization — continued
| | | | | | |
| Name and Year of Birth | | Position(s) with the
Trust | | Length of
Service | | Principal Occupation(s) and Directorships During Past Five Years and Other Relevant Experience |
Noninterested Trustees (continued) |
| | | |
Helen Frame Peters 1948 | | Trustee | | Since 2008 | | Professor of Finance, Carroll School of Management, Boston College. Formerly, Dean, Carroll School of Management, Boston College (2000-2002). Formerly, Chief Investment Officer, Fixed Income, Scudder Kemper Investments (investment management firm) (1998-1999). Formerly, Chief Investment Officer, Equity and Fixed Income, Colonial Management Associates (investment management firm) (1991-1998). Directorships in the Last Five Years.(1) Formerly, Director of BJ’s Wholesale Club, Inc. (wholesale club retailer) (2004-2011). Formerly, Trustee of SPDR Index Shares Funds and SPDR Series Trust (exchange traded funds) (2000-2009). Formerly, Director of Federal Home Loan Bank of Boston (a bank for banks) (2007-2009). |
| | | |
Lynn A. Stout 1957 | | Trustee | | Since 1998 | | Distinguished Professor of Corporate and Business Law, Jack G. Clarke Business Law Institute, Cornell University Law School. Formerly, the Paul Hastings Professor of Corporate and Securities Law (2006-2012) and Professor of Law (2001-2006), University of California at Los Angeles School of Law. Directorships in the Last Five Years.(1) None. |
| | | |
Harriett Tee Taggart 1948 | | Trustee | | Since 2011 | | Managing Director, Taggart Associates (a professional practice firm). Formerly, Partner and Senior Vice President, Wellington Management Company, LLP (investment management firm) (1983-2006). Directorships in the Last Five Years. Director of Albemarle Corporation (chemicals manufacturer) (since 2007) and The Hanover Group (specialty property and casualty insurance company) (since 2009). Formerly, Director of Lubrizol Corporation (specialty chemicals) (2007-2011). |
| | | |
Ralph F. Verni 1943 | | Chairman of the Board and Trustee | | Chairman of the Board since 2007 and Trustee since 2005 | | Consultant and private investor. Formerly, Chief Investment Officer (1982-1992), Chief Financial Officer (1988-1990) and Director (1982-1992), New England Life. Formerly, Chairperson, New England Mutual Funds (1982-1992). Formerly, President and Chief Executive Officer, State Street Management & Research (1992-2000). Formerly, Chairperson, State Street Research Mutual Funds (1992-2000). Formerly, Director, W.P. Carey, LLC (1998-2004) and First Pioneer Farm Credit Corp. (2002-2006). Directorships in the Last Five Years.(1) None. |
| | | |
| | | | | | |
Principal Officers who are not Trustees |
| Name and Year of Birth | | Position(s) with the Trust | | Length of Service | | Principal Occupation(s) During Past Five Years |
Payson F. Swaffield(3) 1956 | | President | | Since 2013 | | Vice President and Chief Income Investment Officer of EVM and BMR. |
| | | |
Maureen A. Gemma 1960 | | Vice President, Secretary and Chief Legal Officer | | Vice President since 2011, Secretary since 2007 and Chief Legal Officer since 2008 | | Vice President of EVM and BMR. |
| | | |
James F. Kirchner(4) 1967 | | Treasurer | | Since 2013 | | Vice President of EVM and BMR. |
| | | |
Paul M. O’Neil 1953 | | Chief Compliance Officer | | Since 2004 | | Vice President of EVM and BMR. |
| (1) | During their respective tenures, the Trustees (except Mr. Eston and Mmes. Mosley and Taggart) also served as Board members of one or more of the following Eaton Vance funds (which operated in the years noted): Eaton Vance Credit Opportunities Fund (launched in 2005 and terminated in 2010); Eaton Vance Insured Florida Plus Municipal Bond Fund (launched in 2002 and terminated in 2009); and Eaton Vance National Municipal Income Trust (launched in 1998 and terminated in 2009). |
| (2) | Effective January 1, 2014, Ms. Mosley became a Trustee of the Trust. |
| (3) | Prior to 2013, Mr. Swaffield was Vice President of the Trust since 2011. |
| (4) | Prior to 2013, Mr. Kirchner served as Assistant Treasurer of the Trust since 2007. |
The SAI for the Fund includes additional information about the Trustees and officers of the Fund and can be obtained without charge on Eaton Vance’s website at www.eatonvance.com or by calling 1-800-260-0761.
Eaton Vance Funds
IMPORTANT NOTICES
Privacy. The Eaton Vance organization is committed to ensuring your financial privacy. Each of the financial institutions identified below has in effect the following policy (“Privacy Policy”) with respect to nonpublic personal information about its customers:
| Ÿ | | Only such information received from you, through application forms or otherwise, and information about your Eaton Vance fund transactions will be collected. This may include information such as name, address, social security number, tax status, account balances and transactions. |
| Ÿ | | None of such information about you (or former customers) will be disclosed to anyone, except as permitted by law (which includes disclosure to employees necessary to service your account). In the normal course of servicing a customer’s account, Eaton Vance may share information with unaffiliated third parties that perform various required services such as transfer agents, custodians and broker-dealers. |
| Ÿ | | Policies and procedures (including physical, electronic and procedural safeguards) are in place that are designed to protect the confidentiality of such information. |
| Ÿ | | We reserve the right to change our Privacy Policy at any time upon proper notification to you. Customers may want to review our Privacy Policy periodically for changes by accessing the link on our homepage: www.eatonvance.com. |
Our pledge of privacy applies to the following entities within the Eaton Vance organization: the Eaton Vance Family of Funds, Eaton Vance Management, Eaton Vance Investment Counsel, Eaton Vance Distributors, Inc., Eaton Vance Trust Company, Eaton Vance Management’s Real Estate Investment Group and Boston Management and Research. In addition, our Privacy Policy applies only to those Eaton Vance customers who are individuals and who have a direct relationship with us. If a customer’s account (i.e., fund shares) is held in the name of a third-party financial advisor/broker-dealer, it is likely that only such advisor’s privacy policies apply to the customer. This notice supersedes all previously issued privacy disclosures. For more information about Eaton Vance’s Privacy Policy, please call 1-800-262-1122.
Delivery of Shareholder Documents. The Securities and Exchange Commission (SEC) permits funds to deliver only one copy of shareholder documents, including prospectuses, proxy statements and shareholder reports, to fund investors with multiple accounts at the same residential or post office box address. This practice is often called “householding” and it helps eliminate duplicate mailings to shareholders. Eaton Vance, or your financial advisor, may household the mailing of your documents indefinitely unless you instruct Eaton Vance, or your financial advisor, otherwise. If you would prefer that your Eaton Vance documents not be householded, please contact Eaton Vance at 1-800-260-0761, or contact your financial advisor. Your instructions that householding not apply to delivery of your Eaton Vance documents will be effective within 30 days of receipt by Eaton Vance or your financial advisor.
Portfolio Holdings. Each Eaton Vance Fund and its underlying Portfolio(s) (if applicable) will file a schedule of portfolio holdings on Form N-Q with the SEC for the first and third quarters of each fiscal year. The Form N-Q will be available on the Eaton Vance website at www.eatonvance.com, by calling Eaton Vance at 1-800-260-0761 or in the EDGAR database on the SEC’s website at www.sec.gov. Form N-Q may also be reviewed and copied at the SEC’s public reference room in Washington, D.C. (call 1-800-732-0330 for information on the operation of the public reference room).
Proxy Voting. From time to time, funds are required to vote proxies related to the securities held by the funds. The Eaton Vance Funds or their underlying Portfolios (if applicable) vote proxies according to a set of policies and procedures approved by the Funds’ and Portfolios’ Boards. You may obtain a description of these policies and procedures and information on how the Funds or Portfolios voted proxies relating to portfolio securities during the most recent 12-month period ended June 30, without charge, upon request, by calling 1-800-260-0761 and by accessing the SEC’s website at www.sec.gov.
This Page Intentionally Left Blank
This Page Intentionally Left Blank
This Page Intentionally Left Blank
Investment Adviser and Administrator
Eaton Vance Management
Two International Place
Boston, MA 02110
Sub-Adviser
Parametric Portfolio Associates LLC
1918 Eighth Avenue, Suite 3100
Seattle, WA 98101
Principal Underwriter*
Eaton Vance Distributors, Inc.
Two International Place
Boston, MA 02110
(617) 482-8260
Custodian
State Street Bank and Trust Company
200 Clarendon Street
Boston, MA 02116
Transfer Agent
BNY Mellon Investment Servicing (US) Inc.
Attn: Eaton Vance Funds
P.O. Box 9653
Providence, RI 02940-9653
(800) 260-0761
Independent Registered Public Accounting Firm
Deloitte & Touche LLP
200 Berkeley Street
Boston, MA 02116-5022
Fund Offices
Two International Place
Boston, MA 02110
| * | FINRA BrokerCheck. Investors may check the background of their Investment Professional by contacting the Financial Industry Regulatory Authority (FINRA). FINRA BrokerCheck is a free tool to help investors check the professional background of current and former FINRA-registered securities firms and brokers. FINRA BrokerCheck is available by calling 1-800-289-9999 and at www.FINRA.org. The FINRA BrokerCheck brochure describing this program is available to investors at www.FINRA.org. |
Item 2. Code of Ethics
The registrant has adopted a code of ethics applicable to its Principal Executive Officer, Principal Financial Officer and Principal Accounting Officer. The registrant undertakes to provide a copy of such code of ethics to any person upon request, without charge, by calling 1-800-262-1122.
Item 3. Audit Committee Financial Expert
The registrant’s Board has designated William H. Park, an independent trustee, as its audit committee financial expert. Mr. Park is a certified public accountant who is a consultant and private investor. Previously, he served as the Chief Financial Officer of Aveon Group, L.P. (an investment management firm), as the Vice Chairman of Commercial Industrial Finance Corp. (specialty finance company), as President and Chief Executive Officer of Prizm Capital Management, LLC (investment management firm), as Executive Vice President and Chief Financial Officer of United Asset Management Corporation (an institutional investment management firm) and as a Senior Manager at Price Waterhouse (now PricewaterhouseCoopers) (an independent registered public accounting firm).
Item 4. Principal Accountant Fees and Services
(a)-(d)
Parametric Currency Fund (formerly, Eaton Vance Parametric Structured Currency Fund) (the “Fund”) is a series of Eaton Vance Mutual Funds Trust (the “Trust”), a Massachusetts business trust, which, including the Funds, contains a total of 37 series (the “Series”). The Trust is registered under the Investment Company Act of 1940 as an open-end management investment company. This Form N-CSR relates to the Funds’ annual reports.
The following table presents the aggregate fees billed to the registrant for the registrant’s fiscal years ended November 30, 2012 and November 30, 2013 by the Fund’s principal accountant, Deloitte & Touche LLP (“D&T”), for professional services rendered for the audit of the Fund’s annual financial statements and fees billed for other services rendered by D&T during such periods.
| | | | | | | | |
Parametric Currency Fund* (formerly Eaton Vance Parametric Structured Currency Fund) Fiscal Period Ended | | 11/30/12 | | | 11/30/13 | |
Audit Fees | | $ | 19,550 | | | $ | 24,800 | |
Audit-Related Fees(1) | | $ | 0 | | | $ | 0 | |
Tax Fees(2) | | $ | 8,310 | | | $ | 9,410 | |
All Other Fees(3) | | $ | 0 | | | $ | 0 | |
| | | | | | | | |
Total | | $ | 27,860 | | | $ | 34,210 | |
| | | | | | | | |
| * | Fund commenced operations on December 30, 2011 |
| (1) | Audit-related fees consist of the aggregate fees billed for assurance and related services that are reasonably related to the performance of the audit of financial statements and are not reported under the category of audit fees. |
| (2) | Tax fees consist of the aggregate fees billed for professional services rendered by the principal accountant relating to tax compliance, tax advice, and tax planning and specifically include fees for tax return preparation. |
| (3) | All other fees consist of the aggregate fees billed for products and services provided by the principal accountant other than audit, audit-related, and tax services. |
The various Series comprising the Trust have differing fiscal year ends (January 31, August 31, September 30, and October 31, November 30 or December 31). The following table presents the aggregate audit, audit-related, tax, and other fees billed to all of the Series in the Trust by D&T for the last two fiscal years of each Series.
| | | | | | | | | | | | | | | | | | | | | | | | | | | | | | | | | | | | | | | | |
Fiscal Years Ended* | | 12/31/11 | | | 1/31/12 | | | 9/30/12 | | | 10/31/12 | | | 11/30/12 | | | 12/31/12 | | | 1/31/13 | | | 9/30/13 | | | 10/31/13 | | | 11/30/13 | |
Audit Fees | | $ | 135,300 | | | $ | 88,300 | | | $ | 109,600 | | | $ | 524,630 | | | $ | 19,550 | | | $ | 88,479 | | | $ | 116,530 | | | $ | 117,400 | | | $ | 556,530 | | | $ | 24,800 | |
Audit-Related Fees(1) | | $ | 0 | | | $ | 0 | | | $ | 0 | | | $ | 0 | | | $ | 0 | | | $ | 0 | | | $ | 0 | | | $ | 0 | | | $ | 0 | | | $ | 0 | |
Tax Fees(2) | | $ | 51,570 | | | $ | 25,420 | | | $ | 28,740 | | | $ | 281,940 | | | $ | 8,310 | | | $ | 55,380 | | | $ | 55,490 | | | $ | 29,970 | | | $ | 299,460 | | | $ | 9,410 | |
All Other Fees(3) | | $ | 1,500 | | | $ | 2,100 | | | $ | 620 | | | $ | 0 | | | $ | 0 | | | $ | 0 | | | $ | 0 | | | $ | 0 | | | $ | 0 | | | $ | 0 | |
| | | | | | | | | | | | | | | | | | | | | | | | | | | | | | | | | | | | | | | | |
Total | | $ | 188,370 | | | $ | 115,820 | | | $ | 138,960 | | | $ | 806,570 | | | $ | 27,860 | | | $ | 143,859 | | | $ | 172, 020 | | | $ | 147,370 | | | $ | 855,990 | | | $ | 34,210 | |
| | | | | | | | | | | | | | | | | | | | | | | | | | | | | | | | | | | | | | | | |
| * | Information is not presented for fiscal years ended 8/31/12 and 8/31/13, as no Series in the Trust with such fiscal year end was in operation during such periods. |
| (1) | Audit-related fees consist of the aggregate fees billed for assurance and related services that are reasonably related to the performance of the audit of financial statements and are not reported under the category of audit fees. |
| (2) | Tax fees consist of the aggregate fees billed for professional services rendered by the principal accountant relating to tax compliance, tax advice, and tax planning and specifically include fees for tax return preparation. |
| (3) | All other fees consist of the aggregate fees billed for products and services provided by the principal accountant other than audit, audit-related, and tax services. |
(e)(1) The registrant’s audit committee has adopted policies and procedures relating to the pre-approval of services provided by the registrant’s principal accountant (the “Pre-Approval Policies”). The Pre-Approval Policies establish a framework intended to assist the audit committee in the proper discharge of its pre-approval responsibilities. As a general matter, the Pre-Approval Policies (i) specify certain types of audit, audit-related, tax, and other services determined to be pre-approved by the audit committee; and (ii) delineate specific procedures governing the mechanics of the pre-approval process, including the approval and monitoring of audit and non-audit service fees. Unless a service is specifically pre-approved under the Pre-Approval Policies, it must be separately pre-approved by the audit committee.
The Pre-Approval Policies and the types of audit and non-audit services pre-approved therein must be reviewed and ratified by the registrant’s audit committee at least annually. The registrant’s audit committee maintains full responsibility for the appointment, compensation, and oversight of the work of the registrant’s principal accountant.
(e)(2) No services described in paragraphs (b)-(d) above were approved by the registrant’s audit committee pursuant to the “de minimis exception” set forth in Rule 2-01(c)(7)(i)(C) of Regulation S-X.
(f) Not applicable.
(g) The following table presents (i) the aggregate non-audit fees (i.e., fees for audit-related, tax, and other services) billed for services rendered to all of the Series in the Trust by D&T for the last two fiscal years of each Series; and (ii) the aggregate non-audit fees (i.e., fees for audit-related, tax, and other services) billed to the Eaton Vance organization by D&T for the last two fiscal years of each Series.
| | | | | | | | | | | | | | | | | | | | | | | | | | | | | | | | | | | | | | | | |
Fiscal Years Ended* | | 12/31/11 | | | 1/31/12 | | | 9/30/12 | | | 10/31/12 | | | 11/30/12 | | | 12/31/12 | | | 1/31/13 | | | 9/30/13 | | | 10/31/13 | | | 11/30/13 | |
Registrant(1) | | $ | 53,070 | | | $ | 27,520 | | | $ | 29,360 | | | $ | 281,940 | | | $ | 8,310 | | | $ | 55,380 | | | $ | 55,490 | | | $ | 29,970 | | | $ | 299,460 | | | $ | 9,410 | |
Eaton Vance(2) | | $ | 334,561 | | | $ | 414,561 | | | $ | 606,619 | | | $ | 566,619 | | | $ | 662,119 | | | $ | 615,489 | | | $ | 544,549 | | | $ | 369,820 | | | $ | 526,385 | | | $ | 526,385 | |
| * | Information is not presented for fiscal years ended 8/31/12 and 8/31/13, as no Series in the Trust with such fiscal year end was in operation during such periods. |
| (1) | Includes all of the Series of the Trust. During the fiscal years reported above, certain of the Funds were “feeder” funds in a “master-feeder” fund structure or funds of funds. |
| (2) | Various subsidiaries of Eaton Vance Corp. act in either an investment advisory and/or service provider capacity with respect to the Series and/or their respective “master” funds (if applicable). |
(h) The registrant’s audit committee has considered whether the provision by the registrant’s principal accountant of non-audit services to the registrant’s investment adviser and any entity controlling, controlled by, or under common control with the adviser that provides ongoing services to the registrant that were not pre-approved pursuant to Rule 2-01(c)(7)(ii) of Regulation S-X is compatible with maintaining the principal accountant’s independence.
Item 5. Audit Committee of Listed Registrants
Not applicable.
Item 6. Schedule of Investments
Please see schedule of investments contained in the Report to Stockholders included under Item 1 of this Form N-CSR.
Item 7. Disclosure of Proxy Voting Policies and Procedures for Closed-End Management Investment Companies
Not applicable.
Item 8. Portfolio Managers of Closed-End Management Investment Companies
Not applicable.
Item 9. Purchases of Equity Securities by Closed-End Management Investment Company and Affiliated Purchasers
Not applicable.
Item 10. Submission of Matters to a Vote of Security Holders
No material changes.
Item 11. Controls and Procedures
(a) It is the conclusion of the registrant’s principal executive officer and principal financial officer that the effectiveness of the registrant’s current disclosure controls and procedures (such disclosure controls and procedures having been evaluated within 90 days of the date of this filing) provide reasonable assurance that the information required to be disclosed by the registrant has been recorded, processed, summarized and reported within the time period specified in the Commission’s rules and forms and that the information required to be disclosed by the registrant has been accumulated and communicated to the registrant’s principal executive officer and principal financial officer in order to allow timely decisions regarding required disclosure.
(b) There have been no changes in the registrant’s internal controls over financial reporting during the second fiscal quarter of the period covered by this report that has materially affected, or is reasonably likely to materially affect, the registrant’s internal control over financial reporting.
Item 12. Exhibits
| | |
| |
| (a)(1) | | Registrant’s Code of Ethics – Not applicable (please see Item 2). |
| |
| (a)(2)(i) | | Treasurer’s Section 302 certification. |
| |
| (a)(2)(ii) | | President’s Section 302 certification. |
| |
| (b) | | Combined Section 906 certification. |
Signatures
Pursuant to the requirements of the Securities Exchange Act of 1934 and the Investment Company Act of 1940, the registrant has duly caused this report to be signed on its behalf by the undersigned, thereunto duly authorized.
Eaton Vance Mutual Funds Trust
| | |
| By: | | /s/ Payson F. Swaffield |
| | Payson F. Swaffield |
| | President |
| |
| Date: | | January 10, 2014 |
Pursuant to the requirements of the Securities Exchange Act of 1934 and the Investment Company Act of 1940, this report has been signed below by the following persons on behalf of the registrant and in the capacities and on the dates indicated.
| | |
| By: | | /s/ James F. Kirchner |
| | James F. Kirchner |
| | Treasurer |
| |
| Date: | | January 10, 2014 |
| |
| By: | | /s/ Payson F. Swaffield |
| | Payson F. Swaffield |
| | President |
| |
| Date: | | January 10, 2014 |